Attached files
| file | filename |
|---|---|
| 8-K - 8-K - CAMDEN NATIONAL CORP | a8k_investorpresentation08.htm |
2017 KBW
Community Bank
Investor Conference
Gregory Dufour | President & Chief Executive Officer
Deborah Jordan | Chief Operating & Financial Officer
August 1-2, 2017
0
Forward Looking Statements
1
This presentation contains certain statements that may be considered forward-looking statements under the Private Securities Litigation
Reform Act of 1995 and other federal securities laws, including certain plans, exceptions, goals, projections, and statements, which are
subject to numerous risks, assumptions, and uncertainties. Forward-looking statements can be identified by the use of the words
“believe,” “expect,” “anticipate,” “intend,” “estimate,” “assume,” “plan,” “target,” or “goal” or future or conditional verbs such as “will,”
“may,” “might,” “should,” “could” and other expressions which predict or indicate future events or trends and which do not relate to
historical matters. Forward-looking statements should not be relied on, because they involve known and unknown risks, uncertainties and
other factors, some of which are beyond the control of Camden National Corporation (the “Company”). These risks, uncertainties and
other factors may cause the actual results, performance or achievements of the Company to be materially different from the anticipated
future results, performance or achievements expressed or implied by the forward-looking statements.
The following factors, among others, could cause the Company’s financial performance to differ materially from the Company’s goals,
plans, objectives, intentions, expectations and other forward-looking statements: weakness in the United States economy in general and
the regional and local economies within the New England region and Maine, which could result in a deterioration of credit quality, an
increase in the allowance for loan losses or a reduced demand for the Company’s credit or fee-based products and services; changes in
trade, monetary, and fiscal policies and laws, including interest rate policies of the Board of Governors of the Federal Reserve System;
inflation, interest rate, market, and monetary fluctuations; competitive pressures, including continued industry consolidation and the
increased financial services provided by non-banks; volatility in the securities markets that could adversely affect the value or credit
quality of the Company’s assets, impairment of goodwill, the availability and terms of funding necessary to meet the Company’s liquidity
needs, and could lead to impairment in the value of securities in the Company's investment portfolio; changes in information technology
that require increased capital spending; changes in consumer spending and savings habits; changes in tax, banking, securities and
insurance laws and regulations; and changes in accounting policies, practices and standards, as may be adopted by the regulatory
agencies as well as the Financial Accounting Standards Board ("FASB"), and other accounting standard setters.
You should carefully review all of these factors, and be aware that there may be other factors that could cause differences, including the
risk factors listed in the Company’s filings with the SEC, including our Annual Report on Form 10-K for the year ended December 31, 2016,
as updated by the Company's quarterly reports on Form 10-Q and other filings with the Securities and Exchange Commission. You should
carefully review the risk factors described therein and should not place undue reliance on our forward-looking statements.
These forward-looking statements were based on information, plans and estimates at the date of this report, and we undertake no
obligation to update any forward-looking statements to reflect changes in underlying assumptions or factors, new information, future
events or other changes, except to the extent required by applicable law or regulation.
Camden National Corporation
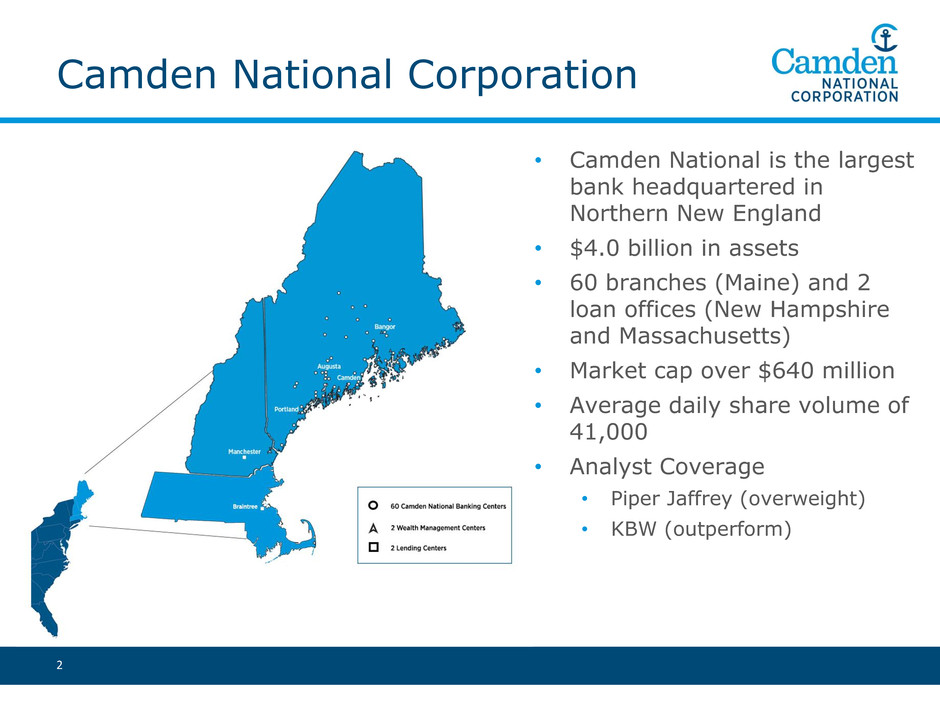
• Camden National is the largest
bank headquartered in
Northern New England
• $4.0 billion in assets
• 60 branches (Maine) and 2
loan offices (New Hampshire
and Massachusetts)
• Market cap over $640 million
• Average daily share volume of
41,000
• Analyst Coverage
• Piper Jaffrey (overweight)
• KBW (outperform)
2
2nd Quarter 2017
Financial Highlights
• Strong earnings performance
o Net income of $10.2 million
o Return on tangible equity: 13.96%(a)
o Return on assets: 1.03%
o Efficiency ratio: 56.76%(a)
o Tangible common equity ratio: 7.79%(a)
• Solid growth
o Total loans $2.7 billion; YTD annualized growth rate of 11%
o Total deposits $2.9 billion; YTD annualized growth rate of 8%
o Mortgage banking income up 25% over first quarter 2017
3
(a) This is a non-GAAP measure. Refer to the second quarter 2017 earnings release filed as exhibit 99.1 to the Form 8-K filed on 7/25/17.
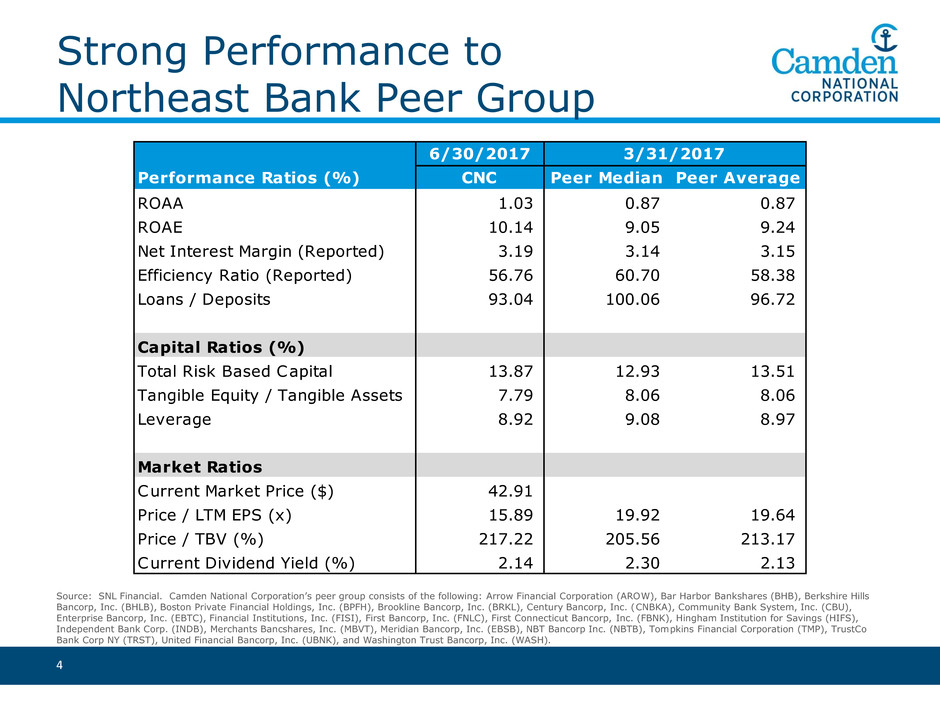
Strong Performance to
Northeast Bank Peer Group
4
Source: SNL Financial. Camden National Corporation’s peer group consists of the following: Arrow Financial Corporation (AROW), Bar Harbor Bankshares (BHB), Berkshire Hills
Bancorp, Inc. (BHLB), Boston Private Financial Holdings, Inc. (BPFH), Brookline Bancorp, Inc. (BRKL), Century Bancorp, Inc. (CNBKA), Community Bank System, Inc. (CBU),
Enterprise Bancorp, Inc. (EBTC), Financial Institutions, Inc. (FISI), First Bancorp, Inc. (FNLC), First Connecticut Bancorp, Inc. (FBNK), Hingham Institution for Savings (HIFS),
Independent Bank Corp. (INDB), Merchants Bancshares, Inc. (MBVT), Meridian Bancorp, Inc. (EBSB), NBT Bancorp Inc. (NBTB), Tompkins Financial Corporation (TMP), TrustCo
Bank Corp NY (TRST), United Financial Bancorp, Inc. (UBNK), and Washington Trust Bancorp, Inc. (WASH).
6/30/2017
Performance Ratios (%) CNC Peer Median Peer Average
ROAA 1.03 0.87 0.87
ROAE 10.14 9.05 9.24
Net Interest Margin (Reported) 3.19 3.14 3.15
Efficiency Ratio (Reported) 56.76 60.70 58.38
Loans / Deposits 93.04 100.06 96.72
Capital Ratios (%)
Total Risk Based Capital 13.87 12.93 13.51
Tangible Equity / Tangible Assets 7.79 8.06 8.06
Leverage 8.92 9.08 8.97
Market Ratios
Current Market Price ($) 42.91
Price / LTM EPS (x) 15.89 19.92 19.64
Price / TBV (%) 217.22 205.56 213.17
Current Dividend Yield (%) 2.14 2.30 2.13
3/31/2017
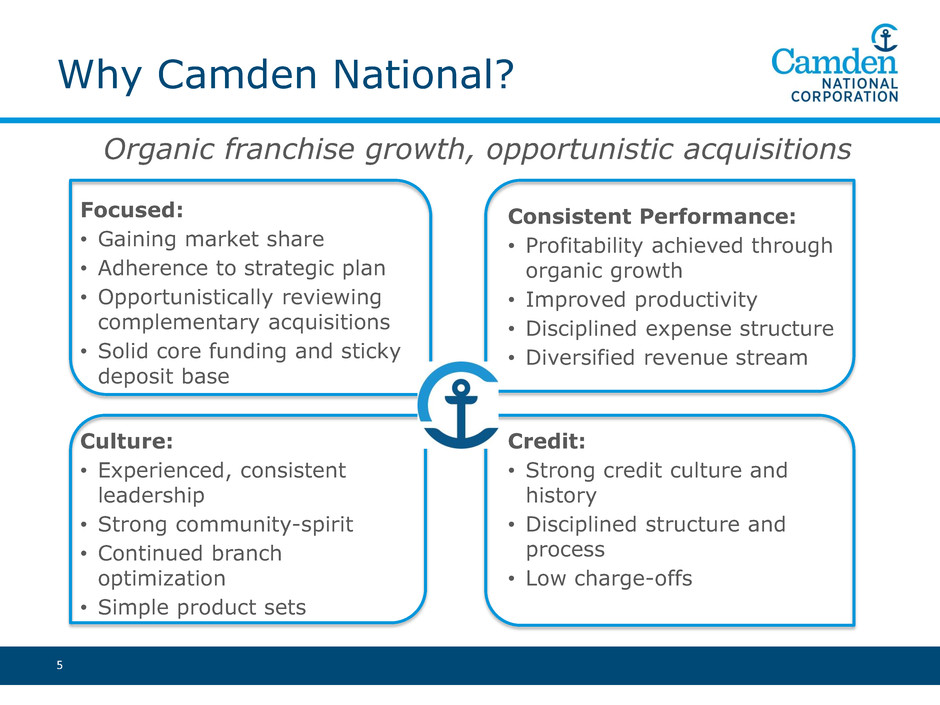
Why Camden National?
Organic franchise growth, opportunistic acquisitions
5
Credit:
• Strong credit culture and
history
• Disciplined structure and
process
• Low charge-offs
Culture:
• Experienced, consistent
leadership
• Strong community-spirit
• Continued branch
optimization
• Simple product sets
Focused:
• Gaining market share
• Adherence to strategic plan
• Opportunistically reviewing
complementary acquisitions
• Solid core funding and sticky
deposit base
Consistent Performance:
• Profitability achieved through
organic growth
• Improved productivity
• Disciplined expense structure
• Diversified revenue stream
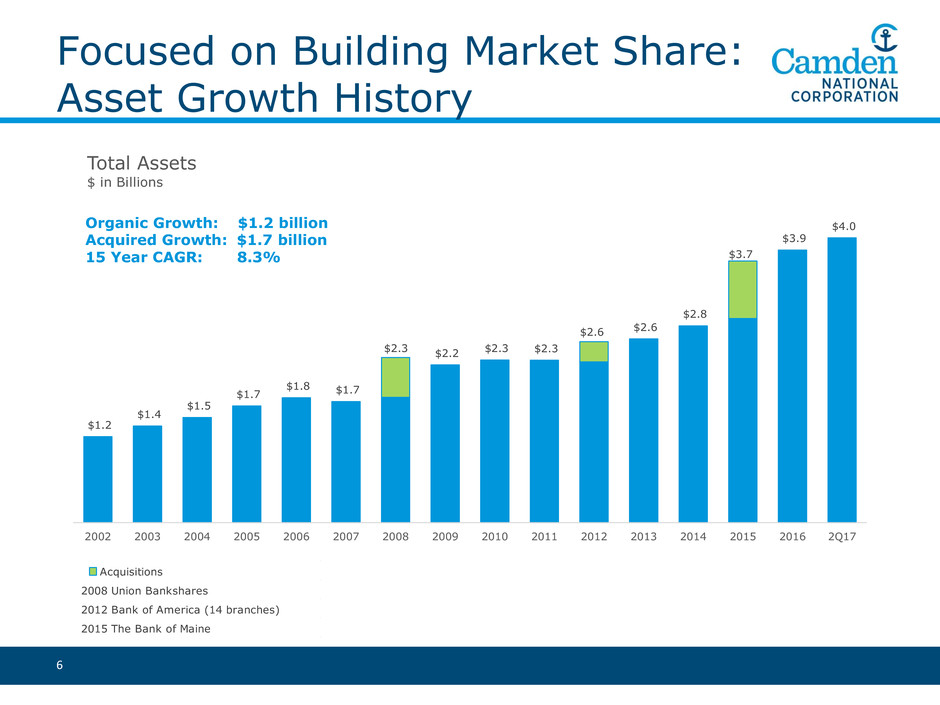
Focused on Building Market Share:
Asset Growth History
6
$1.2
$1.4
$1.5
$1.7
$1.8 $1.7
$2.3 $2.2 $2.3 $2.3
$2.6 $2.6
$2.8
$3.7
$3.9
$4.0
2002 2003 2004 2005 2006 2007 2008 2009 2010 2011 2012 2013 2014 2015 2016 2Q17
Total Assets
$ in Billions
Organic Growth: $1.2 billion
Acquired Growth: $1.7 billion
15 Year CAGR: 8.3%
Acquisitions
2008 Union Bankshares
2012 Bank of America (14 branches)
2015 The Bank of Maine
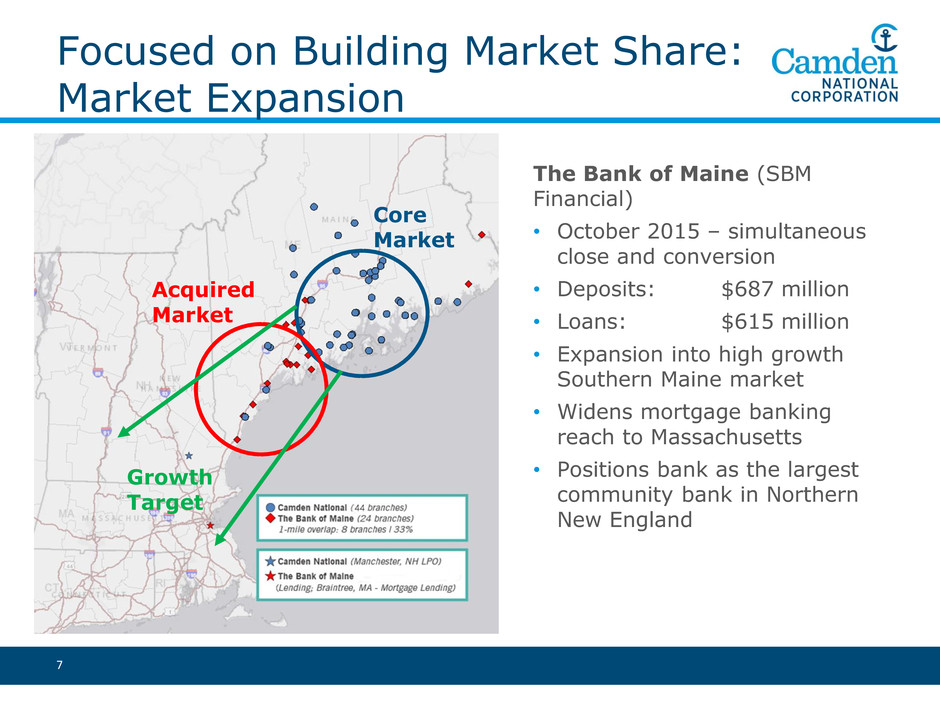
Focused on Building Market Share:
Market Expansion
The Bank of Maine (SBM
Financial)
• October 2015 – simultaneous
close and conversion
• Deposits: $687 million
• Loans: $615 million
• Expansion into high growth
Southern Maine market
• Widens mortgage banking
reach to Massachusetts
• Positions bank as the largest
community bank in Northern
New England
7
Core
Market
Acquired
Market
Growth
Target
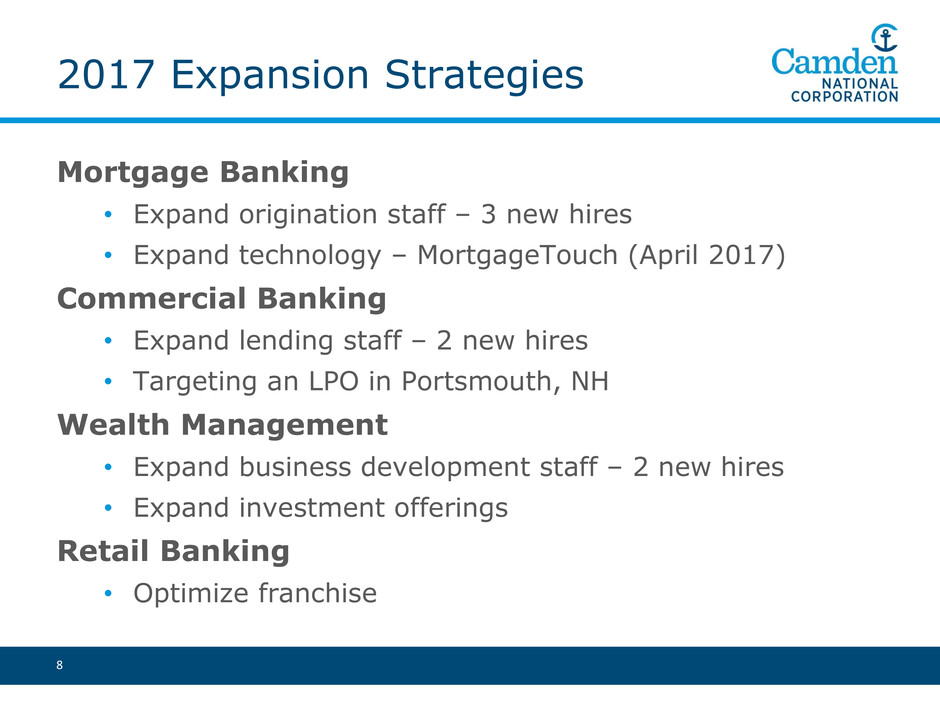
2017 Expansion Strategies
Mortgage Banking
• Expand origination staff – 3 new hires
• Expand technology – MortgageTouch (April 2017)
Commercial Banking
• Expand lending staff – 2 new hires
• Targeting an LPO in Portsmouth, NH
Wealth Management
• Expand business development staff – 2 new hires
• Expand investment offerings
Retail Banking
• Optimize franchise
8
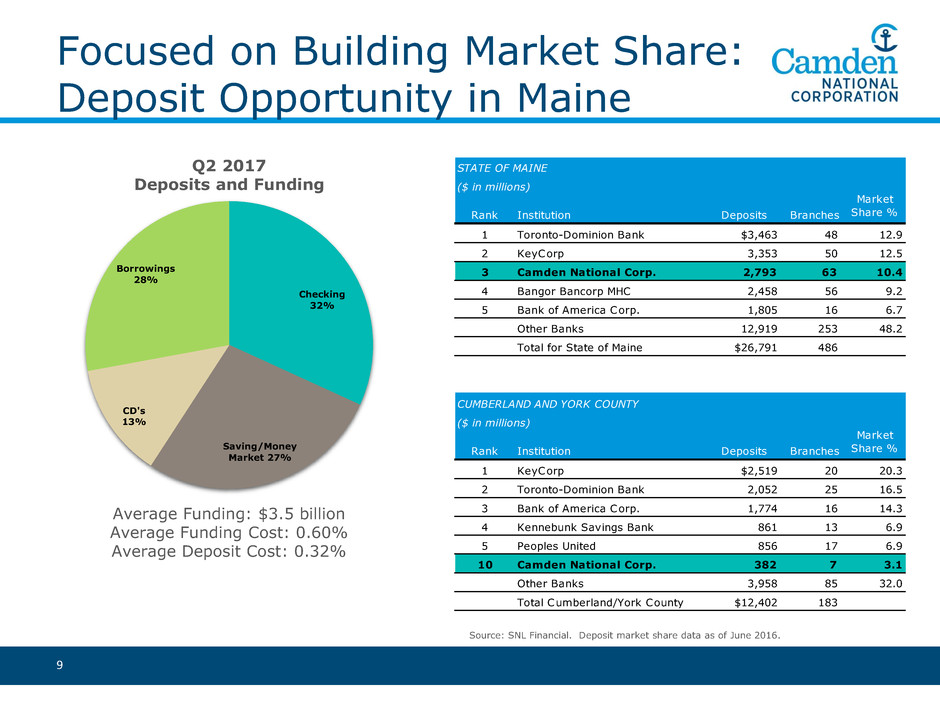
Focused on Building Market Share:
Deposit Opportunity in Maine
9
Source: SNL Financial. Deposit market share data as of June 2016.
Average Funding: $3.5 billion
Average Funding Cost: 0.60%
Average Deposit Cost: 0.32%
Q2 2017
Deposits and Funding
STATE OF MAINE
($ in millions)
Rank Institution Deposits Branches
Market
Share %
1 Toronto-Dominion Bank $3,463 48 12.9
2 KeyCorp 3,353 50 12.5
3 Camden National Corp. 2,793 63 10.4
4 Bangor Bancorp MHC 2,458 56 9.2
5 Bank of America Corp. 1,805 16 6.7
Other Banks 12,919 253 48.2
Total for State of Maine $26,791 486
CUMBERLAND AND YORK COUNTY
($ in millions)
Rank Institution Deposits Branches
Market
Share %
1 KeyCorp $2,519 20 20.3
2 Toronto-Dominion Bank 2,052 25 16.5
3 Bank of America Corp. 1,774 16 14.3
4 Kennebunk Savings Bank 861 13 6.9
5 Peoples United 856 17 6.9
10 Camden National Corp. 382 7 3.1
Other Banks 3,958 85 32.0
Total Cumberland/York County $12,402 183
Checking
32%
Saving/Money
Market 27%
CD's
13%
Borrowings
28%

Focused on Growing and
Diversifying Revenue
Fee income is 25% of total
revenue (net interest income plus
fee income)
10
15%
19%
20%
21%
26%
$0 $1 $2 $3 $4 $5
Other income
Mortgage banking income
Wealth management & brokerage
Debit card income
Service charges
Millions
YTD 2017 Fee Income Diversification
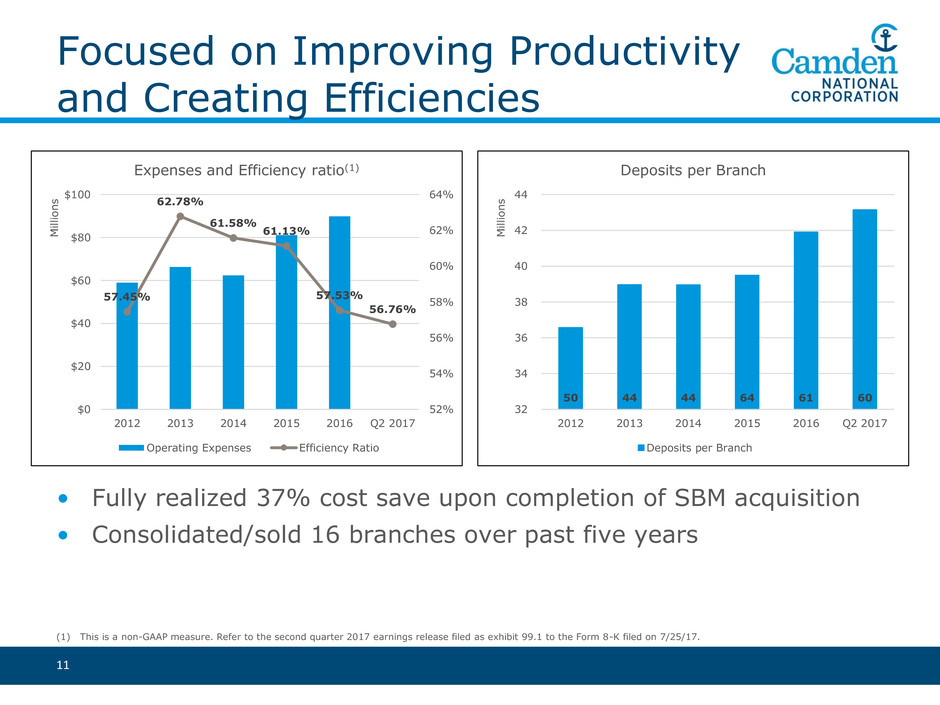
Focused on Improving Productivity
and Creating Efficiencies
11
57.45%
62.78%
61.58%
61.13%
57.53%
56.76%
52%
54%
56%
58%
60%
62%
64%
$0
$20
$40
$60
$80
$100
2012 2013 2014 2015 2016 Q2 2017
M
il
li
o
n
s
Expenses and Efficiency ratio(1)
Operating Expenses Efficiency Ratio
50 44 44 64 61 60
32
34
36
38
40
42
44
2012 2013 2014 2015 2016 Q2 2017
M
il
li
o
n
s
Deposits per Branch
Deposits per Branch
• Fully realized 37% cost save upon completion of SBM acquisition
• Consolidated/sold 16 branches over past five years
(1) This is a non-GAAP measure. Refer to the second quarter 2017 earnings release filed as exhibit 99.1 to the Form 8-K filed on 7/25/17.

Balanced Loan Mix &
Strong Credit Culture
12
Q2 2017
Average Loans: $2.7 billion
Average Yield: 4.23%
• Internal lending limit of $37 million
• Four Credit Relationships over $25
million
1. Assisted Living
2. Insurance
3. Hospital
4. Business Office
• Commercial Diversification
$318 million Nonresidential Building
Operator
$219 million Hotels and Motels
$156 million Apartment Building
Operators
Commercial
15%
Commercial
Real Estate
41%
Residential
Mortgages
31%
Home
Equity/Consumer
13%
YTD 2017 2016 2015
Nonperforming assets / total assets 0.77% 0.67% 0.66%
30-89 days past due loans / total loans 0.32% 0.24% 0.40%
Provision for loan losses / average loans
(annualized)
0.15% 0.21% 0.10%
Net charge-offs / average loans
(annualized)
0.05% 0.13% 0.10%
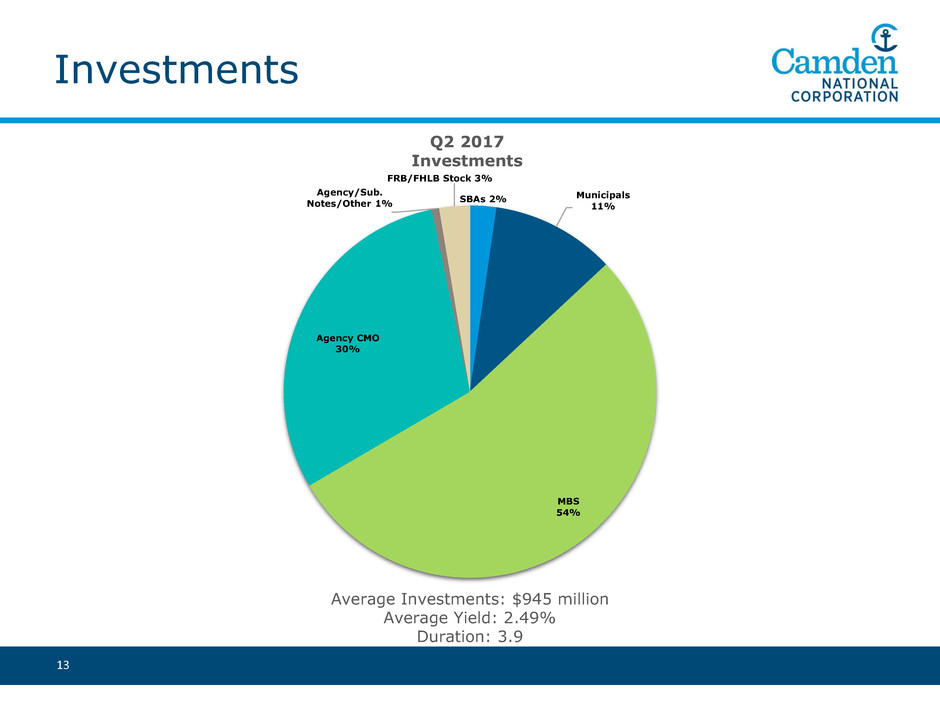
Investments
Average Investments: $945 million
Average Yield: 2.49%
Duration: 3.9
Q2 2017
Investments
13
SBAs 2% Municipals
11%
MBS
54%
Agency CMO
30%
Agency/Sub.
Notes/Other 1%
FRB/FHLB Stock 3%
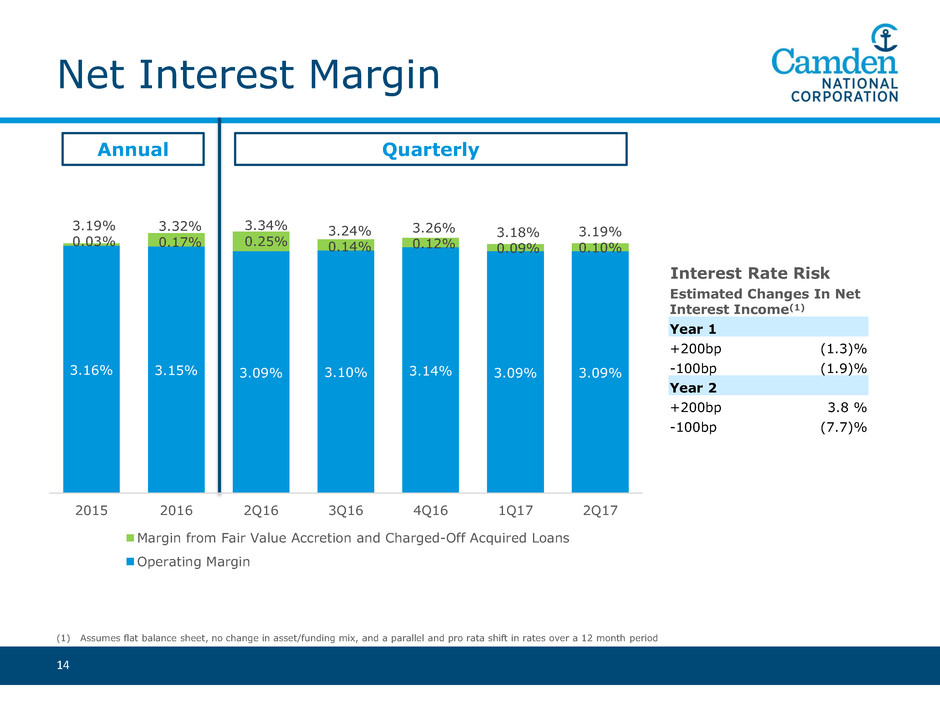
Net Interest Margin
14
Estimated Changes In Net
Interest Income(1)
Year 1
+200bp (1.3)%
-100bp (1.9)%
Year 2
+200bp 3.8 %
-100bp (7.7)%
Interest Rate Risk
(1) Assumes flat balance sheet, no change in asset/funding mix, and a parallel and pro rata shift in rates over a 12 month period
3.16% 3.15% 3.09% 3.10% 3.14% 3.09% 3.09%
3.19%
0.03%
3.32%
0.17%
3.34%
0.25%
3.24%
0.14%
3.26%
0.12%
3.18%
0.09%
3.19%
0.10%
2015 2016 2Q16 3Q16 4Q16 1Q17 2Q17
Margin from Fair Value Accretion and Charged-Off Acquired Loans
Operating Margin
Annual Quarterly
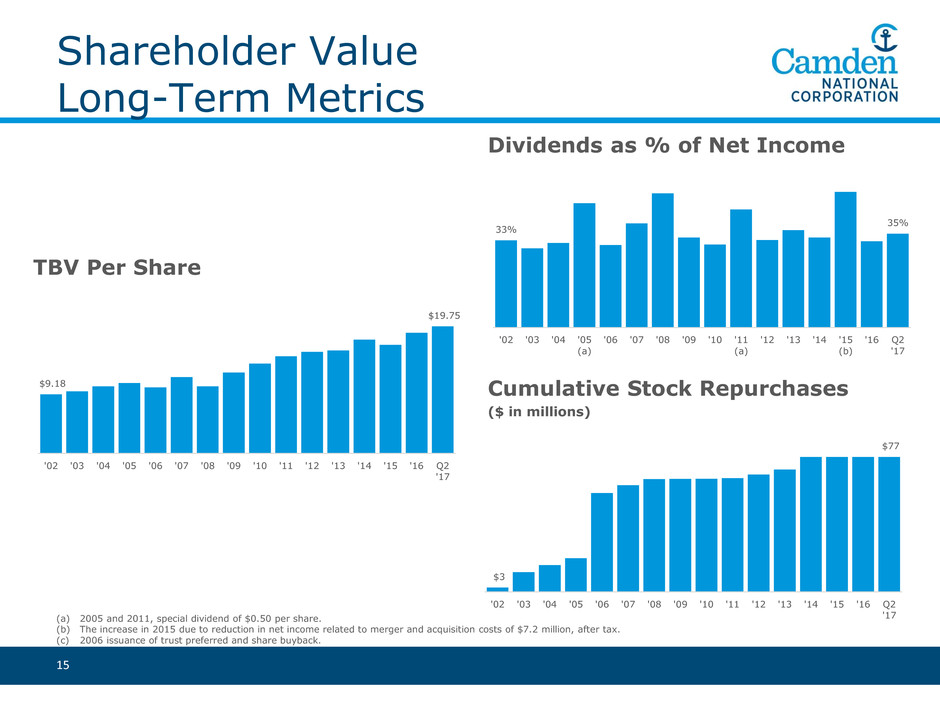
Shareholder Value
Long-Term Metrics
15
(a) 2005 and 2011, special dividend of $0.50 per share.
(b) The increase in 2015 due to reduction in net income related to merger and acquisition costs of $7.2 million, after tax.
(c) 2006 issuance of trust preferred and share buyback.
Dividends as % of Net Income
Cumulative Stock Repurchases
($ in millions)
TBV Per Share
$9.18
$19.75
'02 '03 '04 '05 '06 '07 '08 '09 '10 '11 '12 '13 '14 '15 '16 Q2
'17
33%
35%
'02 '03 '04 '05
(a)
'06 '07 '08 '09 '10 '11
(a)
'12 '13 '14 '15
(b)
'16 Q2
'17
$3
$77
'02 '03 '04 '05 '06 '07 '08 '09 '10 '11 '12 '13 '14 '15 '16 Q2
'17
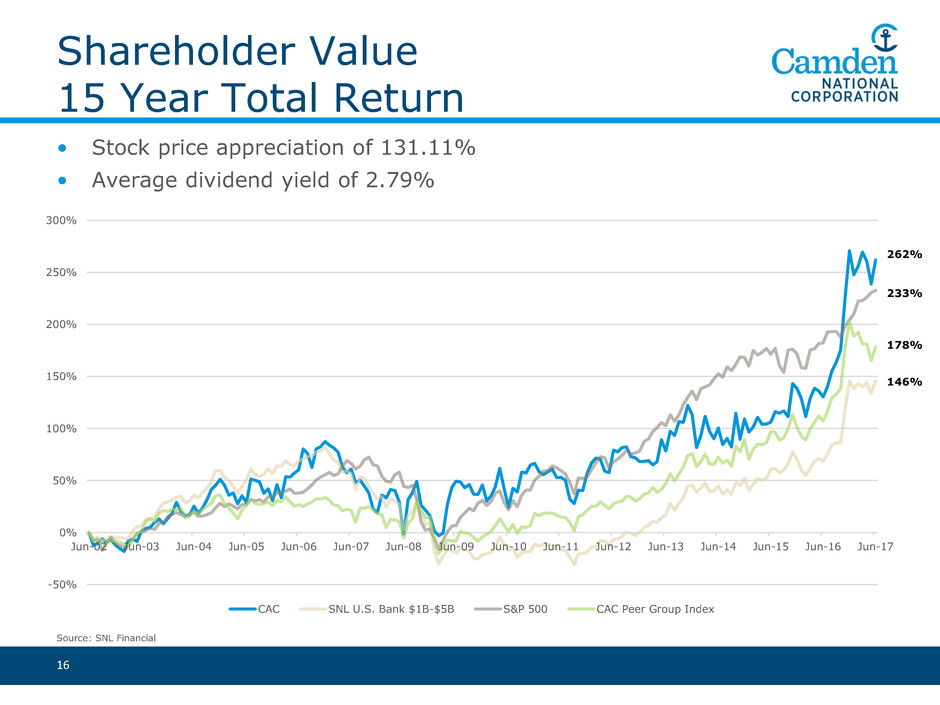
Shareholder Value
15 Year Total Return
16
Source: SNL Financial
• Stock price appreciation of 131.11%
• Average dividend yield of 2.79%
262%
233%
178%
-50%
0%
50%
100%
150%
200%
250%
300%
Jun-02 Jun-03 Jun-04 Jun-05 Jun-06 Jun-07 Jun-08 Jun-09 Jun-10 Jun-11 Jun-12 Jun-13 Jun-14 Jun-15 Jun-16 Jun-17
CAC SNL U.S. Bank $1B-$5B S&P 500 CAC Peer Group Index
146%
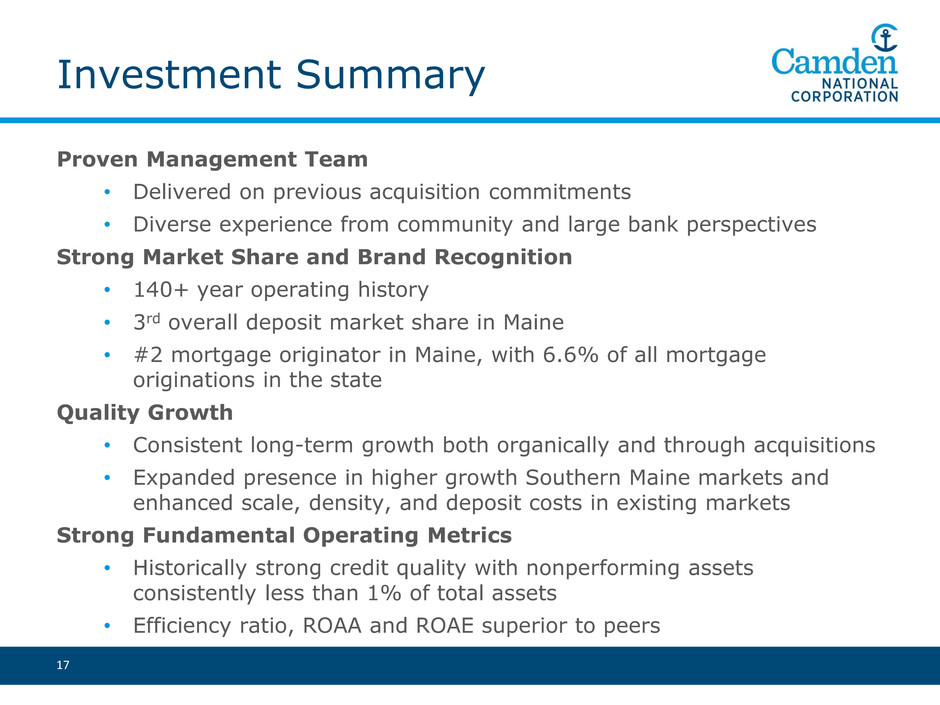
Investment Summary
Proven Management Team
• Delivered on previous acquisition commitments
• Diverse experience from community and large bank perspectives
Strong Market Share and Brand Recognition
• 140+ year operating history
• 3rd overall deposit market share in Maine
• #2 mortgage originator in Maine, with 6.6% of all mortgage
originations in the state
Quality Growth
• Consistent long-term growth both organically and through acquisitions
• Expanded presence in higher growth Southern Maine markets and
enhanced scale, density, and deposit costs in existing markets
Strong Fundamental Operating Metrics
• Historically strong credit quality with nonperforming assets
consistently less than 1% of total assets
• Efficiency ratio, ROAA and ROAE superior to peers
17
18
Appendix

Seasoned Management Team
19
Name Position Age
Years of
Banking
Experience
Year joined
Camden
Greg Dufour President and CEO 57 25+ 2001
Debbie Jordan, CPA COO & CFO 51 20+ 2008
Joanne Campbell EVP Risk Management 55 30+ 1996
Edmund Hayden EVP Chief Credit Officer 61 30+ 2015
Tim Nightingale EVP Senior Loan Officer 59 30+ 2000
Renee Smyth
EVP Chief Experience &
Marketing Officer
46 15+ 2015
Edward Walbridge SVP Human Resources 56 15+ 2016
Mary Beth Haut Director of Wealth Management 53 30+ 2016
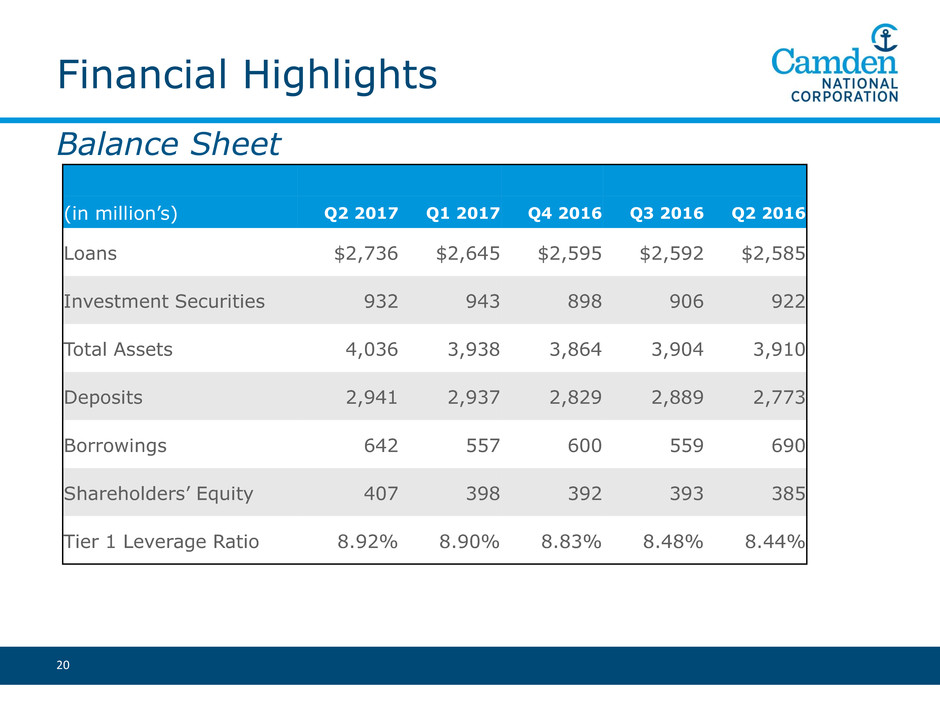
Financial Highlights
20
(in million’s) Q2 2017 Q1 2017 Q4 2016 Q3 2016 Q2 2016
Loans $2,736 $2,645 $2,595 $2,592 $2,585
Investment Securities 932 943 898 906 922
Total Assets 4,036 3,938 3,864 3,904 3,910
Deposits 2,941 2,937 2,829 2,889 2,773
Borrowings 642 557 600 559 690
Shareholders’ Equity 407 398 392 393 385
Tier 1 Leverage Ratio 8.92% 8.90% 8.83% 8.48% 8.44%
Balance Sheet
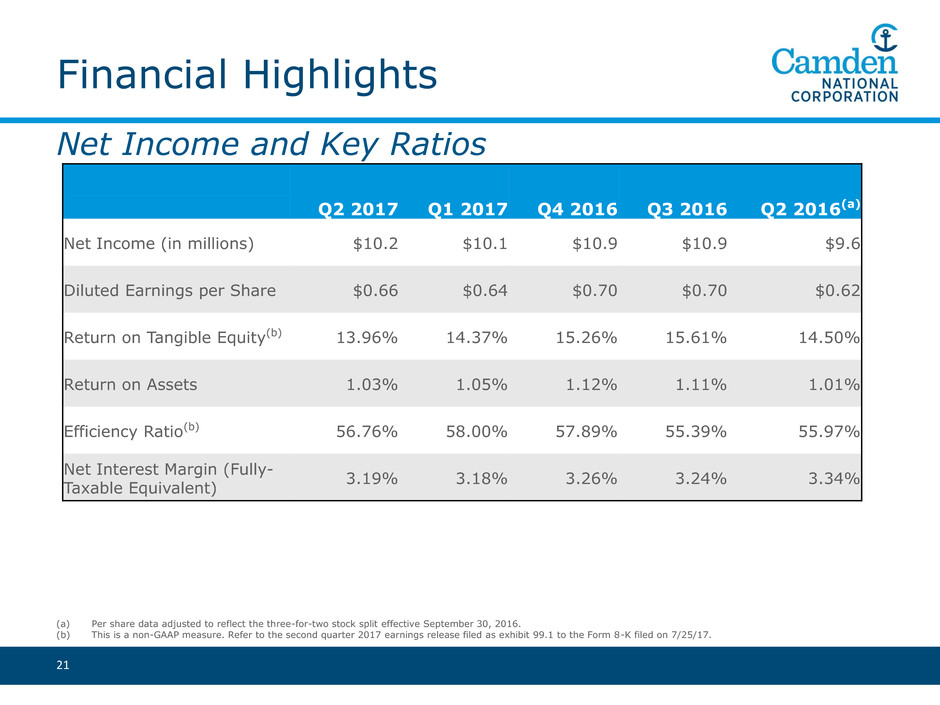
Net Income and Key Ratios
Financial Highlights
21
Q2 2017 Q1 2017 Q4 2016 Q3 2016 Q2 2016(a)
Net Income (in millions) $10.2 $10.1 $10.9 $10.9 $9.6
Diluted Earnings per Share $0.66 $0.64 $0.70 $0.70 $0.62
Return on Tangible Equity(b) 13.96% 14.37% 15.26% 15.61% 14.50%
Return on Assets 1.03% 1.05% 1.12% 1.11% 1.01%
Efficiency Ratio(b) 56.76% 58.00% 57.89% 55.39% 55.97%
Net Interest Margin (Fully-
Taxable Equivalent)
3.19% 3.18% 3.26% 3.24% 3.34%
(a) Per share data adjusted to reflect the three-for-two stock split effective September 30, 2016.
(b) This is a non-GAAP measure. Refer to the second quarter 2017 earnings release filed as exhibit 99.1 to the Form 8-K filed on 7/25/17.
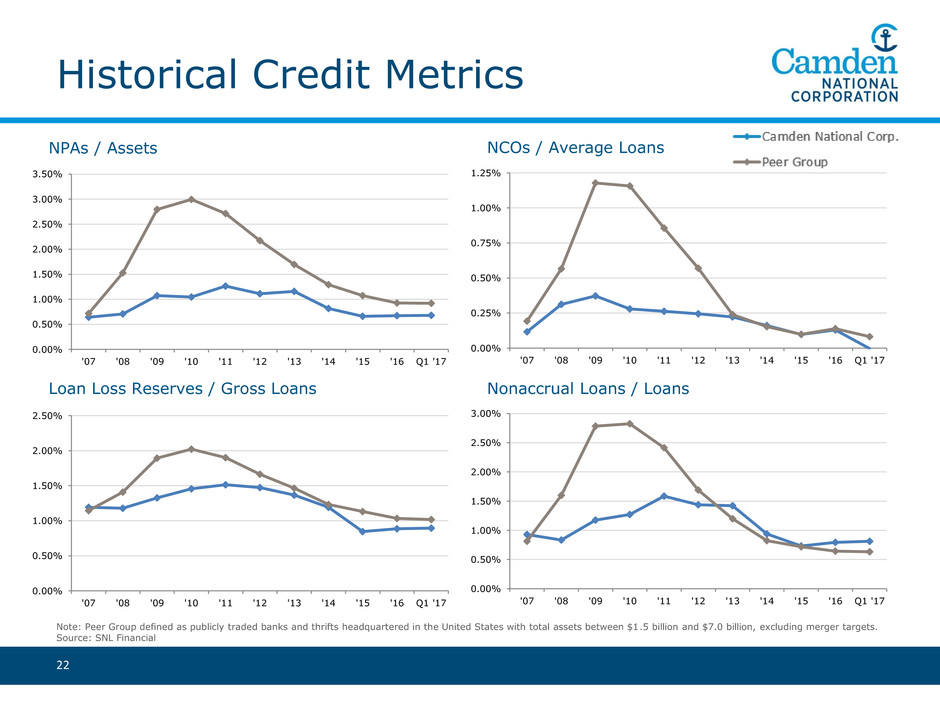
Historical Credit Metrics
Note: Peer Group defined as publicly traded banks and thrifts headquartered in the United States with total assets between $1.5 billion and $7.0 billion, excluding merger targets.
Source: SNL Financial
22
NPAs / Assets NCOs / Average Loans
Loan Loss Reserves / Gross Loans Nonaccrual Loans / Loans
0.00%
0.50%
1.00%
1.50%
2.00%
2.50%
3.00%
3.50%
'07 '08 '09 '10 '11 '12 '13 '14 '15 '16 Q1 '17
0.00%
0.50%
1.00%
1.50%
2.00%
2.50%
'07 '08 '09 '10 '11 '12 '13 '14 '15 '16 Q1 '17
0.00%
0.25%
0.50%
0.75%
1.00%
1.25%
'07 '08 '09 '10 '11 '12 '13 '14 '15 '16 Q1 '17
0.00%
0.50%
1.00%
1.50%
2.00%
2.50%
3.00%
'07 '08 '09 '10 '11 '12 '13 '14 '15 '16 Q1 '17
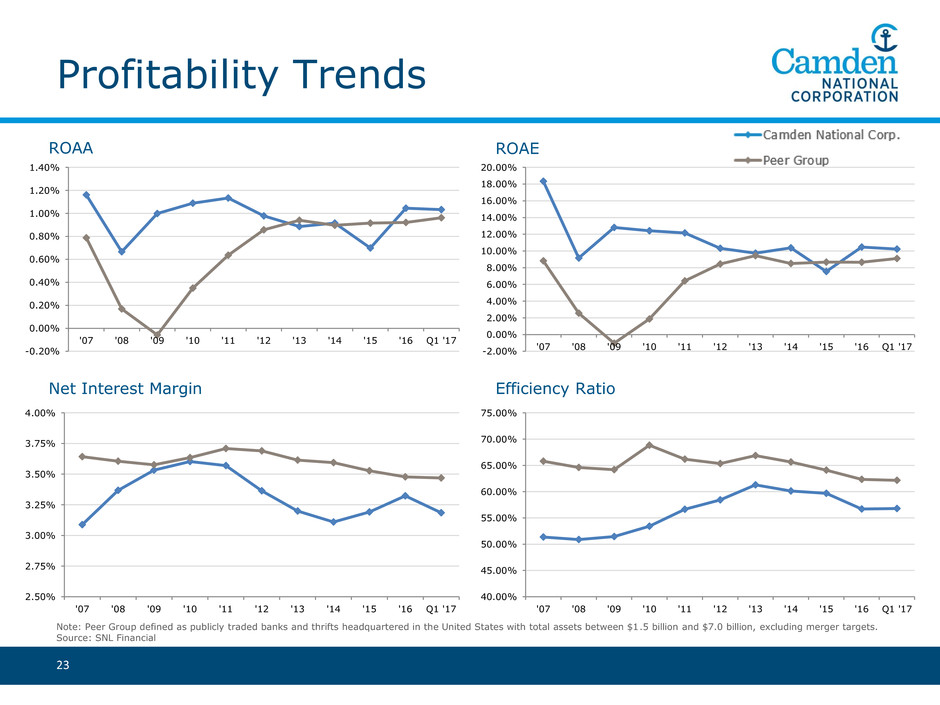
Profitability Trends
Note: Peer Group defined as publicly traded banks and thrifts headquartered in the United States with total assets between $1.5 billion and $7.0 billion, excluding merger targets.
Source: SNL Financial
23
ROAA ROAE
Net Interest Margin Efficiency Ratio
-0.20%
0.00%
0.20%
0.40%
0.60%
0.80%
1.00%
1.20%
1.40%
'07 '08 '09 '10 '11 '12 '13 '14 '15 '16 Q1 '17
2.50%
2.75%
3.00%
3.25%
3.50%
3.75%
4.00%
'07 '08 '09 '10 '11 '12 '13 '14 '15 '16 Q1 '17
-2.00%
0.00%
2.00%
4.00%
6.00%
8.00%
10.00%
12.00%
14.00%
16.00%
18.00%
20.00%
'07 '08 '09 '10 '11 '12 '13 '14 '15 '16 Q1 '17
40.00%
45.00%
50.00%
55.00%
60.00%
65.00%
70.00%
75.00%
'07 '08 '09 '10 '11 '12 '13 '14 '15 '16 Q1 '17
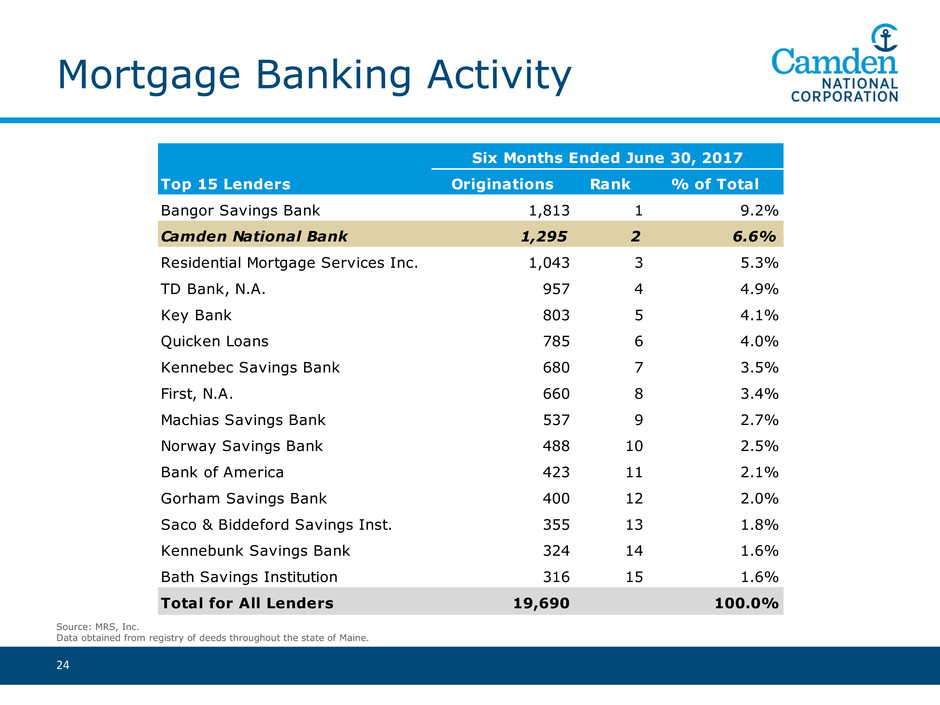
Mortgage Banking Activity
24
Source: MRS, Inc.
Data obtained from registry of deeds throughout the state of Maine.
Top 15 Lenders Originations Rank % of Total
Bangor Savings Bank 1,813 1 9.2%
Camden National Bank 1,295 2 6.6%
Residential Mortgage Services Inc. 1,043 3 5.3%
TD Bank, N.A. 957 4 4.9%
Key Bank 803 5 4.1%
Quicken Loans 785 6 4.0%
Kennebec Savings Bank 680 7 3.5%
First, N.A. 660 8 3.4%
Machias Savings Bank 537 9 2.7%
Norway Savings Bank 488 10 2.5%
Bank of America 423 11 2.1%
Gorham Savings Bank 400 12 2.0%
Saco & Biddeford Savings Inst. 355 13 1.8%
Kennebunk Savings Bank 324 14 1.6%
Bath Savings Institution 316 15 1.6%
Total for All Lenders 19,690 100.0%
Six Months Ended June 30, 2017

Market Overview
Sources: SNL Financial, U.S. Census, Bureau of Economic Analysis, me.gov, nh.gov, detma.org
25
Maine New Hampshire Massachusetts
Population in Millions
(Jun 2017)
1.33 1.34 6.86
Population Increase
(Apr 2010-Jul 2016)
0.2% 1.4% 4.0%
Projected Population Change
(2017-2022)
0.3% 1.3% 3.5%
Median Household Income
(Jun 2017)
$51,499 $70,952 $72,859
Projected HH Income Change
(2017-2022)
6.8% 9.0% 8.9%
Unemployment Rate
(Jun 2017)
3.5% 2.9% 4.3%
GDP Growth
(2015-2016)
1.4% 3.0% 2.0%
De
mo
gra
ph
ics
Ec
on
om
ics
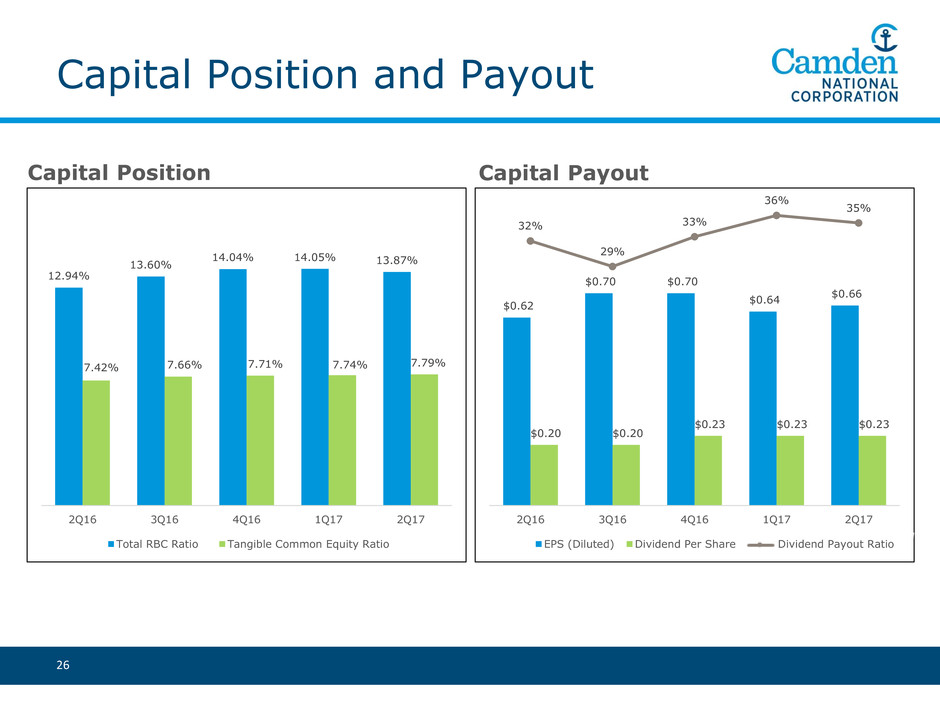
Capital Position and Payout
26
$0.62
$0.70 $0.70
$0.64
$0.66
$0.20 $0.20
$0.23 $0.23 $0.23
2Q16 3Q16 4Q16 1Q17 2Q17
EPS (Diluted) Dividend Per Share
32%
29%
33%
36%
35%
12.94%
13.60%
14.04% 14.05% 13.87%
7.42% 7.66% 7.71% 7.74% 7.79%
2Q16 3Q16 4Q16 1Q17 2Q17
Total RBC Ratio Tangible Common Equity Ratio Dividend Payout Ratio
Capital Position Capital Payout
