Attached files
| file | filename |
|---|---|
| 8-K - 8-K - PEAPACK GLADSTONE FINANCIAL CORP | form8k-18435_pgfc.htm |
Exhibit 99.1

Investor Presentation “Expanding Our Reach” Strategic Update 06/30/2017 P EAPACK - G LADSTONE B ANK

The foregoing contains forward - looking statements within the meaning of the Private Securities Litigation Reform Act of 1995. Such statements are not historical facts and include expressions about Management’s view of future interest income and net loans, Man agement’s confidence and strategies and Management’s expectations about new and existing programs and products, investments, relationsh ips , opportunities and market conditions. These statements may be identified by such forward - looking terminology as “expect”, “look”, “believe”, “anticipate”, “may”, or similar statements or variations of such terms. Actual results may differ materially from such forwar d - l ooking statements. Factors that may cause actual results to differ materially from those contemplated by such forward - looking statement s include, but are not limited to those risk factors identified in the Company’s Form 10 - K for the year ended December 31, 2016, in additio n to/which include the following: a) inability to successfully grow our business and implement our strategic plan, including an inability to generate revenues to offset the increased personnel and other costs related to the strategic plan; b) the impact of anticipated higher op erating expenses in 2017 and beyond; c) inability to manage our growth; d) inability to successfully integrate our expanded employee bas e; e) an unexpected decline in the economy, in particular in our New Jersey and New York market areas; f) declines in our net interest ma rgin caused by the low interest rate environment and highly competitive market; g) declines in value in our investment portfolio; h) high er than expected increases in our allowance for loan losses; i ) higher than expected increases in loan losses or in the level of nonperforming loans; j) unexpected changes in interest rates; k) an unexpected decline in real estate values within our market areas; l) legislative and regulatory actions (including the impact of the Dodd - Frank Wall Street Reform and Consumer Protection Act, Basel III and related regulation s) subject us to additional regulatory oversight which may result in increased compliance costs; m) successful cyberattacks against our IT inf rastructure and that of our IT providers; n) higher than expected FDIC insurance premiums; o) adverse weather conditions; p) inability to suc ces sfully generate new business in new geographic markets; q) inability to execute upon new business initiatives; r) lack of liquidity to fund o ur various cash obligations; s) reduction in our lower - cost funding sources; t) our inability to adapt to technological changes; u) claims and l itigation pertaining to fiduciary responsibility, environmental laws and other matters; and v) other unexpected material adverse changes in our op era tions or earnings. The Company assumes no responsibility to update such forward - looking statements in the future even if experience shows that the indicated results or events will not be realized. Although we believe that the expectations reflected in the forward - looking statements ar e reasonable, the Company cannot guarantee future results, levels of activity, performance, or achievements. Statement Regarding Forward - Looking Information 2

• Full service banking with every conversation aimed at helping clients create , grow , protect & eventually transition their wealth. • Deep understanding of our clients needs , goals, and aspirations. » It’s about the client; not about us. » Risk management tolerance, time horizon, and other traditional variables are all considered. • Our Strategy is attracting higher value clients. • A Senior Private Banker leads a TEAM to develop and deliver customized solutions. • As One Team , everyone in the Bank helps deliver an exceptional client experience . • Employees are empowered to solve any client service issue. • Our Strategy is an ongoing journey that continually focuses on: » Ensuring our Core Principles are part of our employee culture. » Listening to our clients and consistently delivering the PGB Experience. » Listening to our staff and delivering a best - in - class employee experience. » Continued innovation and differentiation through technology. The Peapack - Gladstone Private Banking Model 3

People Market Efficiency, Growth, and Profitability • Shared common vision • Very talented team with ties to the market • High levels of motivation and engagement • Act as a single team • Entrepreneurial culture • We operate in three of the top ten most affluent counties nationwide • New York MSA offers considerable growth opportunity • Large and small banks underserving the wealth related needs in this market • Improved operating leverage is delivering positive earnings momentum • People, products, market - depth and superior delivery ensure future growth • Eye toward capitalizing on emerging market opportunities • Nimble and flexible • Enviable revenue mix Unique Business Model • Holistic, “wealth centric”, advice - led approach • Private Banker acts as a lead point of contact • “Brand of One” • Fee income growth a key area of focus • Sophisticated processes to Enterprise Risk, CRE, and balance sheet management • Excellent risk leadership team • Solid governance including Firm and Board Risk Committees Risk Management Drivers for Creating Sustainable Long - Term Shareholder Value People Market Efficiency, Growth, and Profitability • Shared common vision • Very talented team with ties to the market • High levels of motivation and engagement • Act as a single team • Entrepreneurial culture • We operate in three of the top ten most affluent counties nationwide • New York MSA offers considerable growth opportunity • Large and small banks underserving the wealth related needs in this market Unique Business Model • Holistic, “wealth centric”, advice - led approach • Private Banker acts as a lead point of contact • “Brand of One” • Fee income growth a key area of focus • Sophisticated processes to Enterprise Risk, CRE, and balance sheet management • Excellent risk leadership team • Solid governance including Firm and Board Risk Committees Risk Management People Market • Shared common vision • Very talented team with ties to the market • High levels of motivation and engagement • Act as a single team • Entrepreneurial culture • We operate in three of the top ten most affluent counties nationwide • New York MSA offers considerable growth opportunity • Large and small banks underserving the wealth related needs in this market Unique Business Model • Holistic, “wealth centric”, advice - led approach • Private Banker acts as a lead point of contact • “Brand of One” • Fee income growth a key area of focus Risk Management 4

Markets • Tighter margins due to a flattening yield curve. Government • Increased regulatory and compliance costs. Technology • Continued migration from “bricks and mortar” to technology based delivery channels. Launched in 2013, “Expanding Our Reach” was Designed to Mitigate These Headwinds 5

Population Household Income Median HHI Total Projected $100K - $199K > $200K Projected Branches Population Change Change % of % of HHI Change in Market 20172010-20172017-2022 Number Total Number Total 20172017-2022 NJ Market (County) Total PGC (Actual) (%) (%) (Actual)Market (Actual)Market ($) (%)Rank¹ Markets with PGC Branches Hunterdon, NJ 49 4 124,962 (2.64%) (0.39%) 15,833 34% 9,933 21% $112,337 6.86% 1 Morris, NJ 221 6 500,642 1.70% 1.40% 59,833 32% 37,127 20% $105,146 7.10% 3 Somerset, NJ 129 9 335,954 3.87% 2.50% 38,855 32% 25,902 21% $106,919 8.58% 2 Union, NJ 187 1 560,982 4.56% 2.94% 47,404 24% 24,285 12% $72,505 8.38% 12 PGC Branch Markets 586 20 1,522,540 2.83% 2.06% 161,925 30% 97,247 18% Weighted Avg.: PGC Branch Markets 2.82% 2.01% $105,681 8.07% Markets with PGC Private Banking Office Only Bergen, NJ 457 - 947,782 4.71% 3.03% 102,822 29% 53,625 15% $88,821 5.49% 5 Mercer, NJ 143 - 372,157 1.54% 1.27% 34,920 26% 17,689 13% $76,922 5.63% 10 Aggregate: State of NJ 3,014 20 8,999,188 2.36% 1.82% 868,908 26% 387,608 12% $75,854 8.08% Aggregate: National 20 325,139,271 5.31% 3.77% $57,462 7.27% 1. Rank reflects ranking amongst all New Jersey counties Note: Data is pro forma for pending acquisitions; weighted average is calculated as the sum of (percent of state/national fra nch ise * demographic item) within each market; banks, thrifts, and savings banks included (retail branches only) Sources: SNL Financial, Nielsen; as of January 25, 2017 New Jersey Market Overview 6
• $3.9 billion in AUA as of 06/30/17. • YTD 2017 Managed AUM inflows of $244 million vs. $250 million in all of 2016. • Murphy Capital Management acquisition announced 05/26/2017. • Stage is set for additional strategic wealth management acquisitions. • Wealth and relationship - based residential lending is a lead product for wealth opportunities. • Growing internal referrals from Commercial and Retail segments. • Solid and growing referrals from legal/CPA professionals. Central to Our Strategy: Wealth Management 7

Wealth Management Assets Under Admin Wealth Management Fee Income Wealth Management Performance $8.00 $10.00 $12.00 $14.00 $16.00 $18.00 $20.00 2012 2013 2014 2015 2016 6/30/17 (Dollars in Millions) $2.0 $2.3 $2.5 $2.8 $3.0 $3.3 $3.5 $3.8 $4.0 2012 2013 2014 2015 2016 6/30/17 (Dollars in Billions) $12.28 $13.84 $15.24 $17.04 $2.3 $2.7 $3.0 $3.7 $3.3 $18.24 8 $9.90 $3.9 $9.00 $8.00 $7.00 $6.00 $5.00 $4.00 $10.00
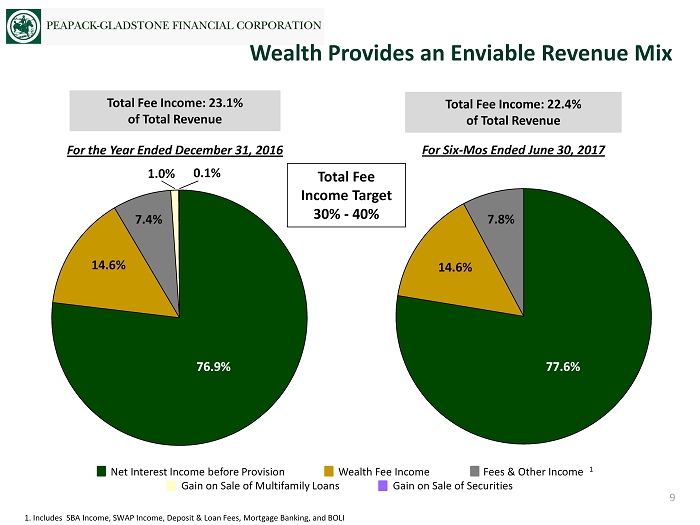
1. Includes SBA Income, SWAP Income, Deposit & Loan Fees, Mortgage Banking, and BOLI Wealth Provides an Enviable Revenue Mix 76.9% 14.6% 7.4% 0.1% 1.0% 77.6% 14.6% 7.8% For Six - Mos Ended June 30, 2017 For the Year Ended December 31, 2016 Total Fee Income: 22.4% of Total Revenue Total Fee Income: 23.1% of Total Revenue Net Interest Income before Provision Wealth Fee Income Fees & Other Income Gain on Sale of Multifamily Loans Gain on Sale of Securities 1 Total Fee Income Target 30% - 40% 9
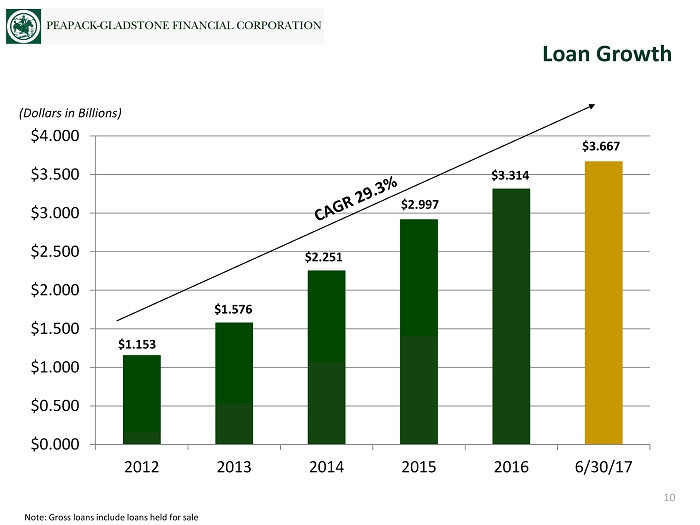
Note: Gross loans include loans held for sale Loan Growth $0.000 $0.500 $1.000 $1.500 $2.000 $2.500 $3.000 $3.500 $4.000 2012 2013 2014 2015 2016 6/30/17 $2.997 $2.251 $1.576 $1.153 $3.314 (Dollars in Billions) 10 $3.667

Loan Mix Transformational Change Multifamily Commercial & Industrial CRE Resident ial , Consumer & Other 41.0% 16.6% 21.9% 20.5% 14.0% 10.0% 22.4% 53.6% 12/31/2012 6/30/2017 Target: 25% - 35% Target: 30% - 35% Target: 15% - 20% Target: 15% - 25% 11
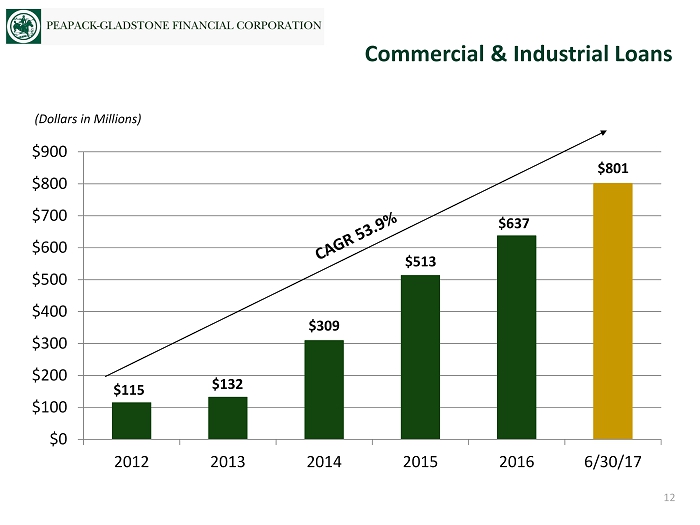
Commercial & Industrial Loans $0 $100 $200 $300 $400 $500 $600 $700 $800 $900 2012 2013 2014 2015 2016 6/30/17 (Dollars in Millions) $115 $132 $309 $513 $637 12 $801

Multifamily Loans as a Percentage of Risk Based Capital are Declining $100 $300 $500 $700 $900 $1,100 $1,300 $1,500 $1,700 2012 2013 2014 2015 2016 6/30/17 (Dollars in Millions) $162 $542 $1,080 $1,499 $1,460 Note: Multifamily Loans include loans held for sale 504% RBC 13 $1,505 372% RBC 352% RBC
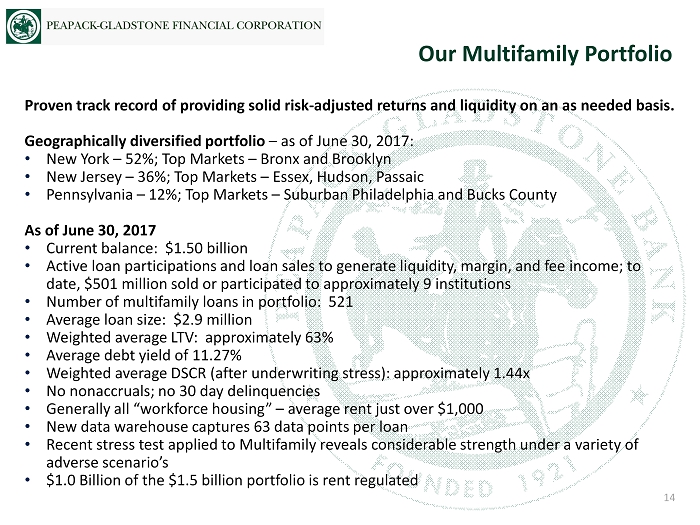
Proven track record of providing solid risk - adjusted returns and liquidity on an as needed basis. Geographically diversified portfolio – as of June 30, 2017: • New York – 52%; Top Markets – Bronx and Brooklyn • New Jersey – 36%; Top Markets – Essex, Hudson, Passaic • Pennsylvania – 12%; Top Markets – Suburban Philadelphia and Bucks County As of June 30, 2017 • Current balance: $1.50 billion • Active loan participations and loan sales to generate liquidity, margin, and fee income; to date, $501 million sold or participated to approximately 9 institutions • Number of multifamily loans in portfolio: 521 • Average loan size: $2.9 million • Weighted average LTV: approximately 63% • Average debt yield of 11.27% • Weighted average DSCR (after underwriting stress): approximately 1.44x • No nonaccruals; no 30 day delinquencies • Generally all “workforce housing” – average rent just over $1,000 • New data warehouse captures 63 data points per loan • Recent stress test applied to Multifamily reveals considerable strength under a variety of adverse scenario’s • $1.0 Billion of the $1.5 billion portfolio is rent regulated Our Multifamily Portfolio 14

1. Nonperforming loans defined as nonaccrual loans plus loans 90+ days past due 2. Texas Ratio defined as nonaccrual loans plus other real estate owned and loans 90+ day past due as a percentage of the sum of tangible common equity and loan loss reserves Texas Ratio² NPLs¹ / Loans NCOs / Average Loans ALLL / Gross Loans Credit Risk Management - Metrics & Performance 0.00% 0.20% 0.40% 0.60% 0.80% 1.00% 1.20% 2012 2013 2014 2015 2016 6/30/17 0.00% 2.00% 4.00% 6.00% 8.00% 10.00% 12.00% 2012 2013 2014 2015 2016 6/30/17 0.75% 1.00% 1.25% 1.50% 2012 2013 2014 2015 2016 6/30/17 0.00% 0.20% 0.40% 0.60% 0.80% 1.00% 2012 2013 2014 2015 2016 6/30/17 0.42% 0.30% 0.23% 0.34% 1.04% 11.34% 4.62% 3.13% 2.45% 3.34% 1.12% 0.98% 0.87% 0.89% 0.97% 0.04% 0.80% 0.06% 0.03% 0.04% 15 0.43% 4.11% 0.98% 0.01%

Operating Efficiency: Deposits Per Branch $50 $70 $90 $110 $130 $150 $170 $190 12/31/12 12/31/13 12/31/14 12/31/15 12/31/16 6/30/17 (Dollars in Millions) $66 $171 $72 $100 16 $100 $140 $179

Operating Efficiency: Loans Per Employee $3,000 $4,000 $5,000 $6,000 $7,000 $8,000 $9,000 $10,000 12/31/13 12/31/14 12/31/15 12/31/16 6/30/17 (Dollars in Thousands) 4,835 7,357 9,484 9,804 17 9,991
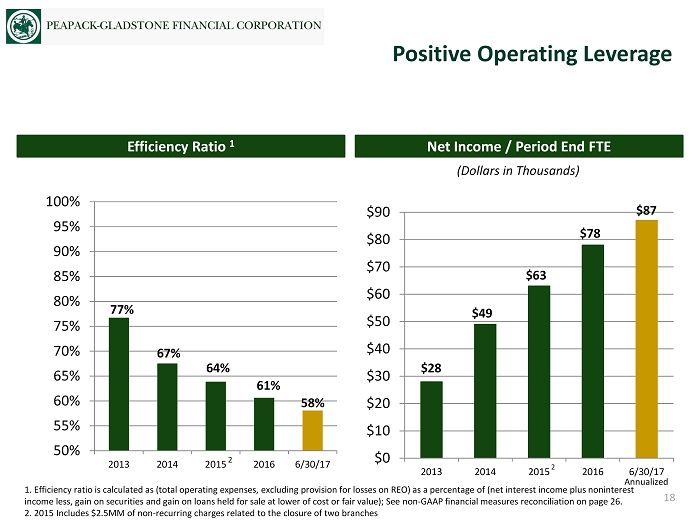
1. Efficiency ratio is calculated as (total operating expenses, excluding provision for losses on REO) as a percentage of (ne t i nterest income plus noninterest income less, gain on securities and gain on loans held for sale at lower of cost or fair value); See non - GAAP financial measures reconciliation on page 26. 2. 2015 Includes $2.5MM of non - recurring charges related to the closure of two branches Net Income / Period End FTE Efficiency Ratio 1 (Dollars in Thousands) Positive Operating Leverage 50% 55% 60% 65% 70% 75% 80% 85% 90% 95% 100% 2013 2014 2015 2016 6/30/17 61% $0 $10 $20 $30 $40 $50 $60 $70 $80 $90 2013 2014 2015 2016 6/30/17 $28 $49 $63 $78 2 64% 67% 77% 2 18 58% $87 Annualized

1. 2015 reflects reported net income and EPS as per 10 - K; includes $2.50 million of pre - tax non - recurring charges related to the closure of two branches Earnings Momentum $5.00 $10.00 $15.00 $20.00 $25.00 $30.00 $35.00 2013 2014 2015 2016 6/30/16 6/30/17 1 Net Income Earnings Per Share $0.40 $0.60 $0.80 $1.00 $1.20 $1.40 $1.60 $1.80 $2.00 2013 2014 2015 2016 6/30/16 6/30/17 $9.26 $14.89 $19.97 $26.48 $1.01 $1.22 $1.29 $1.60 1 (Dollars in Millions) 19 $15.92 $0.91 $12.05 $0.74 YOY Growth +32% YOY Growth +23% $17.50 $15.00 $12.50 $10.00 $7.50 $5.00 $2.50 $1.00 $0.80 $0.70 $0.60 $0.50 $0.40 $0.30 $0.20 $0.90 YTD YTD YTD YTD

Enhanced Returns 6.00% 6.50% 7.00% 7.50% 8.00% 8.50% 9.00% 9.50% 10.00% 2013 2014 2015 2016 6/30/17 Return on Average Equity (ROAE) Return on Average Assets (ROAA) 0.40% 0.50% 0.60% 0.70% 0.80% 0.90% 1.00% 2013 2014 2015 2016 6/30/17 7.37% 7.96% 7.71% 8.92% 0.54% 0.63% 0.64% 0.72% 1. 2015 includes $2.5MM of non - recurring charges related to the closure of two branches 1 1 20 9.33% 0.80% YTD YTD

Our Strategy is Delivering Value Note: Market data as of June 30, 2017 Source: SNL Financial One Year Comparative Stock Price Performance 21 (10%) 0% 10% 20% 30% 40% 50% 60% 70% 80% 06/30/16 07/31/16 08/31/16 09/30/16 10/31/16 11/30/16 12/31/16 01/31/17 02/28/17 03/31/17 04/30/17 05/31/17 06/30/17 PGC +69.0% NASDAQ Bank +37.4% KBW Nasdaq Bank +47.4%
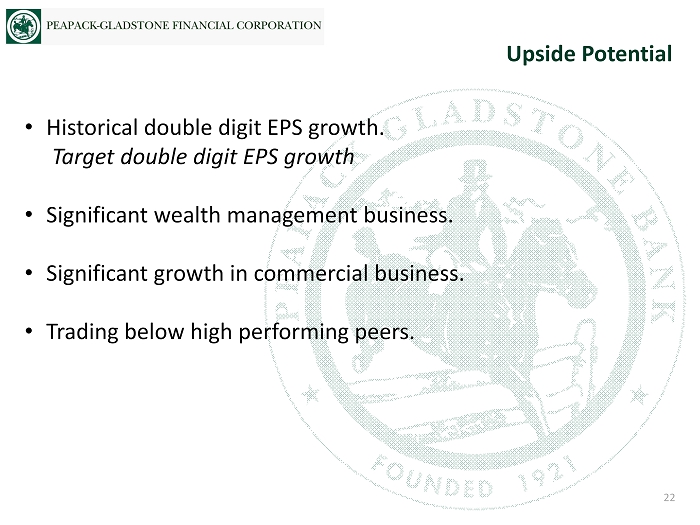
• Historical double digit EPS growth. Target double digit EPS growth • Significant wealth management business. • Significant growth in commercial business. • Trading below high performing peers. Upside Potential 22

• EPS Growth – Low double digit EPS growth. • Return on Equity – 10% target run rate early to mid 2018. • Efficiency Ratio – Targeting low to mid 50’s by early to mid 2018. • Balance Sheet Growth / Loan Growth – 10% to 15% annual balance sheet and loan growth • Loan Mix – Continued diversification into Commercial & Industrial and Wealth relationship based residential lending. Portfolio targets: » C&I (loans and leases): 30% - 35% (22% as of 6/30/2017) » CRE: 15% - 20% (17% as of 6/30/2017) » Multifamily: 25% - 35% (41% as of 6/30/2017) » Residential/Consumer: 15% - 25% (20% as of 6/30/2017) • Revenue Mix – Non - interest income target of 30% - 40%. Organic growth, Wealth M&A plus gains in Treasury Management fees, SBA sales, and back to back SWAP fees will drive this growth. • Funding – Continued funding from diversified sources. Net asset growth to be principally funded by core customer deposits. • Capital – Sufficient for business as usual; Shelf available for M&A and other strategic opportunities. Financial Targets: 2017 and Beyond 23

Appendix P EAPACK - G LADSTONE B ANK

Douglas L. Kennedy President & Chief Executive Officer 908.719.6554 38 years experience; Before joining in 2012, he served as President of the NJ Market for Capital One Bank. He has held key executive level positions and had great success building formidable regional and national specialty banking business at Fleet Bank, Summit Bancorp and Bank of America. He is a current Member of the NJ Chamber of Commerce Board of Directors, Montclair State University Board of Trustees, and Sacred Heart University Board of Trustees. He has served as President of NJ After 3 and as a Board Member of the NJ Bankers Association. John P. Babcock Senior EVP & President of Wealth Management 908.719.3301 35 years experience; Prior to joining, he was the managing director in charge of the Northeast Mid - Atlantic region for the HSBC Private Bank and, prior to that, he was the New York Metro Market Executive for U.S. Trust - the largest of U.S. Trust’s 53 markets in the U.S. In these and previous roles over the last 34 years, he has led commercial and wealth management/private bank businesses in New York City and regional markets through mergers, expansions, rapid growth and periods of significant organizational change. Jeffrey J. Carfora, CPA Senior EVP & Chief Financial Officer 908.719.4308 36 years experience; Joining as Executive Vice President and CFO in March 2009, he was promoted to Senior Executive Vice President in August 2013. Previously, he was affiliated with Penn Federal Savings Bank, where he joined as CFO and was later promoted to COO, Carteret Bank, and Marine Midland Bank. He began his career in 1980 with PriceWaterhouseCoopers . Finn M. W. Caspersen, Jr. Senior EVP, Chief Strategy Officer & General Counsel 908.719.6559 21 years experience; Before j oining in 2004, he worked as a corporate lawyer at Hale and Dorr, as an investment banker at Merrill Lynch and privately in venture capital. He has served as trustee of Cardigan Mountain School, Pomfret School, the Somerset Hills YMCA, the Willowwood Arboretum and the NJ Chapter of the Nature Conservancy. He was a two - term elected member of the Bedminster Township Committee and has also served on the Bedminster Environmental Commission and the Bedminster Land Use Board. Robert A. Plante EVP, Chief Operating Officer 908.470.3329 32 years experience; Before joining in 2017, served as executive vice president and chief operations officer/chief information officer at IDB New York, a $9.8 billion commercial bank, where he was a member of the credit risk, market risk and asset liability committees, r esponsible for all back - office support functions including payments, deposits, commercial and residential lending, treasury, custody, commercial cash management and information technology. Experienced Management Team 25

We believe that these non - GAAP financial measures provide information that is important to investors and that is useful in under standing our financial position, results and ratios. Our management internally assesses our performance based, in part, on these measures. However, these non - GAAP financ ial measures are supplemental and are not a substitute for an analysis based on GAAP measures. Non - GAAP Financial Measures Reconciliation 26 YTD YTD YTD YTD YTD 6/30/2017 2016 2015 2014 2013 Net Interest Income 52,563 96,435 84,452 67,894 52,776 Total Other Income 15,190 28,918 23,714 20,807 20,595 Less: Gain on Loans Sold Held for Sale at lower of cost or fair value 0 1,233 0 166 522 Less: Securities Gains, net 0 119 527 260 840 Total Recurring Revenue 67,753 124,001 107,639 88,275 72,009 Operating Expenses 39,399 75,112 68,926 59,540 55,183 Less: ORE Provision 0 0 250 0 0 Total Operating Expenses 39,399 75,112 68,676 59,540 55,183 Efficiency Ratio 58.15% 60.57% 63.80% 67.45% 76.63%