Attached files
| file | filename |
|---|---|
| 8-K - 8-K - COLUMBUS MCKINNON CORP | a8k060117.htm |
1 1
Gregory P. Rustowicz
Vice President – Finance & Chief Financial Officer
KeyBanc Industrials
Conference
June 1, 2017
2 2
Safe Harbor Statement
These slides contain (and the accompanying oral discussion will contain) “forward-looking statements” within the
meaning of the Private Securities Litigation Reform Act of 1995. Such statements involve known and unknown risks,
uncertainties and other factors that could cause the actual results of the Company to differ materially from the
results expressed or implied by such statements, including general economic and business conditions, conditions
affecting the industries served by the Company and its subsidiaries, conditions affecting the Company’s customers
and suppliers, competitor responses to the Company’s products and services, the overall market acceptance of
such products and services, the integration of acquisitions and other factors disclosed in the Company’s periodic
reports filed with the Securities and Exchange Commission. Consequently such forward looking statements should
be regarded as the Company’s current plans, estimates and beliefs. The Company does not undertake and
specifically declines any obligation to publicly release the results of any revisions to these forward-looking
statements that may be made to reflect any future events or circumstances after the date of such statements or
to reflect the occurrence of anticipated or unanticipated events.
This presentation will discuss some non-GAAP financial measures, which we believe are useful in evaluating
our performance. You should not consider the presentation of this additional information in isolation or as a
substitute for results compared in accordance with GAAP. We have provided reconciliations of comparable
GAAP to non-GAAP measures in tables found in the Supplemental Information portion of this presentation.
3 3
Columbus McKinnon Corporation
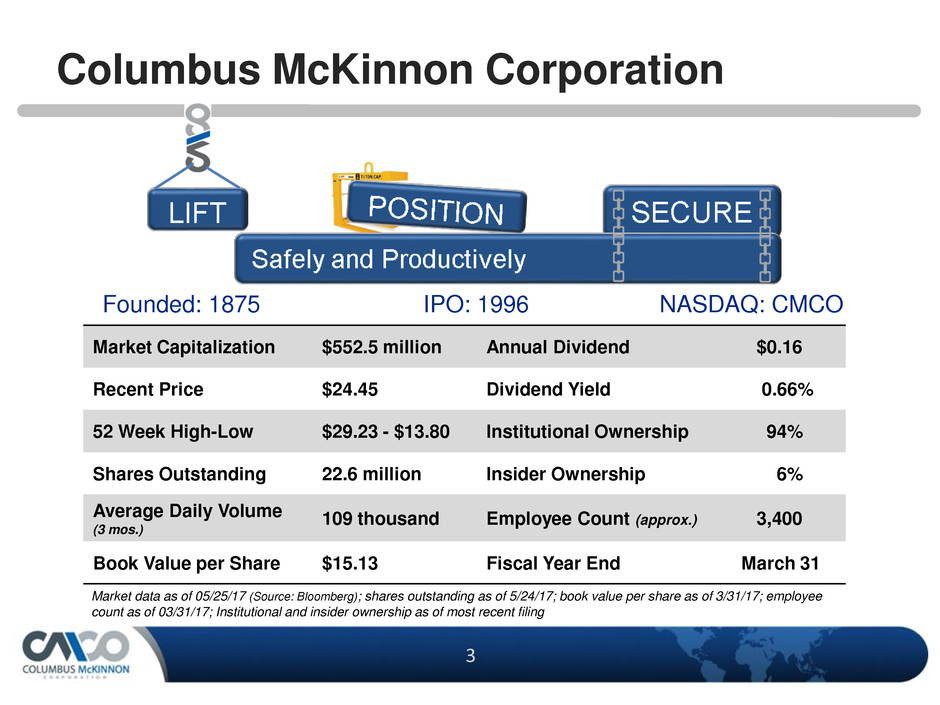
Market Capitalization $552.5 million Annual Dividend $0.16
Recent Price $24.45 Dividend Yield 0.66%
52 Week High-Low $29.23 - $13.80 Institutional Ownership 94%
Shares Outstanding 22.6 million Insider Ownership 6%
Average Daily Volume
(3 mos.)
109 thousand Employee Count (approx.) 3,400
Book Value per Share $15.13 Fiscal Year End March 31
Market data as of 05/25/17 (Source: Bloomberg); shares outstanding as of 5/24/17; book value per share as of 3/31/17; employee
count as of 03/31/17; Institutional and insider ownership as of most recent filing
Founded: 1875 IPO: 1996 NASDAQ: CMCO
4 4
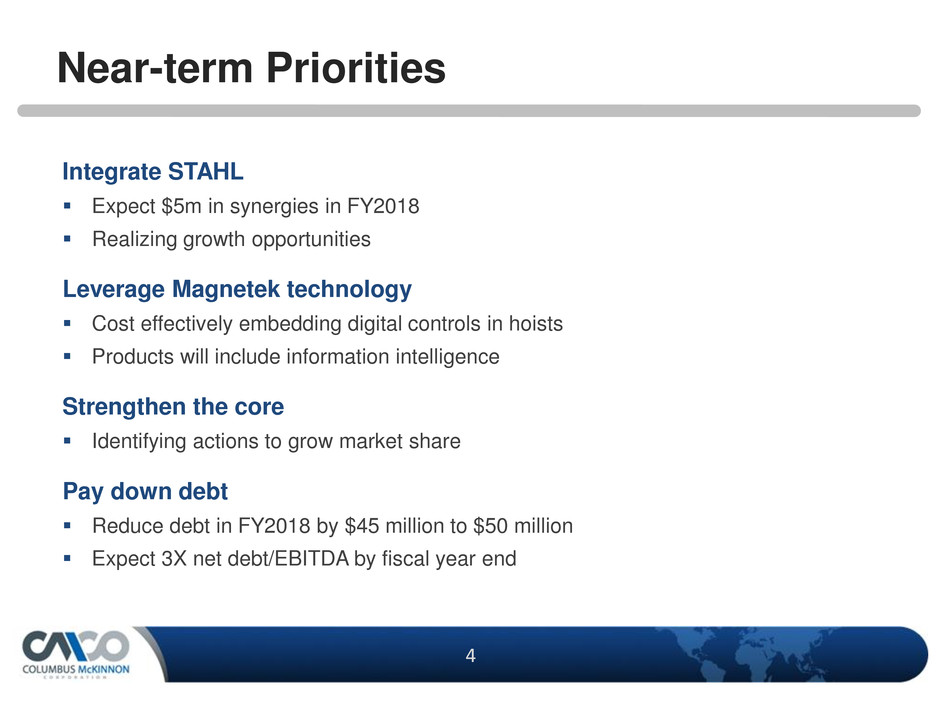
Near-term Priorities
Integrate STAHL
Expect $5m in synergies in FY2018
Realizing growth opportunities
Leverage Magnetek technology
Cost effectively embedding digital controls in hoists
Products will include information intelligence
Strengthen the core
Identifying actions to grow market share
Pay down debt
Reduce debt in FY2018 by $45 million to $50 million
Expect 3X net debt/EBITDA by fiscal year end
5 5
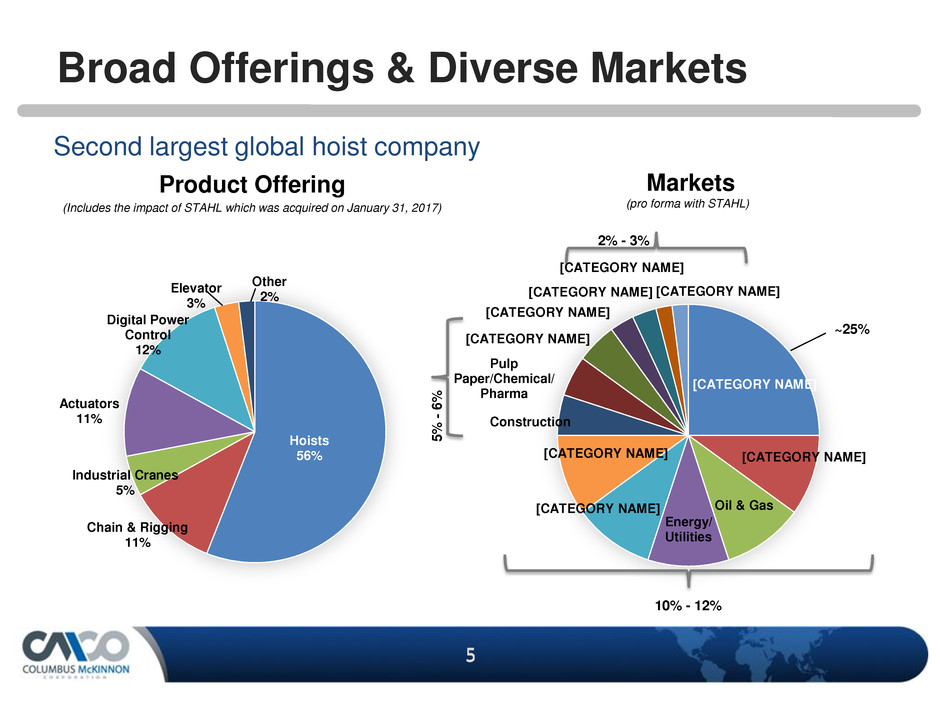
Broad Offerings & Diverse Markets
Hoists
56%
Chain & Rigging
11%
Industrial Cranes
5%
Actuators
11%
Digital Power
Control
12%
Elevator
3%
Other
2%
Second largest global hoist company
(Includes the impact of STAHL which was acquired on January 31, 2017)
Product Offering Markets
(pro forma with STAHL)
[CATEGORY NAME]
[CATEGORY NAME]
Oil & Gas
Energy/
Utilities
[CATEGORY NAME]
[CATEGORY NAME]
Construction
Pulp
Paper/Chemical/
Pharma
[CATEGORY NAME]
[CATEGORY NAME]
[CATEGORY NAME]
[CATEGORY NAME]
[CATEGORY NAME]
~25%
10% - 12%
2% - 3%
5
%
-
6
%
6 6
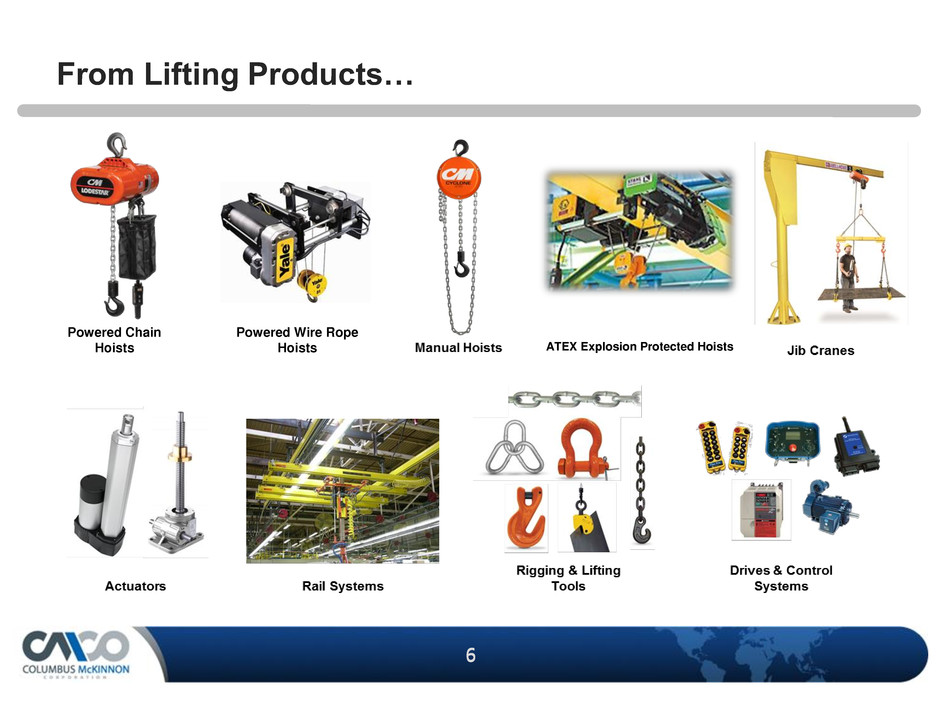
From Lifting Products…
Powered Chain
Hoists
Powered Wire Rope
Hoists ATEX Explosion Protected Hoists
7 7
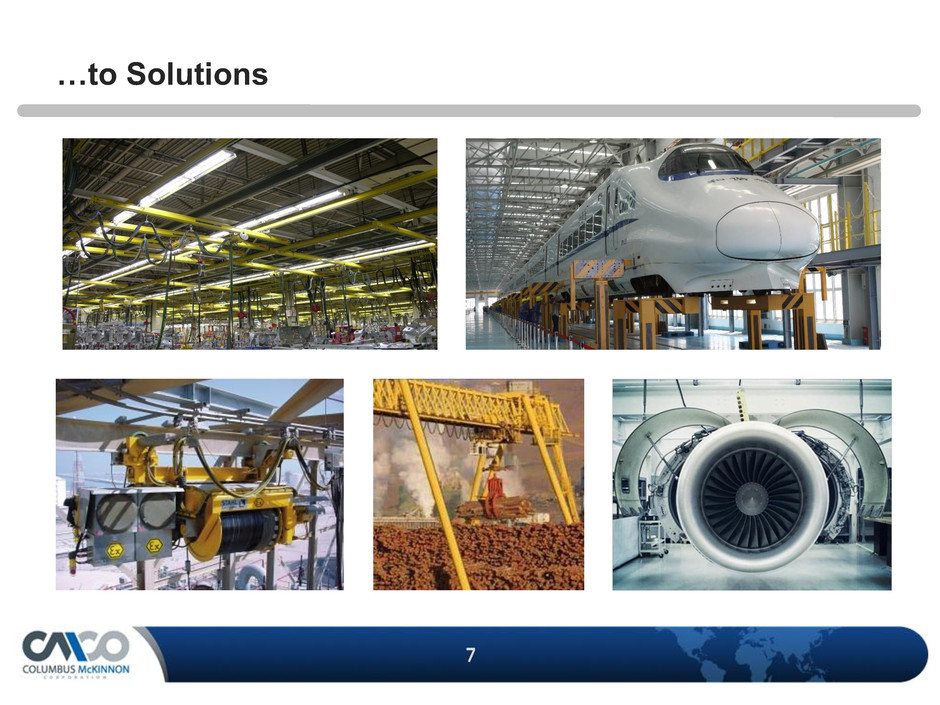
…to Solutions
8 8
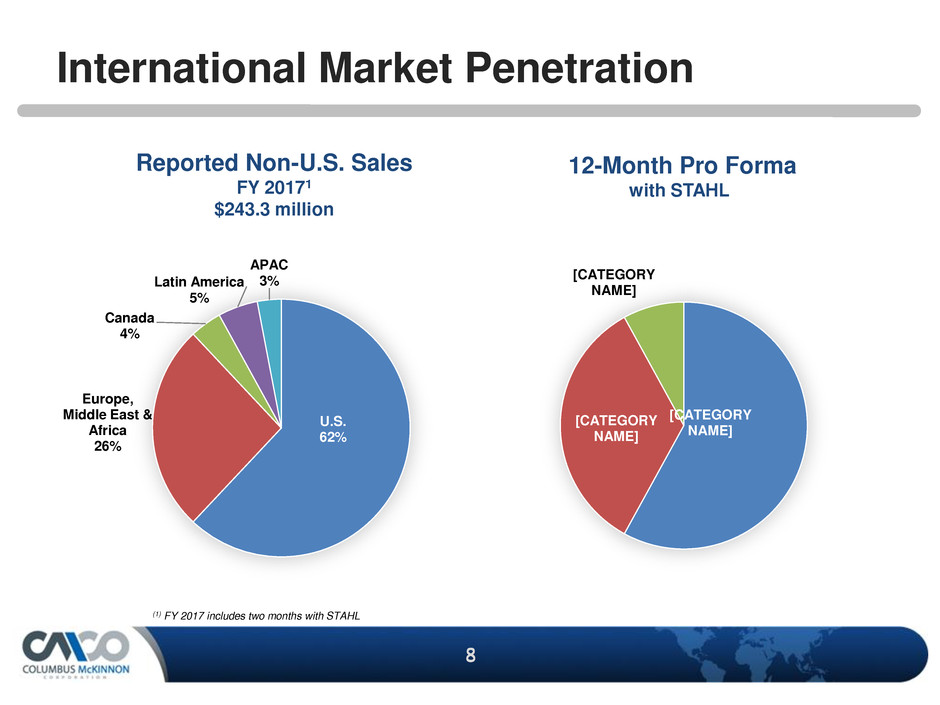
International Market Penetration
Reported Non-U.S. Sales
FY 20171
$243.3 million
U.S.
62%
Europe,
Middle East &
Africa
26%
Canada
4%
Latin America
5%
APAC
3%
(1) FY 2017 includes two months with STAHL
[CATEGORY
NAME]
[CATEGORY
NAME]
[CATEGORY
NAME]
12-Month Pro Forma
with STAHL
9 9
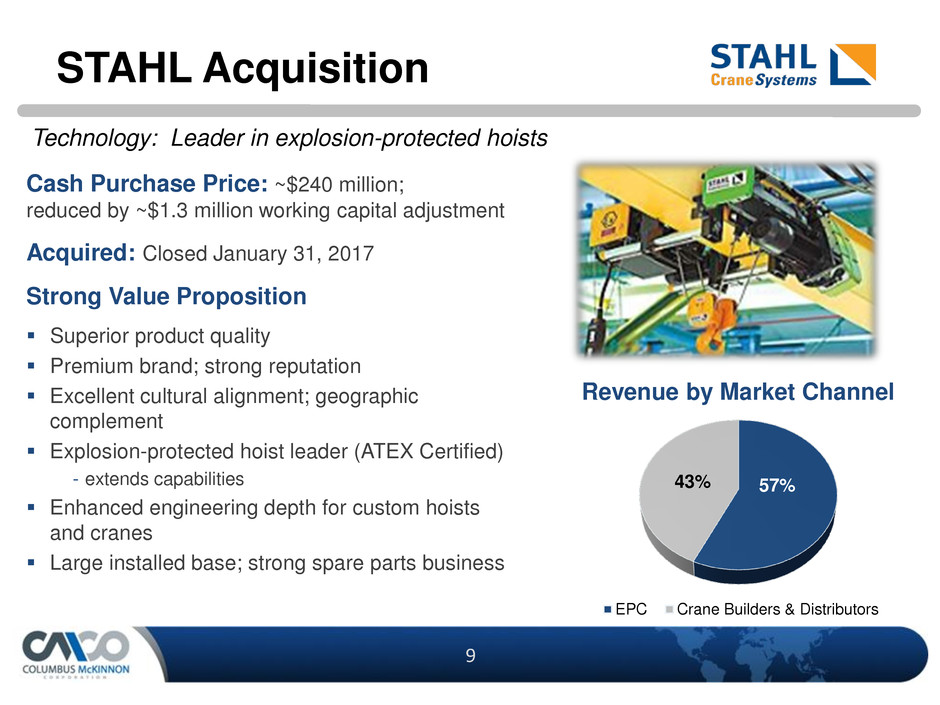
STAHL Acquisition
Cash Purchase Price: ~$240 million;
reduced by ~$1.3 million working capital adjustment
Acquired: Closed January 31, 2017
Strong Value Proposition
Superior product quality
Premium brand; strong reputation
Excellent cultural alignment; geographic
complement
Explosion-protected hoist leader (ATEX Certified)
- extends capabilities
Enhanced engineering depth for custom hoists
and cranes
Large installed base; strong spare parts business
Technology: Leader in explosion-protected hoists
57% 43%
EPC Crane Builders & Distributors
Revenue by Market Channel
10 10
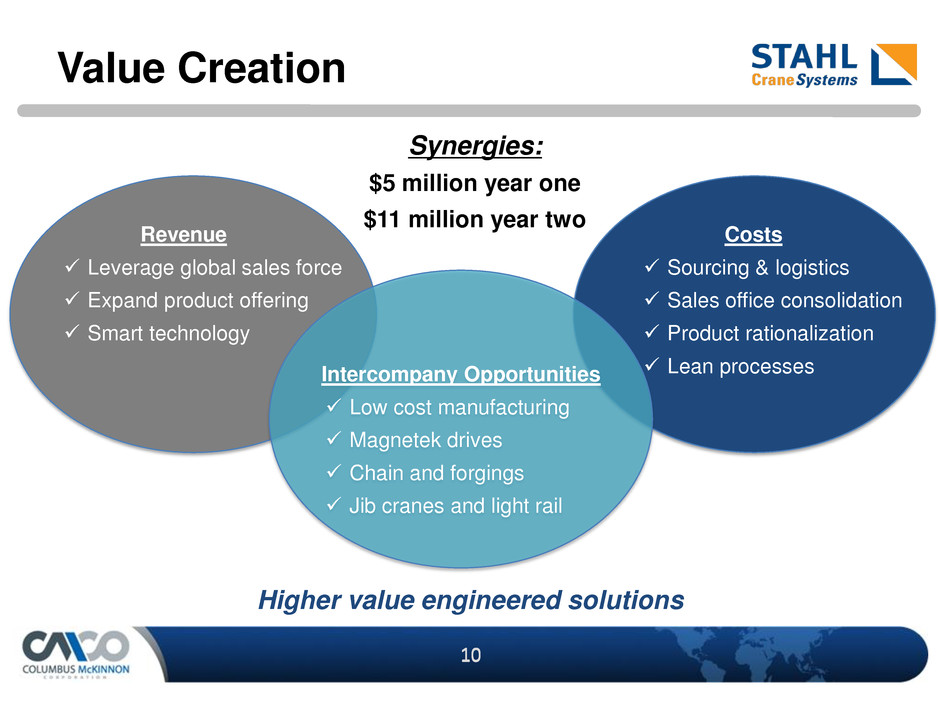
Value Creation
Costs
Sourcing & logistics
Sales office consolidation
Product rationalization
Lean processes
Revenue
Leverage global sales force
Expand product offering
Smart technology
Intercompany Opportunities
Low cost manufacturing
Magnetek drives
Chain and forgings
Jib cranes and light rail
Synergies:
$5 million year one
$11 million year two
Higher value engineered solutions
11 11
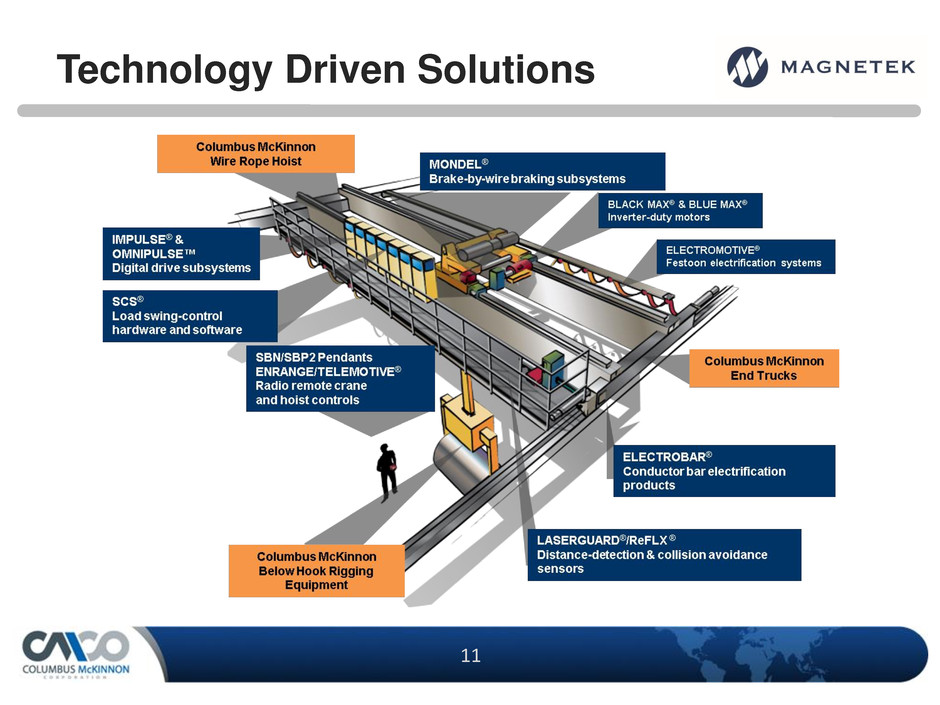
Technology Driven Solutions
12 12
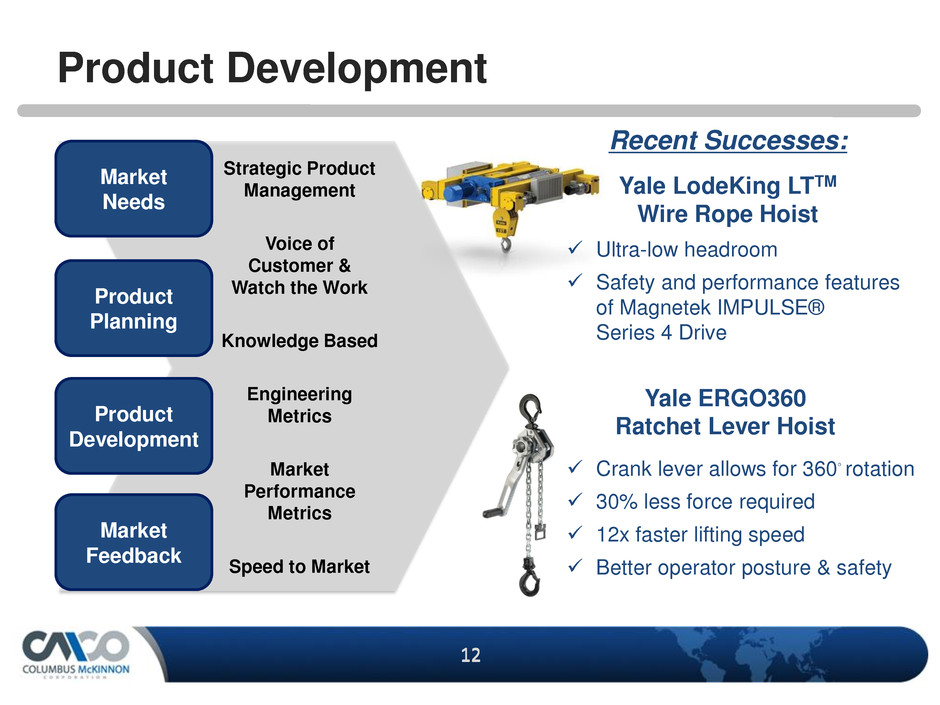
Product Development
Market
Needs
Market
Feedback
Product
Planning
Product
Development
Recent Successes:
Yale LodeKing LTTM
Wire Rope Hoist
Strategic Product
Management
Voice of
Customer &
Watch the Work
Knowledge Based
Engineering
Metrics
Market
Performance
Metrics
Speed to Market
Yale ERGO360
Ratchet Lever Hoist
Crank lever allows for 360◦ rotation
30% less force required
12x faster lifting speed
Better operator posture & safety
Ultra-low headroom
Safety and performance features
of Magnetek IMPULSE®
Series 4 Drive
13 13
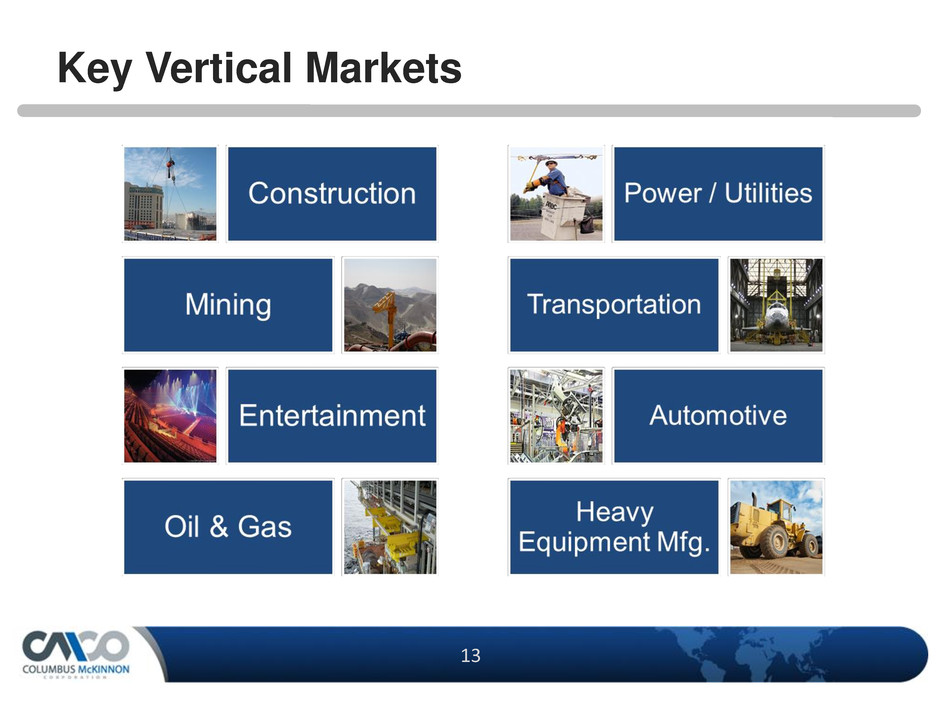
Key Vertical Markets
14 14
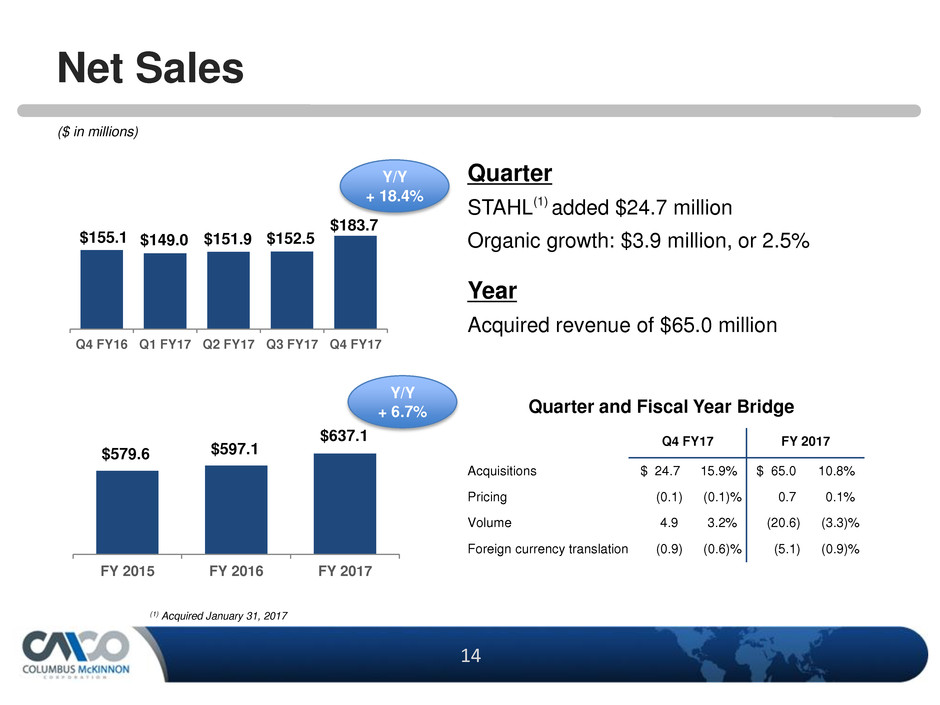
$155.1 $149.0 $151.9 $152.5
$183.7
Q4 FY16 Q1 FY17 Q2 FY17 Q3 FY17 Q4 FY17
Net Sales
($ in millions)
$579.6 $597.1
$637.1
FY 2015 FY 2016 FY 2017
Quarter
STAHL(1) added $24.7 million
Organic growth: $3.9 million, or 2.5%
Year
Acquired revenue of $65.0 million
Q4 FY17 FY 2017
Acquisitions $ 24.7 15.9% $ 65.0 10.8%
Pricing (0.1) (0.1)% 0.7 0.1%
Volume 4.9 3.2% (20.6) (3.3)%
Foreign currency translation (0.9) (0.6)% (5.1) (0.9)%
Quarter and Fiscal Year Bridge
Y/Y
+ 18.4%
Y/Y
+ 6.7%
(1) Acquired January 31, 2017
15 15
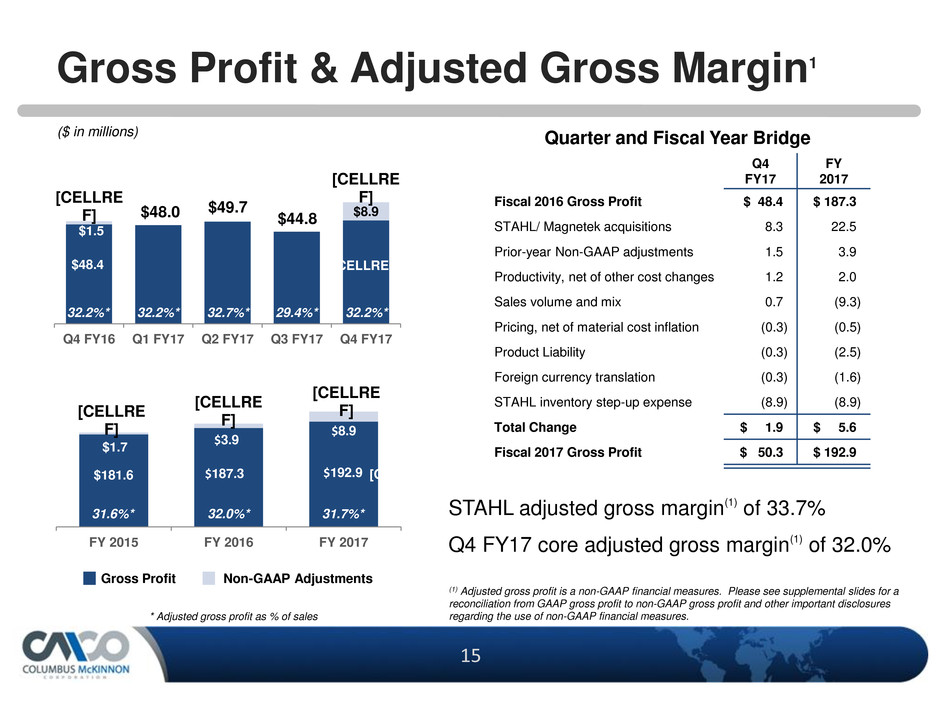
$48.4
$48.0 $49.7 $44.8
$1.5
[CELLREF]
[CELLRE
F]
[CELLRE
F]
$8.9
Q4 FY16 Q1 FY17 Q2 FY17 Q3 FY17 Q4 FY17
$181.6
[CELLRE
F]
[CELLRE
F]
$1.7
[CELLREF]
[CELLRE
F]
FY 2015 FY 2016 FY 2017
$187.3
$3.9
$192.9
$8.9
Gross Profit & Adjusted Gross Margin1
Non-GAAP Adjustments Gross Profit
* Adjusted gross profit as % of sales
Quarter and Fiscal Year Bridge
(1) Adjusted gross profit is a non-GAAP financial measures. Please see supplemental slides for a
reconciliation from GAAP gross profit to non-GAAP gross profit and other important disclosures
regarding the use of non-GAAP financial measures.
32.2%* 29.4%* 32.7%* 32.2%* 32.2%*
($ in millions)
31.7%* 32.0%* 31.6%* STAHL adjusted gross margin
(1) of 33.7%
Q4 FY17 core adjusted gross margin(1) of 32.0%
Q4
FY17
FY
2017
Fiscal 2016 Gross Profit $ 48.4 $ 187.3
STAHL/ Magnetek acquisitions 8.3 22.5
Prior-year Non-GAAP adjustments 1.5 3.9
Productivity, net of other cost changes 1.2 2.0
Sales volume and mix 0.7 (9.3)
Pricing, net of material cost inflation (0.3) (0.5)
Product Liability (0.3) (2.5)
Foreign currency translation (0.3) (1.6)
STAHL inventory step-up expense (8.9) (8.9)
Total Change $ 1.9 $ 5.6
Fiscal 2017 Gross Profit $ 50.3 $ 192.9
16 16
[VALUE]
[CELLRE
F]
$12.6
[CELLRE
F]
[VALUE]
[CELLREF]
[CELLRE
F]
[CELLRE
F]
[VALUE]
Q4 FY16 Q1 FY17 Q2 FY17 Q3 FY17 Q4 FY17
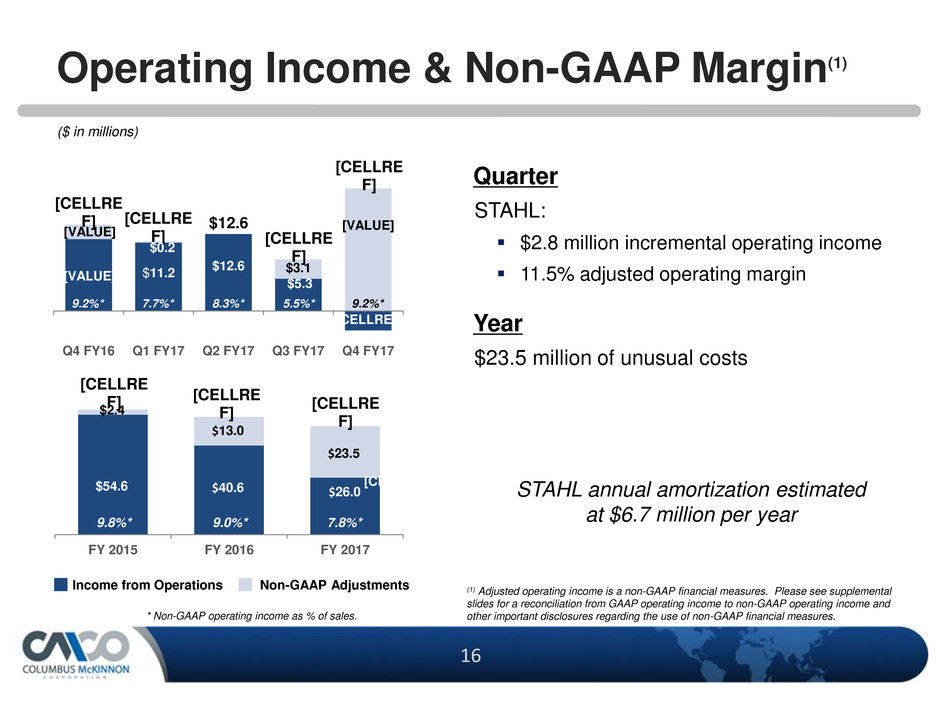
$3.1
$0.2
$11.2
$12.6
$5.3
Operating Income & Non-GAAP Margin(1)
Non-GAAP Adjustments Income from Operations
Quarter
STAHL:
$2.8 million incremental operating income
11.5% adjusted operating margin
Year
$23.5 million of unusual costs
STAHL annual amortization estimated
at $6.7 million per year
* Non-GAAP operating income as % of sales.
(1) Adjusted operating income is a non-GAAP financial measures. Please see supplemental
slides for a reconciliation from GAAP operating income to non-GAAP operating income and
other important disclosures regarding the use of non-GAAP financial measures.
($ in millions)
9.2%* 5.5%* 8.3%* 7.7%* 9.2%*
$54.6
[CELLRE
F]
[CELLRE
F]
$2.4
[CELLREF]
[CELLRE
F]
FY 2015 FY 2016 FY 2017
7.8%* 9.0%* 9.8%*
$40.6
$13.0
$26.0
$23.5
17 17
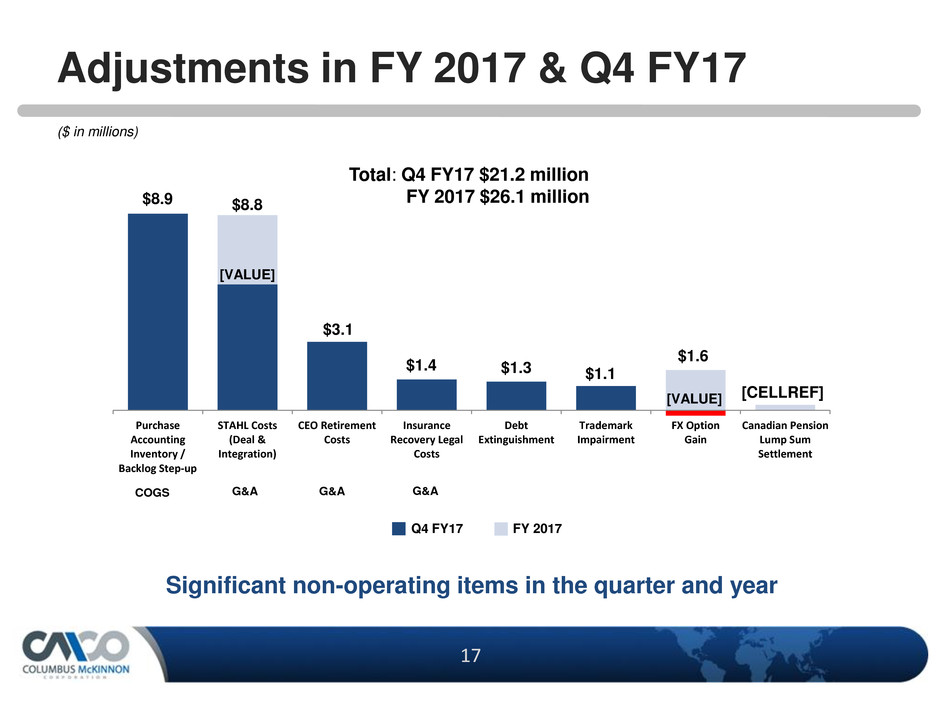
Adjustments in FY 2017 & Q4 FY17
($ in millions)
$8.9
[VALUE]
$3.1
$1.4 $1.3 $1.1
[VALUE] [CELLREF]
Purchase
Accounting
Inventory /
Backlog Step-up
STAHL Costs
(Deal &
Integration)
CEO Retirement
Costs
Insurance
Recovery Legal
Costs
Debt
Extinguishment
Trademark
Impairment
FX Option
Gain
Canadian Pension
Lump Sum
Settlement
$8.8
$1.6
Total: Q4 FY17 $21.2 million
FY 2017 $26.1 million
Significant non-operating items in the quarter and year
COGS G&A G&A G&A
FY 2017 Q4 FY17
18 18
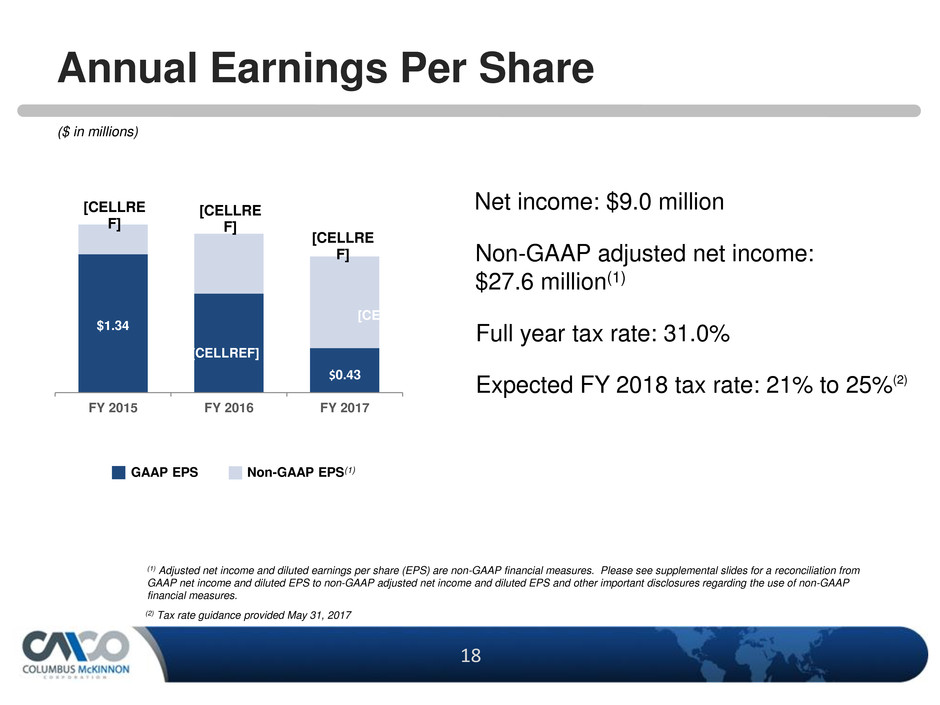
Annual Earnings Per Share
$1.34
[CELLRE
F]
[CELLRE
F]
[CELLREF]
[CELLREF]
[CELLRE
F]
FY 2015 FY 2016 FY 2017
$0.43
(1) Adjusted net income and diluted earnings per share (EPS) are non-GAAP financial measures. Please see supplemental slides for a reconciliation from
GAAP net income and diluted EPS to non-GAAP adjusted net income and diluted EPS and other important disclosures regarding the use of non-GAAP
financial measures.
Net income: $9.0 million
Non-GAAP adjusted net income:
$27.6 million(1)
Full year tax rate: 31.0%
Expected FY 2018 tax rate: 21% to 25%(2)
Non-GAAP EPS(1) GAAP EPS
(2) Tax rate guidance provided May 31, 2017
($ in millions)
19 19
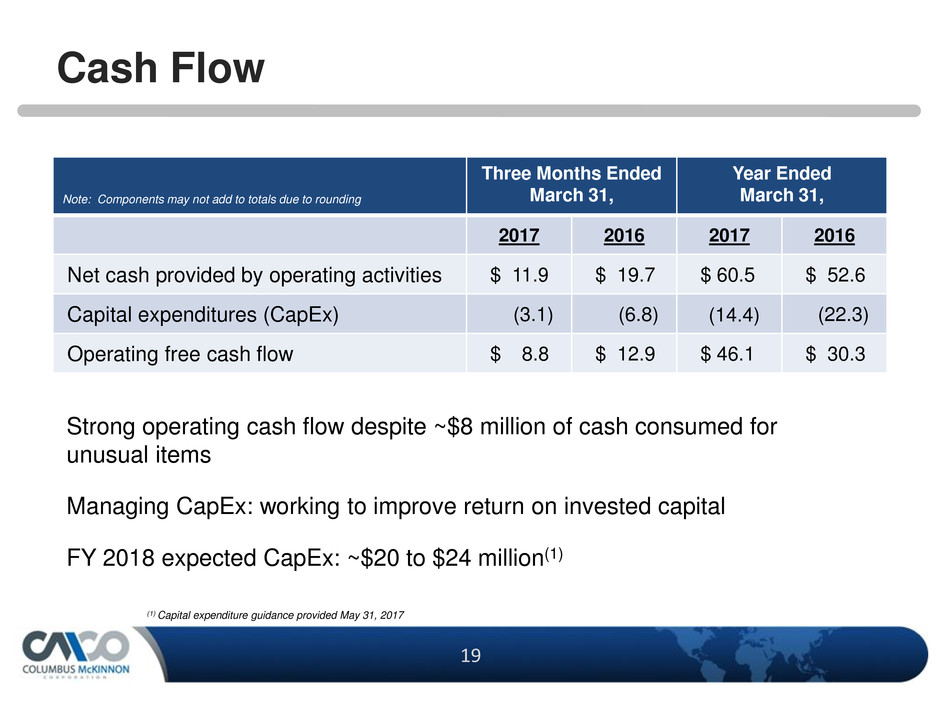
Strong operating cash flow despite ~$8 million of cash consumed for
unusual items
Managing CapEx: working to improve return on invested capital
FY 2018 expected CapEx: ~$20 to $24 million(1)
Cash Flow
Note: Components may not add to totals due to rounding
Three Months Ended
March 31,
Year Ended
March 31,
2017 2016 2017 2016
Net cash provided by operating activities $ 11.9 $ 19.7 $ 60.5 $ 52.6
Capital expenditures (CapEx) (3.1) (6.8) (14.4) (22.3)
Operating free cash flow $ 8.8 $ 12.9 $ 46.1 $ 30.3
(1) Capital expenditure guidance provided May 31, 2017
20 20
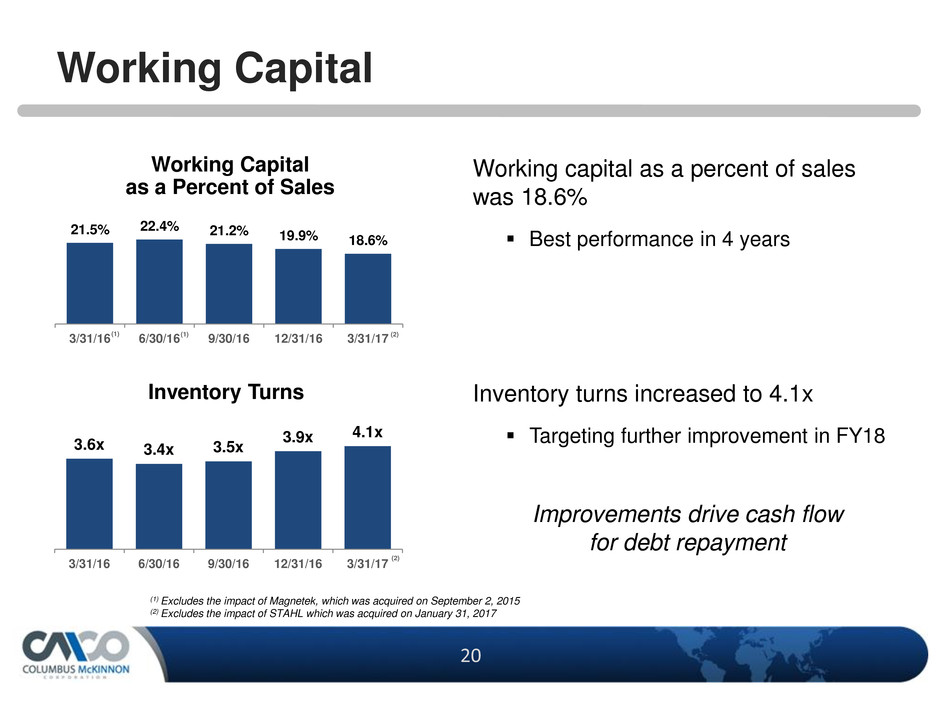
21.5% 22.4% 21.2% 19.9% 18.6%
3/31/16 6/30/16 9/30/16 12/31/16 3/31/17
Working Capital
3.6x 3.4x 3.5x
3.9x 4.1x
3/31/16 6/30/16 9/30/16 12/31/16 3/31/17
Working Capital
as a Percent of Sales
Inventory Turns
(1) Excludes the impact of Magnetek, which was acquired on September 2, 2015
(2) Excludes the impact of STAHL which was acquired on January 31, 2017
(1) (1)
Working capital as a percent of sales
was 18.6%
Best performance in 4 years
(2)
(2)
Inventory turns increased to 4.1x
Targeting further improvement in FY18
Improvements drive cash flow
for debt repayment
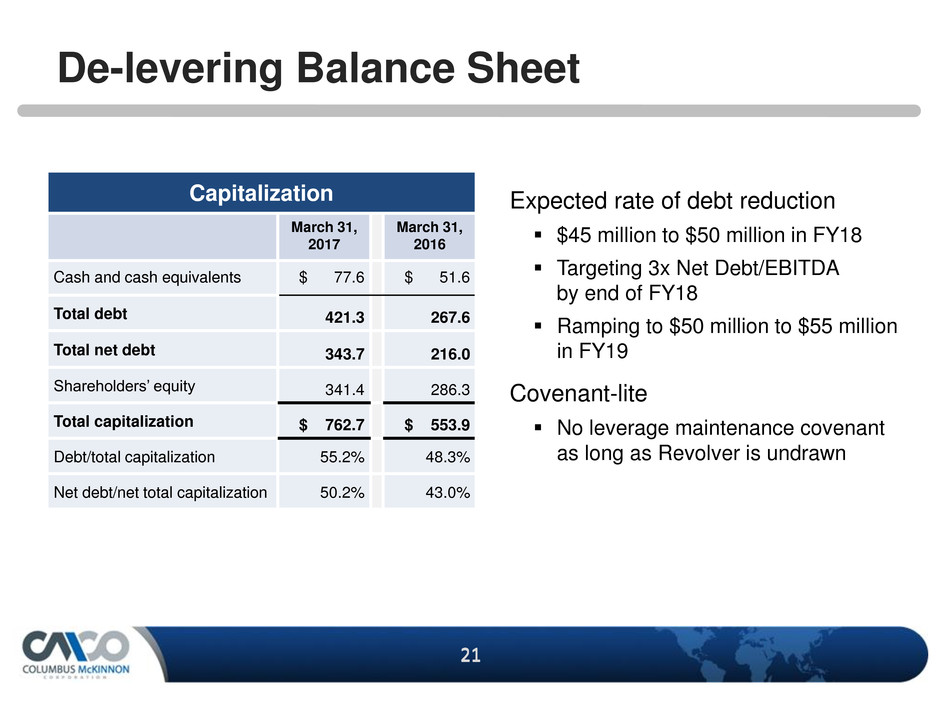
21 21
Capitalization
March 31,
2017
March 31,
2016
Cash and cash equivalents $ 77.6 $ 51.6
Total debt 421.3 267.6
Total net debt 343.7 216.0
Shareholders’ equity 341.4 286.3
Total capitalization $ 762.7 $ 553.9
Debt/total capitalization 55.2% 48.3%
Net debt/net total capitalization 50.2% 43.0%
De-levering Balance Sheet
Expected rate of debt reduction
$45 million to $50 million in FY18
Targeting 3x Net Debt/EBITDA
by end of FY18
Ramping to $50 million to $55 million
in FY19
Covenant-lite
No leverage maintenance covenant
as long as Revolver is undrawn
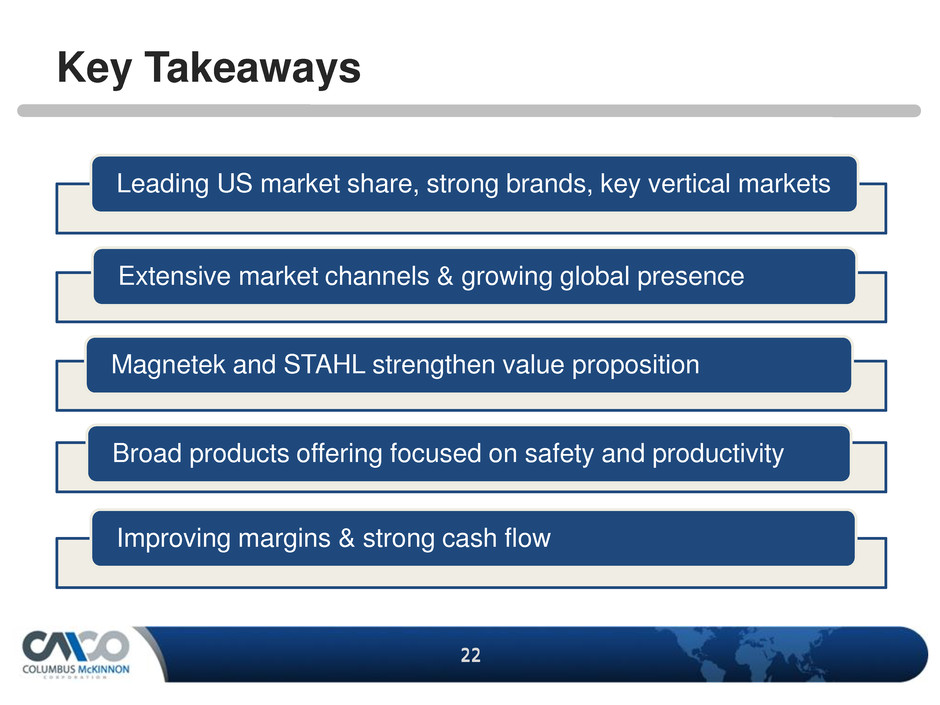
22 22
Key Takeaways
Leading US market share, strong brands, key vertical markets
Magnetek and STAHL strengthen value proposition
Broad products offering focused on safety and productivity
Extensive market channels & growing global presence
Improving margins & strong cash flow
23 23
Supplemental
Information
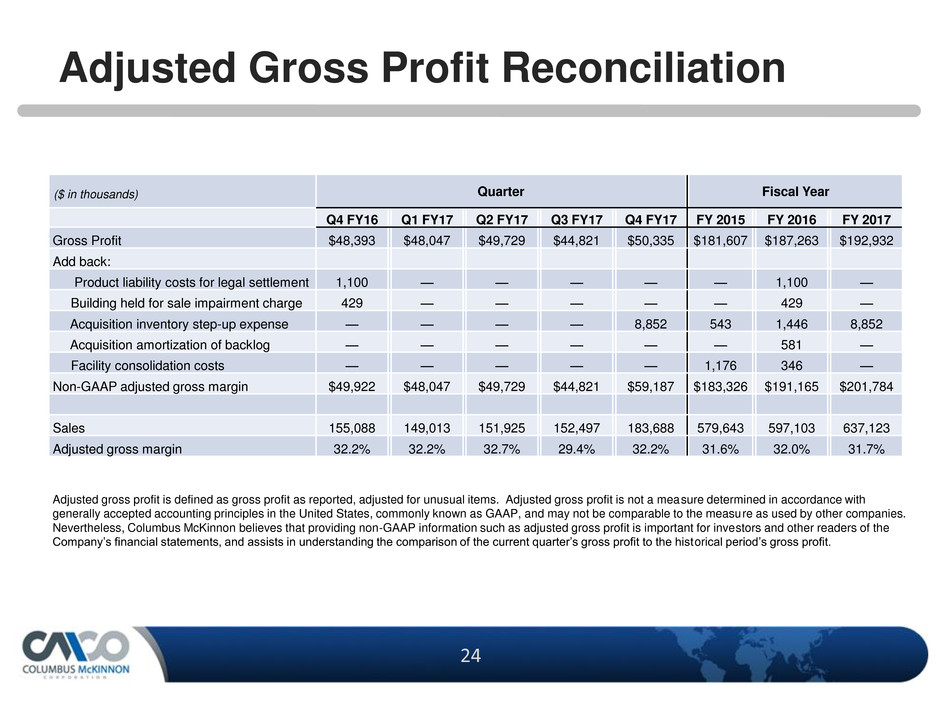
24 24
Adjusted Gross Profit Reconciliation
Adjusted gross profit is defined as gross profit as reported, adjusted for unusual items. Adjusted gross profit is not a measure determined in accordance with
generally accepted accounting principles in the United States, commonly known as GAAP, and may not be comparable to the measure as used by other companies.
Nevertheless, Columbus McKinnon believes that providing non-GAAP information such as adjusted gross profit is important for investors and other readers of the
Company’s financial statements, and assists in understanding the comparison of the current quarter’s gross profit to the historical period’s gross profit.
Quarter Fiscal Year
Q4 FY16 Q1 FY17 Q2 FY17 Q3 FY17 Q4 FY17 FY 2015 FY 2016 FY 2017
Gross Profit $48,393 $48,047 $49,729 $44,821 $50,335 $181,607 $187,263 $192,932
Add back:
Product liability costs for legal settlement 1,100 — — — — — 1,100 —
Building held for sale impairment charge 429 — — — — — 429 —
Acquisition inventory step-up expense — — — — 8,852 543 1,446 8,852
Acquisition amortization of backlog — — — — — — 581 —
Facility consolidation costs — — — — — 1,176 346 —
Non-GAAP adjusted gross margin $49,922 $48,047 $49,729 $44,821 $59,187 $183,326 $191,165 $201,784
Sales 155,088 149,013 151,925 152,497 183,688 579,643 597,103 637,123
Adjusted gross margin 32.2% 32.2% 32.7% 29.4% 32.2% 31.6% 32.0% 31.7%
($ in thousands)
25 25
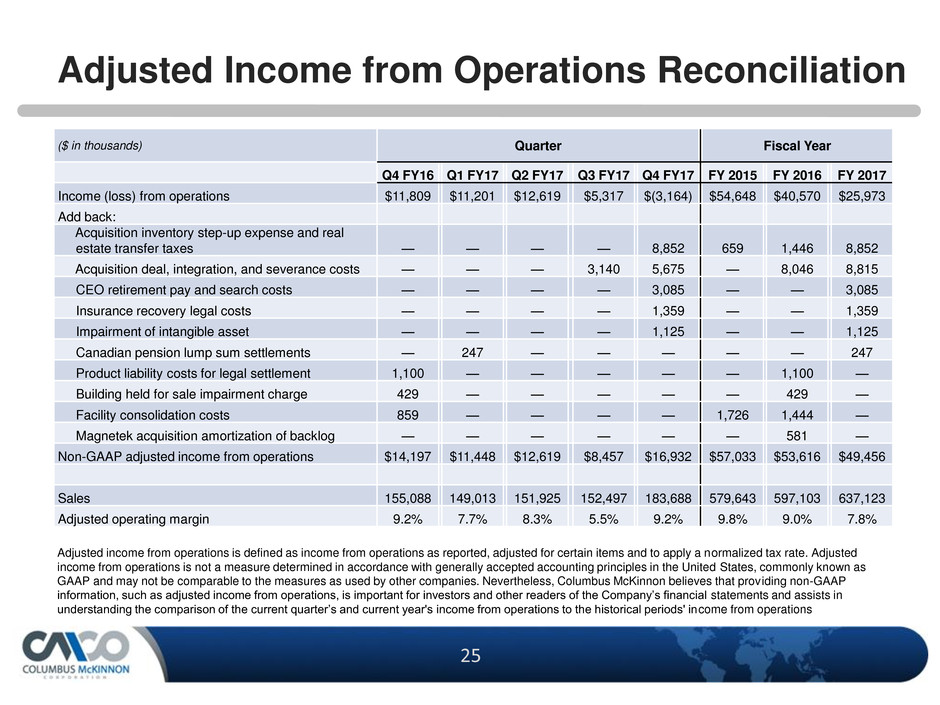
Adjusted Income from Operations Reconciliation
Adjusted income from operations is defined as income from operations as reported, adjusted for certain items and to apply a normalized tax rate. Adjusted
income from operations is not a measure determined in accordance with generally accepted accounting principles in the United States, commonly known as
GAAP and may not be comparable to the measures as used by other companies. Nevertheless, Columbus McKinnon believes that providing non-GAAP
information, such as adjusted income from operations, is important for investors and other readers of the Company’s financial statements and assists in
understanding the comparison of the current quarter’s and current year's income from operations to the historical periods' income from operations
Quarter Fiscal Year
Q4 FY16 Q1 FY17 Q2 FY17 Q3 FY17 Q4 FY17 FY 2015 FY 2016 FY 2017
Income (loss) from operations $11,809 $11,201 $12,619 $5,317 $(3,164) $54,648 $40,570 $25,973
Add back:
Acquisition inventory step-up expense and real
estate transfer taxes — — — — 8,852 659 1,446 8,852
Acquisition deal, integration, and severance costs — — — 3,140 5,675 — 8,046 8,815
CEO retirement pay and search costs — — — — 3,085 — — 3,085
Insurance recovery legal costs — — — — 1,359 — — 1,359
Impairment of intangible asset — — — — 1,125 — — 1,125
Canadian pension lump sum settlements — 247 — — — — — 247
Product liability costs for legal settlement 1,100 — — — — — 1,100 —
Building held for sale impairment charge 429 — — — — — 429 —
Facility consolidation costs 859 — — — — 1,726 1,444 —
Magnetek acquisition amortization of backlog — — — — — — 581 —
Non-GAAP adjusted income from operations $14,197 $11,448 $12,619 $8,457 $16,932 $57,033 $53,616 $49,456
Sales 155,088 149,013 151,925 152,497 183,688 579,643 597,103 637,123
Adjusted operating margin 9.2% 7.7% 8.3% 5.5% 9.2% 9.8% 9.0% 7.8%
($ in thousands)
26 26
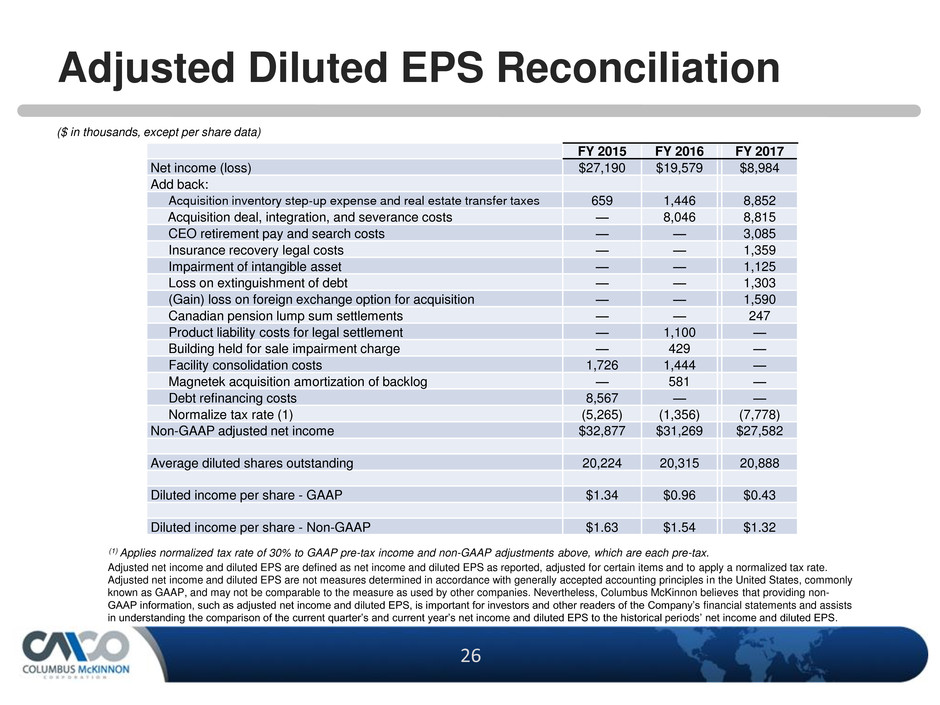
Adjusted Diluted EPS Reconciliation
Adjusted net income and diluted EPS are defined as net income and diluted EPS as reported, adjusted for certain items and to apply a normalized tax rate.
Adjusted net income and diluted EPS are not measures determined in accordance with generally accepted accounting principles in the United States, commonly
known as GAAP, and may not be comparable to the measure as used by other companies. Nevertheless, Columbus McKinnon believes that providing non-
GAAP information, such as adjusted net income and diluted EPS, is important for investors and other readers of the Company’s financial statements and assists
in understanding the comparison of the current quarter’s and current year’s net income and diluted EPS to the historical periods’ net income and diluted EPS.
(1) Applies normalized tax rate of 30% to GAAP pre-tax income and non-GAAP adjustments above, which are each pre-tax.
FY 2015 FY 2016 FY 2017
Net income (loss) $27,190 $19,579 $8,984
Add back:
Acquisition inventory step-up expense and real estate transfer taxes 659 1,446 8,852
Acquisition deal, integration, and severance costs — 8,046 8,815
CEO retirement pay and search costs — — 3,085
Insurance recovery legal costs — — 1,359
Impairment of intangible asset — — 1,125
Loss on extinguishment of debt — — 1,303
(Gain) loss on foreign exchange option for acquisition — — 1,590
Canadian pension lump sum settlements — — 247
Product liability costs for legal settlement — 1,100 —
Building held for sale impairment charge — 429 —
Facility consolidation costs 1,726 1,444 —
Magnetek acquisition amortization of backlog — 581 —
Debt refinancing costs 8,567 — —
Normalize tax rate (1) (5,265) (1,356) (7,778)
Non-GAAP adjusted net income $32,877 $31,269 $27,582
Average diluted shares outstanding 20,224 20,315 20,888
Diluted income per share - GAAP $1.34 $0.96 $0.43
Diluted income per share - Non-GAAP $1.63 $1.54 $1.32
($ in thousands, except per share data)
27 27
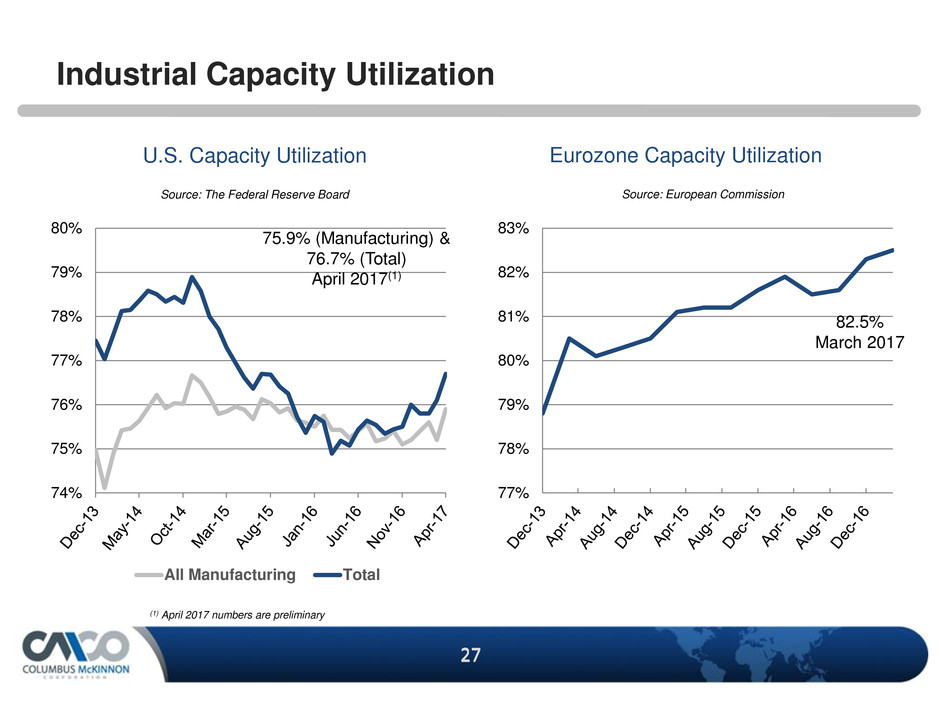
77%
78%
79%
80%
81%
82%
83%
74%
75%
76%
77%
78%
79%
80%
All Manufacturing Total
Source: The Federal Reserve Board
Eurozone Capacity Utilization U.S. Capacity Utilization
Source: European Commission
82.5%
March 2017
75.9% (Manufacturing) &
76.7% (Total)
April 2017(1)
Industrial Capacity Utilization
(1) April 2017 numbers are preliminary
28 28
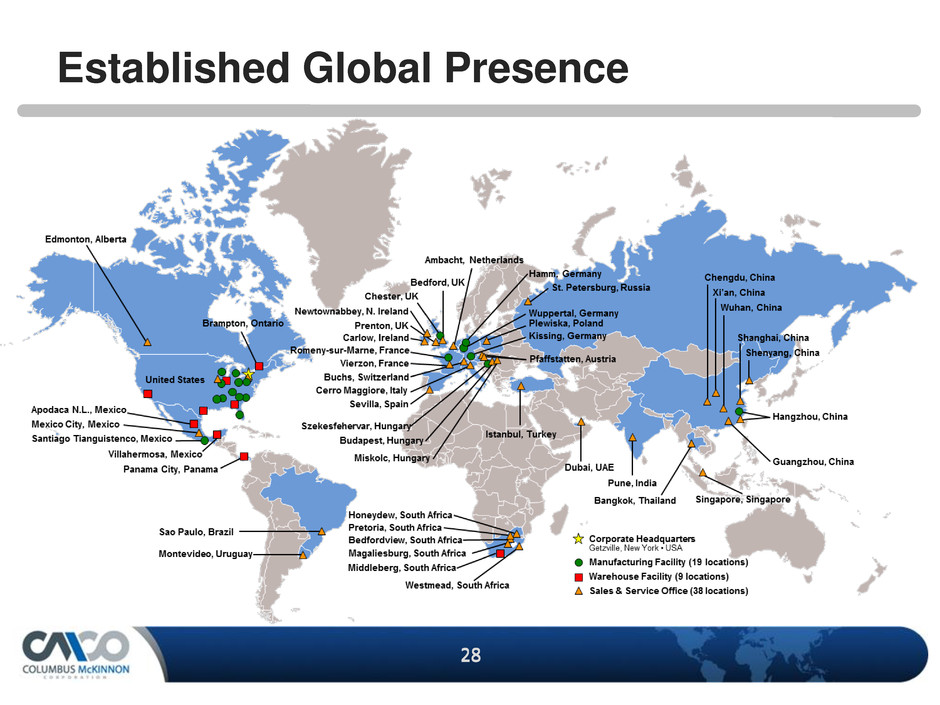
Established Global Presence
