Attached files
| file | filename |
|---|---|
| EX-32.1 - EX-32.1 - EMMAUS LIFE SCIENCES, INC. | a17-8923_1ex32d1.htm |
| EX-31.2 - EX-31.2 - EMMAUS LIFE SCIENCES, INC. | a17-8923_1ex31d2.htm |
| EX-31.1 - EX-31.1 - EMMAUS LIFE SCIENCES, INC. | a17-8923_1ex31d1.htm |
| EX-10.1 - EX-10.1 - EMMAUS LIFE SCIENCES, INC. | a17-8923_1ex10d1.htm |
| EX-4.5 - EX-4.5 - EMMAUS LIFE SCIENCES, INC. | a17-8923_1ex4d5.htm |
| EX-4.4 - EX-4.4 - EMMAUS LIFE SCIENCES, INC. | a17-8923_1ex4d4.htm |
| EX-4.3 - EX-4.3 - EMMAUS LIFE SCIENCES, INC. | a17-8923_1ex4d3.htm |
| EX-4.2 - EX-4.2 - EMMAUS LIFE SCIENCES, INC. | a17-8923_1ex4d2.htm |
| EX-4.1 - EX-4.1 - EMMAUS LIFE SCIENCES, INC. | a17-8923_1ex4d1.htm |
UNITED STATES
SECURITIES AND EXCHANGE COMMISSION
Washington, D.C. 20549
FORM 10-Q
x QUARTERLY REPORT PURSUANT TO SECTION 13 OR 15(d) OF THE SECURITIES EXCHANGE ACT OF 1934
For the Quarterly Period Ended March 31, 2017
OR
o TRANSITION REPORT PURSUANT TO SECTION 13 OR 15(d) OF THE SECURITIES EXCHANGE ACT OF 1934
For the transition period from to
Commission File No.: 000-53072
EMMAUS LIFE SCIENCES, INC.
(Exact name of Registrant as specified in its charter)
|
Delaware |
|
41-2254389 |
|
(State or other jurisdiction of incorporation or organization) |
|
(I.R.S. Employer Identification No.) |
|
21250 Hawthorne Boulevard, Suite 800, Torrance, California |
|
90503 |
|
(Address of principal executive offices) |
|
(Zip code) |
(310) 214-0065
(Registrant’s telephone number, including area code)
Indicate by check mark whether the registrant (1) has filed all reports required to be filed by Section 13 or 15(d) of the Securities Exchange Act of 1934 during the preceding 12 months (or for such shorter period that the registrant was required to file such reports), and (2) has been subject to such filing requirements for the past 90 days. Yes x No o
Indicate by check mark whether the registrant has submitted electronically and posted on its corporate Web site, if any, every Interactive Data File required to be submitted and posted pursuant to Rule 405 of Regulation S-T (§232.405 of this chapter) during the preceding 12 months (or for such shorter period that the registrant was required to submit and post such files). Yes x No o
Indicate by check mark whether the registrant is a large accelerated filer, an accelerated filer, a non-accelerated filer, smaller reporting company, or an emerging growth company. See the definition of “large accelerated filer,” “accelerated filer,” “smaller reporting company,” and “emerging growth company” in Rule 12b-2 of the Exchange Act.
|
Large accelerated filer o |
|
Accelerated filer o |
|
Non-accelerated filer o |
|
Smaller reporting company x |
|
Emerging growth company o |
|
|
|
|
|
|
If an emerging growth company, indicate by check mark if the registrant has elected not to use the extended transition period for complying with any new or revised financial accounting standards provided pursuant to Section 13a) of the Exchange Act. o
Indicate by check mark whether the registrant is a shell company (as defined in Rule 12b-2 of the Exchange Act). Yes o No x
The registrant had 34,742,219 shares of common stock, par value $0.001 per share, outstanding as of May 12, 2017.
EMMAUS LIFE SCIENCES, INC.
FORM 10-Q
For the Quarterly Period Ended March 31, 2017
|
|
|
Page | |
|
Part I Financial Information |
| ||
|
|
|
| |
|
| |||
|
|
|
| |
|
|
(a) Consolidated Balance Sheets as of March 31, 2017 (Unaudited) and December 31, 2016 |
1 | |
|
|
|
| |
|
|
2 | ||
|
|
|
| |
|
|
3 | ||
|
|
|
| |
|
|
4 | ||
|
|
|
| |
|
|
5 | ||
|
|
|
| |
|
Management’s Discussion and Analysis of Financial Condition and Results of Operations |
17 | ||
|
|
|
| |
|
26 | |||
|
|
|
| |
|
26 | |||
|
|
|
| |
|
| |||
|
|
|
| |
|
28 | |||
|
|
|
| |
|
28 | |||
|
|
|
| |
|
28 | |||
|
|
|
| |
|
28 | |||
|
|
|
| |
|
28 | |||
|
|
|
| |
|
29 | |||
|
|
|
| |
|
29 | |||
|
|
|
| |
|
30 | |||
EMMAUS LIFE SCIENCES, INC.
|
|
|
As of |
| ||||
|
|
|
March 31, 2017 |
|
December 31, 2016 |
| ||
|
|
|
(unaudited) |
|
|
| ||
|
ASSETS |
|
|
|
|
| ||
|
CURRENT ASSETS |
|
|
|
|
| ||
|
Cash and cash equivalents |
|
$ |
3,544,873 |
|
$ |
1,317,340 |
|
|
Accounts receivable |
|
27,100 |
|
14,221 |
| ||
|
Inventories, net |
|
261,422 |
|
166,209 |
| ||
|
Investment in available-for-sale securities |
|
10,948,608 |
|
10,917,301 |
| ||
|
Marketable securities, pledged to creditor |
|
197,428 |
|
179,765 |
| ||
|
Prepaid expenses and other current assets |
|
101,097 |
|
129,204 |
| ||
|
Total current assets |
|
15,080,528 |
|
12,724,040 |
| ||
|
|
|
|
|
|
| ||
|
PROPERTY AND EQUIPMENT, Net |
|
93,008 |
|
53,730 |
| ||
|
|
|
|
|
|
| ||
|
OTHER ASSETS |
|
|
|
|
| ||
|
Deposits |
|
212,815 |
|
214,808 |
| ||
|
Total other assets |
|
212,815 |
|
214,808 |
| ||
|
Total Assets |
|
$ |
15,386,351 |
|
$ |
12,992,578 |
|
|
|
|
|
|
|
| ||
|
LIABILITIES AND STOCKHOLDERS’ DEFICIT |
|
|
|
|
| ||
|
|
|
|
|
|
| ||
|
CURRENT LIABILITIES |
|
|
|
|
| ||
|
Accounts payable and accrued expenses |
|
$ |
3,886,433 |
|
$ |
3,201,154 |
|
|
Other current liability |
|
4,019,728 |
|
— |
| ||
|
Notes payable, net |
|
4,292,539 |
|
4,094,429 |
| ||
|
Notes payable to related parties, net |
|
1,926,850 |
|
1,924,850 |
| ||
|
Convertible notes payable, net |
|
9,783,487 |
|
9,205,007 |
| ||
|
Convertible notes payable to related parties, net |
|
474,000 |
|
474,000 |
| ||
|
Total current liabilities |
|
24,383,037 |
|
18,899,440 |
| ||
|
|
|
|
|
|
| ||
|
LONG-TERM LIABILITIES |
|
|
|
|
| ||
|
Deferred rent |
|
53,075 |
|
57,081 |
| ||
|
Warrant derivative liabilities |
|
11,828,000 |
|
10,600,000 |
| ||
|
Convertible notes payable, net |
|
703,094 |
|
997,957 |
| ||
|
Total long-term liabilities |
|
12,584,169 |
|
11,655,038 |
| ||
|
Total Liabilities |
|
36,967,206 |
|
30,554,478 |
| ||
|
|
|
|
|
|
| ||
|
COMMITMENTS AND CONTINGENCIES |
|
|
|
|
| ||
|
STOCKHOLDERS’ DEFICIT |
|
|
|
|
| ||
|
Preferred stock — par value $0.001 per share, 20,000,000 shares authorized, none issued and outstanding |
|
— |
|
— |
| ||
|
Common stock — par value $0.001 per share, 100,000,000 shares authorized, 34,714,219 and 34,701,219 shares issued and outstanding at March 31, 2017 and December 31, 2016, respectively |
|
34,714 |
|
34,701 |
| ||
|
Additional paid-in capital |
|
95,053,204 |
|
92,614,801 |
| ||
|
Accumulated other comprehensive loss |
|
(3,413,383 |
) |
(3,450,746 |
) | ||
|
Accumulated deficit |
|
(113,255,390 |
) |
(106,760,656 |
) | ||
|
Total stockholders’ deficit |
|
(21,580,855 |
) |
(17,561,900 |
) | ||
|
Total Liabilities and Stockholders’ Deficit |
|
$ |
15,386,351 |
|
$ |
12,992,578 |
|
The accompanying notes are an integral part of these consolidated financial statements.
EMMAUS LIFE SCIENCES, INC.
CONSOLIDATED STATEMENTS OF COMPREHENSIVE LOSS
(UNAUDITED)
|
|
|
Three Months Ended March 31, |
| ||||
|
|
|
2017 |
|
2016 |
| ||
|
|
|
|
|
|
| ||
|
REVENUES, net |
|
$ |
107,477 |
|
$ |
79,399 |
|
|
|
|
|
|
|
| ||
|
COST OF GOODS SOLD |
|
48,260 |
|
28,066 |
| ||
|
GROSS PROFIT |
|
59,217 |
|
51,333 |
| ||
|
|
|
|
|
|
| ||
|
OPERATING EXPENSES |
|
|
|
|
| ||
|
Research and development |
|
755,728 |
|
502,301 |
| ||
|
Selling |
|
101,661 |
|
93,580 |
| ||
|
General and administrative |
|
2,799,040 |
|
2,292,922 |
| ||
|
|
|
3,656,429 |
|
2,888,803 |
| ||
|
|
|
|
|
|
| ||
|
LOSS FROM OPERATIONS |
|
(3,597,212 |
) |
(2,837,470 |
) | ||
|
|
|
|
|
|
| ||
|
OTHER INCOME (EXPENSE) |
|
|
|
|
| ||
|
Change in fair value of warrant derivative liabilities |
|
(1,228,000 |
) |
(863,000 |
) | ||
|
Interest and other income (loss) |
|
(13,231 |
) |
(25,833 |
) | ||
|
Interest expense |
|
(1,653,891 |
) |
(731,202 |
) | ||
|
|
|
(2,895,122 |
) |
(1,620,035 |
) | ||
|
|
|
|
|
|
| ||
|
LOSS BEFORE INCOME TAXES |
|
(6,492,334 |
) |
(4,457,505 |
) | ||
|
INCOME TAXES |
|
2,400 |
|
2,400 |
| ||
|
NET LOSS |
|
(6,494,734 |
) |
(4,459,905 |
) | ||
|
|
|
|
|
|
| ||
|
COMPONENTS OF OTHER COMPREHENSIVE INCOME (LOSS) |
|
|
|
|
| ||
|
Unrealized holding gain on securities available-for-sale |
|
48,970 |
|
25,905 |
| ||
|
Unrealized foreign currency translation |
|
(11,607 |
) |
11,004 |
| ||
|
|
|
37,363 |
|
36,909 |
| ||
|
COMPREHENSIVE LOSS |
|
$ |
(6,457,371 |
) |
$ |
(4,422,996 |
) |
|
NET LOSS PER COMMON SHARE |
|
$ |
(0.19 |
) |
$ |
(0.16 |
) |
|
WEIGHTED-AVERAGE COMMON SHARES OUTSTANDING |
|
34,706,419 |
|
28,465,798 |
| ||
The accompanying notes are an integral part of these consolidated financial statements.
EMMAUS LIFE SCIENCES, INC.
CONSOLIDATED STATEMENT OF CHANGES IN STOCKHOLDERS’ DEFICIT
FOR THE THREE MONTHS ENDED MARCH 31, 2017
(UNAUDITED)
|
|
|
Common stock — par value $0.001 |
|
Additional |
|
Accumulated |
|
|
|
|
| |||||||
|
|
|
Shares |
|
Common |
|
Paid-in |
|
Comprehensive |
|
Accumulated |
|
Total Stockholders’ |
| |||||
|
|
|
|
|
|
|
|
|
|
|
|
|
|
| |||||
|
Balance, December 31, 2016 |
|
34,701,219 |
|
$ |
34,701 |
|
$ |
92,614,801 |
|
$ |
(3,450,746 |
) |
$ |
(106,760,656 |
) |
$ |
(17,561,900 |
) |
|
Stock issued for cash |
|
13,000 |
|
13 |
|
98,787 |
|
— |
|
— |
|
98,800 |
| |||||
|
Beneficial conversion feature relating to convertible and promissory notes payable |
|
— |
|
— |
|
1,311,266 |
|
— |
|
— |
|
1,311,266 |
| |||||
|
Share-based compensation |
|
— |
|
— |
|
1,028,350 |
|
— |
|
— |
|
1,028,350 |
| |||||
|
Unrealized gain on marketable securities, net of tax |
|
— |
|
— |
|
— |
|
48,970 |
|
— |
|
48,970 |
| |||||
|
Foreign currency translation effect |
|
— |
|
— |
|
— |
|
(11,607 |
) |
— |
|
(11,607 |
) | |||||
|
Net loss |
|
— |
|
— |
|
— |
|
— |
|
(6,494,734 |
) |
(6,494,734 |
) | |||||
|
|
|
|
|
|
|
|
|
|
|
|
|
|
| |||||
|
Balance, March 31, 2017 |
|
34,714,219 |
|
$ |
34,714 |
|
$ |
95,053,204 |
|
$ |
(3,413,383 |
) |
$ |
(113,255,390 |
) |
$ |
(21,580,855 |
) |
The accompanying notes are an integral part of these consolidated financial statements.
EMMAUS LIFE SCIENCES, INC.
CONSOLIDATED STATEMENTS OF CASH FLOWS
(UNAUDITED)
|
|
|
Three months ended March 31, |
| ||||
|
|
|
2017 |
|
2016 |
| ||
|
|
|
|
|
|
| ||
|
CASH FLOWS FROM OPERATING ACTIVITIES |
|
|
|
|
| ||
|
Net loss |
|
$ |
(6,494,734 |
) |
$ |
(4,459,905 |
) |
|
Adjustments to reconcile net loss to net cash flows used in operating activities |
|
|
|
|
| ||
|
Depreciation and amortization |
|
5,308 |
|
3,668 |
| ||
|
Amortization of discount of convertible notes |
|
1,191,650 |
|
238,130 |
| ||
|
Foreign exchange adjustments on convertible notes and notes payable |
|
103,908 |
|
142,760 |
| ||
|
Share-based compensation |
|
1,028,350 |
|
540,516 |
| ||
|
Change in fair value of warrant derivative liabilities |
|
1,228,000 |
|
863,000 |
| ||
|
Net changes in operating assets and liabilities |
|
|
|
|
| ||
|
Accounts receivable |
|
(12,093 |
) |
43,136 |
| ||
|
Inventories |
|
(91,970 |
) |
(78,021 |
) | ||
|
Prepaid expenses and other current assets |
|
51,633 |
|
57,246 |
| ||
|
Deposits |
|
3,475 |
|
16,859 |
| ||
|
Accounts payable and accrued expenses |
|
937,338 |
|
338,171 |
| ||
|
Other current liability |
|
4,019,339 |
|
(65,000 |
) | ||
|
Deferred rent |
|
(4,016 |
) |
(424 |
) | ||
|
Net cash flows used in operating activities |
|
1,966,188 |
|
(2,359,864 |
) | ||
|
|
|
|
|
|
| ||
|
CASH FLOWS USED IN INVESTING ACTIVITIES |
|
|
|
|
| ||
|
Purchases of property and equipment |
|
(40,424 |
) |
— |
| ||
|
Net cash flows used in investing activities |
|
(40,424 |
) |
— |
| ||
|
|
|
|
|
|
| ||
|
CASH FLOWS FROM FINANCING ACTIVITIES |
|
|
|
|
| ||
|
Proceeds from notes payable issued |
|
— |
|
400,000 |
| ||
|
Proceeds from convertible notes payable issued |
|
200,000 |
|
279,950 |
| ||
|
Payments of notes payable |
|
— |
|
(228,000 |
) | ||
|
Payments of convertible notes |
|
— |
|
(44,000 |
) | ||
|
Proceeds from issuance of common stock |
|
98,800 |
|
1,799,999 |
| ||
|
Net cash flows from financing activities |
|
298,800 |
|
2,207,949 |
| ||
|
Effect of exchange rate changes on cash |
|
2,969 |
|
3,512 |
| ||
|
|
|
|
|
|
| ||
|
Net increase (decrease) in cash and cash equivalents |
|
2,227,533 |
|
(148,403 |
) | ||
|
Cash and cash equivalents, beginning of period |
|
1,317,340 |
|
472,341 |
| ||
|
Cash and cash equivalents, end of period |
|
$ |
3,544,873 |
|
$ |
323,938 |
|
|
|
|
|
|
|
| ||
|
SUPPLEMENTAL DISCLOSURES OF CASH FLOW ACTIVITIES |
|
|
|
|
| ||
|
Interest paid |
|
$ |
69,859 |
|
$ |
146,727 |
|
|
Income taxes paid |
|
$ |
2,400 |
|
$ |
2,400 |
|
The accompanying notes are an integral part of these consolidated financial statements.
EMMAUS LIFE SCIENCES, INC.
NOTES TO CONSOLIDATED FINANCIAL STATEMENTS
MARCH 31, 2017
(UNAUDITED)
NOTE 1 — BASIS OF PRESENTATION
The accompanying unaudited consolidated interim financial statements of Emmaus Life Sciences, Inc. and subsidiaries (collectively, the “Company” or “Emmaus”) have been prepared in accordance with accounting principles generally accepted in the United States of America (“GAAP”) on the basis that the Company will continue as a going concern. The consolidated financial statements include the accounts of the Company and its consolidated subsidiaries. All significant intercompany transactions have been eliminated. The Company’s unaudited consolidated interim financial statements contain adjustments, including normal recurring accruals necessary to present fairly the Company’s consolidated financial position, results of operations, comprehensive income (loss) and cash flows. Due to the uncertainty of the Company’s ability to meet its current operating and capital expenses, there is substantial doubt about the Company’s ability to continue as a going concern, as the continuation and expansion of its business is dependent upon obtaining further financing, successful and sufficient market acceptance of its products, and finally, achieving a profitable level of operations. The consolidated interim financial statements do not include any adjustments that might result from the outcome of these uncertainties. The consolidated interim financial statements should be read in conjunction with the Company’s Annual Report on Form 10-K for the year ended December 31, 2016, filed with the Securities and Exchange Commission (“SEC”) on March 31, 2017 (the “Annual Report”). Interim results for the periods presented herein are not necessarily indicative of the results that may be expected for the fiscal year ending December 31, 2017.
The preparation of the consolidated financial statements requires the use of management estimates. Actual results could differ materially from those estimates.
NOTE 2 — SUMMARY OF SIGNIFICANT ACCOUNTING POLICIES
Refer to the Annual Report for a summary of significant accounting policies. There have been no material changes to the Company’s significant accounting policies during the three months ended March 31, 2017. Below are disclosures of certain interim balances, transactions, and significant assumptions used in computing fair value as of and for the three months ended March 31, 2017 and comparative amounts from the prior fiscal periods:
Inventories — All of the raw material purchased during the three months ended March 31, 2017 and for the year ended December 31, 2016 was from one vendor. The below table presents inventory by category:
|
Inventory by category |
|
March 31, 2017 |
|
December 31, 2016 |
| ||
|
Work-in-process |
|
$ |
139,181 |
|
$ |
34,462 |
|
|
Finished goods |
|
122,241 |
|
131,747 |
| ||
|
|
|
$ |
261,422 |
|
$ |
166,209 |
|
Advertising cost — Advertising costs are expensed as incurred. Advertising costs for the three months ended March 31, 2017 and 2016 were $8,391 and $3,939, respectively.
Marketable securities — The Company’s marketable securities consist of three securities; (a) 39,250 shares of CellSeed, Inc. (“CellSeed”) stock which are part of 147,100 shares acquired in January 2009 for 100,028,000 Japanese Yen (equivalent to $1,109,819), at 680 Yen per share; (b) 849,744 shares of KPM Tech (“KPM”) which were acquired in October 2016 for 14,318,186,400 Korean Won (KRW) (equivalent to $13 million) at KRW16,850 per share; and (c) 271,950 shares of Hanil Vacuum (“Hanil”) which were acquired in October 2016 for KRW1,101,397,500 (equivalent to $1 million) at KRW4,050 per share. As of March 31, 2017 and December 31, 2016, the closing price per share for CellSeed was 560 Yen ($5.03) and 536 Yen ($4.58), respectively, the closing price per share for KPM on the KOSDAQ was KRW13,550 ($12.14) and KRW14,600 ($12.08), and closing price per share for Hanil on the KOSDAQ was KRW2,595 ($2.33) and KRW2,895 ($2.40), respectively.
As of March 31, 2017, 39,250 shares of CellSeed stock were pledged to secure a $300,000 convertible note issued to Mitsubishi UFJ Capital III Limited Partnership that is due on demand and are classified as current assets, as marketable securities, pledged to creditor.
Prepaid expenses and other current assets — Prepaid expenses and other current assets consisted of the following at March 31, 2017 and December 31, 2016:
|
|
|
March 31, 2017 |
|
December 31, 2016 |
| ||
|
Prepaid insurance |
|
$ |
65,016 |
|
$ |
100,060 |
|
|
Other prepaid expenses and current assets |
|
36,081 |
|
29,144 |
| ||
|
|
|
$ |
101,097 |
|
$ |
129,204 |
|
Other Current Liabilities — Included in the balance of other current liabilities as of March 31, 2017 is the $4,000,000 aggregate refundable deposits received from Generex Biotechnology Corporation in connection with the Letter of Intent executed on January 16, 2017 (LOI). The parties’ respective obligations under the LOI to consummate the proposed acquisition are subject to a number of conditions, including completion of due diligence to each party’s satisfaction and the negotiation and execution of a definitive purchase agreement, and there is no assurance these conditions will be satisfied.
Fair value measurements — The following table presents the activity for those items measured at fair value on a recurring basis using Level 3 inputs during the three months ended March 31, 2017 and the year ended December 31, 2016:
|
|
|
Period ended |
| ||||
|
Warrant Derivative Liabilities—Stock Purchase Warrants |
|
March 31, 2017 |
|
December 31, 2016 |
| ||
|
Balance, beginning of period |
|
$ |
10,600,000 |
|
$ |
7,863,000 |
|
|
Change in fair value included in consolidated statements of comprehensive loss |
|
1,228,000 |
|
2,737,000 |
| ||
|
Balance, end of period |
|
$ |
11,828,000 |
|
$ |
10,600,000 |
|
The value of the liability classified warrants, the value of warrant derivative liabilities and the change in fair value of the liability classified warrants and warrant derivative liabilities were determined using a Binomial Monte-Carlo Cliquet (aka “Ratchet”) Option Pricing Model. The model is similar to traditional Black-Scholes-type option pricing models, except that the exercise price resets at certain dates in the future. The values as of March 31, 2017, December 31, 2016 and the initial value as of September 11, 2013 were calculated based on the following assumptions:
|
|
|
March 31, 2017 |
|
December 31, 2016 |
|
Initial Value |
| |||
|
Stock price |
|
$ |
6.60 |
|
$ |
6.00 |
|
$ |
3.60 |
|
|
Risk-free interest rate |
|
1.14 |
% |
1.09 |
% |
1.72 |
% | |||
|
Expected volatility (peer group) |
|
64.70 |
% |
68.30 |
% |
72.40 |
% | |||
|
Expected life (in years) |
|
1.45 |
|
1.70 |
|
5.00 |
| |||
|
Number outstanding |
|
3,320,501 |
|
3,320,501 |
|
3,320,501 |
| |||
|
Balance, end of period: |
|
|
|
|
|
|
| |||
|
Liability classified warrants |
|
$ |
— |
|
$ |
— |
|
$ |
7,541,000 |
|
|
Warrant derivative liabilities |
|
$ |
11,828,000 |
|
$ |
10,600,000 |
|
$ |
— |
|
Debt and related party debt — The following table presents the effective interest rates on loans originated and refinanced in the respective periods that either had a beneficial conversion feature or an attached warrant:
|
Type of Loan |
|
Term of |
|
Stated |
|
Original |
|
Conversion |
|
Beneficial |
|
Warrants |
|
Exercise |
|
Warrant |
|
Effective |
| ||||
|
2016 convertible notes payable |
|
Due on demand - 2 years |
|
10 |
% |
10,866,291 |
|
$3.50- $4.50 |
|
3,196,544 |
|
75,000 |
|
$ |
4.70 |
|
161,658 |
|
14% - 102% |
| |||
|
2017 convertible notes payable |
|
Due on demand - 2 years |
|
10 |
% |
1,834,848 |
|
$3.50- $7.60 |
|
1,311,266 |
|
— |
|
$ |
— |
|
— |
|
10% - 99% |
| |||
|
Total |
|
|
|
|
|
$ |
12,701,139 |
|
|
|
$ |
4,507,810 |
|
75,000 |
|
|
|
$ |
161,658 |
|
|
| |
Related party notes are disclosed as separate line items in the Company’s balance sheets.
Net loss per share — As of March 31, 2017 and 2016, respectively, potentially dilutive securities exercisable or convertible into 15,554,439 and 11,837,427 shares of Company common stock were outstanding. No potentially dilutive securities were included in the calculation of diluted loss per share since their effect would be anti-dilutive for all periods presented.
Recent accounting pronouncements—In August 2014, the FASB issued ASU 2014-15, Presentation of Financial Statements—Going Concern (Subtopic 205-40): Disclosure of Uncertainties about an Entity’s Ability to Continue as a Going
Concern. This guidance requires management to evaluate, at each interim and annual reporting period, whether there are conditions or events that raise substantial doubt about the entity’s ability to continue as a going concern within one year after the date the financial statements are issued, and provide related disclosures. This guidance is effective for annual period ending after December 15, 2016, and for annual and interim periods thereafter. The Company adopted this guidance as of December 31, 2016. The adoption of this guidance had no material impact on its consolidated financial statements.
In January 2016, the Financial Accounting Standards Board (“FASB”) issued Accounting Standards Update (“ASU”) No. 2016-01, Recognition and Measurement of Financial Assets and Financial Liabilities. The amendments applicable to the Company in this Update (1) supersede the guidance to classify equity securities, except equity method securities, with readily determinable fair values into trading or available-for-sale categories and require equity securities to be measured at fair value with changes in the fair value recognized through net income, (2) allow equity investments that do not have readily determinable fair values to be remeasured at fair value either upon the occurrence of an observable price change or upon identification of an impairment, (3) require assessment for impairment of equity investments without readily determinable fair values qualitatively at each reporting period, (4) eliminate the requirement to disclose the methods and significant assumptions used in calculating the fair value of financial instruments required to be disclosed for financial instruments measured at amortized cost on the balance sheet, (5) require public business entities to use the exit price notion when measuring the fair value of financial instruments for disclosure purposes, (6) require separate presentation of financial assets and financial liabilities by measurement category and form of financial asset (that is, securities or loans and receivables) on the balance sheet or the accompanying notes to the financial statements, (7) clarify that an entity should evaluate the need for a valuation allowance on a deferred tax asset related to available-for-sale securities in combination with the entity’s other deferred tax assets. The amendments in this Update are effective for the Company for fiscal years beginning after December 15, 2017, including interim periods within those years. The amendments should be applied by means of a cumulative-effect adjustment to the balance sheet as of the beginning of the fiscal year of adoption. The amendments related to equity securities without readily determinable fair values (including disclosure requirements) should be applied prospectively to equity investments that exist as of the date of adoption of the Update. The impact of the adoption of the amendments in this Update will depend on the amount of equity securities and financial instruments subject to the amendments in this Update held by the Company at the time of adoption.
In February 2016, the FASB issued ASU No. 2016-02, Leases. The amendments in this Update require a lessee to recognize in the statement of financial position a liability to make lease payments (the lease liability) and a right-of-use asset representing its right to use the underlying asset for the lease term for all leases with terms greater than twelve months. For leases less than twelve months, an entity is permitted to make an accounting policy election by class of underlying asset not to recognize lease assets and lease liabilities. If a lessee makes this election, it should recognize lease expense for such leases generally on a straight-line basis over the lease term. The amendments in this Update are effective for the Company for fiscal years beginning after December 15, 2018, including interim periods within those years, with early adoption permitted. The Company is currently in the process of evaluating the impact of adoption of the amendments in this Update on the Company’s consolidated financial position and results of operations; however, adoption of the amendments in this Update are expected to be material for most entities who have a material lease with a term of greater than twelve months.
In March 2016, the FASB issued ASU 2016-09, Compensation—Stock Compensation (Topic 718): Improvements to Employee Share-Based Payment Accounting. The amendments in this Update simplify the accounting for share-based payment award transactions including: income tax consequences, classification of awards as either equity or liabilities and classification on the statement of cash flows. This Update is effective for annual periods beginning after December 15, 2016, including interim periods within those annual periods. Early adoption is permitted. The Company is currently in the process of evaluating this new Update.
In April 2016, the FASB issued ASU 2016-10, Revenue from Contracts with Customers (Topic 606): Identifying Performance Obligations and Licensing (“ASU 2016-10”). The amendments in ASU 2016-10 clarify identification of performance obligations and licensing implementation. The amendments do not change the core principle of the guidance in Topic 606. The effective date and transition requirements for the amendments are the same as the effective date and transition requirements in Topic 606: For public companies, this Update is effective for annual periods, including interim periods within those annual periods, beginning after December 15, 2017. The Company is currently evaluating the impact that the implementation of ASU 2016-10 will have on the Company’s financial statements.
In August 2016, the FASB issued ASU No. 2016-15, Statement of Cash Flows (Topic 230), Classification of Certain Cash Receipts and Cash Payments (“ASU 2016-15”). ASU 2016-15 provides guidance on the following eight specific cash flow classification issues: (1) debt prepayment or debt extinguishment costs; (2) settlement of zero-coupon debt instruments or other debt instruments with coupon interest rates that are insignificant in relation to the effective interest rate of the borrowing; (3) contingent consideration payments made after a business combination; (4) proceeds from the settlement of insurance claims; (5) proceeds from the settlement of corporate-owned life insurance policies, including bank-owned life insurance policies; (6) distributions received from equity method investees; (7) beneficial interests in securitization transactions; and (8) separately identifiable cash flows and
application of the predominance principle. Current GAAP does not include specific guidance on these eight cash flow classification issues. The amendments of this ASU are effective for reporting periods beginning after December 15, 2017, with early adoption permitted. The Company is currently assessing the impact the adoption of ASU 2016-15 will have on its financial statements.
In January 2017, the FASB issued ASU No. 2017-01, Business Combinations (Topic 805): Clarifying the Definition of a Business (“ASU 2017-01”). ASU 2017-01 clarifies the definition of a business with the objective of adding guidance to assist companies and other reporting organizations with evaluating whether transactions should be accounted for as acquisitions (or disposals) of assets or businesses. For public companies, the ASU is effective for annual periods beginning after December 15, 2017, including interim periods within those annual periods. Early adoption is permitted. The Company is currently in the process of evaluating this new Update.
NOTE 3 — PROPERTY AND EQUIPMENT
Property and equipment consisted of the following at:
|
|
|
March 31, 2017 |
|
December 31, 2016 |
| ||
|
Equipment |
|
$ |
180,914 |
|
$ |
175,410 |
|
|
Leasehold improvements |
|
69,189 |
|
30,804 |
| ||
|
Furniture and fixtures |
|
75,867 |
|
74,760 |
| ||
|
Subtotal |
|
325,970 |
|
280,974 |
| ||
|
Less: accumulated depreciation |
|
(232,962 |
) |
(227,244 |
) | ||
|
Total |
|
$ |
93,008 |
|
$ |
53,730 |
|
During the three months ended March 31, 2017 and 2016, depreciation expense was $5,308 and $3,668, respectively.
NOTE 4 — ACCOUNTS PAYABLE AND ACCRUED EXPENSES
Accounts payable and accrued expenses consisted of the following at:
|
|
|
March 31, 2017 |
|
December 31, 2016 |
| ||
|
Accounts payable |
|
|
|
|
| ||
|
Clinical and regulatory expenses |
|
$ |
322,603 |
|
$ |
145,239 |
|
|
Legal expenses |
|
99,859 |
|
43,700 |
| ||
|
Consulting fees |
|
191,473 |
|
99,800 |
| ||
|
Accounting fees |
|
42,500 |
|
65,267 |
| ||
|
Selling expenses |
|
24,991 |
|
60,724 |
| ||
|
Investor relations and public relations expenses |
|
11,099 |
|
19,931 |
| ||
|
Other vendors |
|
259,620 |
|
41,640 |
| ||
|
Total accounts payable |
|
952,145 |
|
476,301 |
| ||
|
Accrued interest payable, related parties |
|
262,766 |
|
274,851 |
| ||
|
Accrued interest payable |
|
1,562,739 |
|
1,441,450 |
| ||
|
Accrued expenses |
|
817,117 |
|
716,886 |
| ||
|
Deferred salary |
|
291,666 |
|
291,666 |
| ||
|
Total accounts payable and accrued expenses |
|
$ |
3,886,433 |
|
$ |
3,201,154 |
|
NOTE 5 — NOTES PAYABLE
Notes payable consisted of the following at March 31, 2017 and December 31, 2016:
|
Year |
|
Interest Rate |
|
Term of Notes |
|
Conversion |
|
Principal |
|
Discount |
|
Carrying |
|
Shares |
|
Principal |
|
Discount Amount |
|
Carrying |
|
Shares |
| ||||||
|
Notes payable |
|
|
|
|
|
|
|
|
|
|
|
|
|
|
|
|
|
|
|
|
|
|
| ||||||
|
2013 |
|
10% |
|
Due on demand |
|
— |
|
$ |
897,400 |
|
$ |
— |
|
$ |
897,400 |
|
— |
|
$ |
854,900 |
|
$ |
— |
|
$ |
854,900 |
|
— |
|
|
2015 |
|
11% |
|
Due on demand |
|
— |
|
1,948,700 |
|
— |
|
1,948,700 |
|
— |
|
2,406,194 |
|
— |
|
2,406,194 |
|
— |
| ||||||
|
2016 |
|
11% |
|
Due on demand |
|
— |
|
833,335 |
|
— |
|
833,335 |
|
— |
|
833,335 |
|
— |
|
833,335 |
|
— |
| ||||||
|
2017 |
|
11% |
|
Due on demand |
|
— |
|
613,104 |
|
— |
|
613,104 |
|
— |
|
— |
|
— |
|
— |
|
— |
| ||||||
|
|
|
|
|
|
|
|
|
$ |
4,292,539 |
|
$ |
— |
|
$ |
4,292,539 |
|
— |
|
$ |
4,094,429 |
|
$ |
— |
|
$ |
4,094,429 |
|
— |
|
|
|
|
|
|
|
|
|
|
|
|
|
|
|
|
|
|
|
|
|
|
|
|
|
| ||||||
|
|
|
|
|
Current |
|
|
|
$ |
4,292,539 |
|
$ |
— |
|
$ |
4,292,539 |
|
— |
|
$ |
4,094,429 |
|
$ |
— |
|
$ |
4,094,429 |
|
— |
|
|
|
|
|
|
Non-current |
|
|
|
$ |
— |
|
$ |
— |
|
$ |
— |
|
— |
|
$ |
— |
|
$ |
— |
|
$ |
— |
|
— |
|
|
Notes payable - related party |
|
|
|
|
|
|
|
|
|
|
|
|
|
|
|
|
|
|
| ||||||||||
|
2012 |
|
8% |
|
Due on demand |
|
— |
|
$ |
500,000 |
|
$ |
— |
|
$ |
500,000 |
|
— |
|
$ |
500,000 |
|
$ |
— |
|
$ |
500,000 |
|
— |
|
|
2013 |
|
8% |
|
Due on demand |
|
— |
|
50,000 |
|
— |
|
50,000 |
|
— |
|
50,000 |
|
— |
|
50,000 |
|
— |
| ||||||
|
2015 |
|
10% - 11% |
|
Due on demand |
|
— |
|
504,340 |
|
— |
|
504,340 |
|
— |
|
514,340 |
|
— |
|
514,340 |
|
— |
| ||||||
|
2016 |
|
10% - 11% |
|
Due on demand |
|
— |
|
860,510 |
|
— |
|
860,510 |
|
— |
|
860,510 |
|
— |
|
860,510 |
|
— |
| ||||||
|
2017 |
|
10% |
|
Due on demand |
|
— |
|
12,000 |
|
— |
|
12,000 |
|
— |
|
— |
|
— |
|
— |
|
— |
| ||||||
|
|
|
|
|
|
|
|
|
$ |
1,926,850 |
|
$ |
— |
|
$ |
1,926,850 |
|
— |
|
$ |
1,924,850 |
|
$ |
— |
|
$ |
1,924,850 |
|
— |
|
|
|
|
|
|
|
|
|
|
|
|
|
|
|
|
|
|
|
|
|
|
|
|
|
| ||||||
|
|
|
|
|
Current |
|
|
|
$ |
1,926,850 |
|
$ |
— |
|
$ |
1,926,850 |
|
— |
|
$ |
1,924,850 |
|
$ |
— |
|
$ |
1,924,850 |
|
— |
|
|
|
|
|
|
Non-current |
|
|
|
$ |
— |
|
$ |
— |
|
$ |
— |
|
— |
|
$ |
— |
|
$ |
— |
|
$ |
— |
|
— |
|
|
Convertible notes payable |
|
|
|
|
|
|
|
|
|
|
|
|
|
|
|
|
|
|
| ||||||||||
|
2011 |
|
10% |
|
5 years |
|
$3.05 |
|
$ |
300,000 |
|
$ |
— |
|
$ |
300,000 |
|
98,285 |
|
$ |
300,000 |
|
$ |
— |
|
$ |
300,000 |
|
98,285 |
|
|
2014 |
|
10% |
|
Due on demand - 2 years |
|
$3.05-$3.60 |
|
472,636 |
|
— |
|
472,636 |
|
160,782 |
|
452,168 |
|
— |
|
452,168 |
|
152,986 |
| ||||||
|
2015 |
|
10% |
|
2 years |
|
$3.50-$3.60 |
|
2,279,226 |
|
28,731 |
|
2,250,495 |
|
693,814 |
|
2,904,800 |
|
104,389 |
|
2,800,411 |
|
889,115 |
| ||||||
|
2016 |
|
10% |
|
Due on demand — 1 year |
|
$3.50-$4.50 |
|
7,299,620 |
|
478,884 |
|
6,820,736 |
|
1,994,045 |
|
8,126,129 |
|
1,475,744 |
|
6,650,385 |
|
2,193,687 |
| ||||||
|
2017 |
|
10% |
|
Due on demand — 1 year |
|
$3.50-$7.60 |
|
1,834,848 |
|
1,192,134 |
|
642,714 |
|
493,089 |
|
— |
|
— |
|
— |
|
— |
| ||||||
|
|
|
|
|
|
|
|
|
$ |
12,186,330 |
|
$ |
1,699,749 |
|
$ |
10,486,581 |
|
3,440,015 |
|
$ |
11,783,097 |
|
$ |
1,580,133 |
|
$ |
10,202,964 |
|
3,334,073 |
|
|
|
|
|
|
|
|
|
|
|
|
|
|
|
|
|
|
|
|
|
|
|
|
|
| ||||||
|
|
|
|
|
Current |
|
|
|
$ |
11,325,037 |
|
$ |
1,541,550 |
|
$ |
9,783,487 |
|
3,211,532 |
|
$ |
10,499,303 |
|
$ |
1,294,296 |
|
$ |
9,205,007 |
|
2,984,161 |
|
|
|
|
|
|
Non-current |
|
|
|
$ |
861,293 |
|
$ |
158,199 |
|
$ |
703,094 |
|
228,483 |
|
$ |
1,283,794 |
|
$ |
285,837 |
|
$ |
997,957 |
|
349,912 |
|
|
Convertible notes payable - related party |
|
|
|
|
|
|
|
|
|
|
|
|
|
|
|
|
|
|
| ||||||||||
|
2012 |
|
10% |
|
Due on demand |
|
$3.30 |
|
$ |
254,000 |
|
$ |
— |
|
$ |
254,000 |
|
78,888 |
|
$ |
254,000 |
|
$ |
— |
|
$ |
254,000 |
|
94,532 |
|
|
2015 |
|
10% |
|
2 years |
|
$4.50 |
|
220,000 |
|
— |
|
220,000 |
|
55,668 |
|
220,000 |
|
— |
|
220,000 |
|
54,463 |
| ||||||
|
|
|
|
|
|
|
|
|
$ |
474,000 |
|
$ |
— |
|
$ |
474,000 |
|
134,556 |
|
$ |
474,000 |
|
$ |
— |
|
$ |
474,000 |
|
148,995 |
|
|
|
|
|
|
|
|
|
|
|
|
|
|
|
|
|
|
|
|
|
|
|
|
|
| ||||||
|
|
|
|
|
Current |
|
|
|
$ |
474,000 |
|
$ |
— |
|
$ |
474,000 |
|
134,556 |
|
$ |
474,000 |
|
$ |
— |
|
$ |
474,000 |
|
148,995 |
|
|
|
|
|
|
Non-current |
|
|
|
$ |
— |
|
$ |
— |
|
$ |
— |
|
— |
|
$ |
— |
|
$ |
— |
|
$ |
— |
|
— |
|
|
|
|
|
|
Grand Total |
|
|
|
$ |
18,879,719 |
|
$ |
1,699,749 |
|
$ |
17,179,970 |
|
3,574,571 |
|
$ |
18,276,376 |
|
$ |
1,580,133 |
|
$ |
16,696,243 |
|
3,483,068 |
|
The weighted average stated interest rate of notes payable as of March 31, 2017 and December 31, 2016 was 10%. The weighted average effective interest rate of notes payable for the three-month period ended March 31, 2017 and the year ended December 31, 2016 was 28% and 27% respectively, after giving effect to discounts relating to beneficial conversion features and the fair value of warrants issued in connection with these notes. The notes payable and convertible notes payable do not have restrictive financial covenants or acceleration clauses associated with a material adverse change event. The holders of the convertible notes have the option to convert their notes into Company common stock at the stated conversion price during the term of their convertible notes. Conversion prices on these convertible notes payable range from $3.05 to $3.60 per share. Certain notes with a $4.50 or a $7.00 stated conversion price in the second year of their two-year term are subject to automatic conversion into shares of Company common stock at a conversion price equal to 80% of the initial public offering price at the time of a qualified public offering. All notes due on demand are treated as current liabilities.
Contractual principal payments due on notes payable are as follows:
|
Year Ending |
|
March 31, 2017 |
| |
|
2017 |
|
$ |
17,473,957 |
|
|
2018 |
|
1,405,762 |
| |
|
Total |
|
$ |
18,879,719 |
|
The Company estimated the total fair value of any beneficial conversion feature and accompanying warrants in allocating the note proceeds. The proceeds allocated to the beneficial conversion feature were determined by taking the estimated fair value of shares issuable under the convertible notes less the fair value of the number of shares that would be issued if the conversion rate equaled the fair value of Company common stock as of the date of issuance (see Note 2). The fair value of the warrants issued in conjunction with notes was determined using the Black Scholes Merton Option Pricing Model with the following inputs for the periods ended December 31, 2016. The Company did not issue any warrants in conjunction with notes in the three months ended March 31, 2017.
|
|
|
December 31, 2016 |
| |
|
Stock price |
|
$ |
5.00 |
|
|
Exercise price |
|
$ |
4.50 - 4.70 |
|
|
Term |
|
5 years |
| |
|
Risk-free interest rate |
|
1.01 - 1.28 |
% | |
|
Expected dividend yield |
|
— |
| |
|
Expected volatility |
|
65.4 - 69.6 |
% | |
In situations where the notes included both a beneficial conversion feature and a warrant, the proceeds were allocated to the warrants and beneficial conversion feature based on their respective pro rata fair values.
NOTE 6 — STOCKHOLDERS’ DEFICIT
Private placement — On September 11, 2013, the Company issued an aggregate of 3,020,501 units at a price of $2.50 per unit (the “Private Placement”). Each unit consisted of one share of common stock and one common stock warrant for the purchase of an additional share of common stock. The aggregate purchase price for the units was $7,551,253. In addition, 300,000 warrants for the purchase of a share of common stock were issued to a broker under the same terms as the Private Placement transaction (the “Broker Warrants”).
The warrants issued in the Private Placement and the Broker Warrants entitle the holders thereof to purchase, at any time on or prior to September 11, 2018, shares of common stock of the Company at an exercise price of $3.50 per share. The warrants contain non-standard anti-dilution protection and, consequently, are being accounted for as liabilities, were originally recorded at fair value, and are adjusted to fair market value each reporting period. Because the shares of common stock underlying the Private Placement warrants and Broker Warrants were not effectively registered for resale by September 11, 2014, the warrant holders have an option to exercise the warrants using a cashless exercise feature. The shares have not been registered for resale as of March 31, 2017. The availability to warrant holders of the cashless exercise feature as of September 11, 2014 caused the then-outstanding 2,225,036 Private Placement warrants and Broker Warrants with fair value of $7,068,000 to be reclassified from liability classified warrants to warrant derivative liabilities and to continue to be remeasured at fair value each reporting period. On June 10, 2014, certain warrant holders exercised 1,095,465 warrants issued in the Private Placement for the exercise price of $3.50 per share, resulting in the Company receiving aggregate exercise proceeds of $3.8 million and issuing 1,095,465 shares of common stock. Prior to exercise, these Private Placement warrants were accounted for at fair value as liability classified warrants. As of June 10, 2014, immediately prior to exercise, the carrying value of these Private Placement warrants was reduced to their fair value immediately prior to exercise of $1.8 million, representing their intrinsic value, with this adjusted carrying value of $1.8 million being transferred to additional paid-in capital. Also
on June 10, 2014, based on an offer made to holders of Private Placement warrants in connection with such exercises, the Company issued an aggregate of 1,095,465 replacement warrants to holders exercising Private Placement warrants, which replacement warrants have terms that are generally the same as the exercised warrants, including an expiration date of September 11, 2018 and an exercise price of $3.50 per share.
The replacement warrants are treated for accounting purposes as liability classified warrants, and their issuance gave rise to a $3.5 million warrant exercise inducement expense based on their fair value as of issuance as determined using a Binomial Monte-Carlo Cliquet (aka Ratchet) Option Pricing Model. Because the shares of common stock underlying the replacement warrants were not effectively registered for resale by June 10, 2015, the warrant holders have an option to exercise the warrants using a cashless exercise feature. The shares have not been registered for resale as of March 31, 2017. The availability to warrant holders of the cashless exercise feature as of June 10, 2015 caused the then-outstanding 1,095,465 replacement warrants with fair value of $2,545,000 to be reclassified from liability classified warrants to warrant derivative liabilities and to continue to be remeasured at fair value each reporting period.
As of March 31, 2017, the aggregate fair value of the Private Placement warrants, replacement warrants and the Broker Warrants was $11,828,000 (see Note 2). For further details regarding registration rights associated with the Private Placement warrants, replacement warrants and Broker Warrants, see the Registration Rights section below in this footnote.
A summary of outstanding warrants as of March 31, 2017 and December 31, 2016 is presented below:
|
|
|
Three months ended |
|
Year ended |
|
|
Warrants outstanding, beginning of period |
|
5,024,668 |
|
3,530,918 |
|
|
Granted |
|
— |
|
1,493,750 |
|
|
Exercised |
|
— |
|
— |
|
|
Cancelled, forfeited or expired |
|
— |
|
— |
|
|
Warrants outstanding, end of period |
|
5,024,668 |
|
5,024,668 |
|
A summary of outstanding warrants by year issued and exercise price as of March 31, 2017 is presented below:
|
|
|
Outstanding |
|
Exercisable |
| |||||||||||
|
Exercise Price |
|
Number of |
|
Weighted |
|
Weighted |
|
Total |
|
Weighted |
| |||||
|
At December 31, 2013 |
|
|
|
|
|
|
|
|
|
|
|
|
| |||
|
|
|
$ |
3.30 |
|
50,000 |
|
1.08 |
|
$ |
3.30 |
|
50,000 |
|
$ |
3.30 |
|
|
|
|
$ |
3.50 |
|
2,225,036 |
|
1.45 |
|
$ |
3.50 |
|
2,225,036 |
|
$ |
3.50 |
|
|
|
|
2013 total |
|
2,275,036 |
|
|
|
|
|
2,275,036 |
|
|
| |||
|
|
|
|
|
|
|
|
|
|
|
|
|
|
| |||
|
At December 31, 2014 |
|
|
|
|
|
|
|
|
|
|
|
|
| |||
|
|
|
$ |
3.50 |
|
1,145,465 |
|
1.48 |
|
$ |
3.50 |
|
1,145,465 |
|
$ |
3.50 |
|
|
|
|
2014 total |
|
1,145,465 |
|
|
|
|
|
1,145,465 |
|
|
| |||
|
|
|
|
|
|
|
|
|
|
|
|
|
|
| |||
|
At December 31, 2015 |
|
|
|
|
|
|
|
|
|
|
|
|
| |||
|
|
|
$ |
4.90 |
|
110,417 |
|
2.93 |
|
$ |
4.90 |
|
110,417 |
|
$ |
4.90 |
|
|
|
|
2015 total |
|
110,417 |
|
|
|
|
|
110,417 |
|
|
| |||
|
At December 31, 2016 |
|
|
|
|
|
|
|
|
|
|
|
|
| |||
|
|
|
$ |
4.50 |
|
118,750 |
|
4.25 |
|
$ |
4.50 |
|
118,750 |
|
$ |
4.50 |
|
|
|
|
$ |
4.70 |
|
75,000 |
|
4.09 |
|
$ |
4.70 |
|
75,000 |
|
$ |
4.70 |
|
|
|
|
$ |
5.00 |
|
1,300,000 |
|
4.11 |
|
$ |
5.00 |
|
1,300,000 |
|
$ |
5.00 |
|
|
|
|
2016 Total |
|
1,493,750 |
|
|
|
|
|
1,493,750 |
|
|
| |||
|
|
|
Total |
|
5,024,668 |
|
|
|
|
|
5,024,668 |
|
|
| |||
Stock options — During the three months ended March 31, 2017, no options were granted by the Company. During the year ended December 31, 2016, the Company granted 2,596,200 options to its officers, directors and employees. Of these options, 300,000 granted to directors of the Company will vest in equal one-third installments on each of the first three anniversaries of the grant date, have an exercise price of $4.70 per share and are exercisable through 2026. The remaining 2,296,200 options will vest one-third (1/3)
on the first anniversary of the grant date and two-thirds (2/3) in 24 approximately equal monthly installments thereafter, except for 300,000 options granted to directors of the Company which will vest in equal one-third installments over three years starting May 10, 2017. These options have an exercise price of $5.00 per share and are exercisable through 2026. As of March 31, 2017, there were 6,955,200 options outstanding under the Emmaus Life Sciences, Inc. 2011 Stock Incentive Plan.
Summaries of outstanding options as of March 31, 2017 and December 31, 2016 are presented below.
|
|
|
March 31, 2017 |
|
December 31, 2016 |
| ||||||
|
|
|
Number of |
|
Weighted- |
|
Number of |
|
Weighted- |
| ||
|
Options outstanding, beginning of period |
|
6,955,200 |
|
$ |
4.10 |
|
4,753,335 |
|
$ |
3.60 |
|
|
Granted or deemed issued |
|
— |
|
$ |
— |
|
2,596,200 |
|
$ |
4.97 |
|
|
Exercised |
|
— |
|
$ |
— |
|
(15,866 |
) |
$ |
3.60 |
|
|
Cancelled, forfeited and expired |
|
— |
|
$ |
— |
|
(378,469 |
) |
$ |
3.91 |
|
|
Options outstanding, end of period |
|
6,955,200 |
|
$ |
4.10 |
|
6,955,200 |
|
$ |
4.10 |
|
|
Options exercisable, end of period |
|
4,503,000 |
|
$ |
3.62 |
|
4,372,667 |
|
$ |
3.59 |
|
|
Options available for future grant, end of period |
|
2,044,800 |
|
|
|
2,044,800 |
|
|
| ||
During the three months ended March 31, 2017 and 2016, the Company recognized $1.0 million and $0.5 million, respectively, of share-based compensation expense arising from stock options. As of March 31, 2017, there was $7.0 million of total unrecognized compensation expense related to unvested share-based compensation arrangements granted under the Company’s 2011 Stock Incentive Plan. That expense is expected to be recognized over the weighted-average remaining period of 1.9 years.
Registration rights — Pursuant to the Subscription Agreements relating to the Private Placement and certain warrants, as well as pursuant to the replacement of certain warrants by the Company on June 10, 2014, the Company agreed to use its commercially reasonable best efforts to have on file with the SEC, by September 11, 2014 and at the Company’s sole expense, a registration statement to permit the public resale of 4,115,966 shares of Company common stock and 3,320,501 shares of common stock underlying warrants (collectively, the “Registrable Securities”). In the event such registration statement includes securities to be offered and sold by the Company in a fully underwritten primary public offering pursuant to an effective registration under the Securities Act of 1933, as amended (the “Securities Act”), and the Company is advised in good faith by any managing underwriter of securities being offered pursuant to such registration statement that the number of Registrable Securities proposed to be sold in such offering is greater than the number of such securities which can be included in such offering without materially adversely affecting such offering, the Company will include in such registration the following securities in the following order of priority: (i) any securities the Company proposes to sell, and (ii) the Registrable Securities, with any reductions in the number of Registrable Securities actually included in such registration to be allocated on a pro rata basis among the holders thereof. The registration rights described above apply until all Registrable Securities have been sold pursuant to Rule 144 under the Securities Act or may be sold without registration in reliance on Rule 144 under the Securities Act without limitation as to volume and without the requirement of any notice filing. If the shares of common stock underlying these warrants to purchase 3,320,501 shares are not registered for resale at the time of exercise, and the registration rights described above then apply with respect to the holder of such warrants, such holder may exercise such warrants on a cashless basis. In such a cashless exercise of all the shares covered by the warrant, the warrant holder would receive a number of shares equal to the quotient of (i) the difference between the fair market value of the common stock, as defined, and the $3.50 exercise price, as adjusted, multiplied by the number of shares exercisable under the warrant, divided by (ii) the fair market value of the common stock, as defined. As of March 31, 2017, based on a fair market value of a share of Company common stock of $6.60 and 3,320,501 warrants issued and outstanding and eligible for cashless exercise, the maximum number of shares the Company would be required to issue, if the warrant holders elected to exercise the cashless exercise feature with respect to all then eligible warrants, is 1,559,629 shares. If the fair market value of a share of Company common stock were to increase by $1.00 from $6.60 to $7.60, the maximum number of shares the Company would be required to issue, if the warrant holders elected to exercise the cashless exercise feature with respect to all then eligible warrants, would increase to 1,791,323 shares as of March 31, 2017.
The Company has not yet filed a registration statement with respect to the resale of the Registrable Securities. The Company believes that it has used commercially reasonable efforts to file a registration statement with respect to the resale of Registrable Securities.
Korean Private Placement — On September 12, 2016, the Company entered into Letter of Agreement with KPM Tech Co., Ltd. (“KPM”) and Hanil Vacuum Co., Ltd. (“Hanil”), both Korean-based public companies whose shares are listed on KOSDAQ, a trading board of Korea Exchange in South Korea. In the Letter of Agreement, the parties agreed that KPM and Hanil would purchase by September 30, 2016 $17 million and $3 million, respectively, of shares of our common stock at a price of $4.50 per share. In exchange, the Company agreed to invest $13 million and $1 million in future capital increases by KPM and Hanil, respectively, at prices based upon the trading prices of KPM and Hanil shares on KOSDAQ. The Letter of Agreement contemplates that KPM and Hanil may purchase additional shares of our common stock in a second transaction to be mutually agreed upon by the parties. In connection with the Letter of Agreement, KPM and Hanil entered into our standard form subscription agreement with respect to their purchase of shares which contains customary representations and warranties of the parties.
On September 29, 2016, KPM and Hanil purchased and acquired from the Company 3,777,778 shares and 666,667 shares, respectively, of common stock at a price of $4.50 a share for $17 million and $3 million, respectively, for a gross total of $20 million. The Company recognized $720,000 as a reduction to its additional paid-in-capital for fees and commissions payable by the Company in connection with the transaction.
Pursuant to the terms of the Letter of Agreement dated September 12, 2016, the Company invested $13 million and $1 million in capital increases by KPM and Hanil, respectively, at $15.32 and $3.68, respectively, per capita share.
Pursuant to the terms of a subscription agreement dated as of September 11, 2013 among the Company and certain purchasers of shares of our common stock and warrants to purchase shares of our common stock, the purchasers are entitled to participation rights with respect to the sale of shares pursuant to the Letter of Agreement. To the extent the purchasers exercise their participation rights, we may be obliged to sell to them a specified number of shares of our common stock at the price per share and other terms set forth in the Letter of Agreement. There can be no assurance that any purchaser will exercise its participation rights or that any shares of our common stock will be issued to any purchaser.
NOTE 7 — COMMITMENTS AND CONTINGENCIES
Distribution contract — Cardinal Health Specialty Pharmacy Services has been contracted to distribute NutreStore to other wholesale distributors and some independent pharmacies since April 2008. For these services, the Company pays a monthly commercialization management fee of $4,500.
Operating leases — The Company leases its office space under operating leases with unrelated entities. The rent expense during the three months ended March 31, 2017 and 2016 amounted to $151,312 and $144,364, respectively.
Future minimum lease payments under the agreements are as follows as of March 31, 2017:
|
Year |
|
Amount |
| |
|
2017 (nine months) |
|
$ |
413,194 |
|
|
2018 |
|
537,279 |
| |
|
2019 |
|
126,115 |
| |
|
|
|
$ |
1,076,588 |
|
NOTE 8 — RELATED PARTY TRANSACTIONS
The following table sets forth information relating to the Company’s loans from related parties outstanding as of March 31, 2017.
|
Class |
|
Lender |
|
Annual |
|
Date |
|
Term |
|
Principal |
|
Highest |
|
Amount |
|
Amount |
|
Conversion |
|
Shares |
| |||||
|
Notes payable to related parties—current: |
|
|
|
|
|
|
|
|
|
|
|
|
|
|
|
|
|
|
| |||||||
|
|
|
Hope Hospice(1) |
|
8 |
% |
1/17/2012 |
|
Due on demand |
|
$ |
200,000 |
|
$ |
200,000 |
|
$ |
— |
|
$ |
4,000 |
|
$ |
— |
|
— |
|
|
|
|
Hope Hospice(1) |
|
8 |
% |
6/14/2012 |
|
Due on demand |
|
200,000 |
|
200,000 |
|
— |
|
— |
|
— |
|
— |
| |||||
|
|
|
Hope Hospice(1) |
|
8 |
% |
6/21/2012 |
|
Due on demand |
|
100,000 |
|
100,000 |
|
— |
|
— |
|
— |
|
— |
| |||||
|
|
|
Hope Hospice(1) |
|
8 |
% |
2/11/2013 |
|
Due on demand |
|
50,000 |
|
50,000 |
|
— |
|
— |
|
— |
|
— |
| |||||
|
|
|
Hope Hospice(1) |
|
10 |
% |
1/7/2015 |
|
Due on demand |
|
100,000 |
|
100,000 |
|
— |
|
— |
|
— |
|
— |
| |||||
|
|
|
IRA Service Trust Co. FBO Peter B. Ludlum(2) |
|
10 |
% |
2/20/2015 |
|
Due on demand |
|
10,000 |
|
10,000 |
|
— |
|
— |
|
— |
|
— |
| |||||
|
|
|
Yutaka Niihara(2)(3) |
|
10 |
% |
5/21/2015 |
|
Due on demand |
|
94,340 |
|
826,105 |
|
731,765 |
|
— |
|
— |
|
— |
| |||||
|
|
|
Masaharu & Emiko Osato(3) |
|
11 |
% |
12/29/2015 |
|
Due on demand |
|
300,000 |
|
300,000 |
|
— |
|
— |
|
— |
|
— |
| |||||
|
|
|
Lan T. Tran(2) |
|
11 |
% |
2/10/2016 |
|
Due on demand |
|
130,510 |
|
130,510 |
|
— |
|
— |
|
— |
|
— |
| |||||
|
|
|
Masaharu & Emiko Osato(3) |
|
11 |
% |
2/25/2016 |
|
Due on demand |
|
400,000 |
|
400,000 |
|
— |
|
— |
|
— |
|
— |
| |||||
|
|
|
Hope Hospice(1) |
|
10 |
% |
4/4/2016 |
|
Due on demand |
|
50,000 |
|
50,000 |
|
— |
|
— |
|
— |
|
— |
| |||||
|
|
|
Lan T. Tran(2) |
|
10 |
% |
4/29/2016 |
|
Due on demand |
|
20,000 |
|
20,000 |
|
— |
|
— |
|
— |
|
— |
| |||||
|
|
|
IRA Service Trust Co. FBO Peter B. Ludlum(2) |
|
10 |
% |
5/5/2016 |
|
Due on demand |
|
10,000 |
|
10,000 |
|
— |
|
— |
|
— |
|
— |
| |||||
|
|
|
Hope Hospice(1) |
|
10 |
% |
6/3/2016 |
|
Due on demand |
|
250,000 |
|
250,000 |
|
— |
|
— |
|
— |
|
— |
| |||||
|
|
|
Lan T. Tran(2) |
|
10 |
% |
2/9/2017 |
|
Due on demand |
|
12,000 |
|
12,000 |
|
— |
|
— |
|
— |
|
— |
| |||||
|
|
|
|
|
|
|
|
|
Sub total |
|
$ |
1,926,850 |
|
$ |
2,658,615 |
|
$ |
731,765 |
|
$ |
4,000 |
|
$ |
— |
|
— |
|
|
Convertible notes payable to related parties—current: |
|
|
|
|
|
|
|
|
|
|
|
|
|
|
|
|
|
|
| |||||||
|
|
|
Yasushi Nagasaki(2) |
|
10 |
% |
6/29/2012 |
|
Due on demand |
|
$ |
254,000 |
|
$ |
388,800 |
|
$ |
134,800 |
|
$ |
57,886 |
|
$ |
3.30 |
|
78,888 |
|
|
|
|
Charles & Kimxa Stark(2) |
|
10 |
% |
10/1/2015 |
|
2 years |
|
20,000 |
|
20,000 |
|
— |
|
— |
|
4.50 |
|
5,111 |
| |||||
|
|
|
Yutaka & Soomi Niihara(2)(3) |
|
10 |
% |
11/16/2015 |
|
2 years |
|
200,000 |
|
200,000 |
|
— |
|
— |
|
4.50 |
|
50,557 |
| |||||
|
|
|
|
|
|
|
|
|
Sub total |
|
$ |
474,000 |
|
$ |
608,800 |
|
$ |
134,800 |
|
$ |
57,886 |
|
— |
|
134,556 |
| |
|
|
|
|
|
|
|
|
|
Total |
|
$ |
2,400,850 |
|
$ |
3,267,415 |
|
$ |
866,565 |
|
$ |
61,886 |
|
— |
|
134,556 |
| |
(1) Dr. Niihara, a director and officer of the Company, is also the Chief Executive Officer of Hope Hospice.
(2) Officer.
(3) Director.
(4) Family of Officer/Director.
The following table sets forth information relating to the Company’s loans from related persons outstanding as of December 31, 2016.
|
Class |
|
Lender |
|
Annual |
|
Date |
|
Term |
|
Principal |
|
Highest |
|
Amount |
|
Amount |
|
Conversion |
|
Shares |
| |||||
|
Notes payable to related parties—current: |
|
|
|
|
|
|
|
|
|
|
|
|
|
|
|
|
|
|
| |||||||
|
|
|
Hope Hospice(1) |
|
8 |
% |
1/17/2012 |
|
Due on demand |
|
$ |
200,000 |
|
$ |
200,000 |
|
$ |
— |
|
$ |
20,000 |
|
$ |
— |
|
— |
|
|
|
|
Hope Hospice(1) |
|
8 |
% |
6/14/2012 |
|
Due on demand |
|
200,000 |
|
200,000 |
|
— |
|
20,000 |
|
— |
|
— |
| |||||
|
|
|
Hope Hospice(1) |
|
8 |
% |
6/21/2012 |
|
Due on demand |
|
100,000 |
|
100,000 |
|
— |
|
10,000 |
|
— |
|
— |
| |||||
|
|
|
Hope Hospice(1) |
|
8 |
% |
2/11/2013 |
|
Due on demand |
|
50,000 |
|
50,000 |
|
— |
|
5,000 |
|
— |
|
— |
| |||||
|
|
|
Hope Hospice(1) |
|
10 |
% |
1/7/2015 |
|
Due on demand |
|
100,000 |
|
100,000 |
|
— |
|
— |
|
— |
|
— |
| |||||
|
|
|
Lan T. Tran(2) |
|
10 |
% |
2/9/2015 |
|
Due on demand |
|
10,000 |
|
10,000 |
|
— |
|
— |
|
— |
|
— |
| |||||
|
|
|
IRA Service Trust Co. FBO Peter B. Ludlum(2) |
|
10 |
% |
2/20/2015 |
|
Due on demand |
|
10,000 |
|
10,000 |
|
— |
|
— |
|
— |
|
— |
| |||||
|
|
|
Yutaka Niihara(2)(3) |
|
10 |
% |
5/21/2015 |
|
Due on demand |
|
94,340 |
|
826,105 |
|
731,765 |
|
47,822 |
|
— |
|
— |
| |||||
|
|
|
Masaharu & Emiko Osato(3) |
|
11 |
% |
12/29/2015 |
|
Due on demand |
|
300,000 |
|
300,000 |
|
— |
|
— |
|
— |
|
— |
| |||||
|
|
|
Lan T. Tran(2) |
|
11 |
% |
2/10/2016 |
|
Due on demand |
|
130,510 |
|
130,510 |
|
— |
|
— |
|
— |
|
— |
| |||||
|
|
|
Hideki & Eiko Uehara(4) |
|
11 |
% |
2/15/2016 |
|
Due on demand |
|
— |
|
133,333 |
|
133,333 |
|
12,226 |
|
— |
|
— |
| |||||
|
|
|
Masaharu & Emiko Osato(3) |
|
11 |
% |
2/25/2016 |
|
Due on demand |
|
400,000 |
|
400,000 |
|
— |
|
— |
|
— |
|
— |
| |||||
|
|
|
Hope Hospice(1) |
|
10 |
% |
4/4/2016 |
|
Due on demand |
|
50,000 |
|
50,000 |
|
— |
|
— |
|
— |
|
— |
| |||||
|
|
|
Willis C. Lee(2)(3) |
|
10 |
% |
4/8/2016 |
|
Due on demand |
|
— |
|
79,700 |
|
79,700 |
|
1,288 |
|
— |
|
— |
| |||||
|
|
|
Lan T. Tran(2) |
|
10 |
% |
4/29/2016 |
|
Due on demand |
|
20,000 |
|
20,000 |
|
— |
|
— |
|
— |
|
— |
| |||||
|
|
|
IRA Service Trust Co. FBO Peter B. Ludlum(2) |
|
10 |
% |
5/5/2016 |
|
Due on demand |
|
10,000 |
|
10,000 |
|
— |
|
— |
|
— |
|
— |
| |||||
|
|
|
Hope Hospice(1) |
|
10 |
% |
6/3/2016 |
|
Due on demand |
|
250,000 |
|
250,000 |
|
— |
|
— |
|
— |
|
— |
| |||||
|
|
|
|
|
|
|
|
|
Sub total |
|
$ |
1,924,850 |
|
$ |
2,869,648 |
|
$ |
944,798 |
|
$ |
116,336 |
|
$ |
— |
|
— |
|
|
Convertible notes payable to related parties—current: |
|
|
|
|
|
|
|
|
|
|
|
|
|
|
|
|
|
|
| |||||||
|
|
|
Yasushi Nagasaki(2) |
|
10 |
% |
6/29/2012 |
|
Due on demand |
|
$ |
254,000 |
|
$ |
388,800 |
|
$ |
134,800 |
|
$ |
27,824 |
|
$ |
3.30 |
|
94,532 |
|
|
|
|
Charles & Kimxa Stark(2) |
|
10 |
% |
10/1/2015 |
|
2 years |
|
20,000 |
|
20,000 |
|
— |
|
— |
|
4.50 |
|
5,002 |
| |||||
|
|
|
Yutaka & Soomi Niihara(2)(3) |
|
10 |
% |
11/16/2015 |
|
2 years |
|
200,000 |
|
200,000 |
|
— |
|
— |
|
4.50 |
|
49,461 |
| |||||
|
|
|
|
|
|
|
|
|
Sub total |
|
$ |
474,000 |
|
$ |
608,800 |
|
$ |
134,800 |
|
$ |
27,824 |
|
— |
|
148,995 |
| |
|
|
|
|
|
|
|
|
|
Total |
|
$ |
2,398,850 |
|
$ |
3,478,448 |
|
$ |
1,079,598 |
|
$ |
144,160 |
|
— |
|
148,995 |
| |
(1) Dr. Niihara, who is the Company’s CEO, is also the CEO of Hope Hospice.
(2) Officer
(3) Director
(4) Family of Officer/Director
NOTE 9 — GEOGRAPHIC INFORMATION
For the three months ended March 31, 2017 and 2016, the Company earned revenue from countries outside of the United States as outlined in the table below:
|
Country |
|
Revenues for |
|
% of total revenue for the |
|
Revenues for the |
|
% of total revenue for the |
| ||
|
Japan |
|
$ |
28,558 |
|
27 |
% |
$ |
51,074 |
|
64 |
% |
|
Taiwan |
|
64,300 |
|
60 |
% |
25,211 |
|
32 |
% | ||
The Company did not have any significant currency translation or foreign transaction adjustments during the three months ended March 31, 2017 or 2016.
NOTE 10 — SUBSEQUENT EVENTS
Subsequent to March 31, 2017, the Company issued the following:
|
Note issued after March 31, 2017 |
|
Amount |
|
Annual Interest |
|
Term of Note |
|
Conversion Price |
| ||
|
Convertible notes |
|
$ |
4,085,587 |
|
10.00 |
% |
Due on demand ~ 2 Years |
|
$ |
3.50 |
|
|
Convertible notes |
|
$ |
555,591 |
|
10.00 |
% |
2 years |
|
$ |
3.60 |
|
|
Promissory note |
|
$ |
1,500,000 |
|
11.00 |
% |
Due on demand ~ 2 Years |
|
— |
| |
|
Total |
|
$ |
6,141,178 |
|
|
|
|
|
|
| |
Subsequent to March 31, 2017, the Company issued the following:
|
Common Shares Issued after March 31, 2017 |
|
Amount |
|
Number of Shares Issued |
| |
|
Common shares |
|
$ |
212,800 |
|
28,000 |
|
|
Total |
|
$ |
212,800 |
|
28,000 |
|
Subsequent to March 31, 2017, the Company announced that the Oncologic Drug Advisory Committee of the U.S. Food and Drug Administration (FDA) has set a date of May 24, 2017 to review the Company’s New Drug Application (NDA) for its orally-administered pharmaceutical grade L-glutamine product (Endari™), for the treatment of sickle cell disease.
Item 2. Management’s Discussion and Analysis of Financial Condition and Results of Operations
With respect to the following discussion, the terms, “we,” “us,” “our” or the “Company” refer to Emmaus Life Sciences, Inc., and its wholly-owned subsidiary Emmaus Medical, Inc., a Delaware corporation, which we refer to as Emmaus Medical, and Emmaus Medical’s wholly-owned subsidiaries, Newfield Nutrition Corporation, a Delaware corporation, which we refer to as Newfield Nutrition, Emmaus Medical Japan, Inc., a Japanese corporation, which we refer to as EM Japan, Emmaus Life Sciences Korea, a Korean corporation which we refer to as ELSK and Emmaus Medical Europe Ltd., a U.K. corporation, which we refer to as EM Europe.
Forward-Looking Statements
This management’s discussion and analysis of financial condition and results of operations should be read in conjunction with the audited consolidated financial statements for the year ended December 31, 2016 and the related notes included in the Company’s Annual Report on Form 10-K for the year ended December 31, 2016 filed with the SEC on March 31, 2017 (the “Annual Report”).
This Quarterly Report contains forward-looking statements that involve substantial risks and uncertainties. All statements other than historical facts contained in this report, including statements regarding our future financial position, capital expenditures, cash flows, business strategy and plans and objectives of management for future operations are forward-looking statements. The words “anticipate,” “believe,” “expect,” “plan,” “intend,” “seek,” “estimate,” “project,” “could,” “may” and similar expressions are intended to identify forward-looking statements. These statements include, among others, information regarding future operations, future capital expenditures, and future net cash flow. Such statements reflect our management’s current views with respect to future events and financial performance and involve risks and uncertainties, including, without limitation, our ability to raise additional capital to fund our operations, obtaining U.S. Food and Drug Administration (“FDA”) and other regulatory authorization to market our drug and biological products, successful completion of our clinical trials, our ability to achieve regulatory authorization to market our pharmaceutical grade L-glutamine treatment for sickle cell disease (“SCD”), our ability to commercialize our pharmaceutical grade L-glutamine treatment for SCD, our reliance on third party manufacturers for our drug products, market acceptance of our products, our dependence on licenses for certain of our products, our reliance on the expected growth in demand for our products, exposure to product liability and defect claims, development of a public trading market for our securities, and various other matters, many of which are beyond our control.
Should one or more of these risks or uncertainties occur, or should underlying assumptions prove to be incorrect, actual results may vary materially and adversely from those anticipated, believed, estimated or otherwise indicated. Consequently, all of the forward-looking statements made in this Form 10-Q are qualified by these cautionary statements.
Company Overview
We are a biopharmaceutical company engaged in the discovery, development and commercialization of innovative treatments and therapies primarily for rare and orphan diseases. We are currently focusing on SCD, a genetic disorder and a significant unmet medical need. Our lead product candidate (Endari™) is an oral pharmaceutical grade L-glutamine treatment that demonstrated positive clinical results in our completed Phase 3 clinical trial for sickle cell anemia and sickle ß0-thalassemia, two of the most common forms of SCD.
In the Phase 3, double-blind, placebo-controlled, parallel-group, multi-center clinical trial which enrolled a total of 230 adult and pediatric patients as young as five years of age, at 31 sites in the United States, Endari™ treatment was administered up to 30 grams per day and demonstrated a 25% decrease in the median frequency of sickle cell crises and 33% decrease in the median number of hospitalizations, as compared to placebo. Based on an analysis, utilizing pre-specified statistical methods, the difference between groups was statistically significant; p=0.0052 and p=0.0045, respectively. Other clinically relevant endpoints showed similar results such as a 66% lower incidence of acute chest syndrome (p=0.0028), 41% less cumulative days in hospital (p=0.022) and 56% delay in onset of the first sickle cell crisis (p=0.0152). The safety data collected demonstrated a safety profile similar to that of placebo.
Based on the results of the Phase 3 clinical trial and other supportive studies, we submitted to the FDA a New Drug Application (“NDA”) for Endari™. The Oncologic Drug Advisory Committee of the FDA has set a date of May 24, 2017 to review the Company’s NDA. This is part of the process under which the FDA must review the NDA under the Prescription Drug User Fee Act (“PDUFA”) by July 7, 2017.
The NDA represents the first potential treatment for pediatric patients with SCD, and the first potential new treatment in nearly 20 years for adult patients.
If the FDA approves our NDA, we intend to market Endari™ in the United States for SCD patients who are at least five years old. Our lead product candidate, Endari™ has received Fast Track designation from the FDA, as well as Orphan Drug designation from both the FDA and the European Commission, or EC.
We plan to market Endari™ in the United States, if approved, either by strategic partnership or by building our own targeted sales force or some combination thereof. We intend to utilize strategic partnerships to market Endari™ in the rest of the world.
We have extensive experience in the field of SCD, including the development, outsourced manufacturing and conduct of clinical trials of our L-glutamine product candidate for the treatment of SCD. Our Chairman of the Board and Chief Executive Officer, Yutaka Niihara, M.D., MPH., is a leading hematologist in the field of SCD. Dr. Niihara is licensed to practice medicine in both the United States and Japan and has been actively engaged in SCD research and the care of patients with SCD for over 20 years, primarily at the University of California Los Angeles and the Los Angeles Biomedical Research Institute at Harbor-UCLA Medical Center (“LA BioMed”), a nonprofit biomedical research institute.
To a lesser extent, we are also engaged in the marketing and sale of NutreStore L-glutamine powder for oral solution, which has received FDA approval as a treatment for short bowel syndrome (“SBS”) in patients receiving specialized nutritional support when used in conjunction with a recombinant human growth hormone that is approved for this indication. Our indirect wholly owned subsidiary, Newfield Nutrition, sells L-glutamine as a nutritional supplement under the brand name AminoPure through retail stores in multiple states in the United States and via importers and distributors in Japan, Taiwan and South Korea. Since inception, we have generated minimal revenues from the sale and promotion of NutreStore and AminoPure.
In May 2006, we formed Newfield Nutrition, a wholly-owned subsidiary of Emmaus Medical, that distributes L-glutamine as a nutritional supplement under the brand name AminoPure.
In October 2010, we formed EM Japan, a wholly-owned subsidiary of Emmaus Medical, that markets and sells AminoPure in Japan and other countries in Asia. EM Japan also manages our distributors in Japan and may also import other medical products and drugs in the future.
In November 2011, we formed EM Europe, a wholly-owned subsidiary of Emmaus Medical, whose primary focus is expanding our business in Europe.
In December 2016, we formed Emmaus Life Sciences Korea, or ELSK, a wholly owned subsidiary of Emmaus Medical, whose primary focus is expanding our business in Korea.
Our corporate structure is illustrated below:
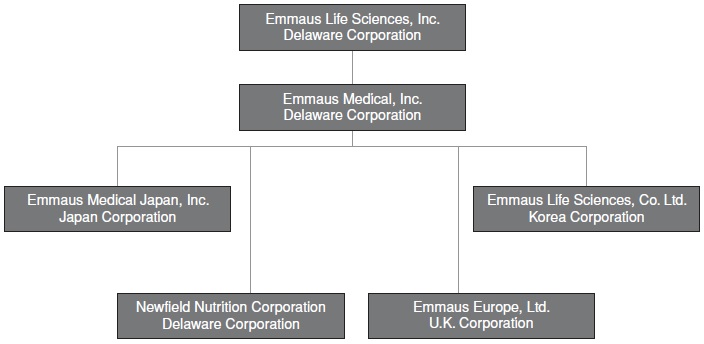
Emmaus Medical, LLC was organized on December 20, 2000. In October 2003, Emmaus Medical, LLC undertook a reorganization and merged with Emmaus Medical, which was originally incorporated in September 2003.
Pursuant to an Agreement and Plan of Merger dated April 21, 2011, which we refer to as the Merger Agreement, by and among us, AFH Merger Sub, Inc., our wholly-owned subsidiary, which we refer to as AFH Merger Sub, AFH Advisory and Emmaus Medical, Emmaus Medical merged with and into AFH Merger Sub on May 3, 2011 with Emmaus Medical continuing as the surviving entity, which we refer to as the Merger. Upon the closing of the Merger, we changed our name from “AFH Acquisition IV, Inc.” to “Emmaus Holdings, Inc.” Subsequently, on September 14, 2011, we changed our name from “Emmaus Holdings, Inc.” to “Emmaus Life Sciences, Inc.”
Our future capital requirements are substantial and may increase beyond our current expectations depending on many factors, including, but not limited to: the duration and results of the clinical trials for our various product candidates going forward; unexpected delays or developments when seeking regulatory approvals; the time and cost in preparing, filing, prosecuting, maintaining and enforcing patent claims; current and future unexpected developments encountered in implementing our business development and commercialization strategies; the outcome of litigation in which we may become engaged in the future; and further arrangements, if any, with collaborators.
Until we can generate a sufficient amount of product revenue, future cash requirements are expected to be financed through public or private equity offerings, debt financings or corporate collaboration and licensing arrangements. As of March 31, 2017, our accumulated deficit was $113.3 million and we had cash and cash equivalents of $3.5 million. Since inception we have had minimal revenues and have been required to rely on funding from sales of equity securities and borrowings from officers and stockholders.
We also own a minority interest of less than 1% in CellSeed, Inc., a Japanese company listed on the Tokyo Stock Exchange, which is engaged in research and development of regenerative medicine products and the manufacture and sale of temperature-responsive cell culture equipment. In collaboration with CellSeed, we are engaged in research and development of cell sheet engineering regenerative medicine products.
On September 12, 2016, we entered into a Letter of Agreement with KPM Tech Co., Ltd. (“KPM”) and Hanil Vacuum Co., Ltd. (“Hanil”), both Korean-based public companies whose shares are listed on KOSDAQ, a trading board of Korea Exchange in South Korea. In the Letter of Agreement, the parties agreed that KPM and Hanil would purchase $17 million and $3 million, respectively, of shares of our common stock at a price of $4.50 per share by September 30, 2016. In exchange, we agreed
to invest $13 million and $1 million in future capital increases by KPM and Hanil, respectively, at prices based upon the trading prices of KPM and Hanil shares on KOSDAQ. The purchases of Emmaus shares by KPM and Hanil were completed in 2016.
Subsequent to the receipt of investments from KPM and Hanil, we completed the cross-investments with KPM and Hanil in which we purchased for an aggregate of $14 million a minority interest of 8.2% in KPM and of 0.8% in Hanil. KPM is principally engaged in the manufacture and distribution of surface treatment chemicals. Hanil is principally engaged in the design, manufacture and sale of vacuum coating systems. Both KPM and Hanil plan to expand their biopharma business.
Proposed Generex Transaction
As previously reported, on January 16, 2017 the Company entered into a letter of intent (“LOI”) with Generex Biotechnology Corporation (“Generex”) which contemplates that Generex will acquire a controlling interest in the Company for a total consideration of $225,000,000, payable $10,000,000 in cash and $215,000,000 in shares of Generex’s common stock, which are referred to as the “Generex shares.” The Generex shares are to be valued for this purpose at $3.80 per share, subject to adjustment in certain events.
On January 25, 2017, the Company’s Chairman and Chief Executive Officer, Yutaka Niihara, MD, MPH, joined the Board of Directors of Generex Biotechnology Corporation as Executive Chairman.
Under the LOI, Generex paid the Company $500,000 as a deposit for an initial cash consideration and was to pay the Company another deposit of $1,500,000 by February 6, 2017. On February 6, 2017, the Company granted Generex an extension of the payment date to February 16, 2017 and, by a letter amendment dated February 16, 2017, the Company granted Generex another extension of the payment date to February 24, 2017 and otherwise amended the LOI.
On March 3, 2017, Generex and the Company further amended the LOI. Following is a summary of the principal terms of the amendment and of the status of certain events:
· Generex agreed to pay the Company an additional deposit of $500,000 on or prior to March 6, 2017, which the Company received.
· Within ten trading days after March 14, 2017, the date of effectiveness of a reverse stock split of Generex common stock, Generex was to pay the Company another deposit of $3,000,000, which the Company received. The total of $4,000,000 deposit is recorded as other current liability in the Company’s balance sheet.
· The parties were to use their best efforts to negotiate and sign a definitive purchase agreement no later than March 30, 2017. The parties have not finalized a definitive purchase agreement.
· The remaining $6,000,000 of the cash consideration is to be paid to the Company at the closing under a definitive purchase agreement, which is to occur no later than five trading days after the date Generex amends its certificate of incorporation to increase its authorized capital, but no later than May 1, 2017. Generex missed this deadline, and has noticed a meeting of its stockholders for June 7, 2017 to act upon the proposed amendment.
· The closing of the proposed acquisition by Generex was to occur no later than May 8, 2017, which deadline has passed.
· If a definitive purchase agreement is not executed or the closing does not occur by the related deadline, and the LOI is terminated by either party, the Company is to refund and return to Generex all deposits within 60 days after the termination.
In consideration for the foregoing waivers, extensions and amendments, Generex agreed to issue to the Company 24,414,063 of restricted shares of Generex common stock within three trading days after Generex effects the planned increase in its authorized capital.
The parties’ respective obligations under the LOI to consummate the proposed acquisition are subject to a number of conditions, including completion of due diligence to each party’s satisfaction and the negotiation and execution of a definitive purchase agreement, and there is no assurance these conditions will be satisfied. Any definitive purchase agreement also would contain customary conditions to closing, which may or may not be satisfied or waived by the parties.
On April 12, 2017, the Company’s Chairman and Chief Executive Officer, Yutaka Niihara, MD, MPH, submitted a letter of resignation as a director and the chairman of the board of directors of Generex Biotechnology Corporation. The resignation was tendered at the request of the board of directors of the Company in connection with the Company’s entering into detailed negotiations
with Generex of a definitive agreement under the Letter of Intent dated January 16, 2017, as amended, that was previously entered into between the Company and Generex.
On April 27, 2017, Generex reported that it had terminated a securities purchase agreement under which Generex was to have sold securities in order to facilitate the proposed acquisition. Generex’s termination of the securities purchase agreement raises substantial doubt about its ability to complete the proposed acquisition.
Our board of directors may determine to terminate the LOI or to abandon the proposed acquisition, if it is in the best interests of the Company and its stockholders.
For all of the foregoing reasons, it is doubtful that the proposed acquisition by Generex and the payment to the Company of the cash consideration and the Generex shares will be completed, and the discussions in the Quarterly Report assume that the proposed acquisition will not be completed.
Other Possible Transactions
From time to time in the ordinary course of business, the Company engages in informal or formal discussions, and may enter into non-binding or binding letters of intent, with prospective investors and other companies regarding possible investments in the Company such as the mutual co-investments between the Company and KPM Tech Co., Ltd. and Hanil Vacuum Co., Ltd. completed in the fourth quarter of 2016. The Company currently is engaged in discussions, and has entered into a non-binding letters of intent, with other companies regarding possible co-investments by us and the companies.
Such discussions and letters of intent are subject to inherent risks and uncertainties, and may not lead to definitive agreements regarding possible transactions. There also can be no assurance whether any such transaction will be undertaken or completed or, if undertaken and completed, on what terms.
Financial Overview
Revenue
Since our inception in 2000, we have had limited revenue from the sale of NutreStore, an FDA-approved prescription drug to treat SBS and AminoPure, a nutritional supplement. We have funded operations principally through the private placement of equity securities and debt financings. Our operations to date have been primarily limited to staffing, licensing and promoting products for SBS, outsourcing distribution and sales activities, developing and sponsoring clinical trials of our pharmaceutical grade L-glutamine treatment for SCD, manufacturing products and maintaining and improving our patent portfolio.
Currently, we generate revenue through the sale of NutreStore L-glutamine powder for oral solution as a treatment for SBS as well as AminoPure, a nutritional supplement. Pursuant to the exclusive sublicense agreement for US Patent No. 5,288,703, or SBS Patent, we were required to pay an annual royalty equal to 10% of adjusted gross sales of NutreStore to CATO Holding Company (“CATO”) through 2016. Management expects that any revenues generated from the sale of NutreStore and AminoPure will fluctuate from quarter to quarter based on the timing of orders and the amount of products sold.
Cost of Goods Sold
Cost of goods sold includes the raw materials, packaging, shipping and distribution costs of NutreStore and AminoPure.
Research and Development Expenses
Research and development costs consist of expenditures for new products and technologies, which primarily involve fees paid to the contract research organization (“CRO”) that conducts the clinical trials of our product candidates, payroll-related expenses, study site payments, consultant fees, and activities related to regulatory filings, manufacturing development costs and other related supplies. The costs of later-stage clinical studies, such as Phase 2 and 3 trials, are generally higher than those of earlier stages of development, such as preclinical studies and Phase 1 trials. This is primarily due to the increased size, expanded scope, patient related healthcare and regulatory compliance costs, and generally longer duration of later-stage clinical studies.
The most significant clinical trial expenditures in prior years have been related to the CRO costs and the payments to study sites. The contract with the CRO is based on time and material expended, whereas the study site agreements are based on per patient costs as well as other pass-through costs, including, but not limited to, start-up costs and institutional review board fees. The financial
terms of these agreements are subject to negotiation and vary from contract to contract and may result in uneven payment flows. Payments under some of these contracts depend on factors such as the successful enrollment of patients and the completion of clinical trial milestones.
Future research and development expenses will depend on any new product candidates or technologies that we may introduce into our research and development pipeline. In addition, we cannot forecast with any degree of certainty which product candidates may be subject to future collaborations, when such arrangements will be secured, if at all, and to what degree, if any, such arrangements would affect our development plans and capital requirements.
At this time, due to the inherently unpredictable nature of the process for developing drugs, biologics and cell-based therapies and the interpretation of the regulatory requirements, we are unable to estimate with any degree of certainty the amount of costs which will be incurred in obtaining FDA approval of our pharmaceutical grade L-glutamine treatment for SCD and the continued development of our other preclinical and clinical programs. Clinical development timelines, the probability of success and development costs can differ materially from expectations and can vary widely. These and other risks and uncertainties relating to product development are described in the Annual Report under the headings “Risk Factors—Risks Related to Development of our Product Candidates,” “Risk Factors—Risks Related to our Reliance on Third Parties,” and “Risk Factors—Risks Related to Regulatory Approval of our Product Candidates and Other Legal Compliance Matters.”
General and Administrative Expenses
General and administrative expenses consist principally of salaries and related costs, including share-based compensation, for personnel in executive, finance, business development, information technology, marketing and legal functions. Other general and administrative expenses include facility costs, patent filing costs and professional fees and expenses for legal, consulting, auditing and tax services. Inflation has not had a material impact on our general and administrative expenses over the past two years.
Environmental Expenses
The cost of compliance with environmental laws has not been material over the past two years and any such costs are included in general and administrative costs.
Inventories
Inventories consist of finished goods and work-in-process and are valued on a first-in, first-out basis and at the lower of cost or market value. All of the raw material purchased during the three months ended March 31, 2017 and 2016 were from one vendor.
Results of Operations
Three months ended March 31, 2017 and 2016
Net Losses. Net losses increased by $2.0 million, or 46%, to $6.5 million from $4.5 million for the three months ended March 31, 2017 and 2016, respectively. The increase in losses is primarily a result of increased other expenses and operating expenses, in each case as discussed below. Losses, partially offset by revenue from commercialized products, will continue as we advance our sickle cell treatment toward potential regulatory approval and commercialization. As a result, we anticipate that we will continue to incur net losses and be unprofitable for the foreseeable future. There can be no assurance that we will ever operate at a profit, even if all of our products are commercialized.
Revenues, Net. Net revenues increased by $28,000, or 35%, to $107,000 from $79,000 for the three months ended March 31, 2017 and 2016. Combined revenues from our AminoPure L-glutamine nutritional supplement product and our NutreStore L-glutamine powder for oral solution for treatment of SBS increased slightly during these periods.
Cost of Goods Sold. Cost of goods sold increased by $20,000, or 72%, to $48,000 from $28,000 for the three months ended March 31, 2017 and 2016. Cost of goods sold includes costs for raw material, packaging, testing, shipping and costs related to scrapped inventory. All of the raw material purchased during the three months ended March 31, 2017 and 2016 was from one vendor. Cost of goods sold increased due to decreased sales in direct sales, which has a higher gross profit margin, associated with our AminoPure L-glutamine nutritional supplement product.
Research and Development Expenses. Research and development expenses increased by $0.3 million, or 50%, to $0.8 million from $0.5 million for the three months ended March 31, 2017 and 2016. This increase was primarily due to an increase in our post
NDA submission activities. We expect our research and development costs to increase in the rest of 2017 to support our post NDA submission activities and work on marketing approvals outside the US.
Selling Expenses. Selling expenses increased slightly by $8,000, or 9%, to $102,000 from $94,000 for the three months ended March 31, 2017 and 2016. Selling expenses include the costs for distribution, promotion, travel, tradeshows and exhibits related to NutreStore and AminoPure as well as the marketing and branding expenses for our pharmaceutical grade L-glutamine treatment for SCD. The increase was due to an increase in the branding cost of our pharmaceutical grade L-glutamine treatment for SCD as we approach the potential regulatory approval and commercialization.
General and Administrative Expenses. General and administrative expenses increased by $0.5 million, or 22%, to $2.8 million from $2.3 million for the three months ended March 31, 2017 and 2016. General and administrative expenses include share-based compensation expenses, professional fees, office rent and payroll expenses. This increase was primarily due to an increase of $0.5 million in share-based compensation expense due to issuance of stock options.
Other Income and Expense. Total other expense increased by $1.3 million, or 79%, to $2.9 million expense for the three months ended March 31, 2017, compared to $1.6 million in other expense for the three months ended March 31, 2016. The increase was primarily due to a $0.9 million increase in interest costs as a result of increased debt and a negative change in the fair value of the warrant derivative liabilities of $0.4 million.
We anticipate that our operating expenses will increase for, among others, the following reasons:
· as a result of increased payroll, expanded infrastructure and higher consulting, legal, accounting and investor relations costs, and director and officer insurance premiums associated with being a public company;
· to support research and development activities, which we expect to expand as development of our product candidate(s) continues and the post-submission activities of an NDA for pharmaceutical grade L-glutamine treatment for SCD; and
· to build a sales and marketing team before we receive regulatory approval of a product candidate in anticipation of commercial launch.
Liquidity and Capital Resources
Based on our losses to date, anticipated future revenue and operating expenses, debt repayment obligations and cash and cash equivalents balance of $3.5 million as of March 31, 2017, we do not have sufficient operating capital for our business without raising additional capital. We incurred a net loss of $6.5 million for the three months ended March 31, 2017 and had an accumulated deficit at March 31, 2017 of $113.3 million. We anticipate that we will continue to incur net losses for the foreseeable future as we incur expenses for post-submission activities of the NDA, the commercialization of our pharmaceutical grade L-glutamine treatment of SCD, research costs for the corneal cell sheets using CAOMECS technology and the expansion of corporate infrastructure, including costs associated with being a public reporting company and additional expenses that may be associated with pursuing a possible initial public offering. We have previously relied on unregistered equity offerings, debt financings and loans, including loans from related parties. As part of this effort, we have received various loans from officers, stockholders and other investors as discussed below. As of March 31, 2017, we had outstanding notes payable in an aggregate principal amount of $18.9 million, consisting of $6.2 million of non-convertible promissory notes and $12.7 million of convertible notes. Of the $18.9 million aggregate principal amount of notes outstanding as of March 31, 2017, approximately $18.0 million is either due on demand or will become due and payable within the next twelve months. Our failure to raise capital as and when needed would have a negative impact on our financial condition and our ability to pursue our business strategies, including the commercialization of our pharmaceutical grade L-glutamine treatment for SCD and the development in the United States of CAOMECS-based cell sheet technology.
We have had recurring operating losses, have a significant amount of notes payable and other obligations due within the next year and projected operating losses including the expected costs relating to the commercialization of our pharmaceutical grade L-glutamine treatment for SCD that exceed both the existing cash balances and cash expected to be generated from operations for at least the next year. In order to meet our expected obligations, management intends to raise additional funds through equity and debt financings. In addition, we may seek to raise additional funds through collaborations with other companies or financing from other sources and a possible initial public offering. Additional funding may not be available in amounts or on terms which are acceptable to us, if at all. Due to the uncertainty of our ability to meet our current operating and capital expenses, there is substantial doubt about our ability to continue as a going concern.
In addition, our cash burn rate for the first three months ending March 31, 2017 was approximately $0.7 million per month.
As discussed in our Annual Report under the heading “Risk Factors—Risks Related to Development of our Product Candidates,” if the FDA does not approve our NDA based on a single Phase 3 clinical trial, in each case unless we conduct a second Phase 3 clinical trial or confirmatory study, the potential approval of our product candidate will be delayed. Under these circumstances, we will incur additional costs to seek to convince the FDA that a confirmatory study is unnecessary for filing or approval, or to design and conduct a second Phase 3 clinical trial or confirmatory study, or both. If we conduct a second Phase 3 clinical trial or confirmatory study prior to the approval of our NDA, it is possible that the results of that trial will be less favorable than the results of our completed Phase 3 trial and further delay or complicate the approval process. The incurrence of additional costs may require us to raise additional capital, and any delay in obtaining approval of our product candidate will reduce the period during which we can market and sell our product with patent protection and may affect our ability to obtain other protections against competition.
Our cash flow from operations is not adequate and our future capital requirements will be substantial and may increase beyond our current expectations depending on many factors including, but not limited to: the number, duration and results of the clinical trials for our various product candidates going forward; unexpected delays or developments in seeking regulatory approvals; the time and cost in preparing, filing, prosecuting, maintaining and enforcing patent claims; other unexpected developments encountered in implementing our business and commercialization strategies; the outcome of any future litigation; and further arrangements, if any, with collaborators. We will rely, in part, on sales of AminoPure and NutreStore. Revenues from both products are currently not significant and we are unsure whether sales of these products will increase. Until we can generate a sufficient amount of product revenue, future cash needs are expected to be financed through public or private equity offerings, debt financings, loans, including loans from related parties, or other sources, such as strategic partnership agreements and corporate collaboration and licensing arrangements. Until we can generate a sufficient amount of product revenue, there can be no assurance of the availability of such capital on terms acceptable to us (or at all).
For the three months ended March 31, 2017 and during the year ended December 31, 2016, we borrowed $0.2 million and $7.4 million, respectively, pursuant to convertible notes and non-convertible promissory notes, of which $0.8 million and $2.2 million, respectively, have been issued to related parties. As of March 31, 2017 and December 31, 2016, the aggregate principal amounts outstanding under convertible notes and non-convertible promissory notes totaled $18.9 million and $18.3 million, respectively. The convertible notes and non-convertible promissory notes bear interest at rates ranging from 6% to 11% and, except for the 2011 convertible note listed below in the principal amount of $0.3 million, are unsecured. The net proceeds of the loans were used for working capital purposes.
The table below lists our outstanding notes payable as of March 31, 2017 and December 31, 2016 and the material terms of our outstanding borrowings:
|
Year |
|
Interest Rate |
|
Term of Notes |
|
Conversion |
|
Principal |
|
Discount |
|
Carrying |
|
Shares |
|
Principal |
|
Discount Amount |
|
Carrying |
|
Shares |
| ||||||
|
Notes payable |
|
|
|
|
|
|
|
|
|
|
|
|
|
|
|
|
|
|
|
|
|
|
| ||||||
|
2013 |
|
10% |
|
Due on demand |
|
— |
|
$ |
897,400 |
|
$ |
— |
|
$ |
897,400 |
|
— |
|
$ |
854,900 |
|
$ |
— |
|
$ |
854,900 |
|
— |
|
|
2015 |
|
11% |
|
Due on demand |
|
— |
|
1,948,700 |
|
— |
|
1,948,700 |
|
— |
|
2,406,194 |
|
— |
|
2,406,194 |
|
— |
| ||||||
|
2016 |
|
11% |
|
Due on demand |
|
— |
|
833,335 |
|
— |
|
833,335 |
|
— |
|
833,335 |
|
— |
|
833,335 |
|
— |
| ||||||
|
2017 |
|
11% |
|
Due on demand |
|
— |
|
613,104 |
|
— |
|
613,104 |
|
— |
|
— |
|
— |
|
— |
|
— |
| ||||||
|
|
|
|
|
|
|
|
|
$ |
4,292,539 |
|
$ |
— |
|
$ |
4,292,539 |
|
— |
|
$ |
4,094,429 |
|
$ |
— |
|
$ |
4,094,429 |
|
— |
|
|
|
|
|
|
|
|
|
|
|
|
|
|
|
|
|
|
|
|
|
|
|
|
|
| ||||||
|
|
|
Current |
|
|
|
$ |
4,292,539 |
|
$ |
— |
|
$ |
4,292,539 |
|
— |
|
$ |
4,094,429 |
|
$ |
— |
|
$ |
4,094,429 |
|
— |
| ||
|
|
|
Non-current |
|
|
|
$ |
— |
|
$ |
— |
|
$ |
— |
|
— |
|
$ |
— |
|
$ |
— |
|
$ |
— |
|
— |
| ||
|
Notes payable - related party |
|
|
|
|
|
|
|
|
|
|
|
|
|
|
|
|
|
|
|
|
|
|
| ||||||
|
2012 |
|
8% |
|
Due on demand |
|
— |
|
$ |
500,000 |
|
$ |
— |
|
$ |
500,000 |
|
— |
|
$ |
500,000 |
|
$ |
— |
|
$ |
500,000 |
|
— |
|
|
2013 |
|
8% |
|
Due on demand |
|
— |
|
50,000 |
|
— |
|
50,000 |
|
— |
|
50,000 |
|
— |
|
50,000 |
|
— |
| ||||||
|
2015 |
|
10% - 11% |
|
Due on demand |
|
— |
|
504,340 |
|
— |
|
504,340 |
|
— |
|
514,340 |
|
— |
|
514,340 |
|
— |
| ||||||
|
2016 |
|
10% - 11% |
|
Due on demand |
|
— |
|
860,510 |
|
— |
|
860,510 |
|
— |
|
860,510 |
|
— |
|
860,510 |
|
— |
| ||||||
|
2017 |
|
10% |
|
Due on demand |
|
— |
|
12,000 |
|
— |
|
12,000 |
|
— |
|
— |
|
— |
|
— |
|
— |
| ||||||
|
|
|
|
|
|
|
|
|
$ |
1,926,850 |
|
$ |
— |
|
$ |
1,926,850 |
|
— |
|
$ |
1,924,850 |
|
$ |
— |
|
$ |
1,924,850 |
|
— |
|
|
|
|
|
|
|
|
|
|
|
|
|
|
|
|
|
|
|
|
|
|
|
|
|
| ||||||
|
|
|
Current |
|
|
|
$ |
1,926,850 |
|
$ |
— |
|
$ |
1,926,850 |
|
— |
|
$ |
1,924,850 |
|
$ |
— |
|
$ |
1,924,850 |
|
— |
| ||
|
|
|
Non-current |
|
|
|
$ |
— |
|
$ |
— |
|
$ |
— |
|
— |
|
$ |
— |
|
$ |
— |
|
$ |
— |
|
— |
| ||
|
Convertible notes payable |
|
|
|
|
|
|
|
|
|
|
|
|
|
|
|
|
|
|
|
|
|
|
| ||||||
|
2011 |
|
10% |
|
5 years |
|
$ 3.05 |
|
$ |
300,000 |
|
$ |
— |
|
$ |
300,000 |
|
98,285 |
|
$ |
300,000 |
|
$ |
— |
|
$ |
300,000 |
|
98,285 |
|
|
2014 |
|
10% |
|
Due on demand - 2 years |
|
$ 3.05-$3.60 |
|
472,636 |
|
— |
|
472,636 |
|
160,782 |
|
452,168 |
|
— |
|
452,168 |
|
152,986 |
| ||||||
|
2015 |
|
10% |
|
2 years |
|
$ 3.50-$3.60 |
|
2,279,226 |
|
28,731 |
|
2,250,495 |
|
693,814 |
|
2,904,800 |
|
104,389 |
|
2,800,411 |
|
889,115 |
| ||||||
|
2016 |
|
10% |
|
Due on demand — 1 year |
|
$ 3.50-$4.50 |
|
7,299,620 |
|
478,884 |
|
6,820,736 |
|
1,994,045 |
|
8,126,129 |
|
1,475,744 |
|
6,650,385 |
|
2,193,687 |
| ||||||
|
2017 |
|
10% |
|
Due on demand — 1 year |
|
$ 3.50-$7.60 |
|
1,834,848 |
|
1,192,134 |
|
642,714 |
|
493,089 |
|
— |
|
— |
|
— |
|
— |
| ||||||
|
|
|
|
|
|
|
|
|
$ |
12,186,330 |
|
$ |
1,699,749 |
|
$ |
10,486,581 |
|
3,440,015 |
|
$ |
11,783,097 |
|
$ |
1,580,133 |
|
$ |
10,202,964 |
|
3,334,073 |
|
|
|
|
|
|
|
|
|
|
|
|
|
|
|
|
|
|
|
|
|
|
|
|
|
| ||||||
|
|
|
Current |
|
|
|
$ |
11,325,037 |
|
$ |
1,541,550 |
|
$ |
9,783,487 |
|
3,211,532 |
|
$ |
10,499,303 |
|
$ |
1,294,296 |
|
$ |
9,205,007 |
|
2,984,161 |
| ||
|
|
|
Non-current |
|
|
|
$ |
861,293 |
|
$ |
158,199 |
|
$ |
703,094 |
|
228,483 |
|
$ |
1,283,794 |
|
$ |
285,837 |
|
$ |
997,957 |
|
349,912 |
| ||
|
Convertible notes payable - related party |
|
|
|
|
|
|
|
|
|
|
|
|
|
|
|
|
|
|
|
|
|
|
| ||||||
|
2012 |
|
10% |
|
Due on demand |
|
$ 3.30 |
|
$ |
254,000 |
|
$ |
— |
|
$ |
254,000 |
|
78,888 |
|
$ |
254,000 |
|
$ |
— |
|
$ |
254,000 |
|
94,532 |
|
|
2015 |
|
10% |
|
2 years |
|
$ 4.50 |
|
220,000 |
|
— |
|
220,000 |
|
55,668 |
|
220,000 |
|
— |
|
220,000 |
|
54,463 |
| ||||||
|
|
|
|
|
|
|
|
|
$ |
474,000 |
|
$ |
— |
|
$ |
474,000 |
|
134,556 |
|
$ |
474,000 |
|
$ |
— |
|
$ |
474,000 |
|
148,995 |
|
|
|
|
|
|
|
|
|
|
|
|
|
|
|
|
|
|
|
|
|
|
|
|
|
| ||||||
|
|
|
Current |
|
|
|
$ |
474,000 |
|
$ |
— |
|
$ |
474,000 |
|
134,556 |
|
$ |
474,000 |
|
$ |
— |
|
$ |
474,000 |
|
148,995 |
| ||
|
|
|
Non-current |
|
|
|
$ |
— |
|
$ |
— |
|
$ |
— |
|
— |
|
$ |
— |
|
$ |
— |
|
$ |
— |
|
— |
| ||
|
|
|
Grand Total |
|
|
|
$ |
18,879,719 |
|
$ |
1,699,749 |
|
$ |
17,179,970 |
|
3,574,571 |
|
$ |
18,276,376 |
|
$ |
1,580,133 |
|
$ |
16,696,243 |
|
3,483,068 |
| ||
Cash flows for the three months ended March 31, 2017 and March 31, 2016
Net cash used in operating activities
Net cash flows used in operating activities decreased by $4.3 million, or 183%, to positive net cash flow of $2.0 million from $2.3 million for the three months ended March 31, 2017 and 2016, respectively. This decrease was primarily due to a $2.0 million increase in net loss partially offset by a $4.6 million increase of working capital, a $1.8 million increase in the non-cash adjustments to net loss. The increase in non-cash adjustments to net loss was primarily attributable to the following: $0.4 million for the change in the fair value of warrant derivative liabilities, a $1.0 million increase in amortization of discount of convertible notes and a $0.5 million increase in share-based compensation.
Net cash used in investing activities
Net cash flows used in investing activities increased by $40,000 to $40,000 from $0 for the three months ended March 31, 2017 and 2016, respectively. Net cash used in investing activities includes purchase of property and equipment.
Net cash from financing activities
Net cash flows from financing activities decreased by $1.9 million, or 87%, to $0.3 million from $2.2 million for the three months ended March 31, 2017 and 2016, respectively, as a result of a $1.7 million decrease in proceeds of issuance of common stock and a $0.5 million decrease in proceeds from issuance of convertible and non-convertible promissory notes, partially offset by a $0.3 million decrease in repayment of convertible and non-convertible promissory notes.
Off-Balance-Sheet Arrangements
We have no off-balance sheet arrangements.
Critical Accounting Policies
Management’s discussion and analysis of financial condition and results of operations is based on our financial statements, which have been prepared in accordance with U.S. generally accepted accounting principles (“GAAP”), on the basis that the Company will continue as a going concern. Due to the uncertainty of the Company’s ability to meet its current operating and capital expenses, there is substantial doubt about the Company’s ability to continue as a going concern, as the continuation and expansion of its business is dependent upon obtaining further financing, successful and sufficient market acceptance of its products, and finally, achieving a profitable level of operations. The consolidated interim financial statements do not include any adjustments that might result from the outcome of these uncertainties. The preparation of these financial statements requires us to make estimates and judgments that affect the reported amounts of assets, liabilities and expenses. On an ongoing basis, we evaluate these estimates and judgments, including those described below. We base our estimates on our historical experience and on various other assumptions that we believe to be reasonable under the present circumstances. These estimates and assumptions form the basis for making judgments about the carrying values of assets and liabilities that are not readily apparent from other sources. Actual results may differ materially from these estimates.
Refer to “Critical Accounting Policies” in Part II, Item 7, “Management’s Discussion and Analysis of Financial Condition and Results of Operations” of the Annual Report for our critical accounting policies. There have been no material changes in any of our critical accounting policies during the three months ended March 31, 2017.
Item 3. Quantitative and Qualitative Disclosures about Market Risk
Not required for a smaller reporting company.
Item 4. Controls and Procedures
Evaluation of Disclosure Controls and Procedures
Disclosure controls and procedures are controls and other procedures that are designed to ensure that information required to be disclosed by us in the reports that we file or submit under the Securities Exchange Act of 1934 (“Exchange Act”), is recorded, processed, summarized and reported within the time periods specified in the SEC’s rules and forms. Disclosure controls and procedures include, without limitation, controls and procedures designed to ensure that information required to be disclosed by us in
the reports that we file under the Exchange Act is accumulated and communicated to our management, including our principal executive and financial officers, as appropriate to allow timely decisions regarding required disclosure.
As of the end of the period covered by this Form 10-Q, we conducted an evaluation, under the supervision and with the participation of our Chief Executive Officer and Chief Financial Officer, of the effectiveness of our disclosure controls and procedures (as defined in Rule 13a-15(e) of the Exchange Act). Based upon this evaluation and due to the material weakness in our internal control over financial reporting as of December 31, 2016 described below, our Chief Executive Officer and Chief Financial Officer concluded that the Company’s disclosure controls and procedures are not effective. Our management is working at remediating the material weakness in our internal controls over financial reporting. However, we have not yet completed a full annual accounting cycle since December 31, 2016 to fully validate the remediation of the material weakness in our internal controls and the effectiveness of the Company’s disclosure controls and procedures.
Changes in Internal Control over Financial Reporting
There were no changes in our internal control over financial reporting (as defined in Rules 13a-15(f) and 15d-15(f) under the Exchange Act) that occurred during the fiscal quarter ended March 31, 2017 which have materially affected, or are reasonably likely to materially affect, our internal control over financial reporting.
Material Weakness and Plan of Remediation
A material weakness is a deficiency, or combination of deficiencies, in internal control over financial reporting such that there is a reasonable possibility that a material misstatement of the Company’s annual or interim financial statements will not be prevented or detected on a timely basis. Material weaknesses would permit information required to be disclosed by the Company in the reports that it files or submits to not be recorded, processed, summarized and reported, within the time periods specified in the SEC’s rules and forms.
We conducted an evaluation pursuant to Rule 13a-15 of the Exchange Act of the effectiveness of the design and operation of our disclosure controls and procedures (“DCP”) as of December 31, 2016. This evaluation was conducted under the supervision (and with the participation) of our management, including our Chief Executive Officer and Chief Financial Officer. Based on that evaluation, our Chief Executive Officer and Chief Financial Officer concluded that our DCP were not effective as of December 31, 2016, because of the continuance of a material weakness in our internal control over financial reporting, initially identified in our evaluations of the effectiveness of our internal control over financial reporting as of December 31, 2014 and 2013, with respect to the application of GAAP on certain complex transactions as well as maintaining effective controls over the completeness and accuracy of financial reporting for complex or unusual transactions and internal communication of significant transactions.
Our management and Board of Directors are committed to the remediation of the material weakness, as well as the continued improvement of our overall system of DCP. We are in the process of implementing measures to remediate the underlying causes of the control deficiency that gave rise to the material weakness, which primarily include engaging additional and supplemental internal and external resources with the technical expertise in GAAP, as well as to implement new policies and procedures to provide more effective controls to track, process, analyze, and consolidate the financial data and reports.
We believe these measures, once implemented, will remediate the control deficiencies that gave rise to a material weakness. As we continue to evaluate and work to remediate these control deficiencies, we may determine that additional remedial measures are required.
Not applicable.
Please refer to the risk factors disclosed in the “Risk Factors” section of the Annual Report. Please refer to the Company’s Annual Report on Form 10-K for the year ended December 31, 2016, filed with the SEC on March 31, 2017 (the “Annual Report”), for a prior discussion of our legal proceedings.
Item 2. Unregistered Sales of Equity Securities and Use of Proceeds
On February 21, 2017, the Company refinanced a convertible note payable to a third party in the original principal amount of $110,880 with a new convertible note in the principal amount of $121,968 which bears interest at 10% per annum. The note has a one-year term. The principal amount plus any unpaid accrued interest due under the convertible note is convertible into shares of the Company’s common stock at $3.60 per share at any time during the term of the note upon election of the holder.
On February 23, 2017, the Company refinanced a convertible note to a third party in the original principal amount of $500,000 with a new convertible note in the principal amount of $525,000 which bears interest at 10% per annum and matures in six months with an option on the part of the holder to renew for up to 18 months. The principal amount plus any unpaid accrued interest due under the convertible note is convertible into shares of Company common stock at $3.50 per share.
On March 2, 2017, the Company refinanced a convertible note payable a third party in the original principal amount of $215,629 with a new convertible note in the principal amount of $237,192 which bears interest at 10% per annum. The note is due on demand up to one year from the date of issuance. The principal amount and any unpaid interest due under the note are convertible into shares of the Company’s common stock at $3.60 per share at any time during the term of the note upon election of the holder.
On March 7, 2017, the Company issued a convertible note to a third party in the principal amount of $200,000 which bears interest at 10% per annum and matures in six months. If the Company completes a qualified public offering, the principal amount of the note will automatically convert into shares of the Company’s common stock at a conversion price equal to 80% of the initial public offering price in the qualified public offering. The principal amount plus any unpaid accrued interest due under the convertible note is convertible into shares of the Company’s common stock at $7.60 per share at any time during the term of the note upon election of the holder.
On March 12, 2017, the Company refinanced a convertible note payable to a third party, in the original principal amount of $120,960 with a new convertible note in the principal amount of $145,152 which bears interest at 10% per annum. The note is due on demand up to two years from the date of issuance. The principal amount plus any unpaid accrued interest due under the convertible note is convertible into shares of the Company’s common stock at $3.60 per share.
On March 14, 2017, the Company refinanced a convertible note payable to a shareholder, in the original principal amount of $504,614 with a new convertible note in the principal amount of $605,536 which bears interest at 10% per annum. The note is due on demand up to two years from the date of issuance. The principal amount plus any unpaid accrued interest due under the convertible note is convertible into shares of the Company’s common stock at $3.50 per share.
All such securities noted above were issued in reliance upon the exemption from registration provided by Section 4(a)(2) of the Securities Act of 1933, as amended (the “Securities Act”) or Regulation D under the Securities Act or, in the case of refinancings and conversions, upon the exemption from registration provided by Section 3(a)(9) of the Securities Act. These securities qualified for exemption under Section 4(a)(2) of the Securities Act or Regulation D because the issuances did not involve a “public offering.” The issuances were not a public offering based upon the following factors: (i) a limited number of securities were issued to a limited number of investors; (ii) there was no public solicitation; (iii) each investor was an “accredited investor” as such term is defined by Rule 501 under the Securities Act; and (iv) the investment intent of the investors. No underwriters were used in connection with such sales of unregistered securities.
Item 3. Defaults Upon Senior Securities
None.
Item 4. Mine Safety Disclosures
Not applicable.
None.
(a) Exhibits
|
Exhibit |
|
Description of Document |
|
|
|
|
|
4.1 |
|
Convertible Promissory Note dated February 21, 2017 issued by the registrant to Sun Moo Lee & Hyon Sil Lee. |
|
|
|
|
|
4.2 |
|
Convertible Promissory Note dated February 23, 2017 issued by the registrant to The Shitabata Family Trust. |
|
|
|
|
|
4.3 |
|
Convertible Promissory Note dated March 2, 2017 issued by the registrant to J.R. Dowey. |
|
|
|
|
|
4.4 |
|
Convertible Promissory Note dated March 7, 2017 issued by the registrant to Clan H. Hahn, MD. |
|
|
|
|
|
4.5 |
|
Form of Convertible Promissory Note issued by the registrant to the persons indicated in Schedule A attached to the Form of Convertible Promissory Note. |
|
|
|
|
|
10.1 |
|
Form of Promissory Note issued by the registrant to the persons indicated in Schedule A attached to the Form of Promissory Note. |
|
|
|
|
|
31.1 |
|
Certification of Chief Executive Officer Pursuant to Item 601(b)(31) of Regulation S-K, as adopted pursuant to Section 302 of the Sarbanes-Oxley Act of 2002 |
|
|
|
|
|
31.2 |
|
Certification of Chief Financial Officer Pursuant to Item 601(b)(31) of Regulation S-K, as adopted pursuant to Section 302 of the Sarbanes-Oxley Act of 2002 |
|
|
|
|
|
32.1* |
|
Certification of the Chief Executive Officer and Chief Financial Officer pursuant to 18 U.S.C. Section 1350, as adopted pursuant to Section 906 of the Sarbanes-Oxley Act of 2002* |
|
|
|
|
|
101.INS |
|
XBRL Instance Document |
|
|
|
|
|
101.SCH |
|
XBRL Taxonomy Extension Schema Document |
|
|
|
|
|
101.CAL |
|
XBRL Taxonomy Extension Calculation Linkbase Document |
|
|
|
|
|
101.DEF |
|
XBRL Taxonomy Extension Definition Linkbase Document |
|
|
|
|
|
101.LAB |
|
XBRL Taxonomy Extension Label Linkbase Document |
|
|
|
|
|
101.PRE |
|
XBRL Taxonomy Extension Presentation Linkbase Document |
* This exhibit shall not be deemed “filed” for purposes of Section 18 of the Securities Exchange Act of 1934 or otherwise subject to the liabilities of that section, nor shall it be deemed incorporated by reference in any filing under the Securities Act of 1933 or the Securities Exchange Act of 1934, whether made before or after the date hereof and irrespective of any general incorporation language in any filings.
EMMAUS LIFE SCIENCES, INC.
Pursuant to the requirements of the Securities Exchange Act of 1934, the Registrant has duly caused this report to be signed on its behalf by the undersigned, thereunto duly authorized.
|
Emmaus Life Sciences, Inc. |
| |
|
|
| |
|
Dated: May 12, 2017 |
By: |
/s/ Yutaka Niihara |
|
|
Name: |
Yutaka Niihara, M.D., M.P.H. |
|
|
Its: |
Chief Executive Officer |
|
|
|
(principal executive officer and duly authorized officer) |
|
|
| |
|
|
| |
|
|
By: |
/s/ Willis C. Lee |
|
|
Name: |
Willis C. Lee |
|
|
Its: |
Chief Financial Officer |
|
|
|
(principal financial and accounting officer) |