Attached files
| file | filename |
|---|---|
| EX-99.1 - EX-99.1 - EARTHSTONE ENERGY INC | este-ex991_6.htm |
| 8-K - 8-K - EARTHSTONE ENERGY INC | este-8k_20170509.htm |
Investor Presentation May 9, 2017 Exhibit 99.2
Disclaimer Forward-Looking Statements This presentation contains forward-looking statements within the meaning of Section 27A of the Securities Act of 1933, as amended (the “Securities Act”), and Section 21E of the Securities Exchange Act of 1934, as amended (the “Exchange Act”). Statements that are not strictly historical statements constitute forward-looking statements and may often, but not always, be identified by the use of such words such as “expects,” “believes,” “intends,” “anticipates,” “plans,” “estimates,” “potential,” “possible,” or “probable” or statements that certain actions, events or results “may,” “will,” “should,” or “could” be taken, occur or be achieved. The forward-looking statements include statements about the expected benefits of the proposed transaction pursuant to the Contribution Agreement (the “Transaction”) to Earthstone and its stockholders, the anticipated completion of the proposed Transaction or the timing thereof, the expected future reserves, production, financial position, business strategy, revenues, earnings, costs, capital expenditures and debt levels of the combined company, and plans and objectives of management for future operations. Forward-looking statements are based on current expectations and assumptions and analyses made by Earthstone and its management in light of experience and perception of historical trends, current conditions and expected future developments, as well as other factors appropriate under the circumstances. However, whether actual results and developments will conform to expectations is subject to a number of material risks and uncertainties, including but not limited to: the ability to obtain stockholder and regulatory approvals of the proposed Transaction; the ability to complete the proposed Transaction on anticipated terms and timetable; Earthstone’s ability to integrate its combined operations successfully after closing the Transaction and achieve anticipated benefits from it; the possibility that various closing conditions for the Transaction may not be satisfied or waived; risks relating to any unforeseen liabilities of Earthstone or Bold; declines in oil, natural gas liquids or natural gas prices; the level of success in exploration, development and production activities; adverse weather conditions that may negatively impact development or production activities; the timing of exploration and development expenditures; inaccuracies of reserve estimates or assumptions underlying them; revisions to reserve estimates as a result of changes in commodity prices; impacts to financial statements as a result of impairment write-downs; risks related to level of indebtedness and periodic redeterminations of the borrowing base under Earthstone’s credit agreement; Earthstone’s ability to generate sufficient cash flows from operations to meet the internally funded portion of its capital expenditures budget; Earthstone’s ability to obtain external capital to finance exploration and development operations and acquisitions; the ability to successfully complete any potential asset dispositions and the risks related thereto; the impacts of hedging on results of operations; uninsured or underinsured losses resulting from oil and natural gas operations; Earthstone’s ability to replace oil and natural gas reserves; and any loss of senior management or technical personnel. Earthstone’s 2016 Annual Report on Form 10-K, recent current reports on Form 8-K, and other Securities and Exchange Commission (“SEC”) filings discuss some of the important risk factors identified that may affect Earthstone’s business, results of operations, and financial condition. Earthstone undertakes no obligation to revise or update publicly any forward-looking statements except as required by law.
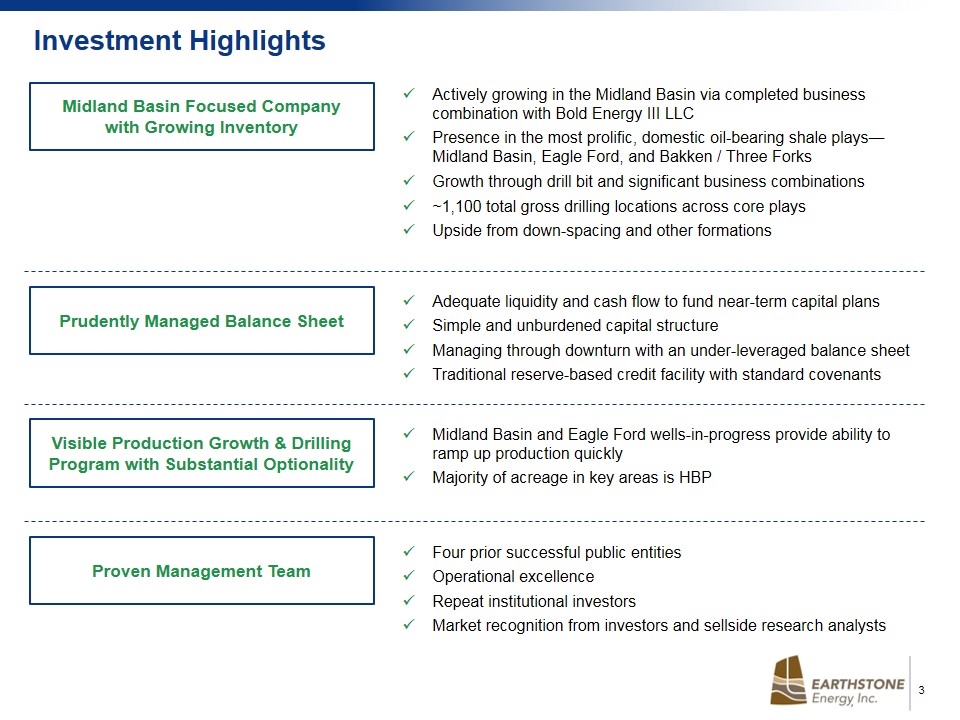
Investment Highlights Prudently Managed Balance Sheet Adequate liquidity and cash flow to fund near-term capital plans Simple and unburdened capital structure Managing through downturn with an under-leveraged balance sheet Traditional reserve-based credit facility with standard covenants Proven Management Team Four prior successful public entities Operational excellence Repeat institutional investors Market recognition from investors and sellside research analysts Midland Basin Focused Company with Growing Inventory Actively growing in the Midland Basin via completed business combination with Bold Energy III LLC Presence in the most prolific, domestic oil-bearing shale plays—Midland Basin, Eagle Ford, and Bakken / Three Forks Growth through drill bit and significant business combinations ~1,100 total gross drilling locations across core plays Upside from down-spacing and other formations Visible Production Growth & Drilling Program with Substantial Optionality Midland Basin and Eagle Ford wells-in-progress provide ability to ramp up production quickly Majority of acreage in key areas is HBP
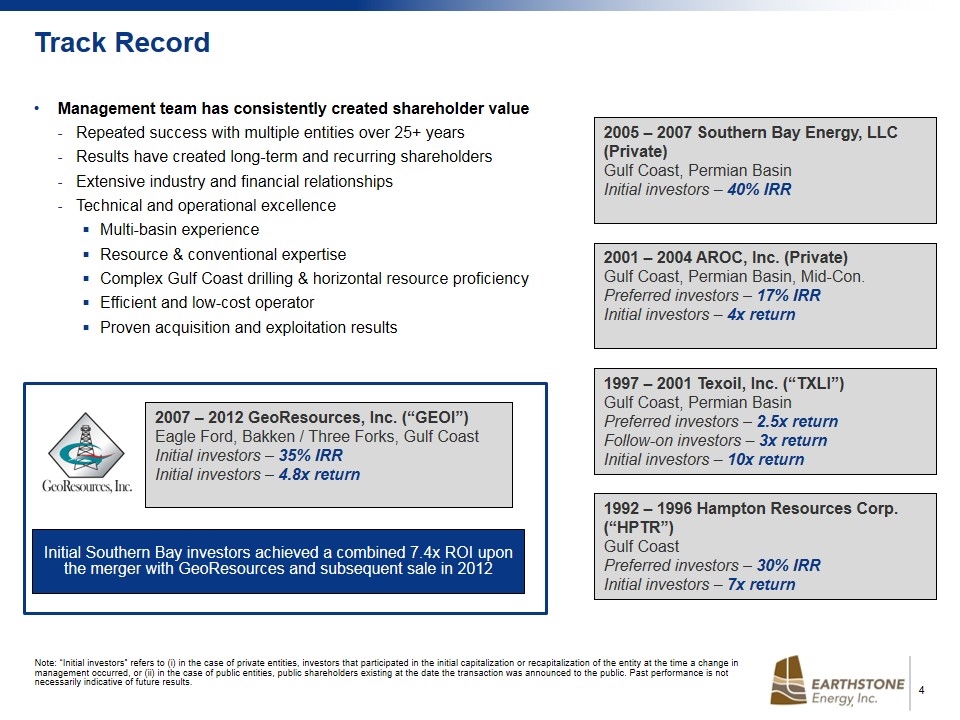
Track Record 2001 – 2004 AROC, Inc. (Private) Gulf Coast, Permian Basin, Mid-Con. Preferred investors – 17% IRR Initial investors – 4x return 2005 – 2007 Southern Bay Energy, LLC (Private) Gulf Coast, Permian Basin Initial investors – 40% IRR 1997 – 2001 Texoil, Inc. (“TXLI”) Gulf Coast, Permian Basin Preferred investors – 2.5x return Follow-on investors – 3x return Initial investors – 10x return 1992 – 1996 Hampton Resources Corp. (“HPTR”) Gulf Coast Preferred investors – 30% IRR Initial investors – 7x return Management team has consistently created shareholder value Repeated success with multiple entities over 25+ years Results have created long-term and recurring shareholders Extensive industry and financial relationships Technical and operational excellence Multi-basin experience Resource & conventional expertise Complex Gulf Coast drilling & horizontal resource proficiency Efficient and low-cost operator Proven acquisition and exploitation results 2007 – 2012 GeoResources, Inc. (“GEOI”) Eagle Ford, Bakken / Three Forks, Gulf Coast Initial investors – 35% IRR Initial investors – 4.8x return Initial Southern Bay investors achieved a combined 7.4x ROI upon the merger with GeoResources and subsequent sale in 2012 Note: “Initial investors” refers to (i) in the case of private entities, investors that participated in the initial capitalization or recapitalization of the entity at the time a change in management occurred, or (ii) in the case of public entities, public shareholders existing at the date the transaction was announced to the public. Past performance is not necessarily indicative of future results.
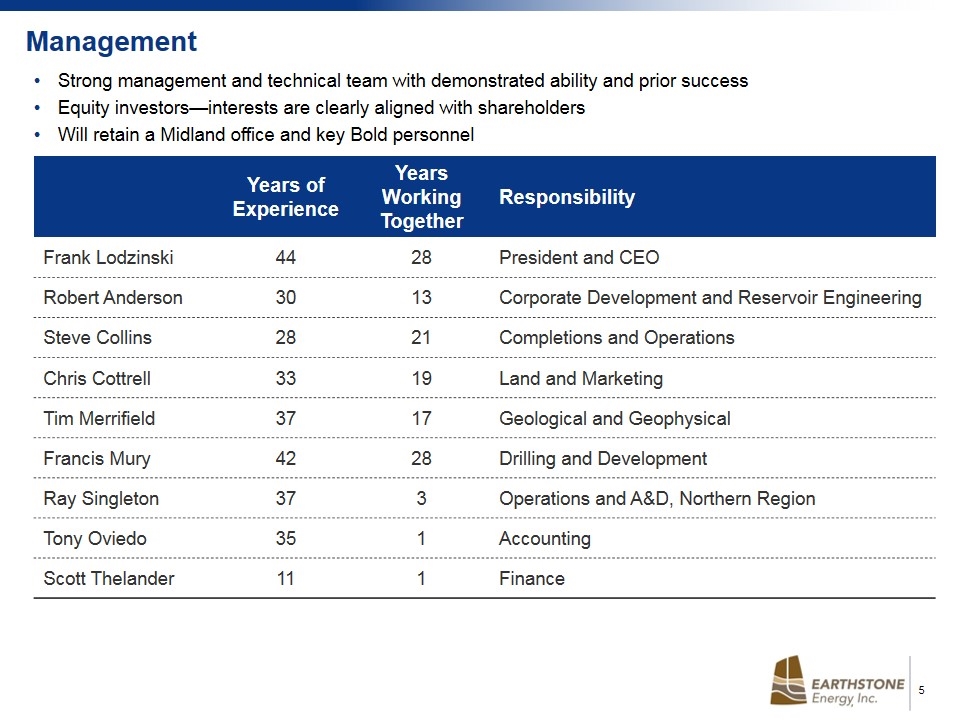
Management Strong management and technical team with demonstrated ability and prior success Equity investors—interests are clearly aligned with shareholders Will retain a Midland office and key Bold personnel Years of Experience Years Working Together Responsibility Frank Lodzinski 44 28 President and CEO Robert Anderson 30 13 Corporate Development and Reservoir Engineering Steve Collins 28 21 Completions and Operations Chris Cottrell 33 19 Land and Marketing Tim Merrifield 37 17 Geological and Geophysical Francis Mury 42 28 Drilling and Development Ray Singleton 37 3 Operations and A&D, Northern Region Tony Oviedo 35 1 Accounting Scott Thelander 11 1 Finance
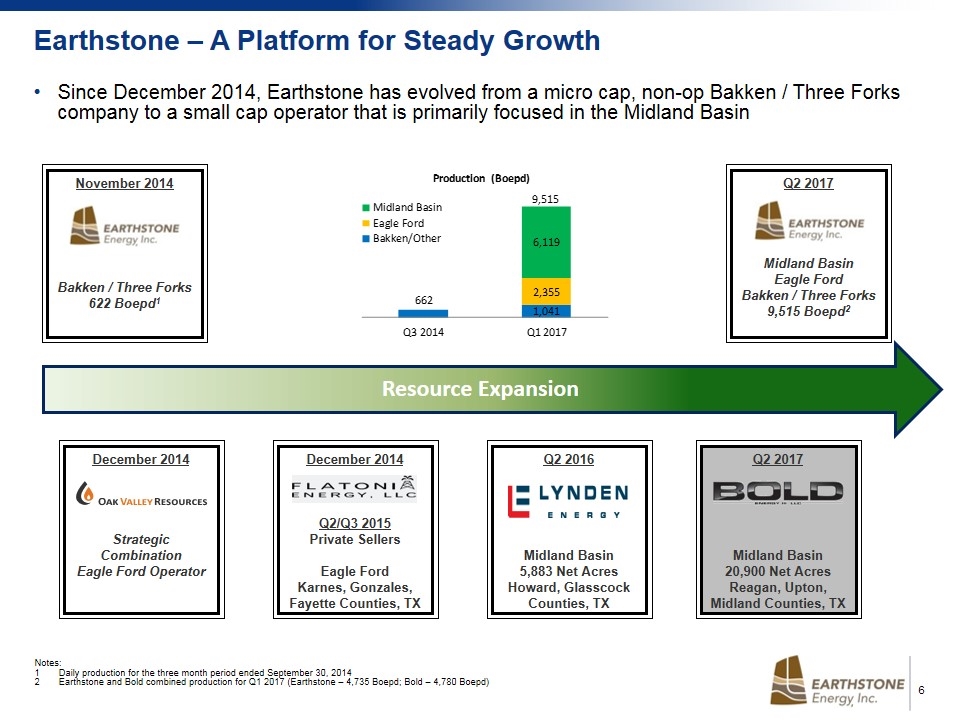
Earthstone – A Platform for Steady Growth December 2014 Q2/Q3 2015 Private Sellers Eagle Ford Karnes, Gonzales, Fayette Counties, TX December 2014 Strategic Combination Eagle Ford Operator Q2 2016 Midland Basin 5,883 Net Acres Howard, Glasscock Counties, TX Since December 2014, Earthstone has evolved from a micro cap, non-op Bakken / Three Forks company to a small cap operator that is primarily focused in the Midland Basin Resource Expansion November 2014 Bakken / Three Forks 622 Boepd1 Q2 2017 Midland Basin Eagle Ford Bakken / Three Forks 9,515 Boepd2 Notes: 1Daily production for the three month period ended September 30, 2014 2Earthstone and Bold combined production for Q1 2017 (Earthstone – 4,735 Boepd; Bold – 4,780 Boepd) Q2 2017 Midland Basin 20,900 Net Acres Reagan, Upton, Midland Counties, TX
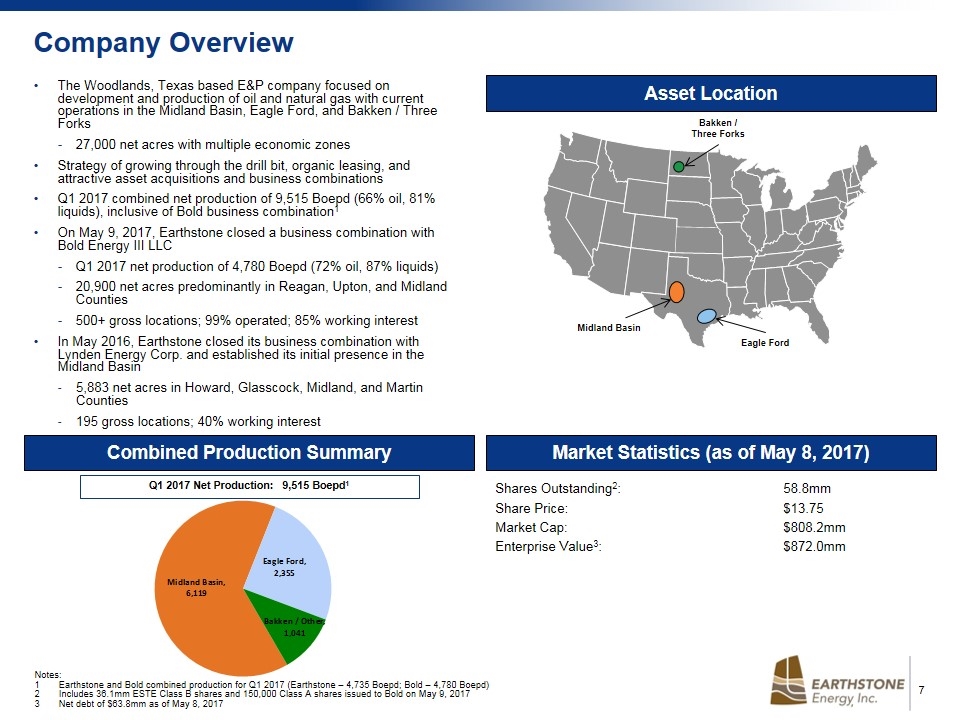
Company Overview Asset Location The Woodlands, Texas based E&P company focused on development and production of oil and natural gas with current operations in the Midland Basin, Eagle Ford, and Bakken / Three Forks 27,000 net acres with multiple economic zones Strategy of growing through the drill bit, organic leasing, and attractive asset acquisitions and business combinations Q1 2017 combined net production of 9,515 Boepd (66% oil, 81% liquids), inclusive of Bold business combination1 On May 9, 2017, Earthstone closed a business combination with Bold Energy III LLC Q1 2017 net production of 4,780 Boepd (72% oil, 87% liquids) 20,900 net acres predominantly in Reagan, Upton, and Midland Counties 500+ gross locations; 99% operated; 85% working interest In May 2016, Earthstone closed its business combination with Lynden Energy Corp. and established its initial presence in the Midland Basin 5,883 net acres in Howard, Glasscock, Midland, and Martin Counties 195 gross locations; 40% working interest Market Statistics (as of May 8, 2017) Shares Outstanding2:58.8mm Share Price: $13.75 Market Cap:$808.2mm Enterprise Value3:$872.0mm Bakken / Three Forks Eagle Ford Midland Basin Combined Production Summary Q1 2017 Net Production: 9,515 Boepd1 Notes: 1Earthstone and Bold combined production for Q1 2017 (Earthstone – 4,735 Boepd; Bold – 4,780 Boepd) 2Includes 36.1mm ESTE Class B shares and 150,000 Class A shares issued to Bold on May 9, 2017 3Net debt of $63.8mm as of May 8, 2017
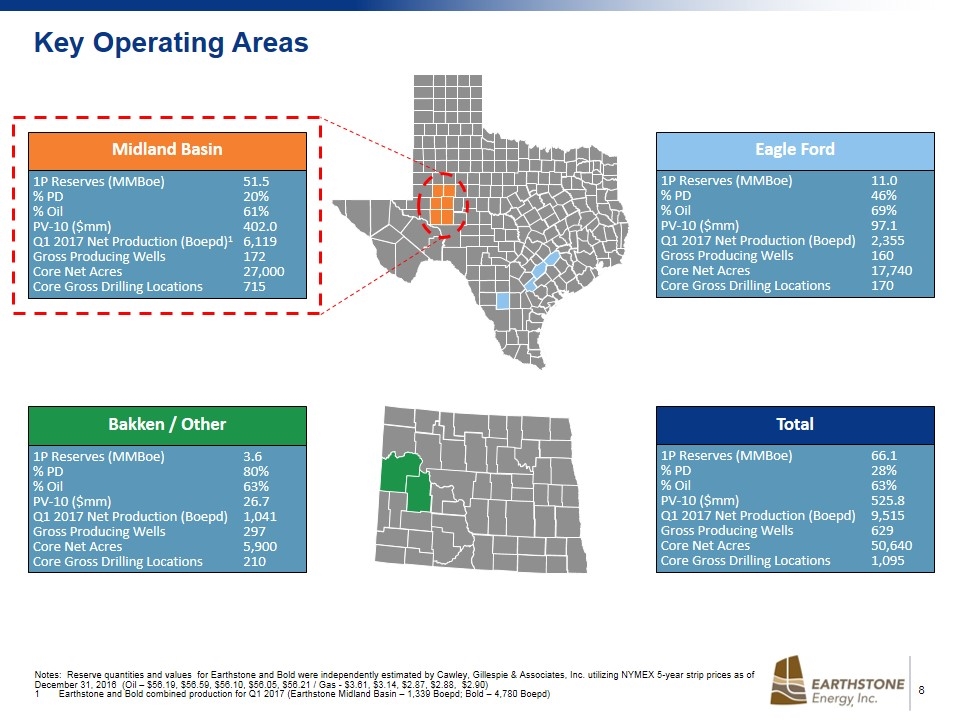
Total 1P Reserves (MMBoe)66.1 % PD28% % Oil63% PV-10 ($mm)525.8 Q1 2017 Net Production (Boepd)9,515 Gross Producing Wells629 Core Net Acres50,640 Core Gross Drilling Locations1,095 Bakken / Other 1P Reserves (MMBoe)3.6 % PD80% % Oil63% PV-10 ($mm)26.7 Q1 2017 Net Production (Boepd)1,041 Gross Producing Wells297 Core Net Acres5,900 Core Gross Drilling Locations210 Eagle Ford 1P Reserves (MMBoe)11.0 % PD46% % Oil69% PV-10 ($mm)97.1 Q1 2017 Net Production (Boepd)2,355 Gross Producing Wells160 Core Net Acres17,740 Core Gross Drilling Locations170 Midland Basin 1P Reserves (MMBoe)51.5 % PD20% % Oil61% PV-10 ($mm)402.0 Q1 2017 Net Production (Boepd)16,119 Gross Producing Wells172 Core Net Acres27,000 Core Gross Drilling Locations715 Key Operating Areas Oneliner Report – Area Column Eagle Ford = Eagle Ford, EF-Karnes, EF-Marathon (includes 1 Pearsall well), First Shot (Austin Chalk), Giddings (Austin Chalk), Hawkville (MR), Hawkville (WK) Delete Flatonia East Pipeline case and 2 sanchez operated wells from PDP well count Core Gross Drilling Locations = Eagle Ford, EF-Karnes, Giddings Oneliner Report – Area Column Core Gross Drilling Locations = Bakken-Three Forks less 40 lease-line locations Remove Ajax wells Notes: Reserve quantities and values for Earthstone and Bold were independently estimated by Cawley, Gillespie & Associates, Inc. utilizing NYMEX 5-year strip prices as of December 31, 2016 (Oil – $56.19, $56.59, $56.10, $56.05, $56.21 / Gas - $3.61, $3.14, $2.87, $2.88, $2.90) 1Earthstone and Bold combined production for Q1 2017 (Earthstone Midland Basin – 1,339 Boepd; Bold – 4,780 Boepd)
Asset Overview
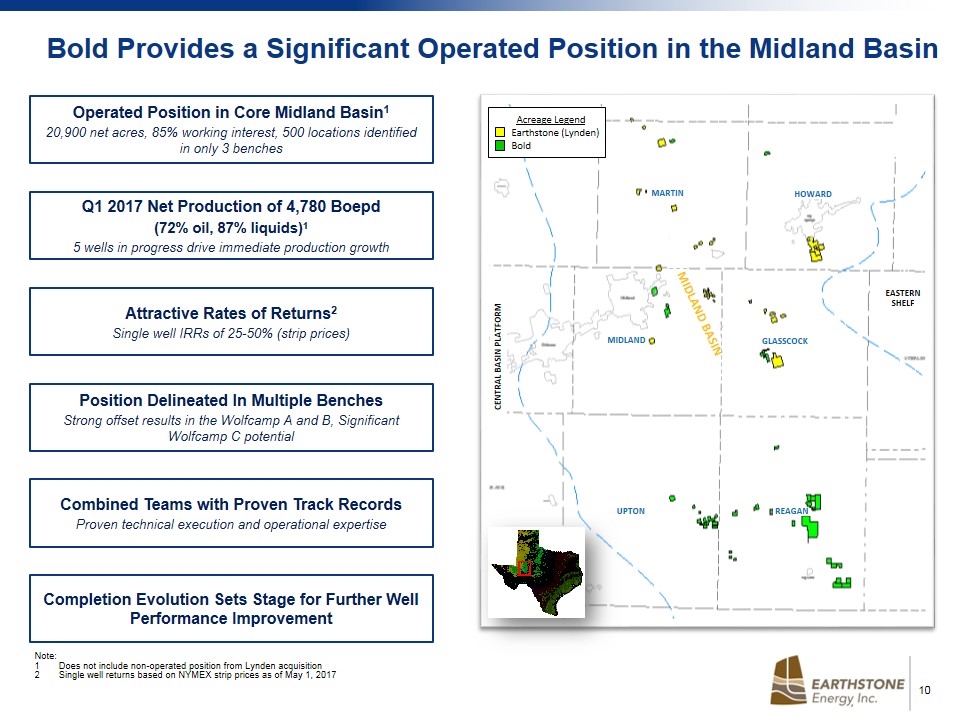
Acreage Legend Bold Operated Bold Non-Operated Operated Position in Core Midland Basin1 20,900 net acres, 85% working interest, 500 locations identified in only 3 benches Q1 2017 Net Production of 4,780 Boepd (72% oil, 87% liquids)1 5 wells in progress drive immediate production growth Attractive Rates of Returns2 Single well IRRs of 25-50% (strip prices) Position Delineated In Multiple Benches Strong offset results in the Wolfcamp A and B, Significant Wolfcamp C potential Combined Teams with Proven Track Records Proven technical execution and operational expertise Completion Evolution Sets Stage for Further Well Performance Improvement Bold Provides a Significant Operated Position in the Midland Basin Note: 1Does not include non-operated position from Lynden acquisition 2Single well returns based on NYMEX strip prices as of May 1, 2017 Acreage Legend Earthstone (Lynden) Bold MARTIN HOWARD GLASSCOCK MIDLAND REAGAN UPTON MIDLAND BASIN EASTERN SHELF CENTRAL BASIN PLATFORM
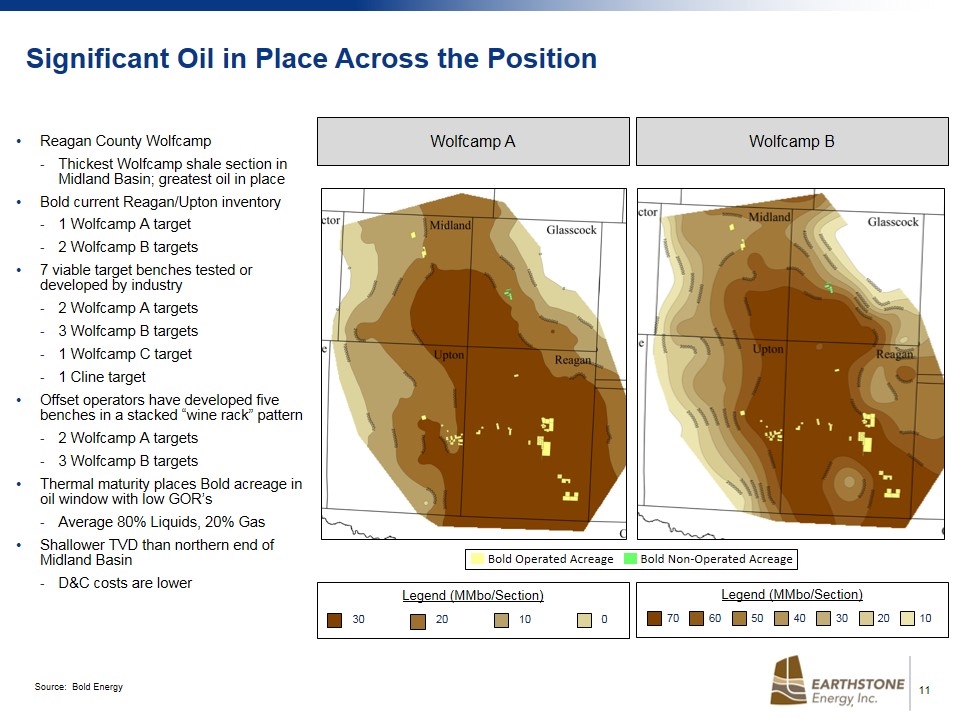
Significant Oil in Place Across the Position Reagan County Wolfcamp Thickest Wolfcamp shale section in Midland Basin; greatest oil in place Bold current Reagan/Upton inventory 1 Wolfcamp A target 2 Wolfcamp B targets 7 viable target benches tested or developed by industry 2 Wolfcamp A targets 3 Wolfcamp B targets 1 Wolfcamp C target 1 Cline target Offset operators have developed five benches in a stacked “wine rack” pattern 2 Wolfcamp A targets 3 Wolfcamp B targets Thermal maturity places Bold acreage in oil window with low GOR’s Average 80% Liquids, 20% Gas Shallower TVD than northern end of Midland Basin D&C costs are lower Wolfcamp A Wolfcamp B Legend (MMbo/Section) 30 0 20 10 70 60 50 40 30 20 10 Legend (MMbo/Section) Bold Operated Acreage Bold Non-Operated Acreage Source: Bold Energy
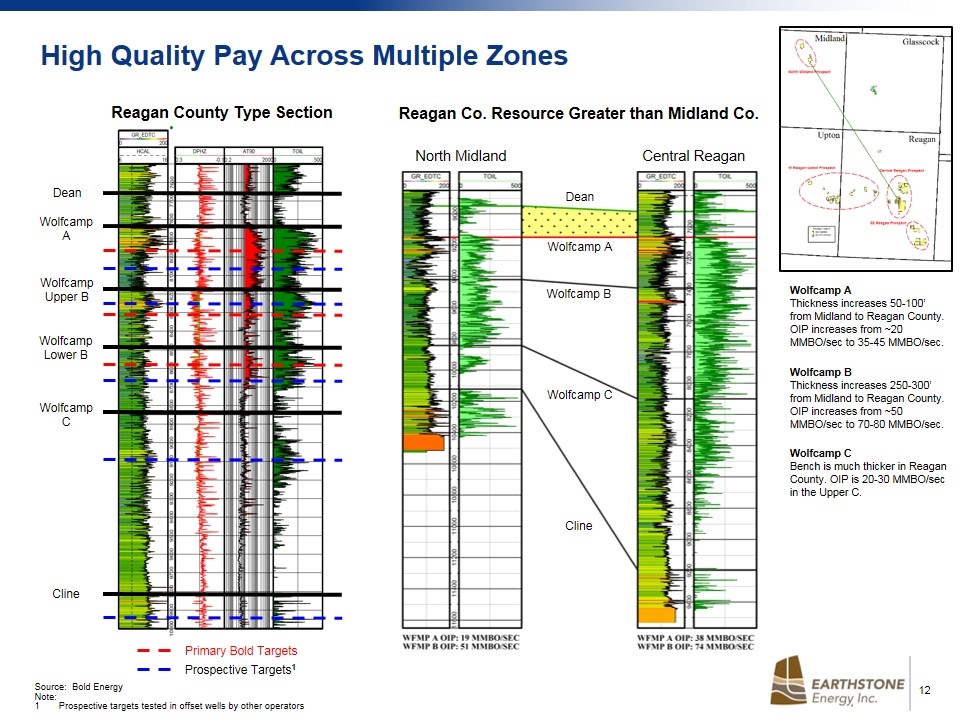
High Quality Pay Across Multiple Zones Reagan County Type Section Dean Wolfcamp Upper B Wolfcamp Lower B Wolfcamp A Wolfcamp C Cline Primary Bold Targets Prospective Targets1 North Midland Central Reagan Dean Wolfcamp A Wolfcamp B Wolfcamp C Cline Wolfcamp A Thickness increases 50-100’ from Midland to Reagan County. OIP increases from ~20 MMBO/sec to 35-45 MMBO/sec. Wolfcamp B Thickness increases 250-300’ from Midland to Reagan County. OIP increases from ~50 MMBO/sec to 70-80 MMBO/sec. Wolfcamp C Bench is much thicker in Reagan County. OIP is 20-30 MMBO/sec in the Upper C. Reagan Co. Resource Greater than Midland Co. Source: Bold Energy Note: 1Prospective targets tested in offset wells by other operators
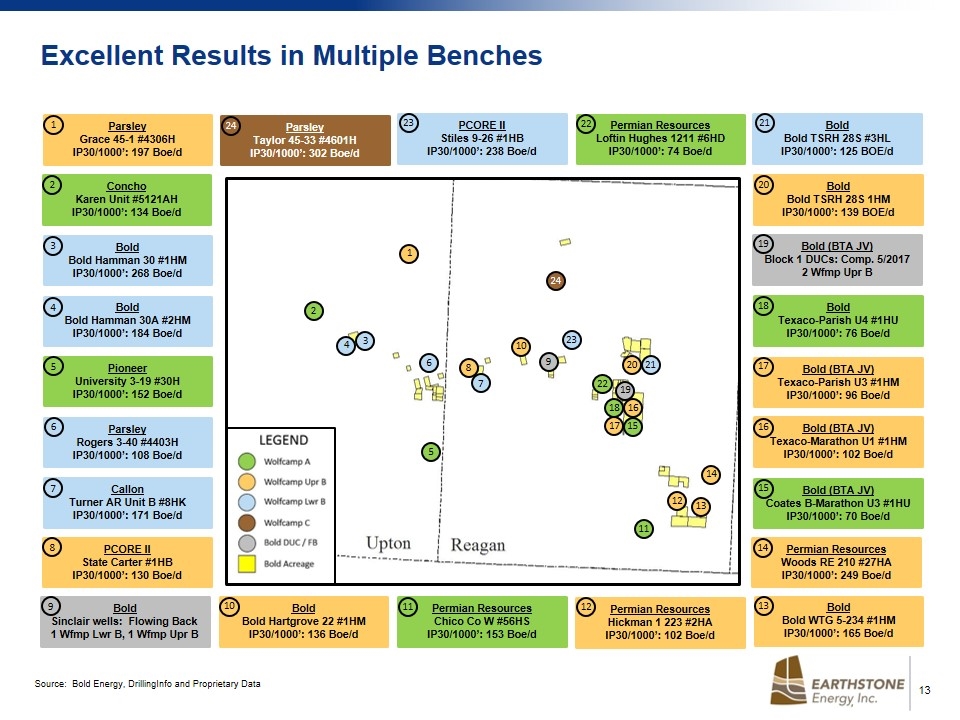
Permian Resources Woods RE 210 #27HA IP30/1000’: 249 Boe/d Bold (BTA JV) Texaco-Marathon U1 #1HM IP30/1000’: 102 Boe/d Bold (BTA JV) Coates B-Marathon U3 #1HU IP30/1000’: 70 Boe/d Bold Bold TSRH 28S #3HL IP30/1000’: 125 BOE/d 24 Bold Bold Hartgrove 22 #1HM IP30/1000’: 136 Boe/d 11 15 18 22 5 2 Permian Resources Loftin Hughes 1211 #6HD IP30/1000’: 74 Boe/d Bold Texaco-Parish U4 #1HU IP30/1000’: 76 Boe/d Permian Resources Chico Co W #56HS IP30/1000’: 153 Boe/d 10 11 15 18 22 4 3 6 7 23 Parsley Taylor 45-33 #4601H IP30/1000’: 302 Boe/d PCORE II Stiles 9-26 #1HB IP30/1000’: 238 Boe/d Bold Bold TSRH 28S 1HM IP30/1000’: 139 BOE/d Callon Turner AR Unit B #8HK IP30/1000’: 171 Boe/d Parsley Rogers 3-40 #4403H IP30/1000’: 108 Boe/d 20 24 23 7 6 17 14 13 Bold (BTA JV) Texaco-Parish U3 #1HM IP30/1000’: 96 Boe/d 17 Permian Resources Hickman 1 223 #2HA IP30/1000’: 102 Boe/d Bold Bold WTG 5-234 #1HM IP30/1000’: 165 Boe/d 14 13 12 PCORE II State Carter #1HB IP30/1000’: 130 Boe/d 8 8 Pioneer University 3-19 #30H IP30/1000’: 152 Boe/d Bold Bold Hamman 30A #2HM IP30/1000’: 184 Boe/d Bold Bold Hamman 30 #1HM IP30/1000’: 268 Boe/d 3 Concho Karen Unit #5121AH IP30/1000’: 134 Boe/d 2 Parsley Grace 45-1 #4306H IP30/1000’: 197 Boe/d 1 Bold (BTA JV) Block 1 DUCs: Comp. 5/2017 2 Wfmp Upr B 4 21 5 Bold Sinclair wells: Flowing Back 1 Wfmp Lwr B, 1 Wfmp Upr B 9 19 16 9 19 1 10 21 20 16 12 Excellent Results in Multiple Benches Source: Bold Energy, DrillingInfo and Proprietary Data
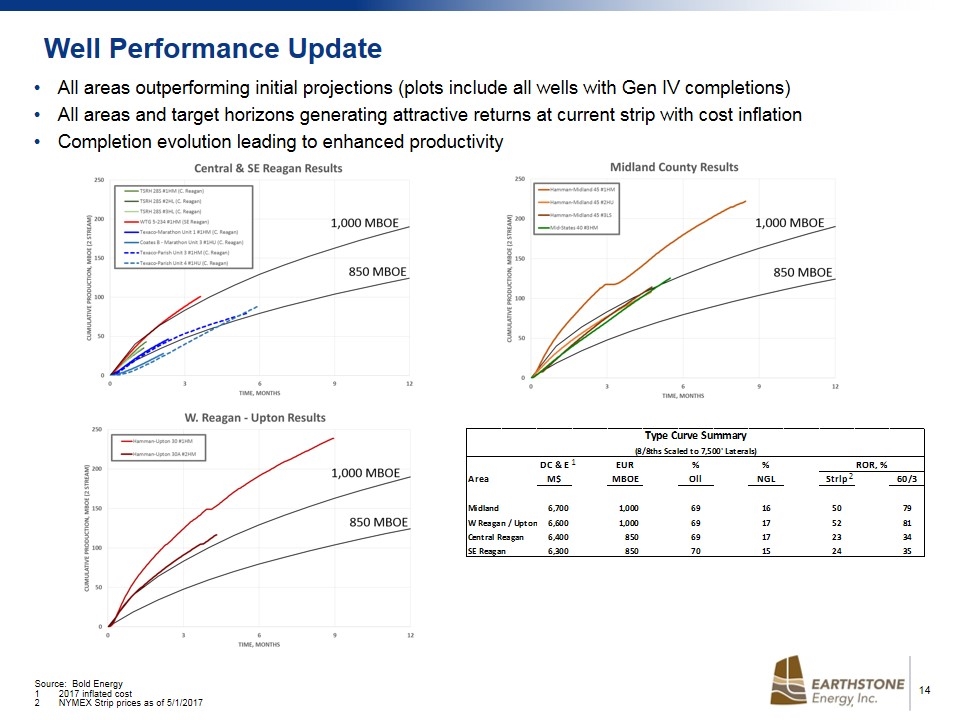
All areas outperforming initial projections (plots include all wells with Gen IV completions) All areas and target horizons generating attractive returns at current strip with cost inflation Completion evolution leading to enhanced productivity 1 2 Well Performance Update Source: Bold Energy 12017 inflated cost 2NYMEX Strip prices as of 5/1/2017
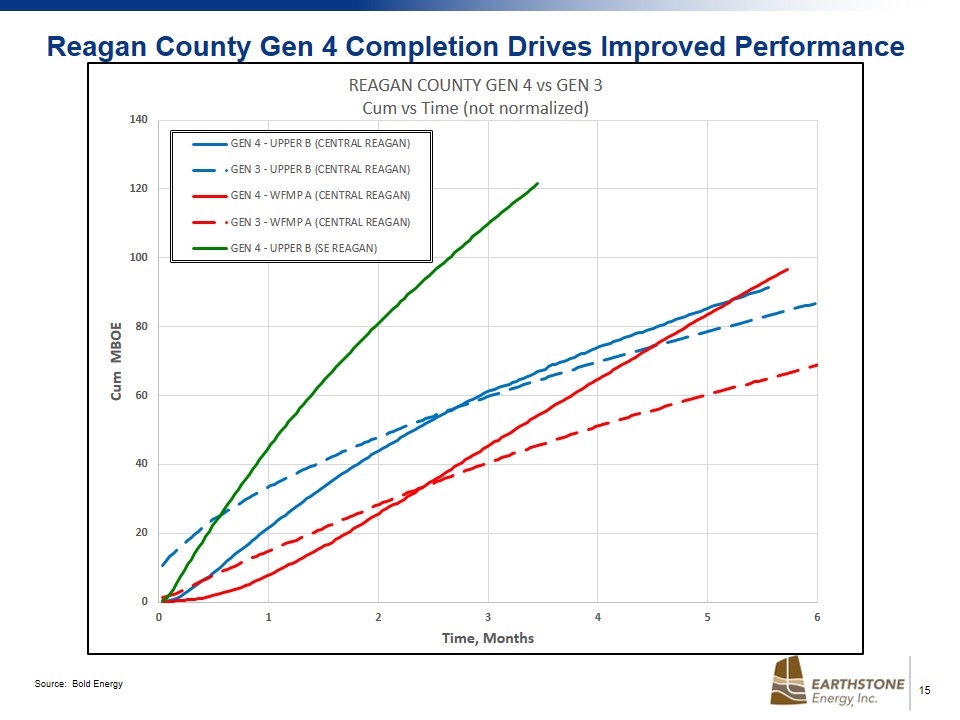
Source: Bold Energy Reagan County Gen 4 Completion Drives Improved Performance
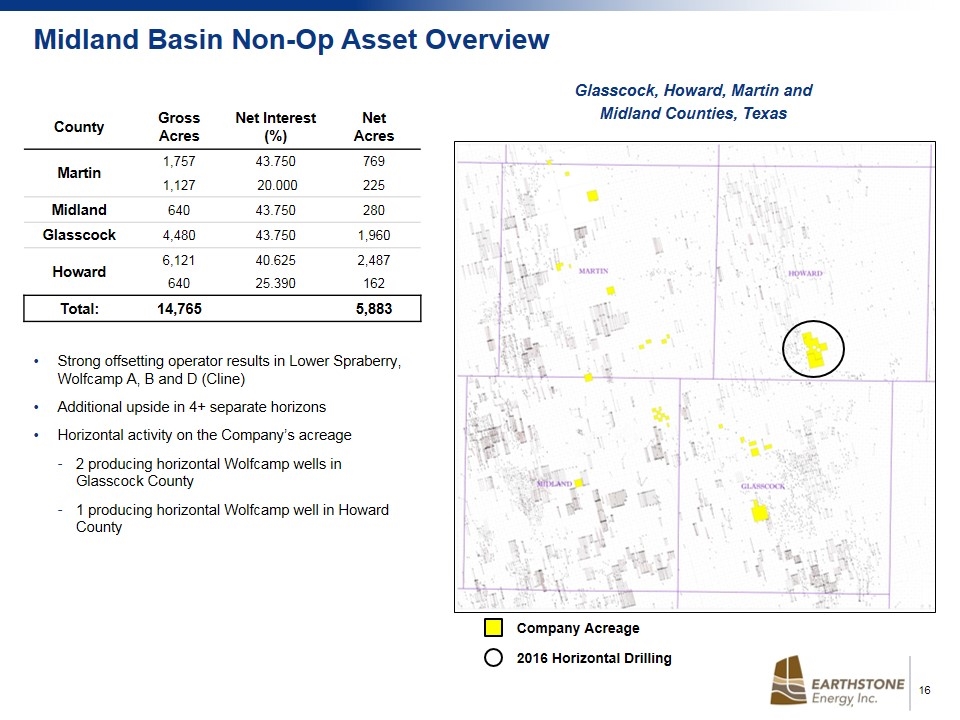
Midland Basin Non-Op Asset Overview Strong offsetting operator results in Lower Spraberry, Wolfcamp A, B and D (Cline) Additional upside in 4+ separate horizons Horizontal activity on the Company’s acreage 2 producing horizontal Wolfcamp wells in Glasscock County 1 producing horizontal Wolfcamp well in Howard County Glasscock, Howard, Martin and Midland Counties, Texas County Gross Acres Net Interest (%) Net Acres Martin 1,757 43.750 769 1,127 20.000 225 Midland 640 43.750 280 Glasscock 4,480 43.750 1,960 Howard 6,121 40.625 2,487 640 25.390 162 Total: 14,765 5,883 2016 Horizontal Drilling Company Acreage
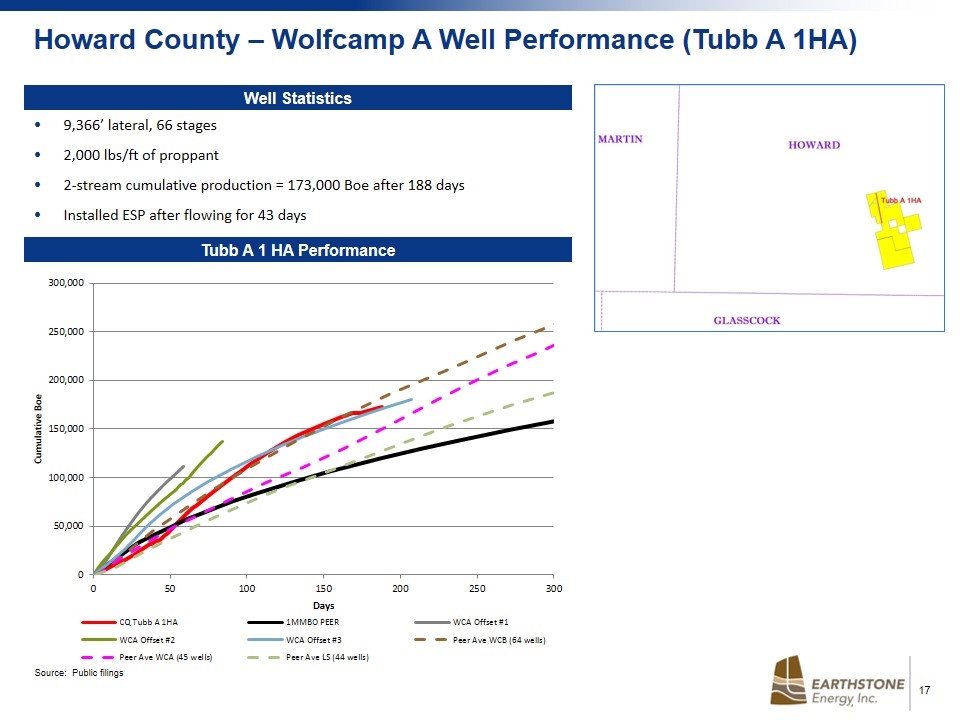
9,366’ lateral, 66 stages 2,000 lbs/ft of proppant 2-stream cumulative production = 173,000 Boe after 188 days Installed ESP after flowing for 43 days Howard County – Wolfcamp A Well Performance (Tubb A 1HA) Tubb A 1 HA Performance Well Statistics Source: Public filings
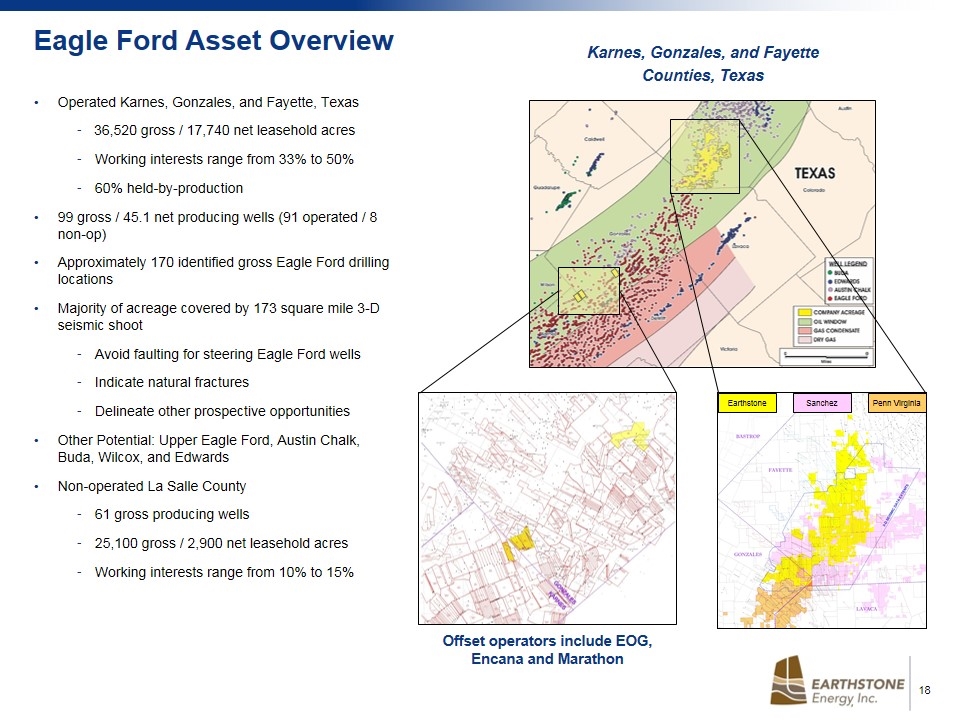
Eagle Ford Asset Overview Operated Karnes, Gonzales, and Fayette, Texas 36,520 gross / 17,740 net leasehold acres Working interests range from 33% to 50% 60% held-by-production 99 gross / 45.1 net producing wells (91 operated / 8 non-op) Approximately 170 identified gross Eagle Ford drilling locations Majority of acreage covered by 173 square mile 3-D seismic shoot Avoid faulting for steering Eagle Ford wells Indicate natural fractures Delineate other prospective opportunities Other Potential: Upper Eagle Ford, Austin Chalk, Buda, Wilcox, and Edwards Non-operated La Salle County 61 gross producing wells 25,100 gross / 2,900 net leasehold acres Working interests range from 10% to 15% Karnes, Gonzales, and Fayette Counties, Texas Earthstone Sanchez Penn Virginia Offset operators include EOG, Encana and Marathon
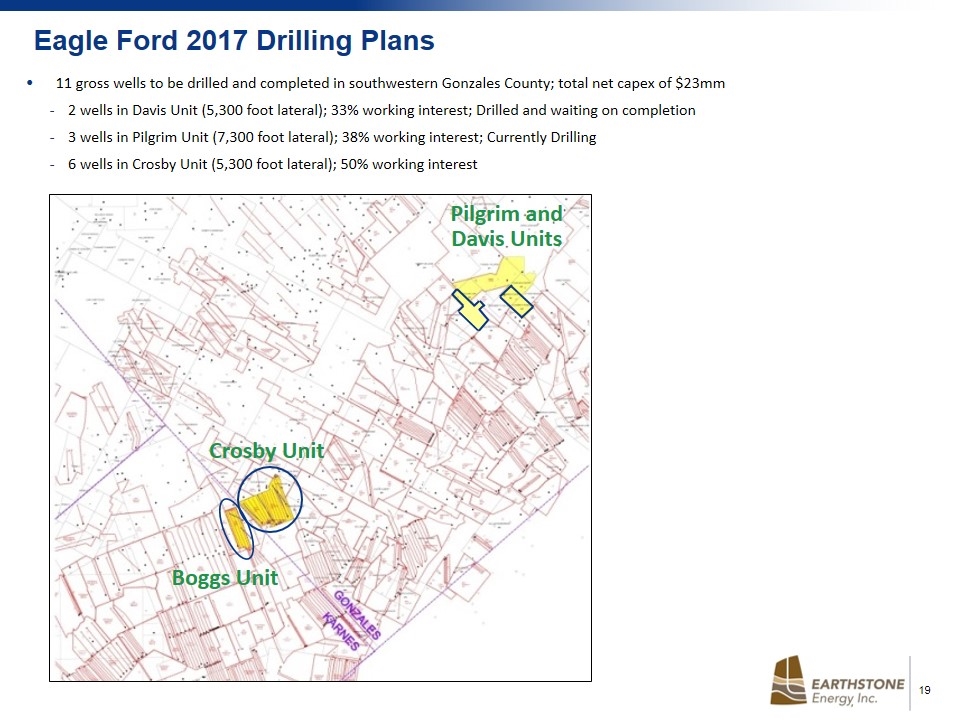
Eagle Ford 2017 Drilling Plans 11 gross wells to be drilled and completed in southwestern Gonzales County; total net capex of $23mm 2 wells in Davis Unit (5,300 foot lateral); 33% working interest; Drilled and waiting on completion 3 wells in Pilgrim Unit (7,300 foot lateral); 38% working interest; Currently Drilling 6 wells in Crosby Unit (5,300 foot lateral); 50% working interest Crosby Unit Pilgrim and Davis Units Boggs Unit
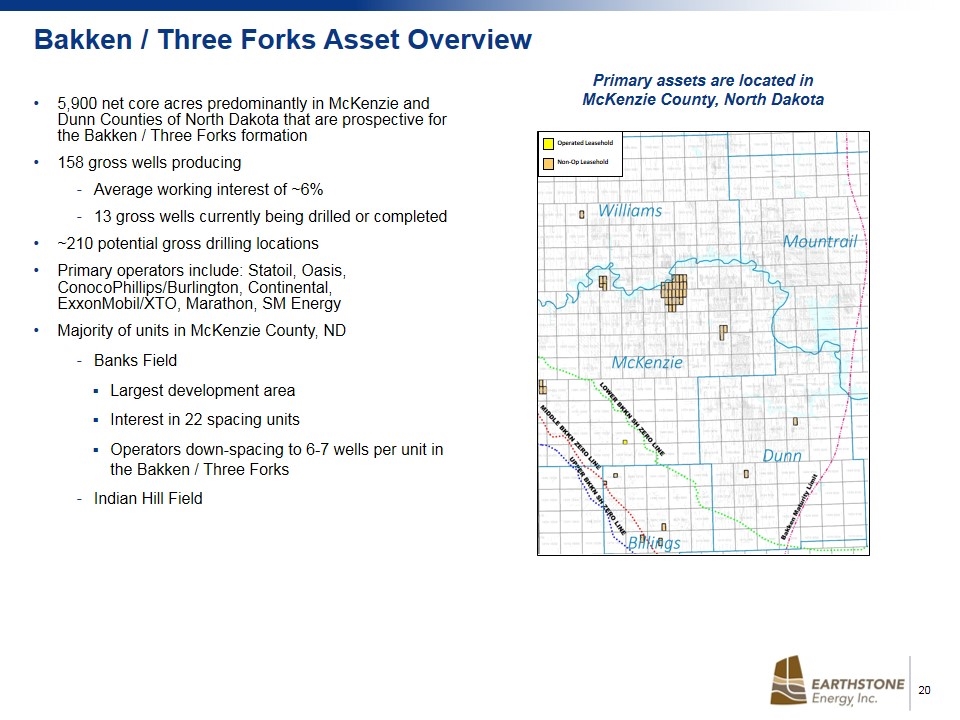
Bakken / Three Forks Asset Overview 5,900 net core acres predominantly in McKenzie and Dunn Counties of North Dakota that are prospective for the Bakken / Three Forks formation 158 gross wells producing Average working interest of ~6% 13 gross wells currently being drilled or completed ~210 potential gross drilling locations Primary operators include: Statoil, Oasis, ConocoPhillips/Burlington, Continental, ExxonMobil/XTO, Marathon, SM Energy Majority of units in McKenzie County, ND Banks Field Largest development area Interest in 22 spacing units Operators down-spacing to 6-7 wells per unit in the Bakken / Three Forks Indian Hill Field Non-Op Leasehold Operated Leasehold Primary assets are located in McKenzie County, North Dakota
Financial Overview
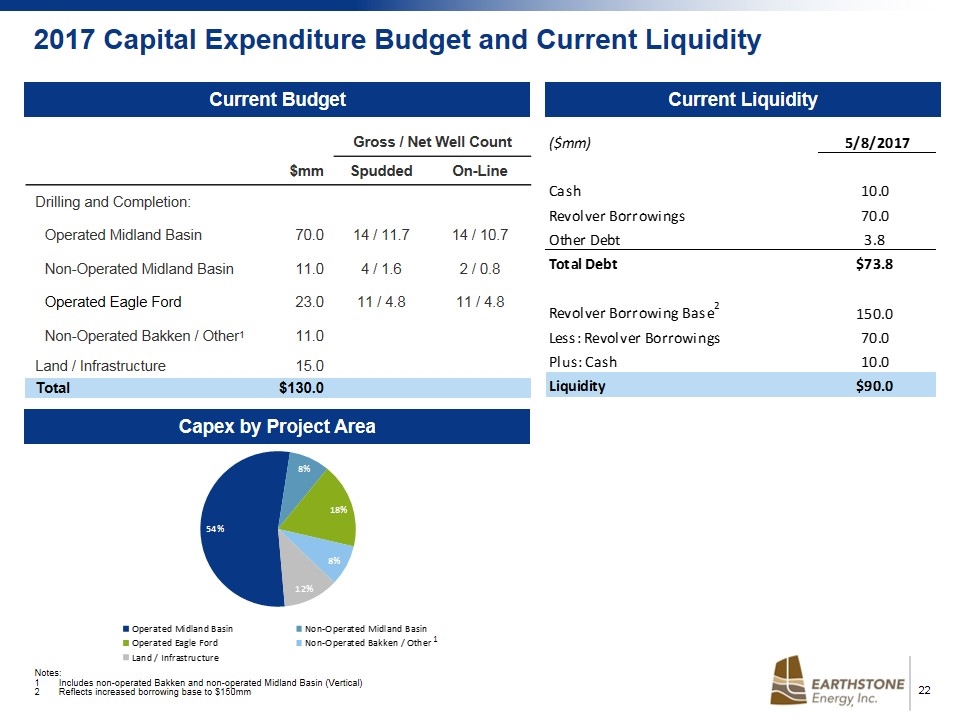
$mm Gross / Net Well Count Spudded On-Line Drilling and Completion: Operated Midland Basin 70.0 14 / 11.7 14 / 10.7 Non-Operated Midland Basin 11.0 4 / 1.6 2 / 0.8 Operated Eagle Ford 23.0 11 / 4.8 11 / 4.8 Non-Operated Bakken / Other1 11.0 Land / Infrastructure 15.0 Total $130.0 Capex by Project Area Current Budget 2017 Capital Expenditure Budget and Current Liquidity Notes: 1Includes non-operated Bakken and non-operated Midland Basin (Vertical) 2Reflects increased borrowing base to $150mm 1 Current Liquidity
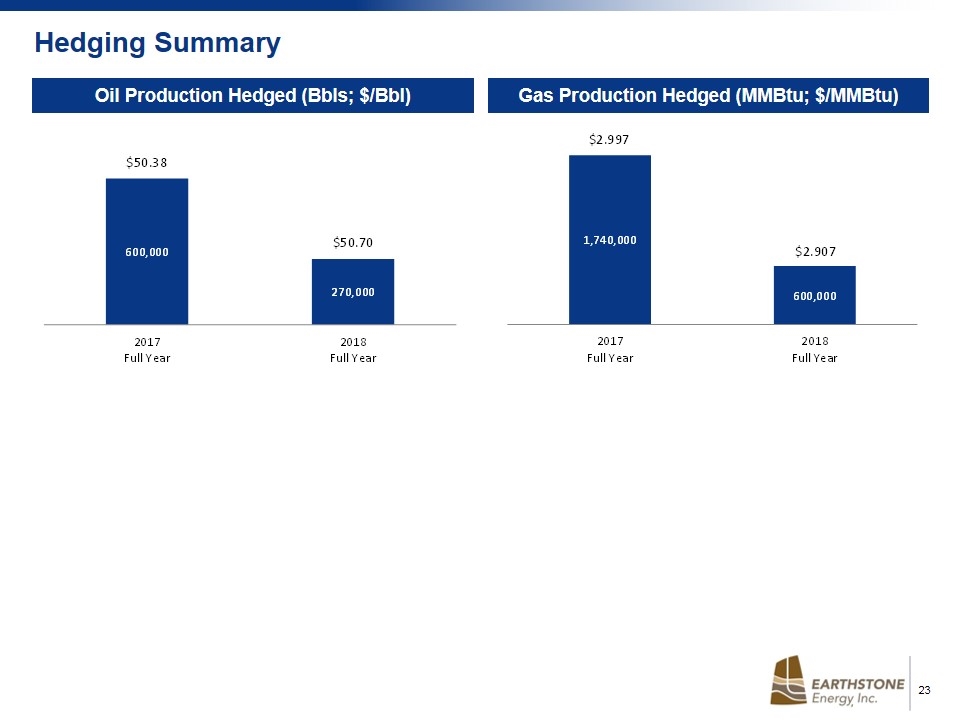
Hedging Summary Oil Production Hedged (Bbls; $/Bbl) Gas Production Hedged (MMBtu; $/MMBtu)
Analyst Coverage Firm Analyst Contact Info Baird Daniel Katzenberg / 646-557-3209 / dkatzenberg@rwbaird.com Euro Pacific Joel Musante / 800-727-7922 ext: 144 / jmusante@europac.net FBR Chad Mabry / 832-319-2520 / cmabry@fbr.com IBERIA Blaise Angelico / 504-310-7548 / blaise.angelico@iberiabank.com Johnson Rice Welles Fitzpatrick / 504-584-1235 / welles@jrco.com Northland Jeff Grampp / 949-600-4150 / jgrampp@northlandcapitalmarkets.com Roth John White / 949-720-7115 / jwhite@roth.com Seaport Global Mike Kelly, CFA / 713-658-6302 / mkelly@seaportglobal.com John Aschenbeck / 713-658-6343 / jaschenbeck@seaportglobal.com Stephens Ben Wyatt / 817-900-5714 / ben.wyatt@stephens.com SunTrust Neal Dingmann / 713-247-9000 / neal.dingmann@suntrust.com Wunderlich Jason Wangler / 713-403-3985 / jwangler@wundernet.com
Frank Lodzinski President and CEO Robert Anderson EVP, Corporate Development and Engineering Scott Thelander Director of Finance Corporate Headquarters Houston 1400 Woodloch Forest Drive | Suite 300 | The Woodlands, TX 77380 | (281) 298-4246 Midland 600 N. Marienfield | Suite 1000 | Midland, TX 79701 | (432) 686-1100 Denver 633 17th Street | Suite 2320 | Denver, CO 80202 | (303) 296-3076 Website www.earthstoneenergy.com Contact Information
