Attached files
| file | filename |
|---|---|
| EX-31.1 - EX-31.1 - EARTHSTONE ENERGY INC | este-ex311_300.htm |
| EX-23.2 - EX-23.2 - EARTHSTONE ENERGY INC | este-ex232_363.htm |
| EX-31.2 - EX-31.2 - EARTHSTONE ENERGY INC | este-ex312_299.htm |
| EX-32.2 - EX-32.2 - EARTHSTONE ENERGY INC | este-ex322_296.htm |
| EX-99.1 - EX-99.1 - EARTHSTONE ENERGY INC | este-ex991_362.htm |
| EX-21.1 - EX-21.1 - EARTHSTONE ENERGY INC | este-ex211_358.htm |
| EX-32.1 - EX-32.1 - EARTHSTONE ENERGY INC | este-ex321_297.htm |
| EX-23.1 - EX-23.1 - EARTHSTONE ENERGY INC | este-ex231_357.htm |
UNITED STATES
SECURITIES AND EXCHANGE COMMISSION
Washington, D.C. 20549
FORM 10-K
(Mark One)
|
þ |
ANNUAL REPORT UNDER SECTION 13 OR 15(d) OF THE SECURITIES EXCHANGE ACT OF 1934 |
For the Fiscal Year Ended December 31, 2015
Or
|
o |
TRANSITION REPORT UNDER SECTION 13 OR 15(d) OF THE SECURITIES EXCHANGE ACT OF 1934 |
Commission File No. 001-35049

EARTHSTONE ENERGY, INC.
(Exact name of registrant as specified in its charter)
|
Delaware |
|
84-0592823 |
|
(State or other jurisdiction of incorporation or organization) |
|
(I.R.S Employer Identification No.) |
1400 Woodloch Forest Drive, Suite 300
The Woodlands, Texas 77380
(Address of principal executive offices)
Registrant’s telephone number, including area code: (281) 298-4246
Securities registered pursuant to Section 12(b) of the Act:
|
Title of each class |
|
Name of each exchange on which registered |
|
Common Stock, $0.001 par value per share |
|
NYSE MKT |
Securities registered under Section 12(g) of the Act:
None
Indicate by check mark if the registrant is a well-known seasoned issuer, as defined in Rule 405 of the Securities Act. Yes o No þ
Indicate by check mark if the registrant is not required to file reports pursuant to Section 13 or 15(d) of the Exchange Act. Yes o No þ
Indicate by check mark whether the issuer (1) has filed all reports required to be filed by Section 13 or 15(d) of the Exchange Act during the past 12 months (or for such shorter period that the registrant was required to file such reports), and (2) has been subject to the filing requirements for the past 90 days. Yes þ No o
Indicate by check mark whether the registrant has submitted electronically and posted on its corporate Website, if any, every Interactive Data File required to be submitted and posted pursuant to Rule 405 of Regulation S-T during the preceding 12 months (or for such shorter period that the registrant was required to post such filed). Yes þ No o
Indicate by check mark if disclosure of delinquent filers pursuant to Item 405 of Regulation S-K (§ 229.405 of this chapter) is not contained herein, and will not be contained, to the best of registrant’s knowledge, in definitive proxy or information statements incorporated by reference in Part III of this Form 10-K or any amendment to this Form 10-K. þ
Indicate by check mark whether the registrant is a large accelerated filer, an accelerated filer, a non-accelerated filer, or a smaller reporting company. See definition of “large accelerated filer”, “accelerated filer” and “smaller reporting company” in Rule 12b-2 of the Exchange Act (check one):
|
|
¨ |
|
Accelerated filer |
|
þ |
|
|
|
|
|
|
|||
|
Non-accelerated filer |
|
¨ (Do not check if a smaller reporting company) |
|
Smaller reporting company |
|
¨ |
Indicate by check mark whether the registrant is a shell company (as defined in Rule 12b-2 of the Exchange Act). Yes o No þ
The aggregate market value of voting and non-voting common equity held by non-affiliates computed by reference to the price of $19.53 per share at which the common equity was last sold, as of the last business day of the registrant’s most recently completed second fiscal quarter was approximately $83,152,373.
As of March 9, 2016 13,835,128 shares of the registrant’s common stock were outstanding.
DOCUMENTS INCORPORATED BY REFERENCE
Portions of the Registrant’s Definitive Proxy Statement for its 2016 Annual Meeting of Stockholders (the “Proxy Statement”), are incorporated by reference into Part III of this report Annual Report on Form 10-K.
|
|
|
|
Page |
|
|
|
||
|
|
|
|
|
|
|
|
||
|
Item 1. |
|
8 |
|
|
Item 1A. |
|
18 |
|
|
Item 1B. |
|
32 |
|
|
Item 2. |
|
32 |
|
|
Item 3. |
|
38 |
|
|
Item 4. |
|
38 |
|
|
|
|
||
|
Item 5. |
|
39 |
|
|
Item 6. |
|
41 |
|
|
Item 7. |
Management’s Discussion and Analysis of Financial Condition and Results of Operations |
|
42 |
|
Item 7A. |
|
56 |
|
|
Item 8. |
|
57 |
|
|
Item 9. |
Changes in and Disagreements with Accountants on Accounting and Financial Disclosure |
|
57 |
|
Item 9A. |
|
58 |
|
|
Item 9B. |
|
61 |
|
|
|
|
||
|
Item 10. |
|
62 |
|
|
Item 11. |
|
62 |
|
|
Item 12. |
Security Ownership of Certain Beneficial Owners and Management and Related Stockholder Matters |
|
62 |
|
Item 13. |
Certain Relationships and Related Transactions, and Director Independence |
|
62 |
|
Item 14. |
|
62 |
|
|
|
|
||
|
Item 15. |
|
63 |
|
|
Signatures |
|
|
|
2
CAUTIONARY STATEMENT CONCERNING FORWARD-LOOKING STATEMENTS
Certain statements contained in this report may contain “forward-looking statements” within the meaning of Section 27A of the Securities Act of 1933, as amended (the “Securities Act”), and Section 21E of the Securities Exchange Act of 1934, as amended (the “Exchange Act”). All statements other than statements of historical facts contained in this report are forward-looking statements. These forward-looking statements can generally be identified by the use of words such as “may,” “will,” “could,” “should,” “project,” “intends,” “plans,” “pursue,” “target,” “continue,” “believes,” “anticipates,” “expects,” “estimates,” “predicts,” or “potential,” the negative of such terms or variations thereon, or other comparable terminology. Statements that describe our future plans, strategies, intentions, expectations, objectives, goals or prospects are also forward-looking statements. Actual results could differ materially from those anticipated in these forward-looking statements. Readers should consider carefully the risks described under the “Risk Factors” section of this report and other sections of this report which describe factors that could cause our actual results to differ from those anticipated in forward-looking statements, including, but not limited to, the following factors:
|
|
· |
volatility and weakness in commodity prices for oil and natural gas and the effect of prices set or influenced by action of the Organization of Petroleum Exporting Countries (“OPEC”); |
|
|
· |
substantial changes in estimates of our proved reserves; |
|
|
· |
substantial declines in the values of our oil and natural gas reserves; |
|
|
· |
our ability to replace our oil and natural gas reserves; |
|
|
· |
the potential for production decline rates for our wells to be greater than we expect; |
|
|
· |
the timing and extent of our success in discovering, acquiring, developing and producing oil and natural gas reserves; |
|
|
· |
the ability and willingness of our partners under our joint operating agreements to join in our future exploration, development and production activities; |
|
|
· |
our ability to acquire leases and quality services and supplies on a timely basis and at reasonable prices; |
|
|
· |
the cost and availability of high quality goods and services with fully trained and adequate personnel, such as drilling rigs and completion equipment; |
|
|
· |
risks in connection with potential acquisitions and the integration of significant acquisitions; |
|
|
· |
the possibility that acquisitions and divestitures may involve unexpected costs or delays, and that acquisitions may not achieve intended benefits and will divert management’s time and energy; |
|
|
· |
the possibility that anticipated divestitures may not occur or could be burdened with unforeseen costs; |
|
|
· |
reductions in the borrowing base under our credit facility; |
|
|
· |
risks incident to the drilling and operation of oil and natural gas wells; |
|
|
· |
the presence or recoverability of estimated oil and natural gas reserves and the actual future production rates and associated costs; |
|
|
· |
the availability of sufficient pipeline and other transportation facilities to carry our production and the impact of these facilities on prices; |
|
|
· |
significant competition for acreage and acquisitions; |
|
|
· |
the effect of existing and future laws, governmental regulations and the political and economic climates of the United States; |
|
|
· |
our ability to retain key members of senior management and key technical and financial employees; |
|
|
· |
changes in environmental laws and the regulation and enforcement related to those laws; |
|
|
· |
the identification of and severity of environmental events and governmental responses to these or other environmental events; |
|
|
· |
legislative or regulatory changes, including retroactive royalty or production tax regimes, hydraulic-fracturing regulations, derivatives reform, and changes in state, and federal income taxes; |
|
|
· |
general economic conditions, whether internationally, nationally or in the regional and local market areas in which we conduct business, may be less favorable than expected, including the possibility that economic conditions in the United States will worsen and that capital markets will be disrupted or unavailable; |
3
|
|
· |
the insurance coverage maintained by us may not adequately cover all losses that may be sustained in connection with our business activities; |
|
|
· |
other economic, competitive, governmental, regulatory, legislative, including federal, state and tribal regulations and laws, geopolitical and technological factors that may negatively impact our business, operations or oil and natural gas prices; |
|
|
· |
the effect of our oil and natural gas derivative activities; |
|
|
· |
title to the properties in which we have an interest may be impaired by title defects; and |
|
|
· |
our dependency on the skill, ability and decisions of third party operators of oil and natural gas properties in which we have a non-operated working interest. |
All forward-looking statements are expressly qualified in their entirety by the cautionary statements in this section and elsewhere in this report. Other than as required under the securities laws, we do not assume a duty to update these forward-looking statements, whether as a result of new information, subsequent events or circumstances, changes in expectations or otherwise.
For further information regarding these and other factors, risks and uncertainties affecting us, see Part I, Item 1A. Risk Factors of this report.
4
GLOSSARY OF CERTAIN OIL AND NATURAL GAS TERMS
The following are abbreviations and definitions of terms commonly used in the oil and natural gas industry and within this report.
3-D seismic – An advanced technology method of detecting accumulation of hydrocarbons identified through a three-dimensional picture of the subsurface created by the collection and measurement of the intensity and timing of sound waves transmitted into the earth as they reflect back to the surface.
Bbl - One barrel or 42 U.S gallons liquid volume of oil or other liquid hydrocarbons.
Behind-pipe reserves – Those reserves expected to be recovered from completion interval(s) not yet open but still behind casing in existing wells. These reserves, if they meet the criteria for proved reserves, will be included in the PDNP category of our reserves.
BOE – Barrel of oil equivalent, determined using a ratio of six Mcf of natural gas equal to one barrel of oil equivalent.
Btu – British thermal unit, the quantity of heat required to raise the temperature of one pound of water by one degree Fahrenheit.
Completion – The installation of permanent equipment for the production of oil or natural gas or, in the case of a dry hole, the reporting of abandonment to the appropriate agency.
Developed acreage – The number of acres which are allotted or assignable to producing wells or wells capable of production.
Development activities – Activities following exploration including the drilling and completion of additional wells and the installation of production facilities.
Development well – A well drilled within the proved area of an oil or natural gas reservoir to the depth of a stratigraphic horizon known to be productive.
Dry hole or well – A well found to be incapable of producing hydrocarbons economically.
Exploitation – The act of making an oil and natural gas property more profitable, productive or useful.
Exploratory well – A well drilled to find and produce oil or natural gas reserves in an area or a potential reservoir not classified as proved.
Farm-in or Farm-out – An agreement whereby the owner of a working interest in an oil and natural gas lease assigns or contractually conveys subject to future assignment the working interest or a portion thereof to another party who desires to drill on the leased acreage. Generally, the farmee is required to drill one or more wells in order to earn its interest in the acreage. The farmor usually retains a royalty and/or an after-payout interest in the lease. The interest received by the farmee is a “farm-in” while the interest transferred by the farmor is a “farm-out.”
Field – An area consisting of a single reservoir or multiple reservoirs all grouped on or related to the same individual geological structural feature and/or stratigraphic condition.
Gross acres or gross wells – The total acres or wells, as the case may be, in which a working interest is owned.
HBP – Held by production, a mineral lease provision that extends the right to operate a lease as long as the property produces a minimum quantity of oil and natural gas.
Horizontal drilling – A drilling technique that permits the operator to drill horizontally within a specified targeted reservoir and thus exposes a larger portion of the producing horizon to a wellbore than would otherwise be exposed through conventional vertical drilling techniques. Greater horizontal exposure to a hydrocarbon bearing reservoir typically results in increased production rates and greater ultimate recoveries of hydrocarbons than vertical drilling.
Hydraulic fracture (Frac) – A well stimulation method by which fluid (approximately 95-98% water) and proppant (purposely sized particles used to hold open an induced fracture) are injected downhole and into the producing formation at high pressures and rates in order to exceed the rock strength and create a fracture such that the proppant material can be placed into the fracture to enhance the productive capability of the formation.
5
Injection well – A well which is used to inject gas, water, or liquefied petroleum gas under high pressure into a producing formation to maintain sufficient pressure to produce the recoverable reserves.
Joint Operating Agreement or JOA – Any agreement between working interest owners concerning the duties and responsibilities of the operator and rights and obligations of the non-operators.
MBbls – One thousand barrels of crude oil or other liquid hydrocarbons.
MBOE – One thousand barrels of oil equivalent, determined using a ratio of six Mcf of natural gas equal to one barrel of oil equivalent.
MMBtu – One million Btu.
Mcf – One thousand cubic feet.
MMcf – One million cubic feet.
Net acres or net wells – The sum of the fractional working interests owned in gross acres or gross wells.
NGLs – Natural gas liquids measured in barrels.
NYMEX – The New York Mercantile Exchange.
Plugging and abandonment or P&A – Refers to the sealing off of fluids in the strata penetrated by a well so that the fluids from one stratum will not escape into another stratum or to the surface.
PV-10 – The present value of estimated future revenues, discounted at 10% annually, to be generated from the production of proved reserves determined in accordance with SEC guidelines, net of estimated production and future development costs, using prices and costs as of the date of estimation without future escalation, without giving effect to (i) estimated future abandonment costs, net of the estimated salvage value of related equipment, (ii) non-property related expenses such as general and administrative expenses, debt service and future income tax expense, or (iii) depreciation, depletion and amortization.
Productive well – A well that is found to be capable of producing hydrocarbons in sufficient quantities such that proceeds from the sale of such production exceeds production expenses and taxes.
Proppant – A solid material, typically treated sand or man-made ceramic materials, designed to keep an induced hydraulic fracture open, during or following a fracturing treatment.
Proved developed nonproducing reserves or PDNP – Hydrocarbons in a potentially producing horizon penetrated by a wellbore, the production of which has been postponed pending installation of surface equipment or gathering facilities, or pending the production of hydrocarbons from another formation penetrated by the wellbore. The hydrocarbons are classified as proved developed but nonproducing reserves.
Proved developed producing reserves or PDP – Reserves that can be expected to be recovered through existing wells with existing equipment and operating methods.
Proved developed reserves or PD – The estimated quantities of oil, natural gas and NGLs that geological and engineering data demonstrate with reasonable certainty to be commercially recoverable in future years from known reservoirs under existing economic and operating conditions.
Proved reserves – Those quantities of oil and natural gas, which, by analysis of geoscience and engineering data, can be estimated with reasonable certainty to be economically producible—from a given date forward, from known reservoirs, and under existing economic conditions, operating methods, and government regulations—prior to the time at which contracts providing the right to operate expire, unless evidence indicates that renewal is reasonably certain, regardless of whether deterministic or probabilistic methods are used for the estimation. The project to extract the hydrocarbons must have commenced or the operator must be reasonably certain that it will commence the project within a reasonable time. The area of the reservoir considered as proved includes (i) the area identified by drilling and limited by fluid contacts, if any, and (ii) adjacent undrilled portions of the reservoir that can, with reasonable certainty, be judged to be continuous with it and to contain economically producible oil or gas on the basis of available geoscience and engineering data. In the absence of data on fluid contacts, proved quantities in a reservoir are limited by the lowest
6
known hydrocarbons (“LKH”), as seen in a well penetration unless geoscience, engineering, or performance data and reliable technology establishes a lower contact with reasonable certainty. Where direct observation from well penetrations has defined a highest known oil (“HKO”), elevation and the potential exists for an associated gas cap, proved oil reserves may be assigned in the structurally higher portions of the reservoir only if geoscience, engineering, or performance data and reliable technology establish the higher contact with reasonable certainty. Reserves which can be produced economically through application of improved recovery techniques (including, but not limited to, fluid injection) are included in the proved classification when (i) successful testing by a pilot project in an area of the reservoir with properties no more favorable than in the reservoir as a whole, the operation of an installed program in the reservoir or an analogous reservoir, or other evidence using reliable technology establishes the reasonable certainty of the engineering analysis on which the project or program was based; and (ii) the project has been approved for development by all necessary parties and entities, including governmental entities. Existing economic conditions include prices and costs at which economic producibility from a reservoir is to be determined. The price shall be the average price during the 12-month period prior to the ending date of the period covered by the report, determined as an unweighted arithmetic average of the first-day-of-the-month price for each month within such period, unless prices are defined by contractual arrangements, excluding escalations based upon future conditions.
Proved undeveloped reserves or PUD – Proved reserves that are expected to be recovered from new wells on undrilled acreage or from existing wells where a relatively major expenditure is required for recompletion. Reserves on undrilled acreage shall be limited to those directly offsetting development spacing areas that are reasonably certain of production when drilled, unless evidence using reliable technology exists that establishes reasonable certainty of economic producibility at greater distances. Undrilled locations can be classified as having undeveloped reserves only if a development plan has been adopted indicating that they are schedule to be drilled within five years, unless specific circumstances justify a longer time. Under no circumstances shall estimates for proved undeveloped reserves be attributable to any acreage for which an application of fluid injection or other improved recovery technique is contemplated, unless such techniques have been proved effective by actual projects in the same reservoir or an analogous reservoir, or by other evidence using reliable technology establishing reasonable certainty.
Recompletion – The completion for production of an existing well bore in another formation from that in which the well has been previously completed.
Re-engineering – A process involving a comprehensive review of the mechanical conditions associated with wells and equipment in producing fields. Our re-engineering practices typically result in a capital expenditure plan, which is implemented over time, to workover (see below) and re-complete wells and modify down-hole artificial lift equipment and surface equipment and facilities. The programs are designed specifically for individual fields to increase and maintain production, reduce down-time and mechanical failures, lower per-unit operating expenses, and therefore, improve field economics.
Reservoir – A permeable underground formation containing a natural accumulation of producible oil and/or natural gas that is confined by impermeable rock or water barriers and is individual and separate from other reservoirs.
Royalty interest – An interest in an oil and natural gas property entitling the owner to a share of oil or natural gas production free of costs of production.
Shut-in reserves – Those reserves expected to be recovered from completion intervals that were open at the time the reserve was estimated but were not producing due to market conditions, mechanical difficulties or because production equipment or pipelines were not yet installed. These reserves are included in the PDNP category in our reserve report.
Undeveloped acreage – Lease acreage on which wells have not been drilled or completed to a point that would permit the production of commercial quantities of oil and natural gas regardless of whether such acreage contains proved reserves.
Working interest or WI – The ownership interest, generally defined in a JOA, that gives the owner the right to drill, produce and/or conduct operating activities on the property and share in the sale of production, subject to all royalties, overriding royalties and other burdens and obligates the owner of the interest to share in all costs of exploration, development operations and all risks in connection therewith.
Workover – Operations on a producing well to restore or increase production.
7
Overview
Earthstone Energy, Inc. (together with our consolidated subsidiaries, the “Company,” “our,” “we,” “us,” “Earthstone” or similar terms), a Delaware corporation formed in 1969, is a growth-oriented independent oil and natural gas exploration and production company focused on the acquisition, development, exploration and production of onshore, crude oil and natural gas reserves. Our strategy, which is discussed in greater detail below, is to deliver competitive and sustainable rates of return to our stockholders by developing and acquiring oil and natural gas reserves through an active and diversified program that includes the acquisition, drilling and development of undeveloped leases, purchases of reserves and exploration activities that currently involve oil-weighted projects.
Our operations are all in the upstream segment of the oil and natural gas industry and are conducted onshore in the United States. Our asset portfolio currently includes activities in the Eagle Ford trend of south Texas and in the Williston Basin of North Dakota and Montana. These regions are a focus for us, as well as other areas in Texas. We also own other operated and non-operated properties in east and south Texas and eastern Oklahoma, which may be divested in the future. We have approximately 21,500 net leasehold acres in the Eagle Ford trend of south Texas, including 18,600 net leasehold acres in the crude oil window in Fayette, Gonzales and Karnes Counties, Texas, and 2,900 net leasehold acres located in the natural gas and condensate window in La Salle County. We serve as the operator for substantially all of our Fayette, Gonzales and Karnes County acreage with working interests ranging from 33% to 50% and we are a non-operator with respect to our La Salle County acreage with working interests ranging typically 10% to 15%. We are also non-operator with respect to the majority of our properties in the Williston Basin. We continuously evaluate opportunities to expand our acreage and our producing assets through acquisitions. Our successful acquisition of assets will depend on the opportunities and the financing alternatives available to us at the time we consider such opportunities.
Our corporate headquarters is located in The Woodlands, Texas. We also have an operating office in Denver, Colorado and two field offices in south Texas. Our common stock is traded on the NYSE MKT under the symbol ESTE.
Recent Developments
Acquisitions
On December 16, 2015, we entered into an Arrangement Agreement (the “Arrangement Agreement”), among Lynden Energy Corp., a corporation existing under the laws of British Columbia, Canada (“Lynden”), Earthstone and 1058286 B.C. Ltd., a company organized under the laws of British Columbia, Canada and wholly-owned subsidiary of Earthstone (“Merger Sub”), pursuant to which Merger Sub will acquire all of the outstanding shares of common stock of Lynden (the “Lynden Shares”) and as an integral part of such acquisition, Merger Sub and Lynden will amalgamate to continue as one corporate entity with Lynden surviving the amalgamation as part of a plan of arrangement (the “Transaction”). Under the Arrangement Agreement, the terms of which were unanimously approved by the Boards of Directors of Earthstone, Lynden and Merger Sub, Earthstone will issue approximately 3.7 million shares of its common stock, (“Earthstone Common Stock”), to Lynden stockholders.
Under the Arrangement Agreement, Lynden stockholders will receive 0.02842 shares of Earthstone Common Stock in exchange for each share of Lynden common stock held. Following the Transaction, stockholders of Earthstone and Lynden are expected to own approximately 79% and 21%, respectively, of the combined company on a fully diluted basis. The Transaction is expected to close in the second quarter of 2016.
On December 19, 2014, we acquired three operating subsidiaries of Oak Valley Resources, LLC, a privately-held Delaware limited liability company (“OVR”), in exchange for shares of our common stock (the “Exchange”), which resulted in a change of control. Pursuant to the Exchange Agreement, OVR contributed to us the membership interests of its three subsidiaries, Earthstone Operating, LLC (formerly Oak Valley Operating, LLC) (“OVO”), EF Non-Op, LLC (“EF Non-Op”) and Sabine River Energy, LLC (“Sabine”), each a Texas limited liability company (collectively “Oak Valley”), in exchange for approximately 9.124 million shares, representing 84% of our common stock. The Exchange was accounted for as a reverse acquisition whereby Oak Valley was considered the acquirer for accounting purposes. All historical financial information contained in this report is that of Oak Valley. Upon the closing of the Exchange, we changed our fiscal year from March 31 to December 31 in order for our fiscal year end to correspond with the fiscal year end of OVR and its subsidiaries.
Immediately following the Exchange, we acquired an additional 20% undivided ownership interest in certain crude oil and natural gas properties located in Fayette and Gonzales Counties, Texas, in exchange for the issuance of approximately 2.957 million shares of our common stock (the “Contribution Agreement”) to Flatonia Energy, LLC (“Flatonia”), increasing our ownership in these properties from a 30% undivided ownership to a 50% undivided ownership interest. As a result of the share issuance to Flatonia, OVR’s ownership in us decreased from 84% to 66%.
8
For further discussion of the Exchange and the Contribution Agreement, see Note 3 Acquisitions and Divestitures within the Notes to the Consolidated Financial Statements included in Item 8 of this report.
Our Business Strategy
We pursue a value-driven growth strategy focused on projects that we believe will generate strong and predictable rates of return and increases in stockholder value. Although we have significant non-operated properties, we believe that we should be the operator of the majority of our properties in order to control costs and direct the efficient development of such properties in an effort to optimize investment returns and profitability. We also believe that a reasonable level of diversification in our asset base is preferable to that of a single basin focused company as it may provide us the ability to take advantage of regional changes in realized prices, service costs, service availability and numerous other factors that may affect the cost-efficient and economic development of our assets. Management concentrates on building production, reserves and cash flows while seeking to expand our undeveloped acreage and drilling inventory in select targeted areas. Further expansion of our asset base will be achieved through cost efficient development, exploitation and operation of our current assets and acreage and through additional leasing, acquisitions, development drilling and exploration activities, currently directed toward oil-weighted projects. Finally, management intends to pursue corporate and asset acquisition opportunities.
Our business strategy includes the following:
|
|
· |
pursuing value-accretive corporate merger and acquisition opportunities; |
|
|
· |
expanding our acreage positions and drilling inventory in our areas of primary interest through acquisitions and farm-in opportunities, with an emphasis on operated positions; |
|
|
· |
pending adequate commodity prices, continuing the cost-effective development and exploitation of existing acreage positions with a particular attention to properties located in the Eagle Ford, Austin Chalk, Bakken and Three Forks formations; |
|
|
· |
generating additional development projects in our areas of primary interest; |
|
|
· |
selectively divesting non-core assets in order to streamline operations and utilize capital and human resources most effectively; and |
|
|
· |
obtaining additional capital, as available and needed, through the issuance of equity and debt securities or by soliciting industry or financial participants to jointly develop and/or acquire assets. |
Our fundamental operating and technical strategy is complemented by our focus on increasing stockholder value by:
|
|
· |
maximizing profit margins; |
|
|
· |
controlling capital expenditures and operating and administrative costs; |
|
|
· |
promoting industry or institutional participants into projects to manage risk, enhance rates of return and lower net finding and development costs; and |
|
|
· |
maintaining a sound capital structure. |
Management believes its strategy is appropriate because it:
|
|
· |
addresses multiple risks of oil and gas operations while providing equity holders with upside potential; and |
|
|
· |
results in “staying power,” which management believes is essential to mitigate the adverse impacts of historically volatile commodity prices and financial markets. |
Our Operations
We are the operator of properties containing approximately 67% of our proved oil and natural gas reserves and 73% of our proved PV-10 as of December 31, 2015. As operator, we are able to directly influence exploration, development and production of operations of our operating properties. Our producing properties have reasonably predictable production profiles and cash flows, subject to commodity price fluctuations. Our status as an operator has allowed us to pursue the development of undeveloped acreage, further develop existing properties and generate new projects that we believe have the potential to increase stockholder value.
As is common in the industry, we participate in non-operated properties on a selective basis. Decisions to participate in non-operated properties are dependent upon the technical and economic nature of the projects and the operating expertise and financial standing of the operators.
9
Description of Major Properties
The following is a brief description of our primary oil and natural gas properties and current focus areas. We also own operated and non-operated properties located in east and south Texas, and eastern Oklahoma.
Fayette County, Texas and Gonzales County, Texas
Operated Eagle Ford
As of December 31, 2015, we accumulated approximately 38,000 gross (18,600 net) leasehold acres in Gonzales, Fayette and Karnes Counties, Texas. The acreage is located in the crude oil window of the Eagle Ford shale trend of South Texas and is prospective for the Eagle Ford, Austin Chalk, Upper Eagle Ford, Buda, Wilcox and Edwards formations. We serve as the operator with a 50% undivided ownership interest in substantially all of the acreage.
As of December 31, 2015, we operated 62 gross Eagle Ford wells and eight gross Austin Chalk wells and had non-operated interests in two gross producing Eagle Ford wells and one gross producing Austin Chalk well. Twelve gross Eagle Ford wells and one upper Austin Chalk well were in the process of being drilled or were waiting on completion at December 31, 2015. Our plan is to complete four Eagle Ford wells and one upper Austin Chalk well during 2016. We have identified a total of approximately 220 gross Eagle Ford drilling locations in our acreage. The number of Eagle Ford locations could potentially increase subject to future down spacing initiatives. In addition, because our acreage position is prospective for the Austin Chalk, Upper Eagle Ford, Buda, Wilcox and Edwards formations, we may have additional future economic locations. The majority of our acreage is covered by a 173 square mile 3-D seismic survey, which is being used to develop the Eagle Ford and identify Austin Chalk locations and other economic opportunities.
We are currently budgeting $4.5 million to $6.0 million per well to drill and complete Eagle Ford wells with completed lateral lengths of approximately 4,500-7,000 feet, and $4.0 million to $4.5 million per well to drill and complete Austin Chalk wells with lateral lengths of approximately 13,000 feet.
Non-Operated Eagle Ford
We have a non-operated position in approximately 25,400 gross acres in two areas within the Hawkville Field in La Salle County, Texas. The acreage is operated by BHP Billiton and Lewis Petro Properties, Inc. and is prone to natural gas and condensate produced from the Eagle Ford formation. The two areas are summarized below:
|
|
a) |
White Kitchen – We have a 15% working interest in approximately 7,100 gross acres, all of which is held by production. As of December 31, 2015, 30 gross wells were producing, and we have identified approximately 40 additional drilling locations. |
|
|
b) |
Martin Ranch – We have a 10% working interest in approximately 18,300 gross acres. As of December 31, 2015, 34 gross wells were producing, and we have identified approximately 140 potential drilling locations in the acreage. |
Williston Basin
We have a non-operated position in approximately 10,900 net acres in the Williston Basin of North Dakota and Montana. At present, our most active area within the basin is the Banks Field in McKenzie County, North Dakota. In the Banks Field, we have an average working interest of 4.1% in 77 horizontal Bakken/Three Forks producing wells that are primarily operated by Statoil. We have an additional 27 wells waiting on completion in the Banks Field. We have identified approximately 140 potential drilling locations which are in existing producing units throughout the Bakken/Three Forks play.
Competition
The domestic oil and natural gas business is intensely competitive in the exploration for and acquisition of reserves and in the producing and marketing of oil and natural gas production. Our competitors include national oil companies, major oil and natural gas companies, independent oil and natural gas companies, individual producers, natural gas marketers, and major pipeline companies, as well as participants in other industries supplying energy and fuel to consumers.
Seasonality of Business
Weather conditions affect the demand for, and prices of, natural gas and can also delay oil and natural gas drilling activities, disrupting our overall business plans. Demand for natural gas is typically higher during the winter, resulting in higher natural gas prices for our natural gas production during our first and fourth fiscal quarters. Due to these seasonal fluctuations, our results of operations for individual quarterly periods may not be indicative of the results that we may realize on an annual basis.
10
Oil and natural gas exploration and development involves a high degree of risk, which even a combination of experience, knowledge and careful evaluation may not be able to overcome. There is no assurance that we will discover or acquire additional oil and natural gas in commercial quantities. Oil and natural gas operations also involve the risk that well fires, blowouts, equipment failure, human error and other events may cause accidental leakage or spills of toxic or hazardous materials, such as petroleum liquids or drilling fluids into the environment, or cause significant injury to persons or property. In such event, substantial liabilities to third parties or governmental entities may be incurred, the satisfaction of which could substantially reduce our available cash and possibly result in loss of oil and natural gas properties. Such hazards may also cause damage to or destruction of wells, producing formations, production facilities and pipeline or other processing facilities.
As is common in the oil and natural gas industry, we do not insure fully against all risks associated with our business either because such insurance is not available or because we believe the premium costs are prohibitive. A loss not fully covered by insurance could have a material effect on our operating results, financial position or cash flows. For further discussion of risks see Item 1A. Risk Factors of this report.
Title to Properties
We believe that the title to our oil and natural gas properties is good and defensible in accordance with standards generally accepted in the oil and natural gas industry, subject to such exceptions which, in our opinion, are not so material as to detract substantially from the use or value of such properties. Our properties are typically subject, in one degree or another, to one or more of the following:
|
|
· |
royalties and other burdens and obligations, express or implied, under oil and natural gas leases; |
|
|
· |
overriding royalties and other burdens created by us or our predecessors in title; |
|
|
· |
a variety of contractual obligations (including, in some cases, development obligations) arising under operating agreements, farmout agreements, production sales contracts and other agreements that may affect the properties or their titles; |
|
|
· |
back-ins and reversionary interests existing under purchase agreements and leasehold assignments; |
|
|
· |
liens that arise in the normal course of operations, such as those for unpaid taxes, statutory liens securing obligations to unpaid suppliers and contractors and contractual liens under operating agreements; as well as pooling, unitization and communitization agreements, declarations and orders; and |
|
|
· |
easements, restrictions, rights-of-way and other matters that commonly affect property. |
To the extent that such burdens and obligations affect our rights to production revenues, they have been taken into account in calculating our net revenue interests and in estimating the size and value of our reserves. We believe that the burdens and obligations affecting our properties are conventional in the industry for properties of the kind that we own.
Regulations
All of the jurisdictions in which we own or operate producing oil and natural gas properties have statutory provisions regulating the exploration for and production of oil and natural gas, including provisions related to permits for the drilling of wells, bonding requirements to drill or operate wells, the location of wells, the method of drilling and casing wells, the surface use and restoration of properties upon which wells are drilled, sourcing and disposal of water used in the drilling and completion process, and the plugging and abandonment of wells. Our operations are also subject to various conservation laws and regulations. These laws and regulations govern the size of drilling and spacing units, the density of wells that may be drilled in oil and natural gas properties and the unitization or pooling of oil and natural gas properties. In this regard, some states allow the forced pooling or integration of land and leases to facilitate exploration while other states rely primarily or exclusively on voluntary pooling of land and leases. In areas where pooling is primarily or exclusively voluntary, it may be difficult to form spacing units and therefore difficult to develop a project if the operator owns less than 100% of the leasehold. In addition, state conservation laws establish maximum rates of production from oil and natural gas wells, generally prohibit the venting or flaring of natural gas, and impose specified requirements regarding the ratability of production. On some occasions, tribal and local authorities have imposed moratoria or other restrictions on exploration and production activities pending investigations and studies addressing potential local impacts of these activities before allowing oil and natural gas exploration and production to proceed.
The effect of these regulations is to limit the amount of oil and natural gas that we can produce from our wells and to limit the number of wells or the locations at which we can drill, although we can apply for exceptions to such regulations or to have reductions in well spacing. Failure to comply with applicable laws and regulations can result in substantial penalties. The regulatory burden on the industry increases the cost of doing business and affects profitability. Moreover, each state generally imposes a production or severance tax with respect to the production and sale of oil, natural gas and natural gas liquids within its jurisdiction.
11
Our operations are subject to stringent federal, state and local laws regulating the discharge of materials into the environment or otherwise relating to health and safety or the protection of the environment. Numerous governmental agencies, such as the United States Environmental Protection Agency, commonly referred to as the EPA, issue regulations to implement and enforce these laws, which often require difficult and costly compliance measures. Among other things, environmental regulatory programs typically govern the permitting, construction and operation of a facility. Many factors, including public perception, can materially impact the ability to secure an environmental construction or operation permit. Failure to comply with environmental laws and regulations may result in the assessment of substantial administrative, civil and criminal penalties, as well as the issuance of injunctions limiting or prohibiting our activities. In addition, some laws and regulations relating to protection of the environment may, in certain circumstances, impose strict liability for environmental contamination, which could result in liability for environmental damages and cleanup costs without regard to negligence or fault on our part.
Beyond existing requirements, new programs and changes in existing programs, may address various aspects of our business including naturally occurring radioactive materials, oil and natural gas exploration and production, air emissions, waste management, and underground injection of waste material. Environmental laws and regulations have been subject to frequent changes over the years, and the imposition of more stringent requirements could have a material adverse effect on our financial condition and results of operations. The following is a summary of the more significant existing environmental, health and safety laws and regulations to which our business operations are subject and for which compliance in the future may have a material adverse impact on our capital expenditures, earnings and competitive position.
Hazardous Substances and Wastes
The federal Comprehensive Environmental Response, Compensation, and Liability Act, referred to as CERCLA or the Superfund law, and comparable state laws impose liability, without regard to fault, on certain classes of persons that are considered to be responsible for the release of a hazardous substance into the environment. These persons may include the current or former owner or operator of the disposal site or sites where the release occurred and companies that disposed or arranged for the disposal of hazardous substances that have been released at the site. Under CERCLA, these persons may be subject to joint and several liability for the costs of investigating and cleaning up hazardous substances that have been released into the environment, for damages to natural resources and for the costs of some health studies. In addition, it is not uncommon for neighboring landowners and other third parties to file claims for personal injury and property damage allegedly caused by hazardous substances or other pollutants released into the environment.
Under the federal Solid Waste Disposal Act, as amended by the Resource Conservation and Recovery Act of 1976, referred to as RCRA, most wastes generated by the exploration and production of oil and natural gas are not regulated as hazardous wastes. Periodically, however, there are proposals to lift the existing exemption for oil and natural gas wastes and reclassify them as hazardous wastes. If such proposals were to be enacted, they could have a significant impact on our operating costs, as well as the oil and natural gas industry in general. In the ordinary course of our operations moreover, some wastes generated in connection with our exploration and production activities may be regulated as solid waste under RCRA, as hazardous waste under existing RCRA regulations or as hazardous substances under CERCLA. From time to time, releases of materials or wastes have occurred at locations we own or at which we have operations. These properties and the materials or wastes released thereon may be subject to CERCLA, RCRA and analogous state laws. Under these laws, we have been and may be required to remove or remediate such materials or wastes.
Water Discharges
Our operations are also subject to the federal Clean Water Act and analogous state laws. Under the Clean Water Act, the EPA has adopted regulations concerning discharges of storm water runoff. This program requires covered facilities to obtain individual permits, or seek coverage under a general permit. Some of our properties may require permits for discharges of storm water runoff. We believe that we will be able to obtain, or be included under, these permits, where necessary, and make minor modifications to existing facilities and operations that would not have a material effect on us. The Clean Water Act and similar state acts regulate other discharges of wastewater, oil, and other pollutants to surface water bodies, such as lakes, rivers, wetlands, and streams. Failure to obtain permits for such discharges could result in civil and criminal penalties, orders to cease such discharges, and costs to remediate and pay natural resources damages. These laws also require the preparation and implementation of Spill Prevention, Control, and Countermeasure Plans in connection with on-site storage of significant quantities of oil.
Our oil and natural gas production also generates salt water, which we dispose of by underground injection. The federal Safe Drinking Water Act (“SDWA”), the Underground Injection Control (“UIC”) regulations promulgated under the SDWA and related state programs regulate the drilling and operation of salt water disposal wells. The EPA directly administers the UIC program in some states, and in others it is delegated to the state for administering. Permits must be obtained before drilling salt water disposal wells, and casing integrity monitoring must be conducted periodically to ensure the casing is not leaking salt water to groundwater. Contamination of groundwater by oil and natural gas drilling, production, and related operations may result in fines, penalties, and
12
remediation costs, among other sanctions and liabilities under the SDWA and state laws. In addition, third party claims may be filed by landowners and other parties claiming damages for alternative water supplies, property damages, and bodily injury.
Hydraulic Fracturing
Our completion operations are subject to regulation, which may increase in the short- or long-term. In particular, the well completion technique known as hydraulic fracturing is used to stimulate production of natural gas and oil has come under increased scrutiny by the environmental community, and local, state and federal jurisdictions. Hydraulic fracturing involves the injection of water, sand and additives under pressure, usually down casing that is cemented in the wellbore, into prospective rock formations at depth to stimulate oil and natural gas production.
Under the direction of Congress, the EPA has undertaken a study of the effect of hydraulic fracturing on drinking water and groundwater. The EPA has also announced its plan to propose pre-treatment standards under the Clean Water Act for wastewater discharges from shale hydraulic fracturing operations. Congress may consider legislation to amend the SDWA to require the disclosure of chemicals used by the oil and natural gas industry in the hydraulic fracturing process. Certain states, including Colorado, Utah and Wyoming, have issued similar disclosure rules. Several environmental groups have also petitioned the EPA to extend toxic release reporting requirements under the Emergency Planning and Community Right-to-Know Act to the oil and natural gas extraction industry.
Air Emissions
The federal Clean Air Act and comparable state laws regulate emissions of various air pollutants through permitting programs and the imposition of other requirements. In addition, the EPA has developed and continues to develop stringent regulations governing emissions of toxic air pollutants at specified sources, including oil and natural gas production. Federal and state regulatory agencies can impose administrative, civil and criminal penalties for non-compliance with air permits or other requirements of the federal Clean Air Act and associated state laws and regulations. Our operations, or the operations of service companies engaged by us, may in certain circumstances and locations be subject to permits and restrictions under these statutes for emissions of air pollutants.
In 2012, the EPA issued four new regulations for the oil and natural gas industry, including: a new source performance standard for volatile organic compounds (“VOCs”); a new source performance standard for sulfur dioxide; an air toxics standard for oil and natural gas production; and an air toxics standard for natural gas transmission and storage. The final rule includes the first federal air standards for natural gas wells that are hydraulically fractured, or refractured, as well as requirements for several sources, such as storage tanks and other equipment, and limits methane emissions from these sources. Compliance with these regulations has imposed additional requirements and costs on our operations.
In October 2015, the EPA announced that it was lowering the primary national ambient air quality standards (“NAAQS”) for ozone from 75 parts per billion to 70 parts per billion. Implementation will take place over several years; however, the new standard could result in a significant expansion of ozone nonattainment areas across the United States, including areas in which we operate. Oil and natural gas operations in ozone nonattainment areas would likely be subject to increased regulatory burdens in the form of more stringent emission controls, emission offset requirements, and increased permitting delays and costs.
Climate Change
Studies over recent years have indicated that emissions of certain gases may be contributing to warming of the Earth’s atmosphere. In response to these studies, governments have been adopting domestic and international climate change regulations that require reporting and reductions of the emission of such greenhouse gases. Methane, a primary component of natural gas, and carbon dioxide, a byproduct of burning oil, natural gas and refined petroleum products, are considered greenhouse gases. Internationally, the United Nations Framework Convention on Climate Change, the Kyoto Protocol and the Paris Agreement address greenhouse gas emissions, and several countries including those comprising the European Union have established greenhouse gas regulatory systems. In the United States, at the state level, many states, either individually or through multi-state regional initiatives, have been implementing legal measures to reduce emissions of greenhouse gases, primarily through the emission inventories, emissions targets, greenhouse gas cap and trade programs or incentives for renewable energy generation, while others have considered adopting such greenhouse gas programs.
At the federal level, the EPA has issued regulations requiring us and other companies to annually report certain greenhouse gas emissions from our oil and natural gas facilities. Beyond its measuring and reporting rules, the EPA has issued an “Endangerment Finding” under section 202(a) of the Clean Air Act, concluding greenhouse gas pollution threatens the public health and welfare of current and future generations. The finding served as the first step to issuing regulations that require permits for and reductions in greenhouse gas emissions for certain facilities.
13
In addition, President Obama released a Strategy to Reduce Methane Emissions in March 2014. Consistent with that strategy, the EPA issued a proposed rule in 2015 that would set additional standards for methane and VOC emissions from oil and natural gas production sources, including hydraulically fractured oil wells and natural gas processing and transmission sources. The EPA intends to issue a final rule in 2016. In addition, the federal Bureau of Land Management (“BLM”) has proposed standards for reducing venting and flaring on public lands. The EPA and BLM actions are part of a series of steps by the Administration that are intended to result by 2025 in a 40-45% decrease in methane emissions from the oil and natural gas industry as compared to 2012 levels. In the courts, several decisions have been issued that may increase the risk of claims being filed by governments and private parties against companies that have significant greenhouse gas emissions. Such cases may seek to challenge air emissions permits that greenhouse gas emitters apply for and seek to force emitters to reduce their emissions or seek damages for alleged climate change impacts to the environment, people, and property.
Any laws or regulations that may be adopted to restrict or reduce emissions of greenhouse gases could require us to incur additional operating costs, such as costs to purchase and operate emissions control systems or other compliance costs, and reduce demand for our products.
The National Environmental Policy Act
Oil and natural gas exploration and production activities may be subject to the National Environmental Policy Act, or NEPA. NEPA requires federal agencies, including the Department of the Interior, to evaluate major agency actions that have the potential to significantly impact the environment. In the course of such evaluations, an agency will prepare an Environmental Assessment that assesses the potential direct, indirect and cumulative impacts of a proposed project and, if necessary, will prepare a more detailed Environmental Impact Statement that may be made available for public review and comment. This process has the potential to delay the development of future oil and natural gas projects.
Threatened and endangered species, migratory birds and natural resources
Various state and federal statutes prohibit certain actions that adversely affect endangered or threatened species and their habitat, migratory birds, wetlands, and natural resources. These statutes include the Endangered Species Act, the Migratory Bird Treaty Act and the Clean Water Act. The United States Fish and Wildlife Service may designate critical habitat areas that it believes are necessary for survival of threatened or endangered species. A critical habitat designation could result in further material restrictions on federal land use or on private land use and could delay or prohibit land access or development. Where takings of or harm to species or damages to wetlands, habitat, or natural resources occur or may occur, government entities or at times private parties may act to prevent or restrict oil and natural gas exploration activities or seek damages for any injury, whether resulting from drilling or construction or releases of oil, wastes, hazardous substances or other regulated materials, and in some cases, criminal penalties may result.
Hazard communications and community right to know
We are subject to federal and state hazard communication and community right to know statutes and regulations. These regulations govern record keeping and reporting of the use and release of hazardous substances, including, but not limited to, the federal Emergency Planning and Community Right-to-Know Act and may require that information be provided to state and local government authorities and the public.
Occupational Safety and Health Act
We are subject to the requirements of the federal Occupational Safety and Health Act and comparable state statues that regulate the protection of the health and safety of workers. In addition, the Occupational Safety and Health Administration’s hazard communication standard requires that information be maintained about hazardous materials used or produced in operations and that this information be provided to employees.
Employees
As of December 31, 2015, we had 50 full-time employees and one part-time employee, 37 of which are management, technical and administrative personnel, and 14 of which are field operations employees. Contract personnel perform some technical and administrative tasks and operate some of our producing fields under the direct supervision of our employees. No employees are covered under a collective bargaining agreement nor are any employees represented by a union. The Company considers all relations with its employees to be good.
14
We lease office space as set forth in the following table:
|
Location |
|
Approximate Size |
|
Lease Expiration Date |
|
Intended Use |
|
The Woodlands, Texas |
|
19,600 sq. ft. |
|
December 31, 2019 |
|
Office |
|
Denver, Colorado |
|
7,000 sq. ft. |
|
April 30, 2018 |
|
Office |
During 2015, aggregate rental payments for our office facilities totaled approximately $0.8 million.
Executive Officers of the Company
|
Name |
|
Age |
|
Position |
|
Frank A Lodzinski |
|
66 |
|
President and Chief Executive Officer |
|
Ray Singleton |
|
65 |
|
Executive Vice President, Northern Region |
|
Robert J. Anderson |
|
54 |
|
Executive Vice President, Corporate Development and Engineering |
|
Steve C. Collins |
|
51 |
|
Executive Vice President, Completions and Operations |
|
Christopher E. Cottrell |
|
55 |
|
Executive Vice President, Land and Marketing and Corporate Secretary |
|
Timothy D. Merrifield |
|
60 |
|
Executive Vice President, Geological and Geophysical |
|
Francis M. Mury |
|
64 |
|
Executive Vice President, Drilling and Development |
|
Neil K. Cohen |
|
33 |
|
Vice President, Finance and Treasurer |
|
G. Bret Wonson |
|
38 |
|
Vice President, Principal Accounting Officer |
Frank A. Lodzinski has served as our Chairman, President and Chief Executive Officer since December 2014. Previously, he served as President and Chief Executive Officer of Oak Valley Resources, LLC from its formation in December 2012 until the closing of its strategic combination with us in December 2014. Prior to his service with Oak Valley Resources, LLC, Mr. Lodzinski was Chairman, President and Chief Executive Officer of GeoResources, Inc. from April 2007 until its merger with Halcón in August 2012 and from September 2012 until December 2012 he conducted pre-formation activities for Oak Valley Resources, LLC. He has over 44 years of oil and gas industry experience. In 1984, he formed Energy Resource Associates, Inc., which acquired management and controlling interests in oil and gas limited partnerships, joint ventures and producing properties. Certain partnerships were exchanged for common shares of Hampton Resources Corporation in 1992, which Mr. Lodzinski joined as a director and President. Hampton was sold in 1995 to Bellwether Exploration Company. In 1996, he formed Cliffwood Oil & Gas Corp. and in 1997, Cliffwood shareholders acquired a controlling interest in Texoil, Inc., where Mr. Lodzinski served as Chief Executive Officer and President. In 2001, Mr. Lodzinski was appointed Chief Executive Officer and President of AROC, Inc., to direct the restructuring and ultimate liquidation of that company. In 2003, AROC completed a monetization of oil and gas assets with an institutional investor and began a plan of liquidation in 2004. In 2004, Mr. Lodzinski formed Southern Bay Energy, LLC, the general partner of Southern Bay Oil & Gas, L.P., which acquired the residual assets of AROC, Inc., and he served as President of Southern Bay Energy, LLC upon its formation. The Southern Bay entities were merged into GeoResources in April 2007. Mr. Lodzinski has served as a director and member of the audit committee of Yuma Energy, Inc. since September 2014. He holds a BSBA degree in Accounting and Finance from Wayne State University in Detroit, Michigan.
Ray Singleton is a petroleum engineer with over 38 years of experience in the oil and gas industry. He has been one of our directors since July 1989 and was our President and Chief Executive Officer from March 1993 until December 2014. Since December 2014, he has served as our Executive Vice President, Northern Region. Mr. Singleton joined us in 1988 as a Production Manager/Petroleum Engineer. From 1983 until 1988, he owned and operated an engineering consulting firm (Singleton & Associates) serving the needs of 40 small oil and gas clients. During this period, he was engaged by the Company on various projects in south Texas and the Rocky Mountain region. Mr. Singleton began his career with Amoco Production Company in 1973 as a production engineer in Texas. He was subsequently employed by the predecessor of Union Pacific Resources as a drilling, completion and production engineer from 1980 to 1983. His professional experience includes acquisition evaluation and economics, reserve engineering and drilling, completion and production engineering in both Texas and the Rocky Mountain region. In addition, he possesses over 20 years of executive experience and has an intimate knowledge of the Company’s legacy Rocky Mountain and south Texas properties. Mr. Singleton received a B.S. degree in Petroleum Engineering from Texas A&M University in 1973, and received an MBA from Colorado State University’s Executive MBA Program in 1992.
Robert J. Anderson is a petroleum engineer with over 29 years of diversified domestic and international oil and gas experience. He has served as our Executive Vice President, Corporate Development and Engineering since December 2014. Previously, he served in a similar capacity with Oak Valley Resources, LLC from March 2013 until the closing of its strategic combination with the Company in December 2014. Prior to joining Oak Valley Resources, LLC, he served from August 2012 to February 2013 as Executive Vice
15
President and Chief Operating Officer of Halcón. Mr. Anderson was employed by GeoResources, Inc. from April 2007 until its merger with Halcón in August 2012, ultimately serving as a director and Executive Vice President, Chief Operating Officer – Northern Region. He was involved in the formation of Southern Bay Energy in September 2004 as Vice President, Acquisitions until its merger with GeoResources in April 2007. From March 2004 to August 2004, Mr. Anderson was employed by AROC, a predecessor company to Southern Bay Energy, as Vice President, Acquisitions and Divestitures. From September 2000 to February 2004, he was employed by Anadarko Petroleum Corporation as a petroleum engineer. In addition, he has worked with major oil companies, including ARCO International/Vastar Resources, and independent oil companies, including Hunt Oil, Hugoton Energy, and Pacific Enterprises Oil Company. His professional experience includes acquisition evaluation, reservoir and production engineering, field development, project economics, budgeting and planning, and capital markets. His domestic acquisition and divestiture experience includes Texas and Louisiana (offshore and onshore), Mid-Continent, and the Rocky Mountain states, and his international experience includes Canada, South America, and Russia. Mr. Anderson has a B.S. degree in Petroleum Engineering from the University of Wyoming and an MBA from the University of Denver.
Steven C. Collins is a petroleum engineer with over 28 years of operations and related experience. He has served as our Executive Vice President, Completions and Operations since December 2014. Previously, he served in a similar capacity with Oak Valley Resources, LLC from its formation in December 2012 until the closing of its strategic combination with the Company in December 2014. Prior to employment by Oak Valley Resources, LLC, he served from August 2012 to November 2012 as a consultant to Halcón. Mr. Collins was employed by GeoResources, Inc. from April 2007 until its merger with Halcón in August 2012 and directed field operations, including well completion, production and workover operations. Prior to employment by GeoResources, he served as Vice President of Operations for Southern Bay, AROC, and Texoil, and as a petroleum and operations engineer at Hunt Oil Company and Pacific Enterprises Oil Company. His experience includes Texas, Louisiana (onshore and offshore), North Dakota, Montana, and the Mid-Continent. Mr. Collins graduated with a B.S. degree in Petroleum Engineering from the University of Texas.
Christopher E. Cottrell has been employed in various aspects of land management and commodity marketing activities since 1983. He has served as our Executive Vice President, Land and Marketing and Corporate Secretary since December 2014. Previously, he served in a similar capacity with Oak Valley Resources, LLC from its formation in December 2012 until the closing of its strategic combination with the Company in December 2014. Prior to employment by Oak Valley Resources, LLC, he was employed by GeoResources, Inc. from April 2007 until its merger with Halcón in August 2012, ultimately serving as Vice President of Land and Marketing, responsible for land and operating contract matters including oil and gas marketing, land and lease records, title and division orders. In addition, he was actively involved in due diligence associated with business development matters. He has held previous roles at AROC, Texoil, Williams Exploration, Ashland Exploration, American Exploration, Belco Energy, and Citation Oil & Gas. Mr. Cottrell graduated with a B.B.A. degree in Petroleum Land Management from the University of Texas.
Timothy D. Merrifield has over 37 years of oil and gas industry experience. He has served as our Executive Vice President, Geology and Geophysics since December 2014. Previously, he served in a similar capacity with Oak Valley Resources, LLC from its formation in December 2012 until the closing of its strategic combination with the Company in December 2014. Prior to employment by Oak Valley Resources, LLC, he served from August 2012 to November 2012 as a consultant to Halcón upon its merger with GeoResources, Inc. in August 2012. From April 2007 to August 2012, Mr. Merrifield led all geology and geophysics efforts at GeoResources. He has held previous roles at AROC, Force Energy, Great Western Resources and other independents. His domestic experience includes Texas, Louisiana (onshore and offshore), North Dakota, Montana, New Mexico, Rocky Mountain States, and the Mid-Continent. In addition, he has international experience in Peru and the East Irish Sea. Mr. Merrifield attended Texas Tech University.
Francis M. Mury has over 42 years of oil and gas industry experience. He has served as our Executive Vice President, Drilling and Development since December 2014. Previously, he served in a similar capacity with Oak Valley Resources, LLC from its formation in December 2012 until the closing of its strategic combination with the Company in December 2014. Prior to employment by Oak Valley Resources, LLC, he was employed by GeoResources, Inc. from April 2007 until its merger with Halcón in August 2012, ultimately serving as an Executive Vice President, Chief Operating Officer–Southern Region. He has held prior roles at AROC, Texoil, Hampton Resources, Wainoco Oil & Gas Company, Diasu Exploration Company, and Texaco, Inc. His experience extends to all facets of petroleum engineering, including reservoir engineering, drilling and production operations, petroleum economics, geology, geophysics, land, and joint operations. Geographical areas of experience include Texas and Louisiana (offshore and onshore), North Dakota, Montana, Mid-Continent, Florida, New Mexico, Oklahoma, Wyoming, Pennsylvania and Michigan. Mr. Mury graduated from Nicholls State University with a degree in Computer Science.
Neil K. Cohen has over 13 years of professional experience. He has served as our Vice President, Finance, and Treasurer since December 2014. Previously, he served in a similar capacity with Oak Valley Resources, LLC from its formation in December 2012 until the closing of its strategic combination with the Company in December 2014. He is primarily responsible for all corporate finance, capital markets, and investor relations activities. Prior to joining Oak Valley Resources, LLC, he served from September 2012 to December 2012 as a consultant to Texoil Energy, Inc. From February 2006 to October 2011, Mr. Cohen was employed by UBS Investment Bank as a member of the Global Energy Group, with exposure to all energy subsectors and a particular focus on mergers and acquisitions and equity and debt financings on behalf of exploration and production companies, and as a member of UBS’ Debt
16
Capital Markets Group, with a particular focus on investment grade bond offerings on behalf of energy, utility, and real estate issuers. He has held previous roles at Merrill Lynch (Debt Capital Markets and Debt Derivatives Finance) and Hess Corporation (Finance). Mr. Cohen graduated with a B.S. degree in Finance from the University of Maryland.
G. Bret Wonson has over 15 years of professional experience. He has served as our Vice President, Principal Accounting Officer since December 2014. Previously, he served in a similar capacity with Oak Valley Resources, LLC from February 2013 until the closing of its strategic combination with the Company in December 2014. Prior to Oak Valley Resources, LLC, he served from August 2012 to February 2013 as Assistant Controller at Halcón upon its merger with GeoResources, Inc. in August 2012. From February 2012 to August 2012 and from April 2008 to November 2010, Mr. Wonson was Corporate Controller and Controller of GeoResources, respectively. From December 2010 to January 2012, he was an Assistant Controller at Valerus Compression. He has held previous roles at Arthur Andersen, Grant Thornton, and BP. Mr. Wonson holds a bachelor’s degree in Accounting from Mississippi State University and a master’s degree in Accounting from the University of Alabama. Mr. Wonson is a Certified Public Accountant in the State of Texas.
There are no arrangements or understandings between any of Messrs. Lodzinski, Singleton, Anderson, Collins, Cottrell, Merrifield, Mury, Cohen and Wonson, or any other person pursuant to which such person was selected as an officer. None of Messrs. Lodzinski, Singleton, Anderson, Collins, Cottrell, Merrifield, Mury, Cohen and Wonson has any family relationship with any director or other executive officer of the Company or any person nominated or chosen by the Company to become a director or executive officer.
Available Information
Our principal executive offices are located at 1400 Woodloch Forest Drive, Suite 300, The Woodlands, Texas 77380. Our telephone number is (281) 298-4246. You can find more information about us at our website located at www.earthstoneenergy.com. Our Annual Report on Form 10-K, our Quarterly Reports on Form 10-Q, our Current Reports on Form 8-K and any amendments to those reports are available free of charge on or through our website, which is not part of this report. These reports are available as soon as reasonably practicable after we electronically file these materials with, or furnish them to, the Securities and Exchange Commission (“SEC”). Information filed with the SEC may be read or copied at the SEC’s Public Reference Room at 100 F Street, N.E., Washington, D.C. 20549. Information on operation of the Public Reference Room may be obtained by calling the SEC at 1-800-SEC-0330. The SEC also maintains a website at www.sec.gov that contains reports, proxy and information statements, and other information regarding issuers that file electronically with the SEC, including us.
17
We are subject to various risks and uncertainties in the course of our business. The following summarizes significant risks and uncertainties that may adversely affect our business, financial condition or results of operations. When considering an investment in our common stock, you should carefully consider the risk factors included below as well as those matters referenced in this report under “Cautionary Statement Concerning Forward-Looking Statements” and other information included and incorporated by reference into this report.
Oil, natural gas and natural gas liquids prices are volatile. The continuing and extended decline in oil, natural gas and natural gas liquids prices since 2014 has adversely affected, and may continue to adversely affect, our business, financial condition and results of operations and may in the future affect our ability to meet our capital expenditure obligations and financial commitments as well as negatively impact our stock price further.
The prices we receive for our oil, natural gas and natural gas liquids production heavily influence our revenue, profitability, access to capital and future rate of growth. Oil, natural gas and natural gas liquids are commodities, and therefore, their prices are subject to wide fluctuations in response to relatively minor changes in supply and demand. Historically, the market for oil, natural gas and natural gas liquids has been volatile, and this volatility exhibited a negative trend in the second half of 2014 which has continued through 2015 and into the first quarter of 2016. This market will likely continue to be volatile in the future. The prices we receive for our production, and the levels of our production, depend on numerous factors beyond our control. These factors include:
|
|
· |
worldwide and regional economic and financial conditions impacting the global supply and demand for oil, natural gas and natural gas liquids; |
|
|
· |
the level of global oil, natural gas and natural gas liquids exploration and production; |
|
|
· |
the level of global oil, natural gas and natural gas liquids supplies, in particular due to supply growth from the United States; |
|
|
· |
foreign and domestic supply capabilities for oil, natural gas and natural gas liquids; |
|
|
· |
the price and quantity of U.S. imports and exports of oil, natural gas, including liquefied natural gas, and natural gas liquids; |
|
|
· |
political conditions in or affecting other oil, natural gas and natural gas liquids-producing countries, including the current conflicts in the Middle East, and conditions in South America, Africa, Ukraine and Russia; |
|
|
· |
actions of the Organization of Petroleum Exporting Countries (“OPEC”) and state-controlled oil companies relating to oil, natural gas and natural gas liquids production and price controls; |
|
|
· |
the extent to which U.S. shale producers become "swing producers" adding or subtracting to the world supply totals of oil, natural gas and natural gas liquids; |
|
|
· |
future regulations prohibiting or restricting our ability to apply hydraulic fracturing to our wells; |
|
|
· |
current and future regulations regarding well spacing; |
|
|
· |
prevailing prices on local oil, natural gas and natural gas liquids price indexes in the areas in which we operate; |
|
|
· |
localized and global supply and demand fundamentals and transportation availability; |
|
|
· |
weather conditions; |
|
|
· |
technological advances affecting energy consumption; |
|
|
· |
the price and availability of alternative fuels; and |
|
|
· |
domestic, local and foreign governmental regulation and taxes. |
Lower oil, natural gas and natural gas liquids prices have and will continue to reduce our cash flows and borrowing ability. We may be unable to obtain needed capital or financing on satisfactory terms, which could lead to a decline in our oil, natural gas and natural gas liquids reserves as existing reserves are depleted. A continuing decrease in oil, natural gas and natural gas liquids prices could render uneconomic an even larger portion of our exploration, development and exploitation projects. This has already resulted in us having to make significant downward adjustments to our estimated proved reserves, and we may need to make further downward adjustments in the future. Furthermore, under our credit agreement providing for a senior secured revolving credit facility (the “Credit Agreement”) with BOKF, NA dba Bank of Texas (“Bank of Texas”), as agent and lead arranger, Wells Fargo Bank, National Association (“Wells Fargo”), as syndication agent, and the Lenders signatory thereto (collectively with Bank of Texas and Wells Fargo, the “Lender”), our initial borrowing base is subject to redetermination during May and November of each year, and the Lender has the right to call for an interim determination of the borrowing base under the specified circumstances. We expect that the extended
18
decline in oil, natural gas and natural gas liquids prices will adversely impact our borrowing base in future borrowing base redeterminations, which could trigger repayment obligations under our senior secured revolving credit facility to the extent our outstanding loans under it exceed the redetermined borrowing base and otherwise materially and adversely affect our future business, financial condition, results of operations, liquidity or ability to finance planned capital expenditures. In addition, lower oil, natural gas and natural gas liquids gas prices may cause a further decline in the price of our common stock.
As a result of the sustained decrease in prices for oil, natural gas and natural gas liquids, we have taken and may be required to take further write-downs of the carrying values of our properties.
Accounting rules require that we periodically review the carrying value of our properties for possible impairment. Based on prevailing commodity prices and specific market factors and circumstances at the time of prospective impairment reviews, and the continuing evaluation of development plans, production data, economics and other factors, we have been required to, and may be required to further, write-down the carrying value of our properties. A write-down constitutes a non-cash charge to earnings.
Oil, natural gas and natural gas liquids prices have significantly declined since mid-2014 and have remained low in the first-quarter of 2016. Primarily as a result of these lower prices, our December 31, 2015 estimated proved reserves decreased 9,618 MBOE from our December 31, 2014 reserves. If prices remain at or below current levels and all other factors remain the same, we will likely incur further charges in the future. Such charges could have a material adverse effect on our results of operations for the periods in which they are taken. See Note 5 Asset Impairments to our consolidated financial statements included elsewhere in this report for additional information.
Any significant reduction in our borrowing base under our senior secured revolving credit facility as a result of a periodic borrowing base redetermination or otherwise may negatively impact our liquidity and, consequently, our ability to fund our operations, and we may not have sufficient funds to repay borrowings under this facility or any other obligation if required as a result of a borrowing base redetermination.
Availability under our senior secured revolving credit facility is currently subject to a borrowing base of $80.0 million. The borrowing base is subject to scheduled semiannual (May 1 and November 1) and other elective borrowing base redeterminations. The lenders can unilaterally adjust the borrowing base and the borrowings permitted to be outstanding under this facility. Reductions in estimates of our oil, NGLs and natural gas reserves will result in a reduction in our borrowing base (if prices are kept constant). Given the ongoing decline in commodity prices for oil, natural gas and natural gas liquids, it is likely that reductions in our borrowing base could also arise from other factors, including but not limited to:
|
|
· |
lower commodity prices or production; |
|
|
· |
increased leverage ratios; |
|
|
· |
inability to drill or unfavorable drilling results; |
|
|
· |
changes in oil, natural gas and natural gas liquids reserve engineering; |
|
|
· |
increased operating and/or capital costs; |
|
|
· |
the lenders' inability to agree to an adequate borrowing base; or |
|
|
· |
adverse changes in the lenders' practices (including required regulatory changes) regarding estimation of reserves. |
As of March 9, 2016, we had $11.2 million of borrowings outstanding under our senior secured revolving credit facility. We may make further borrowings under our facility in the future. Any significant reduction in our borrowing base as a result of such borrowing base redeterminations or otherwise will negatively impact our liquidity and our ability to fund our operations and, as a result, would have a material adverse effect on our financial position, results of operation and cash flows. Further, if the outstanding borrowings under the facility were to exceed the borrowing base as a result of any such redetermination, we could be required to repay the excess. We may not have sufficient funds to make such repayments. If we do not have sufficient funds and we are otherwise unable to negotiate renewals of our borrowings or arrange new financing, we may have to sell significant assets. Any such sale could have a material adverse effect on our business and financial results.
Unless we replace our reserves, our reserves and production will decline, which would adversely affect our financial condition, results of operations and cash flows.
Producing oil and natural gas reservoirs generally are characterized by declining production rates that vary depending upon reservoir characteristics and other factors. Decline rates are typically greatest early in the productive life of a well, particularly horizontal wells. Estimates of the decline rate of an oil or natural gas well are inherently imprecise, and are less precise with respect to new or emerging oil and natural gas formations with limited production histories than for more developed formations with established production histories. Our production levels and the reserves that we currently expect to recover from our wells will change if production from our
19
existing wells declines in a different manner than we have estimated and can change under other circumstances. Thus, our future oil and natural gas reserves and production and, therefore, our cash flows and results of operations are highly dependent upon our success in efficiently developing and exploiting our current properties and economically finding or acquiring additional recoverable reserves. We may not be able to develop, find or acquire additional reserves to replace our current and future production at acceptable costs. If we are unable to replace our current and future production, our cash flows and the value of our reserves may decrease, adversely affecting our business, financial condition and results of operations.
Estimates of proved oil and natural gas reserves involve assumptions and any material inaccuracies in these assumptions will materially affect the quantities and the value of our reserves.
This report contains estimates of our proved oil and natural gas reserves. These estimates are based upon various assumptions, including assumptions required by the SEC relating to oil and natural gas prices, drilling and operating expenses, capital expenditures, taxes and availability of funds. The process of estimating oil and natural gas reserves is complex. This process requires significant decisions and assumptions in the evaluation of available geological, geophysical, engineering and economic data for each reservoir. Therefore, these estimates are inherently imprecise.
Actual future production, oil and natural gas prices, revenues, taxes, development expenditures, operating expenses and quantities of recoverable oil and natural gas reserves will vary from those estimated. Any significant variance could materially affect the estimated quantities and the value of our reserves. In addition, we may adjust estimates of proved reserves to reflect production history, results of exploration and development, prevailing oil and natural gas prices and other factors, many of which are beyond our control.
Quantities of proved reserves are estimated based on economic conditions in existence during the period of assessment. Changes to oil, natural gas and natural gas liquids prices in the markets for such commodities may have the impact of shortening the economic lives of certain fields because it becomes uneconomic to produce all recoverable reserves on such fields, which reduces proved property reserves estimates. As of December 31, 2015, negative revisions of 9,484 MBOE of previously estimated proved reserve quantities are primarily attributable to 7,013 MBOE of revisions to proved undeveloped reserves. The primary driver of the revision in proved undeveloped reserves was 124 locations that were previously economic at year-end 2014 SEC prices were uneconomic at the year-end 2015 SEC prices. The remaining negative revision of 2,471 MBOE of proved reserves resulted from the combined effect of SEC prices at year-end 2015, performance and other factors that shortened the economic life of the proved reserves.
Negative revisions in the estimated quantities of proved reserves have the effect of increasing the rates of depletion on the affected properties, which decrease earnings or result in losses through higher depletion expense. These revisions, as well as revisions in the assumptions of future cash flows of these reserves, may also trigger impairment losses on certain properties, which would result in a non-cash charge to earnings. See Note 5 Asset Impairments, to our consolidated financial statements included elsewhere in this report.
At December 31, 2015, approximately 32% of our estimated reserves were classified as proved undeveloped. Recovery of proved undeveloped reserves requires significant capital expenditures and successful drilling operations. The reserve data assumes that we will make significant capital expenditures to develop our reserves. The estimates of these oil and natural gas reserves and the costs associated with development of these reserves have been prepared in accordance with SEC regulations; however, actual capital expenditures will likely vary from estimated capital expenditures, development may not occur as scheduled and actual results may not be as estimated.
The standardized measure of discounted future net cash flows from our proved reserves will not be the same as the current market value of our estimated oil and natural gas reserves.
You should not assume that the standardized measure of discounted future net cash flows from our proved reserves is the current market value of our estimated oil and natural gas reserves. In accordance with SEC requirements in effect at December 31, 2015, 2014 and 2013, we based the discounted future net cash flows from our proved reserves on the 12-month first-day-of-the-month oil and natural gas average prices without giving effect to derivative transactions. Actual future net cash flows from our oil and natural gas properties will be affected by factors such as:
|
|
· |
the actual prices we receive for oil and natural gas; |
|
|
· |
the actual cost of development and production expenditures; |
|
|
· |
the amount and timing of actual production; and |
|
|
· |
changes in governmental regulations or taxation. |
The timing of both our production and our incurrence of expenses in connection with the development and production of oil and natural gas properties will affect the timing and amount of actual future net revenues from proved reserves, and thus their actual present value. In addition, the 10% discount factor we use when calculating standardized measure may not be the most appropriate
20
discount factor based on interest rates in effect from time to time and risks associated with us or the oil and natural gas industry in general. As a corporation, we are treated as a taxable entity for federal income tax purposes and our future income taxes will be dependent on our future taxable income. Actual future prices and costs may differ materially from those used in the present value estimates included in this report which would could have a material effect on the value of our reserves.
If commodity prices decrease to a level such that our future undiscounted cash flows from our properties are less than their carrying value for a significant period of time, then we will be required to incur write-downs of the carrying values of our properties in addition to the significant write-down we incurred in 2015.
Accounting rules require that we periodically review the carrying value of our properties for possible impairment. Based on specific market factors and circumstances at the time of prospective impairment reviews, and the continuing evaluation of development plans, production data, economics and other factors, we may be required to write down the carrying value of our properties. A write-down constitutes a non-cash charge to earnings. We may incur impairment charges in the future, which could have a material adverse effect on our results of operations for the periods in which such charges are taken.
A write-down of the capitalized cost of individual oil and natural gas properties could occur when oil and natural gas prices are low or if we have substantial downward adjustments to our estimated proved oil and natural gas reserves, if operating costs or development costs increase over prior estimates, or if exploratory drilling is unsuccessful. A write-down could adversely affect the trading price of our common stock.
The capitalized costs of our oil and natural gas properties, on a field-by-field basis, may exceed the estimated future net cash flows of that field. If so, we will record impairment charges to reduce the capitalized costs of such field to our estimate of the field’s fair market value. Unproved properties are evaluated at the lower of cost or fair market value. These types of charges will reduce our earnings and stockholders’ equity.
We periodically assess our properties for impairment based on future estimates of proved and non-proved reserves, oil and natural gas prices, production rates and operating, development and reclamation costs based on operating budget forecasts. Once incurred, an impairment charge cannot be reversed at a later date even if we experience increases in the price of oil and/or natural gas or increases in the quantity of our estimated proved reserves.
The potential drilling locations for our future wells that we have tentatively internally identified will be drilled, if at all, over many years. This makes them susceptible to uncertainties that could materially alter the occurrence or timing of their drilling, which in certain instances could prevent production prior to the expiration date of leases for such locations.
Although our management team has established certain potential drilling locations as a part of our long-range planning related to future drilling activities on our existing acreage, our ability to drill and develop these locations depends on a number of uncertainties, including oil, natural gas and natural gas liquids prices, the availability and cost of capital, drilling and production costs, the availability of drilling services and equipment, drilling results (including the impact of increased horizontal drilling and longer laterals), lease expirations, gathering systems, marketing and pipeline transportation constraints, regulatory approvals and other factors. Because of these uncertain factors, we cannot be certain if the numerous potential drilling locations we have currently identified will ever be drilled to a substantial degree or if we will be able to produce oil, natural gas and natural gas liquids from these or any other potential drilling locations. In addition, unless production is established within the spacing units covering the undeveloped acres on which some of the potential locations are obtained, the leases for such acreage will expire. As such, our actual drilling activities, especially in the long term, may materially differ from those presently anticipated.
Currently, we receive incremental cash flows as a result of our hedging activity. To the extent we are unable to obtain future hedges at attractive prices or our derivative activities are not effective, our cash flows and financial condition may be adversely impacted.
To achieve more predictable cash flows and reduce our exposure to adverse fluctuations in the prices of oil and natural gas, we enter into derivative instrument contracts for a portion of our oil and natural gas production, including swaps, collars, puts and basis swaps. In accordance with applicable accounting principles, we are required to record our derivatives at fair market value, and they are included on our consolidated balance sheet as assets or liabilities and in our consolidated statements of operations as gain (loss) on derivatives. Gain (loss) on derivatives are included in our cash flows from operating activities. Accordingly, our earnings may fluctuate significantly as a result of changes in the fair market value of our derivative instruments. Although our current hedges provide us with a benefit as they are priced above the current depressed prices for oil and natural gas, as these hedges expire, there is significant uncertainty that we will be able to put new hedges in place that will provide us with similar benefit.
21
Derivative instruments also expose us to the risk of financial loss in some circumstances, including when:
|
|
· |
production is less than the volume covered by the derivative instruments; |
|
|
· |
the counter-party to the derivative instrument defaults on its contractual obligations; |
|
|
· |
there is an increase in the differential between the underlying price in the derivative instrument and actual prices received; or |
|
|
· |
there are issues with regard to legal enforceability of such instruments. |
For additional information regarding our hedging activities, please see "Item 7. Management's Discussion and Analysis of Financial Condition and Results of Operations.
The oil and gas industry is highly competitive, and our small size puts us at a disadvantage in competing for resources.
The oil and gas industry is highly competitive. We compete with major integrated and larger independent oil and gas companies for the acquisition of desirable oil and gas properties and leases, for the equipment and services required to develop and operate properties, and in the marketing of oil and gas to end-users. Many competitors have financial and other resources that are substantially greater than ours, which will make any acquisition of acreage or producing properties at economic prices difficult. In addition, many larger competitors may be better able to respond to factors that affect the demand for oil and natural gas production, such as changes in worldwide oil and natural gas prices and levels of production, the cost and availability of alternative fuels and the application of government regulations. Significant competition also exists in attracting and retaining technical personnel, including geologists, geophysicists, engineers, landmen and other specialists, as well as financial and administrative personnel and we may be at a competitive disadvantage to companies with larger financial resources than ours.
A failure to complete additional acquisitions would limit our potential growth.
Our future success is highly dependent on our ability to find, acquire or develop economically recoverable oil and natural gas reserves. Without continued successful acquisition, exploration or development projects, our current oil and natural gas reserves will decline due to continued production activities. Acquiring additional oil and natural gas properties, or businesses that own or operate such properties, when attractive opportunities arise, is an important component of our strategy. If we identify an appropriate acquisition candidate, management may be unable to negotiate mutually acceptable terms with the seller, finance the acquisition or obtain the necessary regulatory approvals. Our limited access to financial resources compared to larger, better capitalized companies may limit our ability to make future acquisitions. If we are unable to complete suitable acquisitions, it will be more difficult to replace and increase our reserves, and an inability to replace our reserves would have a material adverse effect on our financial condition and results of operations.
Acquisitions involve a number of risks, including the risk that we will discover unanticipated liabilities or other problems associated with the acquired business or property.
In assessing potential acquisitions, we will consider information available in the public domain and information provided by the seller. In the event publicly available data is limited, then, by necessity, we may rely to a large extent on information that may only be available from the seller, particularly with respect to drilling and completion costs and practices, geological, geophysical and petrophysical data, detailed production data on existing wells, and other technical and cost data not available in the public domain. Accordingly, the review and evaluation of the business or property to be acquired may not uncover all existing or relevant data, obligations or actual or contingent liabilities that could adversely impact the business or property to be acquired and, hence, could adversely affect us as a result of the acquisition. These issues may be material and could include, among other things, unexpected environmental problems, title defects or other liabilities. If we acquire properties on an “as-is” basis, we will have limited or no remedies against the seller with respect to these types of problems.
The success of any acquisition that we complete will depend on a variety of factors, including our ability to accurately assess the reserves associated with the acquired properties, future oil and natural gas prices and operating costs, potential environmental and other liabilities and other factors. These assessments are often inexact and subjective. As a result, we may not recover the purchase price of a property from the sale of production from the property or recognize an acceptable return from such sales. In addition, we may face greater risks to the extent we acquire properties in areas outside of areas in which we currently operate because we may be less familiar with operating, regulatory and other issues specific to those areas.
22
Our ability to achieve the benefits that we expect from an acquisition will also depend on our ability to efficiently integrate the acquired operations. Management may be required to dedicate significant time and effort to the integration process, which could divert its attention from other business concerns. The challenges involved in the integration process may include retaining key employees and maintaining employee morale, addressing differences in business cultures, processes and systems and developing internal expertise regarding the acquired properties.
We may incur substantial losses and be subject to substantial liability claims as a result of our oil and natural gas operations and drilling operations.
Oil and natural gas exploration, drilling and production activities are subject to numerous significant operating risks, including the possibility of:
|
|
· |
unanticipated, abnormally pressured formations; |
|
|
· |
mechanical difficulties, such as stuck drilling and service tools and casing collapses; |
|
|
· |
blowouts, fires and explosions; |
|
|
· |
personal injuries and death; |
|
|
· |
uninsured or underinsured losses; and |
|
|
· |
environmental hazards, such as uncontrollable flows of oil, natural gas, brine, well fluids, toxic gas or other pollution into the environment, including groundwater contamination. |
Any of these operating hazards could cause damage to properties, reduced cash flows, serious injuries, fatalities, oil spills, discharge of hazardous materials, remediation and clean-up costs and other environmental damages, which could expose us to liabilities. Although we believe we are adequately insured for replacement costs of our wells and associated equipment, the payment of any of these liabilities could reduce the funds available for exploration, development, and acquisition, or could result in a loss of our properties.
The nature of our business and assets will expose us to significant compliance costs and liabilities.
Our operations involving the exploration and production of hydrocarbons are subject to stringent federal, state, and local laws and regulations governing the discharge of materials into the environment. Our operations are also subject to laws and regulations relating to protection of the environment, operational safety, and related employee health and safety matters. Laws and regulations applicable to us include those relating to the following:
|
|
· |
land use restrictions; |
|
|
· |
delivery of our oil and natural gas to market; |
|
|
· |
drilling bonds and other financial responsibility requirements; |
|
|
· |
spacing of wells; |
|
|
· |
emissions into the air; |
|
|
· |
unitization and pooling of properties; |
|
|
· |
habitat and endangered species protection, reclamation and remediation; |
|
|
· |
containment and disposal of hazardous substances, oil field waste and other waste materials; |
|
|
· |
drilling permits; |
|
|
· |
use of saltwater injection wells, which affects the disposal of saltwater from our wells; |
|
|
· |
safety precautions; |
|
|
· |
prevention of oil spills; |
|
|
· |
operational reporting; and |
|
|
· |
taxation and royalties. |
Compliance with all of these laws and regulations are a significant cost of doing business. Failure to comply with applicable laws and regulations may result in the assessment of administrative, civil, and criminal penalties; the imposition of investigatory and remedial
23
liabilities; the issuance of injunctions that may restrict, inhibit or prohibit our operations; and claims of damages to property or persons.
Some environmental laws and regulations impose strict liability. Strict liability means that in some situations we could be exposed to liability for clean-up costs and other damages as a result of conduct that was lawful at the time it occurred or for the conduct of prior operators of properties we acquired or of other third parties. Similarly, some environmental laws and regulations impose joint and several liability, meaning that we could be held responsible for more than our share of a particular reclamation or other obligation, and potentially the entire obligation, where other parties were involved in the activity giving rise to the liability. In addition, we may be required to make large and unanticipated capital expenditures to comply with applicable laws and regulations, for example by installing and maintaining pollution control devices. Similarly, our plugging and abandonment obligations are and will continue to be substantial and may be more than our estimates. It is not possible for us to estimate reliably the amount and timing of all future expenditures related to environmental matters, but they will be material. Environmental risks are generally not fully insurable.
Federal, state and local legislative and regulatory initiatives relating to hydraulic fracturing, natural gas venting and transportation restrictions based on crude oil volatility, could result in increased costs and additional operating restrictions or delays in our production of oil and natural gas and lower returns on our capital investments.
Hydraulic fracturing is a practice that is used to stimulate production of oil and/or natural gas from tight formations. The process involves the injection of water, proppants and chemicals under pressure into the formation to fracture the surrounding rock and stimulate production. The majority of our proved non-producing and proved undeveloped reserves associated with future drilling projects require hydraulic fracturing. If we are unable to apply hydraulic fracturing to our wells or the process is prohibited or significantly regulated or restricted, we would lose the ability to (i) drill and complete the projects for such proved reserves and (ii) maintain the associated acreage, which would have a material adverse effect on our future business, financial condition, operating results and prospects.
The federal Safe Drinking Water Act (“SDWA”) regulates the underground injection of substances through the Underground Injection Control (“UIC”) Program. However, hydraulic fracturing is generally exempt from regulation under the UIC Program, and thus the process is typically regulated by state oil and gas commissions. Nevertheless, the EPA has asserted federal regulatory authority over hydraulic fracturing involving diesel additives under the UIC Program. Under this assertion of authority, the EPA requires facilities to obtain permits to use diesel fuel in hydraulic fracturing operations. The U.S. Energy Policy Act of 2005, which exempts hydraulic fracturing from regulation under the SDWA, prohibits the use of diesel fuel in the fracturing process without a UIC permit. On February 12, 2014, the EPA published a revised UIC Program guidance for oil, NGL and natural gas hydraulic fracturing activities using diesel fuel. The guidance document describes how regulations of Class II wells, which are those wells injecting fluids associated with oil, NGL and natural gas production activities, may be tailored to address the purported unique risks of diesel fuel injection during the hydraulic fracturing process. Although the EPA is not the permitting authority for UIC Class II programs in Texas, where we maintain acreage, the EPA is encouraging state programs to review and consider use of the above-mentioned guidance. Furthermore, legislation has been proposed in recent sessions of Congress to repeal the hydraulic fracturing exemption from the SDWA, provide for federal regulation of hydraulic fracturing, and require public disclosure of the chemicals used in the fracturing process.
On May 9, 2014, the EPA issued an Advanced Notice of Proposed Rulemaking seeking public comment on its intent to develop and issue regulations under the Toxic Substances Control Act regarding the disclosure of information related to the chemicals used in hydraulic fracturing. The public comment period ended on September 18, 2014. The EPA plans to develop a Notice of Proposed Rulemaking by December 2016, which would describe a proposed mechanism, regulatory, voluntary, or a combination of both, to collect data on hydraulic fracturing chemical substances and mixtures.
Also, on March 26, 2015, the Bureau of Land Management (the "BLM") published a final rule governing hydraulic fracturing on federal and Indian lands. The rule requires public disclosure of chemicals used in hydraulic fracturing, implementation of a casing and cementing program, management of recovered fluids, and submission to the BLM of detailed information about the proposed operation, including wellbore geology, the location of faults and fractures, and the depths of all usable water. The rule took effect on June 24, 2015, although it is the subject of several pending lawsuits filed by industry groups and at least four states, alleging that federal law does not give the BLM authority to regulate hydraulic fracturing. On September 30, 2015, the United States District Court for Wyoming issued a preliminary injunction preventing the BLM from implementing the rule nationwide. This order has been appealed to the Tenth Circuit Court of Appeals.
Furthermore, there are certain governmental reviews either underway or being proposed that focus on environmental aspects of hydraulic fracturing practices. For example, the EPA has commenced a study of the potential adverse effects that hydraulic fracturing may have on water quality and public health. In June 2015, the EPA released its draft assessment report for peer review and public comment, finding that, while there are certain mechanisms by which hydraulic fracturing activities could potentially impact drinking water resources, there is no evidence available showing that those mechanisms have led to widespread, systemic impacts. Also, on February 6, 2015, the EPA released a report with findings and recommendations related to public concern about induced seismic
24
activity from disposal wells. The report recommends strategies for managing and minimizing the potential for significant injection-induced seismic events. Other governmental agencies, including the U.S. Department of Energy, the U.S. Geological Survey, and the U.S. Government Accountability Office, have evaluated or are evaluating various other aspects of hydraulic fracturing. These ongoing or proposed studies, depending on their degree of pursuit and any meaningful results obtained, could spur initiatives to further regulate hydraulic fracturing under the SDWA or other regulatory mechanisms.
On August 16, 2012, the EPA published final rules that subject oil, natural gas and natural gas liquids production, processing, transmission, and storage operations to regulation under the New Source Performance Standards ("NSPS") and National Emission Standards for Hazardous Air Pollutants ("NESHAP") programs. The rule includes NSPS Standards for completions of hydraulically fractured gas wells and establishes specific new requirements for emissions from compressors, controllers, dehydrators, storage vessels, natural gas processing plants and certain other equipment. The final rule seeks to achieve a 95% reduction in volatile organic compounds ("VOC") emitted by requiring the use of reduced emission completions or "green completions" on all hydraulically-fractured wells constructed or refractured after January 1, 2015. The EPA received numerous requests for reconsideration of these rules from both industry and the environmental community, and court challenges to the rules were also filed. In response, the EPA has issued, and will likely continue to issue, revised rules responsive to some of these requests for reconsideration. For example, in September 2013 and December 2014, the EPA amended its rules to extend compliance deadlines and to clarify the NSPS. Further, on July 31, 2015, the EPA finalized two updates to the NSPS to address the definition of low-pressure wells and references to tanks that are connected to one another (referred to as connected in parallel). In addition, on September 18, 2015, the EPA published a suite of proposed rules to reduce methane and VOC emissions from oil and gas industry, including new "downstream" requirements covering equipment in the natural gas transmission segment of the industry that was not regulated by the 2012 rules. The public comment period closed on December 4, 2015.
Also, on January 22, 2016, the BLM announced a proposed rule to reduce the flaring, venting and leaking of methane from oil and gas operations on federal and Indian lands. The proposed rule would require operators to use currently available technologies and equipment to reduce flaring, periodically inspect their operations for leaks, and replace outdated equipment that vents large quantities of gas into the air. The rule would also clarify when operators owe the government royalties for flared gas.
These standards, as well as any future laws and their implementing regulations, may require us to obtain pre-approval for the expansion or modification of existing facilities or the construction of new facilities expected to produce air emissions, impose stringent air permit requirements, or utilize specific equipment or technologies to control emissions. Any failure by us to comply with these requirements could subject us to monetary penalties, injunctions, conditions or restrictions on operations and, potentially, criminal enforcement actions.
Some states have adopted, and other states are considering adopting, regulations that could restrict hydraulic fracturing in certain circumstances or otherwise require the public disclosure of chemicals used in the hydraulic fracturing process. For example, pursuant to legislation adopted by the State of Texas in June 2011, the chemical components used in the hydraulic fracturing process, as well as the volume of water used, must be disclosed to the RRC and the public beginning February 1, 2012. Furthermore, on May 23, 2013, the RRC issued the "well integrity rule," which updates the RRC's Rule 13 requirements for drilling, putting pipe down and cementing wells. The rule also includes new testing and reporting requirements, such as (i) the requirement to submit to the RRC cementing reports after well completion or after cessation of drilling, whichever is later, and (ii) the imposition of additional testing on wells less than 1,000 feet below usable groundwater. The "well integrity rule" took effect in January 2014. Additionally, on October 28, 2014, the RRC adopted disposal well rule amendments designed, among other things, to require applicants for new disposal wells that will receive non-hazardous produced water and hydraulic fracturing flowback fluid to conduct seismic activity searches utilizing the U.S. Geological Survey. The searches are intended to determine the potential for earthquakes within a circular area of 100 square miles around a proposed, new disposal well. The disposal well rule amendments, which became effective on November 17, 2014, also clarify the RRC's authority to modify, suspend or terminate a disposal well permit if scientific data indicate a disposal well is likely to contribute to seismic activity. The RRC has used this authority to deny permits for waste disposal wells. In addition to state law, local land use restrictions, such as city ordinances, may restrict or prohibit the performance of well drilling in general and/or hydraulic fracturing in particular.
If these or any other new laws or regulations that significantly restrict hydraulic fracturing are adopted or laws or regulations are adopted to restrict water disposal wells, such laws could make it more difficult or costly for us to drill and produce from conventional or tight formations as well as make it easier for third parties opposing the oil, natural gas and natural gas liquids industry to initiate legal proceedings. In addition, if these matters are regulated at the federal level, fracturing and disposal activities could become subject to additional permitting and financial assurance requirements, more stringent construction specifications, increased monitoring, reporting and recordkeeping obligations, plugging and abandonment requirements and also to attendant permitting delays and potential increases in costs. These developments, as well as new laws or regulations, could cause us to incur substantial compliance costs, and compliance or the consequences of failure to comply by us could have a material adverse effect on our financial condition and results of operations. At this time, it is not possible to estimate the potential impact on our business that may arise if federal or state legislation governing hydraulic fracturing or water disposal wells are enacted into law.
25
Additional legislation or regulation could make it easier for parties opposing the hydraulic fracturing process to initiate legal proceedings based on allegations that specific chemicals used in the fracturing process adversely affect groundwater. There has also been increasing public controversy regarding hydraulic fracturing with regard to use of fracturing fluids, impacts on drinking water supplies, use of water and the potential for adverse impacts to surface water, groundwater and the environment generally. A number of lawsuits and enforcement actions have been initiated in states implicating hydraulic fracturing practices.
Legislation, regulation, litigation and enforcement actions at the federal, state or local level that restrict hydraulic fracturing services could limit the availability and raise the cost of such services, delay completion of new wells and production of our oil, NGLs and natural gas, lower our return on capital expenditures and have a material adverse impact on our business, financial condition, results of operations and cash flows and quantities of oil and natural gas reserves that may be economically produced.
Certain states, including North Dakota where we conduct operations, and have interest in numerous non-operated wells, and intend to expand our presence in the future have adopted, and other states are considering the adoption of, regulations that impose new or more stringent permitting, disclosure and threshold requirements on the intentional or inadvertent venting of natural gas. Such efforts have resulted in the delay of certain drilling and/or completion operations until additional natural gas pipelines are built or sufficient transportation capacity is available. The proliferation of these regulations in North Dakota and in other states may limit or delay our ability to conduct operations in a timely manner.
The state of North Dakota has issued new conditioning standards requiring certain crude oils produced in North Dakota to be conditioned to remove lighter, volatile hydrocarbons, and thereby make the oil safer to transport by railroad. The new standards seek to address safety concerns stemming from train derailments in U.S. and Canada. The new standard establishes a goal of achieving a vapor pressure of no greater than 13.7 pounds per square inch (psi) rather than the current national standard of 14.7 psi or less. The adoption of these regulations and/or their proliferation to other states may require the installation of new and more costly control equipment, increase the cost of production operations, increase the costs incurred by oil transporters and thereby decrease the price we receive for crude oil sold in North Dakota.
The adoption of climate change legislation or regulations restricting emissions of "greenhouse gases" could result in increased operating costs and reduced demand for the oil, natural gas and natural gas liquids we produce.
Congress has from time to time considered legislation to reduce emissions of greenhouse gasses, “GHGs”, and almost one-half of the states have already taken legal measures to reduce emissions of GHGs, through the planned development of GHG emission inventories and/or regional GHG cap and trade programs or other mechanisms. Most cap and trade programs work by requiring major sources of emissions, such as electric power plants, or major producers of fuels, such as refineries and gas processing plants, to acquire and surrender emission allowances corresponding with their annual emissions of GHGs. The number of allowances available for purchase is reduced each year until the overall GHG emission reduction goal is achieved. As the number of GHG emission allowances declines each year, the cost or value of allowances is expected to escalate significantly. Some states have enacted renewable portfolio standards, which require utilities to purchase a certain percentage of their energy from renewable fuel sources.
In addition, in December 2009, the EPA determined that emissions of carbon dioxide, methane and other GHGs present an endangerment to human health and the environment, because emissions of such gases are, according to the EPA, contributing to warming of the earth's atmosphere and other climatic changes. These findings by the EPA allow the agency to proceed with the adoption and implementation of regulations that would restrict emissions of GHGs under existing provisions of the federal Clean Air Act. In response to its endangerment finding, the EPA recently adopted two sets of rules regarding possible future regulation of GHG emissions under the Clean Air Act. The motor vehicle rule, which became effective in July 2010, purports to limit emissions of GHGs from motor vehicles. The EPA adopted the stationary source rule (or the "tailoring rule") in May 2010, and it became effective in January 2011. The tailoring rule established new GHG emissions thresholds that determine when stationary sources must obtain permits under the Prevention of Significant Deterioration ("PSD") and Title V programs of the Clean Air Act. On June 23, 2014, in Utility Air Regulatory Group v. EPA ("UARG v. EPA"), the Supreme Court held that stationary sources could not become subject to PSD or Title V permitting solely by reason of their GHG emissions. The Court ruled, however, that the EPA may require installation of best available control technology for GHG emissions at sources otherwise subject to the PSD and Title V programs. On December 19, 2014, the EPA issued two memoranda providing initial guidance on GHG permitting requirements in response to the Court's decision in UARG v. EPA. In its preliminary guidance, the EPA indicated it would promulgate a rule to rescind any PSD permits issued under the portions of the tailoring rule that were vacated by the Court. In the interim, the EPA issued a narrowly crafted "no action assurance" indicating it will exercise its enforcement discretion not to pursue enforcement of the terms and conditions relating to GHGs in an EPA-issued PSD permit, and for related terms and conditions in a Title V permit. On April 30, 2015, the EPA issued a final rule allowing permitting authorities to rescind PSD permits issued under the invalid regulations.
In September 2009, the EPA issued a final rule requiring the reporting of GHG emissions from specified large GHG emission sources in the U.S., including natural gas liquids fractionators and local natural gas/distribution companies, beginning in 2011 for emissions occurring in 2010. In November 2010, the EPA published a final rule expanding the GHG reporting rule to include onshore oil, NGL and natural gas production, processing, transmission, storage and distribution facilities. This rule requires reporting of GHG emissions
26
from such facilities on an annual basis, with reporting beginning in 2012 for emissions occurring in 2011. In October 2015, the EPA amended the GHG reporting rule to add the reporting of GHG emissions from gathering and boosting systems, completions and workovers of oil wells using hydraulic fracturing, and blowdowns of natural gas transmission pipelines.
The EPA has continued to adopt GHG regulations applicable to other industries, such as its August 2015 adoption of three separate, but related, actions to address carbon dioxide pollution from power plants, including final Carbon Pollution Standards for new, modified and reconstructed power plants, a final Clean Power Plan to cut carbon dioxide pollution from existing power plants, and a proposed federal plan to implement the Clean Power Plan emission guidelines. Upon publication of the Clean Power Plan on October 23, 2015, more than two dozen states as well as industry and labor groups challenged the Clean Power Plan in the D.C. Circuit Court of Appeals. On February 9, 2016, the U.S. Supreme Court stayed the Clean Power Plan pending disposition of the legal challenges. Nevertheless, as a result of the continued regulatory focus, future GHG regulations of the oil and gas industry remain a possibility.
In December 2015, the United States joined the international community at the 21st Conference of the Parties of the United Nations Framework Convention on Climate Change in Paris, France. The resulting Paris Agreement calls for the parties to undertake "ambitious efforts" to limit the average global temperature, and to conserve and enhance sinks and reservoirs of GHGs. The Paris Agreement, if ratified, establishes a framework for the parties to cooperate and report actions to reduce GHG emissions.
Restrictions on GHG emissions that may be imposed could adversely affect the oil and natural gas industry. The adoption of legislation or regulatory programs to reduce GHG emissions could require us to incur increased operating costs, such as costs to purchase and operate emissions control systems, to acquire emissions allowances or comply with new regulatory requirements. Any GHG emissions legislation or regulatory programs applicable to power plants or refineries could also increase the cost of consuming, and thereby reduce demand for, the oil, natural gas and natural gas liquids we produce. Consequently, legislation and regulatory programs to reduce GHG emissions could have an adverse effect on our business, financial condition and results of operations.
In addition, claims have been made against certain energy companies alleging that GHG emissions from oil, NGL and natural gas operations constitute a public nuisance under federal and/or state common law. As a result, private individuals may seek to enforce environmental laws and regulations against us and could allege personal injury or property damages. While we are currently not a party to such litigation, we could be named in actions making similar allegations. An unfavorable ruling in any such case could significantly impact our operations and could have an adverse impact on our financial condition.
Moreover, there has been public discussion that climate change may be associated with extreme weather conditions such as more intense hurricanes, thunderstorms, tornadoes and snow or ice storms, as well as rising sea levels. Another discussed possible consequence of climate change is increased volatility in seasonal temperatures. Some studies indicate that climate change could cause some areas to experience temperatures substantially colder than their historical averages. Extreme weather conditions can interfere with our production and increase our costs and damage resulting from extreme weather may not be fully insured. However, at this time, we are unable to determine the extent to which climate change may lead to increased storm or weather hazards affecting our operations.
Our oil, natural gas and natural gas liquids are sold to a limited number of geographic markets so an oversupply in any of those areas could have a material negative effect on the price we receive.
Our oil, natural gas and natural gas liquids is sold to a limited number of geographic markets which each have a fixed amount of storage and processing capacity. As a result, if such markets become oversupplied with oil, natural gas and/or natural gas liquids, it could have a material negative effect on the price we receive for our products and therefore an adverse effect on our financial condition. There is a risk that refining capacity in the U.S. Gulf Coast may be insufficient to refine all of the light sweet crude oil being produced in the United States. If light sweet crude oil production remains at current levels or continues to increase, demand for our light crude oil production could result in widening price discounts to the world crude prices and potential shut-in of production due to a lack of sufficient markets despite the lift on prior restrictions on the exporting of oil and natural gas.
Derivatives reform legislation and related regulations could have an adverse effect on our ability to hedge risks associated with our business.
The July 2010 Dodd-Frank Wall Street Reform and Consumer Protection Act (the "Dodd-Frank Act") provides for federal oversight of the over-the-counter derivatives market and entities that participate in that market and mandates that the Commodity Futures Trading Commission (the "CFTC"), the SEC, and federal regulators of financial institutions (the "Prudential Regulators") adopt rules or regulations implementing the Dodd-Frank Act and providing definitions of terms used in the Dodd-Frank Act. The Dodd-Frank Act establishes margin requirements and requires clearing and trade execution practices for certain market participants and may result in certain market participants needing to curtail or cease their derivatives activities.
Although some of the rules necessary to implement the Dodd-Frank Act remain to be adopted, the CFTC, the SEC and the Prudential Regulators have issued many rules to implement the Dodd-Frank Act, including a rule, which we refer to as the "Mandatory Clearing
27
Rule," requiring clearing of hedges, or swaps, that are subject to it (currently, only certain interest rate and credit default swaps, which we do not presently have), a rule, which we refer to as the "End User Exception," establishing an "end user" exception to the Mandatory Clearing Rule, a rule, which we refer to as the "Margin Rule," setting forth collateral requirements in connection with swaps that are not cleared and also an exception to the Margin Rule for end users that are not financial end users, which exception we refer to as the "Non-Financial End User Exception," and a rule, subsequently vacated by the United States District Court for the District of Columbia and remanded to the CFTC for further proceedings, imposing position limits. The CFTC proposed a new version of this rule, which we refer to as the "Re-Proposed Position Limit Rule," with respect to which the comment period has closed but a final rule has not been issued.
We qualify for the End User Exception and will utilize it if the Mandatory Clearing Rule is expanded to cover swaps in which we participate, we qualify for the Non-Financial End User Exception and will not be required to post margin in connection with uncleared swaps under the Margin Rule, and the quantities under the swaps in which we participate are well within applicable limits under the Re-Proposed Position Limit Rule, so we do not expect to be directly affected by any of such rules. However, most if not all of our hedge counterparties will be subject to mandatory clearing in connection with their hedging activities with parties who do not qualify for the End User Exception and will be required to post margin in connection with their hedging activities with other swap dealers, major swap participants, financial end users and other persons that do not qualify for the Non-Financial End User Exception. In addition, the European Union and other non-U.S. jurisdictions have enacted laws and regulations, which we refer to collectively as "Foreign Regulations" which may apply to our transactions with counterparties subject to such Foreign Regulations. The Dodd-Frank Act, the rules which have been adopted and not vacated, and, to the extent that the Re-Proposed Position Limit Rule is effected, such proposed rule could significantly increase the cost of our derivative contracts, materially alter the terms of our derivative contracts, reduce the availability of derivatives to us that we have historically used to protect against risks that we encounter in our business, reduce our ability to monetize or restructure our existing derivative contracts, and increase our exposure to less creditworthy counterparties. The Foreign Regulations could have similar effects. If we reduce our use of derivatives as a result of the Dodd-Frank Act and regulations and Foreign Regulations, our results of operations may become more volatile and our cash flows may be less predictable, which could adversely affect our ability to plan for and fund capital expenditures. Finally, the Dodd-Frank Act was intended, in part, to reduce the volatility of oil and natural gas prices, which some legislators attributed to speculative trading in derivatives and commodity contracts related to oil and natural gas. Our revenues could therefore be adversely affected if a consequence of the Dodd-Frank Act and regulations is to lower commodity prices. Any of these consequences could have a material adverse effect on us, our financial condition, and our results of operations.
We may incur more taxes and certain of our projects may become uneconomic if certain federal income tax deductions currently available with respect to oil and natural gas exploration and development are eliminated as a result of future legislation.
Legislation has been proposed that would, if enacted, eliminate certain key U.S. federal income tax preferences currently available to oil and natural gas exploration and production companies. These changes include, but are not limited to (i) the repeal of the percentage depletion allowance for oil and natural gas properties, (ii) the elimination of current deductions for intangible drilling and development costs, (iii) the elimination of the deduction for certain U.S. production activities and (iv) an extension of the amortization period for certain geological and geophysical expenditures. In addition, President Obama recently proposed adding a $10.25 per Bbl tax on crude oil produced in the United States. It is unclear whether any of the foregoing changes will actually be enacted or how soon any such changes could become effective. Any such change or similar other change could materially adversely affect our financial condition and results of operations by increasing the costs we incur which would in turn make it uneconomic to drill some locations if commodity prices are not sufficiently high, resulting in lower revenues and decreases in production and reserves.
Our operations are substantially dependent on the availability, use and disposal of water. New legislation and regulatory initiatives or restrictions relating to water disposal wells could have a material adverse effect on our future business, financial condition, operating results and prospects.
Water is an essential component of both the drilling and hydraulic fracturing processes. Historically, we have been able to purchase water from local land owners and other sources for use in our operations. During the past several years, Texas has experienced the lowest inflows of water in recent history. As a result of these conditions, some local water districts may begin restricting the use of water subject to their jurisdiction for drilling and hydraulic fracturing in order to protect the local water supply. If we are unable to obtain water to use in our operations from local sources, we may be unable to economically produce oil, natural gas and natural gas liquids, which could have an adverse effect on our results of operations, cash flows and financial condition.
Additionally, our drilling procedures produce large volumes of water that we must properly dispose. The Clean Water Act of 1977, as amended, the Safe Drinking Water Act of 1974, as amended, the Oil Pollution Act of 1990, as amended, and comparable state laws impose restrictions and strict controls regarding the discharge of pollutants, including produced waters and other natural gas wastes, into federal and state waters. The discharge of pollutants into regulated waters is prohibited, except in accordance with the terms of a permit issued by the U.S. Environmental Protection Agency (the "EPA") or the state. Furthermore, many states maintain groundwater protection programs that require permits for discharges or operations that may impact groundwater conditions. The underground injection of fluids is subject to permitting and other requirements under state laws and regulation. Obtaining permits has the potential
28
to delay the development of oil, NGL and natural gas projects. These same regulatory programs also limit the total volume of water that can be discharged, hence limiting the rate of development, and require us to incur compliance costs. In October 2014, the RRC adopted new regulations effective as of November 17, 2014 that require additional supporting documentation, including records from the U.S. Geological Survey regarding previous seismic events in the area, as part of applications for new disposal wells. The new regulations also clarify the RRC's ability to modify, suspend or terminate a disposal well permit if scientific data indicates it is likely to contribute to seismic activity. The RRC has used this authority to deny permits for waste disposal sites.
Moreover, the EPA is examining regulatory requirements for "indirect dischargers" of wastewater - i.e., those that send their discharges to private or publicly owned treatment facilities, which treat the wastewater before discharging it to regulated waters. On April 7, 2015, the EPA published a proposed rule establishing federal pre-treatment standards for wastewater discharged from onshore unconventional oil and gas extraction facilities to publicly owned treatment works (“POTWs”). The EPA asserts that wastewater from such facilities can be generated in large quantities and can contain constituents that may disrupt POTW operations and/or be discharged, untreated, from the POTW to receiving waters. If adopted, the new pre-treatment rule would require unconventional oil and gas facilities to pre-treat wastewater before transferring it to POTWs. The public comment period ended on July 17, 2015, and the EPA is expected to publish a final rule in 2016. The EPA is also conducting a study of private wastewater treatment facilities (also known as centralized waste treatment, or CWT, facilities) accepting oil and gas extraction wastewater. The EPA is collecting data and information related to the extent to which CWT facilities accept such wastewater, available treatment technologies (and their associated costs), discharge characteristics, financial characteristics of CWT facilities, and the environmental impacts of discharges from CWT facilities.
Because of the necessity to safely dispose of water produced during drilling and production activities, these regulations, or others like them, could have a material adverse effect on our future business, financial condition, operating results and prospects. See Item 1. Business—Regulations, for a further description of the laws and regulations that affect us.
Any change to government regulation or administrative practices may have a negative impact on our ability to operate and our profitability.
Oil and gas exploration and development is subject to substantial regulation under federal, state and local laws relating to the exploration for, and the development, upgrading, marketing, pricing, taxation, and transportation of, oil and natural gas and related products and other associated matters. Amendments to current laws and regulations governing operations and activities of oil and gas exploration and development operations could have a material adverse impact on our business. In addition, there can be no assurance that income tax laws, royalty regulations and government incentive programs related to our oil and gas properties and the oil and gas industry generally will not be changed in a manner which may adversely affect our progress or cause delays.
Permits, leases, licenses, and approvals are required from a variety of regulatory authorities at various stages of exploration and development. There can be no assurance that the various government permits, leases, licenses and approvals sought will be granted in respect of our activities or, if granted, will not be cancelled or will be renewed upon expiration. There is no assurance that such permits, leases, licenses, and approvals will not contain terms and provisions which may adversely affect our exploration and development activities.
The marketability of our production is dependent upon gathering systems, transportation facilities and processing facilities that we do not own or control. If these facilities or systems are unavailable, our operations can be interrupted and our revenues reduced.
The marketability of our oil and natural gas production is dependent upon the availability, proximity and capacity of pipelines, natural gas gathering systems, transportation and processing facilities owned by third parties. In general, we will not control these facilities, and our access to them may be limited or denied due to circumstances beyond our control. A significant disruption in the availability of these facilities could adversely impact our ability to deliver to market the oil and natural gas we produce and thereby cause a significant interruption in our operations. In some cases, our ability to deliver to market our oil and natural gas is dependent upon coordination among third parties that own transportation and processing facilities we use, and any inability or unwillingness of those parties to coordinate efficiently could also interrupt our operations. These are risks for which we generally will not maintain insurance.
Use of debt financing may adversely affect our strategy.
We intend to use debt to fund a portion of our future acquisition and operating activities. Any temporary or sustained inability to service or repay debt will materially adversely affect our ability to access the financing market and to pursue our operating strategies, as well as impair our ability to respond to adverse economic changes in oil and natural gas markets and the economy in general.
29
Non-operated properties will be controlled by third parties that may not allow us to proceed with planned explorations and expenditures. Activities on operated properties could also be limited or subject to penalties.
While we intend to operate the majority of our properties, we are not currently the operator of many of our existing properties and, therefore, may not be able to influence production operations or further development activities. At present, we operate wells comprising approximately 67% of our total proved reserves. Joint ownership is customary in the oil and gas industry and is generally conducted under the terms of a Joint Operating Agreement (“JOA”), where one of the working interest owners is designated as the “operator” of the property. For non-operated properties, subject to the specific terms and conditions of the applicable JOA, if we disagree with the decision of a majority of working interest owners, we may be required, among other things, to postpone the proposed activity or decline to participate. If we decline to participate, we might be forced to relinquish our interest through “in-or-out” elections or may be subject to certain non-consent penalties, as provided in a JOA. In-or-out elections may require a joint owner to participate or forever relinquish its position, typically only in specific wells or drilling units, although such relinquished positions could be of a larger scope. Non-consent penalties typically allow participating working interest owners to recover from the proceeds of production, if any, an amount equal to 200% to 500% of the non-participating working interest owner’s share of the cost of such operations. Further, even for properties operated by us, there may be instances where decisions related to drilling, completion and operating cannot be made in our sole discretion. In such instances, we could be limited in our development operations and subject to penalties as specified above if we choose not to participate in operations proposed by a majority of working interest owners.
Because we cannot control activities on properties we do not operate, we cannot control the timing of exploration and development projects. If we are unable to fund required capital expenditures with respect to non-operated properties, our interests in those properties may be reduced or forfeited.
Our ability to exercise influence over operations and costs for the properties we do not operate is limited. Our dependence on the operator and other working interest owners for these projects and our limited ability to influence operations and associated costs could prevent the realization of our targeted returns on capital with respect to exploration, exploitation, development or acquisition activities. The success and timing of exploration, exploitation and development activities on properties operated by others depend upon a number of factors that may be outside our control, including:
|
|
· |
the timing and amount of capital expenditures; |
|
|
· |
the operator’s expertise and financial resources; |
|
|
· |
the approval of other participants in drilling wells; and |
|
|
· |
the selection of technology. |
Where we are not the majority owner or operator of a particular oil and natural gas project, we may have no control over the timing or amount of capital expenditures associated with the project. If we are not willing or able to fund required capital expenditures relating to a project when required by the majority owner(s) or operator, our interests in the project may be reduced or forfeited. Also, we could be responsible for plugging and abandonment and other liabilities in excess of our proportionate interest in the property.
Because we cannot control the timing and accuracy of financial information regarding the results of operations on properties we do not operate, our ability to timely and accurately report our results of operations and financial position may be adversely affected.
For properties we do not operate, we are dependent on the operators of such properties for financial information regarding the results of operations. Any delay in receipt of such information or inaccuracies in calculating and reporting such information by the operator would adversely affect our ability to timely and accurately report our results of operations and financial condition.
A cyber incident could result in information theft, data corruption, operational disruption and/or financial loss.
The oil and natural gas industry has become increasingly dependent on digital technologies to conduct day-to-day operations including certain exploration, development and production activities. For example, software programs are used to interpret seismic data, manage drilling rigs, production equipment and gathering and transportation systems, conduct reservoir modeling and reserve estimation, for compliance report.
We are dependent on digital technologies including information systems and related infrastructure, to process and record financial and operating data, communicate with our employees, business partners, and stockholder, analyze seismic and drilling information, estimate quantities of oil and gas reserves as well as other activities related to our business. Our business partners, including vendors, service providers, purchasers of our production, and financial institutions, are also dependent on digital technology. The technologies needed to conduct oil and natural gas exploration and development activities make certain information the target of theft or misappropriation.
30
As dependence on digital technologies has increased, cyber incidents, including deliberate attacks or unintentional events, also has increased. A cyber-attack could include gaining unauthorized access to digital systems for purposes of misappropriating assets or sensitive information, corrupting data, or causing operational disruption, or result in denial-of-service on websites.
Our technologies, systems, networks, and those of our business partners may become the target of cyber-attacks or information security breaches that could result in the unauthorized release, gathering, monitoring, misuse, loss or destruction of proprietary and other information, or other disruption of our business operations. In addition, certain cyber incidents, such as surveillance, may remain undetected for an extended period of time. A cyber incident involving our information systems and related infrastructure, or that of our business partners, could disrupt our business plans and negatively impact our operations.
Risks Related to the Ownership of our Common Stock
We are a “controlled company” within the meaning of the NYSE MKT rules and, as a result, qualify for, and rely on, exemptions from certain corporate governance requirements. As a result, our stockholders do not have the same protections afforded to stockholders of companies that are subject to such requirements.
OVR beneficially owns a majority of our common stock. As a result, we are a “controlled company” within the meaning of the NYSE MKT corporate governance standards. Under the NYSE MKT rules, a company of which more than 50% of the voting power is held by another person or group of persons acting together is a controlled company and may elect not to comply with certain NYSE MKT corporate governance requirements, including the requirements that:
|
|
· |
a majority of our board of directors consist of independent directors; |
|
|
· |
we have a nominating committee that is composed entirely of independent directors with a written charter addressing the committee’s purpose and responsibilities; and |
|
|
· |
we have a compensation committee that is composed entirely of independent directors with a written charter addressing the committee’s purpose and responsibilities. |
We are currently utilizing, and intend to continue to utilize, the exemption relating to a majority of our board of directors not being independent, the compensation committee, the nominating committee, and we may utilize this exemption for so long as we are a controlled company. Accordingly, our stockholders do not have the same protections afforded to stockholders of companies that are subject to all of the corporate governance requirements of the NYSE MKT.
OVR holds a substantial majority of our common stock.
OVR holds the majority of the outstanding shares of our common stock. OVR is entitled to act separately in its own interest with respect to its shares of our common stock, and it has the voting power to elect all of the members of our board of directors and thereby control our management and affairs. In addition, OVR has the ability to determine the outcome of all matters requiring stockholder approval, including mergers and other material transactions, and to cause or prevent a change in the composition of our board of directors or a change in control of our company that could deprive our stockholders of an opportunity to receive a premium for their common stock as part of a sale of our company. The existence of a significant stockholder may also have the effect of deterring hostile takeovers, delaying or preventing changes in control or changes in management, or limiting the ability of our other stockholders to approve transactions that they may deem to be in the best interests of our company.
So long as OVR continues to control a significant amount of our common stock, OVR will continue to be able to strongly influence all matters requiring stockholder approval, regardless of whether or not other stockholders believe that a potential transaction is in their own best interests. In any of these matters, the interests of OVR may differ or conflict with the interests of our other stockholders. Moreover, this concentration of stock ownership may also adversely affect the trading price of our common stock to the extent investors perceive a disadvantage in owning stock of a company with a controlling stockholder.
Our common stock price has been and is likely to continue to be highly volatile.
The trading price of our common stock is subject to wide fluctuations in response to a variety of factors, including quarterly variations in operating results, announcements of drilling and rig activity, economic conditions in the natural gas and oil industry, general economic conditions or other events or factors that are beyond our control.
In addition, the stock market in general and the market for oil and natural gas exploration companies, in particular, have experienced large price and volume fluctuations that have often been unrelated or disproportionate to the operating results or asset values of those companies. These broad market and industry factors may seriously impact the market price and trading volume of our common stock regardless of our actual operating performance. In the past, following periods of volatility in the overall market and in the market price of a company’s securities, securities class action litigation has been instituted against certain oil and natural gas exploration
31
companies. If this type of litigation were instituted against us following a period of volatility in our common stock trading price, it could result in substantial costs and a diversion of our management’s attention and resources, which could have a material adverse effect on our financial condition, future cash flows and the results of operations.
Item 1B. Unresolved Staff Comments
None.
Oil and Natural Gas Reserves
All of our oil and natural gas reserves are located in the United States. Our reserve estimates have been prepared by Cawley, Gillespie & Associates, Inc. (“CG&A”), an independent petroleum engineering firm. The scope and results of CG&A’s procedures are summarized in a letter which is included as an exhibit to this report. For further information on reserves, including information on future net cash flows and the standardized measure of discounted future net cash flows, please refer to the “Supplemental Data on Oil and Gas Exploration and Producing Activities (Unaudited)” within Part II, Item 8 of the Notes To Consolidated Financial Statements of this report.
2015 Decreases in proved reserves
From January 1, 2015 to December 31, 2015, our proved reserves decreased as follows:
|
|
1. |
Total proved reserves decreased 43% from 22,192 MBOE to 12,574 MBOE; |
|
|
2. |
Proved developed reserves decreased 12% from 9,800 MBOE to 8,613 MBOE; and |
|
|
3. |
Proved undeveloped reserves decreased 68% from 12,392 MBOE to 3,961 MBOE. |
These significant decreases were due to production of 1,437 MBOE, the divestiture of non-core assets and an economic loss of reserves due to significantly reduced commodity prices. The majority of 2015 drilling activities were focused on proved locations and therefore very minimal reserves were moved into the proved undeveloped category.
Proved Reserves as of December 31, 2015
The below table sets forth a summary of our estimated crude oil, natural gas and natural gas liquids reserves as of December 31, 2015 based on the reserve report prepared by CG&A. Proved reserves are estimated based on the unweighted average beginning-of-month-prices during the 12-month period for the year. All prices and costs associated with operating wells were held constant in accordance with the SEC guidelines.
|
|
|
Oil (MBbl) |
|
|
Natural Gas (MMcf) |
|
|
NGL (MBbl) |
|
|
Total (MBOE) (1) |
|
|
Present Value Discounted at 10% ($ in thousands) |
|
|||||
|
Proved developed |
|
|
6,114 |
|
|
|
10,954 |
|
|
|
673 |
|
|
|
8,613 |
|
|
$ |
94,585 |
|
|
Proved undeveloped |
|
|
3,247 |
|
|
|
2,384 |
|
|
|
317 |
|
|
|
3,961 |
|
|
|
9,811 |
|
|
Total proved |
|
|
9,361 |
|
|
|
13,338 |
|
|
|
990 |
|
|
|
12,574 |
|
|
$ |
104,396 |
|
|
|
(1) |
Barrels of oil equivalent have been calculated on the basis of six thousand cubic feet (Mcf) of natural gas equal to one barrel of oil equivalent (BOE). Natural gas liquids have been converted to MBbls. |
Present Value Discounted at 10% (“PV-10”) is a non-GAAP measure that differs from the generally accepted accounting practices in the United States (“GAAP”) measure “standardized measure of discounted future net cash flows” in that PV-10 is calculated without including future income taxes. Management believes that the presentation of PV-10 value is relevant and useful to investors because it presents the estimated discounted future net cash flows attributable to our estimated proved reserves independent of our income tax attributes, thereby isolating the intrinsic value of the estimated future cash flows attributable to our reserves. We believe the use of a pre-tax measure provides greater comparability of assets when evaluating companies because the timing and quantification of future income taxes is dependent on company-specific factors, many of which are difficult to discern presently. For these reasons, management uses and believes that the industry generally uses the PV-10 measure in evaluating and comparing acquisition candidates and assessing the potential rate of return on investments in oil and natural gas properties. PV-10 does not necessarily represent the fair market value of oil and natural gas properties. PV-10 is not a measure of financial or operational performance under GAAP, nor
32
should it be considered in isolation or as a substitute for the standardized measure of discounted future net cash flows as defined under GAAP.
The table below provides a reconciliation of PV-10 to the standardized measure of discounted future net cash flows (in thousands):
|
Present value of estimated future net revenues (PV-10) |
|
$ |
104,396 |
|
|
Future income taxes, discounted at 10% |
|
|
— |
|
|
Standardized measure of discounted future net revenues |
|
$ |
104,396 |
|
Proved Undeveloped Reserves (“PUDs”)
Proved undeveloped reserves decreased 8,431 MBOE or 68%, for the year ended December 31, 2015 compared to the year ended December 31, 2014. Revisions of prior estimates reflect our operational results, drilling activities, and on-going evaluation of our asset portfolio. Certain previously booked PUDs were reclassified as proved developed reserves due to successful drilling efforts. Revisions of prior estimates also include certain PUDs that were reclassified to unproved categories due to development plan changes and the impact of changes in commodity prices. In accordance with our 2015 year-end independent engineering reserve report, we plan to drill all of our individual PUD drilling locations within the next five years.
The following table details the changes in our proved undeveloped reserves for year ended December 31, 2015 (in MBOE):
|
Beginning proved undeveloped reserves at December 31, 2014 |
|
|
12,392 |
|
|
Conversions to developed |
|
|
(1,700 |
) |
|
Extensions and discoveries |
|
|
685 |
|
|
Purchases |
|
|
1,924 |
|
|
Revisions |
|
|
(9,340 |
) |
|
Ending proved undeveloped reserves at December 31, 2015 |
|
|
3,961 |
|
Conversions. In 2015, approximately 62% of the reserve conversions occurred in our operated Eagle Ford / Austin Chalk properties in Fayette, Gonzales and Karnes Counties, Texas, with the remaining occurring in our non-operated Bakken/Three Forks program in North Dakota.
Extensions and discoveries. During 2015, we added 685 MBOE of PUDs through extensions and discoveries, primarily as a result of successful drilling in our operated Eagle Ford properties in Fayette and Gonzales Counties, Texas and our non-operated Bakken/Three Forks program in North Dakota.
Purchases. During 2015, we acquired additional interests in our operated Eagle Ford properties in Karnes and Gonzales Counties, Texas.
Revisions. In 2015, the downward revisions of 9,340 MBOE to PUD reserves occurred primarily as a result of decreased oil natural gas prices, which decreased the number of economic PUD locations.
Preparation of Reserve Estimates
We engaged an independent petroleum engineering consulting firm, CG&A, to prepare our annual reserve estimates and we have relied on CG&A’s expertise to ensure that our reserve estimates are prepared in compliance with SEC guidelines.
The technical person primarily responsible for the preparation of the reserve report is Mr. Robert D. Ravnaas, President of CG&A. He earned a Bachelor of Science degree with special honors in Chemical Engineering from the University of Colorado at Boulder in 1979 and a Master of Science degree in Petroleum Engineering from the University of Texas at Austin in 1981. Mr. Ravnaas is a Registered Professional Engineer in Texas and has more than 31 years of experience in the estimation and evaluation of oil and natural gas reserves. He is also a member of the Society of Petroleum Geologists and the Society of Professional Well Log Analysts.
Mr. Anderson, our Executive Vice President responsible for reservoir engineering, is a qualified reserve estimator and auditor and is primarily responsible for overseeing CG&A during the preparation of our reserve report. His professional qualifications meet or exceed the qualifications of reserve estimators and auditors set forth in the “Standards Pertaining to Estimation and Auditing of Oil and Gas Reserves Information” promulgated by the Society of Petroleum Engineers. His qualifications include a Bachelor of Science degree in Petroleum Engineering from the University of Wyoming in 1986; a Master of Business Administration degree from the University of Denver in 1988; member of the Society of Petroleum Engineers since 1985; and more than 29 years of practical
33
experience in estimating and evaluating reserve information with more than five of those years being in charge of estimating and evaluating reserves.
We maintain adequate and effective internal controls over our reserve estimation process as well as the underlying data upon which reserve estimates are based. The primary inputs to the reserve estimation process are technical information, financial data, ownership interest and production data. The relevant field and reservoir technical information, which is updated annually, is assessed for validity when CG&A has technical meetings with our engineers, geologists, operations and land personnel. Current revenue and expense information is obtained from our accounting records, which are subject to external quarterly reviews, annual audits and our own set of internal controls over financial reporting. Internal controls over financial reporting are assessed for effectiveness annually using criteria set forth in Internal Control – Integrated Framework, (2013 Version) issued by the Committee of Sponsoring Organizations of the Treadway Commission. All current financial data such as commodity prices, lease operating expenses, production taxes and field level commodity price differentials are updated in the reserve database and then analyzed to ensure that they have been entered accurately and that all updates are complete. Our current ownership in mineral interests and well production data are also subject to our internal controls over financial reporting, and they are incorporated in our reserve database as well and verified internally by our personnel to ensure their accuracy and completeness. Once the reserve database has been updated with current information, and the relevant technical support material has been assembled, CG&A meets with our technical personnel to review field performance and future development plans in order to further verify the validity of estimates. Following these reviews, the reserve database is furnished to CG&A so that it can prepare its independent reserve estimates and final report. The reserve estimates prepared by CG&A are reviewed and compared to our internal estimates by our Executive Vice President responsible for reservoir engineering. Material reserve estimation differences are reviewed between CG&A and us, and additional data is provided to address the differences. If the supporting documentation will not justify additional changes, the CG&A reserves are accepted. In the event that additional data supports a reserve estimation adjustment, CG&A will analyze the additional data, and may make changes it deems necessary. Additional data is usually comprised of updated production information on new wells. Once the review is completed and all material differences are reconciled, the reserve report is finalized and our reserve database is updated with the final estimates provided by CG&A.
Net Oil, Natural Gas and Natural Gas Liquids Production, Average Price and Average Production Cost
The net quantities of oil and natural gas and natural gas liquids produced and sold by us for the years ended December 31, 2015, 2014, and 2013, the average sales price per unit sold and the average production cost per unit are presented below.
|
|
|
Years Ended December 31, |
|
|||||||||
|
|
|
2015 |
|
|
2014 |
|
|
2013 |
|
|||
|
Sales Volumes: |
|
|
|
|
|
|
|
|
|
|
|
|
|
Oil (MBbl) |
|
|
904 |
|
|
|
403 |
|
|
|
163 |
|
|
Natural gas (MMcf) |
|
|
2,143 |
|
|
|
2,132 |
|
|
|
2,635 |
|
|
Natural gas liquids (MBbl) |
|
|
176 |
|
|
|
124 |
|
|
|
134 |
|
|
Barrels of oil equivalent (MBOE)* |
|
|
1,437 |
|
|
|
882 |
|
|
|
737 |
|
|
|
|
|
|
|
|
|
|
|
|
|
|
|
|
Average prices realized: |
|
|
|
|
|
|
|
|
|
|
|
|
|
Oil (per Bbl) |
|
$ |
44.09 |
|
|
$ |
86.29 |
|
|
$ |
98.32 |
|
|
Natural gas (per Mcf) |
|
$ |
2.55 |
|
|
$ |
4.39 |
|
|
$ |
3.69 |
|
|
Natural gas liquids (per Bbl) |
|
$ |
12.29 |
|
|
$ |
28.29 |
|
|
$ |
28.88 |
|
|
Barrels of oil equivalent (per BOE) |
|
$ |
33.04 |
|
|
$ |
53.99 |
|
|
$ |
40.22 |
|
|
|
|
|
|
|
|
|
|
|
|
|
|
|
|
Production cost per BOE** |
|
$ |
11.10 |
|
|
$ |
11.75 |
|
|
$ |
11.23 |
|
|
|
* |
Barrels of oil equivalent have been calculated on the basis of six thousand cubic feet (Mcf) of natural gas equal to one barrel of oil equivalent (BOE). Natural gas liquids have been converted to MBbls. |
|
|
** |
Excludes ad valorem taxes (which are included in lease operating expenses in our Consolidated Statements of Operations) and severance taxes. Ad valorem taxes included in lease operating expenses were $0.3 million, $0.5 million and $0.5 million in 2015, 2014 and 2013, respectively. |
As of December 31, 2015, four fields accounted for approximately 89% of our total estimated proved reserves. Southern Bay Eagle Ford and Eagleville fields accounted for 30% and 33%, respectively, of our total estimated proved reserves. The Banks field, which was acquired as part of the closing of our transaction with OVR in December 2014, was 20% of our total estimated proved reserves. The Hawkville field accounted for 6% of our total estimated proved reserves. No other single field accounted for 15% or more of our total estimated proved reserves for the years ended December 31, 2015, 2014 or 2013. The net quantities of oil, natural gas and natural gas liquids produced and sold by us from these significant fields for each of the years ended December 31, 2015, 2014 and 2013, the average sales price per unit sold and the average production cost per unit are presented below.
34
|
|
|
Years Ended December 31, |
|
|||||||||
|
|
|
2015 |
|
|
2014 |
|
|
2013 |
|
|||
|
Sales Volumes: |
|
|
|
|
|
|
|
|
|
|
|
|
|
Oil (MBbl) |
|
|
653 |
|
|
|
210 |
|
|
|
46 |
|
|
Natural gas (MMcf) |
|
|
229 |
|
|
|
85 |
|
|
|
16 |
|
|
Natural gas liquids (MBbl) |
|
|
68 |
|
|
|
23 |
|
|
|
5 |
|
|
Barrels of oil equivalent (MBOE)* |
|
|
759 |
|
|
|
247 |
|
|
|
54 |
|
|
|
|
|
|
|
|
|
|
|
|
|
|
|
|
Average prices realized: |
|
|
|
|
|
|
|
|
|
|
|
|
|
Oil (per Bbl) |
|
$ |
45.68 |
|
|
$ |
87.75 |
|
|
$ |
100.43 |
|
|
Natural gas (per Mcf) |
|
$ |
2.58 |
|
|
$ |
4.25 |
|
|
$ |
3.99 |
|
|
Natural gas liquids (per Bbl) |
|
$ |
13.01 |
|
|
$ |
28.98 |
|
|
$ |
34.28 |
|
|
Barrels of oil equivalent (per BOE) |
|
$ |
41.25 |
|
|
$ |
78.80 |
|
|
$ |
90.31 |
|
|
|
|
|
|
|
|
|
|
|
|
|
|
|
|
Production cost per BOE** |
|
$ |
6.89 |
|
|
$ |
6.96 |
|
|
$ |
9.51 |
|
|
|
* |
Barrels of oil equivalent have been calculated on the basis of six thousand cubic feet (Mcf) of natural gas equal to one barrel of oil equivalent (BOE). Natural gas liquids have been converted to MBbls. |
|
|
** |
Excludes ad valorem taxes and severance taxes. |
Eagleville Field
|
|
|
Years Ended December 31, |
|
|||||||||
|
|
|
2015 |
|
|
2014 |
|
|
2013 |
|
|||
|
Sales Volumes: |
|
|
|
|
|
|
|
|
|
|
|
|
|
Oil (MBbl) |
|
|
175 |
|
|
|
70 |
|
|
|
37 |
|
|
Natural gas (MMcf) |
|
|
49 |
|
|
|
25 |
|
|
|
11 |
|
|
Natural gas liquids (MBbl) |
|
|
15 |
|
|
|
7 |
|
|
|
4 |
|
|
Barrels of oil equivalent (MBOE)* |
|
|
198 |
|
|
|
81 |
|
|
|
42 |
|
|
|
|
|
|
|
|
|
|
|
|
|
|
|
|
Average prices realized: |
|
|
|
|
|
|
|
|
|
|
|
|
|
Oil (per Bbl) |
|
$ |
44.75 |
|
|
$ |
84.58 |
|
|
$ |
99.84 |
|
|
Natural gas (per Mcf) |
|
$ |
2.58 |
|
|
$ |
4.36 |
|
|
$ |
4.03 |
|
|
Natural gas liquids (per Bbl) |
|
$ |
13.14 |
|
|
$ |
30.24 |
|
|
$ |
34.43 |
|
|
Barrels of oil equivalent (per BOE) |
|
$ |
41.13 |
|
|
$ |
77.57 |
|
|
$ |
90.93 |
|
|
|
|
|
|
|
|
|
|
|
|
|
|
|
|
Production cost per BOE** |
|
$ |
5.96 |
|
|
$ |
9.16 |
|
|
$ |
4.95 |
|
|
|
* |
Barrels of oil equivalent have been calculated on the basis of six thousand cubic feet (Mcf) of natural gas equal to one barrel of oil equivalent (BOE). Natural gas liquids have been converted to MBbls. |
|
|
** |
Excludes ad valorem taxes and severance taxes. |
35
|
|
|
Year Ended December 31, |
|
|
|
|
|
2015 |
|
|
|
Sales Volumes: |
|
|
|
|
|
Oil (MBbl) |
|
|
126 |
|
|
Natural gas (MMcf) |
|
|
230 |
|
|
Natural gas liquids (MBbl) |
|
|
32 |
|
|
Barrels of oil equivalent (MBOE)* |
|
|
196 |
|
|
|
|
|
|
|
|
Average prices realized: |
|
|
|
|
|
Oil (per Bbl) |
|
$ |
40.29 |
|
|
Natural gas (per Mcf) |
|
$ |
2.69 |
|
|
Natural gas liquids (per Bbl) |
|
$ |
7.98 |
|
|
Barrels of oil equivalent (per BOE) |
|
$ |
30.28 |
|
|
|
|
|
|
|
|
Production cost per BOE** |
|
$ |
8.31 |
|
|
|
* |
Barrels of oil equivalent have been calculated on the basis of six thousand cubic feet (Mcf) of natural gas equal to one barrel of oil equivalent (BOE). Natural gas liquids have been converted to MBbls. |
|
|
** |
Excludes ad valorem taxes and severance taxes. |
Hawkville Field
|
|
|
Years Ended December 31, |
|
|||||||||
|
|
|
2015 |
|
|
2014 |
|
|
2013 |
|
|||
|
Sales Volumes: |
|
|
|
|
|
|
|
|
|
|
|
|
|
Oil (MBbl) |
|
|
18 |
|
|
|
34 |
|
|
|
56 |
|
|
Natural gas (MMcf) |
|
|
943 |
|
|
|
947 |
|
|
|
1,362 |
|
|
Natural gas liquids (MBbl) |
|
|
76 |
|
|
|
85 |
|
|
|
125 |
|
|
Barrels of oil equivalent (MBOE)* |
|
|
251 |
|
|
|
280 |
|
|
|
407 |
|
|
|
|
|
|
|
|
|
|
|
|
|
|
|
|
Average prices realized: |
|
|
|
|
|
|
|
|
|
|
|
|
|
Oil (per Bbl) |
|
$ |
31.69 |
|
|
$ |
82.34 |
|
|
$ |
95.67 |
|
|
Natural gas (per Mcf) |
|
$ |
2.61 |
|
|
$ |
4.45 |
|
|
$ |
3.72 |
|
|
Natural gas liquids (per Bbl) |
|
$ |
13.46 |
|
|
$ |
27.72 |
|
|
$ |
28.40 |
|
|
Barrels of oil equivalent (per BOE) |
|
$ |
16.18 |
|
|
$ |
33.62 |
|
|
$ |
34.23 |
|
|
|
|
|
|
|
|
|
|
|
|
|
|
|
|
Production cost per BOE** |
|
$ |
11.66 |
|
|
$ |
11.08 |
|
|
$ |
8.70 |
|
|
|
* |
Barrels of oil equivalent have been calculated on the basis of six thousand cubic feet (Mcf) of natural gas equal to one barrel of oil equivalent (BOE). Natural gas liquids have been converted to MBbls. |
|
|
** |
Excludes ad valorem taxes and severance taxes. |
Our oil production is sold to large purchasers. Due to the quality and location of our oil production, we may receive a discount or premium from index prices or “posted” prices in the area. Our natural gas production is sold primarily to pipeline companies and/or gas marketers under short-term contracts at prices which are tied to the “spot” market for natural gas sold in the area.
The purchasers of our oil, natural gas and natural gas liquids production consist primarily of independent marketers, major oil and natural gas companies and pipeline companies. In 2015, 2014 and 2013, one purchaser, United Energy Trading, LLC (“United”), accounted for 62%, 60% and 21%, respectively, of our oil, natural gas and natural gas liquids revenues. United is expected to be a significant purchaser in the future as well. No other purchaser accounted for 10% or more of our oil, natural gas and natural gas liquids revenues during 2015, 2014 and 2013.
We hold working interests in oil and natural gas properties for which third parties serve as operator. The operator sells the oil, natural gas and natural gas liquids to the purchaser, and collects and distributes the revenue to us. In 2015, one operator accounted for 12% and in 2014, a different operator account for 20% of our total oil, natural gas and natural gas liquids revenues. In 2013, two operators
36
distributed 47% and 11% of our oil, natural gas and natural gas liquids revenues. No other operator accounted for 10% or more of our oil, natural gas and natural gas liquids revenues during the years ended December 31, 2015, 2014 and 2013.
Gross and Net Productive Wells
As of December 31, 2015, our total gross and net productive wells were as follows:
|
Oil (1) |
|
|
Natural Gas (1) |
|
|
Total (1) |
|
|||||||||||||||
|
Gross Wells |
|
|
Net Wells |
|
|
Gross Wells |
|
|
Net Wells |
|
|
Gross Wells |
|
|
Net Wells |
|
||||||
|
|
312 |
|
|
|
74 |
|
|
|
175 |
|
|
|
51 |
|
|
|
487 |
|
|
|
125 |
|
|
|
(1) |
A gross well is a well in which a working interest is owned. The number of net wells represents the sum of fractions of working interests we own in gross wells. Productive wells are producing wells plus shut-in wells we deem capable of production. Horizontal re-entries of existing wells do not increase a well total above one gross well. |
Gross and Net Developed and Undeveloped Acres
As of December 31, 2015, we had estimated total gross and net developed and undeveloped leasehold acres as set forth below. The developed acreage is stated on the basis of spacing units designated or permitted by state regulatory authorities.
Gross acres are those acres in which working interest is owned. The number of net acres represents the sum of fractional working interests we own in gross acres.
|
|
|
Developed |
|
|
Undeveloped |
|
|
Total |
|
|||||||||||||||
|
State |
|
Gross |
|
|
Net |
|
|
Gross |
|
|
Net |
|
|
Gross |
|
|
Net |
|
||||||
|
Texas |
|
|
60,800 |
|
|
|
20,300 |
|
|
|
37,900 |
|
|
|
20,200 |
|
|
|
98,700 |
|
|
|
40,500 |
|
|
Oklahoma |
|
|
16,200 |
|
|
|
13,900 |
|
|
|
— |
|
|
|
— |
|
|
|
16,200 |
|
|
|
13,900 |
|
|
Montana |
|
|
6,300 |
|
|
|
2,200 |
|
|
|
5,000 |
|
|
|
1,200 |
|
|
|
11,300 |
|
|
|
3,400 |
|
|
North Dakota |
|
|
21,300 |
|
|
|
2,500 |
|
|
|
6,800 |
|
|
|
3,400 |
|
|
|
28,100 |
|
|
|
5,900 |
|
|
Wyoming |
|
|
600 |
|
|
|
300 |
|
|
|
1,400 |
|
|
|
600 |
|
|
|
2,000 |
|
|
|
900 |
|
|
Nebraska |
|
|
— |
|
|
|
— |
|
|
|
20,200 |
|
|
|
9,100 |
|
|
|
20,200 |
|
|
|
9,100 |
|
|
All Others |
|
|
3,500 |
|
|
|
2,500 |
|
|
|
15,900 |
|
|
|
200 |
|
|
|
19,400 |
|
|
|
2,700 |
|
|
Total |
|
|
108,700 |
|
|
|
41,700 |
|
|
|
87,200 |
|
|
|
34,700 |
|
|
|
195,900 |
|
|
|
76,400 |
|
Out of a total of 87,200 gross (34,700 net) undeveloped acres as of December 31, 2015, the portion of our net undeveloped acreage that is subject to expiration over the next three years, if not successfully developed or renewed, is approximately 14% in 2016, 65% in 2017 and 21% in 2018 and beyond. The portion of our net undeveloped acres related to the Eagle Ford acreage that is subject to expiration over the next three years, if not successfully developed or renewed, is approximately 9% in 2016, 7% in 2017 and 6% in 2018 and beyond. We anticipate that within our Eagle Ford acreage, our current and future drilling plans, along with the selected lease extensions, will address the majority of the leases expiring in 2016 and beyond.
Exploratory Wells and Development Wells
Set forth below for the three years ended December 31, 2015 is information concerning the number of wells we drilled during the years indicated.
|
|
|
Net Exploratory Wells Drilled |
|
|
Net Development Wells Drilled |
|
|
Total Net Productive and Dry Wells |
|
|||||||||||
|
Year |
|
Productive |
|
|
Dry |
|
|
Productive |
|
|
Dry |
|
|
Drilled |
|
|||||
|
2015 |
|
|
— |
|
|
|
— |
|
|
|
7.2 |
|
|
|
— |
|
|
|
7.2 |
|
|
2014 |
|
|
— |
|
|
|
— |
|
|
|
7.3 |
|
|
|
— |
|
|
|
7.3 |
|
|
2013 |
|
|
0.2 |
|
|
|
— |
|
|
|
2.8 |
|
|
|
— |
|
|
|
3.0 |
|
Present Activities
As of March 9, 2016, we have 12 gross (4.1 net) operated wells in the process of drilling or completing and 33 gross (1.4 net) non-operated well in the process of drilling or completing.
37
In the normal course of business, we may be involved in litigation and claims arising out of our operations. As of December 31, 2015, and through the filing date of this report, we do not believe the ultimate resolution of any such actions or potential actions of which we are currently aware will have a material effect on our consolidated financial position or results of operations.
A description of our legal proceedings is included in Note 12 Commitments and Contingencies included in Item 8 of this report.
Item 4. Mine Safety Disclosures
Not applicable.
38
Item 5. Market for Registrant’s Common Equity, Related Stockholder Matters and Issuer Purchases of Equity Securities
Market Information for Common Stock
Shares of our common stock are traded on the NYSE MKT under the symbol “ESTE.” The following table sets forth the reported high and low sales prices of our common stock for the period indicated:
|
|
|
Common Stock Price |
|
|||||
|
Period |
|
High |
|
|
Low |
|
||
|
2015 |
|
|
|
|
|
|
|
|
|
First Quarter |
|
$ |
30.41 |
|
|
$ |
20.20 |
|
|
Second Quarter |
|
$ |
28.00 |
|
|
$ |
17.65 |
|
|
Third Quarter |
|
$ |
19.20 |
|
|
$ |
12.80 |
|
|
Fourth Quarter |
|
$ |
18.15 |
|
|
$ |
13.26 |
|
|
|
|
|
|
|
|
|
|
|
|
2014 |
|
|
|
|
|
|
|
|
|
First Quarter |
|
$ |
22.70 |
|
|
$ |
17.48 |
|
|
Second Quarter |
|
$ |
34.63 |
|
|
$ |
21.11 |
|
|
Third Quarter |
|
$ |
36.76 |
|
|
$ |
27.96 |
|
|
Fourth Quarter |
|
$ |
27.25 |
|
|
$ |
15.00 |
|
Holders
As of March 4, 2016, there were approximately 1,800 holders of record of our common stock.
Dividend Policy
We have never paid dividends on our common stock and do not intend to pay a dividend in the foreseeable future. Furthermore, our credit agreement with our bank restricts the payment of cash dividends. The payment of future cash dividends on common stock, if any, will be reviewed periodically by our Board of Directors and will depend upon, but not limited to, our financial condition, funds available for operations, the amount of anticipated capital and other expenditures, our future business prospects and any restrictions imposed by our present or future bank credit arrangements.
Equity Compensation Plan Information
In December 2014, our stockholders approved and adopted the 2014 Long-Term Incentive Plan (the “2014 Plan”), which was effective on December 19, 2014 and the 2014 Plan remains in effect until December 18, 2024. In October 2015, the 2014 Plan was amended to increase the number of shares of our common stock authorized to be issued. Under the 2014 Plan, we may grant stock options, restricted stock awards, restricted stock units, stock appreciation rights, performance units, performance bonuses, stock awards and other incentive awards to our employees or those of our subsidiaries or affiliates as well as persons rendering consulting or advisory services and non-employee directors, subject to the conditions set forth in the 2014 Plan. Generally, all classes of our employees are eligible to participate in the 2014 Plan.
The 2014 Plan currently provides that a maximum of 1,500,000 shares of our common stock may be issued in conjunction with awards granted under the 2014 Plan. Awards that are forfeited under the 2014 Plan will again be eligible for issuance as though the forfeited awards had never been issued. Similarly, awards settled in cash will not be counted against the shares authorized for issuance upon exercise of awards under the 2014 Plan.
The 2014 Plan limits the aggregate number of shares of common stock that may be covered by stock options and/or stock appreciation rights granted to any eligible employee in any calendar year to 250,000 shares. The 2014 Plan also limits the aggregate number of shares of common stock that may be issued in conjunction with awards (other than stock options or stock appreciation rights) granted to any eligible employee in any calendar year to 150,000 shares. The 2014 Plan also limits the maximum aggregate amount that may be paid in cash pursuant to awards (other than stock options or stock appreciation rights) made to any eligible employee in any calendar year to $2,000,000.
39
The following table sets forth information concerning our only compensation plan available to non-employee directors, officers, employees and consultants at December 31, 2015:
|
|
|
(a) |
|
|
(b) |
|
|
(c) |
|
|||
|
Plan Category |
|
Number of securities to be issued upon exercise of outstanding option, warrants and rights |
|
|
Weighted average exercise price of outstanding options, warrants and rights |
|
|
Number of securities remaining available for future issuance under equity compensation plans (excluding securities reflected in column (a)) |
|
|||
|
Equity compensation plans approved by security holders: |
|
|
|
|
|
|
|
|
|
|||
|
2014 Long-Term Incentive Plan |
|
|
— |
|
|
$ |
— |
|
|
|
1,500,000 |
|
|
Equity compensation plans not approved by security holders: |
|
N/A |
|
|
N/A |
|
|
N/A |
|
|||
Repurchase of Equity Securities
We did not repurchase any of our shares of common stock during the year ended December 31, 2015.
Performance Graph
The following graph reflects a comparison of the cumulative total stockholder return of our common stock beginning December 31, 2010 through December 31, 2015, relative to the cumulative total returns of the S&P 500 Index and the S&P Oil & Gas Exploration & Production Select Industry Index. The graph assumes the investment of $100 on December 31, 2010 in our common stock and each index and the reinvestment of all dividends, if any. The identity of the companies included in the S&P Oil & Gas Exploration & Production Select Industry Index will be provided upon request.
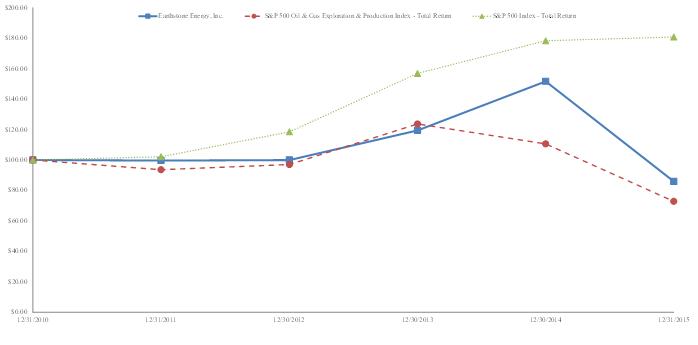
|
|
|
12/31/2010 |
|
12/31/2011 |
|
12/31/2012 |
|
12/31/2013 |
|
12/31/2014 |
|
12/31/2015 |
|
||||||
|
Earthstone Energy, Inc. |
|
$ |
100.00 |
|
$ |
99.61 |
|
$ |
99.94 |
|
$ |
119.35 |
|
$ |
151.61 |
|
$ |
85.87 |
|
|
S&P 500 Index - Total Return |
|
$ |
100.00 |
|
$ |
102.11 |
|
$ |
118.45 |
|
$ |
156.82 |
|
$ |
178.28 |
|
$ |
180.75 |
|
|
S&P 500 Oil & Gas Exploration & Production Index – Total Return |
|
$ |
100.00 |
|
$ |
93.57 |
|
$ |
96.98 |
|
$ |
123.65 |
|
$ |
110.55 |
|
$ |
72.80 |
|
40
Item 6. Selected Financial Data
The following selected financial data should be read in conjunction with Item 7, “Management’s Discussion and Analysis of Financial Condition and Results of Operations”, and our consolidated financial statements and the accompanying notes thereto included elsewhere in this report. In accordance with GAAP the financial information and financial statements included herein are those of OVR and its subsidiaries. Prior to the strategic combination OVR, and its subsidiaries were pass through entities for income tax purposes and therefore no tax expense was recorded for the historical periods prior to the year ended December 31, 2014. OVR was a newly created entity formed in December 2012 that was initially capitalized through the contribution of producing properties, acreage and working capital as well as cash commitments from investors. Upon initial capitalization, the contributed properties, acreage and working capital resulted in one owner retaining a controlling interest in OVR, and despite a change in management, GAAP required OVR to the record the contributed properties at their historical cost basis even though such cost basis was in excess of the valuation agreed upon by members at the time of capitalization. The GAAP requirement resulted in reporting higher DD&A provisions and significant impairments, both in 2013 and 2012, than would have been reported otherwise had the properties been recorded at the agreed upon valuation which approximated fair value.
|
(In thousands, except per share and production amounts) |
|
Years ended December 31, |
|
|||||||||||||||||
|
Summary of Operating Data |
|
2015 |
|
|
2014 |
|
|
2013 |
|
|
2012 |
|
|
2011 |
|
|||||
|
Production |
|
|
|
|
|
|
|
|
|
|
|
|
|
|
|
|
|
|
|
|
|
Oil (MBbl) |
|
|
904 |
|
|
|
403 |
|
|
|
163 |
|
|
|
90 |
|
|
|
69 |
|
|
Natural gas (MMcf) |
|
|
2,143 |
|
|
|
2,132 |
|
|
|
2,635 |
|
|
|
2,298 |
|
|
|
2,864 |
|
|
Natural gas liquids (MBbl) |
|
|
176 |
|
|
|
124 |
|
|
|
134 |
|
|
|
76 |
|
|
|
37 |
|
|
Barrel of oil equivalent (MBOE)* |
|
|
1,437 |
|
|
|
882 |
|
|
|
737 |
|
|
|
549 |
|
|
|
583 |
|
|
Average realized prices: |
|
|
|
|
|
|
|
|
|
|
|
|
|
|
|
|
|
|
|
|
|
Oil (per Bbl) |
|
$ |
44.09 |
|
|
$ |
86.29 |
|
|
$ |
98.32 |
|
|
$ |
96.00 |
|
|
$ |
94.88 |
|
|
Natural gas (per Mcf) |
|
$ |
2.55 |
|
|
$ |
4.39 |
|
|
$ |
3.69 |
|
|
$ |
2.64 |
|
|
$ |
4.21 |
|
|
Natural gas liquids (per Bbl) |
|
$ |
12.29 |
|
|
$ |
28.29 |
|
|
$ |
28.88 |
|
|
$ |
31.00 |
|
|
$ |
44.20 |
|
|
|
|
|
|
|
|
|
|
|
|
|
|
|
|
|
|
|
|
|
|
|
|
Summary of Operations: |
|
|
|
|
|
|
|
|
|
|
|
|
|
|
|
|
|
|
|
|
|
Total revenues |
|
$ |
49,390 |
|
|
$ |
47,994 |
|
|
$ |
29,943 |
|
|
$ |
22,295 |
|
|
$ |
15,470 |
|
|
Lease operating and workover expenses |
|
$ |
16,281 |
|
|
$ |
10,830 |
|
|
$ |
8,768 |
|
|
$ |
6,781 |
|
|
$ |
8,177 |
|
|
Severance taxes |
|
$ |
2,582 |
|
|
$ |
2,002 |
|
|
$ |
1,225 |
|
|
$ |
608 |
|
|
$ |
835 |
|
|
Depreciation, depletion and amortization |
|
$ |
31,228 |
|
|
$ |
18,414 |
|
|
$ |
17,111 |
|
|
$ |
12,191 |
|
|
$ |
16,236 |
|
|
Pretax loss |
|
$ |
(143,097 |
) |
|
$ |
(6,729 |
) |
|
$ |
(19,875 |
) |
|
$ |
(53,321 |
) |
|
$ |
(46,791 |
) |
|
Income tax (benefit) expense |
|
$ |
(26,442 |
) |
|
$ |
22,105 |
|
|
$ |
— |
|
|
$ |
— |
|
|
$ |
— |
|
|
Net loss |
|
$ |
(116,655 |
) |
|
$ |
(28,834 |
) |
|
$ |
(19,875 |
) |
|
$ |
(53,321 |
) |
|
$ |
(46,791 |
) |
|
Net loss per share:** |
|
|
|
|
|
|
|
|
|
|
|
|
|
|
|
|
|
|
|
|
|
Basic |
|
$ |
(8.43 |
) |
|
$ |
(3.11 |
) |
|
$ |
(2.18 |
) |
|
$ |
(5.84 |
) |
|
$ |
(5.13 |
) |
|
Diluted |
|
$ |
(8.43 |
) |
|
$ |
(3.11 |
) |
|
$ |
(2.18 |
) |
|
$ |
(5.84 |
) |
|
$ |
(5.13 |
) |
|
|
|
|
|
|
|
|
|
|
|
|
|
|
|
|
|
|
|
|
|
|
|
Summary Balance Sheet Data at Year End: |
|
|
|
|
|
|
|
|
|
|
|
|
|
|
|
|
|
|
|
|
|
Net oil and natural gas properties |
|
$ |
198,333 |
|
|
$ |
295,877 |
|
|
$ |
147,297 |
|
|
$ |
63,462 |
|
|
$ |
93,860 |
|
|
Total assets |
|
$ |
264,944 |
|
|
$ |
451,388 |
|
|
$ |
189,858 |
|
|
$ |
87,542 |
|
|
$ |
104,904 |
|
|
Long-term debt |
|
$ |
11,191 |
|
|
$ |
11,191 |
|
|
$ |
10,825 |
|
|
$ |
10,825 |
|
|
$ |
5,192 |
|
|
Total equity |
|
$ |
199,873 |
|
|
$ |
316,528 |
|
|
$ |
148,922 |
|
|
$ |
61,267 |
|
|
$ |
90,985 |
|
|
|
|
|
|
|
|
|
|
|
|
|
|
|
|
|
|
|
|
|
|
|
|
Adjusted EBITDAX :*** |
|
|
|
|
|
|
|
|
|
|
|
|
|
|
|
|
|
|
|
|
|
|
|
|
|
|
|
|
|
|
|
|
|
|
|
|
|
|
|
|
|
|
|
Net loss |
|
$ |
(116,655 |
) |
|
$ |
(28,834 |
) |
|
$ |
(19,875 |
) |
|
$ |
(53,321 |
) |
|
$ |
(46,791 |
) |
|
(Gain) loss on sale of property and equipment |
|
|
(1,617 |
) |
|
|
— |
|
|
|
121 |
|
|
|
(4,785 |
) |
|
|
5,356 |
|
|
Interest expense, net |
|
|
722 |
|
|
|
597 |
|
|
|
487 |
|
|
|
273 |
|
|
|
226 |
|
|
Income tax (benefit) expense |
|
|
(26,442 |
) |
|
|
22,105 |
|
|
|
— |
|
|
|
— |
|
|
|
— |
|
|
Depreciation, depletion, amortization and accretion |
|
|
31,778 |
|
|
|
18,731 |
|
|
|
17,328 |
|
|
|
12,370 |
|
|
|
16,410 |
|
|
Impairment expense |
|
|
138,086 |
|
|
|
19,359 |
|
|
|
12,298 |
|
|
|
52,475 |
|
|
|
34,294 |
|
|
Exploration expense |
|
|
142 |
|
|
|
111 |
|
|
|
2,490 |
|
|
|
57 |
|
|
|
11 |
|
|
Unrealized (gain) loss on derivative contracts |
|
|
(125 |
) |
|
|
(3,614 |
) |
|
|
45 |
|
|
|
— |
|
|
|
— |
|
|
Adjusted EBITDAX |
|
$ |
25,889 |
|
|
$ |
28,455 |
|
|
$ |
12,894 |
|
|
$ |
7,069 |
|
|
$ |
9,506 |
|
|
|
* |
Barrels of oil equivalent have been calculated on the basis of six thousand cubic feet (Mcf) of natural gas equals one barrel of oil equivalent (BOE). |
41
|
|
*** |
Adjusted EBITDAX is a Non-GAAP measure that differs from the GAAP measure of Net Income. Adjusted EBITDAX is calculated as shown above. Adjusted EBITDAX should not be considered as an alternative to net income (as an indicator of operating performance) or as an alternative to cash flow (as a measure of liquidity or ability to service debt obligations) and is not in accordance with, nor superior to, generally accepted accounting principles, but provides additional information for evaluation of our operating performance. |
Item 7. Management’s Discussion and Analysis of Financial Condition and Results of Operations
The following discussion of our financial condition, results of operations, liquidity and capital resources should be read together with our consolidated financial statements and the notes to consolidated financial statements, which are included in the report in Item 8, and the information set forth in Risk Factors under Item 1A. Unless the context otherwise requires, the terms “the Company”, “our”, “we”, “us”, and “Earthstone” refer to Earthstone Energy, Inc. and its consolidated subsidiaries.
The following discussion contains “forward-looking statements” that reflect our future plans, estimates, beliefs and expected performance. We caution that assumptions, expectations, projections, intentions or beliefs about future events may, and often do, vary from actual results and the differences can be material. Some of the key factors that could cause actual results to vary from our expectations include changes in oil and natural gas prices, the timing of planned capital expenditures, availability of acquisitions, joint ventures and dispositions, uncertainties in estimating proved reserves and forecasting production results, potential failure to achieve production from development projects, operational factors affecting the commencement or maintenance of producing wells, the condition of the capital and financial markets generally, as well as our ability to access them, and uncertainties regarding environmental regulations or litigation and other legal or regulatory developments affecting our business, as well as those factors discussed below and elsewhere in this report, all of which are difficult to predict. In light of these risks, uncertainties and assumptions, the forward-looking events discussed may not occur. See “Cautionary Statement Regarding Forward-Looking Statements” and Item 1A. Risk Factors.
Executive Overview
Strategy and 2016 Outlook
We are a growth-oriented independent oil and gas company engaged in the development and acquisition of oil and gas reserves through an active and diversified program that includes the acquisition, drilling and development of undeveloped leases, asset and corporate acquisitions, and exploration activities, with its current primary assets located in the Eagle Ford trend of south Texas and in the Williston Basin of North Dakota. As further discussed in this report, future growth in assets, earnings, cash flows and share values will be dependent upon our ability to acquire, discover and develop commercial quantities of oil and natural gas reserves that can be produced at a profit, and assemble an oil and natural gas reserve base with a market value exceeding its acquisition, development and production costs. Our strategy includes a combination of acquisition, development and exploration activities, typically in more than one basin. Historically, we have shifted our emphasis among these basic activities to take advantage of changing market conditions and to facilitate profitable growth. The majority of our efforts are currently focused on developing our acreage positions in the Eagle Ford trend of South Texas and in the Williston Basin of North Dakota. In addition, it is essential that, over time, our personnel expand our current projects and/or generate additional projects so that we have the potential to economically replace our production and increase our proved reserves.
The significant declines in oil and natural gas prices since September 2014 have adversely impacted our business and the industry as a whole. In spite of the severe price declines we achieved certain goals in 2015 which included:
|
|
· |
converting a large portion of our acreage to held by production (“HBP”) status, while improving our lease expiration profile to minimize near-term lease expirations; |
|
|
· |
lowering our operating costs and general and administrative costs, on a unit of production basis; |
|
|
· |
increasing efficiencies and significantly decreasing our drilling and completion costs, generally beyond reductions in the prevailing in the industry; and |
|
|
· |
securing a significant corporate acquisition, which when closed will facilitate our entry into the Permian Basin and will add current production and drilling inventory on leases that are largely HBP. |
At December 31, 2015, 60% of our operated Eagle Ford and substantially all our Bakken acreage is held-by-production. Of the approximately 8,000 remaining total net undeveloped acres prospective for the Eagle Ford, Upper Eagle Ford, Austin Chalk and possibly other objectives, only 2,400 net acres could expire in 2016. We anticipate that our current and future drilling plans, along with the selected lease extensions, will address the majority of the lease expirations.
42
For 2016, it is our intent to conduct our operations within our available cash flows. To that end, we have temporarily suspended drilling and completion operations and, in relation to general and administrative costs, we reduced our head count and salaries. Generally, base salaries have been reduced 10% and we have reduced certain benefits. Further, we do not intend to pay cash bonuses during 2016. Our actions are in direct response to continuing poor commodity prices. While we have made appropriate adjustments, we have also maintained a positive corporate culture and retained an outstanding staff. While conducting operations within available cash flow, we will continue to pursue our business strategy. Following is a brief outline of our current plans:
|
|
· |
pursue attractive asset or corporate acquisitions; |
|
|
· |
maintain and expand our acreage positions and drilling inventory; |
|
|
· |
pending adequate commodity prices continue the development of our acreage positions in the Eagle Ford trend of South Texas and in the Williston Basin of North Dakota; and |
|
|
· |
generate additional exploration and development projects; and obtain additional capital as available and needed, or utilize our common stock for acquisitions. |
Commodity Prices:
The upstream oil and natural gas business is cyclical and we are currently operating in a sustained lower commodity price environment. Our consolidated average realized prices for fiscal year 2015 decreased 49% for crude oil, 42% for natural gas and 57% for natural gas liquids as compared with 2014. These low prices resulted in a reduction in our capital spending program, had significant negative impacts on our revenues, profitability, cash flows and proved reserves, resulted in asset and goodwill impairments, caused us to execute certain organizational changes, and led to reductions in our stock price.
Thus far in 2016, commodity prices have continued to trade in a low range, with crude oil prices falling below $30.00 per barrel on some occasions. If the industry downturn continues for an extended period, or becomes more severe, we could experience additional material negative impacts on our revenues, profitability, cash flows, liquidity, and reserves, and we could consider further reductions in our capital program. Our production and our stock price could decline further as a result of these activities. See Item 1A. Risk Factors, in this report for further discussion.
Results of Operations
Year ended December 31, 2015, compared to the year ended December 31, 2014
Sales and Other Operating Revenues
The quantities of oil, natural gas, and natural gas liquids produced and sold, the average sales price per unit sold and our related revenues, exclusive of settlements related to derivative contracts for the years ended December 31, 2015 and 2014, are presented below:
|
|
|
Years Ended December 31, |
|
|
|
|
|
|||||
|
|
|
2015 |
|
|
2014 |
|
|
Change |
|
|||
|
Sales volumes: |
|
|
|
|
|
|
|
|
|
|
|
|
|
Oil (MBbl) |
|
|
904 |
|
|
|
403 |
|
|
|
501 |
|
|
Natural gas (MMcf) |
|
|
2,143 |
|
|
|
2,132 |
|
|
|
11 |
|
|
Natural gas liquids (MBbl) |
|
|
176 |
|
|
|
124 |
|
|
|
52 |
|
|
Barrel of oil equivalent (MBOE) (1) |
|
|
1,437 |
|
|
|
882 |
|
|
|
555 |
|
|
Barrel of oil equivalent per day (BOEPD) (1) |
|
|
3,936 |
|
|
|
2,416 |
|
|
|
1,520 |
|
|
|
|
|
|
|
|
|
|
|
|
|
|
|
|
Average prices realized: (2) |
|
|
|
|
|
|
|
|
|
|
|
|
|
Oil ( per Bbl) |
|
$ |
44.09 |
|
|
$ |
86.29 |
|
|
$ |
(42.20 |
) |
|
Natural gas (per Mcf) |
|
$ |
2.55 |
|
|
$ |
4.39 |
|
|
$ |
(1.84 |
) |
|
Natural gas liquids (per Bbl) |
|
$ |
12.29 |
|
|
$ |
28.29 |
|
|
$ |
(16.00 |
) |
43
|
|
Years Ended December 31, |
|
|
|
|
|
||||||
|
(In thousands) |
|
2015 |
|
|
2014 |
|
|
Change |
|
|||
|
Oil, natural gas, and natural gas liquids revenues: |
|
|
|
|
|
|
|
|
|
|
|
|
|
Oil |
|
$ |
39,849 |
|
|
$ |
34,734 |
|
|
$ |
5,115 |
|
|
Natural gas |
|
$ |
5,457 |
|
|
$ |
9,367 |
|
|
$ |
(3,910 |
) |
|
Natural gas liquids |
|
$ |
2,158 |
|
|
$ |
3,510 |
|
|
$ |
(1,352 |
) |
|
|
|
|
|
|
|
|
|
|
|
|
|
|
|
Other operating revenues: |
|
|
|
|
|
|
|
|
|
|
|
|
|
Gathering income |
|
$ |
309 |
|
|
$ |
383 |
|
|
$ |
(74 |
) |
|
Gain on sale of oil and gas properties, net |
|
$ |
1,617 |
|
|
$ |
— |
|
|
$ |
1,617 |
|
|
Total revenues |
|
$ |
49,390 |
|
|
$ |
47,994 |
|
|
$ |
1,396 |
|
|
|
(1) |
Barrels of oil equivalent have been calculated on the basis of six thousand cubic feet (Mcf) of natural gas equals one barrel of oil equivalent (BOE). This ratio does not assume price equivalency and, given price differentials, the price per barrel of oil equivalent for natural gas may differ significantly from the price for a barrel of oil. |
|
|
(2) |
Amounts exclude the impact of cash paid/received on settled derivative contracts as we did not elect to apply hedge accounting. Our derivatives for 2015 and 2014 have been marked-to-market through our Consolidated Statements of Operations as other income/expense: which means that all our realized gains/losses on these derivatives are reported in other income/expense. For further information see the Net Gain on Derivative Contracts discussed below. |
Sale of Oil
For the year ended December 31, 2015, oil revenues increased by $5.1 million or 15% relative to the comparable period in 2014. Of the increase, $22.1 million was attributable to increased volume, which was offset by $17.0 million attributable to a decrease in our realized price. The volume of oil we produced and sold increased by 501 MBbls; 317 MBbls were provided by our operated Eagle Ford property as a result of additional production from new wells drilled and completed during 2015 as well as the additional interests we acquired in late 2014 pursuant to the Contribution Agreement; 212 MBbls of the total increase were provided by the legacy Earthstone assets. These significant increases were partially offset by production declines at our non-operated Eagle Ford property and variability in sales volumes in our conventional properties in Texas. Our average realized price per Bbl decreased from $86.29 for the year ended December 31, 2014 to $44.09 or 49% for the year ended December 31, 2015.
Sale of Natural Gas
For the year ended December 31, 2015, natural gas revenues decreased by $3.9 million or 42% relative to the comparable period in 2014. Substantially all of the $3.9 million decrease was attributable to the decrease in our realized price. The total volume of natural gas produced and sold remained relatively consistent and increased by only 11 MMcf in total. At the property level however, on our operated Eagle Ford property the volume of natural gas produced and sold increased by 96 MMcf as a result of additional production from new wells drilled and completed during 2015 as well as the additional interests we acquired in late 2014 pursuant to the Contribution Agreement; the legacy Earthstone assets increased our volumes by 271 MMcf. These increases were offset by the loss of 169 MMcf from the Louisiana properties that were sold in April 2015 and production declines of 130 MMcf on our East Texas property. The remaining 57 MMcf decrease in volumes was due to decreased production in our conventional properties located in Oklahoma and South Texas. Our average realized price per Mcf decreased from $4.39 for the year ended December 31, 2014 to $2.55 or 42% for the year ended December 31, 2015.
Sale of Natural Gas Liquids
For the year ended December 31, 2015, natural gas liquids revenues decreased by $1.4 million or 39% relative to the comparable period in 2014. Of the decrease, $2.0 million was attributable to a decrease in our realized price which was offset by a $0.6 million increase due to volume. The volume of natural gas liquids sales produced and sold increased by 52 MBbls; 30 MBbls of the total were provided by our operated Eagle Ford property as a result of additional production from new wells as well as the additional interests we acquired in late 2014 pursuant to the Contribution Agreement and 31 MBbls of the total were provided by the legacy Earthstone assets; these increases were partially offset by production declines of 9 MBbls from our non-operated Eagle Ford property. Average realized price per Bbl decreased from $28.29 for the year ended December 31, 2014 to $12.29 or 57% for the year ended December 31, 2015.
44
Adjustments Related to Litigation.
During February 2016, in connection with the BHP litigation discussed in Note 12 Commitments and Contingencies within the Notes to the Consolidated Financial Statements, the Company, after consultation with its litigation counsel, accepted “non-consent” status, related to nine (9) wells located in La Salle County, Texas that were drilled and completed by a third party operator. This non-consent status will allow the operator to recoup penalties generally equal to 500% of well costs and 200% of facility costs, allocable to our interests. These wells were placed on production in late 2014 and early 2015. In accordance with GAAP, the Company accrued production, revenues, and expenses related to these nine wells through September 30, 2015. Based on certain events occurring in the litigation in early 2016 and the receipt of a legal opinion, the Company recorded adjustments to sales volumes, revenues and production expenses in its consolidated financial statements during the fourth quarter of 2015. Excluding the interim adjustments related to these nine wells, total Company production for the quarter ended December 31, 2015, would have been 3,872 Boepd. A summary of the production volumes and downward revenue adjustments occurring in the fourth quarter 2015 are as follows:
|
Sales volumes: |
|
|
|
|
|
Oil (MBbl) |
|
|
13 |
|
|
Natural gas (MMcf) |
|
|
367 |
|
|
Natural gas liquids (MBbl) |
|
|
30 |
|
|
Barrel of oil equivalent (MBOE) |
|
|
105 |
|
|
|
|
|
|
|
|
(In thousands) |
|
|
|
|
|
Revenues: |
|
|
|
|
|
Oil |
|
$ |
431 |
|
|
Natural gas |
|
|
1,019 |
|
|
Natural gas liquids |
|
|
447 |
|
|
Total revenues |
|
$ |
1,897 |
|
This partial resolution of this one matter involved in the litigation also resulted in a decrease in our lease operating expenses and production taxes of $0.8 million and $0.1 million, respectively. In addition, accounts payable and accrued liabilities were reduced by approximately $8.7 million, accounts receivable decreased by $0.5 million and proved properties decreased by $9.2 million.
Production Costs
Our production costs for the years ended December 31, 2015 and 2014 are summarized in the table below:
|
|
|
Years Ended December 31, |
|
|
|
|
|
|||||
|
(In thousands) |
|
2015 |
|
|
2014 |
|
|
Change |
|
|||
|
Lease operating expenses |
|
$ |
15,409 |
|
|
$ |
10,122 |
|
|
$ |
5,287 |
|
|
Severance taxes |
|
$ |
2,582 |
|
|
$ |
2,002 |
|
|
$ |
580 |
|
|
Re-engineering and workover expenses |
|
$ |
872 |
|
|
$ |
708 |
|
|
$ |
164 |
|
|
|
|
|
|
|
|
|
|
|
|
|
|
|
|
LOE per BOE* |
|
$ |
10.11 |
|
|
$ |
10.59 |
|
|
$ |
(0.48 |
) |
|
|
|
|
|
|
|
|
|
|
|
|
|
|
|
Severance tax as a percent of crude oil, natural gas and natural gas liquids revenues |
|
|
5.44 |
% |
|
|
4.20 |
% |
|
|
1.24 |
% |
|
|
* |
Excludes ad valorem tax and accretion expense related to the asset retirement obligation. |
45
Lease operating expenses (“LOE”) includes all costs incurred to operate wells and related facilities for both operated and non-operated properties. In addition to direct operating costs such as labor, repairs and maintenance, equipment rentals, materials and supplies, fuel and chemicals, LOE includes product marketing and transportation fees, insurance, ad valorem taxes, accretion expense related to asset retirement obligations, and overhead charges provided for in operating agreements.
|
|
|
Years Ended December 31, |
|
|
|
|
|
|||||
|
(In thousands) |
|
2015 |
|
|
2014 |
|
|
Change |
|
|||
|
Production related LOE |
|
$ |
14,531 |
|
|
$ |
9,336 |
|
|
$ |
5,195 |
|
|
Ad valorem taxes |
|
$ |
328 |
|
|
$ |
469 |
|
|
$ |
(141 |
) |
|
Accretion expense |
|
$ |
550 |
|
|
$ |
317 |
|
|
$ |
233 |
|
|
Total LOE |
|
$ |
15,409 |
|
|
$ |
10,122 |
|
|
$ |
5,287 |
|
Total LOE increased by $5.3 million or 52% for the year ended December 31, 2015 relative to the comparable period in 2014, which was due to the addition of the legacy Earthstone assets, costs on the new wells that we drilled and completed during 2015 in our operated Eagle Ford property as well as having a larger share of the gross costs in our Eagle Ford property due to the additional interests we acquired in late 2014 pursuant to the Contribution Agreement. On a unit-of-production basis, LOE, excluding ad valorem taxes and accretion expense, decreased by 5% or $0.48 per BOE from $10.59 in 2014 to $10.11 in 2015. The decrease on a per BOE basis was due to a decrease in the cost of oil field services as well as economies of scale on our operated Eagle Ford property which offset the increase that resulted from the addition of the legacy Earthstone assets which have a higher operating cost on a per BOE basis than many of our Eagle Ford wells.
Severance Taxes
Severance taxes increased by $0.6 million or 29% for the year ended December 31, 2015 relative to the comparable period in 2014 primarily due to the additional production from new wells drilled and completed during 2015 in our operated Eagle Ford property as well as the additional interests we acquired in late 2014 pursuant to the Contribution Agreement in that same property and the addition of the legacy Earthstone assets. As a percentage of revenues from oil, natural gas, and natural gas liquids, severance taxes increased from 4.20% to 5.44%, primarily due to a shift in our sales; for the year ended December 31, 2015, approximately 84% of our oil, natural gas and natural gas liquids revenue came from oil versus approximately 73% in same period during 2014. These oil revenues are taxed at the full rate whereas a large portion of our natural gas and natural gas liquids sales qualify for partial or full severance tax exemptions. Additionally, in late 2014, as result of the Exchange we added significant oil production from legacy Earthstone assets located in North Dakota and Montana; these states have higher severance tax rates than Texas where our operated Eagle Ford wells are located.
Re-engineering and Workovers
Re-engineering and workover expenses include the costs to restore or enhance production in current producing zones as well as costs of significant non-recurring operations which include major surface repairs. These costs increased $0.2 million or 23% for the year ended December 31, 2015 relative to the comparable period in 2014. We continually evaluate these projects and weigh the advantages of the projects while seeking to control current and future expenditures.
General and Administrative Expenses
General and administrative expenses (“G&A”), primarily consist of employee remuneration, professional and consulting fees and other overhead expenses. G&A expenses increased by $2.4 million or 31% from $7.9 million to $10.3 million for the year ended December 31, 2015 relative to the comparable period in 2014. The increase was due to increased personnel costs and reporting requirements resulting from the Exchange completed in late 2014 and the growth of the Company. Also contributing to the increase are costs incurred, which must be expensed under GAAP, related to finding and completing property and corporate acquisitions.
Depreciation, Depletion and Amortization and Impairment Expense
|
|
|
Years Ended December 31, |
|
|
|
|
|
|||||
|
(In thousands) |
|
2015 |
|
|
2014 |
|
|
Change |
|
|||
|
DD&A |
|
$ |
31,228 |
|
|
$ |
18,414 |
|
|
$ |
12,814 |
|
|
Impairment expense |
|
$ |
138,086 |
|
|
$ |
19,359 |
|
|
$ |
118,727 |
|
|
DD&A per BOE |
|
$ |
21.73 |
|
|
$ |
20.88 |
|
|
$ |
0.85 |
|
46
Depreciation, depletion and amortization (“DD&A”) increased in the year ended December 31, 2015 by $12.8 million, or 70% compared to 2014, due to property additions related primarily to drilling and completion expenditures and increased production during the year ended December 31, 2015, as compared to the same period in 2014. On a unit-of-production basis, DD&A increased by only 4% despite significant capital additions to $21.73 per BOE during 2015 from $20.88 per BOE during 2014.
Impairment
As a result of large commodity price declines and in spite of our operating achievements, we recognized $138.1 million of noncash asset impairments in 2015 that have negatively impacted our results of operations and equity. The 2015 impairments consisted of $42.6 million on unproved properties, $94.0 million on proved properties and $1.5 of goodwill. The impaired unproved properties consisted mainly of acreage throughout Milam and Grayson Counties in Texas as well as our Eagle Ford property in Fayette and Gonzales Counties in Texas. The impairment on proved properties resulted from capitalized costs in excess of the fair market value for our Eagle Ford properties in Fayette and Gonzales Counties in Texas as well as our non-operated Eagle Ford property in La Salle County, Texas. We also had impairments on the legacy Earthstone assets in Montana, Wyoming, North Dakota and south Texas.
During the year ended December 31, 2014, we incurred property impairment charges of $19.4 million, which consisted of $2.5 million on unproved properties and $16.9 million on proved properties. The impaired unproved properties consisted of acreage throughout Milam County, Texas. The impairment on proved properties primarily resulted from capitalized costs in excess of the fair market value for our non-operated Eagle Ford property and our Grayson County, Texas property.
Interest Expense
Interest expense includes commitment fees, amortization of deferred financing costs, and interest on outstanding indebtedness. Interest expense increased from $0.6 million for the year ended December 31, 2014 to $0.8 million for the year ended December 31, 2015. The $0.2 million increase in interest expense was due to higher amortization of deferred financing costs and increased fees due to a larger credit facility.
Income Tax Expense
During the year ended December 31, 2015, we recorded a net income tax benefit of $26.4 million as a result of our pre-tax net loss. Our effective tax rate for the year ended December 31, 2015, was approximately 18.5% which was less than the U.S. federal statutory tax rate primarily due to the addition of a valuation allowance in 2015. The impairments recorded during 2015 reduced the book value of our properties below our tax basis requiring us to record a net deferred tax asset. Because the future realization of this deferred tax asset cannot be assured, we recorded a valuation allowance against our deferred tax asset.
As a result of the Exchange, all historical financial information contained in this report is that of OVR and its subsidiaries. OVR, is a partnership for federal income tax purposes and is not subject to federal income taxes or state or local income taxes that follow the federal treatment, and therefore OVR does not pay or accrue for such taxes. Pursuant to the Exchange, Oak Valley has become a subsidiary of Earthstone, a taxable entity; as such we recorded tax expense during the year ended December 31, 2014.
Net Gain on Derivative Contracts
During the year ended December 31, 2015, we recorded a net gain on derivative contracts of $6.4 million, consisting of net realized gains on settlements of $6.3 million and unrealized mark-to-market gains of $0.1 million. During the year ended December 31, 2014, we recorded a net gain on derivative contracts of $4.4 million, consisting of net realized gains on settlements of $0.8 million and unrealized mark-to-market gains of $3.6 million.
47
Year ended December 31, 2014 compared to the year ended December 31, 2013
Sales and Other Operating Revenues
The quantities of oil, natural gas, and natural gas liquids produced and sold, the average sales price per unit sold and our related revenues, exclusive of settlements related to derivative contracts for the years ended December 31, 2014 and 2013, are presented below:
|
|
|
Years Ended December 31, |
|
|
|
|
|
|||||
|
|
|
2014 |
|
|
2013 |
|
|
Change |
|
|||
|
Sales volumes: |
|
|
|
|
|
|
|
|
|
|
|
|
|
Oil (MBbl) |
|
|
403 |
|
|
|
163 |
|
|
|
240 |
|
|
Natural gas (MMcf) |
|
|
2,132 |
|
|
|
2,635 |
|
|
|
(503 |
) |
|
Natural gas liquids (MBbl) |
|
|
124 |
|
|
|
134 |
|
|
|
(10 |
) |
|
Barrel of oil equivalent (MBOE) (1) |
|
|
882 |
|
|
|
737 |
|
|
|
145 |
|
|
Barrel of oil equivalent per day (BOEPD) (1) |
|
|
2,416 |
|
|
|
2,019 |
|
|
|
397 |
|
|
|
|
|
|
|
|
|
|
|
|
|
|
|
|
Average prices realized: (2) |
|
|
|
|
|
|
|
|
|
|
|
|
|
Oil ( per Bbl) |
|
$ |
86.29 |
|
|
$ |
98.32 |
|
|
$ |
(12.03 |
) |
|
Natural gas (per Mcf) |
|
$ |
4.39 |
|
|
$ |
3.69 |
|
|
$ |
0.70 |
|
|
Natural gas liquids (per Bbl) |
|
$ |
28.29 |
|
|
$ |
28.88 |
|
|
$ |
(0.59 |
) |
|
|
|
Years Ended December 31, |
|
|
|
|
|
|||||
|
(In thousands) |
|
2014 |
|
|
2013 |
|
|
Change |
|
|||
|
Oil, natural gas, and natural gas liquids revenues: |
|
|
|
|
|
|
|
|
|
|
|
|
|
Oil |
|
$ |
34,734 |
|
|
$ |
16,038 |
|
|
$ |
18,696 |
|
|
Natural gas |
|
$ |
9,367 |
|
|
$ |
9,714 |
|
|
$ |
(347 |
) |
|
Natural gas liquids |
|
$ |
3,510 |
|
|
$ |
3,882 |
|
|
$ |
(372 |
) |
|
|
|
|
|
|
|
|
|
|
|
|
|
|
|
Other operating revenues: |
|
|
|
|
|
|
|
|
|
|
|
|
|
Gathering income |
|
$ |
383 |
|
|
$ |
430 |
|
|
$ |
(47 |
) |
|
Loss on sale of oil and gas properties, net |
|
$ |
— |
|
|
$ |
(121 |
) |
|
$ |
121 |
|
|
Total revenues |
|
$ |
47,994 |
|
|
$ |
29,943 |
|
|
$ |
18,051 |
|
|
|
(1) |
Barrels of oil equivalent have been calculated on the basis of six thousand cubic feet (Mcf) of natural gas equals one barrel of oil equivalent (BOE). This ratio does not assume price equivalency and, given price differentials, the price per barrel of oil equivalent for natural gas may differ significantly from the price for a barrel of oil. |
|
|
(2) |
Amounts exclude the impact of cash paid/received on settled derivative contracts as we did not elect to apply hedge accounting. Our derivatives for 2015 and 2014 have been marked-to-market through our Consolidated Statements of Operations as other income/expense: which means that all our realized gains/losses on these derivatives are reported in other income/expense. For further information see the Net Gain on Derivative Contracts discussed below. |
Sale of Oil
For the year ended December 31, 2014, oil revenues increased by $18.7 million or 117% relative to the comparable period in 2013. Of the increase, $23.5 million was attributable to increased volume, which was offset by $4.8 million attributable to a decrease in our realized price. Oil sales volumes increased by 240 MBbls primarily due to an increase of 223 MBbls produced from our operated Eagle Ford property. The interest in these properties that we acquired during 2013 provided for 212 MBbls of the increase while the additional interest we acquired in December 2014 pursuant to the Contribution Agreement, provided for an additional 10 MBbls. Also contributing to the increase in oil sales volumes was 6 MBbls from the legacy Earthstone assets and 12 MBbls from our Grayson County wells that were drilled in late 2013. Average realized price per Bbl decreased from $98.32 for the year ended December 31, 2013 to $86.29 for the year ended December 31, 2014.
Sale of Natural Gas
For the year ended December 31, 2014, natural gas revenues decreased by $0.3 million or 4% relative to the comparable period in 2013. Of the decrease, $1.8 million was attributable to decreased volume, which was offset by $1.5 million attributable to an increase in our realized price. Natural gas sales volumes decreased by 503 MMcf primarily due to a decline in production of 406 MMcf from our non-operated Eagle Ford properties in La Salle County, Texas, a decline in production of 143 MMcf from our non-operated east Texas properties, as well as approximately 61 MMcf due to natural production declines in our other properties. The decreases in
48
production volumes were offset by a production increase of 97 MMcf from our operated Eagle Ford property. The interest in these properties that we acquired during 2013 provided for 93 MMcf of the increase while the additional interest we acquired in December 2014 pursuant to the Contribution Agreement, provided for an additional 4 MMcf. Also offsetting the decreases above was 10 MMcf from the legacy Earthstone properties. Our average realized price per Mcf increased from $3.69 for the year ended December 31, 2013 to $4.39 for the year ended December 31, 2014.
Sale of Natural Gas Liquids
For the year ended December 31, 2014, natural gas liquids revenues decreased by $0.4 million or 10% relative to the comparable period in 2013. Of the decrease, $0.3 million was attributable to decreased volume and $0.1 million was attributable to realized price. Natural gas liquids sales volumes decreased by 10 MBbls primarily due to a decline in production of 39 MBbls from our non-operated Eagle Ford properties in La Salle County, Texas, which was offset by increases in production of 26 MBbls from our operated Eagle Ford property. The interest in these properties that was acquired during 2013 accounted for substantially all of this increase. Average realized price per Bbl decreased from $28.88 for the year ended December 31, 2013 to $28.29 for the year ended December 31, 2014.
Production Costs
Our production costs for the years ended December 31, 2014 and 2013, are summarized in the table below:
|
|
|
Years Ended December 31, |
|
|
|
|
|
|||||
|
(In thousands) |
|
2014 |
|
|
2013 |
|
|
Change |
|
|||
|
Lease operating expenses |
|
$ |
10,122 |
|
|
$ |
8,426 |
|
|
$ |
1,696 |
|
|
Severance taxes |
|
$ |
2,002 |
|
|
$ |
1,225 |
|
|
$ |
777 |
|
|
Re-engineering and workover expenses |
|
$ |
708 |
|
|
$ |
342 |
|
|
$ |
366 |
|
|
|
|
|
|
|
|
|
|
|
|
|
|
|
|
LOE per BOE* |
|
$ |
10.59 |
|
|
$ |
10.47 |
|
|
$ |
0.12 |
|
|
|
|
|
|
|
|
|
|
|
|
|
|
|
|
Severance tax as a percent of crude oil, natural gas and natural gas liquids revenues |
|
|
4.20 |
% |
|
|
4.13 |
% |
|
|
0.07 |
% |
|
|
* |
Excludes ad valorem tax and accretion expense related to the asset retirement obligation. |
Lease Operating Expenses
|
|
|
Years Ended December 31, |
|
|
|
|
|
|||||
|
(In thousands) |
|
2014 |
|
|
2013 |
|
|
Change |
|
|||
|
Production related LOE |
|
$ |
9,336 |
|
|
$ |
7,716 |
|
|
$ |
1,620 |
|
|
Ad valorem taxes |
|
$ |
469 |
|
|
$ |
494 |
|
|
$ |
(25 |
) |
|
Accretion expense |
|
$ |
317 |
|
|
$ |
216 |
|
|
$ |
101 |
|
|
Total LOE |
|
$ |
10,122 |
|
|
$ |
8,426 |
|
|
$ |
1,696 |
|
Total LOE increased by $1.7 million or 20% for the year ended December 31, 2014 relative to the comparable period in 2013. The increase in LOE was primarily due to our operated Eagle Ford properties. On a unit-of-production basis, LOE, excluding ad valorem taxes and accretion expense, has remained relatively consistent, increasing by only $0.12 per BOE from $10.59 in 2014 to $10.47 in 2013. The additional interests that we acquired in our operated Eagle Ford property during December 2014 accounted for $50,000 of the total increase while the legacy Earthstone assets accounted for $53,000 of the increase.
Severance Taxes
Severance taxes increased by $0.8 million or 63% for the year ended December 31, 2014 relative to the comparable period in 2013. The increase in severance taxes was primarily due to increased production from our operated Eagle Ford property. The interest in this property that we acquired during 2013 accounted for $0.9 million of the total increase while the additional interest we acquired in December 2014 added $30,000. The legacy Earthstone assets added an additional $35,000. These increases were offset by decreases on our non-operated Eagle Ford property. As a percentage of revenues from oil, natural gas, and natural gas liquids, severance taxes increased from 4.13% to 4.20%.
49
Re-engineering and workover expenses increased $0.4 million or 107% for the year ended December 31, 2014 relative to the comparable period in 2013. During 2014, we began completing several projects associated with integrating the interests we acquired during 2013 in our operated Eagle Ford property into our operations and reducing the rate at which those wells decline.
General and Administrative Expenses
G&A expenses increased by $0.1 million from $7.8 million to $7.9 million for the year ended December 31, 2014 relative to the comparable period in 2013. The increase was due to increased headcount and strategic combination related costs but was largely offset by increased overhead cost re-imbursements provided for in our joint operating agreements on the properties we operate.
Depreciation, Depletion and Amortization and Impairment Expense
|
|
|
Years Ended December 31, |
|
|
|
|
|
|||||
|
(In thousands) |
|
2014 |
|
|
2013 |
|
|
Change |
|
|||
|
DD&A |
|
$ |
18,414 |
|
|
$ |
17,111 |
|
|
$ |
1,303 |
|
|
Impairment expense |
|
$ |
19,359 |
|
|
$ |
12,298 |
|
|
$ |
7,061 |
|
|
DD&A per BOE |
|
$ |
20.88 |
|
|
$ |
23.22 |
|
|
$ |
(2.34 |
) |
DD&A increased in 2014 by $1.3 million, or 8% compared to 2013, due to property additions related primarily to drilling and completion expenditures and increased production during the year ended December 31, 2014, as compared to the same period in 2013. However, on a unit-of-production basis, DD&A decreased to $20.88 per BOE during 2014 from $23.22 per BOE during 2013. Despite an increase in capitalized property costs, DD&A on a per BOE basis decreased. Reserves in our operated Eagle Ford properties increased significantly, which helped to bring the per BOE rate down, due to successful drilling in the area which resulted in additional proved reserves. We were also able to decrease the rate per BOE due to improved drilling and completion efficiencies and resultant improvement on finding and development costs on a per BOE basis. The additional interest we acquired in our operated Eagle Ford properties during December 2014 and the legacy Earthstone assets increased DD&A by $0.1 million and $0.1 million, respectively.
Impairment
During the year ended December 31, 2014, we incurred impairment charges of $19.4 million, which consisted of $2.5 million on unproved properties and $16.9 million on proved properties. The impaired unproved properties consisted of acreage throughout Milam County, Texas. The impairment on proved properties primarily resulted from capitalized costs in excess of the fair market value for Oak Valley’s non-operated Eagle Ford property and its Grayson County property.
During the year ended December 31, 2013, we incurred impairment charges of $12.3 million which consisted of $2.5 million on unproved properties and $9.8 million on proved properties. The impaired unproved properties primarily consisted of acreage throughout Oklahoma and in Milam County, Texas. The impairment on proved properties resulted from capitalized costs in excess of the fair market value of our non-operated Eagle Ford property, our Milam County property and one of our east Texas properties.
Interest Expense
Interest expense includes commitment fees, amortization of deferred financing costs, and interest on outstanding indebtedness. Debt outstanding as of December 31, 2014 and December 31, 2013 was $11.2 million and $10.8 million, respectively. Interest expense increased from $0.5 million for the year ended December 31, 2013 to $0.6 million for the year ended December 31, 2014. The $0.1 million increase in interest expense was due to higher amortization of deferred financing costs and increased fees due to a larger credit facility and the accompanying larger unused commitment fees incurred during 2014 versus 2013.
Income Tax Expense
As a result of the Exchange, all historical financial information contained in this report is that of OVR and its subsidiaries. OVR, is a partnership for federal income tax purposes and is not subject to federal income taxes or state or local income taxes that follow the federal treatment, and therefore OVR does not pay or accrue for such taxes. Pursuant to the Exchange, Oak Valley has become a subsidiary of Earthstone, a taxable entity; as such we recorded tax expense during the year ended December 31, 2014.
50
Net Gain on Derivative Contracts
During the year ended December 31, 2014, we recorded a net gain on derivative contracts of $4.4 million, consisting of net realized gains on settlements of $0.8 million and unrealized mark-to-market gains of $3.6 million. During the year ended December 31, 2013, we recorded a net gain on derivative contracts of $0.3 million, consisting of net realized gains on settlements of $0.3 million and unrealized mark-to-market losses of $45,000.
Liquidity and Capital Resources
We have initiated multiple initiatives to reduce capital and operating costs in this low price environment. In the absence of commodity price improvement we intend to limit our capital expenditures to cash flows we can generate. We entered 2016 with an inventory of 12 wells waiting on completion operations. Accordingly, should commodity prices increase we can quickly increase production and cash flows. We expect to finance future acquisition, development and exploration activities through available working capital, cash flows from operating activities, possible borrowings under our credit facility, sale of non-strategic assets, various means of corporate and project financing, and assuming we can access the capital markets, the issuance of additional equity securities. In addition, we may continue to partially finance our drilling activities through the sale of participating rights to industry partners or financial institutions, and we could structure such arrangements on a promoted basis, whereby we may earn working interests in reserves and production greater than our proportionate capital costs. Financing activities for the year ended December 31, 2015, did not result in any equity contributions, while equity contributions for the years ended December 31, 2014, and 2013 were $106.9 million, and $107.5 million, respectively.
Senior Secured Revolving Credit Facility
In December 2014, we entered into a credit agreement providing for a $500.0 million four-year senior secured revolving credit facility (the “Credit Agreement”) with BOKF, NA dba Bank of Texas (“Bank of Texas”), as agent and lead arranger, Wells Fargo Bank, National Association (“Wells Fargo”), as syndication agent, and the Lenders signatory thereto (collectively with Bank of Texas and Wells Fargo, the “Lender”).
The current borrowing base under the Credit Agreement is $80.0 million and is subject to redetermination during May and November of each year. The outstanding borrowings under the Credit Agreement bear interest at a rate elected by us that is equal to a base rate (which is equal to the greater of the prime rate, the Federal Funds effective rate plus 0.50%, and 1-month London Interbank Offered Rate (“LIBOR”) plus 1.00%) or LIBOR, in each case plus the applicable margin. The applicable margin ranges from 1.00% to 1.75% for base rate loans and from 2.00% to 2.75% for LIBOR loans, in each case depending on the amount of the loan outstanding in relation to the borrowing base. We are obligated to pay a quarterly commitment fee of 0.50% per year on the unused portion of the borrowing base, which fee is also dependent on the amount of the loan outstanding in relation to the borrowing base. We are also required to pay customary letter of credit fees. Principal amounts outstanding under the Credit Agreement are due and payable in full at maturity on December 19, 2018.
At December 31, 2015, we had approximately $68.5 million of borrowing capacity under our Credit Agreement. Our Credit Agreement contains customary covenants and we were in compliance with them as of December 31, 2015. For additional details, see Note 9 Long-Term Debt within the notes to the consolidated financial statements.
Cash Flows from Operating Activities
Substantially all of our cash flows from or used in operating activities are derived from and used in the production of our oil, natural gas, and natural gas liquids reserves. We use any excess cash flows to fund our exploration and development activities in search of new reserves. Variations in cash flows from operating activities may impact our level of exploration and development expenditures
Cash flows used in operating activities for the year ended December 31, 2015 were $10.4 million compared to cash flows provided by operating activities of $75.8 million and $15.3 million for the years ended December 31, 2014 and 2013, respectively. The decrease in cash flows from (used in) operating activities was due to changes in our working capital items. Accounts payable and accrued expenses decreased during 2015 by $31.0 million; this reduction used a significant portion of the operating cash flows we generated but positively impacted our working capital and overall balance sheet. We believe we have sufficient liquidity and capital resources to execute our business plan over the next 12 months and for the foreseeable future.
Cash Flows from Investing Activities
Cash applied to oil and natural gas properties for the years ended December 31, 2015, 2014, and 2013 was $61.1 million, $83.0 million and $31.2 million, respectively. During 2014, we used $18.8 million in addition to the common stock issued in connection with the Contribution Agreement to acquire an additional 20% undivided ownership interest in our operated Eagle Ford property. During 2013, we also used $86.7 million to fund the original acquisition of our operated Eagle Ford property. Cash applied to other
51
non-oil and gas property fixed assets for the years ended December 31, 2015, 2014, and 2013 was $0.4 million, $1.4 million and $0.7 million, respectively. In 2013, we received $0.9 million of insurance proceeds from a well control issue on our non-operated Eagle Ford property in La Salle County, Texas. For the years ended December 31, 2015 and 2013, we received proceeds from the sale of oil and gas properties of $3.4 million and $0.5 million, respectively. There were no proceeds from the sale of oil and gas properties in 2014.
Hedging Activities
Typically, hedging commodity prices for a portion of our production is a fundamental part of our financial management strategy, however, we have not hedged material quantities during this industry downturn. We do not engage in speculative commodity trading activities and do not hedge all available or anticipated quantities of our production. In implementing our hedging strategy, we seek to effectively manage cash flow to minimize price volatility.
We normally seek to reduce our sensitivity to oil and natural gas price volatility and secure favorable debt financing terms by entering into commodity derivative transactions. We believe our hedging strategy should result in greater predictability of internally generated funds, which in turn can be dedicated to capital development projects and corporate obligations.
Current Commodity Derivative Contracts
The following is a summary of our current oil and natural gas commodity derivative contracts as of December 31, 2015:
|
Period |
|
Instrument |
|
Commodity |
|
Volume in Bbls |
|
|
Fixed Price |
|
||
|
January 2016 - March 2016 |
|
Swap |
|
Crude Oil |
|
|
15,000 |
|
|
$ |
57.00 |
|
|
January 2016 - June 2016 |
|
Swap |
|
Crude Oil |
|
|
60,000 |
|
|
$ |
58.00 |
|
|
January 2016 - December 2016 |
|
Swap |
|
Crude Oil |
|
|
60,000 |
|
|
$ |
60.80 |
|
|
January 2016 - December 2016 |
|
Swap |
|
Crude Oil |
|
|
60,000 |
|
|
$ |
60.80 |
|
In January 2016 and March 2016, we entered into the following commodity derivative contracts:
|
Period |
|
Instrument |
|
Commodity |
|
Volume in MMBtu/Bbls |
|
|
Fixed Price |
|
||
|
February 2016 - December 2016 |
|
Swap |
|
Natural Gas |
|
|
770,000 |
|
|
$ |
2.53 |
|
|
January 2017 - December 2017 |
|
Swap |
|
Natural Gas |
|
|
480,000 |
|
|
$ |
2.785 |
|
|
April 2016 - March 2017 |
|
Swap |
|
Crude Oil |
|
|
120,000 |
|
|
$ |
42.30 |
|
Fair Market Value of Commodity Derivatives
|
|
|
December 31, 2015 |
|
|
December 31, 2014 |
|
||||||||||
|
(In thousands) |
|
Crude Oil |
|
|
Natural Gas |
|
|
Crude Oil |
|
|
Natural Gas |
|
||||
|
Assets: |
|
|
|
|
|
|
|
|
|
|
|
|
|
|
|
|
|
Current |
|
$ |
3,694 |
|
|
$ |
— |
|
|
$ |
3,293 |
|
|
$ |
276 |
|
|
Non-current |
|
$ |
— |
|
|
$ |
— |
|
|
$ |
— |
|
|
$ |
— |
|
Assets and liabilities are netted within each commodity and counterparty on the balance sheet. For the balances without netting, see Note 4 Derivative Financial Instruments in the Notes To Consolidated Financial Statements contained in this report.
At December 31, 2015, a 10% increase in per unit commodity prices would cause the total fair value asset of our commodity derivative financial instruments to decrease by $0.8 million to $2.9 million. A 10% decrease in per unit commodity prices would cause the total fair value asset of our commodity derivative financial instruments to increase by $0.8 million to $4.5 million. There would also be a similar increase or decrease in “Net gain on derivative contracts” on the Consolidated Statements of Operations.
52
We had the following contractual obligations and commitments as of December 31, 2015:
|
(In thousands) |
|
2016 |
|
|
2017 |
|
|
2018 |
|
|
2019 |
|
|
2020 |
|
|
Thereafter |
|
||||||
|
Debt |
|
$ |
— |
|
|
$ |
— |
|
|
$ |
11,191 |
|
|
$ |
— |
|
|
$ |
— |
|
|
$ |
— |
|
|
Drilling contract* |
|
|
5,919 |
|
|
|
— |
|
|
|
— |
|
|
|
— |
|
|
|
— |
|
|
|
— |
|
|
Gas contracts** |
|
|
1,647 |
|
|
|
1,643 |
|
|
|
1,643 |
|
|
|
1,643 |
|
|
|
1,647 |
|
|
|
680 |
|
|
Office leases |
|
|
724 |
|
|
|
738 |
|
|
|
661 |
|
|
|
627 |
|
|
|
— |
|
|
|
— |
|
|
Asset retirement obligations |
|
|
— |
|
|
|
2,420 |
|
|
|
431 |
|
|
|
15 |
|
|
|
104 |
|
|
|
2,105 |
|
|
Total |
|
$ |
8,290 |
|
|
$ |
4,801 |
|
|
$ |
13,926 |
|
|
$ |
2,285 |
|
|
$ |
1,751 |
|
|
$ |
2,785 |
|
|
|
* |
In January 2016, we suspended drilling and temporarily laid down the drilling rig. The above obligation reflects a negotiated lower daily drilling rate. Our rig contractor has agreed with the suspension, and we will not be required to immediately pay a full termination fee which would otherwise total approximately $5.7 million. Rather, we will pay approximately $600,000 per month, with such payments reducing the full termination fee. If industry conditions do not improve, then we may continue to defer drilling operations. |
|
|
** |
We have reserved gathering and processing capacity in a pipeline and have a volume commitment whereby we pay the owner of the pipeline a fee of $0.45 per MMBtu to hold 10,000 MMBtu per day of capacity. The rate and terms under this purchasing and processing contract expire on June 1, 2021. |
Off-Balance Sheet Arrangements
We have no off-balance sheet arrangements, special purpose entities, financing partnerships or guarantees.
Critical Accounting Policies and Estimates
Our discussion of financial condition and results of operations is based upon the information reported in our consolidated financial statements. The preparation of these statements requires us to make certain assumptions and estimates that affect the reported amounts of assets, liabilities, revenues and expenses as well as the disclosure of contingent assets and liabilities at the date of our financial statements. We base our assumptions and estimates on historical experience and other sources that we believe to be reasonable at the time. Actual results may vary from our estimates due to changes in circumstances, weather, politics, global economics, mechanical problems, general business conditions and other risks. We have outlined below certain of these policies as being of particular importance to the portrayal of our financial position and results of operations and which require the application of significant judgment by our management.
Oil and Natural Gas Properties
We use the successful efforts method of accounting for oil and natural gas operations. Under this method, costs to acquire oil and natural gas properties, drill successful exploratory wells, drill and equip development wells, and install production facilities are capitalized. Exploration costs, including unsuccessful exploratory wells, geological and geophysical are charged to operations as incurred. Depreciation, depletion and amortization of the leasehold and development costs that are capitalized for proved oil and natural gas properties are computed using the units-of-production method, at the field level, based on total proved reserves and proved developed reserves, respectively, as estimated by independent petroleum engineers. Oil and natural gas properties are periodically assessed for impairment whenever changes in facts and circumstances indicate a possible significant deterioration in the future cash flows expected to be generated by an asset group, but at least annually. Individual assets are grouped for impairment purposes at the lowest level for which there are identifiable cash flows that are largely independent of the cash flows of other groups of assets, generally on a field-by-field basis. All of our properties are located within the continental United States.
53
Oil and Natural Gas Reserve Quantities
Reserve quantities and the related estimates of future net cash flows affect our periodic calculations of depletion, impairment of our oil and natural gas properties, and asset retirement obligations. Proved oil and natural gas reserves are the estimated quantities of oil, natural gas and natural gas liquids which geological and engineering data demonstrate with reasonable certainty to be recoverable in future periods from known reservoirs under existing economic and operating conditions. Reserve quantities and future cash flows included in this report are prepared in accordance with guidelines established by the SEC and the Financial Accounting Standards Board (“FASB”). The accuracy of our reserve estimates is a function of:
|
|
· |
The quality and quantity of available data; |
|
|
· |
The interpretation of that data; |
|
|
· |
The accuracy of various mandated economic assumptions; and |
|
|
· |
The judgments of the persons preparing the estimates. |
Our proved reserves information included in this report is based on estimates prepared by our independent petroleum engineers, CG&A. The independent petroleum engineers evaluated 100% of our estimated proved reserve quantities and their related future net cash flows as of December 31, 2015. Estimates prepared by others may be higher or lower than our estimates. Because these estimates depend on many assumptions, all of which may differ substantially from actual results, reserve estimates may be different from the quantities of oil and natural gas that are ultimately recovered. We make revisions to reserve estimates throughout the year as additional information becomes available. We make changes to depletion rates, impairment calculations, and asset retirement obligations in the same period that changes to reserve estimates are made.
Depreciation, Depletion and Amortization
Our rate of recording DD&A is dependent upon our estimates of total proved and proved developed reserves, which estimates incorporate various assumptions and future projections. If the estimates of total proved or proved developed reserves decline, the rate at which we record DD&A expense increases, reducing our net income. Such a decline in reserves may result from lower commodity prices, which may make it uneconomic to drill for and produce higher cost fields. We are unable to predict changes in reserve quantity estimates as such quantities are dependent on the success of our exploitation and development program, as well as future economic conditions.
Impairment of Oil and Natural Gas Properties
We review the value of our oil and natural gas properties whenever management judges that events and circumstances indicate that the recorded carrying value of properties may not be recoverable. Impairments of producing properties are determined by comparing the pretax future net undiscounted cash flows to the net book value at the end of each period. If the net capitalized cost exceeds undiscounted future cash flows, the cost of the property is written down to “fair value,” which is determined based on expected future cash flows using discount rates commensurate with the risks involved, using prices and costs consistent with those used for internal decision making. Different pricing assumptions or discount rates could result in a different calculated impairment. We provide for impairments on significant undeveloped properties when we determine that the property will not be developed or a permanent impairment in value has occurred.
Asset Retirement Obligation
Our asset retirement obligations (“AROs”) consist primarily of estimated future costs associated with the plugging and abandonment of oil and natural gas wells, removal of equipment and facilities from leased acreage, and land restoration in accordance with applicable local, state and federal laws. The discounted fair value of an ARO liability is required to be recognized in the period in which it is incurred, with the associated asset retirement cost capitalized as part of the carrying cost of the oil and natural gas asset. The recognition of an ARO requires that management make numerous assumptions regarding such factors as the estimated probabilities, amounts and timing of settlements; the credit-adjusted risk-free rate to be used; inflation rates; and future advances in technology. In periods subsequent to the initial measurement of the ARO, we must recognize period-to-period changes in the liability resulting from the passage of time and revisions to either the timing or the amount of the original estimate of undiscounted cash flows. Increases in the ARO liability due to passage of time impact net income as accretion expense. The related capitalized cost, including revisions thereto, is charged to expense through DD&A over the life of the field.
Derivative Instruments and Hedging Activity
We periodically enter into commodity derivative contracts to manage our exposure to crude oil and natural gas price volatility. We use hedging to help ensure that we have adequate cash flows to fund our capital programs and manage price risks and returns on some of our acquisitions and drilling programs. Our decision on the quantity and price at which we choose to hedge our production is based, in
54
part, on our view of current and future market conditions. Management exercises significant judgment in determining the types of instruments to be used, production volumes to be hedged, prices at which to hedge, and the counterparties’ creditworthiness. All our counterparties are participants in our credit facility.
All derivative instruments are recorded on the Consolidated Balance Sheets as an asset or a liability. Our swaps are valued based on a discounted future cash flow model. Our primary input for the model is the NYMEX futures index. Our model is validated by the counterparty’s marked-to-market statements. The discount rate used in determining the fair values of these instruments includes a measure of nonperformance risk. Changes in the fair values of our commodity derivative instruments are included in “Net gain on derivative contracts” on the Consolidated Statements of Operations.
Income Taxes and Uncertain Tax Positions
We record deferred tax assets and liabilities to account for the expected future tax consequences of events that have been recognized in our financial statements and our tax returns. We routinely assess the realizability of our deferred tax assets. If we conclude that it is more likely than not that some portion or all of the deferred tax assets will not be realized, the tax asset would be reduced by a valuation allowance. We consider future taxable income in making such assessments. Numerous judgments and assumptions are inherent in the determination of future taxable income, including factors such as future operating conditions (particularly as related to prevailing oil and natural gas prices).
We will consider a tax position settled if the taxing authority has completed its examination, we do not plan to appeal, and it is remote that the taxing authority would reexamine the tax position in the future. We use the benefit recognition model which contains a two-step approach, a more likely than not recognition criteria and a measurement attribute that measures the position as the largest amount of tax benefit that is greater than 50% likely of being realized upon ultimate settlement. If it is not more likely than not that the benefit will be sustained on its technical merits, then we will not record the tax benefit. The amount of interest expense that we recognize related to uncertain tax positions is computed by applying the applicable statutory rate of interest to the difference between the tax position recognized and the amount previously taken or expected to be taken in a tax return.
We are subject to taxation in many jurisdictions, and the calculation of our tax liabilities involves dealing with uncertainties in the application of complex tax laws and regulations in various taxing jurisdictions. If we ultimately determine that the payment of these liabilities will be unnecessary, we reverse the liability and recognize a tax benefit during the period in which we determine the liability no longer applies. Conversely, we record additional tax charges in a period in which we determine that a recorded tax liability is less than we expect the ultimate assessment to be.
Revenue Recognition
We predominantly derive our revenue from the sale of produced oil, natural gas, and natural gas liquids. Revenues are recognized when production is sold to a purchaser at a fixed or determinable price, delivery has occurred, title has been transferred, and collectability is probable. We receive payment from one to three months after delivery. At the end of each quarter, we estimate the amount of production delivered to purchasers and the price we will receive. Variances between our estimated revenue and actual payment are recorded in the month the payment is received. Historically, however, differences have been insignificant.
Accounting for Business Combinations
Our business has grown substantially through acquisitions, and our business strategy is to continue to pursue acquisitions as opportunities arise. We have accounted for all of our business combinations to date using the purchase method.
Under the purchase method of accounting, a business combination is accounted for at a purchase price based upon the fair value of the consideration given. The assets and liabilities acquired are measured at their fair value including the recognition of acquisition-related costs that are separate from the acquired net assets. The purchase price is allocated to the assets and liabilities based upon these fair values. The excess of the cost of an acquired entity, if any, over the net amounts assigned to assets acquired and liabilities assumed is recognized as goodwill. The excess of the fair value of assets acquired and liabilities assumed over the cost of an acquired entity, if any, is allocated as a pro rata reduction of the amounts that otherwise would have been assigned to certain acquired assets.
Determining the fair values of the assets and liabilities acquired involves the use of judgment, since some of the assets and liabilities acquired do not have fair values that are readily determinable. Different techniques may be used to determine fair values, including market prices (where available), appraisals, and comparison to transactions for similar assets and liabilities, and present value of estimated future cash flows, among others. Since these estimates involve the use of significant judgment, they can change as new information becomes available.
55
We account for goodwill in accordance with Financial Accounting Standards Board (“FASB”), Accounting Standards Codification (ASC) 350, Intangibles – Goodwill and Other (“ASC 350”). Goodwill represents the excess of the purchase price over the estimated fair value of the assets acquired net of the fair value of the liabilities assumed in an acquisition. ASC 350 requires that intangible assets with indefinite lives, including goodwill, be evaluated on an annual basis for impairment or more frequently if an event occurs or circumstances change that could potentially result in an impairment. We follow FASBs Accounting Standards Update (“ASU”) No. 2011-08, Testing for Goodwill Impairment (“ASU 2011-08”). ASU 2011-08 simplifies testing for goodwill impairments by allowing entities to first assess qualitative factors to determine whether the facts or circumstances lead to the conclusion that it is more likely than not that the fair value of a reporting unit is less than the carrying value. If the entity concludes that it is not more likely than not that the fair value of a reporting unit is less than its carrying value, then the entity does not have to perform the two-step impairment test. However, if the same conclusion is not reached, the entity is required to perform the first step of the two-step impairment test. In this step, the fair value of the reporting unit is calculated and compared to the carrying value of the reporting unit. If the carrying value exceeds the fair value, then the entity must perform the second step of the impairment test to measure the amount of impairment loss, if any. ASU 2011-08 also allows a company to bypass the qualitative assessment and proceed directly with performing the two-step goodwill impairment test.
Recently Issued Accounting Standards
Revenue Recognition – In May 2014, FASB issued updated guidance for recognizing revenue from contracts with customers. The objective of this guidance is to establish principles for reporting information about the nature, timing, and uncertainty of revenue and cash flows arising from an entity’s contracts with customers, including qualitative and quantitative disclosures about contracts with customers, significant judgments and change in judgments, and assets recognized from the costs to obtain or fulfill a contract. In August 2015, the FASB issued guidance deferring the effective date of this standards update for one year, to be effective for interim and annual periods after December 15, 2017; early adoption is permitted as of the original effective date of December 31, 2016. We will adopt this standards update, as required, beginning with the first quarter of 2018. We are is in the process of evaluating the impact, if any, of the adoption of this guidance on our consolidated financial statements.
Debt Issuance Costs – In April 2015, the FASB issued updated guidance which changes the presentation of debt issuance costs in the financial statements. Under this updated guidance, debt issuance costs are presented on the balance sheet as a direct deduction from the related debt liability rather than as an asset. Amortization of the costs is reported as interest expense. In August 2015, the FASB subsequently issued a clarification as to the handling of debt issuance costs related to line-of-credit arrangements that allows the presentation of these costs as an asset. The standards update is effective for interim and annual periods beginning after December 15, 2015. We will adopt this standards update, as required, beginning with the first quarter of 2016 and it will be retrospectively applied to all prior periods. We do not expect the adoption of this new presentation guidance to have a material impact on our consolidated balance sheets.
Measurement-Period Adjustments – In September 2015, the FASB issued updated guidance that eliminates the requirement to restate prior periods to reflect adjustments made to provisional amounts recognized in a business combination. The updated guidance requires that an acquirer recognize adjustments to provisional amounts that are identified during the measurement period in the reporting period in which the adjustment amounts are determined. The standards update is effective prospectively for interim and annual periods beginning after December 15, 2015 with early adoption permitted. We will adopt this standard update, as required, beginning with the first quarter of 2016, and do not expect it to have a material impact on our consolidated financial statements.
Income Taxes – In November 2015, the FASB issued updated guidance changing the presentation of deferred taxes on the balance sheet. The updated guidance requires that all deferred tax assets and liabilities, along with any related valuation allowance, be classified as noncurrent on the balance sheet. The standards update is effective for annual and interim periods beginning after December 15, 2016 with early adoption permitted. We elected to early-adopt this standards update as of December 31, 2015 with prospective application. See Note 13 Income Taxes.
Item 7A. Quantitative and Qualitative Disclosures About Market Risk
We are exposed to market risks associated with interest rate risks, commodity price risk and credit risk. We have established risk management processes to monitor and manage these market risks.
Commodity Price Risk, Derivative Instruments and Hedging Activity
We are exposed to various risks including energy commodity price risk. When oil, natural gas, and natural gas liquids prices decline significantly our ability to finance our capital budget and operations may be adversely impacted. We expect energy prices to remain volatile and unpredictable. Therefore, we use derivative instruments to provide partial protection against declines in oil and natural gas prices and the adverse effect it could have on our financial condition and operations. The types of derivative instruments that we may
56
choose to utilize include costless collars, swaps, and deferred put options. Our hedge objectives may change significantly as our operational profile changes and/or commodities prices change. Currently, we have hedged only a limited amount of our anticipated production beyond 2016 due to low commodity prices. As a consequence, our future performance is subject to increased commodity price risks, and our future cash flows from operations may be subject to further declines if low commodity prices persist. We do not enter into derivative contracts for speculative trading purposes.
We are exposed to market risk on our open derivative contracts related to potential non-performance by our counterparties. We enter into derivative contracts only with counterparties that are creditworthy institutions and are deemed by management as competent and competitive market makers. We did not post collateral under any of these contracts as they are secured under our Credit Agreement or are uncollateralized trades. Please refer to Note 4 Derivative Financial Instruments in our consolidated financial statements included in this report for additional information.
We account for our derivative activities under the provisions of ASC 815, Derivatives and Hedging, (“ASC 815”). ASC 815 establishes accounting and reporting that every derivative instrument be recorded on the balance sheet as either an asset or liability measured at fair value. Please refer to Note 4 Derivative Financial Instruments in our consolidated financial statements included in this report for additional information.
The following table presents average NYMEX prompt month future prices for crude oil and natural gas for the periods identified, as well as average sales prices we realized for our crude oil, natural gas and natural gas liquids production:
|
|
|
Years Ended December 31, |
|
|||||
|
|
|
2015 |
|
|
2014 |
|
||
|
Average NYMEX prompt month future prices: |
|
|
|
|
|
|
|
|
|
Oil ( per Bbl) |
|
$ |
48.79 |
|
|
$ |
92.91 |
|
|
Natural gas (per Mcf) |
|
$ |
2.627 |
|
|
$ |
4.262 |
|
|
|
|
|
|
|
|
|
|
|
|
Average prices realized: |
|
|
|
|
|
|
|
|
|
Oil (per Bbl) |
|
$ |
44.09 |
|
|
$ |
86.29 |
|
|
Natural gas (per Mcf) |
|
$ |
2.55 |
|
|
$ |
4.39 |
|
|
Natural gas liquids (per Bbl) |
|
$ |
12.29 |
|
|
$ |
28.29 |
|
Interest Rate Sensitivity
We are also exposed to market risk related to adverse changes in interest rates. Our interest rate risk exposure results primarily from fluctuations in short-term rates, which are LIBOR and the prime rate based and may result in reductions of earnings or cash flows due to increases in the interest rates we pay on these obligations.
At December 31, 2015, the principal amount of our total long-term debt was $11.2 million and bears interest at rates further described in Note 9 Long-Term Debt. Fluctuations in interest rates will cause our annual interest costs to fluctuate. At December 31, 2015, the interest rate on borrowings under our revolving credit facility was 2.351% per year. If these borrowings at December 31, 2015 were to remain constant, a 10% change in interest rates would impact our cash flow by approximately $26,000 per year.
Disclosure of Limitations
Because the information above included only those exposures that existed at December 31, 2015, it does not consider those exposures or positions which could arise after that date. As a result, our ultimate realized gain or loss with respect to interest rate and commodity price fluctuations will depend on the exposures that arise during the period, our commodity price risk management strategies at the time and interest rates and commodity prices at the time.
Item 8. Financial Statements and Supplementary Data
See Index to Consolidated Financial Statements and Supplementary Information on Page F-1.
Item 9. Changes in and Disagreements with Accountants on Accounting and Financial Disclosures
None.
57
Item 9A. Controls and Procedures
Internal Control Over Financial Reporting
Evaluation of Disclosure Controls and Procedures
Our management, with the participation of our Chief Executive Officer and Chief Accounting Officer, evaluated the effectiveness of the design and operation of our disclosure controls and procedures as of December 31, 2015 pursuant to Rule 13a-15(b) under the Exchange Act. The term “disclosure controls and procedures” as defined in Rules 13a-15(e) and 15d-15(e) under the Exchange Act, means controls and other procedures of a company that are designed to ensure that information required to be disclosed by a company in the reports that it files or submits under the Exchange Act is recorded, processed, summarized and reported within the time periods specified in the SEC’s rules and forms. Disclosure controls and procedures include, without limitation, controls and procedures designed to ensure that the information required to be disclosed by a company in the reports that it files or submits under the Exchange Act is accumulated and communicated to the company’s management, including its principal executive and principal financial officers, as appropriate to allow timely decisions regarding required disclosure.
Based on the evaluation of our disclosure controls and procedures as of December 31, 2015, our Chief Executive Officer and Chief Accounting Officer concluded that, as a result of a material weakness in our internal control over financial reporting as described below, our disclosure controls and procedures were not effective as of December 31, 2015.
Management’s Annual Report on Internal Control Over Financial Reporting
Our management is responsible for establishing and maintaining adequate internal control over financial reporting. Our internal control over financial reporting is designed to provide reasonable assurance regarding the reliability of financial reporting and the preparation of financial statements for external purposes in accordance with GAAP.
Concurrent with year-end reporting, under the supervision and with the participation of our management, including our Chief Executive Officer and Chief Accounting Officer, we conducted an evaluation of the effectiveness of the overall design of our system of internal control over financial reporting based on the framework in Internal Control- Integrated Framework issued by the Committee of Sponsoring Organizations of the Treadway Commission 2013 (COSO). Under standards established by the Public Company Accounting Oversight Board of the United States (“PCAOB”), a material weakness is a deficiency, or a combination of deficiencies, in internal control over financial reporting, such that there is a reasonable possibility that a material misstatement of our annual or interim financial statements will not be prevented or detected on a timely basis.
In performing this evaluation, management identified certain design deficiencies relating to segregation of duties, review and approval, and verification procedures, primarily resulting from the limited number of our accounting staff available to perform such procedures. Additionally, management identified certain design deficiencies to access over information systems.
Based on its assessment, our management concluded that, as of December 31, 2015, the design of our system of internal control over financial reporting was not effective due to the design deficiencies identified. However, management believes that the identified design weaknesses have not affected our ability to present GAAP-compliant financial statements in this Form 10-K. During the year-end financial statement close we were able to implement verification procedures and other review procedures to present properly our financial statements and we were therefore able to present GAAP-compliant financial statements. Management does not believe that its design ineffectiveness with respect to its procedures and controls has had a pervasive effect upon our financial reporting and the overall control environment due to our ability to conduct the foregoing procedures relating to our financial statements.
The effectiveness of our internal control over financial reporting as of December 31, 2015, has been audited by our independent registered public accounting firm, as stated in its report which is included herein.
Management’s Remediation Initiatives
Management plans to implement a number of initiatives to address the ineffective design of the system of our internal control over financial reporting, including but not limited to the following:
|
|
· |
Employ additional accounting staff to perform the required tasks to maintain an optimal segregation of duties, review and approval and verification procedures and provide optimal levels of oversight. |
|
|
· |
Continue to work closely with our independent SOX consultants to help improve the overall design of our system of internal control over financial reporting and promptly remediate any identified weaknesses. |
|
|
· |
Continue to evaluate control procedures on an ongoing basis, and, where possible modify those control procedures to improve oversight. |
58
We believe that these additional resources will enable us to broaden the scope and quality of our controls relating to the oversight and review of financial statements and our application of relevant accounting policies.
Management will continue the process of implementing new controls, reviewing existing controls, procedures and responsibilities to more closely identify key financial reporting controls, and compensating procedures will be developed to ensure that weaknesses are properly addressed and related financial reporting risks are mitigated. Periodic control validation and testing will also be implemented to ensure that controls continue to operate consistently and as designed. Management plans to complete this remediation process as quickly as possible. We believe that in 2016 we will remediate the material weakness related to the overall ineffective design of our system of internal controls over financial reporting. However, the remediation steps we have taken, and are taking and expect to take may not effectively remediate the material weakness, in which case our internal control over financial reporting would continue to be ineffective. We cannot guarantee that we will be able to complete our remedial actions successfully. Even if we are able to complete these actions successfully, these measures may not adequately address our material weakness and may take more than a year to complete. In addition, it is possible that we will discover additional material weaknesses in our internal control over financial reporting or that our existing material weakness will result in additional errors in or restatements of our financial statements.
Limitations of the Effectiveness of Internal Controls
Our management, including our Chief Executive Officer and Chief Accounting Officer, does not expect that our disclosure controls or internal controls over financial reporting will prevent all errors or all instances of fraud. A control system, no matter how well designed and operated, can provide only reasonable, not absolute, assurance that the control system’s objectives will be met. Further, the design of a control system must reflect the fact that there are resource constraints, and the benefits of controls must be considered relative to their costs. Because of the inherent limitations in all control systems, no evaluation of controls can provide absolute assurance that all control issues and instances of fraud, if any, within our company have been detected. These inherent limitations include the realities that judgments in decision-making can be faulty, and that breakdowns can occur because of simple error or mistake. Controls can also be circumvented by the individual acts of some persons, by collusion or two or more people, or by management override of the controls. The design of any system of controls is based in part upon certain assumptions about the likelihood of future events, and any design may not succeed in achieving its stated goals under all potential future conditions. Over time, controls may become inadequate because of changes in conditions or deterioration in the degree of compliance with policies or procedures. Because of the inherent limitation of a cost-effective control system, misstatements due to error or fraud may occur and not be detected.
Changes in Internal Controls over Financial Reporting
During the quarter ended December 31, 2015, we made changes in our internal control over financial reporting (as such term is defined in Rule 13a-15(f) under the Exchange Act). We worked closely with our independent SOX consultants to improve the overall design of our system of internal controls over financial reporting. During the quarter we added documentation protocols to our existing review procedures regarding the preparation of financial reporting schedules and we made changes to user access profiles in our information systems in order to better segregate duties amongst our accounting staff.
59
REPORT OF INDEPENDENT REGISTERED PUBLIC ACCOUNTING FIRM
The Board of Directors and Shareholders
Earthstone Energy, Inc.
We have audited Earthstone Energy, Inc.’s internal control over financial reporting as of December 31, 2015, based on criteria established in Internal Control - Integrated Framework (2013) issued by the Committee of Sponsoring Organizations of the Treadway Commission (COSO). Earthstone Energy Inc.’s management is responsible for maintaining effective internal control over financial reporting and for its assessment of the effectiveness of internal control over financial reporting, included in the accompanying Management’s Report on Internal Control over Financial Reporting. Our responsibility is to express an opinion on the Company’s internal control over financial reporting based on our audit.
We conducted our audit in accordance with the standards of the Public Company Accounting Oversight Board (United States). Those standards require that we plan and perform the audit to obtain reasonable assurance about whether effective internal control over financial reporting was maintained in all material respects. Our audit included obtaining an understanding of internal control over financial reporting, assessing the risk that a material weakness exists, and testing and evaluating the design and operating effectiveness of internal control based on the assessed risk. Our audit also included performing such other procedures as we considered necessary in the circumstances. We believe that our audit provides a reasonable basis for our opinion.
A company’s internal control over financial reporting is a process designed to provide reasonable assurance regarding the reliability of financial reporting and the preparation of financial statements for external purposes in accordance with generally accepted accounting principles. A company’s internal control over financial reporting includes those policies and procedures that (1) pertain to the maintenance of records that, in reasonable detail, accurately and fairly reflect the transactions and dispositions of the assets of the company; (2) provide reasonable assurance that transactions are recorded as necessary to permit preparation of financial statements in accordance with generally accepted accounting principles, and that receipts and expenditures of the company are being made only in accordance with authorizations of management and directors of the company; and (3) provide reasonable assurance regarding prevention or timely detection of unauthorized acquisition, use, or disposition of the company’s assets that could have a material effect on the financial statements.
Because of its inherent limitations, internal control over financial reporting may not prevent or detect misstatements. Also, projections of any evaluation of effectiveness to future periods are subject to the risk that controls may become inadequate because of changes in conditions, or that the degree of compliance with the policies or procedures may deteriorate.
A material weakness is a deficiency, or combination of deficiencies, in internal control over financial reporting, such that there is a reasonable possibility that a material misstatement of the company’s annual or interim financial statements will not be prevented or detected on a timely basis. The following material weakness has been identified and included in management’s assessment. Management has identified a material weakness in controls related to segregation of duties, review and approval, and verification procedures and access over information systems.
In our opinion, because of the effect of the material weakness described above on the achievement of the objectives of the control criteria, Earthstone Energy, Inc. has not maintained effective internal control over financial reporting as of December 31, 2015, based on the COSO criteria.
We also have audited, in accordance with the standards of the Public Company Accounting Oversight Board (United States), the consolidated balance sheets of Earthstone Energy, Inc. as of December 31, 2015 and 2014, and the related consolidated statements of operations, equity, and cash flows for each of the years in the three-year period ended December 31, 2015. This material weakness was considered in determining the nature, timing and extent of audit tests applied in our audit of the 2015 financial statements and this report does not affect our report dated March 11, 2016, which expressed an unqualified opinion on those financial statements.
/s/ Weaver and Tidwell, L.L.P.
Houston, Texas
March 11, 2016
60
None.
61
Item 10. Directors, Executives Officers and Corporate Governance
See list of “Executive Officers of the Company” under Item 1 of this report, which is incorporated herein by reference.
Other information required by this item is incorporated herein by reference to our 2016 Proxy Statement or Form 10-K/A which will be filed with the SEC not later than 120 days subsequent to December 31, 2015.
Item 11. Executive Compensation
Information called for by Item 11 of this report will be set forth in our 2016 Proxy Statement or Form 10-K/A, which is incorporated herein by reference.
Item 12. Security Ownership of Certain Beneficial Owners and Management and Related Stockholder Matters
See “Equity Compensation Plan Information” under Item 5 of this report, which is incorporated herein by reference for the Company’s Securities Authorized for Issuance under Equity Compensation Plans.
Other information required by this item will be set forth in our 2016 Proxy Statement or Form 10-K/A, which is incorporated herein by reference.
Item 13. Certain Relationships and Related Transactions, and Director Independence
Information called for by Item 13 of this report will be set forth in our 2016 Proxy Statement or Form 10-K/A, which is incorporated herein by reference.
Item 14. Principal Accountant Fees and Services
Information called for by Item 14 of this report will be set forth in our 2016 Proxy Statement or Form 10-K/A, which is incorporated herein by reference.
62
Item 15. Exhibits, Financial Statements and Schedules
|
|
|
|
|
Incorporated by Reference |
|
|
|
|
||||||
|
Exhibit No. |
|
Description |
|
Form |
|
SEC File No. |
|
Exhibit |
|
Filing Date |
|
Filed Herewith |
|
Furnished Herewith |
|
2.1 |
|
Arrangement Agreement, dated December 16, 2015, among Earthstone Energy, Inc., 1058286 B.C. Ltd. and Lynden Energy Corp. |
|
8-K |
|
001-35049 |
|
2.1 |
|
December 17, 2015 |
|
|
|
|
|
3.1 |
|
Amended and Restated Certificate of Incorporation of Earthstone Energy, Inc. dated February 26, 2010. |
|
8-K |
|
001-35049 |
|
3(i) |
|
March 3, 2010 |
|
|
|
|
|
3.1(a) |
|
Certificate of Amendment to Certificate of Incorporation of Earthstone Energy, Inc. dated December 20, 2010. |
|
8-K |
|
001-35049 |
|
3(i) |
|
January 4, 2011 |
|
|
|
|
|
3.1(b) |
|
Certificate of Amendment of Certificate of Incorporation of Earthstone Energy, Inc. dated December 19, 2014. |
|
8-K |
|
001-35049 |
|
3.1 |
|
December 29, 2014 |
|
|
|
|
|
3.1(c) |
|
Certificate of Amendment of the Amended and Restated Certificate of Incorporation of Earthstone Energy, Inc. dated October 22, 2015. |
|
8-K |
|
001-35049 |
|
3.1 |
|
October 26, 2015 |
|
|
|
|
|
3.2 |
|
Amended and Restated Bylaws of Earthstone Energy, Inc. dated February 26, 2010. |
|
8-K |
|
001-35049 |
|
3(ii) |
|
March 10, 2010 |
|
|
|
|
|
3.2(a) |
|
First Amendment to the Amended and Restated Bylaws of Earthstone Energy, Inc. dated November 22, 2011. |
|
8-K |
|
001-35049 |
|
3(ii)c |
|
November 23, 2011 |
|
|
|
|
|
3.2(b) |
|
Second Amendment to the Amended and Restated Bylaws of Earthstone Energy, Inc. dated October 22, 2015. |
|
8-K |
|
001-35049 |
|
3.2 |
|
October 26, 2015 |
|
|
|
|
|
4.1 |
|
Rights Agreement dated February 4, 2009 between Earthstone Energy, Inc. and Corporate Stock Transfer, Inc. |
|
8-K |
|
001-35049 |
|
4.1 |
|
February 5, 2009 |
|
|
|
|
|
|
|
|
|
|
|
|
|
|
|
|
|
|
|
|
|
4.1(a) |
|
First Amendment to the Rights Agreement dated May 15, 2014, by and among Earthstone Energy, Inc., Corporate Stock Transfer, Inc., and Direct Transfer LLC. |
|
8-A/A |
|
001-35049 |
|
4.1 |
|
May 16, 2014 |
|
|
|
|
|
4.1(b) |
|
Second Amendment to the Rights Agreement dated May 15, 2014 between Earthstone Energy, Inc. and Direct Transfer LLC. |
|
8-A/A |
|
001-35049 |
|
4.2 |
|
May 16, 2014 |
|
|
|
|
|
4.1(c) |
|
Third Amendment to the Rights Agreement dated October 16, 2014 between Earthstone Energy, Inc. and Direct Transfer LLC. |
|
8-A/A |
|
001-35049 |
|
4.1 |
|
October 20, 2014 |
|
|
|
|
|
4.2 |
|
Specimen Common Stock Certificate of Earthstone Energy, Inc. |
|
10-K |
|
001-35049 |
|
4.2 |
|
June 16, 2011 |
|
|
|
|
|
10.1 |
|
Credit Agreement dated December 19, 2014, by and among Earthstone Energy, Inc., Oak Valley Operating, LLC, EF Non-OP, LLC, Sabine River Energy, LLC, Basic Petroleum Services, Inc., BOKF, NA dba Bank of Texas, and the Lenders party thereto. |
|
8-K |
|
001-35049 |
|
10.4 |
|
December 29, 2014 |
|
|
|
|
63
|
|
First Amendment to the Credit Agreement dated December 19, 2014, by and among Earthstone Energy, Inc., Oak Valley Operating, LLC, EF Non-OP, LLC, Sabine River Energy, LLC, Basic Petroleum Services, Inc., BOKF, NA dba Bank of Texas, and the Lenders party thereto. |
|
8-K |
|
001-35049 |
|
10.1 |
|
December 4, 2015 |
|
|
|
|
|
|
10.2 |
|
Exchange Agreement dated May 15, 2014 between Earthstone Energy, Inc. and Oak Valley Resources, LLC. |
|
8-K |
|
001-35049 |
|
10.1 |
|
May 16, 2014 |
|
|
|
|
|
10.2(a) |
|
Amendment to the Exchange Agreement dated September 26, 2014 between Earthstone Energy, Inc. and Oak Valley Resources, LLC. |
|
8-K |
|
001-35049 |
|
10.1 |
|
October 2, 2014 |
|
|
|
|
|
10.3 |
|
Contribution Agreement dated October 16, 2014, among Earthstone Energy, Inc., Oak Valley Resources, LLC, Sabine River Energy, LLC, Oak Valley Operating, LLC, Parallel Resource Partners, LLC, and Flatonia Energy, LLC. |
|
8-K |
|
001-35049 |
|
10.1 |
|
October 20, 2014 |
|
|
|
|
|
10.3(a) |
|
First Amendment to Contribution Agreement dated June 4, 2015, by and among Earthstone Energy, Inc., Oak Valley Resources, LLC, Sabine River Energy, LLC, Earthstone Operating, LLC, Parallel Resources Partners, LLC, and Flatonia Energy, LLC. |
|
8-K |
|
001-35049 |
|
10.1 |
|
June 10, 2015 |
|
|
|
|
|
10.4 |
|
Registration Rights Agreement dated December 19, 2014 between Earthstone Energy, Inc. and Oak Valley Resources, LLC. |
|
8-K |
|
001-35049 |
|
10.1 |
|
December 29, 2014 |
|
|
|
|
|
10.5 |
|
Registration Rights Agreement dated December 19, 2014, by and among Earthstone Energy, Inc., Parallel Resource Partners, LLC, Flatonia Energy, LLC, and Oak Valley Resources, LLC. |
|
8-K |
|
001-35049 |
|
10.2 |
|
December 29, 2014 |
|
|
|
|
|
10.6† |
|
Earthstone Energy, Inc. Employee Severance Compensation Plan. |
|
8-K |
|
001-35049 |
|
10.2 |
|
May 16, 2014 |
|
|
|
|
|
10.7† |
|
Earthstone Energy, Inc. 2014 Long-Term Incentive Plan. |
|
8-K |
|
001-35049 |
|
10.3 |
|
December 29, 2014 |
|
|
|
|
|
10.7(a)† |
|
First Amendment to the Earthstone Energy, Inc. 2014 Long-Term Incentive Plan dated October 22, 2015. |
|
8-K |
|
001-35049 |
|
10.1 |
|
October 26, 2015 |
|
|
|
|
|
10.8 |
|
Form of Indemnification Agreement. |
|
8-K |
|
001-35049 |
|
10.5 |
|
December 29, 2014 |
|
|
|
|
|
10.9† |
|
Earthstone Energy, Inc. 2011 Equity Incentive Compensation Plan. |
|
Def. Proxy Statement |
|
001-35049 |
|
Appendix A |
|
July 29, 2011 |
|
|
|
|
|
10.10† |
|
Earthstone Energy, Inc. Performance Bonus Plan. |
|
10-K/A |
|
001-35049 |
|
10.3 |
|
October 9, 2009 |
|
|
|
|
|
10.11 |
|
Form of Voting Support Agreement |
|
8-K |
|
001-35049 |
|
10.1 |
|
December 17, 2015 |
|
|
|
|
|
14 |
|
Code of Business Conduct and Ethics. |
|
10-KSB/A |
|
001-35049 |
|
14.1 |
|
May 11, 2005 |
|
|
|
|
|
21.1 |
|
List of Subsidiaries. |
|
|
|
|
|
|
|
|
|
X |
|
|
|
23.1 |
|
Consent of Cawley, Gillespie & Associates, Inc. |
|
|
|
|
|
|
|
|
|
X |
|
|
64
|
|
Consent of Weaver and Tidwell, L.L.P. |
|
|
|
|
|
|
|
|
|
X |
|
|
|
|
31.1 |
|
Certification of the Principal Executive Officer pursuant to Section 302 of the Sarbanes-Oxley Act. |
|
|
|
|
|
|
|
|
|
X |
|
|
|
31.2 |
|
Certification of the Principal Financial Officer pursuant to Section 302 of the Sarbanes-Oxley Act. |
|
|
|
|
|
|
|
|
|
X |
|
|
|
32.1 |
|
Certification of the Chief Executive Officer pursuant to Section 906 of the Sarbanes-Oxley Act. |
|
|
|
|
|
|
|
|
|
|
|
X |
|
32.2 |
|
Certification of the Chief Accounting Officer pursuant to Section 906 of the Sarbanes-Oxley Act. |
|
|
|
|
|
|
|
|
|
|
|
X |
|
99.1 |
|
Report of Cawley, Gillespie & Associates, Inc. |
|
|
|
|
|
|
|
|
|
X |
|
|
|
101.INS* |
|
XBRL Instance Document. |
|
|
|
|
|
|
|
|
|
X |
|
|
|
101.SCH* |
|
XBRL Schema Document. |
|
|
|
|
|
|
|
|
|
X |
|
|
|
101.CAL* |
|
XBRL Calculation Linkbase Document. |
|
|
|
|
|
|
|
|
|
X |
|
|
|
101.DEF* |
|
XBRL Definition Linkbase Document. |
|
|
|
|
|
|
|
|
|
X |
|
|
|
101.LAB* |
|
XBRL Label Linkbase Document. |
|
|
|
|
|
|
|
|
|
X |
|
|
|
101.PRE* |
|
XBRL Presentation Linkbase Document. |
|
|
|
|
|
|
|
|
|
X |
|
|
† Indicates management contract or compensatory plan or arrangement.
65
Pursuant to the requirements of Section 13 or 15(d) of the Securities Exchange Act of 1934, the registrant has duly caused this report to be signed on its behalf by the undersigned, thereunto duly authorized.
|
|
|
EARTHSTONE ENERGY, INC. |
|||
|
|
|
|
|
|
|
|
|
|
|
|
|
|
|
|
|
By: |
|
/s/ Frank A. Lodzinski |
|
|
|
|
Name: |
|
Frank A. Lodzinski |
|
|
Date: March 11, 2016 |
|
Title: |
|
President and Chief Executive Officer (Principal Executive Officer) |
|
Pursuant to the requirements of the Securities Exchange Act of 1934, this report has been signed below by the following persons on behalf of the registrant and in the capacities and on the dates indicated.
|
Signature |
|
Title |
|
Date |
|
|
|
|
|
|
|
/s/ Frank A. Lodzinski |
|
Chairman of the Board, Director, President and Chief Executive Officer (Principal Executive Officer) |
|
March 11, 2016 |
|
Frank A. Lodzinski |
|
|
||
|
|
|
|
|
|
|
/s/ G. Bret Wonson |
|
Principal Financial Officer and Principal Accounting Officer |
|
March 11, 2016 |
|
G. Bret Wonson |
|
|
||
|
|
|
|
|
|
|
/s/ Jay F. Joliat |
|
Director |
|
March 11, 2016 |
|
Jay F. Joliat |
|
|
||
|
|
|
|
|
|
|
/s/ Ray Singleton |
|
Director |
|
March 11, 2016 |
|
Ray Singleton |
|
|
||
|
|
|
|
|
|
|
/s/ Douglas E. Swanson, Jr. |
|
Director |
|
March 11, 2016 |
|
Douglas E. Swanson, Jr. |
|
|
||
|
|
|
|
|
|
|
/s/ Brad A. Thielemann |
|
Director |
|
March 11, 2016 |
|
Brad A. Thielemann |
|
|
||
|
|
|
|
|
|
|
/s/ Zachary G. Urban |
|
Director |
|
March 11, 2016 |
|
Zachary G. Urban |
|
|
||
|
|
|
|
|
|
|
/s/ Robert L. Zorich |
|
Director |
|
March 11, 2016 |
|
Robert L. Zorich |
|
|
66
Index to Consolidated Financial Statements and Supplementary Information
|
|
|
Page |
|
Audited Financial Statements: |
|
|
|
|
F-2 |
|
|
Consolidated Balance Sheets as of December 31, 2015 and 2014 |
|
F-3 |
|
Consolidated Statements of Operations for the Years Ended December 31, 2015, 2014 and 2013 |
|
F-4 |
|
Consolidated Statements of Equity for the Years Ended December 31, 2015, 2014 and 2013 |
|
F-5 |
|
Consolidated Statements of Cash Flows for the Years Ended December 31, 2015, 2014 and 2013 |
|
F-6 |
|
|
F-7 |
|
|
Unaudited Information: |
|
|
|
Supplemental Information on Oil and Gas Exploration and Production Activities |
|
|
F-1
REPORT OF INDEPENDENT REGISTERED PUBLIC ACCOUNTING FIRM
Board of Directors and Stockholders
Earthstone Energy, Inc.
We have audited the accompanying consolidated balance sheets of Earthstone Energy, Inc. and subsidiaries (the Company) (formerly Oak Valley Resources, LLC) as of December 31, 2015 and 2014, and the related consolidated statements of operations, equity, and cash flows for each of the years in the three-year period ended December 31, 2015. These consolidated financial statements are the responsibility of the entity’s management. Our responsibility is to express an opinion on these consolidated financial statements based on our audits.
We conducted our audits in accordance with the standards of the Public Company Accounting Oversight Board (United States). Those standards require that we plan and perform the audit to obtain reasonable assurance about whether the consolidated financial statements are free of material misstatement. An audit includes examining, on a test basis, evidence supporting the amounts and disclosures in the consolidated financial statements. An audit also includes assessing the accounting principles used and significant estimates made by management, as well as evaluating the overall consolidated financial statement presentation. We believe that our audits provide a reasonable basis for our opinion.
In our opinion, the consolidated financial statements referred to above present fairly, in all material respects, the financial position of Earthstone Energy, Inc. and subsidiaries (formerly Oak Valley Resources, LLC) as of December 31, 2015 and 2014, and the results of its operations and its cash flows for each of the years in the three-year period ended December 31, 2015, in conformity with accounting principles generally accepted in the United States of America.
We also have audited, in accordance with the standards of the Public Company Accounting Oversight Board (United States), the Company’s internal control over financial reporting as of December 31, 2015, based on criteria established in 2013 Internal Control—Integrated Framework issued by the Committee of Sponsoring Organizations of the Treadway Commission (COSO) and our report dated March 11, 2016 expressed an adverse opinion thereon.
/s/ Weaver and Tidwell, L.L.P.
Houston, Texas
March 11, 2016
F-2
(In thousands, except share and per share amounts)
|
|
|
December 31, |
|
|||||
|
ASSETS |
|
2015 |
|
|
2014 |
|
||
|
Current assets: |
|
|
|
|
|
|
|
|
|
Cash and cash equivalents |
|
$ |
23,264 |
|
|
$ |
100,447 |
|
|
Accounts receivable: |
|
|
|
|
|
|
|
|
|
Oil, natural gas, and natural gas liquids revenues |
|
|
13,529 |
|
|
|
14,016 |
|
|
Joint interest billings and other |
|
|
4,924 |
|
|
|
9,417 |
|
|
Current derivative assets |
|
|
3,694 |
|
|
|
3,569 |
|
|
Prepaid expenses and other current assets |
|
|
498 |
|
|
|
1,578 |
|
|
Total current assets |
|
|
45,909 |
|
|
|
129,027 |
|
|
|
|
|
|
|
|
|
|
|
|
Oil and gas properties, successful efforts method: |
|
|
|
|
|
|
|
|
|
Proved properties |
|
|
283,644 |
|
|
|
317,006 |
|
|
Unproved properties |
|
|
34,609 |
|
|
|
76,791 |
|
|
Total oil and gas properties |
|
|
318,253 |
|
|
|
393,797 |
|
|
|
|
|
|
|
|
|
|
|
|
Accumulated depreciation, depletion, and amortization |
|
|
(119,920 |
) |
|
|
(97,920 |
) |
|
Net oil and gas properties |
|
|
198,333 |
|
|
|
295,877 |
|
|
|
|
|
|
|
|
|
|
|
|
Other noncurrent assets: |
|
|
|
|
|
|
|
|
|
Goodwill |
|
|
17,532 |
|
|
|
22,992 |
|
|
Office and other equipment, less accumulated depreciation of $1,028 in 2015 and $474 in 2014 |
|
|
1,934 |
|
|
|
2,109 |
|
|
Land |
|
|
— |
|
|
|
101 |
|
|
Other noncurrent assets |
|
|
1,236 |
|
|
|
1,282 |
|
|
TOTAL ASSETS |
|
$ |
264,944 |
|
|
$ |
451,388 |
|
|
LIABILITIES AND EQUITY |
|
|
|
|
|
|
|
|
|
Current liabilities: |
|
|
|
|
|
|
|
|
|
Accounts payable |
|
$ |
11,580 |
|
|
$ |
28,753 |
|
|
Accrued expenses |
|
|
12,975 |
|
|
|
20,529 |
|
|
Revenues and royalties payable |
|
|
8,576 |
|
|
|
17,364 |
|
|
Advances |
|
|
15,447 |
|
|
|
21,398 |
|
|
Asset retirement obligations |
|
|
— |
|
|
|
408 |
|
|
Total current liabilities |
|
|
48,578 |
|
|
|
88,452 |
|
|
|
|
|
|
|
|
|
|
|
|
Noncurrent liabilities: |
|
|
|
|
|
|
|
|
|
Long-term debt |
|
|
11,191 |
|
|
|
11,191 |
|
|
Asset retirement obligations |
|
|
5,075 |
|
|
|
5,670 |
|
|
Deferred tax liability |
|
|
— |
|
|
|
29,258 |
|
|
Other noncurrent liabilities |
|
|
227 |
|
|
|
289 |
|
|
Total noncurrent liabilities |
|
|
16,493 |
|
|
|
46,408 |
|
|
|
|
|
|
|
|
|
|
|
|
Total liabilities |
|
|
65,071 |
|
|
|
134,860 |
|
|
|
|
|
|
|
|
|
|
|
|
Commitments and Contingencies (Note 12) |
|
|
|
|
|
|
|
|
|
|
|
|
|
|
|
|
|
|
|
Equity: |
|
|
|
|
|
|
|
|
|
Preferred stock, $0.001 par value, 20,000,000 shares authorized; none issued or outstanding |
|
|
— |
|
|
|
— |
|
|
Common stock, $0.001 par value, 100,000,000 shares authorized; 13,835,128 shares issued and outstanding in 2015 and 2014 |
|
|
14 |
|
|
|
14 |
|
|
Additional paid-in capital |
|
|
358,086 |
|
|
|
358,086 |
|
|
Accumulated deficit |
|
|
(157,767 |
) |
|
|
(41,112 |
) |
|
Treasury stock, 15,357 shares in 2015 and 2014 |
|
|
(460 |
) |
|
|
(460 |
) |
|
Total equity |
|
|
199,873 |
|
|
|
316,528 |
|
|
|
|
|
|
|
|
|
|
|
|
TOTAL LIABILITIES AND EQUITY |
|
$ |
264,944 |
|
|
$ |
451,388 |
|
The accompanying notes are an integral part of these consolidated financial statements.
F-3
CONSOLIDATED STATEMENTS OF OPERATIONS
(In thousands, except share and per share amounts)
|
|
|
Years Ended December 31, |
|
|||||||||
|
|
|
2015 |
|
|
2014 |
|
|
2013 |
|
|||
|
REVENUES |
|
|
|
|
|
|
|
|
|
|
|
|
|
Oil, natural gas, and natural gas liquids revenues: |
|
|
|
|
|
|
|
|
|
|
|
|
|
Oil |
|
$ |
39,849 |
|
|
$ |
34,734 |
|
|
$ |
16,038 |
|
|
Natural gas |
|
|
5,457 |
|
|
|
9,367 |
|
|
|
9,714 |
|
|
Natural gas liquids |
|
|
2,158 |
|
|
|
3,510 |
|
|
|
3,882 |
|
|
Total oil, natural gas, and natural gas liquids revenues |
|
|
47,464 |
|
|
|
47,611 |
|
|
|
29,634 |
|
|
Gathering income |
|
|
309 |
|
|
|
383 |
|
|
|
430 |
|
|
Gain (loss) on sale of oil and gas properties |
|
|
1,617 |
|
|
|
— |
|
|
|
(121 |
) |
|
Total revenues |
|
|
49,390 |
|
|
|
47,994 |
|
|
|
29,943 |
|
|
|
|
|
|
|
|
|
|
|
|
|
|
|
|
OPERATING COSTS AND EXPENSES |
|
|
|
|
|
|
|
|
|
|
|
|
|
Production costs: |
|
|
|
|
|
|
|
|
|
|
|
|
|
Lease operating expense |
|
|
15,409 |
|
|
|
10,122 |
|
|
|
8,426 |
|
|
Severance taxes |
|
|
2,582 |
|
|
|
2,002 |
|
|
|
1,225 |
|
|
Re-engineering and workovers |
|
|
872 |
|
|
|
708 |
|
|
|
342 |
|
|
Impairment expense |
|
|
138,086 |
|
|
|
19,359 |
|
|
|
12,298 |
|
|
Depreciation, depletion, and amortization |
|
|
31,228 |
|
|
|
18,414 |
|
|
|
17,111 |
|
|
Exploration expense |
|
|
142 |
|
|
|
111 |
|
|
|
2,490 |
|
|
General and administrative expense |
|
|
10,300 |
|
|
|
7,864 |
|
|
|
7,751 |
|
|
Total operating costs and expenses |
|
|
198,619 |
|
|
|
58,580 |
|
|
|
49,643 |
|
|
|
|
|
|
|
|
|
|
|
|
|
|
|
|
Loss from operations |
|
|
(149,229 |
) |
|
|
(10,586 |
) |
|
|
(19,700 |
) |
|
|
|
|
|
|
|
|
|
|
|
|
|
|
|
OTHER INCOME (EXPENSE) |
|
|
|
|
|
|
|
|
|
|
|
|
|
Interest expense, net |
|
|
(722 |
) |
|
|
(597 |
) |
|
|
(487 |
) |
|
Net gain on derivative contracts |
|
|
6,431 |
|
|
|
4,392 |
|
|
|
296 |
|
|
Other income, net |
|
|
423 |
|
|
|
62 |
|
|
|
16 |
|
|
Total other income (expense) |
|
|
6,132 |
|
|
|
3,857 |
|
|
|
(175 |
) |
|
|
|
|
|
|
|
|
|
|
|
|
|
|
|
Loss before income taxes |
|
|
(143,097 |
) |
|
|
(6,729 |
) |
|
|
(19,875 |
) |
|
|
|
|
|
|
|
|
|
|
|
|
|
|
|
Income tax (benefit) expense |
|
|
(26,442 |
) |
|
|
22,105 |
|
|
|
— |
|
|
|
|
|
|
|
|
|
|
|
|
|
|
|
|
Net loss |
|
$ |
(116,655 |
) |
|
$ |
(28,834 |
) |
|
$ |
(19,875 |
) |
|
|
|
|
|
|
|
|
|
|
|
|
|
|
|
Net loss per common share: |
|
|
|
|
|
|
|
|
|
|
|
|
|
Basic |
|
$ |
(8.43 |
) |
|
$ |
(3.11 |
) |
|
$ |
(2.18 |
) |
|
Diluted |
|
$ |
(8.43 |
) |
|
$ |
(3.11 |
) |
|
$ |
(2.18 |
) |
|
|
|
|
|
|
|
|
|
|
|
|
|
|
|
Weighted average common shares outstanding: |
|
|
|
|
|
|
|
|
|
|
|
|
|
Basic |
|
|
13,835,128 |
|
|
|
9,279,324 |
|
|
|
9,124,452 |
|
|
Diluted |
|
|
13,835,128 |
|
|
|
9,279,324 |
|
|
|
9,124,452 |
|
The accompanying notes are an integral part of these consolidated financial statements.
F-4
CONSOLIDATED STATEMENTS OF EQUITY
(In thousands, except share amounts)
|
|
|
|
|
|
|
|
|
|
|
|
|
|
|
Additional |
|
|
|
|
|
|
|
|
|
|
|
|
|
|
|
|
|
|
|
|
|
Members' |
|
|
Common Stock |
|
|
Paid-in |
|
|
Accumulated |
|
|
Treasury Stock |
|
|
Total |
|
||||||||||||||
|
|
|
Equity |
|
|
Shares |
|
|
Amount |
|
|
Capital |
|
|
Deficit |
|
|
Shares |
|
|
Amount |
|
|
Equity |
|
||||||||
|
At December 31, 2012 |
|
$ |
61,267 |
|
|
|
— |
|
|
$ |
— |
|
|
|
— |
|
|
$ |
— |
|
|
|
— |
|
|
$ |
— |
|
|
$ |
61,267 |
|
|
|
|
|
|
|
|
|
|
|
|
|
|
|
|
|
|
|
|
|
|
|
|
|
|
|
|
|
|
|
|
|
|
|
|
Contributions from Oak Valley Resources, LLC members |
|
|
107,530 |
|
|
|
— |
|
|
|
— |
|
|
|
— |
|
|
|
— |
|
|
|
— |
|
|
|
— |
|
|
|
107,530 |
|
|
Net loss |
|
|
(19,875 |
) |
|
|
— |
|
|
|
— |
|
|
|
— |
|
|
|
— |
|
|
|
— |
|
|
|
— |
|
|
|
(19,875 |
) |
|
At December 31, 2013 |
|
|
148,922 |
|
|
|
— |
|
|
|
— |
|
|
|
— |
|
|
|
— |
|
|
|
— |
|
|
|
— |
|
|
|
148,922 |
|
|
|
|
|
|
|
|
|
|
|
|
|
|
|
|
|
|
|
|
|
|
|
|
|
|
|
|
|
|
|
|
|
|
|
|
Contributions from Oak Valley Resources, LLC members |
|
|
107,020 |
|
|
|
— |
|
|
|
— |
|
|
|
— |
|
|
|
— |
|
|
|
— |
|
|
|
— |
|
|
|
107,020 |
|
|
Contribution of Oak Valley Subsidiaries in exchange for shares |
|
|
(268,220 |
) |
|
|
9,124,452 |
|
|
|
9 |
|
|
|
268,211 |
|
|
|
— |
|
|
|
— |
|
|
|
— |
|
|
|
— |
|
|
Reverse acquisition with Oak Valley |
|
|
— |
|
|
|
1,753,388 |
|
|
|
2 |
|
|
|
33,453 |
|
|
|
|
|
|
|
(15,357 |
) |
|
|
(460 |
) |
|
|
32,995 |
|
|
2014 Eagle Ford Acquisition Properties |
|
|
— |
|
|
|
2,957,288 |
|
|
|
3 |
|
|
|
56,422 |
|
|
|
— |
|
|
|
— |
|
|
|
— |
|
|
|
56,425 |
|
|
Net income (loss) |
|
|
12,278 |
|
|
|
— |
|
|
|
— |
|
|
|
— |
|
|
|
(41,112 |
) |
|
|
— |
|
|
|
— |
|
|
|
(28,834 |
) |
|
At December 31, 2014 |
|
|
— |
|
|
|
13,835,128 |
|
|
|
14 |
|
|
|
358,086 |
|
|
|
(41,112 |
) |
|
|
(15,357 |
) |
|
|
(460 |
) |
|
|
316,528 |
|
|
|
|
|
|
|
|
|
|
|
|
|
|
|
|
|
|
|
|
|
|
|
|
|
|
|
|
|
|
|
|
|
|
|
|
Net loss |
|
|
— |
|
|
|
— |
|
|
|
— |
|
|
|
— |
|
|
|
(116,655 |
) |
|
|
— |
|
|
|
— |
|
|
|
(116,655 |
) |
|
At December 31, 2015 |
|
$ |
— |
|
|
|
13,835,128 |
|
|
$ |
14 |
|
|
$ |
358,086 |
|
|
$ |
(157,767 |
) |
|
|
(15,357 |
) |
|
$ |
(460 |
) |
|
$ |
199,873 |
|
The accompanying notes are an integral part of these consolidated financial statements.
F-5
CONSOLIDATED STATEMENTS OF CASH FLOWS
(In thousands)
|
|
|
Years Ended December 31, |
|
|||||||||
|
|
|
2015 |
|
|
2014 |
|
|
2013 |
|
|||
|
Cash flows from operating activities: |
|
|
|
|
|
|
|
|
|
|
|
|
|
Net loss |
|
$ |
(116,655 |
) |
|
$ |
(28,834 |
) |
|
$ |
(19,875 |
) |
|
Adjustments to reconcile net loss to net cash (used in) provided by operating activities: |
|
|
|
|
|
|
|
|
|
|
|
|
|
Depreciation, depletion, and amortization |
|
|
31,228 |
|
|
|
18,414 |
|
|
|
17,111 |
|
|
Impairment of proved and unproved oil and gas properties |
|
|
136,539 |
|
|
|
19,359 |
|
|
|
12,298 |
|
|
Impairment of goodwill |
|
|
1,547 |
|
|
|
— |
|
|
|
— |
|
|
Unrealized (gain) loss on derivative contracts |
|
|
(125 |
) |
|
|
(3,614 |
) |
|
|
45 |
|
|
Dry hole costs |
|
|
— |
|
|
|
— |
|
|
|
2,096 |
|
|
(Gain) loss on sales of oil and gas properties |
|
|
(1,617 |
) |
|
|
— |
|
|
|
121 |
|
|
Accretion of asset retirement obligations |
|
|
550 |
|
|
|
317 |
|
|
|
217 |
|
|
Deferred income taxes |
|
|
(26,533 |
) |
|
|
22,105 |
|
|
|
— |
|
|
Amortization of deferred financing costs |
|
|
264 |
|
|
|
164 |
|
|
|
103 |
|
|
Settlement of asset retirement obligations |
|
|
(108 |
) |
|
|
(56 |
) |
|
|
— |
|
|
Changes in assets and liabilities: |
|
|
|
|
|
|
|
|
|
|
|
|
|
Decrease (increase) in accounts receivable |
|
|
9,246 |
|
|
|
(5,305 |
) |
|
|
(12,141 |
) |
|
Decrease (increase) in prepaid expenses and other |
|
|
779 |
|
|
|
(194 |
) |
|
|
(81 |
) |
|
(Decrease) increase in accounts payable and accrued expenses |
|
|
(30,887 |
) |
|
|
28,408 |
|
|
|
2,171 |
|
|
(Decrease) increase in revenue and royalties payable |
|
|
(8,739 |
) |
|
|
7,099 |
|
|
|
9,698 |
|
|
(Decrease) increase in advances |
|
|
(5,929 |
) |
|
|
17,925 |
|
|
|
3,520 |
|
|
Net cash (used in) provided by operating activities |
|
|
(10,440 |
) |
|
|
75,788 |
|
|
|
15,283 |
|
|
Cash flows from investing activities: |
|
|
|
|
|
|
|
|
|
|
|
|
|
Acquisitions of oil and gas property |
|
|
(8,706 |
) |
|
|
(18,772 |
) |
|
|
(86,687 |
) |
|
Additions to oil and gas property and equipment |
|
|
(61,060 |
) |
|
|
(83,041 |
) |
|
|
(31,162 |
) |
|
Additions to other property and equipment |
|
|
(378 |
) |
|
|
(1,385 |
) |
|
|
(678 |
) |
|
Reverse acquisition with Oak Valley, net of cash |
|
|
— |
|
|
|
(4,239 |
) |
|
|
— |
|
|
Insurance proceeds |
|
|
— |
|
|
|
— |
|
|
|
923 |
|
|
Proceeds from sales of oil and gas properties |
|
|
3,441 |
|
|
|
— |
|
|
|
488 |
|
|
Proceeds from sale of land |
|
|
101 |
|
|
|
— |
|
|
|
— |
|
|
Net cash used in investing activities |
|
|
(66,602 |
) |
|
|
(107,437 |
) |
|
|
(117,116 |
) |
|
Cash flows from financing activities: |
|
|
|
|
|
|
|
|
|
|
|
|
|
Issuance of long-term debt |
|
|
— |
|
|
|
11,191 |
|
|
|
— |
|
|
Reduction of long-term debt |
|
|
— |
|
|
|
(10,825 |
) |
|
|
— |
|
|
Deferred financing costs |
|
|
(141 |
) |
|
|
(613 |
) |
|
|
(425 |
) |
|
Contributions, net of issuance costs |
|
|
— |
|
|
|
106,920 |
|
|
|
107,530 |
|
|
Net cash (used in) provided by financing activities |
|
|
(141 |
) |
|
|
106,673 |
|
|
|
107,105 |
|
|
Net (decrease) increase in cash and cash equivalents |
|
|
(77,183 |
) |
|
|
75,024 |
|
|
|
5,272 |
|
|
Cash and cash equivalents at beginning of period |
|
|
100,447 |
|
|
|
25,423 |
|
|
|
20,151 |
|
|
Cash and cash equivalents at end of period |
|
$ |
23,264 |
|
|
$ |
100,447 |
|
|
$ |
25,423 |
|
|
Supplemental disclosure of cash flow information |
|
|
|
|
|
|
|
|
|
|
|
|
|
Cash paid for: |
|
|
|
|
|
|
|
|
|
|
|
|
|
Interest |
|
$ |
415 |
|
|
$ |
493 |
|
|
$ |
375 |
|
|
Non-cash investing and financing activities: |
|
|
|
|
|
|
|
|
|
|
|
|
|
Asset retirement obligations |
|
$ |
150 |
|
|
$ |
237 |
|
|
$ |
1,033 |
|
|
Acquisitions of oil and gas properties |
|
$ |
1,991 |
|
|
$ |
— |
|
|
$ |
— |
|
|
Stock issued for 2014 Eagle Ford Acquisition Properties |
|
$ |
— |
|
|
$ |
56,425 |
|
|
$ |
— |
|
The accompanying notes are an integral part of these consolidated financial statements.
F-6
NOTES TO CONSOLIDATED FINANCIAL STATEMENTS
Note 1. – Organization and Basis of Presentation
Earthstone Energy, Inc., a Delaware corporation formed in 1969, is a growth-oriented independent oil and gas exploration and production company engaged in the development and acquisition of oil and gas reserves through an active and diversified program that includes the acquisition, drilling and development of undeveloped leases, purchases of reserves, and exploration activities, with its current primary assets located in the Eagle Ford trend of south Texas and in the Williston Basin of North Dakota and Montana. The Company also has conventional wells in East Texas, South Texas and Oklahoma. Unless the context otherwise requires, the terms “Earthstone” and the “Company” refer to Earthstone Energy, Inc. and it consolidated subsidiaries. The Company has evaluated events or transactions through the date of issuance of this report in conjunction with the preparation of these consolidated financial statements.
Oak Valley Resources, LLC (“OVR”), is a Delaware limited liability company, formed on December 14, 2012. Prior to the Exchange (described below), OVR was an independent energy company engaged in the acquisition, exploration, development, and production of crude oil, natural gas, and natural gas liquids (“NGLs”), with properties in Texas, Oklahoma, and Louisiana. OVR was formed through a series of transactions that conveyed properties and committed cash contributions from various investors including EnCap Investments L.P. (“EnCap”), Wells Fargo Central Pacific Holdings, Inc. (“Wells Fargo”), VILLCo Capital II, LLC (“VILLCo”) and an affiliate of OVR, Oak Valley Management, LLC (“OVM”).
On December 19, 2014, the Company acquired three operating subsidiaries of OVR, in exchange for shares of Earthstone common stock (the “Exchange”), which resulted in a change of control of the Company. Pursuant to the Exchange Agreement, OVR contributed to Earthstone the membership interests of its three subsidiaries, Earthstone Operating, LLC (formerly Oak Valley Operating, LLC (“OVO”)), EF Non-Op, LLC (“EF Non-Op”) and Sabine River Energy, LLC (“Sabine”), each a Texas limited liability company (collectively “Oak Valley”), in exchange for 9.124 million shares, representing 84% of the Company’s common stock. The transaction was accounted for as a reverse acquisition whereby Oak Valley was considered the acquirer for accounting purposes. All historical financial information, prior to December 19, 2014, contained in these Consolidated Financial Statements is that of Oak Valley.
Immediately following the exchange, the Company, through its wholly owned subsidiary, Sabine, acquired an additional 20% undivided ownership interest in certain crude oil and natural gas properties located in Fayette and Gonzales Counties, Texas, in exchange for the issuance of approximately 2.957 million shares of common stock (the “Contribution Agreement”) to Flatonia Energy, LLC, increasing the Company’s ownership in these properties from a 30% undivided ownership to a 50% undivided ownership interest. As a result of the share issuance to Flatonia, OVR’s ownership in the Company decreased from 84% to 66%.
Note 2. – Summary of Significant Accounting Policies
Principles of Consolidation
The consolidated financial statements include the accounts and balances of the Company and its wholly owned subsidiaries and have been prepared in accordance with accounting principles generally accepted in the United States of America. All intercompany accounts and transactions are eliminated in consolidation.
As of December 31, 2015, the Company’s wholly-owned subsidiaries included:
|
|
· |
Earthstone Operating, LLC (formerly Oak Valley Operating, LLC), a Texas limited liability company formed on May 26, 2011. Earthstone Operating serves as the operator on all Company-operated properties in Fayette and Gonzales Counties, Texas and Oklahoma; |
|
|
· |
EF Non-Op, LLC, a Texas limited liability company formed on December 1, 2010. EF Non-Op holds interests in oil and natural gas properties located in La Salle County, Texas; |
|
|
· |
Sabine River Energy, LLC, a Texas limited liability company formed on May 18, 2011. Sabine holds interests in oil and natural gas properties located in Texas and Oklahoma; |
|
|
· |
Basic Petroleum Services, Inc. (“BPS”), a Texas corporation formed March 30, 1977. BPS is a service company which provides services to one of the fields that the Company operates in South Texas; and |
F-7
EARTHSTONE ENERGY, INC.
NOTES TO CONSOLIDATED FINANCIAL STATEMENTS (continued)
|
|
among the Company, Merger Sub and Lynden Energy Corp. and has not conducted any activities other than those incidental to its formation and the matters contemplated by the arrangement agreement. |
Use of Estimates
The preparation of the Company’s consolidated financial statements in conformity with accounting principles generally accepted in the United States (“GAAP”) requires the Company’s management to make estimates and assumptions that affect the reported amounts of assets and liabilities and disclosure of contingent assets and liabilities, if any, at the date of the consolidated financial statements and the reported amounts of revenues and expenses during the respective reporting periods.
Estimated quantities of crude oil, natural gas and natural gas liquids reserves are the most significant of our estimates. All the reserves data included in these Consolidated Financial Statements are estimates. Reservoir engineering is a subjective process of estimating underground accumulations of crude oil, natural gas and natural gas liquids. There are numerous uncertainties inherent in estimating quantities of proved crude oil, natural gas and natural gas liquids reserves. The accuracy of any reserves estimate is a function of the quality of available data and of engineering and geological interpretation and judgment. As a result, reserves estimates may be different from the quantities of crude oil, natural gas and natural gas liquids that are ultimately recovered.
Other items subject to estimates and assumptions include the carrying amounts of property, plant and equipment, goodwill and asset retirement obligations, valuation allowances for deferred income tax assets, and valuation of derivative instruments, among others. Management evaluates estimates and assumptions on an ongoing basis using historical experience and other factors, including the current economic and commodity price environment. The volatility of commodity prices results in increased uncertainty inherent in such estimates and assumptions. Further declines in commodity prices could result in an additional reduction in our fair value estimates and cause us to perform analyses to determine if our oil and natural gas properties need to be further impaired. As future commodity prices cannot be determined accurately, actual results could differ significantly from our estimates. See Supplemental Information on Oil and Gas Exploration and Production Activities (Unaudited).
Cash and Cash Equivalents
Cash and cash equivalents consists of all demand deposits and funds invested in highly liquid investments with an original maturity date of three months or less.
Accounts Receivable
Accounts receivable include amounts due from crude oil, natural gas, and natural gas liquids purchasers, other operators for which the Company holds an interest, and from non-operating working interest owners. Accrued crude oil, natural gas, and natural gas liquids sales from purchasers and operators consist of accrued revenues due under normal trade terms, generally requiring payment within 60 days of production.
An allowance for doubtful accounts is established based on reviews of individual customer accounts, recent loss experience, current economic conditions, and other pertinent factors. Accounts deemed uncollectible are charged to the allowance.
Provisions for bad debts and recoveries on accounts previously charged off are added to the allowance. The Company routinely assesses the recoverability of all material trade receivables and other receivables to determine their collectability. At December 31, 2015 and 2014, the Company deemed all their significant account receivables collectible.
Advances
The Company, in its execution of its drilling program, has other working interest partners. The Company, through its joint operating agreements, requires its working interest partners to pay a drilling advance for their share of the estimated drilling and completion costs. Until such advances are applied to actual drilling and completion invoices, the Company carries the advance as a current liability on the consolidated balance sheets. The Company expects such advances to be applied against the partners’ joint interest billings for its share of drilling operations.
F-8
EARTHSTONE ENERGY, INC.
NOTES TO CONSOLIDATED FINANCIAL STATEMENTS (continued)
The Company utilizes derivative instruments in order to manage exposure to commodity price risk associated with future oil and natural gas production. The Company recognizes all derivatives as either assets or liabilities, measured at fair value, and recognizes changes in the fair value of derivatives in current earnings. The Company has elected to not designate any of its positions for hedge accounting. Accordingly, these derivative contracts are marked-to-market and any changes in the estimated values of derivative contracts held at the balance sheet date are recognized in Net gain (loss) on derivative contracts in the Consolidated Statements of Operations as unrealized gains or losses on derivative contracts. Realized gains or losses on derivative contracts are also recognized in Net gain (loss) on derivative contracts in the Consolidated Statements of Operations.
Oil and Gas Properties
Proved Properties
The Company follows the successful efforts method of accounting for its oil and gas properties. Under this method, costs to acquire oil and gas properties, drill and equip exploratory wells that find proved reserves, and drill and equip development wells are capitalized. Exploration costs, including unsuccessful exploratory wells and geological and geophysical costs, are charged to operations as incurred. Upon sale or retirement of oil and gas properties, the costs and related accumulated depreciation, depletion, and amortization are eliminated from the accounts and the resulting gain or loss is recognized.
Costs incurred to maintain wells and related equipment, lease and well operating costs, and other exploration costs are charged to expense as incurred. If additions to proved oil and gas properties will be paid within twelve months of year-end, then such additions are accrued at year-end and are included in Additions to oil and gas property and equipment financial statement line item on the Consolidated Statements of Cash Flows. Gains and losses arising from the sale of properties are included in operating income (loss) on the Consolidated Statements of Operations.
The Company’s lease acquisition costs and development costs of proved oil and gas properties are amortized using the units-of-production method, at the field level, based on total proved reserves and proved developed reserves, respectively. Depletion expense for oil and gas producing property and related equipment was $30.7 million, $18.1 million, and $16.9 million, for the years ended December 31, 2015, 2014, and 2013, respectively.
The Company reviews its proved oil and gas properties for impairment when events and circumstances indicate a decline in the recoverability of the carrying values of such properties, such as a negative revision of reserves estimates or sustained decrease in commodity prices. We estimate future cash flows expected in connection with the properties and compare such future cash flows to the carrying amount of the properties to determine if the carrying amount is recoverable. If, upon review, the sum of the undiscounted pretax cash flows is less than the carrying amount, then the carrying amount is written down to its estimated fair value.
The Company recognized impairment charges on its proved oil and gas properties in 2015, 2014, and 2013. See Note 5 Asset Impairments.
Unproved Properties
Unproved properties consist of costs incurred to acquire undeveloped leases as well as the cost to acquire unproved reserves. Undeveloped lease costs and unproved reserve acquisition costs are capitalized. If additions to unproved oil and gas properties will be paid within twelve months of year-end, then such additions are accrued for at year-end and are included in the Additions to oil and gas property and equipment financial statement line item on the Consolidated Statements of Cash Flows. Unproved oil and gas leases are generally for a primary term of three to five years. In most cases, the term of the unproved leases can be extended by paying delay rentals, meeting contractual drilling obligations, or by the presence of producing wells on the leases. Unproved costs related to successful exploratory drilling are reclassified to proved properties and depleted on a units-of-production basis.
The Company reviews its unproved properties periodically for impairment. In determining whether an unproved property is impaired, the Company considers numerous factors including, but not limited to, current exploration plans, favorable or unfavorable exploration activity on the property being evaluated and/or adjacent properties, our geologists' evaluation of the property, and the remaining months in the lease term for the property.
The Company recognized impairment charges on its unproved oil and gas properties in 2015, 2014, and 2013. See Note 5 Asset Impairments.
F-9
EARTHSTONE ENERGY, INC.
NOTES TO CONSOLIDATED FINANCIAL STATEMENTS (continued)
We account for goodwill in accordance with Financial Accounting Standards Board (“FASB”), Accounting Standards Codification (ASC) 350, Intangibles—Goodwill and Other (“ASC 350”). Goodwill represents the excess of the purchase price over the estimated fair value of the assets acquired net of the fair value of liabilities assumed in an acquisition. ASC 350 requires that intangible assets with indefinite lives, including goodwill, be evaluated on an annual basis for impairment or more frequently if an event occurs or circumstances change that could potentially result in impairment. The goodwill impairment test requires the allocation of goodwill and all other assets and liabilities to reporting units. The Company recorded goodwill related to the reverse acquisition with Earthstone and the 2014 Eagle Ford Acquisition. During 2015, the Company fully impaired the goodwill related to the 2014 Eagle Ford Acquisition. See Note 5 Asset Impairments.
Asset Retirement Obligations
Asset retirement obligations represent the present value of the estimated cash flows expected to be incurred to plug, abandon, remediate oil and gas wells, remove equipment and facilities from leased acreage, and return land to its original condition. The fair value of a liability for an asset retirement obligation is recorded in the period in which it is incurred (typically when a well is completed or acquired or when an asset is installed at the producing location), and the costs of such liability increases the carrying amount of the related long-lived asset by the same amount.
After the liability is initially recorded, the carrying amount of the related long-lived asset is increased over time through a charge to accretion expense each period and the capitalized cost is depleted on a units-of-production basis based on the proved developed reserves of the related assets. Changes in timing or to the original estimate of cash flows will result in changes to the carrying amount of the liability. See Note 10 Asset Retirement Obligations for further disclosure regarding the asset retirement obligation.
Business Combinations
The Company accounts for the acquisition of oil and gas properties, that are not commonly controlled, based on the requirements of FASB ASC Topic 805, Business Combinations, which requires an acquiring entity to recognize the assets acquired and liabilities assumed at fair value under the acquisition method of accounting, provided such assets and liabilities qualify for acquisition accounting under the standard. The Company accounts for property acquisitions of proved developed oil and gas property as business combinations.
Revenue Recognition
Oil, natural gas, and natural gas liquids revenues represent income from the production and delivery of oil, natural gas, and natural gas liquids, recorded net of royalties. Revenues are recognized when production is sold to a purchaser at a fixed or determinable price, delivery has occurred, title has been transferred, and collectability of the revenue is probable. The Company follows the sales method of accounting for gas imbalances. The Company had no significant gas imbalances as of December 31, 2015, 2014, or 2013.
Concentration of Credit Risk
Credit risk represents the actual or perceived financial loss that the Company would record if its purchasers, operators, or counterparties failed to perform pursuant to contractual terms.
The purchasers of the Company’s oil, natural gas, and natural gas liquids production consist primarily of independent marketers, major oil and natural gas companies and gas pipeline companies. Historically, the Company has not experienced any significant losses from uncollectible accounts. In 2015, 2014 and 2013, one purchaser accounted for 62%, 60% and 21%, respectively, of the Company’s oil, natural gas, and natural gas liquids revenues. No other purchaser accounted for 10% or more of the Company’s oil, natural gas, and natural gas liquids revenues during 2015, 2014, and 2013.
The Company holds working interests in oil and gas properties for which a third party serves as operator. The operator sells the oil, natural gas, and NGLs to the purchaser, collects the cash, and distributes the cash to the Company. The Company recognizes the cash received as revenue. In 2015, one operator distributed 12% and in 2014, a different operator distributed 20% of the Company’s oil, natural gas and natural gas liquids revenues. In 2013, two operators distributed 47% and 11% of the Company’s oil, natural gas, and natural gas liquids revenues. No other operator accounted for 10% or more of the Company’s oil, natural gas, and natural gas liquids revenues during 2015, 2014, and 2013.
F-10
EARTHSTONE ENERGY, INC.
NOTES TO CONSOLIDATED FINANCIAL STATEMENTS (continued)
If purchasers and operators fail to perform pursuant to contractual terms, then the Company’s overall business may be adversely impacted. The Company’s management believes this risk is mitigated by the size, and reputation, of its purchasers and operators.
Commodity derivative contracts held by the Company are with three counterparties. The counterparties have investment-grade ratings from Moody’s and Standard & Poor.
The Company regularly maintains its cash in bank deposit accounts. Balances held by the Company at its banks typically exceed Federal Deposit Insurance Corporation (“FDIC”) insurance coverage, and as a result, there is a concentration of credit risk related to the amounts of deposit in excess of FDIC insurance coverage. The Company’s management believes this risk is not significant based upon the size and reputation of the financial institutions.
Income Taxes
The provision for income taxes is based on taxes payable or refundable for the current year and deferred taxes on differences between the tax bases of assets and liabilities and their reported amounts in the consolidated financial statements, which result from temporary differences between the amount of taxable income and pretax financial income. The deferred tax assets and liabilities are calculated for the 2015 consolidated financial statements at currently enacted income tax rates applicable to the period in which the deferred tax assets and liabilities are expected to be realized or settled. Tax positions are evaluated for recognition and measurement, with deferred tax balances recorded at their anticipated settlement amounts. A valuation allowance has been provided for the 2015 deferred tax assets that based on current information is not expected to be realized. As noted in the Basis of Presentation, the historical financials, prior to December 19, 2014, are those of Oak Valley. Oak Valley was not subject to taxation and therefore tax provisions were not recorded on the historical consolidated financial statements. As result of the Exchange Agreement, Oak Valley as result of its change in tax status is now taxable and is subject to taxation and included in the purchase accounting adjustments is a charge to earnings to record a tax provision.
The Company follows the provisions of FASB ASC Topic 740, Income Taxes (“ASC Topic 740”), relating to accounting for uncertainties in income taxes. ASC Topic 740 clarifies the accounting for uncertainties in income taxes by prescribing a minimum recognition threshold that a tax position is required to meet before being recognized in the consolidated financial statements. ASC Topic 740 requires that the Company recognize in the consolidated financial statements the financial effects of a tax position, if that position is more likely than not of being sustained upon examination, including resolution of any appeals or litigation processes, based upon the technical merits of the position. ASC Topic 740 also provides guidance on measurement, classification, interest and penalties and disclosure. Tax positions taken related to the Company’s pass-through status and state income tax liability, including deductibility of expenses, have been reviewed and the Company’s management is of the opinion that material positions taken by the Company would more likely than not be sustained upon examination. Accordingly, the Company has not recorded an income tax liability for uncertain tax positions at December 31, 2015, 2014, or 2013. The 2012 through 2015 tax years generally remain subject to examination.
Recently Issued Accounting Pronouncements
Revenue Recognition – In May 2014, the FASB issued updated guidance for recognizing revenue from contracts with customers. The objective of this guidance is to establish principles for reporting information about the nature, timing, and uncertainty of revenue and cash flows arising from an entity’s contracts with customers, including qualitative and quantitative disclosures about contracts with customers, significant judgments and change in judgments, and assets recognized from the costs to obtain or fulfill a contract. In August 2015, the FASB issued guidance deferring the effective date of this standards update for one year, to be effective for interim and annual periods after December 15, 2017; early adoption is permitted as of the original effective date of December 31, 2016. The Company will adopt this standards update, as required, beginning with the first quarter of 2018. The Company is in the process of evaluating the impact, if any, of the adoption of this guidance on its Consolidated Financial Statements.
Debt Issuance Costs – In April 2015, the FASB issued updated guidance which changes the presentation of debt issuance costs in the financial statements. Under this updated guidance, debt issuance costs are presented on the balance sheet as a direct deduction from the related debt liability rather than as an asset. Amortization of the costs is reported as interest expense. In August 2015, the FASB subsequently issued a clarification as to the handling of debt issuance costs related to line-of-credit arrangements that allows the presentation of these costs as an asset. The standards update is effective for interim and annual periods beginning after December 15, 2015. The Company will adopt this standards update, as required, beginning with the first quarter of 2016 and it will be retrospectively applied to all prior periods. The Company does not expect the adoption of this new presentation guidance to have a material impact on its Consolidated Balance Sheets.
F-11
EARTHSTONE ENERGY, INC.
NOTES TO CONSOLIDATED FINANCIAL STATEMENTS (continued)
Measurement-Period Adjustments – In September 2015, the FASB issued updated guidance that eliminates the requirement to restate prior periods to reflect adjustments made to provisional amounts recognized in a business combination. The updated guidance requires that an acquirer recognize adjustments to provisional amounts that are identified during the measurement period in the reporting period in which the adjustment amounts are determined. The standards update is effective prospectively for interim and annual periods beginning after December 15, 2015 with early adoption permitted. The Company will adopt this standard update, as required, beginning with the first quarter of 2016, and does not expect it to have a material impact on its Consolidated Financial Statements.
Income Taxes – In November 2015, the FASB issued updated guidance changing the presentation of deferred taxes on the balance sheet. The updated guidance requires that all deferred tax assets and liabilities, along with any related valuation allowance, be classified as noncurrent on the balance sheet. The standards update is effective for annual and interim periods beginning after December 15, 2016 with early adoption permitted. The Company elected to early-adopt this standards update as of December 31, 2015 with prospective application. See Note 13 Income Taxes.
Note 3. Acquisitions and Divestitures
Earthstone Energy Reverse Acquisition
On December 19, 2014, the Company and OVR closed the Exchange. In this transaction, OVR contributed to the Company the membership interests of its three wholly-owned subsidiaries, which included producing assets, undeveloped acreage and cash. OVR received approximately 9.124 million shares of newly issued common stock, $0.001 par value per share (the “Common Stock”), of the Company. The Exchange resulted in a change of control of the Company. The Exchange has been accounted in accordance with FASB ASC 805, as a reverse acquisition whereby Oak Valley is considered the acquirer for accounting purposes although Earthstone is the acquirer for legal purposes. ASC 805 also requires, that among other things, assets acquired and liabilities assumed to be measured at their acquisition date fair values. The results of operations from Earthstone’s legacy assets are reflected in the Company’s consolidated statement of operations beginning December 19, 2014.
An allocation of the purchase price was prepared using, among other things, the 2014 year-end reserve report prepared by Cawley, Gillespie and Associates, Inc. (“CG&A”) that was adjusted and re-priced by the Company’s reserve engineering staff back to the December 19, 2014 acquisition date.
F-12
EARTHSTONE ENERGY, INC.
NOTES TO CONSOLIDATED FINANCIAL STATEMENTS (continued)
The following table summarizes the consideration paid to acquire the legacy Earthstone net assets and the estimated values of those net assets (in thousands, except share and share price amounts):
|
Shares of Common Stock outstanding before the Exchange |
|
|
1,734,988 |
|
|
Company director and officer restricted shares that vested in the Exchange |
|
|
18,400 |
|
|
Shares of Common Stock issued in the Exchange |
|
|
9,124,452 |
|
|
Total shares of Common Stock outstanding following the Exchange |
|
|
10,877,840 |
|
|
|
|
|
|
|
|
Shares of Common Stock issued as consideration |
|
|
1,753,388 |
|
|
Closing price of Common Stock (1) |
|
$ |
19.08 |
|
|
Total purchase price |
|
$ |
33,455 |
|
|
Estimated Fair Value of Liabilities Assumed: |
|
|
|
|
|
Current liabilities |
|
$ |
7,631 |
|
|
Long-term debt |
|
|
7,000 |
|
|
Deferred tax liability (2) |
|
|
2,880 |
|
|
Asset retirement obligation |
|
|
1,035 |
|
|
Amount attributable to liabilities assumed |
|
|
18,546 |
|
|
Total purchase price plus liabilities assumed |
|
$ |
52,001 |
|
|
Estimated Fair Value of Assets Acquired: |
|
|
|
|
|
Cash (3) |
|
$ |
2,920 |
|
|
Other current assets |
|
|
3,466 |
|
|
Proved oil and natural gas properties (4) (5) |
|
|
21,813 |
|
|
Unproved oil and natural gas properties |
|
|
5,524 |
|
|
Other non-current assets |
|
|
745 |
|
|
Amount attributable to assets acquired |
|
$ |
34,468 |
|
|
Goodwill (6) |
|
$ |
17,533 |
|
|
|
|
|
|
|
|
|
|
|
|
|
|
|
(1) |
The share price used for the determination of the purchase price, was the adjusted closing price of the Common Stock on December 19, 2014. |
|
|
(2) |
This amount represents the recorded book value versus tax value difference in oil and natural gas properties and other net assets as of the date the Exchange on a tax effected basis of approximately 35%. The tax basis of the legacy Earthstone assets were not adjusted in the Exchange. As noted above, however, ASC 805 requires that the Company in a reverse acquisition record the legacy Earthstone net assets at fair value on the date of the Exchange; the fair value of the net assets was in excess of the tax basis and as such required the recognition of a deferred tax liability. |
|
|
(3) |
The components of cash flow in the Exchange transaction in which the legacy Earthstone assets were acquired was $7.1 million in notes payable and accrued interest that was paid in full in conjunction with the Exchange less the cash acquired of $2.9 million. |
|
|
(4) |
The weighted average commodity prices utilized in the determination of the fair value of oil and natural gas properties was $51.62 per barrel of oil and $4.58 per Mcf of natural gas after adjustments for transportation fees and regional price differentials. |
|
|
(5) |
The market assumptions as to future commodity prices, projections of estimated quantities of oil and natural gas reserves, expectations for timing and amount of future development and operating costs, projections of future rates of production, expected recovery rates and risk adjusted discount rates used by the Company to estimate the fair value of the oil and natural gas properties represent Level 3 inputs. For additional information on Level 3 inputs, see Note 6 Fair Value Adjustments. |
|
|
(6) |
Goodwill was determined to be the excess consideration exchanged over the fair value of the Company’s net assets on December 19, 2014. During the three months ended December 31, 2015, a decrease of $1.4 million was recorded to goodwill and reflect purchase price adjustments made to estimated items in the preliminary purchase price allocation. The goodwill recognized will not be deductible for tax purposes. |
F-13
EARTHSTONE ENERGY, INC.
NOTES TO CONSOLIDATED FINANCIAL STATEMENTS (continued)
2014 Eagle Ford Acquisition Properties
Also on December 19, 2014, immediately following the Exchange, Flatonia Energy, LLC (“Flatonia”), Parallel Resource Partners, LLC (“Parallel”), and Sabine, closed the transactions contemplated by the Contribution Agreement by and among the Company, OVR, Sabine, OVO, Parallel, and Flatonia, whereby Parallel contributed 28.57% of the oil and natural gas property interests held by Flatonia, a wholly owned subsidiary of Parallel, in consideration for approximately 2.957 million shares of Common Stock (the “Contribution”). The assets subject to the Contribution Agreement were oil and natural gas property interests in producing wells and acreage in the Eagle Ford trend of Texas (the “2014 Eagle Ford Acquisition Properties”). One of the subsidiaries included in the Exchange is the operator of the 2014 Eagle Ford Acquisition Properties. The only relationship that Flatonia or Parallel had with this subsidiary or the Company prior to the transaction was that the subsidiary is the operator of the 2014 Eagle Ford Acquisition Properties. The Contribution was accounted for as a business combination in accordance ASC 805 which among other things requires the assets acquired and liabilities assumed to be measured and recorded at their fair values as of the acquisition date.
An allocation of the purchase price was prepared using, the 2014 year-end reserve report prepared by CG&A that was adjusted and re-priced by the Company’s reserve engineering staff back to December 19, 2014. During the three months ended December 31, 2015, the preliminary purchase price allocation was adjusted due to the completion of the 2014 Flatonia tax return, with respect to the deferred tax liability.
The following table summarizes the consideration paid to acquire the 2014 Eagle Ford Acquisition Properties and the estimated values of those net assets (in thousands, except share and share price amounts):
|
Shares of Common Stock issued as consideration in the Contribution |
|
|
2,957,288 |
|
|
Closing price of Common Stock (1) |
|
$ |
19.08 |
|
|
Total purchase price |
|
$ |
56,425 |
|
|
|
|
|
|
|
|
Estimated Fair Value of Liabilities Assumed: |
|
|
|
|
|
Deferred tax liability (2) |
|
$ |
1,547 |
|
|
Asset retirement obligation |
|
|
173 |
|
|
Amount attributable to liabilities assumed |
|
|
1,720 |
|
|
Total purchase price plus liabilities assumed |
|
$ |
58,145 |
|
|
|
|
|
|
|
|
Estimated Fair Value of Assets Acquired: |
|
|
|
|
|
Proved oil and natural gas properties (3) (4) |
|
$ |
34,745 |
|
|
Unproved oil and natural gas properties |
|
|
21,853 |
|
|
Amount attributable to assets acquired |
|
$ |
56,598 |
|
|
|
|
|
|
|
|
Goodwill (5) |
|
$ |
1,547 |
|
|
|
|
|
|
|
|
|
|
|
|
|
|
|
(1) |
The share price used for the determination of the purchase price, was the adjusted closing price of the Common Stock on December 19, 2014. |
|
|
(2) |
This amount represents the recorded book value to tax difference of the oil and natural gas properties as of the date of the closing of the Contribution Agreement on a tax effected basis of approximately 34%. As noted above, the Company received the net assets acquired at Flatonia’s carryover tax basis; however, ASC 805 requires assets acquired and liabilities assumed be measured at their fair values as of the acquisition date; the fair value of the 2014 Eagle Ford Acquisition Properties on December 19, 2014 was in excess of the tax basis and as such required the recognition of a deferred tax liability. |
|
|
(3) |
The weighted average commodity prices utilized in the determination of the fair value of oil and natural gas properties was $56.36 per barrel of oil and $3.36 per Mcf of natural gas after adjustments for transportation fees and regional price differentials. |
F-14
EARTHSTONE ENERGY, INC.
NOTES TO CONSOLIDATED FINANCIAL STATEMENTS (continued)
|
|
(5) |
Goodwill was determined as the excess consideration exchanged over the fair value of the 2014 Eagle Ford Acquisition Properties on December 19, 2014. During the fourth quarter of 2015 and due to the current commodity price environment, the Company determined that the goodwill balance was not recoverable and therefore fully impaired it, recording a goodwill impairment charge of $1.5 million. See Note 5 Asset Impairments. |
The following unaudited pro forma combined condensed results of operations are provided for the years ended December 31, 2014 and 2013 as though the Exchange and Contribution had been completed as of January 1, 2013. These unaudited supplemental pro forma results of operations are provided for illustrative purposes only and do not purport to be indicative of the actual results that would have been achieved by the combined company for the periods presented or that may be achieved by the combined company in the future. The pro forma results of operations do not include any cost savings or other synergies that resulted, or may result, from the Exchange or Contribution or any estimated costs that will be incurred to integrate the legacy Earthstone net assets and the 2014 Eagle Ford Acquisition Properties. Future results may vary significantly from the results reflected in this unaudited pro forma financial information (in thousands, except per share amounts).
|
|
|
Years ended December 31, |
|
|||||
|
|
|
2014 |
|
|
2013 |
|
||
|
|
|
(Unaudited) |
|
|||||
|
Revenue |
|
$ |
85,633 |
|
|
$ |
66,450 |
|
|
Income before taxes |
|
$ |
16,196 |
|
|
$ |
2,460 |
|
|
Net income available to Earthstone common stockholders |
|
$ |
10,672 |
|
|
$ |
1,610 |
|
|
Pro forma net loss per common share: |
|
|
|
|
|
|
|
|
|
Basic and diluted |
|
$ |
0.77 |
|
|
$ |
0.12 |
|
|
|
|
|
|
|
|
|
|
|
The Company’s historical financial information was adjusted to give effect to the pro formas events that were directly attributable to the Exchange and the Contribution and were factually supportable. The unaudited pro forma consolidated results include the historical revenues and expenses of the assets acquired and liabilities assumed in the transactions noted above with the following adjustments:
|
|
· |
Adjustments to recognize incremental depletion expense under the successful efforts method of accounting based on the fair value of the oil and natural gas properties and incremental accretion expense based on the asset retirement costs of the oil and natural gas properties acquired; |
|
|
· |
Eliminate historical interest expense for the legacy Earthstone debt that was retired; |
|
|
· |
Eliminate transaction costs and non-recurring charges directly related to the transactions that were included in the historical results of operations for Earthstone and OVR in the amount of $3.3 million. Transaction costs directly related to the transactions that do not have a continuing impact on the combined Company’s operating results have been excluded from the 2014 and 2013 pro forma earnings; |
|
|
· |
Adjustments to recognize pro forma income tax based on an assumed approximate 35% rate; |
|
|
· |
Adjustments to convert the full cost method financial statement of Earthstone to successful efforts financial statements which included adjusting exploration expense which would not have been capitalized under successful efforts method of accounting for oil and natural gas activities; and |
|
|
· |
Adjustment to eliminate the non-recurring deferred tax expense charge for the conversion of the Oak Valley subsidiaries from a non-taxable partnership to a taxable corporation. |
F-15
EARTHSTONE ENERGY, INC.
NOTES TO CONSOLIDATED FINANCIAL STATEMENTS (continued)
In July 2013 and August 2013, the Company purchased producing wells and acreage in the Eagle Ford shale trend of South Texas for approximately $71.6 million and $15.1 million, respectively (the “2013 Eagle Ford Acquisition”). The 2013 Eagle Ford Acquisition was accounted for as a business combination in accordance with ASC Topic 805, which among other things, requires assets acquired and liabilities assumed to be measured at fair value as of the effective date of the acquisition. The effective date of the 2013 Eagle Ford Acquisition was January 1, 2013. The estimated fair value of the properties approximates the fair value of consideration, and as a result, no goodwill was recognized.
The following table summarizes the consideration paid to acquire the properties and the amounts of the assets acquired and liabilities assumed:
|
(In thousands) |
|
|
|
|
|
Purchase price |
|
$ |
86,687 |
|
|
Allocation of purchase price: |
|
|
|
|
|
Proved properties (1) (2) |
|
$ |
57,255 |
|
|
Unproved properties |
|
|
30,041 |
|
|
Asset retirement obligations |
|
|
(609 |
) |
|
Total |
|
$ |
86,687 |
|
|
|
(1) |
The weighted average commodity prices utilized in the determination of the fair value of oil and natural gas properties was $99.32 per barrel of oil and $3.24 per Mcf of natural gas after adjustments for transportation fees and regional price differentials. |
|
|
(2) |
The market assumptions as to future commodity prices, projections of estimated quantities of oil and natural gas reserves, expectations for timing and amount of future development and operating costs, projections of future rates of production, expected recovery rates and risk adjusted discount rates used by the Company to estimate the fair value of the oil and natural gas properties represent Level 3 inputs. For additional information on Level 3 inputs, see Note 6 Fair Value Adjustments. |
The following unaudited pro forma combined results of operations are provided for the year ended December 31, 2013 as if the 2013 Eagle Ford Acquisition had been completed as of January 1, 2013. The pro forma combined results of operations for the year ended December 31, 2013 have been prepared by adjusting historical results of the Company to include the historical results of the 2013 Eagle Ford Acquisition. These supplemental pro-forma results of operations are provided for illustrative purposes only and do not purport to be indicative of the actual results that would have been achieved by the combined company for the periods presented or that may be achieved by the combined company in the future. The pro forma results of operations do not include any cost savings or other synergies that resulted, or may result, from the Eagle Ford Acquisition or any estimated costs that will be incurred to integrate the 2013 Eagle Ford Acquisition. Future results may vary significantly from the results reflected in this unaudited pro forma financial information because of future events and transactions, as well as other factors.
The unaudited pro forma consolidated results include the Company’s historical financial information and the revenues and expenses of assets acquired and liabilities assumed in the 2013 Eagle Ford Acquisition (in thousands except share amounts):
|
|
|
Year ended December 31, |
|
|
|
|
|
2013 |
|
|
|
|
|
(Unaudited) |
|
|
|
Revenue |
|
$ |
48,291 |
|
|
Loss before taxes |
|
$ |
(5,240 |
) |
|
Net loss available to Earthstone common stockholders |
|
$ |
(3,406 |
) |
|
Pro forma net loss per common share: |
|
|
|
|
|
Basic and diluted |
|
$ |
(0.37 |
) |
|
|
|
|
|
|
F-16
EARTHSTONE ENERGY, INC.
NOTES TO CONSOLIDATED FINANCIAL STATEMENTS (continued)
The Company’s historical financial information was adjusted to give effect to the pro formas events that were directly attributable to 2013 Eagle Ford Property acquisition and were factually supportable. The unaudited pro forma consolidated results include the historical revenues and expenses of the assets acquired and liabilities assumed in the transactions noted above with the following adjustments:
|
|
· |
Adjustments to recognize incremental depletion expense under the successful efforts method of accounting based on the fair value of the oil and natural gas properties and incremental accretion expense based on the asset retirement costs of the oil and natural gas properties acquired; |
|
|
· |
Eliminate transaction costs and non-recurring charges directly related to the transactions that were included in the historical results of operations for OVR in the amount of $1.1 million. Transaction costs directly related to the transactions that do not have a continuing impact on the Company’s operating results have been excluded from the 2013 pro forma earnings; and |
|
|
· |
Adjustments to recognize pro forma income tax based on an assumed approximately 35% rate. |
The amount of revenue and net income from the 2013 Eagle Ford Acquisition included in the Company’s Consolidated Statements of Operations for the year ended December 31, 2013, was $9.5 million and $6.2 million, respectively.
Acquisition costs of $1.1 million, are included in General and administrative expense in the Consolidated Statements of Operations.
Other Acquisitions
In June 2015, the Company acquired a 50% operated interest in two gross Austin Chalk wells, which hold approximately 1,000 gross acres in southern Gonzales County, Texas. The acreage, acquired for future Eagle Ford development, is 100% held-by-production, with gross production as of the time of the acquisition of 44 barrels of oil equivalent per day (“BOEPD”) all of which was oil. Also during June 2015, the Company acquired additional acreage in northern Karnes County, Texas, increasing its total leasehold position to approximately 400 gross acres. The Company has a 33% working interest in the Karnes acreage. These two positions are adjacent to one another. The Company initiated drilling on the Karnes county acreage during the fourth quarter of 2015, with completions on four wells expected to occur during 2016. The Gonzales County acreage will provide for 13 gross Eagle Ford locations.
The following table summarizes the consideration paid to acquire the properties and the estimated fair values of the assets acquired and liabilities assumed (in thousands):
|
Purchase price |
|
$ |
4,066 |
|
|
|
|
|
|
|
|
Estimated fair value of assets acquired: |
|
|
|
|
|
Proved oil and natural gas properties |
|
$ |
588 |
|
|
Unproved oil and natural gas properties |
|
|
3,496 |
|
|
Total assets acquired |
|
$ |
4,084 |
|
|
|
|
|
|
|
|
Estimated fair value of liabilities assumed: |
|
|
|
|
|
Asset retirement obligations |
|
$ |
13 |
|
|
Other liabilities |
|
|
5 |
|
|
Total liabilities assumed |
|
$ |
18 |
|
|
Consideration paid |
|
$ |
4,066 |
|
Pro forma financial information, assuming the acquisition occurred at the beginning of each period presented, has not been presented because the effect on the Company’s results for each of those periods is not material. The results of the above acquisitions have been included in the Company’s consolidated financial statements since the date of each acquisition.
In June 2015, the Company acquired additional acreage and increased the Company’s working interest in wells in existing Bakken spacing units primarily located in the Banks Field of McKenzie County, North Dakota, for $1.4 million plus purchase price adjustments of $2.0 million for the revenues, net of production taxes and operating expenses and capital costs incurred for the existing wells. The acquisition included 164 net acres which allowed the Company to increase its working interest in approximately 41 producing wells and 21 wells that are in the drilling and completion phase.
F-17
EARTHSTONE ENERGY, INC.
NOTES TO CONSOLIDATED FINANCIAL STATEMENTS (continued)
In August 2015, the Company acquired a 33% working interest in approximately 1,650 gross acres, in Southern Gonzales County, Texas for $3.3 million. This acreage is anticipated to support 16 additional gross Eagle Ford locations.
Divestitures
In May 17, 2013, the Company sold undeveloped acreage and working interest in nine wells located in Guadalupe County, Texas, and Caldwell County, Texas for cash consideration of $0.5 million. The Company recorded a loss on sale of $0.1 million. The effective date of the sale was April 1, 2013.
On March 28, 2013, the Company sold undeveloped acreage in Harrison County, Texas, and the working interest in one well for cash consideration of one hundred dollars. The Company recorded a loss on sale of $0.1 million. The effective date of the sale was April 1, 2013.
In April 2015, the Company sold its Louisiana properties located primarily in DeSoto and Caddo Parishes, Louisiana, for cash consideration of $3.4 million. The Company recorded a gain of $1.6 million on the sale. The effective date of the transaction was March 1, 2015.
Note 4. Derivative Financial Instruments
The Company is exposed to certain risks relating to its ongoing business operations, such as commodity price risk. Derivative contracts are utilized to economically hedge the Company’s exposure to price fluctuations and reduce the variability in the Company’s cash flows associated with anticipated sales of future oil and natural gas production. The Company follows FASB ASC Topic 815 Derivatives and Hedging (“ASC Topic 815”), to account for its derivative financial instruments. The Company does not enter into derivative contracts for speculative trading purposes.
It is the Company’s policy to enter into derivative contracts only with counterparties that are creditworthy financial institutions deemed by management as competent and competitive. The counterparties to the Company’s current derivative contracts are lenders in the Company’s Credit Agreement. The Company did not post collateral under any of these contracts as they are secured under the Company’s Credit Agreement.
The Company’s crude oil and natural gas derivative positions consist of swaps. Swaps are designed so that the Company receives or makes payments based on a differential between fixed and variable prices for crude oil and natural gas. The Company has elected to not designate any of its derivative contracts for hedge accounting. Accordingly, the Company records the net change in the mark-to-market valuation of these derivative contracts, as well as all payments and receipts on settled derivative contracts, in “Net gain on derivative contracts” on the Consolidated Statements of Operations. All derivative contracts are recorded at fair market value and included in the Consolidated Balance Sheets as assets or liabilities.
With an individual derivative counterparty, the Company may have multiple hedge positions that expire at various points in the future and result in fair value asset and liability positions. At the end of each reporting period, those positions are offset to a single fair value asset or liability for each commodity, and the netted balance is reflected in the Consolidated Balance Sheets as an asset or a liability.
The Company nets its derivative instrument fair value amounts executed with the same counterparty pursuant to an International Swap Dealers Association Master Agreement (“ISDA”), which provides for net settlement over the term of the contract. The ISDA is a standard contract that governs all derivative contracts entered into between the Company and the respective counterparty. The ISDA allows for offsetting of amounts payable or receivable between the Company and the counterparty, at the election of both parties, for transactions that occur on the same date and in the same currency.
The Company had the following open crude oil and natural gas derivative contracts as of December 31, 2015:
|
Period |
|
Instrument |
|
Commodity |
|
Volume in Bbls |
|
|
Fixed Price |
|
||
|
January 2016 - March 2016 |
|
Swap |
|
Crude Oil |
|
|
15,000 |
|
|
$ |
57.00 |
|
|
January 2016 - June 2016 |
|
Swap |
|
Crude Oil |
|
|
60,000 |
|
|
$ |
58.00 |
|
|
January 2016 - December 2016 |
|
Swap |
|
Crude Oil |
|
|
60,000 |
|
|
$ |
60.80 |
|
|
January 2016 - December 2016 |
|
Swap |
|
Crude Oil |
|
|
60,000 |
|
|
$ |
60.80 |
|
F-18
EARTHSTONE ENERGY, INC.
NOTES TO CONSOLIDATED FINANCIAL STATEMENTS (continued)
In January 2016 and March 2016, the Company entered into the following commodity derivative contracts:
|
Period |
|
Instrument |
|
Commodity |
|
Volume in MMBtu/Bbls |
|
|
Fixed Price |
|
||
|
February 2016 - December 2016 |
|
Swap |
|
Natural Gas |
|
|
770,000 |
|
|
$ |
2.53 |
|
|
January 2017 - December 2017 |
|
Swap |
|
Natural Gas |
|
|
480,000 |
|
|
$ |
2.785 |
|
|
April 2016 - March 2017 |
|
Swap |
|
Crude Oil |
|
|
120,000 |
|
|
$ |
42.30 |
|
The following table summarizes the location and fair value amounts of all derivative instruments in the Consolidated Balance Sheets as well as the gross recognized derivative assets, liabilities, and amounts offset in the Consolidated Balance Sheets (in thousands):
|
|
|
|
|
December 31, 2015 |
|
|
December 31, 2014 |
|
||||||||||||||||||
|
Derivatives not designated as hedging contracts under ASC Topic 815 |
|
Balance Sheet Location |
|
Gross Recognized Assets / Liabilities |
|
|
Gross Amounts Offset |
|
|
Net Recognized Assets / Liabilities |
|
|
Gross Recognized Assets / Liabilities |
|
|
Gross Amounts Offset |
|
|
Net Recognized Assets / Liabilities |
|
||||||
|
Commodity contracts |
|
Current derivative assets |
|
$ |
3,694 |
|
|
$ |
— |
|
|
$ |
3,694 |
|
|
$ |
3,569 |
|
|
$ |
— |
|
|
$ |
3,569 |
|
The follow table summarizes the location and amounts of the Company’s realized and unrealized gains and losses on derivatives instruments in the Company’s Consolidated Statements of Operations (in thousands):
|
|
|
|
|
Years Ended December 31, |
|
|||||||||
|
|
|
|
|
2015 |
|
|
2014 |
|
|
2013 |
|
|||
|
Derivatives not designated as hedging contracts under ASC Topic 815 |
|
Statement of Operations Location |
|
|
|
|
|
|
|
|
|
|
|
|
|
Unrealized gain (loss) on commodity contracts |
|
Net gain on derivative contracts |
|
$ |
125 |
|
|
$ |
3,614 |
|
|
$ |
(45 |
) |
|
Realized gain on commodity contracts |
|
Net gain on derivative contracts |
|
$ |
6,306 |
|
|
$ |
778 |
|
|
$ |
341 |
|
|
|
|
|
|
$ |
6,431 |
|
|
$ |
4,392 |
|
|
$ |
296 |
|
Note 5. Asset Impairments
The Company had the following non-cash asset impairment charges for the years ended December 31, 2015, 2014 and 2013 (in thousands):
|
|
|
Years Ended December 31, |
|
|||||||||
|
|
|
2015 |
|
|
2014 |
|
|
2013 |
|
|||
|
Proved property |
|
$ |
93,984 |
|
|
$ |
16,903 |
|
|
$ |
9,817 |
|
|
Unproved property |
|
|
42,555 |
|
|
|
2,456 |
|
|
|
2,481 |
|
|
Goodwill |
|
|
1,547 |
|
|
|
— |
|
|
|
— |
|
|
Total |
|
$ |
138,086 |
|
|
$ |
19,359 |
|
|
$ |
12,298 |
|
Note 6. Fair Value Measurements
FASB ASC Topic 820, Fair Value Measurements and Disclosure (“ASC Topic 820”), defines fair value as the price that would be received to sell an asset, or paid to transfer a liability, in an orderly transaction between market participants at the measurement date. ASC Topic 820 provides a framework for measuring fair value, establishes a three level hierarchy for fair value measurements based upon the transparency of inputs to the valuation of an asset or liability as of the measurement date and requires consideration of the counterparty’s creditworthiness when valuing certain assets.
F-19
EARTHSTONE ENERGY, INC.
NOTES TO CONSOLIDATED FINANCIAL STATEMENTS (continued)
The three-level fair value hierarchy for disclosure of fair value measurements defined by ASC Topic 820 is as follows:
Level 1 – Unadjusted, quoted prices in active markets that are accessible at the measurement date for identical, unrestricted assets or liabilities. An active market is defined as a market where transactions for the financial instrument occur with sufficient frequency and volume to provide pricing information on an ongoing basis.
Level 2 – Inputs, other than quoted prices within Level 1, that are either directly or indirectly observable for the asset or liability through correlation with market data at the measurement date and for the duration of the instrument’s anticipated life.
Level 3 – Prices or valuations that require unobservable inputs that are both significant to the fair value measurement and unobservable. Valuation under Level 3 generally involves a significant degree of judgment from management.
A financial instrument’s level within the fair value hierarchy is based on the lowest level of any input that is significant to the fair value measurement. Where available, fair value is based on observable market prices or parameters or derived from such prices or parameters. Where observable prices or inputs are not available, valuation models are applied. These valuation techniques involve some level of management estimation and judgment, the degree of which is dependent on the price transparency for the instruments or market and the instrument’s complexity. The Company reflects transfers between the three levels at the beginning of the reporting period in which the availability of observable inputs no longer justifies classification in the original level. There were no transfers between fair value hierarchy levels for the year ended December 31, 2015.
Fair Value on a Recurring Basis
Derivative financial instruments are carried at fair value and measured on a recurring basis. The derivative financial instruments consist of swaps for crude oil and natural gas. The Company’s swaps are valued based on a discounted future cash flow model. The primary input for the model is published forward commodity price curves. The Company’s model is validated by the counterparty’s marked-to-market statements. The swaps are also designated as Level 2 within the valuation hierarchy.
The fair values of commodity derivative instruments in an asset position include a measure of counterparty nonperformance risk, and the fair values of commodity derivative instruments in a liability position include a measure of the Company’s nonperformance risk. These measurements were not material to the consolidated financial statements.
The following table summarizes the fair value of the Company’s financial assets and liabilities, by level within the fair-value hierarchy (in thousands):
|
December 31, 2015 |
|
Level 1 |
|
|
Level 2 |
|
|
Level 3 |
|
|
Total |
|
||||
|
Financial assets |
|
|
|
|
|
|
|
|
|
|
|
|
|
|
|
|
|
Current derivative assets |
|
$ |
— |
|
|
$ |
3,694 |
|
|
$ |
— |
|
|
$ |
3,694 |
|
|
|
|
|
|
|
|
|
|
|
|
|
|
|
|
|
|
|
|
Total financial assets |
|
$ |
— |
|
|
$ |
3,694 |
|
|
$ |
— |
|
|
$ |
3,694 |
|
|
|
|
|
|
|
|
|
|
|
|
|
|
|
|
|
|
|
|
December 31, 2014 |
|
|
|
|
|
|
|
|
|
|
|
|
|
|
|
|
|
Financial assets |
|
|
|
|
|
|
|
|
|
|
|
|
|
|
|
|
|
Current derivative assets |
|
$ |
— |
|
|
$ |
3,569 |
|
|
$ |
— |
|
|
$ |
3,569 |
|
|
|
|
|
|
|
|
|
|
|
|
|
|
|
|
|
|
|
|
Total financial assets |
|
$ |
— |
|
|
$ |
3,569 |
|
|
$ |
— |
|
|
$ |
3,569 |
|
Other financial instruments include cash, accounts receivable and payable, and revenue royalties. The carrying amount of these instruments approximates fair value because of their short-term nature. The Company’s long-term debt obligation bears interest at floating market rates, therefore carrying amounts and fair value are approximately equal.
Fair Value on a Nonrecurring Basis
The Company applies the provisions of the fair value measurement standard on a non-recurring basis to its non-financial assets and liabilities, including oil and gas properties and goodwill. These assets and liabilities are not measured at fair value on an ongoing basis but are subject to fair value adjustments only in certain circumstances.
F-20
EARTHSTONE ENERGY, INC.
NOTES TO CONSOLIDATED FINANCIAL STATEMENTS (continued)
Oil and gas properties are measured at fair value on a nonrecurring basis. The impairment charge reduces the carrying values of oil and gas properties’ to their estimated fair values. These fair value measurements are classified as Level 3 measurements and include many unobservable inputs. Fair value is calculated as the estimated discounted future net cash flows attributable to the assets. The Company’s primary assumptions in preparing the estimated discounted future net cash flows to be recovered from oil and gas properties are based on (i) proved reserves, (ii) forward commodity prices and assumptions as to costs and expenses, and (iii) the estimated discount rate that would be used by potential purchasers to determine the fair value of the assets.
The Company recorded asset impairments of $94.0 million, $16.9 million and $9.8 million on proved properties during the years ended December 31, 2015, 2014, and 2013, respectively. The Company recorded asset impairments of $42.6 million, $2.5 million, and $2.5 million on unproved properties during the years ended December 31, 2015, 2014, and 2013, respectively. All of the 2015, 2014, and 2013 impairments were included in impairment expense in the Company’s Consolidated Statements of Operations.
Goodwill Impairments
The Company tests goodwill for impairment annually in the fourth quarter or whenever events or changes in circumstances indicate that the fair value of its reporting unit may have been reduced below its carrying value. For purposes of determining the goodwill impairment, the Company estimated the fair value of the goodwill using a variety of valuation methods, including the income and market approaches. The estimate of fair value requires the Company to use significant unobservable inputs, representative of a Level 3 fair value measurement, including assumptions for future crude oil and natural gas production, commodity prices based on forward commodity price curves, operating and development costs and other factors.
The Company recorded goodwill impairments of $1.5 million for the year ended December 31, 2015, related to its 2014 Eagle Ford Acquisition Properties.
Business Combinations
The Company records the identifiable assets acquired and liabilities assumed at fair value at the date of acquisition on a nonrecurring basis. Fair value may be estimated using comparable market data, a discounted cash flow method, or a combination of the two. In the discounted cash flow method, estimated future cash flows are based on management’s expectations for the future and include estimates of future oil and gas production, commodity prices based on NYMEX commodity futures price strips as of the date of the estimate, operating and development costs, and a risk-adjusted discount rate. The future oil and natural gas pricing used in the valuation is a Level 2 assumption. Significant Level 3 assumptions associated with the calculation of discounted cash flows used in the determination of fair value of the acquisition include the Company’s estimate operating and development costs, anticipated production of proved reserves, appropriate risk-adjusted discount rates and other relevant data. The Company’s acquisitions are discussed in Note 3 “Acquisitions and Divestitures”.
Asset Retirement Obligation
The asset retirement obligation estimates are derived from historical costs and management’s expectation of future cost environments; and therefore, the Company has designated these liabilities as Level 3. The significant inputs to this fair value measurement include estimates of plugging, abandonment and remediation costs, well life, inflation and credit-adjusted risk free rate. See Note 10 Asset Retirement Obligations for a reconciliation of the beginning and ending balances of the liability for the Company’s asset retirement obligations.
Note 7. Equity
Earnings (Loss) Per Common Share
Basic earnings per share is computed by dividing net income attributable to common shares by the basic weighted-average shares of common stock outstanding during the period. The calculation of diluted earnings per share is similar to basic, except the denominator includes the effect of dilutive common stock equivalents. Common stock equivalents include awards issued under the Company’s long-term incentive plan discussed in Note 8 Stock Based Compensation. The Company had no outstanding common stock equivalents for the years ended December 31, 2015, 2014, and 2013.
F-21
EARTHSTONE ENERGY, INC.
NOTES TO CONSOLIDATED FINANCIAL STATEMENTS (continued)
The following table is a reconciliation of net income and weighted-average common shares outstanding for purposes of calculating basic and diluted loss per share. The number of shares for the year ended December 31, 2013, reflect the shares issued to OVR on December 19, 2014 as a result of the Exchange Agreement that was accounted for as a reverse acquisition.
|
|
|
Years Ended December 31, |
|
|||||||||
|
(In thousands, except per share amounts) |
|
2015 |
|
|
2014 |
|
|
2013 |
|
|||
|
Net loss |
|
$ |
(116,655 |
) |
|
$ |
(28,834 |
) |
|
$ |
(19,875 |
) |
|
|
|
|
|
|
|
|
|
|
|
|
|
|
|
Weighted average common shares outstanding: |
|
|
|
|
|
|
|
|
|
|
|
|
|
Basic |
|
|
13,835 |
|
|
|
9,279 |
|
|
|
9,124 |
|
|
Diluted |
|
|
13,835 |
|
|
|
9,279 |
|
|
|
9,124 |
|
|
|
|
|
|
|
|
|
|
|
|
|
|
|
|
Net loss per share: |
|
|
|
|
|
|
|
|
|
|
|
|
|
Basic |
|
$ |
(8.43 |
) |
|
$ |
(3.11 |
) |
|
$ |
(2.18 |
) |
|
Diluted |
|
$ |
(8.43 |
) |
|
$ |
(3.11 |
) |
|
$ |
(2.18 |
) |
Members’ Equity
As was explained in Note 2 – Summary of Significant Account Policies – Principles of Consolidation the historical financial information contained in these consolidated financial statements is that of OVR and its subsidiaries. OVR was formed on December 14, 2012. On December 21, 2012, OVR was capitalized by affiliates of EnCap via the contribution of certain oil and gas properties which were conveyed by assigning 100% of the issued and outstanding membership interests in ECC VI, LLC and 100% of the issued and outstanding membership interest in Oak Valley Energy, LLC in exchange for membership interests in OVR. Also on December 21, 2012, EnCap, Wells Fargo, VILLCo, and OVM committed an aggregate of $150.0 million in exchange for additional membership interests in OVR. On April 25, 2013, OVR closed a private placement offering amongst accredited investors that raised $62.8 million in capital commitments in exchange for membership interests in OVM. During 2013 OVM members committed an additional $1.7 million (collectively “Investors”).
Capital Call Notices
In January 2013, OVR received cash investments in the amount of $16.8 million related to its first capital call notice sent to Wells Fargo, VILLCo, and OVM.
In May 2013, OVR received cash investments in the amount of $23.7 million related to its second capital call notice to Investors.
In June 2013, OVR received cash investments in the amount of $67.0 million related to its third capital call notice to Investors.
In December 2014, OVR received cash investments in the amount of $107.0 million related to its third capital call notice to Investors.
Common Stock
On December 19, 2014, pursuant to the Exchange Agreement, the Company issued to OVR 9,124,452 shares (the “Exchange Shares”) of Earthstone common stock, in exchange for the outstanding membership interests of OVR’s three subsidiaries. The issuance of the Exchange Shares is exempt from registration as a private placement under Section 4(a)(2) of the Securities Act of 1933, as amended (the “Securities Act”), and Rule 506 promulgated thereunder, among other exemptions.
Pursuant to the Contribution Agreement, OVR, through its wholly owned subsidiary, Sabine, acquired a 20% undivided ownership interest in certain oil and gas properties located in Fayette and Gonzales Counties, Texas, in exchange for the issuance of 2,957,288 shares (the “Contribution Shares”) of Earthstone common stock to Flatonia Energy, LLC. The issuance of Contribution Shares is exempt from registration as a private placement under Section 4(a)(2) of the Securities Act, and Rule 506 promulgated thereunder, amount other exemption.
F-22
EARTHSTONE ENERGY, INC.
NOTES TO CONSOLIDATED FINANCIAL STATEMENTS (continued)
Note 8. Stock Based Compensation
2014 Long-Term Incentive Plan
In December 2014, stockholders approved and adopted the 2014 Long-Term Incentive Plan (the “2014 Plan”), which was effective upon the December 19, 2014 closing of the Exchange Agreement with OVR and shall remain in effect until the day prior to the tenth anniversary thereof. In October 2015, the 2014 Plan was amended to increase the number of shares of common stock authorized to be issued thereunder. Under the 2014 Plan, the Company may grant stock options, restricted stock awards, restricted stock units, stock appreciation rights, performance units, performance bonuses, stock awards and other incentive awards to directors, officers, employees and independent contractors of the Company and its subsidiaries or affiliates. The Company may also grant nonqualified stock options, restricted stock awards, restricted stock units, stock appreciation rights, performance units, stock awards and other incentive awards to any persons rendering consulting or advisory services and non-employee directors, subject to the conditions set forth in the 2014 Plan. Generally, all classes of Company employees are eligible to participate in the 2014 Plan.
The 2014 Plan currently provides that a maximum of 1,500,000 shares of common stock may be issued in conjunction with awards granted under the 2014 Plan. Awards that are forfeited under the 2014 Plan will again be eligible for issuance as though the forfeited awards had never been issued. Similarly, awards settled in cash will not be counted against the shares authorized for issuance upon exercise of awards under the 2014 Plan.
The 2014 Plan limits the aggregate number of shares of common stock that may be covered by stock options and/or stock appreciation rights granted to any eligible employee in any calendar year to 250,000 shares. The 2014 Plan also limits the aggregate number of shares of common stock that may be issued in conjunction with awards (other than stock options or stock appreciation rights) granted to any eligible employee in any calendar year to 150,000 shares. The 2014 Plan also limits the maximum aggregate amount that may be paid in cash pursuant to awards (other than stock options or stock appreciation rights) made to any eligible employee in any calendar year to $2.0 million. At December 31, 2015, there were no shares issued and all 1,500,000 shares remained available for award.
Note 9. Long-Term Debt
In December, 2014, the Company entered into a credit agreement providing for a $500.0 million four-year senior secured revolving credit facility. The current borrowing base under the credit agreement is $80.0 million and is subject to redetermination during May and November of each year. As of December 31, 2015, outstanding borrowings under the credit agreement bear interest at a rate elected by the Company that is equal to a base rate (which is equal to the greater of the prime rate, the Federal Funds effective rate plus 0.50%, and 1-month LIBOR plus 1.00%) or LIBOR, in each case plus the applicable margin. The applicable margin ranges from 1.00% to 1.75% for base rate loans and from 2.00% to 2.75% for LIBOR loans, in each case depending on the amount of the loan outstanding in relation to the borrowing base. The Company is obligated to pay a quarterly commitment fee of 0.50% per year on the unused portion of the borrowing base, which fee is also dependent on the amount of the loan outstanding in relation to the borrowing base. The Company is also required to pay customary letter of credit fees. Principal amounts outstanding under the credit facility are due and payable in full at maturity on December 19, 2018. All of the obligations under the credit agreement, and the guarantees of those obligations, are secured by substantially all of the Company’s assets.
As of December 31, 2015, the Company had an $80.0 million borrowing base, with $11.2 million of debt outstanding, (bearing an interest rate of 2.351%), $0.3 million of letters of credit outstanding, resulting in $68.5 million of borrowing base availability under its credit facility.
The credit facility contains a number of customary covenants that, among other things, restrict, subject to certain exceptions, the Company’s ability to incur additional indebtedness, create liens on asset, pay dividends, and repurchase its capital stock. In addition, the Company is required to maintain certain financial ratios, including a minimum modified current ratio which includes the available borrowing base of 1.0 to 1.0 and a maximum annualized quarterly leverage ratio of 4.0 to 1.0. The Company is also required to submit an audited annual report 120 days after the end of each fiscal period. As of December 31, 2015, the Company was in compliance with these covenants under the credit facility.
Interest expense for 2015, 2014 and 2013 includes amortization of deferred financing costs of $0.3 million, $0.2 million, and $0.1 million, respectively. $0.8 million and $1.0 million, net of amortization, associated with the credit facility have been capitalized as of December 31, 2015 and 2014, respectively, and are amortized on a straight-line basis over the term of the credit agreement.
F-23
EARTHSTONE ENERGY, INC.
NOTES TO CONSOLIDATED FINANCIAL STATEMENTS (continued)
Note 10. Asset Retirement Obligations
The Company has asset retirement obligations associated with the future plugging and abandonment of oil and gas properties and related facilities. The accretion of the asset retirement obligation is included in “Lease operating expense” in the Consolidated Statements of Operations. Revisions to the liability typically occur due to changes in the estimated abandonment costs, well economic lives, and the discount rate.
The following table summarizes the Company’s asset retirement obligation transactions recorded during 2015 and 2014, and in accordance with the provisions of FASB ASC Topic 410, Asset Retirement and Environmental Obligations (in thousands):
|
|
|
2015 |
|
|
2014 |
|
||
|
Beginning asset retirement obligations |
|
$ |
6,078 |
|
|
$ |
3,011 |
|
|
Acquisitions (1) |
|
|
— |
|
|
|
2,742 |
|
|
Purchase price adjustment (2) |
|
|
(1,192 |
) |
|
|
— |
|
|
Liabilities incurred |
|
|
126 |
|
|
|
64 |
|
|
Accretion expense |
|
|
550 |
|
|
|
317 |
|
|
Property dispositions |
|
|
(403 |
) |
|
|
— |
|
|
Liabilities settled |
|
|
(108 |
) |
|
|
(56 |
) |
|
Revision of estimates |
|
|
24 |
|
|
|
— |
|
|
Ending asset retirement obligations |
|
$ |
5,075 |
|
|
$ |
6,078 |
|
|
|
(1) |
See Note 3 Acquisitions and Divestitures for additional information on the Company's acquisition activities. |
|
|
(2) |
The Company recorded a purchase price adjustment related to its December 2014 Reverse Acquisition. The adjustment decreased the allocation of asset retirement obligations due to adjusting the estimates of liabilities assumed to match the Company’s methodology. See Note 3 Acquisition and Divestitures. |
At December 31, 2014, $0.4 was classified as current. At December 31, 2015, the Company did not have any asset retirement obligations classified as current.
Note 11. Related Party Transactions
FASB ASC Topic 850, Related Party Disclosures (“ASC Topic 850”), requires that transactions with related parties that would make a difference in decision making be disclosed so that users of the financial statements can evaluate their significance. Pursuant to ASC Topic 850, OVR and all of its members, most notably Oak Valley Management, LLC (“OVM”) and certain other members (“Certain Other Members of OVR”) are considered related parties. The following are significant related party transactions between the Company and members of OVM as well as between the Company and Certain Other Members of OVR as of December 31, 2015 and December 31, 2014, and for years ended December 2015, 2014 and 2013.
The Company employs members of OVM. For the years ended December 31, 2015, 2014 and 2013, the Company made payments totaling $3.8 million, $3.9 million and $2.2 million, respectively, to these members as compensation for services and reimbursement of expenses. The payments are included in General and administrative expense on the Consolidated Statements of Operations or have been charged out to oil and natural gas properties.
The Company has business relationships with Certain Other Members of OVR and with companies that employ Certain Other Members of OVR. At December 31, 2015 and 2014, the Company had liabilities of $0.7 million and $2.3 million, respectively, owed to such members and companies. These amounts are included in Accounts payable on the Consolidated Balance Sheets.
Note 12. Commitments and Contingencies
In the course of its business affairs and operations, the Company is subject to possible loss contingencies arising from federal, state, and local environmental, health and safety laws and regulations and third party litigation.
F-24
EARTHSTONE ENERGY, INC.
NOTES TO CONSOLIDATED FINANCIAL STATEMENTS (continued)
The following table summarizes the Company’s estimated future contractual commitments as of December 31, 2015 (in thousands):
|
|
|
2016 |
|
|
2017 |
|
|
2018 |
|
|
2019 |
|
|
2020 |
|
|
Thereafter |
|
||||||
|
Drilling contracts* |
|
$ |
5,919 |
|
|
$ |
— |
|
|
$ |
— |
|
|
$ |
— |
|
|
$ |
— |
|
|
$ |
— |
|
|
Gas contract** |
|
|
1,647 |
|
|
|
1,643 |
|
|
|
1,643 |
|
|
|
1,643 |
|
|
|
1,647 |
|
|
|
680 |
|
|
Office leases |
|
|
724 |
|
|
|
738 |
|
|
|
661 |
|
|
|
627 |
|
|
|
— |
|
|
|
— |
|
|
Total |
|
$ |
8,290 |
|
|
$ |
2,381 |
|
|
$ |
2,304 |
|
|
$ |
2,270 |
|
|
$ |
1,647 |
|
|
$ |
680 |
|
|
|
* |
In January 2016, the Company suspended drilling and temporarily laid down the drilling rig. The above obligation reflects a negotiated lower daily drilling rate. Our rig contractor has agreed with the suspension, and the Company will not be required to immediately pay a full termination fee which would otherwise total approximately $5.7 million. Rather, the Company will pay approximately $600,000 per month, with such payments reducing the full termination fee. If industry conditions do not improve, then the Company may continue to further defer drilling operations. |
|
|
** |
As a part of the 2013 Eagle Ford Acquisition as discussed in Note 3 Acquisitions and Divestitures, the Company ratified several long-term gas purchasing and gas processing contracts. As is customary in the industry, the Company has reserved gathering and processing capacity in a pipeline. In one of the contracts, the Company has a volume commitment, whereby the Company pays the owner of the pipeline a fee of $0.45 per MMBtu to hold 10,000 MMBtu per day of capacity for the Company’s use. Since the time of the acquisition, the Company has not been able to meet its delivery commitments. The rate and terms under this purchasing and processing contract expire on June 1, 2021. |
The Company leases corporate office space in The Woodlands, Texas and Denver, Colorado. Rent expense was approximately $0.8 million, $0.4 million, and $0.1 million for the years ended December 31, 2015, 2014, and 2013, respectively. As of December 31, 2015, minimum future lease commitments for subsequent annual periods for all non-cancelable operating leases was approximately $2.8 million.
Contingencies
Environmental
The Company’s operations are subject to risks normally associated with the exploration for and the production of oil and gas, including blowouts, fires, and environmental risks such as oil spills or gas leaks that could expose the Company to liabilities associated with these risks.
In the Company’s acquisition of existing or previously drilled well bores, the Company may not be aware of prior environmental safeguards, if any, that were taken at the time such wells were drilled or during such time the wells were operated. The Company maintains comprehensive insurance coverage that it believes is adequate to mitigate the risk of any adverse financial effects associated with these risks.
However, should it be determined that a liability exists with respect to any environmental cleanup or restoration, the liability to cure such a violation could still fall upon the Company. No claim has been made, nor is the Company aware of any liability which the Company may have, as it relates to any environmental cleanup, restoration, or the violation of any rules or regulations relating thereto except for the matter discussed above.
Legal
From time to time, the Company may be involved in various legal proceedings and claims in the ordinary course of business. In July 2015, EF Non-Op, LLC, a subsidiary of the Company, filed suit in the 125th Judicial District Court of Harris County, Texas against the operator of its properties in LaSalle County, Texas. In the case EF Non-Op, LLC vs. BHP Billiton Petroleum Properties (N.A.), LP (F/K/A Petrohawk Properties, LP) the Company claims the operator has breached the applicable joint operating agreements in numerous ways, including, but not limited to, improper authorization for expenditure requests, improper and imprudent operations, misrepresentation of charges and excessive billings, as well as refusal to provide requested information. The Company also claims damages from negligent representation and fraud. The Company is seeking all relief to which it is entitled, including consequential damages and attorney’s fees. With respect to a portion of the litigation associated with nine non-operated gas wells that were drilled in 2014 and placed on production in late 2014 and early 2015, BHP Billiton recently elected to deem the Company non-consent
F-25
EARTHSTONE ENERGY, INC.
NOTES TO CONSOLIDATED FINANCIAL STATEMENTS (continued)
regarding costs associated with the drilling, completing and operating of these nine wells, as its sole and exclusive remedy. The Company has accepted this “non-consent” status. The litigation is continuing with respect to other disputes. The outcome of remaining disputes in this proceeding is uncertain, and while the Company is confident in its position, any potential monetary recovery to the Company cannot be estimated at this time.
Note 13. Income Taxes
As a partnership, OVR was generally not subject to federal or state income tax on its taxable income. OVR’s taxable income and deductions were reported by the partners in their respective returns. Therefore, no income taxes were reported by OVR prior to the closing of the strategic merger on December 19, 2014.
The following table shows the components of the Company’s income tax provision for the years ended December 31, 2015 and 2014 (in thousands):
|
|
|
Years Ended December 31, |
|
|||||
|
|
|
2015 |
|
|
2014 |
|
||
|
Current: |
|
|
|
|
|
|
|
|
|
Federal |
|
$ |
— |
|
|
$ |
— |
|
|
State |
|
|
91 |
|
|
|
— |
|
|
Total current |
|
|
91 |
|
|
|
— |
|
|
|
|
|
|
|
|
|
|
|
|
Deferred: |
|
|
|
|
|
|
|
|
|
Federal |
|
|
(26,214 |
) |
|
|
21,803 |
|
|
State |
|
|
(319 |
) |
|
|
302 |
|
|
Total deferred |
|
|
(26,533 |
) |
|
|
22,105 |
|
|
Total income tax (benefit) provision |
|
$ |
(26,442 |
) |
|
$ |
22,105 |
|
The following is a reconciliation of taxes computed at the corporate federal statutory income tax rate of 34% to the reported income tax rate provision for the years ended December 31, 2015 and 2014 (in thousands, except percentages):
|
|
|
Years Ended December 31, |
|
|||||
|
|
|
2015 |
|
|
2014 |
|
||
|
Net loss before income taxes |
|
$ |
(143,097 |
) |
|
$ |
(6,729 |
) |
|
Tax benefit computed at Federal statutory rate |
|
|
(48,653 |
) |
|
|
(2,288 |
) |
|
Non-taxable Oak Valley income prior to merger |
|
|
— |
|
|
|
(4,142 |
) |
|
Deferred income tax arising from change in tax status of Oak Valley |
|
|
— |
|
|
|
28,347 |
|
|
Non-deductible general and administrative expenses |
|
|
534 |
|
|
|
— |
|
|
Return to accrual |
|
|
(1,398 |
) |
|
|
— |
|
|
State income taxes, net of Federal benefit |
|
|
(743 |
) |
|
|
188 |
|
|
Valuation allowance |
|
|
23,818 |
|
|
|
— |
|
|
Total income tax (benefit) expense |
|
$ |
(26,442 |
) |
|
$ |
22,105 |
|
|
Effective tax rate |
|
|
18.5 |
% |
|
|
-328.5 |
% |
The Company’s effective tax rate for the year ended December 31, 2015, is approximately 18.5% which is less than the U.S. Federal statutory tax rate primarily due to the increase in valuation allowance in 2015. The impairments recorded by the Company during 2015 reduced the book value of its properties below the tax basis; thereby, giving rise to a significant deferred tax asset associated with its oil and gas properties and putting the Company in an overall net deferred tax asset position prior to any realization assessment. The realizability of the Company’s deferred tax assets is more likely-than-not assured, therefore the Company recorded a valuation allowance to reduce its overall net deferred tax asset portion to zero.
The Company's deferred tax position reflects the net tax effects of the temporary differences between the carrying amounts of assets and liabilities for financial reporting purposes and the amounts used for income tax reporting. The deferred income tax provision for 2014 includes an initial charge of $28.3 million attributable to OVR becoming a taxable entity in December 2014, concurrent with the
F-26
EARTHSTONE ENERGY, INC.
NOTES TO CONSOLIDATED FINANCIAL STATEMENTS (continued)
Reverse Acquisition. Significant components of the deferred tax assets and liabilities at December 31, 2015 and 2014 are as follows (in thousands):
|
|
|
Years Ended December 31, |
|
|||||
|
|
|
2015 |
|
|
2014 |
|
||
|
Deferred current income tax assets: |
|
|
|
|
|
|
|
|
|
Asset retirement obligation |
|
$ |
— |
|
|
$ |
140 |
|
|
Deferred compensation |
|
|
— |
|
|
|
81 |
|
|
Other |
|
|
— |
|
|
|
5 |
|
|
Deferred current income tax assets |
|
|
— |
|
|
|
226 |
|
|
Deferred noncurrent income tax assets (liabilities): |
|
|
|
|
|
|
|
|
|
Office and other equipment |
|
|
(253 |
) |
|
|
(381 |
) |
|
Oil & gas properties |
|
|
23,177 |
|
|
|
(29,730 |
) |
|
Asset retirement obligation |
|
|
1,788 |
|
|
|
1,952 |
|
|
Intangible assets |
|
|
(7 |
) |
|
|
130 |
|
|
Unrealized derivative gain |
|
|
(1,284 |
) |
|
|
(1,229 |
) |
|
Federal net operating loss carryforward |
|
|
339 |
|
|
|
— |
|
|
Other |
|
|
59 |
|
|
|
— |
|
|
Net deferred noncurrent tax assets (liabilities) |
|
|
23,819 |
|
|
|
(29,258 |
) |
|
Valuation allowance |
|
|
(23,819 |
) |
|
|
|
|
|
Net deferred tax asset (liability) |
|
$ |
— |
|
|
$ |
(29,032 |
) |
As of December 31, 2015, the Company has an estimated U.S. net operating loss carryforward of $1.0 million, expiring in 2034 and 2035. The ability to utilize net operating losses and other tax attributes could be subject to a significant limitation if the Company were to undergo an ownership change for the purposes of Section 382 of the US Tax Code. The Company is still evaluating the impact, if any, of potential 382 limitations.
Uncertain Tax Positions
ASC 740, Income Taxes (ASC 740) prescribes a recognition threshold and a measurement attribute for the financial statement recognition and measurement of income tax positions taken or expected to be taken in an income tax return. For those benefits to be recognized, an income tax position must be more-likely-than-not to be sustained upon examination by taxing authorities. As of December 31, 2015, the Company has no material uncertain tax positions. The Company’s uncertain tax positions may change in the next twelve months; however, the Company does not expect any possible change to have a significant impact on its results of operations or financial position.
The Company files a consolidated federal income tax return and various combined and separate filings in several state and local jurisdictions. The Company’s practice is to recognize estimated interest and penalties, if any, related to potential underpayment of income taxes as a component of income tax expense in its Consolidated Statement of Operations. As of December 31, 2015, the Company did not have any accrued interest or penalties associated with any uncertain tax liabilities.
On September 13, 2013, the United States Treasury Department and the Internal Revenue Service issued final tangible property regulations (the tangible property regulations) under provisions that include IRC Sections 162, 167 and 263(a). The tangible property regulations apply to amounts paid to acquire, produce or improve tangible property, as well as dispositions of such property. The general effective date of the tangible property regulations are for tax years beginning on or after January 1, 2014. Based on the Company's analysis management did not consider the impacts of the tangible property regulations to be material to the Company's consolidated financial position, its results of operations, or both.
F-27
EARTHSTONE ENERGY, INC.
NOTES TO CONSOLIDATED FINANCIAL STATEMENTS (continued)
Note 14. Supplemental Selected Quarterly Financial Data (Unaudited)
|
|
|
Three Months Ended, |
|
|||||||||||||
|
(In thousands, except per share data) |
|
March 31, 2015 |
|
|
June 30, 2015 |
|
|
September 30, 2015 |
|
|
December 31, 2015 |
|
||||
|
Year Ended December 31, 2015 |
|
|
|
|
|
|
|
|
|
|
|
|
|
|
|
|
|
Oil and gas revenues |
|
$ |
11,242 |
|
|
$ |
14,958 |
|
|
$ |
13,033 |
|
|
$ |
8,231 |
|
|
Other revenues |
|
|
78 |
|
|
|
1,775 |
|
|
|
47 |
|
|
|
26 |
|
|
Operating expenses |
|
|
13,618 |
|
|
|
16,452 |
|
|
|
15,675 |
|
|
|
152,874 |
|
|
Operating (loss) income |
|
|
(2,298 |
) |
|
|
281 |
|
|
|
(2,595 |
) |
|
|
(144,617 |
) |
|
Other income (expense), net |
|
|
599 |
|
|
|
(1,324 |
) |
|
|
5,124 |
|
|
|
1,733 |
|
|
Income tax benefit (expense) |
|
|
585 |
|
|
|
295 |
|
|
|
(811 |
) |
|
|
26,373 |
|
|
Net (loss) income |
|
$ |
(1,114 |
) |
|
$ |
(748 |
) |
|
$ |
1,718 |
|
|
$ |
(116,511 |
) |
|
Basic and diluted net (loss) income per share |
|
$ |
(0.08 |
) |
|
$ |
(0.05 |
) |
|
$ |
0.12 |
|
|
$ |
(8.42 |
) |
|
|
|
|
|
|
|
|
|
|
|
|
|
|
|
|
|
|
|
|
|
Three Months Ended, |
|
|||||||||||||
|
(In thousands, except per share data) |
|
March 31, 2014 |
|
|
June 30, 2014 |
|
|
September 30, 2014 |
|
|
December 31, 2014 |
|
||||
|
Year Ended December 31, 2014 |
|
|
|
|
|
|
|
|
|
|
|
|
|
|
|
|
|
Oil and gas revenues |
|
$ |
11,577 |
|
|
$ |
12,059 |
|
|
$ |
11,957 |
|
|
$ |
12,018 |
|
|
Other revenues |
|
|
109 |
|
|
|
86 |
|
|
|
98 |
|
|
|
90 |
|
|
Operating expenses |
|
|
7,777 |
|
|
|
9,191 |
|
|
|
10,204 |
|
|
|
31,407 |
|
|
Operating income (loss) |
|
|
3,909 |
|
|
|
2,954 |
|
|
|
1,851 |
|
|
|
(19,299 |
) |
|
Other (expense) income, net |
|
|
(1,169 |
) |
|
|
(1,424 |
) |
|
|
2,363 |
|
|
|
4,086 |
|
|
Income tax expense |
|
|
— |
|
|
|
— |
|
|
|
— |
|
|
|
(22,105 |
) |
|
Net income (loss) |
|
$ |
2,740 |
|
|
$ |
1,530 |
|
|
$ |
4,214 |
|
|
$ |
(37,318 |
) |
|
Basic and diluted net income (loss) per share |
|
$ |
0.30 |
|
|
$ |
0.17 |
|
|
$ |
0.46 |
|
|
$ |
(3.83 |
) |
F-28
SUPPLEMENTAL INFORMATION ON OIL AND GAS EXPLORATION AND PRODUCTION ACTIVITIES
(UNAUDITED)
Costs Incurred Related to Oil and Gas Activities
The Company’s oil and gas activities for 2015, 2014 and 2013 were entirely within the United States of America. Costs incurred in oil and gas producing activities were as follows (in thousands):
|
|
|
Years Ended December 31, |
|
|||||||||
|
|
|
2015 |
|
|
2014 (1) |
|
|
2013 |
|
|||
|
Acquisition cost: |
|
|
|
|
|
|
|
|
|
|
|
|
|
Proved |
|
$ |
4,508 |
|
|
$ |
74,728 |
|
|
$ |
51,488 |
|
|
Unproved |
|
|
10,646 |
|
|
|
36,236 |
|
|
|
32,863 |
|
|
|
|
|
|
|
|
|
|
|
|
|
|
|
|
Exploration costs: |
|
|
|
|
|
|
|
|
|
|
|
|
|
Exploratory drilling |
|
|
— |
|
|
|
— |
|
|
|
64 |
|
|
Geological and geophysical |
|
|
142 |
|
|
|
111 |
|
|
|
394 |
|
|
|
|
|
|
|
|
|
|
|
|
|
|
|
|
Development costs |
|
|
56,862 |
|
|
|
75,105 |
|
|
|
32,511 |
|
|
Total additions |
|
$ |
72,158 |
|
|
$ |
186,180 |
|
|
$ |
117,320 |
|
|
|
(1) |
Acquisition costs include the fair value of the legacy Earthstone proved properties equal to $22.1 million and $5.5 million of unproved properties that were added in the Exchange Agreement which was accounted for as a reserve acquisition. Acquisitions costs also included $34.7 million and $21.9 million in proved and unproved additions related to the 2014 Eagle Ford Acquisition. |
During the years ended December 31, 2015, 2014 and 2013, additions to oil and gas properties of $0.2 million. $0.2 million and $1.0 million, respectively, were recorded for estimated costs of future abandonment related to new wells drilled or acquired.
The net changes in capitalized exploratory well costs were as follows (in thousands):
|
|
December 31, |
|
|||||||||
|
|
2015 |
|
|
2014 |
|
|
2013 |
|
|||
|
Balance, beginning of year |
$ |
— |
|
|
$ |
— |
|
|
$ |
2,032 |
|
|
|
|
|
|
|
|
|
|
|
|
|
|
|
Additions to capitalized exploratory well costs pending the determination of proved reserves |
|
— |
|
|
|
— |
|
|
|
64 |
|
|
|
|
|
|
|
|
|
|
|
|
|
|
|
Capitalized exploratory well costs charged to expense |
|
— |
|
|
|
— |
|
|
|
(2,096 |
) |
|
|
|
|
|
|
|
|
|
|
|
|
|
|
Balance, end of year |
$ |
— |
|
|
$ |
— |
|
|
$ |
— |
|
Oil and Natural Gas Reserves
Users of this information should be aware that the process of estimating quantities of “proved” and “proved developed” oil and natural gas reserves is very complex, requiring significant subjective decisions in the evaluation of all available geological, engineering and economic data for each reservoir. The data for a given reservoir may also change substantially over time as a result of numerous factors including, but not limited to, additional development activity, evolving production history and continual reassessment of the viability of production under varying economic conditions. As a result, revisions to existing reserve estimates may occur from time to time. Although every reasonable effort is made to ensure reserve estimates reported represent the most accurate assessments possible, the subjective decisions and variances in available data for various reservoirs make these estimates generally less precise than other estimates included in the financial statement disclosures.
Proved reserves represent estimated quantities of oil, natural gas and natural gas liquids that geological and engineering data demonstrate, with reasonable certainty, to be recoverable in future years from known reservoirs under economic and operating conditions in effect when the estimates were made. Proved developed reserves represent estimated quantities expected to be recovered through wells and equipment in place and under operating methods used when the estimates were made.
S-1
The proved reserves estimates shown herein for the years ended December 31, 2015, 2014 and 2013 have been independently prepared by Cawley, Gillespie & Associates, Inc.
The reserve information in these consolidated financial statements represents only estimates. There are a number of uncertainties inherent in estimating quantities of proved reserves, including many factors beyond the Company’s control, such as commodity pricing. Reserve engineering is a subjective process of estimating underground accumulations of oil and natural gas that cannot be measured in an exact manner. The accuracy of any reserve estimate is a function of the quality of available data and engineering and geological interpretation and judgement. As a result, estimates by different engineers may vary. In addition, results of drilling, testing and production subsequent to the date of an estimate may lead to revising the original estimate. Accordingly, initial reserve estimates are often different from the quantities of oil and natural gas that are ultimately recovered. The meaningfulness of such estimates depends primarily on the accuracy of the assumptions upon which they were based. Except to the extent the Company acquires additional properties containing proved reserves or conducts successful exploration and development activities or both, the Company’s proved reserves will decline as reserves are produced.
The following table illustrates the Company’s estimated net proved reserves, including changes, and proved developed and proved undeveloped reserves for the periods indicated. The oil prices as of December 31, 2015, 2014, and 2013 are based on the respective 12-month unweighted average of the first of the month prices of the West Texas Intermediate spot prices which equates to $50.28 per barrel, $94.99 per barrel, and $96.94 per barrel, respectively. The natural gas prices as of December 31, 2015, 2014 and 2013 are based on the respective 12-month unweighted average of the first of month prices of the Henry Hub spot price which equates to $2.59 per MMBtu, $4.309 per MMBtu and $3.666 per MMBtu, respectively. All prices are adjusted by lease or field for energy content, transportation fees, and market differentials. All prices are held constant in accordance with SEC guidelines.
S-2
A summary of the Company’s changes in quantities of proved oil and natural gas reserves for the years ended December 31, 2015, 2014 and 2013 are as follows:
|
|
Oil |
|
|
Natural Gas |
|
|
NGLs |
|
|
Total |
|
||||
|
|
(MBbl) |
|
|
(MMcf) |
|
|
(MBbl) |
|
|
(MBOE) |
|
||||
|
Balance - December 31, 2012 |
|
519 |
|
|
|
10,099 |
|
|
|
392 |
|
|
|
2,594 |
|
|
Extensions and discoveries |
|
3,586 |
|
|
|
4,198 |
|
|
|
526 |
|
|
|
4,812 |
|
|
Sale of minerals in place |
|
(15 |
) |
|
|
— |
|
|
|
— |
|
|
|
(15 |
) |
|
Purchases of minerals in place |
|
2,051 |
|
|
|
709 |
|
|
|
213 |
|
|
|
2,382 |
|
|
Production |
|
(163 |
) |
|
|
(2,635 |
) |
|
|
(134 |
) |
|
|
(737 |
) |
|
Revision to previous estimates |
|
100 |
|
|
|
11,842 |
|
|
|
321 |
|
|
|
2,395 |
|
|
|
|
|
|
|
|
|
|
|
|
|
|
|
|
|
|
|
Balance - December 31, 2013 |
|
6,078 |
|
|
|
24,213 |
|
|
|
1,318 |
|
|
|
11,431 |
|
|
Extensions and discoveries |
|
1,909 |
|
|
|
1,403 |
|
|
|
221 |
|
|
|
2,364 |
|
|
Purchases of minerals in place |
|
7,025 |
|
|
|
6,064 |
|
|
|
437 |
|
|
|
8,473 |
|
|
Production |
|
(403 |
) |
|
|
(2,132 |
) |
|
|
(124 |
) |
|
|
(882 |
) |
|
Revision to previous estimates |
|
(806 |
) |
|
|
9,031 |
|
|
|
107 |
|
|
|
806 |
|
|
|
|
|
|
|
|
|
|
|
|
|
|
|
|
|
|
|
Balance - December 31, 2014 |
|
13,803 |
|
|
|
38,579 |
|
|
|
1,959 |
|
|
|
22,192 |
|
|
Extensions and discoveries |
|
526 |
|
|
|
828 |
|
|
|
21 |
|
|
|
685 |
|
|
Sale of minerals in place |
|
(4 |
) |
|
|
(8,040 |
) |
|
|
— |
|
|
|
(1,344 |
) |
|
Purchases of minerals in place |
|
1,641 |
|
|
|
679 |
|
|
|
208 |
|
|
|
1,962 |
|
|
Production |
|
(904 |
) |
|
|
(2,143 |
) |
|
|
(176 |
) |
|
|
(1,437 |
) |
|
Revision to previous estimates |
|
(5,701 |
) |
|
|
(16,565 |
) |
|
|
(1,022 |
) |
|
|
(9,484 |
) |
|
Balance - December 31, 2015 |
|
9,361 |
|
|
|
13,338 |
|
|
|
990 |
|
|
|
12,574 |
|
|
|
|
|
|
|
|
|
|
|
|
|
|
|
|
|
|
|
Proved developed reserves: |
|
|
|
|
|
|
|
|
|
|
|
|
|
|
|
|
December 31, 2012 |
|
296 |
|
|
|
8,245 |
|
|
|
268 |
|
|
|
1,938 |
|
|
December 31, 2013 |
|
1,307 |
|
|
|
11,053 |
|
|
|
557 |
|
|
|
3,706 |
|
|
December 31, 2014 |
|
6,093 |
|
|
|
16,214 |
|
|
|
1,005 |
|
|
|
9,800 |
|
|
December 31, 2015 |
|
6,114 |
|
|
|
10,954 |
|
|
|
673 |
|
|
|
8,613 |
|
|
|
|
|
|
|
|
|
|
|
|
|
|
|
|
|
|
|
Proved undeveloped reserves: |
|
|
|
|
|
|
|
|
|
|
|
|
|
|
|
|
December 31, 2012 |
|
5,782 |
|
|
|
15,968 |
|
|
|
1,050 |
|
|
|
9,493 |
|
|
December 31, 2013 |
|
4,771 |
|
|
|
13,160 |
|
|
|
761 |
|
|
|
7,725 |
|
|
December 31, 2014 |
|
7,710 |
|
|
|
22,365 |
|
|
|
954 |
|
|
|
12,392 |
|
|
December 31, 2015 |
|
3,247 |
|
|
|
2,384 |
|
|
|
317 |
|
|
|
3,961 |
|
Total proved reserves decreased by 9.6 MMBoe during 2015 which is comprised of 1.2 MMBoe in proved developed reserves and 8.4 MMBoe in proved undeveloped reserves. Due to successful drilling in its Eagle Ford and Bakken properties, the Company converted 1.7 MMBoe from proved undeveloped reserves to proved developed. Purchases of minerals in place added an additional 0.1 MMBoe to proved developed reserves. These additions were offset by sales of minerals in place of 1.4 MMBoe and production of 1.4 MMBoe The company also had downward revision of 0.2 MMBoe to proved developed reserves during the year ended December 31, 2015.
At December 31, 2015 the Company’s estimated proved undeveloped reserves (PUDs) were 4.0 MMBoe, a 8.4 MMBoe net decrease over the previous year’s estimate of 12.4 MMBoe. The following details the changes in PUD reserves for 2015 (in MBoe):
|
Beginning proved undeveloped reserves at December 31, 2014 |
|
|
12,392 |
|
|
Undeveloped reserves transfer to developed |
|
|
(1,700 |
) |
|
Revision |
|
|
(9,340 |
) |
|
Purchases |
|
|
1,924 |
|
|
Extensions and discoveries |
|
|
685 |
|
|
Ending proved undeveloped reserves at December 31, 2015 |
|
|
3,961 |
|
S-3
The change to the PUD reserves was a result of the significant decline in oil and natural gas prices from December 31, 2014 to December 31, 2015. Oil prices declined from $94.99 per barrel to $50.28 per barrel while natural gas prices decreased from $4.309 per MMBtu to $2.59 per MMBtu.
Extensions and Discoveries during the year ended December 31, 2015 were from the Company’s operated Eagle Ford and non-operated Bakken properties.
All of the Company’s purchases of minerals in place reserves during the year ended December 31, 2015, occurred in the Eagle Ford property in Gonzales County, Texas.
Based on the Company’s year-end 2015 reserve report, the Company expects to drill all of its PUD locations within five years.
The total proved reserves increase of 10.8 MMBoe during 2014 is comprised of 6.1 MMBoe in proved developed and 4.7 MMBoe in proved undeveloped reserves.
During 2014, the Company added 2.4 MMBoe in proved reserves due to extension and discoveries, the majority of which is due to successful drilling in its operated Eagle Ford property in Fayette and Gonzales counties, Texas. Both new wells drilled and completed during 2014 along with the PUD locations that were added because of this successful drilling contributed to the increase in proved reserves. Purchase of minerals in place of 8.5 MMBoe were as a result of the Exchanges Agreement whereby Oak Valley acquired the legacy Earthstone assets through a reverse acquisition and the Contribution Agreement where the Company acquired additional interests in its operated Eagle Ford property.
The total proved reserves increase of 8.8 MMBoe during 2013 is comprised of 1.8 MMBoe in proved developed and 7.0 MMBoe in proved undeveloped reserves.
During 2013, the Company added 4.8 MMBoe in proved reserves due to successful drilling in both its operated and non-operated Eagle Ford properties. The non-operated Eagle Ford property is located in La Salle county, Texas. Purchases of minerals in place of 2.4 MMBoe were as a result of the purchase, during the second half of 2013, of an approximately 30% working interest of the Company’s operated Eagle Ford property.
All of the Company’s increases through extensions and discoveries occurred in its operated Eagle Ford property in Fayette and Gonzales counties, Texas as a result of successful drilling during 2014 which added additional PUD locations as well.
PUDs that were converted during the year occurred in both the Company’s operated Eagle Ford and non-operated Bakken properties and 62% of the conversions occurred in the Eagle Ford property.
Extensions and Discoveries were from the Company’s operated Eagle Ford and non-operated Bakken properties.
All of the Company’s purchases of PUD reserves occurred in the Eagle Ford property in Gonzales County, Texas.
Based on the Company’s year-end 2015 reserve report, the Company expects to drill all of its PUD locations within five years.
For wells classified as proved developed producing where sufficient production history existed, reserves were based on individual well performance evaluation and production decline curve extrapolation techniques. For undeveloped locations and wells that lack sufficient production history, reserves were based on analogy to producing wells within the same area exhibiting similar geologic and reservoir characteristics, combined with volumetric methods. The volumetric estimates were based on geologic maps and rock and fluid properties derived from well logs, core data, pressure measurements, and fluid samples. Well spacing was determined from drainage patterns derived from a combination of performance-based recoveries and volumetric estimates for each area or field. PUD locations were limited to areas of uniformly high quality reservoir properties, between existing commercial producers.
Standardized Measure of Discounted Future Net Cash Flows Relating to Proved Oil and Natural Gas Reserves
The following Standardized Measure of Discounted Future Net Cash Flows (Standardized Measure) has been developed utilizing ASC 932, Extractives Activities – Oil and Gas (ASC 932) procedures and based on oil and natural gas reserve and production volumes estimated by the Company’s third party engineering staff. It can be used for some comparisons, but should not be the only method used to evaluate the Company or its performance. Further, the information in the following table may not represent realistic assessments of future cash flows, nor should the Standardized Measure be viewed as representative of the current value of the Company.
S-4
The Company believes that the following factors should be taken into account when reviewing the following information:
|
|
· |
Future costs and commodity prices will probably differ from those required to be used in these calculations; |
|
|
· |
Due to future market conditions and governmental regulations, actual rates of production in future years may vary significantly from the rate of production assumed in the calculations; |
|
|
· |
A 10% discount rate may not be reasonable as a measure of the relative risk inherent in realizing future net oil and natural gas revenues; and |
|
|
· |
Future net revenues may be subject to different rates of income taxation |
At December 31, 2015, 2014 and 2013, as specified by the SEC, the prices for oil and natural gas used in this calculation were the unweighted 12-month average of the first day of the month prices, except for volumes subject to fixed price contracts. Estimates of future income taxes are computed using current statutory income tax rates including consideration for estimated future statutory depletion and tax credits. The resulting net cash flows are reduced to present value amounts by applying 10% discount factor.
The Standardized Measure is as follows (in thousands):
|
|
December 31, |
|
|||||||||
|
|
2015 |
|
|
2014 |
|
|
2013 |
|
|||
|
Future cash inflows |
$ |
481,131 |
|
|
$ |
1,464,138 |
|
|
$ |
718,049 |
|
|
Future production costs |
|
(192,349 |
) |
|
|
(427,113 |
) |
|
|
(202,957 |
) |
|
Future development costs |
|
(91,725 |
) |
|
|
(312,010 |
) |
|
|
(220,828 |
) |
|
Future income tax expense |
|
— |
|
|
|
(180,248 |
) |
|
|
— |
|
|
Future net cash flows |
|
197,057 |
|
|
|
544,767 |
|
|
|
294,264 |
|
|
10% annual discount for estimated timing of cash flows |
|
(92,661 |
) |
|
|
(288,911 |
) |
|
|
(168,907 |
) |
|
Standardized measure of discounted future cash flows |
$ |
104,396 |
|
|
$ |
255,856 |
|
|
$ |
125,357 |
|
Changes in Standardized Measure of Discounted Future Net Cash Flows Relating to Proved Oil and Natural Gas Reserves
The following is a summary of the changes in the Standardized Measure for the Company’s proved oil and natural gas reserves during each of the years in the three year period ended December 31, 2015 (in thousands):
|
|
December 31, |
|
|||||||||
|
|
2015 |
|
|
2014 |
|
|
2013 |
|
|||
|
Beginning of year |
$ |
255,856 |
|
|
$ |
125,357 |
|
|
$ |
25,132 |
|
|
Sales of oil and gas produced, net of production costs |
|
(29,152 |
) |
|
|
(35,794 |
) |
|
|
(20,287 |
) |
|
Sales of minerals in place |
|
(2,470 |
) |
|
|
— |
|
|
|
(380 |
) |
|
Net changes in prices and production costs |
|
(288,064 |
) |
|
|
(34,681 |
) |
|
|
241 |
|
|
Extensions, discoveries, and improved recoveries |
|
6,514 |
|
|
|
54,157 |
|
|
|
48,006 |
|
|
Changes in income taxes, net (1) |
|
88,944 |
|
|
|
(88,944 |
) |
|
|
— |
|
|
Previously estimated development costs incurred during the period |
|
26,977 |
|
|
|
18,252 |
|
|
|
3,227 |
|
|
Net changes in future development costs |
|
6,697 |
|
|
|
7,028 |
|
|
|
(22,966 |
) |
|
Purchases of minerals in place |
|
7,695 |
|
|
|
163,309 |
|
|
|
56,069 |
|
|
Revisions of previous quantity estimates |
|
(16,671 |
) |
|
|
16,283 |
|
|
|
26,259 |
|
|
Accretion of discount |
|
25,586 |
|
|
|
12,536 |
|
|
|
2,513 |
|
|
Changes in timing of estimated cash flows and other |
|
22,484 |
|
|
|
18,353 |
|
|
|
7,543 |
|
|
End of year |
$ |
104,396 |
|
|
$ |
255,856 |
|
|
$ |
125,357 |
|
S-5
|
|
Exchange OVR’s subsidiaries have become subsidiaries of Earthstone Energy, Inc., which is a taxable entity; as such estimated tax expense was included in the Standardized Measure for December 31, 2014. |
S-6