Attached files
| file | filename |
|---|---|
| EX-10.1 - EXHIBIT 10.1 AMENDMENT TO S&O AGREEMENT - Delek US Holdings, Inc. | dk-10qxex101soamendmentx03.htm |
| EX-32.2 - EXHIBIT 32.2 CFO CERTIFICATION - Delek US Holdings, Inc. | dk-ex322xcfocertificationx.htm |
| EX-32.1 - EXHIBIT 32.1 CEO CERTIFICATION - Delek US Holdings, Inc. | dk-ex321xceocertificationx.htm |
| EX-31.2 - EXHIBIT 31.2 CFO CERTIFICATION - Delek US Holdings, Inc. | dk-ex312xcfocertificationx.htm |
| EX-31.1 - EXHIBIT 31.1 CEO CERTIFICATION - Delek US Holdings, Inc. | dk-ex311xceocertificationx.htm |
| EX-10.8 - EXHIBIT 10.8 PAGE EMPLOYMENT AGREEMENT - Delek US Holdings, Inc. | dk-10qxex108pageemployment.htm |
| EX-10.7 - EXHIBIT 10.7 CAGLE EMPLOYMENT AGREEMENT - Delek US Holdings, Inc. | dk-10qxex107cagleemploymen.htm |
UNITED STATES
SECURITIES AND EXCHANGE COMMISSION
Washington, D.C. 20549
Form 10-Q
(Mark One)
þ | QUARTERLY REPORT PURSUANT TO SECTION 13 OR 15(d) OF THE SECURITIES EXCHANGE ACT OF 1934 | |||
For the quarterly period ended March 31, 2017 | ||||
or
o | TRANSITION REPORT PURSUANT TO SECTION 13 OR 15(d) OF THE SECURITIES EXCHANGE ACT OF 1934 | |
For the transition period from to | ||
Commission file number 001-32868
DELEK US HOLDINGS, INC.
(Exact name of registrant as specified in its charter)
Delaware | 52-2319066 | |
(State or other jurisdiction of | (I.R.S. Employer | |
incorporation or organization) | Identification No.) | |
7102 Commerce Way | ||
Brentwood, Tennessee | 37027 | |
(Address of principal executive offices) | (Zip Code) | |
(615) 771-6701
(Registrant’s telephone number, including area code)
Not Applicable
(Former name, former address and former fiscal year, if changed since last report)
Indicate by check mark whether the registrant (1) has filed all reports required to be filed by Section 13 or 15(d) of the Securities Exchange Act of 1934 during the preceding 12 months (or for such shorter period that the registrant was required to file such reports), and (2) has been subject to such filing requirements for the past 90 days. Yes þ No o
Indicate by check mark whether the registrant has submitted electronically and posted on its corporate Web site, if any, every Interactive Data File required to be submitted and posted pursuant to Rule 405 of Regulation S-T during the preceding 12 months (or for such shorter period that the registrant was required to submit and post such files). Yes þ No o
Indicate by check mark whether the registrant is a large accelerated filer, an accelerated filer, a non-accelerated filer, a smaller reporting company or an emerging growth company. See the definitions of "large accelerated filer," "accelerated filer," "smaller reporting company" and "emerging growth company" in Rule 12b-2 of the Exchange Act.
Large accelerated filer þ | Accelerated filer o | Non-accelerated filer o | Smaller reporting company o | Emerging growth company o | ||||
(Do not check if a smaller reporting company) | ||||||||
Indicate by check mark whether the registrant is a shell company (as defined in Rule 12b-2 of the Exchange Act). Yes o No þ
If an emerging growth company, indicate by check mark if the registrant has elected not to use the extended transition period for complying with any new or revised financial accounting standards provided pursuant to Section 13(a) of the Exchange Act. o
At May 4, 2017, there were 62,029,238 shares of common stock, $0.01 par value, outstanding (excluding securities held by, or for the account of, the Company or its subsidiaries).
TABLE OF CONTENTS
Exhibit 2.1 | |
Exhibit 2.2 | |
Exhibit 2.3 | |
Exhibit 10.1 | |
Exhibit 10.2 | |
Exhibit 10.3 | |
Exhibit 10.4 | |
Exhibit 10.5 | |
Exhibit 10.6 | |
Exhibit 10.7 | |
Exhibit 10.8 | |
Exhibit 31.1 | |
Exhibit 31.2 | |
Exhibit 32.1 | |
Exhibit 32.2 | |
EX-101 INSTANCE DOCUMENT | |
EX-101 SCHEMA DOCUMENT | |
EX-101 CALCULATION LINKBASE DOCUMENT | |
EX-101 LABELS LINKBASE DOCUMENT | |
EX-101 PRESENTATION LINKBASE DOCUMENT | |
2
Part I.
FINANCIAL INFORMATION
Item 1. | Financial Statements |
Delek US Holdings, Inc.
Condensed Consolidated Balance Sheets (Unaudited)
(In millions, except share and per share data)
March 31, 2017 | December 31, 2016 | |||||||
ASSETS | ||||||||
Current assets: | ||||||||
Cash and cash equivalents | $ | 591.4 | $ | 689.2 | ||||
Accounts receivable | 325.8 | 265.9 | ||||||
Accounts receivable from related party | 1.5 | 0.1 | ||||||
Inventories, net of inventory valuation reserves | 397.4 | 392.4 | ||||||
Other current assets | 51.2 | 49.3 | ||||||
Total current assets | 1,367.3 | 1,396.9 | ||||||
Property, plant and equipment: | ||||||||
Property, plant and equipment | 1,602.7 | 1,587.6 | ||||||
Less: accumulated depreciation | (512.9 | ) | (484.3 | ) | ||||
Property, plant and equipment, net | 1,089.8 | 1,103.3 | ||||||
Goodwill | 12.2 | 12.2 | ||||||
Other intangibles, net | 26.3 | 26.7 | ||||||
Equity method investments | 360.0 | 360.0 | ||||||
Other non-current assets | 102.4 | 80.7 | ||||||
Total assets | $ | 2,958.0 | $ | 2,979.8 | ||||
LIABILITIES AND STOCKHOLDERS’ EQUITY | ||||||||
Current liabilities: | ||||||||
Accounts payable | $ | 503.6 | $ | 494.6 | ||||
Accounts payable to related party | 2.9 | 1.8 | ||||||
Current portion of long-term debt | 84.4 | 84.4 | ||||||
Obligation under Supply and Offtake Agreement | 130.2 | 124.6 | ||||||
Accrued expenses and other current liabilities | 197.8 | 229.8 | ||||||
Total current liabilities | 918.9 | 935.2 | ||||||
Non-current liabilities: | ||||||||
Long-term debt, net of current portion | 740.5 | 748.5 | ||||||
Environmental liabilities, net of current portion | 6.0 | 6.2 | ||||||
Asset retirement obligations | 5.3 | 5.2 | ||||||
Deferred tax liabilities | 75.7 | 76.2 | ||||||
Other non-current liabilities | 29.2 | 26.0 | ||||||
Total non-current liabilities | 856.7 | 862.1 | ||||||
Stockholders’ equity: | ||||||||
Preferred stock, $0.01 par value, 10,000,000 shares authorized, no shares issued and outstanding | — | — | ||||||
Common stock, $0.01 par value, 110,000,000 shares authorized, 67,224,463 shares and 67,150,352 shares issued at March 31, 2017 and December 31, 2016, respectively | 0.7 | 0.7 | ||||||
Additional paid-in capital | 653.6 | 650.5 | ||||||
Accumulated other comprehensive loss | (19.5 | ) | (20.8 | ) | ||||
Treasury stock, 5,195,791 shares, at cost, as of both March 31, 2017 and December 31, 2016 | (160.8 | ) | (160.8 | ) | ||||
Retained earnings | 523.9 | 522.3 | ||||||
Non-controlling interest in subsidiaries | 184.5 | 190.6 | ||||||
Total stockholders’ equity | 1,182.4 | 1,182.5 | ||||||
Total liabilities and stockholders’ equity | $ | 2,958.0 | $ | 2,979.8 | ||||
See accompanying notes to condensed consolidated financial statements
3
Delek US Holdings, Inc.
Condensed Consolidated Statements of Income (Unaudited)
(In millions, except share and per share data)
Three Months Ended | ||||||||
March 31, | ||||||||
2017 | 2016 | |||||||
Net sales | $ | 1,182.2 | $ | 886.1 | ||||
Operating costs and expenses: | ||||||||
Cost of goods sold | 1,035.7 | 815.8 | ||||||
Operating expenses | 61.2 | 69.0 | ||||||
Insurance proceeds — business interruption | — | (42.4 | ) | |||||
General and administrative expenses | 26.5 | 29.0 | ||||||
Depreciation and amortization | 29.0 | 28.3 | ||||||
Total operating costs and expenses | 1,152.4 | 899.7 | ||||||
Operating income (loss) | 29.8 | (13.6 | ) | |||||
Interest expense | 13.6 | 13.2 | ||||||
Interest income | (1.0 | ) | (0.3 | ) | ||||
(Income) loss from equity method investments | (3.1 | ) | 18.0 | |||||
Other expense, net | — | 0.6 | ||||||
Total non-operating expenses, net | 9.5 | 31.5 | ||||||
Income (loss) from continuing operations before income tax expense (benefit) | 20.3 | (45.1 | ) | |||||
Income tax expense (benefit) | 5.0 | (23.6 | ) | |||||
Income (loss) from continuing operations | 15.3 | (21.5 | ) | |||||
Discontinued operations: | ||||||||
Loss from discontinued operations | — | (3.9 | ) | |||||
Income tax benefit | — | (1.5 | ) | |||||
Loss from discontinued operations, net of tax | — | (2.4 | ) | |||||
Net income (loss) | 15.3 | (23.9 | ) | |||||
Net income attributed to non-controlling interest | 4.1 | 5.3 | ||||||
Net income (loss) attributable to Delek | $ | 11.2 | $ | (29.2 | ) | |||
Basic earnings (loss) per share: | ||||||||
Income (loss) from continuing operations | $ | 0.18 | $ | (0.43 | ) | |||
Loss from discontinued operations | — | (0.04 | ) | |||||
Total basic earnings (loss) per share | $ | 0.18 | $ | (0.47 | ) | |||
Diluted earnings (loss) per share: | ||||||||
Income (loss) from continuing operations | $ | 0.18 | $ | (0.43 | ) | |||
Loss from discontinued operations | — | (0.04 | ) | |||||
Total diluted earnings (loss) per share | $ | 0.18 | $ | (0.47 | ) | |||
Weighted average common shares outstanding: | ||||||||
Basic | 61,978,072 | 62,132,007 | ||||||
Diluted | 62,589,210 | 62,132,007 | ||||||
Dividends declared per common share outstanding | $ | 0.15 | $ | 0.15 | ||||
See accompanying notes to condensed consolidated financial statements
4
Delek US Holdings, Inc.
Condensed Consolidated Statements of Comprehensive Income (Unaudited)
(In millions)
Three Months Ended March 31, | |||||||||
2017 | 2016 | ||||||||
Net income (loss) attributable to Delek | $ | 11.2 | $ | (29.2 | ) | ||||
Other comprehensive income (loss): | |||||||||
Commodity contracts designated as cash flow hedges: | |||||||||
Unrealized losses, net of ineffectiveness (gains) losses of $(2.2) million and $1.0 million for the three months ended March 31, 2017 and 2016, respectively | (6.0 | ) | (6.8 | ) | |||||
Realized losses reclassified to cost of goods sold | 7.8 | 7.3 | |||||||
Gain on cash flow hedges, net | 1.8 | 0.5 | |||||||
Income tax expense | (0.6 | ) | (0.2 | ) | |||||
Net comprehensive income on commodity contracts designated as cash flow hedges | 1.2 | 0.3 | |||||||
Foreign currency translation gain (loss) | — | 0.2 | |||||||
Other comprehensive income (loss) from equity method investments, net of tax (expense) benefit of a nominal amount and $0.1 million for the three months ended March 31, 2017 and 2016, respectively | 0.1 | (0.2 | ) | ||||||
Total other comprehensive income | 1.3 | 0.3 | |||||||
Comprehensive income (loss) attributable to Delek | $ | 12.5 | $ | (28.9 | ) | ||||
See accompanying notes to condensed consolidated financial statements
5
Delek US Holdings, Inc.
Condensed Consolidated Statements of Cash Flows (Unaudited)
(In millions)
Three Months Ended March 31, | ||||||||
2017 | 2016 | |||||||
Cash flows from operating activities: | ||||||||
Net income (loss) | $ | 15.3 | $ | (23.9 | ) | |||
Adjustments to reconcile net income (loss) to net cash (used in) provided by operating activities: | ||||||||
Depreciation and amortization | 29.0 | 28.3 | ||||||
Amortization of deferred financing costs and debt discount | 0.9 | 1.1 | ||||||
Accretion of asset retirement obligations | 0.1 | — | ||||||
Amortization of unfavorable contract liability | (1.5 | ) | — | |||||
Deferred income taxes | (1.4 | ) | (11.6 | ) | ||||
(Income) loss from equity method investments | (3.1 | ) | 18.0 | |||||
Dividends from equity method investments | 5.1 | 5.0 | ||||||
Equity-based compensation expense | 3.8 | 4.1 | ||||||
Income tax benefit of equity-based compensation | — | 0.1 | ||||||
Loss from discontinued operations | — | 2.4 | ||||||
Changes in assets and liabilities, net of acquisitions: | ||||||||
Accounts receivable | (61.3 | ) | 19.1 | |||||
Inventories and other current assets | (10.4 | ) | 3.0 | |||||
Fair value of derivatives | 2.0 | (1.3 | ) | |||||
Accounts payable and other current liabilities | (3.1 | ) | 33.5 | |||||
Obligation under Supply and Offtake Agreement | 5.6 | (7.6 | ) | |||||
Non-current assets and liabilities, net | (23.1 | ) | (0.8 | ) | ||||
Cash (used in) provided by operating activities - continuing operations | (42.1 | ) | 69.4 | |||||
Cash provided by operating activities - discontinued operations | — | 2.5 | ||||||
Net cash (used in) provided by operating activities | (42.1 | ) | 71.9 | |||||
Cash flows from investing activities: | ||||||||
Equity method investment contributions | (1.7 | ) | (14.8 | ) | ||||
Purchases of property, plant and equipment | (19.0 | ) | (12.6 | ) | ||||
Proceeds from sales of assets | — | 0.2 | ||||||
Cash used in investing activities - continuing operations | (20.7 | ) | (27.2 | ) | ||||
Cash used in investing activities - discontinued operations | — | (7.0 | ) | |||||
Net cash used in investing activities | (20.7 | ) | (34.2 | ) | ||||
Cash flows from financing activities: | ||||||||
Proceeds from long-term revolvers | 208.6 | 86.0 | ||||||
Payments on long-term revolvers | (179.2 | ) | (79.7 | ) | ||||
Payments on term debt | (37.7 | ) | (12.7 | ) | ||||
Proceeds from product financing agreements | — | 42.5 | ||||||
Repayments of product financing agreements | (6.0 | ) | — | |||||
Taxes paid due to the net settlement of equity-based compensation | (0.7 | ) | (0.2 | ) | ||||
Income tax benefit of equity-based compensation | — | (0.1 | ) | |||||
Repurchase of common stock | — | (2.8 | ) | |||||
Repurchase of non-controlling interest | (4.0 | ) | — | |||||
Distribution to non-controlling interest | (6.4 | ) | (5.7 | ) | ||||
Dividends paid | (9.6 | ) | (9.4 | ) | ||||
Deferred financing costs paid | — | (0.2 | ) | |||||
Cash (used in) provided by financing activities - continuing operations | (35.0 | ) | 17.7 | |||||
Cash used in financing activities - discontinued operations | — | (7.7 | ) | |||||
Net cash (used in) provided by financing activities | (35.0 | ) | 10.0 | |||||
Net (decrease) increase in cash and cash equivalents | (97.8 | ) | 47.7 | |||||
Cash and cash equivalents at the beginning of the period | 689.2 | 302.2 | ||||||
Cash and cash equivalents at the end of the period | $ | 591.4 | $ | 349.9 | ||||
Less cash and cash equivalents of discontinued operations at the end of the period | — | 7.1 | ||||||
Cash and cash equivalents of continuing operations at the end of the period | $ | 591.4 | $ | 342.8 | ||||
Delek US Holdings, Inc.
Condensed Consolidated Statements of Cash Flows (Unaudited)(Continued)
(In millions)
Three Months Ended March 31, | ||||||||
2017 | 2016 | |||||||
Supplemental disclosures of cash flow information: | ||||||||
Cash paid during the period for: | ||||||||
Interest, net of capitalized interest of a nominal amount and $0.1 million in the 2017 and 2016 periods, respectively | $ | 17.9 | $ | 16.5 | ||||
Income taxes | $ | 12.9 | $ | 0.1 | ||||
Non-cash investing activities: | ||||||||
Decrease in accrued capital expenditures | $ | (3.8 | ) | $ | (10.0 | ) | ||
See accompanying notes to condensed consolidated financial statements
6
Delek US Holdings, Inc.
Notes to Condensed Consolidated Financial Statements (Unaudited)
1. Organization and Basis of Presentation
Delek US Holdings, Inc. is the sole shareholder or owner of membership interests of Delek Refining, Inc. ("Refining"), Delek Finance, Inc., Delek Marketing & Supply, LLC, Lion Oil Company ("Lion Oil"), Delek Renewables, LLC, Delek Rail Logistics, Inc., Delek Logistics Services Company, Delek Helena, LLC, and Delek Land Holdings, LLC. Unless otherwise indicated or the context requires otherwise, the terms "we," "our," "us," "Delek" and the "Company" are used in this report to refer to Delek US Holdings, Inc. and its consolidated subsidiaries. Delek is listed on the New York Stock Exchange under the symbol "DK."
In August 2016, we entered into a definitive equity purchase agreement (the "Purchase Agreement") with Compañía de Petróleos de Chile COPEC S.A. and its subsidiary, Copec Inc., a Delaware corporation (collectively, "COPEC"). Under the terms of the Purchase Agreement, Delek has agreed to sell, and COPEC has agreed to purchase, 100% of the equity interests in Delek's wholly-owned subsidiaries MAPCO Express, Inc., MAPCO Fleet, Inc., Delek Transportation, LLC, NTI Investments, LLC and GDK Bearpaw, LLC (collectively, the “Retail Entities”) for cash consideration of $535 million, subject to customary adjustments (the “Retail Transaction”). The Retail Transaction closed in November 2016.
As a result of the Purchase Agreement, we met the requirements under the provisions of Accounting Standards Codification ("ASC") 205-20, Presentation of Financial Statements - Discontinued Operations ("ASC 205-20") and ASC 360, Property, Plant and Equipment ("ASC 360"), to report the results of the Retail Entities as discontinued operations and to classify the Retail Entities as a group of assets held for sale. See Note 4 for further information regarding the Retail Entities.
Having classified the Retail Entities as assets held for sale, the condensed consolidated statements of income for the three months ended March 31, 2016 have been reclassified to reflect the results of the Retail Entities as income from discontinued operations, net of taxes.
Our condensed consolidated financial statements include the accounts of Delek and its consolidated subsidiaries. Certain information and footnote disclosures normally included in annual financial statements prepared in accordance with U.S. Generally Accepted Accounting Principles ("GAAP") have been condensed or omitted, although management believes that the disclosures herein are adequate to make the financial information presented not misleading. Our unaudited condensed consolidated financial statements have been prepared in conformity with GAAP applied on a consistent basis with those of the annual audited financial statements included in our Annual Report on Form 10-K filed with the Securities and Exchange Commission ("SEC") on February 28, 2017 (the "Annual Report on Form 10-K") and in accordance with the rules and regulations of the SEC. These unaudited condensed consolidated financial statements should be read in conjunction with the audited consolidated financial statements and the notes thereto for the year ended December 31, 2016 included in our Annual Report on Form 10-K.
Our condensed consolidated financial statements include Delek Logistics Partners, LP ("Delek Logistics"), a variable interest entity. As the general partner of Delek Logistics, we have the sole ability to direct the activities of Delek Logistics that most significantly impact its economic performance. We are also considered to be the primary beneficiary for accounting purposes and are Delek Logistics' primary customer. As Delek Logistics does not derive an amount of gross margin material to us from third parties, there is limited risk to Delek associated with Delek Logistics' operations. However, in the event that Delek Logistics incurs a loss, our operating results will reflect Delek Logistics' loss, net of intercompany eliminations, to the extent of our ownership interest in Delek Logistics.
In the opinion of management, all adjustments necessary for a fair presentation of the financial condition and the results of operations for the interim periods have been included. All significant intercompany transactions and account balances have been eliminated in consolidation. All adjustments are of a normal, recurring nature. Operating results for the interim period should not be viewed as representative of results that may be expected for any future interim period or for the full year.
Certain prior period amounts have been reclassified in order to conform to the current year presentation.
The preparation of financial statements in conformity with GAAP requires management to make estimates and assumptions that affect the reported amounts of assets and liabilities and disclosure of contingent assets and liabilities at the date of the financial statements and the reported amounts of revenues and expenses during the reporting period. Actual results could differ from those estimates.
New Accounting Pronouncements
In January 2017, the Financial Accounting Standards Board (the "FASB") issued guidance that eliminates Step 2, which required a comparison of the implied fair value of goodwill of the reporting unit with the carrying amount of that goodwill for that reporting unit, from the goodwill impairment test. It also eliminates the requirements for any reporting unit with a zero or negative carrying amount to perform a qualitative assessment and, if it fails that qualitative assessment, to perform Step 2 of the goodwill impairment test. An entity still has the option to perform the qualitative assessment for a reporting unit to determine if the quantitative impairment test is necessary. This guidance is effective for annual
7
or any interim goodwill impairment tests in fiscal years beginning after December 15, 2019. Early adoption is permitted for interim or annual goodwill impairment tests performed on testing dates after January 1, 2017. We expect to adopt this guidance on or before the effective date and are currently evaluating the impact that adopting this new guidance will have on our business, financial condition and results of operations.
In January 2017, the FASB issued guidance clarifying the definition of a business in order to assist entities with evaluating when a set of transferred assets and activities is considered a business. In general, we expect that the revised definition will result in fewer acquisitions being accounted for as business combinations than under the current guidance. This guidance is effective for fiscal years beginning after December 15, 2017, and interim periods within those fiscal years. Early adoption is permitted under certain circumstances. We expect to adopt this guidance on or before the effective date and are currently evaluating the impact that adopting this new guidance will have on our business, financial condition and results of operations.
In March 2016, the FASB issued guidance that simplifies several aspects of the accounting for share-based payment award transactions, including the accounting for excess tax benefits and deficiencies, classification of awards as either equity or liabilities and classification of excess tax benefits on the statement of cash flows. This guidance is effective for fiscal years beginning after December 15, 2016, and interim periods within those fiscal years and can be early adopted for any interim or annual financial statements that have not yet been issued. We prospectively adopted this guidance on the effective date and the adoption did not have a material impact on our business, financial condition or results of operations.
In July 2015, the FASB issued guidance requiring entities to measure FIFO or average cost inventory at the lower of cost and net realizable value. Net realizable value is the estimated selling prices in the ordinary course of business, less reasonably predictable costs of completion, disposal, and transportation. This guidance does not change the measurement of inventory measured using LIFO or the retail inventory method. This guidance is effective for fiscal years beginning after December 15, 2016, and interim periods within those fiscal years. We adopted this guidance on the effective date and the adoption did not have a material impact on our business, financial condition or results of operations.
In May 2014, the FASB issued guidance regarding “Revenue from Contracts with Customers,” to clarify the principles for recognizing revenue. The core principle of the new guidance is that an entity should recognize revenue to depict the transfer of promised goods or services to customers in an amount that reflects the consideration to which the entity expects to be entitled in exchange for those goods or services. The guidance also requires improved interim and annual disclosures that enable the users of financial statements to better understand the nature, amount, timing, and uncertainty of revenues and cash flows arising from contracts with customers. The new guidance is effective for annual reporting periods beginning after December 15, 2017, including interim reporting periods within that reporting period, and can be adopted retrospectively. Early adoption is permitted only as of annual reporting periods beginning after December 15, 2016, including interim reporting periods within that reporting period. We expect to adopt this guidance on January 1, 2018. We have formed a project implementation team as well as a project time-line to evaluate this new standard. We have reviewed and gained an understanding of the new revenue recognition accounting guidance and completed our revenue stream scoping process. We have preliminarily elected to use the modified retrospective adoption method to apply this standard, under which the cumulative effect of initially applying the new guidance will be recognized as an adjustment to the opening balance of retained earnings in the first quarter of 2018. We are still evaluating the impact that adopting this standard will have on our business processes, systems and controls, and interpretative and industry specific guidance is still developing.
2. Delek Logistics
Delek Logistics is a publicly traded limited partnership that was formed by Delek to own, operate, acquire and construct crude oil and refined products logistics and marketing assets. A substantial majority of Delek Logistics' assets are integral to Delek’s refining and marketing operations. As of March 31, 2017, we owned a 61.2% limited partner interest in Delek Logistics, consisting of 15,197,571 common units, and a 94.9% interest in Logistics GP, which owns the entire 2.0% general partner interest, consisting of 496,502 general partner units, in Delek Logistics and all of the incentive distribution rights.
We have agreements with Delek Logistics that, among other things, establish fees for certain administrative and operational services provided by us and our subsidiaries to Delek Logistics, provide certain indemnification obligations and establish terms for fee-based commercial logistics and marketing services provided by Delek Logistics and its subsidiaries to us.
8
Delek Logistics is a variable interest entity as defined under GAAP and is consolidated into our condensed consolidated financial statements. With the exception of intercompany balances which are eliminated in consolidation, the Delek Logistics condensed consolidated balance sheets as of March 31, 2017 and December 31, 2016, as presented below, are included in the consolidated balance sheets of Delek (unaudited, in millions).
March 31, 2017 | December 31, 2016 | |||||||
ASSETS | ||||||||
Cash and cash equivalents | $ | — | $ | 0.1 | ||||
Accounts receivable | 23.8 | 19.2 | ||||||
Accounts receivable from related parties | — | 2.8 | ||||||
Inventory | 6.3 | 8.9 | ||||||
Other current assets | 0.8 | 1.1 | ||||||
Property, plant and equipment, net | 248.9 | 251.0 | ||||||
Equity method investments | 103.0 | 101.1 | ||||||
Goodwill | 12.2 | 12.2 | ||||||
Intangible assets, net | 14.2 | 14.4 | ||||||
Other non-current assets | 4.4 | 4.7 | ||||||
Total assets | $ | 413.6 | $ | 415.5 | ||||
LIABILITIES AND DEFICIT | ||||||||
Accounts payable | $ | 13.1 | $ | 10.9 | ||||
Accounts payable to related parties | 0.3 | — | ||||||
Accrued expenses and other current liabilities | 8.9 | 9.8 | ||||||
Revolving credit facility | 392.0 | 392.6 | ||||||
Asset retirement obligations | 3.9 | 3.8 | ||||||
Other non-current liabilities | 14.4 | 11.7 | ||||||
Deficit | (19.0 | ) | (13.3 | ) | ||||
Total liabilities and deficit | $ | 413.6 | $ | 415.5 | ||||
9
3. Equity Method Investments
On May 14, 2015, Delek acquired from Alon Israel Oil Company, Ltd. ("Alon Israel") approximately 33.7 million shares of common stock (the "ALJ Shares") of Alon USA Energy, Inc. (NYSE: ALJ) ("Alon USA") pursuant to the terms of a stock purchase agreement with Alon Israel dated April 14, 2015 (the "Alon Acquisition"). The ALJ Shares represented an equity interest in Alon USA of approximately 48% at the time of acquisition. We acquired the ALJ Shares with a combination of cash, Delek stock and seller-financed debt.
In January 2017, we announced that Delek, Alon USA, Delek Holdco, Inc., a Delaware corporation and wholly owned subsidiary of Delek (“Holdco”), Dione Mergeco, Inc., a Delaware corporation and wholly owned subsidiary of Holdco ("Parent Merger Sub"), and Astro Mergeco, Inc., a Delaware corporation and wholly owned subsidiary of Holdco (“Astro Merger Sub” and, together with Holdco and Parent Merger Sub, the “Holdco Parties”), entered into an Agreement and Plan of Merger, as subsequently amended on February 27 and April 21, 2017, to effect certain technical amendments, (the “Merger Agreement”) pursuant to which (i) Parent Merger Sub will, upon the terms and subject to the conditions thereof, merge with and into Delek (the “Parent Merger”), with Delek surviving as a wholly owned subsidiary of Holdco and (ii) Astro Merger Sub will, upon the terms and subject to the conditions thereof, merge with and into Alon USA (the “Alon Merger” and, together with the Parent Merger, the “Mergers”) with Alon USA surviving as a wholly owned subsidiary of Holdco. In the Parent Merger, each issued and outstanding share of common stock of Delek, par value $0.01 per share (“Delek common stock”), or fraction thereof, will be converted into the right to receive one validly issued, fully paid and non-assessable share of Holdco common stock, par value $0.01 per share (“Holdco common stock”) or such fraction thereof equal to the fractional share of Delek common stock, upon the terms and subject to the conditions set forth in the Merger Agreement. In the Alon Merger, each issued and outstanding share of common stock of Alon USA, par value $0.01 per share (“Alon common stock”), other than Alon common stock held by Delek or any subsidiary of Delek, will be converted into the right to receive 0.504 shares of Holdco common stock, upon the terms and subject to the conditions set forth in the Merger Agreement.
As of March 31, 2017, our investment balance in Alon USA was $257.0 million and the excess of our initial investment over our net equity in the underlying net assets of Alon USA was approximately $11.5 million. This excess is included in equity method investments in our consolidated balance sheet and a portion has been attributed to property, plant and equipment and finite-lived intangible assets. These portions of the excess are being amortized as a reduction to earnings from equity method investments on a straight-line basis over the lives of the related assets. The earnings or losses from this equity method investment reflected in our consolidated statements of income include our share of net earnings or losses directly attributable to this equity method investment, and amortization of the excess of our investment balance over the underlying net assets of Alon USA. As of March 31, 2017, the market value of our ALJ Shares was $410.7 million, based on quoted market prices. There were no indicators of impairment of our investment in Alon USA as of March 31, 2017.
Below is summarized financial information of the financial condition and results of operations of Alon USA (in millions):
Balance Sheet Information | March 31, 2017 | December 31, 2016 | ||||||
Current assets | $ | 507.3 | $ | 486.2 | ||||
Non-current assets | 1,604.9 | 1,624.0 | ||||||
Current liabilities | 504.4 | 445.5 | ||||||
Non-current liabilities | 1,026.5 | 1,082.2 | ||||||
Non-controlling interests | 62.9 | 61.3 | ||||||
Three Months Ended | ||||||||
Income Statement Information | March 31, 2017 | March 31, 2016 | ||||||
Revenue | $ | 1,150.6 | $ | 850.0 | ||||
Gross profit | 177.7 | 114.8 | ||||||
Pre-tax income (loss) | 12.8 | (57.3 | ) | |||||
Net income (loss) | 10.3 | (36.1 | ) | |||||
Net income (loss) attributable to Alon USA | 7.3 | (35.5 | ) | |||||
In March 2015, Delek Logistics entered into two joint ventures that have constructed logistics assets, which will serve third parties and subsidiaries of Delek. Delek Logistics' investment in these joint ventures is being financed through a combination of cash from operations and borrowings under the DKL Revolver (as defined in Note 7). As of March 31, 2017, Delek Logistics' investment balance in these joint ventures was $103.0 million and was accounted for using the equity method. One of the joint venture projects was completed and began operations in September 2016. The other was completed and began operations in January 2017.
10
4. Discontinued Operations and Assets Held for Sale
In August 2016, Delek entered into a Purchase Agreement to sell the Retail Entities to COPEC. As a result of the Purchase Agreement, we met the requirements of ASC 205-20 and ASC 360 to report the results of the Retail Entities as discontinued operations and to classify the Retail Entities as a group of assets held for sale. The fair value assessment of the Retail Entities as of August 27, 2016 did not result in an impairment. We ceased depreciation of these assets as of August 27, 2016. The Retail Transaction closed in November 2016 and we received cash consideration of $378.9 million, net of debt repayments and transaction costs, and retained approximately $62.8 million of net liabilities from the Retail Entities. The Retail Transaction resulted in a gain on sale of the Retail Entities, before income tax, of $134.1 million.
Under the terms of the Purchase Agreement, Lion Oil and MAPCO Express entered into a supply agreement at the closing of the Retail Transaction pursuant to which Lion Oil will supply fuel to retail locations owned by MAPCO Express for a period of 18 months following the closing of the Retail Transaction (the "Fuel Supply Agreement"). We recorded net revenues of $104.1 million and net cash inflows of $99.0 million for the three months ended March 31, 2017 associated with the Fuel Supply Agreement.
Once the Retail Entities were identified as assets held for sale, the operations associated with these properties qualified for reporting as discontinued operations. Accordingly, the operating results, net of tax, from discontinued operations are presented separately in Delek’s condensed consolidated statements of income and the notes to the condensed consolidated financial statements have been adjusted to exclude the discontinued operations. Components of amounts reflected in income from discontinued operations are as follows (in millions):
Three Months Ended | ||||
March 31, 2016 | ||||
Revenue | 219.8 | |||
Cost of goods sold | (175.2 | ) | ||
Operating expenses | (32.9 | ) | ||
General and administrative expenses | (5.7 | ) | ||
Depreciation and amortization | (7.8 | ) | ||
Other operating expense, net | (0.4 | ) | ||
Interest expense | (1.7 | ) | ||
Income from discontinued operations before taxes | (3.9 | ) | ||
Income tax expense (benefit) | (1.5 | ) | ||
Income from discontinued operations, net of tax | $ | (2.4 | ) | |
5. Inventory
Refinery inventory consists of crude oil, work-in-process, refined products and blendstocks which are stated at the lower of cost or market. Cost of inventory for the Tyler refinery is determined under the last-in, first- out ("LIFO") valuation method and costs in excess of market value are charged to cost of goods sold. Cost of inventory for the El Dorado refinery is determined on a first-in, first-out ("FIFO") basis and costs in excess of net realizable value are charged to cost of goods sold.
Logistics inventory consists of refined products which are stated at the lower of FIFO cost or net realizable value.
Carrying value of inventories consisted of the following (in millions):
March 31, 2017 | December 31, 2016 | |||||||
Refinery raw materials and supplies | $ | 185.7 | $ | 145.6 | ||||
Refinery work in process | 35.4 | 37.6 | ||||||
Refinery finished goods | 170.0 | 200.3 | ||||||
Logistics refined products | 6.3 | 8.9 | ||||||
Total inventories | $ | 397.4 | $ | 392.4 | ||||
Due to a lower crude oil and refined product pricing environment experienced since the end of 2014, market prices have declined to a level below the average cost of our inventories. At March 31, 2017, we recorded a pre-tax inventory valuation reserve of $18.9 million, $18.7 million of which related to LIFO inventory, which is subject to reversal in subsequent periods, not to exceed LIFO cost, should market prices recover. At December 31, 2016, we recorded a pre-tax inventory valuation reserve of $16.0 million, all of which related to LIFO inventory, which reversed
11
in the first quarter of 2017, as the inventories associated with the valuation adjustment at the end of 2016 were sold or used. For the three months ended March 31, 2017 and 2016, we recognized net inventory valuation (losses) gains of $(2.9) million and $3.6 million, respectively, which were recorded as a component of cost of goods sold in the consolidated statements of income.
At March 31, 2017 and December 31, 2016, the excess of replacement cost (FIFO) over the carrying value (LIFO) of the Tyler refinery inventories was $1.1 million and $3.5 million, respectively.
Permanent Liquidations
We incurred a permanent reduction in a LIFO layer resulting in liquidation losses in our refinery inventory of a nominal amount and $3.3 million during the three months ended March 31, 2017 and 2016, respectively. These liquidation losses were recognized as a component of cost of goods sold.
6. Crude Oil Supply and Inventory Purchase Agreement
Delek has a Master Supply and Offtake Agreement (the "Supply and Offtake Agreement") with J. Aron & Company ("J. Aron"). Throughout the term of the Supply and Offtake Agreement, which was amended on February 27, 2017 to change, among other things, certain terms related to pricing and an extension of the maturity date to April 30, 2020, Lion Oil and J. Aron will identify mutually acceptable contracts for the purchase of crude oil from third parties and J. Aron will supply up to 100,000 barrels per day ("bpd") of crude oil to the El Dorado refinery. Crude oil supplied to the El Dorado refinery by J. Aron will be purchased daily at an estimated average monthly market price by Lion Oil. J. Aron will also purchase all refined products from the El Dorado refinery at an estimated daily market price, as they are produced. These daily purchases and sales are trued-up on a monthly basis in order to reflect actual average monthly prices. We have recorded a receivable related to this monthly settlement of $1.0 million and $6.9 million as of March 31, 2017 and December 31, 2016, respectively. Also pursuant to the Supply and Offtake Agreement and other related agreements, Lion Oil will endeavor to arrange potential sales by either Lion Oil or J. Aron to third parties of the products produced at the El Dorado refinery or purchased from third parties. In instances where Lion Oil is the seller to such third parties, J. Aron will first transfer title to the applicable products to Lion Oil.
This arrangement is accounted for as a product financing arrangement. Delek incurred fees payable to J. Aron of $2.5 million during each of the three months ended March 31, 2017 and 2016. These amounts are included as a component of interest expense in the condensed consolidated statements of income. Upon any termination of the Supply and Offtake Agreement, including in connection with a force majeure event, the parties are required to negotiate with third parties for the assignment to us of certain contracts, commitments and arrangements, including procurement contracts, commitments for the sale of product, and pipeline, terminalling, storage and shipping arrangements.
Upon the expiration of the Supply and Offtake Agreement on April 30, 2020, or upon any earlier termination, Delek will be required to repurchase the consigned crude oil and refined products from J. Aron at then prevailing market prices. At March 31, 2017, Delek had 2.5 million barrels of inventory consigned from J. Aron, and we have recorded liabilities associated with this consigned inventory of $130.2 million in the condensed consolidated balance sheet.
7. Long-Term Obligations and Notes Payable
Outstanding borrowings under Delek’s existing debt instruments are as follows (in millions):
March 31, 2017 | December 31, 2016 | |||||||
DKL Revolver | $ | 392.0 | $ | 392.6 | ||||
Wells Term Loan(1) | 57.7 | 63.6 | ||||||
Wells Revolving Loan | 30.0 | — | ||||||
Reliant Bank Revolver | 17.0 | 17.0 | ||||||
Promissory Notes | 105.0 | 130.0 | ||||||
Lion Term Loan Facility(2) | 223.2 | 229.7 | ||||||
824.9 | 832.9 | |||||||
Less: Current portion of long-term debt and notes payable | 84.4 | 84.4 | ||||||
$ | 740.5 | $ | 748.5 | |||||
12
(1) | The Wells Term Loan is net of deferred financing costs of $0.1 million as of both March 31, 2017 and December 31, 2016 and debt discount of $0.5 million as of both March 31, 2017 and December 31, 2016. |
(2) | The Lion Term Loan Facility is net of deferred financing costs of $2.7 million and $3.0 million, respectively, and debt discounts of $1.0 million and $1.1 million, respectively, at March 31, 2017 and December 31, 2016. |
DKL Revolver
Delek Logistics has a $700.0 million senior secured revolving credit agreement with Fifth Third Bank, as administrative agent, and a syndicate of lenders (the "DKL Revolver"). Delek Logistics and each of its existing subsidiaries are borrowers under the DKL Revolver. The DKL Revolver contains a dual currency borrowing tranche that permits draw downs in U.S. or Canadian dollars and an accordion feature whereby Delek Logistics can increase the size of the credit facility to an aggregate of $800.0 million, subject to receiving increased or new commitments from lenders and the satisfaction of certain other conditions precedent.
The obligations under the DKL Revolver are secured by a first priority lien on substantially all of Delek Logistics' tangible and intangible assets. Additionally, a subsidiary of Delek provides a limited guaranty of Delek Logistics' obligations under the DKL Revolver. The guaranty is (i) limited to an amount equal to the principal amount, plus unpaid and accrued interest, of a promissory note made by Delek in favor of the subsidiary guarantor (the "Holdings Note") and (ii) secured by the subsidiary guarantor's pledge of the Holdings Note to the DKL Revolver lenders. As of March 31, 2017, the principal amount of the Holdings Note was $102.0 million.
The DKL Revolver will mature on December 30, 2019. Borrowings under the DKL Revolver bear interest at either a U.S. base rate, Canadian prime rate, LIBOR, or a Canadian Dealer Offered Rate, in each case plus applicable margins, at the election of the borrowers and as a function of draw down currency. The applicable margin, in each case, varies based upon Delek Logistics' leverage ratio, which is defined as the ratio of total funded debt to EBITDA for the most recently ended four fiscal quarters. At March 31, 2017, the weighted average borrowing rate was approximately 3.6%. Additionally, the DKL Revolver requires Delek Logistics to pay a leverage ratio dependent quarterly fee on the average unused revolving commitment. As of March 31, 2017, this fee was 0.50% per year. As of March 31, 2017, Delek Logistics had $392.0 million of outstanding borrowings under the credit facility, as well as letters of credit issued of $7.5 million. Unused credit commitments under the DKL Revolver, as of March 31, 2017, were $300.5 million.
Wells ABL
Our subsidiary, Delek Refining, Ltd., has an asset-based loan credit facility with Wells Fargo Bank, National Association, as administrative agent, and a syndicate of lenders, which was amended and restated on September 29, 2016 (the "Wells ABL"). The Wells ABL consists of (i) a $450.0 million revolving loan (the "Wells Revolving Loan"), which includes a $45.0 million swing line loan sub-limit and a $200.0 million letter of credit sub-limit, (ii) a $70.0 million term loan (the "Wells Term Loan"), and (iii) an accordion feature which permits an increase in the size of the revolving credit facility to an aggregate of $725.0 million, subject to additional lender commitments and the satisfaction of certain other conditions precedent. The Wells Revolving Loan matures on September 29, 2021 and the Wells Term Loan matures on September 29, 2019. The Wells Term Loan is subject to repayment in level principal installments of approximately $5.8 million per quarter, with the final installment due on September 29, 2019. As of March 31, 2017, under the Wells ABL, we had letters of credit issued totaling approximately $92.4 million, $30.0 million in borrowings outstanding under the Wells Revolving Loan and $58.3 million outstanding under the Wells Term Loan. The obligations under the Wells ABL are secured by (i) substantially all the assets of Refining and its subsidiaries, with certain limitations, (ii) guaranties provided by the general partner of Delek Refining, Ltd., as well as by the parent of Delek Refining, Ltd., Delek Refining, Inc. (iii) a limited guarantee provided by Delek in an amount up to $15.0 million and (iv) a limited guarantee provided by Lion Oil in an amount equal to the sum of the face amount of all letters of credit issued on behalf of Lion Oil under the Wells ABL and any loans made by Refining or its subsidiaries to Lion Oil. Under the facility, revolving loans and letters of credit are provided subject to availability requirements which are determined pursuant to a borrowing base calculation as defined in the credit agreement. The borrowing base as calculated is primarily supported by cash, certain accounts receivable and certain inventory. Borrowings under the Wells Revolving Loan and Wells Term Loan bear interest based on separate predetermined pricing grids which allow us to choose between base rate loans or LIBOR rate loans. At March 31, 2017, the weighted average borrowing rate was approximately 4.7% under the Wells Term Loan and 4.5% under the Wells Revolving Loan. Additionally, the Wells ABL requires us to pay a quarterly unused credit commitment fee. As of March 31, 2017, this fee was approximately 0.38% per year. Unused borrowing base availability, as calculated and reported under the terms of the Wells ABL credit facility, as of March 31, 2017, was approximately $155.8 million.
Reliant Bank Revolver
We have a revolving credit agreement with Reliant Bank, which was amended on May 26, 2016 (the "Reliant Bank Revolver"). The Reliant Bank Revolver provides for unsecured loans of up to $17.0 million. As of March 31, 2017, we had $17.0 million outstanding under this facility. The Reliant Bank Revolver matures on June 28, 2018, and bears interest at a fixed rate of 5.25% per annum. The Reliant Bank Revolver requires us to pay a quarterly fee of 0.50% per year on the average available revolving commitment. As of March 31, 2017, we had no unused credit commitments under the Reliant Bank Revolver.
13
Promissory Notes
On April 29, 2011, Delek entered into a $50.0 million promissory note (the "Ergon Note") with Ergon, Inc. ("Ergon") in connection with the closing of our acquisition of Lion Oil. As of March 31, 2017, $10.0 million was outstanding under the Ergon Note. The Ergon Note requires Delek to make annual amortization payments of $10.0 million each, commencing April 29, 2013. The Ergon Note matures on April 29, 2017. Interest under the Ergon Note is computed at a fixed rate equal to 4.0% per annum.
On May 14, 2015, in connection with the closing of the Company’s acquisition of the ALJ Shares, the Company issued the Alon Israel Note in the amount of $145.0 million, which was payable to Alon Israel. The Alon Israel Note bears interest at a fixed rate of 5.5% per annum and requires five annual principal amortization payments of $25.0 million beginning in January 2016 followed by a final principal amortization payment of $20.0 million at maturity on January 4, 2021. In October 2015, we prepaid the first annual principal amortization payment in the amount of $25.0 million, along with all interest due on the prepaid amount. On December 22, 2015, Alon Israel assigned the remaining $120.0 million of principal and all accrued interest due under the Alon Israel Note to assignees under four new notes in substantially the same form and on the same terms as the Alon Israel Note (collectively, the "Alon Successor Notes"). The $120.0 million in total principal of the four Alon Successor Notes collectively require the same principal amortization payments and schedule as under the Alon Israel Note, with payments due under each Alon Successor Note commensurate to such note's pro rata share of $120.0 million in assigned principal. As of March 31, 2017, a total principal amount of $95.0 million was outstanding under the Alon Successor Notes.
Lion Term Loan
Our subsidiary, Lion Oil, has a term loan credit facility with Fifth Third Bank, as administrative agent, and a syndicate of lenders, which was amended and restated on May 14, 2015 in connection with the Company’s closing of the Alon Acquisition to, among other things, increase the total loan size from $99.0 million to $275.0 million (the "Lion Term Loan"). The Lion Term Loan requires Lion Oil to make quarterly principal amortization payments of approximately $6.9 million each, commencing on September 30, 2015, with a final balloon payment due at maturity on May 14, 2020. The Lion Term Loan is secured by, among other things, (i) substantially all the assets of Lion Oil and its subsidiaries (excluding inventory and accounts receivable), (ii) all shares in Lion Oil, (iii) any subordinated and common units of Delek Logistics held by Lion Oil, and (iv) the ALJ Shares. Additionally, the Lion Term Loan is guaranteed by Delek and the subsidiaries of Lion Oil. Interest on the unpaid balance of the Lion Term Loan is computed at a rate per annum equal to LIBOR or a base rate, at our election, plus the applicable margins, subject in each case to an all-in interest rate floor of 5.50% per annum. As of March 31, 2017, approximately $226.9 million was outstanding under the Lion Term Loan and the weighted average borrowing rate was 5.65%.
Restrictive Covenants
Under the terms of our Wells ABL, DKL Revolver, Reliant Bank Revolver and Lion Term Loan, we are required to comply with certain usual and customary financial and non-financial covenants. Further, although we were not required to comply with separate fixed charge coverage ratio financial covenants under the Wells ABL and the Lion Term Loan during the three months ended March 31, 2017, we may be required to comply with these covenants at times when certain trigger thresholds are met, as defined in each of the Wells ABL and Lion Term Loan agreements. We believe we were in compliance with all covenant requirements under each of our credit facilities as of March 31, 2017.
Certain of our credit facilities contain limitations on the incurrence of additional indebtedness, making of investments, creation of liens, dispositions of property, making of restricted payments and transactions with affiliates. Specifically, these covenants may limit the payment, in the form of cash or other assets, of dividends or other distributions, or the repurchase of shares with respect to the equity of our subsidiaries. Additionally, certain of our credit facilities limit our ability to make investments, including extensions of loans or advances to, or acquisitions of equity interests in, or guarantees of obligations of, any other entities.
8. Other Assets and Liabilities
The detail of other current assets is as follows (in millions):
Other Current Assets | March 31, 2017 | December 31, 2016 | |||||
Prepaid expenses | $ | 14.2 | $ | 14.0 | |||
Short-term derivative assets (see Note 15) | 3.4 | 6.8 | |||||
Income and other tax receivables | 14.5 | 19.2 | |||||
RINs Obligation surplus (see Note 14) | 15.0 | 4.9 | |||||
Other | 4.1 | 4.4 | |||||
Total | $ | 51.2 | $ | 49.3 | |||
14
The detail of other non-current assets is as follows (in millions):
Other Non-Current Assets | March 31, 2017 | December 31, 2016 | |||||
Prepaid tax asset | $ | 58.7 | $ | 59.5 | |||
Deferred financing costs | 7.5 | 8.2 | |||||
Long-term income tax receivables | 10.2 | 7.5 | |||||
Supply and Offtake receivable | 20.2 | — | |||||
Long-term derivative assets (see Note 15) | 0.1 | — | |||||
Other | 5.7 | 5.5 | |||||
Total | $ | 102.4 | $ | 80.7 | |||
The detail of accrued expenses and other current liabilities is as follows (in millions):
Accrued Expenses and Other Current Liabilities | March 31, 2017 | December 31, 2016 | |||||
Income and other taxes payable | $ | 103.9 | $ | 115.7 | |||
Short-term derivative liabilities (see Note 15) | 17.1 | 26.1 | |||||
Interest payable | 4.4 | 9.6 | |||||
Employee costs | 5.8 | 7.3 | |||||
Environmental liabilities (see Note 16) | 1.0 | 1.0 | |||||
Product financing agreements | — | 6.0 | |||||
RINs Obligation deficit (see Note 14) | — | 25.6 | |||||
Other | 65.6 | 38.5 | |||||
Total | $ | 197.8 | $ | 229.8 | |||
The detail of other non-current liabilities is as follows (in millions):
Other Non-Current Liabilities | March 31, 2017 | December 31, 2016 | |||||
Long-term derivative liabilities (see Note 15) | $ | 23.0 | $ | 17.3 | |||
Other | 6.2 | 8.7 | |||||
Total | $ | 29.2 | $ | 26.0 | |||
9. Stockholders' Equity
Changes to equity during the three months ended March 31, 2017 are presented below (in millions, except per share amounts):
Delek Stockholders' Equity | Non-Controlling Interest in Subsidiaries | Total Stockholders' Equity | ||||||||||
Balance at December 31, 2016 | $ | 991.9 | $ | 190.6 | $ | 1,182.5 | ||||||
Net income | 11.2 | 4.1 | 15.3 | |||||||||
Net unrealized gain on cash flow hedges, net of income tax expense of $0.6 million and ineffectiveness gain of $2.2 million | 1.2 | — | 1.2 | |||||||||
Other comprehensive income from equity method investments, net of income tax expense of a nominal amount | 0.1 | — | 0.1 | |||||||||
Common stock dividends ($0.15 per share) | (9.6 | ) | — | (9.6 | ) | |||||||
Distribution to non-controlling interest | — | (6.4 | ) | (6.4 | ) | |||||||
Repurchase of non-controlling interest | — | (4.0 | ) | (4.0 | ) | |||||||
Equity-based compensation expense | 3.6 | 0.2 | 3.8 | |||||||||
Taxes due to the net settlement of equity-based compensation | (0.7 | ) | — | (0.7 | ) | |||||||
Other | 0.2 | — | 0.2 | |||||||||
Balance at March 31, 2017 | $ | 997.9 | $ | 184.5 | $ | 1,182.4 | ||||||
Dividends
During the three months ended March 31, 2017, our Board of Directors declared the following dividends:
Date Declared | Dividend Amount Per Share | Record Date | Payment Date | |||
February 27, 2017 | $0.15 | March 15, 2017 | March 29, 2017 | |||
Stock Repurchase Program
In December 2016, our Board of Directors authorized a share repurchase program for up to $150.0 million of Delek common stock. Any share repurchases under the repurchase program may be implemented through open market transactions or in privately negotiated transactions, in accordance with applicable securities laws. The timing, price, and size of repurchases will be made at the discretion of management and will depend on prevailing market prices, general economic and market conditions and other considerations. The repurchase program does not obligate us to acquire any particular amount of stock and does not expire. There were no shares repurchased during the three months ended March 31, 2017.
10. Income Taxes
Under ASC 740, Income Taxes (“ASC 740”), companies are required to apply an estimated annual tax rate to interim period results on a year-to-date basis; however, the estimated annual tax rate should not be applied to interim financial results if a reliable estimate cannot be made. In this situation, the interim tax rate should be based on actual year-to-date results. Based on our current projections, which have fluctuated as a result of changes in crude oil prices and the related crack spreads, we believe that using actual year-to-date results to compute our effective tax rate will produce a more reliable estimate of our tax expense or benefit. As such, we recorded a tax provision for the three months ended March 31, 2017 and 2016 based on actual year-to-date results, in accordance with ASC 740.
Our effective tax rate was 24.6% for the three months ended March 31, 2017, compared to 52.3% for the three months ended March 31, 2016. The decrease in our effective tax rate in the three months ended March 31, 2017 was primarily due to the expiration of provisions for certain tax credits and incentives that expired as of December 31, 2016 and have not been extended by Congress, as well as the impact of pre-tax income in the three months ended March 31, 2017, compared to a pre-tax loss in the three months ended March 31, 2016.
15
11. Equity-Based Compensation
Delek US Holdings, Inc. 2006 and 2016 Long-Term Incentive Plans
Compensation expense for Delek equity-based awards amounted to $3.3 million ($2.1 million, net of taxes) and $3.6 million ($2.3 million, net of taxes) for the three months ended March 31, 2017 and 2016, respectively. These amounts, excluding amounts related to discontinued operations of $0.4 million for the three months ended March 31, 2016, are included in general and administrative expenses in the accompanying condensed consolidated statements of income.
As of March 31, 2017, there was $25.1 million of total unrecognized compensation cost related to non-vested share-based compensation arrangements, which is expected to be recognized over a weighted-average period of 1.8 years.
We issued 74,111 and 40,466 shares of common stock as a result of exercised stock options, stock appreciation rights, and vested restricted stock units during the three months ended March 31, 2017 and 2016, respectively. These amounts do not include shares withheld to satisfy employee tax obligations related to the exercises and vestings. Such withheld shares totaled 61,845 and 12,183 shares during the three months ended March 31, 2017 and 2016, respectively.
Delek Logistics GP, LLC 2012 Long-Term Incentive Plan
Compensation expense for Delek Logistics GP equity-based awards was $0.4 million ($0.3 million, net of taxes) for both the three months ended March 31, 2017 and 2016. These amounts are included in general and administrative expenses in the accompanying condensed consolidated statements of income.
As of March 31, 2017, there was $1.2 million of total unrecognized compensation cost related to non-vested share-based compensation arrangements, which is expected to be recognized over a weighted-average period of 1.6 years.
12. Earnings (Loss) Per Share
Basic and diluted earnings per share are computed by dividing net income (loss) by the weighted average common shares outstanding. The common shares used to compute Delek’s basic and diluted earnings (loss) per share are as follows:
Three Months Ended | ||||||
March 31, | ||||||
2017 | 2016 | |||||
Weighted average common shares outstanding | 61,978,072 | 62,132,007 | ||||
Dilutive effect of equity instruments | 611,138 | — | ||||
Weighted average common shares outstanding, assuming dilution | 62,589,210 | 62,132,007 | ||||
Outstanding common share equivalents totaling 1,934,173 and 2,981,508 were excluded from the diluted earnings per share calculation for the three months ended March 31, 2017 and 2016, respectively, as these common share equivalents did not have a dilutive effect under the treasury stock method. These amounts include outstanding common share equivalents totaling 208,933 that were excluded from the diluted earnings per share calculation due to the net loss for the three months ended March 31, 2016.
13. Segment Data
Prior to August 2016, we aggregated our operating units into three reportable segments: refining, logistics and retail. However, in August 2016, Delek entered into a Purchase Agreement to sell the Retail Entities, which consist of all of the retail segment and a portion of the corporate, other and eliminations segment, to COPEC. As a result of the Purchase Agreement, we met the requirements of ASC 205-20, Presentation of Financial Statements - Discontinued Operations and ASC 360, Property, Plant and Equipment, to report the results of the Retail Entities as discontinued operations and to classify the Retail Entities as a group of assets held for sale. The operating results for the Retail Entities, in all periods presented, have been reclassified to discontinued operations and are no longer reported as retail segment.
Our corporate activities, results of certain immaterial operating segments, our equity method investment in Alon USA and intercompany eliminations are reported in the corporate, other and eliminations segment. Decisions concerning the allocation of resources and assessment of operating performance are made based on this segmentation. Management measures the operating performance of each of the reportable segments based on the segment contribution margin.
Segment contribution margin is defined as net sales less cost of sales and operating expenses, excluding depreciation and amortization. Operations which are not specifically included in the reportable segments are included in the corporate and other category, which primarily consists of operating expenses, depreciation and amortization expense and interest income and expense associated with our corporate headquarters.
The refining segment processes crude oil and other purchased feedstocks for the manufacture of transportation motor fuels, including various grades of gasoline, diesel fuel, aviation fuel, asphalt and other petroleum-based products that are distributed through owned and third-party product terminals. The refining segment has a combined nameplate capacity of 155,000 bpd, including the 75,000 bpd Tyler refinery and the 80,000 bpd El Dorado refinery. The refining segment also owns and operates two biodiesel facilities involved in the production of biodiesel fuels and related activities.
Our refining segment has a services agreement with our logistics segment, which, among other things, requires the refining segment to pay service fees based on the number of gallons sold at the Tyler refinery and a sharing of a portion of the margin achieved in return for providing marketing, sales and customer services. This intercompany transaction fee was $4.3 million and $3.9 million during the three months ended March 31, 2017 and 2016, respectively. Additionally, the refining segment pays crude transportation, terminalling and storage fees to the logistics segment for the utilization of pipeline, terminal and storage assets. These fees were $31.2 million and $31.0 million during the three months ended March 31, 2017 and 2016, respectively. The logistics segment also sold $1.1 million and $1.5 million of Renewable Identification Numbers ("RINs") to the refining segment during the three months ended March 31, 2017 and 2016, respectively. The refining segment recorded sales and fee revenues from the logistics segment of $9.0 million during the three months ended March 31, 2017, and recorded sales and fee revenues from the logistics segment and the Retail Entities, the operations of which are included in discontinued operations, in the amount of $91.4 million during the three months ended March 31, 2016. All inter-segment transactions have been eliminated in consolidation.
Our logistics segment owns and operates crude oil and refined products logistics and marketing assets. The logistics segment generates revenue and contribution margin by charging fees for gathering, transporting and storing crude oil and for marketing, distributing, transporting and storing intermediate and refined products.
16
The following is a summary of business segment operating performance as measured by contribution margin for the period indicated (in millions):
Three Months Ended March 31, 2017 | ||||||||||||||||
(In millions) | Refining | Logistics | Corporate, Other and Eliminations | Consolidated | ||||||||||||
Net sales (excluding intercompany fees and sales) | $ | 1,090.5 | $ | 92.9 | $ | (1.2 | ) | $ | 1,182.2 | |||||||
Intercompany fees and sales | 9.0 | 36.6 | (45.6 | ) | — | |||||||||||
Operating costs and expenses: | ||||||||||||||||
Cost of goods sold | 984.3 | 92.6 | (41.2 | ) | 1,035.7 | |||||||||||
Operating expenses | 50.8 | 10.3 | 0.1 | 61.2 | ||||||||||||
Segment contribution margin | $ | 64.4 | $ | 26.6 | $ | (5.7 | ) | 85.3 | ||||||||
General and administrative expenses | 26.5 | |||||||||||||||
Depreciation and amortization | 29.0 | |||||||||||||||
Operating income | $ | 29.8 | ||||||||||||||
Total assets | $ | 1,994.1 | $ | 413.6 | $ | 550.3 | $ | 2,958.0 | ||||||||
Capital spending (excluding business combinations) | $ | 10.8 | $ | 2.8 | $ | 1.6 | $ | 15.2 | ||||||||
Three Months Ended March 31, 2016 | ||||||||||||||||
Refining | Logistics | Corporate, Other and Eliminations(4) | Consolidated | |||||||||||||
Net sales (excluding intercompany fees and sales) | $ | 735.9 | $ | 67.7 | $ | 0.5 | $ | 804.1 | ||||||||
Intercompany fees and sales(1) | 91.4 | 36.4 | (45.8 | ) | 82.0 | |||||||||||
Operating costs and expenses: | ||||||||||||||||
Cost of goods sold | 787.9 | 66.8 | (38.9 | ) | 815.8 | |||||||||||
Operating expenses | 58.3 | 10.5 | 0.2 | 69.0 | ||||||||||||
Insurance proceeds - business interruption | (42.4 | ) | — | — | (42.4 | ) | ||||||||||
Segment contribution margin | $ | 23.5 | $ | 26.8 | $ | (6.6 | ) | 43.7 | ||||||||
General and administrative expenses | 29.0 | |||||||||||||||
Depreciation and amortization | 28.3 | |||||||||||||||
Operating loss | $ | (13.6 | ) | |||||||||||||
Total assets(2) | $ | 1,937.9 | $ | 379.2 | $ | 979.7 | $ | 3,296.8 | ||||||||
Capital spending (excluding business combinations)(3) | $ | 3.3 | $ | 1.1 | $ | 2.1 | $ | 6.5 | ||||||||
(1) | Intercompany fees and sales for the refining segment include revenues from the Retail Entities of $82.0 million during the three months ended March 31, 2016, the operations of which are reported in discontinued operations. |
(2) | Assets held for sale of $463.8 million are included in the corporate, other and eliminations segment as of March 31, 2016. |
(3) | Capital spending excludes capital spending associated with the Retail Entities of $3.4 million during the three months ended March 31, 2016. |
(4) | The corporate, other and eliminations segment operating results for the three months ended March 31, 2016 have been restated to reflect the reclassification of the Retail Entities to discontinued operations. |
17
Property, plant and equipment and accumulated depreciation as of March 31, 2017 and depreciation expense by reporting segment for the three months ended March 31, 2017 are as follows (in millions):
Refining | Logistics | Corporate, Other and Eliminations | Consolidated | |||||||||||||
Property, plant and equipment | $ | 1,213.6 | $ | 345.2 | $ | 43.9 | $ | 1,602.7 | ||||||||
Less: Accumulated depreciation | (391.8 | ) | (96.3 | ) | (24.8 | ) | (512.9 | ) | ||||||||
Property, plant and equipment, net | $ | 821.8 | $ | 248.9 | $ | 19.1 | $ | 1,089.8 | ||||||||
Depreciation expense | $ | 21.8 | $ | 4.9 | $ | 1.9 | $ | 28.6 | ||||||||
In accordance with ASC 360, Delek evaluates the realizability of property, plant and equipment as events occur that might indicate potential impairment. There were no indicators of impairment of our property, plant and equipment as of March 31, 2017.
14. Fair Value Measurements
The fair values of financial instruments are estimated based upon current market conditions and quoted market prices for the same or similar instruments. Management estimates that the carrying value approximates fair value for all of Delek’s assets and liabilities that fall under the scope of ASC 825, Financial Instruments ("ASC 825").
Delek applies the provisions of ASC 820, Fair Value Measurements ("ASC 820"), which defines fair value, establishes a framework for its measurement and expands disclosures about fair value measurements. ASC 820 applies to our commodity derivatives that are measured at fair value on a recurring basis. The standard also requires that we assess the impact of nonperformance risk on our derivatives. Nonperformance risk is not considered material to our financial statements at this time.
ASC 820 requires disclosures that categorize assets and liabilities measured at fair value into one of three different levels depending on the observability of the inputs employed in the measurement. Level 1 inputs are quoted prices in active markets for identical assets or liabilities. Level 2 inputs are observable inputs other than quoted prices included within Level 1 for the asset or liability, either directly or indirectly through market-corroborated inputs. Level 3 inputs are unobservable inputs for the asset or liability reflecting our assumptions about pricing by market participants.
Over the counter ("OTC") commodity swaps, physical commodity purchase and sale contracts and interest rate swaps and caps are generally valued using industry-standard models that consider various assumptions, including quoted forward prices, spot prices, interest rates, time value, volatility factors and contractual prices for the underlying instruments, as well as other relevant economic measures. The degree to which these inputs are observable in the forward markets determines the classification as Level 2 or 3. Our contracts are valued based on exchange pricing and/or price index developers such as Platts or Argus and are, therefore, classified as Level 2.
The U.S. Environmental Protection Agency ("EPA") requires certain refiners to blend biofuels into the fuel products they produce pursuant to the EPA’s Renewable Fuel Standard - 2. Alternatively, credits called RINs, which may be generated and/or purchased, can be used to satisfy this obligation instead of physically blending biofuels ("RINs Obligation"). Our RINs Obligation surplus or deficit is based on the amount of RINs we must purchase, net of amounts internally generated and purchased and the price of those RINs as of the balance sheet date. The RINs Obligation surplus or deficit is categorized as Level 2 and is measured at fair value based on quoted prices from an independent pricing service.
On March 1, 2017, the El Dorado refinery received approval from the EPA for a small refinery exemption from the requirements of the renewable fuel standard for the 2016 calendar year. This waiver resulted in a reduction of our RINs Obligation and related cost of goods sold of approximately $47.5 million for the three months ended March 31, 2017.
From time to time, Delek enters into future commitments to purchase or sell RINs at fixed prices and quantities, which are used to manage the costs associated with our RINs Obligation. These future RIN commitment contracts meet the definition of derivative instruments under ASC 815, Derivatives and Hedging ("ASC 815"). They are categorized as Level 2, and are measured at fair value based on quoted prices from an independent pricing service. Changes in the fair value of these future RIN commitment contracts are recorded in cost of goods sold on the consolidated statements of income.
We have elected to account for our J. Aron step-out liability at fair value in accordance with ASC 825, as it pertains to the fair value option. This standard permits the election to carry financial instruments and certain other items similar to financial instruments at fair value on the balance sheet, with all changes in fair value reported in earnings. Our J. Aron step-out liability is categorized as Level 2, and is measured at fair value using market prices for the consigned crude oil and refined products we are required to repurchase from J. Aron at the end of the term of the Supply and Offtake Agreement.
18
The fair value hierarchy for our financial assets and liabilities accounted for at fair value on a recurring basis at March 31, 2017 and December 31, 2016, was as follows (in millions):
As of March 31, 2017 | ||||||||||||||||
Level 1 | Level 2 | Level 3 | Total | |||||||||||||
Assets | ||||||||||||||||
OTC commodity swaps | $ | — | $ | 28.5 | $ | — | $ | 28.5 | ||||||||
RINs Obligation surplus | — | 15.0 | — | 15.0 | ||||||||||||
Total assets | — | 43.5 | — | 43.5 | ||||||||||||
Liabilities | ||||||||||||||||
OTC commodity swaps | — | (70.6 | ) | — | (70.6 | ) | ||||||||||
RIN commitment contracts | — | (3.4 | ) | — | (3.4 | ) | ||||||||||
J. Aron step-out liability | — | (130.2 | ) | — | (130.2 | ) | ||||||||||
Total liabilities | — | (204.2 | ) | — | (204.2 | ) | ||||||||||
Net liabilities | $ | — | $ | (160.7 | ) | $ | — | $ | (160.7 | ) | ||||||
As of December 31, 2016 | ||||||||||||||||
Level 1 | Level 2 | Level 3 | Total | |||||||||||||
Assets | ||||||||||||||||
OTC commodity swaps | $ | — | $ | 53.1 | $ | — | $ | 53.1 | ||||||||
RINs Obligation surplus | — | 4.9 | — | 4.9 | ||||||||||||
Total assets | — | 58.0 | — | 58.0 | ||||||||||||
Liabilities | ||||||||||||||||
OTC commodity swaps | — | (103.6 | ) | — | (103.6 | ) | ||||||||||
RIN commitment contracts | — | (0.8 | ) | — | (0.8 | ) | ||||||||||
RINs Obligation deficit | — | (25.6 | ) | — | (25.6 | ) | ||||||||||
J. Aron step-out liability | — | (144.8 | ) | — | (144.8 | ) | ||||||||||
Total liabilities | — | (274.8 | ) | — | (274.8 | ) | ||||||||||
Net liabilities | $ | — | $ | (216.8 | ) | $ | — | $ | (216.8 | ) | ||||||
The derivative values above are based on analysis of each contract as the fundamental unit of account as required by ASC 820. Derivative assets and liabilities with the same counterparty are not netted where the legal right of offset exists. This differs from the presentation in the financial statements which reflects our policy under the guidance of ASC 815-10-45, wherein we have elected to offset the fair value amounts recognized for multiple derivative instruments executed with the same counterparty and where the legal right of offset exists. As of March 31, 2017 and December 31, 2016, $8.9 million and $14.7 million, respectively, of cash collateral was held by counterparty brokerage firms and has been netted with the net derivative positions with each counterparty.
15. Derivative Instruments
We use derivatives to reduce normal operating and market risks with the primary objective of reducing the impact of market price volatility on our results of operations. As such, our use of derivative contracts is aimed at:
• | limiting the exposure to price fluctuations of commodity inventory above or below target levels at each of our segments; |
• | managing our exposure to commodity price risk associated with the purchase or sale of crude oil, feedstocks and finished grade fuel products at each of our segments; and |
• | limiting the exposure to interest rate fluctuations on our floating rate borrowings. |
We primarily utilize OTC commodity swaps, generally with maturity dates of three years or less, and interest rate swap and cap agreements to achieve these objectives. OTC commodity swap contracts require cash settlement for the commodity based on the difference between a
19
fixed or floating price and the market price on the settlement date. As of March 31, 2017, there are no interest rate swap or cap agreements outstanding. At this time, we do not believe there is any material credit risk with respect to the counterparties to these contracts.
From time to time, we also enter into future commitments to purchase or sell RINs at fixed prices and quantities, which are used to manage the costs associated with our RINs Obligation. These future RIN commitment contracts meet the definition of derivative instruments under ASC 815, and are recorded at estimated fair value in accordance with the provisions of ASC 815. Changes in the fair value of these future RIN commitment contracts are recorded in cost of goods sold on the consolidated statements of income.
In accordance with ASC 815, certain of our OTC commodity swap contracts have been designated as cash flow hedges and the effective portion of the change in fair value between the execution date and the end of period has been recorded in other comprehensive income. The effective portion of the fair value of these contracts is recognized in income at the time the positions are closed and the hedged transactions are recognized in income.
From time to time, we also enter into futures contracts with supply vendors that secure supply of product to be purchased for use in the normal course of business at our refining segment. These contracts are priced based on an index that is clearly and closely related to the product being purchased, contain no net settlement provisions and typically qualify under the normal purchase exemption from derivative accounting treatment under ASC 815.
The following table presents the fair value of our derivative instruments as of March 31, 2017 and December 31, 2016. The fair value amounts below are presented on a gross basis and do not reflect the netting of asset and liability positions permitted under our master netting arrangements, including cash collateral on deposit with our counterparties. We have elected to offset the recognized fair value amounts for multiple derivative instruments executed with the same counterparty in our financial statements. As a result, the asset and liability amounts below differ from the amounts presented in our condensed consolidated balance sheets (in millions):
March 31, 2017 | December 31, 2016 | ||||||||||||||||
Derivative Type | Balance Sheet Location | Assets | Liabilities | Assets | Liabilities | ||||||||||||
Derivatives not designated as hedging instruments: | |||||||||||||||||
OTC commodity swaps(1) | Other current assets | $ | 13.7 | $ | (11.7 | ) | $ | 37.4 | $ | (30.6 | ) | ||||||
OTC commodity swaps(1) | Other current liabilities | 9.3 | (16.6 | ) | 14.4 | (35.2 | ) | ||||||||||
OTC commodity swaps(1) | Other long term assets | 1.3 | (1.2 | ) | — | — | |||||||||||
OTC commodity swaps(1) | Other long term liabilities | 2.3 | (2.7 | ) | — | — | |||||||||||
RIN commitment contracts(2) | Other current liabilities | — | (3.4 | ) | — | (0.8 | ) | ||||||||||
Derivatives designated as hedging instruments: | |||||||||||||||||
OTC commodity swaps(1) | Other current assets | 1.4 | (1.0 | ) | 0.1 | (2.5 | ) | ||||||||||
OTC commodity swaps(1) | Other current liabilities | 0.5 | (14.8 | ) | 1.2 | (18.0 | ) | ||||||||||
OTC commodity swaps(1) | Other long term liabilities | — | (22.6 | ) | — | (17.3 | ) | ||||||||||
Total gross fair value of derivatives | $ | 28.5 | $ | (74.0 | ) | $ | 53.1 | $ | (104.4 | ) | |||||||
Less: Counterparty netting and cash collateral(3) | 25.0 | (33.9 | ) | 46.3 | (61.0 | ) | |||||||||||
Total net fair value of derivatives | $ | 3.5 | $ | (40.1 | ) | $ | 6.8 | $ | (43.4 | ) | |||||||
(1) | As of March 31, 2017 and December 31, 2016, we had open derivative positions representing 24,019,000 barrels and 9,348,000 barrels, respectively, of crude oil and refined petroleum products. Of these open positions, contracts representing 1,968,000 barrels and 3,392,000 barrels were designated as cash flow hedging instruments as of March 31, 2017 and December 31, 2016, respectively. |
(2) | As of March 31, 2017 and December 31, 2016, we had open RIN contracts representing 252,670,299 and 36,750,000 RINs, respectively. |
(3) | As of March 31, 2017 and December 31, 2016, $8.9 million and $14.7 million, respectively, of cash collateral held by counterparties has been netted with the derivatives with each counterparty. |
20
Total losses on our commodity derivatives and RIN commitment contracts recorded in cost of goods sold on the condensed consolidated statements of income for the three months ended March 31, 2017 and 2016 are as follows (in millions):
Three Months Ended March 31, | ||||||||
2017 | 2016 | |||||||
Gains on derivatives not designated as hedging instruments | 2.7 | 0.5 | ||||||
Realized losses reclassified out of OCI on derivatives designated as cash flow hedging instruments | (7.8 | ) | (7.3 | ) | ||||
Gains (losses) recognized due to cash flow hedging ineffectiveness | 2.2 | (1.0 | ) | |||||
Total | $ | (2.9 | ) | $ | (7.8 | ) | ||
For cash flow hedges, no component of the derivative instruments’ gains or losses was excluded from the assessment of hedge effectiveness for the three months ended March 31, 2017 or 2016. As of March 31, 2017 and December 31, 2016, losses of $15.0 million and $16.2 million, respectively, on cash flow hedges, net of tax, primarily related to future purchases of crude oil and the associated sale of finished grade fuel, remained in accumulated other comprehensive income. Losses of $5.1 million and $4.7 million, net of tax, on settled contracts were reclassified into the condensed consolidated statements of income during the three months ended March 31, 2017 and 2016, respectively. We estimate that $31.2 million of deferred losses will be reclassified into cost of sales over the next 12 months as a result of hedged transactions that are forecasted to occur. For the three months ended March 31, 2017 and March 31, 2016, there were no amounts reclassified from accumulated other comprehensive income into income as a result of the discontinuation of cash flow hedge accounting.
16. Commitments and Contingencies
Litigation
In the ordinary conduct of our business, we are from time to time subject to lawsuits, investigations and claims, including environmental claims and employee-related matters.
Although we cannot predict with certainty the ultimate resolution of lawsuits, investigations and claims asserted against us, including civil penalties or other enforcement actions, we do not believe that any currently pending legal proceeding or proceedings to which we are a party will have a material adverse effect on our business, financial condition or results of operations.
Self-insurance
Delek is self-insured for workers’ compensation claims up to $1.0 million on a per-accident basis. We self-insure for general liability claims up to $4.0 million on a per-occurrence basis. We self-insure for auto liability up to $4.0 million on a per-accident basis.
We have umbrella liability insurance available to each of our segments in an amount determined reasonable by management.
Environmental, Health and Safety
We are subject to extensive federal, state and local environmental and safety laws and regulations enforced by various agencies, including the EPA, the United States Department of Transportation, the Occupational Safety and Health Administration, the Texas Commission on Environmental Quality, the Railroad Commission of Texas, the Arkansas Department of Environmental Quality (the "ADEQ") and the Tennessee Department of Environment and Conservation, as well as other state and federal agencies. These laws and regulations govern the discharge of materials into the environment, waste management practices, pollution prevention measures and the composition of the fuels we produce, as well as the safe operation of our plants and pipelines and the safety of our workers and the public. Numerous permits or other authorizations are required under these laws and regulations for the operation of our refineries, biodiesel facilities, terminals, pipelines, trucks, rail cars and related operations, and may be subject to revocation, modification and renewal.
These laws and permits raise potential exposure to future claims and lawsuits involving environmental and safety matters which could include soil and water contamination, air pollution, personal injury and property damage allegedly caused by substances which we manufactured, handled, used, released or disposed of, transported, or that relate to pre-existing conditions for which we have assumed responsibility. We believe that our current operations are in substantial compliance with existing environmental and safety requirements. However, there have been and will continue to be ongoing discussions about environmental and safety matters between us and federal and state authorities, including notices of violations, citations and other enforcement actions, some of which have resulted or may result in changes to operating procedures and in capital expenditures. While it is often difficult to quantify future environmental or safety related expenditures, we anticipate that continuing
21
capital investments and changes in operating procedures will be required for the foreseeable future to comply with existing and new requirements, as well as evolving interpretations and more strict enforcement of existing laws and regulations.
As of March 31, 2017, we have recorded an environmental liability of approximately $7.0 million, primarily related to the estimated probable costs of remediating or otherwise addressing certain environmental issues of a non-capital nature at the Tyler and El Dorado refineries. This liability includes estimated costs for ongoing investigation and remediation efforts, which were already being performed by the former operators of the Tyler and El Dorado refineries prior to our acquisition of those facilities, for known contamination of soil and groundwater, as well as estimated costs for additional issues which have been identified subsequent to the acquisitions. We expect approximately $0.2 million of this amount to be reimbursable by a prior owner of the El Dorado refinery, which we have recorded in other current assets in our condensed consolidated balance sheet as of March 31, 2017. Approximately $1.0 million of the total liability is expected to be expended over the next 12 months with most of the balance expended by 2022. In the future, we could be required to extend the expected remediation period or undertake additional investigations of our refineries, pipelines and terminal facilities, which could result in additional remediation liabilities.
We have experienced several crude oil releases from pipelines owned by our logistics segment, including, but not limited to, a release at Magnolia Station in March 2013, a release near Fouke, Arkansas in April 2015 and a release near Woodville, Texas in January 2016. In June 2015, the United States Department of Justice notified Delek Logistics that they were evaluating an enforcement action on behalf of the EPA with regard to potential Clean Water Act violations arising from the March 2013 Magnolia Station release. We are currently attempting to negotiate a resolution to this matter with the EPA and the ADEQ, which may include monetary penalties and/or other relief. Based on current information available to us, we do not believe the total costs associated with these events, whether alone or in the aggregate, including any fines or penalties, will have a material adverse effect upon our business, financial condition or results of operations.
Letters of Credit
As of March 31, 2017, we had in place letters of credit totaling approximately $101.8 million with various financial institutions securing obligations primarily with respect to our commodity purchases for the refining segment, our gasoline and diesel purchases for the logistics segment and our workers’ compensation and general liability self-insurance programs. No amounts were drawn by beneficiaries of these letters of credit at March 31, 2017.
17. Subsequent Events
Dividend Declaration
On May 8, 2017, our Board of Directors voted to declare a quarterly cash dividend of $0.15 per share of our common stock, payable on June 2, 2017 to shareholders of record on May 23, 2017.
22
ITEM 2. MANAGEMENT’S DISCUSSION AND ANALYSIS OF FINANCIAL CONDITION AND RESULTS OF OPERATIONS
Management’s Discussion and Analysis of Financial Condition and Results of Operations ("MD&A") is management’s analysis of our financial performance and of significant trends that may affect our future performance. The MD&A should be read in conjunction with our condensed consolidated financial statements and related notes included elsewhere in this Quarterly Report on Form 10-Q and in the Annual Report on Form 10-K filed with the Securities and Exchange Commission ("SEC") on February 28, 2017 (the "Annual Report on Form 10-K"). Those statements in the MD&A that are not historical in nature should be deemed forward-looking statements that are inherently uncertain. Unless the context otherwise requires, references to "Delek," "the Company," and "we," "our," or "us," and like terms refer to Delek US Holdings, Inc. and its consolidated subsidiaries.
Forward-Looking Statements
This Quarterly Report on Form 10-Q contains "forward-looking statements" within the meaning of Section 27A of the Securities Act of 1933, as amended, and Section 21E of the Securities Exchange Act of 1934, as amended (the "Exchange Act"). These forward-looking statements reflect our current estimates, expectations and projections about our future results, performance, prospects and opportunities. Forward-looking statements include, among other things, the information concerning our possible future results of operations, business and growth strategies, financing plans, expectations that regulatory developments or other matters will or will not have a material adverse effect on our business or financial condition, our competitive position and the effects of competition, the projected growth of the industry in which we operate, and the benefits and synergies to be obtained from our completed and any future acquisitions, statements of management’s goals and objectives, and other similar expressions concerning matters that are not historical facts. Words such as "may," "will," "should," "could," "would," "predicts," "potential," "continue," "expects," "anticipates," "future," "intends," "plans," "believes," "estimates," "appears," "projects" and similar expressions, as well as statements in future tense, identify forward-looking statements.
Forward-looking statements should not be read as a guarantee of future performance or results, and will not necessarily be accurate indications of the times at, or by, which such performance or results will be achieved. Forward-looking information is based on information available at the time and/or management’s good faith belief with respect to future events, and is subject to risks and uncertainties that could cause actual performance or results to differ materially from those expressed in the statements. Important factors that, individually or in the aggregate, could cause such differences include, but are not limited to:
• | volatility in our refining margins or fuel gross profit as a result of changes in the prices of crude oil, other feedstocks and refined petroleum products; |
• | our ability to execute our strategy of growth through acquisitions and the transactional risks inherent in such acquisitions; |
• | acquired assets may suffer a diminishment in fair value, which may require us to record a write-down or impairment; |
• | liabilities related to, and the effects of, the sale of the Retail Entities (as defined below); |
• | a delay in, or failure to close, the Mergers (as defined below); |
• | reliability of our operating assets; |
• | competition; |
• | changes in, or the failure to comply with, the extensive government regulations applicable to our industry segments; |
• | diminution in value of long-lived assets may result in an impairment in the carrying value of the assets on our balance sheet and a resultant loss recognized in the statement of operations; |
• | general economic and business conditions affecting the southern United States; |
• | volatility under our derivative instruments; |
• | deterioration of creditworthiness or overall financial condition of a material counterparty (or counterparties); |
• | unanticipated increases in cost or scope of, or significant delays in the completion of, our capital improvement and periodic turnaround projects; |
• | risks and uncertainties with respect to the quantities and costs of refined petroleum products supplied to our pipelines and/or held in our terminals; |
• | operating hazards, natural disasters, casualty losses and other matters beyond our control; |
23
• | increases in our debt levels or costs; |
• | changes in our ability to continue to access the credit markets; |
• | compliance, or failure to comply, with restrictive and financial covenants in our various debt agreements; |
• | the inability of our subsidiaries to freely make dividends, loans or other cash distributions to us; |
• | seasonality; |
• | acts of terrorism aimed at either our facilities or other facilities that could impair our ability to produce or transport refined products or receive feedstocks; |
• | changes in the cost or availability of transportation for feedstocks and refined products; and |
• | other factors discussed under the headings "Management’s Discussion and Analysis of Financial Condition and Results of Operations" and "Risk Factors" and in our other filings with the SEC. |
In light of these risks, uncertainties and assumptions, our actual results of operations and execution of our business strategy could differ materially from those expressed in, or implied by, the forward-looking statements, and you should not place undue reliance upon them. In addition, past financial and/or operating performance is not necessarily a reliable indicator of future performance and you should not use our historical performance to anticipate future results or period trends. We can give no assurances that any of the events anticipated by any forward-looking statements will occur or, if any of them do, what impact they will have on our results of operations and financial condition.
Forward-looking statements speak only as of the date the statements are made. We assume no obligation to update forward-looking statements to reflect actual results, changes in assumptions or changes in other factors affecting forward-looking information except to the extent required by applicable securities laws. If we do update one or more forward-looking statements, no inference should be drawn that we will make additional updates with respect thereto or with respect to other forward-looking statements.
Executive Summary and Strategic Overview
Business Overview
We are an integrated downstream energy business focused on petroleum refining and the transportation, storage and wholesale distribution of crude oil, intermediate and refined products. Prior to August 2016, we aggregated our operating units into three reportable segments: refining, logistics and retail. However, in August 2016, we entered into a definitive equity purchase agreement (the "Purchase Agreement") with COPEC. Under the terms of the Purchase Agreement, Delek agreed to sell, and COPEC agreed to purchase, 100% of the equity interests in Delek's wholly-owned subsidiaries MAPCO Express, Inc., MAPCO Fleet, Inc., Delek Transportation, LLC, NTI Investments, LLC and GDK Bearpaw, LLC (collectively, the “Retail Entities”) for cash consideration of $535 million, subject to certain customary adjustments (the “Transaction”). The Retail Transaction closed in November 2016.
Our refining segment operates refineries in Tyler, Texas (the "Tyler refinery") and El Dorado, Arkansas (the "El Dorado refinery") with a combined design crude throughput capacity of 155,000 barrels per day ("bpd"). Our logistics segment gathers, transports and stores crude oil and markets, distributes, transports and stores refined products in select regions of the southeastern United States and west Texas for our refining segment and third parties. Our refining segment also includes two biodiesel facilities we own and operate that are engaged in the production of biodiesel fuels and related activities, located in Crossett, Arkansas and Cleburn, Texas.
We own a 61.2% limited partner interest in Delek Logistics Partners, LP ("Delek Logistics") and a 94.9% interest in the entity that owns the entire 2.0% general partner interest in Delek Logistics and all of the incentive distribution rights. Delek Logistics was formed by Delek in 2012 to own, operate, acquire and construct crude oil and refined products logistics and marketing assets. Delek Logistics' initial assets were contributed by us and included certain assets formerly owned or used by certain of our subsidiaries. A substantial majority of Delek Logistics' assets are currently integral to our refining and marketing operations.
Our profitability in the refining segment is substantially determined by the difference between the cost of the crude oil feedstocks we purchase and the price of the refined products we sell, referred to as the "crack spread", "refining margin" or "refined product margin." The cost to acquire feedstocks and the price of the refined petroleum products we ultimately sell from our refineries depend on numerous factors beyond our control, including the supply of, and demand for, crude oil, gasoline and other refined petroleum products which, in turn, depend on, among other factors, changes in domestic and foreign economies, weather conditions such as hurricanes or tornadoes, local, domestic and foreign political affairs, global conflict, production levels, the availability of imports, the marketing of competitive fuels and government regulation. Other significant factors that influence our results in the refining segment include operating costs (particularly the cost of natural gas used for fuel and the cost of electricity), seasonal factors, refinery utilization rates and planned or unplanned maintenance activities or turnarounds. Moreover, while the fluctuations in the cost of crude oil are typically reflected in the prices of light refined products, such as gasoline and diesel fuel, the
24
price of other residual products, such as asphalt, coke, carbon black oil and liquefied petroleum gas ("LPG"), are less likely to move in parallel with crude cost. This could cause additional pressure on our realized margin during periods of rising or falling crude oil prices. Additionally, our margins are impacted by the pricing differentials of the various types and sources of crude oil we use at our two refineries and their relation to product pricing, such as the differentials between Midland West Texas Intermediate crude oil ("WTI") and Cushing WTI or Cushing WTI and Brent crude oil.
For our Tyler refinery, we compare our per barrel refined product margin to a well established industry metric: the U.S. Gulf Coast 5-3-2 crack spread ("Gulf Coast crack spread"). The Gulf Coast crack spread is used as a benchmark for measuring a refinery's product margins by measuring the difference between the market price of light products and crude oil. It represents the approximate gross margin resulting from processing one barrel of crude oil into three-fifths of a barrel of gasoline and two-fifths of a barrel of high-sulfur diesel. We calculate the Gulf Coast crack spread using the market value of U.S. Gulf Coast Pipeline CBOB and U.S. Gulf Coast Pipeline No. 2 Heating Oil (high sulfur diesel) and the first month futures price of WTI on the New York Mercantile Exchange ("NYMEX"). U.S. Gulf Coast CBOB is a grade of gasoline commonly blended with biofuels and marketed as Regular Unleaded at retail locations. U.S. Gulf Coast Pipeline No. 2 Heating Oil is a petroleum distillate that can be used as either a diesel fuel or a fuel oil. This is the standard by which other distillate products (such as ultra low sulfur diesel) are priced. The NYMEX is a commodities trading exchange where contracts for the future delivery of petroleum products are bought and sold.
The crude oil and product slate flexibility of the El Dorado refinery allows us to take advantage of changes in the crude oil and product markets; therefore, we anticipate that the quantities and varieties of crude oil processed and products manufactured at the El Dorado refinery will continue to vary. Thus, we do not believe that it is possible to develop a reasonable refined product margin benchmark that would accurately portray our refined product margins at the El Dorado refinery.
The cost to acquire the refined fuel products we sell to our wholesale customers in our logistics segment depends on numerous factors beyond our control, including the supply of, and demand for, crude oil, gasoline and other refined petroleum products which, in turn, depend on, among other factors, changes in domestic and foreign economies, weather conditions, domestic and foreign political affairs, production levels, the availability of imports, the marketing of competitive fuels and government regulation.
We also own a non-controlling equity interest of approximately 47% of the outstanding shares (the "ALJ Shares") in Alon USA Energy, Inc. (NYSE: ALJ) ("Alon USA"). Alon USA is an independent refiner and marketer of petroleum products, operating primarily in the south central, southwestern and western regions of the United States. Alon USA owns 100% of the general partner and 81.6% of the limited partner interests in Alon USA Partners, LP (NYSE: ALDW), which owns a crude oil refinery in Big Spring, Texas with a crude oil throughput capacity of 73,000 bpd and an integrated wholesale marketing business. In addition, Alon USA directly owns a crude oil refinery in Krotz Springs, Louisiana with a crude oil throughput capacity of 74,000 bpd. Alon USA also owns crude oil refineries in California, which have not processed crude oil since 2012. Alon USA is a marketer of asphalt, which it distributes through asphalt terminals located predominately in the southwestern and western United States. Alon USA is the largest 7-Eleven licensee in the United States and operates approximately 300 convenience stores which market motor fuels in central and west Texas and New Mexico. Our investment in Alon USA is accounted for as an equity method investment and the earnings from this equity method investment reflected in our consolidated statements of income include our share of net earnings directly attributable to this equity method investment, and amortization of the excess of our investment balance over the underlying net assets of Alon USA. In January 2017, we announced a definitive agreement under which Delek will acquire all of the outstanding shares of Alon USA common stock which Delek does not already own in an all-stock transaction. As of March 31, 2017, the market value of our ALJ Shares was $410.7 million, based on quoted market prices. There were no indicators of impairment of our investment in Alon USA as of March 31, 2017.
As part of our overall business strategy, we regularly evaluate opportunities to expand our portfolio of businesses and may at any time be discussing or negotiating a transaction that, if consummated, could have a material effect on our business, financial condition, liquidity or results of operations.
Recent Developments
Alon Merger
In January 2017, we announced that Delek, Alon USA Energy, Inc. (NYSE: ALJ) ("Alon USA"), Delek Holdco, Inc., a Delaware corporation and wholly owned subsidiary of Delek (“Holdco”), Dione Mergeco, Inc., a Delaware corporation and wholly owned subsidiary of Holdco ("Parent Merger Sub"), and Astro Mergeco, Inc., a Delaware corporation and wholly owned subsidiary of Holdco (“Astro Merger Sub” and, together with Holdco and Parent Merger Sub, the “Holdco Parties”), entered into an Agreement and Plan of Merger, as subsequently amended on February 27 and April 21, 2017, to effect certain technical amendments, (the "Merger Agreement") pursuant to which (i) Parent Merger Sub will, upon the terms and subject to the conditions thereof, merge with and into Delek (the “Parent Merger”), with Delek surviving as a wholly owned subsidiary of Holdco and (ii) Astro Merger Sub will, upon the terms and subject to the conditions thereof, merge with and into Alon USA (the “Alon Merger” and, together with the Parent Merger, the “Mergers”) with Alon USA surviving as a wholly owned subsidiary of Holdco.
25
In the Parent Merger, each issued and outstanding share of common stock of Delek, par value $0.01 per share (“Delek common stock”), or fraction thereof, will be converted into the right to receive one validly issued, fully paid and non-assessable share of Holdco common stock, par value $0.01 per share (“Holdco common stock”), or such fraction thereof equal to the fractional share of Delek common stock, upon the terms and subject to the conditions set forth in the Merger Agreement. In the Alon Merger, each issued and outstanding share of common stock of Alon, par value $0.01 per share (“Alon common stock”), other than Alon USA common stock held by Delek or any subsidiary of Delek, will be converted into the right to receive 0.504 shares of Holdco common stock, upon the terms and subject to the conditions set forth in the Merger Agreement.
Pursuant to the Merger Agreement, Delek must take all action necessary to elect as directors of Holdco the directors of Delek immediately prior to the effective time of the Parent Merger; provided, that within thirty days after the closing date, Delek and Holdco must take all action necessary to increase the size of the board of directors of Holdco by one seat and to appoint an individual to fill the resulting vacancy as designated by the special committee of the board of directors of Alon USA to fill the resulting vacancy. Additionally, pursuant to the Merger Agreement, the special committee of the board of Alon USA will nominate one new director that will be appointed to the board of the general partner of Delek Logistics.
The mergers remain subject to the approval of the stockholders of Delek and Alon USA, along with certain other closing conditions as set forth in the Merger Agreement. Concurrently with the execution of the Merger Agreement, Alon, Delek and each of David Wiessman, D.B.W. Holdings (2005) Ltd. (an entity controlled by David Wiessman), Jeff Morris, and Karen Morris entered into Voting, Irrevocable Proxy and Support Agreements (the “Voting Agreements”) in connection with the Merger Agreement. Delek, David Wiessman, D.B.W. Holdings (2005) Ltd., Jeff Morris and Karen Morris are each individually referred to herein as an “Alon Stockholder” and collectively as the “Alon Stockholders.”
The Voting Agreements generally require that the Alon Stockholders vote or cause to be voted all Alon USA common stock owned by the Alon Stockholders at the Alon USA stockholders’ meeting in favor of (1) the Mergers and the Merger Agreement and any other transactions or matters contemplated by the Merger Agreement and (2) any proposal to adjourn or postpone the Alon USA Stockholders Meeting to a later date if there are not sufficient votes to adopt the Merger Agreement or if there are not sufficient shares present in person or by proxy at such meeting to constitute a quorum. In the case of the Alon Stockholders other than Delek, the Voting Agreements also require that they vote in favor of any other matter necessary to consummate the transactions contemplated by the Merger Agreement, in each case at every meeting (or in connection with any action by written consent) of the Alon Stockholders at which such matters are considered and at every adjournment or postponement thereof, and vote against (1) any Company Acquisition Proposal (as defined in the Merger Agreement), (2) any action, proposal, transaction or agreement that could reasonably be expected to result in a breach of any covenant, representation or warranty or any other obligation or agreement of Alon USA under the Merger Agreement or of the Alon Stockholders under the Voting Agreements and (3) any action, proposal, transaction or agreement that could reasonably be expected to impede, interfere with, frustrate, delay, discourage, adversely affect or inhibit the timely consummation of the Merger or the fulfillment of conditions under the Merger Agreement or change in any manner the voting rights of any class of shares of Alon USA.
Subject to certain exceptions, the Voting Agreements prohibit certain sales, transfers, offers, exchanges, and dispositions of Alon USA common stock owned by the Alon Stockholders, the granting of any proxies or powers of attorney that is inconsistent with the Voting Agreements, and the depositing of Alon USA common stock owned by the Alon Stockholders into a voting trust or entering into a voting agreement or arrangement with respect to the voting of shares of Alon USA common stock owned by the Alon Stockholders during the term of the Voting Agreements.
El Dorado Refinery RIN Waiver
In March 2017, the El Dorado refinery received approval from the Environmental Protection Agency for a small refinery exemption from the requirements of the renewable fuel standard for the 2016 calendar year. This waiver resulted in approximately $47.5 million of RINs expense reduction, based on an aggregated average price of $0.45 per RIN.
Return to Shareholders
Dividends
On March 29, 2017, we paid a regular dividend of $0.15 per share of our common stock, declared on February 27, 2017 to shareholders of record on March 15, 2017. On May 8, 2017, our Board of Directors voted to declare a quarterly cash dividend of $0.15 per share of our common stock, payable on June 2, 2017 to shareholders of record on May 23, 2017.
26
Share Repurchase Program
In December 2016, our Board of Directors authorized a share repurchase program for up to $150.0 million of Delek common stock. Any share repurchases under the repurchase program may be implemented through open market transactions or in privately negotiated transactions, in accordance with applicable securities laws. The timing, price, and size of repurchases will be made at the discretion of management and will depend on prevailing market prices, general economic and market conditions and other considerations. The repurchase program does not obligate us to acquire any particular amount of stock and does not expire. There were no shares repurchased during the three months ended March 31, 2017.
Market Trends
Our results of operations are significantly affected by fluctuations in the prices of certain commodities, including, but not limited to, crude oil, gasoline, distillate fuel, biofuels and natural gas and electricity, among others. Historically, our profitability has been affected by commodity price volatility, specifically as it relates to the price of crude oil and refined products.
The table below reflects the quarterly high, low and average prices of Cushing WTI crude oil for each of the quarterly periods in 2016 and the three months ended March 31, 2017.
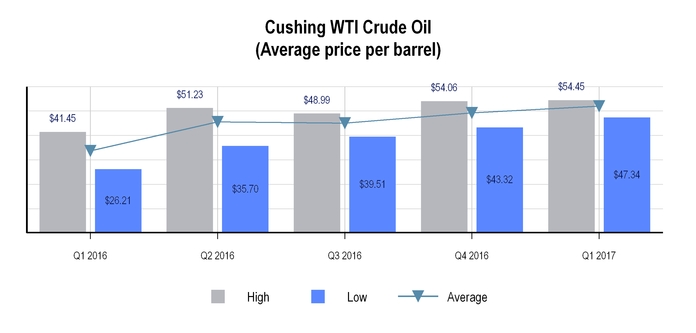
27
The table below reflects the quarterly high, low and average 5-3-2 crack spread for each of the quarterly periods in 2016 and the three months ended March 31, 2017.
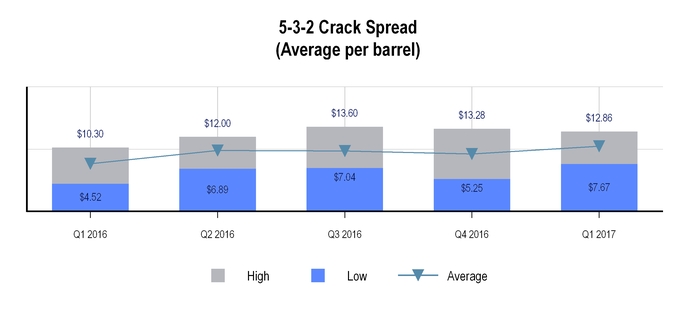
The average Gulf Coast 5-3-2 crack spread increased to $10.50 during the first three months of 2017 from $7.68 during the first three months of 2016. The wholesale price of refined products contributed to the increase in the Gulf Coast 5-3-2 crack spread in the three months ended March 31, 2017, with the U.S. Gulf Coast price of gasoline increasing 45.2%, from an average of $1.04 per gallon in the first three months of 2016 to $1.51 per gallon in the first three months of 2017 and the U.S. Gulf Coast price of High Sulfur Diesel increased 59.3%, from an average of $0.91 per gallon in the first three months of 2016 to $1.45 per gallon in the first three months of 2017. The charts below illustrate the average price of U.S. Gulf Coast Gasoline and U.S. High Sulfur Diesel for each of the quarterly periods in 2016 and the three months ended March 31, 2017.
28
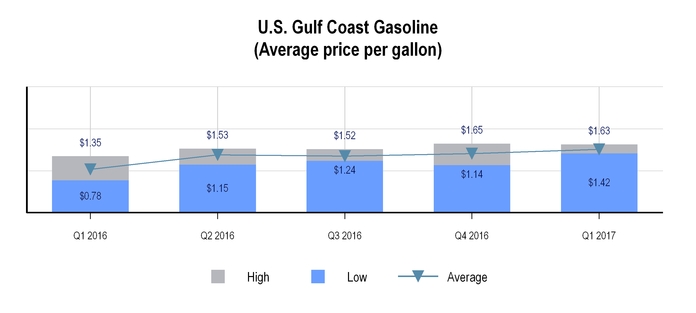
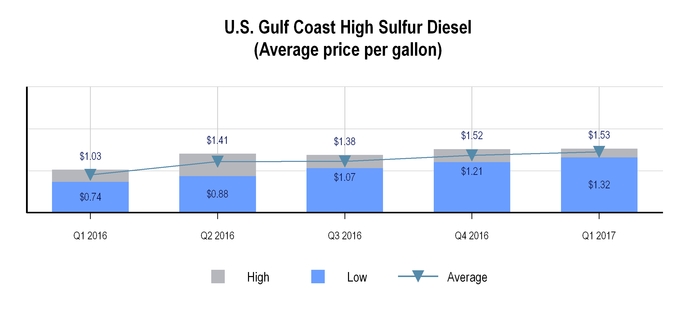
29
Our Tyler and El Dorado refineries both continue to have greater access to Midland WTI and Midland WTI-linked crude feedstocks compared to certain of our competitors. As new pipelines have increased the ability to ship price-advantaged crude oil supplies to and from the mid-continent region, we have experienced a decline in certain crude oil price differentials favorable to us. As these price differentials decrease, so does our competitive advantage created by our access to WTI-linked crude oil. The chart below illustrates the differentials of both Brent crude oil and Midland WTI crude oil as compared to Cushing WTI crude oil for each of the quarterly periods in 2016 and the three months ended March 31, 2017.
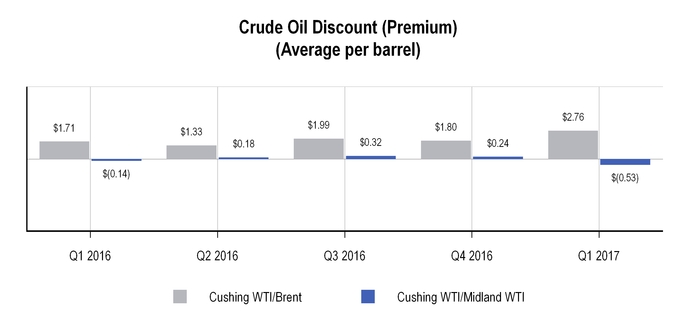
30
Environmental regulations continue to affect our margins in the form of the increasing cost of RINs. On a consolidated basis, we work to balance our RINs obligations in order to minimize the effect of RINs on our results. While we generate RINs in both of our operating segments through our ethanol blending and biodiesel production, our refining segment needs to purchase additional RINs to satisfy its obligations. As a result, increases in the price of RINs generally adversely affect our results of operations. It is not possible at this time to predict with certainty what future volumes or costs may be, but given the increase in required volumes and the volatile price of RINs, the cost of purchasing sufficient RINs could have an adverse impact on our results of operations if we are unable to recover those costs in the price of our refined products. The chart below illustrates the volatile nature of the price for RINs for each of the quarterly periods in 2016 and the three months ended March 31, 2017.
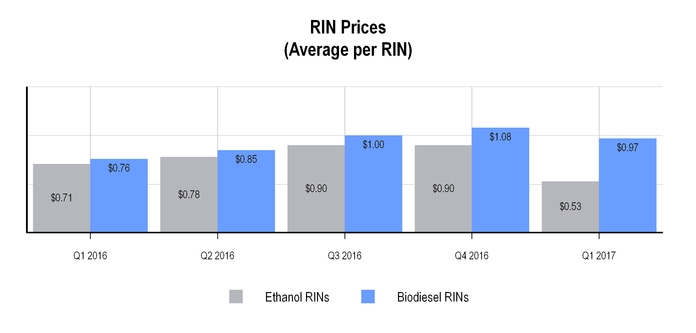
Seasonality
Demand for gasoline and asphalt products is generally lower during the winter months due to seasonal decreases in motor vehicle traffic and road and home construction. Additionally, varying vapor pressure requirements between the summer and winter months tighten summer gasoline supply. As a result, our operating results are generally lower during the first and fourth quarters of the year.
Contractual Obligations
There have been no material changes to our contractual obligations and commercial commitments during the three months ended March 31, 2017, from those disclosed in our Annual Report on Form 10-K.
Critical Accounting Policies
The preparation of our consolidated financial statements requires us to make estimates and judgments that affect the reported amounts of assets, liabilities, revenues and expenses and related disclosure of contingent assets and liabilities. The SEC has defined critical accounting policies as those that are both most important to the portrayal of our financial condition and results of operations and require our most difficult, complex or subjective judgments or estimates. Based on this definition and as further described in our Annual Report on Form 10-K, we believe our critical accounting policies include the following: (i) determining our inventory using the last-in, first-out valuation method, (ii) evaluating impairment for property, plant and equipment and definite life intangibles, (iii) valuing goodwill and evaluating potential impairment, and (iv) estimating environmental expenditures. For all financial statement periods presented, there have been no material modifications to the application of these critical accounting policies or estimates since our most recently filed Annual Report on Form 10-K.
31
Summary Financial and Other Information
The following table provides summary financial data for Delek (in millions, except share and per share data):
Three Months Ended | ||||||||
Statement of Operations Data | March 31, | |||||||
2017 | 2016 | |||||||
Net sales: | ||||||||
Refining | $ | 1,099.5 | $ | 827.3 | ||||
Logistics | 129.5 | 104.1 | ||||||
Other | (46.8 | ) | (45.3 | ) | ||||
Net sales | $ | 1,182.2 | $ | 886.1 | ||||
Operating costs and expenses: | ||||||||
Cost of goods sold | 1,035.7 | 815.8 | ||||||
Operating expenses | 61.2 | 69.0 | ||||||
Insurance proceeds — business interruption | — | (42.4 | ) | |||||
General and administrative expenses | 26.5 | 29.0 | ||||||
Depreciation and amortization | 29.0 | 28.3 | ||||||
Total operating costs and expenses | 1,152.4 | 899.7 | ||||||
Operating income (loss) | 29.8 | (13.6 | ) | |||||
Interest expense | 13.6 | 13.2 | ||||||
Interest income | (1.0 | ) | (0.3 | ) | ||||
(Income) loss from equity method investments | (3.1 | ) | 18.0 | |||||
Other (income) expense, net | — | 0.6 | ||||||
Total non-operating expenses (income), net | 9.5 | 31.5 | ||||||
Income (loss) from continuing operations before income tax expense (benefit) | 20.3 | (45.1 | ) | |||||
Income tax expense (benefit) | 5.0 | (23.6 | ) | |||||
Income (loss) from continuing operations | 15.3 | (21.5 | ) | |||||
Loss from discontinued operations, net of tax | — | (2.4 | ) | |||||
Net income (loss) | 15.3 | (23.9 | ) | |||||
Net income attributed to non-controlling interest | 4.1 | 5.3 | ||||||
Net income (loss) attributable to Delek | $ | 11.2 | $ | (29.2 | ) | |||
Basic earnings per share: | ||||||||
Income (loss) from continuing operations | $ | 0.18 | $ | (0.43 | ) | |||
Loss from discontinued operations | — | (0.04 | ) | |||||
Total basic earnings (loss) per share | $ | 0.18 | $ | (0.47 | ) | |||
Diluted earnings per share: | ||||||||
Income (loss) from continuing operations | $ | 0.18 | $ | (0.43 | ) | |||
Loss from discontinued operations | — | (0.04 | ) | |||||
Total diluted earnings (loss) per share | $ | 0.18 | $ | (0.47 | ) | |||
32
Results of Operations
Consolidated Results of Operations — Comparison of the Three Months Ended March 31, 2017 versus the Three Months Ended March 31, 2016
Net Income (Loss)
Consolidated net income for the first quarter of 2017 was $11.2 million, or $0.18 per diluted share, compared to net loss of $29.2 million, or $0.47 per basic share, for the first quarter of 2016.
Net Sales
In the first quarters of 2017 and 2016, we generated net sales of $1,182.2 million and $886.1 million, respectively, an increase of $296.1 million, or 33.4%. The increase in net sales was primarily due to the effects of increases in the price of finished petroleum products in both of our segments in the first quarter of 2017 compared to the same period in 2016, partially offset by a decline in sales volumes at the Tyler refinery, primarily resulting from sixteen days of scheduled downtime for capital improvements in the first quarter of 2017.
Cost of Goods Sold
Cost of goods sold was $1,035.7 million for the first quarter of 2017 compared to $815.8 million for the first quarter of 2016, an increase of $219.9 million, or 27.0%. The increase in cost of goods sold primarily resulted from the increase in the cost of both crude oil feedstocks in the refining segment and refined products in the logistics segment, partially offset by the $47.5 million reduction in RINs expense associated with the RINs waiver received by the El Dorado refinery in the first quarter of 2017.
Operating Expenses
Operating expenses were $61.2 million for the first quarter of 2017 compared to $69.0 million for the first quarter of 2016, a decrease of $7.8 million, or 11.3%. The decrease in operating expenses was primarily due to refining segment decreases in workers compensation expense and the absence of outside services related to tank cleaning and oil spill remediation that occurred in the first quarter of 2016.
General and Administrative Expenses
General and administrative expenses were $26.5 million and $29.0 million for the first quarter of 2017 and 2016, respectively, a decrease of $2.5 million, or 8.6%. The decrease in general and administrative expenses was primarily due to a reduction in professional consulting expenses associated with various marketing and procurement projects in the first quarter of 2016. We do not allocate general and administrative expenses to our operating segments.
Depreciation and Amortization
Depreciation and amortization was $29.0 million for the first quarter of 2017 compared to $28.3 million for the first quarter of 2016, an increase of $0.7 million, or 2.5%. The increase in
depreciation expense was primarily attributable to capital expenditures and acquisitions completed in 2016.
Interest Expense
Interest expense was $13.6 million for the first quarter of 2017 compared to $13.2 million for the first quarter of 2016, an increase of $0.4 million, or 3.0%. The increase was primarily attributable to increases in interest costs under our credit facilities due to changes in debt utilization and interest rates thereunder, compared to the same period in 2016.
Results from Equity Method Investments
During the first quarter of 2017, we recognized income from equity method investments of $3.1 million, compared to a loss of $18.0 million for the first quarter of 2016. Results from equity method investments for the first quarters of 2017 and 2016 were primarily attributable to our proportionate share of the net income (loss) from our investment in Alon USA of $3.5 million and $(17.1) million, respectively, and $(0.7) million in amortization of the excess of our investment over our equity in the underlying net assets of Alon USA during each of the first quarters of 2017 and 2016.
Income Taxes
Under ASC 740, Income Taxes (“ASC 740”), companies are required to apply an estimated annual tax rate to interim period results on a year-to-date basis; however, the estimated annual tax rate should not be applied to interim financial results if a reliable estimate cannot be made. In this situation, the interim tax rate should be based on actual year-to-date results. Based on our current projections, which have fluctuated as a result of changes in crude oil prices and the related crack spreads, we believe that using actual year-to-date results to compute our effective tax rate will produce a more reliable estimate of our tax expense or benefit. As such, we recorded a tax provision for the three months ended March 31, 2017 and 2016 based on actual year-to-date results, in accordance with ASC 740.
Income tax expense was $5.0 million for the first quarter of 2017, compared to benefit of $23.6 million for the first quarter of 2016, a decrease in benefit of $28.6 million. The decrease in benefit was primarily attributable to a pre-tax income of $20.3 million in the first quarter of 2017, as compared to pre-tax loss of $45.1 million for the first quarter of 2016. Our effective tax rate was 24.6% for the first quarter of 2017, compared to 52.3% for the first quarter of 2016. The decrease in our effective tax rate in the three months ended March 31, 2017 was primarily due to the expiration of provisions for certain tax credits and incentives that expired as of December 31, 2016 and have not been extended by Congress, as well as the impact of pre-tax income in the three months ended March 31, 2017, compared to a pre-tax loss in the three months ended March 31, 2016.
33
Operating Segments
We report operating results in two reportable segments: refining and logistics. Decisions concerning the allocation of resources and assessment of operating performance are made based on this segmentation. Management measures the operating performance of each of its reportable segments based on the segment contribution margin.
Refining Segment
The tables and charts below set forth certain information concerning our refining segment operations ($ in millions, except per barrel amounts):
Three Months Ended March 31, | ||||||||
2017 | 2016 | |||||||
Net sales | $ | 1,099.5 | $ | 827.3 | ||||
Cost of goods sold | 984.3 | 787.9 | ||||||
Gross margin | 115.2 | 39.4 | ||||||
Operating expenses | 50.8 | 58.3 | ||||||
Insurance proceeds — business interruption | — | (42.4 | ) | |||||
Contribution margin | $ | 64.4 | $ | 23.5 | ||||
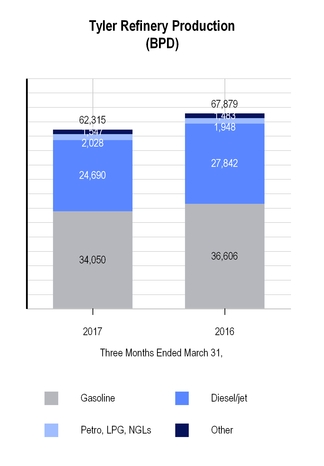
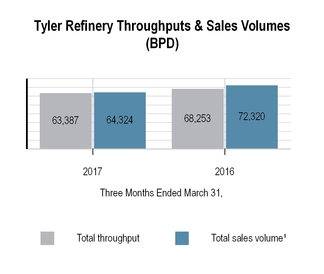 _____________________________
1 | Total sales volume includes 943 bpd and 1,446 bpd sold to the logistics segment during the three months ended March 31, 2017 and 2016, respectively. Total sales volume also includes sales of 8 bpd and 292 bpd of intermediate and finished products to the El Dorado refinery during the three months ended March 31, 2017 and 2016, respectively. Total sales volume excludes 6,430 bpd of wholesale activity during the three months ended March 31, 2017. There were no wholesale activities during the three months ended March 31, 2016 . |
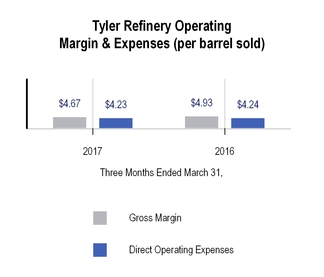
34
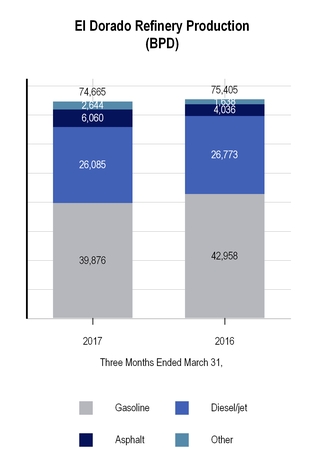
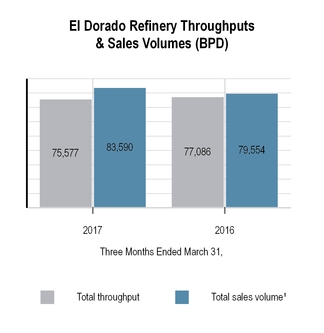
_____________________________
1 | Total sales volume includes 1,052 bpd of produced finished product sold to the Tyler refinery during the three months ended March 31, 2017. There were no produced finished products sold to the Tyler refinery during the three months ended March 31, 2016. Total sales volume excludes 16,615 bpd and |
24,719 bpd of wholesale activity during the three months ended March 31, 2017 and 2016, respectively.
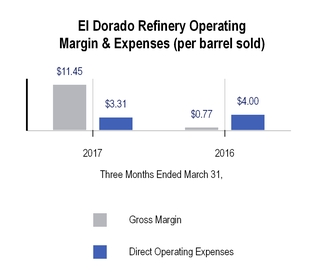
Refining Segment Operational Comparison of the Three Months Ended March 31, 2017 versus the Three Months Ended March 31, 2016
Net Sales
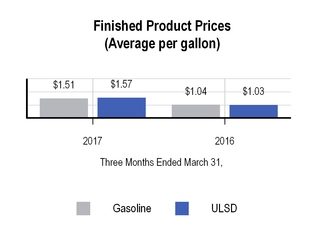
Net sales for the refining segment were $1,099.5 million for the first quarter of 2017 compared to $827.3 million for the first quarter of 2016, an increase of $272.2 million, or 32.9%. The increase in net sales primarily resulted from increases in the price of U.S. Gulf Coast gasoline and Ultra-Low-Sulfur diesel ("ULSD") in the first quarter of 2017 as compared to the first quarter of 2016, partially offset by a decline in sales volumes at the Tyler refinery, primarily resulting from sixteen days of scheduled downtime for capital improvements in the first quarter of 2017.
35
Cost of Goods Sold
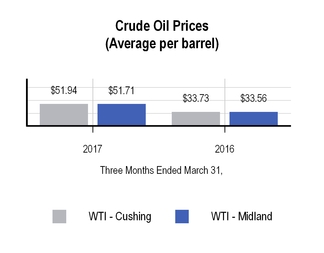
Cost of goods sold for the first quarter of 2017 for the refining segment was $984.3 million compared to $787.9 million for the first quarter of 2016, an increase of $196.4 million, or 24.9%. This increase was primarily attributable to an increase in the cost of WTI crude oil, from an average of $33.73 per barrel in the first quarter of 2016 to an average of $51.94 in the first quarter of 2017, partially offset by a decrease in sales volumes at the Tyler refinery, resulting from sixteen days of scheduled downtime for capital improvements in the first quarter of 2017. The increase in cost of goods sold was partially offset by the $47.5 million reduction in RINs expense associated with the RINs waiver received by the El Dorado refinery in the first quarter of 2017.
Our refining segment has multiple service agreements with our logistics segment which, among other things, require the refining segment to pay terminalling and storage fees based on the throughput volume of crude and finished product in the logistics segment pipelines and the volume of crude and finished product stored in the logistics segment storage tanks. These fees were $31.2 million and $31.0 million during the first quarters of 2017 and 2016, respectively. We eliminate these intercompany fees in consolidation.
Operating Expenses
Operating expenses for the refining segment were $50.8 million for the first quarter of 2017 compared to $58.3 million for the first quarter of 2016, a decrease of $7.5 million, or 12.9%. The decrease in operating expenses was primarily due to a decrease in workers compensation expense and the absence of outside services related to tank cleaning and oil spill remediation that occurred in the first
quarter of 2016.
Contribution Margin
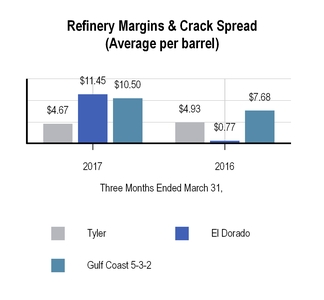
Contribution margin for the refining segment increased to $64.4 million, or 75.5% of our consolidated segment contribution margin, in the first quarter of 2017, compared to $23.5 million, or 53.8% of our consolidated segment contribution margin, in the first quarter of 2016. The refining segment contribution margin increase was primarily attributable to an increase in gross margin at the El Dorado refinery and a decline in operating expenses at both refineries. The gross margin at the El Dorado refinery was positively impacted by the $47.5 million, or $6.31 per barrel sold, reduction in RINs expense associated with the RINs waiver received by the El Dorado refinery in the first quarter of 2017. This increase was partially offset by business interruption insurance proceeds of $42.4 million in the first quarter of 2016, associated with a settlement of litigation.
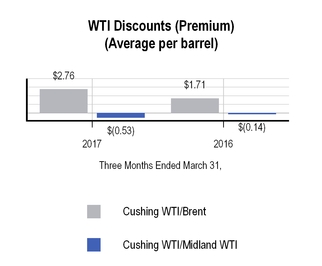
36
Margins at both refineries were positively impacted by a 36.7% increase in the average Gulf Coast 5-3-2 crack spread in the first quarter of 2017, as compared to the first quarter of 2016. This increase was partially offset by a contango futures market which lowered crude purchase prices by $1.00 per barrel in the first quarter of 2017, compared to $1.80 per barrel in the first quarter of 2016 and by an increase in the premium between WTI Midland crude oil and WTI Cushing crude oil to $0.53 in the first quarter of 2017 compared to a premium of $0.14 in the first quarter of 2016.
37
Logistics Segment
The table below sets forth certain information concerning our logistics segment operations ($ in millions, except per barrel amounts):
Three Months Ended March 31, | ||||||||
2017 | 2016 | |||||||
Logistics Segment Contribution: | ||||||||
Net sales | $ | 129.5 | $ | 104.1 | ||||
Cost of goods sold | 92.6 | 66.8 | ||||||
Gross margin | 36.9 | 37.3 | ||||||
Operating expenses | 10.3 | 10.5 | ||||||
Contribution margin | $ | 26.6 | $ | 26.8 | ||||
Operating Information: | ||||||||
East Texas - Tyler Refinery sales volumes (average bpd) (1) | 63,396 | 66,414 | ||||||
West Texas wholesale marketing throughputs (average bpd) | 14,467 | 14,370 | ||||||
West Texas wholesale marketing margin per barrel | $ | 2.72 | $ | 0.53 | ||||
Terminalling throughputs (average bpd) (2) | 114,900 | 118,218 | ||||||
Throughputs (average bpd) | ||||||||
Lion Pipeline System: | ||||||||
Crude pipelines (non-gathered) | 58,744 | 56,342 | ||||||
Refined products pipelines to Enterprise Systems | 51,355 | 53,779 | ||||||
SALA Gathering System | 16,531 | 19,001 | ||||||
East Texas Crude Logistics System | 16,176 | 9,346 | ||||||
El Dorado Rail Offloading Rack | — | — | ||||||
_____________________________
(1) | Excludes jet fuel and petroleum coke. |
(2) | Consists of terminalling throughputs at our Tyler, Big Sandy and Mount Pleasant, Texas, El Dorado and North Little Rock, Arkansas, and Memphis and Nashville, Tennessee terminals. |
Logistics Segment Operational Comparison of the Three Months Ended March 31, 2017 versus the Three Months Ended March 31, 2016
Net Sales
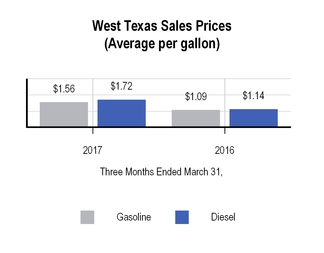
Net sales for the logistics segment were $129.5 million in the first quarter of 2017, compared to $104.1 million for the first quarter of 2016, an increase of $25.4 million, or 24.4%. The increase was primarily attributable to increases in the average sales prices per gallon of gasoline and diesel in our west Texas marketing operations. The average sales prices per gallon of gasoline and diesel sold increased $0.47 per gallon and $0.58 per gallon, respectively, during the first quarter of 2017 compared to the first quarter of 2016. Partially offsetting the increase was a decline in fees on our Paline Pipeline System. During the first quarter of 2017, the Paline Pipeline System was a FERC regulated pipeline with a tariff established for potential shippers, compared to the first quarter of 2016, when the pipeline capacity was under contract with two third-parties for a monthly fee.
Net sales included $4.3 million and $3.9 million of net service fees paid by our refining segment to our logistics segment during the first quarter of 2017 and 2016, respectively. These service fees are based on the number of gallons sold and a shared portion of the margin achieved in return for providing sales and customer support services. Net sales also included crude and refined product transportation, terminalling and storage fees paid by our refining segment to our logistics segment. These fees were $31.2 million and $31.0 million in the first quarter of 2017 and 2016, respectively. The logistics segment also sold $1.1 million and $1.5 million of RINs to the refining segment in the first quarter of 2017 and 2016, respectively. These intercompany sales and fees are eliminated in consolidation.
38
Cost of Goods Sold
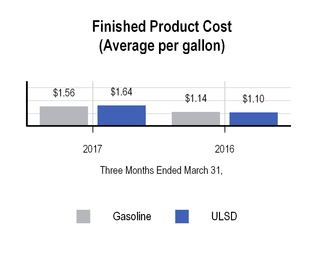
Cost of goods sold for the logistics segment increased $25.8 million, or 38.6%, to $92.6 million in the first quarter of 2017, compared to $66.8 million in the first quarter of 2016. The increase in cost of goods sold was primarily attributable to increases in the average cost per gallon of gasoline and diesel purchased in our west Texas marketing operations. The average cost per gallon of gasoline and diesel purchased increased by $0.42 per gallon and $0.54 per gallon, respectively, during the first quarter of 2017 compared to the first quarter of 2016.
Operating Expenses
Operating expenses for the logistics segment were approximately $10.3 million and $10.5 million for the first quarter of 2017 and 2016, respectively, a decrease of $0.2 million, or 1.9%. The decrease in operating expenses in the first quarter of 2017 compared to the first quarter of 2016 was primarily due to a reduction in operating expenses for one of our terminal locations at which we incurred costs related to internal tank contamination during the first quarter of 2016. Also contributing to the decrease in operating expenses were decreases in maintenance costs at our Memphis Terminal during the first quarter of 2017 compared to the first quarter of 2016. Partially offsetting the decreases were increases in maintenance costs associated with our tanks in the first quarter of 2017 compared to the first quarter of 2016.
Contribution Margin
Contribution margin for the logistics segment decreased to $26.6 million, or 31.2% of our consolidated segment contribution margin, in the first quarter of 2017, compared to $26.8 million, or 61.3% of our consolidated segment contribution margin, in the first quarter of 2016. The decrease in contribution margin was primarily attributable to a decline in fees on our Paline Pipeline System as described above. This decrease was partially offset by improved contribution margin in our west Texas operations as a result of increased drilling activity in the region, which has improved market conditions and increased demand. Further offsetting the decreases were increases in contribution margin at our terminals as a result of volume increases at our Nashville and El Dorado
Terminals and a reduction in operating expenses at our Memphis Terminal during the first quarter of 2017 compared to the first quarter of 2016.
Liquidity and Capital Resources
Our primary sources of liquidity are cash generated from our operating activities and borrowings under our credit facilities. We believe that our cash flows from operations and borrowings under our current or new debt agreements will be sufficient to satisfy the anticipated cash requirements associated with our existing operations and capital expenditures for at least the next 12 months.
Cash Flows
The following table sets forth a summary of our consolidated cash flows for the three months ended March 31, 2017 and 2016 (in millions):
Three Months Ended March 31, | ||||||||
2017 | 2016 | |||||||
Cash Flow Data: | ||||||||
Operating activities | $ | (42.1 | ) | $ | 71.9 | |||
Investing activities | (20.7 | ) | (34.2 | ) | ||||
Financing activities | (35.0 | ) | 10.0 | |||||
Net (decrease) increase | $ | (97.8 | ) | $ | 47.7 | |||
Cash Flows from Operating Activities
Net cash used in operating activities was $42.1 million for the three months ended March 31, 2017, compared to cash provided of $71.9 million for the comparable period of 2016. The decrease in cash flows from operations was primarily due to an increase in accounts receivable and inventory and other current assets due to an increase in line space inventory purchases in the refining segment and an increase in sales in the logistics segment in the first three months of 2017, as compared to the first quarter of 2016. Further contributing to the decrease was a decrease in accrued expenses and other current liabilities in the first quarter of 2017, as compared to the first quarter of 2016. Offsetting the decrease was the net income for the three months ended March 31, 2017 of $15.3 million, compared to net loss of $23.9 million in the same period of 2016. The net loss for the three months ended March 31, 2016 included $42.4 million of business interruption proceeds associated with a litigation settlement. The total litigation settlement received was approximately $49.0 million, of which a total of $6.8 million was recognized as a reduction in general and administrative expenses in the fourth quarter of 2015 and the first quarter of 2016, related to legal expenses incurred as part of the litigation.
39
Cash Flows from Investing Activities
Net cash used in investing activities was $20.7 million for the first three months of 2017, compared to $34.2 million in the comparable period of 2016. The decrease in cash used in investing activities was primarily due to decreased equity method investment contributions in the first quarter of 2017, as compared the first quarter of 2016, partially offset by an increase in our capital expenditures in the three months ended March 31, 2017, as compared to the same period in 2016.
Cash used in investing activities includes the cash portion of our capital expenditures, which was $19.0 million and $12.6 million for the three months ended March 31, 2017 and 2016, respectively.
Cash Flows from Financing Activities
Net cash used in financing activities was $35.0 million for the three months ended March 31, 2017, compared to cash provided of $10.0 million in the comparable 2016 period. The decrease in net cash from financing activities was primarily due to net repayments under our term loans of $37.7 million during the three months ended March 31, 2017, compared to net repayments of $12.7 million in the comparable 2016 period and $6.0 million of repayments of product financing agreements in the three months ended March 31, 2017, compared to proceeds of $42.5 million in the three months ended March 31, 2016. These decreases were partially offset by net borrowings under our revolving credit facilities of $29.4 million in the three months ended March 31, 2017, compared to $6.3 million in the comparable period of 2016.
Cash Position and Indebtedness
As of March 31, 2017, our total cash and cash equivalents were $591.4 million and we had total indebtedness of approximately $824.9 million. Total unused credit commitments or borrowing base availability, as applicable, under our three separate revolving credit facilities was approximately $456.3 million and we had letters of credit issued of approximately $101.8 million. We believe we were in compliance with our covenants in all debt facilities as of March 31, 2017. See Note 7 of the condensed consolidated financial statements in Item 1, Financial Statements, for additional information about our three separate revolving credit facilities.
Capital Spending
A key component of our long-term strategy is our capital expenditure program. Our capital expenditures for the three months ended March 31, 2017 were $15.2 million, of which approximately $10.8 million was spent in our refining segment, $2.8 million in our logistics segment and $1.6 million at the holding company level. The following table summarizes our actual capital expenditures for the three months ended March 31, 2017 and planned capital expenditures for the full year 2017 by operating segment and major category (in millions):
Full Year 2017 Forecast | Three Months Ended March 31, 2017 | |||||||
Refining: | ||||||||
Sustaining maintenance, including turnaround activities | $ | 43.3 | $ | 9.3 | ||||
Regulatory | 12.3 | 0.1 | ||||||
Discretionary projects | 9.5 | 1.4 | ||||||
Refining segment total | 65.1 | 10.8 | ||||||
Logistics: | ||||||||
Regulatory | 5.3 | 0.1 | ||||||
Sustaining maintenance | 9.8 | 1.8 | ||||||
Discretionary projects | 3.2 | 0.9 | ||||||
Logistics segment total | 18.3 | 2.8 | ||||||
Other: | ||||||||
Growth/profit improvements | 5.8 | 1.6 | ||||||
Other total | 5.8 | 1.6 | ||||||
Total capital spending | $ | 89.2 | $ | 15.2 | ||||
The amount of our capital expenditure budget is subject to change due to unanticipated increases in the cost, scope and completion time for our capital projects. For example, we may experience increases in the cost of and/or timing to obtain necessary equipment required for our continued compliance with government regulations or to complete improvement projects or scheduled maintenance activities. Additionally, the scope and cost of employee or contractor labor expense related to installation of that equipment could exceed our projections. Our capital expenditure budget may also be revised as management continues to evaluate projects for reliability or profitability.
Off-Balance Sheet Arrangements
We have no off-balance sheet arrangements through the date of the filing of this Quarterly Report on Form 10-Q.
40
ITEM 3. QUANTITATIVE AND QUALITATIVE DISCLOSURES ABOUT MARKET RISK
These disclosures should be read in conjunction with the condensed consolidated financial statements, "Management's Discussion and Analysis of Financial Condition and Results of Operations," and other information presented herein as well as in the "Quantitative and Qualitative Disclosures About Market Risk" section contained in our Annual Report on Form 10-K.
Price Risk Management Activities. At times, we enter into commodity derivative contracts to manage our price exposure to our inventory positions, future purchases of crude oil and ethanol, future sales of refined products or to fix margins on future production. We also enter into future commitments to purchase or sell RINs at fixed prices and quantities, which are used to manage the costs associated with our RINs obligations. These future RIN commitments meet the definition of derivative instruments under ASC 815, Derivatives and Hedging ("ASC 815"). In accordance with ASC 815, all of these commodity contracts and future purchase commitments are recorded at fair value, and any change in fair value between periods has historically been recorded in the profit and loss section of our condensed consolidated financial statements. Occasionally, at inception, the company will elect to designate the commodity derivative contracts as cash flow hedges under ASC 815. Gains or losses on commodity derivative contracts accounted for as cash flow hedges are recognized in other comprehensive income on the condensed consolidated balance sheets and ultimately, when the forecasted transactions are completed in net sales or cost of goods sold in the condensed consolidated statements of income.
The following table sets forth information relating to our open commodity derivative contracts as of March 31, 2017 ($ in millions).
Total Outstanding | Notional Contract Volume by Year of Maturity | |||||||||||||||
Contract Description | Fair Value | Notional Contract Volume | 2017 | 2018 | 2019 | |||||||||||
Contracts not designated as hedging instruments: | ||||||||||||||||
Crude oil price swaps - long(1) | $ | 0.9 | 1,660,000 | 1,000,000 | 660,000 | — | ||||||||||
Crude oil price swaps - short(1) | (4.3 | ) | 1,860,000 | 1,200,000 | 660,000 | — | ||||||||||
Inventory, refined product and crack spread swaps - long(1) | 6.0 | 7,464,000 | 7,464,000 | — | — | |||||||||||
Inventory, refined product and crack spread swaps - short(1) | (8.1 | ) | 11,067,000 | 10,497,000 | 570,000 | — | ||||||||||
RIN commitment contracts - long(2) | (3.3 | ) | 116,370,000 | 116,370,000 | — | — | ||||||||||
RIN commitment contracts - short(2) | (0.1 | ) | 136,300,299 | 136,300,299 | — | — | ||||||||||
Total | $ | (8.9 | ) | 274,721,299 | 272,831,299 | 1,890,000 | — | |||||||||
Contracts designated as cash flow hedging instruments: | ||||||||||||||||
Crude oil price swaps - long(1) | $ | (37.0 | ) | 1,600,000 | 450,000 | 1,150,000 | — | |||||||||
Total | $ | (36.5 | ) | 1,968,000 | 818,000 | 1,150,000 | — | |||||||||
(1)Volume in barrels
(2)Volume in RINs
ITEM 4. CONTROLS AND PROCEDURES
(a) Evaluation of Disclosure Controls and Procedures
Our management has evaluated, with the participation of our principal executive and principal financial officers, the effectiveness of our disclosure controls and procedures (as defined in Rule 13a-15(e) or Rule 15d-15(e) under the Exchange Act) as of the end of the period covered by this report, and has, based on this evaluation, concluded that our disclosure controls and procedures are effective to provide reasonable assurance that information required to be disclosed by us in the reports that we file or submit under the Exchange Act is recorded, processed, summarized and reported within the time periods specified in the SEC's rules and forms including, without limitation, controls and procedures designed to ensure that information required to be disclosed by us in the reports that we file or submit under the Exchange Act is accumulated
41
and communicated to our management, including our principal executive and principal financial officers, as appropriate to allow timely decisions regarding required disclosures.
(b) Changes in Internal Control over Financial Reporting
There has been no change in our internal control over financial reporting (as defined in Rule 13a-15(f) and 15d-15(f) under the Exchange Act) that occurred during our last fiscal quarter that has materially affected, or is reasonably likely to materially affect, our internal control over financial reporting.
42
PART II.
OTHER INFORMATION
ITEM 1A. RISK FACTORS
There have been no material changes in the risk factors previously disclosed in "Item 1A. Risk Factors" of our Annual Report on Form 10-K.
ITEM 5. OTHER INFORMATION
Submission of Matters to a Vote of Security Holders
The following information relates to matters submitted to the stockholders of Delek US Holdings, Inc. at the Annual Meeting of stockholders held on May 8, 2017.
At the meeting, the following directors were elected by the vote indicated:
Ezra Uzi Yemin | |||
Votes cast in favor: | 43,826,242 | ||
Votes withheld: | 2,734,179 | ||
Broker non-votes: | 3,763,226 | ||
William J. Finnerty | |||
Votes cast in favor: | 46,242,389 | ||
Votes withheld: | 318,032 | ||
Broker non-votes: | 3,763,226 | ||
Carlos E. Jordá | |||
Votes cast in favor: | 46,230,234 | ||
Votes withheld: | 330,187 | ||
Broker non-votes: | 3,763,226 | ||
Charles H. Leonard | |||
Votes cast in favor: | 44,525,962 | ||
Votes withheld: | 2,034,459 | ||
Broker non-votes: | 3,763,226 | ||
Gary M. Sullivan, Jr. | |||
Votes cast in favor: | 46,248,120 | ||
Votes withheld: | 312,301 | ||
Broker non-votes: | 3,763,226 | ||
Shlomo Zohar | |||
Votes cast in favor: | 43,591,975 | ||
Votes withheld: | 2,968,446 | ||
Broker non-votes: | 3,763,226 | ||
The proposal to adopt the advisory resolution approving the Corporation’s executive compensation program for the Corporation’s named executive officers was approved by the vote indicated:
Votes cast in favor: | 45,666,251 | ||
Votes against: | 870,485 | ||
Abstentions: | 23,685 | ||
Broker non-votes: | 3,763,226 | ||
43
The proposal to select, on an advisory basis, the frequency of advisory votes on the Corporation’s executive compensation program for the Corporation’s named executive officers:
Every 1 year: | 39,032,406 | ||
Every 2 years: | 16,447 | ||
Every 3 years: | 7,479,873 | ||
Abstentions: | 31,695 | ||
Broker non-votes: | 3,763,226 | ||
In light of the voting results with respect to the frequency of the advisory vote on executive compensation as set forth above, on May 8, 2017, the Board of Directors of the Company adopted a resolution providing that an advisory vote on executive compensation would be held every year until the next required advisory vote on the frequency of such votes.
The proposal to ratify Ernst & Young LLP as our independent registered public accounting firm for the 2017 fiscal year was approved by the vote indicated:
Votes cast in favor: | 50,132,488 | ||
Votes against: | 179,952 | ||
Abstentions: | 11,207 | ||
Broker non-votes: | — | ||
Dividend Declaration
On May 8, 2017, our Board of Directors voted to declare a quarterly cash dividend of $0.15 per share of our common stock, payable on June 2, 2017 to shareholders of record on May 23, 2017.
44
ITEM 6. EXHIBITS
Exhibit No. | Description | |||
2.1 | ^ | Agreement and Plan of Merger dated as of January 2, 2017, among Delek US Holdings, Inc., Delek Holdco, Inc., Dione Mergeco, Inc., Astro Mergeco, Inc. and Alon USA Energy, Inc. (incorporated by reference to Exhibit 2.1 to the Company's Form 8-K filed on January 3, 2017). | ||
2.2 | First Amendment to Agreement and Plan of Merger dated as of February 27, 2017, among Delek US Holdings, Inc. Delek Holdco, Inc., Dion Mergco, Inc, Astro Mergco, Inc. and Alon USA Energy, Inc. (incorporated by reference to Exhibit 2.6 to the Company's Form 10-K filed on February 28, 2017). | |||
2.3 | § | Second Amendment to Agreement and Plan of Merger dated as of April 21, 2017, among Delek US Holdings, Inc. Delek Holdco, Inc., Dion Mergco, Inc, Astro Mergco, Inc. and Alon USA Energy, Inc. | ||
10.1 | ठ| Second Amended and Restated Master Supply and Offtake Agreement, dated February 27, 2017, by and among J. Aron & Company, Lion Oil Company, and Lion Oil Trading & Transportation, LLC. | ||
10.2 | Voting, Irrevocable Proxy and Support Agreement dated as of January 2, 2017, by and between Delek US Holdings, Inc. and Alon USA Energy, Inc. (incorporated by reference to Exhibit 10.1 to the Company's Form 8-K filed on January 3, 2017). | |||
10.3 | Voting, Irrevocable Proxy and Support Agreement dated as of January 2, 2017, by and between Delek US Holdings, Inc., David Wiessman and D.B.W. Holdings (2005) Ltd. (incorporated by reference to Exhibit 10.2 to the Company's Form 8-K filed on January 3, 2017). | |||
10.4 | Voting, Irrevocable Proxy and Support Agreement dated as of January 2, 2017, by and between Delek US Holdings, Inc., Jeff Morris and Karen Morris (incorporated by reference to Exhibit 10.3 to the Company's Form 8-K filed on January 3, 2017). | |||
10.5 | * | Executive Employment Agreement, effective April 1, 2017, by and between Delek US Holdings, Inc. and Kevin Kremke (incorporated by reference to Exhibit 10.1 to the Company's Form 8-K filed on January 31, 2017). | ||
10.6 | * | Employment Agreement, effective November 1, 2016, between Delek US Holdings, Inc. and Avigal Soreq (incorporated by reference to Exhibit 10.39 to the Company's Form 10-K filed on February 28, 2017). | ||
10.7 | *§ | Employment Agreement, effective May 8, 2013, between Delek US Holdings, Inc. and Ernest C. Cagle. | ||
10.8 | *§ | Employment Agreement, effective May 1, 2014, between Delek US Holdings, Inc. and Mark T. Page. | ||
31.1 | § | Certification of the Company’s Chief Executive Officer pursuant to Rule 13a-14(a)/15(d)-14(a) under the Securities Exchange Act of 1934, as amended. | ||
31.2 | § | Certification of the Company’s Chief Financial Officer pursuant to Rule 13a-14(a)/15(d)-14(a) under the Securities Exchange Act of 1934, as amended. | ||
32.1 | § | Certification of the Company’s Chief Executive Officer pursuant to 18 U.S.C. Section 1350, as adopted pursuant to Section 906 of the Sarbanes-Oxley Act of 2002. | ||
32.2 | § | Certification of the Company’s Chief Financial Officer pursuant to 18 U.S.C. Section 1350, as adopted pursuant to Section 906 of the Sarbanes-Oxley Act of 2002. | ||
101 | The following materials from Delek US Holdings, Inc.’s Quarterly Report on Form 10-Q for the quarterly period ended March 31, 2017, formatted in XBRL (eXtensible Business Reporting Language): (i) Condensed Consolidated Balance Sheets as of March 31, 2017 and December 31, 2016 (Unaudited), (ii) Condensed Consolidated Statements of Income for the three months ended March 31, 2017 and 2016 (Unaudited), (iii) Condensed Consolidated Statements of Comprehensive Income for the three months ended March 31, 2017 and 2016 (Unaudited), (iv) Condensed Consolidated Statements of Cash Flows for the three months ended March 31, 2017 and 2016 (Unaudited), and (v) Notes to Condensed Consolidated Financial Statements (Unaudited). | |||
* | Management contract or compensatory plan or arrangement. |
^ | Certain schedules and exhibits have been omitted pursuant to Item 601(b)(2) of Regulation S-K. The Company agrees to furnish supplementally a copy of any of the omitted schedules or exhibits upon request by the United States Securities and Exchange Commission, provided, however, that Delek may request confidential treatment pursuant to Rule 24b-2 of the Exchange Act, as amended, for any schedules or exhibits so furnished. |
§ | Filed herewith. |
‡ | Confidential treatment has been requested with respect to certain portions of this exhibit pursuant to Rule 24b-2 of the Securities Exchange Act of 1934, as amended. Omitted portions have been filed separately with the United States Securities and Exchange Commission. |
45
SIGNATURES
Pursuant to the requirements of the Securities Exchange Act of 1934, the registrant has duly caused this report to be signed on its behalf by the undersigned, thereunto duly authorized.
Delek US Holdings, Inc. | |
By: | /s/ Ezra Uzi Yemin |
Ezra Uzi Yemin | |
Director (Chairman), President and Chief Executive Officer (Principal Executive Officer) | |
By: | /s/ Assaf Ginzburg |
Assaf Ginzburg | |
Executive Vice President and Chief Financial Officer (Principal Financial and Accounting Officer) | |
Dated: May 9, 2017
46
EXHIBIT INDEX
Exhibit No. | Description | |||
2.1 | ^ | Agreement and Plan of Merger dated as of January 2, 2017, among Delek US Holdings, Inc., Delek Holdco, Inc., Dione Mergeco, Inc., Astro Mergeco, Inc. and Alon USA Energy, Inc. (incorporated by reference to Exhibit 2.1 to the Company's Form 8-K filed on January 3, 2017). | ||
2.2 | First Amendment to Agreement and Plan of Merger dated as of February 27, 2017, among Delek US Holdings, Inc. Delek Holdco, Inc., Dion Mergco, Inc, Astro Mergco, Inc. and Alon USA Energy, Inc. (incorporated by reference to Exhibit 2.6 to the Company's Form 10-K filed on February 28, 2017). | |||
2.3 | § | Second Amendment to Agreement and Plan of Merger dated as of April 21, 2017, among Delek US Holdings, Inc. Delek Holdco, Inc., Dion Mergco, Inc, Astro Mergco, Inc. and Alon USA Energy, Inc. | ||
10.1 | ठ| Second Amended and Restated Master Supply and Offtake Agreement, dated February 27, 2017, by and among J. Aron & Company, Lion Oil Company, and Lion Oil Trading & Transportation, LLC. | ||
10.2 | Voting, Irrevocable Proxy and Support Agreement dated as of January 2, 2017, by and between Delek US Holdings, Inc. and Alon USA Energy, Inc. (incorporated by reference to Exhibit 10.1 to the Company's Form 8-K filed on January 3, 2017). | |||
10.3 | Voting, Irrevocable Proxy and Support Agreement dated as of January 2, 2017, by and between Delek US Holdings, Inc., David Wiessman and D.B.W. Holdings (2005) Ltd. (incorporated by reference to Exhibit 10.2 to the Company's Form 8-K filed on January 3, 2017). | |||
10.4 | Voting, Irrevocable Proxy and Support Agreement dated as of January 2, 2017, by and between Delek US Holdings, Inc., Jeff Morris and Karen Morris (incorporated by reference to Exhibit 10.3 to the Company's Form 8-K filed on January 3, 2017). | |||
10.5 | * | Executive Employment Agreement, effective April 1, 2017, by and between Delek US Holdings, Inc. and Kevin Kremke (incorporated by reference to Exhibit 10.1 to the Company's Form 8-K filed on January 31, 2017). | ||
10.6 | * | Employment Agreement, effective November 1, 2016, between Delek US Holdings, Inc. and Avigal Soreq (incorporated by reference to Exhibit 10.39 to the Company's Form 10-K filed on February 28, 2017). | ||
10.7 | *§ | Employment Agreement, effective May 8, 2013, between Delek US Holdings, Inc. and Ernest C. Cagle. | ||
10.8 | *§ | Employment Agreement, effective May 1, 2014, between Delek US Holdings, Inc. and Mark T. Page. | ||
31.1 | § | Certification of the Company’s Chief Executive Officer pursuant to Rule 13a-14(a)/15(d)-14(a) under the Securities Exchange Act of 1934, as amended. | ||
31.2 | § | Certification of the Company’s Chief Financial Officer pursuant to Rule 13a-14(a)/15(d)-14(a) under the Securities Exchange Act of 1934, as amended. | ||
32.1 | § | Certification of the Company’s Chief Executive Officer pursuant to 18 U.S.C. Section 1350, as adopted pursuant to Section 906 of the Sarbanes-Oxley Act of 2002. | ||
32.2 | § | Certification of the Company’s Chief Financial Officer pursuant to 18 U.S.C. Section 1350, as adopted pursuant to Section 906 of the Sarbanes-Oxley Act of 2002. | ||
101 | The following materials from Delek US Holdings, Inc.’s Quarterly Report on Form 10-Q for the quarterly period ended March 31, 2017, formatted in XBRL (eXtensible Business Reporting Language): (i) Condensed Consolidated Balance Sheets as of March 31, 2017 and December 31, 2016 (Unaudited), (ii) Condensed Consolidated Statements of Income for the three months ended March 31, 2017 and 2016 (Unaudited), (iii) Condensed Consolidated Statements of Comprehensive Income for the three months ended March 31, 2017 and 2016 (Unaudited), (iv) Condensed Consolidated Statements of Cash Flows for the three months ended March 31, 2017 and 2016 (Unaudited), and (v) Notes to Condensed Consolidated Financial Statements (Unaudited). | |||
* | Management contract or compensatory plan or arrangement. |
^ | Certain schedules and exhibits have been omitted pursuant to Item 601(b)(2) of Regulation S-K. The Company agrees to furnish supplementally a copy of any of the omitted schedules or exhibits upon request by the United States Securities and Exchange Commission, provided, however, that Delek may request confidential treatment pursuant to Rule 24b-2 of the Exchange Act, as amended, for any schedules or exhibits so furnished. |
§ | Filed herewith. |
‡ | Confidential treatment has been requested with respect to certain portions of this exhibit pursuant to Rule 24b-2 of the Securities Exchange Act of 1934, as amended. Omitted portions have been filed separately with the United States Securities and Exchange Commission. |
47