Attached files
| file | filename |
|---|---|
| EXCEL - IDEA: XBRL DOCUMENT - Delek US Holdings, Inc. | Financial_Report.xls |
| EX-24.1 - EXHIBIT 24.1 - POA - Delek US Holdings, Inc. | dk-10kxex241poax123114.htm |
| EX-32.1 - EXHIBIT 32.1 - CEO CERTIFICATION - Delek US Holdings, Inc. | dk-ex321xceocertificationx.htm |
| EX-31.2 - EXHIBIT 31.2 - CFO CERTIFICATION - Delek US Holdings, Inc. | dk-ex312xcfocertificationx.htm |
| EX-21.1 - EXHIBIT 21.1 - SUBSIDIARIES - Delek US Holdings, Inc. | dk-10kxex211subsidiariesx1.htm |
| EX-32.2 - EXHIBIT 32.2 - CFO CERTIFICATION - Delek US Holdings, Inc. | dk-ex322xcfocertificationx.htm |
| EX-31.1 - EXHIBIT 31.1 - CEO CERTIFICATION - Delek US Holdings, Inc. | dk-ex311xceocertificationx.htm |
| EX-23.1 - EXHIBIT 23.1 - EY CONSENT - Delek US Holdings, Inc. | dk-10kxex231eyconsentx1231.htm |
UNITED STATES
SECURITIES AND EXCHANGE COMMISSION
Washington, D.C. 20549
Form 10-K
(Mark One)
þ | ANNUAL REPORT PURSUANT TO SECTION 18 OR 15(d) OF THE SECURITIES EXCHANGE ACT OF 1934 | |||
For the Fiscal Year Ended December 31, 2014 | ||||
OR
o | TRANSITION REPORT PURSUANT TO SECTION 13 OR 15(d) OF THE SECURITIES EXCHANGE ACT OF 1934 | |
For the transition period from to | ||
DELEK US HOLDINGS, INC.
(Exact name of registrant as specified in its charter)
Delaware | 52-2319066 | |
(State or other jurisdiction of | (I.R.S. Employer | |
incorporation or organization) | Identification No.) | |
7102 Commerce Way | ||
Brentwood, Tennessee | 37027 | |
(Address of principal executive offices) | (Zip Code) | |
(615) 771-6701
(Registrant’s telephone number, including area code)
Securities registered pursuant to Section 12(b) of the Act:
Title of each class | Name of each exchange on which registered |
Common Stock, $.01 par value | New York Stock Exchange |
Securities registered pursuant to Section 12(g) of the Act:
None
Indicate by check mark if the registrant is a well-known seasoned issuer, as defined in Rule 405 of the Securities Act. Yes þ No o
Indicate by check mark if the registrant is not required to file reports pursuant to Section 13 or Section 15(d) of the Act. Yes o No þ
Indicate by check mark whether the registrant (1) has filed all reports required to be filed by Section 13 or 15(d) of the Securities Exchange Act of 1934 during the preceding 12 months (or for such shorter period that the registrant was required to file such reports), and (2) has been subject to such filing requirements for the past 90 days. Yes þ No o
Indicate by check mark whether the registrant has submitted electronically and posted on its corporate Web site, if any, every Interactive Data File required to be submitted and posted pursuant to Rule 405 of Regulation S-T (Section 232.405 of this chapter) during the preceding 12 months (or for such shorter period that the registrant was required to submit and post such files). Yes þ No o
Indicate by check mark if disclosure of delinquent filers pursuant to Item 405 of Regulation S-K (section 232.405 of this chapter) is not contained herein, and will not be contained, to the best of registrant's knowledge, in definitive proxy or information statements incorporated by reference in Part III of this Form 10-K or any amendments of this Form 10-K. þ
Indicate by check mark whether the registrant is a large accelerated filer, an accelerated filer, a non-accelerated filer, or a smaller reporting company. See the definitions of "large accelerated filer," "accelerated filer" and "smaller reporting company" in Rule 12b-2 of the Exchange Act. (Check one):
Large accelerated filer þ Accelerated filer o Non-accelerated filer o Smaller reporting company o
(Do not check if a smaller reporting company)
Indicate by check mark whether the registrant is a shell company (as defined in Rule 12b-2 of the Act). Yes o No þ
The aggregate market value of the common stock held by non-affiliates as of June 30, 2014 was approximately $1,653,327,694, based upon the closing sale price of the registrant's common stock on the New York Stock Exchange on that date. For purposes of this calculation only, all directors, officers subject to Section 16(b) of the Securities Exchange Act of 1934, and 10% stockholders are deemed to be affiliates.
At February 20, 2015, there were 57,274,594 shares of the registrant's common stock, $.01 par value, outstanding (excluding securities held by, or for the account of, the Company or its subsidiaries).
Documents incorporated by reference
Portions of the registrant's definitive Proxy Statement to be delivered to stockholders in connection with the 2015 Annual Meeting of Stockholders, which will be filed with the Securities and Exchange Commission within 120 days after December 31, 2014, are incorporated by reference into Part III of this Form 10-K.
TABLE OF CONTENTS
2
Unless otherwise indicated or the context requires otherwise, the terms "Delek," "we," "our," "Company" and "us" are used in this report to refer to Delek US Holdings, Inc. and its consolidated subsidiaries. See also "Glossary of Terms" included in Item 1, Business, of this Annual Report on Form 10-K for definitions of certain business and industry terms used herein.
Statements in this Annual Report on Form 10-K, other than purely historical information, including statements regarding our plans, strategies, objectives, beliefs, expectations and intentions are forward-looking statements. These forward-looking statements generally are identified by the words "may," "will," "should," "could," "would," "predicts," "intends," "believes," "expects," "plans," "scheduled," "goal," "anticipates," "estimates" and similar expressions. Forward-looking statements are based on current expectations and assumptions that are subject to risks and uncertainties, including those discussed below and in Item 1A, Risk Factors, which may cause actual results to differ materially from the forward-looking statements. See also "Forward-Looking Statements" included in Item 7, Management's Discussion and Analysis of Financial Condition and Results of Operations, of this Annual Report on Form 10-K.
PART I
ITEM 1. BUSINESS
Company Overview
We are an integrated energy business focused on petroleum refining, the transportation, storage and wholesale of crude oil and intermediate and refined products and convenience store retailing. Delek US Holdings, Inc. ("Holdings"), a Delaware corporation formed in 2001, is the sole shareholder or owner of membership interests of Delek Refining, Inc. ("Refining"), Delek Finance, Inc., Delek Marketing & Supply, LLC, Lion Oil Company ("Lion Oil"), Delek Renewables, LLC, Delek Rail Logistics, Inc., Delek Logistics Services Company, MAPCO Express, Inc. ("MAPCO Express"), MAPCO Fleet, Inc., NTI Investments, LLC, GDK Bearpaw, LLC, Delek Helena, LLC, Commerce Way Insurance Company, Inc., Delek Land Holdings, LLC and Delek Transportation, LLC. In addition, as of December 31, 2014, we owned a 59.9% limited partner interest in Delek Logistics Partners, LP ("Delek Logistics"), a publicly traded master limited partnership that we formed in April 2012, and a 95.8% interest in Delek Logistics GP, LLC ("Logistics GP"), which owns the entire 2.0% general partner interest in Delek Logistics. Unless otherwise indicated or the context requires otherwise, the terms "we," "our," "us," "Delek" and the "Company" are used in this report to refer to Delek US Holdings, Inc. and its consolidated subsidiaries. Our business consists of three operating segments: refining, logistics and retail.
Our refining segment operates independent refineries in Tyler, Texas (the "Tyler refinery") and El Dorado, Arkansas (the "El Dorado refinery") with a combined design crude throughput capacity of 140,000 bpd. We are in the process of expanding our Tyler refinery crude throughput capacity by 15,000 bpd (the "Tyler Expansion"). It is expected to be completed in March 2015 and would increase crude throughput capacity to a combined 155,000 bpd. The Tyler refinery sells the majority of its production over a refinery truck rack owned and operated by our logistics segment to supply the local market in the east Texas area. The El Dorado refinery sells a portion of its production at the refinery truck rack, which is owned and operated by our logistics segment, but the majority of the refinery's production is shipped into the Enterprise Pipeline System and our logistics segment's El Dorado Pipeline system to supply a combination of pipeline bulk sales and wholesale rack sales at terminal locations along the pipeline, including Shreveport, Louisiana, North Little Rock, Arkansas, Memphis, Tennessee, and Cape Girardeau, Missouri. Our refining segment also owns and operates two biodiesel facilities involved in the production of biodiesel fuels and related activities, the second of which was purchased in January 2014.
Our logistics segment gathers, transports and stores crude oil and markets, distributes, transports and stores refined products in select regions of the southeastern United States and west Texas for both our refining segment and third parties. The logistics segment owns approximately 400 miles of crude oil transportation pipelines, approximately 245 miles of active refined product pipelines, an approximately 600-mile crude oil gathering system and associated crude oil storage tanks with an aggregate of approximately 8.1 million barrels of active shell capacity. Our logistics segment owns and operates nine terminals and markets light products using third-party terminals.
Our retail segment markets gasoline, diesel, other refined petroleum products and convenience merchandise through a network of approximately 365 company-operated retail fuel and convenience stores located in Alabama, Arkansas, Georgia, Kentucky, Mississippi, Tennessee and Virginia.
3
Business Strategy
Historically, we have grown through acquisitions across each of our segments. This is demonstrated by the acquisitions of the Tyler refinery and El Dorado refinery in 2005 and 2011, respectively. We also purchased a series of logistics assets since 2006 that created a new growth platform for the Company and provides support to our refining assets as well as third party customers. In the retail segment, after growing through a series of acquisitions from 2001 to 2007, we have focused on managing our portfolio of stores while building new large format stores in our market area, as well as leveraging our gasoline supply opportunities from our refining segment. Our business strategy is focused on growing our integrated business model that allows us to participate from moving crude oil to our refineries for processing into refined products to selling fuel to customers across our retail network. This growth may come from acquisitions, as well as investments in our existing businesses as we continue to broaden our existing geographic presence and integrated business model.
We completed a number of acquisitions during the year ended December 31, 2014, which are described in detail in the section entitled “Executive Summary and Strategic Overview-Strategic Accomplishments-Acquisitions” under Item 7, Management’s Discussion and Analysis of Financial Condition and Results of Operations, of this Annual Report on Form 10-K.
Information About Our Segments
We prepare segment information on the same basis on which we review financial information for operational decision making purposes. In February 2014, a subsidiary of Delek Logistics completed the acquisition of certain storage tanks and the products terminal located at our refinery in El Dorado, Arkansas (the "El Dorado refinery") from Lion Oil (the "El Dorado Acquisition"). In conjunction with the El Dorado Acquisition, we reclassified certain operating segments. The results of the operation of the assets associated with this acquisition were previously reported as part of our refining segment and are now reported in our logistics segment. The historical results of the operation of these assets have been reclassified to conform to the current presentation.
Additional segment and financial information is contained in our segment results included in Item 6, Selected Financial Data, Item 7, Management's Discussion and Analysis of Financial Condition and Results of Operations, and in Note 12, Segment Data, of our consolidated financial statements included in Item 8, Financial Statements and Supplementary Data, of this Annual Report on Form 10-K.
Refining Segment
Overview
We own and operate two independent refineries located in Tyler, Texas and El Dorado, Arkansas, currently representing a combined 140,000 bpd of crude throughput capacity. Our refining system produces a variety of petroleum-based products used in transportation and industrial markets which are sold to a wide range of customers located principally in inland, domestic markets.
Both of our refineries are located in the U.S. Gulf Coast Region (PADD 3), which is one of the five PADD regional zones established by the U.S. Department of Energy where refined products are produced and sold. Refined product prices generally differ within each of the five PADDs.
Refining System Feedstock Purchases
Our refining system purchases crude oil and other feedstocks through term agreements, some of which may include renewal provisions, and through spot market transactions. The majority of the crude oil we purchase is sourced from inland domestic sources, primarily originating in areas of Texas and Arkansas. We also purchase crude delivered by rail car that originates primarily in other parts of the United States and Canada. A large portion of the crude oil currently purchased at both the Tyler and El Dorado refineries is priced at a differential to the price per barrel of WTI. In most cases, this differential is established during the month prior to the month in which the crude oil is processed at our refineries.
Refining System Production Slate
Our refining system processes a combination of light sweet and medium sour crude oils which, when refined, results in a product mix consisting principally of higher-value transportation fuels such as gasoline, distillate and jet fuel. A lesser portion of our overall production consists of residual products, including paving asphalt, roofing flux and other products with industrial applications.
4
Refined Product Sales and Distribution
Our refining segment sells products on a wholesale basis to inter-company and third-party customers located around east Texas, Arkansas, Tennessee and the Ohio River Valley, including gulf coast markets and areas along the Enterprise Pipeline System.
Refining Segment Seasonality
Demand for gasoline and asphalt products is generally higher during the summer months than during the winter months due to seasonal increases in motor vehicle traffic and road and home construction. Varying vapor pressure requirements between the summer and winter months also tighten summer gasoline supply. As a result, the operating results of our refining segment are generally lower for the first and fourth quarters of the calendar year.
Refining Segment Competition
The refining industry is highly competitive and includes fully integrated national and multinational oil companies engaged in many segments of the petroleum business, including exploration, production, transportation, refining, marketing and retail fuel and convenience stores. Our principal competitors are petroleum refiners in the Mid-Continent and Gulf Coast regions, in addition to wholesale distributors operating in these markets.
The principal competitive factors affecting our refinery operations are crude oil and other feedstock costs, the differential in price between various grades of crude oil, refinery product margins, refinery reliability and efficiency, refinery product mix, and distribution and transportation costs.
Refining Segment - Tyler Refinery
As of December 31, 2014, our Tyler refinery has a nameplate crude throughput capacity of 60,000 bpd. During the first quarter of 2015, we plan to conduct a maintenance turnaround at the Tyler refinery, as well as replace the fluid catalytic cracking reactor. In addition, during the turnaround, we expect to complete a project to expand the crude nameplate capacity at the Tyler refinery by 15,000 bpd to 75,000 bpd. See the section entitled “Executive Summary and Strategic Overview-Strategic Accomplishments-Refining Segment” under Item 7, Management’s Discussion and Analysis of Financial Condition and Results of Operations, of this Annual Report on Form 10-K for a description of the turnaround and expansion activities.
The Tyler refinery is currently the only major distributor of a full range of refined petroleum products within a radius of approximately 100 miles of its location. The refinery is situated on approximately 100 out of a total of approximately 600 contiguous acres of land (excluding pipelines) that we own in Tyler, Texas and adjacent areas.
The Tyler refinery is designed to process mainly light, sweet crude oil, which is typically of a higher quality than heavier sour crudes. The Tyler refinery has access to crude oil pipeline systems that allow us access to East Texas, West Texas and limited Gulf of Mexico and foreign crude oils. Most of the crude supplied to the Tyler refinery is delivered by third-party pipelines and through pipelines owned by our logistics segment.
The table below sets forth information concerning crude oil received at the Tyler refinery:
Percentage of Crude Oil Received | ||||||
Year Ended December 31, | ||||||
Origin | 2014 | 2013 | ||||
East Texas crude oil | 9.5 | % | 11.5 | % | ||
WTI crude oil | 90.5 | % | 88.5 | % | ||
The Tyler refinery has a crude oil processing unit with a 60,000 bpd atmospheric column and a 21,000 bpd vacuum tower. The other major processing units at the Tyler refinery include a 20,200 bpd fluid catalytic cracking unit, a 6,500 bpd delayed coking unit, a 22,000 bpd naphtha hydrotreating unit, a 13,000 bpd gasoline hydrotreating unit, a 22,000 bpd distillate hydrotreating unit, a 17,500 bpd continuous regeneration reforming unit, a 5,000 bpd isomerization unit, and a sulfuric alkylation unit with a alkylate production capacity of 4,720 bpd. The Tyler refinery has a Nelson Complexity Factor of 9.5. The Tyler Expansion will increase the crude processing unit to 75,000 bpd, the distillate hydrotreating unit to 36,000 bpd and the naptha hydrotreating unit to 28,000 bpd.
5
The fluid catalytic cracking unit and delayed coker enabled us to produce approximately 97.4% light products in 2014, including primarily a full range of gasoline, diesel, jet fuels, liquefied petroleum gas and natural gas liquids.
The table below sets forth information concerning the throughput at the Tyler refinery:
Year Ended | Year Ended | Year Ended | ||||||||||||||||
December 31, 2014 | December 31, 2013 | December 31, 2012 | ||||||||||||||||
Bpd | % | Bpd | % | Bpd | % | |||||||||||||
Refinery throughput (average bpd): | ||||||||||||||||||
Sweet crude oil | 58,756 | 88.3 | % | 58,327 | 92.1 | % | 56,426 | 94.2 | % | |||||||||
Other blendstocks | 7,811 | 11.7 | % | 4,970 | 7.9 | % | 3,450 | 5.8 | % | |||||||||
Total refinery throughput | 66,567 | 100.0 | % | 63,297 | 100.0 | % | 59,876 | 100.0 | % | |||||||||
The Tyler refinery primarily produces two grades of gasoline (premium - 93 octane and regular - 87 octane), as well as aviation gasoline. Diesel and jet fuel products produced at the Tyler refinery include military specification jet fuel, commercial jet fuel, low sulfur diesel and ultra-low sulfur diesel. The Tyler refinery offers both E-10 and biodiesel blended products. In addition to higher-value gasoline and distillate fuels, the Tyler refinery produces small quantities of propane, refinery grade propylene and butanes, petroleum coke, slurry oil, sulfur and other blendstocks.
The table below sets forth information concerning the Tyler refinery's production slate:
Year Ended | Year Ended | Year Ended | ||||||||||||||||
December 31, 2014 | December 31, 2013 | December 31, 2012 | ||||||||||||||||
Bpd | % | Bpd | % | Bpd | % | |||||||||||||
Products produced (average bpd): | ||||||||||||||||||
Gasoline | 35,829 | 54.7 | % | 33,791 | 54.2 | % | 33,045 | 55.8 | % | |||||||||
Diesel/jet | 25,713 | 39.2 | % | 24,374 | 39.1 | % | 21,883 | 37.0 | % | |||||||||
Petrochemicals, LPG, NGLs | 2,264 | 3.5 | % | 2,292 | 3.7 | % | 2,268 | 3.8 | % | |||||||||
Other | 1,717 | 2.6 | % | 1,847 | 3.0 | % | 1,989 | 3.4 | % | |||||||||
Total production | 65,523 | 100.0 | % | 62,304 | 100.0 | % | 59,185 | 100.0 | % | |||||||||
The vast majority of our transportation fuels and other products are sold directly from a refined products terminal owned by Delek Logistics and located at the Tyler refinery.
As a result of our ability to deliver most of our gasoline and diesel fuel production directly into the local market through Delek Logistics' terminal located at the Tyler refinery, we believe our customers benefit from lower transportation costs compared to alternative sources. Our customers include major oil companies, independent refiners and marketers, jobbers, distributors, utility and transportation companies, the U.S. government and independent retail fuel operators.
Taking into account the Tyler refinery's crude and product slate, as well as the refinery's location near the Gulf Coast region, we apply a Gulf Coast 5-3-2 crack spread to calculate the approximate gross margin resulting from processing one barrel of crude oil into three-fifths of a barrel of gasoline and two-fifths of a barrel of high sulfur diesel. We calculate the Gulf Coast crack spread using the market values of U.S. Gulf Coast Pipeline Conventional 87 CBOB and U.S. Gulf Coast Pipeline No. 2 Heating Oil (high-sulfur diesel) and the market value of WTI crude oil. U.S. Gulf Coast Pipeline Conventional 87 CBOB and U.S. Gulf Coast Pipeline No. 2 Heating Oil are prices for which the products trade in the Gulf Coast region.
Refining Segment - El Dorado Refinery
Our El Dorado refinery has a crude throughput capacity of 80,000 bpd. The El Dorado refinery is the largest refinery in Arkansas and represents more than 90% of state-wide refining capacity.
6
The El Dorado refinery is designed mainly to process a combination of sweet light, medium-sour and heavy crude oils. During the turnaround in 2014, we added the flexibility to process medium gravity or mostly light gravity crude oils. The refinery receives crude by several delivery points, including local crude and other third party pipelines that connect directly into Delek Logistics' El Dorado Pipeline System, which runs from Magnolia, Arkansas, to the El Dorado refinery (the "El Dorado Pipeline System"), and rail at third party terminals.
In 2014, we purchased crude oil for the El Dorado refinery from inland-sourced crude from east and west Texas, local sources, including crude gathered through a local domestic crude oil gathering system in the adjacent Arkansas area production fields owned and operated by Delek Logistics (the "SALA Gathering System"), rail and reduced amounts of Gulf Coast crude. At present, J. Aron and Company ("J. Aron"), through arrangements with various oil companies, supplies a substantial portion of the El Dorado refinery's crude oil input requirements pursuant to an amended and restated Master Supply and Offtake Agreement ( the "S&O Agreement").
The table below sets forth information concerning crude oil received at the El Dorado refinery:
Percentage of Crude Oil Received | ||||||
Year Ended December 31, | ||||||
Origin | 2014 | 2013 | ||||
Domestic inland/local crude oil | 91.9 | % | 85.9 | % | ||
Canadian crude oil | 3.7 | % | 10.2 | % | ||
US Gulf Coast crude oil | 4.2 | % | 2.9 | % | ||
Other foreign crude oil | 0.1 | % | 1.0 | % | ||
The El Dorado refinery is equipped with a crude oil processing unit with a 100,000 bpd capacity. The actual average annual crude unit throughput will vary based on economics and market requirements, as well as other physical limitations that affect the daily throughput or the utilization rate of the refinery. Due to constraints in downstream conversion, the operable capacity of the El Dorado refinery is estimated at approximately 80,000 bpd. The El Dorado refinery is also equipped with a 55,000 bpd vacuum unit, a 22,000 distillate hydrotreating unit, a 20,000 bpd FCC unit, a 15,300 bpd continuous regenerative catalytic reforming unit, a 7,000 bpd isomerization unit and a 5,000 bpd alkylation unit. The El Dorado refinery has a Nelson Complexity Factor of 9.0.
The table below sets forth information concerning the throughput at the El Dorado refinery:
Year Ended | Year Ended | Year Ended | ||||||||||||||||
December 31, 2014 | December 31, 2013 | December 31, 2012 | ||||||||||||||||
Bpd | % | Bpd | % | Bpd | % | |||||||||||||
Refinery throughput (average bpd): | ||||||||||||||||||
Crude: | ||||||||||||||||||
Sweet | 38,721 | 53.1 | % | 36,324 | 49.8 | % | 29,982 | 41.0 | % | |||||||||
Sour | 28,002 | 38.4 | % | 29,563 | 40.6 | % | 35,393 | 48.3 | % | |||||||||
Total crude | 66,723 | 91.5 | % | 65,887 | 90.4 | % | 65,375 | 89.3 | % | |||||||||
Other blendstocks(1) | 6,229 | 8.5 | % | 6,872 | 9.6 | % | 7,797 | 10.7 | % | |||||||||
Total refinery throughput | 72,952 | 100.0 | % | 72,759 | 100.0 | % | 73,172 | 100.0 | % | |||||||||
(1) | Includes denatured ethanol and biodiesel. |
The El Dorado refinery produces a wide range of refined products, from multiple grades of gasoline and ultra-low sulfur diesel fuels, LPGs, refinery grade propylene and a variety of asphalt products, including paving grade asphalt and roofing flux. The El Dorado refinery produces both low-sulfur gasoline and ultra-low sulfur diesel fuel, in compliance with current clean fuels standards. The El Dorado refinery offers both E-10 and biodiesel blended products.
In 2014, gasoline, diesel, liquefied petroleum gas and natural gas liquids accounted for approximately 90.3% of the El Dorado refinery's production, while 9.7% of the product slate included various grades of asphalt, black oils and other residual products.
7
The table below sets forth information concerning the El Dorado refinery's production slate:
Year Ended | Year Ended | Year Ended | ||||||||||||||||
December 31, 2014 | December 31, 2013 | December 31, 2012 | ||||||||||||||||
Bpd | % | Bpd | % | Bpd | % | |||||||||||||
Products produced (average bpd): | ||||||||||||||||||
Gasoline | 35,960 | 50.4 | % | 34,908 | 48.7 | % | 33,411 | 46.8 | % | |||||||||
Diesel | 27,716 | 38.9 | % | 27,097 | 37.8 | % | 27,163 | 38.1 | % | |||||||||
Petrochemicals, LPG, NGLs | 701 | 1.0 | % | 997 | 1.4 | % | 1,318 | 1.8 | % | |||||||||
Asphalt | 6,024 | 8.5 | % | 7,691 | 10.8 | % | 6,897 | 9.7 | % | |||||||||
Other | 885 | 1.2 | % | 949 | 1.3 | % | 2,583 | 3.6 | % | |||||||||
Total production | 71,286 | 100.0 | % | 71,642 | 100.0 | % | 71,372 | 100.0 | % | |||||||||
Products manufactured at the El Dorado refinery are sold to wholesalers and retailers through spot sales, commercial contracts and through exchange agreements in markets in Arkansas, Memphis, Tennessee and north into the Ohio River Valley region. The refinery connection to the Enterprise Pipeline System is a key means of product distribution for the refinery because it provides access to third-party terminals in multiple Mid-Continent markets located adjacent to the system. The refinery also supplies products to exchange partners on the Colonial pipeline systems.
Logistics Segment
Overview
Our logistics segment consists of Delek Logistics, a publicly traded master limited partnership, and its subsidiaries. Our consolidated financial statements include its consolidated financial results. As of December 31, 2014, we owned a 59.9% limited partner interest in Delek Logistics, and a 95.8% interest in Logistics GP, which owns both the entire 2.0% general partner interest in Delek Logistics and all of the incentive distribution rights.
Our logistics segment owns and operates crude oil and intermediate and refined products logistics and marketing assets. It generates revenue and contribution margin, which we define as net sales less cost of goods sold and operating expenses, by charging fees for gathering, transporting and storing crude oil and intermediate product and for marketing, distributing, transporting and storing refined products. A substantial majority of the logistics segment's existing assets are both integral to and dependent upon the successful operation of our refining segment's assets as the logistics segment gathers, transports and stores crude oil and markets, distributes, transports and stores refined products in select regions of the southeastern United States and east Texas in support of the Tyler and El Dorado refineries. In addition to intercompany services, the logistics segment also provides some crude oil transportation services for, and terminalling and wholesale marketing services to, third parties in Texas, Tennessee and Arkansas.
Logistics Segment - Wholesale Marketing and Terminalling
The logistics segment's wholesale marketing and terminalling business provides wholesale marketing and terminalling services to the refining segment and to independent third parties from whom it receives fees for marketing, transporting, storing and terminalling refined products. It generates revenue by (i) providing marketing services for the refined products output of the Tyler refinery, (ii) engaging in wholesale activity at owned terminals in Abilene and San Angelo, Texas, as well as at terminals owned by third parties in Texas, whereby it purchases light products for sale and exchange to third parties, and (iii) providing terminalling services to independent third parties and the refining segment. Three terminals, located in El Dorado, Arkansas, Memphis, Tennessee, and North Little Rock, Arkansas, throughput refined product produced at the El Dorado refinery. Three terminals, located in Tyler, Big Sandy, and Mount Pleasant Texas, throughput refined product produced at the Tyler refinery.
Logistics Segment - Pipelines and Transportation
The logistics segment's pipelines and transportation business owns approximately 400 miles of crude oil transportation pipelines, approximately 140 miles of refined product pipelines, an approximately 600-mile crude oil gathering system and associated crude
8
oil storage tanks with an aggregate of approximately 5.8 million barrels of active shell capacity. These assets are primarily divided into the following operating systems:
• | the Lion Pipeline System, which transports crude oil to, and refined products from, the El Dorado refinery (the "Lion Pipeline System"); |
• | the SALA Gathering System, which gathers and transports crude oil production in southern Arkansas and northern Louisiana, primarily for the El Dorado refinery; |
• | the Paline Pipeline System, which primarily transports crude oil from Longview, Texas to a third-party terminal in Nederland, Texas; |
• | the East Texas Crude Logistics System, which currently transports a small portion of the crude oil delivered to the Tyler refinery (the "East Texas Crude Logistics System"); |
• | the Tyler-Big Sandy Pipeline, which is a pipeline link between the Tyler refinery and the Big Sandy Terminal; |
• | the Tyler Tank Assets; |
• | the El Dorado Tank Assets; and |
• | the Greenville-Mount Pleasant Pipeline and Greenville Storage Facility. |
In addition to these operating systems, the logistics segment acquired approximately 120 trucks and 200 trailers in December 2014, used to haul primarily crude and asphalt.
Logistics Segment Supply Agreement
Approximately 69.0% of the petroleum products for sale by the logistics segment in west Texas are purchased from Noble Petro, Inc. ("Noble Petro"). Under the terms of a supply contract (the "Abilene Contract") with Noble Petro, we have the right to purchase up to 20,350 bpd of petroleum products. Under the Abilene Contract, we purchase petroleum products based on monthly average prices from Noble Petro immediately prior to our resale of such products to customers at our San Angelo and Abilene, Texas terminals, which we lease to Noble Petro. Under this arrangement, we have limited direct exposure to risks associated with fluctuating prices for these refined products due to the short period of time between the purchase and resale of these refined products. The Abilene Contract expires in December 2017 and does not have a renewal option.
Logistics Segment Operating Agreements With Delek
Delek Logistics has various long-term, fee-based commercial agreements with Delek and its subsidiaries that, among other things, establish fees for certain administrative and operational services provided by Delek and its subsidiaries to Delek Logistics, provide certain indemnification obligations and establish terms for fee-based commercial agreements for Delek Logistics to provide certain pipeline transportation, terminal throughput, finished product marketing and storage services to Delek. These agreements have various initial terms which expire, depending on the specific contracts, at different times from 2017 through 2022. Each of these agreements requires Delek or its subsidiary to operate at minimum volume commitments or pay for certain minimum storage capacities. Delek Logistics is a variable interest entity as defined under United States generally accepted accounting principles ("GAAP") and is consolidated into our consolidated financial statements. Intercompany transactions with Delek Logistics and its subsidiaries are eliminated in our consolidated financial statements.
Logistics Segment Customers
Our logistics segment has various types of customers, including major oil companies, independent refiners and marketers, jobbers, distributors, utility and transportation companies, and independent retail fuel operators.
Logistics Segment Seasonality
The volume and throughput of crude oil and refined products transported through our pipelines and sold through our terminals and to third parties is directly affected by the level of supply and demand for all of such products in the markets served directly or indirectly by our assets. Supply and demand for such products fluctuates during the calendar year. Demand for gasoline, for example, is generally higher during the summer months than during the winter months due to seasonal increases in motor vehicle traffic. Varying vapor pressure requirements between the summer and winter months also tighten summer gasoline supply. In addition, our refining segment often performs planned maintenance during the winter, when demand for their products is lower. Accordingly, these factors can diminish the demand for crude oil or finished products by our customers and therefore limit our volumes or throughput during these periods, and we expect that our operating results will generally be lower during the first and fourth quarters of the calendar year.
9
Logistics Segment Competition
Our logistics segment faces competition for the transportation of crude oil from other pipeline owners whose pipelines (i) may have a location advantage over our pipelines, (ii) may be able to transport more desirable crude oil to third parties, or (iii) may be able to transport crude oil or finished product at a lower tariff. In addition, the wholesale marketing and terminalling business in general is also very competitive. Our owned refined product terminals, as well as the other third party terminals we use to sell refined products, compete with other independent terminal operators as well as integrated oil companies on the basis of terminal location, price, versatility and services provided. The costs associated with transporting products from a loading terminal to end users limit the geographic size of the market that can be competitively served by any terminal. Two key markets in west Texas that we serve from our company-owned facilities are Abilene and San Angelo, Texas. We have direct competition from an independent refinery that markets through another terminal in the Abilene market. There are no competitive fuel loading terminals within approximately 90 miles of our San Angelo terminal.
Logistics Segment Activity
The following table summarizes our activity in the wholesale marketing and terminalling portion of our logistics segment:
Year Ended December 31, | |||||||||
2014 | 2013 | 2012 | |||||||
Operating Information: | |||||||||
West Texas marketing throughputs (average bpd) (1) | 16,707 | 18,156 | 16,523 | ||||||
Terminalling throughputs (average bpd) (2) | 96,519 | 75,438 | 15,420 | ||||||
East Texas marketing throughputs (average bpd) | 61,368 | 58,773 | 57,574 | ||||||
(1) | Excludes bulk ethanol and biodiesel |
(2) | Consists of terminalling throughputs at our Tyler, Big Sandy and Mount Pleasant, Texas, North Little Rock, Arkansas and Memphis and Nashville, Tennessee terminals. Throughput volumes at the Tyler, Texas terminal are for the period from July 27, 2013 through December 31, 2014. Prior to July 27, 2013, the logistics segment did not record revenue for throughput at the Tyler, Texas terminal. Throughputs for the North Little Rock Terminal are for the period from October 24, 2013 through December 31, 2014. Throughputs for the the Big Sandy Terminal are for the period from January 1, 2014 through December 31, 2014. Prior to January 1, 2014, the Big Sandy terminal had no throughputs, even though it became operational during December 2013. Throughputs for the Mount Pleasant Terminal are for the 92 days Delek operated the terminal following its acquisition on October 1, 2014. Barrels per day are calculated for only the days we operated each terminal. |
The following table summarizes our activity in the pipelines and transportation portion of our logistics segment:
Year Ended December 31, | |||||||||
2014 | 2013 | 2012 | |||||||
Throughputs (average bpd) | |||||||||
Lion Pipeline System: | |||||||||
Crude pipelines (non-gathered) | 47,906 | 46,515 | 46,027 | ||||||
Refined products pipelines to Enterprise Systems | 53,461 | 49,694 | 45,220 | ||||||
SALA Gathering System | 22,656 | 22,152 | 20,747 | ||||||
East Texas Crude Logistics System | 7,361 | 19,896 | 55,068 | ||||||
10
Retail Segment
Overview
As of December 31, 2014, we operated 365 retail fuel and convenience stores located throughout the southeastern United States. More than 92% of our stores were located in Tennessee, Alabama and Georgia, with additional stores located in Arkansas, Virginia, Kentucky and Mississippi. Our retail locations operate primarily under the MAPCO Express®, MAPCO Mart®, Discount Food MartTM, Fast Food and FuelTM, East Coast®, Delta Express® and Favorite Markets® brands.
During the past several years we have reimaged or newly constructed approximately 59.2% of our store network, in each instance adopting the MAPCO Mart® brand. A reimaged location will typically include the re-configuring of the interior of the store, including remodeling surfaces, as well as replacement of certain inside equipment, remodeling the exterior of the store, and new outdoor signage. During 2014, we spent $28.4 million constructing 11 new stores. Of this amount, $17.1 million was spent at the holding company level.
We believe that we have established strong brand recognition and market presence in the major retail markets in which we operate. The local markets where we have strong presence include Nashville, Memphis and the Chattanooga/northern Georgia corridor, and our presence is growing in Alabama and Arkansas.
We seek to operate store locations in centralized, high-traffic urban and suburban markets. Our retail strategy employs localized marketing tactics that account for the unique demographic characteristics of each region that we serve. In recent years, we have introduced customized product offerings and promotional strategies to address the unique tastes and preferences of our customers on a market-by-market basis, in part by utilizing our loyalty program.
Retail Network
The majority of our stores are open 24 hours per day, while all sites are open at least 14 hours per day. Our average store size is approximately 2,700 square feet, with approximately 78.4% of our stores being 2,000 or more square feet. We are gravitating towards a large-format store, with our new stores constructed averaging 4,770 square feet.
Our retail fuel and convenience stores typically offer tobacco products and immediately consumable items such as non-alcoholic beverages, beer and a large variety of snacks and prepackaged items. A significant number of the sites also offer state sanctioned lottery games, ATM services and money orders. As of December 31, 2014, we operated 85 quick service restaurants in our store locations. In 53 of these locations, we offer national branded quick service food chains such as Quiznos®, Subway®, and Krispy Krunchy Chicken®. We also have a variety of proprietary in-house, quick service food offerings featuring fried chicken, breakfast biscuits, deli sandwiches and other freshly prepared foods.
Our convenience stores also offer unbranded, "private label" products in select categories. Since launching our first private label products in 2006, same-store private label sales as a percentage of total merchandise sales excluding cigarettes has grown to 7.8% in 2014. Our private label products are generally priced at a discount to their branded, nationally recognized counterparts, yet carry a higher gross profit margin for us, when compared to their counterparts. Our private label program provides quality offerings with price points previously unavailable to our customers in a number of categories.
Fuel Operations
For 2014, 2013 and 2012, our fuel sales were 78.5%, 79.6%, and 79.9%, respectively, of total net sales for our retail segment.
The following table highlights certain information regarding our continuing fuel operations:
Year Ended December 31, | ||||||||||||
2014 | 2013 | 2012 | ||||||||||
Number of stores (end of period) | 365 | 361 | 373 | |||||||||
Average number of stores (during period) | 363 | 368 | 374 | |||||||||
Retail fuel sales (thousands of gallons) | 436,895 | 409,086 | 404,558 | |||||||||
Average retail gallons per store (based on average number of stores) (thousands of gallons) | 1,204 | 1,112 | 1,082 | |||||||||
Retail fuel margin ($ per gallon) | $ | 0.190 | $ | 0.173 | $ | 0.146 | ||||||
11
We purchased approximately 79.0% of the fuel sold at our retail fuel and convenience stores in 2014 from three suppliers, including almost half from our refining segment. The price of fuel purchased is generally based on contractual differentials to local and regional price benchmarks. The initial terms of our supply agreements range from one year to 15 years and generally contain minimum monthly or annual purchase requirements. As of December 31, 2014, we had met our purchase commitments under these contracts and did not carry a liability for the failure to purchase required minimums.
Merchandise Operations
For 2014, 2013 and 2012, our merchandise sales were 21.5%, 20.4%, and 20.1%, respectively, of total net sales for our retail segment.
The following table highlights certain information regarding our continuing merchandise operations:
Year Ended December 31, | ||||||||||||
2014 | 2013 | 2012 | ||||||||||
Comparable store merchandise sales change (year over year) | 3.4 | % | 0.6 | % | 3.4 | % | ||||||
Merchandise margin | 28.0 | % | 28.3 | % | 29.3 | % | ||||||
Total merchandise sales (in thousands) | $ | 401,420 | $ | 381,665 | $ | 378,166 | ||||||
Average number of stores (during period) | 363 | 368 | 374 | |||||||||
Average merchandise sales per store (in thousands) | $ | 1,106 | $ | 1,037 | $ | 1,011 | ||||||
We purchased approximately 63.4% of our general merchandise, including most tobacco products and grocery items, for 2014 from a single wholesale grocer, Core-Mark International, Inc., pursuant to a contract that expires at the end of 2018. Our other major suppliers include Coca-Cola®, Pepsi-Cola® and Frito Lay®.
Dealer-Operated Stores
Our retail segment also includes a wholesale fuel distribution network that supplied 46 dealer-operated retail locations as of December 31, 2014. In 2014, our dealer net sales represented approximately 4.3% of net sales for our retail segment. Our business with dealers includes a variety of contractual arrangements in some of which we pay a commission to the dealer based on profits from the fuel sales and, in others we supply fuel and invoice the dealer for the cost of fuel plus an agreed upon margin. We also have non-contractual arrangements with dealers in which dealers order fuel from us at their discretion.
Retail Segment Seasonality
Demand for gasoline and convenience merchandise is generally higher during the summer months than during the winter months due to seasonal increases in motor vehicle traffic. As a result, the operating results of our retail segment are generally lower for the first quarter of the calendar year.
Weather conditions in our operating area also have a significant effect on our operating results. Customers are more likely to purchase higher profit margin items at our retail fuel and convenience stores, such as fast foods, fountain drinks and other beverages and more gasoline during the spring and summer months. Unfavorable weather conditions during these months and a resulting lack of the expected seasonal upswings in traffic and sales could have a negative impact on our results of operations.
Retail Segment Competition
The retail fuel and convenience store business is highly competitive. We compete on a store-by-store basis with other independent convenience store chains, independent owner-operators, major petroleum companies, supermarkets, drug stores, discount stores, club stores, mass merchants, fast food operations and other retail outlets. Major competitive factors affecting us include location, ease of access, pricing, timely deliveries, product and service selections, customer service, fuel brands, store appearance, cleanliness and safety. We believe we are able to compete effectively in the markets in which we operate because our market concentration in most of our markets allows us to improve buying power with our vendors. Our retail segment strategy continues to center on operating a high concentration of sites in a similar geographic region to promote operational efficiencies.
12
Information Technology
We believe that significant investments in information technology ("IT") are important to support our various business units. In 2014, we continued our efforts to improve several areas of IT including infrastructure, security, and enterprise software systems. Capital investments focused on modernization efforts that included the comprehensive transition from the Microsoft XP Operating System to Windows 7 at all our locations. In addition, we continued implementation of our IT security strategy by implementing advanced detection and response systems that we believe will help us maintain adequate data security in an environment of increasing risk of cyber attacks, hacks and other threats. We also focused on continuous improvement of our Enterprise Resource Planning financial and accounting processes that were developed in 2013. We believe our efforts in continuous business process improvement produced a higher level of consistency in our operations by taking advantage of new system tools including the application of responsive analytics and reporting. We also believe these improvements have enhanced our ability to respond to customer and market requirements and set the foundation for future growth.
Most of the retail segment's stores are connected through a high-speed network that provides near real-time information in support of merchandise pricing management, store security, fraud prevention, in-store training, and customer point-of-sale processing. The architecture and design of the store systems provide the flexibility to continue the expansion to new services that require access through a secure Internet connection adhering to Payment Card Industry ("PCI") data security standards. We believe our use of custom and off-the-shelf applications and programs gives us the ability to take advantage of standardization, while offering the flexibility and responsiveness to change. For example, in 2014 we launched a proprietary mobile payment solution that allows our customers to securely pay for fuel purchases at the pump. This offering is a more convenient way to initiate a fuel transaction, leverage the MAPCO Rewards Loyalty program, and generate an electronic receipt. We also continued the development project we launched in 2013 to upgrade our software and hardware design in order to take advantage of additional technologies and techniques not widely available today. This is a two- to three-year project of innovation that we believe will allow us to continually improve the customer experience, enhance revenue generation, and differentiate us in the marketplace.
Governmental Regulation and Environmental Matters
See Note 16 to the consolidated financial statements in Item 8, Financial Statements and Supplementary Data, of this Annual Report on Form 10-K, under the headings "Environmental Health and Safety" and "Rate Regulation of Petroleum Pipelines" for a complete discussion of governmental regulation and environmental matters.
Employees
As of December 31, 2014, we had 4,361 employees, of whom 840 were employed in our refining segment, 142 were employed by Delek for the benefit of our logistics segment, 3,097 were employed either full or part-time in our retail segment and 282 were employed at our corporate office. As of December 31, 2014, 161 operations and maintenance hourly employees and 40 truck drivers at the Tyler refinery were represented by the United Steel, Paper and Forestry, Rubber, Manufacturing, Energy, Allied Industrial and Service Workers International Union and its Local 202. The Tyler operations and maintenance hourly employees are currently covered by a collective bargaining agreement that expired January 31, 2015. National-level negotiations are currently ongoing between the International Union and a third party. While these negotiations are in process, we are operating under rolling, 24-hour extensions to this agreement. The Tyler truck drivers are currently covered by a collective bargaining agreement that expires March 1, 2015. Renewal negotiations for this agreement are in process but not yet finalized. In the event that the union strikes, Delek has a plan in place for continued operation of the Tyler refinery utilizing company employees and/or third party contractors. We do not anticipate these negotiations will prevent the continuous operation of the Tyler refinery. As of December 31, 2014, 167 operations and maintenance hourly employees at the El Dorado refinery were represented by the International Union of Operating Engineers and its Local 381. These employees are covered by a collective bargaining agreement which expires on August 1, 2017. None of our employees in our logistics or retail segments or in our corporate office are represented by a union. We consider our relations with our employees to be satisfactory.
Trade Names, Service Marks and Trademarks
We regard our intellectual property as being an important factor in the marketing of goods and services in our retail segment. We own, have registered or applied for registration of a variety of trade names, service marks and trademarks for use in our business including, without limitation, the following trademark registrations issued by the United States Patent and Trademark Office:
13
Trademark Registration | Segment | Expiration | ||
MAPCO® | Retail | January 29, 2018 | ||
MAPCO MART® | Retail | October 16, 2017 | ||
MAPCO EXPRESS & Design® | Retail | December 4, 2020 | ||
EAST COAST & Design® | Retail | September 10, 2016 | ||
FAVORITE MARKET & Design® | Retail | March 6, 2024 | ||
FM FAVORITE MARKETS® (stylized) | Retail | March 6, 2024 | ||
DELTA EXPRESS® (stylized) | Retail | April 26, 2018 | ||
MY REWARD$ & Design® | Retail | August 20, 2023 | ||
MY REWARD$® | Retail | February 24, 2025 | ||
FLEET ADVANTAGE® | Corporate & Other | May 30, 2016 | ||
FLEED ADVANTAGE & Design® | Corporate & Other | June 13, 2016 | ||
LION & Design® | Refining | May 3, 2015 | ||
Our right to use the "MAPCO" name is limited to the retail fuel and convenience store industry. We are not otherwise aware of any facts which would negatively impact our continuing use of any of our trade names, service marks or trademarks.
Available Information
Our Internet website address is www.DelekUS.com. Information contained on our website is not part of this Annual Report on Form 10-K. Our annual reports on Form 10-K, quarterly reports on Form 10-Q, current reports on Form 8-K and any amendments to such reports filed with or furnished to the Securities and Exchange Commission ("SEC") are available on our Internet website in the "Investor Relations" section, free of charge, as soon as reasonably practicable after we file or furnish such material to the SEC. We also post our Corporate Governance Guidelines, Code of Business Conduct & Ethics and the charters of our Board of Directors' committees in the "Corporate Governance" section of our website accessible by navigating to the "About Us" section on our Internet website. Our governance documents are available in print to any stockholder that makes a written request to the Secretary, Delek US Holdings, Inc., 7102 Commerce Way, Brentwood, Tennessee 37027.
14
Glossary of Terms
The following are definitions of certain industry terms used in this Annual Report on Form 10-K:
Alkylation Unit - A refinery unit utilizing an acid catalyst to combine smaller hydrocarbon molecules to form larger molecules in the gasoline boiling range to produce a high octane gasoline blendstock which is referred to as alkylate.
Amine Regeneration Unit (ARU) - A unit that is used to strip out absorbed sulfur-containing gases from the rich amine to restore the amine so it can be re-used again in the process as lean amine to absorb additional sulfur-containing gases (sour gas).
Barrel - A unit of volumetric measurement equivalent to 42 U.S. gallons.
Biodiesel - A renewable fuel produced from vegetable oils or animal fats that can be blended with petroleum-derived diesel to produce biodiesel blends for use in diesel engines. Pure biodiesel is referred to as B100, whereas blends of biodiesel are referenced by how much biodiesel is in the blend (e.g., a B5 blend contains five volume percent biodiesel and 95 volume percent ULSD).
Blendstocks - Various products or intermediate streams that are combined with other components of similar type and distillation range to produce finished gasoline, diesel fuel or other refined products. Blendstocks may include natural gasoline, hydrotreated Fluid Catalytic Cracking Unit gasoline, alkylate, ethanol, reformate, butane, diesel, biodiesel, kerosene, light cycle oil or slurry, among others.
Bpd/bpd - Barrels per calendar day.
Brent Crude (Brent) - a light, sweet crude oil, though not as light as WTI. Brent is the leading global price benchmark for Atlantic basin crude oils.
CBOB - Motor gasoline blending components intended for blending with oxygenates, such as ethanol, to produce finished conventional motor gasoline.
Crude Distillation Capacity, Nameplate Capacity or Production Capacity - The maximum sustainable capacity for a refinery or process unit for a given feedstock quality and severity level, measured in barrels per day.
Delayed Coking Unit (Coker) - A refinery unit that processes ("cracks") heavy oils, such as the bottom cuts of crude oil from the crude or vacuum units, to produce blendstocks for light transportation fuels or feedstocks for other units and petroleum coke.
Distillates - Products or intermediates that are normally initially produced via distillation and then further processed to produce finished fuels or blendstocks, including gasoline, kerosene, jet fuel and diesel.
Enterprise Products Pipeline System (Enterprise Pipeline System) - a major product pipeline transport system that reaches from the Gulf Coast into the northeastern United States.
Ethanol - An oxygenated blendstock that is blended with sub-grade (CBOB) or conventional gasoline to produce a finished gasoline.
E-10 - A 90% gasoline-10% ethanol blend.
E-15 - An 85% gasoline-15% ethanol blend.
E-85 - A blend of gasoline and 70%-85% ethanol.
FIFO - First-in, first-out inventory accounting method.
Fluid Catalytic Cracking Unit or FCC Unit - A refinery unit that uses fluidized catalyst at high temperatures to crack large hydrocarbon molecules into smaller, higher-valued molecules (LPG, gasoline, LCO, etc.).
Feedstocks - Crude oil and petroleum products used as inputs in refining processes.
15
Gulf Coast 5-3-2 crack spread or Gulf Coast crack spread - A crack spread reflecting the approximate gross margin resulting from processing one barrel of crude oil into three-fifths of a barrel of gasoline and two-fifths of a barrel of high sulfur diesel, utilizing the market prices of WTI crude oil, U.S. Gulf Coast Pipeline Conventional 87 CBOB and U.S. Gulf Coast Pipeline No. 2 Heating Oil.
Gulf Coast Region - Commonly referred to as PADD III, includes the states of Texas, Arkansas, Louisiana, Mississippi, Alabama and New Mexico.
Hydrotreating Unit - A refinery unit that removes sulfur and other contaminants from hydrocarbons at high temperatures and moderate to high pressure in the presence of catalysts and hydrogen. When used to process fuels, this unit reduces the sulfur dioxide emissions from these fuels.
Isomerization Unit - A refinery unit altering the arrangement of a molecule in the presence of a catalyst and hydrogen to produce a more valuable molecule, typically used to increase the octane of gasoline blendstocks.
Jobbers - Retail stations owned by third parties that sell products purchased from or through us.
Large-Format Store - A retail store location averaging or expecting to average, in the case of newly constructed locations, more than 1.85 million gallons of fuel annually.
LPG - Liquefied petroleum gas.
Light/Medium/Heavy Crude Oil - Terms used to describe the relative densities of crude oil, normally represented by their API gravities. Light crude oils (those having relatively high API gravities) may be refined into a greater amount of valuable products and are typically more expensive than a heavier crude oil.
LIFO - Last-in, first-out inventory accounting method.
Mid-Continent Region - Commonly referred to as PADD II, includes the states of North Dakota, South Dakota, Nebraska, Kansas, Oklahoma, Minnesota, Iowa, Missouri, Wisconsin, Illinois, Michigan, Indiana, Ohio, Kentucky and Tennessee.
NaSH Unit - A refinery process that uses caustic to capture hydrogen sulfide from sour gas streams to produce sodium hydrosulfide.
Naphtha - A hydrocarbon fraction that is used as a gasoline blending component, a feedstock for reforming and as a petrochemical feedstock.
Nelson Complexity Index - A measure of secondary conversion capacity of a refinery relative to its primary distillation capacity. Generally, more complex refineries have a higher index number.
NGL - Natural gas liquids.
New York Mercantile Exchange (NYMEX) - A commodities futures exchange.
Petroleum Administration for Defense District (PADD) - Any of five regions in the United States as set forth by the Department of Energy and used throughout the oil industry for geographic reference. Our refineries operate in PADD III, commonly referred to as the Gulf Coast region.
Petroleum Coke - A coal-like substance produced as a byproduct during the Delayed Coking refining process.
Pounds per Square Inch, Gauge (psig) - A unit of pressure.
Refining margin, refined product margin or crack spread - A metric used in the refining industry to assess a refinery's product margins by comparing the difference between the price of refined products produced at the refinery and the price of crude oil required to produce those products.
Reforming Unit - A refinery unit that uses high temperature, moderate pressure and catalyst to create petrochemical feedstocks, high octane gasoline blendstocks and hydrogen.
16
Renewable Fuels Standard 2 (RFS-2) - An EPA regulation promulgated pursuant to the Energy Independence and Security Act of 2007, which requires most refineries to blend increasing amounts of renewable fuels (including biodiesel and ethanol) with refined products.
Roofing flux - An asphalt-like product used to make roofing shingles for the housing industry.
Sweet/Sour crude oil - Terms used to describe the relative sulfur content of crude oil. Sweet crude oil is relatively low in sulfur content; sour crude oil is relatively high in sulfur content. Sweet crude oil requires less processing to remove sulfur and is typically more expensive than sour crude oil.
Throughput - The quantity of crude oil and feedstocks processed through a refinery or a refinery unit.
Turnaround - A periodic shutdown of refinery process units to perform routine maintenance to restore the operation of the equipment to its former level of performance. Turnaround activities normally include cleaning, inspection, refurbishment, and repair and replacement of equipment and piping. It is also common to use turnaround periods to change catalysts or to implement capital project improvements.
Ultra-Low Sulfur Diesel (ULSD) - Diesel fuel produced with a lower sulfur content (15 ppm) to reduce sulfur dioxide emissions. ULSD is the only diesel fuel that may be used for on-road and most other applications in the U.S.
U.S. Gulf Coast Pipeline Conventional 87 CBOB or U.S. Gulf Coast Unleaded Gasoline - A grade of gasoline commonly marketed as Regular Unleaded at retail locations.
U.S. Gulf Coast Pipeline No. 2 Heating Oil - A petroleum distillate that can be used as either a diesel fuel or a fuel oil. This is the standard by which other Gulf Coast distillate products (such as ultra-low sulfur diesel) are priced.
UST - Underground storage tank.
Vacuum Distillation Unit - A refinery unit that distills heavy crude oils under deep vacuum to allow their separation without coking.
West Texas Intermediate Crude Oil (WTI) - A light, sweet crude oil characterized by an API gravity between 38 and 44 and a sulfur content of less than 0.4 weight percent that is used as a benchmark for other crude oils.
17
ITEM 1A. RISK FACTORS
We are subject to numerous known and unknown risks, many of which are presented below and elsewhere in this Annual Report on Form 10-K. You should carefully consider each of the following risks and all of the other information contained in this Annual Report on Form 10-K in evaluating us and our common stock. Any of the risk factors described below or additional risks and uncertainties not presently known to us, or that we currently deem immaterial, could have a material adverse effect on our business, financial condition and results of operations.
Risks Relating to Our Industries
Our refining margins have been volatile and are likely to remain volatile, which may have a material adverse effect on our earnings and cash flows.
Our earnings, cash flow and profitability from our refining operations are substantially determined by the difference between the market price of refined products and the market price of crude oil, which is referred to as the crack spread, refining margin or refined products margin. Refining margins historically have been volatile and are likely to continue to be volatile, as a result of numerous factors beyond our control, including volatility in the prices of the various types of crude oil and other feedstocks purchased by our refineries, volatility in the costs of natural gas and electricity used by our refineries, and volatility in the prices of gasoline and other refined petroleum products sold by our refineries. Although we monitor our refinery operating margins and seek to optimize results by adjusting throughput volumes, throughput types and product slates, there are inherent limitations on our ability to offset the effects of adverse market conditions.
For example, although there are differences between published prices and margins and those experienced in our operations, certain published data illustrate the volatility we encounter. The NYMEX price for domestic light sweet crude oil (NYMEX: CL), the Argus price for WTI Midland crude oil, the U.S. Gulf Coast price for unleaded gasoline (Platts U.S. Gulf Coast Pipeline 87 CBOB), the U.S. Gulf Coast price for high sulfur diesel (Platts U.S. Gulf Coast Pipeline High Sulfur No. 2 Diesel), the Gulf Coast 5-3-2 crack spread and the differential between the price of NYMEX crude oil and Intercontinental Exchange ("ICE") Brent Crude Oil (ICE: B) have fluctuated between the following daily highs and lows during the preceding three calendar years:
Year Ended | Year Ended | Year Ended | ||||||||||||||||
December 31, 2014 | December 31, 2013 | December 31, 2012 | ||||||||||||||||
Low | High | Low | High | Low | High | |||||||||||||
NYMEX crude oil (per barrel) | $ | 53.27 | $ | 107.26 | $ | 86.68 | $ | 110.53 | $ | 77.69 | $ | 109.77 | ||||||
WTI — Midland crude oil (per barrel) | $ | 49.26 | $ | 101.07 | $ | 79.26 | $ | 110.43 | $ | 71.74 | $ | 106.74 | ||||||
U.S. Gulf Coast Unleaded Gasoline (per gallon) | $ | 1.08 | $ | 2.99 | $ | 2.28 | $ | 3.13 | $ | 2.27 | $ | 3.29 | ||||||
U.S. Gulf Coast High Sulfur Diesel (per gallon) | $ | 1.22 | $ | 2.98 | $ | 2.54 | $ | 3.23 | $ | 2.53 | $ | 3.26 | ||||||
U.S. Gulf Coast crack spread (per barrel) | $ | (3.91 | ) | $ | 21.36 | $ | 4.73 | $ | 37.07 | $ | 15.59 | $ | 39.05 | |||||
WTI — Cushing/Brent crude oil differential (per barrel) | $ | 1.77 | $ | 14.95 | $ | 0.02 | $ | 23.18 | $ | 9.17 | $ | 25.53 | ||||||
Such volatility is affected by, among other things:
• | changes in global and local economic conditions; |
• | domestic and foreign supply and demand for crude oil and refined products; |
• | the level of foreign and domestic production of crude oil and refined petroleum products; |
• | increased regulation of feedstock production activities such as hydraulic fracturing; |
• | infrastructure limitations that restrict, or events that disrupt, the distribution of crude oil, other feedstocks and refined petroleum products; |
• | the actual or perceived lessening of infrastructure limitations on the distribution of crude oil, other feedstocks or refined products; |
• | investor speculation in commodities; |
• | worldwide political conditions, particularly in significant oil producing regions such as the Middle East, Africa, the former Soviet Union, and South America; |
• | the ability of the members of the Organization of Petroleum Exporting Countries to maintain oil price and production controls; |
• | pricing and other actions taken by competitors that impact the market; |
• | the level of crude oil, other feedstocks and refined petroleum products imported into and exported out of the United States; |
• | excess capacity and utilization rates of refineries worldwide; |
18
• | development and marketing of alternative and competing fuels, such as ethanol and biodiesel; |
• | changes in fuel specifications required by environmental and other laws, particularly with respect to oxygenates and sulfur content; |
• | local factors, including market conditions, adverse weather conditions and the level of operations of other refineries and pipelines in our markets; |
• | accidents, interruptions in transportation, inclement weather or other events that can cause unscheduled shutdowns or otherwise adversely affect our refineries or the supply and delivery of crude oil from third parties; and |
• | U.S. government regulations. |
The crude oil we purchase and the refined products we sell are commodities whose prices are mainly determined by market forces beyond our control. While an increase or decrease in the price of crude oil will often result in a corresponding increase or decrease in the wholesale price of refined products, a change in the price of one commodity does not always result in a corresponding change in the other. A substantial or prolonged increase in crude oil prices without a corresponding increase in refined product prices or a substantial or prolonged decrease in refined product prices without a corresponding decrease in crude oil prices could also have a significant negative effect on our results of operations and cash flows. This is especially true for non-transportation refined products such as asphalt, butane, coke, sulfur, propane and slurry whose prices are less likely to correlate to fluctuations in the price of crude oil, all of which we produce at our refineries. For example, our refineries have been processing more light sweet crude oils than in the past due to increased local demand for gasoline and diesel fuels combined with lower pricing and demand for residual products, as well as through capital investments made by us that have increased their capacity to process light crudes. As a result, an increase in the cost of light sweet crude oils could have a material adverse effect on our business, financial condition and results of operations.
Also, the price for a significant portion of the crude oil processed at our refineries is based upon the WTI benchmark for such oil rather than the Brent benchmark. While the prices for WTI and Brent historically corresponded to one another, elevated inventories of WTI-priced crude oil in the Mid-Continent region have caused WTI prices to fall significantly below Brent prices at different points in time in recent years. During the years ended December 31, 2013 and December 31, 2014, this differential ranged from highs of $23.18 and $14.95, respectively, to lows of $0.02 and $1.77, respectively. Our ability to purchase and process favorably priced crude oils has allowed us to achieve higher net income and cash flow in recent years; however, we cannot assure you that these favorable conditions will continue. A substantial or prolonged narrowing in (or inversion to) the price differential between the WTI and Brent benchmarks for any reason, including, without limitation, increased crude oil distribution capacity from the Permian Basin and actual or perceived reductions in Mid-Continent crude oil inventories, could negatively impact our earnings and cash flows. In addition, because the premium or discount we pay for a portion of the crude oil processed at our refineries is established based upon this differential during the month prior to the month in which the crude oil is processed, rapid decreases in the differential may negatively affect our results of operations and cash flows.
Finally, higher refined product prices often result in negative consequences for our retail operations such as higher credit card expenses (because credit card interchange fees are typically calculated as a percentage of the transaction amount rather than a percentage of gallons sold), lower retail fuel gross margin per gallon, reduced demand for gasoline and diesel, resulting in fewer retail gallons sold and fewer retail merchandise transactions.
We operate in a highly regulated industry and increased costs of compliance with, or liability for violation of, existing or future laws, regulations and other requirements could significantly increase our costs of doing business, thereby adversely affecting our profitability.
Our industry is subject to extensive laws, regulations, permits and other requirements including, but not limited to, those relating to the environment, safety, transportation, pipeline tariffs, employment, labor, immigration, minimum wages and overtime pay, health care and benefits, working conditions, public accessibility, retail fuel pricing, the sale of alcohol and tobacco and other requirements. These permits, laws and regulations are enforced by federal agencies including the EPA, the U.S. Department of Transportation, the Pipeline and Hazardous Materials Safety Administration, the Federal Motor Carrier Safety Administration, the Federal Railroad Administration, OSHA, National Labor Relations Board, Equal Employment Opportunity Commission and FERC, and state agencies such as the Texas Commission on Environmental Quality and the ADEQ, the Railroad Commission of Texas and the Tennessee Department of Environment and Conservation as well as numerous other state and federal agencies. A violation of any of these requirements could have a material adverse effect on our business, financial condition and results of operations.
Various permits, licenses, registrations and other authorizations are required under these laws for the operation of our refineries, terminals, pipelines and related operations, and these permits are subject to renewal and modification that may require operational changes involving significant costs. If key permits cannot be renewed or are revoked, the ability to continue operation of the effected facilities could be threatened.
19
Ongoing compliance with laws, regulations and other requirements could also have a material adverse effect on our business, financial condition and results of operations. Under various federal, state and local environmental requirements, as the owner or operator of refineries, biodiesel plants, bulk terminals, pipelines, tank farms, rail cars, trucks and retail locations, we may be liable for the costs of removal or remediation of contamination at our existing or former locations, whether we knew of, or were responsible for, the presence of such contamination. We have incurred such liability in the past and several of our current and former locations are the subject of ongoing remediation projects. The failure to timely report and properly remediate contamination may subject us to liability to third parties and may adversely affect our ability to sell or rent our property or to borrow money using our property as collateral. Additionally, persons who arrange for the disposal or treatment of hazardous substances also may be liable for the costs of removal or remediation of these substances at sites where they are located, regardless of whether the site is owned or operated by that person. We typically arrange for the treatment or disposal of hazardous substances in our refining and other operations. Therefore, we may be liable for removal or remediation costs, as well as other related costs, including fines, penalties and damages resulting from injuries to persons, property and natural resources. Our El Dorado refinery is a minor potentially responsible party at a Superfund site for which we expect our costs to be non-material. In the future, we may incur substantial expenditures for investigation or remediation of contamination that has not been discovered at our current or former locations or locations that we may acquire.
In addition, new legal requirements, new interpretations of existing legal requirements, increased legislative activity and governmental enforcement and other developments could require us to make additional unforeseen expenditures. Companies in the petroleum industry, such as us, are often the target of activist and regulatory activity regarding pricing, safety, environmental compliance, derivatives trading and other business practices which could result in price controls, fines, increased taxes or other actions affecting the conduct of our business. For example, consumer activists are lobbying various authorities to enact laws and regulations mandating the removal of tetra-ethyl lead from aviation gasoline. Other activists seek to require reductions in greenhouse gas emissions from our refineries and fuel products and the use of temperature compensation devices for fuel dispensed at our retail stores.
In 2012, the EPA announced an industry-wide enforcement initiative directed at flaring operations and performance at refineries and petrochemical plants and finalized revisions to NSPS Subpart Ja that primarily affects flares and process heaters. Affected flares have three years to comply with the new standard and it is likely the standard will impact the way some flares at our refineries are designed and/or operated. We expect to complete capital projects at our refineries related to flare compliance with NSPS J by 2016. We believe our existing process heaters meet the applicable NSPS Ja requirements, and our refineries have not received any inquiries or requests for information from the EPA regarding flaring operations and are not a party to any associated enforcement action at this time. In 2014, the EPA also proposed to further regulate refinery air emissions from a variety of sources (such as cokers, flares, tanks, and other process units) through additional NSPS and National Emission Standards for Hazardous Air Pollutants and to change the way emissions from startup, shutdown and malfunction operations are regulated. Compliance with the rules as proposed could require additional capital projects and changes in the way we operate some equipment but is not expected to have a material adverse effect on our business, financial condition or results of operations.
In 2007, the EPA issued final Mobile Source Air Toxic II rules for gasoline formulation that required the reduction of average benzene content beginning January 1, 2011 and the reduction of maximum annual average benzene content by July 1, 2012. We currently purchase credits to comply with these content requirements for one of our refineries, but there can be no assurance that such credits will continue to be available for purchase at reasonable prices or at all. In March 2014, the EPA issued final Tier 3 gasoline rules that require a reduction in annual average gasoline sulfur content from 30 ppm to 10 ppm by January 1, 2017 for "large refineries" and retains the current maximum per-gallon sulfur content limit of 80 ppm. Under the final rules, both our refineries are considered “small refineries” and are exempt from complying with the rules' requirements until January 1, 2020. We anticipate that the Tyler refinery will meet these new limits when they become effective with only minor operational changes and that a minor capital project may be required for additional sulfur removal capacity at the El Dorado refinery, but compliance is not expected to have a material adverse effect on our business, financial condition or results of operations.
Environmental and safety regulations are becoming more stringent and new environmental and safety laws and regulations are continuously being enacted or proposed. Compliance with any future legislation or regulation of our produced fuels, including renewable fuel or carbon content; GHG emissions; sulfur, benzene or other toxic content; vapor pressure; or other fuel characteristics, may result in increased capital and operating costs and may have a material adverse effect on our results of operations and financial condition. Future process safety rules could also mandate changes to the way we operate, the processes and chemicals we use and the materials from which our process units are constructed. Such regulations could have a significant negative effect on our operations and profitability. While it is impractical to predict the impact that potential regulatory and activist activity may have, such future activity may result in increased costs to operate and maintain our facilities, as well as increased capital outlays to improve our facilities. Such future activity could also adversely affect our ability to expand production, result in damaging publicity about us, or reduce demand for our products. Our need to incur costs associated with complying with any resulting new legal or regulatory requirements that are substantial and not adequately provided for, could have a material adverse effect on our business, financial
20
condition and results of operations. For an example of a recently concluded regulatory action with the EPA, please see "Government Regulation and Environmental Matters" under Item 1, Business, and Item 3, Legal Proceedings, of this Annual Report on Form 10-K.
We are subject to regulation by the U.S. Department of Transportation and various state agencies in connection with our pipeline, trucking and rail transportation operations. These regulatory authorities exercise broad powers, governing activities such as the authorization to operate hazardous materials pipelines and engage in motor carrier operations. There are additional regulations specifically relating to the transportation industry, including integrity management of pipelines, testing and specification of equipment, product handling and labeling requirements and personnel qualifications. The transportation industry is subject to possible regulatory and legislative changes that may affect the economics of our business by requiring changes in operating practices or by changing the demand for common or contract carrier services or the cost of providing truckload services. Possible changes include, among other things, increasingly stringent environmental regulations, replacement of older pipelines, changes in the hours of service regulations that govern the amount of time a driver may drive in any specific period, onboard black box recorder devices or limits on vehicle weight and size. Proposed changes to the specifications governing rail cars carrying crude oil may eliminate the most commonly used tank car or require that such cars be upgraded. These rules could limit the availability of tank cars to transport crude to our refineries and increase the cost of crude oil transported by rail. In addition to the substantial remediation costs that could be caused by leaks or spills from our pipelines, regulators could prohibit our use of affected portions of the pipeline for extended periods thereby interrupting the delivery of crude oil to, or the distribution of refined products from, our refineries.
The Dodd-Frank Wall Street Reform and Consumer Protection Act (the "Dodd-Frank Act") is comprehensive financial reform legislation that, among other things, establishes comprehensive federal oversight and regulation of over-the-counter derivatives and many of the entities that participate in that market. Although the Dodd-Frank Act was enacted on July 21, 2010, the Commodity Futures Trading Commission, or CFTC, and the SEC, along with certain other regulators, must promulgate final rules and regulations to implement many of the Dodd-Frank Act's provisions relating to over-the-counter derivatives. While some of these rules have been finalized, others have not; and, as a result, the final form and timing of the implementation of the new regulatory regime affecting commodity derivatives remains uncertain.
Finally, the Patient Protection and Affordable Care Act (the “ACA”) as well as other healthcare reform legislation being considered by Congress and state legislatures may have an impact on our business. As of December 31, 2014, we had 4,361 employees, of whom 840 were employed in our refining segment, 142 were employed by Delek for the benefit of our logistics segment, 3,097 were employed either full or part-time in our retail segment and 282 were employed by Holdings. Although many of the rules, reforms and regulations required to implement the ACA have not yet been adopted, and consequently the precise costs of complying with the ACA remain unknown, an increase in our employee healthcare-related costs appears likely and that increase could be extensive and changes to our healthcare cost structure could have a significant, negative impact on our business.
Increased supply of and demand for alternative transportation fuels, increased fuel economy standards and increased use of alternative means of transportation could lead to a decrease in transportation fuel prices and/or a reduction in demand for petroleum-based transportation fuels. A shortage of RINs could require that our refineries operate at reduced production rates.
Pursuant to the EISA, the EPA promulgated RFS-2 requiring refiners to blend "renewable fuels" such as ethanol and biodiesel, with their petroleum fuels or purchase RINs in lieu of blending. The volume of renewable fuels required by the EISA increases from 9 billion gallons in 2008 to 36 billion gallons in 2022. Annually, the EPA establishes the volume of renewable fuels that refineries must blend into their finished petroleum fuels as a percentage of their gasoline and diesel sales. RFS-2 requires displacing increasing amounts of petroleum-based transportation fuels with biofuels, beginning with approximately 7.8% in 2011, 11% in 2015 and 18% or more in 2022, depending on demand for gasoline and diesel and final biofuel volumes established by EPA each year. If we are unable to pass the costs of compliance with RFS-2 on to our customers, our profits will be adversely impacted. Moreover, the market prices for RINs have been volatile. If we have to pay a significantly higher price for RINs, if sufficient RINs are unavailable for purchase or if we are otherwise unable to meet the RFS-2 mandates, our business, financial condition and results of operations could be materially adversely affected.
Meeting the RFS-2 volume requirements now requires more ethanol to be blended than can be achieved with just 10% ethanol gasoline blends (E-10). In 2011, the EPA approved E-15 for use in model year 2001 and later vehicles. However, studies show that E-15 may cause engine and fuel system damage and most vehicle manufacturers do not recommend using E-15 in vehicles manufactured prior to 2013 or 2014 other than"Flex Fuel" vehicles. In addition, most existing USTs and retail dispenser systems are not certified by Underwriters Laboratory, local fire codes or the EPA for use with gasoline blends containing more than 10% ethanol. Flex Fuel vehicles can utilize E-85 but there are relatively few such vehicles on the road, there are few E-85 retail locations and the use of E-85 results in significant reductions in fuel economy. These and other impediments may present challenges to blending the required volumes of ethanol. If adequate supplies of the required types of biofuels are unavailable in volumes sufficient
21
to meet our requirement, if we are unable to physically blend the required biofuel volumes without exceeding 10% ethanol, or if RINs are not available in sufficient volumes or at economical prices, refinery production or profitability could be negatively affected.
In addition, as regulatory initiatives have required an increase in the consumption of renewable transportation fuels such as ethanol and biodiesel, consumer acceptance of electric, hybrid and other alternative vehicles is increasing. Increased use of renewable fuels and alternative vehicles may result in a decrease in demand for petroleum-based transportation fuels. Increased use of renewable fuels may also result in an increase in transportation fuel supply relative to decreased demand and a corresponding decrease in margins. A significant decrease in transportation fuel margins or demand for petroleum-based transportation fuels could have an adverse impact on our financial results. As described above, RFS-2 requires replacement of increasing amounts of petroleum-based transportation fuels with biofuels through 2022. RFS-2 and widespread use of E-15 or E-85 could cause decreased crude runs and materially affect our profitability unless fuel demand rises at a comparable rate or other outlets are found for the displaced petroleum products.
Finally, the EPA and the National Highway Traffic Safety Administration ("NHTSA") finalized new standards in 2010 that raised the required Corporate Average Fuel Economy ("CAFE") of the nation's passenger fleet by 40% to approximately 35 mpg by 2016 and imposed the first-ever federal GHG emissions standards on cars and light trucks. In September 2011, the EPA and the Department of Transportation finalized first-time standards for fuel economy of medium and heavy duty trucks. In September 2012, the EPA and NHTSA finalized rules raising the CAFE and GHG standards for passenger vehicles beginning with 2017 model year vehicles and increasing to the equivalent of 54.5 mpg by 2025. Such increases in fuel economy standards and potential electrification of the vehicle fleet, along with mandated increases in use of renewable fuels discussed above, could result in decreasing demand for petroleum fuels which, in turn, could materially affect profitability at our refineries and convenience stores.
We operate independent refineries which may not be able to withstand volatile market conditions, compete on the basis of price or obtain sufficient quantities of crude oil in times of shortage to the same extent as integrated, multinational oil companies.
We compete with a broad range of companies in our refining and petroleum product marketing operations. Many of these competitors are integrated, multinational oil companies that are substantially larger than us. Because of their diversity, integration of operations, larger capitalization, larger and more complex refineries and greater resources, these companies may be better able to withstand volatile market conditions relating to crude oil and refined product pricing, to compete on the basis of price and to obtain crude oil in times of shortage.
We do not engage in petroleum exploration or production and therefore do not produce any of our crude oil feedstocks. Certain of our competitors, however, obtain a portion of their feedstocks from company-owned production activities. Competitors that have their own crude oil production are at times able to offset losses from refining operations with profits from producing operations and may be better positioned to withstand periods of depressed refining margins or feedstock shortages. If we are unable to compete effectively with these competitors, there could be a material adverse effect on our business, financial condition, and results of operations.
Decreases in commodity prices may lessen our borrowing capacities, increase collateral requirements for derivative instruments or cause a write-down of inventory.
The nature of our business requires us to maintain substantial quantities of crude oil, refined petroleum product and blendstock inventories. Because these inventories are commodities, we have no control over their changing market value. For example, reductions in the value of our inventories or accounts receivable as a result of lower commodity prices could result in a reduction in our borrowing base under the Tyler refinery's revolving credit facility and a reduction in the amount of financial resources available to meet the Tyler and El Dorado refineries' credit requirements. Further, if at any time our availability under the revolving credit facility falls below certain thresholds, we may be required to take steps to reduce our utilization under the credit facility. In addition, changes in commodity prices may require us to post substantial amounts of cash collateral to some or all of our hedging counterparties in order to maintain hedging positions. Finally, because our inventory is valued at the lower of cost or market value, we would record a write-down of inventory and a non-cash charge to cost of sales if the market value of the inventory were to decline to an amount below our cost.
A terrorist attack on our assets, or threats of war or actual war, may hinder or prevent us from conducting our business.
Terrorist attacks in the United States, as well as events occurring in response to or in connection with them, including political instability in various Middle Eastern countries, may harm our business. Energy-related assets (which could include refineries, pipelines and terminals such as ours) may be at greater risk of future terrorist attacks than other possible targets in the United States.
22
A direct attack on our assets or the assets of others used by us could have a material adverse effect on our business, financial condition and results of operations. In addition, any terrorist attack or continued political instability in the Middle East could have an adverse impact on energy prices, including prices for crude oil, other feedstocks and refined petroleum products, and an adverse impact on the margins from our refining and petroleum product marketing operations. Disruption or significant increases in energy prices could also result in government-imposed price controls.
Legislative and regulatory measures to address climate change and GHG emissions could increase our operating costs or decrease demand for our refined products.
Various legislative and regulatory measures to address climate change and GHG emissions (including carbon dioxide, methane and nitrous oxides) are in various phases of discussion or implementation. They include proposed and recently enacted federal regulation and state actions to develop statewide, regional or nationwide programs designed to control and reduce GHG emissions from fixed sources, such as our refineries and coal-fired power plants, as well as mobile transportation sources and fuels. Although it is not possible to predict the requirements of any GHG legislation that may be enacted, any laws or regulations that have been or may be adopted to restrict or reduce GHG emissions will likely require us to incur increased operating and capital costs and/or increased taxes on GHG emissions and petroleum fuels. If we are unable to maintain sales of our refined products at a price that reflects such increased costs, there could be a material adverse effect on our business, financial condition and results of operations. Further, any increase in the prices of refined products resulting from such increased costs, GHG cap and trade programs or taxes on GHGs, could have a material adverse effect on our business, financial condition or results of operations.
Since the 2010 calendar year, EPA rules require that we report GHG emissions from our refinery operations and consumer use of products produced at our refineries on an annual basis. While the cost of compliance with the rule is not material, data gathered under the rule may be used in the future to support additional regulation of GHGs. In January 2011, the EPA began regulating GHG emissions from refineries and other major sources through the PSD and Federal Operating Permit (Title V) programs. While these rules do not impose any limits or controls on GHG emissions from current operations, emission increases from future projects or operational changes, such as capacity increases, may be impacted and required to meet emission limits or technological requirements such as Best Available Control Technologies. The EPA recently proposed rules to limit GHG emissions from new and existing coal and natural gas electric generating plants and has announced its intent to further regulate refinery GHG emissions through a NSPS, although the timing of the EPA's proposal for refineries is currently unclear. GHG regulation, including taxes on the GHG content of fuels, could also impact the consumption of refined products, thereby affecting our refinery operations.
Our retail segment is subject to loss of market share or pressure to reduce prices in order to compete effectively with a changing group of competitors in a fragmented retail industry.
The markets in which we operate our retail fuel and convenience stores are highly competitive and characterized by ease of entry and constant change in the number and type of retailers offering the products and services found in our stores. We compete with other convenience store chains, gas stations, supermarkets, drug stores, discount stores, club stores, mass merchants, fast food operations, independent owner-operators and other retail outlets. In some of our markets, our competitors have been in existence longer and have greater financial, marketing and other resources than us. In addition, independent owner-operators can generally operate stores with lower overhead costs than ours. As a result, our competitors may be able to respond better to changes in the economy and new opportunities within the industry.
In recent years, several non-traditional retailers, such as supermarkets, club stores and mass merchants, have affected the convenience store industry by entering the retail fuel business and/or selling merchandise traditionally found in convenience stores. These non-traditional gasoline and/or convenience merchandise retailers have obtained a significant share of the motor fuels market, may obtain a significant share of the convenience merchandise market and their market share in each market is expected to grow. Because of their diversity, integration of operations, experienced management and greater resources, these companies may be better able to withstand volatile market conditions or levels of low or no profitability in the retail segment. In addition, these retailers may use promotional pricing or discounts, both at the pump and in the store, to encourage in-store merchandise sales. These activities by our competitors could pressure us to offer similar discounts, adversely affecting our profit margins. Additionally, the loss of market share by our retail fuel and convenience stores to these and other retailers relating to either gasoline or merchandise could have a material adverse effect on our business, financial condition and results of operations.
23
Risks Relating to Our Business
We are particularly vulnerable to disruptions to our refining operations because our refining operations are concentrated in two facilities.
Because all of our refining operations are concentrated in the Tyler and El Dorado refineries, significant disruptions at either facility could have a material adverse effect on our business, financial condition or results of operations. Refining segment contribution margin comprised approximately 76.0%, 79.2% and 91.9% of our consolidated contribution margin for the 2014, 2013 and 2012 fiscal years, respectively. We completed a maintenance turnaround of each processing unit at our El Dorado refinery in February 2014 and expect to complete a significant maintenance turnaround at our Tyler refinery in the first quarter of 2015. Depending on which units are affected, all or a portion of a refinery's production may be halted or disrupted during a turnaround.
In addition, our refineries consist of many processing units, a number of which have been in operation for many years. Even if properly maintained, equipment may require significant capital expenditures to maintain desired efficiencies. One or more of the units may require additional unscheduled down time for unanticipated maintenance or repairs that are more frequent than our scheduled turnarounds. For example, an explosion and fire at the Tyler refinery in November 2008 suspended operations for more than five months.
Refinery operations may also be disrupted by external factors such as a suspension of feedstock deliveries or an interruption of electricity, natural gas, water treatment or other utilities. Other potentially disruptive factors discussed elsewhere in these risk factors include natural disasters, severe weather conditions, workplace or environmental accidents, interruptions of supply, work stoppages, losses of permits or authorizations or acts of terrorism. Disruptions to our refining operations could reduce our revenues during the period of time that our processing units are not operating.
The dangers inherent in transporting, storing and processing crude oil and intermediate and finished petroleum products could cause disruptions and expose us to potentially significant costs and liabilities.
Our refining and logistics operations are subject to significant hazards and risks inherent in transporting, storing and processing crude oil and intermediate and finished petroleum products. These hazards and risks include, but are not limited to, natural or weather-related disasters, fires, explosions, pipeline ruptures and spills, trucking accidents, train derailments, third-party interference, mechanical failure of equipment and other events beyond our control. The occurrence of any of these events could result in production and distribution difficulties and disruptions, personal injury or death, environmental pollution and other damage to our properties and the properties of others. For example, an explosion and fire at our Tyler refinery in November 2008 resulted in two employee deaths, third-party claims and a suspension of production that continued for more than five months. In addition, we have detected several crude oil releases from pipelines owned by our logistics segment, including, without limitation, releases at Magnolia Station in March 2013, Macedonia, Arkansas in October 2013 and Haynesville, Louisiana in April 2014. Each of these releases resulted in the need for clean-up and remediation efforts.
Because of these inherent dangers, our refining and logistics operations are subject to various laws and regulations relating to occupational health and safety, process and operating safety and environmental protection. Continued efforts to comply with applicable laws and regulations related to health, safety and the environment, or a finding of non-compliance with current regulations, could result in additional capital expenditures or operating expenses, as well as fines and penalties.
In addition, our refineries, pipelines and terminals are located in populated areas and any release of hazardous material or catastrophic event could affect our employees and contractors as well as persons outside our property. Our pipelines, trucks and rail cars carry flammable and toxic materials on public railways and roads and across populated and/or environmentally sensitive areas and waterways that could be severely impacted in the event of a release. An accident could result in significant personal injuries and/or cause a release that results in damage to occupied areas as well as damage to natural resources. It could also affect deliveries of crude oil to our refineries resulting in a curtailment of operations. The cost to remediate such an accidental release and address other potential liabilities as well as the costs associated with any interruption of operations could be substantial. Although we maintain significant insurance coverage for such events, it may not cover all potential losses or liabilities.
In the event that personal injuries or deaths result from such events, or there are natural resource damages, we would likely incur substantial legal costs and liabilities. The extent of these costs and liabilities could exceed the limits of our available insurance. As a result, any such event could have a material adverse effect on our business, results of operations and cash flows.
24
The costs, scope, timelines and benefits of our refining projects may deviate significantly from our original plans and estimates.
We may experience unanticipated increases in the cost, scope and completion time for our improvement, maintenance and repair projects at our refineries. Refinery projects are generally initiated to increase the yields of higher-value products, increase our ability to process a variety of crude oils, increase production capacity, meet new regulatory requirements or maintain the safe and reliable operations of our existing assets. Equipment that we require to complete these projects may be unavailable to us at expected costs or within expected time periods. Additionally, employee or contractor labor expense may exceed our expectations. Due to these or other factors beyond our control, we may be unable to complete these projects within anticipated cost parameters and timelines. In addition, the benefits we realize from completed projects may take longer to achieve and/or be less than we anticipated. Our inability to complete and/or realize the benefits of refinery projects in a cost-efficient and timely manner could have a material adverse effect on our business, financial condition and results of operations.
We depend upon our logistics segment for a substantial portion of the crude oil supply and refined product distribution networks that serve our refineries.
Our logistics segment consists of Delek Logistics, a publicly traded master limited partnership, and our consolidated financial statements include its consolidated financial results. As of December 31, 2014, we owned a 59.9% limited partner interest in Delek Logistics, and a 95.8% interest in Logistics GP, which owns the entire 2.0% general partner interest in Delek Logistics. Delek Logistics operates a system of crude oil and refined product pipelines, distribution terminals and tankage in Arkansas, Louisiana, Tennessee and Texas. Delek Logistics generates revenues by charging tariffs for transporting crude oil and refined products through its pipelines, by leasing pipeline capacity to third parties, by charging fees for terminalling refined products and other hydrocarbons and storing and providing other services at its terminals.
Our refineries are substantially dependent upon Delek Logistics' assets and services under several long-term pipeline and terminal, tankage and throughput agreements expiring in 2017 through 2030. Delek Logistics is subject to its own operating and regulatory risks, including, but not limited to:
• | its reliance on significant customers, including us; |
• | macroeconomic factors such as commodity price volatility that could affect its customers' utilization of its assets; |
• | its reliance on us for near-term growth; |
• | sufficiency of cash flow for required distributions; |
• | counterparty risks such as creditworthiness and force majeure; |
• | competition from third-party pipelines and terminals and other competitors in the transportation and marketing industries; |
• | environmental regulations; |
• | operational hazards and risks; |
• | pipeline tariff regulations; |
• | limitations on additional borrowings and other restrictions in its debt agreements; and |
• | other financial, operational and legal risks. |
The occurrence of any of these risks could directly or indirectly affect Delek Logistics' financial condition, results of operations and cash flows. Because Delek Logistics is our consolidated subsidiary, the occurrence of any of these risks could also affect our financial condition, results of operations and cash flows. Additionally, if any of these risks affect Delek Logistics' viability, its ability to serve our supply and distribution needs will be jeopardized.
For additional information about Delek Logistics, see "Logistics Segment" under Item 1, Business, and "Terminals and Pipelines" under Item 2, Properties, of this Annual Report on Form 10-K.
25
Interruptions or limitations in the supply and delivery of crude oil or the supply and distribution of refined products may negatively affect our refining operations and inhibit the growth of our refining operations.
We rely on Delek Logistics and third-party transportation systems for the delivery of crude oil to our refineries. For example, during the year ended December 31, 2014, we relied upon the West Texas Gulf pipeline for the delivery of approximately 67.0% of the crude oil processed by our refineries. We could experience an interruption or reduction of supply and delivery, or an increased cost of receiving crude oil, if the ability of these systems to transport crude oil is disrupted because of accidents, adverse weather conditions, governmental regulation, terrorism, maintenance or failure of pipelines or other delivery systems, other third-party action or other events beyond our control. The unavailability for our use for a prolonged period of time of any system of delivery of crude oil could have a material adverse effect on our business, financial condition or results of operations. For example, on two separate occasions since we assumed control of the El Dorado refinery in April 2011, a third-party pipeline operator has temporarily suspended crude oil shipments on a pipeline system that has historically supplied significant amounts of crude oil to the refinery. In May 2011, the suspension resulted from flooding along the Mississippi River and lasted approximately five weeks. In April 2012, the suspension resulted from a pipeline rupture and lasted approximately ten months. In each instance, the El Dorado refinery operated at reduced throughput rates until the pipeline system resumed normal operations.
Moreover, interruptions in delivery or limitations in delivery capacity may not allow our refining operations to draw sufficient crude oil to support current refinery production or increases in refining output. In order to maintain or materially increase refining output, existing crude delivery systems may require upgrades or supplementation, which may require substantial additional capital expenditures.
In addition, the El Dorado refinery distributes most of its light product production through a third-party pipeline system. An interruption to or change in the operation of the third-party pipeline system may result in a material restriction to our distribution channels. Because demand in the El Dorado market is limited, a material restriction to the El Dorado refinery's distribution channels may cause us to reduce production and may have a material adverse effect on our business, financial condition and results of operations.
Finally, our West Texas terminals sell refined products produced by refineries owned mostly by third parties. In 2014, these terminals received a majority of their supply of refined products from a single supplier. We could experience an interruption or termination of supply or delivery of refined products if our suppliers partially or completely ceased operations, temporarily or permanently. The ability of these refineries and our suppliers to supply refined products to us could be disrupted by anticipated events such as scheduled upgrades or maintenance, as well as events beyond their control, such as unscheduled maintenance, fires, floods, storms, explosions, power outages, accidents, acts of terrorism or other catastrophic events, labor difficulties and work stoppages, governmental or private party litigation, or legislation or regulation that adversely impacts refinery operations. In addition, any reduction in capacity of other pipelines that connect with our suppliers' pipelines or our pipelines due to testing, line repair, reduced operating pressures, or other causes could result in reduced volumes of refined product supplied to our West Texas terminals. A reduction in the volume of refined products supplied to our West Texas terminals could adversely affect our sales and earnings.
General economic conditions may adversely affect our business, operating results and financial condition.
Economic slowdowns may have serious negative consequences for our business and operating results because our performance is subject to domestic economic conditions and their impact on levels of consumer spending. Some of the factors affecting consumer spending include general economic conditions, unemployment, consumer debt, reductions in net worth based on declines in equity markets and residential real estate values, adverse developments in mortgage markets, taxation, energy prices, interest rates, consumer confidence and other macroeconomic factors. During a period of economic weakness or uncertainty, current or potential customers may travel less, reduce or defer purchases, go out of business or have insufficient funds to buy or pay for our products and services. Moreover, a financial market crisis may have a material adverse impact on financial institutions and limit access to capital and credit. This could, among other things, make it more difficult for us to obtain (or increase our cost of obtaining) capital and financing for our operations. Our access to additional capital may not be available on terms acceptable to us or at all.
Also, because both of our refineries are located in the Gulf Coast Region, we primarily market our refined products in a relatively limited geographic area. As a result, we are more susceptible to regional economic conditions compared to our more geographically diversified competitors, and any unforeseen events or circumstances that affect the Gulf Coast Region could also materially and adversely affect our revenues and cash flows. The primary factors include, among other things, changes in the economy, weather conditions, demographics and population, increased supply of refined products from competitors and reductions in the supply of crude oil or other feedstocks. In the event of a shift in the supply/demand balance in the Gulf Coast Region due to changes in the local economy, an increase in aggregate refining capacity or other reasons, resulting in supply
26
exceeding the demand in the region, our refineries may have to deliver refined products to more customers outside of the Gulf Coast Region and thus incur considerably higher transportation costs, resulting in lower refining margins, if any.
Finally, substantially all of our retail fuel and convenience stores are located in the southeastern United States and approximately 92% of them were situated in the states of Alabama, Georgia and Tennessee at December 31, 2014. As a result, our results of operations are particularly vulnerable to general economic conditions in that region. An economic downturn in the southeastern United States could cause our sales and the value of our assets to decline and have a material adverse effect on our business, financial condition and results of operations.
From time to time, our cash and credit needs may exceed our internally generated cash flow and available credit, and our business could be materially and adversely affected if we are not able to obtain the necessary cash or credit from financing sources.
We have significant short-term cash needs to satisfy working capital requirements such as crude oil purchases which fluctuate with the pricing and sourcing of crude oil. We rely in part on our access to credit to purchase crude oil for our refineries. If the price of crude oil increases significantly, we may not have sufficient available credit, and may not be able to sufficiently increase such availability, under our existing credit facilities or other arrangements to purchase enough crude oil to operate our refineries at desired capacities. Our failure to operate our refineries at desired capacities could have a material adverse effect on our business, financial condition and results of operations. We also have significant long-term needs for cash, including any capital expenditures for expansion and upgrade plans, as well as projects necessary for regulatory compliance.
Depending on the conditions in credit markets, it may become more difficult to obtain cash or credit from third-party sources. If we cannot generate cash flow or otherwise secure sufficient liquidity to support our short-term and long-term capital requirements, we may not be able to comply with regulatory deadlines or pursue our business strategies, in which case our operations may not perform as well as we currently expect.
Our debt levels may limit our flexibility in obtaining additional financing and in pursuing other business opportunities.
As of December 31, 2014, we had total debt of $589.7 million, including current maturities of $56.4 million. In addition to our outstanding debt, as of December 31, 2014, our letters of credit issued under our various credit facilities were $102.7 million. Our borrowing availability under our various credit facilities as of December 31, 2014 was $708.5 million.
Our level of debt could have important consequences for us. For example, it could:
• | increase our vulnerability to general adverse economic and industry conditions; |
• | require us to dedicate a substantial portion of our cash flow from operations to service our debt and lease obligations, thereby reducing the availability of our cash flow to fund working capital, capital expenditures and other general corporate purposes; |
• | limit our flexibility in planning for, or reacting to, changes in our business and the industry in which we operate; |
• | place us at a disadvantage relative to our competitors that have less indebtedness or better access to capital by, for example, limiting our ability to enter into new markets, upgrade our refining assets, renovate our stores or pursue acquisitions or other business opportunities; |
• | limit our ability to borrow additional funds in the future; and |
• | increase interest costs for our borrowed funds and letters of credit. |
In addition, a substantial portion of our debt has a variable rate of interest, which increases our exposure to interest rate fluctuations, to the extent we elect not to hedge such exposures.
If we are unable to meet our principal and interest obligations under our debt and lease agreements, we could be forced to restructure or refinance our obligations, seek additional equity financing or sell assets, which we may not be able to do on satisfactory terms or at all. Our default on any of those agreements could have a material adverse effect on our business, financial condition and results of operations. In addition, if new debt is added to our current debt levels, the related risks that we now face could intensify.
Our debt agreements contain operating and financial restrictions that might constrain our business and financing activities.
The operating and financial restrictions and covenants in our credit facilities and any future financing agreements could adversely affect our ability to finance future operations or capital needs or to engage in, expand or pursue our business activities. For example, to varying degrees our credit facilities restrict our ability to:
27
• | declare dividends and redeem or repurchase capital stock; |
• | prepay, redeem or repurchase debt; |
• | make loans and investments, issue guaranties and pledge assets; |
• | incur additional indebtedness or amend our debt and other material agreements; |
• | make capital expenditures; |
• | engage in mergers, acquisitions and asset sales; and |
• | enter into certain intercompany arrangements or make certain intercompany payments, which in some instances could restrict our ability to use the assets, cash flows or earnings of one operating segment to support another operating segment or Holdings. |
Other restrictive covenants require that we meet certain financial covenants, including leverage coverage, fixed charge coverage and net worth tests as described in the applicable credit agreements. In addition, the covenant requirements of our various credit agreements require us to make many subjective determinations pertaining to our compliance thereto and exercise good faith judgment in determining our compliance.
Our ability to comply with the covenants and restrictions contained in our debt instruments may be affected by events beyond our control, including prevailing economic, financial and industry conditions. If market or other economic conditions deteriorate, our ability to comply with these covenants and restrictions may be impaired. If we breach any of the restrictions or covenants in our debt agreements, a significant portion of our indebtedness may become immediately due and payable, and our lenders' commitments to make further loans to us may terminate. We might not have, or be able to obtain, sufficient funds to make these immediate payments. In addition, our obligations under our credit facilities are secured by substantially all of our assets. If we are unable to timely repay our indebtedness under our credit facilities, the lenders could seek to foreclose on the assets or we may be required to contribute additional capital to our subsidiaries. Any of these outcomes could have a material adverse effect on our business, financial condition and results of operations.
Changes in our credit profile could affect our relationships with our suppliers, which could have a material adverse effect on our liquidity and our ability to operate our refineries at full capacity.
Changes in our credit profile could affect the way crude oil, feedstock and refined product suppliers view our ability to make payments. As a result, suppliers could shorten the payment terms of their invoices with us or require us to provide significant collateral to them that we do not currently provide. Due to the large dollar amounts and volume of our crude oil and other petroleum product purchases, as well as the historical volatility of crude oil pricing, any imposition by our suppliers of more burdensome payment terms or collateral requirements may have a material adverse effect on our liquidity and our ability to make payments to our suppliers. This, in turn, could cause us to be unable to operate our refineries at desired capacities. A failure to operate our refineries at desired capacities could adversely affect our profitability and cash flows.
The termination or expiration of our Amended and Restated Master Supply and Offtake Agreement could have a material adverse effect on our liquidity.
On December 23, 2013, we entered into the S&O Agreement with J. Aron, which became effective on April 30, 2014 and expires on April 30, 2017. Pursuant to the agreement, J. Aron purchases a substantial portion of the crude oil and refined products in Lion Oil’s inventory at market prices. Upon any termination of the agreement, including at expiration or in connection with a force majeure or default, the parties are required to negotiate with third parties for the assignment to us of certain contracts, commitments and arrangements including procurement contracts, commitments for the sale of product, and pipeline, terminalling, storage and shipping arrangements. Additionally, upon any termination, we will be required to repurchase or refinance the consigned crude oil and refined products from J. Aron at then market prices, which may have a material impact on our working capital needs. At December 31, 2014, we had approximately 3.2 million barrels of inventory consigned to J. Aron, and we had recorded a liability associated with this consigned inventory of $200.9 million.
Our insurance policies do not cover all losses, costs or liabilities that we may experience, and insurance companies that currently insure companies in the energy industry may cease to do so or substantially increase premiums.
We carry property, business interruption, pollution and casualty insurance, but we do not maintain insurance coverage against all potential losses, costs or liabilities. We could suffer losses for uninsurable or uninsured risks or in amounts in excess of existing insurance coverage. In addition, because our business interruption policy does not cover losses during the first 21 to 60 days of the interruption, a significant part or all of a business interruption loss could be uninsured. The occurrence of an event that is not fully covered by insurance could have a material adverse effect on our business, financial condition and results of operations.
28
The energy industry is highly capital intensive, and the entire or partial loss of individual facilities or multiple facilities can result in significant costs to both industry companies, such as us, and their insurance carriers. In recent years, several large energy industry claims have resulted in significant increases in the level of premium costs and deductible periods for participants in the energy industry. For example, hurricanes have caused significant damage to several petroleum refineries along the Gulf Coast, in addition to numerous oil and gas production facilities and pipelines in that region. As a result of large energy industry claims, insurance companies that have historically participated in underwriting energy-related facilities may discontinue that practice, may reduce the insurance capacity they are willing to offer or demand significantly higher premiums or deductible periods to cover these facilities. If significant changes in the number or financial solvency of insurance underwriters for the energy industry occur, or if other adverse conditions over which we have no control prevail in the insurance market, we may be unable to obtain and maintain adequate insurance at reasonable cost.
In addition, we cannot assure you that our insurers will renew our insurance coverage on acceptable terms, if at all, or that we will be able to arrange for adequate alternative coverage in the event of non-renewal. The unavailability of full insurance coverage to cover events in which we suffer significant losses could have a material adverse effect on our business, financial condition and results of operations.
We may not be able to successfully execute our strategy of growth through acquisitions.
A significant part of our growth strategy is to acquire assets such as refineries, pipelines, terminals, and retail fuel and convenience stores that complement our existing assets and/or broaden our geographic presence. If attractive opportunities arise, we may also acquire assets in new lines of business that are complementary to our existing businesses. From our inception in 2001 through December 2014, we acquired the Tyler and El Dorado refineries, acquired approximately 500 retail fuel and convenience stores and developed our logistics segment through the acquisition of transportation and marketing assets. We expect to continue to acquire assets that complement our existing assets and/or broaden our geographic presence as a major element of our growth strategy, however:
• | we may not be able to identify suitable acquisition candidates or acquire additional assets on favorable terms; |
• | we usually compete with others to acquire assets, which competition may increase, and, any level of competition could result in decreased availability or increased prices for acquisition candidates; |
• | we may experience difficulty in anticipating the timing and availability of acquisition candidates; |
• | we may not be able to obtain the necessary financing, on favorable terms or at all, to finance any of our potential acquisitions; |
• | as a public company, we are subject to reporting obligations, internal controls and other accounting requirements with respect to any business we acquire, which may prevent or negatively affect the valuation of some acquisitions we might otherwise deem favorable or increase our acquisition costs. For example, prior to April 2011, the El Dorado refinery was controlled by a privately held entity that was not required to comply with public financial reporting obligations such as the Securities Exchange Act of 1934 and the management certification and auditor attestation requirements of Section 404 of the Sarbanes-Oxley Act of 2002. Now that we control the El Dorado refinery, we must ensure that it maintains appropriate disclosure controls and procedures and internal control over financial reporting. |
The occurrence of any of these factors could adversely affect our growth strategy.
Acquisitions involve risks that could cause our actual growth or operating results to differ adversely compared with our expectations.
Due to our emphasis on growth through acquisitions, we are particularly susceptible to transactional risks that could cause our actual growth or operating results to differ adversely compared with our expectations. For example:
• | during the acquisition process, we may fail or be unable to discover some of the liabilities of companies or businesses that we acquire; |
• | we may assume contracts or other obligations in connection with particular acquisitions on terms that are less favorable or desirable than the terms that we would expect to obtain if we negotiated the contracts or other obligations directly; |
• | we may fail to successfully integrate or manage acquired assets; |
• | acquired assets may not perform as we expect or we may not be able to obtain the cost savings and financial improvements we anticipate; |
• | acquisitions may require us to incur additional debt or issue additional equity; |
• | acquired assets may suffer a diminishment in fair value as a result of which we may need to record a write-down or impairment (such as the $60.0 million impairment of our minority investment in Lion Oil in the fourth quarter of 2010); |
29
• | we may fail to grow our existing systems, financial controls, information systems, management resources and human resources in a manner that effectively supports our growth; |
• | to the extent that we acquire assets in new lines of business, we may become subject to additional regulatory requirements and additional risks that are characteristic or typical of these lines of business; and |
• | to the extent that we acquire equity interests in entities that control assets (rather than acquiring the assets directly), we may become subject to liabilities that predate our ownership and control of the assets. For example, in 2011, we acquired all of the outstanding shares of common stock of Lion Oil, the Arkansas corporation that owns and operates the El Dorado refinery. Because we acquired the stock of Lion Oil (rather than acquiring the refinery assets directly), we may be subject to Lion Oil's historic liabilities. |
The occurrence of any of these factors could adversely affect our business, financial condition and results of operations.
We may incur significant costs and liabilities with respect to investigation and remediation of environmental conditions at our refineries.
Prior to our purchase of our refineries, the previous owners had been engaged for many years in the investigation and remediation of hydrocarbons and other materials which contaminated soil and groundwater at the purchased facilities. Upon purchase of the facilities, we became responsible and liable for certain costs associated with the continued investigation and remediation of known and unknown impacted areas at the refineries. In the future, it may be necessary to conduct further assessments and remediation efforts at our refinery, pipeline, tank, terminal and store locations. In addition, we have identified and self-reported certain other environmental matters subsequent to our purchase of the refineries.
Based upon environmental evaluations performed internally and by third parties subsequent to the purchase of our refineries and other properties, we recorded environmental liabilities and accrued amounts we believe are sufficient to complete remediation. We expect remediation of soil, sediment and groundwater at some properties to continue for the foreseeable future. The need to make future expenditures for these purposes that exceed the amounts we estimated and accrued for could have a material adverse effect on our business, financial condition and results of operations.
In the future, we may incur substantial expenditures for investigation or remediation of contamination that has not been discovered at our current or former locations or locations that we may acquire. In addition, new legal requirements, new interpretations of existing legal requirements, increased legislative activity and governmental enforcement and other developments could require us to make additional unforeseen expenditures. We anticipate that compliance with environmental, health and safety regulations will require us to spend approximately $32.6 million in capital costs in 2015 and approximately $66.0 million during the next five years.
We could incur substantial costs or disruptions in our business if we cannot obtain or maintain necessary permits and authorizations or otherwise comply with health, safety, environmental and other laws and regulations.
Our operations require numerous permits and authorizations under various laws and regulations. These authorizations and permits are subject to revocation, renewal or modification and can require operational changes to limit impacts or potential impacts on the environment and/or health and safety. A violation of authorization or permit conditions or other legal or regulatory requirements could result in substantial fines, criminal sanctions, permit revocations, injunctions, and/or facility shutdowns. In addition, major modifications of our operations could require modifications to our existing permits or upgrades to our existing pollution control equipment. Any or all of these matters could have a negative effect on our business, results of operations and cash flows.
Our Tyler refinery currently has no ability to distribute refined petroleum products outside the northeast Texas market.
In recent years, we have expanded our refined product distribution capacities in northeast Texas with our acquisition of refined product terminals located in Big Sandy, Texas and Mount Pleasant, Texas. However, unlike most other refineries, the Tyler refinery currently has no ability to distribute refined products outside the northeast Texas market. For the year ended December 31, 2014, nearly all of the refinery sales volume in Tyler was completed through a rack system located at the Tyler refinery, which is owned by our logistics segment. The Tyler refinery's limited distribution capabilities may continue to limit its ability to increase its production, attract new customers for its refined petroleum products or increase sales of the Tyler refinery products. In addition, if demand for the Tyler refinery's products diminishes within the northeast Texas market, its production may be reduced and our financial results would be adversely affected unless additional distribution capabilities are identified.
30
An increase in competition and/or reduction in demand in the markets in which we purchase feedstocks and sell our refined products could increase our costs and/or lower prices and adversely affect our sales and profitability.
Our Tyler refinery is currently the only supplier of a full range of refined petroleum products within a radius of approximately 100 miles of its location and there are no competitive fuel loading terminals within approximately 90 miles of our San Angelo terminal. If competitors commence operations within these niche markets, we could lose our niche market advantage, which could have a material adverse effect on our business, financial condition and results of operations.
Our El Dorado refinery's profitability may be impacted by increased competition from refineries that operate in different regions that have access to Canadian and domestic crudes, which, from time to time may be discounted from crudes available to our El Dorado refinery. In addition, third party pipelines are currently in development that are expected to increase the supply of third party refined products in Little Rock, Arkansas.
In addition, the maintenance or replacement of our existing customers depends on a number of factors outside of our control, including increased competition from other suppliers and demand for refined products in the markets we serve. The market for distribution of wholesale motor fuel is highly competitive and fragmented. Some of our competitors have significantly greater resources and name recognition than us. The loss of major customers, or a reduction in amounts purchased by major customers, could have an adverse effect on us to the extent that we are not able to correspondingly increase sales to other purchasers.
Finally, our ability to purchase and process favorably priced crude oils has allowed us to achieve higher net income and cash flow in recent years. For example, we currently enjoy access to mid-continent and southern Arkansas crude oils that are favorably priced due, in part, to the limited markets for them. If the price of these crude oils increases as a result of increased competition for them, it could have a material adverse effect on our business, financial condition and results of operations.
Compliance with and changes in tax laws could adversely affect our performance.
We are subject to extensive tax liabilities, including federal and state income taxes and transactional taxes such as excise, sales/use, payroll, franchise, withholding, and ad valorem taxes. New tax laws and regulations and changes in existing tax laws and regulations are continuously being enacted or proposed that could result in increased expenditures for tax liabilities in the future. Certain of these liabilities are subject to periodic audits by the respective taxing authority which could increase or otherwise alter our tax liabilities. Subsequent changes to our tax liabilities as a result of these audits may also subject us to interest and penalties and could have a material adverse effect on our business, financial condition and results of operations.
For example, the tax treatment of our logistics segment depends on its status as a partnership for federal income tax purposes. If a change in law, our failure to comply with existing law or other factors were to cause our logistics segment to be treated as a corporation for federal income tax purposes, it would become subject to entity-level taxation. As a result, our logistics segment would pay federal income tax on all of its taxable income at regular corporate income tax rates (subject to corporate alternative minimum tax), our logistics segment would likely pay additional state and local income taxes at varying rates, and distributions to unitholders, including us, would be generally treated as taxable dividends from a corporation. In such case, the logistics segment would likely experience a material reduction in its anticipated cash flow and after-tax return to its unitholders and we would likely experience a substantial reduction in its value.
In addition, recent regulatory proposals in the U.S. could effectively limit, or even eliminate, use of the LIFO inventory method for financial and income tax purposes. Although the final outcome of these proposals cannot be ascertained at this time, the ultimate impact to us of the transition from LIFO to another inventory method could be material. We use the LIFO method with respect to our inventories at the Tyler refinery. A change to the FIFO inventory method could result in a material increase/decrease in the tax basis of our inventory at the Tyler refinery. This increase/decrease in inventory value could impact our taxable income in the year of change or ratably over several tax years.
Our commodity and interest rate derivative activity may limit potential gains, increase potential losses, result in earnings volatility and involve other risks.
At times, we enter into commodity derivative contracts to manage our price exposure to our inventory positions, future purchases of crude oil and ethanol, future sales of refined products or to secure margins on future production. We also use interest rate swap and cap agreements to manage our market exposure to changes in interest rates related to our floating rate borrowings. We expect to continue to enter into these types of transactions from time to time and have increased our use of these risk management activities in recent years.
31
While these transactions are intended to limit our exposure to the adverse effects of fluctuations in crude oil prices, refined products prices and interest rates, they may also limit our ability to benefit from favorable changes in market conditions and may subject us to period-by-period earnings volatility in the instances where we do not seek hedge accounting for these transactions. Further, because the volume of derivative activity is less than our actual use of crude oil or production of refined products, our risk management activity does not completely limit our exposure to market volatility. Also, in connection with such derivative transactions, we may be required to make cash payments to maintain margin accounts and to settle the contracts at their value upon termination. Finally, this activity exposes us to potential risk of counterparties to our derivative contracts failing to perform under the contracts. As a result, the effectiveness of our risk management policies could have a material adverse impact on our business, results of operations and cash flows. For additional information about the nature and volume of these transactions, see Item 7A, Quantitative and Qualitative Disclosures about Market Risk, of this Annual Report on Form 10-K.
We are exposed to certain counterparty risks which may adversely impact our results of operations.
We evaluate the creditworthiness of each of our various counterparties, but we may not always be able to fully anticipate or detect deterioration in a counterparty's creditworthiness and overall financial condition. The deterioration of creditworthiness or overall financial condition of a material counterparty (or counterparties) could expose us to an increased risk of nonpayment or other default under our contracts with them. If a material counterparty (or counterparties) defaults on their obligations to us, this could materially adversely affect our financial condition, results of operations or cash flows. For example, under the terms of the S&O Agreement with J. Aron, we granted J. Aron the exclusive right to store and withdraw crude and certain products in the tanks associated with the El Dorado refinery. The S&O Agreement also provides that the ownership of substantially all crude oil and certain other refined products in the tanks associated with the refinery will be retained by J. Aron, and that J. Aron will purchase substantially all of the specified refined products processed at the El Dorado refinery. An adverse change in J. Aron's business, results of operations, liquidity or financial condition could adversely affect its ability to timely discharge its obligations to us, which would consequently have a material adverse effect on our business, results of operations or liquidity.
Adverse weather conditions or other unforeseen developments could damage our facilities, reduce customer traffic and impair our ability to produce and deliver refined petroleum products or receive supplies for our retail fuel and convenience stores.
The regions in which we operate are susceptible to severe storms, including hurricanes, thunderstorms, tornadoes, floods, extended periods of rain, ice storms and snow, all of which we have experienced in the past few years. Inclement weather conditions could damage our facilities, interrupt production, adversely impact consumer behavior, travel and retail fuel and convenience store traffic patterns or interrupt or impede our ability to operate our locations. If such conditions prevail near our refineries, they could interrupt or undermine our ability to produce and transport products from our refineries and receive and distribute products at our terminals. Regional occurrences, such as energy shortages or increases in energy prices, fires and other natural disasters, could also hurt our business. The occurrence of any of these developments could have a material adverse effect on our business, financial condition and results of operations.
Our operating results are seasonal and generally lower in the first and fourth quarters of the year for our refining and logistics segments and in the first quarter of the year for our retail segment. We depend on favorable weather conditions in the spring and summer months.
Demand for gasoline, convenience merchandise and asphalt products is generally higher during the summer months than during the winter months due to seasonal increases in motor vehicle traffic and road and home construction. Varying vapor pressure requirements between the summer and winter months also tighten summer gasoline supply. As a result, the operating results of our refining segment and logistics segment are generally lower for the first and fourth quarters of each year. Seasonal fluctuations in traffic also affect sales of motor fuels and merchandise in our retail fuel and convenience stores. As a result, the operating results of our retail segment are generally lower for the first quarter of the year.
Weather conditions in our operating area also have a significant effect on our operating results in our retail segment. Customers are more likely to purchase more gasoline and higher profit margin items such as fast foods, fountain drinks and other beverages during the spring and summer months. Unfavorable weather conditions during these months and a resulting lack of the expected seasonal upswings in traffic and sales could have a material adverse effect on our business, financial condition and results of operations.
32
A substantial portion of the workforce at our refineries is unionized, and we may face labor disruptions that would interfere with our operations.
As of December 31, 2014, we employed 301 and 501 people in our Tyler and El Dorado operations, respectively. From among these employees, 161 operations and maintenance hourly employees and 40 truck drivers at the Tyler refinery were represented by the United Steel, Paper and Forestry, Rubber, Manufacturing, Energy, Allied Industrial and Service Workers International Union and its Local 202 at year end. The Tyler operations and maintenance hourly employees are currently covered by a collective bargaining agreement that expired January 31, 2015. National-level negotiations are currently ongoing between the International Union and a third party. While these negotiations are in process, we are operating under rolling, 24-hour extensions to this agreement. The Tyler truck drivers are currently covered by a collective bargaining agreement that expires March 1, 2015. Renewal negotiations for this agreement are in process but not yet finalized. In the event that the union strikes, Delek has a plan in place for continued operation of the Tyler refinery utilizing company employees and/or third party contractors. We do not anticipate these negotiations will prevent the continuous operation of the Tyler refinery. As of December 31, 2014, 167 operations and maintenance hourly employees at the El Dorado refinery were represented by the International Union of Operating Engineers and its Local 381. These employees are covered by a collective bargaining agreement which expires on August 1, 2017. Although these collective bargaining agreements contain provisions to discourage strikes or work stoppages, we cannot assure you that strikes or work stoppages will not occur. A strike or work stoppage could have a material adverse effect on our business, financial condition and results of operations.
We rely on information technology in our operations, and any material failure, inadequacy, interruption or security failure of that technology could harm our business.
We rely on information technology systems across our operations, including management of our supply chain, point of sale processing at our retail sites, and various other processes and transactions. We rely on commercially available systems, software, tools and monitoring to provide security for processing, transmission and storage of confidential customer information, such as payment card and personal credit information.
In addition, the systems currently used for certain transmission and approval of payment card transactions, and the technology utilized in payment cards themselves, may put certain payment card data at risk. These systems are determined and controlled by the PCI, and not by us. The regulatory environment surrounding information security and privacy is increasingly demanding, with the frequent imposition of new and constantly changing requirements. We have taken the necessary steps to assure the PCI compliance and Data Security Standards are being employed at all our locations. However, compliance with these requirements may result in cost increases due to necessary systems changes and the development of new administrative processes.
In recent years, several retailers, including us, have experienced data breaches resulting in the exposure of sensitive customer data, including payment card information. For example, our retail segment experienced a security breach in 2013 that may have compromised the payment card information of certain retail customers. Any compromise or breach of our information and payment technology systems could cause interruptions in our operations, damage our reputation, reduce our customers' willingness to visit our sites and conduct business with us, or expose us to litigation from customers or sanctions from the PCI. In addition, a compromise of our internal data network at any of our refining or terminal locations may have disruptive impacts similar to that of our retail operations. These disruptions could range from inconvenience in accessing business information to a disruption in our refining and/or logistics operations. Cost increases may be incurred in this area to combat the continued escalation of cyber attacks and/or disruptive criminal activity.
Also, we utilize information technology systems and controls that monitor the movement of petroleum products through our pipelines and terminals. An undetected failure of these systems could result in environmental damage, operational disruptions, regulatory enforcement or private litigation. Further, the failure of any of our systems to operate effectively, or problems we may experience with transitioning to upgraded or replacement systems, could significantly harm our business and operations and cause us to incur significant costs to remediate such problems.
33
If we lose any of our key personnel, our ability to manage our business and continue our growth could be negatively impacted.
Our future performance depends to a significant degree upon the continued contributions of our senior management team and key technical personnel. We do not currently maintain key person life insurance policies for any of our senior management team. The loss or unavailability to us of any member of our senior management team or a key technical employee could significantly harm us. We face competition for these professionals from our competitors, our customers and other companies operating in our industry. To the extent that the services of members of our senior management team and key technical personnel would be unavailable to us for any reason, we would be required to hire other personnel to manage and operate our company and to develop our products and technology. We cannot assure you that we would be able to locate or employ such qualified personnel on acceptable terms or at all.
We may seek to diversify our retail fuel and convenience store operations by entering new geographic areas, which may present operational and competitive challenges.
Since our inception, we have grown our retail segment primarily by acquiring stores in the southeastern United States. In the future, we may seek to grow by selectively operating stores in geographic areas other than those in which we currently operate, or in which we currently have a relatively small number of stores. This growth strategy would present numerous operational and competitive challenges to our senior management and employees and would place significant pressure on our operating systems. In addition, we cannot assure you that consumers located in the regions in which we may expand our operations would be as receptive to our stores as consumers in our existing markets. The success of any such growth plans will depend in part upon our ability to:
• | select, and compete successfully in, new markets; |
• | obtain suitable sites at acceptable costs; |
• | identify and contract with financially stable developers; |
• | realize an acceptable return on the capital invested in new facilities; |
• | hire, train, and retain qualified personnel; |
• | integrate new retail fuel and convenience stores into our existing distribution, inventory control, and information systems; |
• | expand relationships with our suppliers or develop relationships with new suppliers; and |
• | secure adequate financing, to the extent required. |
We cannot assure you that we will achieve our development goals, manage our growth effectively, or operate our existing and new retail fuel and convenience stores profitability. The failure to achieve any of the foregoing could have a material adverse effect on our business, financial condition and results of operations.
Our retail segment is dependent on fuel sales which makes us susceptible to increases in the cost of gasoline and interruptions in fuel supply.
Net fuel sales of our retail segment represented approximately 78.5%, 79.6% and 79.9% of total net sales of our retail segment for the fiscal years 2014, 2013 and 2012, respectively. Our dependence on fuel sales makes us susceptible to increases in the cost of gasoline and diesel fuel and fuel profit margins have a significant impact on our earnings. The volume of fuel sold by us and our fuel profit margins are affected by numerous factors beyond our control, including the supply and demand for fuel, volatility in the wholesale fuel market and the pricing policies of competitors in local markets. Although we can rapidly adjust our pump prices to reflect higher fuel costs, a material increase in the price of fuel could adversely affect demand. A material, sudden increase in the cost of fuel that causes our fuel sales to decline could have a material adverse effect on our business, financial condition and results of operations.
Our dependence on fuel sales also makes us susceptible to interruptions in fuel supply. At December 31, 2014, fuel from the Gulf Coast transported to us through the Colonial and Plantation pipelines was the primary source of fuel supply for approximately 93.7% of our retail fuel and convenience stores. To mitigate the risks of cost volatility, we typically have no more than a five-day supply of fuel at each of our stores and our fuel contracts do not guarantee an uninterrupted, unlimited supply in the event of a shortage. Gasoline sales generate customer traffic to our retail fuel and convenience stores and any decrease in gasoline sales, whether due to shortage or otherwise, could adversely affect our merchandise sales. A serious interruption in the supply of gasoline to our retail fuel and convenience stores could have a material adverse effect on our business, financial condition and results of operations.
34
If there is negative publicity concerning our brand names or the brand names of our suppliers, fuel and merchandise sales in our retail segment may suffer.
We offer food products in our stores that are marketed under our brand names and certain nationally recognized brands such as Subway®, Krispy Krunchy Chicken® and Quizno's®. Negative publicity, regardless of whether the concerns are valid, concerning food or beverage quality, food or beverage safety or other health concerns, facilities, employee relations or other matters may materially and adversely affect demand for food and beverages offered in our stores and could result in a decrease in customer traffic to our stores. Additionally, we may be the subject of complaints or litigation arising from food or beverage-related illness or injury in general which could have a negative impact on our business. Health concerns, poor food or beverage quality or operating issues stemming from one store or a limited number of stores can materially and adversely affect the operating results of some or all of our stores and harm our proprietary brands.
In addition, we are an independent retailer of fuel that markets some of our products under major oil company brands including BP® and Marathon®. Fuel sold under these major brands represented approximately 14.3% of total fuel sales volume for our retail segment during the year ended December 31, 2014. Negative publicity concerning any of these major oil companies could adversely affect fuel and merchandise sales volumes in our retail segment. For example, the Deepwater Horizon accident in the Gulf of Mexico in April 2010 resulted in consumer boycotts of independent retailers of BP® branded fuels. If negative publicity pertaining to the major brands adversely affects our sales volumes, it could have a material adverse effect on our business, financial condition and results of operations.
Wholesale cost increases, vendor pricing programs and tax increases applicable to tobacco products, as well as campaigns to discourage their use, could adversely impact our results of operations in our retail segment.
Sales of tobacco products accounted for approximately 8.8%, 8.2% and 7.8% of net sales in our retail segment during the fiscal years 2014, 2013 and 2012, respectively. Our tobacco gross profit accounted for approximately 11.9%, 12.2% and 14.8% of total gross profit in our retail segment during the same periods. Increases in the retail price of tobacco products as a result of increased taxes or wholesale costs could materially impact our cigarette sales volume and/or revenues, merchandise gross profit and overall customer traffic. In addition, national and local campaigns to discourage the use of tobacco products may have an adverse effect on demand for these products. A reduction in cigarette sales volume and/or revenues, merchandise gross profit from tobacco products or overall customer demand for tobacco products could have a material adverse effect on the business, financial condition and results of operations of our retail segment.
Major cigarette manufacturers currently offer substantial rebates to us; however, there can be no assurance that such rebate programs will continue. We include these rebates as a component of our gross margin from sales of cigarettes. In the event these rebates are decreased or eliminated, our wholesale cigarette costs will increase. For example, certain major cigarette manufacturers have offered rebate programs that provide rebates only if we follow the manufacturer's retail pricing guidelines. If we do not receive the rebates because we do not participate in the program or if the rebates we receive by participating in the program do not offset or surpass the revenue lost as a result of complying with the manufacturer's pricing guidelines, our cigarette gross margin will be adversely impacted. In general, we attempt to pass wholesale price increases on to our customers. However, due to competitive pressures in our markets, we may not be able to do so. In addition, reduced retail display allowances on cigarettes offered by cigarette manufacturers negatively impact gross margins. These factors could materially impact our retail price of cigarettes, cigarette sales volume and/or revenues, merchandise gross profit and overall customer traffic, which could in turn have a material adverse effect on our business, financial condition and results of operations.
35
If we are, or become, a U.S. real property holding corporation, special tax rules may apply to a sale, exchange or other disposition of common stock and non-U.S. holders may be less inclined to invest in our stock as they may be subject to U.S. federal income tax in certain situations.
A non-U.S. holder of our common stock may be subject to U.S. federal income tax with respect to gain recognized on the sale, exchange or other disposition of our common stock if we are, or were, a "U.S. real property holding corporation" ("USRPHC") at any time during the shorter of the five-year period ending on the date of the sale or other disposition and the period such non-U.S. holder held our common stock (the shorter period referred to as the "lookback period"). In general, we would be a USRPHC if the fair market value of our "U.S. real property interests," as such term is defined for U.S. federal income tax purposes, equals or exceeds 50% of the sum of the fair market value of our worldwide real property interests and our other assets used or held for use in a trade or business. The test for determining USRPHC status is applied on certain specific determination dates and is dependent upon a number of factors, some of which are beyond our control (including, for example, fluctuations in the value of our assets). If we are or become a USRPHC, so long as our common stock is regularly traded on an established securities market such as the NYSE, only a non-U.S. holder who, actually or constructively, holds or held during the lookback period more than five percent of our common stock will be subject to U.S. federal income tax on the disposition of our common stock.
Risks Related to Our Common Stock
The price of our common stock may fluctuate significantly, and you could lose all or part of your investment.
The market price of our common stock may be influenced by many factors, some of which may be beyond our control, including:
• | our quarterly or annual earnings or those of other companies in our industry; |
• | inaccuracies in and changes to our previously published quarterly or annual earnings; |
• | changes in accounting standards, policies, guidance, interpretations or principles; |
• | general economic and stock market conditions; |
• | the failure of securities analysts to cover our common stock or the cessation of such coverage; |
• | changes in financial estimates by securities analysts and the frequency and accuracy of such reports; |
• | future sales of our common stock; |
• | announcements by us or our competitors of significant contracts or acquisitions; |
• | sales of common stock by us, our senior officers or our affiliates; and |
• | the other factors described in these "Risk Factors." |
In recent years, the stock market has experienced extreme price and volume fluctuations. This volatility has had a significant impact on the market price of securities issued by many companies, including companies in our industry. The changes often occur without any apparent regard to the operating performance of these companies. The price of our common stock could fluctuate based upon factors that have little or nothing to do with our company, and these fluctuations could materially reduce our stock price. In addition, recent distress in the credit and financial markets resulted in extreme volatility in trading prices of securities and diminished liquidity, and we cannot assure you that our liquidity will not be affected by changes in the financial markets and the global economy.
In the past, some companies that have experienced volatile market prices for their securities have been subject to securities class action suits filed against them. The filing of a lawsuit against us, regardless of the outcome, could have a material adverse effect on our business, financial condition and results of operations, as it could result in substantial legal costs and a diversion of our management's attention and resources.
36
The risk of stockholder activism has increased because no stockholder controls a majority of our common stock.
Prior to March 20, 2013, Delek Group Ltd. ("Delek Group") controlled a majority of our common stock but, by December 31, 2013 and December 31, 2014, it controlled only 30.5% and 7.8%, respectively. Our stockholders may from time to time engage in proxy solicitations, advance stockholder proposals or otherwise attempt to effect changes or acquire control over us, and Delek Group's divestitures have increased this risk. Campaigns by stockholders to effect changes at publicly traded companies are sometimes led by investors seeking to increase short-term stockholder value through actions such as financial restructuring, increased debt, special dividends, stock repurchases or sales of assets or the entire company. Responding to proxy contests and other actions by activist stockholders can be costly and time-consuming, disrupting our operations and divert the attention of our Board of Directors and senior management from the pursuit of business strategies. As a result, stockholder campaigns could adversely affect our results of operations, financial condition and cash flows.
Future sales of shares of our common stock could depress the price of our common stock.
The market price of our common stock could decline as a result of the introduction of a large number of shares of our common stock into the market or the perception that these sales could occur. These sales, or the possibility that these sales may occur, also might make it more difficult for us to sell equity securities in the future at a time and at a price that we deem appropriate.
Our stockholders may suffer substantial dilution.
We may sell securities in the public or private equity markets if and when conditions are favorable, even if we do not have an immediate need for capital. In addition, if we have an immediate need for capital, we may sell securities in the public or private equity markets even when conditions are not otherwise favorable. Our stockholders will suffer dilution if we issue currently unissued shares of our stock in the future. Our stockholders will also suffer dilution if stock, restricted stock units, restricted stock, stock options, stock appreciation rights, warrants or other equity awards, whether currently outstanding or subsequently granted, are exercised.
We depend upon our subsidiaries for cash to meet our obligations and pay any dividends.
We are a holding company. Our subsidiaries conduct substantially all of our operations and own substantially all of our assets. Consequently, our cash flow and our ability to meet our obligations or pay dividends to our stockholders depend upon the cash flow of our subsidiaries and the payment of funds by our subsidiaries to us in the form of dividends, tax sharing payments or otherwise. Our subsidiaries' ability to make any payments will depend on many factors, including their earnings, cash flows, the terms of their indebtedness, tax considerations and legal restrictions.
We may be unable to pay future regular and/or special dividends in the anticipated amounts and frequency set forth herein.
We will only be able to pay regular and/or special dividends from our available cash on hand and funds received from our subsidiaries. Our ability to receive dividends and other cash payments from our subsidiaries is restricted under the terms of their respective credit facilities. For example, under the terms of their credit facilities, our subsidiaries are subject to certain customary covenants that limit their ability to, subject to certain exceptions as defined in their respective credit agreements, remit cash to, distribute assets to, or make investments in, us as the parent company. Specifically, these covenants limit the payment, in the form of cash or other assets, of dividends or other cash payments to us. The declaration of future regular and/or special dividends on our common stock will be at the discretion of our Board of Directors and will depend upon many factors, including our results of operations, financial condition, earnings, capital requirements, restrictions in our debt agreements and legal requirements. Although we currently intend to pay regular quarterly cash dividends on our common stock at an annual rate of $0.60 per share, we cannot provide any assurances that any regular and/or special dividends will be paid in the anticipated amounts and frequency set forth herein, if at all.
Provisions of Delaware law and our organizational documents may discourage takeovers and business combinations that our stockholders may consider in their best interests, which could negatively affect our stock price.
Provisions of Delaware law, our Second Amended and Restated Certificate of Incorporation and our Second Amended and Restated Bylaws may have the effect of delaying or preventing a change in control of our company or deterring tender offers for our common stock that other stockholders may consider in their best interests. For example, our Second Amended and Restated Certificate of Incorporation provides that:
• | stockholder actions may only be taken at annual or special meetings of stockholders; |
• | members of our Board of Directors can be removed with or without cause by a supermajority vote of stockholders; |
37
• | the Court of Chancery of the State of Delaware is, with certain exceptions, the exclusive forum for certain legal actions; |
• | our bylaws, as may be in effect from time to time, can be amended only by a supermajority vote of stockholders; and |
• | certain provisions of our certificate of incorporation, as may be in effect from time to time, can be amended only by a supermajority vote of stockholders. |
In addition, the certificate of incorporation authorizes us to issue up to 10,000,000 shares of preferred stock in one or more different series with terms to be fixed by our Board of Directors. Stockholder approval is not necessary to issue preferred stock in this manner. Issuance of these shares of preferred stock could have the effect of making it more difficult and more expensive for a person or group to acquire control of us and could effectively be used as an anti-takeover device. On the date of this report, no shares of our preferred stock are outstanding.
Finally, our Second Amended and Restated Bylaws provide for an advance notice procedure for stockholders to nominate director candidates for election or to bring business before an annual meeting of stockholders and require that special meetings of stockholders be called only by our chairman of the Board of Directors, president or secretary after written request of a majority of our Board of Directors. The advance notice provision requires disclosure of derivative positions, hedging transactions, short interests, rights to dividends and other similar positions of any stockholder proposing a director nomination, in order to promote full disclosure of such stockholder's economic interest in us.
The anti-takeover provisions of Delaware law and provisions in our organizational documents may prevent our stockholders from receiving the benefit from any premium to the market price of our common stock offered by a bidder in a takeover context. Even in the absence of a takeover attempt, the existence of these provisions may adversely affect the prevailing market price of our common stock if they are viewed as discouraging takeover attempts in the future.
We are exposed to risks relating to evaluations of internal controls required by Section 404 of Sarbanes-Oxley.
To comply with the management certification and auditor attestation requirements of Section 404 of Sarbanes-Oxley, we are required to evaluate our internal controls systems to allow management to report on, and our independent auditors to audit, our internal controls over financial reporting. During this process, we may identify control deficiencies of varying degrees of severity under applicable SEC and Public Company Accounting Oversight Board rules and regulations that remain unremediated. As a public company, we are required to report, among other things, control deficiencies that constitute a "material weakness" or changes in internal controls that, or are reasonably likely to, materially affect internal controls over financial reporting. A "material weakness" is a deficiency, or combination of deficiencies, in internal control over financial reporting, such that there is a reasonable possibility that a material misstatement of the Company's annual or interim financial statements will not be prevented or detected on a timely basis.
If we fail to comply with the requirements of Section 404, we may be subject to sanctions or investigation by regulatory authorities such as the SEC or the NYSE. Additionally, failure to comply with Section 404 or the report by us of a material weakness may cause investors to lose confidence in our financial statements and our stock price may be adversely affected. If we fail to remedy any material weakness, our financial statements may be inaccurate, we may face restricted access to the capital markets, and our stock price may decline.
ITEM 1B. UNRESOLVED STAFF COMMENTS
None.
ITEM 2. PROPERTIES
Refining Segment
The refining segment owns refineries in Tyler, Texas and El Dorado, Arkansas and the land on which these two refineries are located. The Tyler refinery is situated on approximately 100 out of a total of approximately 600 acres of land owned by us. The El Dorado refinery site consists of approximately 460 acres of which the main plant sits on approximately 335 acres. We also own the Helena Pipeline that connects El Dorado, Arkansas to Helena, Arkansas. In Helena, Arkansas, we own the Helena Terminal on the Mississippi River, which can be used for crude oil or finished products. The Helena Assets are currently out of service and will require capital investment to be restored to working order. The refining segment also owns two biodiesel facilities involved in production of biodiesel fuels and related activities. The results of operation of these assets are included in our refining segment. See also "Refining Segment" included in Item 1, Business, of this Annual Report on Form 10-K.
38
Logistics Segment
The logistics segment owns nine light product distribution terminals, one in each of Nashville and Memphis, Tennessee, Tyler, Big Sandy, San Angelo, Abilene and Mount Pleasant, Texas, and North Little Rock and El Dorado, Arkansas. All of the above properties are located on real property owned by us. The logistics segment also owns the El Dorado Pipeline System, the Magnolia Pipeline System and 600 miles of crude oil gathering lines, which are located in Louisiana and Arkansas. The logistics segment owns the McMurrey Pipeline System, the Nettleton Pipeline, the Tyler-Big Sandy Pipeline, the Paline Pipeline System and the Greenville-Mount Pleasant Pipeline, which are located in Texas. All of the pipeline systems set forth above run across fee owned land, leased land and rights-of-way. The logistics segment also owns storage tanks in El Dorado and North Little Rock, Arkansas and Tyler, Greenville, Big Sandy and Mount Pleasant, Texas and a fleet of 120 trucks and 200 trailers used to transport asphalt and crude oil. See Note 20 to the consolidated financial statements in Item 8, Financial Statements and Supplementary Data, of this Annual Report on Form 10-K for additional information. See also "Logistics Segment" included in Item 1, Business, of this Annual Report on Form 10-K.
Retail Segment
As of December 31, 2014, the retail segment owned the real estate at 210 company-operated retail fuel and convenience store locations, and leased the real property at 155 company-operated stores. In addition to these stores, we own or lease 14 locations that were either leased or subleased to third-party dealers; and 32 other dealer sites are owned or leased independently by dealers.
The following table summarizes the real estate position of our retail segment as of December 31, 2014.
State | Company Operated Sites | Dealer Sites | Dealer Sites Not Owned Nor Leased By Us | Owned Sites | Leased Sites | Remaining Lease Term <3 Years (1) | Remaining Lease Term >3 Years (1) | ||||||||||||||
Tennessee | 197 | 15 | 11 | 117 | 84 | 54 | 30 | ||||||||||||||
Alabama | 90 | 15 | 14 | 53 | 38 | 16 | 22 | ||||||||||||||
Georgia | 48 | 14 | 7 | 37 | 18 | 7 | 11 | ||||||||||||||
Arkansas | 13 | 2 | — | 8 | 7 | — | 7 | ||||||||||||||
Virginia | 8 | — | — | — | 8 | 7 | 1 | ||||||||||||||
Kentucky | 6 | — | — | 2 | 3 | — | 3 | ||||||||||||||
Mississippi | 3 | — | — | 2 | 2 | — | 2 | ||||||||||||||
Total | 365 | 46 | 32 | 219 | 160 | 84 | 76 | ||||||||||||||
(1) | Includes options renewable at our discretion; measured as of December 31, 2014. |
Most of our retail fuel and convenience store leases are net leases requiring us to pay taxes, insurance and maintenance costs. Of the leases that expire in less than three years, we anticipate that we will be able to negotiate acceptable extensions of the leases for those locations that we intend to continue operating. We do not believe that any of these leases are individually material. See also "Retail Segment" included in Item 1, Business, of this Annual Report on Form 10-K.
Liens and Encumbrances
The majority of the assets described above are pledged under and encumbered by certain of our debt facilities. See Note 10 of the consolidated financial statements included in Item 8, Financial Statements and Supplementary Data, of this Annual Report on Form 10-K for further information.
Corporate Headquarters
We lease our corporate headquarters at 7102 Commerce Way, Brentwood, Tennessee. The lease is for 54,000 square feet of office space. The lease term expires in April 2022.
39
ITEM 3. LEGAL PROCEEDINGS
In the ordinary conduct of our business, we are from time to time subject to lawsuits, investigations and claims, including, environmental claims and employee related matters.
Tyler Consent Decree
Following the November 2008 explosion and fire at the Tyler refinery, the EPA conducted an investigation under Section 114 of the Clean Air Act pertaining to our compliance with the chemical accident prevention standards. In late 2011, the EPA referred an enforcement action to the DOJ and in the fourth quarter of 2014, we settled this matter by entering into a Consent Decree. The Consent Decree requires Delek to pay a penalty of $0.5 million and make a minor change to its written inspection procedures.
SEC Investigation
In December 2014, the staff of the SEC advised the Company that a formal order of private investigation had been issued focused on the past restatement of the Company’s financial statements in 2011, the revision of the quarterly information provided in the 2012 Annual Report on Form 10-K and the Company’s internal control over financial reporting. The Company is cooperating fully with the SEC staff’s investigation. The Company cannot predict the scope, timing or outcome of the SEC staff’s investigation at this time.
Although we cannot predict with certainty the ultimate resolution of lawsuits, investigations and claims asserted against us, including civil penalties or other enforcement actions, we do not believe that any currently pending legal proceeding or proceedings to which we are a party will have a material adverse effect on our business, financial condition or results of operations.
ITEM 4. MINE SAFETY DISCLOSURES
Not applicable.
PART II
ITEM 5. | MARKET FOR REGISTRANT'S COMMON EQUITY, RELATED STOCKHOLDER MATTERS AND ISSUER PURCHASES OF EQUITY SECURITIES |
Market Information and Dividends
Our common stock is traded on the New York Stock Exchange under the symbol "DK." The following table sets forth the quarterly high and low sales prices of our common stock for each quarterly period indicated and dividends issued since January 1, 2013:
Period | High Sales Price | Low Sales Price | Regular Dividends Per Common Share | Special Dividends Per Common Share | ||||||||||||
2013 | ||||||||||||||||
First Quarter | $41.47 | $24.70 | $0.10 | $0.10 | ||||||||||||
Second Quarter | $39.80 | $27.57 | $0.15 | $0.10 | ||||||||||||
Third Quarter | $31.53 | $20.57 | $0.15 | $0.10 | ||||||||||||
Fourth Quarter | $34.49 | $19.83 | $0.15 | $0.10 | ||||||||||||
2014 | ||||||||||||||||
First Quarter | $35.11 | $26.39 | $0.15 | $0.10 | ||||||||||||
Second Quarter | $34.07 | $27.77 | $0.15 | $0.10 | ||||||||||||
Third Quarter | $36.05 | $27.48 | $0.15 | $0.10 | ||||||||||||
Fourth Quarter | $34.56 | $25.15 | $0.15 | $0.10 | ||||||||||||
40
The dividends paid in 2014 and 2013 totaled approximately $59.2 million and $57.3 million, respectively. As of the date of this filing, we intend to continue to pay regular quarterly cash dividends on our common stock at the annual rate of $0.60 per share. The declaration and payment of future regular and/or special dividends to holders of our common stock will be at the discretion of our Board of Directors and will depend upon many factors, including our financial condition, earnings, legal requirements, restrictions in our debt agreements and other factors our Board of Directors deems relevant. Except as represented in the table above, we have paid no other cash dividends on our common stock during the two most recent fiscal years.
Holders
As of February 20, 2015, there were approximately seven common stockholders of record. This number does not include beneficial owners of our common stock whose stock is held in nominee or "street" name accounts through brokers.
Purchases of Equity Securities by the Issuer and Affiliated Purchasers
The following table sets forth information with respect to the purchase of shares of our common stock made during the three months ended December 31, 2014 by or on behalf of us or any “affiliated purchaser,” as defined by Rule 10b-18 of the Exchange Act:
Period | Total Number of Shares Purchased | Average Price Paid per Share | Total Number of Shares Purchased as Part of Publicly Announced Plans or Programs (1) | Approximate Dollar Value of Shares that May Yet Be Purchased Under the Plans or Programs (1) | |||||||||||
October 1 - October 31, 2014 | 127,205 | $ | 31.45 | 127,205 | $ | 54,450,309 | |||||||||
November 1 - November 30, 2014 | 481,398 | 31.39 | 481,398 | 39,337,351 | |||||||||||
December 1 - December 31, 2014 | 491,057 | 28.44 | 491,057 | $ | 25,371,753 | (2) | |||||||||
Total | 1,099,660 | $ | 30.08 | 1,099,660 | N/A | ||||||||||
(1) | On March 13, 2014, the Company announced that its Board of Directors authorized a share repurchase program for up to $50.0 million of the Company’s common stock. On August 5, 2014, the Board of Directors increased the authorization under the stock repurchase program by $50.0 million to $100.0 million. The share repurchases under the repurchase program were authorized through open market transactions or in privately negotiated transactions, in accordance with applicable securities laws. The timing, price, and size of repurchases was made at the discretion of management and depended on prevailing market prices, general economic and market conditions and other considerations. The repurchase program did not obligate the Company to acquire any particular amount of stock, and the remaining authorization under the repurchase program expired on December 31, 2014. |
(2) | This amount expired on December 31, 2014 and is not inclusive of the $125.0 million stock repurchase program authorized in 2015. Through February 25, 2015, the 2015 stock repurchase authorization has not been utilized. |
41
Performance Graph
The following Performance Graph and related information shall not be deemed "soliciting material" or to be "filed" with the SEC, nor shall such information be incorporated by reference into any future filing under the Securities Act of 1933 or Securities Exchange Act of 1934, each as amended, except to the extent that we specifically incorporate it by reference into such filing.
The following graph and table compare cumulative total returns for our stockholders to the Standard and Poor's 500 Stock Index and a market capitalization weighted peer group selected by management for the five-year period commencing December 31, 2009 and ending December 31, 2014. The graph assumes a $100 investment made on December 31, 2009. Each of the three measures of cumulative total return assumes reinvestment of dividends. The peer group is comprised of Alon USA Energy, Inc. (NYSE: ALJ), CVR Energy, Inc. (NYSE: CVI), HollyFrontier Corporation (NYSE: HFC), Marathon Petroleum Corporation (NYSE: MPC), Phillips 66 (NYSE: PSX), Tesoro Corporation (NYSE: TSO), Valero Energy Corporation (NYSE: VLO) and Western Refining, Inc (NYSE: WNR). The stock performance shown on the graph below is not necessarily indicative of future price performance.
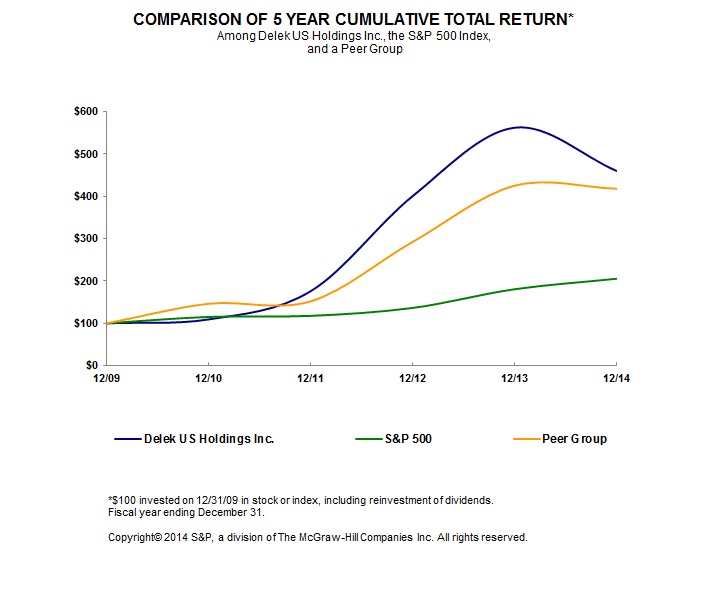
42
ITEM 6. SELECTED FINANCIAL DATA
The following selected financial data should be read in conjunction with Item 7, Management's Discussion and Analysis of Financial Condition and Results of Operations, and Item 8, Financial Statements and Supplementary Data, of this Annual Report on Form 10-K.
Year Ended December 31, | ||||||||||||||||||||
2014 | 2013 | 2012 | 2011 | 2010 | ||||||||||||||||
Statement of Operations Data: | (In millions, except share and per share data) | |||||||||||||||||||
Net sales | 8,324.3 | 8,706.8 | 8,726.7 | 7,198.2 | 3,755.6 | |||||||||||||||
Total operating costs and expenses | 7,957.8 | 8,469.1 | 8,253.6 | 6,912.1 | 3,746.4 | |||||||||||||||
Operating income | 366.5 | 237.7 | 473.1 | 286.1 | 9.2 | |||||||||||||||
Total non-operating expenses, net | 38.9 | 31.1 | 45.5 | 38.3 | 94.1 | |||||||||||||||
Income (loss) before income taxes | 327.6 | 206.6 | 427.6 | 247.8 | (84.9 | ) | ||||||||||||||
Income tax expense (benefit) | 101.6 | 70.9 | 151.6 | 84.7 | (5.0 | ) | ||||||||||||||
Net income (loss) | 226.0 | 135.7 | 276.0 | 163.1 | (79.9) | |||||||||||||||
Net income attributed to non-controlling interest | 27.4 | 18.0 | 3.2 | 4.8 | — | |||||||||||||||
Net income (loss) attributable to Delek | $ | 198.6 | $ | 117.7 | $ | 272.8 | $ | 158.3 | $ | (79.9 | ) | |||||||||
Basic & diluted earnings per share: | ||||||||||||||||||||
Basic | $ | 3.38 | $ | 1.99 | $ | 4.65 | $ | 2.80 | $ | (1.47 | ) | |||||||||
Diluted | $ | 3.35 | $ | 1.96 | $ | 4.57 | $ | 2.78 | $ | (1.47 | ) | |||||||||
Weighted average common shares outstanding: | ||||||||||||||||||||
Basic | 58,780,947 | 59,186,921 | 58,719,968 | 56,543,977 | 54,264,763 | |||||||||||||||
Diluted | 59,355,120 | 60,047,138 | 59,644,798 | 57,026,864 | 54,264,763 | |||||||||||||||
Year Ended December 31, | ||||||||||||||||||||
2014 | 2013 | 2012 | 2011 | 2010 | ||||||||||||||||
Balance Sheet Data: | (In millions) | |||||||||||||||||||
Cash and cash equivalents | $ | 444.1 | $ | 400.0 | $ | 601.7 | $ | 225.9 | $ | 49.1 | ||||||||||
Total current assets | 1,247.4 | 1,417.1 | 1,359.7 | 1,050.6 | 299.4 | |||||||||||||||
Property, plant and equipment, net | 1,448.8 | 1,273.2 | 1,124.2 | 1,053.8 | 680.1 | |||||||||||||||
Total assets | 2,891.4 | 2,840.4 | 2,623.7 | 2,230.6 | 1,144.6 | |||||||||||||||
Total current liabilities | 857.2 | 1,080.1 | 999.1 | 994.7 | 292.5 | |||||||||||||||
Total debt, including current maturities | 589.7 | 410.3 | 362.2 | 432.6 | 295.8 | |||||||||||||||
Total non-current liabilities | 835.8 | 639.9 | 546.6 | 582.3 | 408.8 | |||||||||||||||
Total shareholders' equity | 1,198.4 | 1,120.4 | 1,078.0 | 653.6 | 443.3 | |||||||||||||||
Total liabilities and shareholders' equity | 2,891.4 | 2,840.4 | 2,623.7 | 2,230.6 | 1,144.6 | |||||||||||||||
43
ITEM 7. MANAGEMENT’S DISCUSSION AND ANALYSIS OF FINANCIAL CONDITION AND RESULTS OF OPERATIONS
Forward-Looking Statements
This Annual Report contains "forward-looking statements" within the meaning of Section 27A of the Securities Act of 1933, as amended, and Section 21E of the Securities Exchange Act of 1934, as amended. These forward-looking statements reflect our current estimates, expectations and projections about our future results, performance, prospects and opportunities. Forward-looking statements include, among other things, the information concerning our possible future results of operations, business and growth strategies, financing plans, expectations that regulatory developments or other matters will or will not have a material adverse effect on our business or financial condition, our competitive position and the effects of competition, the projected growth of the industry in which we operate, and the benefits and synergies to be obtained from our completed and any future acquisitions, statements of management’s goals and objectives, and other similar expressions concerning matters that are not historical facts. Words such as "may," "will," "should," "could," "would," "predicts," "potential," "continue," "expects," "anticipates," "future," "intends," "plans," "believes," "estimates," "appears," "projects" and similar expressions, as well as statements in future tense, identify forward-looking statements.
Forward-looking statements should not be read as a guarantee of future performance or results, and will not necessarily be accurate indications of the times at, or by, which such performance or results will be achieved. Forward-looking information is based on information available at the time and/or management’s good faith belief with respect to future events, and is subject to risks and uncertainties that could cause actual performance or results to differ materially from those expressed in the statements. Important factors that, individually or in the aggregate, could cause such differences include, but are not limited to:
• | volatility in our refining margins or fuel gross profit as a result of changes in the prices of crude oil, other feedstocks and refined petroleum products; |
• | reliability of our operating assets; |
• | competition; |
• | changes in, or the failure to comply with, the extensive government regulations applicable to our industry segments; |
• | our ability to execute our strategy of growth through acquisitions and the transactional risks inherent in such acquisitions; |
• | diminution in value of long-lived assets may result in an impairment in the carrying value of the asset on our balance sheet and a resultant loss recognized in the statement of operations; |
• | general economic and business conditions, particularly levels of spending relating to travel and tourism or conditions affecting the southeastern United States; |
• | dependence on one wholesaler for a significant portion of our convenience store merchandise; |
• | deterioration of creditworthiness or overall financial condition of a material counterparty (or counterparties); |
• | unanticipated increases in cost or scope of, or significant delays in the completion of, our capital improvement and periodic turnaround projects; |
• | risks and uncertainties with respect to the quantities and costs of refined petroleum products supplied to our pipelines and/or held in our terminals; |
• | operating hazards, natural disasters, casualty losses and other matters beyond our control; |
• | increases in our debt levels or costs; |
• | changes in our ability to continue to access the credit markets; |
• | compliance, or failure to comply, with restrictive and financial covenants in our various debt agreements; |
• | the inability of our subsidiaries to freely make dividends, loans or other cash distributions to us; |
• | seasonality; |
44
• | acts of terrorism aimed at either our facilities or other facilities that could impair our ability to produce or transport refined products or receive feedstocks; |
• | changes in the cost or availability of transportation for feedstocks and refined products; |
• | volatility of derivative instruments; and |
• | other factors discussed under Item 1A, Risk Factors and Item 7, Management’s Discussion and Analysis of Financial Condition and Results of Operations and in our other filings with the SEC. |
In light of these risks, uncertainties and assumptions, our actual results of operations and execution of our business strategy could differ materially from those expressed in, or implied by, the forward-looking statements, and you should not place undue reliance upon them. In addition, past financial and/or operating performance is not necessarily a reliable indicator of future performance and you should not use our historical performance to anticipate future results or period trends. We can give no assurances that any of the events anticipated by any forward-looking statements will occur or, if any of them do, what impact they will have on our results of operations and financial condition.
Forward-looking statements speak only as of the date the statements are made. We assume no obligation to update forward-looking statements to reflect actual results, changes in assumptions or changes in other factors affecting forward-looking information except to the extent required by applicable securities laws. If we do update one or more forward-looking statements, no inference should be drawn that we will make additional updates with respect thereto or with respect to other forward-looking statements.
Executive Summary and Strategic Overview
Business Overview
We are an integrated downstream energy business focused on petroleum refining, the wholesale distribution of refined products and convenience store retailing. Our business consists of three operating segments: (1) refining, (2) logistics, and (3) retail. Our refining segment operates independent refineries in Tyler, Texas and El Dorado, Arkansas with a combined design crude throughput capacity of 140,000 bpd. We are in the process of expanding our Tyler refinery crude throughput capacity by 15,000 bpd (the "Tyler Expansion"). It is expected to be completed in March 2015 and would increase crude throughput capacity to a combined 155,000 bpd. Our logistics segment gathers, transports and stores crude oil and markets, distributes, transports and stores refined products in select regions of the southeastern United States and west Texas for our refining segment, as well as third parties. Our retail segment markets gasoline, diesel, other refined petroleum products and convenience merchandise through a network of 365 company-operated retail fuel and convenience stores located in Alabama, Arkansas, Georgia, Kentucky, Mississippi, Tennessee and Virginia.
Our profitability in the refining segment is substantially determined by the difference between the cost of the crude oil feedstocks we purchase and the price of the refined products we sell, referred to as the "crack spread, refining margin or refined product margin." The cost to acquire feedstocks and the price of the refined petroleum products we ultimately sell from our refineries depend on numerous factors beyond our control, including the supply of, and demand for, crude oil, gasoline and other refined petroleum products which, in turn, depend on, among other factors, changes in domestic and foreign economies, weather conditions such as hurricanes or tornadoes, local, domestic and foreign political affairs, global conflict, production levels, the availability of imports, the marketing of competitive fuels and government regulation. Other significant factors that influence our results in the refining segment include operating costs (particularly the cost of natural gas used for fuel and the cost of electricity), seasonal factors, refinery utilization rates and planned or unplanned maintenance activities or turnarounds. Moreover, while the fluctuations in the cost of crude oil are typically reflected in the prices of light refined products, such as gasoline and diesel fuel, the price of other residual products, such as asphalt, coke, carbon black oil and LPG are less likely to move in parallel with crude cost. This causes additional pressure on our realized margin in periods of rising crude oil prices. Alternatively, margins may benefit from these economics during periods of falling crude oil prices.
For our Tyler refinery, we compare our per barrel refined product margin to a well-established industry metric: the Gulf Coast crack spread. The Gulf Coast crack spread is used as a benchmark for measuring a refinery's product margins by measuring the difference between the market price of light products and crude oil. It represents the approximate gross margin resulting from processing one barrel of crude oil into three-fifths of a barrel of gasoline and two-fifths of a barrel of high-sulfur diesel. We calculate the Gulf Coast crack spread using the market value of U.S. Gulf Coast Pipeline Conventional 87 CBOB and U.S. Gulf Coast Pipeline No. 2 Heating Oil (high sulfur diesel) and the first month futures price of WTI on the NYMEX. U.S. Gulf Coast Pipeline 87 Octane Conventional Gasoline is a grade of gasoline commonly marketed as Regular Unleaded at retail locations. U.S. Gulf Coast Pipeline No. 2 Heating Oil is a petroleum distillate that can be used as either a diesel fuel or a fuel oil. This is the standard by which other distillate products (such as ultra low sulfur diesel) are priced. The NYMEX is the commodities trading exchange where contracts for the future delivery of petroleum products are bought and sold.
45
We anticipate that the quantities and varieties of crude oil processed and products manufactured at the El Dorado refinery will continue to vary. Therefore, we do not believe that it is possible to develop a reasonable refined product margin benchmark that would accurately portray our refined product margins at the El Dorado refinery.
The cost to acquire the refined fuel products we sell to our wholesale customers in our logistics segment and at our convenience stores in our retail segment depends on numerous factors beyond our control, including the supply of, and demand for, crude oil, gasoline and other refined petroleum products which, in turn, depend on, among other factors, changes in domestic and foreign economies, weather conditions, domestic and foreign political affairs, production levels, the availability of imports, the marketing of competitive fuels and government regulation. Our retail merchandise sales are driven by our ability to offer competitive prices on the products we offer, the accessibility of our convenience store locations, our ability to offer a high level of customer service and our ability to effectively promote our convenience brand in the regional markets we serve. Motor fuel margin is defined as gross sales less the delivered cost of fuel and motor fuel taxes, and is measured on a cents per gallon basis. Our motor fuel margins are impacted by local supply, demand, weather, competitor pricing, blending of renewable fuels and product brand.
As part of our overall business strategy, we regularly evaluate opportunities to expand our portfolio of businesses and may at any time be discussing or negotiating a transaction that, if consummated, could have a material effect on our business, financial condition, liquidity or results of operations.
Strategic Accomplishments
Refining Segment
In our refining segment, we have been focused on growing our operations, improving access to cost advantaged crude supplies and adding flexibility within our refining system. By approaching our refining assets as a system, we continually look for ways to take advantage of this connectivity by shipping intermediate products between refineries and managing our crude supply across the system. During 2014, we added crude oil processing flexibility at our El Dorado refinery and moved forward with our plans to expand our Tyler refinery. We also acquired an additional biodiesel plant. We benefited from increased crude production gathered on the SALA gathering system in Arkansas that provides cost advantaged crude to our El Dorado refinery for a portion of its crude needs. Steps were also taken to increase our access to cost advantaged crude supplies from other locations as we have improved our Midland crude supply and gained flexibility to access Cushing crude supplies. In early 2015, these efforts resulted in our Midland crude supply increasing to an average of 97,000 bpd from 87,000 bpd in 2014. In 2015, we will continue to explore ways to increase access to cost advantaged crude in our refining system.
Asset Expansion and Improvements
El Dorado Refinery Turnaround and Expansion
During January and February 2014, we completed a scheduled turnaround and certain other discretionary capital projects at the El Dorado refinery. The refinery was restored to full operational status during the first quarter of 2014. While turnaround work was underway, customer demand was met by a combination of refined product inventory on-hand and from refined products transferred from the Tyler refinery. During the turnaround, the pre-flash tower project to increase light crude capability by 10,000 bpd was completed. Also, the fluid catalytic cracking reactor was replaced. These projects improved operating efficiencies and crude flexibility at the El Dorado refinery, and allow it to achieve crude throughput of up to 80,000 bpd using a light crude slate or medium-sour crude slate depending on refined product and crude oil pricing, while producing an asphalt yield of 10 percent or less.
Tyler Expansion Project and Turnaround
During the first quarter of 2015, we plan to conduct a maintenance turnaround at the Tyler refinery, as well as replace the fluid catalytic cracking reactor. In addition, during the turnaround, we expect to complete a project to expand the crude nameplate capacity at the Tyler refinery by 15,000 bpd to 75,000 bpd. The Tyler Expansion will increase the crude processing unit to 75,000 bpd, the distillate hydrotreating unit to 36,000 bpd and the naphtha hydrotreating unit to 28,000 bpd. This expansion project is expected to cost approximately $70.3 million, of which approximately $50.9 million was spent during 2014. This expansion project is being primarily financed with the $70.0 million term loan under our Wells ABL credit facility.
46
Acquisitions
Crossett Biodiesel Facility Acquisition
In January 2014, we purchased a biodiesel plant in Crossett, Arkansas (the "Crossett Facility") from Pinnacle Biofuels, Inc. for approximately $11.1 million. The Crossett Facility has a production capacity of approximately 10.0 million gallons per year. The Crossett Facility produced biodiesel exclusively for Delek under a tolling agreement prior to this acquisition.
Logistics Segment
During 2014, we grew our logistics segment through third party acquisitions and the transfer of assets from refining. We completed new agreements with third parties related to the Paline Pipeline in December 2014 that should provide additional growth in 2015. Our strategy in 2015 will continue to focus on growth as we are planning to complete the transfer of logistics assets from our refining segment in first quarter 2015. These assets consist of a crude oil storage tank at the Tyler refinery and rail offloading racks at the El Dorado refinery. In addition, we will continue to explore opportunities to increase our third party business through acquisitions and project development.
Acquisitions
El Dorado Terminal and Tankage Transfer
In February 2014, a subsidiary of Delek Logistics completed the El Dorado Acquisition, whereby it purchased certain storage tanks and the products terminal located at the El Dorado refinery from Lion Oil for approximately $95.9 million in cash. The storage tanks have approximately 2.5 million barrels of aggregate shell capacity and consist of 158 tanks and ancillary assets, including piping and pumps.
The El Dorado Acquisition is considered a transfer of a business between entities under common control. As such, the assets acquired and liabilities assumed were transferred to Delek Logistics at historical basis instead of fair value.
In conjunction with the El Dorado Acquisition, we reclassified certain operating segments. The results of the operation of the assets associated with this acquisition were previously reported as part of our refining segment and are now reported in our logistics segment. The historical results of the operation of these assets have been reclassified to conform to the current presentation.
Mount Pleasant Acquisition
In October 2014, Delek Logistics purchased (i) a light products terminal in Mount Pleasant, Texas (the "Mount Pleasant Terminal"), (ii) a light products storage facility in Greenville, Texas (the "Greenville Storage Facility") and (iii) a 76-mile pipeline connecting the locations (the "Greenville-Mount Pleasant Pipeline"). The Mount Pleasant Terminal, the Greenville Storage Facility and the Greenville-Mount Pleasant Pipeline are hereinafter collectively referred to as the "Greenville-Mount Pleasant Assets." Delek Logistics acquired the Greenville-Mount Pleasant Assets from an affiliate of Magellan Midstream Partners, L.P. to complement our existing assets and provide enhanced logistical capabilities. The Mount Pleasant Terminal consists of approximately 200,000 barrels of light product storage capacity, three truck loading lanes and ethanol blending capability. The Greenville Storage Facility has approximately 325,000 barrels of storage capacity and is connected to the Explorer Pipeline System. The aggregate purchase price was approximately $11.1 million in cash, including $1.1 million in finished product inventory, comprised of cash on hand and borrowings under the DKL Revolver. The purchase price has been preliminarily allocated to inventory and property, plant and equipment. The property, plant and equipment valuation is subject to change during the purchase price allocation period.
Trucking Asset Acquisition
On December 17, 2014, Delek Logistics purchased 100% of the assets of Frank Thompson Transport, Inc. ("FTT"). FTT is a transport company that primarily hauls crude oil and refined products by transport truck. The assets purchased include approximately 120 trucks and 200 trailers (the "FTT Assets"). The aggregate purchase price of the FTT Assets was approximately $11.6 million.
Retail Segment
The retail strategy has been centered around increasing the proportion of large format stores in our portfolio to enhance the value provided to our customers. These large format stores include more fuel pumps, as well as quick service food offerings and a larger merchandise selection inside the store. In addition, we have continued to grow our private label product offerings which reached
47
7.8% of revenue, excluding cigarettes, in 2014. Our loyalty program reached over one million registered users in 2014. We have continued to improve our fuel supply flexibility by leveraging our integration with the refining segment to increase the amount of both direct and exchange fuel shipments to our stores. This resulted in more Gulf Coast bulk fuel purchases in our system giving us better access to better pricing for our product.
Construction Initiative
Our new construction initiative remains ongoing, as we continue to build new stores in our core markets. During 2014, we constructed 11 new large-format stores and divested 7 non-strategic locations. As of December 31, 2014, the retail segment operated 365 locations, versus 361 locations in the prior-year period. Of the 365 stores in operation, 216 stores, or approximately 59.2% of the store base, are either reimaged locations or large-format stores. At the end of 2014 there were 64 large-format stores in operation.
Debt Refinancing
DKL Revolver
On December 30, 2014, Delek Logistics amended and restated its senior secured revolving credit agreement, which was originally entered into on November 7, 2012, with Fifth Third Bank, as administrative agent, and a syndicate of lenders (as amended and restated, the "DKL Revolver"). Under the terms of the DKL Revolver, the lender commitments were increased from $400.0 million to $700.0 million. The DKL Revolver also contains an accordion feature whereby Delek Logistics can increase the size of the credit facility to an aggregate of $800.0 million, subject to receiving increased or new commitments from lenders and the satisfaction of certain other conditions precedent. While the majority of the terms of the DKL Revolver are substantially unchanged from the predecessor facility, among other things, changes were made to certain negative covenants, the financial covenants and the interest rate pricing grid. The DKL Revolver continues to contain an option for Canadian dollar denominated borrowings. The DKL Revolver matures on December 30, 2019.
Borrowings denominated in U.S. dollars under the DKL Revolver bear interest at either a U.S. dollar prime rate, plus an applicable margin, or the London Interbank Offered Rate ("LIBOR"), plus an applicable margin, at the election of the borrowers. Borrowings denominated in Canadian dollars under the DKL Revolver bear interest at either a Canadian dollar prime rate, plus an applicable margin, or the Canadian Dealer Offered Rate ("CDOR"), plus an applicable margin, at the election of the borrowers. The applicable margin in each case varies based upon Delek Logistics' most recent leverage ratio delivered to the lenders, as called for and defined under the terms of the credit facility.
Return Capital to Shareholders
Dividends
We paid a regular quarterly dividend of $0.15 per share, totaling $0.60 per share, during the year ended December 31, 2014. Further, we paid a quarterly special dividend of $0.10 per share throughout 2014, totaling $0.40 per share. Total dividends declared during the year ended December 31, 2014 equaled $59.2 million, or $1.00 per share.
Stock Repurchase Program
On August 5, 2014, we announced that our Board of Directors had increased the authorization under our common stock repurchase program to $100.0 million. The share repurchases were authorized through open market transactions or in privately negotiated transactions, in accordance with applicable securities laws. The timing, price, and size of repurchases were made at the discretion of management and depended upon prevailing market prices, general economic and market conditions and other considerations. The stock repurchase program did not obligate us to acquire any particular amount of stock, and the unused portion of the authorization under the stock repurchase program expired on December 31, 2014. During the year ended December 31, 2014, we repurchased 2,365,561 shares of common stock under the stock repurchase authorization, for a total expenditure of $74.7 million, or an average price of $31.55 per share, respectively.
In 2015, our Board of Directors approved a new share repurchase authorization for $125.0 million that will expire on December 31, 2015. Shares under the program may be repurchased from time to time in the open market or through privately negotiated transactions, subject to market conditions and other factors.
48
Market Trends
Our results of operations are significantly affected by fluctuations in the prices of certain commodities, including, but not limited to, crude oil, gasoline, distillate fuel, biofuels and natural gas and electricity, among others. Historically, our profitability has been affected by commodity price volatility, specifically as it relates to the price of crude oil and refined products.
We continue to experience volatility in the energy markets. During 2014, the price of WTI crude oil ranged from a high of $107.26 per barrel to a low of $53.27 per barrel, and the average decreased 5.2% to $92.94 per barrel when compared to 2013. During the fourth quarter of 2014, the average price of WTI crude oil was $73.02 per barrel, compared to $97.55 in the fourth quarter of 2013, falling from $91.16 per barrel at September 30, 2014 to $53.27 per barrel at December 31, 2014. The sharp decline in the price of WTI crude oil in the fourth quarter of 2014 is primarily attributable to market supply/demand imbalance, coupled with OPEC's decision in late 2014 to maintain crude oil production levels despite the imbalance.
The Gulf Coast 5-3-2 crack spread ranged from a daily high of $21.36 per barrel to a low of $(3.91) per barrel in 2014, while the average decreased 25.2% to $13.42 per barrel, versus $17.93 in 2013. The differential between WTI and Brent crude oil averaged $6.51 per barrel in 2014, versus $10.66 per barrel in 2013. This decline in the WTI/Brent crude oil differential contributed to the decline in the Gulf Coast 5-3-2 crack spread in 2014, as Gulf Coast light product prices track Brent crude oil price movements. A change in the WTI/Brent crude oil differential has a direct impact on our profitability. The wholesale cost of refined products further contributed to the decline in the Gulf Coast 5-3-2 crack spread in 2014, with the US Gulf Coast price of gasoline declining 7.4%, from an average of $2.69 in 2013 to $2.49 in 2014 and the US Gulf coast price of High Sulfur Diesel declining 9.76%, from an average of $2.87 in 2013 to $2.59 in 2014.
Our Tyler and El Dorado refineries both continued to have greater access to discounted WTI and WTI-linked crude feedstocks during 2014 compared to certain of our competitors. However, as new pipelines and rail capabilities have increased the ability to ship price-advantaged crude oil supplies in the mid-continent region, we may experience a decline in certain crude oil price differentials. The average differential between WTI and Midland crude oil widened in 2014, to an average of $6.88 per barrel, compared to $2.64 per barrel in 2013. This occurred primarily because of limited ability to ship crude from Midland as production grew. However, in the fourth quarter of 2014, this differential narrowed significantly, from an average of $9.85 per barrel in the third quarter of 2014 to $5.80 in the fourth quarter of 2014, primarily due to the completion of an interconnection project in the Midland area. As these price differentials decrease, so does our competitive advantage created by our access to WTI-linked crude oil.
Environmental regulations continue to affect our margins in the form of the increasing cost of Renewable Identification Numbers ("RINs"). On a consolidated basis, we work to balance our RINs obligations in order to minimize the effect of RINs on our results. While we generate RINs in all three operating segments through our ethanol blending and biodiesel production, our refining segment needs to purchase additional RINs to satisfy its obligations. As a result, increases in the price of RINs can adversely affect our results of operations. The cost of ethanol RINs has fluctuated from an average of $0.60 in 2013 to an average of $0.49 in 2014. The cost of biodiesel RINs fluctuated from an average of $1.11 in 2013 to an average of 0.84 in 2014.
As part of our overall business strategy, management determines the cost to store crude, the pricing of products and whether we should maintain, increase or decrease inventory levels of crude or other intermediate feedstocks based on various factors, including the crude pricing market in the Gulf Coast region, the refined products market in the same region, the relationship between these two markets, our ability to obtain credit with crude vendors, and any other factors which may impact the costs of crude.
49
Results of Operations
The table below sets forth certain information concerning our consolidated operations:
Year Ended December 31, | ||||||||||||
2014 | 2013 | 2012 | ||||||||||
Net sales | $ | 8,324.3 | $ | 8,706.8 | $ | 8,726.7 | ||||||
Operating costs and expenses: | ||||||||||||
Cost of goods sold | 7,315.2 | 7,880.7 | 7,708.2 | |||||||||
Operating expenses | 398.8 | 387.4 | 363.3 | |||||||||
General and administrative expenses | 133.4 | 111.2 | 99.7 | |||||||||
Depreciation and amortization | 111.5 | 89.8 | 82.5 | |||||||||
Other operating income, net | (1.1 | ) | — | (0.1 | ) | |||||||
Total operating costs and expenses | 7,957.8 | 8,469.1 | 8,253.6 | |||||||||
Operating income | 366.5 | 237.7 | 473.1 | |||||||||
Interest expense | 40.6 | 37.7 | 45.7 | |||||||||
Interest income | (0.8 | ) | (0.3 | ) | (0.2 | ) | ||||||
Other income, net | (0.9 | ) | (6.3 | ) | — | |||||||
Total non-operating expenses, net | 38.9 | 31.1 | 45.5 | |||||||||
Income before income taxes | 327.6 | 206.6 | 427.6 | |||||||||
Income tax expense | 101.6 | 70.9 | 151.6 | |||||||||
Net income | 226.0 | 135.7 | 276.0 | |||||||||
Net income attributed to non-controlling interest | 27.4 | 18.0 | 3.2 | |||||||||
Net income attributable to Delek | $ | 198.6 | $ | 117.7 | $ | 272.8 | ||||||
Consolidated Results of Operations — Comparison of the Year Ended December 31, 2014 versus the Year Ended December 31, 2013
We generated net sales of $8,324.3 million and $8,706.8 million during the years ended December 31, 2014 and 2013, respectively, a decrease of $382.5 million, or 4.4%. The decrease in net sales was primarily attributable to decreases in refined product sales prices across all three operating segments, as well as a decrease in sales volumes attributed to our west Texas operations in the logistics segment for 2014, as compared to 2013. These decreases were partially offset by an increase in sales volumes in the refining and retail segments.
Cost of goods sold was $7,315.2 million for the year ended December 31, 2014, compared to $7,880.7 million for 2013, a decrease of $565.5 million, or 7.2%. The decrease in cost of goods sold was primarily due to a decrease in the average cost of refined products in the logistics and retail segments, a decrease in the cost of crude oil in the refining segment and a decrease in sales volumes in the west Texas operations in the logistics segment. These decreases were partially offset by an increase in sales volumes in both the refining and retail segments.
Operating expenses were $398.8 million for the year ended December 31, 2014 compared to $387.4 million in 2013, an increase of $11.4 million, or 2.9%. The increase in operating expenses is primarily attributable to the expenses associated with the operation of the biodiesel facility acquired in January 2014, increases in maintenance costs in the logistics segment and increases in salaries, maintenance and credit expenses, resulting from our continued shift to large-format stores, in the retail segment. These increases were partially offset by decreases in inspection fees, supplies and insurance expenses in the refining segment.
General and administrative expenses were $133.4 million for the year ended December 31, 2014 compared to $111.2 million in 2013, an increase of $22.2 million, or 20.0%. The overall increase was primarily due to increases in payroll related expenses, attributable to company growth, stock-based compensation and incentive expense.
Depreciation and amortization was $111.5 million and $89.8 million for the years ended December 31, 2014 and 2013, respectively, an increase of $21.7 million, or 24.2%. This increase was primarily due to the additional depreciation associated with the assets acquired in 2014, the completion of capital projects in the refining segment and the construction of new large-format stores in the retail segment.
50
Other operating income for the year ended December 31, 2014 was $1.1 million and primarily related to a condemnation payment associated with one of our retail stores. We did not have any other operating income for 2013.
Interest expense was $40.6 million in the year ended December 31, 2014, compared to $37.7 million for 2013, an increase of $2.9 million, or 7.7%. The increase was primarily attributable to increases in interest costs under our credit facilities due to changes in debt utilization and interest rates thereunder.
Other income was $0.9 million in the year ended December 31, 2014 and was primarily attributable to foreign currency gains and miscellaneous other income. Other income was $6.3 million in 2013 and was primarily attributable to the reversal of litigation accruals due to favorable court rulings.
Income tax expense was $101.6 million and $70.9 million during the years ended December 31, 2014 and 2013, respectively, an increase of $30.7 million. Our effective tax rate was 31.0% for 2014, compared to 34.3% for 2013. The decrease in our effective tax rate for 2014 was primarily due to an increase in certain tax benefits and the actualization of prior-year provision amounts.
Consolidated Results of Operations — Comparison of the Year Ended December 31, 2013 versus the Year Ended December 31, 2012
We generated net sales of $8,706.8 million and $8,726.7 million during the years ended December 31, 2013 and 2012, respectively, a decrease of $19.9 million, or 0.2%. Increased sales volume at both the Tyler and El Dorado refineries and increased sales volumes and pipeline revenue in the logistics segment were more than offset by the elimination of intercompany sales between operating segments.
Cost of goods sold was $7,880.7 million for the year ended December 31, 2013, compared to $7,708.2 million for 2012, an increase of $172.5 million, or 2.2%. The increase in cost of goods sold was primarily due to the increased sales volumes in the refining and logistics segments and increased crude oil prices. These increases were partially offset by a decrease in average fuel costs in the retail segment.
Operating expenses were $387.4 million for the year ended December 31, 2013 compared to $363.3 million in 2012, an increase of $24.1 million, or 6.6%. The increase in operating expenses is primarily attributable to the expenses associated with the operation of the biodiesel facility acquired in 2013, unplanned maintenance activities during the first quarter of 2013 and increased throughput rates at both the Tyler and El Dorado refineries, as well as an increase in advertising expenses associated with our loyalty program in the retail segment.
General and administrative expenses were $111.2 million for the year ended December 31, 2013 compared to $99.7 million in 2012, an increase of $11.5 million, or 11.5%. The overall increase was primarily due to increases in equity-based compensation and payroll related expenses, outside services and legal fees.
Depreciation and amortization was $89.8 million and $82.5 million for the years ended December 31, 2013 and 2012, respectively, an increase of $7.3 million, or 8.8%. This increase was primarily due to the additional depreciation associated with the assets acquired in 2013 and the construction of new large-format stores in the retail segment, partially offset by a decrease in the number of stores operated by the retail segment.
Other operating expenses for the year ended December 31, 2013 included a $1.6 million disposal of certain refining segment assets. This disposal was completely offset by a $1.6 million condemnation payment associated with one of our retail stores. Other operating income for 2012 was $0.1 million and was primarily related to the sale of miscellaneous assets in the retail and refining segments. There were no gains or losses on sales of assets during 2013.
Interest expense was $37.7 million in the year ended December 31, 2013, compared to $45.7 million for the comparable period of 2012, a decrease of $8.0 million, or 17.5%. The decrease was primarily attributable to decreases in our unrealized mark-to-market expenses related to our interest rate swaps, along with decreases in interest costs on our debt resulting from changes in debt utilization and interest rates under our various credit facilities.
Other income was $6.3 million in the year ended December 31, 2013 and was primarily attributable to the reversal of litigation accruals due to favorable court rulings.
Income tax expense was $70.9 million and $151.6 million during the years ended December 31, 2013 and 2012, respectively, a decrease of $80.7 million. Our effective tax rate was 34.3% for 2013, compared to 35.5% for 2012. The decrease in our effective tax rate for 2013 was primarily due to the reduction in taxable income associated with the non-controlling interest in Delek Logistics, which was partially offset by the impact of non-deductible equity-based compensation paid to our executives.
51
Operating Segments
In conjunction with the El Dorado Acquisition, we reclassified certain operating segments. The results of the operation of the assets associated with this acquisition were previously reported as part of our refining segment and are now reported in our logistics segment. The historical results of the operation of these assets have been reclassified to conform to the current presentation.
Also, in April 2014, we revised the structure of the internal financial information reviewed by management and began allocating the results of hedging activity previously reported in corporate, other and eliminations to our refining segment and allocated to each refinery based on total throughput. The historical results of this hedging activity have been reclassified to conform to the current presentation. The assets and/or liabilities associated with this hedging activity have not been allocated to the refining segment.
52
Refining Segment
The table below sets forth certain information concerning our refining segment operations:
Year Ended December 31, | ||||||||||||
2014 | 2013 | 2012 | ||||||||||
Refining Segment Contribution: | ||||||||||||
Net sales | $ | 6,350.5 | 6,435.8 | $ | 6,240.9 | |||||||
Cost of goods sold | 5,664.8 | 5,865.2 | 5,441.3 | |||||||||
Gross Margin | 685.7 | 570.6 | 799.6 | |||||||||
Operating expenses | 221.7 | 223.1 | 197.7 | |||||||||
Contribution margin | $ | 464.0 | $ | 347.5 | $ | 601.9 | ||||||
Tyler Refinery: | ||||||||||||
Days operated in period | 365 | 365 | 366 | |||||||||
Total sales volume (average bpd)(1) | 65,263 | 63,696 | 61,412 | |||||||||
Products manufactured (average bpd): | ||||||||||||
Gasoline | 35,829 | 33,791 | 33,045 | |||||||||
Diesel/Jet | 25,713 | 24,374 | 21,883 | |||||||||
Petrochemicals, LPG, NGLs | 2,264 | 2,292 | 2,268 | |||||||||
Other | 1,717 | 1,847 | 1,989 | |||||||||
Total production | 65,523 | 62,304 | 59,185 | |||||||||
Throughput (average bpd): | ||||||||||||
Crude oil | 58,756 | 58,327 | 56,426 | |||||||||
Other feedstocks | 7,811 | 4,970 | 3,450 | |||||||||
Total throughput | 66,567 | 63,297 | 59,876 | |||||||||
Per barrel of sales(3): | ||||||||||||
Tyler refinery operating margin(4) | $ | 16.71 | $ | 13.67 | $ | 20.41 | ||||||
Direct operating expenses(5) | $ | 4.41 | $ | 4.63 | $ | 4.71 | ||||||
El Dorado Refinery: | ||||||||||||
Days operated in period | 365 | 365 | 366 | |||||||||
Total sales volume (average bpd)(2) | 77,369 | 74,180 | 73,709 | |||||||||
Products manufactured (average bpd): | ||||||||||||
Gasoline | 35,960 | 34,908 | 33,411 | |||||||||
Diesel | 27,716 | 27,097 | 27,163 | |||||||||
Petrochemicals, LPG, NGLs | 701 | 997 | 1,318 | |||||||||
Asphalt | 6,024 | 7,691 | 6,897 | |||||||||
Other | 885 | 949 | 2,583 | |||||||||
Total production | 71,286 | 71,642 | 71,372 | |||||||||
Throughput (average bpd): | ||||||||||||
Crude oil | 66,723 | 65,887 | 65,375 | |||||||||
Other feedstocks | 6,229 | 6,872 | 7,797 | |||||||||
Total throughput | 72,952 | 72,759 | 73,172 | |||||||||
Per barrel of sales(3): | ||||||||||||
El Dorado refinery operating margin(4) | $ | 9.54 | $ | 8.76 | $ | 12.54 | ||||||
Direct operating expenses(5) | $ | 3.94 | $ | 4.06 | $ | 3.40 | ||||||
Pricing statistics (average for the period presented): | ||||||||||||
WTI — Cushing crude oil (per barrel) | $ | 92.94 | $ | 98.04 | $ | 94.19 | ||||||
WTI — Midland crude oil (per barrel) | $ | 86.35 | $ | 96.33 | $ | 90.12 | ||||||
US Gulf Coast crack spread (per barrel) | $ | 13.42 | $ | 17.93 | $ | 26.50 | ||||||
US Gulf Coast Unleaded Gasoline (per gallon) | $ | 2.49 | $ | 2.69 | $ | 2.80 | ||||||
Ultra low sulfur diesel (per gallon) | $ | 2.71 | $ | 2.97 | $ | 3.05 | ||||||
Natural gas (per MMBTU) | $ | 4.36 | $ | 3.73 | $ | 2.75 | ||||||
53
(1) | Sales volume includes 1,096 bpd, 1,277 bpd and 774 bpd sold to the logistics segment during the years ended December 31, 2014, 2013 and 2012, respectively. Sales volume also includes sales of 3,324 bpd, 2,696 bpd and 4,518 bpd of intermediate and finished products to the El Dorado refinery and the logistics segment during the years ended December 31, 2014, 2013 and 2012, respectively |
(2) | Sales volume includes 3,696, 2,720 and 2,958 bpd of produced finished product sold to the retail segment during the years ended December 31, 2014, 2013 and 2012, respectively. Sales volume also includes 1,609 bpd, 936 bpd and 171 bpd of produced finished product sold to the Tyler refinery during the during the years ended December 31, 2014, 2013 and 2012, respectively. Sales volume excludes 13,842 bpd, 20,572 bpd and 11,763 bpd of wholesale activity during the years ended December 31, 2014, 2013 and 2012, respectively. |
(3) | "Per barrel of sales" information is calculated by dividing the applicable income statement line item (operating margin or operating expenses) by the total barrels sold during the period. |
(4) | "Operating margin" is defined as refining segment net sales less cost of goods sold. |
(5) | "Direct operating expenses" are defined as operating expenses attributed to the refining segment. |
Refining Segment Operational Comparison of the Year Ended December 31, 2014 versus the Year Ended December 31, 2013
Contribution margin for the refining segment for the year ended December 31, 2014 was $464.0 million, or 76.0% of our consolidated contribution margin, compared to $347.5 million, or 79.2% of our consolidated segment contribution margin, for the year ended December 31, 2013. The increase to the refining segment contribution margin was primarily attributable to the increased margins at the Tyler refinery, as compared to the same period in 2013, partially offset by a slight decline in margins at the El Dorado refinery. The increase in margins at the Tyler refinery primarily resulted from the increased differential between WTI crude oil and Midland crude oil, to an average of $6.88 per barrel in 2014, compared to an average of $2.64 during 2013. This was partially offset by a decline in the benchmark Gulf Coast crack spread to an average of $13.42 per barrel in 2014, compared to an average of $17.93 per barrel during 2013. The decline in the Gulf Coast crack spread was driven by a 5.2% decline in the cost of WTI crude oil, coupled with larger declines in the US Gulf Coast price of gasoline and ULSD of 7.4% and 8.8%, respectively.
Net sales for the refining segment were $6,350.5 million and $6,435.8 million during the years ended December 31, 2014 and 2013, respectively, a decrease of $85.3 million, or 1.3%. The decrease in net sales is primarily due to declines in the average price of U.S. Gulf Coast gasoline, from $2.69 per gallon in 2013 to $2.49 per gallon in 2014, and ULSD, from $2.97 per gallon in 2013 to $2.71 per gallon in 2014. These declines were partially offset by a 3.4% increase in net sales volume at both the Tyler and El Dorado refineries. During the years ended December 31, 2014 and 2013, the refining segment sold $622.1 million and $430.7 million, or 15,881 and 9,502 bpd, respectively, of finished product to the retail and logistics segments. These sales are eliminated in consolidation.
Cost of goods sold for the year ended December 31, 2014 was $5,664.8 million compared to $5,865.2 million for the year ended December 31, 2013, a decrease of $200.4 million, or 3.4%. The decrease in cost of goods sold was primarily a result of hedging gains associated with our hedging program of $128.5 million in 2014, compared to losses of $3.0 million in 2013 and a decrease in the cost of WTI crude oil, from $98.04 per barrel in 2013 to $92.94 per barrel in 2014, partially offset by an 3.4% increase in average daily sales volume across the refining segment.
Our refining segment has multiple service agreements with our logistics segment which, among other things, require the refining segment to pay terminalling and storage fees based on the throughput volume of crude and finished product in the logistics segment pipelines and the volume of crude and finished product stored in the logistics segment storage tanks. These fees were $94.6 million and $57.8 million during the years ended December 31, 2014 and 2013, respectively. We eliminate these intercompany fees in consolidation.
Operating expenses were $221.7 million for the year ended December 31, 2014, compared to $223.1 million in 2013, a decrease of $1.4 million, or 0.6%. The decrease in operating expenses was primarily due to decreases in inspection fees, supplies and insurance expense, partially offset by increases in maintenance expenses associated with environmental spill clean-up costs, a mechanical issue with the Tyler refinery's fluid catalytic cracking reactor and increased expenses associated with the operation of the biodiesel facility acquired in January 2014.
Refining Segment Operational Comparison of the Year Ended December 31, 2013 versus the Year Ended December 31, 2012
Contribution margin for the refining segment for the year ended December 31, 2013 was $347.5 million, or 79.2% of our consolidated contribution margin, compared to $601.9 million, or 91.9% of our consolidated segment contribution margin, for the year ended December 31, 2012. The decrease to the refining segment contribution margin was primarily attributable to the decreased margins at both the Tyler and El Dorado refineries, as compared to the same period in 2012. The decline in margins at both refineries,
54
from a combined $16.12 per barrel sold in 2012 to $11.31 per barrel sold in 2013, primarily resulted from a decline in the benchmark Gulf Coast crack spread to an average of $17.93 per barrel in 2013, compared to an average of $26.50 per barrel during 2012.
Net sales for the refining segment were $6,435.8 million and $6,240.9 million during the years ended December 31, 2013 and 2012, respectively, an increase of $194.9 million, or 3.1%. The increase in net sales is primarily due to a 2.0% increase in net sales volume at both the Tyler and El Dorado refineries, as well as an increase in wholesale activity at the El Dorado refinery. During the years ended December 31, 2013 and 2012, the refining segment sold $430.7 million and $170.1 million, or 9,502 and 3,732 bpd, respectively, of finished product to the retail and logistics segments. These sales are eliminated in consolidation.
Cost of goods sold for the year ended December 31, 2013 was $5,865.2 million compared to $5,441.3 million for the year ended December 31, 2012, an increase of $423.9 million, or 7.8%. The increase in cost of goods sold was primarily due to a 2.0% increase in average daily sales volume across the refining segment, increased crude oil prices and an increase in the wholesale activity at the El Dorado refinery.
Our refining segment has multiple service agreements with our logistics segment which, among other things, require the refining segment to pay terminalling and storage fees based on the throughput volume of crude and finished product in the logistics segment pipelines and the volume of crude and finished product stored in the logistics segment storage tanks. These fees were $57.8 million and $30.0 million during the years ended December 31, 2013 and 2012, respectively. We eliminate these intercompany fees in consolidation.
Operating expenses were $223.1 million for the year ended December 31, 2013, compared to $197.7 million in 2012, an increase of $25.4 million, or 12.8%. The increase in operating expenses was attributable to expenses associated with the operation of the biodiesel facility acquired in January 2013, unplanned maintenance activities during the first quarter of 2013 at both the Tyler and El Dorado refineries and increased throughput rates.
Logistics Segment
The table below sets forth certain information concerning our logistics segment operations:
Year Ended December 31, | ||||||||||||
2014 | 2013 | 2012 | ||||||||||
Logistics Segment Contribution: | ||||||||||||
Net sales | $ | 841.3 | 907.4 | $ | 818.5 | |||||||
Cost of goods sold | 697.2 | 811.3 | 757.9 | |||||||||
Gross Margin | 144.1 | 96.1 | 60.6 | |||||||||
Operating expenses | 38.8 | 35.6 | 39.4 | |||||||||
Contribution margin | $ | 105.3 | $ | 60.5 | $ | 21.2 | ||||||
Operating Information: | ||||||||||||
East Texas - Tyler Refinery sales volumes (average bpd) (1) | 61,368 | 58,773 | 57,574 | |||||||||
West Texas wholesale marketing throughputs (average bpd) (2) | 16,707 | 18,156 | 16,523 | |||||||||
West Texas wholesale marketing margin per barrel | $ | 4.67 | $ | 2.12 | $ | 2.56 | ||||||
Terminalling throughputs (average bpd) (3) | 96,801 | 75,438 | 15,420 | |||||||||
Throughputs (average bpd): | ||||||||||||
Lion Pipeline System: | ||||||||||||
Crude pipelines (non-gathered) | 47,906 | 46,515 | 46,027 | |||||||||
Refined products pipelines to Enterprise Systems | 53,461 | 49,694 | 45,220 | |||||||||
SALA Gathering System | 22,656 | 22,152 | 20,747 | |||||||||
East Texas Crude Logistics System | 7,361 | 19,896 | 55,068 | |||||||||
(1) | Excludes jet fuel and petroleum coke. |
(2) | Excludes bulk ethanol and biodiesel. |
55
(3) | Consists of terminalling throughputs at our Tyler, Big Sandy and Mount Pleasant, Texas, North Little Rock, Arkansas and Memphis and Nashville, Tennessee terminals. Throughput volumes at the Tyler, Texas terminal are for the period from July 27, 2013 through December 31, 2014. Prior to July 27, 2013, the logistics segment did not record revenue for throughput at the Tyler, Texas terminal. Throughputs for the North Little Rock Terminal are for the period from October 24, 2013 through December 31, 2014. The Big Sandy Terminal had no throughputs for the year ended December 31, 2013, even though it became operational during the year. Throughputs for the Mount Pleasant Terminal are for the 92 days Delek operated the terminal following its acquisition on October 1, 2014. Barrels per day are calculated for only the days we operated each terminal. |
Logistics Segment Operational Comparison of the Year Ended December 31, 2014 versus the Year Ended December 31, 2013
Contribution margin for the logistics segment for the year ended December 31, 2014 was $105.3 million, or 17.3% of our consolidated contribution margin, compared to $60.5 million, or 13.8% of our consolidated contribution margin, for the year ended December 31, 2013, an increase of $44.8 million, or 74.0%. The increase in contribution margin was attributable to increased pipeline and transportation revenues during 2014 compared to 2013, primarily due to the effect of the commercial agreements entered into between the logistics segment and the refining segment in connection with the El Dorado Acquisition in February 2014 and the Tyler Acquisition in July 2013. Further contributing to the increase in contribution margin were higher margins achieved in our west Texas operations during 2014, compared to 2013, as a result of a favorable supply/demand balance due to downtime at refineries in the region in the second quarter 2014 and steady margins despite a fall in fuel prices in the fourth quarter 2014.
The logistics segment generated net sales of $841.3 million and $907.4 million during the years ended December 31, 2014 and 2013, respectively, a decrease of $66.1 million, or 7.3%. The decrease was primarily attributable to decreases in sales volume in our west Texas operations due to reduced supply and to the fact that our Abilene terminal was not operational for a portion of the first quarter of 2014. Also contributing to the decrease in our net sales were decreases in the average sales prices per gallon of gasoline and diesel. The average sales price per gallon of gasoline decreased $0.16 during 2014, to $2.57 per gallon from $2.73 per gallon during 2013, while the average sales price per gallon of diesel decreased $0.13 during 2014, to $2.94 per gallon from $3.07 during the 2013. These decreases were partially offset by increases in net sales attributable to the commercial agreements between the logistics and refining segments resulting from the El Dorado Acquisition and the Tyler Acquisition. Net sales included $14.4 million and $13.6 million of net service fees in our east Texas marketing business, paid by our refining segment during 2014 and 2013, respectively. These service fees are based on the number of gallons sold and a shared portion of the margin achieved in return for providing sales and customer support services. Net sales also include crude, intermediate and refined product transportation, terminalling and storage fees paid by our refining segment. These fees were $94.6 million and $57.8 million in 2014 and 2013, respectively. The logistics segment also sold $4.4 million and $6.2 million of RINs, at market prices, to the refining segment during 2014 and 2013, respectively. These intercompany sales and fees are eliminated in consolidation.
Cost of goods sold was $697.2 million for the year ended December 31, 2014, compared to $811.3 million for 2013, a decrease of $114.1 million, or 14.1%. The decrease in cost of goods sold was primarily attributable to decreases in sales volume and in the average cost per barrel sold in our west Texas marketing operations. The average cost per gallon of gasoline decreased $0.20 per gallon during 2014, to $2.50 per gallon from $2.70 per gallon during 2013, while the average cost per gallon of diesel decreased $0.18 per gallon during 2014, to $2.84 per gallon from $3.02 per gallon during 2013.
Operating expenses were $38.8 million for the year ended December 31, 2014 compared to $35.6 million for the comparable period of 2013, an increase of $3.2 million, or 9.0%. The increase in operating expenses was primarily due to increases in maintenance costs during the year ended December 31, 2014 compared to the year ended December 31, 2013.
Logistics Segment Operational Comparison of the Year Ended December 31, 2013 versus the Year Ended December 31, 2012
Contribution margin for the logistics segment for the year ended December 31, 2013 was $60.5 million, or 13.8% of our consolidated contribution margin, compared to $21.2 million, or 3.2% of our consolidated contribution margin, for the year ended December 31, 2012, an increase of $39.3 million, or 185.4%. The increase in contribution margin was attributable to increased pipeline and transportation revenues during 2013 compared to 2012, primarily due to the effect of the commercial agreements entered into between the logistics segment and the refining segment in connection with the DKL Offering, which reflect higher rates for crude oil gathering, crude oil and refined products transportation and storage services as compared to the rates charged prior to the execution of the commercial agreements. Revenue from our pipeline assets is generated by charging fees for services including gathering, transporting and storing crude oil. Cost of goods sold is therefore not incurred on these assets, resulting in inherently higher margins. Also contributing to the increase are revenues associated with the Paline Pipeline System.
56
The logistics segment generated net sales of $907.4 million and $818.5 million during the years ended December 31, 2013 and 2012, respectively, an increase of $88.9 million, or 10.9%. This increase was primarily attributable to an increase in total sales volume in our west Texas wholesale marketing operations, excluding bulk biofuels, which averaged 18,156 bpd during 2013, compared to 16,569 bpd in 2012. These increases were partially offset by a decline in average sales prices of refined products. Further contributing to the increase in sales was an increase in pipeline revenue, primarily associated with the Paline Pipeline System. Net sales included $13.6 million and $12.6 million of net service fees in our east Texas marketing business, paid by our refining segment during 2013 and 2012, respectively. These service fees are based on the number of gallons sold and a shared portion of the margin achieved in return for providing sales and customer support services. Net sales also include crude, intermediate and refined product transportation, terminalling and storage fees paid by our refining segment. These fees were $57.8 million and $30.0 million in 2013 and 2012, respectively. The logistics segment also sold $6.2 million of RINs, at market prices, to the refining segment during 2013. There were minimal RIN sales during 2012. These intercompany sales and fees are eliminated in consolidation.
Cost of goods sold was $811.3 million for the year ended December 31, 2013, compared to $757.9 million for the comparable period of 2012, an increase of $53.4 million, or 7.0%. The increase in cost of goods sold was primarily attributable to increases in sales volumes in the west Texas wholesale marketing operations.
Operating expenses were $35.6 million for the year ended December 31, 2013 compared to $39.4 million for the comparable period of 2012, a decrease of $3.8 million, or 9.6%. The decrease in operating expenses was primarily due to decreases in maintenance costs in 2013 compared to 2012.
Retail Segment
The table below sets forth certain information concerning our retail segment continuing operations:
Year Ended December 31, | ||||||||||||
2014 | 2013 | 2012 | ||||||||||
Retail Segment Contribution: | ||||||||||||
Net sales | $ | 1,869.3 | 1,871.4 | $ | 1,877.8 | |||||||
Cost of goods sold | 1,671.5 | 1,691.3 | 1,704.6 | |||||||||
Gross Margin | 197.8 | 180.1 | 173.2 | |||||||||
Operating expenses | 136.8 | 132.5 | 128.0 | |||||||||
Contribution margin | $ | 61.0 | $ | 47.6 | $ | 45.2 | ||||||
Operating Information: | ||||||||||||
Number of stores (end of period) | 365 | 361 | 373 | |||||||||
Average number of stores | 363 | 368 | 374 | |||||||||
Retail fuel sales (thousands of gallons) | 436,895 | 409,086 | 404,558 | |||||||||
Average retail gallons per store (based on average number of stores) (thousands of gallons) | 1,204 | 1,112 | 1,082 | |||||||||
Retail fuel margin ($ per gallon) | $ | 0.190 | $ | 0.173 | $ | 0.146 | ||||||
Merchandise sales (in millions) | 401.4 | 381.7 | 378.2 | |||||||||
Merchandise margin % | 28.0 | % | 28.3 | % | 29.3 | % | ||||||
Change in same-store retail fuel gallons sold | 0.1 | % | (1.6 | )% | 0.4 | % | ||||||
Change in same-store merchandise sales | 3.4 | % | 0.6 | % | 3.4 | % | ||||||
Retail Segment Operational Comparison of the Year Ended December 31, 2014 versus the Year Ended December 31, 2013
Contribution margin for the retail segment increased to $61.0 million, or 10.0% of our consolidated contribution margin, for the year ended December 31, 2014, versus $47.6 million, or 10.9% of our consolidated contribution margin, for 2013. The increase was primarily due to an increase in fuel margins and volumes in 2014, as compared to 2013, partially offset by an increase in operating expenses. The increase in fuel margins was primarily attributable to increased flexibility to supply fuel to our stores from the rack or directly from Gulf Coast sources, as well as favorable biofuel blending economics during 2014.
57
Net sales for our retail segment for the year ended December 31, 2014 decreased 0.1% to $1,869.3 million from $1,871.4 million for 2013. This decrease was primarily due to a 5.4% decrease in the retail fuel price per gallon to an average price of $3.17 per gallon for 2014, as compared to an average price of $3.35 per gallon for 2013. The decrease in the retail fuel sales price was partially offset by an increase in retail fuel volumes and an increase in merchandise sales.
Retail fuel sales were 436.9 million gallons for the year ended December 31, 2014, compared to 409.1 million gallons for 2013. Same store retail fuel sales increased 0.1% for 2014, as compared to 2013. Total fuel sales, including wholesale dollars, decreased 1.5% to $1,467.9 million in 2014. These decreases were primarily due to the decrease in the average price per gallon sold, partially offset by the increase in total gallons sold, as noted above.
Merchandise sales increased 5.2% to $401.4 million in the year ended December 31, 2014, compared to $381.7 million in 2013. The increase in merchandise sales was primarily due to an increase in cigarette and other tobacco, dairy, food service and cold dispenser beverage categories, partially offset by declines in the general merchandise and lottery categories. Same store merchandise sales increased 3.4% for 2014, as compared to 2013. This increase was primarily in the cigarette and other tobacco and dairy categories.
Cost of goods sold for our retail segment decreased 1.2% to $1,671.5 million in the year ended December 31, 2014, compared to $1,691.3 million for 2013. This decrease was primarily due to the decrease in the average cost per gallon of 6.3%, for an average cost of $2.98 per gallon in 2014 when compared to an average cost of $3.18 per gallon in 2013, which was partially offset by an increase in fuel volumes.
Operating expenses increased 3.2% to $136.8 million in the year ended December 31, 2014, compared to $132.5 million in 2013. Operating expenses increased primarily due to an increase in salaries, maintenance and credit expenses in 2014, compared to the same period in 2013, resulting from our continued shift to large-format stores.
Retail Segment Operational Comparison of the Year Ended December 31, 2013 versus the Year Ended December 31, 2012
Contribution margin for the retail segment increased to $47.6 million, or 10.9% of our consolidated contribution margin, for the year ended December 31, 2013, versus $45.2 million, or 6.9% of our consolidated contribution margin, for 2012. The increase was primarily due to an increase in fuel margins in 2013, as compared to 2012, partially offset by a decline in merchandise margins. The increase in fuel margins is primarily attributable to decreased wholesale fuel costs, coupled with a less significant drop in retail prices.
Net sales for our retail segment for the year ended December 31, 2013 decreased 0.3% to $1,871.4 million from $1,877.8 million for 2012. This decrease was primarily due to a 2.9% decrease in the retail fuel price per gallon to an average price of $3.35 per gallon for 2013, as compared to an average price of $3.45 per gallon for 2012. The decrease in the retail fuel sales price was partially offset by an increase in retail fuel volumes and an increase in merchandise sales.
Retail fuel sales were 409.1 million gallons for the year ended December 31, 2013, compared to 404.6 million gallons for 2012. Same store retail fuel sales declined by 1.6% for 2013, as compared to 2012. Total fuel sales, including wholesale dollars, decreased 0.7% to $1,489.8 million in 2013. These decreases were primarily due to the decrease in the average price per gallon sold, partially offset by the increase in total gallons sold, as noted above.
Merchandise sales increased 0.9% to $381.7 million in the year ended December 31, 2013, compared to $378.2 million in 2012. The increase in merchandise sales was primarily due to an increase in cigarette and other tobacco, dairy, and candy categories, partially offset by declines in the beer and soft drink categories. Same store merchandise sales increased 0.6% for 2013, as compared to 2012. This increase was primarily in the cigarette, candy and snack categories.
Cost of goods sold for our retail segment decreased 0.8% to $1,691.3 million in the year ended December 31, 2013, compared to $1,704.6 million for 2012. This decrease was primarily due to the decrease in the average cost per gallon of 3.6%, for an average cost of $3.18 per gallon in 2013 when compared to an average cost of $3.30 per gallon in 2012, which was partially offset by an increase in fuel volumes.
Operating expenses increased 3.5% to $132.5 million in the year ended December 31, 2013, compared to $128.0 million for 2012. Operating expenses increased primarily due to an increase in advertising related to our loyalty program in 2013, as well as our continued shift to large-format stores.
58
Liquidity and Capital Resources
Our primary sources of liquidity are cash generated from our operating activities and borrowings under our various credit facilities. We believe that our cash flows from operations and borrowings under or refinancing of our current credit facilities will be sufficient to satisfy the anticipated cash requirements associated with our existing operations, including capital expenditures, for at least the next 12 months.
During 2014, we renegotiated our credit facilities for Delek Logistics, MAPCO Express, Delek US, and Refining, and amended our Lion Oil term loan. Each of these activities extended or enhanced our access to credit or working capital financing.
These various financing arrangements were negotiated at market rates and we believe that the expected cash flows from our operations will be sufficient to satisfy cash requirements related to our various financing arrangements for at least the next 12 months.
Cash Flows
The following table sets forth a summary of our consolidated cash flows (in millions):
Year Ended December 31, | ||||||||||||
2014 | 2013 | 2012 | ||||||||||
Cash Flow Data: | ||||||||||||
Cash flows provided by operating activities | $ | 316.9 | $ | 102.5 | $ | 462.9 | ||||||
Cash flows used in investing activities | (289.4 | ) | (244.2 | ) | (159.2 | ) | ||||||
Cash flows provided by (used in) financing activities | 16.6 | (60.0 | ) | 72.1 | ||||||||
Net increase (decrease) in cash and cash equivalents | $ | 44.1 | $ | (201.7 | ) | $ | 375.8 | |||||
Cash Flows from Operating Activities
Net cash provided by operating activities was $316.9 million for the year ended December 31, 2014, compared to $102.5 million for 2013. The increase in cash flows from operations in 2014 compared to 2013 was primarily due to the increase in net income attributable to Holdings for 2014, which was $198.6 million, compared to $117.7 million in 2013, and decreases in inventory and other current assets and accounts receivable, primarily resulting from the sharp decline in crude oil and finished product prices in the fourth quarter of 2014. These were partially offset by decreases in accounts payable and the obligation under our supply and offtake agreement, also due to the decline in prices.
Net cash provided by operating activities was $102.5 million for the year ended December 31, 2013, compared to $462.9 million for 2012. The decrease in cash flows from operations in 2013 compared to 2012 was primarily due to the decrease in net income attributable to Holdings for 2013, which was $117.7 million, compared to $272.8 million in 2012 and increases in inventory and other current assets due to the building of inventory in anticipation of the January 2014 turnaround at the El Dorado refinery, partially offset by an increase in our obligation under the Supply and Offtake Agreement, which allows for the purchase of crude and refined products at the El Dorado refinery.
Cash Flows from Investing Activities
Net cash used in investing activities was $289.4 million for the year ended December 31, 2014, compared to $244.2 million in 2013. This increase was primarily due to an increase in our capital expenditures for 2014, as compared to 2013.
Cash used in investing activities for the year ended December 31, 2014 included our capital expenditures of approximately $256.9 million, of which $201.3 million was spent on projects in the refining segment, $26.2 million was spent in the retail segment, $7.0 million was spent in our logistics segment and $22.4 million was spent at the holding company level.
Net cash used in investing activities was $244.2 million for the year ended December 31, 2013, compared to $159.2 million in 2012. This increase was primarily due to an increase in our capital expenditures for 2013, as compared to 2012.
Cash used in investing activities for the year ended December 31, 2013 included our capital expenditures of approximately $222.3 million, of which $144.3 million was spent on projects in the refining segment, $37.9 million was spent in the retail segment, $5.1 million was spent in our logistics segment and $35.0 million was spent at the holding company level.
59
Cash Flows from Financing Activities
Net cash provided by financing activities was $16.6 million for the year ended December 31, 2014, compared to cash used of $60.0 million for 2013. The increase in cash provided by financing activities for 2014 primarily consisted of net borrowings under our revolving credit facilities of $102.5 million in 2014, compared to $71.3 million in 2013 and net borrowings under our term loans of $77.2 million, compared to net repayments of $23.2 million in 2013. The cash provided by these activities was partially offset by an increase in stock repurchases, to $74.7 million in 2014, compared to $37.9 million in 2013.
Net cash used in financing activities was $60.0 million for the year ended December 31, 2013, compared to cash provided of $72.1 million for 2012. The increase in net cash used in financing activities for 2013 primarily consisted of a stock repurchase in March 2013, an increase in our regular dividend rate and the payment of quarterly special dividends throughout 2013, and distributions paid to non-controlling interests in 2013. Cash provided by financing activities in 2012 included proceeds from the DKL Offering.
Cash Position and Indebtedness
As of December 31, 2014, our total cash and cash equivalents were $444.1 million and we had total indebtedness of approximately $589.7 million. Borrowing availability under our four separate revolving credit facilities was approximately $708.5 million and we had letters of credit issued of $102.7 million. We believe we were in compliance with our covenants in all debt facilities as of December 31, 2014.
See Note 10 to the consolidated financial statements in Item 8, Financial Statements and Supplementary Data, of this Annual Report on Form 10-K for a complete discussion of our third-party indebtedness.
60
Capital Spending
A key component of our long-term strategy is our capital expenditure program. Our capital expenditures for the year ended December 31, 2014 were $256.9 million, of which approximately $201.3 million was spent in our refining segment, $26.2 million in our retail segment, $7 million in our logistics segment and $22.4 million at the holding company level. Our capital expenditure budget is approximately $218.1 million for 2015. The following table summarizes our actual and planned capital expenditures by operating segment and major category (in millions):
Year Ended December 31, | ||||||||
2015 Forecast | 2014 Actual | |||||||
Refining: | ||||||||
Sustaining maintenance, including turnaround activities | $ | 58.6 | $ | 88.1 | ||||
Regulatory | 30.7 | 6.9 | ||||||
Discretionary projects | 74.9 | 106.3 | ||||||
Refining segment total | 164.2 | 201.3 | ||||||
Logistics: | ||||||||
Regulatory | 2.0 | 0.5 | ||||||
Maintenance projects | 11.7 | 4.1 | ||||||
Discretionary projects | 7.1 | 2.4 | ||||||
Logistics segment total | 20.8 | 7.0 | ||||||
Retail: | ||||||||
Sustaining maintenance | 9.2 | 8.3 | ||||||
Growth/profit improvements | 4.8 | 4.7 | ||||||
Retrofit/rebrand/re-image | 3.2 | 1.9 | ||||||
Raze and rebuild/new/land(1) | — | 11.3 | ||||||
Retail segment total | 17.2 | 26.2 | ||||||
Corporate & Other | ||||||||
Growth/profit improvements | 8.9 | 5.3 | ||||||
New builds(1) | 7.0 | 17.1 | ||||||
Other total | 15.9 | 22.4 | ||||||
Total capital spending | $ | 218.1 | $ | 256.9 | ||||
(1) Retail amounts exclude land and building costs on new store construction, which are included at the corporate level.
For the full year 2015, we plan to spend approximately $17.2 million in the retail segment, including $3.2 million to upgrade facilities and enhance our food offerings at existing stores. We spent $1.9 million on these projects in 2014. In addition, we plan to spend $4.8 million on other profit and growth improvements in existing stores in 2015.
We expect to spend approximately $30.7 million on regulatory projects in the refining segment in 2015. We spent $6.9 million on regulatory projects in 2014. In addition, we plan to spend approximately $58.6 million on maintenance projects and approximately $74.9 million for other discretionary projects in 2015. In 2015, we plan to spend $11.7 million on maintenance projects in the logistics segment, $7.1 million on discretionary projects and $2.0 million on regulatory projects. Of the total discretionary forecast for the logistics segment, $2.8 million relates to the addition of two loading lanes at the Tyler Terminal.
The amount of our capital expenditure budget is subject to change due to unanticipated increases in the cost, scope and completion time for our capital projects. For further information, please refer to our discussion in Item 1A, Risk Factors, of this Annual Report on Form 10-K.
61
Refining Segment
Our capital spending in the refining segment includes both the Tyler and El Dorado refineries.
Tyler, Texas Refinery
The next major turnaround at the Tyler refinery began in January 2015 and is expected to be completed in March 2015. The cost of the Tyler turnaround is estimated to be approximately $42.8 million, of which approximately $33.1 million is included in the 2015 forecast and the remainder was spent in 2014. Other major projects included in forecasted 2015 capital spending at the Tyler refinery are as follows:
• | Expansion Project: This project is being completed during the 2015 turnaround and will expand the crude nameplate capacity at the Tyler refinery by 15,000 bpd to 75,000 bpd. This expansion project is expected to cost approximately $70.3 million, of which approximately $50.9 million was spent during 2014. |
• | Flare Gas Recovery Project: This project will modify the existing flare system to add recovery and scrubbing operations. The cost of this project is estimated to be approximately $31.5 million and we expect to spend $24.7 million on this project in 2015, with the remainder spent in 2014. |
El Dorado, Arkansas Refinery
The El Dorado refinery completed a turnaround in February 2014 and the next planned turnaround is scheduled for 2019. The 2015 capital spending forecast for the El Dorado refinery includes $23.4 million in spending for increased crude oil off-take capacity by rail car.
Contractual Obligations and Commitments
Information regarding our known contractual obligations of the types described below as of December 31, 2014, is set forth in the following table (in millions):
Payments Due by Period | ||||||||||||||||||||
<1 Year | 1-3 Years | 3-5 Years | >5 Years | Total | ||||||||||||||||
Long term debt, notes payable and capital lease obligations | $ | 56.3 | $ | 124.0 | $ | 368.8 | $ | 40.6 | $ | 589.7 | ||||||||||
Interest(1) | 20.5 | 31.7 | 21.0 | 23.7 | 96.9 | |||||||||||||||
Operating lease commitments(2) | 20.8 | 37.5 | 29.1 | 64.6 | 152.0 | |||||||||||||||
Purchase commitments(3) | 411.3 | 234.9 | — | — | 646.2 | |||||||||||||||
Transportation agreements(4) | 56.3 | 122.1 | 119.1 | 92.8 | 390.3 | |||||||||||||||
Total | $ | 565.2 | $ | 550.2 | $ | 538.0 | $ | 221.7 | $ | 1,875.1 | ||||||||||
(1) | Expected interest payments on debt outstanding under credit facilities in place at December 31, 2014. Floating interest rate debt is calculated using December 31, 2014 rates. |
(2) | Amounts reflect future estimated lease payments under operating leases having remaining non-cancelable terms in excess of one year as of December 31, 2014. |
(3) | We have supply agreements to secure certain quantities of crude oil, finished product and other resources used in production at both fixed and market prices. We have estimated future payments under the market based agreements using current market rates. |
(4) | Balances consist of contractual obligations under agreements with third parties for the transportation of crude oil to our refineries. |
Off-Balance Sheet Arrangements
We have no off-balance sheet arrangements through the date of this Annual Report on Form 10-K.
62
Critical Accounting Policies and Estimates
The fundamental objective of financial reporting is to provide useful information that allows a reader to comprehend our business activities. We prepare our consolidated financial statements in conformity with GAAP, and in the process of applying these principles, we must make judgments, assumptions and estimates based on the best available information at the time. To aid a reader's understanding, management has identified our critical accounting policies. These policies are considered critical because they are both most important to the portrayal of our financial condition and results, and require our most difficult, subjective or complex judgments. Often they require judgments and estimation about matters which are inherently uncertain and involve measuring at a specific point in time, events which are continuous in nature. Actual results may differ based on the accuracy of the information utilized and subsequent events, some over which we may have little or no control.
LIFO Inventory
The Tyler refinery's inventory consists of crude oil, refined petroleum products and blendstocks which are stated at the lower of cost or market. Cost is determined under the last-in, first-out LIFO valuation method. The LIFO method requires management to make estimates on an interim basis of the anticipated year-end inventory quantities, which could differ from actual quantities.
We believe the accounting estimate related to the establishment of anticipated year-end LIFO inventory is a critical accounting estimate because it requires management to make assumptions about future production rates in the Tyler refinery, the future buying patterns of our customers, as well as numerous other factors beyond our control including the economic viability of the general economy, weather conditions, the availability of imports, the marketing of competitive fuels and government regulation. The impact of changes in actual performance versus these estimates could be material to the inventories reported on our quarterly balance sheets and the results reported in our quarterly statements of income could be material. In selecting assumed inventory levels, we use historical trending of production and sales, recognition of current market indicators of future pricing and value, and new regulatory requirements which might impact inventory levels. Management's assumptions require significant judgment because actual year-end inventory levels have fluctuated in the past and may continue to do so.
At each year-end, actual physical inventory levels are used to calculate both ending inventory balances and final cost of goods sold for the year.
Property, Plant and Equipment and Definite Life Intangibles Impairment
Property, plant and equipment and definite life intangibles are evaluated for impairment whenever indicators of impairment exist. Accounting standards require that if an impairment indicator is present, we must assess whether the carrying amount of the asset is unrecoverable by estimating the sum of the future cash flows expected to result from the asset, undiscounted and without interest charges. We derive the required undiscounted cash flow estimates from our historical experience and our internal business plans. We use quoted market prices when available and our internal cash flow estimates discounted at an appropriate interest rate to determine fair value, as appropriate. If the carrying amount is more than the recoverable amount, an impairment charge must be recognized based on the fair value of the asset.
Property and equipment of retail stores we are closing are written down to their estimated net realizable value at the time we close such stores. Changes in market demographics, competition, economic conditions and other factors can impact the operations of certain locations. Cash flows vary from year to year, and we analyze regional market, division and store operations. As a result, we identified and recorded impairment charges of $0.1 million, $0.6 million and $0.9 million for closed stores in 2014, 2013 and 2012, respectively. Similar changes may occur in the future that will require us to record an impairment charge.
Goodwill and Potential Impairment
Goodwill is reviewed at least annually for impairment or more frequently if indicators of impairment exist. Goodwill is tested by comparing net book value of the operating segments to the estimated fair value of the reporting unit. In assessing the recoverability of goodwill, assumptions are made with respect to future business conditions and estimated expected future cash flows to determine the fair value of a reporting unit. We use a market participant weighted average cost of capital, estimated minimal growth rates for revenue, gross profit, and capital expenditures based on history and our best estimate of future forecasts. We also estimated the fair values of the reporting units using a multiple of expected future cash flows such as those used by third party analysts. If these estimates and assumptions change in the future due to such factors as a decline in general economic conditions, competitive pressures on sales and margins, and other economic and industry factors beyond management's control, an impairment charge may be required. Our annual assessment of goodwill did not result in impairment during the years ended December 31, 2014, 2013 or 2012. Details of remaining goodwill balances by segment are included in Note 8 to the consolidated financial statements in Item 8, Financial Statements and Supplementary Data, of this Annual Report on Form 10-K.
63
Environmental Liabilities
It is our policy to accrue environmental and clean-up related costs of a non-capital nature when it is both probable that a liability has been incurred and the amount can be reasonably estimated. Environmental liabilities represent the current estimated costs to investigate and remediate contamination at our properties. This estimate is based on internal and third-party assessments of the extent of the contamination, the selected remediation technology and review of applicable environmental regulations. Accruals for estimated costs from environmental remediation obligations generally are recognized no later than completion of the remedial feasibility study, and include, but are not limited to, costs to perform remedial actions and costs of machinery and equipment that is dedicated to the remedial actions and that does not have an alternative use. Such accruals are adjusted as further information develops or circumstances change. We discount environmental liabilities to their present value if payments are fixed and determinable. Expenditures for equipment necessary for environmental issues relating to ongoing operations are capitalized.
Changes in laws and regulations, the financial condition of state trust funds associated with environmental remediation and actual remediation expenses compared to historical experience could significantly impact our results of operations and financial position. We believe the estimates selected, in each instance, represent our best estimate of future outcomes, but the actual outcomes could differ from the estimates selected.
New Accounting Pronouncements
See Note 2 to the consolidated financial statements in Item 8, Financial Statements and Supplementary Data, of this Annual Report on Form 10-K for a discussion of new accounting pronouncements applicable to us.
64
ITEM 7A. QUANTITATIVE AND QUALITATIVE DISCLOSURES ABOUT MARKET RISK
Changes in commodity prices (mainly crude oil and unleaded gasoline) and interest rates are our primary sources of market risk. When we make the decision to manage our market exposure, our objective is generally to avoid losses from adverse price changes, realizing we will not obtain the gains of beneficial price changes.
Commodity Price Risk
Impact of Changing Prices. Our revenues and cash flows, as well as estimates of future cash flows, are sensitive to changes in energy prices. Major shifts in the cost of crude oil, the prices of refined products and the cost of ethanol can generate large changes in the operating margin in each of our segments.
We maintain, at both company-owned and third-party facilities, inventories of crude oil, feedstocks and refined petroleum products, the values of which are subject to wide fluctuations in market prices driven by world economic conditions, regional and global inventory levels and seasonal conditions. At December 31, 2014 and 2013, we held approximately 2.4 million and 2.3 million barrels, respectively, of crude and product inventories associated with the Tyler refinery valued under the LIFO valuation method with an average cost of $57.17 and $82.19 per barrel, respectively. At December 31, 2014 and 2013, the excess of replacement cost (FIFO) over the carrying value (LIFO) of refinery inventories was $0.3 million and $51.5 million, respectively. We refer to this excess as our LIFO reserve. At December 31, 2014 and 2013, we held approximately 3.9 million and 4.2 million barrels, respectively, of crude and product inventories associated with the El Dorado refinery valued under the FIFO valuation method with an average cost of $66.37 and $97.69 per barrel, respectively. In the year ended December 31, 2014, market prices declined to a level below the average cost of our inventories and we recorded a $50.1 million pre-tax write down of the carrying value of our inventory to the market value. Of the total write down, $35.4 million relates to LIFO inventory, which is subject to reversal in subsequent periods, not to exceed LIFO cost, should market prices recover.
Price Risk Management Activities. At times, we enter into commodity derivative contracts to manage our price exposure to our inventory positions, future purchases of crude oil and ethanol, future sales of refined products or to fix margins on future production. In accordance with ASC 815, Derivatives and Hedging ("ASC 815"), all of these commodity contracts are recorded at fair value, and any change in fair value between periods has historically been recorded in the profit and loss section of our consolidated financial statements, unless, at inception, the company elects to designate the contracts as cash flow hedges under ASC 815. Gains or losses on commodity derivative contracts accounted for as cash flow hedges are recognized in other comprehensive income on the consolidated balance sheets and ultimately, when the forecasted transactions are completed in net sales or cost of goods sold in the consolidated statements of income.
65
The following table sets forth information relating to our open commodity derivative contracts as of December 31, 2014 ($ in millions).
Total Outstanding | Notional Contract Volume (barrels) by Year of Maturity | |||||||||||||||
Contract Description | Market Value | Notional Contract Volume (barrels) | 2015 | 2016 | 2017 | |||||||||||
Contracts not designated as hedging instruments: | ||||||||||||||||
Crude oil price swaps - long | $ | 52.4 | 3,757,250 | 907,000 | 2,850,250 | — | ||||||||||
Inventory, refined product and crack spread swaps - long | (31.5 | ) | 1,668,500 | 1,668,500 | — | — | ||||||||||
Inventory, refined product and crack spread swaps - short | 25.7 | 1,231,000 | 1,231,000 | — | — | |||||||||||
Total | $ | 46.6 | 6,656,750 | 3,806,500 | 2,850,250 | — | ||||||||||
Contracts designated as cash flow hedging instruments: | ||||||||||||||||
Crude oil price swaps - long | $ | (38.3 | ) | 2,954,400 | 100,000 | — | 2,854,400 | |||||||||
Inventory, refined product and crack spread swaps - long | (1.5 | ) | 270,000 | 270,000 | — | — | ||||||||||
Inventory, refined product and crack spread swaps - short | 29.5 | 1,288,000 | 1,288,000 | — | — | |||||||||||
Total | $ | (10.3 | ) | 4,512,400 | 1,658,000 | — | 2,854,400 | |||||||||
Interest Rate Risk
We have market exposure to changes in interest rates relating to our outstanding floating rate borrowings, which totaled $496.5 million as of December 31, 2014. The annualized impact of a hypothetical one percent change in interest rates on our floating rate debt outstanding as of December 31, 2014 would be to change interest expense by $5.0 million.
We help manage this risk through interest rate swap and cap agreements that modify the interest characteristics of our outstanding long-term debt. In accordance with ASC 815, all interest rate hedging instruments are recorded at fair value and any changes in the fair value between periods are recognized in earnings. The fair values of our interest rate swaps and cap agreements are obtained from dealer quotes. These values represent the estimated amount that we would receive or pay to terminate the agreements taking into account the difference between the contract rate of interest and rates currently quoted for agreements, of similar terms and maturities. We expect that any interest rate derivatives held would reduce our exposure to short-term interest rate movements. As of both December 31, 2014 and 2013, we had floating-to-fixed interest rate derivative agreements in place for notional amounts of $205.0 million. The estimated fair value of our interest rate derivative liability was $0.9 million and $2.7 million as of December 31, 2014 and 2013, respectively. In accordance with ASC 815, we recorded an expense representing cash settlements and changes in estimated fair value of the interest rate derivative agreements of $0.4 million, $0.4 million and $2.6 million for the years ended December 31, 2014, 2013 and 2012, respectively. These amounts are included in interest expense in the accompanying consolidated statements of income.
While we have not elected to apply permitted hedge accounting treatment for these interest rate derivatives in accordance with the provisions of ASC 815 in the past, we may choose to elect that treatment in future transactions.
ITEM 8. FINANCIAL STATEMENTS AND SUPPLEMENTARY DATA
The information required by Item 8 is incorporated by reference to the section beginning on page F-1.
66
ITEM 9. CHANGES IN AND DISAGREEMENTS WITH ACCOUNTANTS ON ACCOUNTING AND FINANCIAL DISCLOSURE
None.
ITEM 9A. CONTROLS AND PROCEDURES
Disclosure Controls and Procedures
We maintain disclosure controls and procedures (as defined in Rule 13a-15(e) and 15d-15(e)) under the Securities Exchange Act of 1934, as amended ("Exchange Act") that are designed to provide reasonable assurance that the information that we are required to disclose in the reports we file or submit under the Exchange Act is recorded, processed, summarized and reported within the time periods specified in the SEC's rules and forms, and such information is accumulated and communicated to our management, including our Chief Executive Officer and Chief Financial Officer, as appropriate, to allow timely decisions regarding required disclosure. It should be noted that, because of inherent limitations, our disclosure controls and procedures, however well designed and operated, can provide only reasonable, and not absolute, assurance that the objectives of the disclosure controls and procedures are met.
As required by paragraph (b) of Rules 13a-15 and 15d-15 under the Exchange Act, our Chief Executive Officer and our Chief Financial Officer have evaluated the effectiveness of our disclosure controls and procedures (as such term is defined in Rules 13a-15(e) and 15d-15(e) under the Exchange Act) as of the end of the period covered by this report. Based on such evaluation, our Chief Executive Officer and our Chief Financial Officer have concluded, as of the end of the period covered by this report, that our disclosure controls and procedures were effective at a reasonable assurance level to ensure that the information that we are required to disclose in the reports we file or submit under the Exchange Act is recorded, processed, summarized and reported within the time periods specified in SEC rules and forms and such information is accumulated and communicated to our management, including our Chief Executive Officer and Chief Financial Officer, as appropriate, to allow timely decisions regarding required disclosure.
Management's Annual Report on Internal Control over Financial Reporting
Our management is responsible for establishing and maintaining adequate internal control over financial reporting. Our internal control over financial reporting is a process that is designed under the supervision of our Chief Executive Officer and Chief Financial Officer, and effected by our Board of Directors, management and other personnel, to provide reasonable assurance regarding the reliability of financial reporting and the preparation of financial statements for external purposes in accordance with GAAP. Our internal control over financial reporting includes those policies and procedures that:
i. | Pertain to the maintenance of records that, in reasonable detail, accurately and fairly reflect the transactions and dispositions of our assets; |
ii. | Provide reasonable assurance that transactions are recorded as necessary to permit preparation of financial statements in accordance with GAAP, and that receipts and expenditures recorded by us are being made only in accordance with authorizations of our management and Board of Directors; and |
iii. | Provide reasonable assurance regarding prevention or timely detection of unauthorized acquisition, use or disposition of our assets that could have a material effect on our financial statements. |
Because of its inherent limitations, internal control over financial reporting may not prevent or detect misstatements. Also, projections of any evaluation of effectiveness to future periods are subject to the risk that controls may become inadequate because of changes in conditions, or that the degree of compliance with the policies and procedures may deteriorate.
Management has conducted its evaluation of the effectiveness of internal control over financial reporting as of December 31, 2014, based on the framework in Internal Control - Integrated Framework (2013) issued by the Committee of Sponsoring Organizations of the Treadway Commission. Management's assessment included an evaluation of the design of our internal control over financial reporting and testing the operational effectiveness of our internal control over financial reporting. Management reviewed the results of the assessment with the Audit Committee of the Board of Directors. Based on its assessment and review with the Audit Committee, management concluded that, at December 31, 2014, we maintained effective internal control over financial reporting.
Report of Independent Registered Public Accounting Firm
Our independent registered public accounting firm, Ernst & Young LLP, has audited the effectiveness of our internal control over financial reporting as of December 31, 2014, as stated in their report, which is included in the section beginning on page F-1.
67
The information required by Item 8 is incorporated by reference to the section beginning on page F-1.
Changes in Internal Control over Financial Reporting
There have been no changes in our internal control over financial reporting during the fourth quarter of fiscal 2014 that have materially affected, or are reasonably likely to materially affect, our internal control over financial reporting.
From time to time, we make changes to our internal control over financial reporting that are intended to enhance its effectiveness and which do not have a material effect on our overall internal control over financial reporting.
ITEM 9B. OTHER INFORMATION
Dividend Declaration
On February 23, 2015, our Board of Directors voted to declare a quarterly cash dividend of $0.15 per share, payable on March 10, 2015 to shareholders of record on March 24, 2015.
2015 Annual Bonus Plan
On February 24, 2015, our Compensation Committee approved an Annual Incentive Plan for the 2015 fiscal year (the “2015 Bonus Plan”). Payment of awards under the 2015 Bonus Plan will primarily be based on the Company’s earnings per share performance for the year ending December 31, 2015 as such may be adjusted by the Compensation Committee for certain non-cash gains or losses (“Adjusted EPS”).
Under the 2015 Bonus Plan, no annual bonuses will be paid to our executive officers unless the Company’s Adjusted EPS for the year ending December 31, 2015 equals or exceeds $1.00. If the Company’s Adjusted EPS equals or exceeds $1.00, the 2015 Bonus Plan is fully funded and the Compensation Committee may further evaluate the Company’s relative performance and exercise downward discretion under the formula below:
• | Financial Performance. The Compensation Committee expects to attribute 60% of its evaluation to the Company’s financial performance under a matrix similar to the one used in determining annual bonuses for the fiscal year ended December 31, 2014. |
• | Refinery Safety. The Compensation Committee expects to attribute 20% of its evaluation, apportioned equally, to each of (i) the Company’s performance in refinery safety as measured by the Company’s total recordable incident rate and (ii) Tier I and II events at company refining facilities under the OSHA Process Safety Management standard. |
• | Refinery Utilization. The Compensation Committee expects to attribute the remaining 20% of its evaluation to the Company’s performance in refinery utilization as compared to utilization statistics published by the United States Department of Energy and United States Energy Information Administration. |
Yemin 2015 Long-Term Incentive Grant
On February 24, 2015, our Compensation Committee approved a long-term incentive award (the “Yemin Grant”) to Ezra Uzi Yemin, our Chief Executive Officer. The Yemin Grant will be made under our 2006 Long-Term Incentive Plan, as amended, on March 10, 2015 and has two components: (i) time-based restricted stock units having a grant date fair value of $1.5 million (the “Time-Based Award”) and (ii) an equal quantity of performance-based shares assuming target performance (the “Performance Award”). The Time-Based Award will vest quarterly in equal amounts through March 10, 2018 (provided the initial installment that would otherwise vest on June 10, 2015, will instead vest on September 10, 2015, simultaneously with the second installment) and is conditioned upon Mr. Yemin’s continued employment at the time of vesting. The Performance Award is subject to a performance period beginning January 1, 2015 and ending December 31, 2017. The Performance Award vests at the end of the performance period and is based solely on our total shareholder return relative to the performance of our peer group as described in our definitive Proxy Statement filed with the SEC on April 7, 2014. Mr. Yemin may earn from 0% to 200% of the Performance Award based on the Company's performance over the course of the performance period.
68
PART III
ITEM 10. DIRECTORS, EXECUTIVE OFFICERS AND CORPORATE GOVERNANCE
Our Board Governance Guidelines, our charters for our Audit, Compensation, Nominating and Corporate Governance and Environmental, Health and Safety Committees and our Code of Business Conduct & Ethics covering all employees, including our principal executive officer, principal financial officer, principal accounting officer and controllers, are available on our website, www.DelekUS.com, under the "About Us - Corporate Governance" caption. A copy of any of these documents will be mailed upon request made to Investor Relations, Delek US Holdings, Inc. or ir@delekus.com. We intend to disclose any amendments to or waivers of the Code of Business Conduct & Ethics on behalf of our Chief Executive Officer, Chief Financial Officer and persons performing similar functions on our website, at www.DelekUS.com, under the "Investor Relations" caption, promptly following the date of any such amendment or waiver.
The information required by Item 401 of Regulation S-K regarding directors will be included under "Election of Directors" in the definitive Proxy Statement for our Annual Meeting of Stockholders to be held May 5, 2015 (the "Definitive Proxy Statement"), and is incorporated herein by reference. The information required by Item 401 of Regulation S-K regarding executive officers will be included under "Corporate Governance" in the Definitive Proxy Statement and is incorporated herein by reference. The information required by Item 405 of Regulation S-K will be included under "Section 16(a) Beneficial Ownership Reporting Compliance" in the Definitive Proxy Statement and is incorporated herein by reference. The information required by Item 407(c)(3), (d)(4), and (d)(5) of Regulation S-K will be included under "Corporate Governance" in the Definitive Proxy Statement and is incorporated herein by reference.
ITEM 11. EXECUTIVE COMPENSATION
The information required by Item 402 and paragraphs (e)(4) and (e)(5) of Item 407 of Regulation S-K will be included under "Executive Compensation" and "Corporate Governance" in the Definitive Proxy Statement and is incorporated herein by reference.
ITEM 12. SECURITY OWNERSHIP OF CERTAIN OWNERS AND MANAGEMENT AND RELATED STOCKHOLDER MATTERS
The information required by Item 201(d) and Item 403 of Regulation S-K will be included under "Equity Compensation Plan Information" and "Security Ownership of Certain Beneficial Owners and Management" in the Definitive Proxy Statement and is incorporated herein by reference.
ITEM 13. CERTAIN RELATIONSHIPS AND RELATED TRANSACTIONS AND DIRECTOR INDEPENDENCE
The information required by Item 404 of Regulation S-K will be included under "Certain Relationships and Related Transactions" in the Definitive Proxy Statement and is incorporated herein by reference.
The information required by Item 407(a) of Regulation S-K will be included under "Election of Directors" and "Corporate Governance" in the Definitive Proxy Statement and is incorporated herein by reference.
ITEM 14. PRINCIPAL ACCOUNTANT FEES AND SERVICES
Set forth below are the fees paid for the services of Ernst & Young LLP:
December 31, | |||||||
2014 | 2013 | ||||||
Audit Fees (1) | $ | 2,010,205 | $ | 2,983,285 | |||
Audit-related fees (2) | 204,862 | 142,229 | |||||
Tax fees (3) | 124,340 | 122,630 | |||||
Total | $ | 2,339,407 | $ | 3,248,144 | |||
(1) | Audit fees consisted of services rendered to us or certain of our subsidiaries. Such audit services include audits of our consolidated financial statements and internal control over financial reporting, reviews of our quarterly financial statements, and audit services provided in connection with our regulatory filings. Fees and expenses are for services in connection with the audit of our fiscal years ended December 31, 2014 and December 31, 2013 regardless of when the fees and expenses were paid. |
(2) | Fees for audit-related matters billed in 2014 and 2013 primarily consisted of agreed upon procedures related to acquisition due diligence, procedures related to regulatory filings of our parent companies, and consultations on various accounting and reporting areas. |
(3) | Fees for tax services billed in 2014 and 2013 consisted primarily of consultation on various tax matters related to us and our subsidiaries and certain tax compliance related activities. |
The Audit Committee has considered and determined that the provision of non-audit services by our independent registered public accounting firm is compatible with maintaining auditor independence.
Pre-Approval Policies and Procedures. In general, all engagements performed by our independent registered public accounting firm, whether for auditing or non-auditing services, must be pre-approved by the Audit Committee. During 2014, all of the services performed for us by Ernst & Young LLP were pre-approved by the Audit Committee.
69
PART IV
ITEM 15. EXHIBITS AND FINANCIAL STATEMENT SCHEDULES
(a) Certain Documents Filed as Part of this Annual Report on Form 10-K:
1. | Financial Statements. The accompanying Index to Financial Statements and Schedule on page F-1 of this Annual Report on Form 10-K is provided in response to this item. |
2. | List of Financial Statement Schedules: |
Schedule I - Condensed financial information of Registrant as of December 31, 2014, 2013 and 2012
3. | Exhibits - See below. |
70
EXHIBIT INDEX
Exhibit No. | Description | |||
2.1 | ^ | Stock Purchase Agreement, dated March 17, 2011, by and among Ergon, Inc., Lion Oil Company and Delek US Holdings, Inc. (incorporated by reference to Exhibit 2.1 to the Company's Form 8-K filed on May 4, 2011). | ||
2.2 | ^ | First Amendment, dated April 29, 2011, to Stock Purchase Agreement, dated March 17, 2011, by and among Ergon, Inc., Lion Oil Company and Delek US Holdings, Inc. (incorporated by reference to Exhibit 2.2 to the Company's Form 8-K filed on May 4, 2011). | ||
2.3 | Contribution, Conveyance and Assumption Agreement, dated November 7, 2012, by and among Delek Logistics Partners, LP, Delek Logistics GP, LLC, Delek Logistics Operating, LLC, Delek Crude Logistics, LLC, Delek US Holdings, Inc., Delek Marketing & Supply, LLC, Delek Marketing and Supply, LP, Lion Oil Company and Delek Logistics Services Company (incorporated by reference to Exhibit 10.3 to the Company's Form 8-K filed on November 14, 2012). | |||
3.1 | Second Amended and Restated Certificate of Incorporation (incorporated by reference to Exhibit 3.1 to the Company's Form 10-Q filed on August 8, 2013). | |||
3.2 | Third Amended and Restated Bylaws (incorporated by reference to Exhibit 3.1 to the Company's Form 10-Q filed on August 7, 2014). | |||
4.1 | Specimen common stock certificate (incorporated by reference to Exhibit 4.1 to the Company's Registration Statement on Form S-1/A, filed on April 20, 2006, SEC File No. 333-131675). | |||
4.2 | Registration Rights Agreement, dated April 17, 2006, by and between Delek US Holdings, Inc. and Delek Group Ltd. (incorporated by reference to Exhibit 10.4 to the Company's Registration Statement on Form S-1/A, filed on April 20, 2006, SEC File No. 333-131675). | |||
10.1 | * | Employment Agreement, dated November 1, 2013, by and between Delek US Holdings, Inc. and Ezra Uzi Yemin (incorporated by reference to Exhibit 10.1 to the Company's Form 10-K filed on March 3, 2014). | ||
10.1(a) | * | Subscription Agreement, dated March 10, 2013, between Delek Logistics GP, LLC and Ezra Uzi Yemin (incorporated by reference to Exhibit 10.2 to the Company's Form 10-Q filed on May 9, 2013). | ||
10.1(b) | * | Subscription Agreement, dated December 10, 2013, between Delek Logistics GP, LLC and Ezra Uzi Yemin (incorporated by reference to Exhibit 10.1(b) to the Company's Form 10-K filed on March 3, 2014). | ||
10.2 | * | Employment Agreement, dated August 7, 2012, by and between Delek US Holdings, Inc. and Donald N. Holmes (incorporated by reference to Exhibit 10.2 to the Company's Form 10-Q filed on November 8, 2012). | ||
10.3 | * | Form of Indemnification Agreement for Directors and Officers (incorporated by reference to Exhibit 10.3 to the Company's Registration Statement on Form S-1/A, filed on April 20, 2006, SEC File No. 333-131675). | ||
10.6 | * | Delek US Holdings, Inc. 2006 Long-Term Incentive Plan (as amended through May 4, 2010) (incorporated by reference to Exhibit 10.1 to the Company's Form 10-Q filed on May 7, 2010). | ||
10.6(a) | * | Form of Delek US Holdings, Inc. 2006 Long-Term Incentive Plan Restricted Stock Unit Agreement (incorporated by reference to Exhibit 10.13(a) to the Company's Registration Statement on Form S-1/A, filed on April 20, 2006, SEC File No. 333-131675). | ||
10.6(b) | * | Director Form of Delek US Holdings, Inc. 2006 Long-Term Incentive Plan Stock Option Agreement (incorporated by reference to Exhibit 10.13(b) to the Company's Registration Statement on Form S-1/A, filed on April 20, 2006, SEC File No. 333-131675). | ||
10.6(c) | * | Officer Form of Delek US Holdings, Inc. 2006 Long-Term Incentive Plan Stock Option Agreement (incorporated by reference to Exhibit 10.13(c) to the Company's Registration Statement on Form S-1/A, filed on April 20, 2006, SEC File No. 333-131675). | ||
10.6(d) | * | Director Form of Delek US Holdings, Inc. 2006 Long-Term Incentive Plan Stock Appreciation Rights Agreement (incorporated by reference to Exhibit 10.5 to the Company's Form 10-Q filed on August 6, 2010). | ||
10.6(e) | * | Employee Form of Delek US Holdings, Inc. 2006 Long-Term Incentive Plan Stock Appreciation Rights Agreement (incorporated by reference to Exhibit 10.4 to the Company's Form 10-Q filed on August 6, 2010). | ||
10.6(f) | * | Form of Delek US Holdings, Inc. 2006 Long-Term Incentive Plan Performance Restricted Stock Unit Agreement (incorporated by reference to Exhibit 10.4 to the Company's Form 10-Q filed on August 7, 2014). | ||
10.7 | Tyler Throughput and Tankage Agreement, dated July 26, 2013, between Delek Refining, Ltd. and Delek Marketing & Supply, LP (incorporated by reference to Exhibit 10.1 to the Company's Form 8-K filed on August 1, 2013). | |||
10.8 | Pipelines and Tankage Agreement, dated November 7, 2012, by and between Delek Refining, Ltd. and Delek Crude Logistics, LLC (incorporated by reference to Exhibit 10.4 to the Company's Form 8-K filed on November 14, 2012). | |||
71
10.9 | Pipelines and Storage Facilities Agreement, dated November 7, 2012, by and among Lion Oil Company, Delek Logistics Partners, LP, SALA Gathering Systems, LLC, El Dorado Pipeline Company, LLC, Magnolia Pipeline Company, LLC and J. Aron & Company (incorporated by reference to Exhibit 10.5 to the Company's Form 8-K filed on November 14, 2012). | |||
10.10 | * | Employment Agreement, dated July 1, 2011, by and between Delek US Holdings, Inc. and Assaf Ginzburg (incorporated by reference to Exhibit 10.2 to the Company's Form 10-Q filed on November 9, 2011). | ||
10.10(a) | * | Subscription Agreement, dated March 10, 2013, between Delek Logistics GP, LLC and Assaf Ginzburg (incorporated by reference to Exhibit 10.3 to the Company's Form 10-Q filed on May 9, 2013). | ||
10.11 | * | Employment Agreement, dated as of November 1, 2011, by and between Delek US Holdings, Inc. and Frederec Green (incorporated by reference to Exhibit 10.14 to the Company's Form 10-K filed on March 14, 2012). | ||
10.11(a) | * | Subscription Agreement, dated March 10, 2013, between Delek Logistics GP, LLC and Frederec Green (incorporated by reference to Exhibit 10.4 to the Company's Form 10-Q filed on May 9, 2013). | ||
10.12 | Stock Repurchase Agreement, dated March 12, 2013, between Delek US Holdings, Inc. and Delek Hungary Holding Limited Liability Company (incorporated by reference to Exhibit 10.1 to the Company's Form 8-K filed on March 18, 2013). | |||
10.13 | * | Employment Agreement, dated November 1, 2011, by and between Delek US Holdings, Inc. and Mark B. Cox (incorporated by reference to Exhibit 10.16 to the Company's Form 10-K filed on March 14, 2012). | ||
10.13(a) | * | Separation of Employment / General Release, dated January 18, 2013, by and between Delek US Holdings, Inc. and Mark B. Cox (incorporated by reference to Exhibit 10.15(a) to the Company's Form 10-K filed on March 12, 2013). | ||
10.14 | * | Employment Agreement, dated November 1, 2011, by and between Delek US Holdings, Inc. and Harry P. (Pete) Daily (incorporated by reference to Exhibit 10.17 to the Company's Form 10-K filed on March 14, 2012). | ||
10.15 | * | Employment Agreement, dated November 1, 2011, by and between Delek US Holdings, Inc. and Kent B. Thomas (incorporated by reference to Exhibit 10.18 to the Company's Form 10-K filed on March 14, 2012). | ||
10.16 | ‡ | Amended and Restated Master Supply and Offtake Agreement, dated December 23, 2013, by and among J. Aron & Company, Lion Oil Company, and Lion Oil Trading & Transportation, LLC (incorporated by reference to Exhibit 10.18 to the Company's Form 10-K/A filed on June 26, 2014). | ||
10.17 | Amended and Restated Financing Agreement, dated December 18, 2013, among Lion Oil Company as borrower, certain subsidiaries of Lion Oil Company named therein as guarantors, Bank Hapoalim B.M. as collateral agent and lender, and Israel Discount Bank of New York as lender (incorporated by reference to Exhibit 10.1 to the Company's Form 8-K filed on December 20, 2013). | |||
10.17(a) | Amendment No. 1 to Amended and Restated Financing Agreement and Amendment No. 1 to Amended and Restated Parent Guaranty, dated June 23, 2014, among Lion Oil Company as borrower, certain subsidiaries of Lion Oil Company named therein as guarantors, Bank of Hapoalim B.M. as collateral agent and lender, Israel Discount Bank of New York as lender and Fifth Third Bank as lender (incorporated by reference to Exhibit 10.2 to the Company's Form 10-Q filed on August 7, 2014). | |||
10.18 | Amended and restated asset-backed revolving credit agreement dated January 16, 2014 by and between Delek Refining, Ltd. as borrower and a consortium of lenders including Wells Fargo Bank, National Association as administrative agent (incorporated by reference to Exhibit 10.1 to the Company's Form 10-Q filed on May 8, 2014). | |||
10.19 | El Dorado Throughput and Tankage Agreement, executed as of February 10, 2014, between Lion Oil Company and Delek Logistics Operating LLC, and, for limited purposes, J. Aron & Company (incorporated by reference to Exhibit 10.1 to the Form 8-K filed by the Company on February 14, 2014). | |||
10.20 | Second Amended and Restated Omnibus Agreement, dated as of February 10, 2014, among Delek US Holdings, Inc., Lion Oil Company, Delek Marketing & Supply, LP, Delek Refining, Ltd., Delek Logistics Partners, LP, Paline Pipeline Company, LLC, SALA Gathering Systems, LLC, Magnolia Pipeline Company, LLC, El Dorado Pipeline Company, LLC, Delek Crude Logistics, LLC, Delek Marketing-Big Sandy, LLC, Delek Logistics Operating, LLC and Delek Logistics GP, LLC (incorporated by reference to Exhibit 10.2 to the Form 8-K filed by the Company on February 14, 2014). | |||
10.21 | Third Amended and Restated Credit Agreement, dated May 6, 2014, between MAPCO Express, Inc. as borrower, Fifth Third Bank as arranger and administrative agent and a lender, Bank of America, N.A., as co-syndication Agent and a lender, BMO Capital Markets, as joint lead arranger and co-syndication agent, Regions Business Capital, as co-syndication agent and the lenders from time to time parties thereto (incorporated by reference to Exhibit 10.1 to the Form 10-Q filed by the Company on August 7, 2014). | |||
10.22 | Employment letter between Delek US Holdings, Inc. and Mark D. Smith dated April 22, 2014 (incorporated by reference to Exhibit 10.3 to the Form 10-Q filed by the Company on August 7, 2014). | |||
72
10.23 | Employment Agreement, dated November 6, 2012, by and between Delek US Holdings, Inc. and Dan L. Gordon (incorporated by reference to Exhibit 10.1 to the Form 10-Q filed by the Company on November 6, 2014). | |||
10.24 | Second Amended and Restated Credit Agreement, dated as of December 30, 2014, among Delek Logistics Partners, LP and each other borrower referenced therein, as borrowers, Fifth Third Bank, as administrative agent, and a syndicate of lenders (incorporated by reference to Exhibit 10.1 to the Form 8-K filed by the Company on January 6, 2015). | |||
21.1 | § | Subsidiaries of the Registrant | ||
23.1 | § | Consent of Ernst & Young LLP | ||
24.1 | § | Power of Attorney | ||
31.1 | § | Certification of the Company's Chief Executive Officer pursuant to Rule 13a-14(a)/15(d)-14(a) under the Securities Exchange Act. | ||
31.2 | § | Certification of the Company's Chief Financial Officer pursuant to Rule 13a-14(a)/15(d)-14(a) under the Securities Exchange Act. | ||
32.1 | § | Certification of the Company's Chief Executive Officer pursuant to 18 U.S.C. Section 1350, as adopted pursuant to Section 906 of the Sarbanes-Oxley Act of 2002. | ||
32.2 | § | Certification of the Company's Chief Financial Officer pursuant to 18 U.S.C. Section 1350, as adopted pursuant to Section 906 of the Sarbanes-Oxley Act of 2002. | ||
101 | The following materials from Delek US Holdings, Inc.’s Annual Report on Form 10-K for the annual period ended December 31, 2014, formatted in XBRL (eXtensible Business Reporting Language): (i) Consolidated Balance Sheets as of December 31, 2014 and 2013, (ii) Consolidated Statements of Income for the years ended December 31, 2014, 2013 and 2012, (iii) Consolidated Statements of Comprehensive Income for the years ended December 31, 2014, 2013 and 2012, (iv) Consolidated Statements of Changes in Stockholders’ Equity for the years ended December 31, 2014, 2013 and 2012, (v) Consolidated Statements of Cash Flows for the years ended December 31, 2014, 2013 and 2012 and (vi) Notes to Consolidated Financial Statements, tagged as blocks of text. | |||
_______________
* Management contract or compensatory plan or arrangement.
§ Filed herewith.
^ | Certain schedules have been omitted pursuant to Item 601(b)(2) of Regulation S-K. The Company agrees to supplementally furnish a copy of any of the omitted schedules to the United States Securities and Exchange Commission upon request. |
‡ Confidential treatment has been requested and granted with respect to certain portions of this exhibit
pursuant to Rule 24b-2 of the Securities Exchange Act of 1934, as amended. Omitted portions have
been filed separately with the United States Securities and Exchange Commission.
73
Delek US Holdings, Inc.
Consolidated Financial Statements
As of December 31, 2014 and 2013 and
For Each of the Three Years Ended December 31, 2014, 2013 and 2012
INDEX TO FINANCIAL STATEMENTS AND SCHEDULE
Audited Financial Statements: | |
All other financial schedules are not required under related instructions, or are inapplicable and therefore have been omitted.
F-1
Report of Independent Registered Public Accounting Firm
The Board of Directors and Stockholders of
Delek US Holdings, Inc.
We have audited Delek US Holdings, Inc.’s internal control over financial reporting as of December 31, 2014, based on criteria established in Internal Control-Integrated Framework issued by the Committee of Sponsoring Organizations of the Treadway Commission (2013 framework) (the COSO criteria). Delek US Holdings Inc.’s management is responsible for maintaining effective internal control over financial reporting, and for its assessment of the effectiveness of internal control over financial reporting included in the accompanying Management’s Annual Report on Internal Control over Financial Reporting. Our responsibility is to express an opinion on the Company’s internal control over financial reporting based on our audit.
We conducted our audit in accordance with the standards of the Public Company Accounting Oversight Board (United States). Those standards require that we plan and perform the audit to obtain reasonable assurance about whether effective internal control over financial reporting was maintained in all material respects. Our audit included obtaining an understanding of internal control over financial reporting, assessing the risk that a material weakness exists, testing and evaluating the design and operating effectiveness of internal control based on the assessed risk, and performing such other procedures as we considered necessary in the circumstances. We believe that our audit provides a reasonable basis for our opinion.
A company’s internal control over financial reporting is a process designed to provide reasonable assurance regarding the reliability of financial reporting and the preparation of financial statements for external purposes in accordance with generally accepted accounting principles. A company’s internal control over financial reporting includes those policies and procedures that (1) pertain to the maintenance of records that, in reasonable detail, accurately and fairly reflect the transactions and dispositions of the assets of the company; (2) provide reasonable assurance that transactions are recorded as necessary to permit preparation of financial statements in accordance with generally accepted accounting principles, and that receipts and expenditures of the company are being made only in accordance with authorizations of management and directors of the company; and (3) provide reasonable assurance regarding prevention or timely detection of unauthorized acquisition, use, or disposition of the company’s assets that could have a material effect on the financial statements.
Because of its inherent limitations, internal control over financial reporting may not prevent or detect misstatements. Also, projections of any evaluation of effectiveness to future periods are subject to the risk that controls may become inadequate because of changes in conditions, or that the degree of compliance with the policies or procedures may deteriorate.
In our opinion, Delek US Holdings, Inc. maintained, in all material respects, effective internal control over financial reporting as of December 31, 2014, based on the COSO criteria.
We also have audited, in accordance with the standards of the Public Company Accounting Oversight Board (United States), the 2014 consolidated financial statements of Delek US Holdings, Inc. and our report dated February 26, 2015 expressed an unqualified opinion thereon.
/s/ Ernst & Young LLP
Nashville, Tennessee
February 26, 2015
F-2
Report of Independent Registered Public Accounting Firm
The Board of Directors and Stockholders of
Delek US Holdings, Inc.
We have audited the accompanying consolidated balance sheets of Delek US Holdings, Inc. as of December 31, 2014 and 2013, and the related consolidated statements of income, comprehensive income, stockholders' equity, and cash flows for each of the three years in the period ended December 31, 2014. Our audits also included the financial statement schedule listed in the Index at Item 15(a). These financial statements and schedule are the responsibility of the Company's management. Our responsibility is to express an opinion on these financial statements and schedule based on our audits.
We conducted our audits in accordance with the standards of the Public Company Accounting Oversight Board (United States). Those standards require that we plan and perform the audit to obtain reasonable assurance about whether the financial statements are free of material misstatement. An audit includes examining, on a test basis, evidence supporting the amounts and disclosures in the financial statements. An audit also includes assessing the accounting principles used and significant estimates made by management, as well as evaluating the overall financial statement presentation. We believe that our audits provide a reasonable basis for our opinion.
In our opinion, the financial statements referred to above present fairly, in all material respects, the consolidated financial position of Delek US Holdings, Inc. at December 31, 2014 and 2013, and the consolidated results of its operations and its cash flows for each of the three years in the period ended December 31, 2014, in conformity with U.S. generally accepted accounting principles. Also, in our opinion, the related financial statement schedule, when considered in relation to the basic financial statements taken as a whole, presents fairly in all material respects the information set forth therein.
We also have audited, in accordance with the standards of the Public Company Accounting Oversight Board (United States), Delek US Holdings, Inc.’s internal control over financial reporting as of December 31, 2014, based on criteria established in Internal Control-Integrated Framework issued by the Committee of Sponsoring Organizations of the Treadway Commission (2013 framework) and our report dated February 26, 2015 expressed an unqualified opinion thereon.
/s/ Ernst & Young LLP
Nashville, Tennessee
February 26, 2015
F-3
Delek US Holdings, Inc.
Consolidated Balance Sheets
December 31, | ||||||||
2014 | 2013 | |||||||
(In millions, except share and per share data) | ||||||||
ASSETS | ||||||||
Current assets: | ||||||||
Cash and cash equivalents | $ | 444.1 | $ | 400.0 | ||||
Accounts receivable | 197.0 | 250.5 | ||||||
Inventory | 469.6 | 672.3 | ||||||
Other current assets | 136.7 | 94.3 | ||||||
Total current assets | 1,247.4 | 1,417.1 | ||||||
Property, plant and equipment: | ||||||||
Property, plant and equipment | 1,958.4 | 1,678.4 | ||||||
Less: accumulated depreciation | (509.6 | ) | (405.2 | ) | ||||
Property, plant and equipment, net | 1,448.8 | 1,273.2 | ||||||
Goodwill | 73.9 | 73.9 | ||||||
Other intangibles, net | 16.2 | 17.4 | ||||||
Other non-current assets | 105.1 | 58.8 | ||||||
Total assets | $ | 2,891.4 | $ | 2,840.4 | ||||
LIABILITIES AND STOCKHOLDERS’ EQUITY | ||||||||
Current liabilities: | ||||||||
Accounts payable | $ | 477.0 | $ | 602.0 | ||||
Current portion of long-term debt and capital lease obligations | 56.4 | 33.7 | ||||||
Obligation under Supply and Offtake Agreement | 200.9 | 331.0 | ||||||
Accrued expenses and other current liabilities | 122.9 | 113.4 | ||||||
Total current liabilities | 857.2 | 1,080.1 | ||||||
Non-current liabilities: | ||||||||
Long-term debt and capital lease obligations, net of current portion | 533.3 | 376.6 | ||||||
Environmental liabilities, net of current portion | 8.5 | 9.2 | ||||||
Asset retirement obligations | 9.2 | 8.5 | ||||||
Deferred tax liabilities | 266.3 | 220.0 | ||||||
Other non-current liabilities | 18.5 | 25.6 | ||||||
Total non-current liabilities | 835.8 | 639.9 | ||||||
Stockholders’ equity: | ||||||||
Preferred stock, $0.01 par value, 10,000,000 shares authorized, no shares issued and outstanding | — | — | ||||||
Common stock, $0.01 par value, 110,000,000 shares authorized, 60,637,525 shares and 60,229,107 shares issued at December 31, 2014 and 2013, respectively | 0.6 | 0.6 | ||||||
Additional paid-in capital | 395.1 | 384.5 | ||||||
Accumulated other comprehensive loss | (12.6 | ) | (4.0 | ) | ||||
Treasury stock, 3,365,561 and 1,000,000 shares, at cost, as of December 31, 2014 and 2013, respectively. | (112.6 | ) | (37.9 | ) | ||||
Retained earnings | 731.2 | 591.8 | ||||||
Non-controlling interest in subsidiaries | 196.7 | 185.4 | ||||||
Total stockholders’ equity | 1,198.4 | 1,120.4 | ||||||
Total liabilities and stockholders’ equity | $ | 2,891.4 | $ | 2,840.4 | ||||
See accompanying notes to the consolidated financial statements
F-4
Delek US Holdings, Inc.
Consolidated Statements of Income
Year Ended December 31, | ||||||||||||
2014 | 2013 | 2012 | ||||||||||
(In millions, except share and per share data) | ||||||||||||
Net sales | $ | 8,324.3 | $ | 8,706.8 | $ | 8,726.7 | ||||||
Operating costs and expenses: | ||||||||||||
Cost of goods sold | 7,315.2 | 7,880.7 | 7,708.2 | |||||||||
Operating expenses | 398.8 | 387.4 | 363.3 | |||||||||
General and administrative expenses | 133.4 | 111.2 | 99.7 | |||||||||
Depreciation and amortization | 111.5 | 89.8 | 82.5 | |||||||||
Other operating income, net | (1.1 | ) | — | (0.1 | ) | |||||||
Total operating costs and expenses | 7,957.8 | 8,469.1 | 8,253.6 | |||||||||
Operating income | 366.5 | 237.7 | 473.1 | |||||||||
Interest expense | 40.6 | 37.7 | 45.7 | |||||||||
Interest income | (0.8 | ) | (0.3 | ) | (0.2 | ) | ||||||
Other income, net | (0.9 | ) | (6.3 | ) | — | |||||||
Total non-operating expenses, net | 38.9 | 31.1 | 45.5 | |||||||||
Income before income taxes | 327.6 | 206.6 | 427.6 | |||||||||
Income tax expense | 101.6 | 70.9 | 151.6 | |||||||||
Net income | 226.0 | 135.7 | 276.0 | |||||||||
Net income attributed to non-controlling interest | 27.4 | 18.0 | 3.2 | |||||||||
Net income attributable to Delek | $ | 198.6 | $ | 117.7 | $ | 272.8 | ||||||
Basic & diluted earnings per share: | ||||||||||||
Basic | $ | 3.38 | $ | 1.99 | $ | 4.65 | ||||||
Diluted | $ | 3.35 | $ | 1.96 | $ | 4.57 | ||||||
Weighted average common shares outstanding: | ||||||||||||
Basic | 58,780,947 | 59,186,921 | 58,719,968 | |||||||||
Diluted | 59,355,120 | 60,047,138 | 59,644,798 | |||||||||
Dividends declared per common share outstanding | $ | 1.00 | $ | 0.95 | $ | 0.60 | ||||||
See accompanying notes to the consolidated financial statements
F-5
Delek US Holdings, Inc.
Consolidated Statements of Comprehensive Income
Year Ended December 31, | ||||||||||||
2014 | 2013 | 2012 | ||||||||||
(In millions) | ||||||||||||
Net income attributable to Delek | $ | 198.6 | $ | 117.7 | $ | 272.8 | ||||||
Other comprehensive (loss) income: | ||||||||||||
Net loss on derivative instruments, net of tax benefit of $4.0, $2.9, and $0.7 for years ended December 31, 2014, 2013 and 2012, respectively, and net of ineffectiveness of $6.3, $(2.5) and $(0.8) for the years ended December 31, 2014, 2013 and 2012, respectively. | (8.3 | ) | (4.4 | ) | (1.4 | ) | ||||||
Foreign currency translation | (0.3 | ) | — | — | ||||||||
Comprehensive income | $ | 190.0 | $ | 113.3 | $ | 271.4 | ||||||
See accompanying notes to the consolidated financial statements
F-6
Delek US Holdings, Inc.
Consolidated Statements of Changes in Stockholders' Equity
Common Stock | Additional Paid-in Capital | Accumulated Other Comprehensive Income | Retained Earnings | Treasury Stock | Non-Controlling Interest in Subsidiaries | Total Stockholders' Equity | ||||||||||||||||||||||||||||
Shares | Amount | Shares | Amount | |||||||||||||||||||||||||||||||
(In millions, except share and per share data) | ||||||||||||||||||||||||||||||||||
Balance at | December 31, 2011 | 58,036,427 | $ | 0.6 | $ | 356.9 | $ | 1.8 | $ | 294.1 | — | $ | — | $ | 0.2 | $ | 653.6 | |||||||||||||||||
Net income | — | — | — | — | 272.8 | — | — | 3.2 | 276.0 | |||||||||||||||||||||||||
Unrealized loss on cash flow hedges, net of deferred income tax benefit of $0.7 million and ineffectiveness of $(0.8) million | — | — | — | (1.4 | ) | — | — | — | — | (1.4 | ) | |||||||||||||||||||||||
Common stock dividends ($0.60 per share) | — | — | — | — | (35.5 | ) | — | — | — | (35.5 | ) | |||||||||||||||||||||||
Equity-based compensation expense | — | — | 6.1 | — | — | — | — | 0.1 | 6.2 | |||||||||||||||||||||||||
Net proceeds from issuance of common units - Delek Logistics | — | — | — | — | — | — | — | 175.5 | 175.5 | |||||||||||||||||||||||||
Acquisition of non-controlling interest in subsidiaries | — | — | (3.8 | ) | — | — | — | — | (0.3 | ) | (4.1 | ) | ||||||||||||||||||||||
Income tax benefit of equity-based compensation expense | — | — | 9.2 | — | — | — | — | — | 9.2 | |||||||||||||||||||||||||
Taxes paid due to the net settlement of equity-based compensation | — | — | (8.2 | ) | — | — | — | — | — | (8.2 | ) | |||||||||||||||||||||||
Exercise of equity-based awards | 1,583,121 | — | 6.7 | — | — | — | — | — | 6.7 | |||||||||||||||||||||||||
Balance at | December 31, 2012 | 59,619,548 | $ | 0.6 | $ | 366.9 | $ | 0.4 | $ | 531.4 | — | $ | — | $ | 178.7 | $ | 1,078.0 | |||||||||||||||||
F-7
Delek US Holdings, Inc.
Consolidated Statements of Changes in Stockholders' Equity (Continued)
Common Stock | Additional Paid-in Capital | Accumulated Other Comprehensive Income | Retained Earnings | Treasury Stock | Non-Controlling Interest in Subsidiaries | Total Stockholders' Equity | ||||||||||||||||||||||||||||
Shares | Amount | Shares | Amount | |||||||||||||||||||||||||||||||
(In millions, except share and per share data) | ||||||||||||||||||||||||||||||||||
Balance at | December 31, 2012 | 59,619,548 | $ | 0.6 | $ | 366.9 | $ | 0.4 | $ | 531.4 | — | $ | — | $ | 178.7 | $ | 1,078.0 | |||||||||||||||||
Net income | — | — | — | — | 117.7 | — | — | 18.0 | 135.7 | |||||||||||||||||||||||||
Unrealized loss on cash flow hedges, net of deferred income tax benefit of $2.9 million and ineffectiveness of $(2.5) million | — | — | — | (4.4 | ) | — | — | — | — | (4.4 | ) | |||||||||||||||||||||||
Common stock dividends ($0.95 per share) | — | — | — | — | (57.3 | ) | — | — | — | (57.3 | ) | |||||||||||||||||||||||
Equity-based compensation expense | — | — | 13.1 | — | — | — | — | 1.9 | 15.0 | |||||||||||||||||||||||||
Distribution to non-controlling interest | — | — | — | — | — | — | — | (13.2 | ) | (13.2 | ) | |||||||||||||||||||||||
Purchase of common stock | — | — | — | — | — | (1,000,000 | ) | (37.9 | ) | — | (37.9 | ) | ||||||||||||||||||||||
Income tax benefit of equity-based compensation expense | — | — | 5.9 | — | — | — | — | — | 5.9 | |||||||||||||||||||||||||
Taxes paid due to the net settlement of equity-based compensation | — | — | (2.5 | ) | — | — | — | — | — | (2.5 | ) | |||||||||||||||||||||||
Exercise of equity-based awards | 609,559 | — | 1.1 | — | — | — | — | — | 1.1 | |||||||||||||||||||||||||
Balance at | December 31, 2013 | 60,229,107 | $ | 0.6 | $ | 384.5 | $ | (4.0 | ) | $ | 591.8 | (1,000,000 | ) | $ | (37.9 | ) | $ | 185.4 | $ | 1,120.4 | ||||||||||||||
F-8
Delek US Holdings, Inc.
Consolidated Statements of Changes in Stockholders' Equity (Continued)
Common Stock | Additional Paid-in Capital | Accumulated Other Comprehensive Income | Retained Earnings | Treasury Stock | Non-Controlling Interest in Subsidiaries | Total Stockholders' Equity | ||||||||||||||||||||||||||||
Shares | Amount | Shares | Amount | |||||||||||||||||||||||||||||||
(In millions, except share and per share data) | ||||||||||||||||||||||||||||||||||
Balance at | December 31, 2013 | 60,229,107 | $ | 0.6 | $ | 384.5 | $ | (4.0 | ) | $ | 591.8 | (1,000,000 | ) | $ | (37.9 | ) | $ | 185.4 | $ | 1,120.4 | ||||||||||||||
Net income | — | — | — | — | 198.6 | — | — | 27.4 | 226.0 | |||||||||||||||||||||||||
Unrealized loss on cash flow hedges, net of deferred income tax benefit of $4.0 million and ineffectiveness of $6.3 million | — | — | — | (8.3 | ) | — | — | — | — | (8.3 | ) | |||||||||||||||||||||||
Common stock dividends ($1.00 per share) | — | — | — | — | (59.2 | ) | — | — | — | (59.2 | ) | |||||||||||||||||||||||
Equity-based compensation expense | — | — | 12.9 | — | — | — | — | 1.0 | 13.9 | |||||||||||||||||||||||||
Distribution to non-controlling interest | — | — | — | — | — | — | — | (17.1 | ) | (17.1 | ) | |||||||||||||||||||||||
Purchase of common stock | — | — | — | — | — | (2,365,561 | ) | (74.7 | ) | — | (74.7 | ) | ||||||||||||||||||||||
Income tax benefit from equity-based compensation expense | — | — | 1.8 | — | — | — | — | — | 1.8 | |||||||||||||||||||||||||
Taxes paid due to the net settlement of equity-based compensation | — | — | (5.2 | ) | — | — | — | — | — | (5.2 | ) | |||||||||||||||||||||||
Exercise of equity-based awards | 408,418 | — | 1.1 | — | — | — | — | — | 1.1 | |||||||||||||||||||||||||
Foreign currency translation | — | — | — | (0.3 | ) | — | — | — | — | (0.3 | ) | |||||||||||||||||||||||
Balance at | December 31, 2014 | 60,637,525 | $ | 0.6 | $ | 395.1 | $ | (12.6 | ) | $ | 731.2 | (3,365,561 | ) | $ | (112.6 | ) | $ | 196.7 | $ | 1,198.4 | ||||||||||||||
See accompanying notes to the consolidated financial statements
F-9
Delek US Holdings, Inc.
Consolidated Statements of Cash Flows
Year Ended December 31, | ||||||||||||
2014 | 2013 | 2012 | ||||||||||
Cash flows from operating activities: | (In millions, except per share data) | |||||||||||
Net income | $ | 226.0 | $ | 135.7 | $ | 276.0 | ||||||
Adjustments to reconcile net income to net cash provided by operating activities: | ||||||||||||
Depreciation and amortization | 111.5 | 89.8 | 82.5 | |||||||||
Amortization of deferred financing costs | 4.6 | 6.5 | 4.7 | |||||||||
Accretion of asset retirement obligations | 0.6 | 0.6 | 0.8 | |||||||||
Amortization of unfavorable contract liability | (2.7 | ) | (2.6 | ) | (0.7 | ) | ||||||
Deferred income taxes | 38.8 | 44.8 | 25.2 | |||||||||
(Gain) loss on disposal of assets | (1.1 | ) | 1.6 | (0.1 | ) | |||||||
Equity-based compensation expense | 13.9 | 15.0 | 6.2 | |||||||||
Income tax benefit of equity-based compensation | (1.8 | ) | (5.9 | ) | (9.2 | ) | ||||||
Changes in assets and liabilities, net of acquisitions: | ||||||||||||
Accounts receivable | 55.4 | 5.8 | 20.5 | |||||||||
Inventories and other current assets | 217.0 | (252.6 | ) | 43.5 | ||||||||
Market value of derivatives | (59.9 | ) | (8.8 | ) | 1.1 | |||||||
Accounts payable and other current liabilities | (117.3 | ) | 50.3 | 39.3 | ||||||||
Obligation under Supply and Offtake Agreement | (130.1 | ) | 45.8 | (13.4 | ) | |||||||
Non-current assets and liabilities, net | (38.0 | ) | (23.5 | ) | (13.5 | ) | ||||||
Net cash provided by operating activities | 316.9 | 102.5 | 462.9 | |||||||||
Cash flows from investing activities: | ||||||||||||
Business combinations | (33.8 | ) | (23.2 | ) | (23.3 | ) | ||||||
Purchase of non-controlling interest in subsidiaries | — | — | (4.1 | ) | ||||||||
Purchases of property, plant and equipment | (256.9 | ) | (222.3 | ) | (132.0 | ) | ||||||
Proceeds from sales of assets | 1.3 | 1.3 | 0.2 | |||||||||
Net cash used in investing activities | (289.4 | ) | (244.2 | ) | (159.2 | ) | ||||||
Cash flows from financing activities: | ||||||||||||
Proceeds from long-term revolvers | 1,097.7 | 735.2 | 713.6 | |||||||||
Payments on long-term revolvers | (995.2 | ) | (663.9 | ) | (650.3 | ) | ||||||
Proceeds from term debt | 107.4 | 70.9 | 9.3 | |||||||||
Payments on term debt and capital lease obligations | (30.2 | ) | (94.1 | ) | (76.5 | ) | ||||||
Payments of notes payable to related party | — | — | (66.5 | ) | ||||||||
Proceeds from exercise of stock options | 1.1 | 1.1 | 6.7 | |||||||||
Proceeds from issuance of common units - Delek Logistics | — | — | 175.5 | |||||||||
Taxes paid due to the net settlement of equity-based compensation | (5.2 | ) | (2.5 | ) | (8.2 | ) | ||||||
Income tax benefit of equity-based compensation | 1.8 | 5.9 | 9.2 | |||||||||
Repurchase of common stock | (74.7 | ) | (37.9 | ) | — | |||||||
Distribution to non-controlling interest | (17.1 | ) | (13.2 | ) | — | |||||||
Dividends paid | (59.2 | ) | (57.3 | ) | (35.5 | ) | ||||||
Deferred financing costs paid | (9.8 | ) | (4.2 | ) | (5.2 | ) | ||||||
Net cash provided by (used in) financing activities | 16.6 | (60.0 | ) | 72.1 | ||||||||
Net increase (decrease) in cash and cash equivalents | 44.1 | (201.7 | ) | 375.8 | ||||||||
Cash and cash equivalents at the beginning of the period | 400.0 | 601.7 | 225.9 | |||||||||
Cash and cash equivalents at the end of the period | $ | 444.1 | $ | 400.0 | $ | 601.7 | ||||||
Supplemental disclosures of cash flow information: | ||||||||||||
Cash paid during the period for: | ||||||||||||
Interest, net of capitalized interest of $1.5 million, $1.0 million and $0.3 million in the 2014, 2013 and 2012, respectively. | $ | 37.1 | $ | 31.3 | $ | 40.7 | ||||||
Income taxes | $ | 111.7 | $ | 73.7 | $ | 111.3 | ||||||
See accompanying notes to the consolidated financial statements
F-10
Delek US Holdings, Inc.
Notes to Consolidated Financial Statements
1. General
Delek US Holdings, Inc. is the sole shareholder or owner of membership interests of Delek Refining, Inc. ("Refining"), Delek Finance, Inc., Delek Marketing & Supply, LLC, Lion Oil Company ("Lion Oil"), Delek Renewables, LLC, Delek Rail Logistics, Inc., Delek Logistics Services Company, MAPCO Express, Inc. ("MAPCO Express"), MAPCO Fleet, Inc., NTI Investments, LLC, GDK Bearpaw, LLC, Delek Helena, LLC, Commerce Way Insurance Company, Inc., Delek Land Holdings, LLC and Delek Transportation, LLC. Unless otherwise indicated or the context requires otherwise, the terms "we," "our," "us," "Delek" and the "Company" are used in this report to refer to Delek US Holdings, Inc. and its consolidated subsidiaries. Delek is listed on the New York Stock Exchange under the symbol "DK."
2. Accounting Policies
Basis of Presentation
Our consolidated financial statements include the accounts of Delek and its subsidiaries. All significant intercompany transactions and account balances have been eliminated in consolidation. We have evaluated subsequent events through the filing of this Form 10-K. Any material subsequent events that occurred during this time have been properly recognized or disclosed in our financial statements.
Our consolidated financial statements include Delek Logistics Partners, LP ("Delek Logistics"), a variable interest entity. As the general partner of Delek Logistics, we have the sole ability to direct the activities of Delek Logistics that most significantly impact its economic performance. We are also considered to be the primary beneficiary for accounting purposes and are Delek Logistics' primary customer. As Delek Logistics does not derive a significant amount of gross margin from third parties, there is limited risk to Delek associated with Delek Logistics' operations. However, in the event that Delek Logistics incurs a loss, our operating results will reflect Delek Logistics' loss, net of intercompany eliminations, to the extent of our ownership interest in Delek Logistics.
The preparation of financial statements in conformity with U.S. generally accepted accounting principles ("GAAP") and in accordance with the rules and regulations of the Securities and Exchange Commission ("SEC") requires management to make estimates and assumptions that affect the reported amounts of assets and liabilities and disclosure of contingent assets and liabilities at the date of the financial statements and the reported amounts of revenues and expenses during the reporting period. Actual results could differ from those estimates.
Reclassifications
Certain prior period amounts have been reclassified in order to conform to the current year presentation. For example, our December 31, 2013 balance sheet has been adjusted to increase goodwill by $1.2 million, offset by a corresponding decrease to property, plant and equipment, due to the finalization of the purchase price allocation of our Hopewell Pipeline (as defined in Note 4 below). These reclassifications had no effect on net income or shareholders' equity as previously reported.
Segment Reporting
Delek is a diversified energy business focused on petroleum refining, wholesale sales of refined products and retail marketing. Management views operating results in primarily three segments: refining, logistics and retail. As of December 31, 2014, the refining segment operated high conversion, independent refineries in Tyler, Texas (the "Tyler refinery") and El Dorado, Arkansas (the "El Dorado refinery") and biodiesel facilities in Cleburne, Texas and Crossett, Arkansas. The logistics segment owns and operates crude oil and refined products logistics and marketing assets. The retail segment markets gasoline, diesel and other refined petroleum products, and convenience merchandise through a network of 365 company-operated retail fuel and convenience stores. Segment reporting is more fully discussed in Note 12.
F-11
Cash and Cash Equivalents
Delek maintains cash and cash equivalents in accounts with large, multi-national financial institutions and retains nominal amounts of cash at the convenience store locations as petty cash. All highly liquid investments purchased with a term of three months or less are considered to be cash equivalents. As of December 31, 2014 and 2013, these cash equivalents consisted primarily of bank certificates of deposit and bank money market accounts, as well as overnight investments in U.S. Government obligations and bank repurchase obligations collateralized by U.S. Government obligations.
Accounts Receivable
Accounts receivable primarily consists of receivables related to credit card sales, receivables from vendor promotions and trade receivables generated in the ordinary course of business. Delek recorded an allowance for doubtful accounts related to trade receivables of a nominal amount as of both December 31, 2014 and 2013, respectively.
No customer accounted for more than 10% of our consolidated accounts receivable balance as of December 31, 2014 or 2013. No customers accounted for more than 10% of consolidated net sales for the years ended December 31, 2014, 2013 or 2012.
Inventory
Refinery inventory consists of crude oil, refined products and blendstocks which are stated at the lower of cost or market. Inventory cost at the Tyler refinery is determined under the last-in, first-out ("LIFO") valuation method. Cost of crude oil, refined product and blendstock inventories in excess of market value are charged to cost of goods sold. Such changes are subject to reversal in subsequent periods, not to exceed LIFO cost, if prices recover. Inventory costs at the El Dorado refinery are stated at the lower of cost or market on a first-in, first-out ("FIFO") basis.
Logistics inventory consists of refined products which are stated at the lower of cost or market on a FIFO basis.
Retail merchandise inventory consists of gasoline, diesel fuel, other petroleum products, cigarettes, beer, convenience merchandise and food service merchandise. Fuel inventories are stated at the lower of cost or market on a FIFO basis. Non-fuel inventories are stated at estimated cost as determined by the retail inventory method.
One vendor in the refining segment and a second vendor used by both the refining and retail segments accounted for a total of 32.9%, 25.0% and 24.2% of our consolidated inventory purchases during the years ended December 31, 2014, 2013 and 2012, respectively.
Property, Plant and Equipment
Assets acquired by Delek in conjunction with acquisitions are recorded at estimated fair market value in accordance with the purchase method of accounting as prescribed in Accounting Standards Codification ("ASC") 805, Business Combinations ("ASC 805"). Other acquisitions of property and equipment are carried at cost. Betterments, renewals and extraordinary repairs that extend the life of an asset are capitalized. Maintenance and repairs are charged to expense as incurred. Delek owns certain fixed assets on leased locations and depreciates these assets and asset improvements over the lesser of management's estimated useful lives of the assets or the remaining lease term.
F-12
Depreciation is computed using the straight-line method over management's estimated useful lives of the related assets, which are as follows:
Years | |
Automobiles | 3-5 |
Computer equipment and software | 3-10 |
Refinery turnaround costs | 4-5 |
Furniture and fixtures | 5-15 |
Asset retirement obligation assets | 15-50 |
Refinery machinery and equipment | 5-40 |
Pipelines and terminals | 15-40 |
Retail store equipment and site improvements | 7-30 |
Building and building improvements | 15-40 |
Other Intangible Assets
Delek has intangible assets consisting of long-term supply contracts, non-compete agreements, trademarks, capacity contracts and rights of way. We amortize the definite-lived intangible assets on straight-line bases over the estimated useful lives of three to 11.5 years. The amortization expense is included in depreciation and amortization on the accompanying consolidated statements of income.
Property, Plant and Equipment and Other Intangibles Impairment
Property, plant and equipment and definite life intangibles are evaluated for impairment whenever indicators of impairment exist. In accordance with ASC 360 and ASC 350, Intangibles - Goodwill and Other, Delek evaluates the realizability of these long-lived assets as events occur that might indicate potential impairment. In doing so, Delek assesses whether the carrying amount of the asset is unrecoverable by estimating the sum of the future cash flows expected to result from the asset, undiscounted and without interest charges. If the carrying amount is more than the recoverable amount, an impairment charge must be recognized based on the fair value of the asset.
Property and equipment of retail stores identified for closing are written down to their estimated net realizable value at the time such stores are closed. Delek analyzes regional market, division and store operations for changes in market demographics, competition, economic conditions and other factors, including the variability of cash flow. As a result, we identified and recorded impairment charges of $0.1 million, $0.6 million and $0.9 million for closed stores in 2014, 2013 and 2012, respectively. Similar changes may occur in the future that will require us to record an impairment charge.
Capitalized Interest
Delek capitalizes interest on capital projects associated with the refining segment and with the construction related to the new "prototype" stores being built in the retail segment. For the years ended December 31, 2014, 2013 and 2012, interest of $1.5 million, $1.0 million and $0.3 million, respectively, was capitalized relating to these projects.
Refinery Turnaround Costs
Refinery turnaround costs are incurred in connection with planned shutdowns and inspections of the Tyler and El Dorado refineries' major units to perform necessary repairs and replacements. Refinery turnaround costs are deferred when incurred, classified as property, plant and equipment and amortized on a straight-line basis over that period of time estimated to lapse until the next planned turnaround occurs. Refinery turnaround costs include, among other things, the cost to repair, restore, refurbish or replace refinery equipment such as vessels, tanks, reactors, piping, rotating equipment, instrumentation, electrical equipment, heat exchangers and fired heaters.
F-13
Goodwill and Potential Impairment
Goodwill in an acquisition represents the excess of the aggregate purchase price over the fair value of the identifiable net assets. Delek's goodwill, all of which was acquired in various purchase business combinations, is recorded at original fair value and is not amortized. Goodwill is subject to annual assessment to determine if an impairment of value has occurred and Delek performs this review annually in the fourth quarter. We could also be required to evaluate our goodwill if, prior to our annual assessment, we experience disruptions in our business, have unexpected significant declines in operating results, or sustain a permanent market capitalization decline. If a reporting unit's carrying amount exceeds its fair value, the impairment assessment leads to the testing of the implied fair value of the reporting unit's goodwill to its carrying amount. If the implied fair value is less than the carrying amount, a goodwill impairment charge is recorded. Our annual assessment of goodwill did not result in impairment during the years ended December 31, 2014, 2013 or 2012.
Derivatives
Delek records all derivative financial instruments, including interest rate swap and cap agreements, fuel-related derivatives, over the counter ("OTC") future swaps and forward contracts at estimated fair value in accordance with the provisions of ASC 815, Derivatives and Hedging ("ASC 815"). Changes in the fair value of the derivative instruments are recognized in operations, unless we elect to apply the hedging treatment permitted under the provisions of ASC 815 allowing such changes to be classified as other comprehensive income. We validate the fair value of all derivative financial instruments on a periodic basis, utilizing valuations from third party financial and brokerage institutions. On a regular basis, Delek enters into commodity contracts with counterparties for crude oil, blendstocks, and various finished products. These contracts usually qualify for the normal purchase / normal sale exemption under the standard and, as such, are not measured at fair value.
Delek's policy under the guidance of ASC 815-10-45, Derivatives and Hedging - Other Presentation Matters ("ASC 815-10-45"), is to net the fair value amounts recognized for multiple derivative instruments executed with the same counterparty and offset these values against the cash collateral arising from these derivative positions.
Fair Value of Financial Instruments
The fair values of financial instruments are estimated based upon current market conditions and quoted market prices for the same or similar instruments. Management estimates that the carrying value approximates fair value for all of Delek's assets and liabilities that fall under the scope of ASC 825, Financial Instruments ("ASC 825").
Delek applies the provisions of ASC 820, Fair Value Measurements and Disclosure ("ASC 820") in its presentation and disclosures regarding fair value, which pertain to certain financial assets and liabilities measured at fair value in the balance sheet on a recurring basis. ASC 820 defines fair value, establishes a framework for measuring fair value and expands disclosures about such measurements that are permitted or required under other accounting pronouncements. See Note 13 for further discussion.
Delek also applies the provisions of ASC 825 as it pertains to the fair value option. This standard permits the election to carry financial instruments and certain other items similar to financial instruments at fair value on the balance sheet, with all changes in fair value reported in earnings. By electing the fair value option in conjunction with a derivative, an entity can achieve an accounting result similar to a fair value hedge without having to comply with complex hedge accounting rules. As of December 31, 2014 or 2013, we did not make the fair value election for any financial instruments not already carried at fair value in accordance with other standards.
Self-Insurance Reserves
Delek is primarily self-insured for workers' compensation and general liability costs, with varying limits of per claim and aggregate stop loss insurance coverage that management considers adequate. We maintain an accrual for these costs based on claims filed and an estimate of claims incurred but not reported. Differences between actual settlements and recorded accruals are recorded in the period identified.
F-14
Vendor Discounts and Deferred Revenue
Delek receives cash discounts or cash payments from certain vendors related to product promotions based upon factors such as quantities purchased, quantities sold, merchandise exclusivity, store space and various other factors. In accordance with ASC 605-50, Revenue Recognition - Customer Payments and Incentives, we recognize these amounts as a reduction of inventory until the products are sold, at which time the amounts are reflected as a reduction in cost of goods sold. Certain of these amounts are received from vendors related to agreements covering several periods. These amounts are initially recorded as deferred revenue, are reclassified as a reduction in inventory over the period the products are received, and are subsequently recognized as a reduction of cost of goods sold as the products are sold.
Delek also receives advance payments from certain vendors relating to non-inventory agreements. These amounts are recorded as deferred revenue and are subsequently recognized as a reduction of cost of goods sold as earned.
Environmental Expenditures
It is Delek's policy to accrue environmental and clean-up related costs of a non-capital nature when it is both probable that a liability has been incurred and the amount can be reasonably estimated. Environmental liabilities represent the current estimated costs to investigate and remediate contamination at our properties. This estimate is based on internal and third-party assessments of the extent of the contamination, the selected remediation technology and review of applicable environmental regulations, typically considering estimated activities and costs for the next 15 years, unless a specific longer range estimate is practicable. Accruals for estimated costs from environmental remediation obligations generally are recognized no later than completion of the remedial feasibility study and include, but are not limited to, costs to perform remedial actions and costs of machinery and equipment that are dedicated to the remedial actions and that does not have an alternative use. Such accruals are adjusted as further information develops or circumstances change. We discount environmental liabilities to their present value if payments are fixed and determinable. Expenditures for equipment necessary for environmental issues relating to ongoing operations are capitalized.
Asset Retirement Obligations
Delek recognizes liabilities which represent the fair value of a legal obligation to perform asset retirement activities, including those that are conditional on a future event, when the amount can be reasonably estimated. In the retail segment, these obligations relate to the net present value of estimated costs to remove underground storage tanks at owned and leased retail sites which are legally required under the applicable leases. The asset retirement obligation for storage tank removal on leased retail sites is being accreted over the expected life of the owned retail site or the average retail site lease term. In the refining segment, these obligations relate to the required disposal of waste in certain storage tanks, asbestos abatement at an identified location and other estimated costs that would be legally required upon final closure of the Tyler and El Dorado refineries. In the logistics segment, these obligations related to the required cleanout of the pipeline and terminal tanks, and removal of certain above-grade portions of the pipeline situated on right-of-way property.
The reconciliation of the beginning and ending carrying amounts of asset retirement obligations is as follows (in millions):
December 31, | ||||||||
2014 | 2013 | |||||||
Beginning balance | $ | 8.5 | $ | 8.3 | ||||
Liabilities identified | 0.2 | 0.2 | ||||||
Liabilities settled | (0.1 | ) | (0.6 | ) | ||||
Accretion expense | 0.6 | 0.6 | ||||||
Ending balance | $ | 9.2 | $ | 8.5 | ||||
In order to determine fair value, management must make certain estimates and assumptions including, among other things, projected cash flows, a credit-adjusted risk-free rate and an assessment of market conditions that could significantly impact the estimated fair value of the asset retirement obligations.
F-15
Revenue Recognition
Revenues for products sold are recorded at the point of sale upon delivery of product, which is the point at which title to the product is transferred, and when payment has either been received or collection is reasonably assured.
Delek derives service revenue from the sale of lottery tickets, money orders, car washes and other ancillary product and service offerings. Service revenue and related costs are recorded at gross amounts and net amounts, as appropriate, in accordance with the provisions of ASC 605-45, Revenue Recognition - Principal Agent Considerations ("ASC 605-45"). We record service revenue and related costs at gross amounts when Delek is the primary obligor, is subject to inventory risk, has latitude in establishing prices and selecting suppliers, influences product or service specifications, or has several but not all of these indicators. When Delek is not the primary obligor and does not possess other indicators of gross reporting as discussed previously, we record net service revenue.
Cost of Goods Sold and Operating Expenses
For the retail segment, cost of goods sold comprises the costs of specific products sold. Operating expenses include costs such as wages of employees at the stores, lease expense for the stores, utility expense for the stores and other costs of operating the stores. For the refining segment, cost of goods sold includes all the costs of crude oil, feedstocks and external costs. Operating expenses include the costs associated with the actual operations of the Tyler and El Dorado refineries and biodiesel facilities. For the logistics segment, cost of goods sold includes all costs of refined products, additives and related transportation. Operating expenses include the costs associated with the actual operation of owned terminals, terminalling expense at third-party locations and pipeline maintenance costs.
Sales, Use and Excise Taxes
Delek's policy is to exclude sales, use and excise taxes from revenue when we are an agent of the taxing authority, in accordance with ASC 605-45.
Deferred Financing Costs
Deferred financing costs are included in other non-current assets in the accompanying consolidated balance sheets and represent expenses related to issuing our long-term debt and obtaining our lines of credit. These amounts are amortized ratably over the remaining term of the respective financing and are included in interest expense. See Note 10 for further information.
Advertising Costs
Delek expenses advertising costs as the advertising space is utilized. Advertising expense for the years ended December 31, 2014, 2013 and 2012 was $3.6 million, $4.0 million and $3.4 million, respectively.
Operating Leases
Delek leases land, buildings and various equipment under various operating lease arrangements, most of which provide the option, after the initial lease term, to renew the leases. Some of these lease arrangements include fixed rental rate increases, while others include rental rate increases based upon such factors as changes, if any, in defined inflationary indices.
In accordance with ASC 840-20, Leases - Operating Leases, for all leases that include fixed rental rate increases, Delek calculates the total rent expense for the entire lease period, considering renewals for all periods for which failure to renew the lease imposes economic penalty, and records rental expense on a straight-line basis in the accompanying consolidated statements of income.
Income Taxes
Income taxes are accounted for under the provisions of ASC 740, Income Taxes ("ASC 740"). This statement generally requires Delek to record deferred income taxes for the differences between the book and tax bases of its assets and liabilities, which are measured using enacted tax rates and laws that will be in effect when the differences are expected to reverse. Deferred income tax expense or benefit represents the net change during the year in our deferred income tax assets and liabilities, exclusive of the amounts held in other comprehensive income.
ASC 740 also prescribes a comprehensive model for how companies should recognize, measure, present and disclose in their financial statements uncertain tax positions taken or expected to be taken on a tax return and prescribes the minimum recognition threshold a tax position is required to meet before being recognized in the financial statements. Finally, ASC 740 requires an annual tabular roll-forward of unrecognized tax benefits.
F-16
Earnings Per Share
Basic and diluted earnings per share are computed by dividing net income by the weighted average common shares outstanding. The common shares used to compute Delek’s basic and diluted earnings per share are as follows:
Year Ended December 31, | |||||||||
2014 | 2013 | 2012 | |||||||
Weighted average common shares outstanding | 58,780,947 | 59,186,921 | 58,719,968 | ||||||
Dilutive effect of equity instruments | 574,173 | 860,217 | 924,830 | ||||||
Weighted average common shares outstanding, assuming dilution | 59,355,120 | 60,047,138 | 59,644,798 | ||||||
Outstanding equity awards totaling 1,867,368, 1,226,038 and 1,344,825 common share equivalents were excluded from the diluted earnings per share calculation for the years ended December 31, 2014, 2013 and 2012, respectively. These share equivalents did not have a dilutive effect under the treasury stock method.
Stock-Based Compensation
ASC 718, Compensation - Stock Compensation ("ASC 718"), requires the cost of all share-based payments to employees, including grants of employee stock options, to be recognized in the income statement and establishes fair value as the measurement objective in accounting for share-based payment arrangements. ASC 718 requires the use of a valuation model to calculate the fair value of stock-based awards on the date of grant. Delek uses the Black-Scholes-Merton option-pricing model to determine the fair value of stock option and stock appreciation right (SAR) awards, with the exception of the SARs granted to certain executive employees, which are valued under the Monte-Carlo simulation model.
Restricted stock units ("RSUs") are measured based on the fair market value of the underlying stock on the date of grant. Vested RSUs are not issued until the minimum statutory withholding requirements have been remitted to us for payment to the taxing authority. As a result, the actual number of shares accounted for as issued may be less than the number of RSUs vested, due to any withholding amounts which have not been remitted.
We generally recognize compensation expense related to stock-based awards with graded or cliff vesting on a straight-line basis over the vesting period. It is our practice to issue new shares when stock-based compensation is exercised.
Comprehensive Income
For the years ended December 31, 2014, 2013 and 2012, comprehensive income includes net income and changes in the fair value of derivative instruments designated as cash flow hedges and foreign currency translation adjustments.
New Accounting Pronouncements
In May 2014, the FASB issued guidance regarding “Revenue from Contracts with Customers,” to clarify the principles for recognizing revenue. The core principle of the new guidance is that an entity should recognize revenue to depict the transfer of promised goods or services to customers in an amount that reflects the consideration to which the entity expects to be entitled in exchange for those goods or services. The guidance also requires improved interim and annual disclosures that enable the users of financial statements to better understand the nature, amount, timing, and uncertainty of revenues and cash flows arising from contracts with customers. The new guidance is effective for annual reporting periods beginning after December 15, 2016, including interim reporting periods within that reporting period, and can be adopted either retrospectively to each prior reporting period presented using a practical expedient as allowed by the new guidance or retrospectively with a cumulative effect adjustment to retained earnings as of the date of initial application. Early adoption is not permitted. We are currently evaluating the effect that adopting this new standard will have on our consolidated financial statements and related disclosures.
On January 1, 2014 we adopted guidance issued by the Financial Accounting Standards Board ("FASB") regarding "Presentation of an Unrecognized Tax Benefit When a Net Operating Loss Carryforward, a Similar Tax Loss, or a Tax Credit Carryforward Exists." This guidance requires that companies net their unrecognized tax benefits against all same-jurisdiction net operating losses or tax credit carryforwards that would be used to settle the position with a tax authority. The adoption of this guidance did not materially affect our business, financial position or results of operations.
F-17
3. Delek Logistics
Delek Logistics is a publicly traded limited partnership that was formed by Delek to own, operate, acquire and construct crude oil and refined products logistics and marketing assets. A substantial majority of Delek Logistics' assets are currently integral to Delek’s refining and marketing operations. As of December 31, 2014, we owned a 59.9% limited partner interest in Delek Logistics, and a 95.8% interest in Logistics GP, which owns both the entire 2.0% general partner interest in Delek Logistics and all of the incentive distribution rights. Delek's partnership interest in Delek Logistics includes 2,799,258 common units, 11,999,258 subordinated units and 494,197 general partner units.
In July 2013, Delek Logistics completed the acquisition of a terminal, storage tanks and related assets adjacent to our refinery in Tyler, Texas (the "Tyler refinery") from one of our subsidiaries (the "Tyler Acquisition"). The cash paid for the assets acquired was approximately $94.8 million, financed with a combination of proceeds from the amended and restated Delek Logistics revolving credit agreement and cash on hand.
In February 2014, a subsidiary of Delek Logistics completed the acquisition of certain storage tanks and the products terminal located at our refinery in El Dorado, Arkansas (the "El Dorado refinery") from Lion Oil (the "El Dorado Acquisition"). The cash paid for the assets acquired was approximately $95.9 million, financed with borrowings under the amended and restated Delek Logistics revolving credit agreement. The storage tanks have approximately 2.5 million barrels of aggregate shell capacity and consist of 158 tanks and ancillary assets, including piping and pumps.
The Tyler Acquisition and the El Dorado Acquisition are each considered a transfer of a business between entities under common control. As such, the assets acquired and liabilities assumed were transferred to Delek Logistics at historical basis instead of fair value.
We have agreements with Delek Logistics that, among other things, establish fees for certain administrative and operational services provided by us and our subsidiaries to Delek Logistics, provide certain indemnification obligations and establish terms for fee-based commercial logistics and marketing services provided by Delek Logistics and its subsidiaries to us.
Delek Logistics is a variable interest entity as defined under GAAP and is consolidated into our consolidated financial statements. With the exception of affiliate balances which are eliminated in consolidation, the Delek Logistics condensed consolidated balance sheets as of December 31, 2014 and 2013, as presented below, are included in the consolidated balance sheets of Delek.
December 31, | ||||||||
2014 | 2013 | |||||||
(In millions) | ||||||||
ASSETS | ||||||||
Cash and cash equivalents | $ | 1.9 | $ | 0.9 | ||||
Accounts receivable | 28.0 | 29.0 | ||||||
Inventory | 10.3 | 17.5 | ||||||
Other current assets | 0.8 | 0.3 | ||||||
Net property, plant and equipment | 240.5 | 224.5 | ||||||
Goodwill | 11.7 | 11.7 | ||||||
Intangible assets, net | 11.3 | 12.4 | ||||||
Other non-current assets | 7.4 | 5.0 | ||||||
Total assets | $ | 311.9 | $ | 301.3 | ||||
LIABILITIES AND EQUITY | ||||||||
Accounts payable | $ | 18.2 | $ | 26.0 | ||||
Accounts payable to related parties | 0.6 | 1.5 | ||||||
Accrued expenses and other current liabilities | 11.8 | 12.2 | ||||||
Revolving credit facility | 251.8 | 164.8 | ||||||
Asset retirement obligations | 3.3 | 3.1 | ||||||
Deferred tax liabilities | 0.2 | 0.3 | ||||||
Other non-current liabilities | 5.9 | 6.2 | ||||||
Equity | 20.1 | 87.2 | ||||||
Total liabilities and equity | $ | 311.9 | $ | 301.3 | ||||
F-18
4. Acquisitions
Trucking Asset Acquisition
On December 17, 2014, Delek Logistics purchased 100% of the assets of Frank Thompson Transport, Inc. ("FTT"). FTT is a transport company that primarily hauls crude oil and refined products by transport truck. The assets purchased include approximately 120 trucks and 200 trailers (the "FTT Assets"). The aggregate purchase price of the FTT Assets was approximately $11.6 million, of which $0.5 million has been allocated to working capital and $11.1 million has been preliminarily allocated to property, plant and equipment, which is subject to change during the purchase price allocation period.
Mount Pleasant Acquisition
On October 1, 2014, Delek Logistics purchased (i) a light products terminal in Mount Pleasant, Texas (the "Mount Pleasant Terminal"), (ii) a light products storage facility in Greenville, Texas (the "Greenville Storage Facility") and (iii) a 76-mile pipeline connecting the locations (the "Greenville-Mount Pleasant Pipeline"). The Mount Pleasant Terminal, the Greenville Storage Facility and the Greenville-Mount Pleasant Pipeline are hereinafter collectively referred to as the "Greenville-Mount Pleasant Assets." Delek Logistics acquired the Greenville-Mount Pleasant Assets from an affiliate of Magellan Midstream Partners, L.P. to complement our existing assets and provide enhanced logistical capabilities. The Mount Pleasant Terminal consists of approximately 200,000 barrels of light product storage capacity, three truck loading lanes and ethanol blending capability. The Greenville Storage Facility has approximately 325,000 barrels of storage capacity and is connected to the Explorer Pipeline System. The aggregate purchase price was approximately $11.1 million in cash, of which $1.1 million and $10.0 million has been allocated to inventory and property, plant and equipment, respectively. The property, plant and equipment valuation is subject to change during the purchase price allocation period.
Crossett Biodiesel Facility Acquisition
On January 2, 2014, we purchased a biodiesel plant in Crossett, Arkansas (the "Crossett Facility") from Pinnacle Biofuels, Inc. for approximately $11.1 million, of which $11.0 million and $0.1 million has been allocated to property, plant and equipment and inventory, respectively. The Crossett Facility has a production capacity of approximately 10.0 million gallons per year and produced biodiesel exclusively for Delek under a tolling agreement prior to this acquisition.
Helena Acquisition
On December 31, 2013, we purchased a 149-mile pipeline and terminal from an affiliate of Enterprise Product Partners L.P. for $5.0 million. The pipeline is a 10-inch diameter pipe that connects El Dorado, Arkansas to Helena, Arkansas (the "Helena Pipeline"). The terminal is located on the Mississippi River in Helena, Arkansas, contains a dock, and can be used for crude oil or finished products (the "Helena Terminal" and together with the Helena Pipeline, the "Helena Assets"). The Helena Assets are currently out of service and will require capital investment to be restored to working order. This purchase gives us rights of way that terminates in El Dorado, Arkansas, and offers flexibility to increase crude access and light product outlets for the El Dorado refinery.
The allocation of the aggregate purchase price of the Helena Assets as of December 31, 2014 is summarized as follows (in millions):
Property, plant and equipment | $ | 1.0 | |
Intangible assets | 4.0 | ||
$ | 5.0 | ||
North Little Rock Acquisition
On October 24, 2013, we purchased a refined product terminal in Little Rock, Arkansas from Enterprise Refined Products Pipeline Company LLC. The aggregate purchase price was approximately $7.2 million, including $2.2 million in refined product inventory. The remainder of the purchase price was allocated to property, plant and equipment.
Hopewell Acquisition
On July 19, 2013, we purchased a 13.5-mile pipeline from Enterprise TE Products Pipeline Company LLC (the "Hopewell Pipeline"). The Hopewell Pipeline originates at the Tyler refinery and terminates at the Hopewell delivery yard, where it connects to our pipeline that terminates at the Big Sandy Terminal (as defined below). The Hopewell Pipeline and the Big Sandy Pipeline (as defined below) form essentially one pipeline link between the Tyler Refinery and the Big Sandy Terminal (collectively, the Hopewell
F-19
Pipeline and the Big Sandy Pipeline are referred to as the "Tyler-Big Sandy Pipeline"). The aggregate purchase price was approximately $5.7 million.
The allocation of the aggregate purchase price of the Hopewell Pipeline as of December 31, 2014 is summarized as follows (in millions):
Property, plant and equipment | $ | 3.5 | |
Goodwill (all is expected to be deductible for tax purposes) | 1.2 | ||
Intangible assets | 1.0 | ||
$ | 5.7 | ||
Beacon Acquisition
On January 10, 2013, we purchased a biodiesel plant in Cleburne, Texas, involved in the production of biodiesel fuels and related activities, from Beacon Energy (Texas) Corp. The aggregate purchase price was approximately $5.3 million, which has been allocated to property, plant and equipment.
5. Inventory
Refinery inventory consists of crude oil, refined products and blendstocks which are stated at the lower of cost or market. Cost of inventory for the Tyler refinery is determined under the LIFO valuation method. Cost of inventory for the El Dorado refinery is determined on a FIFO basis. Cost of crude oil, refined product and feedstock inventories in excess of market value are charged to cost of goods sold.
Logistics inventory consists of refined products which are stated at the lower of cost or market on a FIFO basis.
Retail merchandise inventory consists of gasoline, diesel fuel, other petroleum products, cigarettes, beer, convenience merchandise and food service merchandise. Fuel inventories are stated at the lower of cost or market on a FIFO basis. Non-fuel inventories are stated at estimated cost as determined by the retail inventory method.
Carrying value of inventories consisted of the following (in millions):
December 31, 2014 | December 31, 2013 | |||||||
Refinery raw materials and supplies | $ | 158.8 | $ | 250.9 | ||||
Refinery work in process | 26.5 | 58.6 | ||||||
Refinery finished goods | 235.1 | 299.2 | ||||||
Retail fuel | 10.9 | 19.2 | ||||||
Retail merchandise | 28.0 | 26.9 | ||||||
Logistics refined products | 10.3 | 17.5 | ||||||
Total inventories | $ | 469.6 | $ | 672.3 | ||||
In the year ended December 31, 2014, market prices declined to a level below the average cost of our inventories and we recorded a $50.1 million pre-tax write down of the carrying value of our inventory to the market value. Of the total write down, $35.4 million related to LIFO inventory, which is subject to reversal in subsequent periods, not to exceed LIFO cost, should market prices recover.
At December 31, 2014 and December 31, 2013, the excess of replacement cost (FIFO) over the carrying value (LIFO) of the Tyler refinery inventories was $0.3 million and $51.5 million, respectively. There were increases of $6.4 million, $0.3 million and $1.1 million to costs of goods sold during the years ended December 31, 2014, 2013 and 2012, respectively, as a result of the liquidation of LIFO inventories.
F-20
6. Crude Oil Supply and Inventory Purchase Agreement
Delek has a Master Supply and Offtake Agreement (the "Supply and Offtake Agreement") with J. Aron & Company ("J. Aron"). Throughout the term of the Supply and Offtake Agreement, which was amended on December 23, 2013 to expire on April 30, 2017, Lion Oil and J. Aron will identify mutually acceptable contracts for the purchase of crude oil from third parties and J. Aron will supply up to 100,000 bpd of crude to the El Dorado refinery. J. Aron purchases virtually all crude oil and refined products at monthly average prices as Lion Oil needs the materials for refining processes or sale to third parties. These daily purchases and sales are made using provisional prices and are trued-up on a monthly basis in order to reflect actual average monthly prices. We have recorded a (payable) receivable related to this monthly settlement of $(4.9) million and $18.2 million as of December 31, 2014 and 2013, respectively. Also pursuant to the Supply and Offtake Agreement and other related agreements, Lion Oil will endeavor to arrange potential sales by either Lion Oil or J. Aron to third parties of the products produced at the El Dorado refinery or purchased from third parties. In instances where Lion Oil is the seller to such third parties, J. Aron will first transfer the applicable products to Lion Oil.
While title to the inventories will reside with J. Aron, this arrangement will be accounted for as a product financing arrangement. Delek incurred fees payable to J. Aron of $10.5 million and $10.0 million during the year ended December 31, 2014 and 2013, respectively. These amounts are included as a component of interest expense in the condensed consolidated statements of income. Upon any termination of the Supply and Offtake Agreement, including in connection with a force majeure event, the parties are required to negotiate with third parties for the assignment to us of certain contracts, commitments and arrangements, including procurement contracts, commitments for the sale of product, and pipeline, terminalling, storage and shipping arrangements.
Upon the expiration of the Supply and Offtake Agreement on April 30, 2017 or upon any earlier termination, Delek will be required to repurchase the consigned crude oil and refined products from J. Aron at then prevailing market prices. At December 31, 2014, Delek had 3.2 million barrels of inventory consigned for J. Aron and we have recorded liabilities associated with this consigned inventory of $200.9 million in the condensed consolidated balance sheet.
7. Property, Plant and Equipment
Property, plant and equipment, at cost, consist of the following (in millions):
December 31, | ||||||||
2014 | 2013 | |||||||
Land | $ | 94.9 | $ | 86.1 | ||||
Building and building improvements | 266.0 | 255.0 | ||||||
Refinery machinery and equipment | 771.4 | 641.4 | ||||||
Pipelines and terminals | 266.2 | 204.6 | ||||||
Retail store equipment and site improvements | 187.4 | 158.3 | ||||||
Refinery turnaround costs | 112.0 | 55.1 | ||||||
Other equipment | 77.8 | 58.4 | ||||||
Construction in progress | 182.7 | 219.5 | ||||||
1,958.4 | 1,678.4 | |||||||
Less: accumulated depreciation | (509.6 | ) | (405.2 | ) | ||||
$ | 1,448.8 | $ | 1,273.2 | |||||
F-21
Property, plant and equipment, accumulated depreciation and depreciation expense by reporting segment as of and for the years ended December 31, 2014 and 2013 are as follows (in millions):
As of and For the Year Ended December 31, 2014 | ||||||||||||||||||||
Refining(1) | Logistics(1) | Retail | Corporate, Other and Eliminations | Consolidated | ||||||||||||||||
Property, plant and equipment | $ | 1,098.1 | $ | 293.5 | $ | 511.9 | $ | 54.9 | $ | 1,958.4 | ||||||||||
Less: Accumulated depreciation | (252.9 | ) | (53.0 | ) | (194.5 | ) | (9.2 | ) | (509.6 | ) | ||||||||||
Property, plant and equipment, net | $ | 845.2 | $ | 240.5 | $ | 317.4 | $ | 45.7 | $ | 1,448.8 | ||||||||||
Depreciation expense | $ | 63.5 | $ | 13.6 | $ | 28.5 | $ | 4.6 | $ | 110.2 | ||||||||||
As of and For the Year Ended December 31, 2013 | ||||||||||||||||||||
Refining(1) | Logistics(1) | Retail | Corporate, Other and Eliminations | Consolidated | ||||||||||||||||
Property, plant and equipment | $ | 893.3 | $ | 264.1 | $ | 477.6 | $ | 43.4 | $ | 1,678.4 | ||||||||||
Less: Accumulated depreciation | (192.7 | ) | (39.6 | ) | (168.4 | ) | (4.5 | ) | (405.2 | ) | ||||||||||
Property, plant and equipment, net | $ | 700.6 | $ | 224.5 | $ | 309.2 | $ | 38.9 | $ | 1,273.2 | ||||||||||
Depreciation expense | $ | 44.3 | $ | 12.6 | $ | 25.2 | $ | 3.4 | $ | 85.5 | ||||||||||
(1) | In conjunction with the El Dorado Acquisition, we have reclassified certain operating segments. The certain assets previously operated by our refining segment were contributed to Delek Logistics. |
8. Goodwill
Goodwill represents the excess of the aggregate purchase price over the fair value of the identifiable net assets acquired. Goodwill acquired in a purchase business combination is recorded at fair value and is not amortized. Delek's goodwill relates to its retail and logistics segments only. As of December 31, 2014, our accumulated goodwill impairment losses were $20.4 million, all of which related to our retail segment.
Delek performs an annual assessment of whether goodwill retains its value. This assessment is done more frequently if indicators of potential impairment exist. We performed our annual goodwill impairment review in the fourth quarter of 2014, 2013 and 2012. In our retail segment, this review was performed on reporting units at a level below our reportable segment level. In our logistics segment, our review was done at the original west Texas operations level of the segment. We performed a discounted cash flows test to test for value of each of our reporting units. We use a market participant weighted average cost of capital, estimated minimal growth rates for revenue, gross profit, and capital expenditures based on history and our best estimate of future forecasts. We also estimated the fair values of the reporting units using a multiple of expected future cash flows such as those used by third party analysts. In December 31, 2014, 2013 and 2012, the annual impairment review resulted in the determination that no impairment of goodwill had occurred.
A summary of our goodwill accounts in our retail and logistics segments are as follows (in millions):
Retail | Logistics | Total | |||||||||||
Balance, | December 31, 2011 | $ | 62.2 | $ | 7.5 | $ | 69.7 | ||||||
Acquisitions | — | 3.0 | 3.0 | ||||||||||
Balance, | December 31, 2012 | 62.2 | 10.5 | 72.7 | |||||||||
Acquisitions | — | 1.2 | 1.2 | ||||||||||
Balance, | December 31, 2013 | 62.2 | 11.7 | 73.9 | |||||||||
Balance, | December 31, 2014 | $ | 62.2 | $ | 11.7 | $ | 73.9 | ||||||
F-22
9. Other Intangible Assets
A summary of our identifiable intangible assets are as follows (in millions):
As of December 31, 2014 | Useful Life | Gross | Accumulated Amortization | Net | |||||||||||
Intangible Assets subject to amortization: | |||||||||||||||
Supply contracts | 11.5 years | $ | 12.2 | $ | (8.9 | ) | $ | 3.3 | |||||||
Trademarks | 4 years | 0.7 | (0.7 | ) | — | ||||||||||
Non-compete Agreements | 3-10 years | 1.3 | (1.3 | ) | — | ||||||||||
Capacity contract | 8 years | 9.3 | (8.5 | ) | 0.8 | ||||||||||
Intangible assets not subject to amortization: | |||||||||||||||
Rights-of-Way | Indefinite | 12.1 | — | 12.1 | |||||||||||
Total | $ | 35.6 | $ | (19.4 | ) | $ | 16.2 | ||||||||
As of December 31, 2013 | Useful Life | Gross | Accumulated Amortization | Net | |||||||||||
Intangible Assets subject to amortization: | |||||||||||||||
Supply contracts | 11.5 years | $ | 12.2 | $ | (7.9 | ) | $ | 4.3 | |||||||
Trademarks | 4 years | 0.7 | (0.7 | ) | — | ||||||||||
Non-compete Agreements | 3-10 years | 1.3 | (1.3 | ) | — | ||||||||||
Capacity contract | 8 years | 9.3 | (8.2 | ) | 1.1 | ||||||||||
Intangible assets not subject to amortization: | |||||||||||||||
Rights-of-Way | Indefinite | 12.0 | — | 12.0 | |||||||||||
Total | $ | 35.5 | $ | (18.1 | ) | $ | 17.4 | ||||||||
Amortization of intangible assets was $1.3 million, $4.3 million and $4.2 million during the years ended December 31, 2014, 2013 and 2012, respectively, and is included in depreciation and amortization on the accompanying consolidated statements of income. Amortization expense is estimated to be $1.3 million, $1.3 million, $1.3 million and $0.2 million, for the years ended 2015 through 2018, respectively.
10. Long-Term Obligations and Notes Payable
Outstanding borrowings under Delek’s existing debt instruments and capital lease obligations are as follows (in millions):
December 31, 2014 | December 31, 2013 | |||||||
MAPCO Revolver | $ | 76.0 | $ | 67.5 | ||||
Wells Term Loan | 64.2 | — | ||||||
DKL Revolver | 251.8 | 164.8 | ||||||
Reliant Bank Revolver | 17.0 | 10.0 | ||||||
Promissory Notes | 76.0 | 77.4 | ||||||
Lion Term Loan Facility, net of $0.3 million debt discount | 104.2 | 90.0 | ||||||
Capital Lease Obligations | 0.5 | 0.6 | ||||||
589.7 | 410.3 | |||||||
Less: Current portion of long-term debt, notes payable and capital lease obligations | 56.4 | 33.7 | ||||||
$ | 533.3 | $ | 376.6 | |||||
Principal maturities of Delek's existing third party debt instruments for the next five years and thereafter are as follows as of December 31, 2014 (in millions):
F-23
2015 | 2016 | 2017 | 2018 | 2019 | Thereafter | Total | ||||||||||||||||||||||
MAPCO Revolver | $ | — | $ | — | $ | — | $ | — | $ | 76.0 | $ | — | $ | 76.0 | ||||||||||||||
Wells Term Loan | 23.3 | 40.9 | — | — | — | — | 64.2 | |||||||||||||||||||||
DKL Revolver | — | — | — | — | 251.8 | — | 251.8 | |||||||||||||||||||||
Reliant Bank Revolver | — | 17.0 | — | — | — | — | 17.0 | |||||||||||||||||||||
Promissory Notes | 11.0 | 11.0 | 11.1 | 1.1 | 1.2 | 40.6 | 76.0 | |||||||||||||||||||||
Lion Term Loan Facility, net of $0.3 million debt discount | 21.9 | 21.9 | 21.9 | 38.5 | — | — | 104.2 | |||||||||||||||||||||
Capital Lease Obligations | 0.1 | 0.1 | 0.1 | 0.1 | 0.1 | — | 0.5 | |||||||||||||||||||||
Total | $ | 56.3 | $ | 90.9 | $ | 33.1 | $ | 39.7 | $ | 329.1 | $ | 40.6 | $ | 589.7 | ||||||||||||||
MAPCO Revolver
Our subsidiary, MAPCO Express, has a revolving credit facility with Fifth Third Bank, as administrative agent, and a syndicate of lenders that was amended and restated on May 6, 2014 (the "MAPCO Revolver"). The MAPCO Revolver consists of a $160.0 million revolving credit limit which includes (i) a $10.0 million swing line loan sub-limit; (ii) a $40.0 million letter of credit sub-limit; and (iii) an accordion feature which permits an increase in borrowings by up to $50.0 million, subject to additional lender commitments. As of December 31, 2014, we had $76.0 million outstanding under the MAPCO Revolver, as well as letters of credit issued of $2.6 million, with approximately $81.4 million availability remaining. Borrowings under the MAPCO Revolver are secured by (i) substantially all the assets of MAPCO Express and its subsidiaries, subject to certain exceptions and limitations, (ii) all of Delek’s shares in MAPCO Express, and (iii) a limited guaranty provided by Delek of up to $50.0 million in obligations. The MAPCO Revolver will mature on May 6, 2019. The MAPCO Revolver bears interest based on predetermined pricing grids which allow us to choose between base rate loans or London Interbank Offered Rate ("LIBOR") loans. At December 31, 2014, the weighted average borrowing rate under the MAPCO Revolver was approximately 3.6%. Additionally, the MAPCO Revolver requires us to pay a leverage ratio dependent quarterly fee on the average unused revolving commitment. As of December 31, 2014, this fee was 0.35% per year.
Wells ABL
Our subsidiary, Delek Refining, Ltd., has an asset-based loan credit facility with Wells Fargo Bank, National Association, as administrative agent, and a syndicate of lenders (the "Wells ABL") that consists of (i) a $600.0 million revolving loan (the "Wells Revolving Loan"), which includes a $55.0 million swing line loan sub-limit and a $550.0 million letter of credit sub-limit, (ii) a $70.0 million delayed single draw term loan (the "Wells Term Loan"), and (iii) an accordion feature which permits an increase in the size of the revolving credit facility to an aggregate of $875.0 million subject to additional lender commitments and the satisfaction of certain other conditions precedent. The Wells Revolving Loan matures on January 16, 2019 and the Wells Term Loan matures on December 31, 2016. The Wells Term Loan is subject to repayment in level principal installments of approximately $5.8 million per quarter, beginning December 31, 2014, with a final balloon payment due on December 31, 2016. As of December 31, 2014, under the Wells ABL we had letters of credit issued totaling $90.5 million and no amounts outstanding under the Wells Revolving Loan; under the Wells Term Loan we had approximately $64.2 million outstanding. Borrowings under the Wells ABL are secured by substantially all the assets of Refining and its subsidiaries, with certain limitations. Under the facility, revolving loans and letters of credit are provided subject to availability requirements which are determined pursuant to a borrowing base calculation as defined in the credit agreement. The borrowing base as calculated is primarily supported by cash, certain accounts receivable and certain inventory. Borrowings under the Wells Revolving Loan and Wells Term Loan bear interest based on separate predetermined pricing grids which allow us to choose between base rate loans or LIBOR loans. At December 31, 2014, the weighted average borrowing rate under the Wells Term Loan was approximately 3.9%. Additionally, the Wells ABL requires us to pay a quarterly unused credit commitment fee. As of December 31, 2014, this fee was approximately 0.38% per year. Borrowing capacity, as calculated and reported under the terms of the Wells ABL credit facility, as of December 31, 2014, was $186.3 million.
DKL Revolver
Delek Logistics has a $700.0 million Senior Secured Revolving Credit Agreement with Fifth Third Bank, as administrative agent, and a syndicate of lenders (the "DKL Revolver"). Delek Logistics and each of its existing subsidiaries are borrowers under the DKL Revolver. The DKL Revolver contains a dual currency borrowing tranche that permits draw downs in U.S. or Canadian dollars and an accordion feature whereby Delek Logistics can increase the size of the credit facility to an aggregate of $800.0 million, subject to receiving increased or new commitments from lenders and the satisfaction of certain other conditions precedent.
F-24
The obligations under the DKL Revolver are secured by a first priority lien on substantially all of Delek Logistics' tangible and intangible assets. Additionally, a subsidiary of Delek provides a limited guaranty of Delek Logistics' obligations under the DKL Revolver. The guaranty is (i) limited to an amount equal to the principal amount, plus unpaid and accrued interest, of a promissory note made by Delek in favor of the subsidiary guarantor (the "Holdings Note") and (ii) secured by the subsidiary guarantor's pledge of the Holdings Note to the DKL Revolver lenders. As of December 31, 2014, the principal amount of the Holdings Note was $102.0 million.
The DKL Revolver will mature on December 30, 2019. Borrowings under the DKL Revolver bear interest at either a U.S. base rate, Canadian prime rate, LIBOR, or a Canadian Dealer Offered Rate ("CDOR"), plus applicable margins, at the election of the borrowers and as a function of draw down currency. The applicable margin, in each case, varies based upon Delek Logistics' Leverage Ratio, which is defined as the ratio of total funded debt to EBITDA for the most recently ended four fiscal quarters. At December 31, 2014, the weighted average borrowing rate was approximately 2.3%. Additionally, the DKL Revolver requires us to pay a leverage ratio dependent quarterly fee on the average unused revolving commitment. As of December 31, 2014, this fee was 0.3% per year. As of December 31, 2014, Delek Logistics had $251.8 million of outstanding borrowings under the credit facility, as well as letters of credit issued of $7.5 million. Amounts available under the DKL Revolver, as of December 31, 2014, were approximately $440.8 million.
Reliant Bank Revolver
We have a revolving credit agreement with Reliant Bank which was amended on June 26, 2014 (the "Reliant Bank Revolver"). The Reliant Bank Revolver provides for unsecured loans of up to $17.0 million. As of December 31, 2014, we had $17.0 million outstanding under this facility. The Reliant Bank Revolver matures on June 28, 2016 and bears interest at a fixed rate of 5.25% per annum. The Reliant Bank Revolver requires us to pay a quarterly fee of 0.50% per year on the average available revolving commitment. As of December 31, 2014, we had no undrawn amounts available under the Reliant Bank Revolver.
Promissory Notes
In 2011, Delek began construction on new MAPCO Mart convenience stores (each a "Build-to-Suit Development" or "BTS"). In order to fund these construction projects, we entered into separate notes for each BTS project with Standard Insurance Company (collectively, the "Notes") varying in size from $1.0 million to $2.2 million. The Notes bear interest at fixed rates, ranging from 5.0% to 6.4% per annum. Each of the Notes is secured by the land or leasehold interest, as applicable, and the building and equipment of its respective completed MAPCO Mart. Under the terms of each Note, beginning on the first day of the eleventh month following the initial fund advancement, payments of principal on each respective Note are due over a ten-year term calculated using a 25-year amortization schedule. If any Note is not paid in full after the initial ten-year period, we may continue to make monthly payments under the Note, however, the interest rate will reset pursuant to the terms of the Note. There is also an additional interest rate reset after the first 20-year period. The final maturity dates of the Notes range from June 1, 2036 to November 1, 2039. As of December 31, 2014, we had amounts drawn under 29 Notes related to these BTS projects for a total amount of approximately $46.0 million outstanding under the Notes.
On April 29, 2011, Delek entered into a $50.0 million promissory note (the "Ergon Note") with Ergon, Inc. in connection with the closing of our acquisition of Lion Oil. As of December 31, 2014, $30.0 million was outstanding under the Ergon Note. The Ergon Note requires Delek to make annual amortization payments of $10.0 million each, commencing April 29, 2013. The Ergon Note matures on April 29, 2017. Interest under the Ergon Note is computed at a fixed rate equal to 4.0% per annum.
On December 19, 2011, Delek entered into a $25.0 million promissory note (the "Ergon Paline Note") with Ergon Terminaling, Inc. ("Ergon Terminaling") in connection with the closing of the acquisition of all of the membership interests of Paline from Ergon Terminaling. The Ergon Paline Note was subsequently assigned by Ergon Terminaling to Ergon. The Ergon Paline Note matured on December 19, 2014 and as of December 31, 2014, there were no amounts outstanding under the Ergon Paline Note.
Lion Term Loan
Our subsidiary, Lion Oil, has a term loan credit facility (the "Lion Term Loan") with Israel Discount Bank of New York, Bank Hapoalim B.M. and Fifth Third Bank as the lenders. The Lion Term Loan was amended on June 23, 2014 to add Fifth Third Bank as an additional lender in the principal amount to $20.0 million, thereby increasing the total loan size to $110.0 million. As of December 31, 2014, $104.5 million was outstanding under the Lion Term Loan. The Lion Term Loan requires Lion Oil to make quarterly principal amortization payments in the amount of $5.5 million each, commencing on December 31, 2014. The Lion Term Loan matures on December 18, 2018, and is secured by (i) all the assets of Lion Oil (excluding inventory and accounts receivable), (ii) all of our shares in Lion Oil, and (iii) a first priority lien on the subordinated and common units of Delek Logistics held by Lion Oil. Interest on the unpaid balance of the Lion Term Loan is computed at a rate per annum equal to LIBOR or the base rate, at our
F-25
election, plus the applicable margins, subject in each case to an interest rate floor of 5.50% per annum. As of December 31, 2014, the weighted average borrowing rate under the Lion Term Loan was 5.5%.
Restrictive Covenants
Under the terms of our MAPCO Revolver, Wells ABL, DKL Revolver, Reliant Bank Revolver and Lion Term Loan, we are required to comply with certain usual and customary financial and non-financial covenants. Further, although we were not required to comply with a fixed charge coverage ratio financial covenant under the Wells ABL during the year ended December 31, 2014, we may be required to comply with this covenant at times when the borrowing base excess availability is less than certain thresholds, as defined in the Wells ABL. We believe we were in compliance with all covenant requirements under each of our credit facilities as of December 31, 2014.
Certain of our credit facilities contain limitations on the incurrence of additional indebtedness, making of investments, creation of liens, dispositions of property, making of restricted payments and transactions with affiliates. Specifically, these covenants may limit the payment, in the form of cash or other assets, of dividends or other distributions, or the repurchase of shares with respect to the equity of our subsidiaries. Additionally, certain of our credit facilities limit our ability to make investments, including extensions of loans or advances to, or acquisitions of equity interests in, or guarantees of obligations of, any other entities.
Restricted Net Assets
Some of Delek's subsidiaries have restrictions in their respective credit facilities limiting their use of certain assets, as has been discussed above. The total amount of our subsidiaries' restricted net assets as of December 31, 2014 was $941.8 million.
Interest-Rate Derivative Instruments
Delek entered into interest rate swap and cap agreements for a total notional amount of $205.0 million. These agreements are intended to economically hedge floating interest rate risk related to our existing debt. However, as we have elected to not apply the permitted hedge accounting treatment, including formal hedge designation and documentation, in accordance with the provisions of ASC 815, the fair value of the derivatives is recorded in other current assets in the accompanying consolidated balance sheets with the offset recognized in interest expense in the accompanying consolidated statements of income. The derivative instruments mature in 2015 and 2016. The estimated mark-to-market liability associated with our interest rate derivatives as of December 31, 2014 and 2013 was $0.9 million and $2.7 million, respectively.
In accordance with ASC 815, we recorded expense representing cash settlements and changes in estimated fair value of the interest rate derivative agreements of $0.4 million, $0.4 million and $2.6 million for the years ended December 31, 2014, 2013 and 2012, respectively. These amounts are included in interest expense in the accompanying consolidated statements of income.
While Delek has not elected to apply permitted hedge accounting treatment for these interest rate derivatives in accordance with the provisions of ASC 815 in the past, we may choose to apply that treatment for future transactions.
11. Equity Based Compensation
2006 Long-Term Incentive Plan
The Delek US Holdings, Inc. 2006 Long-Term Incentive Plan, as amended (the "Plan"), allows Delek to grant stock options, SARs, restricted stock, RSUs, performance awards and other stock-based awards of up to 5,053,392 shares of Delek's common stock to certain directors, officers, employees, consultants and other individuals who perform services for Delek or its affiliates. Stock options and SARs granted under the Plan are generally granted at market price or higher. The vesting of all outstanding awards is subject to continued service to Delek or its affiliates except that vesting of awards granted to certain executive employees could, under certain circumstances, accelerate upon termination of their employment and the vesting of all outstanding awards could accelerate upon the occurrence of an Exchange Transaction (as defined in the Plan).
In the second quarter of 2010, Delek's Board of Directors and its Incentive Plan Committee began using stock-settled SARs, rather than stock options, as the primary form of appreciation award under the Plan.
Delek Logistics GP, LLC 2012 Long-Term Incentive Plan
Logistics GP maintains a unit-based compensation plan for officers, directors and employees of Logistics GP or its affiliates and any consultants, affiliates of our general partner or other individuals who perform services for Delek Logistics. The Delek Logistics GP, LLC 2012 Long-Term Incentive Plan ("Logistics LTIP") permits the grant of phantom units, unit options, restricted units, unit
F-26
appreciation rights, distribution equivalent rights, unit awards, and other unit-based awards. The Logistics LTIP limits the number of units that may be delivered pursuant to vested awards to 612,207 common units, subject to proportionate adjustment in the event of unit splits and similar events. Awards granted under the Logistics LTIP will be settled with Delek Logistics units. Total compensation expense for awards granted under the Logistics LTIP amounted to $1.6 million ($1.0 million, net of taxes) and $4.2 million ($2.7 million, net of taxes) for the years ended December 31, 2014 and 2013, respectively. These amounts are included in general and administrative expenses in the accompanying consolidated statements of income.
As of December 31, 2014, there was $4.4 million of total unrecognized compensation cost related to non-vested Logistics LTIP awards, which is expected to be recognized over a weighted-average period of 2.7 years.
Option and SAR Assumptions
The table below provides the assumptions used in estimating the fair values of our outstanding stock options and SARs under the Plan. For all awards granted, we calculated volatility using historical volatility and implied volatility of a peer group of public companies using weekly stock prices.
2014 Grants | 2013 Grants | 2012 Grants | 2011 Grants | 2010 Grants | ||||||||||||||||
(Graded Vesting) | (Graded Vesting) | (Graded Vesting) | (Graded Vesting) | (Graded Vesting) | ||||||||||||||||
4 years | 4 years | 4 years | 4 years | 4 years | ||||||||||||||||
Expected Volatility | 50.15%-52.63% | 53.36%-53.95% | 55.35%-57.46% | 58.58%-60.54% | 33.01-60.88% | |||||||||||||||
Dividend Yield | 2.54%-2.74% | 1.00 | % | 1.00 | % | 1.00 | % | 1.00 | % | |||||||||||
Expected Term | 4.54-6.25 years | 6.25 years | 6.25 years | 6.25 years | 6.25 years | |||||||||||||||
Risk Free Rate | 0.01%-2.96% | 0.01%-2.96% | 0.04%-2.04% | 0.00%-3.37% | 0.06%-3.33% | |||||||||||||||
Fair Value | $ | 10.67 | $ | 15.75 | $ | 9.28 | $ | 6.59 | $ | 3.51 | ||||||||||
Stock Option and SAR Activity
The following table summarizes the stock option and SAR activity under the Plan for Delek for the years ended December 31, 2014, 2013 and 2012:
Number of Options | Weighted-Average Exercise Price | Weighted-Average Contractual Term | Average Intrinsic Value | ||||||||||
Options outstanding, December 31, 2011 | 4,057,829 | $ | 11.71 | ||||||||||
Granted | 1,140,300 | $ | 19.01 | ||||||||||
Exercised | (2,538,210 | ) | $ | 10.95 | |||||||||
Forfeited | (101,078 | ) | $ | 12.84 | |||||||||
Options and SARs outstanding, December 31, 2012 | 2,558,841 | $ | 15.67 | ||||||||||
Granted | 867,400 | $ | 33.23 | ||||||||||
Exercised | (773,186 | ) | $ | 14.07 | |||||||||
Forfeited | (265,125 | ) | $ | 20.41 | |||||||||
Options and SARs outstanding, December 31, 2013 | 2,387,930 | $ | 22.04 | ||||||||||
Granted | 1,006,100 | $ | 30.18 | ||||||||||
Exercised | (390,753 | ) | $ | 14.27 | |||||||||
Forfeited | (306,691 | ) | $ | 27.02 | |||||||||
Options and SARs outstanding, December 31, 2014 | 2,696,586 | $ | 25.61 | 8.2 | $ | 16.1 | |||||||
Vested options and SARs exercisable, December 31, 2014 | 721,450 | $ | 14.17 | 6.3 | $ | 9.4 | |||||||
F-27
Restricted Stock Units
The Plan also provides for the award of RSUs to certain employees and non-employee directors. RSUs granted to employees vest ratably over three to five years from the date of grant and RSUs granted to non-employee directors vest quarterly over the year following the date of grant. The fair value of RSUs is determined based on the closing price of Delek's common stock on grant date.
During 2014, we granted 49,836 performance-based RSUs to Ezra Uzi Yemin, our Chairman, President and Chief Executive Officer (our "CEO") which may vest in 2015 and 2016, based on the level of performance during the performance period and subject to continued employment. The number of awards that will ultimately vest is based on the Company's total shareholder return over the performance period ended December 31, 2015 and 2016 relative to the total shareholder return of a peer group of companies during the same period. The weighted average grant date fair value of $36.84 was determined using a Monte-Carlo simulation model, which assumed a risk-free rate of interest of 0.72%, an expected life of 2.56 years and an expected volatility of 40.26%. As these awards include a market condition, we record compensation expense for these awards based on the grant date fair value of the award, recognized ratably over the measurement period.
The following table summarizes the RSU activity under the Plan for Delek for the years ended December 31, 2014, 2013 and 2012:
Number of RSUs | Weighted-Average Grant Price | ||||||
Non-vested RSUs, | December 31, 2011 | 935,500 | $ | 11.41 | |||
Granted | 156,000 | $ | 23.94 | ||||
Vested | (279,045 | ) | $ | 11.65 | |||
Non-vested RSUs, | December 31, 2012 | 812,455 | $ | 13.73 | |||
Granted | 121,000 | $ | 32.59 | ||||
Vested | (284,786 | ) | $ | 15.02 | |||
Forfeited | (136,000 | ) | $ | 10.91 | |||
Non-vested RSUs, | December 31, 2013 | 512,669 | $ | 18.21 | |||
Granted | 145,452 | $ | 32.41 | ||||
Vested | (241,122 | ) | $ | 18.17 | |||
Non-vested RSUs, | December 31, 2014 | 416,999 | $ | 23.19 | |||
Compensation Expense Related to Equity-based Awards Granted Under the Plan
Total compensation expense for the equity-based awards amounted to $11.9 million ($7.7 million, net of taxes), $9.3 million ($6.0 million, net of taxes) and $6.1 million ($4.0 million, net of taxes) for the years ended December 31, 2014, 2013 and 2012, respectively. These amounts are included in general and administrative expenses in the accompanying consolidated statements of income. We recognized a total income tax benefit for equity-based awards of $1.8 million, $5.9 million and $9.2 million for the years end December 31, 2014, 2013 and 2012, respectively.
As of December 31, 2014, there was $25.5 million of total unrecognized compensation cost related to non-vested share-based compensation arrangements, which is expected to be recognized over a weighted-average period of 2.3 years.
The aggregate intrinsic value, which represents the difference between the underlying stock's market price and the award's exercise price, of the share-based awards exercised or vested during the years ended December 31, 2014, 2013 and 2012 was $13.9 million, $10.9 million and $27.8 million, respectively. During the years December 31, 2014, 2013 and 2012, respectively, we issued 408,418, 609,743 and 1,583,121 shares of common stock as a result of exercised or vested equity-based awards. These amounts are net of 223,457, 448,229 and 1,234,134 shares, respectively, withheld to satisfy employee tax obligations related to the exercises and vestings for the years ended December 31, 2014, 2013 and 2012. Delek paid approximately $5.2 million, $2.5 million and $8.2 million of taxes in connection with the settlement of these awards for the years ended December 31, 2014, 2013 and 2012. We issue new shares of common stock upon exercise or vesting of share-based awards.
Granting of GP Interest
F-28
On March 10, 2013, we granted membership interests in Logistics GP, the general partner of Delek Logistics, to certain executives, including our CEO. These interests consisted of a total 1.4% membership interest in Logistics GP and vested on June 10, 2013. On December 10, 2013, we granted Mr. Yemin an additional 4.0% membership interest in Logistics GP, half of which vested immediately. Subject to Mr. Yemin's continued employment with Delek, 0.50% vested on June 10, 2014 and 0.25% will vest every six months thereafter through June 10, 2017. Total compensation expense recognized for these grants amounted to $0.4 million ($0.3 million, net of taxes) and $1.5 million ($1.0 million, net of taxes) for the years ended December 31, 2014 and 2013. As of December 31, 2014, there was $0.5 million of total unrecognized compensation cost related to non-vested GP membership interests, which is expected to be recognized over a weighted-average period of 2.4 years.
12. Segment Data
We report our operating results in three reportable segments: refining, logistics and retail. Decisions concerning the allocation of resources and assessment of operating performance are made based on this segmentation. Management measures the operating performance of each of its reportable segments based on the segment contribution margin.
In conjunction with the El Dorado Acquisition, we reclassified the components of certain operating segments. The results of the operations of the assets associated with these acquisitions were previously reported as part of our refining segment and are now reported in our logistics segment. The historical results of the operations of these assets have been reclassified to conform to the current presentation.
In April 2014, we revised the structure of the internal financial information reviewed by management and began allocating the results of hedging activity previously reported in corporate, other and eliminations to our refining segment. The historical results of this hedging activity have been reclassified to conform to the current presentation. The assets and/or liabilities associated with this hedging activity have not been allocated to the refining segment.
Segment contribution margin is defined as net sales less cost of sales and operating expenses, excluding depreciation and amortization. Operations which are not specifically included in the reportable segments are included in the corporate and other category, which primarily consists of operating expenses, depreciation and amortization expense and interest income and expense associated with corporate headquarters.
The refining segment processes crude oil and other purchased feedstocks for the manufacture of transportation motor fuels including various grades of gasoline, diesel fuel, aviation fuel, asphalt and other petroleum-based products that are distributed through owned and third-party product terminals. The refining segment has a combined nameplate capacity of 140,000 bpd, including the 60,000 bpd Tyler refinery and the 80,000 bpd El Dorado refinery. As of December 31, 2014, the refining segment also owned and operated two biodiesel facilities involved in the production of biodiesel fuels and related activities and a currently idle pipeline and terminal in Helena, Arkansas.
Our logistics segment owns and operates crude oil and refined products logistics and marketing assets. The logistics segment generates revenue and subsequently contribution margin, which we define as net sales less cost of goods sold and operating expenses, by charging fees for gathering, transporting and storing crude oil and for marketing, distributing, transporting and storing intermediate and refined products.
Our retail segment markets gasoline, diesel, other refined petroleum products and convenience merchandise through a network of company-operated retail fuel and convenience stores throughout the southeastern United States. As of December 31, 2014, we had 365 stores in total, consisting of 197 located in Tennessee, 90 in Alabama, 48 in Georgia, 13 in Arkansas and 8 in Virginia. The remaining 9 stores are located in Kentucky and Mississippi. The retail fuel and convenience stores operate under Delek’s MAPCO Express®, MAPCO Mart®, East Coast®, Fast Food and FuelTM, Favorite Markets®, Delta Express® and Discount Food MartTM brands. The retail segment also supplied fuel to approximately 46 dealer locations as of December 31, 2014. In the retail segment, management reviews operating results on a divisional basis, where a division represents a specific geographic market. These divisional operating segments exhibit similar economic characteristics, provide the same products and services, and operate in such a manner such that aggregation of these operations is appropriate for segment presentation.
Our refining segment has a services agreement with our logistics segment, which, among other things, requires the refining segment to pay service fees based on the number of gallons sold at the Tyler refinery and a sharing of a portion of the margin achieved in return for providing marketing, sales and customer services. This intercompany transaction fee was $14.4 million and $13.6 million during the years ended December 31, 2014 and 2013, respectively. Additionally, the refining segment pays crude transportation and storage fees to the logistics segment for the utilization of certain crude pipeline assets. These fees were $94.6 million and $57.8 million during the years ended December 31, 2014 and 2013, respectively. During the year ended December 31, 2014 and 2013, the refining segment recorded sales and fee revenues from the retail and logistics segments in the amount of $622.1 million and $430.7 million, respectively. All inter-segment transactions have been eliminated in consolidation.
F-29
The following is a summary of business segment operating performance as measured by contribution margin for the period indicated (in millions):
As of and For the Year Ended December 31, 2014 | ||||||||||||||||||||
(In millions) | Refining | Retail | Logistics | Corporate, Other and Eliminations | Consolidated | |||||||||||||||
Net sales (excluding intercompany fees and sales) | $ | 5,728.4 | $ | 1,869.3 | $ | 726.7 | $ | (0.1 | ) | $ | 8,324.3 | |||||||||
Intercompany fees and sales | 622.1 | — | 114.6 | (736.7 | ) | — | ||||||||||||||
Operating costs and expenses: | ||||||||||||||||||||
Cost of goods sold | 5,664.8 | 1,671.5 | 697.2 | (718.3 | ) | 7,315.2 | ||||||||||||||
Operating expenses | 221.7 | 136.8 | 38.8 | 1.5 | 398.8 | |||||||||||||||
Segment contribution margin | $ | 464.0 | $ | 61.0 | $ | 105.3 | $ | (20.0 | ) | 610.3 | ||||||||||
General and administrative expenses | 133.4 | |||||||||||||||||||
Depreciation and amortization | 111.5 | |||||||||||||||||||
Other operating income | (1.1 | ) | ||||||||||||||||||
Operating income | $ | 366.5 | ||||||||||||||||||
Total assets | $ | 1,959.9 | $ | 447.1 | $ | 311.8 | $ | 172.6 | $ | 2,891.4 | ||||||||||
Capital spending (excluding business combinations) | $ | 201.1 | $ | 26.2 | $ | 7.2 | $ | 22.4 | $ | 256.9 | ||||||||||
As of and For the Year Ended December 31, 2013 | ||||||||||||||||||||
(In millions) | Refining | Retail | Logistics | Corporate, Other and Eliminations | Consolidated | |||||||||||||||
Net sales (excluding intercompany fees and sales) | $ | 6,005.1 | $ | 1,871.4 | $ | 829.8 | $ | 0.5 | $ | 8,706.8 | ||||||||||
Intercompany fees and sales | 430.7 | — | 77.6 | (508.3 | ) | — | ||||||||||||||
Operating costs and expenses: | ||||||||||||||||||||
Cost of goods sold | 5,865.2 | 1,691.3 | 811.3 | (487.1 | ) | 7,880.7 | ||||||||||||||
Operating expenses | 223.1 | 132.5 | 35.6 | (3.8 | ) | 387.4 | ||||||||||||||
Segment contribution margin | $ | 347.5 | $ | 47.6 | $ | 60.5 | $ | (16.9 | ) | 438.7 | ||||||||||
General and administrative expenses | 111.2 | |||||||||||||||||||
Depreciation and amortization | 89.8 | |||||||||||||||||||
Operating income | $ | 237.7 | ||||||||||||||||||
Total assets | $ | 1,881.1 | $ | 449.0 | $ | 301.3 | $ | 209.0 | $ | 2,840.4 | ||||||||||
Capital spending (excluding business combinations) | $ | 136.7 | $ | 37.9 | $ | 12.7 | $ | 35.0 | $ | 222.3 | ||||||||||
F-30
As of and For the Year Ended December 31, 2012 | ||||||||||||||||||||
(In millions) | Refining | Retail | Logistics | Corporate, Other and Eliminations | Consolidated | |||||||||||||||
Net sales (excluding intercompany fees and sales) | $ | 6,070.8 | $ | 1,877.8 | $ | 775.9 | $ | 2.2 | $ | 8,726.7 | ||||||||||
Intercompany fees and sales | 170.1 | — | 42.6 | (212.7 | ) | — | ||||||||||||||
Operating costs and expenses: | ||||||||||||||||||||
Cost of goods sold | 5,441.3 | 1,704.6 | 757.9 | (195.6 | ) | 7,708.2 | ||||||||||||||
Operating expenses | 197.7 | 128.0 | 39.4 | (1.8 | ) | 363.3 | ||||||||||||||
Segment contribution margin | $ | 601.9 | $ | 45.2 | $ | 21.2 | $ | (13.1 | ) | 655.2 | ||||||||||
General and administrative expenses | 99.7 | |||||||||||||||||||
Depreciation and amortization | 82.5 | |||||||||||||||||||
Other operating income, net | (0.1 | ) | ||||||||||||||||||
Operating income | $ | 473.1 | ||||||||||||||||||
Total assets | $ | 1,811.2 | $ | 425.6 | $ | 307.9 | $ | 79.0 | $ | 2,623.7 | ||||||||||
Capital spending (excluding business combinations) | $ | 46.1 | $ | 29.1 | $ | 30.3 | $ | 26.5 | $ | 132.0 | ||||||||||
13. Fair Value Measurements
The fair values of financial instruments are estimated based upon current market conditions and quoted market prices for the same or similar instruments. Management estimates that the carrying value approximates fair value for all of Delek’s assets and liabilities that fall under the scope of ASC 825.
Delek applies the provisions of ASC 820, which defines fair value, establishes a framework for its measurement and expands disclosures about fair value measurements. ASC 820 applies to our interest rate and commodity derivatives that are measured at fair value on a recurring basis. The standard also requires that we assess the impact of nonperformance risk on our derivatives. Nonperformance risk is not considered material at this time.
ASC 820 requires disclosures that categorize assets and liabilities measured at fair value into one of three different levels depending on the observability of the inputs employed in the measurement. Level 1 inputs are quoted prices in active markets for identical assets or liabilities. Level 2 inputs are observable inputs other than quoted prices included within Level 1 for the asset or liability, either directly or indirectly through market-corroborated inputs. Level 3 inputs are unobservable inputs for the asset or liability reflecting our assumptions about pricing by market participants.
OTC commodity swaps, physical commodity purchase and sale contracts and interest rate swaps and caps are generally valued using industry-standard models that consider various assumptions, including quoted forward prices, spot prices, interest rates, time value, volatility factors and contractual prices for the underlying instruments, as well as other relevant economic measures. The degree to which these inputs are observable in the forward markets determines the classification as Level 2 or 3. Our contracts are valued using quotations provided by brokers based on exchange pricing and/or price index developers such as Platts or Argus and are, therefore, classified as Level 2.
F-31
The fair value hierarchy for our financial assets and liabilities accounted for at fair value on a recurring basis at December 31, 2014, was (in millions):
As of December 31, 2014 | ||||||||||||||||
Level 1 | Level 2 | Level 3 | Total | |||||||||||||
Assets | ||||||||||||||||
OTC commodity swaps | $ | — | $ | 389.6 | $ | — | $ | 389.6 | ||||||||
Interest rate derivatives | — | — | — | — | ||||||||||||
Total assets | — | 389.6 | — | 389.6 | ||||||||||||
Liabilities | ||||||||||||||||
Interest rate derivatives | — | (0.9 | ) | — | (0.9 | ) | ||||||||||
OTC commodity swaps | — | (353.3 | ) | — | (353.3 | ) | ||||||||||
Total liabilities | — | (354.2 | ) | — | (354.2 | ) | ||||||||||
Net assets | $ | — | $ | 35.4 | $ | — | $ | 35.4 | ||||||||
As of December 31, 2013 | ||||||||||||||||
Level 1 | Level 2 | Level 3 | Total | |||||||||||||
Assets | ||||||||||||||||
OTC commodity swaps | $ | — | $ | 23.9 | $ | — | $ | 23.9 | ||||||||
Interest rate derivatives | — | 0.1 | — | 0.1 | ||||||||||||
Total assets | — | 24.0 | — | 24.0 | ||||||||||||
Liabilities | ||||||||||||||||
Interest rate derivatives | — | (2.8 | ) | — | (2.8 | ) | ||||||||||
OTC commodity swaps | — | (24.9 | ) | — | (24.9 | ) | ||||||||||
Total liabilities | — | (27.7 | ) | — | (27.7 | ) | ||||||||||
Net liabilities | $ | — | $ | (3.7 | ) | $ | — | $ | (3.7 | ) | ||||||
The derivative values above are based on analysis of each contract as the fundamental unit of account as required by ASC 820. Derivative assets and liabilities with the same counterparty are not netted where the legal right of offset exists. This differs from the presentation in the financial statements which reflects our policy under the guidance of ASC 815-10-45, wherein we have elected to offset the fair value amounts recognized for multiple derivative instruments executed with the same counterparty, where right of offset exists. As of December 31, 2014 and 2013, $11.1 million and $2.6 million, respectively, of cash collateral was held by counterparty brokerage firms and has been netted with the net derivative positions with each counterparty.
14. Derivative Instruments
We use derivatives to reduce normal operating and market risks with the primary objective of reducing the impact of market price volatility on our results of operations. As such, our use of derivative contracts is aimed at:
• | limiting the exposure to price fluctuations of commodity inventory above or below target levels at each of our segments; |
• | managing our exposure to commodity price risk associated with the purchase or sale of crude oil, feedstocks and finished grade fuel products at each of our segments; and |
• | limiting the exposure to interest rate fluctuations on our floating rate borrowings. |
We primarily utilize OTC commodity swaps, generally with maturity dates of three years or less, and interest rate swap and cap agreements to achieve these objectives. OTC commodity swap contracts require cash settlement for the commodity based on the difference between a fixed or floating price and the market price on the settlement date. Interest rate swap and cap agreements economically hedge floating rate debt by exchanging interest rate cash flows, based on a notional amount from a floating rate to a fixed rate. At this time, we do not believe there is any material credit risk with respect to the counterparties to these contracts.
In accordance with ASC 815, certain of our OTC commodity swap contracts have been designated as cash flow hedges and the change in fair value between the execution date and the end of period has been recorded in other comprehensive income. The fair
F-32
value of these contracts is recognized in income at the time the positions are closed and the hedged transactions are recognized in income.
From time to time, we also enter into futures contracts with supply vendors that secure supply of product to be purchased for use in the normal course of business at our refining and retail segments. These contracts are priced based on an index that is clearly and closely related to the product being purchased, contain no net settlement provisions and typically qualify under the normal purchase exemption from derivative accounting treatment under ASC 815.
The following table presents the fair value of our derivative instruments as of December 31, 2014 and 2013. The fair value amounts below are presented on a gross basis and do not reflect the netting of asset and liability positions permitted under our master netting arrangements, including cash collateral on deposit with our counterparties. We have elected to offset the recognized fair value amounts for multiple derivative instruments executed with the same counterparty in our financial statements. As a result, the asset and liability amounts below differ from the amounts presented in our consolidated balance sheets (in millions):
As of December 31, 2014 | As of December 31, 2013 | ||||||||||||||||
Derivative Type | Balance Sheet Location | Assets | Liabilities | Assets | Liabilities | ||||||||||||
Derivatives not designated as hedging instruments: | |||||||||||||||||
OTC commodity swaps(1) | Other current assets | $ | 190.3 | $ | (163.3 | ) | $ | 17.4 | $ | (8.6 | ) | ||||||
OTC commodity swaps(1) | Other current liabilities | 20.1 | (37.8 | ) | — | (3.4 | ) | ||||||||||
OTC commodity swaps(1) | Other long term assets | 21.5 | (14.3 | ) | — | — | |||||||||||
OTC commodity swaps(1) | Other long term liabilities | 32.8 | (2.7 | ) | — | — | |||||||||||
Interest rate derivatives | Other current assets | — | (0.6 | ) | — | — | |||||||||||
Interest rate derivatives | Other current liabilities | — | (0.3 | ) | — | — | |||||||||||
Interest rate derivatives | Other long term assets | — | — | 0.1 | — | ||||||||||||
Interest rate derivatives | Other long term liabilities | — | — | — | (2.8 | ) | |||||||||||
Derivatives designated as hedging instruments: | |||||||||||||||||
OTC commodity swaps(1) | Other current assets | 97.1 | (76.1 | ) | 3.5 | (3.2 | ) | ||||||||||
OTC commodity swaps(1) | Other current liabilities | 9.4 | (7.1 | ) | — | — | |||||||||||
OTC commodity swaps(1) | Other long term assets | — | — | — | — | ||||||||||||
OTC commodity swaps(1) | Other long term liabilities | 18.4 | (52.0 | ) | 3.0 | (9.7 | ) | ||||||||||
Total gross fair value of derivatives | 389.6 | (354.2 | ) | 24.0 | (27.7 | ) | |||||||||||
Less: Counterparty netting and cash collateral(2) | 333.0 | (344.1 | ) | 14.2 | (16.8 | ) | |||||||||||
Less: Amounts subject to master netting arrangements that are not netted on the balance sheet | $ | 3.2 | $ | (3.2 | ) | $ | 6.0 | $ | (6.0 | ) | |||||||
Total net fair value of derivatives | $ | 53.4 | $ | (6.9 | ) | $ | 3.8 | $ | (4.9 | ) | |||||||
(1) | As of December 31, 2014 and 2013, we had open derivative contracts representing 11,169,150 and 7,703,000 barrels, respectively, of crude oil and refined petroleum products. Of these open contracts, contracts representing 4,512,400 and 5,186,000 barrels were designated as hedging instruments as of December 31, 2014 and 2013, respectively. |
(2) | As of December 31, 2014 and 2013, $11.1 million and $2.6 million, respectively, of cash collateral has been netted with the derivatives with each counterparty. Included in these amounts is $2.0 million of cash collateral associated with our interest rate derivatives as of both December 31, 2014 and 2013. |
For the years ended December 31, 2014, 2013 and 2012, we recognized total gains (losses) on our commodity derivatives of $131.6 million, $(3.0) million and $1.4 million, respectively. The gains and losses on commodity derivatives were recorded in cost of goods sold on the condensed consolidated statement of income, primarily in the refining segment.
F-33
Gains (losses) associated with derivatives not designated as hedging instruments for the years ended December 31, 2014, 2013 and 2012 are as follows (in millions):
Year Ended December 31, | |||||||||||||
Derivative Type | Income Statement Location | 2014 | 2013 | 2012 | |||||||||
OTC commodity swaps | Cost of goods sold | $ | 102.7 | $ | (1.2 | ) | $ | 3.3 | |||||
Interest rate derivatives | Interest expense | (0.4 | ) | (0.4 | ) | (2.6 | ) | ||||||
Total | $ | 102.3 | $ | (1.6 | ) | $ | 0.7 | ||||||
Gains (losses) on our derivatives designated as cash flow hedging instruments or the years ended December 31, 2014, 2013 and 2012 are as follows (in millions):
Year Ended December 31, | ||||||||||||
2014 | 2013 | 2012 | ||||||||||
OTC commodity swaps: | ||||||||||||
Gain (loss) recognized in OCI (effective portion) | $ | 15.0 | $ | (5.6 | ) | $ | (4.0 | ) | ||||
Gain (loss) reclassified from accumulated OCI into cost of goods sold on closed positions (effective portion) | $ | 22.6 | $ | 0.7 | $ | (1.1 | ) | |||||
Gain (loss) recognized in cost of goods sold related to ineffectiveness | $ | 6.3 | $ | (2.5 | ) | $ | (0.8 | ) | ||||
For cash flow hedges, no component of the derivative instruments’ gains or losses was excluded from the assessment of hedge effectiveness for the years ended December 31, 2014, 2013 and 2012. For the year ended December 31, 2014, losses of $12.3 million, net of taxes, on cash flow hedges, primarily related to future purchases of crude oil and the associated sale of finished grade fuel, remain in accumulated other comprehensive income. Gains (losses) of $14.7 million, $0.4 million and $(0.7) million, net of tax, on settled contracts were reclassified into cost of sales during the years ended December 31, 2014, 2013 and 2012. We estimate that $9.0 million of deferred gains as of December 31, 2014 will be reclassified into cost of sales over the next 12 months as a result of hedged transactions that are forecasted to occur. For the years ended December 31, 2014, 2013 and 2012, there were no amounts reclassified from accumulated other comprehensive income into income as a result of the discontinuation of cash flow hedge accounting.
F-34
15. Income Taxes
Deferred income taxes reflect the net tax effects of temporary differences between the carrying amounts of assets and liabilities for financial reporting purposes and the amounts used for income tax purposes.
Significant components of Delek's deferred tax assets and liabilities, reported separately in the accompanying consolidated financial statements, as of December 31, 2014 and 2013 were as follows (in millions):
December 31, | |||||||
2014 | 2013 | ||||||
Current Deferred Taxes: | |||||||
Reserves and accruals | 9.7 | 4.3 | |||||
Inventories | 22.2 | 2.7 | |||||
ASC 815 | (11.6 | ) | — | ||||
Valuation allowance | (0.1 | ) | (0.1 | ) | |||
Total current deferred tax assets | 20.2 | 6.9 | |||||
Non-Current Deferred Taxes: | |||||||
Property, plant and equipment, and intangibles | (251.6 | ) | (207.8 | ) | |||
Partnership investment | (16.3 | ) | (12.6 | ) | |||
Deferred revenues | (13.8 | ) | (14.8 | ) | |||
Compensation and employee benefits | 7.1 | 4.9 | |||||
Net operating loss carryforwards | 6.2 | 6.0 | |||||
Reserves and accruals | 4.9 | 5.3 | |||||
Other | — | 2.3 | |||||
Valuation allowance | (2.8 | ) | (3.3 | ) | |||
Total non-current deferred tax liabilities | (266.3 | ) | (220.0 | ) | |||
Total net deferred tax liabilities | $ | (246.1 | ) | $ | (213.1 | ) | |
The difference between the actual income tax expense and the tax expense computed by applying the statutory federal income tax rate to income from continuing operations was attributable to the following (in millions):
Year Ended December 31, | |||||||||||
2014 | 2013 | 2012 | |||||||||
Provision for federal income taxes at statutory rate | $ | 114.7 | $ | 72.3 | $ | 149.7 | |||||
State income taxes, net of federal tax provision | 6.7 | 2.6 | 11.4 | ||||||||
Non-controlling interest | (9.6 | ) | (6.4 | ) | (1.1 | ) | |||||
Other items | (10.2 | ) | 2.4 | (8.4 | ) | ||||||
Income tax expense | $ | 101.6 | $ | 70.9 | $ | 151.6 | |||||
Income tax expense from continuing operations was as follows (in millions):
Year Ended December 31, | |||||||||||
2014 | 2013 | 2012 | |||||||||
Current | $ | 64.2 | $ | 32.0 | $ | 135.8 | |||||
Deferred | 37.4 | 38.9 | 15.8 | ||||||||
$ | 101.6 | $ | 70.9 | $ | 151.6 | ||||||
Deferred income tax expense above was reflective of the changes in deferred tax assets and liabilities during the current period.
F-35
During the year ended December 31, 2014 and 2013, we recorded decreases to the valuation allowance of $0.5 million and $2.0 million, respectively. We carry valuation allowances against certain state deferred tax assets and net operating losses that may not be recoverable with future taxable income. During the year ended December 31, 2014 and 2013, we decreased the valuation allowance on some of our state deferred tax assets that we believe will more likely than not be realized based on the future reversal of our deferred tax liabilities.
In assessing the realizability of deferred tax assets, management considers whether it is more likely than not that some portion or all of the deferred tax assets will be realized. The ultimate realization of deferred tax assets is dependent upon the generation of future taxable income during the periods in which those temporary differences become deductible. Management considers the scheduled reversal of deferred tax liabilities, projected future taxable income, and tax planning strategies in making this assessment. Based upon the level of historical taxable income and projections for future taxable income over the periods for which the deferred tax assets are deductible, management believes it is more likely than not Delek will realize the benefits of these deductible differences, net of the existing valuation allowance. The amount of the deferred tax assets considered realizable, however, could be reduced in the near term if estimates of future taxable income during the carryforward period are reduced. Subsequently recognized tax benefit or expense relating to the valuation allowance for deferred tax assets will be reported as an income tax benefit or expense in the consolidated statement of income.
State net operating loss carryforwards at December 31, 2014 totaled $170.5 million, a portion of which was subject to a valuation allowance and which include $26.8 million related to non-qualified stock option deductions. Delek has $0.8 million of state net operating losses that are set to expire between 2015 and 2016. Remaining net operating losses will begin expiring in 2017-2034. To the extent net operating loss carryforwards, when realized, relate to non-qualified stock option deductions, the resulting benefits will be credited to stockholders' equity.
Delek files a consolidated U.S. federal income tax return, as well as income tax returns in various state jurisdictions. Delek is no longer subject to U.S. federal income tax examinations by tax authorities for years through 2009. The Internal Revenue Service has examined Delek's income tax returns through the tax year ending 2009.
ASC 740 provides a recognition threshold and guidance for measurement of income tax positions taken or expected to be taken on a tax return. ASC 740 requires the elimination of the income tax benefits associated with any income tax position where it is not "more likely than not" that the position would be sustained upon examination by the taxing authorities. During the years ending December 31, 2014 and 2013, respectively, $2.6 million and a nominal amount of unrecognized tax benefits were recorded, while $0.2 million and $0.3 million of unrecognized tax benefits lapsed due to statue of limitations expiration.
Increases and decreases to the beginning balance of unrecognized tax benefits during the year ended December 31, 2014 and 2013 were as follows:
2014 | 2013 | 2012 | |||||||||
Balance at the beginning of the year | $ | 0.3 | $ | 0.6 | $ | 0.7 | |||||
Additions based on tax positions related to current year | — | — | 0.1 | ||||||||
Additions for tax positions related to prior years | 2.6 | — | — | ||||||||
Reductions for tax positions related to the lapse of applicable statute of limitations | (0.2 | ) | (0.3 | ) | (0.2 | ) | |||||
Balance at the end of the year | $ | 2.7 | $ | 0.3 | $ | 0.6 | |||||
The amount of the unrecognized benefit above that if recognized would change the effective tax rate is $2.2 million and $0.3 million as of December 31, 2014 and 2013, respectively.
Delek recognizes accrued interest and penalties related to unrecognized tax benefits as an adjustment to the current provision for income taxes. Interest of $0.2 million was recognized related to unrecognized tax benefits during the year ended December 31, 2014. A nominal amount of interest was recognized related to unrecognized tax benefits during each of the years ended December 31, 2013 and 2012.
Uncertain tax positions have been examined by Delek for any material changes in the next 12 months and none are expected.
16. Commitments and Contingencies
Litigation
In the ordinary conduct of our business, we are from time to time subject to lawsuits, investigations and claims, including environmental claims and employee-related matters.
We experienced a security breach by third-party hackers that may have compromised the credit/debit card information of certain of our retail segment customers. The incident involved credit/debit card payments for transactions at certain retail locations between March 19-25, 2013, April 14-15, 2013 and April 20-21, 2013, and several lawsuits have been brought against us as a result of this incident. Although we are unable to definitively determine the extent of any potential losses related to this breach, we do not believe that this incident will have a material adverse effect on our business, financial position or results of operations.
Although we cannot predict with certainty the ultimate resolution of lawsuits, investigations and claims asserted against us, including civil penalties or other enforcement actions, we do not believe that any currently pending legal proceeding or proceedings to which we are a party will have a material adverse effect on our business, financial condition or results of operations.
Self-insurance
Delek is self-insured for workers’ compensation claims up to $1.0 million on a per accident basis. We self-insure for general liability claims up to $4.0 million on a per occurrence basis. We self-insure for auto liability up to $4.0 million on a per accident basis.
We have umbrella liability insurance available to each of our segments in an amount determined reasonable by management.
Rate Regulation of Petroleum Pipelines
The rates and terms and conditions of service on certain of our pipelines may be subject to regulation by the Federal Energy Regulatory Commission ("FERC") under the Interstate Commerce Act ("ICA") or by the state regulatory commissions in the states in which we transport crude oil and refined products, including the Railroad Commission of Texas, the Louisiana Public Service Commission, and the Arkansas Public Service Commission. Certain of our pipeline systems are subject to such regulation and have filed tariffs with the appropriate entities. We also comply with the reporting requirements for these pipelines. Other of our pipelines have received a waiver from application of FERC's tariff requirements but will comply with other regulatory requirements.
F-36
FERC regulates interstate transportation under the ICA, the Energy Policy Act of 1992 and the rules and regulations promulgated under those laws. The ICA and its implementing regulations require that tariff rates for interstate service on oil pipelines, including pipelines that transport crude oil and refined products in interstate commerce (collectively referred to as “petroleum pipelines”), be just and reasonable and non-discriminatory and that such rates and terms and conditions of service be filed with FERC. Under the ICA, shippers may challenge new or existing rates or services. FERC is authorized to suspend the effectiveness of a challenged rate for up to seven months, though rates are typically not suspended for the maximum allowable period.
While FERC regulates rates for shipments of crude oil or refined products in interstate commerce, state agencies may regulate rates and service for shipments in intrastate commerce. We own pipeline assets in Texas, Arkansas, and Louisiana.
Environmental Health and Safety
We are subject to various federal, state and local environmental and safety laws enforced by agencies including the United States Environmental Protection Agency (the "EPA"), the United States Department of Transportation, the Occupational Safety and Health Administration, the Texas Commission on Environmental Quality, the Railroad Commission of Texas, the Arkansas Department of Environmental Quality and the Tennessee Department of Environment and Conservation as well as other state and federal agencies. Numerous permits or other authorizations are required under these laws for the operation of our refineries, biodiesel facilities, terminals, pipelines, underground storage tanks ("USTs"), trucks, rail cars and related operations, and may be subject to revocation, modification and renewal.
These laws and permits raise potential exposure to future claims and lawsuits involving environmental and safety matters which could include soil and water contamination, air pollution, personal injury and property damage allegedly caused by substances which we manufactured, handled, used, released or disposed of, transported, or that relate to pre-existing conditions for which we have assumed responsibility. We believe that our current operations are in substantial compliance with existing environmental and safety requirements. However, there have been and will continue to be ongoing discussions about environmental and safety matters between us and federal and state authorities, including notices of violations, citations and other enforcement actions, some of which have resulted or may result in changes to operating procedures and in capital expenditures. While it is often difficult to quantify future environmental or safety related expenditures, we anticipate that continuing capital investments and changes in operating procedures will be required for the foreseeable future to comply with existing and new requirements as well as evolving interpretations and more strict enforcement of existing laws and regulations.
The Comprehensive Environmental Response, Compensation and Liability Act, also known as Superfund, imposes liability, without regard to fault or the legality of the original conduct, on certain classes of persons who are considered to be responsible for the release of a hazardous substance into the environment. Analogous state laws impose similar responsibilities and liabilities on responsible parties. In the course of our ordinary operations, our various businesses generate waste, some of which falls within the statutory definition of a hazardous substance and some of which may have been disposed of at sites that may require future cleanup under Superfund. At this time, our El Dorado refinery has been named as a minor potentially responsible party at one site for which we believe future costs will not be material.
As of December 31, 2014, we have recorded an environmental liability of approximately $9.4 million, primarily related to the probable estimated costs of remediating or otherwise addressing certain environmental issues of a non-capital nature at the Tyler and El Dorado refineries and a pipeline leak location. This liability includes estimated costs for ongoing investigation and remediation efforts, which were already being performed by the former operators of the Tyler and El Dorado refineries prior to our acquisition of those facilities, for known contamination of soil and groundwater, as well as estimated costs for additional issues which have been identified subsequent to the acquisition. We expect approximately $0.5 million of this amount to be reimbursable by a prior owner of the El Dorado refinery and have recorded $0.1 million in other current assets and $0.4 million in other non-current assets in our condensed consolidated balance sheet as of December 31, 2014. Approximately $0.9 million of the total liability is expected to be expended over the next 12 months with most of the balance expended by 2022. In the future, we could be required to undertake additional investigations of our refineries, pipelines and terminal facilities or convenience stores, which could result in additional remediation liabilities.
Most of the cost of remediating releases from USTs in our retail segment is reimbursed by state reimbursement funds which are funded by a tax on petroleum products and subject to certain deductible amounts. As of December 31, 2014, our accrual for such UST-related remediation was less than $0.1 million.
The EPA issued final rules for gasoline formulation that required the reduction of average benzene content by January 1, 2011 and the reduction of maximum annual average benzene content by July 1, 2012. It is necessary for us to purchase credits to fully comply with these content requirements for the Tyler refinery. Although credits have been acquired that we believe will be sufficient to cover our obligations through at least 2016, there can be no assurance that such credits will be available in the future or that we
F-37
will be able to purchase available credits at reasonable prices. Additional benzene reduction projects may be implemented to reduce or eliminate our need to purchase benzene credits depending on the availability and cost of such credits.
Various legislative and regulatory measures to address climate change and greenhouse gas ("GHG") emissions (including carbon dioxide, methane and nitrous oxides) have been discussed or implemented. They include proposed and enacted federal regulation and state actions to develop statewide, regional or nationwide programs designed to control and reduce GHG emissions from fixed sources, such as our refineries, as well as mobile transportation sources and fuels. We are not aware of any state or regional initiatives for controlling existing GHG emissions that would affect our refineries. Although it is not possible to predict the requirements of any GHG legislation that may be enacted, any laws or regulations that may be adopted to restrict or reduce GHG emissions will likely require us to incur increased operating and capital costs. The EPA also has indicated that it intends to regulate refinery GHG emissions from new and existing sources through a New Source Performance Standard ("NSPS"), although there is no firm proposal or date for such regulation.
Since the 2010 calendar year, EPA rules require us to report GHG emissions from our refinery operations and consumer use of fuel products produced at our refineries on an annual basis. While the cost of compliance with the reporting rule is not material, data gathered under the rule may be used in the future to support additional regulation of GHG. Effective January 2011, the EPA began regulating GHG emissions from refineries and other major sources through the Prevention of Significant Deterioration ("PSD") and Federal Operating Permit ("Title V") programs. In June 2014, the United States Supreme Court ruled that the EPA may not require PSD and Title V permits solely because of GHG emissions, but may require Best Available Control Technology (“BACT”) for GHG emissions above a certain threshold if emissions of other pollutants would otherwise require PSD permitting. While this decision does not impose any limits or controls on GHG emissions from current operations, GHG emission increases from future projects or operational changes, such as capacity increases, may be impacted and required to meet emission limits or technological requirements such as BACT. We do not believe this decision will materially affect our operations.
In mid-2012, the EPA announced an industry-wide enforcement initiative directed at flaring operations and performance at refineries and petrochemical plants. In September 2012, the EPA finalized revisions to the NSPS for Petroleum Refineries ("NSPS Subpart Ja") that primarily affects flares and process heaters. We believe our existing process heaters meet the applicable requirements and our refineries have not received any associated inquiries or requests for information, nor are they a party to any associated enforcement action at this time. The NSPS will impact the way some flares at our Tyler and El Dorado refineries are designed and/or operated. Affected flares have three years to comply with the new standard and we have capital projects at our refineries related to flare compliance that will be implemented between 2014 and 2016.
In June 2014, the EPA proposed rules to further regulate refinery air emissions through additional NSPS and Maximum Achievable Control Technology requirements. The proposed rules would require capital expenditures for additional controls on the Tyler refinery’s coker and for the relief systems, flares, tanks and other sources at both refineries, as well as requiring changes to the way we operate or start up some process units. The proposed rule would also require that we monitor property line benzene concentrations and provide the results to the EPA, which will make the results available to the public. The EPA anticipates finalizing the proposed rules in June 2015 with approximately three years to comply with most of the requirements. If the proposed rules are finalized, we do not anticipate that any required capital and operating costs will be material and do not believe compliance will affect our production capacities or have a material adverse effect upon our business, financial condition or results of operations.
The Energy Independence and Security Act of 2007 ("EISA") increased the amounts of renewable fuel required to be blended into domestic transportation fuel supplies by the Energy Policy Act of 2005 to 32 billion gallons by 2022. The Renewable Fuel Standard - 2 (RFS-2) rule finalized by the EPA in 2010 to implement EISA, requires that most refiners blend increasing amounts of biofuels with refined products, equal to approximately 9.2% of combined gasoline and diesel volume in 2012, increasing to 10% and 11% in 2014 and 2015, respectively, and escalating annually to approximately 18% by 2022. Because the mandate requires specified volumes of biofuels, if the demand for motor fuels decreases in future years, even higher percentages of biofuels may be required. Alternatively, credits called Renewable Identification Numbers ("RINs") can be used instead of physically blending biofuels. The Tyler refinery began supplying a 10% ethanol gasoline blend (E-10) in January 2008 and 5% biodiesel blends in June 2011. The El Dorado refinery completed projects at its truck loading rack in June 2011 to make E-10 available and in July 2012 to make biodiesel blends available. In 2013, we internally generated, through our logistics, retail and refining segments, most of the RINs required to meet the obligations of our refineries, including a carryover of 2012 RINs, with a net surplus of biodiesel RINs that were available to be sold to purchase RINs in other categories.
The EPA has proposed slightly lower overall renewable fuel obligations for 2014 in recognition of blending issues associated with exceeding the 10% "blendwall" in gasoline; however, the EPA is not expected to finalize the required volumes until sometime in the second quarter of 2015. The EPA could require increased volumes compared with the proposed volumes. If the volumes in the proposed rule are finalized, it is likely we will obtain most of the RINs required for 2014 compliance through internal operations
F-38
of our refineries and other business units. If the final rule requires higher volumes than proposed, it will be necessary for our refineries to purchase additional RINs in the market, but it is not possible at this time to predict what those volumes may be.
In March 2013, the EPA proposed Tier 3 gasoline rules, which were finalized in March 2014. The final Tier 3 rule requires a reduction in annual average gasoline sulfur content from 30 ppm to 10 ppm and retains the current maximum per-gallon sulfur content of 80 ppm. Larger refineries must comply with the 10 ppm sulfur standard by January 1, 2017 but the final rule provides a three-year waiver period, to January 1, 2020, for small volume refineries that processed less than 75,000 bpd in 2011 or 2012. Both of our refineries meet this waiver provision and will have until January 1, 2020 to comply. We anticipate that the Tyler refinery will meet these new limits when they become effective with only minor operational changes and that a minor capital project may be required for additional sulfur removal capacity at the El Dorado refinery.
Following the November 2008 explosion and fire at the Tyler refinery, the EPA conducted an investigation under Section 114 of the Clean Air Act pertaining to our compliance with the chemical accident prevention standards. In late 2011, the EPA referred an enforcement action to the DOJ and in the fourth quarter of 2014, we settled this matter by entering into a Consent Decree with the government. The Consent Decree requires Delek to pay a penalty of $0.5 million and make a minor change to its written inspection procedures. The Consent Decree has no effect on production at the refinery and no cost implications other than the penalty amount.
We have detected several crude oil releases from pipelines owned by our logistics segment, including a release at Magnolia Station in March 2013, a release near Macedonia, Arkansas in October 2013 and a release in Haynesville, Louisiana in April 2014. Based on current information available to us, we do not believe the total costs associated with these events, whether alone or in the aggregate, including any fines or penalties and net of partial insurance reimbursement, will have a material adverse effect upon our business, financial condition or results of operations.
Vendor Commitments
Our retail segment maintains an agreement with a significant vendor that requires the purchase of certain general merchandise exclusively from this vendor over a specified period of time. Additionally, we maintain agreements with certain fuel suppliers that contain terms which generally require the purchase of predetermined quantities of third-party branded fuel for a specified period of time. In certain fuel vendor contracts, penalty provisions exist if minimum quantities are not met.
Letters of Credit
As of December 31, 2014, Delek had in place letters of credit totaling approximately $102.7 million with various financial institutions primarily securing obligations with respect to its workers’ compensation and general liability self-insurance programs, crude oil purchases for the refining segment, and gasoline and diesel purchases for the logistics segment. No amounts were drawn by beneficiaries of these letters of credit at December 31, 2014.
Operating Leases
Delek leases land, buildings, retail store locations, equipment and corporate office space under agreements expiring at various dates through 2037 after considering available renewal options. Many of these leases contain renewal options and require Delek to pay executory costs (such as property taxes, maintenance, and insurance). Lease expense for all operating leases for the years ended December 31, 2014, 2013 and 2012 totaled $24.7 million, $19 million, and $17.1 million, respectively.
The following is an estimate of our future minimum lease payments for operating leases having remaining noncancelable terms in excess of one year as of December 31, 2014 (in millions):
2015 | $ | 20.8 | ||
2016 | 19.8 | |||
2017 | 17.7 | |||
2018 | 15.9 | |||
2019 | 13.2 | |||
Thereafter | 64.6 | |||
Total future minimum rentals | $ | 152.0 | ||
F-39
17. Employees
Workforce
A portion of our workforce in the refining segment is represented by the United Steel, Paper and Forestry, Rubber Manufacturing, Energy, Allied Industrial and Service Workers International Union and its Local 202. As of December 31, 2014, 161 operations and maintenance hourly employees and 40 truck drivers at the Tyler refinery were represented by the United Steel, Paper and Forestry, Rubber, Manufacturing, Energy, Allied Industrial and Service Workers International Union and its Local 202. The Tyler operations and maintenance hourly employees are currently covered by a collective bargaining agreement that expired January 31, 2015. National-level negotiations are currently ongoing between the International Union and a third party. While these negotiations are in process, we are operating under rolling, 24-hour extensions to this agreement. The Tyler truck drivers are currently covered by a collective bargaining agreement that expires March 1, 2015. Renewal negotiations for this agreement are in process but not yet finalized. In the event that the union strikes, Delek has a plan in place for continued operation of the Tyler refinery utilizing company employees and/or third party contractors. We do not anticipate these negotiations will prevent the continuous operation of the Tyler refinery. As of December 31, 2014, 167 operations and maintenance hourly employees at the El Dorado refinery were represented by the International Union of Operating Engineers and its Local 381. These employees are covered by a collective bargaining agreement which expires on August 1, 2017. None of our employees in our marketing or retail segments or in our corporate office are represented by a union. We consider our relations with our employees to be satisfactory.
401(k) Plan
We sponsor a voluntary 401(k) Employee Retirement Savings Plan for eligible employees administered by Wells Fargo Bank, N.A. Employees must be at least 21 years of age and have 45 days of service to be eligible to participate in the plan. Employee contributions are matched on a fully-vested basis by us up to a maximum of 6% of eligible compensation. Eligibility for the company matching contribution begins on the first of the month following one year of employment. For the years ended December 31, 2014, 2013 and 2012, the 401(k) expense recognized was $4.2 million, $3.9 million, and $3.4 million, respectively.
18. Related Party Transactions
From the time of our initial public offering in May 2006 through March 20, 2013, Delek Group Ltd. ("Delek Group") controlled more than 50% of our voting power. As a result, Delek Group and its controlling stockholder Mr. Itshak Sharon (Tshuva), could, without the consent of our other stockholders, control the election of our directors, influence our corporate and management policies and determine the outcome of any matter or corporate transaction submitted to our stockholders for approval, including potential mergers or acquisitions, asset sales and other significant corporate transactions. On March 20, 2013 (the "2013 Offering") and May 20, 2014, Delek Group completed the sale of 9,000,000 and 10,580,000 shares of our outstanding common stock, respectively, in separate secondary offerings. Concurrently with the 2013 Offering, we repurchased 1,000,000 shares of our outstanding common stock from Delek Group in a privately negotiated transaction. Additionally, from 2012 through 2014, Delek Group engaged in several block trade sales of our common stock, further reducing their holdings of our outstanding common stock. As of December 31, 2014, no representative of Delek Group served on our Board of Directors, but, based on information filed in a Schedule 13G/A with the SEC on February 17, 2015, Delek Group beneficially owned approximately 5.2% of our outstanding shares of common stock on that date.
F-40
19. Selected Quarterly Financial Data (Unaudited)
Quarterly financial information for the years ended December 31, 2014 and 2013 is summarized below. The quarterly financial information summarized below has been prepared by Delek's management and is unaudited (in millions, except per share data).
For the Three Month Periods Ended | ||||||||||||||||
March 31, 2014 | June 30, 2014 | September 30, 2014 | December 31, 2014 | |||||||||||||
Net sales | $ | 1,865.7 | $ | 2,374.7 | $ | 2,322.2 | $ | 1,761.7 | ||||||||
Operating income | $ | 67.7 | $ | 106.0 | $ | 120.9 | $ | 71.9 | ||||||||
Net income | $ | 39.3 | $ | 63.2 | $ | 78.2 | $ | 45.3 | ||||||||
Net income attributable to Delek | $ | 33.7 | $ | 54.9 | $ | 72.5 | $ | 37.5 | ||||||||
Basic earnings per share | $ | 0.57 | $ | 0.93 | $ | 1.23 | $ | 0.65 | ||||||||
Diluted earnings per share | $ | 0.56 | $ | 0.92 | $ | 1.22 | $ | 0.64 | ||||||||
For the Three Month Periods Ended | ||||||||||||||||
March 31, 2013 | June 30, 2013 | September 30, 2013 | December 31, 2013 | |||||||||||||
Net sales | $ | 2,259.9 | $ | 2,187.4 | $ | 2,321.8 | $ | 1,937.7 | ||||||||
Operating income | $ | 134.4 | $ | 77.8 | $ | 12.9 | $ | 12.6 | ||||||||
Net income | $ | 82.1 | $ | 51.0 | $ | 3.0 | $ | (0.4 | ) | |||||||
Net income (loss) attributable to Delek | $ | 77.5 | $ | 46.6 | $ | (1.7 | ) | $ | (4.7 | ) | ||||||
Basic earnings (loss) per share | $ | 1.30 | $ | 0.79 | $ | (0.03 | ) | $ | (0.08 | ) | ||||||
Diluted earnings (loss) per share | $ | 1.28 | $ | 0.78 | $ | (0.03 | ) | $ | (0.08 | ) | ||||||
20. Subsequent Events
Dividend Declaration
On February 23, 2015, Delek's Board of Directors voted to declare a quarterly cash dividend of $0.15 per share, payable on March 24, 2015, to stockholders of record on March 10, 2015.
Share Repurchase Authorization
In 2015, our Board of Directors approved a new share repurchase authorization for $125.0 million that will expire on December 31, 2015. Shares under the program may be repurchased from time to time in the open market or through privately negotiated transactions, subject to market conditions and other factors.
F-41
SCHEDULE I
Delek US Holdings, Inc.
Parent Company Only
Condensed Balance Sheets
December 31, | ||||||||
2014 | 2013 | |||||||
(In millions, except share and per share data) | ||||||||
ASSETS | ||||||||
Current assets: | ||||||||
Cash and cash equivalents | $ | 186.9 | $ | 184.3 | ||||
Accounts receivable | 0.9 | 0.8 | ||||||
Interest receivable from subsidiaries | 2.1 | — | ||||||
Income tax receivable from subsidiaries | 14.0 | 44.7 | ||||||
Other current assets | 70.9 | 16.5 | ||||||
Total current assets | 274.8 | 246.3 | ||||||
Property, plant and equipment: | ||||||||
Property, plant and equipment | 28.4 | 23.5 | ||||||
Less: accumulated depreciation | (9.6 | ) | (4.7 | ) | ||||
Property, plant and equipment, net | 18.8 | 18.8 | ||||||
Notes receivable from related parties | 74.4 | 72.7 | ||||||
Investment in subsidiaries | 865.5 | 799.3 | ||||||
Deferred tax asset | — | 0.2 | ||||||
Other non-current assets | 2.3 | 0.5 | ||||||
Total assets | $ | 1,235.8 | $ | 1,137.8 | ||||
LIABILITIES AND SHAREHOLDERS’ EQUITY | ||||||||
Current liabilities: | ||||||||
Accounts payable | $ | 3.1 | $ | 6.4 | ||||
Accounts payable to subsidiaries | 74.6 | 64.7 | ||||||
Current portion of long-term debt and capital lease obligations | — | 18.3 | ||||||
Accrued expenses and other current liabilities | 24.5 | 7.9 | ||||||
Total current liabilities | 102.2 | 97.3 | ||||||
Non-current liabilities: | ||||||||
Long-term debt and capital lease obligations, net of current portion | 17.0 | — | ||||||
Notes payable to subsidiaries | 102.0 | 105.5 | ||||||
Deferred tax liabilities | 7.3 | — | ||||||
Other non-current liabilities | 5.6 | — | ||||||
Total non-current liabilities | 131.9 | 105.5 | ||||||
Shareholders’ equity: | ||||||||
Preferred stock, $0.01 par value, 10,000,000 shares authorized, no shares issued and outstanding | — | — | ||||||
Common stock, $0.01 par value, 110,000,000 shares authorized, 60,637,525 shares and 60,229,107 shares issued at December 31, 2014 and 2013, respectively | 0.6 | 0.6 | ||||||
Additional paid-in capital | 395.1 | 384.5 | ||||||
Accumulated other comprehensive loss | (12.6 | ) | (4.0 | ) | ||||
Treasury stock, 3,365,561 and 1,000,000 shares, at cost, as of December 31, 2014 and 2013, respectively. | (112.6 | ) | (37.9 | ) | ||||
Retained earnings | 731.2 | 591.8 | ||||||
Total shareholders’ equity | 1,001.7 | 935.0 | ||||||
Total liabilities and shareholders’ equity | $ | 1,235.8 | $ | 1,137.8 | ||||
The "Notes to Consolidated Financial Statements" of Delek US Holdings, Inc., beginning on page F-12 of this
Form 10-K are an integral part of these condensed financial statements.
F-42
Delek US Holdings, Inc.
Parent Company Only
Condensed Statements of Income
Year Ended December 31, | ||||||||||||
2014 | 2013 | 2012 | ||||||||||
(In millions) | ||||||||||||
Net sales | $ | — | $ | — | $ | — | ||||||
Operating costs and expenses: | ||||||||||||
Cost of goods sold | (81.1 | ) | 8.8 | (2.1 | ) | |||||||
General and administrative expenses | 50.9 | 40.8 | 31.1 | |||||||||
Depreciation and amortization | 4.9 | 3.4 | 0.9 | |||||||||
Total operating costs and expenses | (25.3 | ) | 53.0 | 29.9 | ||||||||
Operating income (loss) | 25.3 | (53.0 | ) | (29.9 | ) | |||||||
Interest expense | 0.6 | 1.8 | 5.1 | |||||||||
Interest income | (0.2 | ) | — | — | ||||||||
Net interest expense from related parties | 1.8 | 2.8 | 2.8 | |||||||||
Earnings from investment in subsidiaries | (181.1 | ) | (156.5 | ) | (289.6 | ) | ||||||
Total non-operating income, net | (178.9 | ) | (151.9 | ) | (281.7 | ) | ||||||
Income before income taxes | 204.2 | 98.9 | 251.8 | |||||||||
Income tax expense (benefit) | 5.6 | (18.8 | ) | (21.0 | ) | |||||||
Net income | $ | 198.6 | $ | 117.7 | $ | 272.8 | ||||||
The "Notes to Consolidated Financial Statements" of Delek US Holdings, Inc., beginning on page F-12 of this
Form 10-K are an integral part of these condensed financial statements.
F-43
Delek US Holdings, Inc.
Parent Company Only
Condensed Consolidated Statements of Comprehensive Income
Year Ended December 31, | ||||||||||||
2014 | 2013 | 2012 | ||||||||||
(In millions) | ||||||||||||
Net income attributable to Delek | $ | 198.6 | $ | 117.7 | $ | 272.8 | ||||||
Other comprehensive income: | ||||||||||||
Net loss on derivative instruments, net of tax benefit of $4.0, $2.9, and $0.7 for years ended December 31, 2014, 2013 and 2012, respectively, and net of ineffectiveness of $6.3, $(2.5) and $(0.8) for the years ended December 31, 2014, 2013 and 2012, respectively. | (8.3 | ) | (4.4 | ) | (1.4 | ) | ||||||
Foreign currency translation | $ | (0.3 | ) | $ | — | $ | — | |||||
Comprehensive income | $ | 190.0 | $ | 113.3 | $ | 271.4 | ||||||
The "Notes to Consolidated Financial Statements" of Delek US Holdings, Inc., beginning on page F-12 of this
Form 10-K are an integral part of these condensed financial statements.
F-44
Delek US Holdings, Inc.
Parent Company Only
Condensed Statements of Cash Flows
Year Ended December 31, | ||||||||||||
2014 | 2013 | 2012 | ||||||||||
(In millions) | ||||||||||||
Cash flows from operating activities: | ||||||||||||
Net income | $ | 198.6 | $ | 117.7 | $ | 272.8 | ||||||
Adjustments to reconcile net income to net cash provided by operating activities: | ||||||||||||
Depreciation and amortization | 4.9 | 3.4 | 0.9 | |||||||||
Amortization of deferred financing costs | 0.4 | 0.4 | 0.3 | |||||||||
Deferred income taxes | 12.8 | 12.1 | 4.9 | |||||||||
Equity-based compensation expense | 7.3 | 6.5 | 3.8 | |||||||||
Income tax benefit of equity-based compensation | (0.8 | ) | (4.7 | ) | (8.2 | ) | ||||||
Income from subsidiaries | (181.1 | ) | (156.5 | ) | (289.6 | ) | ||||||
Changes in assets and liabilities, net of acquisitions: | ||||||||||||
Accounts receivable, net | (0.1 | ) | (0.8 | ) | 0.5 | |||||||
Inventories and other current assets | 5.6 | (24.2 | ) | (17.3 | ) | |||||||
Market value of derivatives | (47.7 | ) | (5.3 | ) | 0.5 | |||||||
Receivables and payables from related parties | 6.5 | (8.6 | ) | 16.6 | ||||||||
Accounts payable and other current liabilities | 6.0 | (6.7 | ) | 12.3 | ||||||||
Non-current assets and liabilities, net | 7.8 | (6.4 | ) | (0.1 | ) | |||||||
Net cash provided by (used in) operating activities | 20.2 | (73.1 | ) | (2.6 | ) | |||||||
Cash flows from investing activities: | ||||||||||||
Business combinations | — | (5.1 | ) | — | ||||||||
Purchase of property, plant and equipment | (4.9 | ) | (8.0 | ) | (9.4 | ) | ||||||
Investment in subsidiaries | (24.3 | ) | (46.4 | ) | (23.5 | ) | ||||||
Dividends from subsidiaries | 155.3 | 317.2 | 83.1 | |||||||||
Distributions from subsidiaries | — | — | 50.0 | |||||||||
Net repayments of notes receivable from subsidiaries | (1.7 | ) | (27.7 | ) | — | |||||||
Net cash provided by investing activities | 124.4 | 230.0 | 100.2 | |||||||||
Cash flows from financing activities: | ||||||||||||
Proceeds from revolver | 57.0 | 12.0 | 8.5 | |||||||||
Payments on revolver | (50.0 | ) | (6.0 | ) | (4.5 | ) | ||||||
Repayment of note payable to related party | (11.8 | ) | — | (66.5 | ) | |||||||
Proceeds from notes payable to subsidiaries | — | — | 136.0 | |||||||||
Repayment of note payable to subsidiaries | — | (23.1 | ) | (21.0 | ) | |||||||
Repayments of other debt instruments | — | (29.1 | ) | (30.4 | ) | |||||||
Proceeds from exercise of stock options | 1.1 | 7.4 | 6.7 | |||||||||
Taxes paid due to the net settlement of equity-based compensation | (5.2 | ) | (5.0 | ) | (8.2 | ) | ||||||
Income tax benefit of equity-based compensation | 0.8 | 4.7 | 8.2 | |||||||||
Repurchase of common stock | (74.7 | ) | (37.9 | ) | — | |||||||
Dividends paid | (59.2 | ) | (57.3 | ) | (35.5 | ) | ||||||
Deferred financing costs paid | — | — | (0.4 | ) | ||||||||
Net cash used in financing activities | (142.0 | ) | (134.3 | ) | (7.1 | ) | ||||||
Net increase in cash and cash equivalents | 2.6 | 22.6 | 90.5 | |||||||||
Cash and cash equivalents at the beginning of the period | 184.3 | 161.7 | 71.2 | |||||||||
Cash and cash equivalents at the end of the period | $ | 186.9 | $ | 184.3 | $ | 161.7 | ||||||
The "Notes to Consolidated Financial Statements" of Delek US Holdings, Inc., beginning on page F-12 of this
Form 10-K are an integral part of these condensed financial statements.
F-45
SIGNATURES
Pursuant to the requirements of Section 13 or 15(d) of the Securities Exchange Act of 1934, the registrant has duly caused this report to be signed on its behalf by the undersigned, thereunto duly authorized.
Delek US Holdings, Inc.
By: /s/ Assaf Ginzburg
Assaf Ginzburg
Executive Vice President and Chief Financial Officer
(Principal Financial and Accounting Officer)
Dated: February 26, 2015
Pursuant to the requirements of the Securities Exchange Act of 1934, this report has been signed below by or on behalf of the following persons on behalf of the registrant and in the capacities indicated on February 26, 2015:
/s/ Ezra Uzi Yemin
Ezra Uzi Yemin
Director (Chairman), President and Chief Executive Officer
(Principal Executive Officer)
/s/ William J. Finnerty*
William J. Finnerty
Director
/s/ Carlos E. Jorda*
Carlos E. Jorda
Director
/s/ Charles H. Leonard*
Charles H. Leonard
Director
/s/ Shlomo Zhohar*
Shlomo Zhohar
Director
/s/ Assaf Ginzburg
Assaf Ginzburg
Executive Vice President and Chief Financial Officer
(Principal Financial and Accounting Officer)
*By: /s/ Assaf Ginzburg
Assaf Ginzburg
Individually and as Attorney-in-Fact
F-46
EXHIBIT INDEX
Exhibit No. | Description | |||
2.1 | ^ | Stock Purchase Agreement, dated March 17, 2011, by and among Ergon, Inc., Lion Oil Company and Delek US Holdings, Inc. (incorporated by reference to Exhibit 2.1 to the Company's Form 8-K filed on May 4, 2011). | ||
2.2 | ^ | First Amendment, dated April 29, 2011, to Stock Purchase Agreement, dated March 17, 2011, by and among Ergon, Inc., Lion Oil Company and Delek US Holdings, Inc. (incorporated by reference to Exhibit 2.2 to the Company's Form 8-K filed on May 4, 2011). | ||
2.3 | Contribution, Conveyance and Assumption Agreement, dated November 7, 2012, by and among Delek Logistics Partners, LP, Delek Logistics GP, LLC, Delek Logistics Operating, LLC, Delek Crude Logistics, LLC, Delek US Holdings, Inc., Delek Marketing & Supply, LLC, Delek Marketing and Supply, LP, Lion Oil Company and Delek Logistics Services Company (incorporated by reference to Exhibit 10.3 to the Company's Form 8-K filed on November 14, 2012). | |||
3.1 | Second Amended and Restated Certificate of Incorporation (incorporated by reference to Exhibit 3.1 to the Company's Form 10-Q filed on August 8, 2013). | |||
3.2 | Third Amended and Restated Bylaws (incorporated by reference to Exhibit 3.1 to the Company's Form 10-Q filed on August 7, 2014). | |||
4.1 | Specimen common stock certificate (incorporated by reference to Exhibit 4.1 to the Company's Registration Statement on Form S-1/A, filed on April 20, 2006, SEC File No. 333-131675). | |||
4.2 | Registration Rights Agreement, dated April 17, 2006, by and between Delek US Holdings, Inc. and Delek Group Ltd. (incorporated by reference to Exhibit 10.4 to the Company's Registration Statement on Form S-1/A, filed on April 20, 2006, SEC File No. 333-131675). | |||
10.1 | * | Employment Agreement, dated November 1, 2013, by and between Delek US Holdings, Inc. and Ezra Uzi Yemin (incorporated by reference to Exhibit 10.1 to the Company's Form 10-K filed on March 3, 2014). | ||
10.1(a) | * | Subscription Agreement, dated March 10, 2013, between Delek Logistics GP, LLC and Ezra Uzi Yemin (incorporated by reference to Exhibit 10.2 to the Company's Form 10-Q filed on May 9, 2013). | ||
10.1(b) | * | Subscription Agreement, dated December 10, 2013, between Delek Logistics GP, LLC and Ezra Uzi Yemin (incorporated by reference to Exhibit 10.1(b) to the Company's Form 10-K filed on March 3, 2014). | ||
10.2 | * | Employment Agreement, dated August 7, 2012, by and between Delek US Holdings, Inc. and Donald N. Holmes (incorporated by reference to Exhibit 10.2 to the Company's Form 10-Q filed on November 8, 2012). | ||
10.3 | * | Form of Indemnification Agreement for Directors and Officers (incorporated by reference to Exhibit 10.3 to the Company's Registration Statement on Form S-1/A, filed on April 20, 2006, SEC File No. 333-131675). | ||
10.6 | * | Delek US Holdings, Inc. 2006 Long-Term Incentive Plan (as amended through May 4, 2010) (incorporated by reference to Exhibit 10.1 to the Company's Form 10-Q filed on May 7, 2010). | ||
10.6(a) | * | Form of Delek US Holdings, Inc. 2006 Long-Term Incentive Plan Restricted Stock Unit Agreement (incorporated by reference to Exhibit 10.13(a) to the Company's Registration Statement on Form S-1/A, filed on April 20, 2006, SEC File No. 333-131675). | ||
10.6(b) | * | Director Form of Delek US Holdings, Inc. 2006 Long-Term Incentive Plan Stock Option Agreement (incorporated by reference to Exhibit 10.13(b) to the Company's Registration Statement on Form S-1/A, filed on April 20, 2006, SEC File No. 333-131675). | ||
10.6(c) | * | Officer Form of Delek US Holdings, Inc. 2006 Long-Term Incentive Plan Stock Option Agreement (incorporated by reference to Exhibit 10.13(c) to the Company's Registration Statement on Form S-1/A, filed on April 20, 2006, SEC File No. 333-131675). | ||
10.6(d) | * | Director Form of Delek US Holdings, Inc. 2006 Long-Term Incentive Plan Stock Appreciation Rights Agreement (incorporated by reference to Exhibit 10.5 to the Company's Form 10-Q filed on August 6, 2010). | ||
10.6(e) | * | Employee Form of Delek US Holdings, Inc. 2006 Long-Term Incentive Plan Stock Appreciation Rights Agreement (incorporated by reference to Exhibit 10.4 to the Company's Form 10-Q filed on August 6, 2010). | ||
10.6(f) | * | Form of Delek US Holdings, Inc. 2006 Long-Term Incentive Plan Performance Restricted Stock Unit Agreement (incorporated by reference to Exhibit 10.4 to the Company's Form 10-Q filed on August 7, 2014). | ||
10.7 | Tyler Throughput and Tankage Agreement, dated July 26, 2013, between Delek Refining, Ltd. and Delek Marketing & Supply, LP (incorporated by reference to Exhibit 10.1 to the Company's Form 8-K filed on August 1, 2013). | |||
F-47
10.8 | Pipelines and Tankage Agreement, dated November 7, 2012, by and between Delek Refining, Ltd. and Delek Crude Logistics, LLC (incorporated by reference to Exhibit 10.4 to the Company's Form 8-K filed on November 14, 2012). | |||
10.9 | Pipelines and Storage Facilities Agreement, dated November 7, 2012, by and among Lion Oil Company, Delek Logistics Partners, LP, SALA Gathering Systems, LLC, El Dorado Pipeline Company, LLC, Magnolia Pipeline Company, LLC and J. Aron & Company (incorporated by reference to Exhibit 10.5 to the Company's Form 8-K filed on November 14, 2012). | |||
10.10 | * | Employment Agreement, dated July 1, 2011, by and between Delek US Holdings, Inc. and Assaf Ginzburg (incorporated by reference to Exhibit 10.2 to the Company's Form 10-Q filed on November 9, 2011). | ||
10.10(a) | * | Subscription Agreement, dated March 10, 2013, between Delek Logistics GP, LLC and Assaf Ginzburg (incorporated by reference to Exhibit 10.3 to the Company's Form 10-Q filed on May 9, 2013). | ||
10.11 | * | Employment Agreement, dated as of November 1, 2011, by and between Delek US Holdings, Inc. and Frederec Green (incorporated by reference to Exhibit 10.14 to the Company's Form 10-K filed on March 14, 2012). | ||
10.11(a) | * | Subscription Agreement, dated March 10, 2013, between Delek Logistics GP, LLC and Frederec Green (incorporated by reference to Exhibit 10.4 to the Company's Form 10-Q filed on May 9, 2013). | ||
10.12 | Stock Repurchase Agreement, dated March 12, 2013, between Delek US Holdings, Inc. and Delek Hungary Holding Limited Liability Company (incorporated by reference to Exhibit 10.1 to the Company's Form 8-K filed on March 18, 2013). | |||
10.13 | * | Employment Agreement, dated November 1, 2011, by and between Delek US Holdings, Inc. and Mark B. Cox (incorporated by reference to Exhibit 10.16 to the Company's Form 10-K filed on March 14, 2012). | ||
10.13(a) | * | Separation of Employment / General Release, dated January 18, 2013, by and between Delek US Holdings, Inc. and Mark B. Cox (incorporated by reference to Exhibit 10.15(a) to the Company's Form 10-K filed on March 12, 2013). | ||
10.14 | * | Employment Agreement, dated November 1, 2011, by and between Delek US Holdings, Inc. and Harry P. (Pete) Daily (incorporated by reference to Exhibit 10.17 to the Company's Form 10-K filed on March 14, 2012). | ||
10.15 | * | Employment Agreement, dated November 1, 2011, by and between Delek US Holdings, Inc. and Kent B. Thomas (incorporated by reference to Exhibit 10.18 to the Company's Form 10-K filed on March 14, 2012). | ||
10.16 | ‡ | Amended and Restated Master Supply and Offtake Agreement, dated December 23, 2013, by and among J. Aron & Company, Lion Oil Company, and Lion Oil Trading & Transportation, LLC (incorporated by reference to Exhibit 10.18 to the Company's Form 10-K/A filed on June 26, 2014). | ||
10.17 | Amended and Restated Financing Agreement, dated December 18, 2013, among Lion Oil Company as borrower, certain subsidiaries of Lion Oil Company named therein as guarantors, Bank Hapoalim B.M. as collateral agent and lender, and Israel Discount Bank of New York as lender (incorporated by reference to Exhibit 10.1 to the Company's Form 8-K filed on December 20, 2013). | |||
10.17(a) | Amendment No. 1 to Amended and Restated Financing Agreement and Amendment No. 1 to Amended and Restated Parent Guaranty, dated June 23, 2014, among Lion Oil Company as borrower, certain subsidiaries of Lion Oil Company named therein as guarantors, Bank of Hapoalim B.M. as collateral agent and lender, Israel Discount Bank of New York as lender and Fifth Third Bank as lender (incorporated by reference to Exhibit 10.2 to the Company's Form 10-Q filed on August 7, 2014). | |||
10.18 | Amended and restated asset-backed revolving credit agreement dated January 16, 2014 by and between Delek Refining, Ltd. as borrower and a consortium of lenders including Wells Fargo Bank, National Association as administrative agent (incorporated by reference to Exhibit 10.1 to the Company's Form 10-Q filed on May 8, 2014). | |||
10.19 | El Dorado Throughput and Tankage Agreement, executed as of February 10, 2014, between Lion Oil Company and Delek Logistics Operating LLC, and, for limited purposes, J. Aron & Company (incorporated by reference to Exhibit 10.1 to the Form 8-K filed by the Company on February 14, 2014). | |||
10.20 | Second Amended and Restated Omnibus Agreement, dated as of February 10, 2014, among Delek US Holdings, Inc., Lion Oil Company, Delek Marketing & Supply, LP, Delek Refining, Ltd., Delek Logistics Partners, LP, Paline Pipeline Company, LLC, SALA Gathering Systems, LLC, Magnolia Pipeline Company, LLC, El Dorado Pipeline Company, LLC, Delek Crude Logistics, LLC, Delek Marketing-Big Sandy, LLC, Delek Logistics Operating, LLC and Delek Logistics GP, LLC (incorporated by reference to Exhibit 10.2 to the Form 8-K filed by the Company on February 14, 2014). | |||
10.21 | Third Amended and Restated Credit Agreement, dated May 6, 2014, between MAPCO Express, Inc. as borrower, Fifth Third Bank as arranger and administrative agent and a lender, Bank of America, N.A., as co-syndication Agent and a lender, BMO Capital Markets, as joint lead arranger and co-syndication agent, Regions Business Capital, as co-syndication agent and the lenders from time to time parties thereto (incorporated by reference to Exhibit 10.1 to the Form 10-Q filed by the Company on August 7, 2014). | |||
F-48
10.22 | Employment letter between Delek US Holdings, Inc. and Mark D. Smith dated April 22, 2014 (incorporated by reference to Exhibit 10.3 to the Form 10-Q filed by the Company on August 7, 2014). | |||
10.23 | Employment Agreement, dated November 6, 2012, by and between Delek US Holdings, Inc. and Dan L. Gordon (incorporated by reference to Exhibit 10.1 to the Form 10-Q filed by the Company on November 6, 2014). | |||
10.24 | Second Amended and Restated Credit Agreement, dated as of December 30, 2014, among Delek Logistics Partners, LP and each other borrower referenced therein, as borrowers, Fifth Third Bank, as administrative agent, and a syndicate of lenders (incorporated by reference to Exhibit 10.1 to the Form 8-K filed by the Company on January 6, 2015). | |||
21.1 | § | Subsidiaries of the Registrant | ||
23.1 | § | Consent of Ernst & Young LLP | ||
24.1 | § | Power of Attorney | ||
31.1 | § | Certification of the Company's Chief Executive Officer pursuant to Rule 13a-14(a)/15(d)-14(a) under the Securities Exchange Act. | ||
31.2 | § | Certification of the Company's Chief Financial Officer pursuant to Rule 13a-14(a)/15(d)-14(a) under the Securities Exchange Act. | ||
32.1 | § | Certification of the Company's Chief Executive Officer pursuant to 18 U.S.C. Section 1350, as adopted pursuant to Section 906 of the Sarbanes-Oxley Act of 2002. | ||
32.2 | § | Certification of the Company's Chief Financial Officer pursuant to 18 U.S.C. Section 1350, as adopted pursuant to Section 906 of the Sarbanes-Oxley Act of 2002. | ||
101 | The following materials from Delek US Holdings, Inc.’s Annual Report on Form 10-K for the annual period ended December 31, 2014, formatted in XBRL (eXtensible Business Reporting Language): (i) Consolidated Balance Sheets as of December 31, 2014 and 2013, (ii) Consolidated Statements of Income for the years ended December 31, 2014, 2013 and 2012, (iii) Consolidated Statements of Comprehensive Income for the years ended December 31, 2014, 2013 and 2012, (iv) Consolidated Statements of Changes in Stockholders’ Equity for the years ended December 31, 2014, 2013 and 2012, (v) Consolidated Statements of Cash Flows for the years ended December 31, 2014, 2013 and 2012 and (vi) Notes to Consolidated Financial Statements, tagged as blocks of text. | |||
_______________
* Management contract or compensatory plan or arrangement.
§ Filed herewith.
^ | Certain schedules have been omitted pursuant to Item 601(b)(2) of Regulation S-K. The Company agrees to supplementally furnish a copy of any of the omitted schedules to the United States Securities and Exchange Commission upon request. |
‡ Confidential treatment has been requested and granted with respect to certain portions of this exhibit
pursuant to Rule 24b-2 of the Securities Exchange Act of 1934, as amended. Omitted portions have
been filed separately with the United States Securities and Exchange Commission.
† | Confidential treatment has been requested with respect to certain portions of this exhibit pursuant to |
Rule 24b-2 of the Securities Exchange Act of 1934, as amended. Omitted portions have been filed
separately with the United States Securities and Exchange Commission.
F-49