Attached files
| file | filename |
|---|---|
| EX-10.2 - EXHIBIT 10.2 - PLANTRONICS INC /CA/ | q417ex102.htm |
| EX-10.1 - EXHIBIT 10.1 - PLANTRONICS INC /CA/ | q417ex101.htm |
| 8-K - 8-K - PLANTRONICS INC /CA/ | q4fy17earningsrelease8-k.htm |

PRESS RELEASE
INVESTOR CONTACT: Greg Klaben Vice President of Investor Relations (831) 458-7533 | MEDIA CONTACT: George Gutierrez Sr. Director, Global Communications & Content Strategy (831) 458-7537 |
Plantronics Announces Fourth Quarter & Fiscal Year 2017 Financial Results
Company Reports Improved Fourth Quarter Fiscal Year 2017 Enterprise Revenue Offset by Weaker than Expected Quarterly Consumer Revenue; Meets Operating Income and GAAP EPS Guidance and Exceeds Non-GAAP EPS Guidance
SANTA CRUZ, Calif., - May 1, 2017 - Plantronics, Inc. (NYSE: PLT) today announced fourth quarter and Fiscal Year 2017 financial results. Highlights of the fourth quarter include the following (comparisons are against the fourth quarter and full Fiscal Year 2016, as noted):
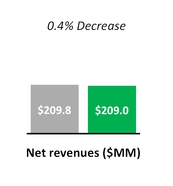
• | Net revenues were $209.0 million, a decrease of 0.4% compared with $209.8 million, and below our guidance range of $213 million to $223 million |
• | GAAP gross margin was 51.5% compared with 50.9% |
◦ | Non-GAAP gross margin was 51.9% compared with 51.3% |
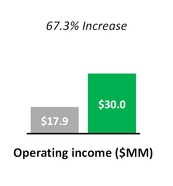
• | GAAP operating income was $30.0 million compared with $17.9 million |
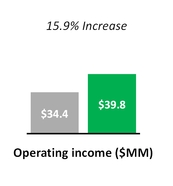
◦ | Non-GAAP operating income was $39.8 million compared with $34.4 million |
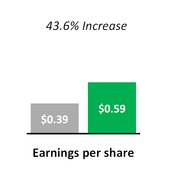
• | GAAP diluted earnings per share (“EPS”) was $0.59 compared with $0.39, and within our guidance range of $0.53 to $0.63 |
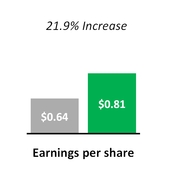
◦ | Non-GAAP diluted EPS was $0.81 compared with $0.64, and above our guidance range of $0.69 to $0.79 |
Year-over-year GAAP Results
Year-over-year Non-GAAP Results

1
Full Year GAAP Results
Full Year Non-GAAP Results

A reconciliation between our GAAP and non-GAAP results is provided in the tables at the end of this press release.
"We achieved our revenue and profitability targets for the fiscal year, and while fourth quarter Consumer product revenues were weaker than anticipated, we are pleased to have achieved better than expected 10% growth in Consumer revenues for the full year," stated Joe Burton, President and CEO. "We have a strong pipeline of products in all major categories, and are targeting an improved revenue growth rate for our Enterprise category in Fiscal Year 2018. The introduction of our Plantronics Manager Pro v3.9 software was met with an enthusiastic reception from both partners and Enterprise customers, and we believe our software offerings and vision provide a strategic advantage in the Enterprise market."
"We achieved our goal of improved Non-GAAP operating margins for Fiscal Year 2017, excluding an extraordinary $4.9 million litigation charge in the first quarter," stated Pam Strayer, Senior Vice President and Chief Financial Officer. "Excluding this charge, we improved our Non-GAAP operating margins by 50 basis points compared to the prior fiscal year. Throughout Fiscal Year 2017, our focus on improving efficiency and implementing cost reductions resulted in a substantially improved cost structure from the previous year; in part, this drove a 270 basis point improvement in Non-GAAP operating margins in the fourth quarter of Fiscal Year 2017 versus the prior year quarter. Through additional cost reduction activities taken in the fourth quarter of Fiscal Year 2017, we entered Fiscal Year 2018 well positioned to drive further Non-GAAP operating margin improvement of 50 to 100 basis points for the full fiscal year, while continuing to invest in several new growth opportunities, including software and Soundscaping.”
Financial Highlights for Fourth Quarter and Fiscal Year 2017:
Revenue
Total net revenues for the fourth quarter of Fiscal Year 2017 were $209.0 million, down 0.4%, or $0.8 million compared to the fourth quarter last year. Enterprise net revenues of $160.9 million were up 3%, or $4.7 million, driven by growth of revenue from Unified Communications headsets in the high teens. Consumer net revenues were $48.1 million, down 10%, or $5.5 million, primarily driven by a larger than anticipated seasonal decline in both mono and stereo Bluetooth headset sales.
2
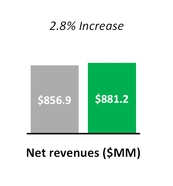
Total net revenues for Fiscal Year 2017 were $881.2 million, up 3% or $24.3 million compared to Fiscal Year 2016. Enterprise revenues increased slightly for the fiscal year.
Consumer product revenues increased 10% or $22.3 million as a result of improved sales of our BackBeat FIT stereo Bluetooth products and a refreshed gaming portfolio.
Revenues in the Americas region were down 5%, or $6.1 million for the quarter, and up 3%, or $14.7 million for the fiscal year. Revenues in the Europe and Africa region were up 8%, or $4.4 million for the quarter, and up 4%, or $9.0 million for the fiscal year. Compared to the prior year, revenues in the Asia Pacific region were up slightly for both the quarter and full year.
Restructuring Activities
In the fourth quarter of Fiscal Year 2017, the Company took additional cost reduction actions, resulting in a charge of $1.2 million, which when complete, are expected to result in approximately $3 million in annual cost savings.
Operating Income
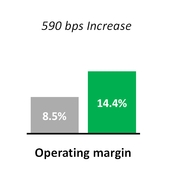
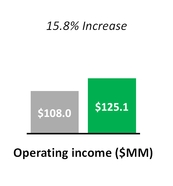
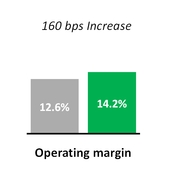
GAAP operating income for the fourth quarter was $30.0 million, an increase of 67.3%, or $12.1 million from the prior year quarter. As a percentage of revenues, GAAP operating income for the fourth quarter was 14.4%, compared to 8.5% in the prior year quarter. GAAP operating income for Fiscal Year 2017 was $125.1 million, an increase of 15.8%, or $17.0 million from Fiscal Year 2016. As a percentage of revenues, GAAP operating income for Fiscal Year 2017 was 14.2%, compared to 12.6% in Fiscal Year 2016.
The increase in GAAP operating income in both the quarter and Fiscal Year 2017 was driven primarily by a reduction in restructuring expenses.
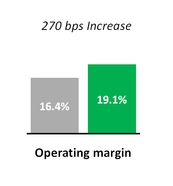
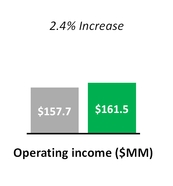
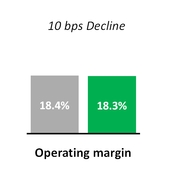
Non-GAAP operating income for the fourth quarter was $39.8 million, an increase of 15.9%, or $5.5 million. As a percentage of revenue, Non-GAAP operating income for the fourth quarter was 19.1%, compared to 16.4% in the prior year quarter. Non-GAAP operating income for Fiscal Year 2017 was $161.5 million, an increase of 2.4%, or $3.8 million. As a percentage of revenue, Non-GAAP operating income for Fiscal Year 2017 was 18.3%, compared to 18.4% in Fiscal Year 2016.
The $4.9 million extraordinary litigation charge taken in the first quarter of Fiscal Year 2017 had a negative 60 basis point impact on our full year Non-GAAP operating margin.
Earnings Per Share
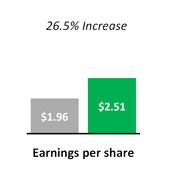
GAAP diluted EPS for the fourth quarter was $0.59, up $0.20 and 51.3% compared to the prior year quarter. GAAP diluted EPS for Fiscal Year 2017 was $2.51, up $0.55 and 28.1% compared to Fiscal Year 2016.
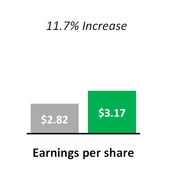
Non-GAAP diluted EPS for the fourth quarter was $0.81, up $0.17 and 26.6% compared to the prior year quarter. Non-GAAP diluted EPS for Fiscal Year 2017 was $3.17, up $0.35 and 12.4% compared to Fiscal Year 2016.
GAAP diluted EPS and Non-GAAP diluted EPS for Fiscal Year 2017 were positively impacted by $0.14 and $0.18, respectively, as a result of share repurchases made over the past year. We repurchased approximately 765,000 shares in Fiscal Year 2017 for approximately $34 million and approximately 9 million shares in Fiscal Year 2016 for approximately $497 million, for which the fully weighted impact reduced our weighted average outstanding shares in Fiscal Year 2017.
Balance Sheet and Cash Flow Highlights
We finished the fourth quarter of Fiscal Year 2017 with $607 million in cash and investments and generated $51 million in cash flow from operations during the quarter. Cash flow from operations increased by $8 million compared to the prior year quarter, driven by higher net income adjusted for non-cash items and partially offset by higher accounts receivable and lower accrued income tax balances compared to the prior year.
Of the $607 million in cash and investments at the end of the fourth quarter of Fiscal Year 2017, $48 million was held domestically.
Capital Expenditures were $3.6 million for the fourth quarter and $23.2 million for Fiscal Year 2017. Significant capital expenditures included the completion of a new European Smarter Working office in the Netherlands. Our long-term expectation for capital expenditures is approximately 2.5% of revenues.
3
Plantronics Announces Quarterly Dividend of $0.15
We are also announcing that we have declared a quarterly dividend of $0.15 per common share, to be paid on June 9, 2017 to all shareholders of record as of the close of business on May 19, 2017.
Upcoming Events
Plantronics will be presenting at the JP Morgan Global TMT Conference on May 24th and the R.W. Baird Global Consumer, Technology & Services Conference on June 7. Information on how to access the presentation webcast can be found at investor.plantronics.com under Upcoming Events.
Business Outlook
The following statements are based on our current expectations and many of these statements are forward-looking. Actual results are subject to a variety of risks and uncertainties and may differ materially from our expectations.
We have a “book and ship” business model whereby we fulfill the majority of orders received within 48 hours of receipt of those orders. However, our backlog is occasionally subject to cancellation or rescheduling by our customers on short notice with little or no penalty. Therefore, there is a lack of meaningful correlation between backlog at the end of a fiscal period and net revenues in a succeeding fiscal period.
Our business is inherently difficult to forecast, particularly with continuing uncertainty in regional economic conditions and currency fluctuations, and there can be no assurance that expectations of incoming orders over the balance of the current quarter will materialize.
Subject to the foregoing, we currently expect the following range of financial results for the first quarter of Fiscal Year 2018 (all amounts assuming currency rates remain stable):
• | Net revenues of $211 million to $221 million; |
• | GAAP operating income of $28 million to $33 million; |
• | Non-GAAP operating income of $37 million to $42 million, excluding the impact of $9 million from stock-based compensation. |
• | Assuming approximately 33 million diluted average weighted shares outstanding: |
• | GAAP diluted EPS of $0.52 to $0.62; |
• | Non-GAAP diluted EPS of $0.70 to $0.80; and |
• | Cost of stock-based compensation and GAAP only related tax charges to be approximately $0.18 per diluted share. |
Please see our updated Investor Relations Presentation available on our corporate website at investor.plantronics.com.
Conference Call and Prepared Remarks
Plantronics is providing a copy of prepared remarks in combination with its press release. These remarks are offered to provide shareholders and analysts with additional time and detail for analyzing results in advance of our quarterly conference call. The remarks will be available in the Investor Relations section of our website along with this press release.
We have scheduled a conference call to discuss fourth quarter and Fiscal Year 2017 financial results. The conference call will take place today, May 1, 2017 at 6:00 AM (Pacific Time). All interested investors and potential investors in our stock are invited to participate. To listen to the call, please dial in five to ten minutes prior to the scheduled starting time and refer to the “Plantronics Conference Call.” The dial-in from North America is (888) 301-8736 and the international dial-in is (706) 634-7260.
A replay of the call with the conference ID #97341960 will be available until June 1, 2017 at (855) 859-2056 or (800) 585-8367 for callers from North America and at (404) 537-3406 for all other callers. The conference call will also be simultaneously webcast in the Investor Relations section of our corporate website at investor.plantronics.com, and the webcast of the conference call will remain available on our website for one month. A reconciliation between our GAAP and non-GAAP results is provided in the tables at the end of this press release.
4
Use of Non-GAAP Financial Information
To supplement our condensed consolidated financial statements presented on a GAAP basis, we use non-GAAP measures of operating results, including non-GAAP operating income, non-GAAP net income and non-GAAP diluted EPS which exclude certain non-cash expenses and charges that are included in the most directly comparable GAAP measure. These non-cash charges and expenses include stock-based compensation related to stock options, restricted stock and employee stock purchases made under our employee stock purchase plan, purchase accounting amortization, restructuring and other related charges and credits, and executive transition charges, all net of the associated tax impact, tax benefits from the release of tax reserves, transfer pricing, tax deduction and tax credit adjustments, and the impact of tax law changes. We exclude these expenses from our non-GAAP measures primarily because management does not believe they are part of our target operating model. We believe that the use of non-GAAP financial measures provides meaningful supplemental information regarding our performance and liquidity and helps investors compare actual results with our long-term target operating model goals. We believe that both management and investors benefit from referring to these non-GAAP financial measures in assessing our performance and when planning, forecasting and analyzing future periods; however, non-GAAP financial measures are not meant to be considered in isolation or as a substitute for, or superior to, gross margin, operating income, operating margin, net income or EPS prepared in accordance with GAAP.
Safe Harbor
This release contains forward-looking statements within the meaning of Section 27A of the Securities Act of 1933, as amended, and Section 21E of the Securities Exchange Act of 1934, as amended, including statements relating to: (i) our belief in our product pipeline; (ii) our expectations for improved revenue growth in Fiscal Year 2018; (iii) our belief that our software offerings and vision provide a strategic advantage; (iv) our ability to improve our Non-GAAP operating margin for Fiscal Year 2018; (iv) the impact of cost reduction activities in the fourth quarter of Fiscal Year 2017; (v) our expectations for long-term capital expenditures; (vi) estimates of GAAP and non-GAAP financial results for the first quarter of Fiscal Year 2018, including net revenues, operating income and diluted EPS; (vii) our estimates of stock-based compensation, as well as the impact of non-cash expenses on Non-GAAP operating income and diluted EPS for the first quarter of Fiscal Year 2018; and (vii) our estimate of weighted average shares outstanding for the first quarter of Fiscal Year 2018, in addition to other matters discussed in this press release that are not purely historical data. We do not assume any obligation to update or revise any such forward-looking statements, whether as the result of new developments or otherwise.
Forward-looking statements involve risks and uncertainties that may cause actual results to differ materially from those contemplated by such statements. Among the factors that could cause actual results to differ materially from those contemplated are:
• | Micro and macro-economic conditions in our domestic and international markets; |
• | our ability to realize and achieve positive financial results projected to arise in the Enterprise market from UC adoption could be adversely affected by a variety of factors including the following: (i) as UC becomes more widely adopted, the risk that competitors will offer solutions that will effectively commoditize our headsets which, in turn, will reduce the sales prices for our headsets; (ii) our plans are dependent upon adoption of our UC solution by major platform providers and strategic partners such as Microsoft Corporation, Cisco Systems, Inc., Avaya, Inc., Alcatel-Lucent, and Huawei, and our influence over such providers with respect to the functionality of their platforms or their product offerings, their rate of deployment, and their willingness to integrate their platforms and product offerings with our solutions is limited; (iii) delays or limitations on our ability to timely introduce solutions that are cost effective, feature-rich, stable, and attractive to our customers within forecasted development budgets; (iv) our successful implementation and execution of new and different processes involving the design, development, and manufacturing of complex electronic systems composed of hardware, firmware, and software that works seamlessly and continuously in a wide variety of environments and with multiple devices; (v) failure of UC solutions generally, or our solutions in particular, to be adopted with the breadth and speed we anticipate (vi) our sales model and expertise must successfully evolve to support complex integration of hardware and software with UC infrastructure consistent with changing customer purchasing expectations; (vii) as UC becomes more widely adopted we anticipate that competition for market share will increase, particularly given that some competitors may have superior technical and economic resources; (vii) (viii) sales cycles for more complex UC deployments are longer as compared to our traditional Enterprise products; (ix) our inability to timely and cost-effectively adapt to changing business requirements may impact our profitability in this market and our overall margins; and (x) our failure to expand our technical support capabilities to support the complex and proprietary platforms in which our UC products are and will be integrated; |
• | failure to match production to demand given long lead times and the difficulty of forecasting unit volumes and acquiring the component parts and materials to meet demand without having excess inventory or incurring cancellation charges; |
• | volatility in prices from our suppliers, including our manufacturers located in China, have in the past and could in the future negatively affect our profitability and/or market share; |
5
• | fluctuations in foreign exchange rates; |
• | with respect to our stock repurchase program, prevailing stock market conditions generally, and the price of our stock specifically; |
• | the bankruptcy or financial weakness of distributors or key customers, or the bankruptcy of or reduction in capacity of our key suppliers; |
• | additional risk factors including: interruption in the supply of sole-sourced critical components, continuity of component supply at costs consistent with our plans, and the inherent risks of our substantial foreign operations; and |
• | seasonality in one or more of our product categories. |
For more information concerning these and other possible risks, please refer to our Annual Report on Form 10-K filed with the Securities and Exchange Commission on May 16, 2016 and other filings with the Securities and Exchange Commission, as well as recent press releases. The Securities and Exchange Commission filings can be accessed over the Internet at http://www.sec.gov/edgar/searchedgar/companysearch.html.
Financial Summaries
The following related charts are provided:
• |
• |
• |
About Plantronics
Plantronics is a global leader in audio communications for businesses and consumers. We have pioneered new trends in audio technology for over 50 years, creating innovative products that allow people to simply communicate. From Unified Communication solutions to Bluetooth headsets, we deliver uncompromising quality, an ideal experience, and extraordinary service. Plantronics is used by every company in the Fortune 100, as well as 911 dispatch, air traffic control and the New York Stock Exchange. For more information, please visit www.plantronics.com or call (800) 544-4660.
Plantronics is a registered trademark of Plantronics, Inc. The Bluetooth name and the Bluetooth trademarks are owned by Bluetooth SIG, Inc. and are used by Plantronics, Inc. under license. All other trademarks are the property of their respective owners.
PLANTRONICS, INC. / 345 Encinal Street / P.O. Box 1802 / Santa Cruz, California 95061-1802
831-426-6060 / Fax 831-426-6098
6
PLANTRONICS, INC. | |||||||||||||||||
SUMMARY CONDENSED CONSOLIDATED FINANCIAL STATEMENTS | |||||||||||||||||
($ in thousands, except per share data) | |||||||||||||||||
UNAUDITED CONSOLIDATED STATEMENTS OF OPERATIONS | |||||||||||||||||
Three Months Ended | Twelve Months Ended | ||||||||||||||||
March 31, | March 31, | ||||||||||||||||
2016 | 2017 | 2016 | 2017 | ||||||||||||||
Net revenues | $ | 209,797 | $ | 208,954 | $ | 856,907 | $ | 881,176 | |||||||||
Cost of revenues | 102,967 | 101,283 | 422,233 | 439,806 | |||||||||||||
Gross profit | 106,830 | 107,671 | 434,674 | 441,370 | |||||||||||||
Gross profit % | 50.9 | % | 51.5 | % | 50.7 | % | 50.1 | % | |||||||||
Research, development, and engineering | 23,794 | 22,202 | 90,408 | 88,318 | |||||||||||||
Selling, general, and administrative | 57,610 | 54,249 | 221,299 | 223,830 | |||||||||||||
(Gain) loss, net from litigation settlements | (236 | ) | (32 | ) | (1,234 | ) | 4,255 | ||||||||||
Restructuring and other related charges (credits) | 7,727 | 1,241 | 16,160 | (109 | ) | ||||||||||||
Total operating expenses | 88,895 | 77,660 | 326,633 | 316,294 | |||||||||||||
Operating income | 17,935 | 30,011 | 108,041 | 125,076 | |||||||||||||
Operating income % | 8.5 | % | 14.4 | % | 12.6 | % | 14.2 | % | |||||||||
Interest expense | (7,871 | ) | (7,363 | ) | (25,149 | ) | (29,230 | ) | |||||||||
Other non-operating income and (expense), net | 1,309 | 1,700 | (716 | ) | 5,819 | ||||||||||||
Income before income taxes | 11,373 | 24,348 | 82,176 | 101,665 | |||||||||||||
Income tax expense | (1,607 | ) | 4,831 | 13,784 | 19,066 | ||||||||||||
Net income | $ | 12,980 | $ | 19,517 | $ | 68,392 | $ | 82,599 | |||||||||
% of net revenues | 6.2 | % | 9.3 | % | 8.0 | % | 9.4 | % | |||||||||
Earnings per common share: | |||||||||||||||||
Basic | $ | 0.40 | $ | 0.60 | $ | 2.00 | $ | 2.56 | |||||||||
Diluted | $ | 0.39 | $ | 0.59 | $ | 1.96 | $ | 2.51 | |||||||||
Shares used in computing earnings per common share: | |||||||||||||||||
Basic | 32,466 | 32,334 | 34,127 | 32,279 | |||||||||||||
Diluted | 33,038 | 33,056 | 34,938 | 32,963 | |||||||||||||
Effective tax rate | (14.1 | )% | 19.8 | % | 16.8 | % | 18.8 | % | |||||||||
7
PLANTRONICS, INC. | |||||||||
SUMMARY CONDENSED CONSOLIDATED FINANCIAL STATEMENTS | |||||||||
($ in thousands) | |||||||||
UNAUDITED CONSOLIDATED BALANCE SHEETS | |||||||||
March 31, | March 31, | ||||||||
2016 | 2017 | ||||||||
ASSETS | |||||||||
Cash and cash equivalents | $ | 235,266 | $ | 301,970 | |||||
Short-term investments | 160,051 | 178,179 | |||||||
Total cash, cash equivalents, and short-term investments | 395,317 | 480,149 | |||||||
Accounts receivable, net | 128,219 | 141,177 | |||||||
Inventory, net | 53,162 | 55,456 | |||||||
Other current assets | 20,297 | 22,195 | |||||||
Total current assets | 596,995 | 698,977 | |||||||
Long-term investments | 145,623 | 127,176 | |||||||
Property, plant, and equipment, net | 149,735 | 150,307 | |||||||
Goodwill and purchased intangibles, net | 15,827 | 15,577 | |||||||
Deferred tax and other assets | 25,257 | 25,122 | |||||||
Total assets | $ | 933,437 | $ | 1,017,159 | |||||
LIABILITIES AND STOCKHOLDERS' EQUITY | |||||||||
Accounts payable | $ | 39,133 | $ | 42,885 | |||||
Accrued liabilities | 68,302 | 74,285 | |||||||
Total current liabilities | 107,435 | 117,170 | |||||||
Long-term debt, net of issuance costs | 489,609 | 491,059 | |||||||
Long-term income taxes payable | 11,968 | 11,729 | |||||||
Other long-term liabilities | 12,026 | 15,045 | |||||||
Total liabilities | 621,038 | 635,003 | |||||||
Stockholders' equity | 312,399 | 382,156 | |||||||
Total liabilities and stockholders' equity | $ | 933,437 | $ | 1,017,159 | |||||
8
PLANTRONICS, INC. | |||||||||||||||||
SUMMARY CONDENSED CONSOLIDATED FINANCIAL STATEMENTS | |||||||||||||||||
($ in thousands, except per share data) | |||||||||||||||||
UNAUDITED CONSOLIDATED STATEMENTS OF CASH FLOWS | |||||||||||||||||
Three Months Ended | Twelve Months Ended | ||||||||||||||||
March 31, | March 31, | ||||||||||||||||
2016 | 2017 | 2016 | 2017 | ||||||||||||||
Cash flows from operating activities | |||||||||||||||||
Net Income | $ | 12,980 | $ | 19,517 | $ | 68,392 | $ | 82,599 | |||||||||
Adjustments to reconcile net income to net cash provided by operating activities: | |||||||||||||||||
Depreciation and amortization | 5,304 | 5,353 | 20,142 | 20,977 | |||||||||||||
Amortization of debt issuance cost | 363 | 363 | 1,208 | 1,450 | |||||||||||||
Stock-based compensation | 8,666 | 8,534 | 33,265 | 33,539 | |||||||||||||
Excess tax benefit from stock-based compensation | (240 | ) | (397 | ) | (3,540 | ) | (1,416 | ) | |||||||||
Deferred income taxes | (10,343 | ) | 96 | (8,291 | ) | (657 | ) | ||||||||||
Provision for excess and obsolete inventories | 1,111 | 668 | 2,430 | 1,960 | |||||||||||||
Restructuring charges (credits) | 7,727 | 1,241 | 16,160 | (109 | ) | ||||||||||||
Cash payments for restructuring charges | (10,385 | ) | (208 | ) | (10,385 | ) | (4,001 | ) | |||||||||
Other operating activities | (680 | ) | (280 | ) | 9,519 | 1,486 | |||||||||||
Changes in assets and liabilities: | |||||||||||||||||
Accounts receivable, net | 7,166 | (446 | ) | 8,445 | (13,894 | ) | |||||||||||
Inventory, net | 1,709 | 2,199 | 1,357 | (3,791 | ) | ||||||||||||
Current and other assets | 1,990 | 3,488 | (2,444 | ) | 9 | ||||||||||||
Accounts payable | (337 | ) | 751 | 5,407 | 4,377 | ||||||||||||
Accrued liabilities | 8,972 | 9,908 | 4,998 | 16,099 | |||||||||||||
Income taxes | 8,843 | 484 | 206 | (657 | ) | ||||||||||||
Cash provided by operating activities | 42,846 | 51,271 | 146,869 | 137,971 | |||||||||||||
Cash flows from investing activities | |||||||||||||||||
Proceeds from sale of investments | 45,627 | 13,435 | 102,517 | 157,066 | |||||||||||||
Proceeds from maturities of investments | 45,269 | 46,839 | 97,164 | 144,092 | |||||||||||||
Purchase of investments | (94,510 | ) | (52,943 | ) | (300,620 | ) | (300,434 | ) | |||||||||
Capital expenditures | (9,684 | ) | (3,573 | ) | (30,661 | ) | (23,176 | ) | |||||||||
Cash (used for) provided by investing activities | (13,298 | ) | 3,758 | (131,600 | ) | (22,452 | ) | ||||||||||
Cash flows from financing activities | |||||||||||||||||
Repurchase of common stock | (14,617 | ) | — | (497,393 | ) | (34,236 | ) | ||||||||||
Employees' tax withheld and paid for restricted stock and restricted stock units | (264 | ) | (292 | ) | (11,068 | ) | (9,736 | ) | |||||||||
Proceeds from issuances under stock-based compensation plans | 5,530 | 8,686 | 15,384 | 15,202 | |||||||||||||
Proceeds from revolving line of credit | — | — | 155,749 | — | |||||||||||||
Repayments of revolving line of credit | — | — | (190,249 | ) | — | ||||||||||||
Proceeds from bonds issuance, net | — | — | 488,401 | — | |||||||||||||
Payment of cash dividends | (5,027 | ) | (5,012 | ) | (21,061 | ) | (19,959 | ) | |||||||||
Excess tax benefit from stock-based compensation | 240 | 397 | 3,540 | 1,416 | |||||||||||||
Other financing activities | — | — | — | 761 | |||||||||||||
Cash (used for) provided by financing activities | (14,138 | ) | 3,779 | (56,697 | ) | (46,552 | ) | ||||||||||
Effect of exchange rate changes on cash and cash equivalents | 765 | 701 | (156 | ) | (2,263 | ) | |||||||||||
Net increase (decrease) in cash and cash equivalents | 16,175 | 59,509 | (41,584 | ) | 66,704 | ||||||||||||
Cash and cash equivalents at beginning of period | 219,091 | 242,461 | 276,850 | 235,266 | |||||||||||||
Cash and cash equivalents at end of period | $ | 235,266 | $ | 301,970 | $ | 235,266 | $ | 301,970 | |||||||||
9
PLANTRONICS, INC. | ||||||||||||||||
UNAUDITED RECONCILIATIONS OF GAAP MEASURES TO NON-GAAP MEASURES | ||||||||||||||||
($ in thousands, except per share data) | ||||||||||||||||
UNAUDITED CONSOLIDATED STATEMENTS OF OPERATIONS DATA | ||||||||||||||||
Three Months Ended | Twelve Months Ended | |||||||||||||||
March 31, | March 31, | |||||||||||||||
2016 | 2017 | 2016 | 2017 | |||||||||||||
GAAP Gross profit | $ | 106,830 | $ | 107,671 | $ | 434,674 | $ | 441,370 | ||||||||
Stock-based compensation | 837 | 830 | 3,306 | 3,244 | ||||||||||||
Non-GAAP Gross profit | $ | 107,667 | $ | 108,501 | $ | 437,980 | $ | 444,614 | ||||||||
Non-GAAP Gross profit % | 51.3 | % | 51.9 | % | 51.1 | % | 50.5 | % | ||||||||
GAAP Research, development, and engineering | $ | 23,794 | $ | 22,202 | $ | 90,408 | $ | 88,318 | ||||||||
Stock-based compensation | (2,644 | ) | (1,953 | ) | (9,908 | ) | (8,616 | ) | ||||||||
Purchase accounting amortization | (63 | ) | (63 | ) | (250 | ) | (250 | ) | ||||||||
Non-GAAP Research, development, and engineering | $ | 21,087 | $ | 20,186 | $ | 80,250 | $ | 79,452 | ||||||||
GAAP Selling, general, and administrative | $ | 57,610 | $ | 54,249 | $ | 221,299 | $ | 223,830 | ||||||||
Stock-based compensation | (5,185 | ) | (5,751 | ) | (20,051 | ) | (21,679 | ) | ||||||||
Executive transition costs | — | — | — | (2,759 | ) | |||||||||||
Non-GAAP Selling, general, and administrative | $ | 52,425 | $ | 48,498 | $ | 201,248 | $ | 199,392 | ||||||||
GAAP Operating expenses | $ | 88,895 | $ | 77,660 | $ | 326,633 | $ | 316,294 | ||||||||
Stock-based compensation | (7,829 | ) | (7,704 | ) | (29,959 | ) | (30,295 | ) | ||||||||
Executive transition costs | — | — | — | (2,759 | ) | |||||||||||
Purchase accounting amortization | (63 | ) | (63 | ) | (250 | ) | (250 | ) | ||||||||
Restructuring and other related charges (credits) | (7,727 | ) | (1,241 | ) | (16,160 | ) | 109 | |||||||||
Non-GAAP Operating expenses | $ | 73,276 | $ | 68,652 | $ | 280,264 | $ | 283,099 | ||||||||
10
PLANTRONICS, INC. | ||||||||||||||||||||
UNAUDITED RECONCILIATIONS OF GAAP MEASURES TO NON-GAAP MEASURES | ||||||||||||||||||||
($ in thousands, except per share data) | ||||||||||||||||||||
UNAUDITED CONSOLIDATED STATEMENTS OF OPERATIONS DATA (CONTINUED) | ||||||||||||||||||||
Three Months Ended | Twelve Months Ended | |||||||||||||||||||
March 31, | March 31, | |||||||||||||||||||
2016 | 2017 | 2016 | 2017 | |||||||||||||||||
GAAP Operating income | $ | 17,935 | $ | 30,011 | $ | 108,041 | $ | 125,076 | ||||||||||||
Stock-based compensation | 8,666 | 8,534 | 33,265 | 33,539 | ||||||||||||||||
Executive transition costs | — | — | — | 2,759 | ||||||||||||||||
Purchase accounting amortization | 63 | 63 | 250 | 250 | ||||||||||||||||
Restructuring and other related charges (credits) | 7,727 | 1,241 | 16,160 | (109 | ) | |||||||||||||||
Non-GAAP Operating income | $ | 34,391 | $ | 39,849 | $ | 157,716 | $ | 161,515 | ||||||||||||
GAAP Net income | $ | 12,980 | $ | 19,517 | $ | 68,392 | $ | 82,599 | ||||||||||||
Stock-based compensation | 8,666 | 8,534 | 33,265 | 33,539 | ||||||||||||||||
Executive transition costs | — | — | — | 2,759 | ||||||||||||||||
Purchase accounting amortization | 63 | 63 | 250 | 250 | ||||||||||||||||
Restructuring and other related charges (credits) | 7,727 | 1,241 | 16,160 | (109 | ) | |||||||||||||||
Income tax effect of above items | (6,004 | ) | (2,202 | ) | (14,547 | ) | (11,806 | ) | ||||||||||||
Income tax effect of unusual tax items | (2,386 | ) | (1 | ) | (479 | ) | (2 | ) | (4,976 | ) | (1 | ) | (2,620 | ) | (2 | ) | ||||
Non-GAAP Net income | $ | 21,046 | $ | 26,674 | $ | 98,544 | $ | 104,612 | ||||||||||||
GAAP Diluted earnings per common share | $ | 0.39 | $ | 0.59 | $ | 1.96 | $ | 2.51 | ||||||||||||
Stock-based compensation | 0.26 | 0.26 | 0.95 | 1.02 | ||||||||||||||||
Executive transition costs | — | — | — | 0.08 | ||||||||||||||||
Restructuring and other related charges (credits) | 0.23 | 0.04 | 0.46 | — | ||||||||||||||||
Income tax effect | (0.24 | ) | (0.08 | ) | (0.55 | ) | (0.44 | ) | ||||||||||||
Non-GAAP Diluted earnings per common share | $ | 0.64 | $ | 0.81 | $ | 2.82 | $ | 3.17 | ||||||||||||
Shares used in diluted earnings per common share calculation | 33,038 | 33,056 | 34,938 | 32,963 | ||||||||||||||||
(1) | Excluded amounts represent tax benefits from the release of tax reserves and federal return to provision adjustments. |
(2) | Excluded amounts represent tax benefits from the release of tax reserves and the impact of tax law changes. |
11
Summary of Unaudited Reconciliations of GAAP Measures to Non-GAAP Measures and other Unaudited GAAP Data | |||||||||||||||||||||||||||||||||
($ in thousands, except per share data) | |||||||||||||||||||||||||||||||||
Q116 | Q216 | Q316 | Q416 | Q117 | Q217 | Q317 | Q417 | ||||||||||||||||||||||||||
GAAP Gross profit | $ | 107,358 | $ | 110,970 | $ | 109,516 | $ | 106,830 | $ | 113,073 | $ | 110,446 | $ | 110,180 | $ | 107,671 | |||||||||||||||||
Stock-based compensation | 779 | 879 | 811 | 837 | 842 | 778 | 794 | 830 | |||||||||||||||||||||||||
Non-GAAP Gross profit | $ | 108,137 | $ | 111,849 | $ | 110,327 | $ | 107,667 | $ | 113,915 | $ | 111,224 | $ | 110,974 | $ | 108,501 | |||||||||||||||||
Non-GAAP Gross profit % | 52.4 | % | 52.0 | % | 48.9 | % | 51.3 | % | 51.1 | % | 51.4 | % | 47.6 | % | 51.9 | % | |||||||||||||||||
GAAP Operating expenses | $ | 77,996 | $ | 76,874 | $ | 82,868 | $ | 88,895 | $ | 81,822 | $ | 78,490 | $ | 78,322 | $ | 77,660 | |||||||||||||||||
Stock-based compensation | (7,271 | ) | (7,953 | ) | (6,906 | ) | (7,829 | ) | (7,571 | ) | (7,125 | ) | (7,895 | ) | (7,704 | ) | |||||||||||||||||
Executive transition costs | — | — | — | — | — | (2,759 | ) | — | — | ||||||||||||||||||||||||
Purchase accounting amortization | (62 | ) | (63 | ) | (62 | ) | (63 | ) | (62 | ) | (63 | ) | (62 | ) | (63 | ) | |||||||||||||||||
Restructuring and other related charges (credits) | — | — | (8,433 | ) | (7,727 | ) | 1,048 | 415 | (113 | ) | (1,241 | ) | |||||||||||||||||||||
Non-GAAP Operating expenses | $ | 70,663 | $ | 68,858 | $ | 67,467 | $ | 73,276 | $ | 75,237 | $ | 68,958 | $ | 70,252 | $ | 68,652 | |||||||||||||||||
GAAP Operating income | $ | 29,362 | $ | 34,096 | $ | 26,648 | $ | 17,935 | $ | 31,251 | $ | 31,956 | $ | 31,858 | $ | 30,011 | |||||||||||||||||
Stock-based compensation | 8,050 | 8,832 | 7,717 | 8,666 | 8,413 | 7,903 | 8,689 | 8,534 | |||||||||||||||||||||||||
Executive transition costs | — | — | — | — | — | 2,759 | — | — | |||||||||||||||||||||||||
Purchase accounting amortization | 62 | 63 | 62 | 63 | 62 | 63 | 62 | 63 | |||||||||||||||||||||||||
Restructuring and other related charges (credits) | — | — | 8,433 | 7,727 | (1,048 | ) | (415 | ) | 113 | 1,241 | |||||||||||||||||||||||
Non-GAAP Operating income | $ | 37,474 | $ | 42,991 | $ | 42,860 | $ | 34,391 | $ | 38,678 | $ | 42,266 | $ | 40,722 | $ | 39,849 | |||||||||||||||||
Non-GAAP Operating income % | 18.2 | % | 20.0 | % | 19.0 | % | 16.4 | % | 17.3 | % | 19.6 | % | 17.5 | % | 19.1 | % | |||||||||||||||||
GAAP Income before income taxes | $ | 26,336 | $ | 24,638 | $ | 19,829 | $ | 11,373 | $ | 26,315 | $ | 26,039 | $ | 24,963 | $ | 24,348 | |||||||||||||||||
Stock-based compensation | 8,050 | 8,832 | 7,717 | 8,666 | 8,413 | 7,903 | 8,689 | 8,534 | |||||||||||||||||||||||||
Executive transition costs | — | — | — | — | — | 2,759 | — | — | |||||||||||||||||||||||||
Purchase accounting amortization | 62 | 63 | 62 | 63 | 62 | 63 | 62 | 63 | |||||||||||||||||||||||||
Restructuring and other related charges (credits) | — | — | 8,433 | 7,727 | (1,048 | ) | (415 | ) | 113 | 1,241 | |||||||||||||||||||||||
Non-GAAP Income before income taxes | $ | 34,448 | $ | 33,533 | $ | 36,041 | $ | 27,829 | $ | 33,742 | $ | 36,349 | $ | 33,827 | $ | 34,186 | |||||||||||||||||
GAAP Income tax expense | $ | 5,108 | $ | 6,742 | $ | 3,541 | $ | (1,607 | ) | $ | 5,928 | $ | 5,565 | $ | 2,742 | 4,831 | |||||||||||||||||
Income tax effect of above items | 2,338 | 2,656 | 3,549 | 6,004 | 2,753 | 3,839 | 3,012 | $ | 2,202 | ||||||||||||||||||||||||
Income tax effect of unusual tax items | 994 | 177 | 1,419 | 2,386 | 86 | 53 | 2,002 | 479 | |||||||||||||||||||||||||
Non-GAAP Income tax expense | $ | 8,440 | $ | 9,575 | $ | 8,509 | $ | 6,783 | $ | 8,767 | $ | 9,457 | $ | 7,756 | $ | 7,512 | |||||||||||||||||
Non-GAAP Income tax expense as a % of Non-GAAP Income before income taxes | 24.5 | % | 28.6 | % | 23.6 | % | 24.4 | % | 26.0 | % | 26.0 | % | 22.9 | % | 22.0 | % | |||||||||||||||||
12
Summary of Unaudited Reconciliations of GAAP Measures to Non-GAAP Measures and other Unaudited GAAP Data (Continued) | |||||||||||||||||||||||||||||||||
($ in thousands, except per share data) | |||||||||||||||||||||||||||||||||
Q116 | Q216 | Q316 | Q416 | Q117 | Q217 | Q317 | Q417 | ||||||||||||||||||||||||||
GAAP Net income | $ | 21,228 | $ | 17,896 | $ | 16,288 | $ | 12,980 | $ | 20,387 | $ | 20,474 | $ | 22,221 | $ | 19,517 | |||||||||||||||||
Stock-based compensation | 8,050 | 8,832 | 7,717 | 8,666 | 8,413 | 7,903 | 8,689 | 8,534 | |||||||||||||||||||||||||
Executive transition costs | — | — | — | — | — | 2,759 | — | — | |||||||||||||||||||||||||
Purchase accounting amortization | 62 | 63 | 62 | 63 | 62 | 63 | 62 | 63 | |||||||||||||||||||||||||
Restructuring and other related charges (credits) | — | — | 8,433 | 7,727 | (1,048 | ) | (415 | ) | 113 | 1,241 | |||||||||||||||||||||||
Income tax effect of above items | (2,338 | ) | (2,656 | ) | (3,549 | ) | (6,004 | ) | (2,753 | ) | (3,839 | ) | (3,012 | ) | (2,202 | ) | |||||||||||||||||
Income tax effect of unusual tax items | (994 | ) | (177 | ) | (1,419 | ) | (2,386 | ) | (86 | ) | (53 | ) | (2,002 | ) | (479 | ) | |||||||||||||||||
Non-GAAP Net income | $ | 26,008 | $ | 23,958 | $ | 27,532 | $ | 21,046 | $ | 24,975 | $ | 26,892 | $ | 26,071 | $ | 26,674 | |||||||||||||||||
GAAP Diluted earnings per common share | $ | 0.55 | $ | 0.52 | $ | 0.49 | $ | 0.39 | $ | 0.62 | $ | 0.63 | $ | 0.68 | $ | 0.59 | |||||||||||||||||
Stock-based compensation | 0.21 | 0.26 | 0.24 | 0.26 | 0.26 | 0.24 | 0.26 | 0.26 | |||||||||||||||||||||||||
Restructuring and other related charges (credits) | — | — | 0.25 | 0.23 | (0.03 | ) | (0.01 | ) | — | 0.04 | |||||||||||||||||||||||
Income tax effect | (0.09 | ) | (0.08 | ) | (0.15 | ) | (0.24 | ) | (0.09 | ) | (0.12 | ) | (0.15 | ) | (0.08 | ) | |||||||||||||||||
Non-GAAP Diluted earnings per common share | $ | 0.67 | $ | 0.70 | $ | 0.83 | $ | 0.64 | $ | 0.76 | $ | 0.82 | $ | 0.79 | $ | 0.81 | |||||||||||||||||
Shares used in diluted earnings per common share calculation | 38,943 | 34,245 | 33,259 | 33,038 | 32,818 | 32,726 | 32,826 | 33,056 | |||||||||||||||||||||||||
SUMMARY OF UNAUDITED GAAP DATA | |||||||||||||||||||||||||||||||||
($ in thousands) | |||||||||||||||||||||||||||||||||
Net revenues from unaffiliated customers: | |||||||||||||||||||||||||||||||||
Enterprise | $ | 151,757 | $ | 160,468 | $ | 158,251 | $ | 156,190 | $ | 155,897 | $ | 154,542 | $ | 157,345 | $ | 160,870 | |||||||||||||||||
Consumer | 54,601 | 54,549 | 67,484 | 53,607 | 67,209 | 61,641 | 75,588 | 48,084 | |||||||||||||||||||||||||
Total net revenues | $ | 206,358 | $ | 215,017 | $ | 225,735 | $ | 209,797 | $ | 223,106 | $ | 216,183 | $ | 232,933 | $ | 208,954 | |||||||||||||||||
Net revenues by geographic area from unaffiliated customers: | |||||||||||||||||||||||||||||||||
Domestic | $ | 117,578 | $ | 123,803 | $ | 122,075 | $ | 119,166 | $ | 128,238 | $ | 119,062 | $ | 123,719 | $ | 111,196 | |||||||||||||||||
International | 88,780 | 91,214 | 103,660 | 90,631 | 94,868 | 97,121 | 109,214 | 97,758 | |||||||||||||||||||||||||
Total net revenues | $ | 206,358 | $ | 215,017 | $ | 225,735 | $ | 209,797 | $ | 223,106 | $ | 216,183 | $ | 232,933 | $ | 208,954 | |||||||||||||||||
Balance Sheet accounts and metrics: | |||||||||||||||||||||||||||||||||
Accounts receivable, net | $ | 127,160 | $ | 139,939 | $ | 136,402 | $ | 128,219 | $ | 133,155 | $ | 136,779 | $ | 141,297 | $ | 141,177 | |||||||||||||||||
Days sales outstanding (DSO) | 55 | 59 | 54 | 59 | 54 | 57 | 55 | 61 | |||||||||||||||||||||||||
Inventory, net | $ | 55,918 | $ | 57,760 | $ | 55,650 | $ | 53,162 | $ | 53,912 | $ | 52,686 | $ | 58,026 | $ | 55,456 | |||||||||||||||||
Inventory turns | 7.1 | 7.2 | 8.3 | 7.7 | 8.2 | 8.0 | 8.5 | 7.3 | |||||||||||||||||||||||||
13