Attached files
| file | filename |
|---|---|
| EX-32.1 - EXHIBIT 32.1 - Till Capital Ltd. | exh_321.htm |
| EX-31.2 - EXHIBIT 31.2 - Till Capital Ltd. | exh_312.htm |
| EX-31.1 - EXHIBIT 31.1 - Till Capital Ltd. | exh_311.htm |
| EX-21 - EXHIBIT 21 - Till Capital Ltd. | exh_21.htm |
| EX-4.1 - EXHIBIT 4.1 - Till Capital Ltd. | exh_41.htm |
UNITED STATES
SECURITIES AND EXCHANGE COMMISSION
WASHINGTON, D.C. 20549
FORM 10-K
[x] ANNUAL REPORT PURSUANT TO SECTION 13 OR 15(d) OF THE SECURITIES EXCHANGE ACT OF 1934
For the fiscal year ended December 31, 2016
OR
[ ] TRANSITION REPORT PURSUANT TO SECTION 13 OR 15(d) OF THE SECURITIES EXCHANGE ACT OF 1934
For the transition period from ___________ to ___________
Commission file number: 001-37402
Till Capital Ltd.
(Exact Name of Registrant as Specified in its Charter)
Bermuda (State or other Jurisdiction of Incorporation or Organization) |
Not Applicable (I.R.S. Employer Identification No.) |
Continental
Building
25 Church Street
Hamilton, HM12, Bermuda
(Address of Principal Executive Offices, Including Zip Code)
Registrant’s U.S. telephone number, including area code: (208) 635-5415
Securities registered pursuant to Section 12(b) of the Act:
Title of each class |
Name of each exchange on which registered |
| Restricted voting shares, par value $0.001 | The NASDAQ Stock Market LLC |
Securities registered pursuant to Section 12(g) of the Act: None
Indicate by check mark if the registrant is a well-known seasoned issuer, as defined in Rule 405 of the Securities Act. Yes [ ] No [x]
Indicate by check mark if the registrant is not required to file reports pursuant to Section 13 or Section 15(d) of the Act. Yes [ ] No [x]
Indicate by check mark whether the registrant: (1) has filed all reports required to be filed by Section 13 or 15(d) of the Securities Exchange Act of 1934 during the preceding 12 months (or for such shorter period that the registrant was required to file such reports), and (2) has been subject to such filing requirements for the past 90 days. Yes [x] No [ ]
Indicate by check mark whether the registrant has submitted electronically and posted on its corporate Web site, if any, every Interactive Data File required to be submitted and posted pursuant to Rule 405 of Regulation S-T (§232.405 of this chapter) during the preceding 12 months (or for such shorter period that the registrant was required to submit and post such files. Yes [ ] No [ ]
Indicate by check mark if disclosure of delinquent filers pursuant to Item 405 of Regulation S-K (§229.405) is not contained herein, and will not be contained, to the best of registrant’s knowledge, in definitive proxy or information statements incorporated by reference in Part III of this Form 10-K or any amendment to this Form 10-K. [x]
Indicate by check mark whether the registrant is a large accelerated filer, an accelerated filer, a non-accelerated filer, smaller reporting company, or an emerging growth company. See the definitions of “large accelerated filer,” “accelerated filer,” “smaller reporting company,” and “emerging growth company” in Rule 12b-2 of the Exchange Act:
| Large accelerated filer | [ ] | Accelerated filer | [ ] |
| Non-accelerated filer | [ ] (Do not check if a smaller reporting company) | Smaller reporting company | [x] |
| Emerging growth company | [x] |
If an emerging growth company, indicate by check mark if the registrant has elected not to use the extended transition period for complying with any new or revised financial accounting standards provided pursuant to Section 13(a) of the Exchange Act. [x]
Indicate by check mark whether the registrant is a shell company (as defined in Rule 12b-2 of the Act). Yes [ ] No [x]
The aggregate market value of the registrant’s restricted voting shares held by stockholders who were not affiliates (as defined by regulations of the Securities and Exchange Commission) of the registrant was $10,870,830 at June 30, 2016 based upon the closing price reported for such date on the NASDAQ Capital Market.
As of April 14, 2017, the registrant had 3,350,284 restricted voting shares outstanding.
Documents Incorporated by Reference
Certain information required by Part III of this Annual Report on Form 10-K is incorporated by reference herein from the registrant’s Definitive Proxy Statement for its 2017 Annual Meeting of Stockholders to be filed with the Securities and Exchange Commission within 120 days after the end of the registrant’s fiscal year ended December 31, 2016.
TILL CAPITAL LTD.
ANNUAL REPORT ON FORM 10-K
Year Ended December 31, 2016
TABLE OF CONTENTS
FORWARD-LOOKING STATEMENTS
Certain statements in this Annual Report on Form 10-K (this “Report”) of Till Capital Ltd. (“Till,” “we,” “us” or “our”), including statements in “Management’s Discussion and Analysis of Financial Condition and Results of Operations” in Part II, Item 7 of this Report, are forward-looking statements within the meaning of the Private Securities Litigation Reform Act of 1995. Those forward-looking statements include, but are not limited to, statements and information concerning (i) the potential benefit of the acquisition of Americas Bullion Royalty Corp. (“AMB”) on April 17, 2014 (the “Arrangement”), and the potential benefits of the Arrangement, (ii) statements relating to the business and future activities of, and developments related to, Till after the date of this Report, and (iii) Till’s market position and future financial or operating performance, goals, business and investment strategies, future growth, sufficiency of sources of liquidity and funding, stock repurchases, and other events or conditions that may occur in the future.
Any statements that involve discussions with respect to predictions, expectations, beliefs, plans, projections, objectives, assumptions, future events, or performance (often, but not always, using phrases such as “expects” or “does not expect,” “is expected,” “anticipates”, or “does not anticipate,” “plans,” “scheduled,” “forecasts,” “estimates,” “believes,” “intends,” or variations of such words and phrases or stating that certain actions, events, or results “may,” “could,” “would,” “might,” or “will” be taken to occur or be achieved) are not statements of historical fact and may be forward-looking statements and are intended to identify forward-looking statements. Those forward-looking statements are based on the beliefs of our management, as well as on assumptions that such management believes to be reasonable, based on information currently available at the time such statements were made. Forward-looking statements speak only as of the date they are made, and we assume no duty to, and do not undertake to, update forward-looking statements.
By their nature, forward-looking statements are based on assumptions and involve known and unknown risks, uncertainties, and other factors that may cause our actual results, performance, or achievements to be materially different from any future results, performance, or achievements expressed, or implied, by the forward-looking statements. Forward-looking statements are subject to a variety of risks, uncertainties, and other factors that could cause actual events or results to differ from those expressed, or implied, by the forward-looking statements.
In addition to the factors discussed under Part 1, Item 1A, “Risk Factors,” and elsewhere in this Report, the reader should also consider the following list of general factors that, among others, could cause Till’s actual results and financial condition to differ materially from estimated results and financial condition.
Factors related to the regulatory and legal environment in which Till and its subsidiaries operate:
| · | Governmental actions, including, but not limited to, implementation of new U.S. federal and state, Bermuda, and Canada laws and regulations, and court decisions interpreting existing laws and regulations or policy provisions; |
| · | Uncertainties related to regulatory approval of insurance rates, policy forms, insurance products, license applications, dividends from insurance subsidiaries, acquisitions or divestitures of businesses, and other matters within the purview of insurance regulators; |
| · | Till is subject to the risk of possibly becoming an investment company under U.S. federal securities law; |
| · | Insurance regulations to which Till’s subsidiaries are, or may become, subject, and potential changes thereto, could have a significant and negative effect on Till’s business; |
| · | Till is an “emerging growth company” and there is no certainty that Till will be able to maintain such status or if the reduced disclosure requirements applicable to emerging growth companies will make Till’s restricted voting shares less attractive to investors; and |
| · | Adverse outcomes in litigation or other legal or regulatory proceedings involving Till, its subsidiaries, or affiliates. |
Factors related to insurance claims and related reserves in Till’s insurance businesses:
| · | The number and severity of insurance claims; |
| · | Changes in facts and circumstances affecting assumptions used in determining loss and loss adjustment expense (“LAE”) reserves, including, but not limited to, the number and severity of insurance claims, changes in claim handling procedures, and closure and development patterns; |
| 1 |
| · | The impact of inflation on insurance claims, including, but not limited to, the effects on personal injury claims and property claims; |
| · | Developments related to insurance policy claims and coverage issues, including, but not limited to, interpretations or decisions by courts or regulators that may govern or influence losses incurred; |
| · | Orders, interpretations, or other actions by regulators that impact the reporting, adjustment, and payment of claims; and |
| · | Changes in the pricing or availability of reinsurance, or in the financial condition of reinsurers, and amounts recoverable therefrom. |
Factors related to Till’s ability to compete:
| · | Changes in ratings by rating agencies of Till and/or its insurance company subsidiaries with regard to credit, financial strength, claims-paying ability, and other areas on which those entities are or may be rated; |
| · | The level of success and costs incurred in realizing or maintaining economies of scale, implementing significant business initiatives, including those related to, but not limited to, expenses, claims, consolidations, reorganizations, technology, integration of acquired businesses, and divestitures of businesses; |
| · | Absolute and relative performance of Till’s products and services, including, but not limited to, the level of success achieved in designing and introducing new products; |
| · | The ability of Till to maintain availability of critical systems and manage technology initiatives cost-effectively to address insurance industry developments and regulatory requirements; and |
| · | Heightened competition, including, with respect to pricing, entry of new competitors, and alternative distribution channels, introduction of new technologies, refinements of existing products, and development of new products by current or future competitors. |
Factors related to the business environment in which Till and its subsidiaries operate:
| · | Changes in general economic conditions, including, but not limited to, performance of financial markets, interest rates, inflation, unemployment rates, and fluctuating values of certain investments held by Till that may be thinly traded or that are subject to other market considerations; |
| · | Till’s outstanding common shares (“Till Shares”) are not widely held, and, accordingly, the market for Till Shares may be more volatile and less liquid than the securities of other publicly traded companies; |
| · | Absolute and relative performance of investments held by Till; |
| · | Investments in junior and intermediate resource companies that may have a significantly higher degree of volatility risk than other types of investments; |
| · | Changes in insurance industry trends and significant industry developments; |
| · | Changes in consumer trends and significant consumer or product developments; |
| · | Changes in capital requirements, including the calculations thereof, used by regulators and rating agencies; |
| · | Regulatory, accounting, or tax changes that may affect the cost of, or demand for, Till’s products, services, or after-tax returns from Till’s investments; |
| · | Changes in distribution channels, methods, or costs resulting from changes in laws or regulations, lawsuits, or market forces; |
| · | Increased costs and risks related to cybersecurity and information technology, including, but not limited to, identity theft, data breaches, and system disruptions affecting services and actions taken to minimize the risks thereof; and |
| 2 |
| · | Failure to maintain the security of personal data that may result in lost business, reputational harm, legal costs, and regulatory penalties. |
Other risks and uncertainties described from time to time in Till’s filings with the U.S. Securities and Exchange Commission (“SEC”):
Till cannot provide any assurances that the results contemplated in any forward-looking statements will be achieved, or will be achieved in any particular timetable, or that future events or developments will not cause such statements to be inaccurate. Till assumes no obligation to correct or update any forward-looking statements publicly for any changes in events or developments or in Till’s expectations or results subsequent to the date of this Report. Till advises the reader to consult any further disclosures Till makes on related subjects, if any, in its filings with the SEC.
| 3 |
PART I
In this Report, unless otherwise specified, all dollar amounts are expressed in United States dollars (“U.S.$” or “$”) and any references to “Cdn$” and “Canadian dollars” are to the lawful currency of Canada. All references to “Till Shares” refer to Till’s restricted voting shares, par value $0.001.
Our Corporate History
Till Capital Ltd. was incorporated under the laws of Bermuda on August 20, 2012 under the name Resource Holdings Ltd. On March 19, 2014, we changed our name to Till Capital Ltd. in accordance with our bye-laws and Section 10 of the Bermuda Companies Act 1981, as amended (the “Companies Act”). Till Capital Ltd. is an exempted holding company with its principal place of business at Continental Building, 25 Church Street, Hamilton HM12, Bermuda, U.S. telephone number (208) 635-5415. Our registered office is Crawford House, 50 Cedar Avenue, Hamilton HM 11, Bermuda, and our registered agent is Compass Administration Services, Ltd.
On April 17, 2014, we acquired Americas Bullion Royalty Corp. (“AMB”) in a reverse takeover by way of a plan of arrangement (the “Arrangement”) under the British Columbia Business Corporations Act. Prior to the Arrangement, AMB was an exploration and development junior natural resource and mining company with royalty and exploration property holdings, and Till was an exempted holding company with no operations. Following completion of the Arrangement, we began to transition our business to primarily conduct reinsurance business through Resource Re Ltd. (“RRL”), our wholly-owned Bermuda-based subsidiary (a Class 3A insurance company in Bermuda). In support of this transition, through the Arrangement, we acquired an investment portfolio of cash, marketable securities, and illiquid securities from Kudu Partners L.P. (“Kudu”).
On May 15, 2015, Till acquired all of the issued and outstanding shares of Omega Insurance Holdings Inc. (“Holdings”), a privately held company based in Toronto, Canada, including its subsidiaries, Omega General Insurance Company (a fully licensed insurance company) (“Omega”) and Focus Group Inc. (“Focus”).
Our Corporate Organization Chart
The following chart sets forth Till’s corporate structure as of April 14, 2017.
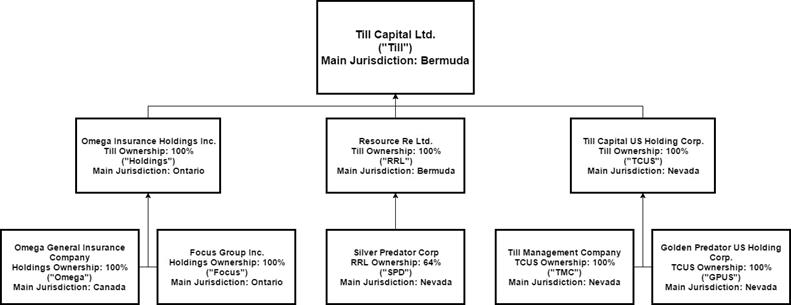
Our Business
Following completion of the Arrangement, we transitioned our business to primarily conduct reinsurance business through RRL, a wholly-owned subsidiary. In 2015, Till began the transition out of various investments in the natural resource sector. We also expanded into the insurance business through the acquisition of Holdings. In 2016, RRL has reduced its natural resource investments through the sale of equities and the transfer of shares in Golden Predator Mining Corp. (“GPY”) to Mr. William M. Sheriff, a former officer and director of Till, as part of a separation agreement. RRL no longer has a controlling interest in GPY.
| 4 |
Overview of Insurance and Reinsurance Business
Insurance
Insurance is a business arrangement in which an insurance company agrees to indemnify another company or individual against the expenses associated with events that are unpredictable in advance with respect to their realization and/or their time of occurrence. The insurer charges a “premium” to the insured to cover its expected costs of the indemnity, including all expenses associated with the processing of covered claims, plus a margin for the insurer’s overhead costs, general and administrative (“G&A”) expenses, and profit. The premiums are determined by multiple factors, including actuarial estimates of the expected claims, the insurer’s overhead costs and G&A expenses, market conditions, and an assumed profit margin. Since there is generally some passage of time between when premiums are received and claim expenses are incurred, the premiums are typically invested in lower-risk securities to provide an investment return on insurance-related capital. The insurer profits when the composite premiums charged, combined with the insurer’s investment gains, exceed the insurer’s composite expenses. In the case that the latter composite expenses are larger than the composite premiums and investment income and gains, the insurer sustains a loss.
There are many different risk categories of insurance, having variable degrees of risk. In general, the spectrum of risks ranges from those having to do with events of higher frequency but lower severity, where claim expenses tend to be rather predictable, as compared to those having to do with infrequent and less predictable events that may have extreme claim costs when losses occur. The latter class of insurance is often denoted as “catastrophic” coverage. In general, the more predictable the claim costs and expenses are, the more stable the expected required reserve and related allocation of capital.
The insurance industry is highly-regulated, with specific licensing required for each class of insurance. Insurance regulators monitor the fiscal performance of insurance companies under their charge and, in the U.S., Canada, and Bermuda, require those insurers to maintain certain levels of statutory capital and surplus. In addition, regulatory-based company-specific calculated risk-based capital levels are also required by various regulators. Insurance regulators also establish limitations on the types of investments allowed in an insurer’s investment portfolio to minimize exposure to potential market losses. In combination with competitive pressures, those regulations and requirements result in the insurance industry being driven by the type of insurance being written, with the volatility in the expected returns generally being the lowest for higher-frequency, lower-severity classes of insurance, and the highest for catastrophic coverage.
Reinsurance
Reinsurance is an arrangement whereby one insurance company, the “reinsurer,” agrees to indemnify another insurance company, the “cedent,” for all or a portion of the insurance risks underwritten by the cedent. Reinsurance can benefit a cedent in a number of ways, including reducing exposure on individual or multiple risks, providing catastrophe protections from large or multiple losses, and providing surplus relief to assist the cedent in maintaining or managing its capital and surplus risk exposure. Reinsurance can also be used to help provide a cedent additional underwriting capacity by assuming all or a portion of the cedent’s contract risk through fronting and quota-share reinsurance arrangements that may permit the cedent to accept larger risks and/or to underwrite a greater number of risks without a corresponding increase in its capital.
Reinsurance is generally written on a treaty or facultative basis. Treaty reinsurance is an agreement whereby the reinsurer assumes a specified portion or category of risk under all qualifying policies issued by the cedent during the term of the agreement, usually one year. When a reinsurer writes reinsurance on a treaty basis, the reinsurer does not re-underwrite each individual risk and generally accepts the original underwriting decisions made by the cedent. Treaty reinsurance is typically written on either a proportional or excess of loss basis. A proportional reinsurance treaty is an arrangement whereby a reinsurer assumes a predetermined proportional share of the premiums and losses attributable to a specific book of business. An excess of loss treaty is an arrangement whereby a reinsurer assumes losses that exceed a specific retention of loss by the cedent. Facultative reinsurance, on the other hand, is underwritten on a risk-by-risk basis that allows the reinsurer to determine the pricing for each exposure.
A period of time, sometimes significant, normally elapses between the receipt of reinsurance premiums and the payment of reinsurance claims. While premiums are generally payable to the reinsurer at inception of the underlying coverage, claim payments typically occur later. The related claim process, generally, begins with the occurrence of an event causing an insured loss followed by (i) the reporting of the loss by the insured to its broker or agent; (ii) the reporting by the broker or agent to the insurer; (iii) the reporting by the insurer/cedent to its reinsurance intermediary or agent; (iv) the reporting by the reinsurance intermediary or agent to the reinsurer; (v) the cedent’s adjustment and payment of the loss; and (vi) the payment to the cedent by the reinsurer. During that elapsed time period, reinsurers generally are able to invest premiums pursuant to their investment management strategy to earn investment income along with net realized and unrealized investment gains and losses on investments.
| 5 |
Summary of Our Reinsurance and Insurance Business
RRL
Till’s intention is to conduct certain reinsurance business through its wholly-owned subsidiary, RRL. RRL was incorporated in Bermuda in August 2012 and licensed as a Class 3A insurance company by the Bermuda Monetary Authority (“BMA”) in August 2013. Certain of the conditions of that license are summarized as follows:
| · | RRL is to, at all times, meet and maintain the relevant solvency margin(s), liquidity, and other ratios applicable under Bermuda law; |
| · | Without obtaining the prior written approval of the BMA, RRL is not to: |
| · | Write any “long- term” business, as such expression is understood in Bermuda’s Insurance Act of 1978, as amended and its related regulations (the “Insurance Act”); |
| · | Enter into any contracts of retrocession other than with Multi-Strat Re Ltd., a Class 3A Bermuda insurance company; and |
| · | Declare and/or pay any dividends and/or make any capital contributions to RRL’s parent, shareholders, or affiliates. |
RRL entered into its initial reinsurance contracts effective December 31, 2014 through Multi-Strat Re Ltd. (“Multi-Strat Re”). Those initial reinsurance contracts were novated in September 2015 and RRL currently has no reinsurance contracts in force. In the future, RRL intends to participate in reinsurance contracts using the Multi-Strat Re platform to underwrite medium- to long-term property and casualty business, as acceptable opportunities are identified.
RRL’s business strategy is to offer reinsurance coverage to a select group of insurance companies, e.g., captive insurers, privately-held insurers, and other global insurers and reinsurers. In addition to more traditional investments, RRL has an investment approach, ancillary to the reinsurance business, that includes alternative asset strategies in sectors with higher potential and liquidity.
RRL Reinsurance Business
RRL’s plan is to offer property and casualty insurers the opportunity to cede a proportionate amount of their insurance risk with the objectives of achieving an underwriting profit and retaining most of the investment returns on the related premium- and reserve-related liability investment float. RRL may also underwrite loss portfolio transfers of prior business written by an insurer to provide adverse development protection. However, the downside risks on loss portfolio transfers are to be contractually capped relative to the premium collected.
Reinsurance Strategy
In 2015 and 2016, RRL was a party to a quota-share retrocession agreement (the “Retrocession Agreement”) and a master services agreement (the “MSA”), collectively, the “Multi-Strat Agreements”, with Multi-Strat Re in respect of the reinsurance arrangements. Under the terms of the Multi-Strat Agreements, Multi-Strat Re is expected to assume risks from insurers, reinsurers, and captive insurers. Multi-Strat Re will, in turn, retrocede all of its premiums and risks to its pool of subscribing reinsurers, including RRL and reinsurers similar to RRL, based on the individual subscribing company’s acceptance of its subject risks and relative level of equity capital and appetite for reinsurance risks.
As part of its participation in the Multi-Strat Re program, RRL incurs two types of expenses in connection with its reinsurance underwriting, namely, (i) initial payments for sourcing premiums, including, but not limited to, brokerage, commissions, expert opinions, taxes, and pre-underwriting audits, and (ii) ongoing payments for claims handling and risk monitoring of business underwritten, including, but not limited to, audits, technical accounting and reporting, collateral administration, and underwriting renewals. Multi-Strat Re charges each reinsurer a retrocession commission on any premium at the time of binding and an annual administration fee for servicing the business underwritten. Multi-Strat Re also charges a performance fee based on the difference between the targeted underwriting profitability and the actual underwriting profitability, payable when the reinsurer is no longer at risk.
Annually, RRL may opt to maintain or increase the portion of its capital committed to the Multi-Strat Re program or withdraw from the program. If RRL elects to withdraw from the program, Multi-Strat Re is to consider, but is not obligated to, allocate RRL’s portion of the reinsured book to the other Class 3A reinsurers, including other Multi-Strat Re participating reinsurers, provided that those other Class 3A reinsurers have the capacity and willingness to accept any such reallocation.
| 6 |
Under the MSA, Multi-Strat Re remains obligated to service the business underwritten and RRL remains obligated to pay the administrative servicing fee to Multi-Strat Re. Once RRL has hired senior staff, RRL may elect to continue to do business with Multi-Strat Re in conjunction with initiating its own insurance or reinsurance underwriting or RRL may ultimately withdraw from new business under the Multi-Strat Re program consistent with the Retrocession Agreement.
Underwriting
For all insurance business that is accepted by RRL from Multi-Strat Re, RRL relies on Multi-Strat Re to fulfill the role of underwriter for that business by adhering, at a minimum, to the underwriting guidelines set forth in the MSA.
The types of non-acceptable risks and exposures that RRL will not underwrite include, but are not limited to, (i) war and civil risks, (ii) nuclear risks, (iii) windstorms, earthquake, flood, and terrorism risks, (iv) cybersecurity exposures, (v) asbestos and environmental risks, and (vi) master policies issued to a risk group, association, or an organization that solicits its members under a mass marketing program. However, excluded risk exposures of an incidental nature may be included in business to be underwritten. RRL does not intend to underwrite life or health insurance.
Premium Payments
Premiums on business assumed by RRL are paid directly to an account in the name of Multi-Strat Re, to its agents in a fiduciary capacity, or into collateral accounts. Multi-Strat Re may not use those premiums except for certain purposes as specified in the MSA.
Claims Handling
All claim billings are reviewed to ensure that the billings are covered by the terms and conditions of the reinsurance agreements (period of coverage, limits, etc.). As a reinsurer, RRL does not intend to handle claims directly, but will retain the right to audit the cedent’s handling of claims.
Security and Funding
Every insurance obligation placed through the Multi-Strat platform by RRL is required to be collateralized to the aggregate limit reinsured by RRL using either Reinsurance Trust Agreements (“RTAs”) or Letters of Credit (“LOCs”) from banks rated “A-” or better.
Regulatory Considerations - Solvency II
Bermuda has been awarded full equivalence for commercial insurers (which criteria includes Class 3A insurers) under Europe’s Solvency II regime applicable to insurance companies, which regime came into effect on January 1, 2016. As a Class A insurance company, RRL is required to comply with Solvency II.
Solvency II is a European-based regulatory frame-work for regulation of the insurance industry, the key objectives of which are to (i) improve consumer protection by ensuring a uniform and enhanced level of policyholder protection across the European Union, (ii) modernize the insurance regulatory focus from compliance monitoring and capital to evaluating insurers’ risk profiles and the quality of their risk management and governance systems, (iii) increase harmonization of the various country regulatory regimes, and (vi) establish a regulatory framework that includes not just capital concerns, but a more comprehensive program of regulatory requirements for insurers, including licensing/authorizations, corporate governance, supervisory reporting, public disclosure, risk assessment and management, as well as the establishment of solvency and reserving criteria. In summary, the Solvency II focus is comprised of three “pillars” that include financial requirements, governance and supervision, and reporting and disclosure.
Ratings
RRL may in the future apply for a rating from an insurance industry rating company, e.g., A.M. Best Company (“A.M. Best”), a company that provides credit ratings services for the insurance industry. If such a rating is obtained, RRL will strive to maintain capital levels consistent with an “A-” or better rating. There is no guarantee that such a rating will be obtained by RRL. Debt may be used as deemed prudent, consistent with maintaining such rating, though, in general, RRL expects to utilize a less leveraged asset mix than a majority of its peers.
| 7 |
Holdings
Holdings Background
On May 15, 2015, Till completed the acquisition of Holdings, a privately-held insurance holding company domiciled in Toronto, Canada and its wholly-owned subsidiaries, Omega and Focus. In the second quarter of 2015, Till reported the purchase price of $14,062,970, an amount that represented 1.2 times Holdings’ book value as of the closing date, and included an additional $751,880 for pending insurance transactions in process at the time. All payments were subject to a 5% hold-back to be paid to Holdings shareholders based on Omega’s 2015 operating results, and adjusted to give effect to any adverse development above 10% in loss reserves as calculated from the closing date until December 31, 2015. One of the two pending insurance transactions was closed in the third quarter of 2015 and the other one was closed in October 2015. The final amount for the two pending insurance transactions was $730,994. Accordingly, the final purchase price for Holdings was approximately $14,042,000.
Holdings was incorporated in January 2004 under the Ontario Business Corporations Act. In September 2004, Holdings began operations by incorporating a wholly-owned subsidiary insurance company, Omega, under the Insurance Companies Act (Canada). In September 2004, Holdings acquired all of the assets and liabilities of Focus, an Ontario corporation, through the purchase of all of its outstanding shares. Focus was formed in 1985 and has been providing management and consulting services to the insurance industry for over 25 years. Focus has significant experience and expertise in managing the operations of foreign insurance companies that want to operate in Canada without establishing a fully-staffed Canadian operation. Omega and Focus have two main target markets:
| · | Managing “run-off” business of insurance companies that have decided to exit the Canadian market, in whole or in part. Omega and Focus provide operational services to facilitate the exit of those companies and the management of the financial and legal obligations of that business on a continuing basis, while being able to repatriate their surplus capital in a more-timely manner. |
| · | Providing those insurers that want to access the Canadian market an ability to do so in an efficient manner, through customized fronting arrangements and other means. |
In October 2004, Omega received its order to commence insurance business from the Office of the Superintendent of Financial Institutions (“OSFI”), an independent agency of the Government of Canada. Omega is authorized to write all classes of insurance, other than life insurance, subject to the limitation that, in the case of policies that fall within classes other than property and liability, insurance approval be obtained from OSFI. At December 31, 2016, Omega was licensed in all provinces and territories in Canada. Omega’s insurance business focuses on property and casualty insurance. Omega earns income from underwriting insurance and reinsurance risks and fees from managing insurers in run-off.
Focus provides management services to Omega as well as a full range of consulting and management services to other clients. Focus currently has chief agency contracts with three foreign insurers and management contracts with two foreign insurers. Focus also provides ongoing and one-time consulting services in the areas of taxation, risk management, mergers and acquisitions, expert witness testimony, and claim reviews.
As a participant in the Canadian insurance industry, Omega is subject to significant regulations enacted by the Canadian federal and provincial governments, including capital and solvency standards, restrictions on certain types of investments, and periodic market conduct and financial examinations by regulators. Omega is a property and casualty insurance company that is regulated by OSFI. Omega has established procedures and controls to gain reasonable assurance that it is in compliance with all relevant laws, rules, and regulations.
Omega
Omega’s revenue is from three sources, namely, (i) premiums on portfolio transfer transactions and fees related to managing Canadian branch offices in “run off,” (ii) assumption reinsurance, including servicing fees in certain transactions, and (iii) premiums on direct insurance business. Omega also purchases reinsurance for both its portfolio transfer and direct insurance businesses to manage its risk exposures.
Omega underwrites insurance on a direct basis and as a reinsurer. As a reinsurer, Omega provides assumption reinsurance to insurance companies that want to exit the Canadian market, and to insurance companies that want to transfer of all their remaining claim liabilities on particular books of business. Those arrangements are commonly referred to as “run-off” or “loss portfolio transfer” assumption business. Omega also provides support services on assumed risks.
| 8 |
Omega’s business also includes acting as the primary insurer, direct writer, for insurance companies seeking Canadian business, but lacking the appropriate Canadian insurance licenses. In that capacity, Omega acts as the direct writer, or fronting company, for a specific insurance company, and Omega typically will cede most or all of that direct, fronted, business to that insurer. Omega remains contingently liable for the payment of losses on such fronted business. Omega’s principal income on fronting business is a fee for the management of the business in Canada. If Omega retains any of that fronting business, Omega also retains a portion of the premium and retains the insurance risk on the portion retained by Omega. That business generally requires customized contractual arrangements to address the unique aspects of those markets and to define the specifics of the coverage. Omega tends to write Canadian insurance business that is non-traditional, also known as “boutique” insurance, where there are fewer competitors. Those classes of insurance typically require more extensive research regarding the insurance risks, as there may be less generally-available loss-related data on the those non-traditional types of business.
Relationship between RRL and Omega
RRL and Omega are wholly-owned insurance subsidiary companies of Till, but operate substantially independently of each other and maintain their distinct legal and governance structures.
Our Competitive Strengths
Till believes it is well positioned to take advantage and leverage potential opportunities in its businesses due to Till’s strong insurance and investment capabilities, and its ability to leverage the resources of its business partners. Those strengths include:
Industry Expertise
Till has internal resources that are strong in investment management and insurance operations, including, among others, product development, underwriting, claims management, reinsurance, and financial management. In addition, through the leveraging of our outside service providers, including actuarial, claims management, the Multi-Strat platform, and select investment advisors, Till is well positioned to actively monitor and manage our assets and liabilities as a whole, matching cash flows to produce a resilient business portfolio to optimize our long-term performance.
Development of Tailored Solutions for Clients
Our focus is on developing tailored solutions to best address our clients’ insurance and reinsurance needs. By delivering individualized solutions to cedents and insureds, we expect to attract new business and to structure arrangements that may be more advantageous to both our clients and us.
Investment Strategy
Till Management Company (“TMC”), a wholly-owned subsidiary of Till, oversees Till’s investment strategy and serves as an investment advisor to Till, RRL, and Holdings.
Till’s primary investments are its 100% ownership of RRL and Holdings. Till may pursue acquisitions of other companies in the insurance industry or other sectors, but does not have any plans to do so at this time. Till’s investment strategy is designed to not only meet the regulatory requirements of RRL’s and Omega’s insurance business, but to also research investments that provide opportunity to leverage those investments with higher risks to benefit Till’s overall business and shareholder returns.
RRL’s Investment Guidelines
RRL’s investment policy is intended to achieve the highest portfolio yields consistent with its overall objectives, strategy, and parameters, including the maintenance of adequate liquidity to reasonably meet its obligations and liabilities. Those objectives take into account the “prudent person” objective of balancing a reasonably high and stable growth rate while avoiding undue risk of loss.
It is the responsibility of RRL’s investment advisor(s) to provide guidance and/or instructions for the purchase or sale of securities for RRL with accredited, reputable, and reliable brokers/traders/custodians in the investment community. All transactions are to be promptly and accurately recorded as they occur and appropriate reports are to be submitted to RRL by the advisors for review.
| 9 |
All investment transactions, along with the investment performance and adherence to RRL’s investment policy, are reviewed by the Board of Directors of RRL, or its designee, on a regular basis to ensure compliance with that investment policy and Bermudian laws and regulations.
At least annually, all RRL officers, advisors, and any others associated with the investment function confirm to the Board of Directors of RRL that they have no conflict of interest and undertake not to engage in any activity pursuant to the investment function that could produce a potential conflict of interest.
RRL reviews its investment portfolio together with its reinsurance operations on a periodic basis with its advisors to ensure that RRL has sufficient capital to withstand modeled losses on either or both of its investment and reinsurance portfolios.
RRL’s Investment Portfolio
The following table summarizes RRL’s investment portfolio at December 31, 2016:
| Cash | $1.7 million |
| Marketable securities | $2.9 million |
| Collateralized note receivable | $2.4 million |
| Control position: | |
| Silver Predator Corp. | 91.7 million shares (approx. 64% ownership) |
| Collateralized notes receivable | $4.2 million |
| Associated company: | |
| IG Copper, LLC | 221,500 units (approx. 3.6% ownership) |
| Note receivable | $0.4 million |
| Other holdings – Royalty rights | On 10 mining properties |
RRL’s Investment in Silver Predator Corp.
Following the Arrangement, RRL owned approximately 55% of the issued and outstanding shares of Silver Predator Corp. (“SPD”) and had a $4.5 million collateralized note receivable from SPD (the “SPD Collateralized Note”). On July 31, 2014, SPD completed a non-brokered private placement of 19,000,000 common shares at Cdn$0.07 per share for proceeds of Cdn$1,330,000. In April 2015, SPD issued 29,028,000 of its common shares to RRL at a value of Cdn$0.05 per share as the first payment on the SPD Collateralized Note. At December 31, 2016, RRL owned approximately 64% of SPD’s issued and outstanding common shares.
SPD has historically been engaged in exploring for and developing economically viable silver, gold, and tungsten deposits in Canada and the United States, with a focus on Nevada and Idaho. SPD’s two core properties were the Springer tungsten mine and mill in Pershing County, Nevada (the “Springer Property”) and the Taylor mine and mill near Ely, Nevada (the “Taylor Property”). SPD also owns the Copper King property near Coeur d’Alene, Idaho, the Cornucopia property in Elko County, Nevada, and several additional properties in Nevada. SPD is not currently engaged in any mining or exploration activities.
In January 2017, SPD transferred 100% of its ownership of the Springer Property to RRL in exchange for the full release and satisfaction of the SPD Collateralized Note. The balance of that SPD Collateralized Note, at the date of transfer to RRL, amounted to $3.97 million.
Springer Property
Until January 2017, SPD owned a 100% interest in the Springer Property, a non-operating former tungsten production facility located on the east flank of the Eugene Mountains, approximately 25 miles southwest of Winnemucca, Nevada. In addition to the former tungsten production facility, the project consists of 209 lode mineral claims, 25 placer claims, and fee lands for a total area of approximately 6,400 acres, including all mineral claims and fee lands, subject to a 2% net smelter royalty. The Springer production facility consists of a 1,360-foot vertical shaft and underground workings, a 1,200 ton per day mill with automated rod/ball mill grinding and flotation circuits, plus all water rights, and most permits necessary for operation of the facility. SPD has not conducted any significant exploration on the Springer Property for several years. As described previously, in January 2017, SPD transferred 100% of its ownership of the Springer Property to RRL.
In the second quarter of 2015, SPD announced its intention to realize value from assets by initiating a process to sell all, or part, of the tangible and intangible assets at some of its properties in Nevada. At that time, SPD disclosed that mining and production at the facility could be restarted with additional capital expenditures required for exploration to determine the existence of mineral reserves, modernization, and refurbishment.
| 10 |
Neither RRL, nor Till, currently intend to allocate additional capital to restart mining, exploration, and production at the Springer Property.
Taylor Property
SPD owns a 100% interest in the Taylor Property, a gold and silver mining and mill project site located in White Pine County, Nevada, 17 miles south of Ely, Nevada. The property consists of 130 unpatented and patented lode claims and five unpatented mill site claims totaling approximately 2,166 acres, subject to a 2% net smelter royalty and a 1% net profits royalty. The Taylor Property was a high-grade underground silver producer during the late 1880s, and again in the 1960s. The most significant production history occurred from 1981 to 1984, when its then owner produced over five million ounces of silver from several open pits. The mine closed due to low silver prices, leaving significant current resources pre-stripped in close proximity to the existing mill. The mill opened again in 1989 to process ore from a nearby gold mine and continued in operation until 1991 when the nearby mine closed. To restart mining and production at the mine and mill, SPD will need to either modernize and expand the existing mill or build a new mill and design and build a new tailings facility. SPD will also need to conduct further exploration of the property to identify mineral reserves. SPD did not conduct any significant exploration on the Taylor Property in 2015 or 2016, and SPD has no current plans for any significant further exploration expenditures.
Neither RRL, nor Till, currently intend to make additional capital contributions to SPD to restart mining and production at the Taylor Property.
Omega’s Investment Guidelines
Omega’s investment policy is intended to achieve the highest portfolio yields consistent with its overall objectives, strategy, and operational parameters, including the maintenance of adequate liquidity to reasonably meet its obligations and liabilities and regulatory guidelines. Those objectives take into account the “prudent person” objective of balancing a reasonable and stable income stream while avoiding undue risk of loss.
It is the responsibility of Omega’s Chief Executive Officer, or other persons so designated, to provide guidance and/or instructions for the purchase or sale of securities for Omega with accredited, reputable, and reliable investment advisors and brokers/traders in the Canadian and U.S. investment community, and to use a reputable Canadian custodial firm designated by Omega. All transactions are to be promptly and accurately recorded as they occur and appropriate reports are to be submitted to Omega for review.
All investment transactions are reviewed by Omega on a regular basis to ensure compliance with Omega’s investment policy and Canadian laws and regulations.
At least annually, all Omega officers, advisors, and any others associated with the investment function confirm to the Board of Directors of Omega that they have no conflict of interest and undertake not to engage in any activity pursuant to the investment function that could produce a potential conflict of interest.
Omega reviews its investment portfolio together with its insurance operations on a periodic basis with its advisors to ensure that Omega has sufficient capital to withstand modeled losses on either or both of its investment and insurance portfolios.
The following table summarizes Omega’s investment portfolio at December 31, 2016:
| Cash and cash equivalents | $3.0 million |
| Canadian government term deposits and debt | $8.1 million |
| Exchange traded bond funds | $4.4 million |
| Marketable securities | $0.1 million |
Regulatory Matters
Bermuda Insurance Regulations
Bermuda Exchange Control Regulation
| 11 |
The BMA must give permission for all issuances and transfers of securities of Bermuda exempted companies like Till and RRL, unless the proposed transaction is exempted by the BMA’s written general permissions. In its policy statement, dated June 1, 2005, the BMA provides that, where any equity securities, including Till Shares, of a Bermuda company are listed on an appointed stock exchange, general permission is given for the issuance and subsequent transfer of any securities of such a company from and/or to a non-resident, for as long as any such equity securities of such company remain so listed. Till Shares are listed on the Toronto Stock Exchange-Venture (“TSX-V”) and on the NASDAQ Stock Market (“NASDAQ”); both the TSX-V and NASDAQ are deemed to be appointed stock exchanges under Bermuda law. Therefore, following the listing the Till Shares on the TSX-V, in April 2014, the general permission issued by the BMA resulted in Till Shares being freely transferable among persons who are residents and non-residents of Bermuda.
Although Till is incorporated in Bermuda, Till is classified as a non-resident of Bermuda for exchange control purposes by the BMA. Other than transferring Bermuda dollars out of Bermuda, there are no restrictions on our ability to transfer funds into and out of Bermuda or to pay dividends in currency other than Bermuda dollars to nonresidents of Bermuda who are holders of Till Shares.
The Insurance Act of 1978.
The Insurance Act and related regulations of Bermuda that regulate the insurance business of RRL provide that no person is to carry on any insurance business in or from within Bermuda unless registered as an insurer under the Insurance Act by the BMA. Under the Insurance Act, insurance business includes reinsurance business. The BMA is required by the Insurance Act to determine whether the applicant is a fit and proper body to be engaged in the insurance business and, in particular, whether it has, or has available to it, adequate knowledge and expertise. The registration of an applicant as an insurer is subject to its compliance with the terms of its registration and such other conditions as the BMA may impose from time to time.
The Insurance Act also imposes, on Bermuda insurance companies, various solvency and liquidity standards, auditing and reporting requirements, and grants to the BMA powers to supervise, investigate, and intervene in the affairs of those insurance companies. Certain significant aspects of the Bermuda insurance regulatory framework are set forth below.
RRL, like all Bermuda domiciled insurers, is required to maintain a principal office in Bermuda and to appoint and maintain a principal representative in Bermuda. Further, any registered insurer that is a Class 3A insurer or above is required to maintain a head office in Bermuda and direct and manage its insurance business from Bermuda.
Every registered Bermuda insurer must appoint an independent auditor who will annually audit and report on the statutory financial statements and the statutory financial return of the insurer, both of which, in the case of RRL, are required to be filed annually with the BMA. The independent auditor of RRL must be approved by the BMA and may be the same person or firm that audits RRL’s financial statements and reports for presentation to its shareholders. RRL’s independent auditor is Arthur Morris & Company Limited and has been approved by the BMA.
Generally, a Class 3A insurer must appoint an individual approved by the BMA to be its loss reserve specialist and annually submit an opinion of its approved loss reserve specialist with its statutory financial statements and return in respect of its loss and loss expense provisions. Ordinance Holdings Limited serves as the actuary for RRL and has been approved by the BMA.
A Bermuda insurer, such as RRL, has to prepare annual statutory financial statements and file a statutory financial return. The Insurance Act prescribes rules for the preparation and substance of such statutory financial statements (that include, in statutory form, a balance sheet, an income statement, a statement of capital and surplus, and notes related thereto). The insurer is required to give detailed information and analyses as regards premiums, claims, reinsurance, and investments. The statutory financial statements are not prepared in accordance with generally accepted accounting principles in the United States (“U.S. GAAP”) and are distinct from the financial statements prepared for presentation to the insurer’s shareholders under the Companies Act, which financial statements are to be prepared in accordance with U.S. GAAP. An insurer is required to submit the annual statutory financial statements as part of its annual statutory financial return. The statutory financial statements and the statutory financial return do not form part of the public records maintained by the BMA or the Bermuda Registrar of Companies.
Canada Insurance Regulation
Omega’s business is regulated through various federal and provincial regulators in Canada and in the provinces in which it operates. Omega’s insurance business is subject to regulation and supervision by OSFI under the Insurance Companies Act (Canada) and by insurance regulatory authorities of the provinces in which it is licensed to conduct business. That regulation and supervision is designed to protect policyholders and creditors rather than investors. Provincial insurance regulations pertain primarily to market conduct, and the authorities have latitude to effect change in the commercial operating environment.
| 12 |
OSFI has established, and monitors compliance with, required minimum capital levels and targeted capital levels for insurance companies such as Omega. OSFI also requires insurance companies, such as Omega, to establish, and adhere to, prudent investment and lending policies, standards, and procedures that are subject to certain limits. Further, there are various regulatory requirements, guidelines, and/or restrictions on dividends, capital, reinsurance, acquisitions, and divestitures that govern Omega’s business. In certain circumstances, prior regulatory approvals for certain transactions and products are required.
United States Insurance Regulation
Neither RRL nor Omega currently intend to do business in any jurisdiction in the United States. The insurance laws of each state of the United States and of many foreign countries regulate the sale of insurance and reinsurance within their jurisdictions by alien insurers and reinsurers, such as RRL and Omega, that are organized under the laws of non-U.S. jurisdictions. RRL and Omega intend to conduct their respective business so as not to be subject to the licensing requirements of insurance regulators in the United States or elsewhere, other than their respective domicile countries, namely, Bermuda and Canada, respectively.
Competition
The insurance and reinsurance market is well established and very competitive with both mature and new companies participating in the marketplace. The market exhibits periodic cycles of soft and hard pricing that our insurance subsidiaries, RRL and Omega, consider in the underwriting of their insurance and reinsurance business.
Employees
At December 31, 2016, Till and its subsidiaries had a total of 18 full-time employees, ten employees are located in Canada and eight employees are located in the United States. There are also three part-time employees in Bermuda.
The following risks related to Till are in addition to the general risk factors set forth on pages 1-3 of this Report.
Insurance and Reinsurance Risks
| · | The insurance and reinsurance markets are cyclical and we are subject to those cycles. |
The insurance and reinsurance markets are cyclical and subject to unforeseen developments that may affect our operating results. Those developments could include trends of legal and regulatory decisions that could result in increasingly larger awards for certain types of losses, natural disasters, fluctuations in interest rates, changes in laws, changes in the investment environment that affect market prices of investments, inflationary pressures, and other events that affect the size of premiums or losses that companies and insurers experience. Prevailing market and economic conditions can affect the demand for insurance and reinsurance.
| · | We may not be able to purchase reinsurance on favorable terms when required. |
We may purchase reinsurance for our own account to mitigate the volatility of losses impacting our financial condition. From time to time, market conditions have limited, and in some cases have prevented, insurers and reinsurers from obtaining the types and amounts of reinsurance that they consider adequate for their business needs. If we are unable to purchase reinsurance on the terms we desire, we may be exposed to additional costs and/or insurance-related risks that could adversely affect our results of operations.
| · | There are ever-changing legal and regulatory developments in the insurance and reinsurance industries that could adversely affect our business. |
The insurance industry has experienced substantial volatility as a result of litigation, investigations, and regulatory activity by various insurance, government, and enforcement authorities concerning certain practices within the insurance industry. Those events have resulted in changes in the insurance and reinsurance markets and industry business practices. We cannot predict the potential effects, if any, that future litigation, investigations, and regulatory activity may have on the insurance and reinsurance industries that could materially affect our results of operation.
| 13 |
| · | The effect of emerging claim and coverage issues on our business is uncertain. |
As industry practices and legal, judicial, and regulatory conditions change, unexpected issues related to claims and coverage may emerge. Various provisions of our contracts, such as limitations or exclusions from coverage or choice of forum, may be difficult to enforce in the manner we intend, due to, among other things, disputes relating to coverage and choice of legal forum. Those issues may adversely affect our business by either extending coverage beyond the period that we intended or by increasing the number or size of claims. In some instances, those changes may not manifest themselves until many years after we have issued insurance or reinsurance contracts that are, or could be, affected by those changes.
| · | We could face unanticipated losses from acts of terror and the continued threat of terrorism, as well as increased political instability that could have a material adverse effect on our financial condition and results of operations. |
We could be exposed to unexpected losses on our reinsurance contracts resulting from terrorist activity, the continued threat of terrorism, and acts of civil or international hostility, both within the United States and abroad, political instability, and other politically-driven events, locally or globally. Those risks are inherently unpredictable and such events may indicate, or may result in, an increased frequency and severity of losses. It is difficult to predict the likelihood or timing of those types of events or to estimate the amount of loss that any given occurrence could cause.
| · | Any suspension or revocation of RRL’s or Omega’s reinsurance/insurance license could materially affect our ability to do insurance and reinsurance business and to implement our business strategy. |
RRL is licensed as a reinsurer only in Bermuda and Omega is licensed as an insurance provider only in Canada. The suspension or revocation of RRL’s or Omega’s licenses to do business as a reinsurance or insurance company in either of their respective jurisdictions, for any reason, would mean that RRL or Omega would not be able to enter into any new reinsurance or insurance contracts until the license revocation or suspension ended or until RRL or Omega became licensed in other jurisdictions.
| · | RRL is unrated and may not be able to generate sufficient premiums to be profitable. |
The reinsurance markets rely heavily on ratings whereby third-party rating agencies assess and rate the claims-paying ability of insurers and reinsurers based on criteria established by such rating agencies. The claims-paying ability ratings assigned by rating agencies to insurance and reinsurance companies represent independent opinions of financial strength and ability to meet policyholder obligations, and are not directed toward the protection of investors. Insured parties and brokers/intermediaries use those ratings as one measure by which to assess the financial strength and quality of insurers and reinsurers. Those ratings are often a key factor in the decision by an insured or a broker/intermediary as to whether to place business with a particular insurance or reinsurance provider. RRL may in the future apply for such a rating from A.M. Best. However, there is no guarantee that such a rating, or a rating from any rating agency, will be obtained, or that, if any such rating is obtained, it will be maintained.
| · | Interest rates could increase significantly or we could be unable to generate sufficient investment income. |
If interest rates move upward significantly, competitors may become more aggressive in their insurance product pricing to make up for any increase in underwriting losses with higher investment income and/or gains. Cedents could also insist on higher claims limits to compensate for the opportunity cost of investing the funds that they are using to pay premiums on products issued by RRL and Omega. RRL’s and Omega’s operating results may be adversely affected if significant changes in interest rates occur and competitive factors occur that result from such changes, e.g., product-pricing changes or reinsurance-related changes.
| 14 |
Operational Risks
| · | Our operational structure is continually being developed and implemented. |
We continue to develop and implement our operational structure and enterprise risk management framework, including risk exposure management, financial reporting, information technology, and internal controls, with which we conduct our business activities. There can be no assurance that the development of our operational structure or the implementation of our enterprise risk management framework will proceed smoothly or on our projected timetable.
| · | We may not be able to recruit the quality or quantity of full-time management necessary to make us successful. |
While outsourcing makes sense at our current size, an expansion of our business may require us to recruit additional full-time management and employees. If we are unable to do so, we could fail to grow, and our results of operations could be adversely affected.
| · | We are reliant on key employees. |
Various aspects of our business will depend on the services and skills of key personnel, including our Chief Executive Officer, Chief Investment Officer, and other key management personnel of Holdings. There can be no assurance that we will be able to attract and retain key personnel.
| · | There are limitations in using predictive models. |
We utilize predictive models to underwrite our insurance and reinsurance business and to calculate our reserves. Any substantial or repeated failures in the accuracy or reliability of such models could have a material adverse effect on our business, financial condition, and results of operation.
| · | Till may require additional capital that may be unavailable when we need it. |
Our future capital requirements depend on many factors, including our ability to establish reserves at levels sufficient to cover losses. We may need to raise additional funds through financings or curtail our growth and reduce our assets. Any equity or debt financing, if available at all, may be on terms that are not favorable to us. In the case of equity financings, dilution to our shareholders could result.
| · | We are subject to the jurisdiction of Bermuda work eligibility laws that may limit our ability to employ key employees. |
We may be affected by Bermuda laws that require work permits for certain employees. Under Bermuda law, non-Bermudians (other than spouses of Bermudians) may not engage in any gainful occupation in Bermuda without an appropriate governmental work permit. Our success may depend in part on the continued services of key employees and contractors in Bermuda. A work permit may be granted or renewed after a showing that, after proper public advertisement, no Bermudian (or spouse of a Bermudian or a holder of a permanent resident’s certificate or holder of a working resident’s certificate) is available who meets the minimum standards reasonably required by the employer. If work permits are not obtained, or are not renewed, for our principal employees and contractors, we would lose their services, which event could materially affect our business.
| · | There could be changes in the Bermuda or Canada laws and regulations that could adversely affect us. |
Because we are organized in Bermuda, and also operate in Canada, we are subject to changes of law or regulation in those jurisdictions that may have an adverse impact on our operations, including imposition of tax liability or increased regulatory supervision. We are also exposed to changes in the political environment in Bermuda and Canada that could have an adverse impact on our operations.
| · | Because Till currently qualifies as a “smaller reporting company,” our disclosure obligations are different than what is required for non-smaller reporting companies. |
In addition to qualifying as an “emerging growth company,” Till currently qualifies as a “smaller reporting company”. The “smaller reporting company” category includes companies that (i) have a common equity public float of less than $75 million or (ii) are unable to calculate their public float and have annual revenue of $50 million or less when entering the system. A smaller reporting company prepares and files reports and registration statements with the Securities and Exchange Commission (“SEC”) using the same forms as are required for other SEC reporting companies; however, the information required to be disclosed may differ and may be less comprehensive than that required for other registrants.
| 15 |
| · | As a result of the loss of our foreign private issuer status, Till currently is required to comply with the Exchange Act’s domestic reporting regime. |
As of June 30, 2016, Till determined that it no longer qualified as a “foreign private issuer” as such term is defined in Rule 405 under the Securities Act. As a result, as of January 1, 2017, Till is required to comply with the provisions of U.S. securities laws applicable to U.S. domestic issuers, including without limitation, periodic disclosure and current reporting requirements of the Exchange Act that are applicable to U.S. domestic issuers, such as the filing of Forms 10-K, 10-Q, and 8-K that, in some cases, are more detailed and extensive than the forms Till has filed with the SEC in the past as a foreign private issuer. As a U.S. domestic issuer, Till is required to comply with the U.S. proxy rules and Regulation FD, and Till’s officers, directors, and principal shareholders are subject to the Section 16 beneficial ownership reporting and short-swing profit rules. In addition, Till is required to prepare its financial statements filed with the SEC in accordance with U.S. Generally Accepted Accounting Principles (“GAAP”) (and to recast prior financial statements and selected financial data from the International Financial Reporting Standards (“IFRS”) to comply with GAAP for all periods required to be presented in its financial statements).
As a result of such compliance with those additional securities laws, we could incur additional costs and could lose certain exemptions available to foreign private issuers.
| · | We are exposed to foreign currency risk. |
We are a multi-national company and have operations in Canada, Bermuda, and the United States. As a result, Till is exposed to foreign currency risk to the extent that exchange rates of foreign currencies are subject to adverse change over time. In particular, the U.S. dollar value of our foreign currency transaction settlements and the periodic conversion of the foreign-denominated earnings to U.S. dollars are each subject to foreign exchange rate movements. Consequently, the resulting impact of a movement in foreign currency exchange rates could materially and adversely affect our results of operations and/or financial condition.
Taxation Risks
| · | U.S. holders who hold Till Shares may be subject to adverse U.S. tax consequences if Till is considered to be a passive foreign investment company (“PFIC”) for U.S. federal income tax purposes as contemplated in Section 1291 of the U.S. Internal Revenue Code (“IRC”). |
Under Section 1291 of the IRC, a “U.S. holder” means a beneficial owner of shares of Till Shares who is, or that is, (i) a U.S. citizen or resident, (ii) a U.S. corporation, (iii) an estate, the income of which is subject to U.S. federal income taxation regardless of its source, or (iv) a trust that it is subject to the primary supervision of a U.S. court and the control of one or more U.S. persons, or has a valid election in effect under applicable U.S. Treasury Regulations to be treated as a U.S. person.
If Till is considered to be a PFIC, a U.S. holder who owns any Till Shares may be subject to adverse U.S. federal income tax consequences, including (i) a greater tax liability than might otherwise apply, (ii) an interest charge on certain taxes that are otherwise deferred by virtue of our non-U.S. status, (iii) recognizing gain from the sale of Till Shares as ordinary income (and potentially subject to an interest charge), and (iv) dividends received from us not constituting qualified dividend income (and therefore not eligible for the preferential rate of tax otherwise available to qualified dividend income). In such a case, U.S. holders that own an interest in Till will be required to file additional annual U.S. federal tax information returns.
In general, Till would be a PFIC for a tax year if either (i) 75% or more of its income constitutes “passive income” or (ii) 50% or more of its assets (by value) produce or were held to produce “passive income,” based on the quarterly average of the fair market value of such assets. Passive income generally includes interest, dividends, and other investment income but does not include income derived in the active conduct of an insurance business by a corporation predominantly engaged in an insurance business (the “Active Insurance Company Exception”).
We do not believe that Till was classified as a PFIC for the tax years ended December 31, 2014, 2015, and 2016. No opinion of legal counsel or ruling from the U.S. Internal Revenue Service (“IRS”) concerning our status as a PFIC has been requested or obtained. Whether Till will be classified as a PFIC for the year ended December 31, 2017, any prior tax years, or any subsequent tax years will depend, in part, on whether Till was, or continues to be, actively engaged in insurance activities that involve sufficient transfer of risk and whether our financial reserves are, or were, consistent with industry standards. As such, Till can provide no assurance that it will not be deemed a PFIC for federal income tax purposes as contemplated in Section 1291 of the IRC.
| 16 |
Should Till be classified as a PFIC, a U.S. resident holder of Till Shares may be required to file an annual report with the IRS containing such information as the Treasury Regulations and/or other IRS guidance may require (e.g., IRS Form 8621). In addition to penalties, a failure to satisfy such reporting requirements may result in an extension of the time period during which the IRS can assess a tax.
If Till is classified as a PFIC, a U.S. holder may be able to mitigate certain of the adverse, or negative, tax consequences by making an election to treat Till as a “Qualified Electing Fund” or by making a mark-to-market election with respect to such U.S. holder’s ownership of Till Shares.
| · | Changes in U.S. federal income tax law could materially adversely affect an investment in Till Shares. |
In the past, legislation has been introduced (but not enacted) in the U.S. Congress that was intended to eliminate certain perceived tax advantages of companies (including insurance companies) that have legal domiciles outside the United States but have certain U.S. connections. We are not able to predict if, when, or in what form any such legislation or guidance might be enacted or provided and whether any such legislation or guidance would have an effect on Till.
| · | Till may be subject to U.S. federal income tax that could have an adverse effect on our financial condition and/or results of operations and on an investment in Till Shares. |
If Till, Holdings, and/or RRL is considered to be engaged in a trade or business in the U.S., we could be subject to U.S. federal income tax and additional taxes on the portion of our earnings that are effectively connected to such U.S. trade or business. Alternatively, if Till, Holdings, and/or RRL is entitled to benefits under an applicable income tax treaty, and if such entity were considered engaged in a trade or business in the United States through a “permanent establishment” (as such term is defined pursuant to such applicable United States income tax treaty), then such entity could be subject to U.S. federal income tax on the portion of its earnings that are attributable to its permanent establishment in the U.S. If any portion of Till’s, Holdings’, and/or RRL’s earnings was determined to be subject to U.S. federal income tax, then such entity’s results of operations could be materially adversely affected.
Till and RRL are Bermuda companies, and Holdings is a Canadian company. We intend to manage our business so that each of these companies operates in such a manner that none of those companies should be treated as engaged in a U.S. trade or business and, thus, should not be subject to U.S. federal taxation (other than the U.S. federal excise tax on insurance and reinsurance premium income attributable to insuring or reinsuring U.S. risks and U.S. federal withholding tax on certain U.S. source investment income). However, there can be no assurance that the IRS will not contend that Till, Holdings, and/or RRL are engaged in a trade or business in the United States that would be subject to U.S. federal taxation.
No Till shareholder or combination of shareholders who attribute beneficial ownership to one another may hold more than 9.9% of the voting power of Till, regardless of whether any such person holds substantially more than 9.9% of the votes attaching to our issued and outstanding shares. However, if any one person, within the meaning of the IRC, owns in excess of 50% of the outstanding Till Shares, then the restriction on voting power will cease to apply. We are not able to predict what, if any, effect such an event may have on Till’s operations.
| · | Till could become subject to Canadian federal income tax that could have an adverse effect on our financial condition and/or results of operations, and on an investment in Till Shares. |
Till could become subject to Canadian federal income tax on its income or the income of RRL from all sources if Till and/or RRL were considered under Canadian law to be resident in Canada, or if either or both were considered to carry on a trade or business in Canada (as determined under Canadian law). Till intends to manage its business such that Canadian federal income tax would not apply to Till and/or RRL. However, there can be no assurance that the Canada Revenue Agency would agree with Till’s and/or RRL’s position. In such a case, Till and/or RRL could be subject to combined Canadian federal and provincial corporate tax on their income, and shareholder dividends paid by Till could be subject to, among others, Canadian withholding tax.
| · | Changes to Bermuda tax policies could have an adverse effect on our financial position and/or results of operation. |
Under current Bermuda law, Till is not subject to tax on income, profits, withholding, capital gains, or capital transfers. Furthermore, under the Exempted Undertakings Tax Protection Act 1966 (as amended), Till obtained from the Minister of Finance of Bermuda, an assurance that, in the event that Bermuda enacts legislation imposing tax computed on profits, income, any capital asset, gain, or appreciation, or any tax in the nature of estate duty or inheritance tax, the imposition of any such tax will not be applicable to Till or our operations until March 2035.
| 17 |
| · | Till, Holdings, or RRL may become subject to U.S. withholding and information reporting requirements under the Foreign Account Tax Compliance Act (“FATCA”) provisions. |
As a general matter, FATCA was designed to require U.S. persons’ direct and indirect ownership of certain non-U.S. accounts and non-U.S. entities to be reported to the IRS. FATCA generally imposes a 30% withholding tax regime with respect to (i) certain U.S. source income (including interest and dividends) and gross proceeds from any sale or other disposition after December 31, 2018, of property that can produce U.S. source interest or dividends (“withholdable payments”) and (ii) “foreign pass-thru payments” made by foreign financial institutions (“FFIs”), or by non-financial foreign entities (“NFFEs”), after December 31, 2018 (or, if later, the date on which the final U.S. Treasury Regulations that define foreign pass-thru payments are published). Till, Holdings, and RRL intend to use reasonable efforts to avoid the imposition of a withholding tax under FATCA. There can be no certainty as to whether Till, Holdings, and/or RRL will be subject to the requirements imposed on FFIs or NFFEs under FATCA.
OTHER RISKS
| · | U.S. persons who own Till Shares may have more difficulty in protecting their interests than U.S. persons who are shareholders of a U.S. corporation. |
Our bye-laws require that all shareholder suits are to be adjudicated in Bermuda and that all shareholders have to accept that condition when purchasing Till Shares. Our bye-laws also provide that shareholders waive all claims or rights of action that they might have against any director or officer for any act or failure to act in the performance of such director’s or officer’s duties, except with respect to any fraud or dishonesty of such director or officer.
The rights of shareholders under Bermuda law are also not as extensive as the rights of shareholders under legislation or judicial precedent in many Canadian or United States jurisdictions. Bermuda does not permit attorneys to act on behalf of clients on a contingency fee basis, so any shareholder or combination of shareholders must pay legal fees to press any grievance against us or our directors in a Bermuda court of law. Furthermore, Bermuda’s legal system requires the non-prevailing party to pay the legal fees of the prevailing party.
Item 1B. Unresolved Staff Comments
Not applicable.
We lease office space at 13403 N. Government Way, Suite 212, in Hayden, Idaho, as well as at 25 Church Street, Hamilton HM12, Bermuda, and at 34 King Street East, Suite 1200, Toronto, Ontario, Canada. In addition, see Part I, Item 1, “Business—Investment Strategy” of this Report for a description of certain properties owned by Till and our controlled subsidiary, SPD.
We believe that our existing properties are adequate to meet current needs and that suitable additional space will be available as needed to accommodate any expansion of operations and additional offices on commercially acceptable terms.
We are party to various litigation matters in the ordinary course of our business. We cannot estimate with certainty our ultimate legal and financial liability, if any, with respect to our pending litigation matters. However, we believe, based on our knowledge of such matters, that our ultimate liability with respect to those matters will not have a material adverse effect on our financial position, results of operations, or cash flows.
Item 4. Mine Safety Disclosures
Not applicable.
| 18 |
PART II
Item 5. Market for Registrant’s Common Equity, Related Stockholder Matters, and Issuer Purchases of Equity Securities
Market Information
Till Shares are currently listed for trading on the (i) Toronto Stock Exchange-Venture (“TSX-V”) under the symbol “TIL” and on (ii) the NASDAQ Stock Market (“NASDAQ”) under the symbol “TIL”, the following table sets forth, for the quarterly periods indicated, the high and low sales price per Till Share as reported on the TSX-V and NASDAQ.
| TSX-V (Canadian Dollars) | NASDAQ (U.S. Dollars) | |||||||||||||||
| 2016 | High | Low | High | Low | ||||||||||||
| 4th Quarter (October 1 - December 31) | $ | 5.78 | $ | 4.15 | $ | 4.39 | $ | 3.87 | ||||||||
| 3rd Quarter (July 1 - September 30) | $ | 6.00 | $ | 3.92 | $ | 5.00 | $ | 3.08 | ||||||||
| 2nd Quarter (April 1 - June 30) | $ | 5.34 | $ | 3.88 | $ | 4.44 | $ | 2.98 | ||||||||
| 1st Quarter (January 1 - March 31) | $ | 5.25 | $ | 3.28 | $ | 4.00 | $ | 2.76 | ||||||||
| 2015 | ||||||||||||||||
| 4th Quarter (October 1 - December 31) | $ | 5.90 | $ | 5.03 | $ | 4.77 | $ | 3.70 | ||||||||
| 3rd Quarter (July 1 - September 30) | $ | 6.60 | $ | 4.31 | $ | 5.43 | $ | 3.50 | ||||||||
| 2nd Quarter (April 1 - June 30) | $ | 8.00 | $ | 5.50 | $ | 5.83 | $ | 4.75 | ||||||||
| 1st Quarter (January 1 - March 31) | $ | 8.01 | $ | 5.75 | $ | 6.91 | $ | 4.82 | ||||||||
Shareholders
As of March 21, 2017, there were 66 shareholders of record of Till Shares. Because a number of Till Shares are held by brokers and other institutions on behalf of shareholders, we are unable to estimate the total number of shareholders represented by those holders of record.
Dividends
Till has never declared or paid any cash dividend on Till Shares. Till currently intends to retain any earnings and does not expect to pay dividends in the foreseeable future.
Bermuda and Canada have restrictions as to the ability of our subsidiaries, RRL and Omega, respectively, to pay dividends to Till.
Recent Sales of Unregistered Securities
None.
| 19 |
Issuer Purchases of Equity Securities
Period |
(a) Total Number of Shares Purchased |
(b) Average Price Paid per Share | (c) Total Number of Shares Purchased as Part of Publicly Announced Plan or Program (1)(2)(3) | (d) Approximate Dollar Value of Shares that May Yet Be Purchased Under the Plans or Programs (1)(2)(3) | ||||||||||||
| October 1, 2016 through October 31, 2016 | — | — | — | — | ||||||||||||
| December 1 through December 31, 2016 | 59,400 | $ | 4.19 | 59,400 | $ | 850,000 | ||||||||||
| (1) | On September 25, 2015, Till announced that its board of directors had authorized the repurchase of up to 265,502 Till Shares commencing October 13, 2015 through October 13, 2016. Pursuant to such repurchase program, we purchased 79,000 Till Shares through open market purchases in 2016, all of which have been returned to treasury and cancelled. |
| (2) | There was no repurchase program in November 2016. |
| (3) | On December 1, 2016, Till announced that its board of directors had authorized the repurchase of up to 262,860 Till Shares commencing December 7, 2016 through December 6, 2017. Purchases will be carried out pursuant to open market transactions and any purchased Till Shares will be returned to treasury and cancelled in 2017. In 2016, a total of 138,400 Till Shares were purchased. |
Item 6. Selected Financial Data
Not applicable.
Item 7. Management’s Discussion and Analysis of Financial Condition and Results of Operations
The following discussion and analysis of our financial condition and results of our operations should be read in conjunction with the Consolidated Financial Statements and notes thereto included in Part II, Item 8, of this Report. Our actual results could differ materially from those contained in forward-looking statements due to a number of factors, including those discussed in Forward-Looking Statements, “Risk Factors” in Part I, Item 1A, and elsewhere in this Report.
Overview
Till is an insurance holding company domiciled in Bermuda. Through Till’s two wholly-owned insurance subsidiaries, RRL and Omega, we provide property and casualty insurance and reinsurance business. Till operates in a single segment, specifically insurance. For additional information, see Note 18 to the Consolidated Financial Statements in Part II, Item 8, of this Report.
RRL, a Bermuda domiciled company, was organized to offer reinsurance coverage to a select group of insurance companies, e.g., captive insurers, privately-held insurers, and other global insurers and reinsurers. RRL entered into its initial reinsurance contracts effective December 31, 2014. Those initial reinsurance contracts were novated in September 2015. RRL currently does not have any active reinsurance contracts in force. RRL intends to participate in reinsurance contracts using the Multi-Strat Re platform to underwrite medium- to long-term property and casualty business, as acceptable opportunities are identified. RRL’s primary sources of income are reinsurance premiums and investment income.
Omega, a Canada domiciled company, underwrites direct and reinsurance business. As a reinsurer, Omega provides assumption reinsurance to insurance companies that want to exit the Canadian market, and to insurance companies that want to transfer all of their remaining claim liabilities on particular books of business; those arrangements are commonly referred to as “run-off” or “loss portfolio transfer” assumption business. Omega also is a primary insurer, direct writer, for insurance companies looking to write Canadian business, but lacking the appropriate Canadian insurance licenses. In that capacity, Omega acts as the direct writer, or fronting company, for a specific insurance company and typically will cede most or all of that fronted business to that insurer. Omega has three sources of revenue, namely, (i) premiums on portfolio transfer transactions and fees related to managing Canadian branch offices in “run-off”, (ii) assumption reinsurance, including servicing fees in certain transactions, and (iii) premiums on direct business.
| 20 |
Till’s other subsidiaries include Till Management Company (“TMC”), Golden Predator US Holding Corp. (“GPUS”), and Focus. TMC provides investment advisory and investment management services, and GPUS provides personnel services, financial accounting, corporate and compliance, and other back-office support to Till and its subsidiaries, and Focus provides management services to Omega and consulting and management services to third-party insurers.
Financial Data
The discussion of our financial condition and results of operations that follows is intended to provide summarized information to assist the reader in understating our consolidated financial statements, as well as to provide explanations as regards the primary factors that accounted for those financial statement changes between 2015 and 2016. This discussion should be read in conjunction with Till’s consolidated financial statements that appear in Item 8 of this Report.
Financial Highlights as of and for the Year Ended December 31, 2016 (rounded)
| · | Gross premiums written were $39,682,000 and net premiums earned were $131,000. |
| · | Total revenue was $4,111,000. |
| · | Expenses were $3,647,000. |
| · | Net income was $491,000. |
| · | Cash and cash equivalents were $5,320,000. |
| · | Investments were $16,769,000. |
| · | Reinsurance recoverables were $2,391,000. |
| · | Reserve for unpaid losses and loss adjustment expenses was $13,212,000. |
| · | Reinsurance payables were $3,193,000. |
| · | Shareholders’ equity was $25,789,000. |
Results of Operations
The following table summarizes Till’s consolidated results of operations for 2016 and 2015:
| Year Ended December 31 | ||||||||
| 2016 | 2015 | |||||||
| Revenue: | ||||||||
| Insurance premiums written | $ | 39,681,953 | $ | 20,693,110 | ||||
| Insurance premiums ceded to reinsurers | (39,551,312 | ) | (20,764,179 | ) | ||||
| Net premiums earned | 130,641 | (71,069 | ) | |||||
| Insurance contract novations | - | (5,246,208 | ) | |||||
| Investment income (loss), net | 3,083,055 | (765,507 | ) | |||||
| Gain (loss) on disposal of PP&E and mineral properties | 369,693 | (83,828 | ) | |||||
| Gain from loss of control of subsidiary | - | 2,696,834 | ||||||
| Other revenue | 527,203 | 496,339 | ||||||
| Total Revenue (Loss) | $ | 4,110,592 | $ | (2,973,439 | ) | |||
| Expenses: | ||||||||
| Losses and loss adjustment expenses, net | 318,452 | 488,710 | ||||||
| Insurance contract novations | - | (5,113,010 | ) | |||||
| General and administrative expenses | 2,006,086 | 2,571,509 | ||||||
| Salaries and benefits | 1,428,537 | 2,159,117 | ||||||
| Stock-based compensation | 28,839 | 309,044 | ||||||
| Mining related expenses and property impairment | 155,233 | 335,680 | ||||||
| Foreign exchange (gain) loss | (263,514 | ) | 678,665 | |||||
| Interest and other (income) expense | (26,252 | ) | 125,480 | |||||
| Total Expenses | 3,647,381 | 1,555,195 | ||||||
| Income (loss) before income taxes and loss on equity method investment | 463,211 | (4,528,634 | ) | |||||
| Current income tax expense | (16,430 | ) | - | |||||
| Deferred income tax benefit (expense) | 104,017 | (22,079 | ) | |||||
| Loss on equity method investment | (60,258 | ) | (60,430 | ) | ||||
| Net income (loss) | $ | 490,540 | $ | (4,611,143 | ) | |||
| Net income (loss) attributable to: | ||||||||
| Shareholders of Till Capital Ltd. | $ | 508,244 | $ | (4,234,633 | ) | |||
| Non-controlling interests | (17,704 | ) | (376,510 | ) | ||||
| Net income (loss) | $ | 490,540 | $ | (4,611,143 | ) | |||
| Basic and diluted income (loss) per share of Till Capital Ltd. | $ | 0.15 | $ | (1.23 | ) | |||
| 21 |
Consolidated Results of Operations for the Years Ended December 31, 2016 and 2015
Revenue
Insurance premiums written
Insurance premiums written increased from $20.7 million in 2015 to $39.7 million in 2016. The increase in premiums written was due to the inclusion of Omega for all of 2016 as compared to 7.5 months in 2015.
Insurance premiums ceded to reinsurers
Insurance premiums ceded to reinsurers increased from $20.8 million in 2015 to $39.6 million in 2016. The increase in premiums ceded was due to the inclusion of Omega for all of 2016 as compared to 7.5 months in 2015.
Insurance contract novations
As a result of RRL’s novations in 2015 of the insurance contracts written that were assumed in 2014, Till reversed premium revenue of $5.2 million and reversed losses and loss adjustment expenses of $5.1 million. There were no insurance contract novations during 2016.
Investment income (loss), net
Investment income, inclusive of net realized investment gains and losses, increased from a loss of $0.8 million in 2015 to income of $3.1 million in 2016. The increase in net investment income was due to successful trading of futures and options strategies, along with increases in the market value of legacy natural resource investments, many of which were liquidated during 2016 as part of Till’s ongoing business strategy to focus on the insurance industry. The loss in 2015 occurred as a result of Till’s disposal of natural resource investments that were owned by AMB at the time of the Arrangement and were not considered to coincide with Till’s prospective forward-looking insurance business strategy. Several of those natural resource investments were sold at substantial losses.
Gain (loss) on disposal of PP&E and mineral properties
Gain (loss) on disposal of property, equipment, mineral properties, and write-offs increased from a loss of $83,828 in 2015 to a gain of $369,693 for the year ended December 31, 2016. The increase is due to the sale of mineral properties and royalties during the year ended December 31, 2016 compared to write-offs of property and equipment at SPD during the year ended December 31, 2015.
Gain from loss of control of subsidiary
The $2.7 million gain from loss of control of subsidiary in 2015 resulted from the loss of control of GPY in 2015. No loss of control event occurred during 2016.
Other revenue
Other revenue amounted to $0.5 million in both 2015 and 2016. Other revenue is comprised principally of consulting and service fee income earned by Focus.
| 22 |
Expenses
Losses and loss adjustment expenses
Losses and loss adjustment expenses decreased from $0.5 million in 2015 to $0.3 million in 2016. The decrease in losses and loss adjustment expenses was due to in the net favorable development in 2016 as compared to the 7.5 months in 2015.
Insurance contract novations
As noted above, there were no insurance contract novations during, 2016. Accordingly, expenses related to the novations of RRL’s insurance contracts decreased from $5.1 million in 2015 to $-0- in 2016.
General and administrative expenses
General and administrative expenses decreased from $2.6 million in 2015 to $2.0 million in 2016. The decrease in general and administrative expenses was primarily the result of reduced legal and professional fees and travel-related costs during 2016.
Salaries and benefits
Salaries and benefits decreased from $2.2 million in 2015 to $1.4 million in 2016. The decrease was due to staff reductions, partially offset by the inclusion of salaries and benefits at Holdings for all of 2016 as compared to 7.5 months in 2015. The 2016 salaries and benefit expenses also included a non-repetitive severance payment to Till’s former CFO who had been a former AMB senior officer. Salaries and benefits in 2015 also included non-repetitive severance payments to two former AMB senior officers after the Arrangement became effective in 2014.
Stock-based compensation
Stock-based compensation decreased from $309,044 in 2015 to $28,839 in 2016. The decrease in stock-based compensation is due mostly to forfeited options during the year ended December 31, 2015 that resulted from certain changes in Till’s management and board of directors.
Mining related expenses and property impairment
Mining related expenses and property impairment decreased from $0.3 million in 2015 to $0.2 million in 2016. That decrease results from reduced mining related expenses and property impairment at SPD in 2016 and the loss of control of GPY in 2015.
Foreign exchange (gain) loss
Foreign exchange gain increased from an expense of $0.7 million in 2015 to a gain of $0.3 million in 2016. That increase is due primarily to a decrease in value of the Canadian dollar relative to the U.S. dollar during 2015 as compared with an increase in the value of the Canadian dollar during 2016.
Interest and other (income) expense
Interest and other (income) expense increased from an expense of $0.1 million in 2015 to income of $26,000 in 2016. That increase was due to non-recurring expenses incurred in 2015 related to Till’s reorganization in 2014.
| 23 |
Financial Condition
| December 31 | ||||||||
| 2016 | 2015 | |||||||
| Cash and cash equivalents | $ | 5,320,208 | $ | 1,519,881 | ||||
| Investments | 16,769,265 | 25,272,761 | ||||||
| Unpaid losses and LAE ceded | 7,058,004 | 7,304,975 | ||||||
| Unearned premiums ceded | 1,614,803 | 1,615,977 | ||||||
| Reinsurance recoverables | 2,391,427 | 1,994,350 | ||||||
| Deferred policy acquisition costs | 498,889 | 465,472 | ||||||
| Assets held for sale | 4,543,239 | 4,542,639 | ||||||
| Promissory note receivable | 2,410,494 | 2,463,262 | ||||||
| Royalty and mineral interests | 1,003,373 | 1,077,827 | ||||||
| Deferred income tax asset | 583,153 | 479,136 | ||||||
| Goodwill | 2,980,819 | 2,913,110 | ||||||
| Other | 845,428 | 696,413 | ||||||
| Total assets | $ | 46,019,102 | $ | 50,345,803 | ||||
| Reserve for unpaid losses and LAE | $ | 13,212,366 | $ | 14,539,623 | ||||
| Unearned premiums | 2,283,118 | 2,432,468 | ||||||
| Reinsurance payables | 3,193,409 | 5,031,132 | ||||||
| Accounts payable and accrued liabilities | 1,143,825 | 1,994,899 | ||||||
| Other liabilities | 397,103 | 400,752 | ||||||
| Total liabilities | 20,229,821 | 24,398,874 | ||||||
| Total shareholders’ equity | 25,789,281 | 25,946,929 | ||||||
| Total liabilities and shareholder’s equity | $ | 46,019,102 | $ | 50,345,803 | ||||
Cash and cash equivalents and Investments
Cash and cash equivalents ($5.3 million) and investments ($16.8 million) totaled $22.1 million at December 31, 2016 as compared to cash and cash equivalents ($1.5 million) and investments ($25.3 million) that totaled $26.8 million at December 31, 2015. The decline in investments resulted from maturities in investments in the normal course of business and sales of natural resource investments.
Reinsurance recoverables
The $2.4 million of reinsurance recoverables at December 31, 2016 is comparable to the $2.0 million at December 31, 2015 and represents amounts due from reinsurers that are collectible under the reinsurance contracts.
Deferred policy acquisition costs
The deferred policy acquisition costs (“DPAC”) amounted to $0.5 million at December 31, 2016 and 2015. Acquisition costs deferred increased substantially during 2016 as compared to 2015 due to the volume of business written by Omega in 2016; however, similar to 2015, due to the short-tail nature of Omega’s insurance business, generally covering a 12-month period, the majority of the amounts capitalized were fully amortized during the same year.
| 2016 | 2015 | |||||||
| Balance at beginning of year | $ | 465,472 | $ | ─ | ||||
| Acquisition costs deferred | 11,110,040 | 5,609,635 | ||||||
| Amortization of DPAC | (11,076,623 | ) | (5,144,163 | ) | ||||
| Balance at end of year | $ | 498,889 | $ | 465,472 | ||||
Assets held for sale
The $4.5 million of assets held for sale at December 31, 2016 and 2015 principally represents the valuation related to SPD’s announced intention to realize value from those assets by initiating a process to sell all or part of the tangible and mineral property assets for some of its properties.
| 24 |
Other changes in identified assets
The changes in certain asset balances, e.g., Promissory note receivable and Goodwill, are primarily indicative of foreign currency changes at December 31, 2016 as compared to December 31, 2015.
Reserve for unpaid losses and loss adjustment expenses
The $13.2 million reserve for unpaid losses and loss adjustment expenses at December 31, 2016 as compared to the $14.5 million at December 31, 2015 is partially the result of more favorable development on prior-year business. There have been no changes in the actuarial methodology used by Omega to estimate reserves in 2016 or 2015.
Reinsurance payables
The $3.2 million of reinsurance payables at December 31, 2016 represents a decrease of $1.8 million as compared to the $5.0 million balance at December 31, 2015. Those payables related to amounts due to reinsurers.
Accounts payable and accrued liabilities
The $1.1 million of accounts payable and accrued liabilities at December 31, 2016 represents a decrease of $0.9 million compared to the $2.0 million balance at December 31, 2015.
Cash Flows
| Year Ended December 31 | ||||||||
| 2016 | 2015 | |||||||
| Net cash provided by (used in): | ||||||||
| Operating activities | $ | (6,697,840 | ) | $ | (6,239,683 | ) | ||
| Investing activities | 10,012,013 | (8,861,605 | ) | |||||
| Financing activities | 267,652 | (1,011,966 | ) | |||||
| Increase (decrease) in cash and cash equivalents | 3,581,825 | (16,113,254 | ) | |||||
| Effect of foreign exchange rate on cash | 218,502 | 598,684 | ||||||
| Cash and cash equivalents, beginning of year | 1,519,881 | 17,034,451 | ||||||
| Cash and cash equivalents, end of year | $ | 5,320,208 | $ | 1,519,881 | ||||
Operating Activities
Net cash used in operation activities was $6.7 million in 2016 as compared to $6.2 million used in 2015, a change of $0.6 million. The increase in cash used in 2016 is primarily due to the decrease in reinsurance payables of $1.8 million resulting from the reimbursement paid to a loss portfolio assumption in 2016 and gains on investments of $3.2 million in 2016.
Investing Activities
Net cash from investing activities were $10.0 million in 2016, as compared to cash used of $8.9 million in 2015. The increase is primarily the result of 2016 net sales of investments that contributed $10.5 million in positive cash flow in 2016 and in the cash outflow of $13.0 million in 2015 related to the purchase of Holdings.
Financing Activities
Net cash from financing activities amounted to $0.3 million in 2016 as compared to cash used of $1.0 million in 2015. The primary use of cash in 2016 and 2015 was for the purchases of Till Shares. In 2016, cash receipts included $0.5 million on a note receivable from GPY.
| 25 |
Critical Accounting Estimates
The preparation of Till’s consolidated financial statements requires judgments and estimates that may have a significant impact on its financial results. Note 3, under Item 8, Financial Statements and Supplementary Data — Notes to Consolidated Financial Statements, of this Annual Report contains a summary of Till’s significant accounting policies, most of which require the use of estimates and assumptions.
The information contained in Note 3 to the Consolidated Financial statements in Part II, Item 8, of this Report includes a description of critical accounting estimates that is incorporated herein by reference.
Liquidity and Capital Resources
The information contained in Notes 20 and 21 to the Consolidated Financial Statements in Part II, Item 8, of this Report includes a description of the liquidity and capital resources that is incorporated by reference herein.
Off-Balance Sheet Arrangements
As of December 31, 2016, Till did not have any off-balance sheet arrangements as defined in Item 303(a)(4) of Regulation S-K.
Contractual Obligations
Not applicable.
Recently Issued Accounting Standards
The information contained in Note 3 to the Consolidated Financial Statements in Part II, Item 8, of this Report that includes a description of recent accounting pronouncements, including Till’s expected dates of adoption and the estimated effects on Till’s results of operations and financial condition, is incorporated by reference herein.
Item 7A. Quantitative and Qualitative Disclosures About Market Risk
Not applicable.
| 26 |
Item 8. Financial Statements and Supplementary Data
Index to the Consolidated Financial Statements of Till Capital Ltd.
| 27 |
| Note 21 – Financial Risk Management | 62 |
| Note 22 – Quarterly Financial Information (Unaudited) | 65 |
| Note 23 – Contingencies | 65 |
| Note 24 – Subsequent Events | 65 |
| 28 |
REPORT OF INDEPENDENT REGISTERED PUBLIC ACCOUNTING FIRM
Board of Directors and Shareholders
Till Capital Ltd.
We have audited the accompanying consolidated balance sheet of Till Capital Ltd. (a Bermuda corporation) and subsidiaries (the “Company”) as of December 31, 2016, and the related consolidated statements of income (loss) and comprehensive income (loss), changes in shareholders’ equity, and cash flows for the year then ended. These consolidated financial statements are the responsibility of the Company’s management. Our responsibility is to express an opinion on these consolidated financial statements based on our audit.
We conducted our audit in accordance with the standards of the Public Company Accounting Oversight Board (United States). Those standards require that we plan and perform the audit to obtain reasonable assurance about whether the consolidated financial statements are free of material misstatement. We were not engaged to perform an audit of the Company’s internal control over financial reporting. Our audit included consideration of internal control over financial reporting as a basis for designing audit procedures that are appropriate in the circumstances, but not for the purpose of expressing an opinion on the effectiveness of the Company’s internal control over financial reporting. Accordingly, we express no such opinion. An audit also includes examining, on a test basis, evidence supporting the amounts and disclosures in the consolidated financial statements, assessing the accounting principles used and significant estimates made by management, as well as evaluating the overall financial statement presentation. We believe that our audit provides a reasonable basis for our opinion.
In our opinion, the consolidated financial statements referred to above present fairly, in all material respects, the financial position of Till Capital Ltd. and subsidiaries as of December 31, 2016, and the results of their operations and their cash flows for the year then ended in conformity with accounting principles generally accepted in the United States of America.
/s/ GRANT THORNTON LLP
Hartford, Connecticut
April 14, 2017
| 29 |
REPORT OF INDEPENDENT REGISTERED PUBLIC ACCOUNTING FIRM
Board of Directors and Shareholders
Till Capital Ltd.
We have audited the accompanying consolidated balance sheet of Till Capital Ltd (a Bermuda corporation) and subsidiaries (the “Company”) as of December 31, 2015, and the related consolidated statements of income (loss) and comprehensive income (loss), changes in shareholders’ equity, and cash flows for the year then ended. These financial statements are the responsibility of the Company’s management. Our responsibility is to express an opinion on these financial statements based on our audit.
We conducted our audit in accordance with the standards of the Public Company Accounting Oversight Board (United States). Those standards require that we plan and perform the audit to obtain reasonable assurance about whether the financial statements are free of material misstatement. We were not engaged to perform an audit of the Company’s internal control over financial reporting. Our audit included consideration of internal control over financial reporting as a basis for designing audit procedures that are appropriate in the circumstances, but not for the purpose of expressing an opinion on the effectiveness of the Company’s internal control over financial reporting. Accordingly, we express no such opinion. An audit also includes examining, on a test basis, evidence supporting the amounts and disclosures in the financial statements, assessing the accounting principles used and significant estimates made by management, as well as evaluating the overall financial statement presentation. We believe that our audit provides a reasonable basis for our opinion.
In our opinion, the consolidated financial statements referred to above present fairly, in all material respects, the financial position of Till Capital Ltd. and subsidiaries as of December 31, 2015, and the results of their operations and their cash flows for the year then ended in conformity with accounting principles generally accepted in the United States of America.
As discussed in Note 2 to the consolidated financial statements, as of January 1, 2016, the Company transitioned to accounting principles generally accepted in the United States of America. The impact of the transition was applied retrospectively to all periods presented.
| /s/ GRANT THORNTON LLP | ||
| Toronto, Canada | Chartered Professional Accountants | |
| April 14, 2017 | Licensed Public Accountants |
| 30 |
TILL CAPITAL LTD.
| December 31, 2016 | December 31, 2015 | |||||||
| Assets | ||||||||
| Cash and cash equivalents | $ | 5,320,208 | $ | 1,519,881 | ||||
| Investments (Note 7) | 15,520,774 | 24,183,191 | ||||||
| Investment, equity method (Note 7) | 1,248,491 | 1,089,570 | ||||||
| Unpaid losses and loss adjustment expenses ceded (Note 8) | 7,058,004 | 7,304,975 | ||||||
| Unearned premiums ceded (Note 9) | 1,614,803 | 1,615,977 | ||||||
| Reinsurance recoverables | 2,391,427 | 1,994,350 | ||||||
| Deferred policy acquisition costs (Note 10) | 498,889 | 465,472 | ||||||
| Assets held for sale (Note 5) | 4,543,239 | 4,542,639 | ||||||
| Promissory note receivable (Note 6) | 2,410,494 | 2,463,262 | ||||||
| Property, plant, and equipment (Note 11) | 52,676 | 77,244 | ||||||
| Royalty and mineral interests (Note 12) | 1,003,373 | 1,077,827 | ||||||
| Deferred income tax asset (Note 15) | 583,153 | 479,136 | ||||||
| Goodwill (Note 4) | 2,980,819 | 2,913,110 | ||||||
| Other assets (Note 13) | 792,752 | 619,169 | ||||||
| Total Assets | $ | 46,019,102 | $ | 50,345,803 | ||||
| Liabilities | ||||||||
| Reserve for unpaid losses and loss adjustment expenses (Note 8) | $ | 13,212,366 | $ | 14,539,623 | ||||
| Unearned premiums (Note 9) | 2,283,118 | 2,432,468 | ||||||
| Reinsurance payables | 3,193,409 | 5,031,132 | ||||||
| Accounts payable and accrued liabilities (Note 14) | 1,143,825 | 1,994,899 | ||||||
| Other liabilities | 397,103 | 400,752 | ||||||
| Total liabilities | 20,229,821 | 24,398,874 | ||||||
| Contingencies (Note 23) | ||||||||
| Shareholders' equity (Note 16) | ||||||||
| Common stock | 3,350 | 3,429 | ||||||
| Additional paid in capital | 31,532,168 | 31,519,775 | ||||||
| Treasury stock | (248,951 | ) | — | |||||
| Accumulated other comprehensive loss | (1,685,517 | ) | (1,216,461 | ) | ||||
| Deficit (excluding $105,305,060 reclassified to additional paid in capital in the December 31, 2014 quasi-reorganization) | (5,566,729 | ) | (5,760,374 | ) | ||||
| Equity attributable to shareholders of Till Capital Ltd. | 24,034,321 | 24,546,369 | ||||||
| Non-controlling interests in Silver Predator Corp. (Notes 5 and 24) | 1,754,960 | 1,400,560 | ||||||
| Total shareholders’ equity | 25,789,281 | 25,946,929 | ||||||
| Total liabilities and shareholders' equity | $ | 46,019,102 | $ | 50,345,803 | ||||
The accompanying notes are an integral part of these consolidated financial statements.
| 31 |
TILL CAPIAL LTD.
CONSOLIDATED STATEMENTS OF INCOME (LOSS) AND COMPREHENSIVE INCOME (LOSS)
| Years Ended | ||||||||
| December 31, 2016 | December 31, 2015 | |||||||
| Revenue | ||||||||
| Insurance premiums written | $ | 39,681,953 | $ | 20,693,110 | ||||
| Insurance premiums ceded to reinsurers | (39,551,312 | ) | (20,764,179 | ) | ||||
| Net premiums earned | 130,641 | (71,069 | ) | |||||
| Insurance contract novations (Note 8) | — | (5,246,208 | ) | |||||
| Investment income (loss), net (Note 7) | 3,083,055 | (765,507 | ) | |||||
| Gain (loss) on disposal of PP&E and mineral properties | 369,693 | (83,828 | ) | |||||
| Gain from loss of control of subsidiary (Note 6) | — | 2,696,834 | ||||||
| Other revenue | 527,203 | 496,339 | ||||||
| 4,110,592 | (2,973,439 | ) | ||||||
| Expenses | ||||||||
| Losses and loss adjustment expenses, net (Note 8) | 318,452 | 488,710 | ||||||
| Insurance contract novations (Note 8) | — | (5,113,010 | ) | |||||
| General and administrative expenses | 2,006,086 | 2,571,509 | ||||||
| Salaries and benefits | 1,428,537 | 2,159,117 | ||||||
| Stock-based compensation (Note 16) | 28,839 | 309,044 | ||||||
| Mining related expenses and property impairment | 155,233 | 335,680 | ||||||
| Foreign exchange (gain) loss | (263,514 | ) | 678,665 | |||||
| Interest and other (income) expense | (26,252 | ) | 125,480 | |||||
| 3,647,381 | 1,555,195 | |||||||
| Income (loss) before income taxes and loss on equity method investment | 463,211 | (4,528,634 | ) | |||||
| Current income tax expense (Note 15) | (16,430 | ) | — | |||||
| Deferred income tax benefit (expense) (Note 15) | 104,017 | (22,079 | ) | |||||
| Loss on equity method investment (Note 7) | (60,258 | ) | (60,430 | ) | ||||
| Net income (loss) | $ | 490,540 | $ | (4,611,143 | ) | |||
| Net income (loss) attributable to: | ||||||||
| Shareholders of Till Capital Ltd. | $ | 508,244 | $ | (4,234,633 | ) | |||
| Non-controlling interests | (17,704 | ) | (376,510 | ) | ||||
| Net income (loss) | $ | 490,540 | $ | (4,611,143 | ) | |||
| Other comprehensive income (loss): | ||||||||
| Change in cumulative foreign exchange translation adjustment | $ | (519,178 | ) | $ | (1,823,264 | ) | ||
| Change in net unrealized gains on available for sale investments | 1,495,317 | 575,747 | ||||||
| Reclassification adjustment for net realized gain (loss) on available for sale investments | (1,445,195 | ) | 31,056 | |||||
| Other comprehensive income (loss) | (469,056 | ) | (1,216,461 | ) | ||||
| Comprehensive income (loss) | $ | 21,484 | $ | (5,827,604 | ) | |||
| Basic and diluted net income (loss) per share of Till Capital Ltd. | $ | 0.15 | $ | (1.23 | ) | |||
| Weighted average number of shares outstanding | 3,399,329 | 3,454,207 | ||||||
The accompanying notes are an integral part of these consolidated financial statements.
| 32 |
TILL CAPITAL LTD.
CONSOLIDATED STATEMENTS OF CHANGES IN SHAREHOLDERS’ EQUITY
| Common Stock | Accumulated other comprehensive income (loss) | Equity | ||||||||||||||||||||||||||||||||||||||||||
| Shares Issued | Amount | Treasury shares | Additional
paid in capital | Available for sale investments | Currency translation adjustment | Total | Deficit | attributable
to shareholders of Till Capital Ltd. | Non- Controlling interests | Total | ||||||||||||||||||||||||||||||||||
| Balance, January 1, 2015 | 3,569,184 | $ | 3,569 | $ | (149,900 | ) | $ | 31,251,642 | $ | — | $ | — | $ | — | $ | (684,361 | ) | $ | 30,420,950 | $ | 2,991,283 | $ | 33,412,233 | |||||||||||||||||||||
| Net loss | — | — | — | — | — | — | — | (4,234,633 | ) | (4,234,633 | ) | (376,510 | ) | (4,611,143 | ) | |||||||||||||||||||||||||||||
| Other comprehensive income (loss) | — | — | — | — | 606,803 | (1,823,264 | ) | (1,216,461 | ) | — | (1,216,461 | ) | (112,682 | ) | (1,329,143 | ) | ||||||||||||||||||||||||||||
| Total comprehensive income (loss) | — | — | — | — | 606,803 | (1,823,264 | ) | (1,216,461 | ) | (4,234,633 | ) | (5,451,094 | ) | (489,192 | ) | (5,940,286 | ) | |||||||||||||||||||||||||||
| Purchase of treasury shares | — | — | (691,620 | ) | — | — | — | — | — | (691,620 | ) | — | (691,620 | ) | ||||||||||||||||||||||||||||||
| Cancellation of treasury shares | (139,900 | ) | (140 | ) | 841,520 | — | — | — | — | (841,380 | ) | — | — | — | ||||||||||||||||||||||||||||||
| Stock-based compensation | — | — | — | 268,133 | — | — | — | — | 268,133 | — | 268,133 | |||||||||||||||||||||||||||||||||
| Loss of control of subsidiary | — | — | — | — | — | — | — | — | — | (1,101,531 | ) | (1,101,531 | ) | |||||||||||||||||||||||||||||||
| Balance, December 31, 2015 | 3,429,284 | $ | 3,429 | $ | — | $ | 31,519,775 | $ | 606,803 | $ | (1,823,264 | ) | $ | (1,216,461 | ) | $ | (5,760,374 | ) | $ | 24,546,369 | $ | 1,400,560 | $ | 25,946,929 | ||||||||||||||||||||
| Net income (loss) | — | — | — | — | — | — | — | 508,244 | 508,244 | (17,704 | ) | 490,540 | ||||||||||||||||||||||||||||||||
| Other comprehensive income (loss) | — | — | — | — | 50,122 | (519,178 | ) | (469,056 | ) | — | (469,056 | ) | (34,639 | ) | (503,695 | ) | ||||||||||||||||||||||||||||
| Total comprehensive income (loss) | — | — | — | — | 50,122 | (519,178 | ) | (469,056 | ) | 508,244 | 39,188 | (52,343 | ) | (13,155 | ) | |||||||||||||||||||||||||||||
| Purchase of treasury shares | — | — | (563,629 | ) | — | — | — | — | — | (563,629 | ) | — | (563,629 | ) | ||||||||||||||||||||||||||||||
| Cancellation of treasury shares | (79,000 | ) | (79 | ) | 314,678 | — | — | — | — | (314,599 | ) | — | — | — | ||||||||||||||||||||||||||||||
| Stock-based compensation | — | — | — | 12,393 | — | — | — | — | 12,393 | 5,523 | 17,916 | |||||||||||||||||||||||||||||||||
| Decrease of controlling interest in subsidiary | — | — | — | — | — | — | — | — | — | 401,220 | 401,220 | |||||||||||||||||||||||||||||||||
| Balance, December 31, 2016 | 3,350,284 | $ | 3,350 | $ | (248,951 | ) | $ | 31,532,168 | $ | 656,925 | $ | (2,342,442 | ) | $ | (1,685,517 | ) | $ | (5,566,729 | ) | $ | 24,034,321 | $ | 1,754,960 | $ | 25,789,281 | |||||||||||||||||||
The accompanying notes are an integral part of these consolidated financial statements.
| 33 |
TILL CAPIAL LTD.
CONSOLIDATED STATEMENTS OF CASH FLOWS
| Years Ended | ||||||||
| December 31, 2016 | December 31, 2015 | |||||||
| Cash flows from operating activities | ||||||||
| Net income (loss) | $ | 490,540 | $ | (4,611,143 | ) | |||
| Adjustments to reconcile net income (loss) to net cash used in operating activities: | ||||||||
| Deferred income taxes | (104,017 | ) | 22,079 | |||||
| Depreciation and amortization expense | 237,655 | 79,853 | ||||||
| Stock-based compensation | 12,393 | 268,133 | ||||||
| (Gain) loss on sale of PP&E and mineral properties | (369,693 | ) | 83,828 | |||||
| (Gain) loss on investments | (3,083,055 | ) | 296,935 | |||||
| Loss on equity method investment | 60,258 | 60,430 | ||||||
| Gain from loss of control of subsidiary | — | (2,696,834 | ) | |||||
| (2,755,919 | ) | (6,496,719 | ) | |||||
| Changes in operating assets and liabilities: | ||||||||
| (Increase) decrease in reinsurance recoverables | (397,077 | ) | 903,190 | |||||
| Increase (decrease) in unpaid losses, LAE, and amounts ceded | (1,080,286 | ) | 463,025 | |||||
| Decrease in reinsurance payables | (1,837,723 | ) | (1,412,234 | ) | ||||
| Increase in deferred policy acquisition costs | (33,417 | ) | (465,472 | ) | ||||
| Increase (decrease) in unearned premiums | (148,176 | ) | 816,491 | |||||
| Increase (decrease) in accounts payable and accrued liabilities | (172,753 | ) | 400,752 | |||||
| Other working capital changes | (272,489 | ) | (448,716 | ) | ||||
| (6,697,840 | ) | (6,239,683 | ) | |||||
| Cash flows from investing activities | ||||||||
| Proceeds from sales of available for sale investments | 8,857,888 | 3,154,130 | ||||||
| Sales of held for trading investments, net | 1,649,516 | (100,539 | ) | |||||
| Proceeds from sale of mineral properties | 220,829 | — | ||||||
| Sales of property, plant, and equipment, net | 244,140 | 528,650 | ||||||
| Proceeds from reclamation bonds | — | 750,889 | ||||||
| Purchase of Holdings, net of cash received | (681,970 | ) | (12,896,775 | ) | ||||
| Development costs capitalization | (278,390 | ) | (322,657 | ) | ||||
| Decrease in mineral interests | — | 24,697 | ||||||
| 10,012,013 | (8,861,605 | ) | ||||||
| Cash flows from financing activities | ||||||||
| Purchase of Till Capital Ltd. shares (Note 16) | (563,629 | ) | (691,620 | ) | ||||
| Proceeds from note receivable (Note 6) | 546,545 | — | ||||||
| Other items, net | 284,736 | (320,346 | ) | |||||
| 267,652 | (1,011,966 | ) | ||||||
| Increase (decrease) in cash and cash equivalents | 3,581,825 | (16,113,254 | ) | |||||
| Effect of foreign exchange rate changes on cash and cash equivalents | 218,502 | 598,684 | ||||||
| Cash and cash equivalents, beginning of the year | 1,519,881 | 17,034,451 | ||||||
| Cash and cash equivalents, end of the year | $ | 5,320,208 | $ | 1,519,881 | ||||
| Supplemental cash flow information: | ||||||||
| Interest paid | $ | — | $ | — | ||||
| Income taxes paid, net | $ | 26,227 | $ | 21,663 | ||||
The accompanying notes are an integral part of these consolidated financial statements.
| 34 |
TILL CAPIAL LTD.
NOTES TO THE CONSOLIDATED FINANCIAL STATEMENTS
| 1. | NATURE OF OPERATIONS |
Till Capital Ltd. ("Till") was incorporated under the laws of Bermuda in August 2012 under the name Resource Holdings Ltd. In March 2014, Resource Holdings Ltd. changed its name to Till Capital Ltd. in accordance with Till's bye-laws and Section 10 of the Bermuda Companies Act 1981, as amended (the "Companies Act"). Till is an exempted holding company with its principal place of business at Continental Building, 25 Church Street, Hamilton HM12, Bermuda. Till's registered office is Crawford House, 50 Cedar Avenue, Hamilton HM 11, Bermuda and its registered agent is Compass Administration Services Ltd.
Till was formed to respond to the market need for more capacity for certain types of insurance and reinsurance. Till conducts its reinsurance business through Resource Re Ltd. (“RRL”), a wholly-owned subsidiary of Till that was incorporated in Bermuda in August 2012 and licensed as a Class 3A insurance company in Bermuda by the Bermuda Monetary Authority (“BMA”) in August 2013. RRL intends to offer property and casualty reinsurance coverage to a select group of insurance companies, e.g., captive insurers, privately-held insurers, other global insurers and reinsurers with capital constraints, and insurers and reinsurers that are under regulatory, capital, or ratings stress. RRL assumption reinsurance business has been, and expects to be, written through the Multi-Strat Re Ltd. ("MSRE") platform. The insurance business assumed from Multi-Strat Re is anticipated to be primarily medium- and long-tail coverage under customized reinsurance contracts with capped liabilities and diversification in specialty property and casualty lines of business. MSRE is a Bermuda based privately-held reinsurance company.
On May 15, 2015, Till acquired all of the issued and outstanding shares of Omega Insurance Holdings, Inc. (“Holdings”), a privately-held Toronto, Canada based holding company, including its subsidiaries, Omega General Insurance Company ("Omega"), a fully licensed insurance company, and Focus Group, Inc. ("Focus"), an insurance consulting and services company. Holdings offers innovative and customized solutions in a cost effective manner for insurers/reinsurers exiting the market and organizations with unique insurance needs.
The business strategy for both RRL and Holdings is to produce both underwriting profits and investment-related returns by investing reinsurance premiums and corporate capital.
| 2. | BASIS OF PRESENTATION |
Basis of presentation
The consolidated financial statements have been prepared in accordance with accounting principles generally accepted in the United States of America ("GAAP"). In the opinion of management, the accompanying consolidated financial statements contain all normal and recurring adjustments necessary to fairly present the consolidated financial position of Till and its subsidiaries at December 31, 2016 and 2015 and the results of operations and cash flows for the years then ended. The preparation of financial statements in conformity with GAAP requires management to make estimates and assumptions that affect the amounts reported in the consolidated financial statements and notes thereto. Actual results could differ from those estimates.
Prior to 2016, Till prepared its financial statements under International Financial Reporting Standards ("IFRS"), as issued by the International Accounting Standards Board ("IASB"), for reporting as required by securities regulators in Canada, and as permitted in the United States ("U.S.") based on Till's status as a foreign private issuer as defined by the U.S. Securities and Exchange Commission (the "SEC") for foreign private issuers. During 2016, Till determined that it no longer qualified as a foreign private issuer under the SEC rules. As a result, beginning with Till's annual report on Form 10-K for the year ended December 31, 2016, Till is required to comply with all of the periodic disclosure and current reporting requirements of the Securities Exchange Act of 1934 (the "Exchange Act"), as amended, applicable to U.S. domestic issuers. Under the Toronto Securities Exchange - Venture ("TSX-V") regulations,Till is permitted in Canada to prepare its consolidated financial statements in accordance with GAAP. The transition to GAAP was made retrospectively for all periods presented in Till's 2016 Form 10-K, including the consolidated financial statements.
| 35 |
The consolidated financial statements have been prepared in U.S. dollars as if the U.S. dollar had been the presentation currency since January 1, 2015. The functional currency for Till is the U.S. dollar. The exchange rates used in converting Canadian dollars to U.S. dollars were as follows:
| Years Ended | ||||||||
| December 31, 2016 | December 31, 2015 | |||||||
| Exchange rate comparisons at year end | US$1 = CDN$1.3427 | US$1 = CDN$1.3870 | ||||||
| Average exchange rate for the year | US$1 = CDN$1.3243 | US$1 = CDN$1.2785 | ||||||
Basic and diluted income (loss) per restricted voting share are calculated on Till's income (loss) expressed in U.S. dollars attributed to Till's shareholders divided by the weighted average number of Till shares outstanding during the year.
Exchange listing
In May 2015, Till completed a U.S. exchange listing to broaden its access to capital markets. Till’s restricted voting shares commenced trading on the NASDAQ Market Exchange ("NASDAQ") on May 26, 2015. Till’s Board of Directors also made a decision to change the currency presentation in Till's financial statements from Canadian dollars to U.S. dollars so that (i) investors in the U.S. can more easily understand Till’s financial results of operations and financial position, and (ii) Till's financial statements are more comparable to other companies in the U.S. market.
| 3. | SIGNIFICANT ACCOUNTING POLICIES |
The significant accounting policies used in the accompanying consolidated financial statements are as follows:
Basis of consolidation
The accompanying consolidated financial statements include the accounts of Till, its wholly-owned subsidiaries, and other entities in which Till has, or had, a controlling interest (a "controlled subsidiary"). None of Till's controlled subsidiaries are variable interest entities. Non-controlled minority interests in the consolidated financial statements are separately identified in the consolidated balance sheets and statements of income (loss) and comprehensive income (loss). All intercompany accounts and transactions have been eliminated in consolidation.
Where necessary, adjustments are made to the financial statements of the subsidiaries and controlled subsidiaries to conform their accounting policies with those used by Till.
| 36 |
Till's major subsidiaries and ownership interests as of December 31, 2016 and 2015 were as follows:
| Portion of Ownership Interest | ||||||||||||||||||
| Name of Subsidiary | Country of Incorporation | Functional Currency | December 31, 2016 | December 31, 2015 | Principal Activity | |||||||||||||
| Resource Re Ltd. | Bermuda | U.S. | 100 | % | 100 | % | Reinsurance | |||||||||||
| Silver Predator Corp. | Canada | Canadian | 64 | % | 72 | % | Mineral exploration | |||||||||||
| Omega Insurance Holdings Inc. | Canada | Canadian | 100 | % | 100 | % | Holding company | |||||||||||
| Omega General Insurance Company | Canada | Canadian | 100 | % | 100 | % | Insurance | |||||||||||
| Focus Group, Inc. | Canada | Canadian | 100 | % | 100 | % | Insurance consulting | |||||||||||
| Till Capital U.S. Holding Corp. | U.S.A. | U.S. | 100 | % | 100 | % | Holding company | |||||||||||
| Till Management Company | U.S.A. | U.S. | 100 | % | 100 | % | Investment management | |||||||||||
| Golden Predator U.S. Holding Corp. | U.S.A. | U.S. | 100 | % | 100 | % | Management services | |||||||||||
Estimates and assumptions
The preparation of consolidated financial statements in conformity with GAAP requires management to make estimates and assumptions that affect the reported amounts of assets and liabilities, the disclosure of contingent assets and liabilities at the date of the consolidated financial statements, and the reported amounts of revenues and expenses during the reporting period. Amounts in the accompanying consolidated financial statements represent Till’s best estimates and assumptions; however, the actual amounts could differ materially from those estimates. Till’s principal use of estimates and assumptions include fair value determination of certain investments and other than temporary impairment, valuation of derivative instruments, valuation of mineral rights and mining properties, valuation of purchased intangibles, assessment of goodwill impairment, projection of unpaid loss and loss expense adjustment reserves, assessment of reinsurance recoverable including any provision for uncollectible reinsurance, and valuation of deferred tax assets.
The application of the purchase method of accounting for business combinations requires the use of significant estimates and assumptions in determining the fair value of assets acquired and liabilities assumed to properly allocate the purchase price. The estimates of the fair value of the assets acquired and liabilities assumed are based on assumptions believed to be reasonable using established valuation techniques that consider a number of factors. Assets acquired and liabilities assumed in connection with business combinations are recorded based on their respective fair values at the date of acquisition. The identifiable intangible assets that Till has acquired are customer relationships and trade names. Goodwill is calculated as the excess of the cost of the acquired entity over the net fair value of the assets acquired and the liabilities assumed.
Fair Value
Fair value is the price that would be received to sell an asset or paid to transfer a liability in an orderly transaction between market participants (an exit price). When reporting the fair values of Till’s financial instruments, Till prioritizes those fair value measurements into one of three levels based on the nature of the inputs, as follows:
| • | Level 1 - Assets and liabilities with values based on unadjusted quoted prices for identical assets or liabilities in an active market that Till is able to access. |
| • | Level 2 - Assets and liabilities with values based on quoted prices for similar assets or liabilities in active markets, quoted prices for identical or similar assets in markets that are not active, or valuation models with inputs that are observable, directly or indirectly, for substantially the term of the asset or liability. |
| • | Level 3 - Certain inputs are unobservable (supported by little or no market activity) and significant to the fair value measurement. Unobservable inputs represent Till’s best estimate of what hypothetical market participants would use to determine a transaction price for the asset or liability at the reporting date based on the best information available in the circumstances. |
| 37 |
Till assesses the levels for the investments at each measurement date, and transfers between levels are recognized on the actual date of the event or change in circumstances that caused the transfer.
The fair values of quoted investments are determined based on the closing prices on the last business day of the reporting period from recognized exchanges (e.g., NASDAQ, the New York Stock Exchange, etc.), recognized indices, or pricing vendors. Securities that do not have quoted prices available in active markets are valued using observable inputs such as quoted prices in inactive markets, quoted prices in active markets for similar instruments, benchmark interest rates, broker quotes, and other relevant inputs. Till’s estimate of fair value corresponds with the interest rate environment that existed as of the close of business on December 31, 2016.
Because of their short-term nature, the carrying amounts for cash and cash equivalents, accrued investment income, and reinsurance recoverables approximate their fair values.
Derivatives are recognized at estimated fair value on the date a contract is entered into, the trade date, and are subsequently carried at estimated fair value. Derivative instruments with a positive estimated fair value are reported as derivative financial assets and those with a negative estimated fair value are reported as derivative financial liabilities.
Till’s non-financial assets, such as goodwill and property, plant, and equipment, are carried at cost or depreciated cost unless there are indicators of impairment, and are reported at fair value only when an impairment charge has been recognized.
Foreign currencies
Transactions denominated in currencies other than the functional currency are recorded using the exchange rates prevailing on the dates of the transactions. At each balance sheet date, monetary items denominated in foreign currencies are translated at the rates prevailing on the balance sheet date. Non-monetary items that are measured at historical cost in a foreign currency are translated using the exchange rate at the date of the transaction. Exchange differences that occur on the settlement of monetary items, and on the translation of monetary items, are recognized in the period in which they occur.
For the purpose of presenting the consolidated financial statements, the assets and liabilities of Till’s foreign operations, being those entities that have a functional currency different from that of Till, are translated into U.S. dollars at the rate of exchange prevailing at the end of the reporting period. Opening balances in shareholders' equity are translated at their historic rates.
Transactions in shareholders' equity are translated at the rates prevailing at the date of the transactions. Income and expenses transactions are translated at the average exchange rates for the period. Where those rates approximate the rates on the dates of transactions, and, where exchange differences occur, those differences are recognized as a component of equity.
Cash and cash equivalents
Cash and cash equivalents include cash on deposit with banks and highly liquid short-term interest-bearing investments with a maturity of three months or less at origination. Carrying amounts approximate fair value due to the short-term nature and high liquidity of the instruments.
Interest income earned on cash and cash equivalents is recognized on the effective interest rate method.
| 38 |
Investments
Purchases of investments in trading securities and available for sale investments are initially recorded at the purchase price on the trade date and are subsequently carried at fair value. Sales of investments are recorded at the sales price on the trade date. Realized gains and losses are included in income or loss in the period in which they occur. Unrealized gains and losses from changes in fair value of held for trading investments are included in income or loss. Unrealized gains and losses from changes in fair value of available for sale investments are included in accumulated other comprehensive income (loss) in shareholders’ equity. On disposal or sale of an available for sale investment, previously recorded unrealized gains and losses are removed from accumulated other comprehensive income (loss) in shareholders’ equity and included in current period income or loss.
Quarterly, Till performs an assessment of its investments to determine if any are impaired. An investment is impaired when the fair value of the investment declines to an amount less than the cost or amortized cost of that investment. As part of the assessment process, Till determines whether the impairment is temporary or “other-than-temporary”. Till bases its assessment on both quantitative criteria and qualitative information, considering a number of factors, including, but not limited to, how long the security has been impaired, the amount of the impairment, whether, in the case of equity securities, Till intends to hold, and has the ability to hold, the security for a period sufficient for Till to recover its cost basis, or whether, in the case of debt securities, (i) Till intends to sell the investment or it is more-likely-than-not that Till will have to sell the investment before it recovers the amortized cost or cost, (ii) the financial condition and near-term prospects of the issuer, as to whether the issuer is current on contractually-obligated interest and principal payments, and (iii) whether the market decline was affected by macroeconomic conditions.
If Till were to determine that an equity investment has incurred an “other-than-temporary” impairment, Till would permanently reduce the cost of that investment to fair value and recognize an impairment charge in its consolidated statements of comprehensive income (loss). If an investment in a debt security was impaired, and Till either intends to sell the security or it is more likely than not that Till will have to sell that security before it is able to recover the amortized cost, then Till would record the full amount of the impairment in its consolidated statements of comprehensive income (loss).
A large portion of Till’s investment portfolio consists of fixed maturity securities that may be adversely affected by changes in interest rates as a result of governmental monetary policies, domestic and international economic and political conditions, and other factors beyond Till’s control. A rise in interest rates would decrease the net unrealized holding gains of Till's investment portfolio, offset by Till’s ability to earn higher rates of return on funds reinvested. Conversely, a decline in interest rates would increase the net unrealized holding gains of Till's investment portfolio, offset by lower rates of return on funds reinvested.
Derivative financial instruments
Derivatives are recognized at estimated fair value on the date a contract is entered into, the trade date, and are subsequently carried at estimated fair value. Derivative instruments with a positive estimated fair value are reported as derivative financial assets and those with a negative estimated fair value are reported as derivative financial liabilities.
Derivative financial instruments include exchange-traded future and option contracts. They derive their value from the underlying instrument and are subject to the same risks as that underlying instrument, including liquidity, credit, and market risk. Till does not hold any derivatives classified as hedging instruments.
Derivative financial assets and liabilities are offset and the net amount is reported in the balance sheet only to the extent there is a legally enforceable right of offset and there is an intention to settle on a net basis, or to realize the assets and liabilities simultaneously. Derivative financial assets and liabilities are derecognized when Till has transferred substantially all of the risks and rewards of ownership or the liability is discharged, canceled, or expired.
| 39 |
Insurance product classification
An insurance policy is a contract where the insurer has accepted insurance risk from the policyholder(s) by agreeing to compensate the policyholders if one or more specified uncertain future events (the insured event) adversely affects the policyholder.
Once a policy, or reinsurance agreement, has been classified as an insurance contract, it remains classified as an insurance contract for the remainder of its lifetime, even if the insurance risk reduces significantly during that period.
Premium revenue and unearned premiums
Insurance premiums are generally recorded as written on the date that coverage begins. Those written premiums, for both insurance and reinsurance products, are primarily earned on a pro rata basis over the term of the policies to which they relate. Unearned premiums represent the portion of the premiums written applicable to the unexpired portion of the policies in force.
Insurance premiums written and insurance premiums earned may also include various adjustments that occur during the accounting period for premiums receivable with respect to business written in prior periods.
Assumption reinsurance includes retroactive loss portfolio transfer contracts. Premiums are received from other insurance companies and those premiums are reported as revenue over the estimated period of run-off of the underlying insurance portfolio. At the same time, the actuarially determined estimate of unpaid losses, including loss adjustment expenses, the impact of any existing reinsurance on the portfolio transferred, and other costs of the transaction, are also reported over the estimated period of run-off of the underlying insurance portfolio assumed.
During the period that the underlying insurance coverage of the assumed reinsurance business is in effect, the unearned premiums are reported as revenue on a pro rata basis over the term of the remaining underlying insurance policies. The impact of any reinsurance ceded on the portfolio is reported as an expense at the time that the reinsurance contract is entered into.
Deferred policy acquisition costs
Commissions, premium taxes, and other expenses that relate directly to the acquisition of premiums written are deferred and amortized over the terms of the related policies to the extent they are considered recoverable from unearned premiums.
Deferred policy acquisition costs (“DPAC”) are reviewed regularly for recoverability from unearned premiums, including investment income thereon. A premium deficiency, i.e., unrecoverable DPAC, occurs to the extent that unearned premiums plus anticipated investment income are not considered adequate to cover all DPAC and related insurance claims and expenses, and would be recognized in the period the deficiency is identified. Till has determined that no premium deficiency existed at December 31, 2016 or 2015.
Reserve for unpaid losses and loss adjustment expenses
A liability is established for the estimated unpaid losses and loss adjustment expenses under the terms of Till’s insurance subsidiaries’ policies and reinsurance agreements. The reserve for unpaid losses and loss adjustment expenses represents the estimated ultimate cost of settling all reported unpaid losses and related loss adjustment expenses, and losses that have been incurred but net yet reported ("IBNR").
| 40 |
Till's insurance subsidiaries estimate the reserve for unpaid losses and loss adjustment expenses using individual case-based estimates for reported claims and actuarial estimates for IBNR losses. Till, through its insurance subsidiaries, continually reviews and adjusts its estimated losses as necessary based on industry development trends, Till’s evolving claims experience, and new information obtained. If Till’s unpaid losses and loss adjustment expenses are considered to be deficient or redundant, Till increases or decreases the liability in the period in which Till identifies the difference and reports the change in its current period results of operations. Because Till’s estimate of the ultimate cost of settling all reported and unreported claims may change at any point in the future, a possibility exists that the ultimate cost may vary significantly from the estimated amounts included in Till’s consolidated financial statements.
Till reports its reserves for unpaid losses and loss adjustment expenses gross of the amounts related to unpaid losses recoverable from reinsurers and reports losses net of amounts ceded to reinsurers. Till does not discount its loss reserves for financial statement purposes.
Reinsurance
Till’s insurance subsidiaries assume and cede reinsurance. Ceded reinsurance can provide the opportunity for increased diversification of business and an ability to minimize the net loss potential attributable to the insured risks. Ceded reinsurance does not relieve the ceding company of its primary obligation to its policyholders. For both ceded and assumed reinsurance, risk transfer requirements must be met to properly account for the related contract as reinsurance.
Reinsurance receivable represents balances due from reinsurance companies for paid losses and unpaid premiums due from the reinsurer. In the event that losses are incurred that are recoverable under its reinsurance program, Till records amounts recoverable from its reinsurers on paid losses plus an estimate of amounts recoverable on unpaid losses. As is the case with the estimate of unpaid losses and loss adjustment expenses, Till's estimate of amounts recoverable on unpaid losses and loss adjustment expenses is a function of Till’s liability for unpaid losses and loss adjustment expenses associated with the reinsured policies; therefore, those amounts can change in conjunction with any changes to the estimate of unpaid losses and loss adjustment expenses. The estimate of amounts recoverable from reinsurers on unpaid losses and loss adjustment expenses may change at any point in the future because of its relation to Till’s reserves for unpaid losses and loss adjustment expenses, which change could vary significantly from the initial estimates.
Reinsurance receivable is reported net of uncollectible reinsurance determined based on a review of the financial conditions of the reinsurers and other factors. At December 31, 2016 and 2015, there was no provision for uncollectable reinsurance.
Till’s insurance subsidiaries front and also assume a portion or all of the insurance risk of other insurance companies. The reinsurance payables include premiums due to reinsurers and amounts payable for paid losses and loss adjustment expenses under assumption contracts. In the event of a loss related to assumption business that is incurred but not yet settled or paid, the related reserve is included in the unpaid loss and loss adjustment expense amounts.
Property, plant, and equipment
Property, plant, and equipment are carried at cost less accumulated depreciation and any impairment charges. Depreciation is recorded on a straight-line basis over the estimated useful life of the asset. Residual values and useful lives are reviewed annually. Impairment losses and gains and losses on disposals of property, plant, and equipment are included in the consolidated statements of comprehensive loss.
Mineral interests
Significant payments related to the acquisition of land and mineral rights are capitalized. Costs incurred before technical and commercial viability of a mineral property has been demonstrated are expensed and classified as exploration expense. Capitalization of mine development costs begins once all operating permits have been secured, technical feasibility has been determined, and a decision to develop has been made.
| 41 |
If it is determined that capitalized costs are not recoverable, the property is abandoned, or, if management has determined that there is an impairment in value, the property is written down to its recoverable amount. Mineral properties are reviewed for impairment when facts and circumstances suggest that the carrying amount may exceed the recoverable amount.
From time to time, Till acquires or disposes of properties pursuant to the terms of option agreements. Options are exercisable entirely at the discretion of the optionee and, accordingly, are recorded as mineral property costs or recoveries when the payments are made or received. After all costs relating to a property have been recovered, further payments received are reported as a gain on option or disposition of mineral property.
Reclamation bonds
Reclamation bonds include bonds that have been pledged for mining-related reclamation and closure activities and that are not available for immediate disbursement.
Goodwill
Goodwill represents the excess of the cost of acquisitions over the fair value of net assets acquired and is not amortized. Goodwill is subject to evaluation for impairment using a fair value based test. That evaluation is performed annually, during the fourth quarter or more frequently if facts and circumstances warrant. Till uses a qualitative approach to test goodwill for impairment by first assessing qualitative factors to determine whether it is more-likely-than-not that the fair value of a reporting unit is less than its carrying amount as a basis for determining whether it is necessary to perform the two-step goodwill impairment test. If required following the qualitative assessment, the first step in the goodwill impairment test involves comparing the fair value of each of its reporting units to the carrying value of those reporting units. If the carrying value of a reporting unit exceeds the fair value of the reporting unit, Till is required to proceed to the second step. In the second step, the fair value of the reporting unit would be allocated to the assets (including unrecognized intangibles) and liabilities of the reporting unit, with any residual representing the implied fair value of goodwill. An impairment loss would be recognized if, and to the extent that, the carrying value of goodwill exceeded the implied value. Till reviews amortizable intangible assets for impairment whenever events or circumstances indicate that carrying amounts may not be recoverable. If Till concludes that an impairment exists, the carrying amount is reduced to fair value.
Impairment of long-lived assets
Till assesses the recoverability of long-lived assets when events or circumstances indicate that the assets might have become impaired. Till determines whether the assets can be recovered from undiscounted future cash flows and, if not recoverable, Till recognizes the impairment by reducing the carrying value to fair value. Recoverability of long-lived assets is dependent on, among other things, Till’s ability to maintain profitability, so as to be able to meet its obligations when they become due. No such impairment was recognized in 2015 or 2016.
Other revenue
Other revenue primarily represents consulting and service fees earned by Focus.
Stock-based compensation
Till measures stock-based compensation at the grant date based on the fair value of the award and recognizes stock-based compensation expense over the requisite vesting period. Determining the fair value of stock option awards requires judgment, including estimates of stock price volatility, forfeiture rates, and expected option life.
| 42 |
Income taxes
Income tax expense represents the sum of the tax currently payable and deferred. The tax currently payable is based on taxable earnings for the period. Taxable income differs from income as reported in the consolidated statements of comprehensive loss because it excludes items of income or expense that are taxable or deductible in non-current periods and it further excludes items that are never taxable or deductible. Till’s liability for current tax is calculated using tax rates that have been enacted or substantively enacted by the balance sheet date.
Till recognizes deferred tax assets and liabilities for the future tax consequences attributable to differences between the financial statement carrying amounts of existing assets and liabilities and their respective tax bases. Till measures deferred tax assets and liabilities using enacted tax rates expected to apply to taxable income in the years in which it expects to recover or settle those temporary differences. Should a change in tax rates occur, Till recognizes the effect on deferred tax assets and liabilities in operations in the period that includes the enactment date of the related change. Realization of Till’s deferred income tax assets depends on Till having sufficient future taxable income.
Till recognizes the financial statement benefit of a tax position only after determining that the relevant tax authority would more-likely-than-not sustain the position following an audit. For tax positions meeting the more-likely-than-not threshold, the amount recognized in the consolidated financial statements is the largest benefit that has a greater than 50% likelihood of being realized at the time of an ultimate settlement with the relevant taxing authority.
Deferred tax is calculated at the tax rates that are expected to apply in the period when the liability is settled or the asset realized, based on tax rates and tax laws that have been enacted or substantively enacted by the balance sheet date. Deferred tax is charged or credited to income, except when it relates to items charged or credited directly to equity, in which case the deferred tax is recognized in equity.
Income tax assets and liabilities are offset when there is a legally enforceable right to offset the assets and liabilities and when they relate to income taxes levied by the same tax authority on either the same taxable entity or different taxable entities where there is an intention to settle the balance on a net basis.
Income (loss) per share
Basic income (loss) per share is computed by dividing net income (loss) attributable to restricted voting shares by the weighted average number of shares outstanding during the reporting period. Diluted income (loss) per share is computed similar to basic income (loss) per share computation except that the weighted average shares outstanding are increased to include additional shares for the assumed exercise of stock options and warrants, if dilutive. The number of additional shares is calculated by assuming that outstanding stock options and warrants were exercised and that the proceeds from such exercises were used to acquire common stock at the average market price during the reporting periods. In periods of loss, all unexercised options and warrants are considered anti-dilutive.
Accounting pronouncements
The recent accounting pronouncements described below have had or may have a significant effect on Till's consolidated financial statements or on its disclosures on future adoption. Till does not discuss recent pronouncements that (i) are not anticipated to have an impact on Till or (ii) are unrelated to Till's financial condition, results of operations, or related disclosures.
In May 2014, the Financial Accounting and Standards Board ("FASB") issued Accounting Standard Update ("ASU") No. 2014-09, Revenue from Contracts with Customers (Topic 606). Topic 606 provides guidance on revenue recognition for entities that enter into contracts with customers to transfer goods or services or enter into contracts for the transfer of nonfinancial assets. The core principle of the guidance is that an entity should recognize revenue to depict the transfer of promised goods or services to customers in an amount that represents the consideration that the entity expects to be entitled to in exchange for those goods or services. Additional disclosures are required to provide quantitative and qualitative information regarding the nature, amount, timing, and uncertainty of revenue and cash flows arising from contracts with customers. Topic 606 is effective for annual reporting periods, and interim reporting periods within those annual periods, beginning after December 15, 2017. Earlier application is permitted only as of annual reporting periods beginning after December 15, 2016, including interim reporting periods within that reporting period. Till is continuing to evaluate the impact of the new guidance on its consolidated financial statements. Till believes the new guidance will be less complex and will not have a significant impact on its financial statements.
| 43 |
In May 2015, the FASB issued ASU No. 2015-09, Financial Services - Insurance (Topic 944), that requires additional disclosures for short-duration insurance contracts. Till adopted those disclosures as of December 31, 2016, and has included, in Note 7, disclosures that provide more information about initial claim estimates and subsequent adjustments to those estimates, the methodologies and judgments used to estimate claims, and, if available, the timing, frequency, and severity of claims. This guidance requires a change in disclosure only and adoption of this guidance did not have any effect on Till's financial condition or results of operations.
In September 2015, the FASB issued ASU Topic 2015-16, Business Combinations (Topic 805): Simplifying the Accounting for Measurement-Period Adjustments, that allows an entity to recognize adjustments to provisional amounts in a business combination in the reporting period in which the adjustment amounts are determined. Topic 805 is effective for fiscal year 2017 and is expected to be adopted by Till in 2017. Till does not expect the adoption of this standard to have a material impact on its financial statements.
In January 2016, the FASB issued ASU Topic 2016-01, Financial Statements - Overall (Topic 825-10): Recognition and Measurement of Financial Assets and Financial Liabilities, that requires equity investments to be measured at fair value with changes in fair value recognized in income, use of the exit price notion when measuring the fair value of financial instruments for disclosure purposes, separate presentation of financial assets and financial liabilities by measurement category and form of financial asset on the balance sheet or the accompanying notes to the financial statements, present separately in other comprehensive income the portion of the total change in the fair value of a liability resulting from a change in the instrument-specific credit risk, and eliminates the requirement to disclose the method(s) and significant assumptions used to estimate the fair value that is required to be disclosed for financial instruments measured at amortized cost on the balance sheet. Topic 825-10 is effective for annual periods beginning after December 15, 2017, including interim periods within those annual periods, with early adoption permitted for certain requirements. Till is assessing the impact of adopting this accounting standard on its consolidated financial statements and related disclosures.
In February 2016, the FASB issued guidance that affects the recognition, measurement, presentation and disclosure of leases. The new guidance requires substantially all leases to be reported on the balance sheet as right-to-use assets and lease liabilities, as well as additional disclosures. The standard is effective as of January 1, 2019, and early adoption is permitted. While Till has limited leasing activities, Till is in the early stages of evaluating the impact of the new guidance on its consolidated financial statements.
In March 2016, the FASB issued ASU Topic 2016-09, Compensation-Stock Compensation (Topic718), that requires recognition of the excess tax benefits or deficiencies of share-based awards through net income rather than through additional paid in capital. Additionally, the guidance allows for an election to account for forfeitures related to share-based payments either as they occur or through an estimation method. Till expects to adopt this guidance beginning in the first quarter of 2017.
In January 2017, the FASB issued updated guidance on goodwill impairment testing requiring entities to calculate the implied fair value of goodwill through a hypothetical purchase price allocation. Under the updated guidance, impairment will have to be recognized as the amount by which a reporting unit’s carrying value exceeds its fair value. The standard is effective for Till in the first quarter of 2020 on a prospective basis with early adoption permitted. Till is evaluating the impact of this guidance.
| 44 |
No other new accounting pronouncement issued or effective during 2016 had or is expected to have a material impact on Till's consolidated financial statements or disclosures.
| 4. | ACQUISITION OF OMEGA INSURANCE HOLDINGS INC. |
On May 15, 2015, Till completed the acquisition of Holdings, including its subsidiaries, Omega and Focus. That acquisition enabled Till to write direct insurance and to provide those insurers wishing to access the Canadian market an ability to do so in an efficient manner, through reinsurance, and to provide those insurers wishing to exit the Canadian market, through a company with experience in handling "run-off" business, an ability to facilitate such an exit so that their financial and legal obligations are met on a continuing basis, while being able to repatriate surplus capital in a more timely fashion.
In the second quarter of 2015, Till reported a purchase price of $14,062,970 for Holdings, an amount that represented 1.2 times Holdings' book value as of the closing date and an additional amount for two pending insurance transactions then in process. All payments were subject to a 5% hold-back to be paid to Holdings' shareholders based on Holdings' 2015 results of operations, and adjusted to give effect to any adverse development above 10% in loss reserves, as calculated from the closing date until December 31, 2015. Subsequent to December 31, 2015, it was determined that Holdings' results required payment of the holdback; that holdback amount was paid in March 2016.
One of the two pending insurance transactions closed in the third quarter of 2015 and the other one closed in October 2015. The final amount for the two insurance transactions was $730,994. Accordingly, the final purchase price was $14,042,084.
Transaction-related costs in the amount of $47,911 were expensed in general and administrative expenses in 2015.
| 45 |
Till completed the identification and valuation of all identifiable assets and liabilities related to the acquisition in 2015. A summary of the allocation of the purchase price of Holdings to the fair value of the assets acquired and liabilities assumed at the date of acquisition is as follows:
| Consideration: | ||||
| 1.2 times the Holdings' book value as of May 15, 2015 | $ | 13,311,090 | ||
| Pending insurance transactions | 730,994 | |||
| Total purchase price | $ | 14,042,084 | ||
| Fair value of assets acquired: | ||||
| Cash and cash equivalents | $ | 463,339 | ||
| Investments | 21,578,246 | |||
| Accrued investment income | 287,991 | |||
| Other receivables | 3,357,467 | |||
| Goodwill | 3,368,321 | |||
| Intangible asset | 630,858 | |||
| Capital assets | 45,774 | |||
| Deferred income taxes | 600,668 | |||
| Total fair value of assets acquired | 30,332,664 | |||
| Fair value of liabilities assumed: | ||||
| Reserve for unpaid losses and loss adjustment expenses ($13,225,004), less unpaid losses ceded ($4,400,547) | 8,824,457 | |||
| Accounts payable and accrued liabilities | 3,742,756 | |||
| Other liabilities | 3,723,367 | |||
| Total fair value of liabilities assumed | 16,290,580 | |||
| Fair value of net assets acquired | $ | 14,042,084 | ||
Till attributed $3,368,321 of the Holdings' purchase price to goodwill. Holdings' results of operations have been included in Till's consolidated financial statements from the date of acquisition.
The amount of goodwill related to the acquisition of Holdings is subsequently adjusted for the foreign exchange translation. The goodwill on Till's consolidated balance sheets is summarized as follows:
| 2016 | 2015 | |||||||
| Balance, January 1 | $ | 2,913,110 | $ | — | ||||
| Acquired goodwill | — | 3,368,321 | ||||||
| Foreign exchange translation and other adjustments | 67,709 | (455,211 | ) | |||||
| Balance, December 31 | $ | 2,980,819 | $ | 2,913,110 | ||||
| 5. | ASSETS HELD FOR SALE |
In the second quarter of 2015, Till's controlled subsidiary, Silver Predator Corp. ("SPD"), announced its intention to realize value from some of its assets by initiating a process to sell all, or part, of the tangible and mineral property assets at some of its properties in Nevada. SPD’s Board of Directors and management committed to a plan to sell Springer Mining Company ("SMC") and the Taylor mill. Since initiating that process, active negotiations have been held related to the sale of those assets. On August 10, 2016, SPD completed a private placement whereby SPD sold 15,000,000 shares of its common shares at CDN$0.05 per share for total proceeds of CDN$732,556 (US$560,868), including CDN$17,444 (US$13,356) in share issuance costs.
| 46 |
During the fourth quarter of 2016, SPD received $224,990 from the sale of multiple pieces of equipment at the Taylor mill resulting in a gain of $224,990 as the Taylor mill assets had a book value of $-0-.
SPD has informed Till that SPD considers it probable that (i) the sale of SMC will be completed in one year; therefore, those assets are classified as assets held for sale and are measured at the lower of carrying amount and fair value less cost to sell at December 31, 2016 and (ii) the sale of the remaining Taylor mill assets is expected to be completed within one year; therefore, those assets are classified as assets held for sale and are measured at the lower of carrying amount and fair value less cost to sell at December 31 2016. Assets held for sale at December 31, 2016 and 2015 are as follows:
| December 31, 2016 | December 31, 2015 | |||||||
| Assets held for sale: | ||||||||
| Cash, accounts receivable, and prepaid expenses | $ | 23,399 | $ | — | ||||
| Reclamation bonds | 32,401 | — | ||||||
| Mineral properties | 488,871 | 544,071 | ||||||
| Property, plant, and equipment | 3,998,568 | 3,998,568 | ||||||
| Total | $ | 4,543,239 | $ | 4,542,639 | ||||
| 6. | PROMISSORY NOTE RECEIVABLE AND INVESTMENT IN GOLDEN PREDATOR MINING CORP. |
Loss of control of subsidiary
On September 2, 2015, Till entered into a separation agreement with Mr. William M. Sheriff, a former officer and director. As part of that process, 7,100,000 shares of Till's controlled subsidiary, Golden Predator Mining Corp. ("GPY"), were transferred to Mr. Sheriff. As a result, Till no longer has a controlling interest in GPY. Accordingly, Till consolidated GPY through September 2, 2015 and recognized a $2,696,834 gain from loss of control of subsidiary. The remaining 11,812,154 GPY shares held by Till were reported as an available for sale investment.
| Fair value of promissory note | $ | 2,570,950 | ||
| Fair value of options issued | (163,868 | ) | ||
| Fair value of retained investment | 446,281 | |||
| 2,853,363 | ||||
| Assets of GPY derecognized | (1,725,403 | ) | ||
| Liabilities of GPY derecognized | 467,343 | |||
| Non-controlling interest | 1,101,531 | |||
| (156,529 | ) | |||
| Gain from loss of control of subsidiary | $ | 2,696,834 |
With the loss of control, Till derecognized the assets and liabilities of GPY, the former subsidiary, along with the non-controlling interests, and the cumulative translation amount related to the cumulative foreign exchange adjustments that had been reported in equity. The resulting gain was recognized in 2015.
Options on GPY shares
As part of the separation agreement between Till and Mr. Sheriff, Till granted Mr. Sheriff two assignable options, each with a term of 18 months, to purchase the balance of Till’s ownership of 11,812,154 GPY shares. The initial derivative liability associated with those options was $163,868 and was included in the 2015 gain from loss of control. Thereafter, the financial derivative has been reported at fair value until the options were exercised at which time the carrying amount became $-0-. If an option were to be exercised prior to that date, the carrying amount of the financial derivative would be included in the sale proceeds of the investment. At December 31, 2015, that derivative liability was $337,684.
| 47 |
The first option was for Mr. Sheriff to purchase up to 5,500,000 of Till’s GPY shares, according to a staggered schedule and price, was as follows:
a) if exercised by September 30, 2015, at CDN$0.11 per share
b) if exercised by October 31, 2015, at CDN$0.12 per share
c) if exercised by November 30, 2015, at CDN$0.13 per share
d) if exercised by December 23, 2015, at CDN$0.14 per share, and
e) if exercised after December 23, 2015 and before March 1, 2017, at CDN$0.15 per share
The second option was for Mr. Sheriff to purchase up to 6,312,154 of Till’s GPY shares before March 1, 2017 at CDN$0.15 per share. Till could accelerate the expiry of either option to a date 45 days after Till gives notice to the holder at any time after the ten-day volume-weighted average price (“VWAP”) of the GPY shares is at or above CDN$0.25 per share. On May 12, 2016, Till gave notice to Mr. Sheriff that Till had elected to accelerate the expiry of both options to June 26, 2016 due to the VWAP criteria being met.
Mr. Sheriff and an assignee have exercised all 11,812,154 GPY share options. The first transaction was completed on September 30, 2015 for 500,000 shares at an exercise price of CDN$0.11 per share, the second transaction was completed on October 30, 2015 for 800,000 shares at an exercise price of CDN$0.12 per share, the third transaction was completed on May 17, 2016 for 200,000 shares at an exercise price of CDN$0.15, and the fourth and final transaction was completed on June 7, 2016 for 10,312,154 shares at an exercise price of CDN$0.15. As a result, as of December 31, 2016, there is no derivative liability associated with the options and Till no longer owns shares of GPY. For reference purposes, as of December 31, 2016, the exchange rate was CDN$1.00 equaled US$0.74.
Promissory note
Till holds a promissory note receivable from GPY with a face amount of CDN$3,753,332 (US$2,570,950). That promissory note bears interest at 6% per annum to June 1, 2016, 8% per annum to June 1, 2017, and 12% thereafter. That promissory note was eliminated in consolidation until such time as GPY was no longer a controlled subsidiary.
The first installment of CDN$717,450 (US$546,545) was received on May 25, 2016. The remaining balance of that promissory note is repayable in amounts, including interest, of CDN$1,256,000 on June 1, 2017, CDN$1,364,000 on June 1, 2018, and CDN$1,232,000 on June 1, 2019. All amounts are to be paid in cash. That promissory note is secured by the shares of GPY's 100% owned subsidiary, Golden Predator Exploration, Ltd., and by GPY's interests in the Brewery Creek and 3 Aces properties.
With the loss of control of GPY on September 2, 2015, that promissory note was initially recognized at fair value, and has subsequently been carried at amortized cost using the effective interest rate method.
| 2016 | 2015 | |||||||
| Balance, January 1 | $ | 2,463,262 | $ | — | ||||
| Principal balance at date of loss of control of GPY | — | 2,570,950 | ||||||
| Principal payment | (421,522 | ) | — | |||||
| Interest | 271,971 | 40,479 | ||||||
| Foreign exchange gain (loss) | 96,783 | (148,167 | ) | |||||
| Balance, December 31 | $ | 2,410,494 | $ | 2,463,262 | ||||
| 48 |
| 7. | INVESTMENTS |
The following tables summarize the differences between cost or amortized cost and fair value, by major investment category, at December 31, 2016 and 2015:
Trading investments
| Amortized Cost | Unrealized Gains | Unrealized Losses | Fair Value | |||||||||||||
| December 31, 2016: | ||||||||||||||||
| Equity Securities - natural resource sector | $ | 642,914 | $ | 4,515 | $ | 134,536 | $ | 512,893 | ||||||||
| Equity securities - all other sectors | 1,828,778 | — | 395,689 | 1,433,089 | ||||||||||||
| Total | $ | 2,471,692 | $ | 4,515 | $ | 530,225 | $ | 1,945,982 | ||||||||
| December 31, 2015: | ||||||||||||||||
| Equity Securities - natural resource sector | $ | 2,084,927 | $ | 410,850 | $ | 324,920 | $ | 2,170,857 | ||||||||
| Equity securities - all other sectors | 800,924 | 730,443 | 2,155 | 1,529,212 | ||||||||||||
| Total | $ | 2,885,851 | $ | 1,141,293 | $ | 327,075 | $ | 3,700,069 | ||||||||
Available for sale investments
| Amortized Cost | Unrealized Gains | Unrealized Losses | Fair Value | |||||||||||||
| December 31, 2016: | ||||||||||||||||
| Canadian government bonds and provincial bonds | $ | 8,114,813 | $ | 58,709 | $ | 6 | $ | 8,173,516 | ||||||||
| Equity securities - bond funds | 4,467,788 | — | 48,439 | 4,419,349 | ||||||||||||
| Equity securities - natural resource sector | 335,267 | 661,555 | 14,895 | 981,927 | ||||||||||||
| Total | $ | 12,917,868 | $ | 720,264 | $ | 63,340 | $ | 13,574,792 | ||||||||
| December 31, 2015: | ||||||||||||||||
| Canadian government bonds and provincial bonds | $ | 14,478,099 | $ | 155,086 | $ | — | $ | 14,633,185 | ||||||||
| Equity securities - bond funds | 4,325,877 | 12,257 | — | 4,338,134 | ||||||||||||
| Equity securities - natural resource sector | 1,072,342 | 657,151 | 217,690 | 1,511,803 | ||||||||||||
| Total | $ | 19,876,318 | $ | 824,494 | $ | 217,690 | $ | 20,483,122 | ||||||||
Total Investments
| Amortized Cost | Unrealized Gains | Unrealized Losses | Fair Value | |||||||||||||
| December 31, 2016: | ||||||||||||||||
| Held for trading | $ | 2,471,692 | $ | 4,515 | $ | 530,225 | $ | 1,945,982 | ||||||||
| Available for sale | 12,917,868 | 720,264 | 63,340 | 13,574,792 | ||||||||||||
| Total | $ | 15,389,560 | $ | 724,779 | $ | 593,565 | $ | 15,520,774 | ||||||||
| December 31, 2015: | ||||||||||||||||
| Held for trading | $ | 2,885,851 | $ | 1,141,293 | $ | 327,075 | $ | 3,700,069 | ||||||||
| Available for sale | 19,876,318 | 824,494 | 217,690 | 20,483,122 | ||||||||||||
| Total | $ | 22,762,169 | $ | 1,965,787 | $ | 544,765 | $ | 24,183,191 | ||||||||
Realized gain (loss) on investments, net:
Till calculates the gain or loss realized on the sale of investments by comparing the sales price (fair value) to the cost or amortized cost of the security sold. Till determines the cost or amortized cost of the bonds sold using the specific-identification method and all other securities sold using the average cost method.
Held for trading investments
The net realized gain from sales of held for trading investments was $1,408,337 for the year ended December 31, 2016 and a loss of $86,901 in 2015.
| 49 |
Available for sale investments
| 2016 | 2015 | |||||||||||||||
| Gains (Losses) | Fair Value at Sale | Gains (Losses) | Fair Value at Sale | |||||||||||||
| Year ended December 31: | ||||||||||||||||
| Equities | $ | 1,429,623 | $ | 2,077,634 | $ | — | $ | — | ||||||||
| Canadian provincial bonds | 42,741 | 3,794,578 | 1,672 | 3,100,905 | ||||||||||||
| Total realized gains | 1,472,364 | 5,872,212 | 1,672 | 3,100,905 | ||||||||||||
| Equities | (16,958 | ) | 116,864 | (32,728 | ) | 53,225 | ||||||||||
| Canadian provincial bonds | (211 | ) | 2,868,812 | — | — | |||||||||||
| Total realized losses | (17,169 | ) | 2,985,676 | (32,728 | ) | 53,225 | ||||||||||
| Net realized gains (losses) | $ | 1,455,195 | $ | 8,857,888 | $ | (31,056 | ) | $ | 3,154,130 | |||||||
The following tables summarize Till's fixed maturities by contractual maturity periods. Actual results may differ as issuers may have the right to call or prepay obligations, with or without penalties, prior to the contractual maturity of those obligations.
| December 31, 2016 | ||||||||||||||||
| Amortized Cost | Percent of Total | Fair Value | Percent of Total | |||||||||||||
| Due in one year or less | $ | 2,063,193 | 16 | % | $ | 2,064,575 | 16 | % | ||||||||
| Due after one year through five years | 8,309,375 | 66 | 8,315,177 | 66 | ||||||||||||
| Due after five years through 10 years | 2,210,033 | 18 | 2,213,113 | 18 | ||||||||||||
| Due after ten years | — | — | — | — | ||||||||||||
| Total | $ | 12,582,601 | 100 | % | $ | 12,592,865 | 100 | % | ||||||||
| December 31, 2015 | ||||||||||||||||
| Amortized Cost | Percent of Total | Fair Value | Percent of Total | |||||||||||||
| Due in one year or less | $ | 3,952,149 | 21 | % | $ | 3,951,504 | 21 | % | ||||||||
| Due after one year through five years | 10,870,885 | 58 | 11,008,803 | 58 | ||||||||||||
| Due after five years through 10 years | 3,980,942 | 21 | 4,011,012 | 21 | ||||||||||||
| Due after ten years | — | — | — | — | ||||||||||||
| Total | $ | 18,803,976 | 100 | % | $ | 18,971,319 | 100 | % | ||||||||
Net change in unrealized gain (loss) on investments:
Available for sale investments
| Years Ended | ||||||||
| December 31, 2016 | December 31, 2015 | |||||||
| Canadian government and provincial bonds | $ | (96,382 | ) | $ | 155,086 | |||
| Bond funds | (60,696 | ) | 12,257 | |||||
| Equities | 207,200 | 439,460 | ||||||
| Included in accumulated other comprehensive income | $ | 50,122 | $ | 606,803 | ||||
| 50 |
Investment income (expense):
| Years Ended | ||||||||
| December 31, 2016 | December 31, 2015 | |||||||
| Net interest and dividends | $ | 582,198 | $ | 249,883 | ||||
| Investment related expenses | (700,359 | ) | (879,385 | ) | ||||
| Total | $ | (118,161 | ) | $ | (629,502 | ) | ||
Investment income (loss), net:
| Years Ended | ||||||||
| December 31, 2016 | December 31, 2015 | |||||||
| Net gain on held for trading securities | $ | 1,408,337 | $ | 86,901 | ||||
| Net realized gain (loss) on available for sale securities | 1,455,195 | (31,056 | ) | |||||
| Change in unrealized loss on derivative liability | 337,684 | (191,850 | ) | |||||
| Net investment expense | (118,161 | ) | (629,502 | ) | ||||
| Total | $ | 3,083,055 | $ | (765,507 | ) | |||
The following table presents information about Till’s assets stated at fair value:
| December 31, 2016 | ||||||||||||||||
| Total | Level 1 | Level 2 | Level 3 | |||||||||||||
| Canadian government bonds and provincial bonds | $ | 12,592,865 | $ | 4,419,349 | $ | 8,173,516 | $ | — | ||||||||
| Equity securities | 2,927,909 | 2,694,945 | 232,964 | — | ||||||||||||
| Total investments | $ | 15,520,774 | $ | 7,114,294 | $ | 8,406,480 | $ | — | ||||||||
| December 31, 2015 | ||||||||||||||||
| Total | Level 1 | Level 2 | Level 3 | |||||||||||||
| Canadian government bonds and provincial bonds | $ | 18,971,320 | $ | 4,410,233 | $ | 14,561,087 | $ | — | ||||||||
| Equity securities | 5,211,871 | 4,585,122 | 626,749 | |||||||||||||
| Total investments | $ | 24,183,191 | $ | 8,995,355 | $ | 15,187,836 | $ | — | ||||||||
| 51 |
The following table presents an aging of Till’s unrealized investment losses on available for sale investments by investment class as of December 31, 2016 and December 31, 2015:
| Less than Twelve Months | Twelve Months or More | |||||||||||||||||||||||
| Number of Securities | Gross Unrealized Losses | Fair Value | Number of Securities | Gross Unrealized Losses | Fair Value | |||||||||||||||||||
| December 31, 2016 | ||||||||||||||||||||||||
| Canadian government bond | 1 | $ | 6 | $ | 186,165 | — | $ | — | $ | — | ||||||||||||||
| Equity securities - bond funds | — | — | — | 2 | 48,439 | 4,419,349 | ||||||||||||||||||
| Equity security - natural resource sector | — | — | — | 1 | 14,895 | — | ||||||||||||||||||
| Total | 1 | $ | 6 | $ | 186,165 | 3 | $ | 63,334 | $ | 4,419,349 | ||||||||||||||
| December 31, 2015 | ||||||||||||||||||||||||
| Equity securities - natural resource sector | 1 | $ | 15,567 | $ | 72,098 | 3 | $ | 202,123 | $ | 440,007 | ||||||||||||||
Equity Investment in Limited Liability Company
Till, through RRL, has an investment in a limited liability company (“LLC”) that is accounted for under the equity method of accounting that is summarized as follows:
| December 31, 2016 | December 31, 2015 | |||||||
| Beginning of year | $ | 1,089,570 | $ | 1,080,000 | ||||
| Additional investments | 219,179 | 70,000 | ||||||
| Share of accumulated equity method losses | (60,258 | ) | (60,430 | ) | ||||
| End of year | $ | 1,248,491 | $ | 1,089,570 | ||||
| Till's ownership percentage | 3.59 | % | 3.21 | % | ||||
On December 17, 2016, Till, through RRL, entered in to an unsecured loan agreement with that LLC. Under that loan agreement, the principal amount loaned by RRL was $400,000, the annual interest rate is 15%, and the loan and accrued interest are due August 19, 2017. At the sole discretion of RRL, RRL can elect for interest on the loan to be paid in membership interests in that LLC at $7 per membership interest. As of December 31, 2016, the loan and accrued interest totaled $401,973 and is included in other assets.
| 52 |
| 8. | UNPAID LOSSES, LOSS ADJUSTMENT EXPENSES, AND AMOUNTS CEDED |
Summary of changes in outstanding losses and loss adjustment expenses ("LAE") and amounts ceded
| Year Ended | ||||||||||||||||||||||||
| December 31, 2016 | December 31, 2015 | |||||||||||||||||||||||
| Unpaid Losses and LAE | Amounts Ceded | Net | Unpaid Losses and LAE | Amounts | Net | |||||||||||||||||||
| Balance, beginning of year | $ | 14,539,623 | $ | 7,304,975 | $ | 7,234,648 | $ | 6,771,623 | $ | — | $ | 6,771,623 | ||||||||||||
| Omega unpaid losses, LAE and ceded amounts at acquisition | — | — | — | 12,296,850 | 4,233,462 | 8,063,388 | ||||||||||||||||||
| Assumed through assumption reinsurance transactions | — | — | — | 7,880,165 | 6,384,944 | 1,495,221 | ||||||||||||||||||
| Losses and LAE incurred for insured events related to: | ||||||||||||||||||||||||
| Current year | 24,921,829 | 24,658,524 | 263,305 | 14,592,727 | 14,187,692 | 405,035 | ||||||||||||||||||
| Prior years | (106,183 | ) | (161,330 | ) | 55,147 | (2,954,302 | ) | (3,037,977 | ) | 83,675 | ||||||||||||||
| Total incurred | 24,815,646 | 24,497,194 | 318,452 | 11,638,425 | 11,149,715 | 488,710 | ||||||||||||||||||
| Losses and LAE paid: | ||||||||||||||||||||||||
| Current year events | (22,734,079 | ) | (22,732,134 | ) | (1,945 | ) | (12,865,963 | ) | (12,850,596 | ) | (15,367 | ) | ||||||||||||
| Prior year events | (4,020,082 | ) | (2,263,295 | ) | (1,756,787 | ) | (3,684,433 | ) | (417,788 | ) | (3,266,645 | ) | ||||||||||||
| Total paid | (26,754,161 | ) | (24,995,429 | ) | (1,758,732 | ) | (16,550,396 | ) | (13,268,384 | ) | (3,282,012 | ) | ||||||||||||
| Unpaid losses and LAE related to RRL novated reinsurance contracts | — | — | — | (5,113,010 | ) | — | (5,113,010 | ) | ||||||||||||||||
| Adjustment due to currency conversion | 611,258 | 251,264 | 359,994 | (2,384,034 | ) | (1,194,762 | ) | (1,189,272 | ) | |||||||||||||||
| Balance, end of year | $ | 13,212,366 | $ | 7,058,004 | $ | 6,154,362 | $ | 14,539,623 | $ | 7,304,975 | $ | 7,234,648 | ||||||||||||
Till acquired Omega on May 15, 2015. The Omega unpaid losses, LAE, and amounts ceded at acquisition in the foregoing schedule are related to business written or assumed by Omega at the date of acquisition on business written prior to the date of acquisition. Claim frequency information is not available, nor deemed informative, for the Omega business due to the varied, and specialized, nature of the business that Omega writes and assumes.
In September 2015, RRL novated two reinsurance contracts that had been assumed in December 2014 form Multi-Strat Re. As a result of those novations, RRL paid a novation-related premium of $5,246,208 and released its reserve for unpaid losses and LAE of $5,113,010.
Omega’s reinsurance business includes assumption reinsurance for loss portfolio transfers. In the assumption of some of those loss portfolio transfers, Omega may receive funds from the reinsured for adverse loss development. In the event that that fund is not applied to expected losses and LAE, all or a portion of that adverse development fund may subsequently be remitted to the reinsured. Based on the history of Omega’s loss portfolio business, and the unusual patterns particularly related to loss and LAE pattern that distort the non-loss portfolio business, the following loss development triangles exclude that loss portfolio business. The summary of changes in outstanding losses, LAE, and amounts ceded include amounts that relate to the loss portfolio business.
| 53 |
Incurred loss and allocated loss adjustment expenses, net of reinsurance and excluding portfolio transfer transactions:
| Underwriting | Unaudited: | Net IBNR | ||||||||||||||||||||||||||||||||||||||||||
| year | 2007 | 2008 | 2009 | 2010 | 2011 | 2012 | 2013 | 2014 | 2015 | 2016 | Reserves | |||||||||||||||||||||||||||||||||
| 2007 | $ | 131,561 | $ | 195,387 | $ | 174,436 | $ | 172,753 | $ | 175,303 | $ | 175,164 | $ | 173,926 | $ | 173,929 | $ | 173,845 | $ | 173,845 | $ | 745 | ||||||||||||||||||||||
| 2008 | — | 447,274 | 777,843 | 801,156 | 1,378,219 | 1,510,205 | 1,379,575 | 1,398,814 | 1,483,991 | 1,598,042 | 43,197 | |||||||||||||||||||||||||||||||||
| 2009 | — | — | 504,079 | 1,002,233 | 2,355,574 | 3,392,028 | 3,478,403 | 3,402,017 | 3,468,178 | 3,418,968 | 62,560 | |||||||||||||||||||||||||||||||||
| 2010 | — | — | — | 4,930,009 | 6,787,931 | 7,463,808 | 7,837,658 | 7,929,862 | 8,431,049 | 8,719,599 | 164,594 | |||||||||||||||||||||||||||||||||
| 2011 | — | — | — | — | 6,598,370 | 7,856,552 | 7,619,513 | 7,771,136 | 7,856,329 | 7,964,762 | 162,359 | |||||||||||||||||||||||||||||||||
| 2012 | — | — | — | — | — | 7,411,264 | 8,014,138 | 8,072,408 | 8,232,554 | 8,356,887 | 122,887 | |||||||||||||||||||||||||||||||||
| 2013 | — | — | — | — | — | — | 7,763,646 | 8,275,612 | 8,277,191 | 8,269,606 | 53,623 | |||||||||||||||||||||||||||||||||
| 2014 | — | — | — | — | — | — | — | 10,142,696 | 10,807,952 | 10,795,823 | 175,765 | |||||||||||||||||||||||||||||||||
| 2015 | — | — | — | — | — | — | — | — | 277,081 | 439,094 | 189,916 | |||||||||||||||||||||||||||||||||
| 2016 | — | — | — | — | — | — | — | — | — | 286,539 | 246,518 | |||||||||||||||||||||||||||||||||
| Total | $ | 50,023,165 | $ | 1,222,164 | ||||||||||||||||||||||||||||||||||||||||
Cumulative paid losses and loss adjustment expenses, net of reinsurance and excluding portfolio transfer transactions:
| Underwriting | Unaudited: | |||||||||||||||||||||||||||||||||||||||
| year | 2007 | 2008 | 2009 | 2010 | 2011 | 2012 | 2013 | 2014 | 2015 | 2016 | ||||||||||||||||||||||||||||||
| 2007 | $ | 421,164 | $ | 155,975 | $ | 162,609 | $ | 161,942 | $ | 163,774 | $ | 165,170 | $ | 164,213 | $ | 164,242 | $ | 164,275 | $ | 164,373 | ||||||||||||||||||||
| 2008 | — | 60,852 | 186,465 | 297,368 | 448,738 | 575,992 | 953,112 | 1,008,941 | 1,027,561 | 1,662,025 | ||||||||||||||||||||||||||||||
| 2009 | — | — | 26,826 | 157,140 | 440,256 | 982,161 | 1,811,374 | 2,460,272 | 3,005,513 | 3,089,274 | ||||||||||||||||||||||||||||||
| 2010 | — | — | — | 4,157,126 | 4,650,475 | 5,249,953 | 5,989,172 | 6,575,646 | 7,611,481 | 7,828,845 | ||||||||||||||||||||||||||||||
| 2011 | — | — | — | — | 5,780,386 | 6,162,589 | 6,427,678 | 6,715,236 | 6,995,669 | 7,084,388 | ||||||||||||||||||||||||||||||
| 2012 | — | — | — | — | — | 6,794,995 | 7,175,566 | 7,305,404 | 7,606,231 | 7,977,758 | ||||||||||||||||||||||||||||||
| 2013 | — | — | — | — | — | — | 7,511,788 | 7,886,024 | 7,980,730 | 8,023,076 | ||||||||||||||||||||||||||||||
| 2014 | — | — | — | — | — | — | — | 9,885,551 | 10,427,680 | 10,482,292 | ||||||||||||||||||||||||||||||
| 2015 | — | — | — | — | — | — | — | — | 5,121 | 71,675 | ||||||||||||||||||||||||||||||
| 2016 | — | — | — | — | — | — | — | — | — | 1,919 | ||||||||||||||||||||||||||||||
| Total | $ | 46,385,625 | ||||||||||||||||||||||||||||||||||||||
Portfolio transfer transactions were excluded from the preceding tables due to their distortion of insurance losses from Omega's property and casualty insurance programs. The cumulative number of reported claims is not determinable and impracticable due to the majority of the business written by Omega is reinsurance assumed contract business; as such claim count information is not available or comparable between contracts.
Reconciliation of net to gross reserve for unpaid loss and loss adjustment expenses:
| December 31, 2016 | ||||
| Unpaid Loss and Loss Adjustment Expense, net of ceded amounts | $ | 6,154,362 | ||
| Ceded Unpaid Loss and Loss Adjustment Expense | 7,058,004 | |||
| Unpaid Loss and Loss Adjustment Expense | $ | 13,212,366 | ||
Average annual percentage payout of incurred losses by duration, net of reinsurance, as of December 31, 2016:
| Year - 1 | Year - 2 | Year - 3 | Year - 4 | Year - 5 | Year - 6 | Year - 7 | Year - 8 | Year - 9 | Year - 10 | |||||||||||||||||||||||||||||
| 56 | % | (11 | )% | 4 | % | 6 | % | 8 | % | 11 | % | 5 | % | 1 | % | 20 | % | — | % | |||||||||||||||||||
| 54 |
The following table presents written premiums, earned premiums, and the effects of those components on the Till’s consolidated statements of income (loss) and comprehensive income (loss):
| Years Ended | ||||||||
| December 31, 2016 | December 31, 2015 | |||||||
| Premiums written: | ||||||||
| Direct | $ | 39,679,955 | $ | 20,674,105 | ||||
| Assumed | 1,998 | 19,005 | ||||||
| Ceded | (39,477,825 | ) | (20,437,983 | ) | ||||
| Net premiums written | $ | 204,128 | $ | 255,127 | ||||
| Change in unearned premiums: | ||||||||
| Direct | $ | (161,040 | ) | $ | (1,900,973 | ) | ||
| Assumed | — | — | ||||||
| Ceded | 87,553 | 1,574,777 | ||||||
| Net decrease (increase) | $ | (73,487 | ) | $ | (326,196 | ) | ||
| Premiums earned: | ||||||||
| Direct | $ | 39,518,915 | $ | 18,773,132 | ||||
| Assumed | 1,998 | 19,005 | ||||||
| Ceded | (39,390,272 | ) | (18,863,206 | ) | ||||
| Net premiums earned | $ | 130,641 | $ | (71,069 | ) | |||
| 9. | UNEARNED PREMIUMS |
Summary of changes in unearned premiums and unearned premiums ceded
| Years Ended | ||||||||||||||||||||||||
| December 31, 2016 | December 31, 2015 | |||||||||||||||||||||||
| Unearned Premiums | Unearned Premiums Ceded | Net | Unearned Premiums | Unearned Premiums Ceded | Net | |||||||||||||||||||
| Balance at beginning of year | $ | 2,432,468 | $ | 1,615,977 | $ | 816,491 | $ | — | $ | — | $ | — | ||||||||||||
| Omega acquisition | — | — | — | 3,792,978 | 2,531,853 | 1,261,125 | ||||||||||||||||||
| Premiums written | 39,681,953 | 39,551,312 | 130,641 | 20,693,110 | 20,764,179 | (71,069 | ) | |||||||||||||||||
| Premiums earned | (39,530,607 | ) | (39,396,728 | ) | (133,879 | ) | (18,506,822 | ) | (18,648,114 | ) | 141,292 | |||||||||||||
| Amortization of unearned premiums | (379,162 | ) | (136,345 | ) | (242,817 | ) | (3,146,630 | ) | (2,395,508 | ) | (751,122 | ) | ||||||||||||
| Adjustment due to currency conversion | 78,466 | (19,413 | ) | 97,879 | (400,168 | ) | (636,433 | ) | 236,265 | |||||||||||||||
| Balance at end of year | $ | 2,283,118 | $ | 1,614,803 | $ | 668,315 | $ | 2,432,468 | $ | 1,615,977 | $ | 816,491 | ||||||||||||
| 10. | DEFERRED POLICY ACQUISITION COSTS |
Summary of changes in deferred policy acquisition costs
| Years Ended | ||||||||
| December 31, 2016 | December 31, 2015 | |||||||
| Balance at beginning of year | $ | 465,472 | $ | — | ||||
| Acquisition costs deferred | 11,110,040 | 5,609,635 | ||||||
| Amortization of deferred policy acquisition costs | (11,076,623 | ) | (5,144,163 | ) | ||||
| Balance at end of year | $ | 498,889 | $ | 465,472 | ||||
| 55 |
| 11. | PROPERTY, PLANT, AND EQUIPMENT |
Summary of property, plant, and equipment
| Land and structures | Computer equipment | Leasehold improvements and furniture | Equipment | Total | ||||||||||||||||
| Cost: | ||||||||||||||||||||
| Balance, January 1, 2015 | $ | 854,755 | $ | 703,445 | $ | 94,460 | $ | 5,175,397 | $ | 6,828,057 | ||||||||||
| Additions and other | — | 6,424 | 50,780 | — | 57,204 | |||||||||||||||
| Dispositions | (613,572 | ) | (404,902 | ) | (24,959 | ) | (90,837 | ) | (1,134,270 | ) | ||||||||||
| Reclassification to Assets held for sale | — | — | — | (4,006,002 | ) | (4,006,002 | ) | |||||||||||||
| Loss of control of subsidiary | (197,694 | ) | (64,745 | ) | (16,297 | ) | (926,384 | ) | (1,205,120 | ) | ||||||||||
| Currency translation adjustment | (43,489 | ) | (10,937 | ) | 974 | (152,174 | ) | (205,626 | ) | |||||||||||
| Balance, December 31, 2015 | $ | — | $ | 229,285 | $ | 104,958 | $ | — | $ | 334,243 | ||||||||||
| Additions and other | — | 3,323 | — | — | 3,323 | |||||||||||||||
| Dispositions | — | (2,649 | ) | (8,166 | ) | — | (10,815 | ) | ||||||||||||
| Currency translation adjustment | — | — | 1,854 | — | 1,854 | |||||||||||||||
| Balance, December 31, 2016 | $ | — | $ | 229,959 | $ | 98,646 | $ | — | $ | 328,605 | ||||||||||
| Accumulated depreciation: | ||||||||||||||||||||
| Balance, January 1, 2015 | $ | 244,064 | $ | 635,007 | $ | 53,729 | $ | 869,548 | $ | 1,802,348 | ||||||||||
| Depreciation | 49,350 | 36,657 | 20,058 | 153,355 | 259,420 | |||||||||||||||
| Dispositions | (94,399 | ) | (386,869 | ) | (14,073 | ) | (29,671 | ) | (525,012 | ) | ||||||||||
| Reclassification to Assets held for sale | — | — | — | (7,434 | ) | (7,434 | ) | |||||||||||||
| Loss of control of subsidiary | (168,042 | ) | (63,982 | ) | (11,778 | ) | (860,748 | ) | (1,104,550 | ) | ||||||||||
| Currency translation adjustment | (30,973 | ) | (10,255 | ) | (1,495 | ) | (125,050 | ) | (167,773 | ) | ||||||||||
| Balance, December 31, 2015 | $ | — | $ | 210,558 | $ | 46,441 | $ | — | $ | 256,999 | ||||||||||
| Depreciation | — | 10,291 | 15,193 | — | 25,484 | |||||||||||||||
| Dispositions | — | (1,479 | ) | (5,136 | ) | — | (6,615 | ) | ||||||||||||
| Currency translation adjustment | — | — | 61 | — | 61 | |||||||||||||||
| Balance, December 31, 2016 | $ | — | $ | 219,370 | $ | 56,559 | $ | — | $ | 275,929 | ||||||||||
| Net carrying amounts: | ||||||||||||||||||||
| As of January 1, 2015: | $ | 610,691 | $ | 68,438 | $ | 40,731 | $ | 4,305,849 | $ | 5,025,709 | ||||||||||
| As of December 31, 2015: | $ | — | $ | 18,727 | $ | 58,517 | $ | — | $ | 77,244 | ||||||||||
| As of December 31, 2016: | $ | — | $ | 10,589 | $ | 42,087 | $ | — | $ | 52,676 | ||||||||||
| 12. | ROYALTY AND MINERAL INTERESTS |
Summary of royalty and mineral interests
| Balance January 1, 2016 | Sale of mineral properties | Impairments | Currency translation and other adjustments | Balance December 31, 2016 | ||||||||||||||||
| Taylor | $ | 478,836 | $ | — | $ | — | $ | 18,121 | $ | 496,957 | ||||||||||
| Other properties | 462,258 | — | — | — | 462,258 | |||||||||||||||
| Royalty interests | 136,733 | (86,982 | ) | (5,593 | ) | — | 44,158 | |||||||||||||
| Total | $ | 1,077,827 | $ | (86,982 | ) | $ | (5,593 | ) | $ | 18,121 | $ | 1,003,373 | ||||||||
| 56 |
| Balance January 1, 2015 | Acquisition costs incurred | Currency translation and other adjustments | Re-classification to assets held for sale | Loss of control of subsidiary | Balance December 31, 2015 | |||||||||||||||||||
| Yukon, Canada Properties: | ||||||||||||||||||||||||
| Brewery Creek | $ | 253,919 | $ | — | $ | (33,761 | ) | $ | — | $ | (220,158 | ) | $ | — | ||||||||||
| Sonora Gulch | 424,713 | — | (56,470 | ) | — | (368,243 | ) | — | ||||||||||||||||
| 3 Aces | 154,336 | 7,587 | (20,521 | ) | — | (141,402 | ) | — | ||||||||||||||||
| Other | 246,411 | 17,110 | (32,763 | ) | — | (230,758 | ) | — | ||||||||||||||||
| Royalty interests | 24,158 | — | — | — | — | 24,158 | ||||||||||||||||||
| Total Yukon, Canada Properties | $ | 1,103,537 | $ | 24,697 | $ | (143,515 | ) | $ | — | $ | (960,561 | ) | $ | 24,158 | ||||||||||
| U.S. and Other Properties: | ||||||||||||||||||||||||
| Taylor | $ | 571,210 | $ | — | $ | (92,374 | ) | $ | — | $ | — | $ | 478,836 | |||||||||||
| Other SPD Properties | 649,030 | — | (104,959 | ) | (544,071 | ) | — | — | ||||||||||||||||
| Other U.S. Properties | 462,258 | — | — | — | — | 462,258 | ||||||||||||||||||
| Royalty interests | 112,575 | — | — | — | — | 112,575 | ||||||||||||||||||
| Total U.S. and Other Properties | $ | 1,795,073 | $ | — | $ | (197,333 | ) | $ | (544,071 | ) | $ | — | $ | 1,053,669 | ||||||||||
| Total | $ | 2,898,610 | $ | 24,697 | $ | (340,848 | ) | $ | (544,071 | ) | $ | (960,561 | ) | $ | 1,077,827 | |||||||||
| 13. | OTHER ASSETS |
Summary of other assets
| December 31, 2016 | December 31, 2015 | |||||||
| Note receivable (Note 7) | $ | 401,973 | $ | — | ||||
| Other receivables | 24,861 | 96,293 | ||||||
| Prepaid expenses and deposits | 155,187 | 179,252 | ||||||
| Reclamation bonds | 92,066 | 124,468 | ||||||
| Other | 118,665 | 219,156 | ||||||
| Total | $ | 792,752 | $ | 619,169 | ||||
| 14. | ACCOUNTS PAYABLE AND ACCRUED LIABILITIES |
Summary of accounts payable and accrued liabilities
| December 31, 2016 | December 31, 2015 | |||||||
| Accounts payable | $ | 1,069,614 | $ | 1,622,068 | ||||
| Accrued payroll | 45,056 | 33,159 | ||||||
| Other liabilities | 29,155 | 1,988 | ||||||
| Financial derivative (Note 6) | — | 337,684 | ||||||
| Total | $ | 1,143,825 | $ | 1,994,899 | ||||
| 15. | INCOME TAXES |
Till's income tax expense consisted of Canadian current taxes of $16,430 in 2016 and a Canadian deferred tax (benefit) expense of ($104,017) and $22,079 in 2016 and 2015, respectively.
| 57 |
Till's income (loss) before income taxes and loss on equity method investments consisted of:
| Years Ended | ||||||||
| December 31, 2016 | December 31, 2015 | |||||||
| Canada | $ | (778,736 | ) | $ | (1,293,967 | ) | ||
| U.S. | (420,504 | ) | (158,202 | ) | ||||
| Bermuda | 1,662,451 | (3,076,465 | ) | |||||
| Total | $ | 463,211 | $ | (4,528,634 | ) | |||
A reconciliation of income taxes at statutory rates with the reported taxes is as follows:
| Years Ended | ||||||||
| December 31, 2016 | December 31, 2015 | |||||||
| Income (loss) before income taxes and loss on equity method investment | $ | 463,211 | $ | (4,528,634 | ) | |||
| Impact of different foreign statutory rates on earnings of subsidiaries | (293,000 | ) | (2,310,000 | ) | ||||
| Permanent differences | (345,000 | ) | (547,000 | ) | ||||
| True up of prior year provision to statutory tax returns | 43,000 | (746,000 | ) | |||||
| Change in unrecognized deductible temporary differences and other | 507,413 | 3,625,079 | ||||||
| Total income tax (benefit) expense | $ | (87,587 | ) | $ | 22,079 | |||
| Current income tax expense | $ | 16,430 | $ | — | ||||
| Deferred income tax (benefit) expense | (104,017 | ) | 22,079 | |||||
| Total | $ | (87,587 | ) | $ | 22,079 | |||
The components of Till's deferred income tax items are as follows:
| Years Ended | ||||||||
| December 31, 2016 | December 31, 2015 | |||||||
| Deferred income tax items: | ||||||||
| Losses available for future periods | 20,925,000 | 19,237,221 | ||||||
| Exploration and evaluation assets | 9,737,000 | 9,764,360 | ||||||
| Marketable securities | (82,000 | ) | 13,539 | |||||
| Property and equipment | (12,000 | ) | 27,376 | |||||
| Reserve for unpaid losses and LAE | 572,353 | 467,536 | ||||||
| Cumulative eligible capital deductions | 10,800 | 11,600 | ||||||
| 31,151,153 | 29,521,632 | |||||||
| Valuation allowance | (30,568,000 | ) | (29,042,496 | ) | ||||
| Reported deferred income tax asset | $ | 583,153 | $ | 479,136 | ||||
The deferred tax asset relates primarily to Omega's operations whereby the timing of insurance deductions for tax purposes is different than for financial accounting purposes.
Tax attributes are subject to review and potential adjustment by tax authorities. Till's April 2014 reorganization involved multiple transactions with various tax considerations that Till believes have no material effect on its current or deferred income tax position.
In assessing the net carrying amount of the deferred tax asset, Till considers whether it is more-likely-than-not that Till will not realize some portion or all of the deferred tax asset. The ultimate realization of the deferred tax asset depends on the availability of future taxable income during the periods in which those temporary differences become deductible. Till considers the scheduled reversal of deferred tax liabilities, projected future taxable income, and tax planning strategies in making that assessment.
| 58 |
| 16. | SHAREHOLDERS' EQUITY |
Common stock
Till is authorized to issue 12,000,000 shares of restricted voting stock at a par value of $0.001. Those Till shares have restricted voting rights whereby no single shareholder of Till is able to exercise voting rights for more than 9.9% of the voting rights of the total issued and outstanding Till shares. However, if any one shareholder of Till beneficially owns, or exercises control or direction over more than 50% of the issued and outstanding Till shares, the 9.9% restriction will no longer apply to the Till shares. At December 31, 2016 and 2015, there were 3,350,284, and 3,429,284, respectively, issued Till shares.
Stock options and warrants
Till’s Board of Directors may, from time to time and in its sole discretion, award options to acquire shares of the restricted voting stock of Till to directors, employees, and consultants. During the year ended December 31, 2016, Till recognized stock-based compensation related to options of $28,839 (year ended December 31, 2015 - $309,044), which amounts are included in the consolidated statements of comprehensive loss. At December 31, 2016, Till has 119,952 stock options outstanding with a weighted average exercise price of CDN$10.38 (U.S.$7.73) and a weighted average remaining term of 2.85 years. Till recognized stock-based compensation of $16,446 in 2016 and $40,911 in 2015 as a result of consolidating SPD, and those amounts are included in the consolidated statements of comprehensive loss.
Till's Board of Directors may, from time to time and in its sole discretion, issue warrants to acquire shares of the restricted voting stock of Till. At December 31, 2016, Till has 179,500 warrants outstanding with a weighted average exercise price of CDN$9.92 (U.S.$7.39) and a weighted average remaining term of 2.94 years.
The fair value of all compensatory options granted is estimated on the grant date using the Black-Scholes-Merton option pricing model. The weighted average assumptions used in calculating the fair values are as follows:
| December 31, 2016 | December 31, 2015 | |||||||
| Risk-free interest rate | 1.10 | % | 1.42 | % | ||||
| Expected life | 5.00 years | 5.00 years | ||||||
| Volatility | 47.97 | % | 53.14 | % | ||||
| Dividend rate | 0.0 | % | 0.0 | % | ||||
| 59 |
The warrants and options outstanding in the following table are shown with historical amounts:
| Warrants | Stock Options | |||||||||||||||
| Number | Weighted average exercise price (Canadian $) | Number | Weighted average exercise price (Canadian $) | |||||||||||||
| Outstanding, January 1, 2015 | 8,500 | $ | 18.27 | 307,863 | $ | 19.49 | ||||||||||
| Issued / granted | 171,000 | 9.50 | 10,500 | 7.00 | ||||||||||||
| Expired | — | — | (16,050 | ) | 43.12 | |||||||||||
| Forfeited | — | — | (134,672 | ) | 21.90 | |||||||||||
| Outstanding, December 31, 2015 | 179,500 | $ | 9.92 | 167,641 | $ | 14.51 | ||||||||||
| Issued / granted | — | — | 11,000 | 7.00 | ||||||||||||
| Expired | — | — | (9,056 | ) | 50.00 | |||||||||||
| Forfeited | — | — | (49,633 | ) | 15.85 | |||||||||||
| Outstanding, December 31, 2016 | 179,500 | $ | 9.92 | 119,952 | $ | 10.38 | ||||||||||
| Exercisable, December 31, 2016 | 179,500 | $ | 9.92 | 105,077 | $ | 10.86 | ||||||||||
The intrinsic value of outstanding Till warrants and stock options at December 31, 2016 is zero.
Normal course issuer bid
On December 1, 2016, Till announced that it had renewed its normal course issuer bid ("NCIB"). Under the NCIB, Till has approval to bid for up to 262,860 common shares, representing 10% of the 2,628,600 shares that represented Till's public float at that date. Purchased shares will be returned to treasury and canceled. Till's Board of Directors believes that the current and recent market prices for Till's common shares do not give full effect to their underlying value and that the purchase of common shares under the NCIB will increase the proportionate share interest of, and be advantageous to, all remaining shareholders. Till also believes the NCIB purchases will provide increased liquidity to current shareholders who would like to sell their shares. Purchases subject to the NCIB will be carried out pursuant to open market transactions through the facilities of the TSX-V/NASDAQ by Canaccord Genuity Corp. on behalf of Till. During 2016, Till purchased 138,400 common shares for $563,629 through the NCIB program.
On September 25, 2015, Till announced that it had initiated an NCIB. Under that NCIB, Till had approval to bid for up to 265,502 common shares, representing 10% of the 2,655,025 shares that represented Till's public float at that date. During 2015, Till purchased 119,600 common shares for $691,620 through the NCIB program. Those purchased shares were returned to treasury and canceled.
Treasury shares
Pursuant to an NCIB program approved by Till's directors in September 2014, treasury shares are canceled at cost through retained earnings (deficit).
The Arrangement
In April 2014, Till acquired American Bullion Royalty Corp. in a reverse takeover by way of a plan of arrangement (the “Arrangement”). Effective December 31, 2014, Till completed a quasi-reorganization that, among other consequences, restated and reduced the then common stock and paid in capital and eliminated the historical deficit and the accumulated other comprehensive loss.
| 17. | INCOME (LOSS) PER SHARE |
Till uses the treasury stock method to calculate diluted income (loss) per share. Following the treasury stock method, the numerator for Till’s diluted income (loss) per share calculation remains unchanged from the basic income (loss) per share calculation, as the assumed exercise of Till’s stock options and warrants does not result in an adjustment to net income or loss.
| 60 |
Stock options to purchase 119,952 restricted voting shares were outstanding at December 31, 2016 (December 31, 2015 – 167,641). Warrants to purchase 179,500 restricted voting shares were outstanding at December 31, 2016 and 2015. Those stock options and warrants were excluded in the calculation of diluted earnings per share because the exercise price of the awards was greater than the weighted average market value of the restricted voting shares in the years ended December 31, 2016 and 2015.
| 18. | SEGMENT DATA |
Till operates in a single segment, that being insurance.
The revenue from policyholders and other customers is attributable to the following countries:
| Years Ended | ||||||||
| December 31, 2016 | December 31, 2015 | |||||||
| Revenue: | ||||||||
| Canada | $ | 1,199,014 | $ | 551,576 | ||||
| Bermuda | 2,858,606 | (3,653,348 | ) | |||||
| United States | 52,972 | 128,333 | ||||||
| Total | $ | 4,110,592 | $ | (2,973,439 | ) | |||
| 19. | RELATED PARTY DISCLOSURES |
Service agreements
Till is party to service agreements with SPD whereby Till provides accounting, corporate communications, and technical services on a cost-plus recovery basis, and was a party to service agreements with GPY whereby Till provided similar services to GPY on a cost-plus recovery basis. The agreements with GPY were terminated on July 31, 2015. The technical service agreement with SPD was terminated on January 1, 2016, leaving only the accounting and corporate communications service agreements in effect. During the years ended December 31, 2016 and 2015, Till charged SPD a total of $36,000 and $242,786, respectively, and charged GPY $-0- and $82,082, respectively, for those services.
Other
Till Management Company ("TMC") pays a performance bonus to certain TMC members based on a formal method approved by the Till Board of Directors. Based on that performance bonus plan, $162,182 and $-0- was paid related to the respective 2016 and 2015 investment results. The 2016 bonus was paid in 2017.
In the first quarter 2016, $252,875 was paid to Till's former Chief Financial Officer as part of a separation agreement that is included in total compensation. No additional payments are required under that separation agreement.
| 20. | CAPITAL MANAGEMENT |
Regulatory capital
Till manages capital on an aggregate basis, as well as individually for each regulated entity. Till's insurance subsidiaries are subject to the regulatory capital requirements defined by the Bermuda Monetary Authority (“BMA”) for RRL and by the Office of Superintendent of Financial Institutions (Canada) (“OSFI”) for Omega.
| 61 |
Till’s objectives when managing capital consist of:
| • | Ensuring that policyholders in the insurance and reinsurance subsidiaries are protected while complying with regulatory capital requirements. |
| • | Maximizing long-term shareholder value by optimizing capital used to operate and grow Till. |
Till views capital as a scarce and strategic resource. That resource protects the financial well-being of the organization, and is also critical in enabling Till to pursue strategic business opportunities. Adequate capital also acts as a safeguard against possible unexpected losses, and as a basis for confidence in Till by shareholders, policyholders, creditors, and others. For the purpose of capital management, Till has defined capital as shareholders’ equity, excluding accumulated other comprehensive income ("AOCI"). Capital is monitored by Till's Board of Directors. Till's insurance subsidiaries are subject to minimum capital requirements that, in the case of RRL, is $1 million, and, in the case of Omega, the Minimum Capital Test (“MCT”) is calculated based on guidelines established by OSFI. Those amounts are not available to satisfy liabilities of Till or other subsidiaries. Both RRL and Omega are in compliance with those requirements.
RRL
RRL is registered under The Bermuda Insurance Act 1978 and related regulations (the “Act”) that require RRL to file a statutory financial return and maintain certain measures of solvency and liquidity. The required Minimum General Business Solvency Margin at December 31, 2016 was $1 million. The Minimum Liquidity Ratio is the ratio of the insurer’s relevant assets to its relevant liabilities. The minimum allowable ratio is 75%. RRL’s relevant assets at December 31, 2016 were $8.98 million (December 31, 2015 - $5.66 million) and 75% of its relevant liabilities as of December 31, 2016 was $141,003 (December 31, 2015 - $28,671). As of December 31, 2016 and 2015, RRL is in compliance with those requirements.
Omega
OSFI has set out expectation of a 100% MCT as the minimum and have also set out 150% MCT as the supervisory target for Canadian property and casualty insurance companies. As of December 31, 2016, Omega had total capital available of CDN$9.42 (U.S.$7.02) million (December 31, 2015 - CDN$9.29 (U.S.$6.70) million) and a total capital required of CDN$1.89 (U.S.$1.41) million (December 31, 2015 - CDN$2.27 (U.S.$1.64) million) resulting in a MCT of 499% (December 31, 2015 - 410%) of the required amount. As of December 31, 2016 and 2015, Omega is in compliance with OSFI's MCT requirement.
Statutory Accounting Practices for RRL and Omega.
RRL and Omega follow accounting practices prescribed or permitted by their respective regulators, Bermuda and Canada, respectively. Statutory accounting practices differ from GAAP in certain areas, the most significant being that statutory accounting practices:
| • | Require the expensing of policy acquisition costs as incurred, i.e., does not allow for the deferral and amortization of policy acquisition costs, i.e., DPAC. |
| • | Require that certain investments be recorded at cost or amortized cost and allows bonds to be carried at amortized cost or fair value based on an independent rating. |
| • | Specify how much, if any, of a deferred income tax asset is reportable as an admitted asset. |
| 62 |
As of and for the years ended December 31, 2016 and 2015, the equity and net income (loss) on a statutory basis and GAAP basis for RRL and Omega were as follows:
| RRL | Omega | |||||||||||||||
| December 31, 2016 | December 31, 2015 | December 31, 2016 | December 31, 2015 | |||||||||||||
| Statutory Equity | $ | 6,669,463 | $ | 3,660,932 | $ | 7,900,193 | $ | 7,843,685 | ||||||||
| GAAP-Basis Stockholder Equity | $ | 18,679,531 | $ | 20,311,297 | $ | 7,571,118 | $ | 7,899,549 | ||||||||
| Statutory Net Income (Loss) | $ | 722,034 | $ | (3,248,443 | ) | $ | 108,415 | $ | 229,247 | |||||||
| GAAP-Basis Net Income (loss) | $ | 150,455 | $ | (2,989,792 | ) | $ | (220,660 | ) | $ | 285,111 | ||||||
| 21. | FINANCIAL RISK MANAGEMENT |
Insurance risk
Omega principally issues general insurance contracts in personal property, commercial property, and liability lines of business. Under those general insurance contracts, Omega is exposed to certain risks defined in the general insurance contracts, usually for durations of one to twelve months.
In addition to general insurance contracts, Omega also assumes portfolios of existing claims from other insurers through assumption reinsurance transactions. Those portfolios of claims could be from any line of business that the transferring insurer wrote in the past. Under those assumption reinsurance transactions, Omega is exposed to certain risks defined in the underlying insurance contracts that were originally written by the transferring insurer.
The principal risk that Omega faces under both general insurance contracts and assumption reinsurance transactions is that the actual claims and benefit payments, or the timing thereof, differs from the expectations used to price the general insurance contracts or assumption reinsurance transactions. That risk is influenced by the frequency of claims, severity of claims, emergence of unknown claims, actual benefits paid, and subsequent development of long-tail claims. For long-tail claims that take years to settle, Till is also exposed to inflation risk. Till's objective is to ensure that sufficient reserves are available to cover those known and unknown liabilities.
Risk exposure is mitigated by diversification across a portfolio of insurance contracts and geographical areas and by the use of various underwriting and claim review strategies. Inflation risk is mitigated by taking expected inflation into account when estimating insurance contract liabilities. Omega purchases reinsurance as part of its risk mitigation strategies. Reinsurance is placed on both a proportional and non-proportional basis. The use of proportional and non-proportional reinsurance varies by line of business.
Amounts recoverable from reinsurers are estimated in a manner consistent with the underlying claim liabilities and in accordance with the reinsurance contracts. Although Omega has reinsurance arrangements in effect, Omega is not relieved of its obligations to its policyholders and, thus, a credit risk exposure exists with respect to such reinsurance arrangements.
| 63 |
The following table sets forth the unpaid losses and LAE by line of business:
| December 31, 2016 | December 31, 2015 | |||||||||||||||||||||||
| Unpaid Losses and LAE | Amounts Ceded | Net Unpaid Losses and LAE | Unpaid Losses and LAE | Amounts Ceded | Net Unpaid Losses and LAE | |||||||||||||||||||
| Automobile | $ | 1,949,947 | $ | 1,452,272 | $ | 497,675 | $ | 2,220,581 | $ | 1,433,655 | $ | 786,926 | ||||||||||||
| Aircraft | 173,798 | 49,187 | 124,611 | 220,922 | 100,291 | 120,631 | ||||||||||||||||||
| Property | 1,714,353 | 1,598,758 | 115,595 | 1,653,422 | 1,490,486 | 162,936 | ||||||||||||||||||
| Liability | 9,079,657 | 3,957,787 | 5,121,870 | 9,976,865 | 4,280,543 | 5,696,322 | ||||||||||||||||||
| Other | 294,611 | — | 294,611 | 467,833 | — | 467,833 | ||||||||||||||||||
| Total | $ | 13,212,366 | $ | 7,058,004 | $ | 6,154,362 | $ | 14,539,623 | $ | 7,304,975 | $ | 7,234,648 | ||||||||||||
The key assumption underlying the valuation of the reserve for unpaid losses and LAE is that the future loss development will follow a similar pattern to past loss development experience, including average claim costs, claim handling costs, and other claim factors for each accident year. Additional qualitative judgments are used to assess the extent to which past trends may not apply in the future. Judgment is further used to assess the extent to which external factors, such as inflation, court decisions, and government legislation, may affect the estimates. Other factors that may affect the reliability of loss and LAE assumptions include any variation in interest rates, claim settlement delays, and changes in foreign exchange rates.
Liquidity risk
Liquidity risk is the risk that Till is unable to meet its financial obligations as they come due. Till manages this risk by the continuous monitoring of its working capital to determine that its investments exceed its estimated obligations.
The following tables summarize the terms to maturity of Till's investments and liabilities as of December 31, 2016:
| Less than 1 year | From 1 to 5 years | Over 5 years | No specific maturity | Total | ||||||||||||||||
| Cash and cash equivalents | $ | 5,320,208 | $ | — | $ | — | $ | — | $ | 5,320,208 | ||||||||||
| Fixed-income securities | 2,064,575 | 8,315,177 | 2,213,113 | — | 12,592,865 | |||||||||||||||
| Common and preferred securities | 2,909,410 | — | — | 18,498 | 2,927,908 | |||||||||||||||
| Total | $ | 10,294,193 | $ | 8,267,440 | $ | 2,260,851 | $ | 18,498 | $ | 20,840,982 | ||||||||||
| Less than 1 year | From 1 to 5 years | Over 5 years | No specific maturity | Total | ||||||||||||||||
| Reserve for unpaid losses and LAE | $ | 4,083,849 | $ | 4,973,165 | $ | 4,155,352 | $ | — | $ | 13,212,366 | ||||||||||
| Reinsurance payables | 3,193,409 | — | — | — | 3,193,409 | |||||||||||||||
| Accounts payable and accrued liabilities | 1,143,825 | — | — | — | 1,143,825 | |||||||||||||||
| Total | $ | 8,421,083 | $ | 4,973,165 | $ | 4,155,352 | $ | — | $ | 17,549,600 | ||||||||||
Credit risk
Credit risk is the risk of loss associated with a counterparty’s inability to fulfill its obligations. Till's credit risk is primarily attributable to cash and cash equivalents, investments, reinsurance recoverables, and a promissory note receivable. Till has policies in place to limit and monitor its exposure to individual issuers and classes of issuers of investments. Till's insurance and reinsurance policies are distributed by brokers and agents who manage cash collection on its behalf and Till monitors its exposure as regards of the activities of those brokers and agents. Till has policies in place that limit its exposure to individual reinsurers, and Till conducts regular review processes to assess the creditworthiness of reinsurers with whom it transacts business.
| 64 |
Till's maximum exposure to credit risk is limited to the carrying amount of Till's financial assets as follows:
| December 31, 2016 | December 31, 2015 | |||||||
| Class of financial assets, at carrying amounts: | ||||||||
| Government bonds and bond funds | $ | 12,592,865 | $ | 18,971,319 | ||||
| Listed and other equity securities | 2,927,909 | 5,211,872 | ||||||
| Cash and cash equivalents | 5,320,208 | 1,519,881 | ||||||
| Reinsurance-related recoverables | 11,064,234 | 10,915,302 | ||||||
| Promissory note receivable | 2,410,494 | 2,463,262 | ||||||
| Receivables | 426,833 | 96,293 | ||||||
| Total | $ | 34,742,543 | $ | 39,177,929 | ||||
| 65 |
| 22. | QUARTERLY FINANCIAL INFORMATION (UNAUDITED) |
The following table provides a summary of the unaudited quarterly financial information for the periods presented:
| First Quarter | Second Quarter | Third Quarter | Fourth Quarter | |||||||||||||
| For the year ended December 31, 2016 | ||||||||||||||||
| Net premiums earned | $ | 147,644 | $ | 214,563 | $ | 232,070 | $ | (463,636 | ) | |||||||
| Investment income (loss) | $ | 45,288 | $ | 1,705,210 | $ | 1,609,051 | $ | (276,494 | ) | |||||||
| Total revenues | $ | 362,706 | $ | 2,044,129 | $ | 1,962,477 | $ | (258,720 | ) | |||||||
| Total expenses | $ | 988,721 | $ | 1,002,306 | $ | 1,012,066 | $ | 644,288 | ||||||||
| Net income (loss) | $ | (599,040 | ) | $ | 957,313 | $ | 966,858 | $ | (834,591 | ) | ||||||
| Net income (loss) per share | $ | (0.19 | ) | $ | 0.29 | $ | 0.30 | $ | (0.25 | ) | ||||||
| 23. | CONTINGENCIES |
Till and its subsidiaries are party to various litigation-related matters in the ordinary course of our business. Till cannot estimate with certainty the ultimate legal and financial liability with respect to those pending litigation matters. However, Till believes, based on its knowledge of such matters, that Till's ultimate liability with respect to those matters will not have a material adverse effect on Till's financial position, results of operations, or cash flows.
| 24. | SUBSEQUENT EVENTS |
Silver Predator Corp.
At December 31, 2016, RRL owned approximately 64% of the issued and outstanding common shares of Silver Predator Corp. (“SPD”). SPD has historically been engaged in exploring for and developing economically viable silver, gold, and tungsten deposits in Canada and the United States, with a focus on Nevada and Idaho. Until January 2017, SPD’s two core properties were the Springer tungsten mine and mill in Pershing County, Nevada (the “Springer Property”) and the Taylor mine and mill near Ely, Nevada (the “Taylor Property”). SPD also owns the Copper King property near Coeur d’Alene, Idaho, the Cornucopia property in Elko County, Nevada, and several additional properties in Nevada.
In January 2017, SPD gave 100% of its ownership of the Springer Property to RRL in exchange for the release of a related party debt owed to RRL. Until the transfer of the Springer Property to RRL, SPD owned a 100% interest in the Springer Property, a non-operating former tungsten production facility located on the east flank of the Eugene Mountains, approximately 25 miles southwest of the city of Winnemucca, Nevada. In addition to the former tungsten production facility, the project consists of 209 lode mineral claims, 25 placer claims, and fee lands for a total area of approximately 6,400 acres, including all mineral claims and fee lands, subject to a 2% net smelter royalty. The Springer production facility consists of a 1,360-foot vertical shaft and underground workings, a 1,200 ton per day mill with automated rod/ball mill grinding and flotation circuits, plus all water rights, and most of the permits necessary for operation of the facility. SPD did not conduct any significant exploration on the Springer Property in 2015 or 2016, and SPD has no plans for any significant further exploration expenditures.
In the second quarter of 2015, SPD announced its intention to realize value from its assets by initiating a process to sell all, or part, of the tangible and intangible assets at some of its properties in Nevada. At that time, SPD disclosed that mining and production at the facility could be restarted with additional capital expenditures required for exploration to determine the existence of mineral reserves, modernization, and refurbishment.
Neither RRL nor Till currently intends to allocate additional capital to restart mining and production at the Springer Property.
| 66 |
Montego Resource, Inc.
On April 3, 2017, SPD announced that it had entered into an option agreement with Montego Resource, Inc. (“Montego”) whereby Montego has the right to acquire certain Taylor mining claims in Nevada (the “Mining Claims”) from SPD. The terms of that agreement specify, among other things, that Montego (i) make a series of cash payments totaling $1.2 million over a three-year period, (ii) issue a total of 2,500,000 shares of Montego’s common stock over a three-year period to SPD, and (iii) expend at least $700,000 on the Mining Claims. In addition to the foregoing conditions, the completion of the transaction is subject to a number of closing conditions. As such, there can be no assurance that all of those conditions will be satisfied or that Montego will ultimately acquire a 100% interest in the Mining Claims. See Note 5 in these Consolidated Financial Statements.
Sale of mineral property
On April 11, 2017, a Till subsidiary, Golden Predator US Holding Corp., received $1.16 million for the sale of a mineral property to an unrelated party resulting in a gain of approximately $1 million.
| 67 |
Item 9. Changes in and Disagreements With Accountants on Accounting and Financial Disclosure
Not applicable.
Item 9A. Controls and Procedures
Disclosure Controls and Procedures
Till maintains a system of disclosure controls and procedures (as such term is defined under Rules 13a-15(e) and 15(d)-15(e) under the Exchange Act) that is designed to ensure that information required to be disclosed in our Exchange Act reports is recorded, processed, summarized, and reported within the time periods specified in the SEC’s rules and forms, and that such information is accumulated and communicated to our management, including our Chief Executive Officer and Chief Financial Officer, as appropriate, to allow timely decisions regarding required disclosures. Under the supervision and with the participation of our management, including our Chief Executive Officer and Chief Financial Officer, we conducted an evaluation of our disclosure controls and procedures. Based on that evaluation, our Chief Executive Officer and our Chief Financial Officer concluded that, as of December 31, 2016, our disclosure controls and procedures were effective.
There are inherent limitations to the effectiveness of any system of disclosure controls and procedures. Those limitations include the possibility of human error, the circumvention or overriding of the controls and procedures, and reasonable resource constraints. Because we have designed our system of controls based on certain assumptions that we believe are reasonable as regards future events, our system of controls may not achieve its desired purpose under all possible future conditions. Accordingly, our disclosure controls and procedures provide reasonable, but not absolute, assurance of achieving their objectives
Changes in Internal Control Over Financial Reporting
There have been no changes in our internal control over financial reporting during the quarter ended December 31, 2016 that have materially affected, or are reasonably likely to materially affect, our internal control over financial reporting.
Management’s Report on Internal Control Over Financial Reporting
Till’s management is responsible for establishing and maintaining adequate internal control over financial reporting (as such term is defined under Rules 13a-15(f) and 15d-15(f) of the Exchange Act). Till’s management, including our Chief Executive Officer and Chief Financial Officer, conducted an evaluation of the effectiveness of our internal control over financial reporting as of December 31, 2016. In making that assessment, our management used the criteria established in Internal Control – Integrated Framework (2013) issued by the Committee of Sponsoring Organizations of the Treadway Commission (“COSO”). Management has concluded that Till maintained effective internal control over financial reporting as of December 31, 2016, based on the criteria established in COSO’s Internal Control – Integrated Framework.
There are inherent limitations to the effectiveness of any system of internal control over financial reporting. Those limitations include the possibility of human error, the circumvention or overriding of the system, and reasonable resource constraints. Because of its inherent limitations, our internal control over financial reporting may not prevent or detect misstatements. Also, projections of any evaluation of effectiveness of the internal control over financial reporting to future periods are subject to the risks that controls may become inadequate because of changes in conditions, or that the degree of compliance with the policies or procedures may deteriorate.
Not applicable.
| 68 |
PART III
Item 10. Directors, Executive Officers, and Corporate Governance
The information required by this Item 10 is incorporated by reference herein from our Definitive Proxy Statement for our 2017 Annual Meeting of Stockholders to be filed with the SEC as set forth under the caption “Documents Incorporated by Reference” on the cover of this Report.
Item 11. Executive Compensation
The information required by this Item 11 is incorporated by reference herein from our Definitive Proxy Statement for our 2017 Annual Meeting of Stockholders to be filed with the SEC as set forth under the caption “Documents Incorporated by Reference” on the cover of this Report.
Item 12. Security Ownership of Certain Beneficial Owners and Management and Related Stockholder Matters
The information required by this Item 12 is incorporated by reference herein from our Definitive Proxy Statement for our 2017 Annual Meeting of Stockholders to be filed with the SEC as set forth under the caption “Documents Incorporated by Reference” on the cover of this Report.
Item 13. Certain Relationships and Related Transactions, and Director Independence
The information required by this Item 13 is incorporated by reference herein from our Definitive Proxy Statement for our 2017 Annual Meeting of Stockholders to be filed with the SEC as set forth under the caption “Documents Incorporated by Reference” on the cover of this Report.
Item 14. Principal Accounting Fees and Services
The information required by this Item 14 is incorporated by reference herein from our Definitive Proxy Statement for our 2017 Annual Meeting of Stockholders to be filed with the SEC as set forth under the caption “Documents Incorporated by Reference” on the cover of this Report.
| 69 |
PART IV
Item 15. Exhibits, Financial Statements, and Schedules
(a) Financial Statements and Schedules
The Consolidated Financial Statements of Till Capital Ltd. are filed herein as set forth under Part II, Item 8, of this Report.
Financial statement schedules have been omitted as they are either not required, not applicable, or the information is otherwise included in the Consolidated Financial Statements or notes thereto.
(b) Exhibits
The exhibits list immediately following the signature page is incorporated herein by reference as the list of exhibits is required as part of this Report.
None.
| 70 |
Pursuant to the requirements of Section 13 or 15(d) of the Securities Exchange Act of 1934, the registrant has duly caused this Report to be signed on its behalf by the undersigned, thereunto duly authorized.
| TILL CAPITAL LTD. | |||
| By | /s/ John T. Rickard | ||
| John T. Rickard | |||
| Chief Executive Officer | |||
Dated: April 14, 2017
Pursuant to the requirements of the Securities Exchange Act of 1934, this Report has been signed below by the following persons on behalf of the registrant and in the capacities and on the dates indicated.
| Signature | Title | Date | |
| /s/ John T. Rickard | Chief Executive Officer and Director | April 14, 2017 | |
| John T. Rickard | (Principal Executive Officer) | ||
| /s/ Brian P. Lupien | Chief Financial Officer | April 14, 2017 | |
| Brian P. Lupien | (Principal Financial Officer) | ||
| /s/ Weiying Zhu | Treasurer and Controller | April 14, 2017 | |
| Weiying Zhu | |||
| /s/ Alan S. Danson | Chairman of the Board | April 14, 2017 | |
| Alan S. Danson | |||
| /s/ Wayne Kauth | Director | April 14, 2017 | |
| Wayne Kauth | |||
| /s/ Roger Loeb | Director | April 14, 2017 | |
| Roger Loeb | |||
| /s/ William A. Lupien | Director | April 14, 2017 | |
| William A. Lupien | |||
| /s/ George J. Rohlinger | Director | April 14, 2017 | |
| George J. Rohlinger | |||
| /s/ Patricia M. Tilton | Director | April 14, 2017 | |
| Patricia M. Tilton |
| 71 |
| Incorporated by Reference | ||||||||||||
| Exhibit Number |
Exhibit Description | Form | File No. | Exhibit Number |
Filing Date | Filed Herewith | ||||||
| 2.1 | Arrangement Agreement, dated as of February 18, 2014, between Americas Bullion Royalty Corp. and Resource Holdings Ltd.) | 20-F | 000-55324 | 4.11 | March 13, 2015 | |||||||
| 3.1 | Memorandum of Association of Resource Holdings Ltd. | 20-F | 000-55324 | 1.1 | March 13, 2015 | |||||||
| 3.2 | Bye-laws of Till Capital Ltd. | 20-F | 000-55324 | 1.2 | March 13, 2015 | |||||||
| 4.1 | Specimen of Restricted Voting Share Certificate | X | ||||||||||
| 10.1 | Administration Agreement, dated February 12, 2014, between Resource Re Ltd. and Cedar Management Limited | 20-F | 000-55324 | 4.1 | March 13, 2015 | |||||||
| 10.2 | Master Services Agreement, dated August 11, 2014, between Multi-Strat Re Ltd. and Resource Re Ltd. | 20-F | 000-55324 | 4.2 | March 13, 2015 | |||||||
| 10.3 | Quota Share Retrocession Agreement, dated August 11, 2014, between Multi-Strat Re Ltd. and Resource Re Ltd. | 20-F | 000-55324 | 4.3 | March 13, 2015 | |||||||
| 10.4* | Stock Option Plan | 20-F | 000-55324 | 4.4 | March 13, 2015 | |||||||
| 10.5* | Employment agreement with Philip Cook, dated May 15, 2015 | 20-F | 001-37402 | 4.6 | May 12, 2016 | |||||||
| 10.6* | Employment agreement with Matthew Cook, dated May 15, 2015 | 20-F | 001-37402 | 4.7 | May 12, 2016 | |||||||
| 10.7* | Separation Agreement with William Sheriff, dated September 1, 2015 | 20-F | 001-37402 | 4.8 | May 12, 2016 | |||||||
| 14 | Code of Business Conduct and Ethics | 20-F | 000-55324 | 11.1 | March 13, 2015 | |||||||
| 16 | Letter, dated February 3, 2017, from Grant Thornton LLP, Toronto, Ontario, Canada | 8-K | 001-37402 | 16.1 | February 3, 2017 | |||||||
| 21 | Subsidiaries of Till Capital Ltd. | X | ||||||||||
| 31.1 | Certification of Chief Executive Officer pursuant to Exchange Act Rules 13a-14(a) and 15d-14(a), as adopted pursuant to Section 302 of the Sarbanes-Oxley Act of 2002 | X | ||||||||||
| 31.2 | Certification of Chief Financial Officer pursuant to Exchange Act Rules 13a-14(a) and 15d-14(a), as adopted pursuant to Section 302 of the Sarbanes-Oxley Act of 2002 | X | ||||||||||
| 32.1 | Certification of Chief Executive Officer and Chief Financial Officer pursuant to 18 U.S.C. Section 1350, as adopted pursuant to Section 906 of the Sarbanes-Oxley Act of 2002 | X | ||||||||||
_______________
* Management contract or compensatory plan or arrangement.
72