Attached files
| file | filename |
|---|---|
| 8-K - FORM 8-K - IHS Markit Ltd. | dp74169_8k.htm |
EXHIBIT 99.1
© 2017 IHS Markit. All Rights Reserved.© 2017 IHS Markit. All Rights Reserved. IHS Markit Supplemental Information to the Proxy Statement March 2017
© 2017 IHS Markit. All Rights Reserved. Forward-looking statements This presentation contains “forward-looking statements” within the meaning of the federal securities laws, including Section 27Aof the Securities Act of 1933, as amended, and Section 21E of the Securities Exchange Act of 1934, as amended. In this context, forward-looking statements often address expected future business and financial performance and financial condition, and often contain words such as “expect,” “anticipate,” “intend,” “plan,” “believe,” “seek,” “see,” “will,” “would,” “target,” “aim”and similar expressions, and variations or negatives of these words. Without limiting the generality of the foregoing, forward-looking statements contained in this presentation may include the expectations of management regarding plans, strategies, objectives and anticipated financial and operating results of IHS Markit. IHS Markit’s estimates and forward-looking statements are mainly based on its current expectations and estimates of future events and trends, which affect or may affect its businesses and operations. Although IHS Markit believes that these estimates and forward-looking statements are based upon reasonable assumptions, they are subject to several risks and uncertainties and are made in light of information currently available to IHSMarkit. These and other forward-looking statements are not guarantees of future results and are subject to risks, uncertainties and assumptions that could cause actual results to differ materially from those expressed in any forward-looking statements. Important risk factors that may cause such a difference include, but are not limited to, those risks discussed in IHS Markit’s filings with the US Securities and Exchange Commission (the “SEC”). IHS Markit’s SEC filings are available at www.sec.gov or on the investor relations section of its website, www.ihsmarkit.com. However, those factors should not be considered to be a complete statement of all potential risks and uncertainties. Other factors may present significant additional obstacles to the realization of forward-looking statements. Consequences of material differences in results as compared with those anticipated in the forward-looking statements could include, among other things, business disruption, operational problems, financial loss, legal liability to third parties and similar risks, any of which could have a material adverse effect on IHS Markit’s consolidated financial condition, results of operations, credit rating or liquidity. IHS Markit does not assume any obligation to publicly provide revisions or updates to any forward-looking statements, whether as a result of new information, future developments or otherwise, should circumstances change, except as otherwise required by securities and other applicable laws. You are cautioned not to place undue reliance on these forward-looking statements, which speak only as of the date of this presentation. All forward-looking statements are qualified in their entirety by this cautionary statement. Important Information IHS Inc. was the accounting acquirer in the merger with Markit Ltd. IHS operated, and IHS Markit operates, under a fiscal year that ends on November 30th of each year, while Markit operated under a fiscal year that ended on December 31st of each year. As a result, financial results for the fiscal year ended November 30, 2016 will include 12 months of results of IHS and results of Markit from and after the July 12, 2016 closing date of the merger in the new Financial Services segment that IHS Markit has created. The 2016 guidance set forth in this presentation includes results of Markit only since closing of the merger. Unless otherwise indicated in this presentation, the combined historical information presented is based on the reported GAAP results of IHS for its fiscal year ended November 30 th and the historical IFRS results of Markit (now reported as the Financial Services segment of IHS Markit) adjusted to reflect a fiscal year ended November 30 th . The combined historical financial information set forth in this presentation has not been prepared in accordance with SEC rules, including Article 11 of Regulation S-X, and it therefore does not reflect any of the pro forma adjustments that would be required by Article 11 of Regulation S-X. In addition, certain stand alone historical results of Markit (now reported as the Financial Services segment of IHS Markit) are presented based on the reported results of Markit for its December 31 st fiscal year without any adjustment for the new fiscal year. Non-GAAP measures Non-GAAP financial information is presented only as a supplement to IHS Markit’s financial information based on GAAP. Non-GAAP financial information is provided to enhance the reader’s understanding of the financial performance of IHS Markit, but none of these non-GAAP financial measures are recognized terms under GAAP and should not be considered in isolation from, or as a substitute for, financial measures calculated in accordance with GAAP. Definitions and reconciliations of IHS Markit non-GAAPmeasures to the most directly comparable GAAP measures are provided with the schedules to IHS Markit quarterly earnings releases and are available on IHS Markit’s website (www.ihsmarkit.com). IHS Markit uses non-GAAP measures in its operational and financial decision making, and believes that it is useful to exclude certain items in order to focus on what it regards to be a more reliable indicator of the underlying operating performance of the business and its ability to generate cash flow from operations. As a result, internal management reports used during monthly operating reviews feature non-GAAP measures. IHS Markit also believes that investors may find non-GAAP financial measures for IHS Markit useful for the same reasons, although investors are cautioned that non-GAAP financial measures are not a substitute for GAAP disclosures. Non-GAAP measures are frequently used by securities analysts, investors and other interested parties in their evaluation of companies comparable to IHS Markit, many of which present non- GAAP measures when reporting their results. These measures can be useful in evaluating IHS Markit’s performance against its peercompanies because it believes he measures provide users with valuable insight into key components of GAAP financial disclosures. However, non-GAAP measures have limitations as an analytical tool. Non-GAAP measures are not necessarily comparable to similarly titled measures used by other companies. They are not presentations made in accordance with GAAP, are not measures of financial condition or liquidity and should not be considered as an alternative to profit or loss for the period determined in accordance with GAAP or operating cash flows d etermined in accordance with GAAP. As a result, you should not consider such performance measures in isolation from, or as a substitute analysis for, results of operations as determined in accordance with GAAP. 2
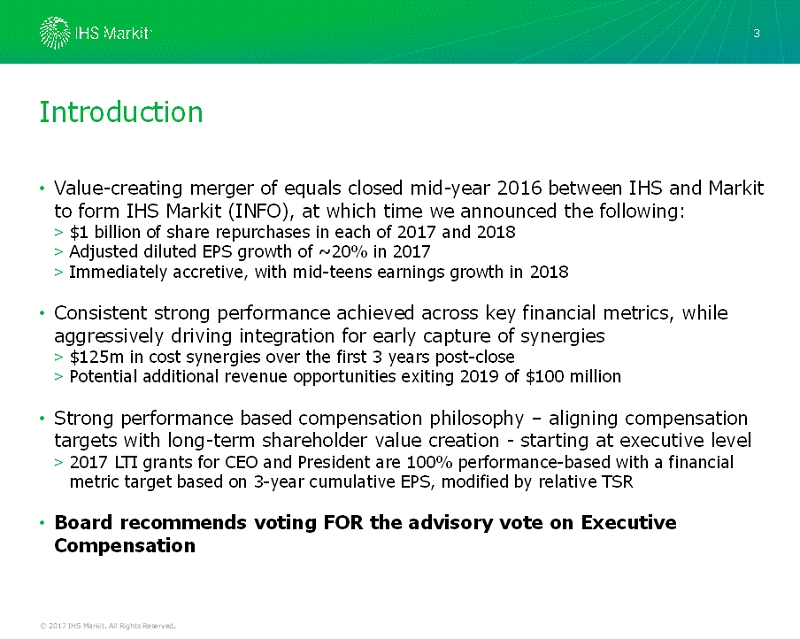
© 2017 IHS Markit. All Rights Reserved. Introduction •Value-creating merger of equals closed mid-year 2016 between IHS and Markit to form IHS Markit (INFO), at which time we announced the following: >$1 billion of share repurchases in each of 2017 and 2018 >Adjusted diluted EPS growth of ~20% in 2017 >Immediately accretive, with mid-teens earnings growth in 2018 •Consistent strong performance achieved across key financial metrics, while aggressively driving integration for early capture of synergies >$125m in cost synergies over the first 3 years post-close >Potential additional revenue opportunities exiting 2019 of $100 million •Strong performance based compensation philosophy –aligning compensation targets with long-term shareholder value creation -starting at executive level >2017 LTI grants for CEO and President are 100% performance-based with a financial metric target based on 3-year cumulative EPS, modified by relative TSR •Board recommends voting FOR the advisory vote on Executive Compensation 3

© 2017 IHS Markit. All Rights Reserved. Broad customer bases Global scale in growth markets Complementary product offerings Information powerhouse innovating for the future 1 2 3 4 Identifiable and achievable cost synergies High recurring revenue driving significant free cash flow Experienced management team 5 6 7 IHS Markit merger: strategic and financial rationale 4 ▪ Merger created opportunity to drive robust shareholder returns ▪ Successful CEO transition is imperative to achieving short and long term shareholder value creation

© 2016 IHS Markit. All Rights Reserved. Strong relative shareholder return under Mr. Stead 5 Legacy IHS CEO Tenure Pre-retirement (11/11/05 –5/31/2013) Post Return Announcement (6/1/2015 –6/30/2015) IHS Markit CEO Tenure (7/13/2016 –3/17/2017) 515% 43% 55% IHS Peers (1) S&P 500 1 Reflects market cap weighted return of peers who were publicly traded at the measurement start date. Peer group used consistentwith peer group disclosed in CD&A. 2 Reflects return based on opening price of first day of public trading to close price on 3/17/17. • Long track record of significant post–IPO success 4% -3% -2% IHS Peers (1) S&P 500 • Immediate favorable reaction to announcement of Mr. Stead’s return as CEO of IHS • IHS stock went up 4% in the weeks after the announcement while the broader market declined 23% 5% 12% IHS Markit (2) Peers S&P 500 • Continued outperformance as CEO of IHS Markit

© 2017 IHS Markit. All Rights Reserved. Post-merger CEO grant •Following merger close, the HR Committee granted a special one-time performance-based equity award to ensure retention and alignment through CEO succession period >Continued retention, engagement and alignment with short and long term merger objectives is imperative >Seamless CEO succession is key to future success and shareholder value creation •Grant 100% performance-based award based on stretch goals >EPS growth performance goal for grant tied to the high end of communicated guidance –Award only vests at target levels if outperformance is realized >This goal is only achievable with revenue growth and attainment of synergies •Performance period consistent with CEO succession timeline >Alignment and focus on short-term merger success critical for Company success >All future awards have a three year performance period and based on long-term (cumulative) EPS and relative TSR goals •Grant size determined following review of unvested equity and market data >Mr. Stead’s unvested equity participation lagged due to timing of his return to CEO position >Grant size approximates median of CEO awards in disclosed peer group 6

© 2017 IHS Markit. All Rights Reserved. Pay Element Pay Philosophy Component Performance Element Long-Term Equity- Based Incentive 100% PSUs 3-Year Cumulative EPS 3-Year Relative TSR Modifier Annual Cash Incentives Cash Corporate Revenue Corporate EBITDA EBITDA Multiplier Individual Multiplier Base Salary Cash Evaluated Annually Overview of CEO compensation program elements 7 • Support long-term strategy and alignment with shareholders by tying a significant portion of total pay to long-term Company financial and share price performance • No time-based vesting equity awards for CEO • Motivate and provide annual recognition of superior operational and financial performance • Fixed pay to recognize individual's role and responsibilities
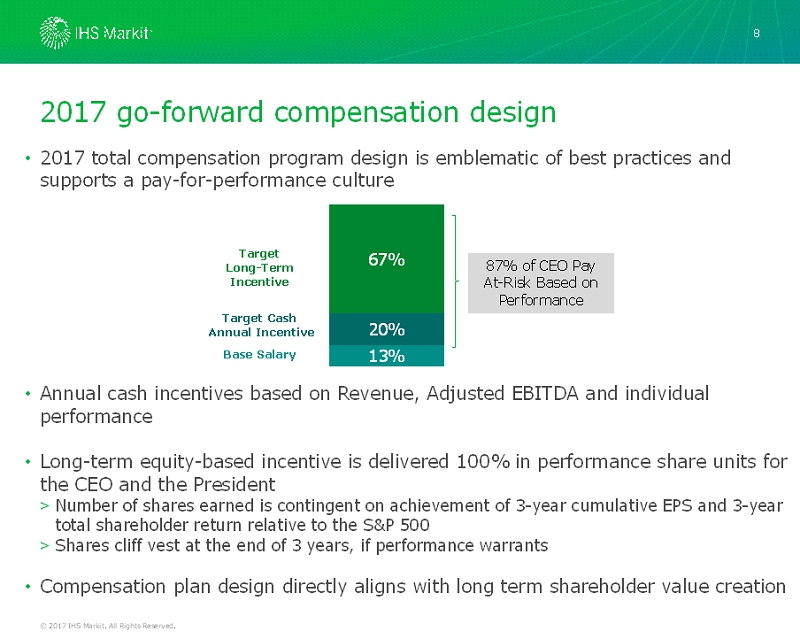
© 2017 IHS Markit. All Rights Reserved. 2017 go-forward compensation design •2017 total compensation program design is emblematic of best practices and supports a pay-for-performance culture •Annual cash incentives based on Revenue, Adjusted EBITDA and individual performance •Long-term equity-based incentive is delivered 100% in performance share units for the CEO and the President >Number of shares earned is contingent on achievement of 3-year cumulative EPS and 3-year total shareholder return relative to the S&P 500 >Shares cliff vest at the end of 3 years, if performance warrants •Compensation plan design directly aligns with long term shareholder value creation 8 13% 20% 67% Target Long-Term Incentive Target Cash Annual Incentive Base Salary 87% of CEO Pay At-Risk Based on Performance