Attached files
| file | filename |
|---|---|
| EX-32 - CEO/CFO CERTIFICATION - IHS Markit Ltd. | ex32q418.htm |
| EX-31.2 - CFO CERTIFICATION - IHS Markit Ltd. | ex312q418.htm |
| EX-31.1 - CEO CERTIFICATION - IHS Markit Ltd. | ex311q418.htm |
| EX-24.1 - POWER OF ATTORNEY - IHS Markit Ltd. | ex241powerofattorney2018q4.htm |
| EX-23.1 - CONSENT OF ERNST & YOUNG LLP - IHS Markit Ltd. | ex231q418.htm |
| EX-21.1 - SUBSIDIARIES OF REGISTRANT - IHS Markit Ltd. | ex211q418.htm |
| EX-10.79 - SECOND AMENDMENT TO DEFERRED COMPENSATION PLAN - IHS Markit Ltd. | ex1079q418.htm |
| EX-10.78 - FIRST AMENDMENT TO DEFERRED COMPENSATION PLAN - IHS Markit Ltd. | ex1078q418.htm |
UNITED STATES
SECURITIES AND EXCHANGE COMMISSION
Washington, D.C. 20549
___________________________________________________
FORM 10-K
___________________________________________________
x | ANNUAL REPORT PURSUANT TO SECTION 13 OR 15(d) OF THE SECURITIES EXCHANGE ACT OF 1934 |
For the fiscal year ended November 30, 2018
OR
o | TRANSITION REPORT PURSUANT TO SECTION 13 OR 15(d) OF THE SECURITIES EXCHANGE ACT OF 1934 |
For the transition period from to
Commission file number 001-36495
___________________________________________________
IHS MARKIT LTD.
(Exact name of registrant as specified in its charter)
___________________________________________________
Bermuda | 98-1166311 | |
(State or Other Jurisdiction of Incorporation or Organization) | (IRS Employer Identification No.) | |
4th Floor, Ropemaker Place
25 Ropemaker Street
London, England
EC2Y 9LY
(Address of Principal Executive Offices)
+44 20 7260 2000
(Registrant’s telephone number, including area code)
Securities registered pursuant to Section 12(b) of the Act:
Title of each class | Name of each exchange on which registered | |
Common Shares, $0.01 par value per share | NASDAQ Global Select Market | |
Securities registered pursuant to Section 12(g) of the Act:
None.
___________________________________________________
Indicate by check mark if the registrant is a well-known seasoned issuer, as defined in Rule 405 of the Securities Act. x Yes o No
Indicate by check mark if the registrant is not required to file reports pursuant to Section 13 or 15(d) of the Act. o Yes x No
Indicate by check mark whether the registrant (1) has filed all reports required to be filed by Section 13 or 15(d) of the Securities Exchange Act of 1934 during the preceding 12 months (or for such shorter period that the registrant was required to file such reports), and (2) has been subject to such filing requirements for the past 90 days. x Yes o No
Indicate by check mark whether the registrant has submitted electronically every Interactive Data File required to be submitted pursuant to Rule 405 of Regulation S-T (§232.405 of this chapter) during the preceding 12 months (or for such shorter period that the registrant was required to submit and post such files). x Yes o No
Indicate by check mark if disclosure of delinquent filers pursuant to Item 405 of Regulation S-K is not contained herein, and will not be contained, to the best of registrant's knowledge, in definitive proxy or information statements incorporated by reference in Part III of this Form 10-K or any amendment to this Form 10-K. x
Indicate by check mark whether the registrant is a large accelerated filer, an accelerated filer, a non-accelerated filer, or a smaller reporting company. See the definitions of “large accelerated filer,” “accelerated filer” and “smaller reporting company” in Rule 12b-2 of the Exchange Act.
Large accelerated filer | x | Accelerated filer | o | ||
Non-accelerated filer | o | Smaller reporting company | o | ||
Emerging growth company | o | ||||
If an emerging growth company, indicate by check mark if the registrant has elected not to use the extended transition period for complying with any new or revised financial accounting standards provided pursuant to Section 13(a) of the Exchange Act. o
Indicate by check mark whether the registrant is a shell company (as defined in Rule 12b-2 of the Exchange Act). o Yes x No
The aggregate market value of the voting and non-voting common equity held by non-affiliates, based upon the closing price for the common shares as reported on the NASDAQ Global Select Market on the last business day of the registrant’s most recently completed second fiscal quarter, was approximately $13.4 billion. All executive officers, directors, and holders of five percent or more of the outstanding common shares of the registrant have been deemed, solely for purposes of the foregoing calculation, to be “affiliates” of the registrant.
As of December 31, 2018, there were 397,359,890 of our common shares outstanding, excluding 25,219,470 outstanding common shares held by the Markit Group Holdings Limited Employee Benefit Trust.
DOCUMENTS INCORPORATED BY REFERENCE
None.
TABLE OF CONTENTS
Page | |||
Item 1. | |||
Item 1A. | |||
Item 1B. | |||
Item 2. | |||
Item 3. | |||
Item 4. | |||
Item 5. | |||
Item 6. | |||
Item 7. | |||
Item 7A. | |||
Item 8. | |||
Item 9. | |||
Item 9A. | |||
Item 9B. | |||
Item 10. | |||
Item 11. | |||
Item 12. | |||
Item 13. | |||
Item 14. | |||
Item 15. | |||
Item 16. | |||
2
Certain Definitions
The following definitions apply throughout this Annual Report on Form 10-K unless the context requires otherwise:
“common shares” | The common shares of IHS Markit Ltd., par value $0.01 per share | |
“IHS” | IHS Inc., a Delaware corporation and a subsidiary of IHS Markit, which is the accounting predecessor to IHS Markit in connection with the Merger, and its subsidiaries | |
“IHS Markit” | IHS Markit Ltd., a Bermuda exempted company, after completion of the Merger, and its subsidiaries | |
“Markit” | Markit Ltd., which was the name of IHS Markit prior to completion of the Merger, and its subsidiaries | |
“Merger” | Merger of IHS and Markit, with IHS surviving the merger as an indirect and wholly owned subsidiary of IHS Markit, pursuant to that certain Agreement and Plan of Merger, dated as of March 20, 2016, and completed on July 12, 2016 | |
“We,” “Us,” “Company,” “Group,” or “Our” | IHS Markit after completion of the Merger, and IHS or Markit, as the context requires, prior to completion of the Merger | |
Cautionary Note Regarding Forward-Looking Statements
This Annual Report on Form 10-K contains “forward-looking statements” as defined in the Private Securities Litigation Reform Act of 1995. These statements, which express management’s current views concerning future business, events, trends, contingencies, financial performance, or financial condition, appear at various places in this report and use words like “aim,” “anticipate,” “assume,” “believe,” “continue,” “could,” “estimate,” “expect,” “forecast,” “future,” “goal,” “intend,” “likely,” “may,” “might,” “plan,” “potential,” “predict,” “project,” “see,” “seek,” “should,” “strategy,” “strive,” “target,” “will,” and “would” and similar expressions, and variations or negatives of these words. Examples of forward-looking statements include, among others, statements we make regarding: guidance and predictions relating to expected operating results, such as revenue growth and earnings; strategic actions such as acquisitions, joint ventures, and dispositions, the anticipated benefits therefrom, and our success in integrating acquired businesses; anticipated levels of capital expenditures in future periods; our belief that we have sufficient liquidity to fund our ongoing business operations; expectations of the effect on our financial condition of claims, litigation, environmental costs, contingent liabilities, and governmental and regulatory investigations and proceedings; and our strategy for customer retention, growth, product development, market position, financial results, and reserves. Forward-looking statements are neither historical facts nor assurances of future performance. Instead, they are based only on management’s current beliefs, expectations, and assumptions regarding the future of our business, future plans and strategies, projections, anticipated events and trends, the economy, and other future conditions. Because forward-looking statements relate to the future, they are subject to inherent uncertainties, risks, and changes in circumstances that are difficult to predict and many of which are outside of our control. Important factors that could cause our actual results and financial condition to differ materially from those indicated in the forward-looking statements include, among others, the following: economic and financial conditions, including volatility in interest and exchange rates; our ability to develop new products and services; our ability to manage system failures or capacity constraints; our ability to manage fraudulent or unpermitted data access or other cyber-security or privacy breaches; our ability to successfully manage risks associated with changes in demand for our products and services; our ability to manage our relationships with third-party service providers; legislative, regulatory, and economic developments, including any new or proposed U.S. Treasury rule changes; the extent to which we are successful in gaining new long-term relationships with customers or retaining existing ones and the level of service failures that could lead customers to use competitors’ services; the anticipated tax treatment, unforeseen liabilities, future capital expenditures, revenues, expenses, earnings, synergies, economic performance, indebtedness, financial condition, losses, future prospects, business and management strategies for the management, expansion, and growth of our operations; our ability to retain and hire key personnel; our ability to satisfy our debt obligations and our other ongoing business obligations; and the occurrence of any catastrophic events, including acts of terrorism or outbreak of war or hostilities. These risks, as well as other risks which would cause actual results to be significantly different from those expressed or implied by these forward-looking statements, are more fully discussed under the caption “Risk Factors” in this Annual Report on Form 10-K, along with our other filings with the U.S. Securities and Exchange Commission (“SEC”). While the list of factors presented here is considered representative, no such list should be considered to be a complete statement of all potential risks and uncertainties. Unlisted factors may present significant additional obstacles to the realization of forward-looking statements. Consequences of material differences in results as
3
compared with those anticipated in the forward-looking statements could include, among other things, business disruption, operational problems, financial loss, legal liability to third parties and similar risks, any of which could have a material adverse effect on our consolidated financial condition, results of operations, credit rating, or liquidity. Therefore, you should not rely on any of these forward-looking statements. Any forward-looking statement made by us in this Annual Report on Form 10-K is based only on information currently available to our management and speaks only as of the date of this report. We do not assume any obligation to publicly provide revisions or updates to any forward-looking statements, whether as a result of new information, future developments or otherwise, should circumstances change, except as otherwise required by securities and other applicable laws.
Website and Social Media Disclosure
We use our website (www.ihsmarkit.com) and corporate Twitter account (@IHSMarkit) as routine channels of distribution of company information, including news releases, analyst presentations, and supplemental financial information, as a means of disclosing material non-public information and for complying with our disclosure obligations under Regulation FD. Accordingly, investors should monitor our website and our corporate Twitter account in addition to following press releases, SEC filings, and public conference calls and webcasts. Additionally, we provide notifications of news or announcements as part of our investor relations website. Investors and others can receive notifications of new information posted on our investor relations website in real time by signing up for email alerts.
None of the information provided on our website, in our press releases, public conference calls, and webcasts, or through social media channels is incorporated into, or deemed to be a part of, this Annual Report on Form 10-K or in any other report or document we file with the SEC, and any references to our website or our social media channels are intended to be inactive textual references only.
Financial Presentation
We operate on a November 30 fiscal year end. Unless otherwise indicated, references in this Annual Report on Form 10-K to an individual year means the fiscal year ended November 30. For example, “2018” refers to the fiscal year ended November 30, 2018.
Trademarks, Service Marks, and Copyrights
We own or have rights to use the trademarks, service marks, and trade names that we use in connection with the operation of our business; other trademarks, service marks, and trade names referred to in this Annual Report on Form 10-K are, to our knowledge, the property of their respective owners. We also own or have the rights to copyrights that protect aspects of our products and services. Solely for convenience, the trademarks, service marks, trade names, and copyrights referred to in this Annual Report on Form 10-K are listed without the ®, ™, and © symbols, but we will assert, to the fullest extent under applicable law, our rights or the rights of the applicable licensors to these trademarks, service marks, and trade names.
4
PART I
Item 1. Business
History and Development of the Company
On July 12, 2016, IHS Inc. (“IHS”), a Delaware corporation, Markit Ltd. (“Markit”), a Bermuda exempted company, and Marvel Merger Sub, Inc. (“Merger Sub”), a Delaware corporation and an indirect and wholly owned subsidiary of Markit, completed a merger (“Merger”) pursuant to which Merger Sub merged with and into IHS, with IHS surviving the Merger as an indirect and wholly owned subsidiary of Markit. Upon completion of the Merger, Markit became the combined group holding company and was renamed IHS Markit Ltd. (“IHS Markit” or “we” or “us” or “our”). In accordance with the terms of the Merger agreement, IHS stockholders received 3.5566 common shares of IHS Markit for each share of IHS common stock they owned. IHS was treated as the acquiring entity for accounting purposes, which is reflected in the results of operations, financial position, financial statements, and Management’s Discussion and Analysis of Financial Condition and Results of Operations. Other sections of this report refer to legacy Markit and legacy IHS, as the context requires, for each of the entities prior to the Merger, and to IHS Markit, the combined company after completion of the Merger.
IHS was in business since 1959 and became a publicly traded company on the New York Stock Exchange in 2005. Markit was founded in 2003 and was incorporated pursuant to the laws of Bermuda in 2014 to become the holding company for Markit’s business in connection with its initial public offering on the NASDAQ Stock Market (“NASDAQ”) in June 2014. IHS Markit’s common shares are traded on the NASDAQ under the symbol “INFO.”
Our principal executive offices are located at 4th Floor, Ropemaker Place, 25 Ropemaker Street, London, England EC2Y 9LY. Our telephone number at this address is +44 20 7260 2000. We maintain a registered office in Bermuda at Clarendon House, 2 Church Street, Hamilton HM 11, Bermuda. The telephone number of our registered office is +1 441 295 5950.
Our Vision
Our vision is to be our customers’ leading source for critical information, analytics, and insight. Our purpose is to help our customers grow, enabling better decision making and operational efficiency.
Our Business
We deliver data, insight, and software that combine our expertise, unique content sets, and leading technology to the world’s major industries, financial markets, and governments. Our analytics reveal interdependencies across complex industries, which enhances transparency, reduces risk, and improves operational efficiency for our customers. Our information, analytics, and solutions are significant components in the systems and workflows of many of our customers and continue to become increasingly important to our customers’ operations. We leverage leading technologies and our industry expertise to create innovative products and services that provide information and insight to our customers to help them be more efficient and make more informed decisions. We are committed to sustainable, profitable growth.
Our core competency is using our expertise to source and transform data into information and analytics that our customers can use when making operational and strategic decisions. We are a dependable resource for our customers, who require and demand the most accurate and robust information available. We are dedicated to providing the information and analysis our customers need to make critical decisions that drive growth and value for their operations.
By integrating and connecting our information and analytics with proprietary and widely used decision-support technology on scalable platforms, we produce critical information and insight designed to meet our customers’ needs. Our product development teams have also created proprietary Web services and application interfaces that enhance access to our information and allow our customers to integrate our offerings with other data, business processes, and applications (such as computer-aided design, enterprise resource planning (“ERP”), supply chain management, and product data/lifecycle management).
Our Objectives
To achieve our vision, we are focusing our efforts primarily on the following areas:
• | Customers. We are working together with our customers to be a trusted and valued partner through meaningful and responsive engagement, deep and differentiated expertise, and best-in-class delivery. |
5
• | Product. We strive to develop innovative, best-in-class products that deliver real value, are reliable, and stand out from our competitors. |
• | Technology and data science. We are using technology and data science as a differentiator to maximize and optimize our content, expertise, and operations. |
• | People. Our work environment is designed to encourage excitement and pride in the work we do and where our people are constantly learning and feel challenged, respected, and valued. |
• | Efficiency. We expect to achieve operational excellence by consistently improving productivity and efficiency by leveraging technology and operations. |
• | Financial strength. We seek to consistently deliver on our key financial commitments. |
We benchmark our progress annually against these objectives using external and internal metrics. For example, to measure customer and employee satisfaction, we use third-party surveys and develop goals based on those metrics.
Our Strategy
Our strategy is to bring together information, research, analytics, and technology to deliver integrated offerings to customers in separate but interconnected industries. We believe that we can best implement our strategy by using our strong foundation of leading assets, talent, and competitive positioning in large growing global markets to achieve the following:
• | Increase in geographic, product, and customer penetration. We believe there are continued opportunities to add new customers and to increase the use of our products and services by existing customers. We plan to add new customers and build our relationships with existing customers by leveraging our existing sales channels, broad product portfolio, global footprint, and industry expertise to anticipate and respond to the changing demands of our end markets. |
• | Introduce innovative offerings and enhancements. To maintain and enhance our position as a leading information services provider, we introduce enhancements to our products and services, as well as launch new products and services. We maintain an active dialogue with our customers and partners to allow us to understand their needs and anticipate market developments. We also seek to develop innovative uses for our existing products and services to generate incremental revenue, find more cost-effective inputs to support our existing products and services, and facilitate development of profitable new products and services. Our investment priorities are primarily in energy, automotive, and financial services, and we intend to continue to invest across our business to increase our customer value proposition. |
• | Balance capital allocation. We expect to balance capital allocation between returning capital to shareholders (through consistent share repurchases) and completing mergers and acquisitions, focused primarily on targeted transactions in our core end markets that will allow us to continue to build out our strategic position. |
Our Global Organizational Structure
To serve our customers, we are organized into the following four industry-focused segments:
•Resources, which includes our Energy and Chemicals product offerings;
• | Transportation, which includes our Automotive; Maritime & Trade; and Aerospace, Defense & Security product offerings; |
• | Consolidated Markets & Solutions, which includes our Product Design; Technology, Media & Telecom; and Economics & Country Risk product offerings; and |
• | Financial Services, which includes our financial Information, Processing, and Solutions product offerings, as well as product offerings of Ipreo, our recent acquisition. |
We believe that this sales and operating model helps our customers do business with us by providing a cohesive, consistent, and effective product, sales, and marketing approach by segment.
Our Competitive Strengths
We believe that our competitive strengths include the following:
• | Trusted partner with diversified, global customer base and strong brand recognition. We believe that our customers trust and rely on us for our consultative approach to product development, dedication to customer satisfaction, and ability to execute and deliver effective product and service offerings. Our industry expertise allows us to effectively |
6
anticipate, understand, and address our customers’ needs. The Merger increased our capacity to address new markets and opportunities, and our global footprint allows us to serve our customers throughout the world and to introduce our products and services to customers in new markets. Our product offerings are well established and recognized in multiple industries. We also own a number of well-known brands, including CARFAX, CERAWeek, Jane’s, the Purchasing Managers Index series, Bigdough, and the iBoxx indices.
• | Breadth and depth of information and analytics. Our customers benefit from a concentration of intellectual wealth and thought leadership in a variety of industries. We believe that our global team of information and industry experts, research analysts, and economists provides our customers with leading strategic information and research. We convert raw data into critical information through a series of transformational steps that reduce the uncertainty that is inherent in unrefined data. Our goal is to ensure that the information we provide through our product offerings is correct, current, complete, and consistent; therefore, we place a high degree of emphasis on the data transformation process. With our process, we believe that we are able to provide information and analytics that are both useful to our customers and available where and when needed. Our process also provides the foundation for the integration of our products and services into differentiated offerings and advanced analytics for the customers in our target industries. |
• | Attractive financial model. We believe we have an attractive financial model due to our recurring revenue, margin expansion, cash generation, and capital flexibility characteristics. |
◦ | Significant recurring revenue. We offer our products and services primarily through recurring fixed and variable fee agreements, and this business model has historically delivered stable revenue and predictable cash flows. For the year ended November 30, 2018, we generated approximately 84 percent of our revenue from recurring revenue streams. Many of our offerings are core to our customers’ business operations, and we have long-term relationships with many of our customers. |
◦ | Solid margin expansion. Our customer focus and fiscal discipline has permitted us to maintain and progressively increase our margins as we integrate and streamline our operations and leverage our business model to provide valuable customer support. |
◦ | High cash generation. Our business has low capital requirements for product enhancement and new product development, allowing us to generate strong cash flow. |
◦ | Capital flexibility. Our cash flow model and credit quality provide us with a significant amount of flexibility in decision-making, allowing us to balance internal resource and investment needs, acquisitions, and shareholder return. |
Our Customers
We have a diverse customer base, with more than 50,000 business and government customers, including 80 percent of the Fortune Global 500 and 70 percent of the Fortune U.S. 1000. Our customers operate in global interconnected industries and financial markets, and we continue to build on our existing scale to integrate our comprehensive content, expertise, tools, technology, and research and analysis to produce a differentiated offering that makes us an important part of many of our customers’ core workflows. In 2018, no customer or group of affiliated customers represented more than 10 percent of our revenue.
Our Operating Segments
We develop our products and services based on customer needs in the target industries we serve and in the workflows that our customers use. We have organized our business to address the following key industries:
Resources
Our Resources segment includes our Energy offerings, which represent approximately 87 percent of Resources revenue, and our Chemicals offerings, which make up the balance of the segment’s revenue.
Our Energy offerings are focused on upstream, midstream, downstream, and power/gas/coal/renewables (“PGCR”) services. Within those offerings, we also offer proprietary physical commodity pricing through our OPIS Price Reporting Agency Group.
• | Our upstream offerings provide critical information and expertise around country exploration and production risk; plays and basins technical information; costs and technologies; and energy company information for approximately 20,000 assets worldwide, including more than 6.5 million oil and gas wells, 5,000 basins, more than 3,400 land rigs |
7
and 6,200 marine vessels, and a database of 47,000 merger and acquisition transactions. We do this through a combination of energy technical information, analytical tools, and market forecasting and consulting. For instance, strategic planners, geoscientists, and engineers use our insight and leading geotechnical database and analytical tools to facilitate exploration, development, and production of energy assets. Some of our key offerings include the following:
◦ | Our Global Well, Production, Land, and Subsurface Content provides a comprehensive inventory of current and historical energy data. This content forms the basis for all of our upstream technical research, intelligence, analysis, and software portfolio. |
◦ | The Kingdom/Harmony Suite provides leading-edge analysis of subsurface properties, including seismic interpretation and production estimation, for the geoscience and engineering markets globally. |
◦ | Vantage is a global asset evaluation system that contains more than 23,000 oil and gas assets across the globe, performing forward-looking analysis of an asset’s expected return and permitting large-scale asset comparisons from distinct individual regions. |
◦ | Companies and Transactions performs database-driven analysis of roughly 47,000 merger and acquisition transactions, as well as financial analysis of all major oil and gas companies globally. |
• | Our midstream and downstream offerings provide market forecasting, midstream market analysis and supply chain data, refining and marketing economics, and oil product intelligence. For instance, we are a leading provider of pricing information for refined products on spot, rack, and retail markets. This information provides critical reference and benchmark information for buyers and sellers of refined products. We are also a leading supplier of bespoke consulting, providing strategic direction and capital investment advisory services. A key pricing product offering for our midstream and downstream offerings is the OPIS Spot Ticker, which allows almost a thousand petroleum wholesalers in North America to time their rack purchases in order to reduce expenditures on their fuel purchases. |
• | Our PGCR offerings provide global and regional outlooks and forecasts for power, coal, gas, and renewable markets. Buyers and sellers in these markets use our studies to gain insight on market trends and fundamentals. In 2018, we launched an analytics platform for Liquefied Natural Gas (“LNG”), providing insights on supply and demand for this growing worldwide fuel. |
Our Chemicals offerings include data for manufacturing processes, as well as capital expenditure, cost, price, production, trade, demand, and capacity industry analysis and forecasts for more than 250 chemicals in more than 110 countries. We also have an extensive library of detailed techno-economic analyses of chemicals and refining process technologies. We provide a number of consulting services, including training, strategy development, and project development offerings to the chemical and related industries. Our business information services track current events, supply high-velocity information, and hold conferences related to the chemical industry. Our chemical data, insights, and analysis help companies develop and deploy robust plans pertaining to capital deployment, operations, and risk mitigation.
In addition, we leverage our market leadership in these industries to convene global industry, government, and regulatory leaders in global and regional events, such as our annual CERAWeek and World Petrochemical conferences.
Transportation
Our Transportation segment includes our Automotive offerings, which represent about 84 percent of the segment’s revenue, and our Maritime & Trade and Aerospace, Defense & Security offerings, which make up the balance of the segment’s revenue.
• | Automotive. We serve the full automotive value chain with a focus on original equipment manufacturers (“OEMs”), parts suppliers, and dealers. |
Within the new car market, we provide authoritative analysis and forecasts of sales and production for light vehicles, medium and heavy commercial vehicles, powertrain, components, and technology systems across all major markets. Our comprehensive forecast database covers 99 percent of global light vehicle sales and production. We forecast sales and production of more than 50,000 unique vehicle model variants, as well as more than 100 different vehicle systems, sub-systems, and components.
We also provide a wide range of performance measurement and marketing tools for carmakers, dealers, and agencies. We continue to leverage analytics and innovation to develop product and service offerings aimed at addressing needs across the value chain, including strategy and planning, marketing, sales, dealer services, and after sales. In the US,
8
our sales and marketing offerings draw on a database of more than 7 billion ownership records, covering 760 million vehicles and more than 240 million US households over a period of 25 years. We also offer a range of vehicle recall solutions to carmakers, including identifying households to be contacted, providing accurate measurement of recall program completion, and in some cases, providing a full turnkey solution that manages the entire fulfillment process for their safety recall campaigns.
Our automotiveMastermind (“aM”) offering provides predictive analytics and marketing automation software for the new car dealer market, enabling dealers to improve their customer retention and extend their customer portfolio through “conquest” campaigns.
Within the used car market, we support dealers, insurers, and consumers through our CARFAX products. These offerings provide critical information for used car dealers and their customers in the used car buying process. For example, CARFAX vehicle history reports provide maintenance, accident, odometer, and commercial use information on cars in the United States. This history, based on more than 20 billion records collected from more than 112,000 data sources, provides confidence to dealers and consumers in the car buying process. We have expanded our product line under CARFAX to include a used car listing service for dealers and vehicle-specific valuation offerings.
• | Maritime & Trade (“M&T”). We have been gathering data on ships since 1764 when the first Lloyd’s Register of Ships was published. We provide, on behalf of the International Maritime Organization (“IMO”), the unique global ID (the IMO number) for all ocean-going ships over 100 gross tons. Our M&T content and analytics provide comprehensive data on close to 200,000 ships over 100 gross tons, as well as monthly import and export statistics on more than 90 countries and tracking and forecasting more than 90 percent of international trade by value. |
• | Aerospace, Defense & Security (“AD&S”). We are a significant provider of Open-Source Intelligence (“OSINT”) for national security organizations and aerospace & defense companies. Our AD&S content and analytics provide specifications for more than 20,000 military vehicles, naval vessels, and aircraft types. Our budget forecasts cover more than 99 percent of global defense spending, and we have analyzed more than 350,000 terrorism-related events, with more analyzed and added each day. Our AD&S offerings include Jane’s Military & Security Assessments Intelligence Centre, Jane’s Defence Equipment & Technology Intelligence Centre, and Jane's Terrorism and Insurgency Centre. |
Consolidated Markets & Solutions (“CMS”)
Our CMS segment includes our Product Design offerings, which represent approximately 60 percent of the segment’s revenue, and our Technology, Media & Telecom and Economics and Country Risk offerings, which make up the balance of the segment’s revenue.
• | Product Design. Our Product Design solutions provide technical professionals with the information and insight required to more effectively design products, optimize engineering projects and outcomes, solve technical problems, and address complex supply chain challenges. Our offerings utilize advanced knowledge discovery technologies, research tools, and software-based engineering decision engines to advance innovation, maximize productivity, improve quality, and reduce risk. Our Product Design offerings include the following: |
◦ | Engineering Workbench™ from IHS Markit provides a single interface to surface answers from a curated universe of technical knowledge comprising more than 145 million records. This includes standards, codes, and specifications; applied technical reference; engineering journals, reports, best practices, and other vetted technical reference; and patents and patent applications. |
◦ | BOM Intelligence, including data on more than 590 million parts, enables our customers to integrate their bills of materials with obsolescence management, product change notifications (PCNs), end-of-life (EOL) alerts, and research and analysis. |
◦ | Goldfire’s cognitive search and other advanced knowledge discovery capabilities help pinpoint answers buried in enterprise systems and unstructured data, enabling engineers and technical professionals to accelerate problem solving and make better decisions more quickly. |
• | Technology, Media & Telecom. Our Technology, Media & Telecom offerings service the entire technology value chain, including components and devices, performance analytics, and end market intelligence. We deliver comprehensive insight and tools for managing technology. Our offerings enable customers to optimize their supplier and customer engagement strategy and differentiate their product portfolio from the competition. With our expert research, custom consulting, analytics, and component cost information, we provide insights on technology market |
9
share, supply chain, and adoption, as well as forecasts for key technology markets on a geographic, industry, and company level.
• | Economics and Country Risk (“ECR”). We provide a vast range of economic and risk data, forecasts, and analytic tools to customers for their strategic market planning, procurement, and risk management decisions. Our economists and analysts globally monitor economic developments and the risk environment in more than 200 countries and regions. |
Financial Services
Our Financial Services segment provides pricing and reference data, indices, valuation and trading services, trade processing, enterprise software, and managed services. Financial Services end users include front- and back-office professionals, such as traders, portfolio managers, risk managers, research professionals, and other financial markets participants, as well as operations, compliance, and enterprise data managers. This segment includes our Information, Processing, and Solution offerings, as well as offerings from our recent acquisition of Ipreo, a leading financial services solutions and data provider.
• | Information. Our Information offerings provide enriched content consisting of pricing and reference data, indices, and valuation and trading services across multiple asset classes and geographies through both direct and third-party distribution channels. Our Information products and services are used for independent valuations, research, trading, and liquidity and risk assessments. These products and services help our customers price instruments, comply with relevant regulatory reporting and risk management requirements, and analyze financial markets. Some of our key Information offerings include the following: |
◦ | Pricing and Reference Data Services provide independent pricing across major geographies and key asset classes as well as instrument, entity, and reference data products. We price instruments spanning major asset classes, including fixed income, equities, credit, and foreign exchange (“FX”). Customers use our pricing data primarily for independent valuations, risk analytics, and pre-trade analytics, and they use our reference data products in a broad range of valuation, trading, and risk applications in both cash and derivative markets. |
◦ | The Indices product portfolio includes owned and administered indices covering all asset classes. Key proprietary index families include the PMI series, iBoxx, iTraxx and CDX. In addition, we provide a range of index-related services for custom indices. Our indices are used for benchmarking, risk management, valuation, and trading. They also form the basis of a wide range of financial products, including exchange-traded funds, index funds, structured products, and derivatives. |
◦ | Valuation and Trading Services provide a broad range of valuation and trading services to both derivative and cash market participants, focused on instrument and portfolio valuations, trading performance and analysis, research aggregation, and investment process workflow. Our portfolio valuation service provides independent valuations for a wide range of derivatives and cash products across all asset classes to a range of financial institutions, including many buy-side firms. Our private equity services provide independent valuation and performance reporting solutions for investors in unlisted equity, private placements, and hard-to-value debt. |
• | Processing. Our Processing offerings provide trade processing products and services globally for over-the-counter (“OTC”) derivatives, FX, and syndicated loans. Our trade processing services enable buy-side and sell-side firms to process transactions rapidly, which increases efficiency by optimizing post-trade workflow, reducing risk, complying with reporting regulations, and improving connectivity. We believe we are among the largest providers of end-to-end multiple asset OTC derivatives trade processing services, as well as the largest providers of syndicated loan processing services. |
• | Solutions. Our Solutions offerings provide configurable enterprise software platforms, managed services, and hosted digital solutions. |
◦ | Enterprise Software Platforms include both standardized and custom solutions to automate our customers’ in-house processing and connectivity for trading and post-trading processing, as well as enterprise risk management solutions to enable customers to calculate risk measures. Our primary enterprise software products, which also provide hosted solution alternatives, include the following: |
▪ | Enterprise Data Management (“EDM”) software and services provide customers a central hub to manage the acquisition, validation, storage, and distribution of data sets from multiple sources. |
10
▪ | Analytics provides our customers with a range of enterprise risk management software solutions to enable customers to calculate risk measures while delivering exceptional computation speed and rapid time to market. |
▪ | Wall Street Office provides a loan portfolio management platform to participants in the syndicated bank loan market across the complete trading lifecycle. |
▪ | Information Mosaic is a global provider of post-trade securities and corporate actions processing solutions. |
▪ | Thinkfolio is an enterprise order management and portfolio modeling system. |
◦ | Managed Services and Hosted Digital Solutions offerings, which are targeted at a broad range of financial services industry participants, help our customers capture, organize, process, display, and analyze information, manage risk, reduce fixed costs, and meet regulatory requirements. Our primary offerings include the following: |
▪ | Digital designs, builds, and hosts custom web solutions for customers in both the retail and institutional financial services markets. |
▪ | WSO Services helps syndicated loan customers streamline their business by providing outsourced access to our portfolio of services for middle and back office loan operations. |
▪ | Corporate Actions is a centralized source of validated corporate action data for equities, fixed income, and structured securities across the globe. |
▪ | Risk & Regulatory Compliance includes platforms and services to support counterparty transparency, tax regulations, and regulatory support for Dodd-Frank Act, EMIR, and other global regulations designed to increase oversight of financial markets. |
In August 2018, we added Ipreo to our Financial Services offerings. Ipreo is a leading financial services solutions and data provider that supports market participants in the capital-raising process, corporate activities, and private capital markets, including banks, public and private companies, and institutional and individual investors, as well as research, asset management, and wealth management firms. Our primary Ipreo offerings include the following:
• | Global Markets Group product offerings deliver bookbuilding platforms, investor prospecting solutions, customer relationship management platforms, and road show and event management systems to capital markets and financial services firms across multiple asset classes, including municipal bonds, equities, fixed income, and loans. |
• | Corporate product offerings deliver capital market intelligence and real-time investor analysis across asset classes to senior management and investor relations professionals. |
• | Private Capital Markets product offerings provide portfolio data management, analytics, reporting and valuation solutions, and platform services to private market owners and investors. |
Sales and Marketing
Our sales teams are located throughout the world and are organized within their respective business lines to align with our customers. In addition to field experience, we also conduct regular customer surveys to understand both current customer satisfaction levels and potential opportunities for product and coverage improvement.
Our financial services and corporate account management teams are part of our overall sales organization and are responsible for the delivery of the full breadth of our products and services to new and existing customers. The account management teams are also responsible for our overall relationship with our larger customers, focusing on developing new business, increasing our sales pipeline, and developing strategic transactions.
Our marketing organization is aligned with our sales organization, and defines our marketing strategy and executes marketing programs. A primary focus for marketing strategy is to empower IHS Markit brand awareness, revenue acceleration, and market leadership across our key industries for all products and services globally. Functionally, this includes corporate marketing, product marketing, and field marketing.
Competition
We believe the principal competitive factors in our business include the following:
• | Depth, breadth, timeliness, and accuracy of information and data provided |
•Quality of decision-support tools and services
11
•Quality and relevance of our analysis and insight
•Ease of use
•Customer support
•Value for price
We believe that we compete favorably on each of these factors. Although we face competition in specific industries and with respect to specific offerings, we do not believe that we have a direct competitor across all of the industries we serve due to the depth and breadth of our offerings. Competitors within specific industries or with respect to specific offerings are described below.
• | Resources. Our Energy and Chemical offerings compete primarily with offerings from Verisk, DrillingInfo, Schlumberger, Halliburton, GeoScout, Reed Elsevier, Argus, Genscape, S&P Global, and Nexant. |
• | Transportation. In the Automotive market, we primarily compete with offerings from LMC Automotive, Urban Science, and Experian and, with respect to vehicle history reports, principally with Experian and various other providers approved by the National Motor Vehicle Title Information System of the United States Department of Justice. In Maritime & Trade markets, we primarily compete with offerings from Informa and Genscape, and increasingly Bloomberg and Thomson Reuters. In AD&S markets, we primarily compete with offerings from Avascent in the area of market forecasts, Palantir and IBM Cognitive in the area of deep analytics, and Accenture in procurement and system sustainability. |
• | CMS. Our Product Design offerings primarily compete with offerings of SAI Global, Clarivate Analytics and TechStreet, and the standards developing organizations (“SDOs”), among others. Our Technology, Media & Telecom and electronic design offerings compete principally with offerings from Interactive Data, Gartner, Ampere, Arrow Electronics, SiliconExpert and parts manufacturers and distributors. Our ECR offerings compete primarily with offerings from the Economist Group, Oxford Economics, BMI Research, Moody’s, McGraw-Hill Education, Control Risks, and Verisk. |
• | Financial Services. Our Information offerings primarily compete with offerings of Bloomberg, FactSet, IntercontinentalExchange, S&P Global, MSCI, and Thomson Reuters. Our Processing products and services primarily compete with Bloomberg, IntercontinentalExchange, CME Group, Nasdaq, DTCC, and Thomson Reuters. Our Solutions offerings primarily compete with firms such as BlackRock, Bloomberg, IBM Algorithmics, Thomson Reuters, SS&C, AcadiaSoft, and global accounting and consulting firms. Our Ipreo offerings primarily compete with firms such as Dealogic, FIS, and Nasdaq. |
Government Contracts
We sell our products to various government agencies and entities. No individual contract is significant to our business. Although some of our government contracts are subject to terms that would allow renegotiation of profits or termination at the election of the government, we believe that no renegotiation or termination of any individual contract or subcontract at the election of the government would have a material adverse effect on our financial results.
Intellectual Property
We rely heavily on intellectual property, including the intellectual property we own and license. We regard our trademarks, copyrights, licenses, and other intellectual property as valuable assets and use intellectual property laws, as well as license and confidentiality agreements with our employees, customers, channel and strategic partners, and others, to protect our rights. In addition, we exercise reasonable measures to protect our intellectual property rights and enforce these rights when we become aware of any potential or actual violation or misuse.
We use intellectual property licensed from third parties, including SDOs, government agencies, public sources, market data providers, financial institutions, and manufacturers, as a component of our offerings and, in many cases, it cannot be independently replaced or recreated by us or others. We have longstanding relationships with most of the third parties from whom we license information. Almost all of the licenses that we rely upon are nonexclusive and expire within one to two years, unless renewed, although we have longer licenses with some of those third parties, particularly in the Financial Services segment.
We maintain registered trademarks and service marks in jurisdictions around the world. In addition, we have obtained patents and applied for patents in the United States, primarily related to our software portfolio, including our Kingdom,
12
Goldfire, Indices, and Digital products. For more information relating to our intellectual property rights, see “Item 1A. Risk Factors - We may not be able to protect our intellectual property rights and confidential information.”
Employees
As of November 30, 2018, we had approximately 14,900 employees located in 35 countries around the world.
Seasonality
Our business has seasonal aspects. Our first quarter generally has our lowest quarterly levels of revenue and profit. We also experience event-driven seasonality in our business; for instance, CERAWeek, an annual energy conference, is typically held in the second quarter of each year. Another example is the biennial release of the Boiler Pressure Vessel Code (“BPVC”) engineering standard, which generates revenue for us predominantly in the third quarter of every other year. The most recent BPVC release was in the third quarter of 2017.
Financial Information about Segments
See “Item 8 - Financial Statements and Supplementary Data - Notes to Consolidated Financial Statements - Note 17” in Part II of this Form 10-K for information with respect to each segment’s revenues, profits, and total assets and for information with respect to our revenues and long-lived assets for the U.S., U.K., and the rest of the world in aggregate. See also “Item 1A. Risk Factors - Our international operations are subject to risks relating to worldwide operations.”
Available Information
IHS Markit files annual, quarterly, and current reports, proxy statements, and other information with the Securities and Exchange Commission (“SEC”). The SEC maintains a website that contains annual, quarterly, and current reports, proxy statements, and other information regarding issuers that file electronically with the SEC (including IHS Markit). The SEC’s website is www.sec.gov.
We maintain an internet website for investors at http://investor.ihsmarkit.com. On this website, we make available, free of charge, annual reports on Form 10-K, quarterly reports on Form 10-Q, current reports on Form 8-K, Forms 3, 4, and 5 filed on behalf of directors and executive officers, and all amendments to any of those reports or filings, as soon as reasonably practicable after we electronically file such material with, or furnish such material to, the SEC. Unless specifically incorporated by reference, information on our website is not a part of this Annual Report on Form 10-K.
Also available on the website for investors at http://investor.ihsmarkit.com are our Amended and Restated Bye-laws, Corporate Governance Guidelines, Audit Committee Charter, Risk Committee Charter, Human Resources Committee Charter, Nominating and Governance Committee Charter, Business Code of Conduct, and Compliance Hotline and Reporting Misconduct Policy. Our corporate governance documents are available in print, free of charge to any shareholder who requests them, by contacting IHS Markit Investor Relations and Corporate Communications at 15 Inverness Way East, Englewood, CO 80112 or by calling (303) 790-0600.
Item 1A. Risk Factors
In addition to the other information provided in this Form 10-K, you should carefully consider the risks described in this section. The risks described below are not the only risks that could adversely affect our business; other risks currently deemed immaterial or additional risks not currently known to us could also adversely affect us. These and other factors could have a material adverse effect on the value of your investment in our securities, meaning that you could lose all or part of your investment.
Note that this section includes forward-looking statements and future expectations as of the date of this Form 10-K. This discussion of Risk Factors should be read in conjunction with “Management’s Discussion and Analysis of Financial Condition and Results of Operations” and the consolidated financial statements and related notes in Part II of this Form 10-K.
Our business performance might not be sufficient for us to meet the full-year financial guidance that we provide publicly.
We provide full-year financial guidance to the public based upon our assumptions regarding our expected financial performance. For example, we provide assumptions regarding our ability to grow revenue, our expenses and tax rates, and our ability to achieve our profitability targets. While we believe that our annual financial guidance provides investors and analysts
13
with insight to our view of the company’s future performance, such financial guidance is based on assumptions that may not always prove to be accurate and may vary from actual results. If we fail to meet the full-year financial guidance that we provide, or if we find it necessary to revise such guidance during the year, the market value of our common shares could be adversely affected.
We operate in competitive markets, which may adversely affect our financial results.
While we do not believe that we have a direct competitor across all of the industries we serve, we face competition across all markets for our products and services, including by larger or smaller competitors that may be able to adopt new or emerging technologies to address customer requirements more quickly than we can. We may also face competition from incumbent companies with strong market share in specific markets or organizations and businesses that have not traditionally competed with us but that could adapt their products and services or utilize significant financial and information-gathering resources, recognized brands, or technological expertise to begin competing with us. We believe that competitors are continuously enhancing their products and services, developing new products and services, investing in technology, and consolidating or acquiring new businesses to better serve the needs of their existing customers and to attract new customers. Increased competition could require us to make additional capital investments. The impact of cost-cutting pressures across the industries we serve could lower demand for our products and services, as customers intensify their focus on containing or reducing costs. Our competitors may choose to sell products and services competitive with ours at lower prices or bundled with other offerings, which may require us to reduce the prices of our offerings or offer additional products or services to compete. An increase in our capital investments, price reductions for our offerings or reduced spending by our customers could negatively impact our revenues, margins and results of operations.
We may be unsuccessful in achieving our growth and profitability objectives.
We seek to achieve our growth objectives by enhancing our offerings to meet the needs of our customers through organic development, including by delivering integrated workflow platforms, cross-selling our products across our existing customer base and acquiring new customers, entering into strategic partnerships, acquisitions, and by implementing operational efficiency initiatives. If we are unable to successfully execute on our strategies to achieve our growth objectives or drive operational efficiencies, or if we experience higher than expected operating costs that cannot be adjusted accordingly, our growth and profitability rates could be adversely affected. An additional factor that may adversely affect our growth rates is global economic uncertainty, particularly in our energy and financial end markets. Our resources and financial markets segments in particular may be adversely affected by industry dynamics, including decisions on the part of our customers to defer capital spending in uncertain economic environments.
If we are unable to develop successful new products and services or adapt to rapidly changing technology, our business could suffer serious harm.
The information services industry is characterized by rapidly changing technology, evolving industry standards and changing regulatory requirements. Our growth and success depend upon our ability to enhance our existing products and services and to develop and introduce new products and services to keep pace with such changes and developments and to meet changing and increasingly sophisticated customer needs. The process of developing our products and services is complex and may become increasingly complex and expensive in the future due to the introduction of new platforms, operating systems, technologies and customer expectations. Current areas of significant technological change include artificial intelligence, mobility, cloud-based computing, blockchain, speed of availability of data, and the storing, processing, and analysis of large amounts of data. We may find it difficult or costly to update our services and software and to develop new products and services quickly enough to work effectively with new or changed technologies and regulations, to keep the pace with evolving industry standards or to meet our customers’ needs. If we are unable to develop new products or services, or to successfully enhance or update existing products and services, we may not be able to grow our business as quickly as we anticipate.
Fraudulent or unpermitted data access or other cyber-security or privacy breaches may negatively impact our business and harm our reputation.
Many of our products and services involve the storage and transmission of proprietary information and sensitive or confidential data. Similar to other global multinational companies that provide services online, we experience cyber-threats, cyber-attacks and security breaches of varying degrees of severity on our information technology systems, which can include unauthorized attempts to access, disable, improperly modify or degrade our information, systems and networks, the introduction of computer viruses and other malicious codes and fraudulent “phishing” e-mails that seek to misappropriate data and information or install malware onto users’ computers. For example, in 2018, unauthorized actors obtained access to
14
certain employee email accounts by sending phishing messages, a breach that we determined was not material to our business or operations. Cyber-threats in particular vary in technique and sources, are persistent, frequently change, and increasingly are more sophisticated, targeted, and difficult to detect and prevent against. Other recent, highly publicized data security breaches and cyber-attacks of other companies have further heightened awareness of this issue and may embolden individuals or groups to target our systems.
While we have dedicated resources at our company who are responsible for maintaining appropriate levels of cyber-security and training our business teams on cyber-security, and while we utilize third party technology products and services to help identify, protect, and remediate our information technology systems and infrastructure against security breaches and cyber-incidents, our responsive and precautionary measures may not be adequate or effective to prevent, identify, or mitigate attacks by hackers, foreign governments, or other actors or breaches caused by employee error, malfeasance, or other disruptions. We are also dependent on security measures that some of our third-party suppliers and customers are taking to protect their own systems and infrastructures. For example, our outsourcing of certain functions requires us to sometimes grant network access to third-party suppliers. If our third-party suppliers do not maintain adequate security measures, do not require their sub-contractors to maintain adequate security measures, do not perform as anticipated and in accordance with contractual requirements, or become targets of cyber-attacks, we may experience operational difficulties and increased costs. In addition, if a customer experiences a data security breach that results in the misappropriation of some of our proprietary business information, our reputation could be harmed, even if we were not responsible for the breach. While we maintain what we believe is sufficient insurance coverage that may (subject to certain policy terms and conditions, including deductibles) cover certain aspects of third-party security and cyber-risks and business interruption, our insurance coverage may not always cover all costs or losses.
We collect, store, use, and transmit our employees’, customers’, and suppliers’ data on our networks, including information from public and private sources, intellectual property, proprietary business information, personally identifiable information, and information that may be confidential, sensitive, or material and nonpublic. We rely on a system of physical and technological security measures, internal processes and controls, contractual precautions and business continuity plans, and policies, procedures, and training to protect the confidentiality of such data. It is not always possible to prevent misconduct or misuse of such information or data by employees or third parties. The precautions we take to detect and prevent such activity, including trading and contractual obligations, may not be effective in all cases.
Any fraudulent, malicious, or accidental breach of data security controls could also result in unintentional disclosure of, or unauthorized access to, or misappropriation or misuse of, customer, vendor, employee, or other confidential or sensitive data or information, which could potentially result in additional costs to our company to enhance security or to respond to occurrences, lost sales, violations of regulations or laws relating to the privacy of personal or payment card information, penalties, or litigation. Similarly, if any confidential or embargoed data is inadvertently disclosed or deliberately misused prior to our authorization, customers and financial markets could be negatively affected, and any resulting need to change our procedures for handling and sharing this data may diminish the value of such offerings. In addition, media or other reports of perceived security vulnerabilities to our systems or those of our third-party suppliers, even if no breach has been attempted or occurred, could also adversely impact our reputation and materially impact our business.
Misappropriation, misuse, improper modification, or disclosure, destruction, corruption, or unavailability of data and information or ransom demands due to cyber-attacks or other security breaches could damage our brand and reputation, and customers and data suppliers could lose confidence in our processes, security measures, and reliability, which would harm our ability to retain customers and data suppliers and gain new ones. We could also face litigation or other claims from impacted individuals as well as substantial regulatory sanctions or fines. We may be required to incur significant costs to minimize or alleviate the effects of cyber-attacks or other security vulnerabilities and to protect against damage caused by disruptions, security breaches, or cyber-attacks of the nature we have already incurred, in the future. If any of these were to occur, it could have a material adverse effect on our business and results of operations.
We could experience system failures or capacity constraints that could negatively impact our business.
Our ability to provide reliable service largely depends on the efficient and uninterrupted operation of complex systems, relying on people, processes, and technology to function effectively. Most of our products and services are delivered electronically, and our customers rely on our ability to process and deliver substantial quantities of information and other services on computer-based networks. Some elements of these systems have been outsourced to third-party providers, including critical data inputs received from third-party suppliers. Some of our systems have been consolidated for the purpose of enhancing scalability and efficiency, which increases our dependency on a smaller number of systems. Any failure of, or significant interruption, delay or disruption to, or security breaches affecting, our systems could result in: disruption to our
15
operations; significant expense to repair, replace or remediate systems, equipment or facilities; a loss of customers; legal or regulatory claims, proceedings or fines; damage to our reputation; and harm to our business.
System interruption, failures or security breaches could result from a wide variety of causes, including: human error, natural disasters (such as hurricanes and floods), infrastructure or network failures (including failures at third-party data centers, by third party cloud-computing providers, or of aging technology assets), disruptions to the internet, malicious attacks or cyber incidents such as unauthorized access, ransomware, loss or destruction of data (including confidential and/or personal customer information), account takeovers, computer viruses or other malicious code, and the loss or failure of systems over which we have no control. In addition, significant growth of our customer base or increases in the number of products or services or in the speed at which we are required to provide products and services may also strain our systems in the future. We may also face significant increases in our use of power and data storage and may experience a shortage of capacity and increased costs associated with such usage. We may also face additional strain on our systems and networks due to aging or end-of-life technology that we have not yet updated or replaced. While we generally have disaster recovery and business continuity plans that utilize industry standards and best practices for much of our business, including back-up facilities for our primary data centers, a testing program and staff training, our systems are not always fully redundant and our disaster recovery and business continuity plans may not always be sufficient or effective. In the past when we have experienced slow operation of our systems or service interruptions, some of our products or services have been unavailable for a limited period of time, but none of these occurrences have been material to our business. However, any of the above factors could individually or in the aggregate adversely affect our business, and our insurance may not be adequate to compensate us for all failures, interruptions, delays, disruptions or security breaches.
Design defects, errors, failures or delays associated with our products or services could negatively impact our business.
Despite testing, software, products and services that we develop, license or distribute may contain errors or defects when first released or when major new updates or enhancements are released that cause the software, product or service to operate incorrectly or less effectively. Many of our products and services also rely on data and services provided by third-party providers over which we have no control and may be provided to us with defects, errors or failures. We may also experience delays while developing and introducing new products and services for various reasons, such as difficulties in licensing data inputs or adapting to particular operating environments. Defects, errors or delays in our products or services that are significant, or are perceived to be significant, could result in rejection or delay in market acceptance, damage to our reputation, loss of revenue, a lower rate of license renewals or upgrades, diversion of development resources, product liability claims or regulatory actions, or increases in service and support costs. We may also need to expend significant capital resources to eliminate or work around defects, errors, failures or delays. In each of these ways, our business, financial condition or results of operations could be materially adversely impacted.
We depend on externally obtained content and services to support our offerings, and the inability to continue to obtain access could prove harmful to our business.
We obtain data from a wide variety of external sources that we transform into critical information and analytics and use to create integrated product and service offerings for our customers. Many of our offerings include content and information that is purchased or licensed from third parties, including from public record sources or parties that are our customers or our competitors, or obtained using independent contractors. In addition, we often rely on third-party dealers to sell or distribute some of our offerings, such as in locations where we do not maintain a sales office or sales teams or for methods of distribution to which we do not have direct access. For instance, our industry standards offerings that are part of our Product Design workflow rely on information licensed from standards developing organizations, and many of our financial institution customers provide us with data which is a critical input for many of our Financial Services offerings. We believe that the content licensed from many of these third parties might not be able to be obtained from alternate sources on favorable terms, if at all.
Our license agreements with these third parties are often nonexclusive and many are terminable on less than one year’s notice. In addition, many of these third parties compete with one another and with us, including by providing data to our competitors or becoming competitors themselves, which may cause them to reduce their willingness to supply, or increase the price of, data and content that are important to our products and services. Our competitors could also enter into exclusive contracts with our data sources, which may preclude us from receiving certain data from these suppliers or restricted in our use of such data. We could also become subject to legislative, regulatory, judicial or contractual restrictions on the use of data, such as if such data is not collected by the third parties in a way which allows us to process the data or use it legally. We are also limited in our ability to monitor and direct the activities of our independent contractors, but if any actions or business practices of these individuals or entities violate our policies or procedures or are otherwise deemed inappropriate or illegal, we could lose access to the data they collect, as well as be subject to litigation, regulatory sanctions, or reputational damage.
16
If we lose access to, or are restricted in receiving, a significant number of data sources and cannot replace the data through alternative sources or we are unable to obtain information licensed to us consistently, in a timely manner, or on terms commercially reasonable to us, specific products, services and customer solutions may be impacted or disrupted and our business, reputation, financial condition, operating results and cash flow could be materially adversely affected.
Our relationships with third-party service providers may not be successful or may change, which could adversely affect our results of operations.
We have commercial relationships with third-party service providers whose capabilities complement our own, for integral services, software and technologies. Many of our products and services are developed using third-party service providers’ data or services, or are made available to our customers or are integrated for our customers’ use through integral infrastructure, information and technology solutions provided by such third-party service providers. For example, we outsource certain functions involving our data transformation process and data hosting functions to business partners who we believe offer us deep expertise in these areas, as well as scalability and cost effective services. In some cases, these providers are also our competitors or may in the future become our competitors as we expand our product and service offerings, which could impact our relationships.
The priorities and objectives of these providers may differ from ours, which may make us vulnerable to changes or terminations of our commercial relationships and could reduce our access over time to information and technology. We have little control over these third-party providers, which increases our vulnerability to errors, failures, interruptions or disruptions or problems with their services or technologies. We also face risks that one or more service providers may perform work that deviates from our standards or that we may not be able to adequately protect our intellectual property. Any errors, failures to perform, interruptions, delays or terminations of service experienced in connection with these third-party providers, or if we do not obtain the expected benefits from our relationships with third-party service providers, we may be less competitive, our products and services may be negatively affected, and our results of operations could be adversely impacted.
Some of the critical information we use in our offerings is publicly available in raw form at little or no cost.
The internet, widespread availability of sophisticated search engines, pervasive wireless data delivery, and public sources of free or relatively inexpensive information and solutions have simplified the process of locating, gathering, and disseminating data, potentially diminishing the perceived value of our offerings. While we believe our offerings are distinguished by such factors as currency, accuracy and completeness, and our analysis and other added value, our customers could choose to obtain the information and solutions they need from public, regulatory, governmental or other sources. To the extent that customers become more self-sufficient, demand for our offerings may be reduced, and our business, financial condition, and results of operations could be adversely affected.
The loss of, or the inability to attract and retain, key personnel could impair our future success.
Our future success depends to a large extent on the continued service of our highly skilled, educated and trained employees, including our experts in research and analysis, information technology, the industries in which we operate, and colleagues in sales, marketing, product development, operations, technology and management, including our executive officers. We do not carry any “key person” insurance policies that could offset potential loss of service under applicable circumstances. We must maintain our ability to attract, motivate, compensate and retain highly qualified colleagues in order to support our customers and achieve business results. The loss of the services of key personnel and any inability to recruit effective replacements or to otherwise attract, motivate, or retain highly qualified personnel could have a material adverse effect on our business, financial condition, and operating results.
We may not be able to protect our intellectual property rights and confidential information.
Our success depends in part on our proprietary technology, processes, methodologies and information. We rely on a combination of copyright, trademark, trade secret, patent and other intellectual property laws and nondisclosure, license, assignment and confidentiality arrangements to establish, maintain and protect our proprietary rights as well as the intellectual property rights of third parties whose assets we license. However, we cannot assure that the steps we have taken to protect our intellectual property rights, and the rights of those from whom we license intellectual property, are adequate to prevent unauthorized use, misappropriation, or theft of our intellectual property. Intellectual property laws in various jurisdictions in which we operate are also subject to change at any time and could further restrict our ability to protect our intellectual property and proprietary rights. In particular, a portion of our revenues are derived from jurisdictions where adequately protecting intellectual property rights may prove more challenging or impossible. We may also not be able to detect unauthorized uses or take timely and effective steps to remedy unauthorized conduct. To prevent or respond to unauthorized
17
uses of our intellectual property, we might be required to engage in costly and time-consuming litigation or other proceedings and we may not ultimately prevail. Any failure to establish, maintain or protect our intellectual property or proprietary rights could have a material adverse effect on our business, financial condition or results of operations.
We may be exposed to litigation related to products we make available to customers and we may face legal liability or damage to our reputation.
Companies in our industry have increasingly pursued patent and other intellectual property protection for their data, technologies and business methods. As we do not actively monitor third-party intellectual property, if any of our data, technologies or business methods are covered or become covered by third-party intellectual property protection and used without license or if we misuse data, technologies or business methods outside the terms of our licenses, we may be subject to claims or threats of infringement, misappropriation or other violation of intellectual property rights, or have the use of our data, technologies and business methods otherwise challenged. We have also in the past been, and may in the future be, called upon to defend partners, customers, suppliers or distributors against such third-party claims under indemnification clauses in our agreements.
Responding to such claims or threats, regardless of merit, can consume valuable time and resources, result in costly or unfavorable litigation or settlements that could exceed the limits of applicable insurance coverage, delay operations of our business, require redesign of our products and services, or require new royalty and licensing agreements. It could also damage our reputation for any reason which could adversely affect our ability to attract and retain customers, employees, and information suppliers. Any such factors could have a material adverse effect on our financial condition or results of operations.
We are subject to litigation and investigation risks which could adversely affect our business, results of operations, and financial condition.
We are from time to time involved in various litigation matters and claims, including regulatory proceedings, administrative proceedings, lawsuits, governmental investigations, and contract disputes, as they relate to our products, services, and business. We may face potential commercial or intellectual property claims or liability for, among other things, breach of contract, defamation, libel, fraud, or negligence, with respect to the use of our offerings by our customers, particularly if the information in our offerings was incorrect for any reason, or if it were misused or used inappropriately. We may also face employment-related litigation and investigations, including claims of age discrimination, sexual harassment, gender discrimination, racial discrimination, immigration violations, or other local, state, and federal labor, environmental, health, and safety violations. In addition, we may receive routine requests for information from governmental agencies in connection with their regulatory or investigatory authority. Because of the uncertain nature of litigation, investigations, and insurance coverage decisions, we cannot predict the outcome of these matters, which could have a material adverse effect on our business, results of operations, and financial condition. Litigation and investigations are very costly, and the costs associated with prosecuting and defending litigation and investigation matters could have a material adverse effect on our business, results of operations, and financial condition. In light of the potential cost and uncertainty involved in litigation and investigations, we may settle matters even when we believe we have a meritorious defense. We are unable to estimate precisely the ultimate dollar amount of exposure to loss or the amounts we actually pay in connection with litigation and investigation matters, due to inherent uncertainties and the inherent shortcomings of the estimation process, the uncertainties involved in litigation, and other factors.
Our use of open source software could result in litigation or impose unanticipated restrictions on our ability to commercialize our products and services.
We use open source software in our technology, most often as small components within a larger product or service. Open source code is also contained in some third-party software we rely on. The terms of many open source licenses are ambiguous and have not been interpreted by U.S. or other courts, and these licenses could be construed in a manner that imposes unanticipated conditions or restrictions on our ability to commercialize our products and services, license the software on unfavorable terms, require us to re-engineer our products and services or take other remedial actions, any of which could have a material adverse effect on our business. We could also be subject to suits by parties claiming breach of the terms of licenses, which could be costly for us to defend.
Our brand and reputation are key assets and competitive advantages of our company and our business may be affected by how we are perceived in the marketplace.
The integrity and external perceptions of our brand and reputation are key to our ability to remain a trusted source of products and services and to attract and retain customers. Reputational damage from negative perceptions or publicity, or
18
actual, alleged, or perceived issues regarding any of our products or services, could damage our reputation and relationships with customers, prospects, and the public generally. Although we monitor developments, including social media, for areas of potential risk to our brand and reputation, negative perceptions or publicity may adversely impact our credibility as a trusted source for critical information, analytics, and insight and may have a negative impact on our business.
We enter into redistribution arrangements that allow other firms to represent certain of our products and services as partners or agents. It is difficult to monitor whether the representation of our products and services by such partners or agents is accurate. Poor representation of our products and services by our partners or agents could have an adverse effect on our brand, reputation, and our business.
Cost-cutting pressures and consolidation in our customer markets could lower demand for our products and services.
Our customers are focused on controlling or reducing spending as a result of the continued financial challenges and market uncertainty many of them face. Customers within the financial services, shipping and energy industries in particular strive to reduce their operating costs, and may use strategies that result in a reduction in their spending on our products and service, such as by consolidating their spending with fewer or lower cost vendors or by internally developing products, services and functionality. In addition, mergers or consolidations among our customers could reduce the number of our customers and potential customers, which could cause them to discontinue or reduce their use of our products and services. All such developments could materially and adversely affect our business, financial condition, operating results and cash flow.
Declining activity levels in our core end markets, or weak or declining financial performance of companies in our end markets, could lower demand for certain of our products and services.
Many of our products and services are dependent upon the robustness of the core end markets in which we operate, as well as the financial health of the participants in those markets and the general economy. In addition, a proportion of our revenue in our Financial Services segment is variable and depends upon transaction volumes, investment levels (i.e., assets under management), or the number of positions we value. Unfavorable or uncertain economic conditions or lower activity levels in the end markets in which we operate could result in cancellations, reductions, or delays for our products and services or in lower revenues, and could have a material adverse effect on our financial condition or results of operations.
Some of our products and services typically face long selling cycles to secure new contracts, which require significant resource commitments and result in long lead times before we receive revenue.
For certain new products and services, and especially for complex products and services, we often face long selling cycles to secure new contracts and customers and there can be a long preparation period before we commence providing products and services. For instance, some of our Financial Services products and services can require active engagement with potential customers and can take 12 months or more to reach deal closure. Some products’ success is also dependent on building a network of users, and may not be profitable while such a network is developing. We can incur significant business development expenses during the selling cycle and we may not succeed in winning a new customer’s business, in which case we receive no revenue and may receive no reimbursement for such expenses. Selling cycle periods have historically lengthened and could lengthen further, causing us to incur even higher business development expenses with no guarantee of winning a new customer’s business. Even if we succeed in developing a relationship with a potential new customer, we may not be successful in obtaining contractual commitments after the selling cycle or in maintaining contractual commitments after the implementation cycle, and our business, financial condition, and results of operations could be adversely affected.
If we are unable to consistently renew and enter into new subscriptions for our offerings, our results could weaken.
The majority of our revenue is recurring, typically based on subscription agreement to our offerings. In 2018, approximately 84 percent of our revenues were recurring fixed and recurring variable revenues. Our operating results depend on our ability to achieve and sustain high renewal rates on our existing subscription base and to enter into new subscription arrangements at acceptable prices and other commercially acceptable terms. Failure to meet one or more of these subscription objectives could have a material adverse effect on our business, financial condition, and operating results.
Changes in the legislative, regulatory, and commercial environments in which we operate may adversely impact our ability to collect, compile, use, transfer, publish, or sell data, subject us to increased regulation or decreased demand of our products and services, or prevent us from offering certain products or services, which could adversely affect our financial condition and operating results.
19
Certain types of information we collect, compile, store, use, transfer, publish and/or sell, and certain of our products and services, are subject to regulation by governmental authorities in various jurisdictions in which we operate.
There is an increasing public concern regarding privacy, data, and consumer protection issues, and the number of jurisdictions with data protection laws has been increasing. Certain types of information we collect, compile, use, and publish, including offerings in our Automotive businesses, are subject to laws and regulations by governmental authorities in jurisdictions in which we operate. These laws and regulations pertain primarily to “personally identifiable information” and “personal data” (i.e., information relating to an identified or identifiable individual), constrain whether and how we collect that data, how that data may be used and stored, and whether, to whom, and where that data may be transferred, as well as notification and other requirements that must be followed in the event data is accessed by unauthorized persons. To conduct our operations, we regularly move data across national borders, and consequently are subject to a variety of continuously evolving and developing laws and regulations regarding privacy, data protection, and data security. Many jurisdictions have passed laws in this area, such as the European Union General Data Protection Regulation (the “GDPR”) and the cyber-security law adopted by China in June 2017, and other jurisdictions are considering imposing additional restrictions. These laws and regulations are increasing in complexity and number, change frequently and increasingly conflict among the various countries in which we operate, which has resulted in greater compliance risk and cost for us. It is possible that we could be prohibited or constrained from collecting or disseminating certain types of data or from providing certain products or services. If we fail to comply with these laws or regulations, we could be subject to significant litigation, civil or criminal penalties, monetary damages, regulatory enforcement actions or fines in one or more jurisdictions. For example, a failure to comply with the GDPR could result in fines up to the greater of €20 million or 4% of annual global revenues.
In addition, many of our customers rely on many of our products and services to meet their operational, regulatory, or compliance needs. Our financial industry customers, for example, operate within a highly regulated environment and must comply with governmental and quasi-governmental legislation, regulations, directives, and standards. Complex and ever-evolving legislative and regulatory changes around the world that impact our customers’ industries may impact how we provide products and services to our customers and may affect the structure and regulation of, and possibly the demand for, certain products and services we offer, such as indices, benchmark administration, intermediating and clearing services, and offerings in which we function as a “third-party service provider.”
It is very difficult to predict the future impact of the broad and expanding laws, rules, regulations or standards affecting our business, our products and services, and our customers. There can be no assurance that changes in laws, rules or regulations will not have a material adverse effect on our business, financial condition or results of operations. If we fail to comply with any applicable laws, rules, regulations, or standards, or fail to obtain regulatory approval to conduct certain operations or provide certain products or services, we could be subject to fines or other penalties. Additionally, we may be required to comply with multiple and potentially conflicting laws, rules, or regulations in various jurisdictions, or investigate, defend, or remedy actual or alleged violations, which could, individually or in the aggregate, result in materially higher compliance costs to us. New legislation, or a significant change in laws, rules, regulations, or standards could also result in some of our products and services becoming obsolete or prohibited, reduce demand for our products and services, increase expenses as we modify our products and services to comply with new requirements and retain relevancy, impose limitations on our operations, and increase compliance or litigation expense, each of which could have a material adverse effect on our business, financial condition and results of operations.
Our operations are subject to risks relating to worldwide operations, and our compliance and risk management methods might not be effective and may result in outcomes that could adversely affect our reputation, financial condition, and operating results.
Operating in many jurisdictions around the world, we may be affected by numerous, and sometimes conflicting, legal and regulatory regimes, including: changes in tax rates and tax laws or their interpretation, including changes related to tax holidays or tax incentives; trade protection laws, policies and measures, and other regulatory requirements affecting trade and investment, including export controls and economic sanctions laws; unexpected changes in regulatory requirements; political conditions and events, including embargoes; different liability standards and legal systems that may be less developed and less predictable than those in the United States and the United Kingdom, restrictive actions by the United States, the United Kingdom, the European Union, and foreign governments that could limit our ability to provide services in specific countries; and potential noncompliance with a wide variety of laws and regulations. We must also manage social, political, labor, or economic conditions in a specific country or region; difficulties in staffing and managing local operations; difficulties with local or grassroots activism; difficulties in penetrating new markets because of established and entrenched competitors; uncertainties of obtaining data and creating products and services that are relevant to particular geographic markets; lack of recognition of our brands, products, or services; unavailability of local joint venture partners; restrictions or limitations on outsourcing contracts or services abroad; differing levels of data privacy and intellectual property protection in various
20
jurisdictions; potential adverse tax consequences on the repatriation of funds and from taxation reform affecting multinational companies; and exposure to adverse government action in countries where we may conduct reporting activities. Because of the varying degrees of development of the legal systems of the countries in which we operate, local laws might be insufficient to protect our rights. Compliance with diverse legal and regulatory requirements is costly and time-consuming, and requires significant resources. Violations could result in significant fines or monetary damages, criminal sanctions, prohibitions, suspensions, or restrictions on doing business and damage to our reputation.
As we operate our business around the world, we must manage the potential conflicts between locally accepted business practices in any given jurisdiction and our obligations to comply with laws and regulations, including anti-corruption laws or regulations applicable to us, such as the U.S. Foreign Corrupt Practices Act (the “FCPA”) and the UK Bribery Act 2010 (the “UKBA”). The U.S., U.K., and other foreign agencies and authorities have a broad range of civil and criminal penalties they may seek to impose against companies for violations of export controls, the FCPA, the UKBA, and other laws, rules, sanctions, embargoes, and regulations, including those established by the Office of Foreign Assets Control (“OFAC”). For example, the United States, the European Union, and other countries have imposed significant sanctions measures against Russia targeting the energy, defense, and financial sectors of Russia’s economy, as well as specific Russian officials and businesses that they own. Although we believe all our business activities are permissible under all current applicable laws, rules, sanctions, embargoes and regulations, we may be required to discontinue or limit our business activities in the future. Further, the implementation of new legislation or regulations, or changes in or unfavorable interpretations of existing regulations by courts or regulatory bodies, could require us to incur significant compliance costs and impede our ability to operate, expand, and enhance our products and services as necessary to remain competitive and grow our business.
Our ability to comply with applicable complex and changing laws and rules, including anti-corruption laws, is largely dependent on our establishment and maintenance of compliance, surveillance, audit and reporting systems, as well as our ability to attract and retain qualified compliance and other risk management personnel. We have developed and instituted a corporate compliance program intended to promote and facilitate compliance with all applicable laws which includes, among other things, employee training and the creation of appropriate policies and procedures defining employee behavior that mandate adherence to laws. We also have policies, procedures, and controls designed to comply with all applicable laws, rules, sanctions, embargoes, and regulations. However, we cannot assure you that these measures will always be effective, and we may fail to appropriately monitor or evaluate the risks to which we are or may be exposed or identify business activities that violate laws, rules, sanctions, embargoes, and regulations. We may also not always be successful in detecting if our employees, contractors, agents, and suppliers, including those independent companies to which we outsource certain business operations, are engaging in misconduct, fraud, or other errors, or otherwise taking actions in violation of our policies, procedures, and controls. In addition, some of our risk management methods depend upon evaluation of information regarding markets, customers, or other matters that are publicly available or otherwise accessible by us. That information may not in all cases be accurate, complete, up-to-date, or properly evaluated. In case of non-compliance or alleged non-compliance with applicable laws or regulations by us or our employees, contractors, agents, or suppliers, we could be subject to investigations and proceedings that may be very expensive to defend and may result in criminal enforcement actions, penalties for non-compliance, or civil actions or lawsuits, including by customers, for damages which can be significant.
Any of these outcomes could adversely affect our business, reputation, financial condition, and operating results.
The U.K. electorate voted in favor of a U.K. exit from the E.U. in a referendum, which could adversely impact our business, results of operations and financial condition.
The U.K. Government held an in-or-out referendum on the United Kingdom’s membership of the European Union in June 2016, which resulted in the electorate voting in favor of a U.K. exit from the European Union (“Brexit”). A process of negotiation is now taking place to determine the future terms of the United Kingdom’s relationship with the European Union, with the United Kingdom due to exit the European Union on March 29, 2019. We are headquartered and tax domiciled in the United Kingdom and conduct business in Europe primarily through our U.K. subsidiaries. Depending on the final terms of Brexit, we could face new regulatory costs and challenges. For instance, the United Kingdom could lose access to the single E.U. market and to the global trade deals negotiated by the European Union on behalf of its members, and we may be required to move certain operations to other European Union member states to maintain such access. A decline in trade could affect the attractiveness of the United Kingdom as a global investment center and, as a result, could have a detrimental impact on U.K. growth. Although we have an international customer base, we could be adversely affected by reduced growth and greater volatility in the Pound Sterling and the U.K. economy. Changes to U.K. immigration policy could likewise occur as a result of Brexit. Although the United Kingdom would likely retain its diverse pool of talent, London’s role as a global financial center may decline, particularly if financial institutions shift their operations to the European Union and the E.U. financial services passport is not maintained. Any adjustments we make to our business and operations as of Brexit could
21
result in significant time and expense to complete. Any of the foregoing factors could have a material adverse effect on our business, results of operations or financial condition.
Our international operations are subject to exchange rate fluctuations.
We operate in many countries around the world and a significant part of our revenue comes from international sales. In 2018, we generated approximately 40 percent of our revenues from sales outside the United States. Approximately 20 percent of our revenue was transacted in currencies other than the U.S. dollar in 2018. We earn revenues, pay expenses, own assets, and incur liabilities in countries using currencies other than the U.S. dollar, including, but not limited to, the British Pound, the Euro, the Canadian Dollar, the Singapore Dollar, and the Indian Rupee. As we continue to leverage our global delivery model, more of our expenses will likely be incurred in currencies other than those in which we bill for the related products and services. An increase in the value of certain currencies against the U.S. dollar could increase costs for delivery of services at offshore sites by increasing labor and other costs that are denominated in local currency. Because our consolidated financial statements are presented in U.S. dollars, we must translate revenues, income, expenses, and the value of assets and liabilities into U.S. dollars at exchange rates in effect during or at the end of each reporting period. We may use derivative financial instruments to reduce our net exposure to currency exchange rate fluctuations. Nevertheless, increases or decreases in the value of the U.S. dollar against other major currencies can materially affect our net operating revenues, operating income, and the value of balance sheet items denominated in other currencies.
International hostilities, terrorist or cyber-terrorist activities, natural disasters, pandemics, and infrastructure disruptions could prevent us from effectively serving our customers and thus adversely affect our results of operations.
Acts of terrorist violence, cyber-terrorism, political unrest, war, civil disturbance, armed regional and international hostilities and international responses to these hostilities, natural disasters, including hurricanes or floods, global health risks or pandemics or the threat of or perceived potential for these events could have a negative impact on us. These events could adversely affect our customers’ levels of business activity and precipitate sudden significant changes in regional and global economic conditions and cycles. These events also pose significant risks to our employees and our physical facilities and operations around the world, whether the facilities are ours or those of our third-party service providers or customers. By disrupting communications and travel and increasing the difficulty of obtaining and retaining highly skilled and qualified personnel, these events could make it difficult or impossible for us to deliver products and services to our customers. Extended disruptions of electricity, other public utilities or network services at our facilities, as well as system failures at our facilities or otherwise, could also adversely affect our ability to serve our customers. We may be unable to protect our employees, facilities and systems against all such occurrences. We generally do not have insurance for losses and interruptions caused by terrorist attacks, conflicts and wars. If these disruptions prevent us from effectively serving our customers, our results of operations could be adversely affected.
Acquisitions, joint ventures, partnerships, alliances, or similar strategic relationships, or dispositions of any of our businesses, and the related integration or separation risks may disrupt or otherwise have a material adverse effect on our business and financial results.
As part of our business strategy, we pursue selective acquisitions of complementary businesses, products or technologies, or joint ventures, partnerships, alliances, or similar strategic transactions and relationships with third parties, to support our business, such as the Merger of IHS and Markit in June 2016 and the acquisition of Ipreo, a leading financial services solutions and data provider, in August 2018. We may also undertake dispositions of certain of our businesses or products. We seek to be disciplined in a highly competitive market, and there can be no assurance that we will be able to identify suitable candidates on favorable terms to successfully complete acquisitions, joint ventures, partnerships, alliances, or strategic relationships, or dispositions of businesses. In addition, we typically fund our acquisitions through our credit facilities. Although we have capacity under our credit facilities, those may not be sufficient. Therefore, future acquisitions or strategic relationships may require us to obtain additional financing through debt or equity, which may not be available on favorable terms or at all and could result in dilution.
If such acquisitions or other strategic transactions are completed, the anticipated growth and other strategic objectives of such transactions may not be fully realized, and a variety of factors may adversely affect any anticipated benefits from such transactions. The success of such transactions depends on, among other things, our ability to combine the various businesses in a manner that realizes anticipated synergies and exceeds the projected stand-alone cost savings and revenue growth trends we have identified, which is a complex, costly, and time-consuming process. We expect to benefit from cost synergies driven by a number of strategies, such as integrating corporate functions, reducing technology spending by optimizing IT infrastructure, using centers of excellence in cost-competitive locations, and optimizing real estate and other costs, as well as greater tax efficiencies from global management and global cash movement. We may also enjoy revenue synergies, including
22
product and service cross-selling, a more diversified and expanded product offering, and balance across geographic regions.
We cannot assure you that we will be successful in integrating acquired businesses or other strategic transactions, or that they will perform at the levels we anticipate or achieve the cost or revenue synergies expected. The completion of such transactions may have material unanticipated difficulties, expenses, liabilities, competitive responses, and diversion of management focus and attention, such as:
• | difficulties or delays in integrating or remediating operations, systems, and technology and maintaining institutional knowledge and procedures; |
• | challenges in conforming standards, controls, procedures, accounting and other policies, business cultures, and compensation structures; |
• | difficulties in attracting and retaining key personnel; |
• | challenges in keeping existing, and developing new, customers and business relationships; |
• | difficulties or delays in achieving anticipated cost savings, synergies, business opportunities, and growth prospects from the transaction; |
• | difficulties in managing the expanded operations of the company; |
• | unanticipated transaction and integration expenses; |
• | disruption of operations; |
• | unexpected regulatory and operating difficulties and expenditures; |
• | contingent liabilities (including contingent tax liabilities) that are larger than expected; and |
• | potential unknown risks and liabilities, adverse consequences and unforeseen increased expenses, including possible adverse tax consequences pursuant to changes in applicable tax laws, regulations, or other administrative guidance. |
Many of these factors are outside of our control, and any one of them could result in increased costs, decreased expected revenues, and diversion of management time and energy. The anticipated benefits from an acquisition or other strategic transaction may take longer to realize than expected or may not be realized fully. We may also have difficulty integrating and operating businesses in countries and geographies where we do not currently have a significant presence, and acquisitions of businesses having a significant presence outside of the United States or the United Kingdom will increase our exposure to risks of conducting operations in international markets. Similarly, any divestitures will be accompanied by risks commonly encountered in the sale of businesses. As a result, the failure of acquisitions, dispositions, and other strategic transactions to perform as expected could have a material adverse effect on our business, financial condition, or results of operations. Future acquisitions or dispositions could also result in the incurrence of debt, contingent liabilities or amortization expenses, or write-offs of goodwill and other intangible assets, any of which could harm our financial condition.
We may be subject to antitrust litigation or government investigation in the future, which may result in an award of money damages or force us to change the way we do business.
In the past, certain of our business practices have been investigated by government antitrust or competition agencies, and we have on multiple occasions been sued by private parties for alleged violations of the antitrust and competition laws of various jurisdictions. Following some of these actions, we have changed certain of our business practices to reduce the likelihood of future litigation. Although each of these material prior legal actions has been resolved, there is a risk based upon the leading position of certain of our business operations or the relationships between our customers in using our products and services that we could, in the future, be the target of investigations by government entities or actions by private parties challenging the legality of our business practices. Depending on the outcome of any future claims or investigations, we may be required to change the way we offer particular products or services, which could result in material disruptions to and costs incurred by our business, and we may be subject to substantial fines, penalties, damages or an injunction or other equitable remedies. Future claims or investigations (regardless of outcome) may also affect how parties interact with us, including the manner or type of data provided to us and the manner or type of data products and services purchased from us. Any antitrust or competition-related claim or investigation could be costly for our company in terms of time and expense incurred defending such claims or investigations. Any of the above impacts, individually or together, could have a material adverse effect on our business, financial condition or results of operations.
Our indebtedness could adversely affect our business, financial condition, and results of operations.
Our indebtedness could have significant consequences on our future operations, including:
• | making it more difficult for us to satisfy our indebtedness obligations and our other ongoing business obligations, which may result in defaults; |
23
• | events of default if we fail to comply with the financial and other covenants contained in the agreements governing our debt instruments, which could result in all of our debt becoming immediately due and payable or require us to negotiate an amendment to financial or other covenants that could cause us to incur additional fees and expenses; |
• | sensitivity to interest rate increases on our variable rate outstanding indebtedness, which could cause our debt service obligations to increase significantly; |
• | reducing the availability of our cash flow to fund working capital, capital expenditures, acquisitions and other general corporate purposes, and limiting our ability to obtain additional financing for these purposes; |
• | limiting our flexibility in planning for, or reacting to, and increasing our vulnerability to, changes in our business, the industries in which we operate, and the overall economy; |
• | placing us at a competitive disadvantage compared to any of our competitors that have less debt or are less leveraged; and |
• | increasing our vulnerability to the impact of adverse economic and industry conditions. |
Our ability to meet our payment and other obligations under our debt instruments depends on our ability to generate significant cash flow in the future. This, to some extent, is subject to general economic, financial, competitive, legislative and regulatory factors as well as other factors that are beyond our control. We cannot be certain that our business will generate cash flow from operations, or that future borrowings will be available to us under our existing or any future credit facilities or otherwise, in an amount sufficient to enable us to meet our indebtedness obligations and to fund other liquidity needs. We may incur substantial additional indebtedness, including secured indebtedness, for many reasons, including to fund acquisitions. If we add additional indebtedness or other liabilities, the related risks that we face could intensify.
A downgrade to our credit ratings would increase our cost of borrowing under our credit facilities and adversely affect our ability to access the capital markets.
We are party to a $2.0 billion senior unsecured revolving agreement that matures in June 2023 and a $1.206 billion term loan facility that matures in July 2021 (collectively, the Senior Credit Facilities). The cost of borrowing under the Senior Credit Facilities and our ability and the terms under which we may access the credit markets are affected by credit ratings assigned to us by the major credit rating agencies. These ratings are premised on our performance under assorted financial metrics and other measures of financial strength, business and financial risk, industry conditions, timeliness of financial reporting, and other factors determined by the credit rating agencies. Our current ratings have served to lower our borrowing costs and facilitate access to a variety of lenders. However, there can be no assurance that our credit ratings or outlook will not be lowered in the future in response to adverse changes in these metrics and factors caused by our operating results or by actions that we take, that reduce our profitability, or that require us to incur additional indebtedness for items such as substantial acquisitions, significant increases in costs and capital spending in security and IT systems, significant costs related to settlements of litigation or regulatory requirements, or by returning excess cash to shareholders through dividends or under our share repurchase program. A downgrade of our credit ratings would increase our cost of borrowing under the Senior Credit Facilities, negatively affect our ability to access the capital markets on advantageous terms, or at all, negatively affect the trading price of our securities, and have a significant negative impact on our business, financial condition, and results of operations.
The price of our common shares may be volatile and may be affected by market conditions beyond our control.
Our share price is likely to fluctuate in the future because of the volatility of the stock market in general and a variety of factors, many of which are beyond our control. Market fluctuations could result in volatility in the price of our common shares, one possible outcome of which could be a decline in the value of your investment. In addition, if our operating results fail to meet the expectations of stock analysts or investors, or if we are perceived by the market to suffer material business or reputational damage, we may experience a significant decline in the trading price of our common shares.
Sales of substantial amounts of our common shares in the public market, or the perception that these sales may occur, could cause the market price of our shares to decline.
Sales of substantial amounts of our common shares in the public market, or the perception that these sales may occur, could depress the market price of our common shares and could impair our ability to raise capital through the sale of additional equity securities. We have entered into a registration rights agreement with certain of our shareholders. These shareholders have the right to demand that we file a registration statement covering the offer and sale of their securities under the Securities Act, for as long as each holds unregistered securities. In addition, many of our largest shareholders are able to sell their common shares in the public market from time to time without registration, subject to limitations on the timing, amount, and method of those sales imposed by securities laws. Sales of common shares by these or any other shareholders, including through the exercise of options and the sale of shares by our employees, could have a material adverse effect on the
24
trading price of our common shares. We cannot predict the effect, if any, that future sales and issuances of shares would have on the market price of our common shares.
There is no assurance that the share repurchase programs approved by our Board of Directors will be fully consummated and any share repurchases under such programs may not result in enhanced value to shareholders and may negatively affect our share price.
Between August 2016 and October 2017, our Board of Directors authorized a share repurchase program of up to $3.25 billion of IHS Markit common shares through November 30, 2019. As of November 30, 2018, the remaining authorization under the share repurchase program was approximately $1.01 billion. Under the share repurchase program, we are authorized to repurchase our common shares on the open market from time to time, in privately negotiated transactions, or through accelerated share repurchase agreements, subject to availability of common shares, price, market conditions, alternative uses of capital, and applicable regulatory requirements, at management’s discretion. The share repurchase program does not, however, obligate us to repurchase any set dollar amount or number of shares and may be modified, suspended, or terminated at any time without prior notice. The share repurchase program carries risks and uncertainties, including, among other things, that the authorized purchases will not be completed within the expected timing or will not be made at the best possible price. In connection with our acquisition of Ipreo, we suspended our share repurchase program until we return to our capital policy target leverage ratio of 2.0-3.0x. Accordingly, there can be no assurance that we will pursue or be successful in completing the execution of the share repurchase program in the time period authorized by our Board of Directors or any future repurchase program. Additionally, the existence of a share repurchase program could cause the market price of our common shares to be higher than it would be in the absence of such a program and could potentially reduce the market liquidity for our shares. As a result, any repurchase program may not ultimately result in enhanced value to our shareholders and may not prove to be the best use of our cash resources.
The U.S. Internal Revenue Service (the “IRS”) may not agree that, after the Merger, IHS Markit should be treated as a foreign corporation for U.S. federal income tax purposes, and/or that we are not subject to certain other adverse U.S. federal income tax laws relating to certain transactions that we may undertake in the future. In addition, future changes to U.S. tax laws could adversely affect us.
Although IHS Markit is incorporated in Bermuda and is and has been treated as tax resident in the United Kingdom, the IRS may assert that IHS Markit should be treated as a U.S. corporation (and, therefore, a U.S. tax resident) for U.S. federal income tax purposes pursuant to Section 7874 of the Code (referred to as “Section 7874”). Section 7874 provides that if, following an acquisition of a U.S. corporation by a non-U.S. corporation, at least 80% of the acquiring non-U.S. corporation’s stock (by vote or value) is considered to be held by former shareholders of the U.S. corporation by reason of holding stock of such U.S. corporation (such percentage referred to as the “ownership percentage” and such test referred to as the “ownership test”) and the “expanded affiliated group” which includes the acquiring non-U.S. corporation does not have substantial business activities in the country in which the acquiring non-U.S. corporation is created or organized, then the non-U.S. corporation would be treated as a U.S. corporation for U.S. federal income tax purposes even though it is a corporation created and organized outside the United States.
Moreover, if the ownership percentage is 60% or more (but less than 80%), the acquired U.S. corporation and its U.S. affiliates could be prohibited from using foreign tax credits or other attributes to offset the income or gain recognized by reason of the transfer of property to a foreign related person or any income received or accrued by reason of a license of any property by the acquired U.S. corporation to a foreign related person. In addition, in such case, a combined company may have a limited ability to integrate certain of its non-U.S. operations or access cash earned by the acquired U.S. corporation’s non-U.S. subsidiaries, in each case without incurring substantial U.S. tax liabilities.
We believe that, based on current law, Section 7874 did not to apply to us after the Merger because the former IHS stockholders held, for purposes of the relevant Section 7874 rules, less than 60% of our common shares (by vote and value) after the Merger by reason of holding IHS common stock. However, there is limited guidance regarding the application of Section 7874, and there can be no assurance that the IRS will agree with the position that the former IHS stockholders will be treated as holding less than 60% of our common shares (by vote and value) after the Merger by reason of holding IHS common stock for purposes of the ownership test. Further, a subsequent change in law might cause IHS stockholders to be treated as owning either 60% or more, or 80% or more, of our common shares after the Merger for U.S. federal income tax purposes, including with retroactive effect to the date of the Merger.
If IHS stockholders were treated as having acquired 80% of our common shares for U.S. federal income tax purposes, IHS Markit would be treated as a U.S. corporation for U.S. federal income tax purposes, and we could be liable for substantial additional U.S. federal income tax on its operations and income following the closing of the Merger. Additionally, non-U.S.
25
shareholders would be subject to U.S. withholding tax on the gross amount of any dividends we pay to such shareholders. If IHS stockholders were treated as having acquired 60% or more (but less than 80%) of our common shares for U.S. federal income tax purposes, while IHS Markit would not be treated as a U.S. corporation for U.S. federal income tax purposes, we could be subject to the other adverse tax consequences described above.
Finally, recent legislative proposals have aimed to expand the scope of U.S. corporate tax residence, including in such a way as would cause IHS Markit to be treated as a U.S. corporation if the management and control of IHS Markit and its affiliates were determined to be located primarily in the United States, or would reduce the ownership percentage at or above which IHS Markit would be treated as a U.S. corporation. Thus, the rules under Section 7874 and other relevant provisions of U.S. tax law could change on a prospective or retroactive basis in a manner that could adversely affect us.
Audits, investigations and tax proceedings could have a material adverse effect on our results of operations and financial condition.
We are subject to direct and indirect taxes in numerous jurisdictions. We calculate and provide for such taxes in each tax jurisdiction in which we operate. The amount of tax we pay is subject to our interpretation of applicable tax laws in the jurisdictions in which we file. We have taken and will continue to take tax positions based on our interpretation of tax laws, but tax accounting often involves complex matters and judgment is required in determining our worldwide provision for taxes and other tax liabilities. Although we believe that we have complied with all applicable tax laws, we have been and expect to continue to be subject to ongoing tax audits in various jurisdictions, and tax authorities have disagreed, and may in the future disagree, with some of our interpretations of applicable tax law. We regularly assess the likely outcomes of these audits to determine the appropriateness of our tax provisions. However, our judgments may not be sustained on completion of these audits, and the amounts ultimately paid could be different from the amounts previously recorded, which may have a material adverse effect on our results of operations and financial condition.
Future changes in tax laws, including in the rates of taxation, could have a material adverse effect on our results of operations and financial condition.
Our tax liabilities and effective tax rate in the future could be adversely affected by changes in the mix of earnings in countries with differing statutory tax rates, changes in the valuation of deferred tax assets and liabilities and changes in tax laws. Tax laws, including tax rates, in the jurisdictions in which we operate may change as a result of macroeconomic, political or other factors, and such changes could have a negative impact on our profitability. For example, the U.S. Congress, the Organisation for Economic Co-operation and Development (“OECD”) and other government agencies have had an extended focus on issues related to the taxation of multinational corporations. One example is in the area of “base erosion and profit shifting.” The G20 finance ministers have endorsed a comprehensive plan set forth by the OECD to create an agreed set of international rules for fighting base erosion and profit shifting. As a result, the tax laws in the United States, the United Kingdom, and other countries in which we operate could change on a prospective or retroactive basis, and any such changes could adversely affect us. In addition, changes in tax laws, treaties or regulations, or their interpretation or enforcement, may be unpredictable, particularly in less developed markets, and could become more stringent, which could materially adversely affect our tax position. Any of these occurrences could have a material adverse effect on our results of operations and financial condition.
On December 22, 2017, a law commonly known as the Tax Cuts and Jobs Act (“TCJA”) was enacted in the United States. Among other things, the TCJA reduces the U.S. federal corporate income tax rate to 21 percent and implements a new system of taxation for non-U.S. earnings, including by imposing a one-time tax on the deemed repatriation of undistributed earnings of non-U.S. subsidiaries. Our financial statements for the current year now reflect the effects of the TCJA based on current guidance, including the effects of the one-time transition tax on certain unrepatriated foreign earnings and the remeasurement of our deferred tax assets and liabilities, as well as the effects of the reduced rate of U.S. corporate income tax and certain other provisions of the TCJA on our effective tax rate and operating results. However, in the absence of guidance on various uncertainties and ambiguities in the application of certain provisions of the TCJA, we will use what we believe are reasonable interpretations and assumptions in applying the TCJA, but it is possible that the IRS as well as state tax authorities could issue subsequent guidance or take positions on audit that differ from our prior interpretations and assumptions, which could have a material adverse effect on our cash tax liabilities, results of operations, and financial condition. In addition, the TCJA could be subject to potential amendments and technical corrections, any of which could materially lessen or increase certain adverse impacts of the legislation on us and our business. We will continue to evaluate the effects of the TCJA on us as federal and state tax authorities issue additional regulations and guidance, and if and when amendments and technical corrections are enacted with respect to the TCJA, which could cause our consolidated financial results to differ from previous estimates and could materially affect our financial position.
26
Bermuda law differs from the laws in effect in the United States and may afford less protection to holders of our common shares, including enforcing judgments against us or our directors and executive officers.
We are organized under the laws of Bermuda, as a Bermuda exempted company. As a result, our corporate affairs and the rights of holders of our common shares are governed by Bermuda law, including the Companies Act 1981 (the “Companies Act”), which differs in some material respects from laws typically applicable to U.S. corporations and shareholders, including the provisions relating to interested directors, amalgamations, mergers and acquisitions, takeovers, shareholder lawsuits and indemnification of directors. Generally, the duties of directors and officers of a Bermuda company are owed to the company only. Shareholders of Bermuda companies typically do not have rights to take action against directors or officers of the company and may only do so in limited circumstances. Class actions are not available under Bermuda law. The circumstances in which derivative actions may be available under Bermuda law are substantially more proscribed and less clear than they would be to shareholders of U.S. corporations. The Bermuda courts, however, would ordinarily be expected to permit a shareholder to commence an action in the name of a company to remedy a wrong to the company where the act complained of is alleged to be beyond the corporate power of the company or illegal, or would result in the violation of the company’s memorandum of association or bye-laws. Furthermore, consideration would be given by a Bermuda court to acts that are alleged to constitute a fraud against the minority shareholders or, for instance, where an act requires the approval of a greater percentage of the company’s shareholders than that which actually approved it.
When the affairs of a company are being conducted in a manner that is oppressive or prejudicial to the interests of some shareholders, one or more shareholders may apply to the Supreme Court of Bermuda, which may make such order as it sees fit, including an order regulating the conduct of the company’s affairs in the future or ordering the purchase of the shares of any shareholders by other shareholders or by the company. Additionally, under our bye-laws and as permitted by Bermuda law, each shareholder has waived any claim or right of action against our directors or officers for any action taken by directors or officers in the performance of their duties, except for actions involving fraud or dishonesty. In addition, the rights of holders of our common shares and the fiduciary responsibilities of our directors under Bermuda law are not as clearly established as under statutes or judicial precedent in existence in jurisdictions in the United States, particularly the State of Delaware. It is also doubtful whether courts in Bermuda will enforce judgments obtained in other jurisdictions, including the United States, against us or our directors or officers under the securities laws of those jurisdictions or entertain actions in Bermuda against us or our directors or officers under the securities laws of other jurisdictions. Therefore, holders of our common shares may have more difficulty protecting their interests than would shareholders of a corporation incorporated in a jurisdiction within the United States.
We have anti-takeover provisions in our bye-laws that may discourage a change of control.
Our bye-laws contain provisions that could make it more difficult for a third party to acquire us without the consent of our Board of Directors. These provisions provide for:
• | directors only to be removed for cause; |
• | restrictions on the time period in which directors may be nominated; |
• | our Board of Directors to determine the powers, preferences and rights of our preference shares and to issue the preference shares without shareholder approval; and |
• | an affirmative vote of 66-2/3% of our voting shares for certain “business combination” transactions which have not been approved by our Board of Directors. |
These provisions could make it more difficult for a third party to acquire us, even if the third party’s offer may be considered beneficial by many shareholders. As a result, shareholders may be limited in their ability to obtain a premium for their shares.
Item 1B. Unresolved Staff Comments
None.
27
Item 2. Properties
Our Facilities
Our colleagues work in offices at 113 locations around the world, comprised of 54 offices in the Americas (44 in the United States), 34 offices in Europe, the Middle East and Africa, and 25 offices in the Asia Pacific region. We own the buildings at three of our locations. All of our other facilities are leased with terms ranging from month-to-month at some locations to an expiration date in 2032 for one of our facilities. We believe that our properties, taken as a whole, are in good operating condition, are suitable and adequate for our current business operations, and that additional or alternative space will be available on commercially reasonable terms for future use and expansion.
Item 3. Legal Proceedings
See “Item 8 - Financial Statements and Supplementary Data - Notes to Consolidated Financial Statements - Note 13” in Part II of this Form 10-K for information about legal proceedings.
Item 4. Mine Safety Disclosures
Not applicable.
PART II
Item 5. Market for the Registrant’s Common Equity, Related Stockholder Matters and Issuer Purchases of Equity Securities
Our common shares are traded on the NASDAQ Stock Market under the symbol “INFO.”
As of December 31, 2018, we had 81 holders of record of our common shares and approximately 175,000 beneficial holders of our common shares.
Our authorized share capital of $30 million consists of 3,000,000,000 shares of common shares, par value $0.01 per share, and undesignated shares, par value $0.01 per share, that our Board of Directors is authorized to designate from time to time as common shares or as preference shares. As of November 30, 2018, no preference shares were issued and outstanding. The holders of our common shares are entitled to one vote per share.
Exchange Controls
Under Bermuda law, there are currently no restrictions on the export or import of capital, including foreign exchange controls or restrictions that affect the remittance of dividends, interest or other payments to non-resident holders of our common shares.
We have been designated by the Bermuda Monetary Authority as a non-resident for Bermuda exchange control purposes. This designation allows us to engage in transactions in currencies other than the Bermuda dollar, and there are no restrictions on our ability to transfer funds (other than funds denominated in Bermuda dollars) in and out of Bermuda or to pay dividends to U.S. residents who are holders of our common shares.
Under Bermuda law, “exempted” companies are companies formed for the purpose of conducting business outside Bermuda from a principal place of business in Bermuda. As an exempted company, we may not carry on certain business in Bermuda without a license or consent granted by the Minister responsible for the Companies Act 1981.
Dividend Policy
We have not previously paid a dividend. We periodically review our capital allocation policy with our Board of Directors and could pay a dividend in the future.
28
Securities Authorized for Issuance Under Equity Compensation Plans
The following table sets forth information as of November 30, 2018, the last day of fiscal year 2018, with respect to compensation plans under which equity securities are authorized for issuance.
Equity Compensation Plan Information | |||||||||||
Plan Category | Number of securities to be issued upon exercise of outstanding options, warrants and rights ( a ) | Weighted-average exercise price of outstanding options, warrants, and rights ( b ) | Number of securities remaining available for issuance under equity compensation plans (excluding securities reflected in column (a)) ( c ) | ||||||||
Equity compensation plans approved by security holders | 25.6 | (1) | $ | 26.61 | (2) | 20.0 | (3) | ||||
Equity compensation plans not approved by security holders | N/A | N/A | N/A | ||||||||
Total | 25.6 | N/A | 20.0 | ||||||||
(1) Includes (a) 15.7 million stock options, (b) 6.9 million restricted share units and 1.4 million performance share units at target performance levels that were issued with no exercise price or other consideration, (c) 1.3 million shares reserved for issuance if maximum performance on performance share units is met, and (d) 0.3 million deferred share units payable to non-employee directors upon their termination of service. Of the 25.6 million awards currently outstanding, approximately 0.7 million restricted share units and 0.3 million deferred share units were issued under the Amended and Restated IHS Inc. 2004 Long-Term Incentive Plan, which plan was assumed in the Merger. Our 2014 Equity Plan contains a provision that increases the authorized maximum share amount by (a) the number of shares granted and outstanding under the Key Employee Incentive Program, the 2013 Share Option Plan, and the 2014 Share Option Plan as of June 24, 2014 that terminate by expiration, forfeiture, cancellation or otherwise without the issuance of our common shares, and (b) on January 1 of each year through January 1, 2024, in an amount equal to the lesser of: (x) 2.5 percent of the total number of IHS Markit’s common shares issued and outstanding on a fully diluted basis as of December 31 of the immediately preceding calendar year and (y) such number of common shares determined by our Board of Directors. | |||||||||||
(2) The weighted-average exercise price is reported for the outstanding stock options reported in the first column. There are no exercise prices for the restricted share units, performance share units, or deferred share units included in the first column. There are no other outstanding warrants or rights. | |||||||||||
(3) Includes shares repurchased by the Company upon vesting of restricted share units and performance share units for tax withholding obligations. The total number of securities remaining available for issuance under equity compensation plans may be issued under the 2014 Equity Plan. | |||||||||||
Issuer Purchases of Equity Securities
The following table provides detail about our share repurchases during the three months ended November 30, 2018. See “Item 8 - Financial Statements and Supplementary Data - Notes to Consolidated Financial Statements - Note 14” in Part II of this Form 10-K for information regarding our stock repurchase programs.
Total Number of Shares Purchased | Average Price Paid per Share | Total Number of Shares Purchased as Part of Publicly Announced Plans or Programs | Maximum Dollar Value of Shares That May Yet Be Purchased Under the Plans or Programs (in millions) | ||||||||
September 1 - September 30, 2018: | |||||||||||
Employee transactions (1) | 32,161 | $ | 54.15 | N/A | N/A | ||||||
October 1 - October 31, 2018: | |||||||||||
Employee transactions (1) | 4,268 | $ | 53.73 | N/A | N/A | ||||||
November 1 - November 30, 2018: | |||||||||||
Employee transactions (1) | 143,575 | $ | 52.43 | N/A | N/A | ||||||
Total share repurchases | 180,004 | $ | 52.77 | — | |||||||
(1) For the fourth quarter of 2018, we repurchased approximately $9.5 million of common shares related to employee transactions. These amounts represent common shares repurchased from employees in an amount equal to the statutory tax liability associated with the vesting of their equity awards. We then pay the statutory tax on behalf of the employee. Our Board of Directors has approved this program in an effort to reduce the dilutive effects of employee equity grants.
29
Performance Graph
The following graph compares our total cumulative stockholder return with the Standard & Poor’s Composite Stock Index (“S&P 500”) and a peer index representing the total price change of The Dun & Bradstreet Corporation; Equifax Inc.; FactSet Research Systems Inc.; Gartner, Inc.; Moody’s Corporation; MSCI Inc.; Nielsen Holdings N.V.; S&P Global Inc.; TransUnion; Thomson Reuters Corporation; and Verisk Analytics, Inc.
The graph assumes a $100 cash investment on June 19, 2014 (our first trading day as a public company) and the reinvestment of all dividends (which we did not pay). This graph is not indicative of future financial performance.
Comparison of Cumulative Total Return Among IHS Markit, S&P 500 Index, and Peer Group
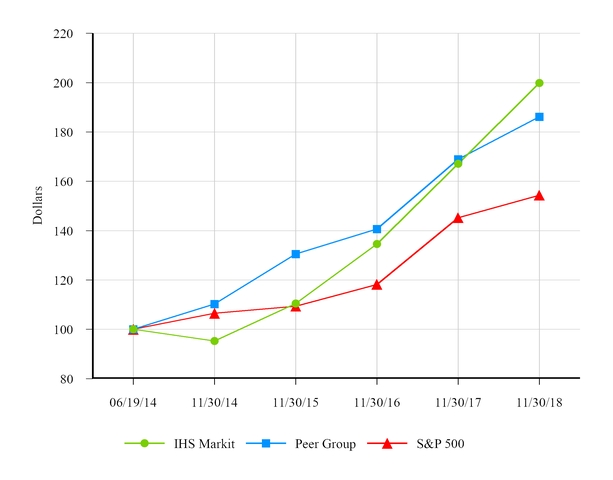
TAXATION
The following sets forth material Bermuda and U.K. income tax consequences of owning and disposing of our common shares. It is based upon laws and relevant interpretations thereof as of the date of this Form 10-K, all of which are subject to change. This discussion does not address all possible tax consequences relating to an investment in our common shares, such as the tax consequences under U.S. federal, state, local, and other tax laws.
Bermuda Tax Considerations
At the present time, there is no Bermuda income or profits tax, withholding tax, capital gains tax, capital transfer tax, estate duty, or inheritance tax payable by us or by our shareholders in respect of our shares. We have obtained an assurance from the Minister of Finance of Bermuda under the Exempted Undertakings Tax Protection Act 1966 that, in the event that any legislation is enacted in Bermuda imposing any tax computed on profits or income, or computed on any capital asset, gain or appreciation or any tax in the nature of estate duty or inheritance tax, such tax shall not, until March 31, 2035, be applicable to
30
us or to any of our operations or to our shares, debentures, or other obligations except insofar as such tax applies to persons ordinarily resident in Bermuda or is payable by us in respect of real property owned or leased by us in Bermuda.
United Kingdom Taxation
General
The following is a description of the material U.K. tax consequences of an investment in our common shares. It is intended only as a general guide to the position under current U.K. tax law and what is understood to be the current published practice of HMRC and may not apply to certain classes of investors, such as dealers in securities, persons who acquire (or are deemed to acquire) their securities by reason of an office or employment, insurance companies, and collective investment schemes. Rates of tax, thresholds, and allowances are given for the U.K. tax year 2018-19. Any person who is in doubt as to his tax position is strongly recommended to consult his own professional tax adviser. To the extent this description applies to U.K. resident and, if individuals, domiciled shareholders, it applies only to those shareholders who beneficially hold their shares as an investment (unless expressly stated otherwise) and hold less than 5 percent of the shares. This description does not apply to shareholders to whom split year treatment applies.
The Company
It is the intention of the directors to conduct the affairs of IHS Markit Ltd. so that the central management and control of IHS Markit Ltd. is exercised in the United Kingdom such that IHS Markit Ltd. is treated as resident in the United Kingdom for U.K. tax purposes.
Taxation of dividends
Withholding tax
We will not be required to withhold U.K. tax at source on any dividends paid to shareholders in respect of our common shares.
U.K. resident shareholders
Individuals resident in the United Kingdom for taxation purposes will pay no tax on the first £2,000 of dividend income received in a tax year (the “nil rate amount”). The rates of income tax on dividends received above the nil rate amount for the 2018-19 tax year are: (a) 7.5 percent for dividends taxed in the basic rate band; (b) 32.5 percent for dividends taxed in the higher rate band; and (c) 38.1 percent for dividends taxed in the additional rate band. Dividend income that is within the nil rate amount counts towards an individual’s basic or higher rate limits. In calculating into which tax band any dividend income over the nil rate amount falls, dividend income is treated as the highest part of an individual’s income.
A U.K. resident shareholder who holds common shares in an individual savings account will be exempt from income tax on dividends in respect of such shares. Subject to certain exceptions, including for traders in securities and insurance companies, dividends paid by us and received by a corporate shareholder resident in the United Kingdom for tax purposes should be within the provisions set out in Part 9A of the Corporation Tax Act 2009 which exempt certain classes of dividend from corporation tax. Each shareholder’s position will depend on its own individual circumstances, although it would normally be expected that the dividends paid by us would fall into an exempt class and will not be subject to corporation tax.
Non-U.K. resident shareholders
Non-U.K. resident shareholders are not subject to tax (including withholding tax) in the United Kingdom on dividends received on our common shares unless they carry on a trade, profession, or vocation in the United Kingdom through a branch or agency (or, in the case of a non-U.K. resident corporate shareholder, a permanent establishment) to which the common shares are attributable.
Taxation of capital gains
31
U.K. resident shareholders
A disposal of common shares by an individual shareholder who is (at any time in the relevant U.K. tax year) resident in the United Kingdom for tax purposes, may give rise to a chargeable gain or an allowable loss for the purposes of U.K. taxation of chargeable gains, depending on the shareholder’s circumstances and subject to any allowable deductions and any available exemption or relief including the annual exempt amount (being £11,700 for 2018-19). Capital gains tax is charged on chargeable gains at a rate of 10 percent or 20 percent (or a combination of both rates) depending on whether the individual is a basic rate taxpayer or a higher or additional rate taxpayer.
For shareholders within the charge to U.K. corporation tax on chargeable gains in respect of the common shares, indexation allowance, frozen with effect from December 31, 2017, may be available to reduce the amount of any chargeable gain realized on a disposal of common shares (but not to create or increase any loss).
Non-resident shareholders
A shareholder who is not resident in the United Kingdom for tax purposes will not be subject to U.K. taxation of capital gains on the disposal or deemed disposal of common shares unless they carry on a trade, profession, or vocation in the United Kingdom through a branch or agency (or, in the case of a non-U.K. resident corporate shareholder, a permanent establishment) to which the common shares are attributable, in which case they will be subject to the same rules which apply to U.K. resident shareholders.
A shareholder who is an individual and who is temporarily resident for tax purposes outside the United Kingdom at the date of disposal of common shares may also be liable, on his return, to U.K. taxation of chargeable gains (subject to any available exemption or relief).
Stamp duty and stamp duty reserve tax (“SDRT”)
The statements below summarize the current law and are intended as a general guide only to stamp duty and SDRT. Special rules apply to agreements made by broker dealers and market makers in the ordinary course of their business and to transfers, agreements to transfer, or issues to certain categories of person (such as depositaries and clearance services) which may be liable to stamp duty or SDRT at a higher rate.
No stamp duty reserve tax will be payable on any agreement to transfer the common shares, provided that the common shares are not registered in a register kept in the United Kingdom. It is not intended that such a register will be kept in the United Kingdom. Further, no stamp duty will be payable on transfer of the common shares provided that (i) any instrument of transfer is not executed in the United Kingdom; and (ii) such instrument of transfer does not relate to any property situated, or any matter or thing done or to be done, in the United Kingdom.
Inheritance tax
U.K. inheritance tax may be chargeable on the death of, or on a gift of common shares by, a U.K. domiciled shareholder. For inheritance tax purposes, a transfer of assets at less than full market value may be treated as a gift and particular rules apply to gifts where the donor reserves or retains some benefit. Special rules also apply to the trustees of settlements who hold common shares. Potential investors should consult an appropriate professional adviser if they make a gift or transfer at less than full market value or they intend to hold common shares through trust arrangements.
ISA
The common shares are eligible for inclusion in the stocks and shares component of an ISA, subject, where applicable, to the annual subscription limits for new investments into an ISA (for the tax year 2018-19, this is £20,000). Sums received by a shareholder on a disposal of common shares will not count towards the shareholder’s annual limit, but a disposal of common shares held in an ISA will not serve to make available again any part of the annual subscription limit that has already been used by the shareholder in that tax year.
32
Item 6. Selected Financial Data
You should read the following selected consolidated financial data in conjunction with “Management’s Discussion and Analysis of Financial Condition and Results of Operations” and our consolidated financial statements and the related notes appearing in Part II of this Form 10-K.
Years Ended November 30, | |||||||||||||||
2018 | 2017 | 2016 | 2015 | 2014 | |||||||||||
(in millions, except for per share amounts) | |||||||||||||||
Statement of Operations Data: | |||||||||||||||
Revenue | $ | 4,009.2 | $ | 3,599.7 | $ | 2,734.8 | $ | 2,184.3 | $ | 2,079.8 | |||||
Income from continuing operations attributable to IHS Markit Ltd. | $ | 542.3 | $ | 416.9 | $ | 143.6 | $ | 188.9 | $ | 178.0 | |||||
Income from discontinued operations | — | — | 9.2 | 51.3 | 16.5 | ||||||||||
Net income attributable to IHS Markit Ltd. | $ | 542.3 | $ | 416.9 | $ | 152.8 | $ | 240.2 | $ | 194.5 | |||||
Basic earnings per share: | |||||||||||||||
Income from continuing operations attributable to IHS Markit Ltd. | $ | 1.38 | $ | 1.04 | $ | 0.46 | $ | 0.78 | $ | 0.73 | |||||
Income from discontinued operations | — | — | 0.03 | 0.21 | 0.07 | ||||||||||
Net income attributable to IHS Markit Ltd. | $ | 1.38 | $ | 1.04 | $ | 0.49 | $ | 0.99 | $ | 0.80 | |||||
Diluted earnings per share: | |||||||||||||||
Income from continuing operations attributable to IHS Markit Ltd. | $ | 1.33 | $ | 1.00 | $ | 0.45 | $ | 0.77 | $ | 0.72 | |||||
Income from discontinued operations | — | — | 0.03 | 0.21 | 0.07 | ||||||||||
Net income attributable to IHS Markit Ltd. | $ | 1.33 | $ | 1.00 | $ | 0.48 | $ | 0.97 | $ | 0.79 | |||||
Balance Sheet Data (as of period end): | |||||||||||||||
Cash and cash equivalents | $ | 120.0 | $ | 133.8 | $ | 291.6 | $ | 291.6 | $ | 153.2 | |||||
Total assets | $ | 16,062.3 | $ | 14,554.4 | $ | 5,577.5 | $ | 5,577.5 | $ | 5,272.1 | |||||
Total long-term debt and capital leases | $ | 4,889.2 | $ | 3,617.3 | $ | 2,071.5 | $ | 2,071.5 | $ | 1,806.1 | |||||
Total stockholders' equity | $ | 8,020.5 | $ | 8,004.4 | $ | 2,200.9 | $ | 2,200.9 | $ | 2,159.5 | |||||
33
Item 7. | Management’s Discussion and Analysis of Financial Condition and Results of Operations |
The following discussion of our financial condition and operating results should be read in conjunction with other information and disclosures elsewhere in this Form 10-K, including “Selected Financial Data,” our consolidated financial statements and accompanying notes, and “Website and Social Media Disclosure.” The following discussion includes forward-looking statements as described in “Cautionary Note Regarding Forward-Looking Statements” in this Form 10-K. A detailed discussion of risks and uncertainties that could cause actual results and events to differ materially from such forward-looking statements is outlined under “Item 1A. Risk Factors” in this Form 10-K.
This MD&A includes the financial results of Markit Ltd. beginning July 12, 2016. The comparability of our operating results for fiscal 2017 to fiscal 2016 is significantly impacted by the Merger. As a result of the Merger, we created a new Financial Services segment, which consists entirely of legacy Markit’s business (and also includes Ipreo from the date of acquisition in August 2018), and we have included revenue and expense attributable to legacy Markit in the Financial Services segment from the date of the Merger. In our discussion and analysis of comparative periods, we have quantified the legacy Markit contribution wherever we have deemed such amounts to be meaningful. While identified amounts may provide indications of general trends, the analysis cannot completely address the effects attributable to the Merger.
Executive Summary
Business Overview
We are a world leader in critical information, analytics, and solutions for the major industries and markets that drive economies worldwide. We deliver next-generation information, analytics, and solutions to customers in business, finance, and government, improving their operational efficiency and providing deep insights that lead to well-informed, confident decisions. We have more than 50,000 business and government customers, including 80 percent of the Fortune Global 500 and the world’s leading financial institutions. Headquartered in London, we are committed to sustainable, profitable growth.
On July 12, 2016, the Merger was completed pursuant to the Merger Agreement between IHS, Markit, and Merger Sub, and Merger Sub merged with and into IHS, with IHS continuing as the surviving corporation and an indirect and wholly owned subsidiary of IHS Markit. Upon completion of the Merger, Markit became the combined group holding company and was renamed IHS Markit Ltd. In accordance with the terms of the Merger Agreement, IHS stockholders received 3.5566 common shares of IHS Markit for each share of IHS common stock they owned.
To best serve our customers, we are organized into the following four industry-focused segments:
•Resources, which includes our Energy and Chemicals product offerings;
• | Transportation, which includes our Automotive; Maritime & Trade; and Aerospace, Defense & Security product offerings; |
• | Consolidated Markets & Solutions, which includes our Product Design; Technology, Media & Telecom (“TMT”); and Economics & Country Risk (“ECR”) product offerings; and |
• | Financial Services, which includes our financial Information, Processing, and Solutions product offerings, as well as our product offerings from Ipreo, our recent acquisition. |
We believe that this sales and operating model helps our customers do business with us by providing a cohesive, consistent, and effective product, sales, and marketing approach by segment.
Our recurring fixed revenue and recurring variable revenue represented approximately 84 percent of our total revenue in 2018. Our recurring revenue is generally stable and predictable, and we have long-term relationships with many of our customers.
Our business has seasonal aspects. Our first quarter generally has our lowest quarterly levels of revenue and profit. We also experience event-driven seasonality in our business; for instance, CERAWeek, an annual energy conference, is typically held in the second quarter of each year. Another example is the biennial release of the BPVC engineering standard, which generates revenue for us predominantly in the third quarter of every other year. The most recent BPVC release was in the third quarter of 2017.
During 2018, we focused our efforts on integrating our organizational structure, innovating and developing new product offerings, and managing our capital allocation. In 2018, we completed our key Merger integration activities. We also introduced
34
or enhanced many of our product offerings, and we took advantage of the opportunity to further enhance our Financial Services product portfolio with the Ipreo acquisition. Related to our capital structure, our corporate credit rating improved to investment-grade in the second quarter of 2018.
For 2019, we expect to focus our efforts on the following actions:
• | Increase in geographic, product, and customer penetration. We believe there are continued opportunities to add new customers and to increase the use of our products and services by existing customers. We plan to add new customers and build our relationships with existing customers by leveraging our existing sales channels, broad product portfolio, global footprint, and industry expertise to anticipate and respond to the changing demands of our end markets. |
• | Introduce innovative offerings and enhancements. In recent years, we have launched several new product offerings addressing a wide array of customer needs, and we expect to continue to innovate using our existing data sets and industry expertise, converting core information to higher value advanced analytics. Our investment priorities are primarily in energy, automotive, and financial services, and we intend to continue to invest across our business to increase our customer value proposition. |
• | Balance capital allocation. Our capital allocation focus for the majority of 2019 will be to de-lever to our capital policy target leverage ratio of 2.0-3.0x. Over the long term, we expect to balance capital allocation between returning capital to shareholders (through consistent share repurchases) and completing mergers and acquisitions, focused primarily on targeted transactions in our core end markets that will allow us to continue to build out our strategic position. |
Key Performance Indicators
We believe that revenue growth, Adjusted EBITDA (both in dollars and margin), and free cash flow are key financial measures of our success. Adjusted EBITDA and free cash flow are financial measures that are not recognized terms under U.S. generally accepted accounting principles (“non-GAAP”).
Revenue growth. We review year-over-year revenue growth in our segments as a key measure of our success in addressing customer needs. We measure revenue growth in terms of organic, acquisitive, and foreign currency impacts. We define these components as follows:
• | Organic – We define organic revenue growth as total revenue growth from continuing operations for all factors other than acquisitions and foreign currency movements. We drive this type of revenue growth through value realization (pricing), expanding wallet share of existing customers through up-selling and cross-selling efforts, securing new customer business, and through the sale of new or enhanced product offerings. |
• | Acquisitive – We define acquisitive revenue as the revenue generated from acquired products and services from the date of acquisition to the first anniversary date of that acquisition. This type of growth comes as a result of our strategy to purchase, integrate, and leverage the value of assets we acquire. We also include the impact of divestitures in this growth metric. Due to the size of the Merger, we have not included Markit’s 2017 reported results versus 2016 results in the acquisitive category, but have broken out those results in the organic, acquisitive (for acquisitions completed by legacy Markit prior to the Merger), and foreign currency growth metrics. |
• | Foreign currency – We define the foreign currency impact on revenue as the difference between current revenue at current exchange rates and current revenue at the corresponding prior period exchange rates. Due to the significance of revenue transacted in foreign currencies, we believe it is important to measure the impact of foreign currency movements on revenue. |
In addition to measuring and reporting revenue by segment, we also measure and report revenue by transaction type. Understanding revenue by transaction type helps us identify and address broad changes in product mix. We summarize our transaction type revenue into the following three categories:
• | Recurring fixed revenue represents revenue generated from contracts specifying a relatively fixed fee for services delivered over the life of the contract. The fixed fee is typically paid annually or more periodically in advance. These contracts typically consist of subscriptions to our various information offerings and software maintenance, and the revenue is usually recognized over the life of the contract. The initial term of these contracts is typically |
35
annual and non-cancellable for the term of the subscription and may contain provisions for minimum monthly payments.
• | Recurring variable revenue represents revenue from contracts that specify a fee for services which is typically not fixed. The variable fee is usually paid monthly in arrears. Recurring variable revenue is based on, among other factors, the number of trades processed, assets under management, or the number of positions we value. Many of these contracts do not have a maturity date, while the remainder have an initial term ranging from one to five years. Recurring variable revenue was derived entirely from the Financial Services segment for all periods presented. |
• | Non-recurring revenue represents consulting (e.g., research and analysis, modeling, and forecasting), services, single-document product sales, software license sales and associated services, conferences and events, and advertising. Our non-recurring products and services are an important part of our business because they complement our recurring business in creating strong and comprehensive customer relationships. |
Non-GAAP measures. We use non-GAAP financial measures such as EBITDA, Adjusted EBITDA, and free cash flow in our operational and financial decision-making. We believe that such measures allow us to focus on what we deem to be more reliable indicators of ongoing operating performance (Adjusted EBITDA) and our ability to generate cash flow from operations (free cash flow). We also believe that investors may find these non-GAAP financial measures useful for the same reasons, although we caution readers that non-GAAP financial measures are not a substitute for U.S. GAAP financial measures or disclosures. None of these non-GAAP financial measures are recognized terms under U.S. GAAP and do not purport to be an alternative to net income or operating cash flow as an indicator of operating performance or any other U.S. GAAP measure. Throughout this MD&A, we provide reconciliations of these non-GAAP financial measures to the most directly comparable U.S. GAAP measures.
EBITDA and Adjusted EBITDA. EBITDA and Adjusted EBITDA are used by many of our investors, research analysts, investment bankers, and lenders to assess our operating performance. For example, a measure similar to Adjusted EBITDA is required by the lenders under our term loan and revolving credit agreements. We define EBITDA as net income plus or minus net interest, plus provision for income taxes, depreciation, and amortization. Our definition of Adjusted EBITDA further excludes primarily non-cash items and other items that we do not consider to be useful in assessing our operating performance (e.g., stock-based compensation expense, restructuring charges, acquisition-related costs and performance compensation, exceptional litigation, net other gains and losses, pension mark-to-market and other adjustments, the impact of joint ventures and noncontrolling interests, and discontinued operations).
Free Cash Flow. We define free cash flow as net cash provided by operating activities less capital expenditures.
Non-GAAP measures are frequently used by securities analysts, investors, and other interested parties in their evaluation of companies comparable to us, many of which present non-GAAP measures when reporting their results. These measures can be useful in evaluating our performance against our peer companies because we believe the measures provide users with valuable insight into key components of U.S. GAAP financial disclosures. For example, a company with higher U.S. GAAP net income may not be as appealing to investors if its net income is more heavily comprised of gains on asset sales. Likewise, excluding the effects of interest income and expense moderates the impact of a company’s capital structure on its performance. However, non-GAAP measures have limitations as an analytical tool. Because not all companies use identical calculations, our presentation of non-GAAP financial measures may not be comparable to other similarly titled measures of other companies. They are not presentations made in accordance with U.S. GAAP, are not measures of financial condition or liquidity, and should not be considered as an alternative to profit or loss for the period determined in accordance with U.S. GAAP or operating cash flows determined in accordance with U.S. GAAP. As a result, these performance measures should not be considered in isolation from, or as a substitute analysis for, results of operations as determined in accordance with U.S. GAAP.
Strategic Acquisitions
Acquisitions have historically been an important part of our growth strategy. We completed three acquisitions during the year ended November 30, 2018 for a total purchase price of approximately $1.9 billion. In 2017, we completed two acquisitions for a total purchase price of approximately $0.4 billion. We paid a total purchase price of approximately $1.1 billion for two acquisitions we completed during the year ended November 30, 2016, in addition to the Merger. Our consolidated financial statements include the results of operations and cash flows for these business combinations beginning on their respective dates of acquisition. For a more detailed description of our recent acquisition activity, see “Item 8 - Financial Statements and Supplementary Data - Notes to Consolidated Financial Statements - Note 3” in Part II of this Form 10-K.
36
Global Operations
Approximately 40 percent of our revenue is transacted outside of the United States; however, only about 20 percent of our revenue is transacted in currencies other than the U.S. dollar. As a result, a strengthening U.S. dollar relative to certain currencies has historically resulted in a negative impact on our revenue; conversely, a weakening U.S. dollar has historically resulted in a positive impact on our revenue. However, the impact on operating income is diminished due to certain operating expenses denominated in currencies other than the U.S. dollar. Our largest foreign currency exposures are the British Pound, Euro, Canadian Dollar, Singapore Dollar, and Indian Rupee. See “Quantitative and Qualitative Disclosures About Market Risk – Foreign Currency Exchange Rate Risk” for additional discussion of the impacts of foreign currencies on our operations.
Pricing information
We customize many of our sales offerings to meet individual customer needs and base our pricing on a number of factors, including various price segmentation models which utilize customer attributes, value attributes, and other data sources. Attributes can include a proxy for customer size (e.g., barrels of oil equivalent and annual revenue), industry, users, usage, breadth of the content to be included in the offering, and multiple other factors. Because of the level of offering customization we employ, it is difficult for us to evaluate pricing impacts on a period-to-period basis with absolute certainty. This analysis is further complicated by the fact that the offering sets purchased by customers are often not constant between periods. As a result, we are not able to precisely differentiate between pricing and volume impacts on changes in revenue comprehensively across the business.
Other Items
Cost of operating our business. We incur our cost of revenue primarily through acquiring, managing, and delivering our offerings. These costs include personnel, information technology, data acquisition, and occupancy costs, as well as royalty payments to third-party information providers. Our sales, general, and administrative expenses include wages and other personnel costs, commissions, corporate occupancy costs, and marketing costs. A large portion of our operating expenses are not directly commensurate with volume sold, particularly in our recurring revenue business model.
Stock-based compensation expense. We issue equity awards to our employees primarily in the form of restricted stock units, performance stock units, and stock options, for which we record cost over the respective vesting periods. The typical vesting period is three years. As of November 30, 2018, we had approximately 8.8 million unvested RSUs/RSAs and 6.2 million unvested stock options outstanding.
Critical Accounting Policies and Estimates
Our consolidated financial statements are prepared in accordance with U.S. GAAP. In applying U.S. GAAP, we make significant estimates and judgments that affect our reported amounts of assets, liabilities, revenues, and expenses, as well as disclosure of contingent assets and liabilities. We believe that our accounting estimates and judgments are reasonable when made, but in many instances, alternative estimates and judgments would also be acceptable. In addition, changes in the accounting estimates are reasonably likely to occur from period to period. Accordingly, actual results could differ significantly from our estimates. To the extent that there are material differences between these estimates and actual results, our financial condition or results of operations will be affected. We base our estimates on historical experience and other assumptions that we believe are reasonable, and we evaluate these estimates on an ongoing basis. We refer to accounting estimates of this type as critical accounting policies and estimates, which are discussed further below.
Revenue Recognition. The majority of our offerings are provided under agreements containing standard terms and conditions. Approximately 84 percent of our 2018 revenue was derived from recurring revenue arrangements, which are initially deferred and then recognized ratably as delivered over the term of the agreement for annual contractual periods billed up front, or is billed and recognized on a periodic basis. These standard agreements typically do not require any significant judgments about when revenue should be recognized. For non-standard agreements, we generally make judgments about revenue recognition matters such as whether sufficient legally binding terms and conditions exist and whether customer acceptance has been received.
We review customer agreements and utilize advice from legal counsel, as appropriate, in evaluating the binding nature of contract terms and conditions, as well as whether customer acceptance has been achieved. We estimate progress on consulting project deliverables based on our knowledge and judgment about the current status of individual consulting engagements.
37
Historically, our judgments and estimates have been reasonably accurate, as we have not experienced significant disputes with our customers regarding the timing and acceptance of delivered products and services. However, our actual experience in future periods with respect to binding terms and conditions and customer acceptance may differ from our historical experience.
In the first quarter of 2019, we will adopt Accounting Standards Update (“ASU”) 2014-09, 2016-08, 2016-10, and 2016-12. These standards establish a comprehensive new revenue recognition model designed to depict the transfer of goods or services to a customer in an amount that reflects the consideration the entity expects to receive in exchange for those goods or services. We will adopt the new revenue guidance using the modified retrospective transition method, which results in a cumulative effect adjustment to the opening balance of retained earnings as of the date of adoption. We currently estimate an increase of approximately $50 million to the opening balance of retained earnings for this transition for the change in revenue recognition, primarily related to the change in accounting for the license rights associated with certain term-based software license arrangements, which were historically recognized over the term of the contract, but will now be recognized at contract inception based on estimated stand-alone selling price.
The expected $50 million transition adjustment pertains solely to the impact to retained earnings as of December 1, 2018 on our consolidated balance sheet, and is not indicative of the impact the new standards are expected to have on our future consolidated financial statements. We do not believe that implementation of the new standards will have a significant impact on our annual results of operations, although we anticipate that there may be more quarterly fluctuations in revenue due to the change in accounting treatment for our term-based software license arrangements. We do not expect that application of the new guidance will affect our cash flows or the economics of our business.
Business Combinations. We apply the purchase method of accounting to our business combinations. All of the assets acquired, liabilities assumed, and contingent consideration are allocated based on their estimated fair values. Fair value determinations involve significant estimates and assumptions about several highly subjective variables, including future cash flows, discount rates, and expected business performance. There are also different valuation models and inputs for each component, the selection of which requires considerable judgment. Our estimates and assumptions may be based, in part, on the availability of listed market prices or other transparent market data. These determinations will affect the amount of amortization expense recognized in future periods. We base our fair value estimates on assumptions we believe are reasonable, but recognize that the assumptions are inherently uncertain. Depending on the size of the purchase price of a particular acquisition, the mix of intangible assets acquired, and expected business performance, the purchase price allocation could be materially impacted by applying a different set of assumptions and estimates. In 2018, 2017, and 2016, we recorded approximately $745.3 million, $113.8 million, and $3.6 billion, respectively, of intangible assets associated with business combinations.
The structure of certain business combinations may also require the application of significant assumptions and estimates. For example, in 2017, we acquired 78 percent of aM; in exchange for the remaining 22 percent, we issued equity interests in aM’s immediate parent holding company to aM’s founders and certain employees. We will pay cash to acquire these interests over the five years post-acquisition based on put/call provisions that tie the valuation to the underlying adjusted EBITDA performance of aM. Since the purchase of the remaining 22 percent of the business requires continued service of the founders and employees, we are accounting for the arrangement as compensation expense that is remeasured based on changes in the fair value of the equity interests. We had preliminarily estimated a range of $200 million to $225 million of unrecognized compensation expense related to this transaction, to be recognized over a weighted-average remaining recognition period of approximately 4 years. In the third quarter of 2018, upon reassessment of near-term financial expectations and their impact on the earn-out calculations, we reduced our estimated compensation expense range to $150.0 million to $175.0 million, to be recognized over a weighted-average recognition period of approximately 3.5 years. This change did not significantly impact 2018 expense. This arrangement requires the use of a number of significant judgments and estimates, including the expected put/call exercise pattern and the expected value of the cash payout at the time of exercise.
Goodwill and Other Intangible Assets. We make various assumptions about our goodwill and other intangible assets, including their estimated useful lives and whether any potential impairment events have occurred. We perform impairment analyses on the carrying values of goodwill and other intangible assets at least annually. Additionally, we review the carrying value of goodwill and other intangible assets whenever events or changes in circumstances indicate that their carrying amounts may not be recoverable. Examples of such events or changes in circumstances, many of which are subjective in nature, include the following:
•Significant negative industry or economic trends;
•A significant change in the manner of our use of the acquired assets or our strategy;
•A significant decrease in the market value of the asset;
•A significant change in legal factors or in the business climate that could affect the value of the asset; and
38
•A change in segments.
If an impairment indicator is present, we perform an analysis to confirm whether an impairment has actually occurred and if so, the amount of the required charge.
As of November 30, 2018 and 2017, we had approximately $4.5 billion and $4.2 billion, respectively, of finite-lived intangible assets. For finite-lived intangible assets, we review the carrying amount at least annually to determine whether current events or circumstances indicate a triggering event which could require an adjustment to the carrying amount. A finite-lived intangible asset is considered to be impaired if its carrying value exceeds the estimated future undiscounted cash flows to be derived from it. We exercise judgment in selecting the assumptions used in the estimated future undiscounted cash flows analysis. Any impairment is measured by the amount that the carrying value of such assets exceeds their fair value.
As of November 30, 2018 and 2017, we had approximately $9.8 billion and $8.8 billion, respectively, of goodwill. For goodwill, we use both qualitative and quantitative analysis to determine whether we believe it is more likely than not that goodwill has been impaired. In 2018 and 2017, we used a qualitative analysis for each reporting unit with goodwill in determining that no impairment indicators were present. That determination requires a number of significant assumptions and judgments, including assumptions about future economic conditions, revenue growth, and operating margins, among other factors. The use of different estimates or assumptions could result in significantly different fair values for our goodwill and other intangible assets.
Income Taxes. We exercise significant judgment in determining our provision for income taxes, current tax assets and liabilities, deferred tax assets and liabilities, future taxable income (for purposes of assessing our ability to realize future benefit from our deferred tax assets), our permanent reinvestment assertion regarding foreign earnings, and recorded reserves related to uncertain tax positions. A valuation allowance is established to reduce our deferred tax assets to the amount that is considered more likely than not to be realized through the generation of future taxable income and other tax planning opportunities. To the extent that a determination is made to establish or adjust a valuation allowance, the expense or benefit is recorded in the period in which the determination is made.
If actual results differ from estimates we have used, or if we adjust these estimates in future periods, our operating results and financial position could be materially affected.
The TCJA significantly changed existing U.S. tax law and includes numerous provisions that affect our business. We have recognized a tax charge of $31 million due to transition tax liability and a tax benefit of $172 million due to the impact of the reduction in U.S. tax rates in the period when the TCJA was enacted as a component of our provision for income taxes from continuing operations. We have completed the accounting for all the impacts of the TCJA. See “Item 8 - Financial Statements and Supplementary Data - Notes to Consolidated Financial Statements - Note 10” in Part II of this Form 10-K for further information about these changes. These computations are based on the regulations and guidance already provided by federal and state tax authorities. We will continue to assess the impact of the further guidance from federal and state tax authorities on our business and consolidated financial statements. Any future adjustments will be recognized as discrete income tax expense or benefit in the period the guidance is issued.
Pension Accounting. During the fourth quarter of each fiscal year (or upon any remeasurement date), we immediately recognize net actuarial gains or losses in excess of a corridor in our operating results. The corridor amount is equivalent to 10 percent of the greater of the market-related value of plan assets or the plan’s benefit obligation at the beginning of the year. We use the actual fair value of plan assets at the measurement date as the measure of the market-related value of plan assets.
Our pension expense and associated pension liability requires the use of judgment in determining assumptions about the estimated long-term rate of return on plan assets and the discount rate, as well as various demographic assumptions. Our pension investment strategy is designed to align the majority of our pension assets with the underlying pension liability, which should minimize volatility caused by changes in asset returns and discount rates. Our pension expense estimates are updated for actual experience through the remeasurement process in the fourth quarter, or sooner if earlier remeasurements are required. For 2018, we used a 4.3 percent expected long-term rate of return on plan assets and a 3.8 percent discount rate for the U.S. Retirement Income Plan (RIP). The actual return on U.S. RIP plan assets during 2018 was negative 4.5 percent.
39
Discount rates and expected rates of return on plan assets are selected at the end of a given fiscal year and will impact expense in the subsequent year. A 50-basis-point change in certain assumptions made at the beginning of 2018 would have resulted in the following effects on 2018 pension expense and the projected benefit obligation (“PBO”) as of November 30, 2018 for the U.S. and U.K. RIP plans (in millions):
Impact to Pension Results - U.S. and U.K. RIP | ||||||||
Change in assumption | Increase/(Decrease) to 2018 Pre-Tax Expense | Increase/(Decrease) to November 30, 2018 PBO | ||||||
50-basis-point decrease in discount rate | $ | 4.0 | $ | 11.9 | ||||
50-basis-point increase in discount rate | 0.5 | (10.8 | ) | |||||
50-basis-point decrease in expected return on assets | 1.0 | — | ||||||
50-basis-point increase in expected return on assets | (1.0 | ) | — | |||||
We have taken initial steps to terminate the U.S. RIP and are awaiting regulatory approval before proceeding. For the year ending November 30, 2018, we have used the same accounting estimate methodology as in prior years.
Stock-Based Compensation. Our stock plans provide for the grant of various equity awards, including performance-based awards. For time-based restricted stock unit grants, we calculate stock-based compensation cost by multiplying the grant date fair market value by the number of shares granted, reduced for estimated forfeitures. For time-based stock option grants, we calculate stock-based compensation cost by multiplying the grant date fair market value by the number of option shares granted, reduced for estimated forfeitures. The estimated forfeiture rate is based on historical experience, and we periodically review our forfeiture assumptions based on actual experience.
For performance-based restricted stock unit grants, including those with a market-based adjustment factor, we calculate stock-based compensation cost by multiplying the grant date fair market value by the number of shares granted, reduced for estimated forfeitures. Each quarter, we evaluate the probability of the number of shares that are expected to vest and adjust our stock-based compensation expense accordingly.
Results of Operations
Total Revenue
Total revenue for 2018 increased 11 percent compared to the same period of 2017. Total revenue for 2017 increased 32 percent compared to the same period in 2016. The table below displays the percentage point change in revenue due to organic, acquisitive, and foreign currency factors when comparing 2018 to 2017 and 2017 to 2016. Markit’s revenue of $1.233 billion for the year ended November 30, 2017, less the $68 million increase from the year ended November 30, 2016, has been included in the calculation of acquisitive growth in the table immediately below, and the components of Markit’s $68 million revenue growth from 2016 to 2017 have been included in their related factors in the table further below. We have noted Financial Services growth percentages as not meaningful (N/M) where applicable, as absolute growth percentages are not meaningful comparisons due to the timing of the Merger in 2016.
Increase (Decrease) in Total Revenue | |||||||||
(All amounts represent percentage points) | Organic | Acquisitive | Foreign Currency | ||||||
2018 vs. 2017 | 6 | % | 5 | % | 1 | % | |||
2017 vs. 2016 | 4 | % | 29 | % | (1 | )% | |||
Organic revenue growth in 2018 and 2017 was attributable to both recurring and nonrecurring revenue growth. The recurring-based business represented 84 percent of total revenue in 2018, compared to 83 percent and 82 percent of total revenue in 2017 and 2016, respectively. The recurring-based business increased 6 percent organically in 2018 and 3 percent organically in 2017, led in each year by Transportation and Financial Services offerings, with Resources also contributing to the organic growth in 2018. The non-recurring business increased 6 percent organically in 2018, led by Transportation and Resources offerings, and increased 9 percent organically in 2017, led by Transportation and Financial Services offerings. The non-recurring revenue increase in 2017 was also partially due to the timing of the biennial cycle of the BPVC standard, which contributed approximately $12 million of revenue in the 2017 results.
40
Acquisition-related revenue growth for 2018 was primarily due to the Ipreo acquisition in the third quarter of 2018 and the aM acquisition in the fourth quarter of 2017. Acquisition-related revenue growth for 2017 was primarily due to the Merger, as well as the run-out of the CARPROOF and OPIS acquisitions from the first quarter of 2016.
Foreign currency movements had a slightly positive effect on our 2018 revenue growth and a slightly negative impact on our 2017 revenue growth. Due to the extent of our global operations, foreign currency movements could continue to positively or negatively affect our results in the future.
Revenue by Segment
Year ended November 30, | % Change 2018 vs. 2017 | % Change 2017 vs. 2016 | ||||||||||||||||
(In millions, except percentages) | 2018 | 2017 | 2016 | |||||||||||||||
Revenue: | ||||||||||||||||||
Resources | $ | 876.5 | $ | 839.3 | $ | 860.8 | 4 | % | (2 | )% | ||||||||
Transportation | 1,160.2 | 991.6 | 892.8 | 17 | % | 11 | % | |||||||||||
CMS | 552.8 | 535.9 | 532.2 | 3 | % | 1 | % | |||||||||||
Financial Services | 1,419.7 | 1,232.9 | 449.0 | 15 | % | N/M | ||||||||||||
Total revenue | $ | 4,009.2 | $ | 3,599.7 | $ | 2,734.8 | 11 | % | 32 | % | ||||||||
The percentage change in revenue for each segment is due to the factors described in the following table.
2018 vs. 2017 | 2017 vs. 2016 | ||||||||||||||||
(All amounts represent percentage points) | Organic | Acquisitive | Foreign Currency | Organic | Acquisitive | Foreign Currency | |||||||||||
Resources revenue | 4 | % | — | % | — | % | (4 | )% | 2 | % | — | % | |||||
Transportation revenue | 11 | % | 6 | % | 1 | % | 10 | % | 2 | % | — | % | |||||
CMS revenue | 2 | % | 1 | % | 1 | % | 2 | % | — | % | (1 | )% | |||||
Financial Services revenue | 6 | % | 8 | % | 1 | % | 7 | % | — | % | (1 | )% | |||||
Resources revenue had encountered significant energy industry headwinds in 2016 and into early 2017 due to lower energy prices and reduced industry spending. However, we saw a more stable price environment and more favorable capital spending budgets as 2017 progressed, and those trends have continued through 2018. During 2016, on a constant currency basis, our Resources annual contract value (“ACV”), which represents the annualized value of recurring revenue contracts, declined approximately 10 percent; in 2017, ACV was relatively flat, and in 2018, ACV increased 3 percent. As a result, Resources recurring revenue improved from a 9 percent organic decline in 2016 to a 5 percent organic decline in 2017 to 4 percent organic growth in 2018. The energy industry improvements have also led to an improvement in our Resources non-recurring revenue results, going from a 12 percent organic decline in 2016 to 3 percent organic growth in 2017 and 8 percent organic growth in 2018.
Transportation revenue increases for 2017 and 2018 were driven by continued solid organic recurring and non-recurring growth, primarily in our various automotive product offerings. We continue to see strong organic growth in our automotive product category due to continued growth in our used car product offerings and benefits from ongoing innovation in new car product offerings as a result of the increasing use of digital marketing, new automotive technologies, and global regulatory pressure to curb fuel consumption and emissions, along with strong recall activity. The aM acquisition in the fourth quarter of 2017 contributed the acquisitive growth in each of 2018 and 2017.
CMS organic revenue growth in 2018 was primarily due to recurring and non-recurring revenue growth in our ECR and TMT product offerings, as well as recurring organic revenue growth in our Product Design offerings; our non-recurring organic revenue decline in Product Design in 2018 was primarily due to the prior year BPVC release. CMS organic revenue growth in 2017 was primarily due to growth in our Product Design offerings, including the BPVC release.
Financial Services revenue experienced strong total organic growth in both 2018 and 2017. Within our Information product offerings, we experienced 7 percent organic growth in both 2017 and 2018, primarily due to the strong performance of our pricing, indices, and valuation services offerings. Our Processing offerings declined 1 percent organically in 2018, compared to 6 percent organic revenue growth in 2017. The 2017 growth was driven by our loans processing products associated with the strong leveraged finance and syndicated loans markets, partially offset by derivatives processing decreases due to lower credit volumes. The 2018 Processing decline was due to both lower loan processing and derivative processing
41
organic revenue. Solutions organic revenue growth of 8 percent in 2017 and 9 percent in 2018 benefitted from broad-based growth across the portfolio, led by our managed loan services and EDM product offerings.
Revenue by Transaction Type
Year ended November 30, | % Change 2018 vs. 2017 | % Change 2017 vs. 2016 | ||||||||||||||||
(In millions, except percentages) | 2018 | 2017 | 2016 | |||||||||||||||
Revenue: | ||||||||||||||||||
Recurring fixed | $ | 2,861.5 | $ | 2,550.0 | $ | 2,074.5 | 12 | % | 23 | % | ||||||||
Recurring variable | 506.3 | 449.0 | 164.1 | 13 | % | N/M | ||||||||||||
Non-recurring | 641.4 | 600.7 | 496.2 | 7 | % | 21 | % | |||||||||||
Total revenue | $ | 4,009.2 | $ | 3,599.7 | $ | 2,734.8 | 11 | % | 32 | % | ||||||||
As a percent of total revenue: | ||||||||||||||||||
Recurring fixed | 71 | % | 71 | % | 76 | % | ||||||||||||
Recurring variable | 13 | % | 12 | % | 6 | % | ||||||||||||
Non-recurring | 16 | % | 17 | % | 18 | % | ||||||||||||
Recurring revenue represents a steady and predictable source of revenue for us. Recurring fixed revenue increased 6 percent organically for 2018, compared to 2017, and increased 2 percent organically for 2017, compared to 2016. Recurring variable revenue was comprised entirely of Financial Services revenue for all periods, and grew 6 percent organically in 2018 and 9 percent organically in 2017. These trends are especially important for us, as recurring revenue is at the core of our business model. Transportation recurring revenue offerings provided the largest contribution to the growth, at 11 percent organic growth for 2018 and 10 percent organic growth for 2017. Financial Services recurring revenue provided 7 percent organic growth in 2018 and 6 percent organic growth in 2017. Resources recurring offerings increased 4 percent organically in 2018 and declined 5 percent organically in 2017. CMS recurring offerings delivered 3 percent organic growth in 2018 and 1 percent organic growth in 2017.
Non-recurring revenue grew 6 percent organically in 2018 and 9 percent organically in 2017. The 2018 increase was primarily driven by strength in our automotive and Resources product offerings, while the 2017 increase was primarily driven by our automotive and Financial Services product offerings, as well as some positive contribution from Resources and the benefit from the 2017 BPVC release.
Operating Expenses
The following table shows our operating expenses and the associated percentages of revenue.
Year ended November 30, | % Change 2018 vs. 2017 | % Change 2017 vs. 2016 | |||||||||||||||
(In millions, except percentages) | 2018 | 2017 | 2016 | ||||||||||||||
Operating expenses: | |||||||||||||||||
Cost of revenue | $ | 1,495.7 | $ | 1,348.4 | $ | 1,037.7 | 11 | % | 30 | % | |||||||
SG&A expense | 1,192.8 | 1,096.0 | 907.1 | 9 | % | 21 | % | ||||||||||
Total cost of revenue and SG&A expense | $ | 2,688.5 | $ | 2,444.4 | $ | 1,944.8 | 10 | % | 26 | % | |||||||
Depreciation and amortization expense | $ | 541.2 | $ | 492.5 | $ | 335.7 | 10 | % | 47 | % | |||||||
As a percent of revenue: | |||||||||||||||||
Total cost of revenue and SG&A expense | 67 | % | 68 | % | 71 | % | |||||||||||
Depreciation and amortization expense | 13 | % | 14 | % | 12 | % | |||||||||||
Cost of Revenue and SG&A Expense
In managing our business, we evaluate our costs by type (e.g., salaries) rather than by income statement classification. The increase in absolute total costs in 2018 and 2017 was primarily due to recent acquisitions and the Merger. As a percent of revenue, cost of revenue and SG&A expense have steadily decreased since 2015, primarily because of the higher margin
42
Financial Services segment, as well as ongoing cost management and rationalization efforts associated with acquisition integration.
Within our cost of revenue and SG&A expense, stock-based compensation expense as a percentage of revenue was 6 percent, 7 percent, and 7 percent for the years ended November 30, 2018, 2017, and 2016, respectively. The higher stock-based compensation percentages in 2017 and 2016 are primarily due to the assumption and revaluation of legacy Markit outstanding awards at the Merger date and the acceleration of certain share awards associated with severance activities post-Merger.
Depreciation and Amortization Expense
Depreciation expense has been increasing primarily as a result of increases in capital expenditures for our various infrastructure and software development initiatives, as well as assets acquired through the Merger. Amortization expense has increased primarily because of intangible assets associated with the Merger and subsequent acquisitions.
Acquisition-related Costs
In 2018 and 2017, we incurred $135 million and $113 million, respectively, of costs associated with acquisitions, including employee severance charges and retention costs, contract termination costs for facility consolidations, legal and professional fees, and compensation costs of $54 million in 2018 and $10 million in 2017 related to the performance awards granted in connection with the purchase of aM. We expect to incur additional acquisition-related costs related to the aM performance awards over the next four years.
We incurred $161 million of acquisition-related costs in 2016, primarily for the Merger, including $90 million of costs related to advisory and banker fees and another $60 million for costs to achieve Merger synergy targets, including employee severance and retention costs, as well as contract termination costs primarily related to the consolidation of our legacy facilities.
Segment Adjusted EBITDA
Year ended November 30, | % Change 2018 vs. 2017 | % Change 2017 vs. 2016 | |||||||||||||||
(In millions, except percentages) | 2018 | 2017 | 2016 | ||||||||||||||
Adjusted EBITDA: | |||||||||||||||||
Resources | $ | 369.4 | $ | 360.2 | $ | 367.8 | 3 | % | (2 | )% | |||||||
Transportation | 479.3 | 408.6 | 353.3 | 17 | % | 16 | % | ||||||||||
CMS | 127.4 | 125.2 | 127.5 | 2 | % | (2 | )% | ||||||||||
Financial Services | 636.9 | 553.7 | 190.4 | 15 | % | N/M | |||||||||||
Shared services | (48.1 | ) | (57.8 | ) | (51.3 | ) | (17 | )% | 13 | % | |||||||
Total Adjusted EBITDA | $ | 1,564.9 | $ | 1,389.9 | $ | 987.7 | 13 | % | 41 | % | |||||||
As a percent of segment revenue: | |||||||||||||||||
Resources | 42 | % | 43 | % | 43 | % | |||||||||||
Transportation | 41 | % | 41 | % | 40 | % | |||||||||||
CMS | 23 | % | 23 | % | 24 | % | |||||||||||
Financial Services | 45 | % | 45 | % | 42 | % | |||||||||||
For 2017 and 2018, Adjusted EBITDA increased due to the Merger and subsequent acquisitions, profit delivery from revenue growth in Transportation and Financial Services, and ongoing cost management and rationalization efforts associated with acquisition integration.
As a percentage of segment revenue, Adjusted EBITDA improved in 2017 and remained flat in 2018 as a result of strengthening revenue results, Merger integration, business leveraging efforts, and recent acquisitions. Transportation segment Adjusted EBITDA margin increases in 2018 and 2017 were aided by margin flow through from high revenue growth in that segment, partially offset in 2018 by lower aM margins. Financial Services segment Adjusted EBITDA margin was also strengthened in 2017 and 2018 by margin flow-through from high revenue growth, partially offset in 2018 by lower Ipreo margins.
43
Provision for Income Taxes
Our effective tax rate for continuing operations for the year ended November 30, 2018 was negative 27.2 percent, compared to negative 13.4 percent in 2017 and negative 3.6 percent in 2016. The reduction in our tax rate for 2018, compared to 2017, is primarily due to net tax benefits associated with U.S. tax reform of $141 million. The reduction in our tax rate for 2017, compared to 2016, is primarily due to tax benefits associated with our capital structure, the benefit from Merger-related expenses, the release of a $29.3 million valuation allowance on tax attributes in the third quarter of 2017, and excess tax benefits on stock-based compensation.
In December 2017, the TCJA was enacted in the United States. The TCJA enacted significant changes affecting our fiscal year 2018, including, but not limited to, (1) reducing the U.S. federal corporate income tax rate to 21% and (2) imposing a one-time transition tax on certain unrepatriated earnings of foreign subsidiaries of U.S. companies that had not been previously taxed in the U.S.
The TJCA also establishes new tax provisions affecting our fiscal year 2019, including, but not limited to, (1) creating a new provision designed to tax global intangible low-tax income (“GILTI”); (2) generally eliminating U.S. federal taxes on dividends from foreign subsidiaries; (3) eliminating the corporate alternative minimum tax (“AMT”); (4) creating the base erosion anti-abuse tax (“BEAT”); (5) establishing a deduction for foreign derived intangible income ("FDII"); (6) repealing domestic production activity deduction; and (7) establishing new limitations on deductible interest expense and certain executive compensation.
The TCJA reduced the U.S. federal corporate income tax rate from 35 percent to 21 percent effective January 1, 2018. Due to our fiscal year end, the lower corporate tax rate will be phased in, resulting in a U.S. statutory federal rate of 22.19 percent for our fiscal year ending November 30, 2018 and 21 percent for subsequent fiscal years.
ASC 740, Income Taxes, requires companies to recognize the effect of the tax law changes in the period of enactment. However, the SEC staff issued Staff Accounting Bulletin No. 118 (“SAB 118”) which allowed companies to record provisional amounts during a measurement period not extending beyond one year from the TJCA enactment date. For the year ended November 30, 2018, we recognized income tax benefit related to the TCJA of $141 million which includes (1) an expense of $31 million for U.S. transition tax liability and correlative items on deemed repatriated earnings of non-U.S. subsidiaries and (2) a benefit of $172 million associated with the impact on deferred taxes resulting from the decreased U.S. federal corporate income tax rate as described below. As of November 30, 2018, we have completed the accounting for all the impacts of the TCJA.
Deemed Repatriation Transition Tax (“Transition Tax”): The Transition Tax is based on the total unrepatriated post-1986 earnings and profits (“E&P”) of our foreign subsidiaries and the amount of non-U.S. taxes paid (Tax Pools) on such earnings. Historically, we permanently reinvested a significant portion of post-1986 E&P outside the U.S. For the remaining portion, we previously accrued deferred taxes. Since the TCJA required all foreign earnings to be taxed currently, we recorded an income tax expense of $31 million for our one-time transition tax liability, which will be paid over 8 years in accordance with the election available under the TCJA. We have completed our accounting for charges related to the Transition Tax.
Reduction of U.S. Federal Corporate Tax Rate: The reduction of the U.S. federal corporate income tax rate requires that we remeasure our deferred tax assets and liabilities as of the date of enactment. The amount recorded for the year ended November 30, 2018 for the remeasurement due to tax rate change is $172 million. We have completed our accounting for the measurement of deferred taxes.
GILTI: The TCJA subjects a U.S. corporation to tax on its GILTI. U.S. GAAP allows companies to make an accounting policy election to either (1) treat taxes due on future GILTI inclusions in U.S. taxable income as a current-period expense when incurred (“period cost method”) or (2) factor such amounts into the measurement of its deferred taxes (“deferred method”). We have elected to use the period cost method.
Indefinite Reinvestment Treatment: Prior to the enactment of the TCJA, we treated a significant portion of our undistributed earnings from legacy foreign subsidiaries of IHS as indefinitely reinvested. As a result of the enactment of the TCJA, we have reevaluated our historic assertion and no longer consider certain earnings of legacy foreign subsidiaries of IHS to be indefinitely reinvested. We have recorded a deferred tax liability of $12 million for foreign withholding taxes on repatriation of remaining undistributed earnings.
44
EBITDA and Adjusted EBITDA (non-GAAP measure)
Year ended November 30, | % Change 2018 vs. 2017 | % Change 2017 vs. 2016 | |||||||||||||||
(In millions, except percentages) | 2018 | 2017 | 2016 | ||||||||||||||
Net income attributable to IHS Markit Ltd. | $ | 542.3 | $ | 416.9 | $ | 152.8 | 30 | % | 173 | % | |||||||
Interest income | (3.1 | ) | (2.2 | ) | (1.3 | ) | |||||||||||
Interest expense | 225.7 | 154.3 | 119.4 | ||||||||||||||
Benefit for income taxes | (115.4 | ) | (49.9 | ) | (5.1 | ) | |||||||||||
Depreciation | 175.1 | 157.0 | 114.8 | ||||||||||||||
Amortization | 366.1 | 335.5 | 220.9 | ||||||||||||||
EBITDA | $ | 1,190.7 | $ | 1,011.6 | $ | 601.5 | 18 | % | 68 | % | |||||||
Stock-based compensation expense | 241.7 | 261.9 | 203.9 | ||||||||||||||
Restructuring charges | 1.7 | — | 22.8 | ||||||||||||||
Acquisition-related costs | 80.7 | 103.1 | 161.2 | ||||||||||||||
Acquisition-related performance compensation | 54.1 | 9.9 | — | ||||||||||||||
Litigation charges related to class action suit | — | — | 0.1 | ||||||||||||||
Loss on debt extinguishment | 4.7 | — | 0.6 | ||||||||||||||
Gain on sale of assets | — | — | (0.7 | ) | |||||||||||||
Pension mark-to-market and settlement (gain) expense | (6.5 | ) | 5.4 | 8.4 | |||||||||||||
Share of joint venture results not attributable to Adjusted EBITDA | 0.5 | (1.2 | ) | 0.3 | |||||||||||||
Adjusted EBITDA attributable to noncontrolling interest | (2.7 | ) | (0.8 | ) | (1.2 | ) | |||||||||||
Income from discontinued operations, net | — | — | (9.2 | ) | |||||||||||||
Adjusted EBITDA | $ | 1,564.9 | $ | 1,389.9 | $ | 987.7 | 13 | % | 41 | % | |||||||
Adjusted EBITDA as a percentage of revenue | 39.0 | % | 38.6 | % | 36.1 | % | |||||||||||
Our Adjusted EBITDA margin performance increased each year primarily because of the Merger and our integration and cost management efforts, partially offset by recent acquisitions. In 2017 and 2018, we also benefitted from margin flow-through from our organic revenue growth. We expect to continue to drive margin improvement through leveraging our business model and continued focus on efficiency and cost management efforts.
Financial Condition
(In millions, except percentages) | As of November 30, 2018 | As of November 30, 2017 | Dollar change | Percent change | ||||||||||
Accounts receivable, net | $ | 792.9 | $ | 693.5 | $ | 99.4 | 14 | % | ||||||
Accrued compensation | $ | 214.1 | $ | 157.4 | $ | 56.7 | 36 | % | ||||||
Deferred revenue | $ | 886.8 | $ | 790.8 | $ | 96.0 | 12 | % | ||||||
The increase in our accounts receivable balance was primarily due to the acquisition of Ipreo, along with increased revenue in the current year. The increase in accrued compensation was due primarily to the attainment of certain performance objectives associated with our annual incentive plan as compared to the prior year, along with the acquisition of Ipreo. The increase in deferred revenue was primarily due to the acquisition of Ipreo, as well as increased billings in 2018.
Liquidity and Capital Resources
As of November 30, 2018, we had cash and cash equivalents of $120 million. Our principal sources of liquidity include cash generated by operating activities, cash and cash equivalents on the balance sheet, and amounts available under a revolving credit facility. We had approximately $5.68 billion of debt as of November 30, 2018, consisting primarily of $1.1 billion of
45
revolving facility debt, $1.31 billion of term loan debt, and $3.31 billion of senior notes. As of November 30, 2018, we had approximately $0.9 billion available under our revolving credit facility.
In 2018, we entered into the following arrangements:
• | We issued $500 million aggregate principal amount of senior unsecured notes at a 4.000 percent interest rate, due 2026. Net proceeds from this offering were used to repay amounts outstanding under our revolving credit facility. |
• | We terminated our previous revolving credit facility and associated term loans and entered into a new revolving credit facility and associated term loans. |
• | We borrowed $250 million under a 364-day credit agreement to help fund the acquisition of Ipreo, which was repaid in January 2019 using cash on hand and borrowings under the revolving credit facility. |
• | We issued $500 million aggregate principal amount of senior unsecured notes at a 4.125 percent interest rate, due 2023. Net proceeds from this offering were used to repay amounts outstanding under our revolving credit facility. |
• | We issued $750 million aggregate principal amount of senior unsecured notes at a 4.750 percent interest rate, due 2028. Net proceeds from this offering were used to repay amounts outstanding under our revolving credit facility. |
Our interest expense in each of 2016, 2017, and 2018 increased primarily because of a higher average debt balance as a result of acquisitions and share repurchases, a higher effective interest rate due to an increased amount of fixed-rate debt, financing fees incurred in conjunction with acquisition and Merger activity, and higher short-term interest rates. We expect that our interest expense will continue to be higher in 2019 compared to 2018 and 2017, primarily due to increasing debt balances and a higher percentage of fixed-rate debt as we execute additional long-term fixed-rate financing.
Our Board of Directors has authorized a share repurchase program of up to $3.25 billion of IHS Markit common shares through November 30, 2019, to be funded using our existing cash, cash equivalents, marketable securities and future cash flows, or through the incurrence of short- or long-term indebtedness, at management’s discretion. This repurchase program does not obligate us to repurchase any set dollar amount or number of shares and may be modified, suspended, or terminated at any time without prior notice. Under this program, we are authorized to repurchase our common shares on the open market from time to time, in privately negotiated transactions, or through accelerated share repurchase agreements, subject to availability of common shares, price, market conditions, alternative uses of capital, and applicable regulatory requirements, at management’s discretion. As of November 30, 2018, we had repurchased approximately $2.24 billion under this authorization.
Our Board of Directors has separately authorized, subject to applicable regulatory requirements, the repurchase of our common shares surrendered by employees in an amount equal to the exercise price, if applicable, and statutory tax liability associated with the vesting of their equity awards, for which we pay the statutory tax on behalf of the employee and forgo receipt of the exercise price of the award from the employee, if applicable. Such repurchases have been authorized in addition to the share repurchase program described above.
Based on our cash, debt, and cash flow positions, we believe we will have sufficient liquidity to meet our ongoing working capital and capital expenditure needs. Our future capital requirements will depend on many factors, including the number and magnitude of future acquisitions, amount of share repurchases, the need for additional facilities or facility improvements, the timing and extent of spending to support product development efforts, information technology infrastructure investments, investments in our internal business applications, and the continued market acceptance of our offerings. We could be required, or could elect, to seek additional funding through public or private equity or debt financings; however, additional funds may not be available on terms acceptable to us.
See “Item 8 - Financial Statements and Supplementary Data - Notes to Consolidated Financial Statements - Note 8” in Part II of this Form 10-K for additional information about our debt obligations.
Cash Flows
Year ended November 30, | % Change 2018 vs. 2017 | % Change 2017 vs. 2016 | |||||||||||||||
(In millions, except percentages) | 2018 | 2017 | 2016 | ||||||||||||||
Net cash provided by operating activities | $ | 1,289.5 | $ | 961.5 | $ | 638.3 | 34 | % | 51 | % | |||||||
Net cash used in investing activities | $ | (2,112.1 | ) | $ | (646.3 | ) | $ | (982.8 | ) | 227 | % | (34 | )% | ||||
Net cash provided by (used in) financing activities | $ | 873.0 | $ | (329.3 | ) | $ | 177.5 | N/M | N/M | ||||||||
46
Net cash provided by operating activities in 2018 increased primarily by continued increasing operating performance and working capital improvements. In 2017, net cash provided by operating activities increased significantly, primarily as a result of the Merger.
Net cash used in investing activities for 2018 increased from 2017 primarily due to the Ipreo acquisition in 2018, partially offset by lower capital expenditures compared to the prior year. Net cash used in investing activities for 2017 decreased from 2016 primarily due to lower cost acquisitions, partially offset by increased capital expenditures primarily due to the Merger.
Net cash provided by financing activities increased in 2018 primarily due to borrowings to fund the Ipreo acquisition and lower share repurchases, partially offset by lower proceeds from stock option exercises. Net cash used in financing activities in 2017 consists primarily of repurchases of common shares in the open market and for payments related to tax withholding for stock-based compensation, partially offset by increased borrowings and cash from stock option exercises.
Free Cash Flow (non-GAAP measure)
The following table reconciles our non-GAAP free cash flow measure to net cash provided by operating activities.
Year ended November 30, | % Change 2018 vs. 2017 | % Change 2017 vs. 2016 | |||||||||||||||
(In millions, except percentages) | 2018 | 2017 | 2016 | ||||||||||||||
Net cash provided by operating activities | $ | 1,289.5 | $ | 961.5 | $ | 638.3 | |||||||||||
Capital expenditures on property and equipment | (222.7 | ) | (260.2 | ) | (147.6 | ) | |||||||||||
Free cash flow | $ | 1,066.8 | $ | 701.3 | $ | 490.7 | 52 | % | 43 | % | |||||||
The increase in free cash flow was primarily due to higher net cash provided by operating activities and lower capital expenditure activity. Our free cash flow has historically been positive due to the robust cash generation attributes of our business model, and we expect that it will continue to be a significant source of funding for our business strategy of growth through organic and acquisitive means.
Credit Facility and Other Debt
Please refer to “Item 8 - Financial Statements and Supplementary Data - Notes to Consolidated Financial Statements - Note 8” in Part II of this Form 10-K for a discussion of the current status of our debt arrangements.
Share Repurchase Programs
Please refer to Part II, Item 5 and “Item 8 - Financial Statements and Supplementary Data - Notes to Consolidated Financial Statements - Note 14” in Part II of this Form 10-K for a discussion of our share repurchase programs.
Off-Balance Sheet Transactions
We have no off-balance sheet transactions.
Contractual Obligations and Commercial Commitments
We have various contractual obligations and commercial commitments that are recorded as liabilities in our consolidated financial statements. Other items, such as certain purchase commitments and other executory contracts, are not recognized as liabilities in our consolidated financial statements but are required to be disclosed. The following table summarizes our contractual obligations and commercial commitments as of November 30, 2018, along with the obligations associated with our term loans and notes, and the future periods in which such obligations are expected to be settled in cash (in millions):
47
Payment due by period | ||||||||||||||||||||
Contractual Obligations and Commercial Commitments | Total | Less than 1 year | 1 - 3 years | 3 - 5 years | More than 5 years | |||||||||||||||
Term loans, notes, and interest | $ | 5,728.1 | $ | 572.8 | $ | 1,304.2 | $ | 1,516.0 | $ | 2,335.1 | ||||||||||
Operating lease obligations | 495.9 | 74.1 | 125.4 | 95.3 | 201.1 | |||||||||||||||
Unconditional purchase obligations | 153.0 | 67.2 | 84.6 | 0.9 | 0.3 | |||||||||||||||
Total | $ | 6,377.0 | $ | 714.1 | $ | 1,514.2 | $ | 1,612.2 | $ | 2,536.5 | ||||||||||
We expect to contribute approximately $2 million to our pension and postretirement benefit plans in 2019.
Over the next one to four years, we expect to pay cash to acquire the remaining 22 percent of aM’s equity interests. The amount of cash to be paid is based on put/call provisions that tie the valuation to underlying adjusted EBITDA performance of aM. Based on our current estimates, we believe that the purchase price for the remaining equity interests will be in a range of $150 million to $175 million.
In addition to the term loans and notes, as of November 30, 2018, we also had $1.1 billion of outstanding borrowings under our $2.0 billion 2018 revolving facility at a current annual interest rate of 3.69 percent. The facility has a five-year term ending in June 2023. We also had approximately $7 million in capital lease obligations as of November 30, 2018.
Recent Accounting Pronouncements
Please refer to “Item 8 - Financial Statements and Supplementary Data - Notes to Consolidated Financial Statements - Note 2” in Part II of this Form 10-K for a discussion of recent accounting pronouncements and their anticipated effect on our business.
Item 7A. Quantitative and Qualitative Disclosures About Market Risk
Market risk refers to potential losses from adverse changes in market rates and prices. We are exposed to market risk primarily in the form of interest rate, foreign currency exchange rate, and credit risk. We actively monitor these exposures. In order to manage these exposures, we use derivative financial instruments, including interest rate swaps and foreign currency forwards. Our objective is to reduce fluctuations in revenue, earnings, and cash flows resulting from changes in interest rates and foreign currency rates. We do not use derivatives for speculative purposes.
Interest Rate Risk
As of November 30, 2018, we had no significant investments other than cash and cash equivalents and therefore we were not exposed to material interest rate risk on investments.
Our 2018 revolving facility, our 2018 term loans, and our 364-day credit agreement are subject to variable interest rates. We use interest rate swaps in order to fix a portion of our variable rate debt as part of our overall interest rate risk management strategy. As of November 30, 2018, we had $2.413 billion of floating-rate debt at a 3.76 percent weighted-average interest rate, of which $400 million was subject to effective floating-to-fixed interest rate swaps. A hypothetical increase in interest rates of 100 basis points applied to our floating rate indebtedness would increase annual interest expense by approximately $20 million ($24 million without giving effect to any of our interest rate swaps).
Foreign Currency Exchange Rate Risk
Our consolidated financial statements are expressed in U.S. dollars, but a portion of our business is conducted in currencies other than U.S. dollars. Changes in the exchange rates for such currencies into U.S. dollars can affect our revenues, earnings, and the carrying values of our assets and liabilities in our consolidated balance sheet, either positively or negatively. Fluctuations in foreign currency rates increased (decreased) our revenues by approximately $24 million, $(27) million, and $(50) million for the years ended November 30, 2018, 2017, and 2016, respectively, and had no material impact on operating income for the same respective periods. The translation effects of changes in exchange rates in our consolidated balance sheet are recorded within the cumulative translation adjustment component of our shareholders’ equity. In 2018, we recorded a cumulative translation loss of $220 million, reflecting changes in exchange rates of various currencies compared to the U.S. dollar.
48
A hypothetical ten percent change in the currencies that we are primarily exposed to would have impacted our 2018 revenue by approximately $91 million and would not have had a material impact on operating income. Approximately 75% of total revenue was earned in subsidiaries with the U.S. dollar as the functional currency.
Credit Risk
We are exposed to credit risk associated with cash equivalents, foreign currency and interest rate derivatives, and trade receivables. We do not believe that our cash equivalents or foreign currency and interest rate derivatives present significant credit risks because the counterparties to the instruments consist of major financial institutions that are financially sound, and we manage the notional amount of contracts entered into with any one counterparty. Substantially all trade receivable balances are unsecured. The concentration of credit risk with respect to trade receivables is limited by the large number of customers in our customer base and their dispersion across various industries and geographic areas. We perform ongoing credit evaluations of our customers and maintain an allowance for potential credit losses.
Item 8. | Financial Statements and Supplementary Data |
Index to Consolidated Financial Statements
Consolidated Financial Statements |
Consolidated Balance Sheets as of November 30, 2018 and 2017 |
Consolidated Statements of Operations for the Years Ended November 30, 2018, 2017, and 2016 |
Consolidated Statements of Comprehensive Income for the Years Ended November 30, 2018, 2017, and 2016 |
Consolidated Statements of Cash Flows for the Years Ended November 30, 2018, 2017, and 2016 |
Consolidated Statements of Changes in Equity for the Years Ended November 30, 2018, 2017, and 2016 |
Notes to Consolidated Financial Statements for the Years Ended November 30, 2018, 2017, and 2016 |
49
Report of Independent Registered Public Accounting Firm
To the Board of Directors and the Shareholders of IHS Markit Ltd.
Opinion on the Financial Statements
We have audited the accompanying consolidated balance sheets of IHS Markit Ltd. (the Company) as of November 30, 2018 and 2017, the related consolidated statements of operations, comprehensive income, cash flows, and changes in equity for each of the three years in the period ended November 30, 2018 and the related notes (collectively referred to as the “consolidated financial statements”). In our opinion, the consolidated financial statements present fairly, in all material respects, the financial position of the Company at November 30, 2018 and 2017, and the results of its operations and its cash flows for each of the three years in the period ended November 30, 2018, in conformity with U.S. generally accepted accounting principles.
We also have audited, in accordance with the standards of the Public Company Accounting Oversight Board (United States) (PCAOB), the Company’s internal control over financial reporting as of November 30, 2018, based on criteria established in Internal Control-Integrated Framework issued by the Committee of Sponsoring Organizations of the Treadway Commission (2013 framework) and our report dated January 18, 2019 expressed an unqualified opinion thereon.
Basis for Opinion
These financial statements are the responsibility of the Company's management. Our responsibility is to express an opinion on the Company’s financial statements based on our audits. We are a public accounting firm registered with the PCAOB and are required to be independent with respect to the Company in accordance with the U.S. federal securities laws and the applicable rules and regulations of the Securities and Exchange Commission and the PCAOB.
We conducted our audits in accordance with the standards of the PCAOB. Those standards require that we plan and perform the audit to obtain reasonable assurance about whether the financial statements are free of material misstatement, whether due to error or fraud. Our audits included performing procedures to assess the risks of material misstatement of the financial statements, whether due to error or fraud, and performing procedures that respond to those risks. Such procedures included examining, on a test basis, evidence regarding the amounts and disclosures in the financial statements. Our audits also included evaluating the accounting principles used and significant estimates made by management, as well as evaluating the overall presentation of the financial statements. We believe that our audits provide a reasonable basis for our opinion.
/s/ Ernst & Young LLP
We have served as the Company’s auditor since 2001.
Denver, Colorado
January 18, 2019
50
IHS MARKIT LTD.
CONSOLIDATED BALANCE SHEETS
(In millions, except for per-share amount)
As of | As of | ||||||
November 30, 2018 | November 30, 2017 | ||||||
Assets | |||||||
Current assets: | |||||||
Cash and cash equivalents | $ | 120.0 | $ | 133.8 | |||
Accounts receivable, net | 792.9 | 693.5 | |||||
Income tax receivable | 20.8 | 31.9 | |||||
Deferred subscription costs | 77.3 | 62.8 | |||||
Other current assets | 88.4 | 93.0 | |||||
Total current assets | 1,099.4 | 1,015.0 | |||||
Non-current assets: | |||||||
Property and equipment, net | 579.6 | 531.3 | |||||
Intangible assets, net | 4,484.8 | 4,188.3 | |||||
Goodwill | 9,836.0 | 8,778.5 | |||||
Deferred income taxes | 14.6 | 7.1 | |||||
Other | 47.9 | 34.2 | |||||
Total non-current assets | 14,962.9 | 13,539.4 | |||||
Total assets | $ | 16,062.3 | $ | 14,554.4 | |||
Liabilities and equity | |||||||
Current liabilities: | |||||||
Short-term debt | $ | 789.9 | $ | 576.0 | |||
Accounts payable | 63.8 | 53.4 | |||||
Accrued compensation | 214.1 | 157.4 | |||||
Other accrued expenses | 357.7 | 323.0 | |||||
Income tax payable | 8.0 | 5.5 | |||||
Deferred revenue | 886.8 | 790.8 | |||||
Total current liabilities | 2,320.3 | 1,906.1 | |||||
Long-term debt, net | 4,889.2 | 3,617.3 | |||||
Accrued pension and postretirement liability | 17.4 | 31.8 | |||||
Deferred income taxes | 699.9 | 869.8 | |||||
Other liabilities | 109.1 | 105.9 | |||||
Commitments and contingencies | |||||||
Redeemable noncontrolling interests | 5.9 | 19.1 | |||||
Shareholders' equity: | |||||||
Common shares, $0.01 par value, 3,000.0 authorized, 472.9 and 468.7 issued, and 397.1 and 399.2 outstanding at November 30, 2018 and November 30, 2017, respectively | 4.7 | 4.7 | |||||
Additional paid-in capital | 7,680.4 | 7,612.1 | |||||
Treasury shares, at cost: 75.8 and 69.5 at November 30, 2018 and November 30, 2017, respectively | (2,108.8 | ) | (1,745.0 | ) | |||
Retained earnings | 2,743.1 | 2,217.6 | |||||
Accumulated other comprehensive loss | (298.9 | ) | (85.0 | ) | |||
Total shareholders' equity | 8,020.5 | 8,004.4 | |||||
Total liabilities and equity | $ | 16,062.3 | $ | 14,554.4 | |||
See accompanying notes.
51
IHS MARKIT LTD.
CONSOLIDATED STATEMENTS OF OPERATIONS
(In millions, except for per-share amounts)
Year ended November 30, | ||||||||||||
2018 | 2017 | 2016 | ||||||||||
Revenue | $ | 4,009.2 | $ | 3,599.7 | $ | 2,734.8 | ||||||
Operating expenses: | ||||||||||||
Cost of revenue | 1,495.7 | 1,348.4 | 1,037.7 | |||||||||
Selling, general and administrative | 1,192.8 | 1,096.0 | 907.1 | |||||||||
Depreciation and amortization | 541.2 | 492.5 | 335.7 | |||||||||
Restructuring charges | 1.7 | — | 22.8 | |||||||||
Acquisition-related costs | 134.8 | 113.0 | 161.2 | |||||||||
Net periodic pension and postretirement expense (income) | (5.6 | ) | 6.9 | 10.0 | ||||||||
Other expense (income), net | 1.7 | 18.7 | (0.1 | ) | ||||||||
Total operating expenses | 3,362.3 | 3,075.5 | 2,474.4 | |||||||||
Operating income | 646.9 | 524.2 | 260.4 | |||||||||
Interest income | 3.1 | 2.2 | 1.3 | |||||||||
Interest expense | (225.7 | ) | (154.3 | ) | (119.4 | ) | ||||||
Non-operating expense, net | (222.6 | ) | (152.1 | ) | (118.1 | ) | ||||||
Income from continuing operations before income taxes and equity in loss of equity method investee | 424.3 | 372.1 | 142.3 | |||||||||
Benefit for income taxes | 115.4 | 49.9 | 5.1 | |||||||||
Equity in loss of equity method investee | (0.5 | ) | (5.0 | ) | (4.5 | ) | ||||||
Income from continuing operations | 539.2 | 417.0 | 142.9 | |||||||||
Income from discontinued operations, net | — | — | 9.2 | |||||||||
Net income | $ | 539.2 | $ | 417.0 | $ | 152.1 | ||||||
Net loss (income) attributable to noncontrolling interest | 3.1 | (0.1 | ) | 0.7 | ||||||||
Net income attributable to IHS Markit Ltd. | $ | 542.3 | $ | 416.9 | 152.8 | |||||||
Basic earnings per share: | ||||||||||||
Income from continuing operations attributable to IHS Markit Ltd. | $ | 1.38 | $ | 1.04 | $ | 0.46 | ||||||
Income from discontinued operations, net | — | — | 0.03 | |||||||||
Net income attributable to IHS Markit Ltd. | $ | 1.38 | $ | 1.04 | $ | 0.49 | ||||||
Weighted average shares used in computing basic earnings per share | 394.4 | 400.3 | 309.2 | |||||||||
Diluted earnings per share: | ||||||||||||
Income from continuing operations attributable to IHS Markit Ltd. | $ | 1.33 | $ | 1.00 | $ | 0.45 | ||||||
Income from discontinued operations, net | — | — | 0.03 | |||||||||
Net income attributable to IHS Markit Ltd. | $ | 1.33 | $ | 1.00 | $ | 0.48 | ||||||
Weighted average shares used in computing diluted earnings per share | 406.9 | 416.2 | 316.3 | |||||||||
See accompanying notes.
52
IHS MARKIT LTD.
CONSOLIDATED STATEMENTS OF COMPREHENSIVE INCOME
(In millions)
Year ended November 30, | ||||||||||||
2018 | 2017 | 2016 | ||||||||||
Net income | $ | 539.2 | $ | 417.0 | $ | 152.1 | ||||||
Other comprehensive income (loss), net of tax: | ||||||||||||
Net hedging activities (1) | 7.6 | 6.6 | 4.1 | |||||||||
Net pension liability adjustment (2) | 4.8 | 1.4 | (1.3 | ) | ||||||||
Foreign currency translation adjustment | (220.4 | ) | 345.8 | (250.4 | ) | |||||||
Total other comprehensive income (loss) | (208.0 | ) | 353.8 | (247.6 | ) | |||||||
Comprehensive income (loss) | $ | 331.2 | $ | 770.8 | $ | (95.5 | ) | |||||
Comprehensive loss (income) attributable to noncontrolling interest | 3.1 | (0.1 | ) | 0.7 | ||||||||
Comprehensive income (loss) attributable to IHS Markit Ltd. | $ | 334.3 | $ | 770.7 | $ | (94.8 | ) | |||||
(1) Net of tax expense of $1.8, $1.7, and $2.8 for the years ended November 30, 2018, 2017, and 2016, respectively. | ||||||||||||
(2) Net of tax (expense) benefit of $(1.1), $(1.2), and $0.6 for the years ended November 30, 2018, 2017, and 2016, respectively. | ||||||||||||
See accompanying notes.
53
IHS MARKIT LTD.
CONSOLIDATED STATEMENTS OF CASH FLOWS
(In millions)
Year ended November 30, | |||||||||||
2018 | 2017 | 2016 | |||||||||
Operating activities: | |||||||||||
Net income | $ | 539.2 | $ | 417.0 | $ | 152.1 | |||||
Reconciliation of net income to net cash provided by operating activities: | |||||||||||
Depreciation and amortization | 541.2 | 492.5 | 335.7 | ||||||||
Stock-based compensation expense | 241.7 | 261.9 | 206.2 | ||||||||
Gain on sale of business | — | — | (41.5 | ) | |||||||
Excess tax benefit from stock-based compensation | — | — | (5.6 | ) | |||||||
Net periodic pension and postretirement expense (income) | (5.6 | ) | 6.9 | 10.0 | |||||||
Undistributed (income) loss of affiliates, net | (0.8 | ) | 5.2 | 2.9 | |||||||
Pension and postretirement contributions | (2.6 | ) | (5.7 | ) | (5.7 | ) | |||||
Deferred income taxes | (211.7 | ) | (100.1 | ) | 6.7 | ||||||
Change in assets and liabilities: | |||||||||||
Accounts receivable, net | (11.8 | ) | (27.5 | ) | (8.5 | ) | |||||
Other current assets | (2.2 | ) | (34.6 | ) | 12.3 | ||||||
Accounts payable | 10.9 | (20.0 | ) | (12.5 | ) | ||||||
Accrued expenses | 104.1 | (42.8 | ) | 35.6 | |||||||
Income tax | 23.5 | (14.7 | ) | (44.7 | ) | ||||||
Deferred revenue | 26.6 | 4.7 | (14.6 | ) | |||||||
Other liabilities | 37.0 | 18.7 | 9.9 | ||||||||
Net cash provided by operating activities | 1,289.5 | 961.5 | 638.3 | ||||||||
Investing activities: | |||||||||||
Capital expenditures on property and equipment | (222.7 | ) | (260.2 | ) | (147.6 | ) | |||||
Acquisitions of businesses, net of cash acquired | (1,876.2 | ) | (401.1 | ) | (1,014.4 | ) | |||||
Proceeds from sale of business | — | — | 190.9 | ||||||||
Change in other assets | (6.2 | ) | 0.5 | (4.5 | ) | ||||||
Settlements of forward contracts | (7.0 | ) | 14.5 | (7.2 | ) | ||||||
Net cash used in investing activities | (2,112.1 | ) | (646.3 | ) | (982.8 | ) | |||||
Financing activities: | |||||||||||
Proceeds from borrowings | 4,617.0 | 3,194.5 | 4,018.0 | ||||||||
Repayment of borrowings | (3,122.6 | ) | (2,381.2 | ) | (3,364.8 | ) | |||||
Payment of debt issuance costs | (30.8 | ) | (14.4 | ) | (22.8 | ) | |||||
Payments for purchase of noncontrolling interests | (10.1 | ) | (57.0 | ) | — | ||||||
Proceeds from noncontrolling interests | — | 7.5 | — | ||||||||
Contingent consideration payments | (43.0 | ) | (2.6 | ) | — | ||||||
Repurchases of common shares | (672.5 | ) | (1,317.8 | ) | (570.0 | ) | |||||
Proceeds from the exercise of employee stock options | 230.0 | 331.6 | 147.3 | ||||||||
Payments related to tax withholding for stock-based compensation | (95.0 | ) | (89.9 | ) | (35.8 | ) | |||||
Excess tax benefit from stock-based compensation | — | — | 5.6 | ||||||||
Net cash provided by (used in) financing activities | 873.0 | (329.3 | ) | 177.5 | |||||||
Foreign exchange impact on cash balance | (64.2 | ) | 9.0 | 12.8 | |||||||
Net decrease in cash and cash equivalents | (13.8 | ) | (5.1 | ) | (154.2 | ) | |||||
Cash and cash equivalents at the beginning of the period | 133.8 | 138.9 | 293.1 | ||||||||
Cash and cash equivalents at the end of the period | $ | 120.0 | $ | 133.8 | $ | 138.9 | |||||
See accompanying notes.
54
IHS MARKIT LTD.
CONSOLIDATED STATEMENTS OF CHANGES IN EQUITY
(In millions)
Common Shares | Additional Paid-In Capital | Accumulated Other Comprehensive Loss | Total Shareholders’ Equity | Redeemable Noncontrolling Interests | |||||||||||||||||||||||||||
Shares Outstanding | Amount | Treasury Shares | Retained Earnings | ||||||||||||||||||||||||||||
Balance at November 30, 2015 | 240.2 | $ | 2.5 | $ | 1,051.3 | $ | (317.0 | ) | $ | 1,655.3 | $ | (191.2 | ) | $ | 2,200.9 | $ | — | ||||||||||||||
Repurchases of common shares | (17.1 | ) | — | — | (570.0 | ) | — | — | (570.0 | ) | — | ||||||||||||||||||||
Common shares issued in connection with the Merger | 182.8 | 2.0 | 6,245.4 | — | — | — | 6,247.4 | — | |||||||||||||||||||||||
Noncontrolling interest acquired through the Merger | — | — | — | — | — | — | — | 57.2 | |||||||||||||||||||||||
Cancellation of treasury shares | — | — | (420.2 | ) | 420.2 | — | — | — | — | ||||||||||||||||||||||
Share-based award activity | 2.7 | — | 183.7 | (32.3 | ) | — | — | 151.4 | — | ||||||||||||||||||||||
Option exercises | 6.4 | — | 147.3 | — | — | — | 147.3 | — | |||||||||||||||||||||||
Excess tax benefit on vested shares | — | — | 3.4 | — | — | — | 3.4 | — | |||||||||||||||||||||||
Net income | — | — | — | — | 152.8 | — | 152.8 | (0.7 | ) | ||||||||||||||||||||||
Noncontrolling interest activity | — | — | — | — | (1.2 | ) | — | (1.2 | ) | 1.2 | |||||||||||||||||||||
Other comprehensive loss | — | — | — | — | — | (247.6 | ) | (247.6 | ) | — | |||||||||||||||||||||
Balance at November 30, 2016 | 415.0 | 4.5 | 7,210.9 | (499.1 | ) | 1,806.9 | (438.8 | ) | 8,084.4 | 57.7 | |||||||||||||||||||||
Repurchases of common shares | (32.3 | ) | — | — | (1,317.8 | ) | — | — | (1,317.8 | ) | — | ||||||||||||||||||||
Share-based award activity | 2.3 | 0.1 | 68.7 | 71.9 | — | — | 140.7 | — | |||||||||||||||||||||||
Option exercises | 14.2 | 0.1 | 332.5 | — | — | — | 332.6 | — | |||||||||||||||||||||||
Net income | — | — | — | — | 416.9 | — | 416.9 | 0.1 | |||||||||||||||||||||||
Issuance of noncontrolling interests | — | — | — | — | — | — | — | 10.0 | |||||||||||||||||||||||
Purchase of noncontrolling interests | — | — | — | — | — | — | — | (57.0 | ) | ||||||||||||||||||||||
Other noncontrolling interest activity | — | — | — | — | (6.2 | ) | — | (6.2 | ) | 8.3 | |||||||||||||||||||||
Other comprehensive income | — | — | — | — | — | 353.8 | 353.8 | — | |||||||||||||||||||||||
Balance at November 30, 2017 | 399.2 | 4.7 | 7,612.1 | (1,745.0 | ) | 2,217.6 | (85.0 | ) | 8,004.4 | 19.1 | |||||||||||||||||||||
Repurchases of common shares | (14.2 | ) | — | — | (672.5 | ) | — | — | (672.5 | ) | — | ||||||||||||||||||||
Share-based award activity | 2.5 | — | (162.9 | ) | 308.7 | (22.7 | ) | — | 123.1 | — | |||||||||||||||||||||
Option exercises | 9.6 | — | 231.2 | — | — | — | 231.2 | — | |||||||||||||||||||||||
Net income (loss) | — | — | — | — | 542.3 | — | 542.3 | (3.1 | ) | ||||||||||||||||||||||
Impact of the Tax Cuts and Jobs Act of 2017 | — | — | — | — | 5.9 | (5.9 | ) | — | — | ||||||||||||||||||||||
Purchase of noncontrolling interests | — | — | — | — | — | — | — | (10.1 | ) | ||||||||||||||||||||||
Other comprehensive loss | — | — | — | — | — | (208.0 | ) | (208.0 | ) | — | |||||||||||||||||||||
Balance at November 30, 2018 | 397.1 | $ | 4.7 | $ | 7,680.4 | $ | (2,108.8 | ) | $ | 2,743.1 | $ | (298.9 | ) | $ | 8,020.5 | $ | 5.9 | ||||||||||||||
See accompanying notes.
55
IHS MARKIT LTD.
NOTES TO CONSOLIDATED FINANCIAL STATEMENTS
1. | Nature of Business |
On July 12, 2016, IHS Inc. (“IHS”), a Delaware corporation, Markit Ltd. (“Markit”), a Bermuda exempted company, and Marvel Merger Sub, Inc. (“Merger Sub”), a Delaware corporation and an indirect and wholly owned subsidiary of Markit, completed a merger (“Merger”) pursuant to which Merger Sub merged with and into IHS, with IHS surviving the Merger as an indirect and wholly owned subsidiary of Markit. Upon completion of the Merger, Markit became the combined group holding company and was renamed IHS Markit Ltd. (“IHS Markit” or “we” or “us” or “our”). In accordance with the terms of the Merger agreement, IHS stockholders received 3.5566 common shares of IHS Markit for each share of IHS common stock they owned and IHS Inc. common stock was delisted from the New York Stock Exchange and deregistered under the Securities Exchange Act.
The Merger has been accounted for as a business combination in accordance with Accounting Standards Codification (“ASC”) Topic 805. This standard requires that one of the two companies in the Merger be designated as the acquirer for accounting purposes based on the evidence available. We have treated IHS as the acquiring entity for accounting purposes, and accordingly, the Markit assets acquired and liabilities assumed have been adjusted based on fair value at the consummation of the Merger. Any excess of the purchase price over the fair value of identified assets acquired and liabilities assumed has been recognized as goodwill. In identifying IHS as the acquiring entity for accounting purposes, IHS Markit took into account the voting rights of all equity instruments, the intended corporate governance structure of the combined company, and the size of each of the companies. In assessing the size of each of the companies, IHS Markit evaluated various metrics, including, but not limited to: assets, revenue, operating income, EBITDA, Adjusted EBITDA, market capitalization, and enterprise value. No single factor was the sole determinant in the overall conclusion that IHS is the acquirer for accounting purposes; rather, all factors were considered in arriving at our conclusion.
Our segments are organized to address customer needs by industry, as follows:
•Resources, which includes our Energy and Chemicals product offerings;
• | Transportation, which includes our Automotive; Maritime & Trade; and Aerospace, Defense & Security product offerings; |
• | Consolidated Markets & Solutions (“CMS”), which includes our Product Design; Technology, Media & Telecom; and Economics & Country Risk product offerings; and |
• | Financial Services, which includes our Information, Processing, and Solutions product offerings, as well as our product offerings from Ipreo, our recent acquisition. |
We offer the majority of our products and services through recurring fixed and variable fee arrangements, and this business model has historically delivered stable revenue and predictable cash flows.
Our business has seasonal aspects. Our first quarter generally has our lowest quarterly levels of revenue and profit. We also experience event-driven seasonality in our business; for instance, CERAWeek, an annual energy conference, is typically held in the second quarter of each year. Another example is the biennial release of the Boiler Pressure Vessel Code (“BPVC”) engineering standard, which generates revenue for us predominantly in the third quarter of every other year. The most recent BPVC release was in the third quarter of 2017.
2. | Significant Accounting Policies |
Fiscal Year End
Our fiscal year ends on November 30 of each year. References herein to individual years mean the year ended November 30. For example, 2018 means the year ended November 30, 2018.
Consolidation Policy
The consolidated financial statements include the accounts of all wholly owned and majority-owned subsidiaries. All significant intercompany accounts and transactions have been eliminated in consolidation.
In July 2014, Markit acquired a controlling stake in Compliance Technologies International LLP (“CTI”). At the time of the acquisition, a back-to-back put/call option for the shares held by the noncontrolling interest was established, with the earliest exercise date being July 2017. Subsequent to the Merger, the put/call option was accounted for as mezzanine equity, with current income or loss being recorded as an adjustment to the mezzanine equity balance and the mezzanine equity balance
56
accreting value up to the earliest redemption date. In October 2017, we purchased a majority of the remaining noncontrolling interest for approximately $57 million, and in December 2017, we purchased the remaining noncontrolling interest for approximately $10 million.
In May 2017, we sold a redeemable noncontrolling interest in a small limited liability company we own. The units issued to the noncontrolling interests include put/call options, and we have determined that the noncontrolling interests should be reported as mezzanine equity. The carrying value for this interest as of November 30, 2018 approximates fair value.
Use of Estimates
The preparation of financial statements in conformity with U.S. GAAP requires that we make estimates and assumptions that affect the reported amounts of assets and liabilities and disclosure of contingent assets and liabilities at the date of the financial statements, as well as the reported amounts of revenues and expenses during the reporting period. Significant estimates have been made in areas that include valuation of acquired long-lived and intangible assets and goodwill, income taxes, pension accounting, allowance for doubtful accounts, long-term compensation arrangements, and stock-based compensation. Actual results could differ from those estimates.
Concentration of Credit Risk
We are exposed to credit risk associated with cash equivalents, foreign currency and interest rate derivatives, and trade receivables. We do not believe that our cash equivalents or derivatives present significant credit risks because the counterparties to the instruments consist of major financial institutions that are financially sound or have been capitalized by the U.S. government, and we manage the notional amount of contracts entered into with any counterparty. Substantially all trade receivable balances are unsecured. The concentration of credit risk with respect to trade receivables is limited by the large number of customers in our customer base and their dispersion across various industries and geographic areas. We perform ongoing credit evaluations of our customers and maintain an allowance for probable credit losses. The allowance is based upon management’s assessment of known credit risks as well as general industry and economic conditions. Specific accounts receivable are written off upon notification of bankruptcy or once the account is significantly past due and our collection efforts are unsuccessful.
Segments
We periodically reassess our identification of operating segments. In 2016, as a result of the Merger, we created the Financial Services segment. Our chief operating decision maker (“CODM”) reviews operating results at the Resources, Transportation, CMS, and Financial Services segment level when determining how to allocate resources and assess performance.
Fair Value Measurements
Fair value is determined based on the assumptions that market participants would use in pricing the asset or liability. We utilize the following fair value hierarchy in determining fair values:
Level 1 – Quoted prices for identical assets or liabilities in active markets.
Level 2 – Inputs other than quoted prices within Level 1 that are observable either directly or indirectly, including quoted prices in markets that are not active, quoted prices in active markets for similar assets or liabilities, and observable inputs other than quoted prices such as interest rates or yield curves.
Level 3 – Unobservable inputs reflecting our view about the assumptions that market participants would use in pricing the asset or liability.
Our cash, accounts receivable, and accounts payable are all short-term in nature; therefore, the carrying value of these items approximates their fair value. The carrying value of our debt instruments other than our senior notes approximate their fair value because of the variable interest rate associated with those instruments. The fair value of the senior notes is included in Note 8, and is measured using observable inputs in markets that are not active; consequently, we have classified the senior notes within Level 2 of the fair value hierarchy. Our derivatives, as further described in Note 7, are measured at fair value on a recurring basis by reference to similar transactions in active markets and observable inputs other than quoted prices; consequently, we have classified those financial instruments within Level 2 of the fair value hierarchy. Our pension plan assets, as further described in Note 11, are measured at fair value on a recurring basis by reference to similar assets in active markets and are therefore also classified within Level 2 of the fair value hierarchy.
Revenue Recognition
57
Revenue is recognized when all of the following criteria have been met: (a) persuasive evidence of an arrangement exists, (b) delivery has occurred or services have been rendered, (c) the price to the customer is fixed or determinable, and (d) collectibility is reasonably assured.
The majority of our offerings are provided under recurring agreements containing standard terms and conditions. A significant proportion of our revenue is derived from these recurring revenue arrangements, which are initially deferred and then recognized ratably as delivered over the term of the agreement for annual contractual periods billed up front, or is billed and recognized on a monthly basis. For recurring revenue, the timing of our cash flows generally precedes the recognition of revenue and income due to the receipt of payment in advance of delivering our services. In recurring revenue arrangements that are based on volume usage, we recognize revenue in line with the usage in the period. Customers are invoiced on a monthly or quarterly basis to reflect actual usage under these arrangements.
Revenue is recognized upon delivery for non-recurring sales.
In certain locations, we use dealers to distribute our product offerings. For recurring product offerings sold through dealers, revenue is recognized ratably as delivered to the end user over the term of the agreement. For non-recurring product offerings sold through dealers, revenue is recognized upon delivery to the dealer.
We do not defer revenue for the limited number of recurring sales where we act as a sales agent for third parties and have no continuing responsibility to maintain and update the underlying database. We recognize this revenue on a net basis upon the sale of these products and delivery of the information and tools.
Services
We provide our customers with service offerings that are primarily sold on a stand-alone basis. Our service offerings are generally separately priced in a standard price book. For services that are not in a standard price book, as the price varies based on the nature and complexity of the service offering, pricing is based on the estimated amount of time to be incurred at standard billing rates for the estimated underlying effort for executing the associated deliverable in the contract. Revenue related to services performed under time-and-material-based contracts is recognized in the period performed at standard billing rates. Revenue associated with fixed-price contracts is recognized upon completion of each specified performance obligation. See discussion of “multiple-element arrangements” below. If the contract includes acceptance contingencies, revenue is recognized in the period in which we receive documentation of acceptance from the customer.
Software
In addition to meeting the standard revenue recognition criteria described above, revenue from software arrangements must also meet the requirement that vendor-specific objective evidence (“VSOE”) of the fair value of undelivered elements exists. As a significant portion of our software licenses are sold in multiple-element arrangements that include either maintenance or, in more limited circumstances, both maintenance and professional services, we use the residual method to determine the amount of license revenue to be recognized. Under the residual method, consideration is allocated to undelivered elements based upon VSOE of the fair value of those elements, with the residual of the arrangement fee allocated to and recognized as license revenue. We recognize perpetual license revenue upon delivery or acceptance, with maintenance revenue recognized ratably over the maintenance period. We typically recognize term license revenue over the contractual period. Delivery for software sales is deemed to occur upon electronic delivery of the license key to the end user. We have established VSOE of the fair value of maintenance through independent maintenance renewals, which demonstrate a consistent relationship of pricing maintenance as a percentage of the discounted or undiscounted perpetual license list price. VSOE of the fair value of professional services is established based on daily rates when sold on a stand-alone basis.
Multiple-element arrangements
Occasionally, we may execute contracts with customers which contain multiple offerings. In our business, multiple-element arrangements refer to contracts with separate fees for subscription offerings, maintenance, and/or related services. We have established separate units of accounting as each offering is primarily sold on a stand-alone basis. Using the relative selling price method, each element of the arrangement is allocated based generally on stand-alone sales of these products and services, which constitutes our best estimate of stand-alone selling price. We do not use any other factors, inputs, assumptions, or methods to determine an estimated selling price. We recognize the elements of the contract as follows:
• | Recurring offerings and license fees are recognized ratably over the license period as long as there is an associated licensing period or a future obligation; otherwise, revenue is recognized upon delivery. |
• | For non-recurring offerings of a multiple-element arrangement, the revenue is generally recognized for each element in the period in which delivery of the product to the customer occurs, completion of services occurs or, for post-contract support, ratably over the term of the maintenance period. |
58
• | In some instances, customer acceptance is required for consulting services rendered. For those transactions, the service revenue component of the arrangement is recognized in the period that customer acceptance is obtained. |
Adoption of ASU 2014-09 and related amendments
In May 2014, the Financial Accounting Standards Board (“FASB”) issued Accounting Standards Update (“ASU”) 2014-09, which establishes a comprehensive new revenue recognition model designed to depict the transfer of goods or services to a customer in an amount that reflects the consideration the entity expects to receive in exchange for those goods or services. In March, April, and May 2016, the FASB issued ASU 2016-08, ASU 2016-10, and ASU 2016-12, respectively, which provide further revenue recognition guidance related to principal versus agent considerations, performance obligations and licensing, and narrow-scope improvements and practical expedients. We will adopt the new revenue guidance on December 1, 2018, using the modified retrospective transition method, which results in a cumulative effect adjustment to the opening balance of retained earnings as of the date of adoption, and application of the provisions of the guidance prospectively. We currently estimate an increase of approximately $50 million to the opening balance of retained earnings for this transition for the change in revenue recognition, primarily related to the change in accounting for the license rights associated with term-based software license arrangements, which were historically recognized over the term of the contract, but will now be recognized at contract inception based on estimated stand-alone selling price. Additionally, the new guidance specifies that all incremental costs of obtaining a contract and the direct costs of fulfilling a contract with customers should be deferred and recognized over the contract period or expected customer life; we are still assessing the impact of this guidance on our consolidated financial statements.
In addition to disclosures about the transition adjustment, we will also be required to provide enhanced disclosures in 2019, including revenue recognition policies, revenue disaggregation, and contract asset and liability accounts. We are currently finalizing the transition adjustment, as well as the quantitative and qualitative information necessary to provide the incremental disclosures required in our first quarter 2019 consolidated financial statements.
Cash and Cash Equivalents
We consider all highly liquid investments purchased with an original maturity of three months or less to be cash equivalents. Cash equivalents are carried at cost, which approximates fair value.
Deferred Subscription Costs
Deferred subscription costs represent royalties and certain dealer commissions associated with customer subscriptions. These costs are deferred and amortized to expense over the period of the subscriptions.
Property and Equipment
Property and equipment is stated at cost. Depreciation is recorded using the straight-line method over the estimated useful lives of the assets as follows:
Buildings and improvements | 7 | to | 30 | years | |
Capitalized software | 3 | to | 7 | years | |
Computers and office equipment | 3 | to | 10 | years | |
Leasehold improvements are depreciated over the shorter of their estimated useful life or the life of the lease. Maintenance, repairs, and renewals of a minor nature are expensed as incurred. Betterments and major renewals which extend the useful lives of buildings, improvements, and equipment are capitalized. We also capitalize certain software development costs in accordance with ASC 350-40, “Accounting for Costs of Computer Software Developed or Obtained for Internal Use” and ASC 985-20, “Software to be Sold, Leased or Otherwise Marketed.”
We review the carrying amounts of long-lived assets such as property and equipment whenever current events or circumstances indicate their value may be impaired. A long-lived asset with a finite life is considered to be impaired if its carrying value exceeds the estimated future undiscounted cash flows to be derived from it. Any impairment is measured by the amount that the carrying value of such assets exceeds their fair value, primarily based on estimated discounted cash flows. Considerable management judgment is necessary to estimate the fair value of assets. Assets to be disposed of are carried at the lower of their financial statement carrying amount or fair value, less cost to sell.
Leases
59
In certain circumstances, we enter into leases with free rent periods, tenant improvement allowances, and rent escalations over the term of the lease. In such cases, we calculate the total payments over the term of the lease and record them ratably as rent expense over that term.
Intangible Assets and Goodwill
We account for our business combinations using the purchase method of accounting. We allocate the total cost of an acquisition to the underlying net assets based on their respective estimated fair values. As part of this allocation process, we must identify and attribute values and estimated lives to the intangible assets acquired.
Finite-lived intangible assets
Identifiable intangible assets with finite lives are generally amortized on a straight-line basis over their respective lives, as follows:
Information databases | 4 | to | 15 | years | |
Customer relationships | 5 | to | 25 | years | |
Developed technology | 5 | to | 15 | years | |
Developed computer software | 8 | to | 10 | years | |
Trademarks | 3 | to | 15 | years | |
Other | 3 | to | 5 | years | |
We review the carrying amount of finite-lived intangible assets at least annually to determine whether current events or circumstances indicate a triggering event which could require an adjustment to the carrying amount. A finite-lived intangible asset is considered to be impaired if its carrying value exceeds the estimated future undiscounted cash flows to be derived from it. We exercise judgment in selecting the assumptions used in the estimated future undiscounted cash flows analysis. Any impairment is measured by the amount that the carrying value of such assets exceeds their fair value. We did not identify any impairment in the fiscal years ended November 30, 2018, 2017, and 2016.
Goodwill
We review the carrying amount of goodwill at least annually to determine whether current events or circumstances indicate a triggering event which could require an adjustment to the carrying amount. We test goodwill for impairment on a reporting unit level. A reporting unit is a group of businesses (i) for which discrete financial information is available and (ii) that have similar economic characteristics. We determined that we have six reporting units for 2018. We use both qualitative and quantitative analysis to determine whether we believe it is more likely than not that goodwill has been impaired. In 2018 and 2017, we used a qualitative analysis in determining that no impairment indicators were present. In 2016, we tested goodwill for impairment quantitatively by determining the fair value of each reporting unit and comparing it to the reporting unit’s carrying value. We determined the fair value of our reporting units based on projected future discounted cash flows, which, in turn, were based on our views of uncertain variables such as growth rates, anticipated future economic conditions, and the appropriate discount rates relative to risk and estimates of residual values. We did not identify any impairment in the fiscal years ended November 30, 2018, 2017, and 2016.
Income Taxes
Deferred income taxes are provided using tax rates enacted for periods of expected reversal on all temporary differences. Temporary differences relate to differences between the book and tax basis of assets and liabilities, principally intangible assets, property and equipment, deferred revenue, pension and other postretirement benefits, accruals, and stock-based compensation. Valuation allowances are established to reduce deferred tax assets to the amount that will more likely than not be realized. To the extent that a determination is made to establish or adjust a valuation allowance, the expense or benefit is recorded in the period in which the determination is made.
Judgment is required in determining the worldwide provision for income taxes. Additionally, the income tax provision is based on calculations and assumptions that are subject to examination by many different tax authorities and to changes in tax law and rates in many jurisdictions. We record tax benefits when it is more likely than not that the tax benefits will be sustained upon examination by tax authorities. We adjust our income tax provision in the period in which it becomes probable that actual results will differ from our estimates.
Pension Accounting
During the fourth quarter of each fiscal year (or upon any other remeasurement date), we immediately recognize net actuarial gains or losses in excess of a corridor in our operating results. The corridor amount is equivalent to 10 percent of the
60
greater of the market-related value of plan assets or the plan’s benefit obligation at the beginning of the year. We use the actual fair value of plan assets at the measurement date as the measure of the market-related value of plan assets.
Treasury Shares
Treasury share purchases, whether through share withholdings for taxes or repurchase programs and transactions, are recorded at cost. Issuances from treasury shares are recorded using the weighted-average cost method.
Earnings per Share
Basic earnings per share (“EPS”) is computed by dividing net income by the weighted-average number of common shares outstanding during the period. Diluted EPS is computed using the weighted-average number of common shares and dilutive potential common shares outstanding during the period. Diluted EPS reflects the potential dilution that could occur if securities were exercised or converted into common shares.
Advertising Costs
Production costs are expensed as of the first date that the advertisements take place. Advertising expense was approximately $59.7 million, $55.5 million, and $50.8 million for the years ended November 30, 2018, 2017, and 2016, respectively, and was primarily comprised of advertising for CARFAX.
Foreign Currency
The functional currency of each of our foreign subsidiaries is typically such subsidiary’s local currency. Assets and liabilities are translated at period-end exchange rates. Income and expense items are translated at weighted-average rates of exchange prevailing during the year. Any translation adjustments are included in other comprehensive income. Transactions executed in currencies other than a subsidiary’s functional currency (which result in exchange adjustments) are remeasured at spot rates and resulting foreign-exchange-transaction gains and losses are included in the results of operations.
Stock-based Compensation
All stock-based awards are recognized in the income statement based on their grant date fair values. Compensation expense is recognized net of estimated forfeitures. We adjust compensation expense in future periods if actual forfeitures differ from our estimates. Our forfeiture rate is based upon historical experience as well as anticipated employee turnover considering certain qualitative factors. We amortize the value of stock-based awards to expense over the vesting period on a straight-line basis. For awards with performance conditions, we evaluate the probability of the number of shares that are expected to vest, and compensation expense is then adjusted to reflect the number of shares expected to vest and the cumulative vesting period met to date.
In March 2016, the FASB issued ASU 2016-09, which impacts the accounting for stock-based compensation. We early adopted the standard in the first quarter of our fiscal 2017. As a result of the adoption, for 2017 and 2018, excess tax benefits or deficiencies associated with stock-based compensation award activity are reflected in income tax expense in the consolidated statements of operations; for 2016, excess tax benefits and deficiencies are reported as a component of additional paid-in capital. In addition, excess tax benefits associated with award activity are now classified as cash flows from operating activities along with all other income tax cash flows, and we have elected to apply this classification change on a prospective basis.
Reclassifications
Certain reclassifications have been made to prior period amounts to conform to the current year presentation.
Recent Accounting Pronouncements
In February 2016, the FASB issued ASU 2016-02, which requires that lease assets and lease liabilities be recognized on the balance sheet, and that key information about leasing arrangements be disclosed. The ASU requires the use of a modified retrospective transition method. The standard will be effective for us in the first quarter of our fiscal 2020, although early adoption is permitted. We are currently evaluating the impact of this new standard on our consolidated financial statements, but believe that the most significant impact of adoption will be the recognition of right-of-use assets and lease liabilities associated with our operating leases.
In August 2016, the FASB issued ASU 2016-15, which clarifies how certain cash receipts and cash payments are presented and classified in the statement of cash flows. The ASU should be applied using a retrospective transition method to each period presented. The standard will be effective for us in the first quarter of our fiscal 2019, although early adoption is permitted. We do not expect that the adoption of this ASU will have a significant impact on our consolidated financial statements.
61
In January 2017, the FASB issued ASU 2017-01, which clarifies the definition of a business to assist entities with evaluating whether transactions should be accounted for as acquisitions (or disposals) of assets or businesses. The standard will be effective for us in the first quarter of our fiscal 2019. We do not expect that the adoption of this ASU will have a significant impact on our consolidated financial statements.
In January 2017, the FASB issued ASU 2017-04, which removes Step 2 from the goodwill impairment test. The standard will be effective for us in the first quarter of our fiscal 2021, although early adoption is permitted. We do not expect that the adoption of this ASU will have a significant impact on our consolidated financial statements.
In March 2017, the FASB issued ASU 2017-07, which requires that the service cost component of pension expense be included in the same line item as other compensation costs arising from services rendered by employees, with the other components of pension expense being classified outside of a subtotal of income from operations. The standard will be effective for us in the first quarter of our fiscal year 2019. We do not expect that the adoption of this ASU will have a significant impact on our consolidated financial statements.
In May 2017, the FASB issued ASU 2017-09, which provides guidance about which changes to the terms or conditions of a share-based payment award require an entity to apply modification accounting in Topic 718. The standard will be effective for us in the first quarter of our fiscal year 2019. We do not expect that the adoption of this ASU will have a significant impact on our consolidated financial statements.
In June 2018, the FASB issued ASU 2018-07, which simplifies the accounting for nonemployee share-based payment transactions. The amendments specify that Topic 718 applies to all share-based payment transactions in which a grantor acquires goods or services to be used or consumed in a grantor’s own operations by issuing share-based payment awards. The standard will be effective for us in the first quarter of our fiscal year 2020, although early adoption is permitted (but no sooner than the adoption of Topic 606). We do not expect that the adoption of this ASU will have a significant impact on our consolidated financial statements.
In August 2018, the FASB issued ASU 2018-15, which addresses the accounting for implementation costs associated with a hosted service. The standard provides that implementation costs be evaluated for capitalization using the same criteria as that used for internal-use software development costs, with amortization expense being recorded in the same income statement expense line as the hosted service costs and over the expected term of the hosting arrangement. The standard will be effective for us in the first quarter of our fiscal 2021, although early adoption is permitted. The amendments will be applied either retrospectively or prospectively to all implementation costs incurred after the date of adoption. We do not expect that the adoption of this ASU will have a significant impact on our consolidated financial statements.
3. | Business Combinations |
During the year ended November 30, 2018, we completed the following acquisitions:
Ipreo. In August 2018, we completed our acquisition of Ipreo, a leading financial services solutions and data provider, for approximately $1.86 billion. Ipreo supports market participants in the capital-raising process, including banks, public and private companies, and institutional and individual investors, as well as research, asset management, and wealth management firms. The acquisition of Ipreo helps us expand our core businesses and provides us with the potential to grow in the alternatives segment with a focus on delivering tools for greater transparency and efficiency. This acquisition is included in our Financial Services segment.
DeriveXperts. In April 2018, we acquired DeriveXperts, a provider of valuation services for OTC derivatives and other complex financial securities, for approximately $9 million. This acquisition complements and enhances our existing derivatives data and valuations products.
PetroChem Wire. In August 2018, we acquired PetroChem Wire LLC, a daily, independent publication that creates global awareness of the U.S. NGLs, olefins, and polymers markets by providing useful and clear information at the close of each business day, for approximately $8 million. This acquisition complements our existing OPIS product offerings.
The purchase price allocation for these acquisitions is preliminary and may change upon completion of the determination of fair value of assets acquired and liabilities assumed. The following table summarizes the preliminary purchase price allocation, net of acquired cash, for these acquisitions (in millions):
62
Total | |||
Assets: | |||
Current assets | $ | 98.8 | |
Property and equipment | 11.8 | ||
Intangible assets | 745.3 | ||
Goodwill | 1,184.9 | ||
Other assets | 5.2 | ||
Total assets | 2,046.0 | ||
Liabilities: | |||
Current liabilities | 35.6 | ||
Deferred revenue | 79.9 | ||
Deferred taxes | 53.4 | ||
Total liabilities | 168.9 | ||
Purchase price | $ | 1,877.1 | |
Of the goodwill recorded for the 2018 business combinations, approximately $636.3 million is tax deductible.
During the year ended November 30, 2017, we completed the following acquisitions:
automotiveMastermind Inc. (“aM”). On September 25, 2017, we acquired automotiveMastermind Inc., a leading provider of predictive analytics and marketing automation software for the automotive industry. The purchase price consisted of initial cash consideration of approximately $432 million for 78% of aM, which includes an estimated $43 million contingent consideration payment based on underlying business performance through January 2018, to be paid in the second quarter of 2018. The contingent consideration liability is recorded within other current liabilities in our consolidated balance sheet. The acquisition of aM helps to fill out our existing automotive offerings by leveraging predictive analytics to improve the buyer experience in the new car dealer market. This acquisition is included in our Transportation segment.
In exchange for the remaining 22 percent of aM, we issued equity interests in aM’s immediate parent holding company to aM’s founders and certain employees. We will pay cash to acquire these interests over the five years post-acquisition based on put/call provisions that tie the valuation to the underlying adjusted EBITDA performance of aM. Since the purchase of the remaining 22 percent of the business requires continued service of the founders and employees, we are accounting for the arrangement as compensation expense that is remeasured based on changes in the fair value of the equity interests. We have classified this expense as acquisition-related costs within the consolidated statements of operations and we have classified the associated accrued liability within other accrued expenses and other liabilities within the consolidated balance sheets. We had preliminarily estimated a range of $200 million to $225 million of unrecognized compensation expense related to this transaction, to be recognized over a weighted-average remaining recognition period of approximately 4 years. In the third quarter of 2018, upon reassessment of near-term financial expectations and their impact on the earn-out calculations, we reduced our estimated compensation expense range to $150.0 million to $175.0 million, to be recognized over a weighted-average recognition period of approximately 3.5 years, which did not significantly impact 2018 expense.
Macroeconomic Advisers (“MEA”). On September 13, 2017, we acquired Macroeconomic Advisers, a small independent research firm that specializes in monitoring, analyzing and forecasting developments in the U.S. economy. We acquired MEA in order to provide increased macroeconomic coverage to our clients, with a special focus on policy and financial markets.
The following table summarizes the purchase price allocation, net of acquired cash, for these acquisitions (in millions):
63
Total | ||||
Assets: | ||||
Current assets | $ | 7.3 | ||
Property and equipment | 1.1 | |||
Intangible assets | 113.8 | |||
Goodwill | 363.0 | |||
Other long-term assets | 0.9 | |||
Total assets | 486.1 | |||
Liabilities: | ||||
Current liabilities | 4.4 | |||
Deferred revenue | 1.4 | |||
Deferred taxes | 36.2 | |||
Total liabilities | 42.0 | |||
Purchase price | $ | 444.1 | ||
Of the goodwill recorded for the 2017 business combinations, approximately $8.4 million is tax deductible.
During the year ended November 30, 2016, we completed the following acquisitions:
CARPROOF. On December 24, 2015, we acquired CARPROOF, a Canada-based company that offers products and services in vehicle history, appraisal, and valuation for the automotive industry, for approximately $459.2 million, net of cash acquired. We acquired CARPROOF in order to expand our vehicle history report services into Canada. This acquisition is included in our Transportation segment.
Oil Price Information Service (“OPIS”). On February 10, 2016, we acquired OPIS, an internationally referenced pricing reporting agency that serves the oil, natural gas, and biofuels industries, for $652.3 million, net of cash acquired. OPIS information primarily serves the downstream energy market, and we completed this acquisition in support of our efforts to further diversify our energy portfolio. This acquisition is included in our Resources segment.
Merger with Markit Ltd.
As described in Note 1 above, we completed the Merger on July 12, 2016 in an all-share transaction. The following table shows the calculation of the purchase consideration (in millions, except for Markit closing price):
Markit shares issued and outstanding at merger date (1) | 179.79 | |||
Markit closing price | $ | 32.70 | ||
Total equity consideration | $ | 5,879.1 | ||
Additional consideration for stock compensation | 368.3 | |||
Total purchase consideration | 6,247.4 | |||
Less cash acquired | (97.1 | ) | ||
Purchase price, net of cash acquired | $ | 6,150.3 | ||
(1) Excludes restricted stock awards that were issued and outstanding as of the merger date, but were not yet vested. | ||||
Markit is a leading global provider of financial information services. Its offerings are designed to enhance transparency, reduce risk, and improve operational efficiency in the financial markets. We created a new Financial Services segment for Markit’s business, and we have included revenue and expense attributable to Markit in the Financial Services segment from the date of the Merger. Markit contributed $449.0 million of revenue and a loss of $37.7 million from continuing operations for the post-Merger period ended November 30, 2016.
The following unaudited pro forma information has been prepared as if the Merger had been consummated at December 1, 2014. This information is presented for informational purposes only, and is not necessarily indicative of the operating results
64
that would have occurred if the Merger had been consummated as of that date. This information should not be used as a predictive measure of our future financial position, results of operations, or liquidity.
Year ended November 30, | ||||
Supplemental pro forma financial information (unaudited) | 2016 | |||
(In millions) | ||||
Total revenue | $ | 3,450.9 | ||
Net income | $ | 291.9 | ||
The pro forma net income excludes $70.0 million of one-time merger and transaction costs for the year ended November 30, 2016.
The following table summarizes the purchase price allocation, net of acquired cash, for these acquisitions (in millions):
CARPROOF | OPIS | Markit | Total | ||||||||||||
Assets: | |||||||||||||||
Current assets | $ | 6.4 | $ | 13.8 | $ | 301.9 | $ | 322.1 | |||||||
Property and equipment | 2.2 | 1.7 | 60.2 | 64.1 | |||||||||||
Intangible assets | 168.3 | 200.3 | 3,209.1 | 3,577.7 | |||||||||||
Goodwill | 330.0 | 464.6 | 4,301.1 | 5,095.7 | |||||||||||
Other long-term assets | — | — | 10.5 | 10.5 | |||||||||||
Total assets | 506.9 | 680.4 | 7,882.8 | 9,070.1 | |||||||||||
Liabilities: | |||||||||||||||
Current liabilities | 2.7 | 3.2 | 251.4 | 257.3 | |||||||||||
Deferred revenue | 0.2 | 24.8 | 230.8 | 255.8 | |||||||||||
Deferred taxes | 44.5 | — | 627.4 | 671.9 | |||||||||||
Long-term debt | — | — | 546.5 | 546.5 | |||||||||||
Other long-term liabilities | 0.3 | 0.1 | 19.3 | 19.7 | |||||||||||
Noncontrolling interest | — | — | 57.1 | 57.1 | |||||||||||
Total liabilities and noncontrolling interest | 47.7 | 28.1 | 1,732.5 | 1,808.3 | |||||||||||
Purchase price, net of cash acquired | $ | 459.2 | $ | 652.3 | $ | 6,150.3 | $ | 7,261.8 | |||||||
The finalization of purchase accounting in fiscal 2017 resulted in reductions to intangible assets of approximately $80 million, deferred taxes of $66 million, and other current working capital of $6 million, with an offsetting $20 million increase to goodwill. Of the goodwill recorded for the 2016 business combinations, approximately $744.3 million is tax deductible.
4. | Accounts Receivable |
Our accounts receivable balance consists of the following as of November 30, 2018 and 2017 (in millions):
2018 | 2017 | |||||||
Accounts receivable | $ | 823.3 | $ | 716.7 | ||||
Less: Accounts receivable allowance | (30.4 | ) | (23.2 | ) | ||||
Accounts receivable, net | $ | 792.9 | $ | 693.5 | ||||
We record an accounts receivable allowance when it is probable that the accounts receivable balance will not be collected. The amounts comprising the allowance are based upon management’s estimates and historical collection trends. The activity in
65
our accounts receivable allowance consists of the following for the years ended November 30, 2018, 2017, and 2016, respectively (in millions):
2018 | 2017 | 2016 | ||||||||||
Balance at beginning of year | $ | 23.2 | $ | 16.0 | $ | 12.5 | ||||||
Provision for bad debts | 15.6 | 13.9 | 11.4 | |||||||||
Other additions | 7.9 | 2.9 | 2.4 | |||||||||
Write-offs and other deductions | (16.3 | ) | (9.6 | ) | (10.3 | ) | ||||||
Balance at end of year | $ | 30.4 | $ | 23.2 | $ | 16.0 | ||||||
5. | Property and Equipment |
Property and equipment consists of the following as of November 30, 2018 and 2017 (in millions):
2018 | 2017 | |||||||
Land, buildings and improvements | $ | 208.0 | $ | 197.3 | ||||
Capitalized software | 822.2 | 644.5 | ||||||
Computers and office equipment | 334.0 | 315.9 | ||||||
Property and equipment, gross | 1,364.2 | 1,157.7 | ||||||
Less: Accumulated depreciation | (784.6 | ) | (626.4 | ) | ||||
Property and equipment, net | $ | 579.6 | $ | 531.3 | ||||
Depreciation expense was $175.1 million, $157.0 million, and $114.8 million for the years ended November 30, 2018, 2017, and 2016, respectively.
6. | Intangible Assets |
The following table presents details of our acquired intangible assets, other than goodwill (in millions):
As of November 30, 2018 | As of November 30, 2017 | ||||||||||||||||||||||
Gross | Accumulated Amortization | Net | Gross | Accumulated Amortization | Net | ||||||||||||||||||
Intangible assets subject to amortization: | |||||||||||||||||||||||
Customer relationships | $ | 3,458.8 | $ | (473.3 | ) | $ | 2,985.5 | $ | 2,957.8 | $ | (348.6 | ) | $ | 2,609.2 | |||||||||
Developed technology | 928.8 | (133.1 | ) | 795.7 | 827.6 | (73.4 | ) | 754.2 | |||||||||||||||
Information databases | 671.0 | (329.6 | ) | 341.4 | 753.7 | (340.2 | ) | 413.5 | |||||||||||||||
Trademarks | 493.8 | (153.6 | ) | 340.2 | 488.9 | (111.4 | ) | 377.5 | |||||||||||||||
Developed computer software | 85.0 | (63.0 | ) | 22.0 | 85.6 | (54.3 | ) | 31.3 | |||||||||||||||
Other | 1.1 | (1.1 | ) | — | 8.3 | (5.7 | ) | 2.6 | |||||||||||||||
Total intangible assets | $ | 5,638.5 | $ | (1,153.7 | ) | $ | 4,484.8 | $ | 5,121.9 | $ | (933.6 | ) | $ | 4,188.3 | |||||||||
66
Intangible asset amortization expense was $366.1 million, $335.5 million, and $220.9 million for the years ended November 30, 2018, 2017, and 2016, respectively. Estimated future amortization expense related to intangible assets held as of November 30, 2018 is as follows (in millions):
Year | Amount | |||
2019 | $ | 375.3 | ||
2020 | $ | 367.7 | ||
2021 | $ | 362.0 | ||
2022 | $ | 343.7 | ||
2023 | $ | 333.1 | ||
Thereafter | $ | 2,703.0 | ||
Changes in our goodwill and gross intangible assets from November 30, 2017 to November 30, 2018 were primarily the result of our recent acquisition activities, as described in Note 3, as well as foreign currency translation effects. The change in net intangible assets was also primarily due to our recent acquisition activities, partially offset by current year amortization. Goodwill, gross intangible assets, and net intangible assets were all subject to foreign currency translation effects.
7. | Derivatives |
Our business is exposed to various market risks, including interest rate and foreign currency risks. We utilize derivative instruments to help us manage these risks. We do not hold or issue derivatives for speculative purposes.
Interest Rate Swaps
To mitigate interest rate exposure on our outstanding revolving facility and term loan debt, we utilize interest rate derivative contracts that effectively swap $400 million of floating rate debt at a 2.86 percent weighted-average fixed interest rate, plus the applicable spread on our floating rate debt. We entered into these swap contracts in November 2013 and January 2014, and the contracts expire between May and November 2020.
Because the terms of these swaps and the variable rate debt (as amended or extended over time) coincide, we do not expect any ineffectiveness. We have designated and accounted for these instruments as cash flow hedges, with changes in fair value being deferred in accumulated other comprehensive income/loss (“AOCI”) in our consolidated balance sheets.
Foreign Currency Forwards
To mitigate foreign currency exposure, we utilize short-term foreign currency forward contracts that manage market risks associated with fluctuations in balances that are denominated in currencies other than the local functional currency. We account for these forward contracts at fair value and recognize the associated realized and unrealized gains and losses in other expense (income), net, on the consolidated statements of operations, since we have not designated these contracts as hedges for accounting purposes. The notional amount of these outstanding foreign currency forward contracts was $500.1 million and $261.3 million as of November 30, 2018 and 2017, respectively.
Fair Value of Derivatives
Since our derivative instruments are not listed on an exchange, we have evaluated fair value by reference to similar transactions in active markets; consequently, we have classified all of our derivative instruments within Level 2 of the fair value measurement hierarchy. As of November 30, 2018 and 2017, we had assets of $0.2 million and $2.8 million, respectively, which were classified within other current assets, and we had liabilities of $1.6 million and $10.6 million, respectively, which were classified within other accrued expenses and other liabilities.
8. | Debt |
The following table summarizes total indebtedness as of November 30, 2018 and 2017 (in millions):
67
November 30, 2018 | November 30, 2017 | |||||||
2016 revolving facility | $ | — | $ | 886.0 | ||||
2018 revolving facility | 1,108.0 | — | ||||||
2016 term loan: | ||||||||
Tranche A-1 | — | 615.0 | ||||||
Tranche A-2 | — | 515.6 | ||||||
2018 term loan: | ||||||||
Tranche A-1 | 574.0 | — | ||||||
Tranche A-2 | 481.3 | — | ||||||
2017 term loan | — | 500.0 | ||||||
364-day credit agreement | 250.0 | — | ||||||
5% senior notes due 2022 | 750.0 | 750.0 | ||||||
4.125% senior notes due 2023 | 498.6 | — | ||||||
4.75% senior notes due 2025 | 813.8 | 815.8 | ||||||
4.00% senior notes due 2026 | 500.0 | — | ||||||
4.75% senior notes due 2028 | 747.3 | — | ||||||
Institutional senior notes: | ||||||||
Series A | — | 95.8 | ||||||
Series B | — | 53.7 | ||||||
Debt issuance costs | (51.2 | ) | (42.8 | ) | ||||
Capital leases | 7.3 | 4.2 | ||||||
Total debt | $ | 5,679.1 | $ | 4,193.3 | ||||
Current portion | (789.9 | ) | (576.0 | ) | ||||
Total long-term debt | $ | 4,889.2 | $ | 3,617.3 | ||||
2016 revolving facility. In July 2016, we entered into a $1.85 billion senior unsecured revolving credit agreement (“2016 revolving facility”). Borrowings under the 2016 revolving facility were set to mature in July 2021. The interest rates for borrowings under the 2016 revolving facility were the applicable LIBOR plus a spread of 1.00 percent to 1.75 percent, depending upon our Leverage Ratio, which was defined as the ratio of Consolidated Funded Indebtedness to rolling four-quarter Consolidated Earnings Before Interest Expense, Taxes, Depreciation and Amortization (“EBITDA”), as such terms were defined in the revolving facility agreement. A commitment fee on any unused balance was payable periodically and ranged from 0.125 percent to 0.30 percent based upon our Leverage Ratio.
2018 revolving facility. On June 25, 2018, we terminated the 2016 revolving facility and entered into a new $2.0 billion senior unsecured revolving credit agreement (“2018 revolving facility”). Borrowings under the 2018 revolving facility mature in June 2023. The interest rates for borrowings under the 2018 revolving facility are the applicable LIBOR plus a spread of 1.00 percent to 1.75 percent, depending upon our corporate credit rating. A commitment fee on any unused balance is payable periodically and ranges from 0.125 percent to 0.30 percent based upon our corporate credit rating. The obligations under the 2018 revolving facility are not guaranteed by any of our subsidiaries. As a result of the termination of the 2016 revolving facility, the outstanding letters of credit under that facility were transferred to the 2018 revolving facility. We had approximately $1.5 million of outstanding letters of credit under the 2018 revolving facility as of November 30, 2018, which reduced the available borrowing under the facility by an equivalent amount.
2016 term loan. In July 2016, we entered into a $1.206 billion senior unsecured amortizing term loan agreement (“2016 term loan”). The 2016 term loan had a final maturity date of July 2021. The interest rates for borrowings under the 2016 term loan were the same as those under the 2016 revolving facility.
2018 term loan. Coincident with entering into the 2018 revolving facility and terminating the 2016 revolving facility, we terminated the 2016 term loan and entered into a new senior unsecured amortizing term loan agreement (“2018 term loan”). The 2018 term loan has a final maturity date of July 2021. The obligations under the 2018 term loan are not guaranteed by any of our subsidiaries. The interest rates for borrowings under the 2018 term loan are the same as those under the 2018 revolving facility.
68
Subject to certain conditions, the 2018 revolving facility may be expanded by up to an aggregate of $1.0 billion in additional commitments. The 2018 revolving facility and the 2018 term loan have certain financial and other covenants, including a maximum Leverage Ratio and a minimum Interest Coverage Ratio, which is defined as the ratio of Consolidated EBITDA to Consolidated Interest Expense, as such terms are defined in the agreements.
2017 term loan. On January 26, 2017, we entered into a 364-day $500 million senior unsecured term loan (“2017 term loan”). The 2017 term loan was structured as a non-amortizing loan with repayment of principal due at maturity. The interest rates for borrowings under the 2017 term loan were the same as those under the 2016 revolving facility. The 2017 term loan had certain financial covenants that were the same as the 2016 revolving facility and the 2016 term loan, including a maximum Leverage Ratio and minimum Interest Coverage Ratio, as such terms were defined in the agreement. The 2017 term loan was repaid in January 2018 using borrowings from the 2016 revolving facility.
364-Day Credit Agreement. On June 25, 2018, we entered into a 364-day Credit Agreement (the “364-Day Credit Agreement”) for a term loan credit facility in an aggregate principal amount of $1.855 billion, which became available to be borrowed upon the satisfaction of certain conditions precedent, including the concurrent completion of our acquisition of Ipreo. On August 2, 2018, concurrent with the completion of our acquisition of Ipreo, we borrowed $250.0 million under the 364-Day Credit Agreement. The unutilized balance of the commitment terminated upon completion of the acquisition. The interest rates for borrowings under the 364-Day Credit Agreement are the applicable LIBOR plus a spread of 1.00 percent to 1.75 percent, depending upon our corporate credit rating. The spread over LIBOR is subject to a 0.25 percent step-up on the 180th day following the closing date of the agreement and a 0.50 percent step-up on the 270th day following the closing date. The obligations under the 364-Day Credit Agreement are not guaranteed by any of our subsidiaries. The 364-Day Credit Agreement has certain financial and other covenants that are consistent with the covenants contained in the 2018 revolving facility and the 2018 term loan, including a maximum Leverage Ratio and a minimum Interest Coverage Ratio, which is defined as the ratio of Consolidated EBITDA to Consolidated Interest Expense, as such terms are defined in the 364-Day Credit Agreement. On January 7, 2019, we repaid the 364-Day Credit Agreement using cash on hand and borrowings under the revolving credit facility.
As of November 30, 2018, we had approximately $1.108 billion of outstanding borrowings under the 2018 revolving facility at a current annual interest rate of 3.69 percent and approximately $1.305 billion of outstanding borrowings under the 2018 term loans and 364-Day Credit agreement at a current weighted average annual interest rate of 3.88 percent, including the effect of the interest rate swaps described in Note 7.
5.00% senior notes due 2022 (“5% Notes due 2022”). In October 2014, IHS Inc. issued $750.0 million aggregate principal amount of senior unsecured notes due 2022 in an offering not subject to the registration requirements of the Securities Act of 1933, as amended (the Securities Act). In August 2015, we completed a registered exchange offer for the 5% Notes due 2022. In July 2016, in connection with the merger between IHS and Markit, we completed an exchange offer for $742.8 million of the outstanding 5% Notes due 2022 for an equal principal amount of new 5% senior unsecured notes issued by IHS Markit with the same maturity. Approximately $7.2 million of the 5% Notes due 2022 did not participate in the exchange offer. The new 5% Notes due 2022 are not, and will not be, registered under the Securities Act or the securities laws of any other jurisdiction. The new 5% Notes due 2022 have been admitted to the official list of The International Stock Exchange in the Channel Islands.
The 5% Notes due 2022 bear interest at a fixed rate of 5.00 percent and mature on November 1, 2022. Interest on the 5% Notes due 2022 is due semiannually on May 1 and November 1 of each year, commencing May 1, 2015. We may redeem the 5% Notes due 2022 in whole or in part at a redemption price equal to 100 percent of the principal amount of the notes plus the Applicable Premium, as defined in the indenture governing the 5% Notes due 2022. Additionally, at the option of the holders of the notes, we may be required to purchase all or a portion of the notes upon occurrence of a Change of Control Triggering Event as defined in the indenture, at a price equal to 101 percent of the principal amount thereof, plus accrued and unpaid interest to the date of purchase. The indenture contains covenants that limit our ability to, among other things, incur or create liens and enter into sale and leaseback transactions. In addition, the indenture contains a covenant that limits our ability to consolidate or merge with another entity or to sell all or substantially all of our assets to another entity. The indenture contains customary default provisions. In connection with the entry into the 2018 revolving facility and 2018 term loan and the termination of the 2016 revolving facility and 2016 term loan in June 2018, each guarantor of the 5% Notes due 2022 was released from its guarantees pursuant to the terms of the indenture under which such notes were issued. The fair value of the 5% Notes due 2022 as of November 30, 2018 was approximately $764.6 million.
4.125% senior notes due 2023 (“4.125% Notes due 2023”). In July 2018, we issued $500 million aggregate principal amount of senior unsecured notes due 2023 in a registered offering under the Securities Act. The 4.125% Notes due 2023 have
69
been admitted for trading to the official list of The International Stock Exchange in the Channel Islands. The 4.125% Notes due 2023 bear interest at a fixed rate of 4.125 percent and mature on August 1, 2023. Interest on the 4.125% Notes due 2023 is due semiannually on February 1 and August 1 of each year, commencing February 1, 2019. The notes were issued at a discount which represented a price to the public of 99.707% of the principal amount. We may redeem the 4.125% Notes due 2023 in whole or in part at a redemption price equal to 100 percent of the principal amount of the notes plus the applicable premium, as defined in the indenture governing the 4.125% Notes due 2023. Additionally, at the option of the holders of the notes, we may be required to purchase all or a portion of the notes upon occurrence of a change of control triggering event as defined in the indenture, at a price equal to 101 percent of the principal amount thereof, plus accrued and unpaid interest to the date of purchase. The indenture contains covenants that limit our ability to, among other things, incur or create liens and enter into sale and leaseback transactions. In addition, the indenture contains a covenant that limits our ability to consolidate or merge with another entity or to sell all or substantially all of our assets to another entity. The indenture contains customary default provisions. The fair value of the 4.125% Notes due 2023 as of November 30, 2018 was approximately $494.7 million.
4.75% senior notes due 2025 (“4.75% Notes due 2025”). In February 2017, we issued $500 million aggregate principal amount of senior unsecured notes due 2025 in an offering not subject to the registration requirements of the Securities Act. In July 2017, we issued an additional $300 million aggregate principal amount of the 4.75% Notes due 2025 at a $16.5 million premium, resulting in an effective interest rate of 3.88 percent. The 4.75% Notes due 2025 have been admitted for trading to the official list of The International Stock Exchange in the Channel Islands. The 4.75% Notes due 2025 bear interest at a fixed rate of 4.75 percent and mature on February 15, 2025. Interest on the 4.75% Notes due 2025 is due semiannually on February 15 and August 15 of each year, commencing August 15, 2017. We may redeem the 4.75% Notes due 2025 in whole or in part at a redemption price equal to 100 percent of the principal amount of the notes plus the Applicable Premium, as defined in the indenture governing the 4.75% Notes due 2025. Additionally, at the option of the holders of the notes, we may be required to purchase all or a portion of the notes upon occurrence of a Change of Control Triggering Event as defined in the indenture, at a price equal to 101 percent of the principal amount thereof, plus accrued and unpaid interest to the date of purchase. The indenture contains covenants that limit our ability to, among other things, incur or create liens and enter into sale and leaseback transactions. In addition, the indenture contains a covenant that limits our ability to consolidate or merge with another entity or to sell all or substantially all of our assets to another entity. The indenture contains customary default provisions. In connection with the entry into the 2018 revolving facility and 2018 term loan and the termination of the 2016 revolving facility and 2016 term loan in June 2018, each guarantor of the 4.75% Notes due 2025 was released from its guarantees pursuant to the terms of the indenture under which such notes were issued. The fair value of the 4.75% Notes due 2025 as of November 30, 2018 was approximately $794.3 million.
4.00% senior notes due 2026 (“4% Notes due 2026”). In December 2017, we issued $500 million aggregate principal amount of senior unsecured notes due 2026 in an offering not subject to the registration requirements of the Securities Act. The 4% Notes due 2026 have been admitted for trading to the official list of The International Stock Exchange in the Channel Islands. The 4% Notes due 2026 bear interest at a fixed rate of 4.00 percent and mature on March 1, 2026. Interest on the 4% Notes due 2026 is due semiannually on March 1 and September 1 of each year, commencing March 1, 2018. We may redeem the 4% Notes due 2026 in whole or in part at a redemption price equal to 100 percent of the principal amount of the notes plus the applicable premium, as defined in the indenture governing the 4% Notes due 2026. Additionally, at the option of the holders of the notes, we may be required to purchase all or a portion of the notes upon occurrence of a change of control triggering event as defined in the indenture, at a price equal to 101 percent of the principal amount thereof, plus accrued and unpaid interest to the date of purchase. The indenture contains covenants that limit our ability to, among other things, incur or create liens and enter into sale and leaseback transactions. In addition, the indenture contains a covenant that limits our ability to consolidate or merge with another entity or to sell all or substantially all of our assets to another entity. The indenture contains customary default provisions. In connection with the entry into the 2018 revolving facility and 2018 term loan and the termination of the 2016 revolving facility and 2016 term loan in June 2018, each guarantor of the 4% Notes due 2026 was released from its guarantees pursuant to the terms of the indenture under which such notes were issued. The fair value of the 4% Notes due 2026 as of November 30, 2018 was approximately $471.5 million.
4.75% senior notes due 2028 (“4.75% Notes due 2028”). In July 2018, we issued $750 million aggregate principal amount of senior unsecured notes due 2028 in a registered offering under the Securities Act. The 4.75% Notes due 2028 have been admitted for trading to the official list of The International Stock Exchange in the Channel Islands. The 4.75% Notes due 2028 bear interest at a fixed rate of 4.75 percent and mature on August 1, 2028. Interest on the 4.75% Notes due 2028 is due semiannually on February 1 and August 1 of each year, commencing February 1, 2019. The 4.75% Notes due 2028 were issued at a discount which represented a price to the public of 99.628% of the principal amount. We may redeem the 4.75% Notes due 2028 in whole or in part at a redemption price equal to 100 percent of the principal amount of the notes plus the applicable premium, as defined in the indenture governing the 4.75% Notes due 2028. Additionally, at the option of the holders of the notes, we may be required to purchase all or a portion of the notes upon occurrence of a change of control triggering event as defined in the indenture, at a price equal to 101 percent of the principal amount thereof, plus accrued and unpaid interest to the
70
date of purchase. The indenture contains covenants that limit our ability to, among other things, incur or create liens and enter into sale and leaseback transactions. In addition, the indenture contains a covenant that limits our ability to consolidate or merge with another entity or to sell all or substantially all of our assets to another entity. The indenture contains customary default provisions. The fair value of the 4.75% Notes due 2028 as of November 30, 2018 was approximately $731.3 million.
Institutional senior notes. In November 2015, Markit issued two series of senior unsecured notes having an aggregate principal amount of $500 million to certain institutional investors. In November 2016, we completed an offer to repurchase approximately $350 million of these notes. In May 2018, we prepaid the remaining notes in full through a combination of cash on hand and drawings under the 2016 revolving facility and terminated the related Note Purchase and Guarantee Agreement. The Series A notes bore interest at a fixed rate of 3.73 percent and were set to mature on November 4, 2022. The Series B notes bore interest at a fixed rate of 4.05 percent and were set to mature on November 4, 2025. The institutional senior notes had certain financial and other covenants, including a maximum Consolidated Leverage Ratio and a minimum Interest Coverage Ratio, as such terms were defined in the Note Purchase and Guarantee Agreement.
As of November 30, 2018, we were in compliance with all of our debt covenants. We have classified short-term debt based on scheduled loan payments and intended repayments on our revolving facility based on expected cash availability over the next 12 months.
The carrying value of our variable rate debt instruments approximate their fair value because of the variable interest rates associated with those instruments. The fair values of the senior notes were measured using observable inputs in markets that are not active; consequently, we have classified those notes within Level 2 of the fair value hierarchy.
Maturities of outstanding borrowings under the revolving facility, term loans, and notes as of November 30, 2018 are as follows (in millions):
Year | Amount | |||
2019 | $ | 370.6 | ||
2020 | 120.6 | |||
2021 | 814.1 | |||
2022 | 750.0 | |||
2023 | 1,608.0 | |||
Thereafter | 2,050.0 | |||
$ | 5,713.3 | |||
9. | Acquisition-related Costs |
During 2016, we incurred approximately $161.2 million in costs associated with acquisitions, primarily the Merger. Approximately $90 million of the costs were related to advisory and banker fees from the Merger, and another $60 million was for costs to achieve Merger synergy targets, including employee severance and retention costs, as well as contract termination costs primarily related to the consolidation of our legacy facilities. As a result of the Merger, we eliminated 307 positions. Approximately $78.4 million of the total charge was allocated to shared services, with $69.6 million of the charge recorded in the Financial Services segment, $3.0 million in the Resources segment, $7.4 million in the Transportation segment, and $2.8 million in the CMS segment.
During 2017, we incurred approximately $113.0 million in costs associated with acquisitions, including employee severance charges and retention costs, contract termination costs for facility consolidations, legal and professional fees, and the performance compensation expense related to the aM acquisition described in Note 3. We eliminated 378 positions in 2017 related to the Merger. Approximately $53.9 million of the total charge was allocated to shared services, with $31.3 million of the charge recorded in the Financial Services segment, $11.1 million in the Resources segment, $12.8 million in the Transportation segment, and $3.9 million in the CMS segment.
During 2018, we incurred approximately $134.8 million in costs associated with acquisitions, including performance compensation expense related to the aM acquisition described in Note 3, employee severance charges and retention costs, contract termination costs for facility consolidations, and legal and professional fees. Approximately $19.4 million of the total charge was allocated to shared services, with $49.2 million of the charge recorded in the Financial Services segment, $3.5 million in the Resources segment, $59.0 million in the Transportation segment, and $3.7 million in the CMS segment.
71
The following table provides a reconciliation of the acquisition-related costs accrued liability as of November 30, 2018 (in millions):
Employee Severance and Other Termination Benefits | Contract Termination Costs | Performance Compensation and Other | Total | ||||||||||||
Balance at November 30, 2015 | $ | — | $ | 0.1 | $ | 0.3 | $ | 0.4 | |||||||
Add: Costs incurred | 43.6 | 7.9 | 109.9 | 161.4 | |||||||||||
Revision to prior estimates | — | — | (0.2 | ) | (0.2 | ) | |||||||||
Less: Amount paid | (18.9 | ) | 0.6 | (93.3 | ) | (111.6 | ) | ||||||||
Balance at November 30, 2016 | $ | 24.7 | $ | 8.6 | $ | 16.7 | $ | 50.0 | |||||||
Add: Costs incurred | 53.6 | 18.1 | 34.0 | 105.7 | |||||||||||
Revision to prior estimates | (3.0 | ) | 10.4 | (0.1 | ) | 7.3 | |||||||||
Less: Amount paid | (61.4 | ) | (19.5 | ) | (26.9 | ) | (107.8 | ) | |||||||
Balance at November 30, 2017 | $ | 13.9 | $ | 17.6 | $ | 23.7 | $ | 55.2 | |||||||
Add: Costs incurred | 25.2 | 19.8 | 88.3 | 133.3 | |||||||||||
Revision to prior estimates | — | 2.1 | (0.6 | ) | 1.5 | ||||||||||
Less: Amount paid | (36.6 | ) | (22.7 | ) | (42.7 | ) | (102.0 | ) | |||||||
Balance at November 30, 2018 | $ | 2.5 | $ | 16.8 | $ | 68.7 | $ | 88.0 | |||||||
As of November 30, 2018, the $88.0 million remaining liability was primarily in shared services, the Financial Services segment, and the Transportation segment. Approximately $64.0 million of the remaining liability in the Other category is associated with the aM acquisition-related performance compensation liability. We expect that substantially all of the remaining acquisition-related costs accrued liability will be paid in 2019 except for the long-term aM performance compensation liability, which was approximately $21.7 million as of November 30, 2018.
10. | Income Taxes |
The amounts of income from continuing operations before income taxes and equity in loss of equity method investee for the years ended November 30, 2018, 2017, and 2016, respectively, is as follows (in millions):
2018 | 2017 | 2016 | |||||||||
U.K. | $ | 75.8 | $ | (67.0 | ) | $ | (55.4 | ) | |||
U.S. | (167.5 | ) | 28.7 | (96.4 | ) | ||||||
Foreign | 516.0 | 410.4 | 294.1 | ||||||||
Income from continuing operations before income taxes and equity in loss of equity method investee | $ | 424.3 | $ | 372.1 | $ | 142.3 | |||||
The benefit for income taxes from continuing operations for the years ended November 30, 2018, 2017, and 2016, respectively, is as follows (in millions):
72
2018 | 2017 | 2016 | |||||||||
Current: | |||||||||||
U.K. | $ | 12.1 | $ | 0.4 | $ | (4.3 | ) | ||||
U.S. | 24.4 | (0.5 | ) | (32.0 | ) | ||||||
Foreign | 59.8 | 50.3 | 40.4 | ||||||||
Total current | 96.3 | 50.2 | 4.1 | ||||||||
Deferred: | |||||||||||
U.K. | (21.1 | ) | (25.7 | ) | (7.6 | ) | |||||
U.S. | (155.9 | ) | (35.3 | ) | 4.4 | ||||||
Foreign | (34.7 | ) | (39.1 | ) | (6.0 | ) | |||||
Total deferred | (211.7 | ) | (100.1 | ) | (9.2 | ) | |||||
Benefit for income taxes | $ | (115.4 | ) | $ | (49.9 | ) | $ | (5.1 | ) | ||
The following table presents the reconciliation of the benefit for income taxes between the U.K. rate and our effective tax rate for the years ended 2018, 2017 and 2016, respectively (in millions):
2018 | 2017 | 2016 | |||||||||
Statutory tax at U.K. rate (19%, 19.3% and 20%, respectively) | $ | 80.6 | $ | 71.9 | $ | 28.4 | |||||
Foreign rate differential | (38.9 | ) | (45.5 | ) | (49.3 | ) | |||||
Stock-based compensation | (39.2 | ) | (61.2 | ) | — | ||||||
Tax law change | (178.3 | ) | 1.2 | (17.1 | ) | ||||||
Transition tax | 31.4 | — | — | ||||||||
Valuation allowance | 5.5 | (32.6 | ) | 19.3 | |||||||
Transaction costs | 13.0 | 4.5 | 13.5 | ||||||||
Uncertain tax positions | 1.1 | 2.5 | 7.3 | ||||||||
Other | 9.4 | 9.3 | (7.2 | ) | |||||||
Benefit for income taxes | $ | (115.4 | ) | $ | (49.9 | ) | $ | (5.1 | ) | ||
Effective tax rate expressed as a percentage of pre-tax earnings | (27.2 | )% | (13.4 | )% | (3.6 | )% | |||||
We have not provided a deferred tax liability on approximately $5.5 billion of temporary differences related to investments in foreign subsidiaries that are essentially permanent in duration. This amount includes $2.7 billion of U.S. earnings and $2.8 billion of non-U.S. earnings at November 30, 2018. Those earnings are considered to be indefinitely reinvested, and do not include earnings from certain subsidiaries which are considered distributed. Accordingly, no provision has been provided for those earnings. If we were to repatriate those earnings, in the form of dividends or otherwise, we would be subject to income taxes (subject to an adjustment for foreign tax credits) and withholding taxes payable to the various countries. Determination of the amount of unrecognized deferred income tax liability is not practicable due to the complexity associated with the hypothetical calculation.
73
The significant components of deferred tax assets and liabilities as of November 30, 2018 and 2017 are as follows (in millions):
2018 | 2017 | ||||||
Deferred tax assets: | |||||||
Deferred stock-based compensation | $ | 67.1 | $ | 119.6 | |||
Loss and other carryforwards | 142.3 | 113.0 | |||||
Other | 100.3 | 109.2 | |||||
Gross deferred tax assets | 309.7 | 341.8 | |||||
Valuation allowance | (22.4 | ) | (23.6 | ) | |||
Realizable deferred tax assets | 287.3 | 318.2 | |||||
Deferred tax liabilities: | |||||||
Partnership investments | (11.8 | ) | (11.5 | ) | |||
Property and equipment | (57.5 | ) | (72.9 | ) | |||
Intangible assets | (877.7 | ) | (1,063.2 | ) | |||
Other | (25.6 | ) | (33.3 | ) | |||
Gross deferred tax liabilities | (972.6 | ) | (1,180.9 | ) | |||
Net deferred tax liability | $ | (685.3 | ) | $ | (862.7 | ) | |
A significant portion of the net deferred tax liability included above relates to the tax effect of the step-up in value of Markit’s intangible assets as a result of the Merger.
As of November 30, 2018, we had loss carryforwards for tax purposes totaling approximately $446.3 million, comprised of $283.4 million of U.S. net operating loss carryforwards, $96.5 million of U.K. net operating loss carryforwards, and $66.4 million of foreign net operating loss carryforwards. If not used, the U.S. net operating loss carryforwards will begin to expire in 2019 and the U.K. and foreign net operating loss carryforwards generally may be carried forward indefinitely. We have analyzed the net operating losses and placed valuation allowances on those where we have determined the realization is not more likely than not to occur.
The valuation allowance for deferred tax assets decreased by $1.1 million in 2018. The decrease is primarily due to the TCJA, which resulted in the utilization of foreign tax credits.
We have provided what we believe to be an appropriate amount of tax for items that involve interpretation of the tax law. However, events may occur in the future that will cause us to reevaluate our current reserves and may result in an adjustment to the reserve for taxes.
A summary of the activities associated with our reserve for unrecognized tax benefits, interest, and penalties follows (in millions):
Unrecognized Tax Benefits | Interest and Penalties | ||||||
Balance at November 30, 2017 | $ | 11.1 | $ | 1.2 | |||
Additions: | |||||||
Prior year tax positions | 1.9 | 0.7 | |||||
Decreases: | |||||||
Lapse of statute of limitations | (1.5 | ) | (0.1 | ) | |||
Balance at November 30, 2018 | $ | 11.5 | $ | 1.8 | |||
As of November 30, 2018, the total amount of unrecognized tax benefits was $13.3 million, of which $1.8 million related to interest and penalties. We include accrued interest and accrued penalties related to amounts accrued for unrecognized tax benefits in our provision for income taxes. The entire amount of unrecognized benefits at November 30, 2018 may affect the annual effective tax rate if the benefits are eventually recognized.
74
It is reasonably possible that we will experience a $0.7 million decrease in the reserve for unrecognized tax benefits within the next 12 months. We would experience this decrease in relation to uncertainties associated with the expiration of applicable statutes of limitation.
We and our subsidiaries file federal, state, and local income tax returns in multiple jurisdictions around the world. With few exceptions, we are no longer subject to income tax examinations by tax authorities for years before 2014.
In December 2017, the TCJA was enacted in the United States. The TCJA enacted significant changes affecting our fiscal year 2018, including, but not limited to, (1) reducing the U.S. federal corporate income tax rate to 21% and (2) imposing a one-time transition tax on certain unrepatriated earnings of foreign subsidiaries of U.S. companies that had not been previously taxed in the U.S.
The TJCA also establishes new tax provisions affecting our fiscal year 2019, including, but not limited to, (1) creating a new provision designed to tax global intangible low-tax income (“GILTI”); (2) generally eliminating U.S. federal taxes on dividends from foreign subsidiaries; (3) eliminating the corporate alternative minimum tax (“AMT”); (4) creating the base erosion anti-abuse tax (“BEAT”); (5) establishing a deduction for foreign derived intangible income ("FDII"); (6) repealing domestic production activity deduction; and (7) establishing new limitations on deductible interest expense and certain executive compensation.
The TCJA reduced the U.S. federal corporate income tax rate from 35 percent to 21 percent effective January 1, 2018. Due to our fiscal year end, the lower corporate tax rate will be phased in, resulting in a U.S. statutory federal rate of 22.19 percent for our fiscal year ending November 30, 2018 and 21 percent for subsequent fiscal years.
ASC 740, Income Taxes, requires companies to recognize the effect of the tax law changes in the period of enactment. However, the SEC staff issued Staff Accounting Bulletin No. 118 (“SAB 118”) which allowed companies to record provisional amounts during a measurement period not extending beyond one year from the TJCA enactment date. For the year ended November 30, 2018, we recognized income tax benefit related to the TCJA of $141 million which includes (1) an expense of $31 million for U.S. transition tax liability and correlative items on deemed repatriated earnings of non-U.S. subsidiaries and (2) a benefit of $172 million associated with the impact on deferred taxes resulting from the decreased U.S. federal corporate income tax rate as described below. As of November 30, 2018, we have completed the accounting for all the impacts of the TCJA.
Deemed Repatriation Transition Tax (“Transition Tax”): The Transition Tax is based on the total unrepatriated post-1986 earnings and profits (“E&P”) of our foreign subsidiaries and the amount of non-U.S. taxes paid (Tax Pools) on such earnings. Historically, we permanently reinvested a significant portion of post-1986 E&P outside the U.S. For the remaining portion, we previously accrued deferred taxes. Since the TCJA required all foreign earnings to be taxed currently, we recorded an income tax expense of $31 million for our one-time transition tax liability, which will be paid over 8 years in accordance with the election available under the TCJA. We have completed our accounting for charges related to the Transition Tax.
Reduction of U.S. Federal Corporate Tax Rate: The reduction of the U.S. federal corporate income tax rate requires that we remeasure our deferred tax assets and liabilities as of the date of enactment. The amount recorded for the year ended November 30, 2018 for the remeasurement due to tax rate change is $172 million. We have completed our accounting for the measurement of deferred taxes.
GILTI: The TCJA subjects a U.S. corporation to tax on its GILTI. U.S. GAAP allows companies to make an accounting policy election to either (1) treat taxes due on future GILTI inclusions in U.S. taxable income as a current-period expense when incurred (“period cost method”) or (2) factor such amounts into the measurement of its deferred taxes (“deferred method”). We have elected to use the period cost method.
Indefinite Reinvestment Treatment: Prior to the enactment of the TCJA, we treated a significant portion of our undistributed earnings from legacy foreign subsidiaries of IHS as indefinitely reinvested. As a result of the enactment of the TCJA, we have reevaluated our historic assertion and no longer consider certain earnings of legacy foreign subsidiaries of IHS to be indefinitely reinvested. We have recorded a deferred tax liability of $12 million for foreign withholding taxes on repatriation of remaining undistributed earnings.
11. | Pensions and Postretirement Benefits |
Defined Benefit Plans
75
We sponsor the following defined benefit plans:
• | A frozen, non-contributory defined-benefit retirement plan (the “U.S. RIP”) for certain of our U.S. employees. We have taken initial steps to terminate this plan and are awaiting regulatory approval before proceeding. |
• | A frozen defined-benefit pension plan (the “U.K. RIP”) that covers certain employees of a subsidiary based in the United Kingdom. |
• | A frozen, unfunded Supplemental Income Plan (“SIP”), which is a non-qualified pension plan, for certain U.S. employees who earn over a federally stipulated amount. |
Benefits for all three plans are generally based on years of service and either average or cumulative base compensation, depending on the plan. Plan funding strategies are influenced by employee benefit laws and tax laws. The U.K. RIP includes a provision for employee contributions and inflation-based benefit increases for retirees. We expect to contribute approximately $2 million to our pension and postretirement benefit plans in 2019.
The following table provides the expected benefit payments for our pension plans (in millions):
Total | |||
2019 | $ | 11.7 | |
2020 | $ | 11.4 | |
2021 | $ | 10.8 | |
2022 | $ | 12.7 | |
2023 | $ | 12.2 | |
2024-2027 | $ | 58.8 | |
Our net periodic pension expense for the pension plans consisted of the following (in millions):
Year Ended November 30, | |||||||||||
2018 | 2017 | 2016 | |||||||||
Service costs incurred | $ | 1.7 | $ | 1.6 | $ | 1.3 | |||||
Interest costs on projected benefit obligation | 7.4 | 7.7 | 8.5 | ||||||||
Expected return on plan assets | (8.4 | ) | (8.2 | ) | (8.5 | ) | |||||
Settlements | 0.8 | 0.5 | — | ||||||||
Fourth quarter expense recognition of actuarial loss in excess of corridor | — | 4.9 | 8.3 | ||||||||
Net periodic pension expense | $ | 1.5 | $ | 6.5 | $ | 9.6 | |||||
76
The changes in the projected benefit obligation, plan assets, and the funded status of the pension plans were as follows (in millions):
2018 | 2017 | |||||||
Change in projected benefit obligation: | ||||||||
Net benefit obligation, beginning of year | $ | 222.2 | $ | 205.4 | ||||
Service costs incurred | 1.7 | 1.6 | ||||||
Interest costs on projected benefit obligation | 7.4 | 7.7 | ||||||
Actuarial (gain) loss | (18.8 | ) | 14.9 | |||||
Gross benefits paid | (16.5 | ) | (11.8 | ) | ||||
Foreign currency exchange rate change | (3.2 | ) | 4.4 | |||||
Net benefit obligation, end of year | $ | 192.8 | $ | 222.2 | ||||
Change in plan assets: | ||||||||
Fair value of plan assets, beginning of year | $ | 198.8 | $ | 181.0 | ||||
Actual return on plan assets | (5.7 | ) | 20.7 | |||||
Employer contributions | 1.9 | 4.8 | ||||||
Gross benefits paid | (16.5 | ) | (11.8 | ) | ||||
Foreign currency exchange rate change | (3.1 | ) | 4.1 | |||||
Fair value of plan assets, end of year | $ | 175.4 | $ | 198.8 | ||||
Funded status (underfunded) | $ | (17.4 | ) | $ | (23.4 | ) | ||
Amounts in Accumulated Other Comprehensive Income not yet recognized as components of net periodic pension and postretirement expense, pretax | ||||||||
Net actuarial loss | $ | 12.6 | $ | 17.9 | ||||
The net underfunded status of the plans is recorded in accrued pension and postretirement liability in the consolidated balance sheets. Any future reclassification of actuarial loss from AOCI to income would only be recognized if the cumulative actuarial loss exceeds the corridor, and the reclassification would be recognized as a fourth quarter mark-to-market adjustment.
Amounts reclassified from AOCI to income related to net pension and OPEB liability are recorded in net periodic pension and postretirement expense.
Pension expense is actuarially calculated annually based on data available at the beginning of each year. We determine the expected return on plan assets by multiplying the expected long-term rate of return on assets by the market-related value of plan assets. The market-related value of plan assets is the fair value of plan assets. Assumptions used in the actuarial calculation include the discount rate selected and disclosed at the end of the previous year as well as the expected rate of return on assets detailed in the table below, as of the years ended November 30, 2018 and 2017:
U.S. RIP | U.K. RIP | ||||||||||
2018 | 2017 | 2018 | 2017 | ||||||||
Weighted-average assumptions as of year-end | |||||||||||
Discount rate | 4.50 | % | 3.80 | % | 2.90 | % | 2.50 | % | |||
Expected long-term rate of return on assets | 5.00 | % | 4.30 | % | 4.60 | % | 4.60 | % | |||
Fair Value of Pension Assets
As of November 30, 2018 and 2017, the U.S. RIP plan assets consist primarily of fixed-income securities, with a moderate amount of equity securities. The U.K. RIP plan assets consist primarily of equity securities, with smaller holdings of bonds and other assets. Equity assets are diversified between international and domestic investments, with additional diversification in the domestic category through allocations to large-cap, mid-cap, and growth and value investments.
The U.S. RIP’s established investment policy seeks to align the expected rate of return with the discount rate, while allowing for some equity variability to allow for upside market potential that would strengthen the overall asset position of the
77
plan. The U.K. RIP’s established investment policy is to match the liabilities for active and deferred members with equity investments and match the liabilities for pensioner members with fixed-income investments. Asset allocations are subject to ongoing analysis and possible modification as basic capital market conditions change over time (interest rates, inflation, etc.).
The following table compares target asset allocation percentages with actual asset allocations at the end of 2018:
U.S. RIP Assets | U.K. RIP Assets | ||||||||||
Target Allocations | Actual Allocations | Target Allocations | Actual Allocations | ||||||||
Fixed Income | 75 | % | 73 | % | 45 | % | 46 | % | |||
Equities | 25 | % | 25 | % | 55 | % | 50 | % | |||
Cash and Other | — | % | 3 | % | — | % | 5 | % | |||
Investment return assumptions for both plans have been determined by obtaining independent estimates of expected long-term rates of return by asset class and applying the returns to assets on a weighted-average basis.
All of our pension plan assets are measured at fair value on a recurring basis by reference to similar assets in active markets and are therefore classified within Level 2 of the fair value hierarchy. Plan assets as of November 30, 2018 and 2017 were classified in the following categories (in millions):
2018 | 2017 | |||||||
Interest-bearing cash | $ | 5.6 | $ | 6.2 | ||||
Collective trust funds: | ||||||||
Fixed income funds | 113.9 | 128.7 | ||||||
Equity funds | 55.9 | 63.9 | ||||||
$ | 175.4 | $ | 198.8 | |||||
Postretirement Benefits
During the third quarter of 2018, we terminated our contributory postretirement medical plan, which resulted in a $7.1 million curtailment gain associated with the reduction in postretirement benefit liability. The plan historically subsidized the cost of coverage for retiree-medical coverage for certain grandfathered employees. Our subsidy was capped at different rates per month depending on individual retirees’ Medicare eligibility. Our net periodic postretirement expense was $0.4 million in 2017 and $0.4 million in 2016, and our postretirement benefit obligation was zero and $8.4 million as of November 30, 2018 and 2017, respectively. The net unfunded status of the postretirement benefit plan is recorded in accrued pension and postretirement liability in the consolidated balance sheets.
Defined Contribution Plans
Employees of certain subsidiaries may participate in defined contribution plans, and we provide matching contributions as part of the plans. Benefit expense relating to these plans was approximately $21.1 million, $24.8 million, and $23.4 million for the years ended November 30, 2018, 2017, and 2016, respectively.
12. | Stock-based Compensation |
As of November 30, 2018, IHS Markit equity awards may only be issued from the 2014 Equity Incentive Award Plan (“2014 Equity Plan”), which is a legacy Markit plan. The legacy IHS plan, the Amended and Restated IHS Inc. 2004 Long-Term Incentive Plan, expired on November 30, 2018. The 2014 Equity Plan provides for the grant of non-qualified stock options, incentive stock options, stock appreciation rights, restricted stock, restricted stock units, performance units and performance shares, cash-based awards, other stock based awards, and covered employee annual incentive awards. Upon vesting of an award, we may either issue new shares or reissue treasury shares. As of November 30, 2018, we have an authorized maximum of 35.2 million shares under the 2014 Equity Plan, and that amount will be increased by (a) the number of shares granted and outstanding under the Key Employee Incentive Program, the 2013 Share Option Plan, and the 2014 Share Option Plan as of June 24, 2014 that terminate by expiration, forfeiture, cancellation or otherwise without the issuance of our common shares, and (b) on January 1 of each year through January 1, 2024, in an amount equal to the lesser of: (x) 2.5 percent of the total number of IHS Markit’s common shares issued and outstanding on a fully diluted basis as of December 31 of the
78
immediately preceding calendar year and (y) such number of common shares determined by our Board of Directors. As of November 30, 2018, 20.0 million shares were available for future grant under the 2014 Equity Plan.
Total unrecognized compensation expense related to all nonvested awards was $222.9 million as of November 30, 2018, with a weighted-average recognition period of approximately 1.6 years.
Restricted Stock Units (“RSUs”) and Restricted Stock Awards (“RSAs”). RSUs and RSAs typically vest from one to three years and are generally subject to either cliff vesting or graded vesting. RSUs and RSAs do not have nonforfeitable rights to dividends or dividend equivalents. The fair value of RSUs and RSAs is typically based on the fair value of our common shares on the date of grant. We amortize the value of these awards to expense over the vesting period on a straight-line basis. For performance-based RSUs, an evaluation is made each quarter about the likelihood that the performance criteria will be met. As the number of performance-based RSUs expected to vest increases or decreases, compensation expense is also adjusted up or down to reflect the number expected to vest and the cumulative vesting period met to date.
The following table summarizes RSU/RSA activity for the year ended November 30, 2018:
Shares | Weighted- Average Grant Date Fair Value | |||||
(in millions) | ||||||
Balance at November 30, 2017 | 10.7 | $ | 35.64 | |||
Granted | 4.0 | $ | 48.24 | |||
Vested | (5.4 | ) | $ | 34.47 | ||
Forfeited | (0.5 | ) | $ | 42.20 | ||
Balance at November 30, 2018 | 8.8 | $ | 41.77 | |||
The total fair value of RSUs that vested during the year ended November 30, 2018 was $259.5 million.
Stock Options. In connection with the Merger, we assumed options outstanding under the legacy Markit plans. Stock options under the 2014 Equity Plan generally vest over one to three years, and expire 7 years from the date of grant. At the Merger date, we revalued all of the outstanding stock options using a Monte Carlo simulation model with assumptions about anticipated employee exercise behavior, expected stock price volatility, and the risk-free interest rate. The following table summarizes stock option awards assumed in conjunction with the Merger and subsequent activity through November 30, 2018, as well as stock options that are vested and expected to vest and stock options exercisable as of November 30, 2018:
Shares | Weighted-Average Exercise Price | Weighted-Average Remaining Contractual Term | Aggregate Intrinsic Value | ||||||||
(in millions) | (in years) | (in millions) | |||||||||
Balance at November 30, 2017 | 25.3 | $ | 25.69 | ||||||||
Exercised | (9.5 | ) | $ | 24.18 | |||||||
Forfeited | (0.1 | ) | $ | 25.66 | |||||||
Balance at November 30, 2018 | 15.7 | $ | 26.61 | 1.8 | 419.4 | ||||||
Vested and expected to vest at November 30, 2018 | 15.6 | $ | 26.61 | 1.8 | 417.2 | ||||||
Exercisable at November 30, 2018 | 9.5 | $ | 26.43 | 1.7 | 257.0 | ||||||
The aggregate intrinsic value amounts in the table above represent the difference between the closing price of our common shares on November 30, 2018 and the exercise price, multiplied by the number of in-the-money stock options as of that date. This represents the value that would have been received by stock option holders if they had all exercised their stock options on November 30, 2018. In future periods, this amount will change depending on fluctuations in our share price. The total intrinsic value of stock options exercised during the year ended November 30, 2018 was approximately $248.2 million.
Stock-based compensation expense for the years ended November 30, 2018, 2017, and 2016, respectively, was as follows (in millions):
79
2018 | 2017 | 2016 | ||||||||||
Cost of revenue | $ | 70.0 | $ | 76.3 | $ | 32.2 | ||||||
Selling, general and administrative | 171.7 | 185.6 | 171.7 | |||||||||
Total stock-based compensation expense | $ | 241.7 | $ | 261.9 | $ | 203.9 | ||||||
Total income tax benefits recognized for stock-based compensation arrangements were as follows (in millions):
2018 | 2017 | 2016 | ||||||||||
Income tax benefits | $ | 106.2 | $ | 72.3 | $ | 60.9 | ||||||
No stock-based compensation cost was capitalized during the years ended November 30, 2018, 2017, or 2016.
13. | Commitments and Contingencies |
Commitments
Rental charges in 2018, 2017, and 2016 approximated $65.0 million, $65.6 million and $57.7 million, respectively. Minimum rental commitments under non-cancelable operating leases in effect at November 30, 2018, are as follows:
Year | Amount (in millions) | |||
2019 | $ | 74.1 | ||
2020 | 66.5 | |||
2021 | 58.9 | |||
2022 | 49.5 | |||
2023 | 45.8 | |||
Thereafter | 201.1 | |||
$ | 495.9 | |||
We also had outstanding letters of credit and bank guarantees in the aggregate amount of approximately $10.4 million and $9.1 million at November 30, 2018 and 2017, respectively.
Indemnifications
In the normal course of business, we are party to a variety of agreements under which we may be obligated to indemnify the other party for certain matters. These obligations typically arise in contracts where we customarily agree to hold the other party harmless against losses arising from a breach of representations or covenants for certain matters such as title to assets and intellectual property rights associated with the sale of products. We also have indemnification obligations to our officers and directors. The duration of these indemnifications varies, and in certain cases, is indefinite. In each of these circumstances, payment by us depends upon the other party making an adverse claim according to the procedures outlined in the particular agreement, which procedures generally allow us to challenge the other party’s claims. In certain instances, we may have recourse against third parties for payments that we make.
We are unable to reasonably estimate the maximum potential amount of future payments under these or similar agreements due to the unique facts and circumstances of each agreement and the fact that certain indemnifications provide for no limitation to the maximum potential future payments under the indemnification. We have not recorded any liability for these indemnifications in the accompanying consolidated balance sheets; however, we accrue losses for any known contingent liability, including those that may arise from indemnification provisions, when the obligation is both probable and reasonably estimable.
Litigation
From time to time, in the ordinary course of our business, we are involved in various legal, regulatory or administrative proceedings, lawsuits, government investigations, and other claims, including employment, commercial, intellectual property,
80
and environmental, safety, and health matters. In addition, we may receive routine requests for information from governmental agencies in connection with their regulatory or investigatory authority. We review such proceedings, lawsuits, investigations, claims, and requests for information and take appropriate action as necessary. At the present time, we can give no assurance as to the outcome of any such pending proceedings, lawsuits, investigations, claims, or requests for information and we are unable to determine the ultimate resolution of or provide a reasonable estimate of the range of possible loss attributable to these matters or the effect they may have on us. However, we do not expect the outcome of such proceedings, lawsuits, claims, or requests for information to have a material adverse effect on our results of operations or financial condition. We have and will continue to vigorously defend ourselves in all matters.
14. | Common Shares and Earnings per Share |
Weighted average common shares outstanding for the years ended November 30, 2018, 2017, and 2016, respectively, were calculated as follows (in millions):
2018 | 2017 | 2016 | |||||||
Weighted-average shares outstanding: | |||||||||
Shares used in basic EPS calculation | 394.4 | 400.3 | 309.2 | ||||||
Effect of dilutive securities: | |||||||||
RSUs/RSAs | 3.4 | 5.0 | 3.2 | ||||||
Stock options | 9.1 | 10.9 | 3.9 | ||||||
Shares used in diluted EPS calculation | 406.9 | 416.2 | 316.3 | ||||||
Share Repurchase Programs
In August 2016, our Board of Directors authorized a share repurchase program of up to $1.5 billion of IHS Markit common shares from September 29, 2016 through November 30, 2017, to be funded using our existing cash, cash equivalents, marketable securities and future cash flows, or through the incurrence of short- or long-term indebtedness, at management’s discretion. In January 2017, our Board of Directors increased the size of this repurchase program to up to $2.25 billion of IHS Markit common shares and extended its termination date to May 31, 2018. In October 2017, our Board of Directors increased the size of the program to up to $3.25 billion of IHS Markit common shares and extended the program’s termination date to November 30, 2019. This repurchase program does not obligate us to repurchase any set dollar amount or number of shares and may be modified, suspended, or terminated at any time without prior notice. Under the repurchase program, we are authorized to repurchase our common shares on the open market from time to time, in privately negotiated transactions, or through accelerated repurchase agreements, subject to availability of common shares, price, market conditions, alternative uses of capital, and applicable regulatory requirements, at management’s discretion. As of November 30, 2018, we had $1.007 billion remaining available to repurchase under the program that expires November 30, 2019.
In August 2016, our Board of Directors separately and additionally authorized, subject to applicable regulatory requirements, the repurchase of our common shares surrendered by employees in an amount equal to the exercise price, if applicable, and statutory tax liability associated with the vesting of their equity awards, for which we pay the statutory tax on behalf of the employee and forgo receipt of the exercise price of the award from the employee, if applicable.
Employee Benefit Trust (“EBT”) Shares
We have approximately 25.2 million outstanding common shares that are held by the Markit Group Holdings Limited Employee Benefit Trust. The trust is under our control using the variable interest entity model criteria; consequently, we have consolidated and classified the trust shares as treasury shares within our consolidated balance sheets.
15. | Accumulated Other Comprehensive Income (Loss) |
AOCI consists of foreign currency translation adjustments, net pension and postretirement liability adjustments, and net gain (loss) on hedging activities. Each item is reported net of the related income tax effect. The following table summarizes the changes in AOCI by component, net of tax, for the year ended November 30, 2018 (in millions):
81
Foreign currency translation | Net pension and OPEB liability | Unrealized losses on hedging activities | Total | |||||||||||||
Balance at November 30, 2015 | $ | (163.5 | ) | $ | (13.1 | ) | $ | (14.6 | ) | $ | (191.2 | ) | ||||
Other comprehensive loss before reclassifications | (250.4 | ) | (7.1 | ) | (1.8 | ) | (259.3 | ) | ||||||||
Reclassifications from AOCI to income | — | 5.8 | 5.9 | 11.7 | ||||||||||||
Balance at November 30, 2016 | $ | (413.9 | ) | $ | (14.4 | ) | $ | (10.5 | ) | $ | (438.8 | ) | ||||
Other comprehensive income (loss) before reclassifications | 345.8 | (0.1 | ) | 1.0 | 346.7 | |||||||||||
Reclassifications from AOCI to income | — | 1.5 | 5.6 | 7.1 | ||||||||||||
Balance at November 30, 2017 | $ | (68.1 | ) | $ | (13.0 | ) | $ | (3.9 | ) | $ | (85.0 | ) | ||||
Other comprehensive income (loss) before reclassifications | (220.4 | ) | 3.6 | 4.8 | (212.0 | ) | ||||||||||
Reclassifications from AOCI to income | — | 1.2 | 2.8 | 4.0 | ||||||||||||
Reclassifications from AOCI to retained earnings | — | (1.7 | ) | (4.2 | ) | (5.9 | ) | |||||||||
Balance at November 30, 2018 | $ | (288.5 | ) | $ | (9.9 | ) | $ | (0.5 | ) | $ | (298.9 | ) | ||||
Amounts reclassified from AOCI to income related to net pension and OPEB liability are recorded in net periodic pension and postretirement expense.
16. | Supplemental Cash Flow Information |
Net cash provided by operating activities reflects cash payments for interest and income taxes as shown below, for the years ended November 30, 2018, 2017, and 2016, respectively (in millions):
2018 | 2017 | 2016 | ||||||||||
Interest paid | $ | 188.5 | $ | 137.2 | $ | 103.0 | ||||||
Income tax payments, net | $ | 64.1 | $ | 59.3 | $ | 81.5 | ||||||
Interest paid during 2016, 2017, and 2018 increased primarily due to increased borrowings associated with acquisitions and share repurchase programs, as well as a higher effective interest rate due to an increased amount of fixed-rate debt.
Cash and cash equivalents amounting to approximately $120.0 million and $133.8 million reflected on the consolidated balance sheets at November 30, 2018 and 2017, respectively, are maintained primarily in U.S. Dollars, British Pounds, and Euros.
17. | Segment Information |
Our Chief Executive Officer is our CODM, and the CODM evaluates segment performance based primarily on revenue and segment Adjusted EBITDA, as described below. In addition, the CODM regularly reviews revenue by transaction type. The accounting policies of our segments are the same as those described in the summary of significant accounting policies (see Note 2).
No single customer accounted for 10 percent or more of our total revenue for the years ended November 30, 2018, 2017, or 2016. There are no material inter-segment revenues for any period presented. Our shared services function includes corporate transactions that are not allocated to the reportable segments, including net periodic pension and postretirement expense, as well as certain corporate functions such as investor relations, procurement, corporate development, and portions of finance, legal, and marketing.
We evaluate segment operating performance at the Adjusted EBITDA level for each of our four segments. We define Adjusted EBITDA as net income before net interest, provision for income taxes, depreciation and amortization, stock-based compensation cost, restructuring charges, acquisition-related costs and performance compensation, exceptional litigation, net other gains and losses, pension mark-to-market and settlement expense, the impact of joint ventures and noncontrolling interests, and discontinued operations. Information about the operations of our four segments is set forth below (in millions).
82
Year ended November 30, | |||||||||||
2018 | 2017 | 2016 | |||||||||
Revenue | |||||||||||
Resources | $ | 876.5 | $ | 839.3 | $ | 860.8 | |||||
Transportation | 1,160.2 | 991.6 | 892.8 | ||||||||
CMS | 552.8 | 535.9 | 532.2 | ||||||||
Financial Services | 1,419.7 | 1,232.9 | 449.0 | ||||||||
Total revenue | $ | 4,009.2 | $ | 3,599.7 | $ | 2,734.8 | |||||
Adjusted EBITDA | |||||||||||
Resources | $ | 369.4 | $ | 360.2 | $ | 367.8 | |||||
Transportation | 479.3 | 408.6 | 353.3 | ||||||||
CMS | 127.4 | 125.2 | 127.5 | ||||||||
Financial Services | 636.9 | 553.7 | 190.4 | ||||||||
Shared services | (48.1 | ) | (57.8 | ) | (51.3 | ) | |||||
Total Adjusted EBITDA | $ | 1,564.9 | $ | 1,389.9 | $ | 987.7 | |||||
Reconciliation to the consolidated statements of operations: | |||||||||||
Interest income | 3.1 | 2.2 | 1.3 | ||||||||
Interest expense | (225.7 | ) | (154.3 | ) | (119.4 | ) | |||||
Benefit for income taxes | 115.4 | 49.9 | 5.1 | ||||||||
Depreciation | (175.1 | ) | (157.0 | ) | (114.8 | ) | |||||
Amortization related to acquired intangible assets | (366.1 | ) | (335.5 | ) | (220.9 | ) | |||||
Stock-based compensation expense | (241.7 | ) | (261.9 | ) | (203.9 | ) | |||||
Restructuring charges | (1.7 | ) | — | (22.8 | ) | ||||||
Acquisition-related costs | (80.7 | ) | (103.1 | ) | (161.2 | ) | |||||
Acquisition-related performance compensation | (54.1 | ) | (9.9 | ) | — | ||||||
Litigation charges related to class action suit | — | — | (0.1 | ) | |||||||
Loss on debt extinguishment | (4.7 | ) | — | (0.6 | ) | ||||||
Gain on sale of assets | — | — | 0.7 | ||||||||
Pension mark-to-market and settlement gain (expense) | 6.5 | (5.4 | ) | (8.4 | ) | ||||||
Share of joint venture results not attributable to Adjusted EBITDA | (0.5 | ) | 1.2 | (0.3 | ) | ||||||
Adjusted EBITDA attributable to noncontrolling interest | 2.7 | 0.8 | 1.2 | ||||||||
Income from discontinued operations, net | — | — | 9.2 | ||||||||
Net income attributable to IHS Markit | $ | 542.3 | $ | 416.9 | $ | 152.8 | |||||
83
Total assets by segment were as follows:
Year ended November 30, | |||||||
2018 | 2017 | ||||||
Total Assets | |||||||
Resources | $ | 2,681.1 | $ | 2,720.7 | |||
Transportation | 3,144.7 | 3,152.0 | |||||
CMS | 761.6 | 772.4 | |||||
Financial Services | 9,474.9 | 7,909.3 | |||||
Total assets | $ | 16,062.3 | $ | 14,554.4 | |||
The table below provides information about revenue and long-lived assets for the U.S., the U.K., and the rest of the world for 2018, 2017, and 2016. Revenue by country is generally based on where the customer contract is signed. Long-lived assets include net property and equipment.
2018 | 2017 | 2016 | |||||||||||||||||||||
(in millions) | Revenue | Long-lived assets | Revenue | Long-lived assets | Revenue | Long-lived assets | |||||||||||||||||
U.S. | $ | 2,411.6 | $ | 415.4 | $ | 2,152.0 | $ | 362.4 | $ | 1,632.3 | $ | 324.9 | |||||||||||
U.K. | 536.8 | 127.9 | 435.4 | 128.9 | 298.1 | 54.7 | |||||||||||||||||
Rest of world | 1,060.8 | 36.3 | 1,012.3 | 40.0 | 804.4 | 36.6 | |||||||||||||||||
Total | $ | 4,009.2 | $ | 579.6 | $ | 3,599.7 | $ | 531.3 | $ | 2,734.8 | $ | 416.2 | |||||||||||
Revenue by transaction type was as follows:
(in millions) | 2018 | 2017 | 2016 | |||||||||
Recurring fixed revenue | $ | 2,861.5 | $ | 2,550.0 | $ | 2,074.5 | ||||||
Recurring variable revenue | 506.3 | 449.0 | 164.1 | |||||||||
Non-recurring revenue | 641.4 | 600.7 | 496.2 | |||||||||
Total revenue | $ | 4,009.2 | $ | 3,599.7 | $ | 2,734.8 | ||||||
Activity in our goodwill account was as follows:
(in millions) | Resources | Transportation | CMS | Financial Services | Consolidated Total | ||||||||||||||
Balance at November 30, 2016 | $ | 2,004.0 | $ | 1,671.1 | $ | 349.2 | $ | 4,185.5 | $ | 8,209.8 | |||||||||
Acquisitions | — | 362.3 | 8.4 | — | 370.7 | ||||||||||||||
Adjustments to purchase price | — | — | — | 20.1 | 20.1 | ||||||||||||||
Foreign currency translation | 22.0 | 22.2 | 3.8 | 129.9 | 177.9 | ||||||||||||||
Balance at November 30, 2017 | 2,026.0 | 2,055.6 | 361.4 | 4,335.5 | 8,778.5 | ||||||||||||||
Acquisitions | 5.6 | — | — | 1,179.3 | 1,184.9 | ||||||||||||||
Adjustments to purchase price | — | (7.3 | ) | (0.4 | ) | — | (7.7 | ) | |||||||||||
Foreign currency translation | (16.6 | ) | (16.7 | ) | (2.9 | ) | (83.5 | ) | (119.7 | ) | |||||||||
Balance at November 30, 2018 | $ | 2,015.0 | $ | 2,031.6 | $ | 358.1 | $ | 5,431.3 | $ | 9,836.0 | |||||||||
84
18. | Quarterly Results of Operations (Unaudited) |
The following table summarizes certain quarterly results of operations (in millions):
Three Months Ended | |||||||||||||||
February 28 | May 31 | August 31 | November 30 | ||||||||||||
2018 | |||||||||||||||
Revenue | $ | 932.1 | $ | 1,008.3 | $ | 1,001.0 | $ | 1,067.8 | |||||||
Net income attributable to IHS Markit Ltd. | $ | 241.3 | $ | 114.7 | $ | 104.5 | $ | 81.8 | |||||||
Earnings per share: | |||||||||||||||
Basic | $ | 0.61 | $ | 0.29 | $ | 0.26 | $ | 0.21 | |||||||
Diluted | $ | 0.59 | $ | 0.28 | $ | 0.26 | $ | 0.20 | |||||||
2017 | |||||||||||||||
Revenue | $ | 844.2 | $ | 906.1 | $ | 904.7 | $ | 944.7 | |||||||
Net income attributable to IHS Markit Ltd. | $ | 66.0 | $ | 99.3 | $ | 145.9 | $ | 105.7 | |||||||
Earnings per share: | |||||||||||||||
Basic | $ | 0.16 | $ | 0.25 | $ | 0.37 | $ | 0.27 | |||||||
Diluted | $ | 0.16 | $ | 0.24 | $ | 0.35 | $ | 0.26 | |||||||
Item 9. | Changes in and Disagreements with Accountants on Accounting and Financial Disclosure |
None.
Item 9A. Controls and Procedures
Disclosure Controls and Procedures
Under the supervision and with the participation of our management, including the Chief Executive Officer and Chief Financial Officer, we have evaluated the effectiveness of our disclosure controls and procedures pursuant to Rules 13a-15(e) and 15d-15(e) under the Exchange Act, as of the end of the period covered by this Form 10-K. Based on that evaluation, the Chief Executive Officer and Chief Financial Officer concluded that our disclosure controls and procedures as defined in Rules 13a-15(e) and 15d-15(e) under the Exchange Act are effective to ensure that information required to be disclosed in the reports required to be filed or submitted under the Exchange Act is (i) recorded, processed, summarized, and reported within the time periods specified in the Securities and Exchange Commission’s rules and forms, and (ii) accumulated and communicated to our management, including our Chief Executive Officer and Chief Financial Officer, to allow timely decisions regarding required disclosure.
Management’s Report on Internal Control over Financial Reporting
Our Chief Executive Officer and our Chief Financial Officer are responsible for establishing and maintaining adequate internal control over financial reporting, as such term is defined in Exchange Act Rules 13a-15(f) and 15d-15(f). A company’s internal control over financial reporting is a process designed by, or under the supervision of, the company’s principal executive and principal financial officers, or persons performing similar functions, and effected by the company’s board of directors, management, and other personnel, to provide reasonable assurance regarding the reliability of financial reporting and the preparation of financial statements for external purposes in accordance with generally accepted accounting principles and includes those policies and procedures that (i) pertain to the maintenance of records that, in reasonable detail, accurately and fairly reflect the transactions and dispositions of the assets of the company; (ii) provide reasonable assurance that transactions are recorded as necessary to permit the preparation of financial statements in accordance with U.S. GAAP, and that receipts and expenditures of the company are being made only in accordance with authorizations of management and directors of the company; and (iii) provide reasonable assurance regarding prevention or timely detection of unauthorized acquisition, use, or disposition of the company’s assets that could have a material effect on the financial statements.
Because of its inherent limitations, internal control over financial reporting may not prevent or detect misstatements. Therefore, even those systems determined to be effective can provide only reasonable assurance with respect to financial statement preparation and presentation. In addition, projections of any evaluation of effectiveness to future periods are subject
85
to the risk that controls may become inadequate because of changes in conditions, or that the degree of compliance with the policies or procedures may deteriorate.
Under the supervision and with the participation of our management, including our Chief Executive Officer and Chief Financial Officer, we conducted an evaluation of the effectiveness of our internal control over financial reporting as of November 30, 2018 using the Internal Control—Integrated Framework (2013) issued by the Committee of Sponsoring Organizations of the Treadway Commission. Based on that evaluation, our management concluded that our internal control over financial reporting was effective as of November 30, 2018.
Our management’s assessment of and conclusion on the effectiveness of internal control over financial reporting did not include the internal controls of Ipreo which are included in our 2018 consolidated financial statements and constituted $109 million of current assets as of November 30, 2018, and $102 million and $19 million of revenues and net income, respectively, for the year then ended.
Our independent registered public accounting firm has audited and issued a report on the effectiveness of our internal control over financial reporting. Their report appears on the following page.
Changes in Internal Control over Financial Reporting
There were no changes in our internal control over financial reporting that occurred during the quarter ended November 30, 2018, that have materially affected, or are reasonably likely to materially affect, our internal control over financial reporting.
86
Report of Independent Registered Public Accounting Firm
To the Board of Directors and the Shareholders of IHS Markit Ltd.
Opinion on Internal Control over Financial Reporting
We have audited IHS Markit Ltd.’s internal control over financial reporting as of November 30, 2018, based on criteria established in Internal Control-Integrated Framework issued by the Committee of Sponsoring Organizations of the Treadway Commission (2013 framework) (the COSO criteria). In our opinion, IHS Markit Ltd. (the Company) maintained, in all material respects, effective internal control over financial reporting as of November 30, 2018, based on the COSO criteria.
As indicated in the accompanying Management’s Report on Internal Control over Financial Reporting, management’s assessment of and conclusion on the effectiveness of internal control over financial reporting did not include the internal controls of Infinity Intermediate Holdings, LLC and subsidiaries (Ipreo) which are included in the 2018 consolidated financial statements of the Company and constituted $109 million of current assets as of November 30, 2018, and $102 million and $19 million of revenues and net income, respectively, for the year then ended. Our audit of internal control over financial reporting of the Company also did not include an evaluation of the internal control over financial reporting of Ipreo.
We also have audited, in accordance with the standards of the Public Company Accounting Oversight Board (United States) (PCAOB), the consolidated balance sheets of the Company as of November 30, 2018 and 2017, the related consolidated statements of operations, comprehensive income, cash flows, and changes in equity for each of the three years in the period ended November 30, 2018 and the related notes and our report dated January 18, 2019 expressed an unqualified opinion thereon.
Basis for Opinion
The Company’s management is responsible for maintaining effective internal control over financial reporting and for its assessment of the effectiveness of internal control over financial reporting included in the accompanying Management’s Report on Internal Control over Financial Reporting. Our responsibility is to express an opinion on the Company’s internal control over financial reporting based on our audit. We are a public accounting firm registered with the PCAOB and are required to be independent with respect to the Company in accordance with the U.S. federal securities laws and the applicable rules and regulations of the Securities and Exchange Commission and the PCAOB.
We conducted our audit in accordance with the standards of the PCAOB. Those standards require that we plan and perform the audit to obtain reasonable assurance about whether effective internal control over financial reporting was maintained in all material respects.
Our audit included obtaining an understanding of internal control over financial reporting, assessing the risk that a material weakness exists, testing and evaluating the design and operating effectiveness of internal control based on the assessed risk, and performing such other procedures as we considered necessary in the circumstances. We believe that our audit provides a reasonable basis for our opinion.
Definition and Limitations of Internal Control Over Financial Reporting
A company’s internal control over financial reporting is a process designed to provide reasonable assurance regarding the reliability of financial reporting and the preparation of financial statements for external purposes in accordance with generally accepted accounting principles. A company’s internal control over financial reporting includes those policies and procedures that (1) pertain to the maintenance of records that, in reasonable detail, accurately and fairly reflect the transactions and dispositions of the assets of the company; (2) provide reasonable assurance that transactions are recorded as necessary to permit preparation of financial statements in accordance with generally accepted accounting principles, and that receipts and expenditures of the company are being made only in accordance with authorizations of management and directors of the company; and (3) provide reasonable assurance regarding prevention or timely detection of unauthorized acquisition, use, or disposition of the company’s assets that could have a material effect on the financial statements.
87
Because of its inherent limitations, internal control over financial reporting may not prevent or detect misstatements. Also, projections of any evaluation of effectiveness to future periods are subject to the risk that controls may become inadequate because of changes in conditions, or that the degree of compliance with the policies or procedures may deteriorate.
/s/ Ernst & Young LLP
Denver, Colorado
January 18, 2019
88
Item 9B. Other Information
Iran Threat Reduction and Syria Human Rights Act Disclosure
Under the Iran Threat Reduction and Syrian Human Rights Act of 2012, which added Section 13(r) of the Exchange Act, we are required to include certain disclosures in our periodic reports if we or any of our affiliates knowingly engaged in certain specified activities during the period covered by the report. Disclosure is generally required even if the transactions or dealings were conducted in compliance with applicable law and regulations. During the third quarter of 2014, we acquired Global Trade Information Services, a Virginia corporation (“GTIS”). GTIS publishes the Global Trade Atlas (the “GTA”), an online trade data system offering global merchandise trade statistics such as import and export data from official sources in more than 90 countries. Included in the GTA is certain trade data sourced from Iran for which GTIS pays an annual fee of approximately $40,000. The procurement of this information is exempt from applicable economic sanctions laws and regulations as a funds transfer related to the exportation or importation of information and informational materials. Sales attributable to this Iranian trade data represented approximately $50,000 in gross revenue for GTIS in the fourth quarter of 2018 and would have represented less than 0.01% of our company’s fourth quarter 2018 consolidated revenues and gross profits. Subject to any changes in the exempt status of such activities, we intend to continue these business activities as permissible under applicable export control and economic sanctions laws and regulations.
PART III
Item 10. Directors, Executive Officers and Corporate Governance
We incorporate by reference the information responsive to this Item appearing in our Proxy Statement for our 2019 Annual General Meeting of Shareholders (“Proxy Statement”), which will be filed no later than 120 days after November 30, 2018.
We have adopted a code of ethics, referred to as our Business Code of Conduct, which applies to our directors, officers and employees. Information regarding our Business Code of Conduct is incorporated herein by reference from our Proxy Statement, which will be filed no later than 120 days after November 30, 2018. Our Business Code of Conduct is available on the Investor Relations page of our website at http://investor.ihsmarkit.com. If we approve any substantive amendment to our Business Code of Conduct, or if we grant any waiver of our Business Code of Conduct to our directors or executive officers, we will post an update on the Investor Relations page of our website (http://investor.ihsmarkit.com) within four business days following the date of the amendment or waiver describing the nature and date of the amendment or the nature of the waiver, the name of the person to whom it was granted, and the date of the waiver, as the case may be. The information on our website is not and should not be considered a part of this Form 10-K.
Item 11. Executive Compensation
We incorporate by reference the information responsive to this Item appearing in our Proxy Statement, which will be filed no later than 120 days after November 30, 2018.
Item 12. Security Ownership of Certain Beneficial Owners and Management and Related Stockholder Matters
We incorporate by reference the information responsive to this Item appearing in our Proxy Statement, which will be filed no later than 120 days after November 30, 2018. The information provided under Part II, Item 5. “Market for the Registrant’s Common Equity, Related Stockholder Matters and Issuer Purchases of Equity Securities” of this Annual Report on Form 10-K is incorporated by reference herein.
Item 13. Certain Relationships and Related Transactions, and Director Independence
We incorporate by reference the information responsive to this Item appearing in our Proxy Statement, which will be filed no later than 120 days after November 30, 2018.
Item 14. Principal Accountant Fees and Services
We incorporate by reference the information responsive to this Item appearing in our Proxy Statement, which will be filed no later than 120 days after November 30, 2018.
89
PART IV
Item 15. | Exhibits, Financial Statement Schedules |
(a) | Index of Financial Statements |
The Financial Statements listed in the Index to Consolidated Financial Statements are filed as part of this report on Form 10-K (see Part II, Item 8 – Financial Statements and Supplementary Data).
(b) | Index of Exhibits |
The following exhibits are filed as part of this report:
90
4.12 | Senior Notes Indenture, dated as of December 1, 2017, among IHS Markit Ltd., the Guarantors (as defined therein) and Wells Fargo Bank, National Association, as trustee (including the form of 4.00% Senior Notes due 2026) (Incorporated by reference to Exhibit 4.1 of the IHS Markit Ltd. Current Report on Form 8-K (file no. 001-36495) filed on December 1, 2017) |
4.13 | Base Indenture, dated as of July 23, 2018, between the Company and Wells Fargo Bank, National Association, as trustee (Incorporated by reference to Exhibit 4.1 of the IHS Markit Ltd. Current Report on Form 8-K (file no. 001-36495) filed on July 23, 2018) |
4.14 | First Supplemental Indenture, dated as of July 23, 2018, between the Company and Wells Fargo Bank, National Association, as trustee (Incorporated by reference to Exhibit 4.2 of the IHS Markit Ltd. Current Report on Form 8-K (file no. 001-36495) filed on July 23, 2018) |
4.15 | |
4.16 | Second Supplemental Indenture, dated as of July 23, 2018, between the Company and Wells Fargo Bank, National Association, as trustee (Incorporated by reference to Exhibit 4.4 of the IHS Markit Ltd. Current Report on Form 8-K (file no. 001-36495) filed o July 23, 2018 |
4.17 | |
10.1+ | Amended and Restated 2004 Markit Additional Share Option Plan (Incorporated by reference to Exhibit 4.1 of the IHS Markit Ltd. Annual Report on Form 20-F for the year ended December 31, 2014 (file no. 001-36495) filed on March 10, 2015) |
10.2+ | Amended and Restated Markit 2006 Share Option Plan (Incorporated by reference to Exhibit 4.2 of the IHS Markit Ltd. Annual Report on Form 20-F for the year ended December 31, 2014 (file no. 001-36495) filed on March 10, 2015) |
10.3+ | Amended and Restated Markit 2006 Additional Share Option Plan (Incorporated by reference to Exhibit 4.3 of the IHS Markit Ltd. Annual Report on Form 20-F for the year ended December 31, 2014 (file no. 001-36495) filed on March 10, 2015) |
10.4+ | Amended and Restated Markit 2007 Share Option Plan (Incorporated by reference to Exhibit 4.4 of the IHS Markit Ltd. Annual Report on Form 20-F for the year ended December 31, 2014 (file no. 001-36495) filed on March 10, 2015) |
10.5+ | Amended and Restated Markit 2008 Share Option Plan (1/3 vesting) (Incorporated by reference to Exhibit 4.5 of the IHS Markit Ltd. Annual Report on Form 20-F for the year ended December 31, 2014 (file no. 001-36495) filed on March 10, 2015) |
10.6+ | Amended and Restated Markit 2008 Share Option Plan (1/5 vesting) (Incorporated by reference to Exhibit 4.6 of the IHS Markit Ltd. Annual Report on Form 20-F for the year ended December 31, 2014 (file no. 001-36495) filed on March 10, 2015) |
10.7+ | Amended and Restated Markit 2008 Additional Share Option Plan (1/3 vesting) (Incorporated by reference to Exhibit 4.7 of the IHS Markit Ltd. Annual Report on Form 20-F for the year ended December 31, 2014 (file no. 001-36495) filed on March 10, 2015) |
10.8+ | Amended and Restated Markit 2008 Additional Share Option Plan (1/5 vesting) (Incorporated by reference to Exhibit 4.8 of the IHS Markit Ltd. Annual Report on Form 20-F for the year ended December 31, 2014 (file no. 001-36495) filed on March 10, 2015) |
10.9+ | Amended and Restated Markit 2009 Additional Share Option Plan (Incorporated by reference to Exhibit 4.9 of the IHS Markit Ltd. Annual Report on Form 20-F for the year ended December 31, 2014 (file no. 001-36495) filed on March 10, 2015) |
10.10+ | Amended and Restated Markit 2009 Share Option Plan (1/3 vesting) (Incorporated by reference to Exhibit 4.10 of the IHS Markit Ltd. Annual Report on Form 20-F for the year ended December 31, 2014 (file no. 001-36495) filed on March 10, 2015) |
10.11+ | Amended and Restated Markit 2009 Share Option Plan (1/5 vesting) (Incorporated by reference to Exhibit 4.11 of the IHS Markit Ltd. Annual Report on Form 20-F for the year ended December 31, 2014 (file no. 001-36495) filed on March 10, 2015) |
10.12+ | Amended and Restated Markit 2010 Share Option Plan (Incorporated by reference to Exhibit 4.13 of the IHS Markit Ltd. Annual Report on Form 20-F for the year ended December 31, 2014 (file no. 001-36495) filed on March 10, 2015) |
10.13+ | Amended and Restated Markit 2010 Share Option Plan (1/3 vesting) (Incorporated by reference to Exhibit 4.14 of the IHS Markit Ltd. Annual Report on Form 20-F for the year ended December 31, 2014 (file no. 001-36495) filed on March 10, 2015) |
10.14+ | Amended and Restated Markit 2010 Share Option Plan (1/5 vesting) (Incorporated by reference to Exhibit 4.15 of the IHS Markit Ltd. Annual Report on Form 20-F for the year ended December 31, 2014 (file no. 001-36495) filed on March 10, 2015) |
10.15+ | Amended and Restated 2011 Markit Share Option Plan (Incorporated by reference to Exhibit 4.17 of the IHS Markit Ltd. Annual Report on Form 20-F for the year ended December 31, 2014 (file no. 001-36495) filed on March 10, 2015) |
10.16+ | Amended and Restated 2012 Markit Share Option Plan (Incorporated by reference to Exhibit 4.19 of the IHS Markit Ltd. Annual Report on Form 20-F for the year ended December 31, 2014 (file no. 001-36495) filed on March 10, 2015) |
10.17+ | Amended and Restated 2013 Markit Share Option Plan (Incorporated by reference to Exhibit 4.21 of the IHS Markit Ltd. Annual Report on Form 20-F for the year ended December 31, 2014 (file no. 001-36495) filed on March 10, 2015) |
10.18+ | Amended and Restated 2013 Markit Share Option Plan (mid-year awards April through December 2013) (Incorporated by reference to Exhibit 4.22 of the IHS Markit Ltd. Annual Report on Form 20-F for the year ended December 31, 2014 (file no. 001-36495) filed on March 10, 2015) |
10.19+ | Amended and Restated 2014 Markit Share Option Plan (Incorporated by reference to Exhibit 4.24 of the IHS Markit Ltd. Annual Report on Form 20-F for the year ended December 31, 2014 (file no. 001-36495) filed on March 10, 2015) |
10.20+ | Amended and Restated Markit Key Employee Incentive Program (KEIP) (Incorporated by reference to Exhibit 4.25 of the IHS Markit Ltd. Annual Report on Form 20-F for the year ended December 31, 2014 (file no. 001-36495) filed on March 10, 2015) |
10.21+ | Amendment #1 to Amended and Restated Key Employee Incentive Program (Incorporated by reference to Exhibit 10.2 of the IHS Markit Ltd. Quarterly Report on Form 10-Q (file no. 001-36495) filed on October 7, 2016) |
10.22+ | Amendment #2 to Amended and Restated Key Employee Incentive Program (Incorporated by reference to Exhibit 10.23 to the IHS Markit Ltd. Annual Report on Form 10-K for the period ended November 30, 2016 (file no. 001-36495) filed with the Securities and Exchange Commission on January 27, 2017) |
10.23+ | IHS Markit Ltd. 2014 Equity Incentive Award Plan (Incorporated by reference to Exhibit 4.26 of the IHS Markit Ltd. Annual Report on Form 20-F for the year ended December 31, 2014 (file no. 001-36495) filed on March 10, 2015) |
91
10.24+ | Amendment to IHS Markit Ltd. 2014 Equity Incentive Award Plan (Incorporated by reference to Exhibit 10.1 of the IHS Markit Ltd. Quarterly Report on Form 10-Q (file no. 001-36495) filed on October 7, 2016) |
10.25+ | Amendment #2 to IHS Markit Ltd. 2014 Equity Incentive Award Plan (Incorporated by reference to Exhibit 10.26 to the IHS Markit Ltd. Annual Report on Form 10-K for the period ended November 30, 2016 (file no. 001-36495) filed with the Securities and Exchange Commission on January 27, 2017) |
10.26+ | Amendment #3 to IHS Markit Ltd. 2014 Equity Incentive Award Plan (Incorporated by reference to Exhibit 10.27 to the IHS Markit Ltd. Annual Report on Form 10-K for the period ended November 30, 2016 (file no. 001-36495) filed with the Securities and Exchange Commission on January 27, 2017) |
10.27+ | Amendment #4 to IHS Markit Ltd. 2014 Equity Incentive Award Plan (Incorporated by reference to Exhibit 10.7 of the IHS Markit Ltd. Quarterly Report on Form 10-Q (file no. 001-36495) filed on March 28, 2017) |
10.28+ | IHS Markit Ltd. Non-Employee Director Compensation Policy (April 2017) (Incorporated by reference to Exhibit 10.1 of the IHS Markit Ltd. Quarterly Report on Form 10-Q (file no. 001-36495) filed on June 27, 2017) |
10.29+ | IHS Markit Ltd. Non-Employee Director Equity Compensation Policy (Incorporated by reference to Exhibit 10.28 to the IHS Markit Ltd. Annual Report on Form 10-K for the period ended November 30, 2016 (file no. 001-36495) filed with the Securities and Exchange Commission on January 27, 2017) |
10.30+ | Summary of IHS Markit Ltd. 2016 Non-Employee Director Compensation Policy (Incorporated by reference to Exhibit 10.3 of the IHS Markit Ltd. Quarterly Report on Form 10-Q (file no. 001-36495) filed on October 7, 2016) |
10.31+ | IHS Markit Ltd. 2014 Equity Incentive Award Plan - 2018 Form of Restricted Share Unit Agreement (Time Based) (Incorporated by reference to Exhibit 10.4 of the IHS Markit Ltd. Quarterly Report on Form 10-Q (file no. 001-36495) filed on March 27, 2018) |
10.32+ | IHS Markit Ltd. 2014 Equity Incentive Award Plan - 2018 Form of Performance Share Unit Agreement (Incorporated by reference to Exhibit 10.5 of the IHS Markit Ltd. Quarterly Report on Form 10-Q (file no. 001-36495) filed on March 27, 2018) |
10.33+ | IHS Markit Ltd. 2014 Equity Incentive Award Plan - 2016 Form of Restricted Share Unit Agreement(Incorporated by reference to Exhibit 10.30 to the IHS Markit Ltd. Annual Report on Form 10-K for the period ended November 30, 2016 (file no. 001-36495) filed with the Securities and Exchange Commission on January 27, 2017) |
10.34+ | IHS Markit Ltd. 2014 Equity Incentive Award Plan - 2016 Form of Performance Share Unit Agreement (Incorporated by reference to Exhibit 10.31 to the IHS Markit Ltd. Annual Report on Form 10-K for the period ended November 30, 2016 (file no. 001-36495) filed with the Securities and Exchange Commission on January 27, 2017) |
10.35+ | |
10.36+ | |
10.37+ | |
10.38+ | IHS Markit Ltd. 2014 Equity Incentive Award Plan - 2014 Form of Performance Share Unit Agreement (Incorporated by reference to Exhibit 10.4 of the IHS Markit Ltd. Quarterly Report on Form 10-Q (file no. 001-36495) filed on March 28, 2017) |
10.39+ | IHS Markit Ltd. 2014 Equity Incentive Award Plan - 2014 Form of Performance Share Unit Agreement (Incorporated by reference to Exhibit 10.5 of the IHS Markit Ltd. Quarterly Report on Form 10-Q (file no. 001-36495) filed on March 28, 2017) |
10.40+ | IHS Markit Ltd. 2014 Equity Incentive Award Plan - 2014 Form of Restricted Share Unit Agreement (Incorporated by reference to Exhibit 10.6 of the IHS Markit Ltd. Quarterly Report on Form 10-Q (file no. 001-36495) filed on March 28, 2017) |
10.41+ | IHS Markit Ltd. Deferred Compensation Plan (Incorporated by reference to Exhibit 10.35 to the IHS Markit Ltd. Annual Report on Form 10-K for the period ended November 30, 2016 (file no. 001-36495) filed with the Securities and Exchange Commission on January 27, 2017) |
10.42+ | IHS Markit Ltd. Deferred Compensation Plan Adoption Agreement (Incorporated by reference to Exhibit 10.36 to the IHS Markit Ltd. Annual Report on Form 10-K for the period ended November 30, 2016 (file no. 001-36495) filed with the Securities and Exchange Commission on January 27, 2017) |
10.43+ | Form of Indemnification Agreement between IHS Markit Ltd. and its Directors and Executive Officers (Incorporated by reference to Exhibit 10.4 of the IHS Markit Ltd. Quarterly Report on Form 10-Q (file no. 001-36495) filed on October 7, 2016) |
10.44+ | IHS Markit Ltd. Policy on Recovery of Incentive Compensation (Incorporated by reference to Exhibit 10.38 to the IHS Markit Ltd. Annual Report on Form 10-K for the period ended November 30, 2016 (file no. 001-36495) filed with the Securities and Exchange Commission on January 27, 2017) |
10.45+ | Markit Ltd. Non-Employee Director Compensation Policy (Incorporated by reference to Exhibit 4.30 of the IHS Markit Ltd. Annual Report on Form 20-F for the year ended December 31, 2014 (file no. 001-36495) filed on March 10, 2015) |
10.46+ | Amended and Restated IHS Inc. 2004 Long-Term Incentive Plan (Incorporated by reference to Exhibit 10.1 to the IHS Inc. Annual Report on Form 10-K for the period ended November 30, 2014 (file no. 001-32511) filed with the Securities and Exchange Commission on January 16, 2015) |
10.47+ | Amendment #1 to the Amended and Restated IHS Inc. 2004 Long-Term Incentive Plan (Incorporated by reference to Exhibit 10.40 to the IHS Markit Ltd. Annual Report on Form 10-K for the period ended November 30, 2016 (file no. 001-36495) filed with the Securities and Exchange Commission on January 27, 2017) |
92
10.48+ | Amended and Restated IHS Inc. 2004 Directors Stock Plan (Incorporated by reference to Exhibit 10.1 to the IHS Inc. Quarterly Report on Form 10-Q for the period ended August 31, 2014 (file no. 001-32511) filed with the Securities and Exchange Commission on September 22, 2014) |
10.49+ | Summary of IHS Inc. Non-Employee Director Compensation (Incorporated by reference to Exhibit 10.2 to the IHS Inc. Quarterly Report on Form 10-Q for the period ended August 31, 2014 (file no. 001-32511) filed with the Securities and Exchange Commission on September 22, 2014) |
10.50+ | IHS Inc. Supplemental Income Plan (Incorporated by reference to Exhibit 10.17 to the IHS Inc. Registration Statement on Form S-1 (No. 333-122565) filed with the Securities and Exchange Commission on February 4, 2005). |
10.51+ | IHS Inc. Deferred Compensation Plan (Incorporated by reference to Exhibit 10.15 to the IHS Inc. Annual Report on Form 10-K for the period ended November 30, 2014 (file no. 001-32511) filed with the Securities and Exchange Commission on January 16, 2015) |
10.52+ | IHS Inc. Deferred Compensation Plan Adoption Agreement (Incorporated by reference to Exhibit 10.16 to the IHS Inc. Annual Report on Form 10-K for the period ended November 30, 2014 (file no. 001-32511) filed with the Securities and Exchange Commission on January 16, 2015) |
10.53+ | IHS Inc. Policy on Recoupment of Incentive Compensation (Incorporated by reference to Exhibit 10.14 to the IHS Inc. Annual Report on Form 10-K for the period ended November 30, 2014 (file no. 001-32511) filed with the Securities and Exchange Commission on January 16, 2015) |
10.54+ | IHS Inc. 2004 Long-Term Incentive Plan- Form of 2007 Restricted Stock Unit Award-Time-Based (Incorporated by reference to Exhibit 10.35 to the IHS Inc. Annual Report on Form 10-K for the period ended November 30, 2006 (file no. 001-32511) filed with the Securities and Exchange Commission on January 24, 2007) |
10.55+ | IHS Inc. 2004 Long-Term Incentive Plan- Form of 2007 Restricted Stock Unit Award-Performance-Based (Incorporated by reference to Exhibit 10.36 to the IHS Inc. Annual Report on Form 10-K for the period ended November 30, 2006 (file no. 001-32511) filed with the Securities and Exchange Commission on January 24, 2007) |
10.56+ | IHS Inc. 2004 Long-Term Incentive Plan- Form of 2010 Restricted Stock Unit Award-Performance-Based (Incorporated by reference to Exhibit 99.1 to the IHS Inc. Current Report on Form 8-K (file no. 001-32511) filed with the Securities and Exchange Commission on December 10, 2010) |
10.57+ | IHS Inc. 2004 Long-Term Incentive Plan- Form of 2011 Restricted Stock Unit Award-Performance-Based (Incorporated by reference to Exhibit 10.17 to the IHS Inc. Annual Report on Form 10-K for the period ended November 30, 2010 (file no. 001-32511) filed with the Securities and Exchange Commission on January 18, 2011) |
10.58+ | IHS Inc. 2004 Long-Term Incentive Plan- Form of 2016 Restricted Stock Unit Award-Time-Based (Incorporated by reference to Exhibit 10.14 of the IHS Markit Ltd. Quarterly Report on Form 10-Q (file no. 001-36495) filed on October 7, 2016) |
10.59+ | Form of Indemnification Agreement between IHS Inc. and its Directors (Incorporated by reference to Exhibit 10.30 to Amendment No. 4 to the IHS Inc. Registration Statement on Form S-1/A (No. 333-122565) filed with the Securities and Exchange Commission on May 20, 2005) |
10.60+ | Contract of Employment for Lance Uggla dated as of July 1, 2014 (Incorporated by reference to Exhibit 10.66 to Amendment No. 1 on Form 10-K/A for IHS Markit Ltd. for the period ended November 30, 2016 (file no. 001-36495) filed with the Securities and Exchange Commission on February 21, 2017) |
10.61+ | First Amendment dated March 19, 2016 to contract of employment for Lance Uggla (Incorporated by reference to Exhibit 10.1 of the IHS Markit Ltd. Quarterly Report on Form 10-Q (file no. 001-36495) filed on March 28, 2017) |
10.62+ | Second Amendment dated January 24, 2017 to contract of employment for Lance Uggla (Incorporated by reference to Exhibit 10.2 of the IHS Markit Ltd. Quarterly Report on Form 10-Q (file no. 001-36495) filed on March 27, 2017) |
10.63+ | Letter Agreement for Todd Hyatt dated October 31, 2013 (Incorporated by reference to Exhibit 10.67 to Amendment No. 1 on Form 10-K/A for IHS Markit Ltd. for the period ended November 30, 2016 (file no. 001-36495) filed with the Securities and Exchange Commission on February 21, 2017) |
10.64+ | Letter Agreement Amendment for Todd Hyatt dated July 8, 2016 (Incorporated by reference to Exhibit 10.68 to Amendment No. 1 on Form 10-K/A for IHS Markit Ltd. for the period ended November 30, 2016 (file no. 001-36495) filed with the Securities and Exchange Commission on February 21, 2017) |
10.65+ | Second Amendment dated February 3, 2017 to letter agreement for Todd Hyatt (Incorporated by reference to Exhibit 10.3 of the IHS Markit Ltd. Quarterly Report on Form 10-Q (file no. 001-36495) filed on March 28, 2017) |
10.66+ | Letter of Assignment for Todd Hyatt dated July 8, 2016 (Incorporated by reference to Exhibit 10.69 to Amendment No. 1 on Form 10-K/A for IHS Markit Ltd. for the period ended November 30, 2016 (file no. 001-36495) filed with the Securities and Exchange Commission on February 21, 2017) |
10.67+ | Employment Agreement for Adam Kansler dated as of July 1, 2014 (Incorporated by reference to Exhibit 10.73 to Amendment No. 1 on Form 10-K/A for IHS Markit Ltd. for the period ended November 30, 2016 (file no. 001-36495) filed with the Securities and Exchange Commission on February 21, 2017) |
10.68+ | Employment Agreement Amendment for Adam Kansler dated as of July 11, 2016 (Incorporated by reference to Exhibit 10.74 to Amendment No. 1 on Form 10-K/A for IHS Markit Ltd. for the period ended November 30, 2016 (file no. 001-36495) filed with the Securities and Exchange Commission on February 21, 2017) |
10.69+ | Amended and Restated Terms of Employment for Adam Kansler (Incorporated by reference to Exhibit 10.2 of the IHS Markit Ltd. Quarterly Report on Form 10-Q (file no. 001-36495) filed on March 27, 2018) |
10.70+ | Amended and Restated Terms of Employment for Jonathan Gear (Incorporated by reference to Exhibit 10.3 of the IHS Markit Ltd. Quarterly Report on Form 10-Q (file no. 001-36495) filed on March 27, 2018) |
10.71 | Credit Agreement, dated as of January 26, 2017 (Incorporated by reference to Exhibit 10.1 of the IHS Markit Ltd. Current Report on Form 8-K (file no. 001-36495) filed on January 26, 2017) |
10.72 | Guaranty Agreement, dated as of January 26, 2017 (Incorporated by reference to Exhibit 10.2 of the IHS Markit Ltd. Current Report on Form 8-K (file no. 001-36495) filed on January 26, 2017) |
93
10.73 | Commitment Letter, dated as of May 19, 2018, by and among IHS Markit Ltd., HSBC Securities (USA) Inc. and HSBC Bank USA, National Association (Incorporated by reference to Exhibit 10.1 of the IHS Markit Ltd. Current Report on Form 8-K (file no. 001-36495) filed on May 23, 2018) |
10.74 | Credit Agreement, dated as of June 25, 2018, by and among IHS Markit Ltd., the lenders from time to time party thereto and Bank of America, N.A., as administrative agent (Incorporated by reference to Exhibit 10.1 of the IHS Markit Ltd. Current Report on Form 8-K (file no. 001-36495) filed on June 26, 2018 (first Form 8-K)) |
10.75 | Credit Agreement, dated as of June 25, 2018, by and among IHS Markit Ltd., the lenders from time to time party thereto and HSBC Bank USA, National Association, as administrative agent (Incorporated by reference to Exhibit 10.2 of the IHS Markit Ltd. Current Report on Form 8-K (file no. 001-36495) filed on June 26, 2018 (first Form 8-K)) |
10.76+ | Employment Agreement for Sari Granat dated as of September 1, 2015 (Incorporated by reference to Exhibit 10.75 to Amendment No. 1 on Form 10-K/A for IHS Markit Ltd. for the period ended November 30, 2016 (file no. 001-36495) filed with the Securities and Exchange Commission on February 21, 2017) |
10.77+ | Employment Agreement Amendment for Sari Granat dated as of July 11, 2016 (Incorporated by reference to Exhibit 10.76 to Amendment No. 1 on Form 10-K/A for IHS Markit Ltd. for the period ended November 30, 2016 (file no. 001-36495) filed with the Securities and Exchange Commission on February 21, 2017) |
10.78+* | |
10.79+* | |
21.1* | |
23.1* | |
24.1* | |
31.1* | |
31.2* | |
32* | |
101.INS | XBRL Instance Document |
101.SCH | XBRL Taxonomy Extension Schema Document |
101.CAL | XBRL Taxonomy Extension Calculation Linkbase Document |
101.DEF | XBRL Taxonomy Extension Definition Linkbase Document |
101.LAB | XBRL Taxonomy Extension Label Linkbase Document |
101.PRE | XBRL Taxonomy Extension Presentation Linkbase Document |
* Filed herewith.
+ Compensatory plan or arrangement.
(c) Financial Statement Schedules
All schedules for the Registrant have been omitted since the required information is not present or because the information is included in the financial statements or notes thereto.
Item 16. | Form 10-K Summary |
None.
94
SIGNATURES
Pursuant to the requirements of Section 13 or 15(d) of the Securities Exchange Act of 1934, the Registrant has duly caused this report to be signed on its behalf by the undersigned, thereunto duly authorized.
IHS MARKIT LTD. | ||||
By: | /s/ Todd S. Hyatt | |||
Name: | Todd S. Hyatt | |||
Title: | Executive Vice President, Chief Financial Officer | |||
Date: | January 18, 2019 | |||
95
Pursuant to the requirements of the Securities Exchange Act of 1934, as amended, this report has been signed by the following persons on behalf of the registrant and in the capacities indicated on January 18, 2019.
Signature | Title | |
/s/ Lance Uggla | Chairman and Chief Executive Officer | |
Lance Uggla | (Principal Executive Officer) | |
/s/ Todd S. Hyatt | Executive Vice President, Chief Financial Officer | |
Todd S. Hyatt | (Principal Financial Officer) | |
/s/ Michael Easton | Senior Vice President and Chief Accounting Officer | |
Michael Easton | (Principal Accounting Officer) | |
* | Director | |
The Lord Browne of Madingley | ||
* | Director | |
Dinyar S. Devitre | ||
* | Director | |
Ruann F. Ernst | ||
* | Director | |
William E. Ford | ||
* | Director | |
Nicoletta Giadrossi | ||
* | Director | |
Balakrishnan S. Iyer | ||
* | Director | |
Robert P. Kelly | ||
* | Director | |
Deborah Doyle McWhinney | ||
* | Director | |
Jean-Paul L. Montupet | ||
* | Director | |
Richard W. Roedel | ||
* | Director | |
James A. Rosenthal | ||
*By: /s/ Todd S. Hyatt | ||
Todd S. Hyatt | ||
Attorney-in-Fact | ||
96