Attached files
| file | filename |
|---|---|
| EX-99.1 - EXHIBIT 99.1 - Western Refining, Inc. | wnrearningsrelease-123116.htm |
| 8-K - 8-K - Western Refining, Inc. | wnr8-kxearningsreleasex123.htm |

Q4 2016 Earnings Review
February 28, 2017

Cautionary Statement on Forward-Looking Statements
This presentation contains forward-looking statements which are protected by the safe harbor
provisions of the Private Securities Litigation Reform Act of 1995. The forward-looking statements
reflect Western Refining, Inc.’s (“Western,” “Western Refining,” or “WNR” as applicable or the context
requires) current expectations regarding future events, results or outcomes. Words such as
“anticipate,” “assume,” “believe,” “budget,” “continue,” “could,” “estimate,” “expect,” “forecast,”
“intend,” “may,” “plan,” “position,” “potential,” “predict,” “project,” “strategy,” “will,” “future” and other
similar terms and phrases are used to identify forward-looking statements. The forward-looking
statements contained herein include, but are not limited to, statements about: first quarter 2017
guidance, including regarding total throughput; direct operating expenses; selling, general and
administrative expenses (“SG&A”); depreciation and amortization; interest expense; budgeted
capital expenditures (including maintenance/regulatory and discretionary expenditures); and crack
spread hedge positions and market pricing. These statements are subject to the general risks
inherent in Western Refining, Inc.’s business. These expectations may or may not be realized.
Some of these expectations may be based upon assumptions or judgments that prove to be
incorrect. In addition, Western’s business and operations involve numerous risks and uncertainties,
many of which are beyond its control, which could result in Western’s expectations not being realized
or otherwise materially affect Western’s financial condition, results of operations, and cash flows.
Additional information relating to the uncertainties affecting Western’s business is contained in its
filings with the Securities and Exchange Commission. The forward-looking statements are only as
of the date made. Except as required by law, Western does not undertake any obligation to (and
expressly disclaims any obligation to) update any forward-looking statements to reflect events or
circumstances after the date such statements were made, or to reflect the occurrence of
unanticipated events.

Q4 2016 Highlights
S Consolidated Adjusted EBITDA of $92.6 million
S Western (excluding WNRL): $55.9 million
S WNRL: $36.7 million
S Completed St. Paul Park turnaround; expanded crude unit capacity by 4,000 barrels
per day
S Assumed 100% ownership of East Coast wholesale marketing business
S Strong retail fuel volumes
S Repaid $125 million of term loan debt
S Dividend of $0.38 per share
($ in millions, except per share data) Q4 2016 Q4 2015
Net income (loss) attributable to Western Refining, Inc. $(10) $14
per Diluted Share $(0.09) $0.14
Net income (loss) attributable to Western excluding special items 1 $(8) $52
per Diluted Share, excluding special items 1 $(0.07) $0.56
Adjusted EBITDA 2 $93 $204
1 See Appendix for further detail on Net Income (loss) excluding special items.
2 Adjusted EBITDA includes an adjustment for non-cash unrealized mark-to-market hedging gains and losses;
see Appendix for reconciliation of Net Income to Adjusted EBITDA and the definition of Adjusted EBITDA.
4
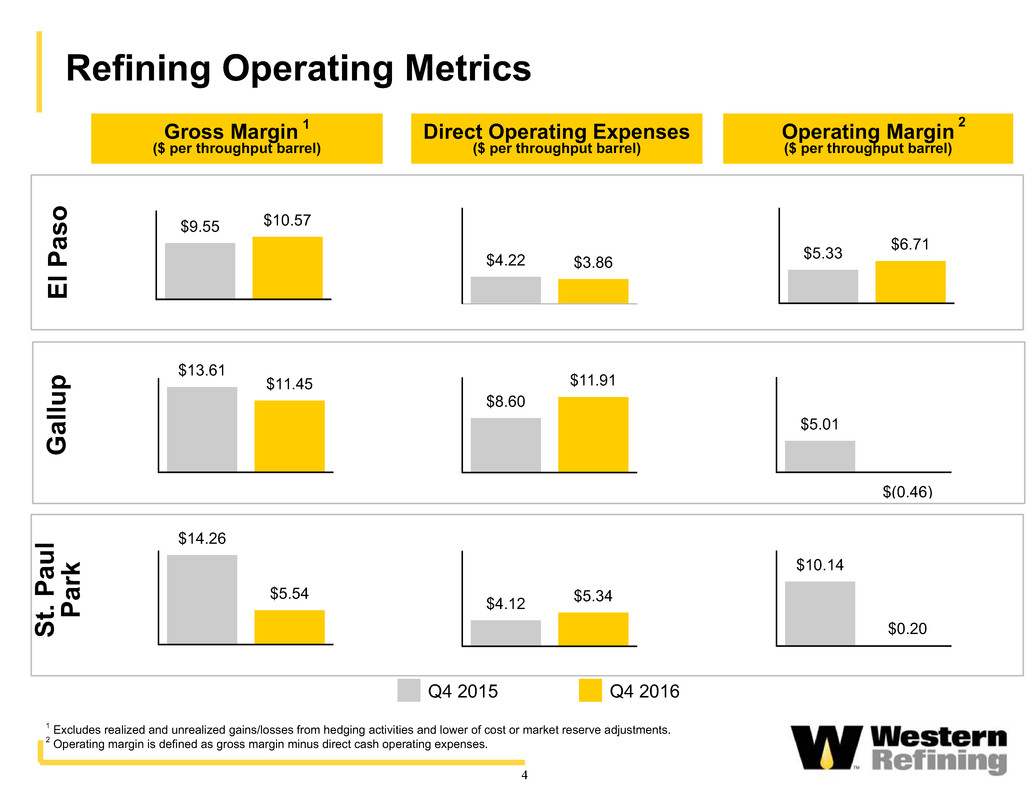
Refining Operating Metrics
Gross Margin 1
($ per throughput barrel)
1 Excludes realized and unrealized gains/losses from hedging activities and lower of cost or market reserve adjustments.
2 Operating margin is defined as gross margin minus direct cash operating expenses.
Direct Operating Expenses
($ per throughput barrel)
Operating Margin
($ per throughput barrel)
Q4 2016 Q4 2015
2
El Pas
o
Gallu
p
$9.55 $10.57
$4.22 $3.86 $5.33
$6.71
$13.61
$11.45
$8.60
$11.91
$5.01
$(0.46)
St. Pau
l
Par
k
$14.26
$5.54 $4.12 $5.34
$10.14
$0.20

5
700
600
500
400
300
200
100
0
$
m
illi
on
s
Beginning
Cash and
Restricted
Cash
9/30/16
Adjusted
EBITDA
Debt
Additions
Debt
Repayments
Cash Taxes
and Cash
Interest Paid
Dividends
Paid
CAPEX Change in
Working
Capital & Other
WNRL
Distributions
Ending
Cash
12/31/16
461.1
268.6
92.6
73.0
53.8
253.2
38.5
42.1
65.9 12.2
Q3 2016 to Q4 2016 Consolidated Cash Flow Bridge
1 Restricted cash as of September 30, 2016 was $195 million.
2 See Appendix for a reconciliation of Net Income to Adjusted EBITDA and the definition of Adjusted EBITDA.
2
Western $ 444.6 $ 55.9 $ 73.0 $ (253.2) $ (37.8) $ (42.1) $ (61.1) $ 59.5 $ 15.1 $ 253.9
WNRL 16.5 36.7 — — (0.7) — (4.8) (5.7) (27.3) 14.7
Total $ 461.1 $ 92.6 $ 73.0 $ (253.2) $ (38.5) $ (42.1) $ (65.9) $ 53.8 $ (12.2) $ 268.6
1

6
Capital Structure
1 NTI debt is non-recourse to Western.
2 Debt levels shown are face value, exclude unamortized financing costs, discounts and premiums.
3 See Appendix for a reconciliation of Net Income to Adjusted EBITDA and the definition of Adjusted EBITDA.
4 Western LTM Adjusted EBITDA includes distributions from WNRL.
As of December 31, 2016
($ millions)
WNR
Consolidated Western
Total Cash $ 269 $ 254
Western
Revolving Credit Facility $ — $ —
Term Loan B-1, due 2020 534 534
Term Loan B-2, due 2023 373 373
6.25% Senior Unsecured Notes due 2021 350 350
NTI
Revolving Credit Facility — —
7.125% Senior Secured Notes, due November 2020 350 350
WNRL
Revolving Credit Facility 20
7.5% Senior Notes, due 2023 300
Total Long-term Debt 2 1,927 1,607
Shareholders' Equity 2,297 1,697
Total Capitalization $ 4,224 $ 3,304
LTM Adjusted EBITDA 3 $ 576 $ 507
Total Debt / LTM Adjusted EBITDA 3.3x 3.2x
Total Debt / Total Capitalization 46% 49%
4
1

7
Operations
El Paso Gallup St. Paul Park
Total Throughput (mbpd) 128 - 132 26 - 28 101 - 105
Direct Operating Expenses ($/Bbl) $4.20 - $4.40 $9.00 - $9.50 $4.50 - $4.70
First Quarter 2017 Guidance
Other
($ millions)
Western WNRL Total
SG&A $50 $6 $56
Depreciation and Amortization $46 $10 $56
Interest Expense $28 $7 $35
FY 2017 Capital Expenditures Budget
Maintenance/Regulatory $120 $16 $136
Discretionary 146 27 173
Total $266 $43 $309
Appendix

9
Reconciliation of Special Items
1 We recompute income taxes after deducting special items and earnings attributable to non-controlling interests.
Three Months Ended
December 31,
2016 2015
(In thousands, except per share data)
Reported diluted earnings (loss) per share $ (0.09) $ 0.14
Income (loss) before income taxes $ (13,364) $ 1,464
Special items:
Loss (gain) and impairments on disposal of assets, net (90) 208
Merger and reorganization costs 8,453 —
Unrealized loss on commodity hedging transactions 22,976 8,160
Net change in lower of cost or market inventory reserve (30,895) 113,667
Loss on extinguishment of debt 3,916 —
Earnings (loss) before income taxes excluding special items (9,004) 123,499
Recomputed income taxes after special items (1) 11,029 (28,737)
Net income (loss) excluding special items 2,025 94,762
Net income attributable to non-controlling interests 9,795 42,572
Net income (loss) attributable to Western excluding special items $ (7,770) $ 52,190
Diluted earnings (loss) per share excluding special items $ (0.07) $ 0.56
1
10
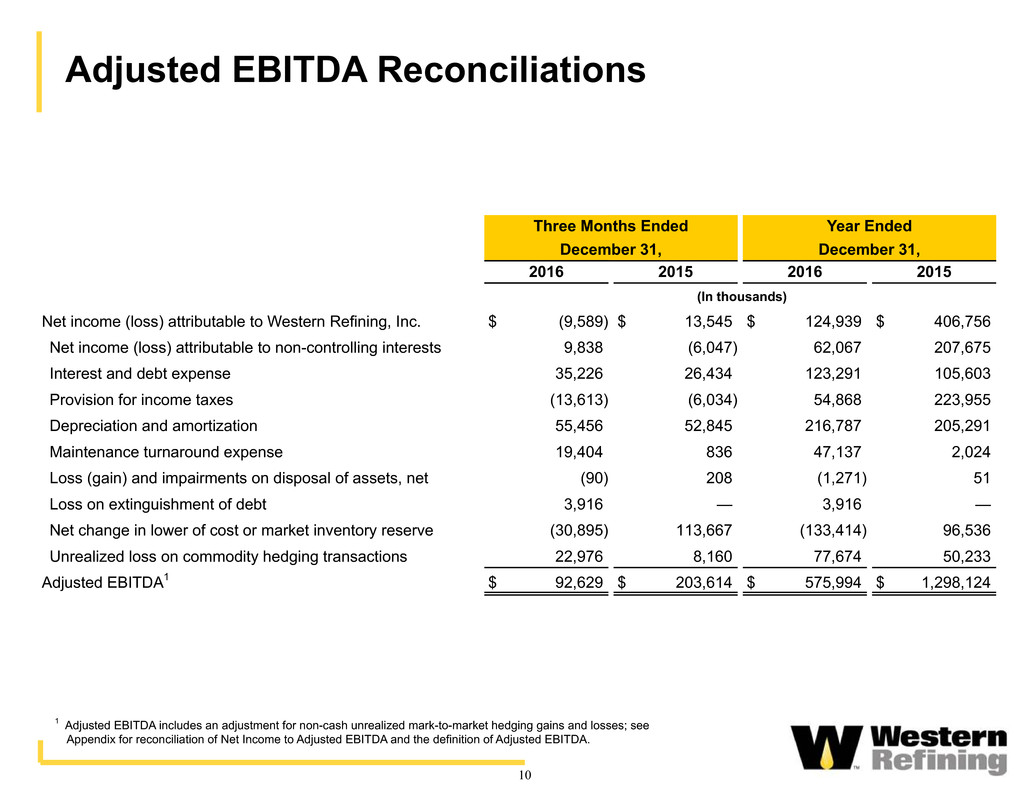
1 Adjusted EBITDA includes an adjustment for non-cash unrealized mark-to-market hedging gains and losses; see
Appendix for reconciliation of Net Income to Adjusted EBITDA and the definition of Adjusted EBITDA.
Adjusted EBITDA Reconciliations
Three Months Ended Year Ended
December 31, December 31,
2016 2015 2016 2015
(In thousands)
Net income (loss) attributable to Western Refining, Inc. $ (9,589) $ 13,545 $ 124,939 $ 406,756
Net income (loss) attributable to non-controlling interests 9,838 (6,047) 62,067 207,675
Interest and debt expense 35,226 26,434 123,291 105,603
Provision for income taxes (13,613) (6,034) 54,868 223,955
Depreciation and amortization 55,456 52,845 216,787 205,291
Maintenance turnaround expense 19,404 836 47,137 2,024
Loss (gain) and impairments on disposal of assets, net (90) 208 (1,271) 51
Loss on extinguishment of debt 3,916 — 3,916 —
Net change in lower of cost or market inventory reserve (30,895) 113,667 (133,414) 96,536
Unrealized loss on commodity hedging transactions 22,976 8,160 77,674 50,233
Adjusted EBITDA1 $ 92,629 $ 203,614 $ 575,994 $ 1,298,124

11
Consolidated Adjusted EBITDA Reconciliations
Three Month Period Ending
Twelve
Months
Ended
(In thousands)
Consolidated Western Refining, Inc. Mar 2016 June 2016 Sep 2016 Dec 2016 Dec 2016
Net income (loss) attributable to Western Refining, Inc. $ 30,538 $ 65,415 $ 38,575 $ (9,589) $ 124,939
Net income attributable to non-controlling interests 9,047 37,449 5,733 9,838 62,067
Interest and debt expense 26,681 26,928 34,456 35,226 123,291
Provision for income taxes 18,629 38,152 11,700 (13,613) 54,868
Depreciation and amortization 52,651 54,359 54,321 55,456 216,787
Maintenance turnaround expense 125 400 27,208 19,404 47,137
Gain and impairments on disposal of assets, net (130) (772) (279) (90) (1,271)
Loss on extinguishment of debt — — — 3,916 3,916
Net change in lower of cost or market inventory reserve (51,734) (35,619) (15,166) (30,895) (133,414)
Unrealized loss on commodity hedging transactions 12,483 14,598 27,616 22,976 77,674
Adjusted EBITDA1 $ 98,290 $ 200,910 $ 184,164 $ 92,629 $ 575,994
1 Adjusted EBITDA includes an adjustment for non-cash unrealized mark-to-market hedging gains and losses; see
Appendix for reconciliation of Net Income to Adjusted EBITDA and the definition of Adjusted EBITDA.

12
Adjusted EBITDA Consolidation
Last Twelve Months
December 31, 2016
Western WNRL
WNR
Consolidated
(In thousands)
Net income attributable to Western Refining, Inc. $ 85,027 $ 39,912 $ 124,939
Net income attributed to non-controlling interests 35,323 26,744 62,067
Interest and debt expense 97,319 25,972 123,291
Provision for income taxes 54,162 706 54,868
Depreciation and amortization 183,909 32,878 216,787
Maintenance turnaround expense 47,137 — 47,137
Gain and impairments on disposal of assets, net (217) (1,054) (1,271)
Loss on extinguishment of debt 3,916 — 3,916
Net change in lower of cost or market inventory reserve (133,414) — (133,414)
Unrealized loss on commodity hedging transactions 77,674 — 77,674
Adjusted EBITDA $ 450,836 $ 125,158 $ 575,994
Distributions from WNRL 56,190
Total Adjusted EBITDA plus Distributions $ 507,026

13
Adjusted EBITDA Reconciliations
The tables on the previous page reconcile net income to Adjusted EBITDA for the periods presented.
Adjusted EBITDA represents earnings before interest and debt expense, provision for income taxes, depreciation,
amortization, maintenance turnaround expense and certain other non-cash income and expense items. However, Adjusted
EBITDA is not a recognized measurement under U.S. generally accepted accounting principles ("GAAP"). Our management
believes that the presentation of Adjusted EBITDA is useful to investors because it is frequently used by securities analysts,
investors and other interested parties in the evaluation of companies in our industry. In addition, our management believes that
Adjusted EBITDA is useful in evaluating our operating performance compared to that of other companies in our industry
because the calculation of Adjusted EBITDA generally eliminates the effects of financings, income taxes, the accounting
effects of significant turnaround activities (that many of our competitors capitalize and thereby exclude from their measures of
EBITDA) and certain non-cash charges that are items that may vary for different companies for reasons unrelated to overall
operating performance.
Adjusted EBITDA has limitations as an analytical tool, and you should not consider it in isolation, or as a substitute for analysis
of our results as reported under GAAP. Some of these limitations are:
• Adjusted EBITDA does not reflect our cash expenditures or future requirements for significant turnaround activities, capital
expenditures or contractual commitments;
• Adjusted EBITDA does not reflect the interest expense or the cash requirements necessary to service interest or principal
payments on our debt;
• Adjusted EBITDA does not reflect changes in, or cash requirements for, our working capital needs; and
• Adjusted EBITDA, as we calculate it, may differ from the Adjusted EBITDA calculations of other companies in our industry,
thereby limiting its usefulness as a comparative measure.
Because of these limitations, Adjusted EBITDA should not be considered a measure of discretionary cash available to us to invest
in the growth of our business. We compensate for these limitations by relying primarily on our GAAP results and using Adjusted
EBITDA only supplementally.

14
Net Positions
Volume Hedged
(000 barrels)
% of Planned
Production Hedged Strike Price
Mark-to-Market Price 1
December 31, 2016
Offsetting
Unrealized Gain
Period Gasoline Distillate Gasoline Distillate Gasoline Distillate Gasoline Distillate Positions ($MM) 2
2017 Q1 850 270 10.9% 4.8% $ 12.45 $ 14.43 $ 16.12 $ 16.17 $ 4.2
Q2 — 120 0.0% 2.0% $ — $ 14.22 $ — $ 15.06 $ 2.5
Q3 — 120 0.0% 2.0% $ — $ 14.22 $ — $ 15.69 $ 2.5
Q4 — 120 0.0% 2.3% $ — $ 14.22 $ — $ 15.93 $ 2.5
2018 Q1 — 150 0.0% 2.5% $ — $ 15.48 $ — $ 16.62 $ —
Q2 — 150 0.0% 2.5% $ — $ 15.48 $ — $ 16.06 $ —
Q3 — 150 0.0% 2.4% $ — $ 15.48 $ — $ 16.57 $ —
Q4 — 150 0.0% 2.4% $ — $ 15.48 $ — $ 16.04 $ —
1 Mark-to-market pricing based on data obtained from the CME Group.
2 Represents unrealized gains on short positions that were closed by the purchase of an offsetting long position during Q4 2016, neither of
which position will be realized until maturity.
US Gulf Coast Products
Crack Spread Hedge Positions
As of December 31, 2016
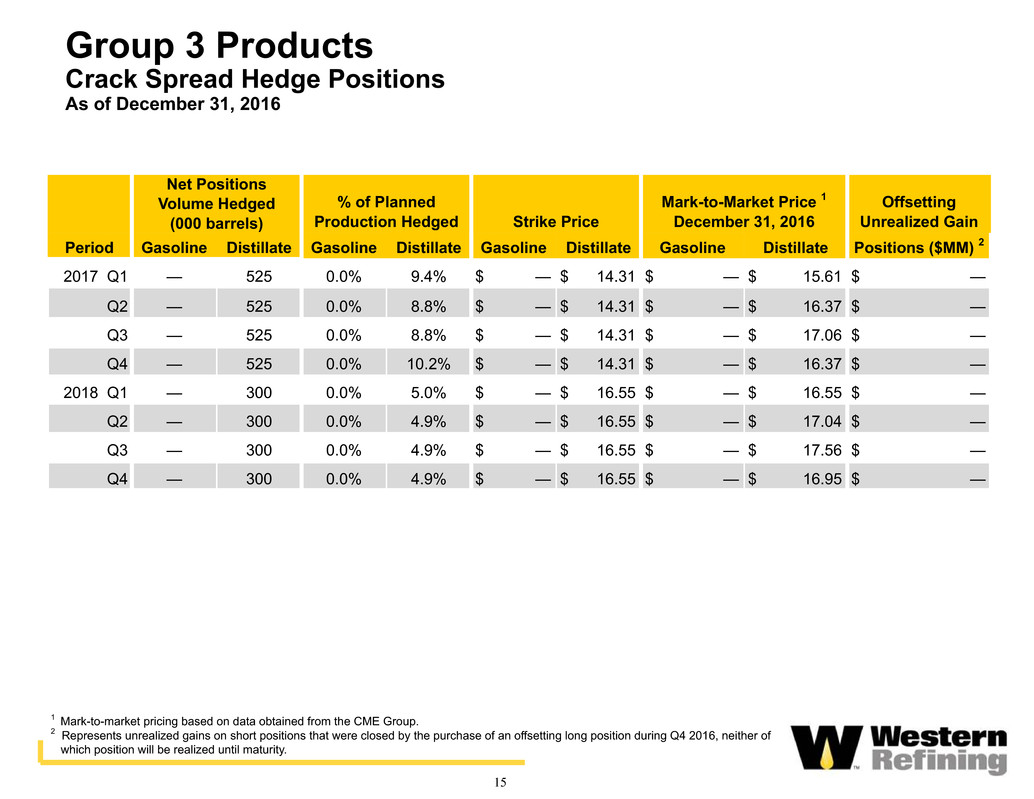
Net Positions
Volume Hedged
(000 barrels)
% of Planned
Production Hedged Strike Price
Mark-to-Market Price 1
December 31, 2016
Offsetting
Unrealized Gain
Period Gasoline Distillate Gasoline Distillate Gasoline Distillate Gasoline Distillate Positions ($MM) 2
2017 Q1 — 525 0.0% 9.4% $ — $ 14.31 $ — $ 15.61 $ —
Q2 — 525 0.0% 8.8% $ — $ 14.31 $ — $ 16.37 $ —
Q3 — 525 0.0% 8.8% $ — $ 14.31 $ — $ 17.06 $ —
Q4 — 525 0.0% 10.2% $ — $ 14.31 $ — $ 16.37 $ —
2018 Q1 — 300 0.0% 5.0% $ — $ 16.55 $ — $ 16.55 $ —
Q2 — 300 0.0% 4.9% $ — $ 16.55 $ — $ 17.04 $ —
Q3 — 300 0.0% 4.9% $ — $ 16.55 $ — $ 17.56 $ —
Q4 — 300 0.0% 4.9% $ — $ 16.55 $ — $ 16.95 $ —
1 Mark-to-market pricing based on data obtained from the CME Group.
2 Represents unrealized gains on short positions that were closed by the purchase of an offsetting long position during Q4 2016, neither of
which position will be realized until maturity.
Group 3 Products
Crack Spread Hedge Positions
As of December 31, 2016
15
16
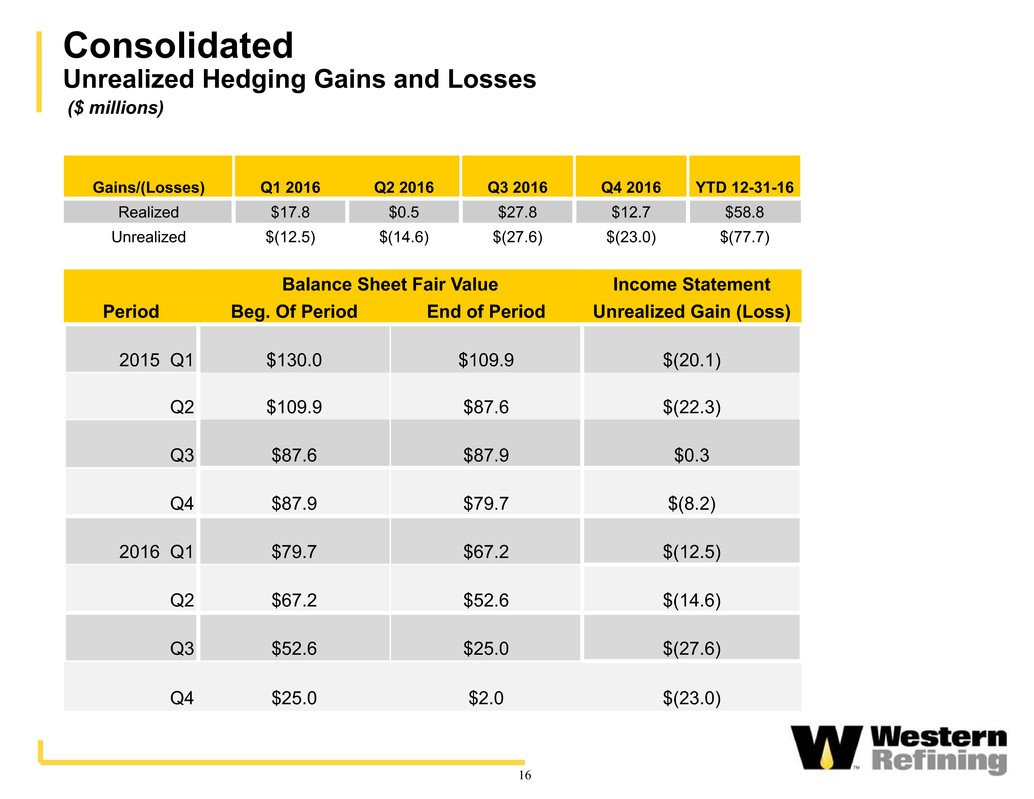
Consolidated
Unrealized Hedging Gains and Losses
($ millions)
Balance Sheet Fair Value Income Statement
Period Beg. Of Period End of Period Unrealized Gain (Loss)
2015 Q1 $130.0 $109.9 $(20.1)
Q2 $109.9 $87.6 $(22.3)
Q3 $87.6 $87.9 $0.3
Q4 $87.9 $79.7 $(8.2)
2016 Q1 $79.7 $67.2 $(12.5)
Q2 $67.2 $52.6 $(14.6)
Q3 $52.6 $25.0 $(27.6)
Q4 $25.0 $2.0 $(23.0)
Gains/(Losses) Q1 2016 Q2 2016 Q3 2016 Q4 2016 YTD 12-31-16
Realized $17.8 $0.5 $27.8 $12.7 $58.8
Unrealized $(12.5) $(14.6) $(27.6) $(23.0) $(77.7)

