Attached files
| file | filename |
|---|---|
| EX-32 - EX-32 - STEPAN CO | scl-ex32_9.htm |
| EX-31.2 - EX-31.2 - STEPAN CO | scl-ex312_10.htm |
| EX-31.1 - EX-31.1 - STEPAN CO | scl-ex311_7.htm |
| EX-24 - EX-24 - STEPAN CO | scl-ex24_8.htm |
| EX-23 - EX-23 - STEPAN CO | scl-ex23_11.htm |
| EX-21 - EX-21 - STEPAN CO | scl-ex21_6.htm |
| EX-10.18 - EX-10.18 - STEPAN CO | scl-ex1018_262.htm |
| EX-10.14 - EX-10.14 - STEPAN CO | scl-ex1014_261.htm |
UNITED STATES
SECURITIES AND EXCHANGE COMMISSION
Washington, D.C. 20549
FORM 10-K
(MARK ONE)
|
☒ |
ANNUAL REPORT PURSUANT TO SECTION 13 OR 15(d) OF THE SECURITIES EXCHANGE ACT OF 1934 |
FOR THE FISCAL YEAR ENDED DECEMBER 31, 2016
OR
|
☐ |
TRANSITION REPORT PURSUANT TO SECTION 13 OR 15(d) OF THE SECURITIES EXCHANGE ACT OF 1934 |
FOR THE TRANSITION PERIOD FROM TO
Commission File Number 1-4462
STEPAN COMPANY
(Exact name of registrant as specified in its charter)
|
Delaware |
|
36-1823834 |
|
(State or other jurisdiction of incorporation or organization) |
|
(I.R.S. Employer Identification Number) |
|
|
|
|
|
Edens and Winnetka Road, Northfield, Illinois |
|
60093 |
|
(Address of principal executive offices) |
|
(Zip Code) |
Registrant’s telephone number including area code: 847-446-7500
Securities registered pursuant to Section 12 (b) of the Act:
|
Title of Each Class |
|
Name of Each Exchange on Which Registered |
|
Common Stock, $1 par value |
|
New York Stock Exchange |
Securities registered pursuant to Section 12 (g) of the Act:
None
Indicate by check mark if the registrant is a well-known seasoned issuer, as defined in Rule 405 of the Securities Act Yes ☒ No ☐
Indicate by check mark if the registrant is not required to file reports pursuant to Section 13 or Section 15(d) of the Act Yes ☐ No ☒
Indicate by check mark whether the registrant (1) has filed all reports required to be filed by Section 13 or 15(d) of the Securities Exchange Act of 1934 during the preceding 12 months (or for such shorter period that the registrant was required to file such reports), and (2) has been subject to such filing requirements for the past 90 days. Yes ☒ No ☐
Indicate by check mark whether the registrant has submitted electronically and posted on its corporate Web site, if any, every Interactive Data File required to be submitted and posted pursuant to Rule 405 of Regulation S-T (§232.405 of this chapter) during the preceding 12 months (or for such shorter period that the registrant was required to submit and post such files). Yes ☒ No ☐
Indicate by check mark if disclosure of delinquent filers pursuant to Item 405 of Regulation S-K is not contained herein, and will not be contained, to the best of registrant’s knowledge, in definitive proxy or information statements incorporated by reference in part III of this Form 10-K or any amendment to this Form 10-K. ☐.
Indicate by check mark whether the registrant is a large accelerated filer, an accelerated filer, a non-accelerated filer or a smaller reporting company. See definitions of “large accelerated filer”, “accelerated filer” and “smaller reporting company” in Rule 12b-2 of the Exchange Act.
|
(Check one): Large accelerated filer ☒ |
Accelerated filer ☐ |
Non-accelerated filer ☐ |
Smaller reporting company ☐ |
Indicate by check mark whether the registrant is a shell company (as defined in Rule 12b-2 of the Exchange Act) Yes ☐ No ☒
Aggregate market value at June 30, 2016, of voting and non-voting common stock held by nonaffiliates of the registrant: $ 1,159,775,366*
Number of shares outstanding of each of the registrant’s classes of common stock as of January 31, 2017:
|
Class |
|
Outstanding at January 31, 2017 |
|
Common Stock, $1 par value |
|
22,424,698 |
Documents Incorporated by Reference
|
Part of Form 10-K |
|
Document Incorporated |
|
Part III, Items 10-14 |
|
Portions of the Proxy Statement for Annual Meeting of Stockholders to be held April 25, 2017. |
* Based on reported ownership by all directors and executive officers at June 30, 2016.
ANNUAL REPORT ON FORM 10-K
December 31, 2016
|
|
|
|
Page No |
|
|
|
|
|
|
Item 1. |
|
3 |
|
|
|
|
5 |
|
|
Item 1A. |
|
6 |
|
|
Item 1B. |
|
13 |
|
|
Item 2. |
|
14 |
|
|
Item 3. |
|
15 |
|
|
Item 4. |
|
16 |
|
|
|
|
|
|
|
|
|
|
|
|
|
|
|
|
|
Item 5. |
|
17 |
|
|
Item 6. |
|
19 |
|
|
Item 7. |
|
Management’s Discussion and Analysis of Financial Condition and Results of Operations |
20 |
|
Item 7A. |
|
39 |
|
|
Item 8. |
|
40 |
|
|
Item 9. |
|
Changes in and Disagreements with Accountants on Accounting and Financial Disclosure |
85 |
|
Item 9A. |
|
85 |
|
|
Item 9B. |
|
86 |
|
|
|
|
|
|
|
|
|
|
|
|
|
|
|
|
|
Item 10. |
|
87 |
|
|
Item 11. |
|
87 |
|
|
Item 12. |
|
Security Ownership of Certain Beneficial Owners and Management and Related Stockholder Matters |
87 |
|
Item 13. |
|
Certain Relationships and Related Transactions, and Director Independence |
87 |
|
Item 14. |
|
87 |
|
|
|
|
|
|
|
|
|
|
|
|
|
|
|
|
|
Item 15. |
|
88 |
|
|
Item 16. |
|
88 |
|
|
|
|
|
|
|
89 |
|||
SPECIAL NOTE REGARDING FORWARD-LOOKING STATEMENTS
Certain statements in this Annual Report on Form 10-K, other than purely historical information, are “forward-looking statements” within the meaning of the Private Securities Litigation Reform Act of 1995, Section 27A of the Securities Act of 1933, as amended, and Section 21E of the Securities Exchange Act of 1934, as amended (the Exchange Act). These statements include statements about Stepan Company’s and its subsidiaries’ (the Company) plans, objectives, strategies, financial performance and outlook, trends, the amount and timing of future cash distributions, prospects or future events and involve known and unknown risks that are difficult to predict. As a result, our actual financial results, performance, achievements or prospects may differ materially from those expressed or implied by these forward-looking statements. In some cases, you can identify forward-looking statements by the use of words such as “may,” “could,” “expect,” “intend,” “plan,” “seek,” “anticipate,” “believe,” “estimate,” “guidance,” “predict,” “potential,” “continue,” “likely,” “will,” “would,” “illustrative” and variations of these terms and similar expressions, or the negative of these terms or similar expressions. Such forward-looking statements are necessarily based upon estimates and assumptions that, while considered reasonable by the Company and its management based on their knowledge and understanding of the business and industry, are inherently uncertain. These statements are not guarantees of future performance, and stockholders should not place undue reliance on forward-looking statements. There are a number of risks, uncertainties and other important factors, many of which are beyond our control, that could cause our actual results to differ materially from the forward-looking statements contained in this Annual Report on Form 10-K. Such risks, uncertainties and other important factors, include, among others, the risks, uncertainties and factors set forth under “Part I-Item IA. Risk Factors” and “Part II-Item 7. Management’s Discussion and Analysis of Financial Condition and Results of Operations,” and the risks and uncertainties related to the following:
|
|
• |
disruptions in production or accidents at, or loss of, any of our manufacturing facilities; |
|
|
• |
global competition and the Company’s ability to successfully compete; |
|
|
• |
volatility of raw material, natural gas and electricity costs as well as any disruption in their supply; |
|
|
• |
disruptions in transportation or significant changes in transportation costs; |
|
|
• |
reduced demand for Company products due to customer product reformulations or new technologies; |
|
|
• |
the Company’s ability to make acquisitions of suitable candidates and successfully integrate acquisitions; |
|
|
• |
the Company’s ability to keep and protect its intellectual property rights; |
|
|
• |
international business risks, including fluctuations in currency exchange rates, legal restrictions and taxes; |
|
|
• |
potentially adverse tax consequences due to the international scope of the Company’s operations; |
|
|
• |
compliance with anti-corruption, environmental, health and safety and product registration laws; |
|
|
• |
the Company’s ability to accurately estimate and maintain appropriate levels of recorded liabilities for existing and future contingencies; |
|
|
• |
the Company’s ability to operate within the limitations of our debt covenants; |
|
|
• |
downgrades to the Company’s credit ratings or disruptions to the Company’s ability to access well-functioning capital markets; |
|
|
• |
downturns in certain industries and general economic downturns; |
|
|
• |
conflicts, military actions, terrorist attacks and general instability, particularly in certain energy-producing nations, along with increased security regulations; |
|
|
• |
cost overruns, delays and miscalculations in capacity needs with respect to the Company’s expansion or other capital projects; |
1
|
|
• |
interruption of, damage to or compromise of the Company’s IT systems and failure to maintain the integrity of customer, colleague or Company data; |
|
|
• |
unfavorable resolution of litigation against us; |
|
|
• |
the Company’s ability to retain its executive management and other key personnel; and |
|
|
• |
the other factors set forth under “Risk Factors.” |
These factors are not necessarily all of the important factors that could cause our actual financial results, performance, achievements or prospects to differ materially from those expressed in or implied by any of our forward-looking statements. Other unknown or unpredictable factors also could harm our results. All forward-looking statements attributable to us or persons acting on our behalf are expressly qualified in their entirety by the cautionary statements set forth above. Forward-looking statements speak only as of the date they are made, and we do not undertake or assume any obligation to update publicly any of these forward-looking statements to reflect actual results, new information or future events, changes in assumptions or changes in other factors affecting forward-looking statements, except to the extent required by applicable laws. If we update one or more forward-looking statements, no inference should be drawn that we will make additional updates with respect to those or other forward-looking statements.
The “Company,” “we,” “our” or “us” means Stepan Company and one or more of its subsidiaries only.
2
Stepan Company, which was incorporated under the laws of the state of Delaware on February 19, 1959, and its subsidiaries produce specialty and intermediate chemicals, which are sold to other manufacturers and used in a variety of end products. The Company has three reportable segments: Surfactants, Polymers and Specialty Products.
Surfactants are chemical agents that affect the interaction between two surfaces; they can provide actions such as detergency (i.e., the ability of water to remove soil from another surface), wetting and foaming, dispersing, emulsification (aiding two dissimilar liquids to mix), demulsification, viscosity modifications and biocidal disinfectants. Surfactants are the basic cleaning agent in detergents for washing clothes, dishes, carpets, fine fabrics, floors and walls. Surfactants are also used for the same purpose in shampoos, body wash and conditioners, fabric softeners, toothpastes, cosmetics and other personal care products. Commercial and industrial applications include emulsifiers for agricultural products, emulsion polymers such as floor polishes and latex foams and coatings, wetting and foaming agents for wallboard manufacturing and surfactants for enhanced oil recovery. In 2016, the Company’s subsidiary in Brazil purchased the commercial business of Tebras Tensoativos do Brazil Ltda. (Tebras) and the sulfonation production facility of PBC Industria Quimica Ltda. (PBC). The acquisition is expected to expand and diversify the Company’s customer base for sulfonated products in Brazil and to provide an opportunity to sell the Company’s broader surfactants portfolio to over 1,200 new customers who management believes will benefit from the Company’s technical service and formulation support.
Polymers, which include polyurethane polyols, polyester resins and phthalic anhydride, are used in a variety of applications. Polyurethane polyols are used in the manufacture of rigid foam for thermal insulation in the construction industry. They are also a raw material base for coatings, adhesives, sealants and elastomers (CASE) applications. Polyester resins, which include liquid and powdered products, are used in CASE and polyurethane systems house applications. Phthalic anhydride is used in polyester resins, alkyd resins, and plasticizers for applications in construction materials and components of automotive, boating, and other consumer products and internally in the Company’s polyols.
Specialty Products are chemicals used in food, flavoring, nutritional supplement and pharmaceutical applications.
MARKETING AND COMPETITION
Principal customers for surfactants are manufacturers of detergents, shampoos, body wash, fabric softeners, toothpastes and cosmetics. In addition, surfactants are sold to the producers of agricultural herbicides and insecticides and lubricating products. Surfactants are also sold into the enhanced oil recovery end markets. Polymers are used in the construction and appliance industries, as well as in applications for the coatings, adhesives, sealants and elastomers industries. Phthalic anhydride, a Polymer product, is also used by automotive, boating and other consumer product companies. Specialty products are used primarily by food, nutritional supplement and pharmaceutical manufacturers.
The Company does not sell directly to the retail market, but sells to a wide range of manufacturers in many industries and has many competitors. The principal methods of competition are product performance, price, technical assistance and adaptability to the specific needs of individual customers. These factors allow the Company to compete on bases other than price alone, reducing the severity of competition as experienced in the sales of commodity chemicals having identical performance characteristics. The Company is one of the leading merchant producers of surfactants in the world. In the case of surfactants, much of the Company’s competition comes from several large global and regional producers and the internal divisions of larger customers. In the manufacture of polymers, the Company competes with the chemical divisions of several large companies, as well as with other small specialty chemical manufacturers. In specialty products, the Company competes with several large firms plus numerous small companies.
MAJOR CUSTOMER AND BACKLOG
The Company did not have any one customer whose business represented more than 10 percent of the Company’s consolidated revenue in 2016, 2015 or 2014. The Company has contract arrangements with certain customers, but volumes are generally contingent on purchaser requirements. Much of the Company’s business is essentially on a “spot delivery basis” and does not involve a significant backlog.
ENERGY SOURCES
Substantially all of the Company’s manufacturing plants operate on electricity and interruptible natural gas. During peak heating demand periods, gas service to all plants may be temporarily interrupted for varying periods ranging from a few days to several months. The plants operate on fuel oil during these periods of interruption. The Company’s operations have not experienced any
3
plant shutdowns or adverse effects upon its business in recent years that were caused by a lack of available energy sources, other than temporary service interruptions brought on by mechanical failure.
RAW MATERIALS
The principal raw materials used by the Company are petroleum or plant based. For 2017, the Company has contracts with suppliers that cover the majority of its forecasted requirements for major raw materials and is not substantially dependent upon any one supplier.
RESEARCH AND DEVELOPMENT
The Company maintains an active research and development program to assist in the discovery and commercialization of new knowledge with the intent that such efforts will be useful in developing a new product or in bringing about a significant improvement to an existing product or process. Total expenses for research and development during 2016, 2015 and 2014 were $34.9 million, $30.3 million, and $27.2 million, respectively. The remainder of research, development and technical service expenses reflected in the consolidated statements of income relates to technical services, which include routine product testing, analytical methods development and sales support service.
ENVIRONMENTAL COMPLIANCE
Compliance with applicable country, state and local regulations regarding the discharge of materials into the environment, or otherwise relating to the protection of the environment, resulted in capital expenditures by the Company of approximately $1.7 million during 2016. These expenditures represented approximately 2 percent of the Company’s total 2016 capital expenditures. Capitalized environmental expenditures are depreciated and charged on a straight-line basis to pretax earnings over their estimated useful lives, which are typically 10 years. Recurring costs associated with the operation and maintenance of facilities for waste treatment and disposal and managing environmental compliance in ongoing operations at our manufacturing locations were approximately $25.0 million in 2016. Compliance with such regulations is not expected to have a material adverse effect on the Company’s earnings and competitive position in the foreseeable future.
EMPLOYMENT
At December 31, 2016 and 2015, the Company employed 2,145 and 2,073 persons, respectively. The Company has collective bargaining agreements with employees at some of its manufacturing locations. While the Company has experienced occasional work stoppages as a result of the collective bargaining process and may experience some work stoppages in the future, management believes that it will be able to negotiate all labor agreements on satisfactory terms. Past work stoppages have not had a significant impact on the Company’s operating results. Overall, the Company believes it has good relationships with its employees.
FOREIGN OPERATIONS AND REPORTING SEGMENTS
See Note 17, Segment Reporting, of the Consolidated Financial Statements (Item 8 of this Form 10-K).
ACQUISITIONS AND DISPOSITIONS
See Note 20, Acquisitions, of the Consolidated Financial Statements (Item 8 of this Form 10-K). See also Note 21, Sale of Product Line, of the Consolidated Financial Statements (Item 8 of this Form 10-K).
WEBSITE
The Company’s website address is www.stepan.com. The Company makes available free of charge on or through its website its code of conduct, annual report on Form 10-K, quarterly reports on Form 10-Q, current reports on Form 8-K, and all amendments to those reports as soon as reasonably practicable after such material is electronically filed with or furnished to the Securities and Exchange Commission. The website also includes the Company’s corporate governance guidelines and the charters for the audit, nominating and corporate governance and compensation and development committees of the Board of Directors.
4
Executive Officers of the Registrant
The Company’s executive officers are elected annually by the Board of Directors at the first meeting following the Annual Meeting of Stockholders to serve through the next annual meeting of the Board and until their respective successors are duly elected and qualified.
The executive officers of the Company, their ages and certain other information as of February 24, 2017, are as follows:
|
Name |
|
Age |
|
Title |
|
Year First Elected Officer |
|
|
|
|
|
|
|
|
|
F. Quinn Stepan, Jr. |
|
56 |
|
Chairman, President and Chief Executive Officer |
|
1997 |
|
Frank Pacholec |
|
61 |
|
Vice President, Strategy and Corporate Development |
|
2003 |
|
Gregory Servatius |
|
57 |
|
Vice President, Human Resources |
|
2006 |
|
Scott C. Mason |
|
58 |
|
Vice President, Supply Chain |
|
2010 |
|
Scott D. Beamer |
|
45 |
|
Vice President and Chief Financial Officer |
|
2013 |
|
Arthur W. Mergner |
|
53 |
|
Vice President and General Manager – Polymers |
|
2014 |
|
Scott R. Behrens |
|
47 |
|
Vice President and General Manager – Surfactants |
|
2014 |
|
Debra A. Stefaniak |
|
55 |
|
Vice President, Business Transformation |
|
2015 |
|
Jennifer A. Hale |
|
55 |
|
Vice President, General Counsel and Secretary |
|
2016 |
|
Robert V. Slone |
|
45 |
|
Vice President, Corporate Technology and Sustainability |
|
2016 |
F. Quinn Stepan, Jr. assumed the position of Chairman of the Company’s Board of Directors on of January 1, 2017. He continues to serve the Company as President and Chief Executive Officer, as he has done since January 2006. He served the Company as President and Chief Operating Officer from 1999 through 2005. From January 1997 until February 1999 he served as Vice President and General Manager – Surfactants. From May 1996 until January 1997 he served as Vice President – Global Laundry and Cleaning Products. From May 1992 until May 1996 he served as Director – Business Management.
Frank Pacholec has served the Company as Vice President, Strategy and Corporate Development since June 2016. He served as Vice President, Research and Development and Corporate Sustainability Officer from May 2010 until June 2016. From April 2003 until May 2010 he served as Vice President, Research and Development.
Gregory Servatius has served the Company as Vice President, Human Resources since February 2006. From April 2003 until January 2006, he served as Vice President, Surfactant Sales. From October 2001 until April 2003, he served as Vice President Functional Products. From 1998 to 2001, he served as the Managing Director of the Company’s European operations.
Scott C. Mason has served the Company as Vice President, Supply Chain since March 2010. From January 2006 until December 2009, he served as Senior Vice President Global Supply Chain and President, Alternative Channels of Nalco Company.
Scott D. Beamer has served the Company as Vice President and Chief Financial Officer since August 2013. From January 2012 until July 2013, he served as Assistant Corporate Controller at PPG Industries, Inc. From June 2008 until December 2011 he served as Chief Financial Officer and Director of Finance – PPG Europe at PPG Industries, Inc.
Arthur W. Mergner has served the Company as Vice President and General Manager – Polymers since April 2014. From June 2013 until April 2014, he served as Vice President – North America Polymers. From July 2008 through June 2013 he served as Vice President, Procurement.
Scott R. Behrens has served the Company as Vice President and General Manager – Surfactants since September 2014. From January 2010 to September 2014 he served as Vice President – Business Management. From November 2008 to January 2010 he served as Vice President – Functional Products.
Debra A. Stefaniak has served the Company as Vice President, Business Transformation since February 2014. From May 2009 to February 2014, she served as Vice President, Global Logistics. From July 2006 to May 2009, she served as Director, Global Logistics.
Jennifer A. Hale has served the Company as Vice President, General Counsel and Secretary since January 2016. From 2013 through 2015, she served as Vice President, Global General Counsel and Strategic Business Consultant at Vita-Mix Holdings Company. From 2007 to 2013, she served as Vice President, General Counsel and Secretary at Dyson, Inc.
Robert V. Slone has served the Company as Vice President, Chief Technology and Sustainability Officer since June 2016. From November 2013 until June 2016, he served as Vice President of Surfactants Product Development. From 2011 to 2013, he served as Director of Technology at British Petroleum/Castrol innoVentures. From 2009 to 2011, he served as R&D Director – Formulations and Materials Science at Dow Chemical.
5
The following discussion identifies the most significant factors that may materially and adversely affect the Company’s business, financial condition, results of operations and cash flows. These and other factors, many of which are beyond the Company’s control, may cause future results of operations to differ materially from past results or those results currently expected or desired. The following information should be read in conjunction with Part II, Item 7, Management’s Discussion and Analysis of Financial Condition and Results of Operations and the consolidated financial statements and related notes included in this Form 10-K.
RISKS RELATED TO OUR BUSINESS
Disruptions in production or accidents at, or loss of, any of our manufacturing facilities may have a material impact on our business, financial position, results of operations and cash flows.
Manufacturing facilities in the Company’s industry are subject to planned and unplanned production shutdowns, turnarounds and outages. Unplanned production disruptions may occur for external reasons, such as natural disasters, weather, disease, strikes, transportation interruption, government regulation, political unrest or terrorism, or internal reasons, such as fire, unplanned maintenance or other manufacturing problems. Certain of our production facilities are, and production facilities acquired or built in the future may be, located in areas where unplanned disruptions are more likely. Alternative facilities with sufficient capacity may not be available, may cost substantially more or may take a significant amount of time to increase production or qualify with Company customers, each of which could negatively impact the Company’s business, financial position, results of operations and cash flows. Further, some of the Company’s products cannot currently be made, or made in the volume required, at more than one of the Company’s locations. For some of these products, the Company has access to external market suppliers, but the Company cannot guarantee that these products will be available to it in amounts sufficient to meet its requirements or at a cost that is competitive with the Company’s cost of manufacturing these products. Long-term production disruptions may cause Company customers to seek alternative supply, which could further adversely affect Company profitability. Although the Company takes precautions to enhance the safety of its operations and minimize the risk of disruptions, the Company’s operations are subject to hazards inherent in the manufacturing of chemical products. These hazards include: chemical spills, pipeline leaks and ruptures, storage tank leaks, discharges or releases of toxic or hazardous substances or gases and other hazards incident to the manufacturing, processing, handling, transportation and storage of dangerous chemicals. Many potential hazards can cause bodily injury and loss of life, severe damage to or destruction of property and equipment and environmental damage, and may result in suspension of operations and the imposition of civil or criminal penalties and liabilities. Furthermore, the Company is subject to present and future claims with respect to workplace exposure, exposure of contractors on Company premises as well as other persons located nearby, workers' compensation and other matters.
The Company maintains property, business interruption, products liability and casualty insurance policies which we believe are in accordance with customary industry practices, as well as insurance policies covering other types of risks, including pollution legal liability insurance. However, some of these potential manufacturing hazards and risks may not be insurable, and when they are insurable, there can be no assurance that the insurance coverage would be sufficient to cover any or all losses resulting from the occurrence of any of these events or that insurance carriers would not deny coverage for these losses even if they are insured. Each of these insurance policies is subject to customary exclusions, deductibles and coverage limits, in accordance with industry standards and practices. As a result of market conditions, premiums and deductibles for certain insurance policies can increase substantially and, in some instances, certain insurance may become unavailable or available only for reduced amounts of coverage. There is also a risk, beyond the reasonable control of the Company, that an insurance carrier may not have the financial resources to cover an insurable loss. As a result, the occurrence of any of these events could have a material adverse effect on the Company’s business, financial position, results of operations and cash flows.
The Company faces significant global competition in each of its operating segments. If the Company cannot successfully compete in the marketplace, its business, financial position, results of operations and cash flows may be materially and adversely affected.
The Company faces significant competition from numerous global companies as well as national, regional and local companies in the markets it serves. Many of the Company’s competitors have access to greater financial resources, which may enable them to invest significant capital into their businesses, including expenditures for research and development. Some of the Company’s competitors have their own raw material resources and may be able to produce products more economically. In addition, some of the Company’s customers have internal manufacturing capabilities that allow them to achieve make-versus-buy economics, which may result at times in the Company gaining or losing business with these customers in volumes that could adversely affect its profitability.
6
To achieve expected profitability levels, the Company must, among other things, maintain the service levels, product quality and performance and competitive pricing necessary to retain existing customers and attract new customers. The Company’s inability to do so could place it at a competitive disadvantage relative to its competitors and if the Company cannot successfully compete in the marketplace, its business, financial position, results of operations and cash flows may be materially and adversely affected.
The volatility of raw material, natural gas and electricity costs as well as any disruption in their supply may result in increased costs and materially and adversely affect the Company’s business, financial position, results of operations and cash flows.
The costs of raw materials, natural gas and electricity represent a substantial portion of the Company’s operating costs. The principal raw materials used in the Company’s products are petroleum-based or plant-based. Natural gas is used in the Company’s manufacturing sites primarily to generate steam for its manufacturing processes. The prices of many of these raw materials have recently increased and been very volatile. These fluctuations in prices may be affected by supply and demand factors, such as general economic conditions, manufacturers’ ability to meet demand, restrictions on the transport of raw material (some of which may be viewed as hazardous), currency exchange rates, political instability or terrorist attacks, all of which are beyond the Company’s control. The Company may not be able to pass increased raw material or energy costs on to customers through increases in product prices as a result of arrangements the Company has with certain customers and competitive pressures in the market. If the Company is unable to minimize the effects of increased raw material and energy costs or pass such increased costs on to customers, or manage any interruption to the supply of raw materials or energy, its business, financial position, results of operations and cash flows may be materially and adversely affected.
The Company relies heavily on third party transportation to deliver raw materials to Company manufacturing facilities and ship products to Company customers. Disruptions in transportation or significant changes in transportation costs could affect the Company’s business, financial position, results of operations and cash flows.
The Company relies heavily on railroads, barges and other over-the-road shipping methods to transport raw materials to its manufacturing facilities and to ship finished product to customers. Transport operations are exposed to various risks, such as extreme weather conditions, natural disasters, work stoppages and operating hazards, as well as interstate transportation regulations. If the Company experiences transportation problems, or if there are significant changes in the cost of these services, the Company may not be able to arrange efficient alternatives and timely means to obtain raw materials or ship finished product, which could result in an adverse effect on Company revenues, costs and operating results.
Customer product reformulations or new technologies can reduce the demand for the Company’s products.
The Company’s products are used in a broad range of customer product applications. Customer product reformulations or development and use of new technologies may lead to reduced consumption of Company-produced products or make some Company products obsolete. It is imperative that the Company develops new products to replace the sales of products that mature and decline in use. The Company’s business, financial position, results of operations and cash flows could be materially and adversely affected if the Company is unable to manage successfully the maturation of existing products and the introduction of new products.
To the extent the Company seeks acquisition opportunities, it may not be able to make acquisitions of suitable candidates or integrate acquisitions successfully.
To the extent the Company seeks acquisition opportunities to expand into new markets and to enhance its position in existing markets throughout the world, it may not be able to successfully identify suitable candidates, negotiate appropriate acquisition terms, obtain financing needed to consummate those acquisitions, complete proposed acquisitions or successfully integrate acquired businesses into its existing operations. In addition, any acquisition, once successfully integrated, may not perform as planned, be accretive to earnings, or otherwise prove beneficial to the Company.
Acquisitions involve numerous risks, including the assumption of undisclosed or unindemnified liabilities, difficulties in the assimilation of the operations, technologies, services and products of the acquired companies and the diversion of management’s attention from other business concerns. In addition, prior acquisitions have resulted, and future acquisitions could result, in the incurrence of substantial additional indebtedness and other expenses.
If the Company is unable to keep and protect its intellectual property rights, the Company’s ability to compete may be negatively impacted.
The Company’s patents and other intellectual property may not prevent competitors from independently developing or selling similar or duplicative products and services, and there can be no assurance that the resources the Company invests to protect its intellectual property will be sufficient or that the Company’s intellectual property portfolio will adequately deter misappropriation or improper use of its technology. The Company could also face competition in some countries where it has not invested in an intellectual property
7
portfolio, or where intellectual property rights are more difficult to obtain and/or assert. In addition, the Company may be the target of aggressive and opportunistic enforcement of patents by third parties, including non-practicing entities. Regardless of the merit of such claims, responding to infringement claims can be expensive and time-consuming. If the Company is found to infringe any third-party rights, it could be required to pay substantial damages or it could be enjoined from offering some of its products and services. Also, there can be no assurances that the Company will be able to obtain or renew from third parties the licenses it may need in the future, and there is no assurance that such licenses can be obtained on reasonable terms.
The Company’s results of operations may be adversely affected by international business risks, including fluctuations in currency exchange rates, legal restrictions and taxes.
The Company has substantial operations outside the U.S. In the year ended December 31, 2016, the Company’s sales outside of the U.S. constituted approximately 39 percent of the Company’s net sales. In addition to the risks described in this Annual Report on Form 10‑K that are common to both the Company’s U.S. and non-U.S. operations, the Company faces, and will continue to face, risks related to the Company’s foreign operations such as:
|
|
• |
variability of intellectual property laws outside the U.S. may impact enforceability and consistency of protection of intellectual property assets; |
|
|
• |
high levels of inflation; |
|
|
• |
fluctuations in foreign currency exchange rates may affect product demand and may adversely affect the profitability in U.S. Dollars of products and services the Company provides in international markets where payment for the Company’s products and services is made in the local currency; |
|
|
• |
political, economic, financial and market conditions may be unstable; |
|
|
• |
changes in labor conditions and difficulties in staffing and managing international operations; |
|
|
• |
differing economic cycles and adverse economic conditions; |
|
|
• |
trade and currency restrictions, including tariffs and currency exchange controls imposed by foreign countries; |
|
|
• |
changes in foreign laws and tax rates or U.S. laws and tax rates with respect to foreign income may unexpectedly increase the rate at which the Company’s income is taxed, impose new and additional taxes on remittances, repatriation or other payments by subsidiaries, or cause the loss of previously recorded tax benefits; |
|
|
• |
greater difficulty enforcing contracts and collecting accounts receivable; |
|
|
• |
enforceability and compliance with U.S. and foreign laws affecting operations outside of the U.S., including the Foreign Corrupt Practices Act (and foreign equivalents), export controls and regulations administered by the Office of Foreign Assets Control. |
The actual occurrence of any or all of the foregoing could have a material adverse effect on the Company’s business, financial position, results of operations and cash flows in the future.
Fluctuations in foreign currency exchange rates could affect Company financial results.
The Company is also exposed to fluctuations in exchange rates. The Company’s results of operations are reported in U.S. dollars. However, outside the U.S., the Company’s sales and costs are denominated in a variety of currencies including the European euro, British pound, Canadian dollar, Mexican peso, Colombian peso, Philippine peso, Brazilian real, Polish zloty, Singapore dollar and Chinese RMB. The Company translates its local currency financial results into U.S. dollars based on average exchange rates prevailing during the reporting period or the exchange rate at the end of that period. During times of a strengthening U.S. dollar, the Company’s reported international sales and earnings may be reduced because the local currency may translate into fewer U.S. dollars. Fluctuations in exchange rates may materially and adversely affect the Company’s business, financial position, results of operations and cash flows.
In all jurisdictions in which the Company operates, the Company is also subject to laws and regulations that govern foreign investment, foreign trade and currency exchange transactions. These laws and regulations may limit the Company’s ability to repatriate cash as dividends or otherwise to the U.S. or to efficiently allocate cash to support strategic initiatives, and may limit the Company’s ability to convert foreign currency cash flows into U.S. dollars. A weakening of the currencies in which the Company generates sales relative to the foreign currencies in which the Company’s costs are denominated may lower the Company’s operating profits and cash flows.
8
The international scope of the Company’s operations and corporate structure may expose the Company to potentially adverse tax consequences.
The Company is subject to taxation in and to the tax laws and regulations of multiple jurisdictions as a result of the international scope of its operations and corporate structure. The Company is also subject to intercompany pricing laws, including those relating to the flow of funds between its entities pursuant to, for example, purchase agreements, licensing agreements or other arrangements. Adverse developments in these laws or regulations, or any change in position regarding the application, administration or interpretation of these laws or regulations in any applicable jurisdiction could have a material adverse effect on the Company’s business, financial position, results of operations and cash flows. In addition, the tax authorities in any applicable jurisdiction may disagree with the positions the Company has taken or intends to take regarding the tax treatment or characterization of any of the Company’s transactions, including the tax treatment or characterization of the Company’s indebtedness. If any applicable tax authorities were to successfully challenge the tax treatment or characterization of any of the Company’s transactions, it could result in the disallowance of deductions, the imposition of withholding taxes on internal deemed transfers or other consequences that could have a material adverse effect on the Company’s business, financial position, results of operations and cash flows.
The Company’s failure to comply with the anti-corruption laws of the United States and various international jurisdictions could negatively impact its reputation and results of operations.
Doing business on a worldwide basis requires the Company to comply with anti-corruption laws and regulations imposed by governments around the world with jurisdiction over our operations, which may include the U.S. Foreign Corrupt Practices Act (“FCPA”) and the U.K. Bribery Act 2010 (the “Bribery Act”), as well as the laws of the countries where the Company does business. These laws and regulations can apply to companies, individual directors, officers, employees and agents, and may restrict the Company’s operations, trade practices, investment decisions and partnering activities. Where they apply, the FCPA and the Bribery Act prohibit, among other things, the Company and its officers, directors, employees and business partners, including joint venture partners and agents acting on the Company’s behalf, from corruptly offering, promising, authorizing or providing anything of value to “foreign officials” for the purposes of influencing official decisions or obtaining or retaining business or otherwise obtaining favorable treatment. The Bribery Act also prohibits non-governmental “commercial” bribery and accepting bribes. Part of the Company’s business may involve dealings with governments and state-owned business enterprises, the employees and representatives of which may be considered “foreign officials” for purposes of the FCPA and the Bribery Act. The Company is also subject to the jurisdiction of various governments and regulatory agencies around the world, which may bring Company personnel and agents into contact with “foreign officials” responsible for issuing or renewing permits, licenses, or approvals or for enforcing other governmental regulations. The Company’s global operations expose it to the risk of violating, or being accused of violating, anti-corruption laws. Any failure on the part of the Company to successfully comply with these laws and regulations may expose the Company to reputational harm as well as significant sanctions, including criminal fines, imprisonment, civil penalties, disgorgement of profits, injunctions and debarment from government contracts, as well as other remedial measures. Investigations of alleged violations can be expensive and disruptive. The Company maintains policies and procedures designed to assist the Company and its subsidiaries in complying with applicable anti-corruption laws. However, there can be no guarantee that these policies and procedures will effectively prevent violations by Company employees or representatives for which the Company may be held responsible, and any such violation could adversely affect the Company’s reputation, business, financial position and results of operations.
The Company is subject to a variety of environmental, health and safety and product registration laws that expose it to potential financial liability and increased operating costs.
The Company’s operations are regulated under a number of federal, state, local and foreign environmental, health and safety laws and regulations that govern, among other things, the discharge of hazardous materials into the air, soil and water as well as the use, handling, storage and disposal of these materials. These laws and regulations include, but are not limited to, the U.S. Clean Air Act, the Clean Water Act, the Resource Conservation and Recovery Act, the Comprehensive Environmental Response, Compensation and Liability Act, the Toxic Substances Control Act, as well as analogous foreign, state and local laws such as Proposition 65, and the Registration, Evaluation, Authorization and Restriction of Chemical Substances Act (REACH). Compliance with these environmental laws and regulations is a major consideration for the Company because the Company is a chemical manufacturing company and uses hazardous materials in some of the Company’s manufacturing processes. In addition, compliance with environmental laws could restrict the Company’s ability to expand its facilities or require the Company to modify its facilities or acquire additional costly pollution control equipment, incur other significant expenses, modify its manufacturing processes or expose the Company to greater liability associated with its production processes and products. The Company has incurred and will continue to incur capital expenditures and operating costs in complying with these laws and regulations. In addition, because the Company generates hazardous wastes during some of its manufacturing processes, the Company, along with any other entity that disposes or arranges for the disposal of the Company’s wastes, may be subject to financial exposure for costs associated with any investigation and remediation of sites at which the Company has disposed or arranged for the disposal of hazardous wastes if those sites become contaminated, even if the Company fully complied with applicable environmental laws at the time of disposal. In the event that new
9
contamination is discovered, the Company may become subject to additional requirements with respect to existing contamination or the Company’s clean-up obligations.
The transportation of certain raw materials is highly regulated and is subject to increased regulation or restrictions, which may restrict or prohibit transport of these raw materials, resulting in these raw materials not being available to the Company in quantities desired by the Company or at costs attractive to the Company, which may restrict or substantially limit the Company’s manufacturing operations.
The Company is also subject to numerous federal, state, local and foreign laws that regulate the manufacture, storage, distribution and labeling of many of the Company’s products, including some of the Company’s disinfecting, sanitizing and antimicrobial products. Some of these laws require the Company to have operating permits for the Company’s production facilities, warehouse facilities and operations. Various federal, state, local and foreign laws and regulations also require the Company to register the Company’s products and to comply with specified requirements with respect to those products. If the Company fails to comply with any of these laws and regulations, it may be liable for damages and the costs of remedial actions in excess of the Company’s recorded liabilities, and may also be subject to fines, injunctions or criminal sanctions or to revocation, non-renewal or modification of the Company’s operating permits and revocation of the Company’s product registrations. Any such revocation, modification or non-renewal may require the Company to cease or limit the manufacture and sale of its products at one or more of the Company’s facilities, which may limit or prevent the Company’s ability to meet product demand or build new facilities and may have a material adverse effect on the Company’s business, financial position, results of operations and cash flows. Any such revocation, non-renewal or modification may also result in an event of default under the indenture for the Company’s notes or under the Company’s credit facilities, which, if not cured or waived, may result in the acceleration of all the Company’s indebtedness.
In addition to the costs of complying with environmental, health and safety requirements, the Company has incurred and may incur in the future costs defending against environmental litigation and/or investigations brought by government agencies and private parties. The Company is, and may be in the future, a defendant in lawsuits brought by parties alleging environmental damage, personal injury or property damage. A significant judgment or settlement, to the extent not covered by existing insurance policies, against the Company could have a material adverse effect on its business, financial position, results of operations and cash flows. Although the Company has insurance that may cover some of these potential losses, there is always uncertainty as to whether such insurance may be available to the Company based on case-specific factors and the specific provisions of the Company’s insurance policies.
The potential cost to the Company relating to environmental, health and safety and product registration matters, including the cost of complying with the foregoing legislation and remediating contamination, is uncertain due to factors such as the unknown magnitude and type of possible contamination and clean-up costs, the complexity and evolving nature of laws and regulations relating to the environment, health and safety and product registration, including those outside of the U.S., and the timing, variable costs and effectiveness of clean-up and compliance methods. Environmental and product registration laws may also become more stringent over time, imposing greater compliance costs and increasing risks and penalties associated with any violation, as well as restricting or prohibiting the sale of existing or new products, which may also negatively impact the Company’s operating results. Without limiting the foregoing, these laws or regulations may restrict or prohibit the use of non-renewable or carbon-based substances, or impose fees or penalties for the use of these substances. Accordingly, the Company may become subject to additional liabilities and increased operating costs in the future under these laws and regulations. The impact of any such changes, which are unknown at this time, may have a material adverse effect on the Company’s business, financial position, results of operations and cash flows.
The Company’s inability to accurately estimate and maintain appropriate levels of recorded liabilities for existing and future contingencies may materially and adversely affect the Company’s business, financial position, results of operations and cash flows.
The liabilities recorded by the Company for pending and threatened legal proceedings are estimates based on various assumptions. An adverse ruling or external forces, such as changes in the rate of inflation, the regulatory environment and other factors that could prove such assumptions to be no longer appropriate, may affect the accuracy of these estimates. Given the uncertainties inherent in such estimates, the Company’s actual liabilities could differ significantly from the estimated amounts the Company records in its financial statements with respect to existing and future contingencies. If the Company’s actual liability is higher than estimated or any new legal proceeding is initiated or other contingency occurs, it could materially and adversely affect the Company’s business, financial position, results of operations and cash flows.
10
The Company has a significant amount of indebtedness and may incur additional indebtedness, or need to refinance existing indebtedness, in the future, which may adversely affect the Company’s business, financial position, results of operations and cash flows.
The Company has a significant amount of indebtedness and may incur additional indebtedness in the future. As of December 31, 2016, the Company had $317.0 million of debt on its balance sheet. U.S. debt included $309.6 million in unsecured promissory notes with maturities extending from 2017 until 2027.
The Company’s foreign subsidiaries also maintain bank term loans and short-term bank lines of credit in their respective countries to meet working capital requirements as well as to fund capital expenditure programs and acquisitions. As of December 31, 2016, the Company’s foreign subsidiaries’ aggregate outstanding debt totaled $7.4 million.
The Company’s current indebtedness and any additional indebtedness incurred in the future may materially and adversely affect its business, financial position, results of operations and cash flows. For example, it could:
|
|
• |
require the Company to dedicate a substantial portion of cash flow from operations to pay principal and interest on the Company’s debt, which would reduce funds available to fund future working capital, capital expenditures and other general operating requirements; |
|
|
• |
limit the Company’s ability to borrow funds that may be needed to operate and expand its business; |
|
|
• |
limit the Company’s flexibility in planning for or reacting to changes in the Company’s business and the industries in which the Company operates; |
|
|
• |
increase the Company’s vulnerability to general adverse economic and industry conditions or a downturn in the Company’s business; and |
|
|
• |
place the Company at a competitive disadvantage compared to its competitors that have less debt. |
The Company’s loan agreements contain provisions, which, among others, require maintenance of certain financial ratios and place limitations on additional debt, investments and payment of dividends. Failure to comply with these loan agreements would require debt restructuring that could be materially adverse to the Company’s financial position, results of operations and cash flows.
An increase in interest rates could limit the ability of the Company to incur additional debt to fund the Company’s strategic plans or to refinance maturing debt without incurring significant additional cost, and could make borrowings under the Company’s credit facility or other floating rate debt materially more expensive. Additionally, any future disruptions in the credit and financial markets may reduce the availability of debt financing or refinancing and increase the costs associated with such financing. If the Company is unable to secure financing on satisfactory terms, or at all, its business financial position, results of operations and cash flows may be materially and adversely affected.
The Company could be adversely affected by downgrades to its credit ratings or disruptions in its ability to access well-functioning capital markets.
Historically, the Company has relied on the debt capital markets to fund portions of its capital investments and access to bank credit facilities as part of its working capital management strategy. The Company’s continued access to these markets, and the terms of such access, depend on multiple factors including the condition of debt capital markets, the Company’s operating performance, and its credit ratings. These ratings are based on a number of factors, which include rating agencies’ assessment of the Company’s financial strength and financial policies. There can be no assurance that any particular rating assigned to the Company will remain in effect for any given period of time or that a rating will not be changed or withdrawn by a rating agency, if in that rating agency’s judgment, future circumstances relating to the basis of the rating so warrant. Incurrence of additional debt by the Company could adversely affect its credit ratings. The Company depends on banks and other financial institutions to provide credit to its business and perform under the Company’s agreements with them. Defaults by one or more of these counterparties on their obligations to the Company could materially and adversely affect it. Any downgrade of the Company’s credit ratings could materially adversely affect its cost of funds, liquidity, competitive position and access to capital markets and increase the cost of and counterparty risks associated with existing facilities, which could materially and adversely affect Company business operations, financial condition, and results of operations.
Downturns in certain industries and general economic downturns may have an adverse effect on the Company’s business, financial position, results of operations and cash flows
Economic downturns may adversely affect users of some end products that are manufactured using the Company’s products and the industries in which such end products are used. These users may reduce their volume of purchases of such end products during economic downturns, which would reduce demand for the Company’s products. Additionally, uncertain conditions in the credit
11
markets pose a risk to the overall economy that may impact consumer and customer demand of some of the Company’s products, as well as the Company’s ability to manage normal commercial relationships with its customers, suppliers and creditors. Some of the Company’s customers may not be able to meet the terms of sale and suppliers may not be able to fully perform their contractual obligations due to tighter credit markets or a general slowdown in economic activity.
In the event that economic conditions worsen or result in a prolonged downturn or recession, the Company’s business, financial position, results of operations and cash flows may be materially and adversely affected.
Conflicts, military actions, terrorist attacks and general instability, particularly in certain energy-producing nations, along with increased security regulations related to our industry, could adversely affect the Company’s business.
Conflicts, military actions and terrorist attacks have precipitated economic instability and turmoil in financial markets. Instability and turmoil, particularly in energy-producing nations, may result in raw material cost increases. The uncertainty and economic disruption resulting from hostilities, military action or acts of terrorism may impact any or all of the Company’s facilities and operations or those of its suppliers or customers. Accordingly, any conflict, military action or terrorist attack that impacts the Company or any of its suppliers or customers, could have a material adverse effect on the Company’s business, results of operations, financial position, results of operations and cash flows.
Cost overruns, delays and miscalculations in capacity needs with respect to the Company’s expansion or other capital projects could adversely affect the Company’s business, financial position, results of operations and cash flows.
From time to time, the Company initiates expansion and other significant capital projects. Projects of this type are subject to risks of delay or cost overruns inherent in any large construction project resulting from numerous factors, including the following: shortages of equipment, materials or skilled labor; work stoppages; unscheduled delays in the delivery of ordered materials and equipment; unanticipated cost increases; difficulties in obtaining necessary permits or in meeting permit conditions; difficulties in meeting regulatory requirements or obtaining regulatory approvals; availability of suppliers to certify equipment for existing and enhanced regulations; design and engineering problems; and failure or delay of third party service providers, civil unrest and labor disputes. Significant cost overruns or delays in completing a project could have a material adverse effect on the Company’s return on investment, results of operations and cash flows. In addition, if the Company misjudges its future capacity needs, this too could negatively impact its operations, financial condition and results of operations.
The Company relies extensively on information technology (IT) systems to conduct its business. Interruption of, damage to or compromise of the Company’s IT systems and failure to maintain the integrity of customer, colleague or Company data could harm the Company’s reputation and have an adverse effect on the Company’s business, financial position, results of operations and cash flows.
The Company relies on IT systems for most areas of operations, including production, supply chain, research and development, finance, human resource and regulatory functions. The Company’s ability to effectively manage its business depends on the security, reliability and adequacy of these systems. IT system failures due to events including but not limited to network disruptions, programming errors, computer viruses and security breaches (e.g., cyber-attacks) could impact production activities, impede shipment of products, cause delays or cancellations of customer orders, or hamper the processing of transactions or reporting of financial results. These or similar occurrences, whether accidental or intentional, could result in theft, unauthorized use or publication of our intellectual property and/or confidential business information, which could harm our reputation and competitive position, reduce the value of our investment in research and development and other strategic initiatives, result in a loss of business, as well as remedial and other costs, fines, investigations, enforcement actions or lawsuits or otherwise adversely affect our business.
The Company continues to develop and enhance controls and security measures to protect against the risk of theft, loss or fraudulent or unlawful use of customer, colleague or company data, and it maintains an ongoing process to re-evaluate the adequacy of its controls and measures. The Company may also be required to expend additional resources to continue to enhance its information privacy and security measures and/or to investigate and remediate any information security vulnerabilities. The Company maintains what it believes to be adequate and collectible insurance in the event of the theft, loss, fraudulent or unlawful use of customer, colleague or company data, but any such occurrences could result in costs which may not be covered or may be in excess of any available insurance that the Company may have procured. While the Company has a comprehensive program in place for continuously reviewing, maintaining, testing and upgrading its IT systems and security, there can be no assurance that such efforts will prevent breakdowns or breaches in Company systems that could adversely affect the Company’s business, financial position, results of operations and cash flows.
12
Various liability claims could materially and adversely affect the Company’s financial position, operating results and cash flows.
The Company may be required to pay for losses or injuries purportedly caused by its products. The Company faces an inherent exposure to various types of claims including general liability, product liability, product recall, toxic tort and environmental (“claims”), among others, if its products, or the end products that are manufactured with the Company’s products, result in property damage, injury or death. In addition, because the Company conducts business in multiple jurisdictions, the Company also faces an inherent exposure to other general claims based on its operations in those jurisdictions and the laws of those jurisdictions, including but not limited to claims arising from its relationship with employees, distributors, agents and customers, and other parties with whom it has a business relationship, directly or indirectly. Many of these claims may be made against the Company even if there is no evidence of a loss from that claim, and these claims may be either made by individual entities, or potentially a group of plaintiffs in a class action. Defending these claims could result in significant legal expenses relating to defense costs and/or damage awards and diversion of management’s time and the Company’s resources. Any claim brought against the Company could materially and adversely affect the Company’s business financial position, results of operations and cash flows.
The Company’s success depends on its executive management and other key personnel.
The Company’s future success depends to a significant degree on the skills, experience and efforts of its executive management and other key personnel and their ability to provide the Company with uninterrupted leadership and direction. The availability of highly qualified talent is limited, and the competition for talent is robust and the Company may not be able to recruit and retain the personnel it needs if it were to lose an existing member of senior management. The Company’s future success will depend on its ability to have adequate succession plans in place and to attract, retain and develop qualified personnel. A failure to efficiently replace executive management members and other key personnel and to attract, retain and develop new qualified personnel could have an adverse effect on the Company’s business financial position, results of operations and cash flows.
Item 1B. Unresolved Staff Comments
None
13
The following are the Company’s principal plants and other important physical properties. Unless otherwise noted, the listed properties are owned by the Company. Management believes that the facilities are suitable and adequate for the Company’s current operations.
|
|
Name of Facility |
Location |
Site Size |
Segment |
|
1. |
Millsdale |
Millsdale (Joliet), Illinois |
492 acres |
Surfactants/Polymers |
|
2. |
Fieldsboro |
Fieldsboro, New Jersey |
45 acres |
Surfactants |
|
3. |
Anaheim |
Anaheim, California |
8 acres |
Surfactants |
|
4. |
Winder |
Winder, Georgia |
202 acres |
Surfactants |
|
5. |
Maywood |
Maywood, New Jersey |
19 acres |
Surfactants / Specialty Products |
|
6. |
Columbus |
Columbus, Georgia |
29.8 acres |
Polymers |
|
7. |
Stepan France |
Voreppe, France |
20 acres |
Surfactants |
|
8. |
Stepan Mexico |
Matamoros, Mexico |
13 acres |
Surfactants |
|
9. |
Stepan Germany |
Wesseling, Germany |
12 acres |
Surfactants/Polymers |
|
10. |
Stepan UK |
Stalybridge, United Kingdom |
11 acres |
Surfactants |
|
11. |
Stepan Colombia |
Manizales, Colombia |
5 acres |
Surfactants |
|
12. |
Stepan China |
Nanjing, China (Nanjing Chemical Industrial Park) |
13 acres (right of use arrangement) |
Polymers |
|
13. |
Stepan Brazil |
Vespasiano, Minas Gerais, Brazil |
27 acres |
Surfactants |
|
14. |
Tebras Tensoativos Do Brasil Ltda. and PBC Industria Quimica Ltda. |
Salto, Sao Paulo, Brazil |
7 acres |
Surfactants |
|
15. |
Stepan Philippines |
Bauan, Batangas, Philippines |
9 acres (leased) |
Surfactants |
|
16. |
Stepan Poland |
Brzeg Dolny, Poland |
4 acres (perpetual use right) |
Polymers |
|
17. |
Stepan Asia |
Jurong Island, Singapore |
8 acres (leased) |
Surfactants |
|
18. |
Company Headquarters and Central Research Laboratories |
Northfield, Illinois |
8 acres |
N/A |
|
19. |
Company Corporate Supply Chain, Human Resources, Legal and Finance Functions |
Northbrook, Illinois |
3.25 acres |
N/A |
14
There are a variety of legal proceedings pending or threatened against the Company that occur in the normal course of the Company’s business, the majority of which relate to environmental matters. Some of these proceedings may result in fines, penalties, judgments or costs being assessed against the Company at some future time. The Company’s operations are subject to extensive local, state and federal regulations, including the U.S. Comprehensive Environmental Response, Compensation and Liability Act of 1980 (CERCLA) and the Superfund amendments of 1986 (Superfund). Over the years, the Company has received requests for information relative to or has been named by government authorities as a potentially responsible party (PRP) at a number of sites where cleanup costs have been or may be incurred under CERCLA and similar state statutes. In addition, damages are being claimed against the Company in general liability actions for alleged personal injury or property damage in the case of some disposal and plant sites. The Company believes that it has made adequate provisions for the costs it may incur with respect to these sites. For most of these sites, the involvement of the Company is expected to be minimal. The most significant sites are described below:
Maywood, New Jersey Site
The Company’s property in Maywood, New Jersey and property formerly owned by the Company adjacent to its current site and other nearby properties (Maywood site) were listed on the National Priorities List in September 1993 pursuant to the provisions of CERCLA because of certain alleged chemical contamination. Pursuant to an Administrative Order on Consent entered into between the U.S. Environmental Protection Agency (USEPA) and the Company for property formerly owned by the Company, and the issuance of an order by USEPA to the Company for property currently owned by the Company, the Company has completed various Remedial Investigation Feasibility Studies (RI/FS), and on September 24, 2014, USEPA issued its Record of Decision (ROD) for chemically-contaminated soil. USEPA has not yet issued a ROD for chemically-contaminated groundwater for the Maywood site. Based on the most current information available, the Company believes its recorded liability represents its best estimate of the cost of remediation for the Maywood site. The best estimate of the cost of remediation for the Maywood site could change as the Company continues to hold discussions with USEPA, as the design of the remedial action progresses, if a groundwater ROD is issued or if other PRPs are identified. The ultimate amount for which the Company is liable could differ from the Company’s current recorded liability.
In April 2015, the Company entered into an Administrative Settlement Agreement and Administrative Order on Consent with USEPA which requires payment of certain costs and performance of certain investigative and design work for chemically-contaminated soil. Based on the Company’s review and analysis of this order, no changes to the Company’s current recorded liability for claims associated with soil remediation of chemical contamination were required.
In addition, under the terms of a settlement agreement reached on November 12, 2004, the United States Department of Justice and the Company agreed to fulfill the terms of a Cooperative Agreement reached in 1985 under which the United States will take title to and responsibility for radioactive waste removal at the Maywood site, including past and future remediation costs incurred by the United States. As such, the Company recorded no liability related to this settlement agreement.
D’Imperio Property Site
During the mid-1970’s, Jerome Lightman and the Lightman Drum Company disposed of hazardous substances at several sites in New Jersey. The Company was named as a PRP in a lawsuit in the U.S. District Court for the District of New Jersey that involved the D’Imperio Property Site located in New Jersey. In 2016, the PRPs were provided with updated remediation cost estimates which were considered in the Company’s determination of its range of estimated possible losses and liability balance. The changes in range of possible losses and liability balance were immaterial. Remediation work is continuing at this site. Based on current information, the Company believes that its recorded liability represents its best estimate of the cost of remediation for the D’Imperio site. Depending on the ultimate cost of the remediation at this site, the amount for which the Company is liable could differ from the current estimates.
Wilmington Site
The Company is currently contractually obligated to contribute to the response costs associated with the Company’s formerly-owned site at 51 Eames Street, Wilmington, Massachusetts. Remediation at this site is being managed by its current owner, to whom the Company sold the property in 1980. Under the agreement, once total site remediation costs exceed certain levels, the Company is obligated to contribute up to five percent of future response costs associated with this site with no limitation on the ultimate amount of contributions. The Company had paid the current owner $2.5 million for the Company’s portion of environmental response costs through December 31, 2016. The Company has recorded a liability for its portion of the estimated remediation costs for the site. Depending on the ultimate cost of the remediation at this site, the amount for which the Company is liable could differ from the current estimates.
The Company and other prior owners also entered into an agreement in April 2004 waiving certain statute of limitations defenses for claims which may be filed by the Town of Wilmington, Massachusetts, in connection with this site. While the Company
15
has denied any liability for any such claims, the Company agreed to this waiver while the parties continue to discuss the resolution of any potential claim which may be filed.
The Company believes that based on current information it has adequate reserves for the claims related to this site. However, depending on the ultimate cost of the remediation at this site, the amount for which the Company is liable could differ from the current estimates.
Other Matters
The Company has been named as a de minimis PRP at other sites, and as such the Company believes that a resolution of its liability will not have a material impact on the financial position, results of operations or cash flows of the Company.
Item 4. Mine Safety Disclosures
Not Applicable.
16
Item 5. Market for Registrant’s Common Equity, Related Stockholder Matters and Issuer Purchases of Equity Securities
|
(a) |
The Company’s common stock is listed and traded on the New York Stock Exchange. As of the close of trading on January 31, 2017, the market price for the Company’s common stock was $78.11. See the table below for New York Stock Exchange quarterly market price information. |
|
Quarterly Stock Data |
|
|||||||||||||||
|
|
|
Stock Price Range |
|
|||||||||||||
|
|
|
2016 |
|
|
2015 |
|
||||||||||
|
Quarter |
|
High |
|
|
Low |
|
|
High |
|
|
Low |
|
||||
|
First |
|
$ |
56.50 |
|
|
$ |
41.42 |
|
|
$ |
41.80 |
|
|
$ |
37.20 |
|
|
Second |
|
$ |
63.32 |
|
|
$ |
54.00 |
|
|
$ |
55.22 |
|
|
$ |
41.34 |
|
|
Third |
|
$ |
73.90 |
|
|
$ |
56.89 |
|
|
$ |
55.67 |
|
|
$ |
40.49 |
|
|
Fourth |
|
$ |
87.00 |
|
|
$ |
67.85 |
|
|
$ |
54.87 |
|
|
$ |
40.72 |
|
|
Year |
|
$ |
87.00 |
|
|
$ |
41.42 |
|
|
$ |
55.67 |
|
|
$ |
37.20 |
|
On February 19, 2013, the Board of Directors of Stepan Company authorized the Company to repurchase up to 1,000,000 shares of its outstanding common stock. During 2016, 43,835 shares of Company common stock were purchased in the open market. These shares were recorded as treasury stock in the Company’s balance sheet. At December 31, 2016, 717,929 shares remained available for repurchase under the February 19, 2013, authorization. The timing and amount of the repurchases are determined by the Company’s management based on its evaluation of market conditions and share price. Shares will be repurchased with cash in open market or private transactions in accordance with applicable securities and stock exchange rules.
|
(b) |
On January 31, 2017, there were 1,649 holders of record of common stock of the Company. |
|
(c) |
There were no purchases of shares of the Company’s stock by the Company during the fourth quarter of 2016. |
|
(d) |
See the table below for quarterly dividend information. |
Dividends Declared Per Common Share
|
Quarter |
|
2016 |
|
|
2015 |
|
||
|
First |
|
$ |
0.19 |
|
|
$ |
0.18 |
|
|
Second |
|
$ |
0.19 |
|
|
$ |
0.18 |
|
|
Third |
|
$ |
0.19 |
|
|
$ |
0.18 |
|
|
Fourth |
|
$ |
0.21 |
|
|
$ |
0.19 |
|
|
Year |
|
$ |
0.78 |
|
|
$ |
0.73 |
|
The Company has increased its dividends for 49 consecutive years.
The Company has material debt agreements that restrict the payment of dividends. See the Liquidity and Financial Condition section of Part II, Item 7, Management’s Discussion and Analysis, for a description of the restrictions. See also Note 6, Debt, of the consolidated financial statements (Item 8 of this Form 10-K) for the amount of retained earnings available for dividend distribution at December 31, 2016.
17
The following stock performance graph compares the yearly change since December 31, 2011, in cumulative return on the common stock of the Company on a dividend reinvested basis to the Dow Jones Chemical Industry Index and the Russell 2000 Index. The Dow Jones Chemical Industry Index is a market-capitalization weighted grouping of 35 chemical companies, including major manufacturers of both basic and specialty products. The Company is not included in the Dow Jones Chemical Industry Index. The Russell 2000 Index is a market-capitalization weighted grouping of 2,000 small to medium sized companies in a broad range of industries. The Company has been included in the Russell 2000 Index since 1992. The graph assumes $100 was invested on December 31, 2011, and shows the cumulative total return as of each December 31 thereafter.
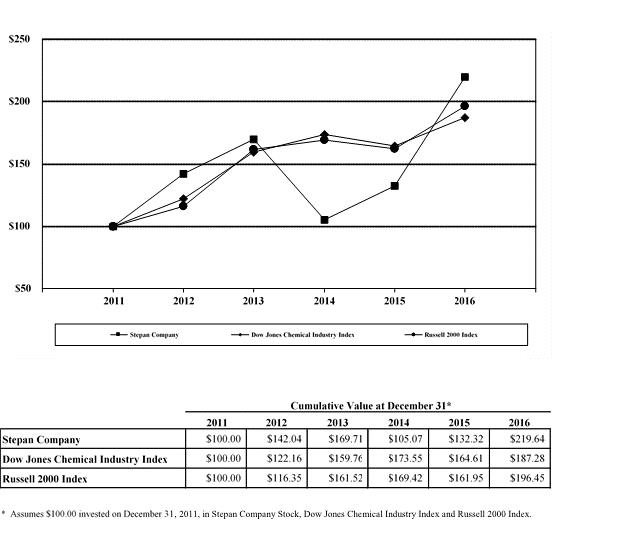
18
Item 6. Selected Financial Data
(In thousands, except per share data)
|
For the Year |
|
2016 |
|
|
2015 |
|
|
2014 |
|
|
2013 |
|
|
2012 |
|
|||||
|
Net Sales |
|
$ |
1,766,166 |
|
|
$ |
1,776,167 |
|
|
$ |
1,927,213 |
|
|
$ |
1,880,786 |
|
|
$ |
1,803,737 |
|
|
Operating Income |
|
|
126,193 |
|
|
|
122,790 |
|
|
|
90,694 |
|
|
|
109,153 |
|
|
|
128,716 |
|
|
Percent of Net Sales |
|
|
7.1 |
% |
|
|
6.9 |
% |
|
|
4.7 |
% |
|
|
5.8 |
% |
|
|
7.1 |
% |
|
Income Before Provision for Income Taxes |
|
|
113,816 |
|
|
|
102,856 |
|
|
|
75,535 |
|
|
|
95,630 |
|
|
|
115,722 |
|
|
Percent of Net Sales |
|
|
6.4 |
% |
|
|
5.8 |
% |
|
|
3.9 |
% |
|
|
5.1 |
% |
|
|
6.4 |
% |
|
Provision for Income Taxes (a) |
|
|
27,618 |
|
|
|
26,819 |
|
|
|
18,454 |
|
|
|
23,293 |
|
|
|
36,035 |
|
|
Net Income Attributable to Stepan Company (a) |
|
|
86,191 |
|
|
|
75,968 |
|
|
|
57,101 |
|
|
|
72,828 |
|
|
|
79,396 |
|
|
Per Diluted Share (a) |
|
|
3.73 |
|
|
|
3.32 |
|
|
|
2.49 |
|
|
|
3.18 |
|
|
|
3.49 |
|
|
Percent of Net Sales |
|
|
4.9 |
% |
|
|
4.3 |
% |
|
|
3.0 |
% |
|
|
3.9 |
% |
|
|
4.4 |
% |
|
Percent to Total Stepan Company Stockholders’ Equity (b) |
|
|
14.5 |
% |
|
|
13.9 |
% |
|
|
10.5 |
% |
|
|
14.1 |
% |
|
|
18.0 |
% |
|
Cash Dividends Paid |
|
|
17,329 |
|
|
|
16,300 |
|
|
|
15,387 |
|
|
|
14,474 |
|
|
|
12,757 |
|
|
Per Common Share |
|
|
0.7800 |
|
|
|
0.7300 |
|
|
|
0.6900 |
|
|
|
0.6500 |
|
|
|
0.5800 |
|
|
Depreciation and Amortization |
|
|
74,967 |
|
|
|
66,985 |
|
|
|
63,804 |
|
|
|
56,400 |
|
|
|
51,294 |
|
|
Capital Expenditures |
|
|
103,076 |
|
|
|
119,349 |
|
|
|
101,819 |
|
|
|
92,865 |
|
|
|
83,159 |
|
|
Weighted-average Common Shares Outstanding (Diluted) |
|
|
23,094 |
|
|
|
22,858 |
|
|
|
22,917 |
|
|
|
22,924 |
|
|
|
22,730 |
|
|
|
|
|
|
|
|
|
|
|
|
|
|
|
|
|
|
|
|
|
|
|
|
As of Year End |
|
|
|
|
|
|
|
|
|
|
|
|
|
|
|
|
|
|
|
|
|
Working Capital |
|
$ |
388,276 |
|
|
$ |
376,329 |
|
|
$ |
326,043 |
|
|
$ |
339,557 |
|
|
$ |
275,911 |
|
|
Current Ratio |
|
|
2.3 |
|
|
|
2.5 |
|
|
|
2.3 |
|
|
|
2.3 |
|
|
|
2.1 |
|
|
Property, Plant and Equipment, Net |
|
|
582,714 |
|
|
|
555,463 |
|
|
|
524,195 |
|
|
|
494,042 |
|
|
|
422,022 |
|
|
Total Assets |
|
|
1,353,890 |
|
|
|
1,239,661 |
|
|
|
1,162,014 |
|
|
|
1,167,202 |
|
|
|
985,478 |
|
|
Long-term Debt Obligations, Less Current Maturities (c) |
|
|
288,859 |
|
|
|
313,817 |
|
|
|
246,897 |
|
|
|
235,246 |
|
|
|
149,564 |
|
|
Total Stepan Company Stockholders’ Equity |
|
|
634,604 |
|
|
|
556,984 |
|
|
|
535,546 |
|
|
|
552,286 |
|
|
|
478,985 |
|
|
|
(a) |
The 2016 amounts for the noted items lack comparability with the prior years due to the Company’s early adoption of the new accounting guidance regarding stock-based compensation. See Note 1 to the consolidated financial statements (Item 8 of this Form 10-K) for additional information regarding Accounting Standards Update No. 2016-9. |
|
|
(b) |
Based on average equity. |
|
|
(c) |
Amounts for 2012 through 2015 have been changed from those originally reported as a result of the Company’s January 1, 2016, adoption of the new accounting guidance regarding the classification of debt issuance costs. See Note 1 to the consolidated financial statements (Item 8 of this Form 10-K) for additional information regarding Accounting Standards Update No. 2015-3. |
19
Item 7. Management’s Discussion and Analysis of Financial Condition and Results of Operations
The following is management’s discussion and analysis (MD&A) of certain significant factors that have affected the Company’s financial condition and results of operations during the annual periods included in the accompanying consolidated financial statements.
Overview
The Company produces and sells intermediate chemicals that are used in a wide variety of applications worldwide. The overall business comprises three reportable segments:
|
• |
Surfactants – Surfactants, which accounted for 67 percent of Company consolidated net sales in 2016, are principal ingredients in consumer and industrial cleaning products such as detergents for washing clothes, dishes, carpets, floors and walls, as well as shampoos and body washes. Other applications include fabric softeners, germicidal quaternary compounds, lubricating ingredients, emulsifiers for spreading agricultural products and industrial applications such as latex systems, plastics and composites. Surfactants are manufactured at five North American sites, three European sites (United Kingdom, France and Germany), five Latin American sites (Mexico, Colombia and three sites in Brazil) and two Asian sites (Philippines and Singapore). In 2016, the Company shut down its production facility in Canada, moving the production of goods previously manufactured in Canada to other Company North American production sites. Manufacturing operations at that facility have ceased, but decommissioning activities will continue into 2017. In October 2016, the Company’s subsidiary in Brazil closed on its previously announced agreement to acquire the commercial business of Tebras Tensoativos do Brazil Ltda. and the sulfonation production facility of PBC Industria Quimica Ltda. See Business Acquisition section below. In late 2016, a major customer of the Company’s Bahia, Brazil, plant exited the product line for which the Company was supplying them product. As a result, asset impairments were required (see Note 22 to the consolidated financial statements for additional information). Prior to 2016, the Company also held a 50 percent ownership interest in a joint venture, TIORCO, LLC (TIORCO), that marketed chemical solutions for enhanced oil recovery (EOR). The joint venture was accounted for under the equity method, and its financial results were excluded from surfactant segment operating results. In October 2015, the Company and its partner, Nalco Company (a subsidiary of Ecolab Inc.), made the decision to dissolve TIORCO. No business activities have been conducted since the fourth quarter of 2015. Legal dissolution of TIORCO is finalized. |
|
• |
Polymers – Polymers, which accounted for 28 percent of consolidated net sales in 2016, include polyurethane polyols, polyester resins and phthalic anhydride. Polyurethane polyols are used in the manufacture of rigid foam for thermal insulation in the construction industry and are also a base raw material for coatings, adhesives, sealants and elastomers (collectively, CASE products) and flexible foams. Polyester resins, which include liquid and powdered products, are used in CASE and polyurethane systems house applications. CASE, polyester resins and flexible foam are collectively referred to as specialty polyols. Phthalic anhydride is used in unsaturated polyester resins, alkyd resins and plasticizers for applications in construction materials and components of automotive, boating and other consumer products. In addition, the Company uses phthalic anhydride internally in the production of polyols. In the United States, polyurethane polyols and phthalic anhydride are manufactured at the Company’s Millsdale, Illinois, site and specialty polyols are manufactured at the Company’s Columbus, Georgia, site. In Europe, polyurethane polyols are manufactured at the Company’s subsidiary in Germany, and specialty polyols are manufactured at the Company’s Poland subsidiary. In China, polyurethane polyols and specialty polyols are manufactured at the Company’s Nanjing, China, manufacturing plant that was commissioned in early 2016. |
|
• |
Specialty Products – Specialty Products, which accounted for five percent of consolidated net sales in 2016, include flavors, emulsifiers and solubilizers used in food, flavoring, nutritional supplement and pharmaceutical applications. Specialty products are primarily manufactured at the Company’s Maywood, New Jersey, site and, in some instances, at outside contractors. |
20
On October 3, 2016, the Company’s subsidiary in Brazil acquired the commercial business of Tebras Tensoativos do Brazil Ltda. (Tebras) and the sulfonation production facility of PBC Industria Quimica Ltda. (PBC). The purchase price of the acquisitions, including adjustments for working capital, was approximately $29.1 million. The combined entities have 25,000 metric tons of sulfonation capacity and a large, diverse customer portfolio. The acquisition is expected to expand and diversify the Company’s customer base for sulfonated products in Brazil and to provide an opportunity to sell the Company’s broader surfactant portfolio to over 1,200 new customers who could benefit from the Company’s technical service and formulation support. The acquired businesses are included in the Company’s Surfactants segment. The acquired entities’ contributions to Company net sales and net income for the year ended December 31, 2016, were insignificant. See Note 20 to the consolidated financial statements for further information regarding the business acquisition.
Deferred Compensation Plans
The accounting for the Company’s deferred compensation plans can cause period-to-period fluctuations in Company expenses and profits. Compensation expense results when the values of Company common stock and mutual fund investment assets held for the plans increase, and compensation income results when the values of Company common stock and mutual fund investment assets decline. The pretax effect of all deferred compensation-related activities (including realized and unrealized gains and losses on the mutual fund assets held to fund the deferred compensation obligations) and the income statement line items in which the effects of the activities were recorded are presented in the following table:
|
|
|
Income (Expense) For the Year Ended December 31 |
|
|
|
|
|
|
|||||
|
(In millions) |
|
2016 |
|
|
2015 |
|
|
Change |
|
|
|||
|
Deferred Compensation (Operating expenses) |
|
$ |
(16.8 |
) |
|
$ |
(6.5 |
) |
|
$ |
(10.3 |
) |
(1) |
|
Investment Income (Other, net) |
|
|
0.6 |
|
|
|
0.8 |
|
|
|
(0.2 |
) |
|
|
Realized/Unrealized Gains on Investments (Other, net) |
|
|
0.1 |
|
|
|
0.1 |
|
|
|
— |
|
|
|
Pretax Income Effect |
|
$ |
(16.1 |
) |
|
$ |
(5.6 |
) |
|
$ |
(10.5 |
) |
|
|
|
|
Income (Expense) For the Year Ended December 31 |
|
|
|
|
|
|
|||||
|
(In millions) |
|
2015 |
|
|
2014 |
|
|
Change |
|
|
|||
|
Deferred Compensation (Operating expenses) |
|
$ |
(6.5 |
) |
|
$ |
11.9 |
|
|
$ |
(18.4 |
) |
(1) |
|
Investment Income (Other, net) |
|
|
0.8 |
|
|
|
1.2 |
|
|
|
(0.4 |
) |
|
|
Realized/Unrealized Gains on Investments (Other, net) |
|
|
0.1 |
|
|
|
0.3 |
|
|
|
(0.2 |
) |
|
|
Pretax Income Effect |
|
$ |
(5.6 |
) |
|
$ |
13.4 |
|
|
$ |
(19.0 |
) |
|
|
|
(1) |
See the applicable Corporate Expenses section of this MD&A for details regarding the period-to-period changes in deferred compensation. |
|
Below are the year-end Company common stock market prices used in the computation of deferred compensation expense:
|
|
|
December 31 |
|
|||||||||||||
|
|
|
2016 |
|
|
2015 |
|
|
2014 |
|
|
2013 |
|
||||
|
Company Stock Price |
|
$ |
81.48 |
|
|
$ |
49.69 |
|
|
$ |
40.08 |
|
|
$ |
65.63 |
|
21
Effects of Foreign Currency Translation
The Company’s foreign subsidiaries transact business and report financial results in their respective local currencies. As a result, foreign subsidiary income statements are translated into U.S. dollars at average foreign exchange rates appropriate for the reporting period. Because foreign exchange rates fluctuate against the U.S. dollar over time, foreign currency translation affects year-over-year comparisons of financial statement items (i.e., because foreign exchange rates fluctuate, similar year-to-year local currency results for a foreign subsidiary may translate into different U.S. dollar results). The following tables present the effects that foreign currency translation had on the year-over-year changes in consolidated net sales and various income line items for 2016 compared to 2015 and 2015 compared to 2014:
|
|
|
For the Year Ended December 31 |
|
|
Increase |
|
|
(Decrease) Due to Foreign Currency |
|
|||||||
|
(In millions) |
|
2016 |
|
|
2015 |
|
|
(Decrease) |
|
|
Translation |
|
||||
|
Net Sales |
|
$ |
1,766.2 |
|
|
$ |
1,776.2 |
|
|
$ |
(10.0 |
) |
|
$ |
(42.9 |
) |
|
Gross Profit |
|
|
338.5 |
|
|
|
308.2 |
|
|
|
30.3 |
|
|
|
(5.9 |
) |
|
Operating Income |
|
|
126.2 |
|
|
|
122.8 |
|
|
|
3.4 |
|
|
|
(3.7 |
) |
|
Pretax Income |
|
|
113.8 |
|
|
|
102.9 |
|
|
|
10.9 |
|
|
|
(3.6 |
) |
|
|
|
For the Year Ended |
|
|
|
|
|
|
(Decrease) Due |
|
||||||
|
|
|
December 31 |
|
|
Increase |
|
|
to Foreign Currency |
|
|||||||
|
(In millions) |
|
2015 |
|
|
2014 |
|
|
(Decrease) |
|
|
Translation |
|
||||
|
Net Sales |
|
$ |
1,776.2 |
|
|
$ |
1,927.2 |
|
|
$ |
(151.0 |
) |
|
$ |
(131.8 |
) |
|
Gross Profit |
|
|
308.2 |
|
|
|
249.6 |
|
|
|
58.6 |
|
|
|
(21.6 |
) |
|
Operating Income |
|
|
122.8 |
|
|
|
90.7 |
|
|
|
32.1 |
|
|
|
(13.2 |
) |
|
Pretax Income |
|
|
102.9 |
|
|
|
75.5 |
|
|
|
27.4 |
|
|
|
(12.7 |
) |
Results of Operations
2016 Compared with 2015
Summary
Net income attributable to the Company for 2016 increased 13 percent to $86.2 million, or $3.73 per diluted share, from $76.0 million, or $3.32 per diluted share, for 2015. Adjusted net income increased 24 percent to $98.2 million, or $4.25 per diluted share, from $79.4 million, or $3.46 per diluted share (See the “Reconciliations of Non-GAAP Adjusted Net Income and Diluted Earnings per Share” section of this MD&A for reconciliations between reported net income attributable to the Company and reported earnings per diluted share and non-GAAP adjusted net income and adjusted earnings per diluted share). Below is a summary discussion of the major factors leading to the year-over-year changes in net sales, profits and expenses. A detailed discussion of segment operating performance for 2016 compared to 2015 follows the summary.
Consolidated net sales declined $10.0 million, or one percent, between years. Sales volume increased six percent, which had a $114.0 million favorable effect on the year-over-year change in net sales. All three reportable segments contributed to the consolidated sales volume improvement. By segment, sales volume increased five percent, 12 percent and eight percent for Surfactants, Polymers and Specialty Products, respectively. The effect of increased consolidated sales volume was more than offset by lower selling prices and the unfavorable effects of foreign currency translation, which negatively affected the year-over-year net sales change by $81.1 million and $42.9 million, respectively. The decreased selling prices were primarily attributable to declines in raw material costs. Overall unit margins improved slightly between years. The unfavorable foreign currency translation effect reflected a stronger U.S. dollar against all currencies for countries where the Company has foreign operations.
Operating income for 2016 improved $3.4 million, or three percent, over operating income for 2015 despite current year restructuring and asset impairment charges of $7.1 million and increased deferred compensation expense of $10.3 million. Operating income improved for Polymers and Specialty Products. Surfactant segment operating income declined four percent largely due to the settlement of two customer claims and accelerated depreciation related to the cessation of manufacturing operations at the Company’s Canadian plant. Last year’s operating income included a $2.9 million gain on the sale of the Company’s specialty polyurethane systems product line. Foreign currency translation had an unfavorable $3.7 million effect on the year-over-year consolidated operating income change.
22
Operating expenses (including the business restructuring and asset impairment expenses) increased $24.0 million, or 13 percent, between years. Changes in the individual income statement line items that comprise the Company’s operating expenses were as follows:
|
|
• |
Selling expenses increased $1.7 million, or three percent, year over year largely due to higher U.S. fringe benefit expenses ($1.0 million), which reflected increased incentive-based compensation (which includes stock-based compensation, bonuses and profit sharing) recognized as a result of the year-over-year improvement in Company financial performance and in Company common stock value. |
|
|
• |
Administrative expenses declined $0.9 million, or one percent, year over year. The decrease was attributable to lower consulting expense ($5.2 million) as external resources related to the initiative to improve efficiency across the Company’s global organization (referred to as DRIVE) were not used in 2016. Partially offsetting the lower consulting expense were higher fringe benefit ($2.3 million) and salary ($1.2 million) expenses. Higher U.S. incentive-based compensation led to the increase in fringe benefit expense. Legal and environmental expense also increased by $0.9 million primarily due to adjustments to Company environmental liabilities. |
|
|
• |
Research, development and technical service (R&D) expenses increased $5.8 million, or 12 percent, year over year. Higher expense for U.S. salaries and the related fringe benefits ($3.9 million) was the major contributor to the increase. In addition, foreign R&D expenses grew $0.4 million, as some of the Company’s non-U.S. subsidiaries have added product development resources to support their local needs. The accumulation of increases for a number of other expense items accounted for the remainder of the year-over-year variance. |
|
|
• |
Deferred compensation plan expense was $10.3 million higher in 2016 than in 2015 due to a significantly larger increase in the value of Company common stock during 2016 than for 2015. See the “Overview” and “Corporate Expenses” sections of this MD&A for further details. |
|
|
• |
Business restructuring and asset impairment charges totaled $7.1 million in 2016. There were no such charges in 2015. Restructuring expenses related to the closure of the Company’s surfactant plant in Canada amounted to $2.8 million. In addition, the Company recognized impairment charges of $4.3 million. See Note 22 to the consolidated financial statements for additional information. The business restructuring and asset impairment charges were excluded from the determination of segment operating income. |
Net interest expense for 2016 declined $1.3 million, or nine percent, from net interest expense for 2015. The decline in interest expense was principally attributable to higher interest income earned on excess cash. Lower average debt levels due to scheduled repayments also contributed.
In the fourth quarter of 2015, the Company and its partner agreed to dissolve the TIORCO joint venture and, therefore, the Company has reported no results in the loss from equity joint venture line in 2016. The Company’s share of TIORCO’s loss for the 2015 was $7.0 million.
Other, net income for 2016 declined $0.8 million, or 48 percent, from other, net income for 2015. Foreign exchange activity resulted in an insignificant loss in 2016 compared to a $0.7 million gain in 2015. Investment income (including realized and unrealized gains and losses) for the Company’s deferred compensation and supplemental defined contribution mutual fund assets declined $0.1 million between years to $0.8 million in 2016 from $0.9 million in 2015.
The effective tax rate was 24.3 percent in 2016 compared to 26.1 percent in 2015. The decrease was attributable to the following items: 1) a tax benefit derived from the early adoption of Accounting Standards Update No. 2016-9, Compensation – Stock Compensation (Topic 718): Improvement to Employee Share-Based Payment Accounting (see Recent Accounting Pronouncements in Note1 to the consolidated financial statements); 2) an unrecognized tax benefit recorded in 2015 that was nonrecurring in 2016; and 3) a more favorable geographical mix of income in 2016. This decrease was partially offset by the 2011 and 2012 Agricultural Chemicals Security Credit tax benefit recorded in 2015 that was nonrecurring in 2016. See Note 9 to the consolidated financial statements for a reconciliation of the statutory U.S. federal income tax rate to the effective tax rate.
23
|
(Dollars in thousands) |
|
For the Year Ended |
|
|
|
|
|
|
|
|
|
|||||
|
Net Sales |
|
December 31, 2016 |
|
|
December 31, 2015 |
|
|
Increase (Decrease) |
|
|
Percent Change |
|
||||
|
Surfactants |
|
$ |
1,181,563 |
|
|
$ |
1,205,849 |
|
|
$ |
(24,286 |
) |
|
|
-2 |
|
|
Polymers |
|
|
498,826 |
|
|
|
491,488 |
|
|
|
7,338 |
|
|
|
1 |
|
|
Specialty Products |
|
|
85,777 |
|
|
|
78,830 |
|
|
|
6,947 |
|
|
|
9 |
|
|
Total Net Sales |
|
$ |
1,766,166 |
|
|
$ |
1,776,167 |
|
|
$ |
(10,001 |
) |
|
|
-1 |
|
|
(Dollars in thousands) |
|
For the Year Ended |
|
|
|
|
|
|
|
|
|
|||||
|
Operating Income |
|
December 31, 2016 |
|
|
December 31, 2015 |
|
|
Increase (Decrease) |
|
|
Percent Change |
|
||||
|
Surfactants |
|
$ |
99,796 |
|
|
$ |
104,080 |
|
|
$ |
(4,284 |
) |
|
|
-4 |
|
|
Polymers |
|
|
96,788 |
|
|
|
80,942 |
|
|
|
15,846 |
|
|
|
20 |
|
|
Specialty Products |
|
|
10,698 |
|
|
|
4,397 |
|
|
|
6,301 |
|
|
|
143 |
|
|
Segment Operating Income |
|
$ |
207,282 |
|
|
$ |
189,419 |
|
|
$ |
17,863 |
|
|
|
9 |
|
|
Corporate Expenses, Excluding Deferred Compensation and Restructuring |
|
|
57,220 |
|
|
|
60,129 |
|
|
|
(2,909 |
) |
|
|
-5 |
|
|
Deferred Compensation Expense |
|
|
16,805 |
|
|
|
6,500 |
|
|
|
10,305 |
|
|
|
159 |
|
|
Business Restructuring and Asset Impairments |
|
|
7,064 |
|
|
|
— |
|
|
|
7,064 |
|
|
NM |
|
|
|
Total Operating Income |
|
$ |
126,193 |
|
|
$ |
122,790 |
|
|
$ |
3,403 |
|
|
|
3 |
|
Surfactants
Surfactants 2016 net sales declined $24.3 million, or two percent, from net sales reported in 2015. Sales volume increased five percent between years, which had a $58.5 million positive effect on the year-over-year net sales change. All regions, except Europe, contributed to the sales volume improvement. Decreased selling prices and foreign currency translation had negative effects of $48.3 million and $34.5 million, respectively, on the net sales change. North American operations accounted for most of the decline in selling prices, which reflected lower year-over-year costs for major raw materials and a less favorable sales mix. The foreign currency translation effect resulted from a stronger U.S. dollar compared to all currencies of the segment’s foreign operations. A year-over-year comparison of net sales by region follows:
|
|
|
For the Year Ended |
|
|
|
|
|
|
|
|
|
|||||
|
(Dollars in thousands) |
|
December 31, 2016 |
|
|
December 31, 2015 |
|
|
Increase (Decrease) |
|
|
Percent Change |
|
||||
|
North America |
|
$ |
724,619 |
|
|
$ |
737,713 |
|
|
$ |
(13,094 |
) |
|
|
-2 |
|
|
Europe |
|
|
237,489 |
|
|
|
258,841 |
|
|
|
(21,352 |
) |
|
|
-8 |
|
|
Latin America |
|
|
151,229 |
|
|
|
148,812 |
|
|
|
2,417 |
|
|
|
2 |
|
|
Asia |
|
|
68,226 |
|
|
|
60,483 |
|
|
|
7,743 |
|
|
|
13 |
|
|
Total Surfactants Segment |
|
$ |
1,181,563 |
|
|
$ |
1,205,849 |
|
|
$ |
(24,286 |
) |
|
|
-2 |
|
Net sales for North American operations declined two percent between years. Sales volume increased seven percent, which favorably affected the year-over-year change in net sales by $49.7 million. The effect of the increased sales volume was more than offset by an eight percent decline in selling prices and the unfavorable impact of foreign currency translation, which negatively affected the change in net sales by $61.1 million and $1.7 million, respectively. Most of the sales volume growth occurred in the first three quarters of 2016. For the full year, laundry and cleaning products were the largest contributors to the sales volume improvement, as the Company derived the full-year benefits of a supply agreement with a large customer that commenced during the third quarter of 2015. Sales volume for products used in personal care applications declined, primarily due to weaker demand in the second half of 2016 coupled with some lost business. In addition, lower crude oil prices led to a decrease in sales volumes of oil field products used in EOR applications. The year-over-year decline in sales prices primarily reflected decreased raw material costs, particularly for the first half of 2016, and a less favorable sales mix. The foreign currency impact reflected a stronger U.S. dollar relative to the Canadian dollar.
Net sales for European operations declined eight percent. Reducing 2016 net sales was $7.4 million of settlements for two customer claims (see Note 23 to the consolidated financial statements for further information). In addition, the unfavorable effects of foreign currency translation and a two percent decline in sales volume unfavorably impacted the change in net sales by $12.5 million
24
and $4.6 million, respectively. Selling prices averaged one percent higher, which had a $3.1 million favorable effect on the year-over-year net sales change. A weaker British pound sterling relative to the U.S. dollar accounted for most of the foreign currency effect. The decline in sales volume was mainly attributable to weaker demand for agricultural chemicals, laundry and cleaning products and personal care products. Sales volumes of general surfactants sold through distributors increased year over year.
Net sales for Latin American operations increased two percent. Included in fourth quarter and full year 2016 net sales was $4.3 million in compensation for future lost revenue related to a negotiated settlement with a major customer under contract with the region’s Bahia, Brazil, plant that exited the product line for which the Company supplied them product (see Note 22 to the consolidated financial statements for further information). A six percent increase in sales volume and higher selling prices favorably affected the year-over-year change in net sales by $8.7 million and $6.4 million, respectively. The unfavorable effects of currency translation offset the positive impacts of increased sales prices and volumes by $17.0 million. Improved laundry and cleaning and agricultural chemical sales volumes in Brazil accounted for most of the improvement in Latin America. New business related to the fourth quarter 2016 acquisitions of Tebras and PBC also contributed to the growth in sales volumes and net sales dollars. The higher selling prices reflected increased raw material costs and a more favorable mix of sales. The year-over-year weakening of the Brazilian real, Mexican peso and Colombian peso against the U.S. dollar led to the foreign currency translation effect.
Net sales for Asian operations increased 13 percent primarily due to a nine percent increase in average selling prices and a seven percent growth in sales volume, which positively affected the year-over-year change in net sales by $6.1 million and $4.4 million, respectively. An improved mix of sales coupled with the effects of increased raw material costs led to the higher average selling prices. Most of the sales volume improvement was attributable to new business and increased demand from existing customers of the Company’s Philippine operations. Sales volume also increased from Singapore. Foreign currency translation had a $2.8 million unfavorable effect on the net sales change.
Surfactant operating income for 2016 declined $4.3 million, or four percent, from operating income reported in 2015. Operating income for 2016 was negatively affected by accelerated depreciation related to the Canadian plant shutdown and by the settlement of customer claims in Europe. Gross profit increased $4.5 million, or two percent, largely due to higher sales volumes. The effects of foreign currency translation had an unfavorable $4.6 million impact on the year-over-year gross profit change. Operating expenses increased $8.8 million, or 10 percent. Year-over-year comparisons of gross profit by region and total segment operating expenses and operating income follow:
|
|
|
For the Year Ended |
|
|
|
|
|
|
|
|
|
|||||
|
(Dollars in thousands) |
|
December 31, 2016 |
|
|
December 31, 2015 |
|
|
Increase (Decrease) |
|
|
Percent Change |
|
||||
|
Gross Profit and Operating Income |
|
|
|
|
|
|
|
|
|
|
|
|
|
|
|
|
|
North America |
|
$ |
125,859 |
|
|
$ |
124,522 |
|
|
$ |
1,337 |
|
|
|
1 |
|
|
Europe |
|
|
23,246 |
|
|
|
31,363 |
|
|
|
(8,117 |
) |
|
|
-26 |
|
|
Latin America |
|
|
28,508 |
|
|
|
25,366 |
|
|
|
3,142 |
|
|
|
12 |
|
|
Asia |
|
|
20,397 |
|
|
|
12,254 |
|
|
|
8,143 |
|
|
|
66 |
|
|
Surfactants Segment Gross Profit |
|
$ |
198,010 |
|
|
$ |
193,505 |
|
|
$ |
4,505 |
|
|
|
2 |
|
|
Operating Expenses |
|
|
98,214 |
|
|
|
89,425 |
|
|
|
8,789 |
|
|
|
10 |
|
|
Operating Income |
|
$ |
99,796 |
|
|
$ |
104,080 |
|
|
$ |
(4,284 |
) |
|
|
-4 |
|
Gross profit for North American operations increased one percent principally as the result of the seven percent year-over-year improvement in sales volume. The favorable effect of the growth in sales volume was largely offset by $4.5 million of accelerated depreciation associated with the shutdown of manufacturing operations at the Company’s Canadian plant.
Gross profit for European operations declined 26 percent between years largely due to the aforementioned $7.4 million customer claim settlements and a two percent decline in sales volume. The region also incurred approximately $0.6 million of expenses associated with a planned 30-day mandatory inspection shutdown of the Company’s plant in Germany. There was no such inspection in 2015. Foreign currency translation negatively affected the change in gross profit by $1.0 million.
Gross profit for Latin American operations improved twelve percent mainly due to the $4.3 million settlement noted earlier and the effects of the six percent increase in sales volume. Foreign currency translation negatively impacted gross profit by $2.8 million. The contribution from the Tebras and PBC acquisitions was insignificant for 2016.
Asia gross profit increased 66 percent largely due to the seven percent increase in sales volume and to margin improvement, particularly for the Company’s Philippine operations. A more favorable product mix, higher selling prices and greater utilization of the plant in the Philippines led to the margin improvement.
25
Operating expenses for the Surfactants segment increased $8.8 million, or 10 percent, year over year. Expenses increased for all regions, reflecting the additional resources and expenditures necessary to support the segment’s global organization and growth initiatives. In addition, U.S. incentive-based compensation (which includes stock-based compensation, bonuses and profit sharing) increased between years due to improved Company financial performance and higher common stock prices. The favorable effects of foreign currency translation reduced the year-over-year change in operating expenses by $1.6 million.
Polymers
Polymer net sales for 2016 increased $7.3 million, or one percent, over net sales for 2015. Sales volume increased 12 percent, which had a $58.5 million favorable effect on the year-over-year net sales change. All regions contributed to the sales volume improvement. Lower selling prices and the effects of foreign currency translation unfavorably affected the net sales change by $42.9 million and $8.3 million, respectively. Year-over-year raw material cost declines led to the decrease in selling prices. The foreign currency translation effect reflected a stronger U.S. dollar against the currencies of the segment’s foreign operations. A year-over-year comparison of net sales by region follows:
|
|
|
For the Year Ended |
|
|
|
|
|
|
|
|
|
|||||
|
(Dollars in thousands) |
|
December 31, 2016 |
|
|
December 31, 2015 |
|
|
Increase |
|
|
Percent Change |
|
||||
|
North America |
|
$ |
319,769 |
|
|
$ |
317,580 |
|
|
$ |
2,189 |
|
|
|
1 |
|
|
Europe |
|
|
153,986 |
|
|
|
150,654 |
|
|
|
3,332 |
|
|
|
2 |
|
|
Asia and Other |
|
|
25,071 |
|
|
|
23,254 |
|
|
|
1,817 |
|
|
|
8 |
|
|
Total Polymers Segment |
|
$ |
498,826 |
|
|
$ |
491,488 |
|
|
$ |
7,338 |
|
|
|
1 |
|
Net sales for North American operations increased one percent. Sales volume increased nine percent, which had a $29.7 million favorable effect on the year-over-year net sales change. Selling prices declined eight percent, which offset the impact of higher sales volume by $27.5 million. The sales volume improvement was attributable to a 20 percent increase for polyols used in rigid foam applications. New business and the continued growth in demand for rigid foam insulation led to the polyol sales volume growth. Sales volume of phthalic anhydride and specialty polyols declined three and five percent, respectively, between years. Year-over-year decreases in the cost of raw materials drove the decline in selling prices.
Net sales for European operations increased two percent. Sales volume grew 14 percent, which had a $20.8 million favorable effect on the year-over-year net sales change. The sales volume improvement was driven by new business and increased demand for polyols used in rigid foam insulation and insulated metal panels. The impact of higher sales volume was partially offset by the effects of lower selling prices and foreign currency translation, which negatively affected the change in net sales by $10.6 million and $6.9 million, respectively. Lower raw material costs led to the decline in selling prices.
Net sales for Asia and Other operations increased eight percent between years due to a 29 percent increase in sales volume, which had a $6.8 million positive impact on the year-over-year net sales change. Business gained from efforts to fill the capacity of the Company’s new plant in Nanjing, China, accounted for most of the sales volume increase. The unfavorable effects of lower selling prices and foreign currency translation negatively impacted the change in net sales by $3.5 million and $1.5 million, respectively.
Polymer operating income for 2016 increased $15.8 million, or 20 percent, over operating income for 2015. Results for 2015 included a $2.9 million gain from the sale of Company’s specialty polyurethane systems product line. Gross profit increased $20.3 million, or 19 percent, due to the 12 percent increase in sales volume and to improved margins resulting primarily from lower raw material costs and an improved product mix. Year-over-year comparisons of gross profit by region and total segment operating expenses and operating income follow:
|
|
|
For the Year Ended |
|
|
|
|
|
|
|
|
|
|||||
|
(Dollars in thousands) |
|
December 31, 2016 |
|
|
December 31, 2015 |
|
|
Increase (Decrease) |
|
|
Percent Change |
|
||||
|
Gross Profit and Operating Income |
|
|
|
|
|
|
|
|
|
|
|
|
|
|
|
|
|
North America |
|
$ |
98,745 |
|
|
$ |
83,213 |
|
|
$ |
15,532 |
|
|
|
19 |
|
|
Europe |
|
|
27,702 |
|
|
|
22,357 |
|
|
|
5,345 |
|
|
|
24 |
|
|
Asia and Other |
|
|
1,737 |
|
|
|
2,276 |
|
|
|
(539 |
) |
|
|
-24 |
|
|
Polymers Segment Gross Profit |
|
$ |
128,184 |
|
|
$ |
107,846 |
|
|
$ |
20,338 |
|
|
|
19 |
|
|
Less: Operating Expenses |
|
|
31,396 |
|
|
|
29,766 |
|
|
|
1,630 |
|
|
|
5 |
|
|
Add: Gain on Sale of Product Line |
|
|
— |
|
|
|
2,862 |
|
|
|
(2,862 |
) |
|
|
-100 |
|
|
Operating Income |
|
$ |
96,788 |
|
|
$ |
80,942 |
|
|
$ |
15,846 |
|
|
|
20 |
|
26
Gross profit for North American operations increased 19 percent year over year. The nine percent increase in sales volume, the positive effects of lower raw material costs and a more favorable mix of sales all contributed to the improved gross profit. Production efficiencies were also a positive factor as unit manufacturing overhead costs declined as a result of production volume increases that outpaced a five percent year-over-year increase in plant expenses.
Gross profit for European operations increased 24 percent primarily due to the 14 percent increase in sales volume and to lower raw material costs. The 2016 results were negatively affected by higher plant expenses that resulted from the planned 30-day mandatory inspection shutdown of manufacturing operations in Germany during the third quarter of 2016. As a result of the shutdown, 2016 plant expenses included $2.4 million of inspection and storage expenses not incurred in 2015. The unfavorable effects of foreign currency translation negatively impacted the year-over-year change in gross profit by $1.0 million.
Gross profit for Asia and Other operations declined 24 percent despite a 29 percent increase in sales volume. Higher overhead costs due to operating the new China plant at partial capacity led to the decline in gross profit. Most of the decline occurred in the fourth quarter when it was no longer necessary for the plant to manufacture product for other Company locations as it had done for a large period of 2016.
Operating expenses for the Polymers segment increased $1.6 million, or five percent, year over year largely due to higher U.S. incentive-based compensation resulting from improved year-over-year Company financial performance and common stock prices.
Specialty Products
Net sales for 2016 increased $6.9 million, or nine percent, over net sales for 2015. An eight percent increase in sales volume accounted for most of the net sales improvement. Selling prices increased approximately one percent. Most of the sales volume increase was attributable to increased demand for products used in food ingredient applications. Operating income increased $6.3 million year over year due to increased sales volume and lower manufacturing and operating expenses. The decline in expenses reflected actions taken in 2015 to reduce the segment’s cost structure. Approximately half of the year-over-year operating income improvement occurred in the fourth quarter due to higher sales volumes and selling prices and lower costs for food ingredient products.
Corporate Expenses
Corporate expenses increased $14.5 million to $81.1 million for 2016 from $66.6 million for 2015. The increase was primarily attributable to increased expenses for deferred compensation ($10.3 million), fringe benefits ($1.4 million) and salaries ($1.2 million) expenses and the previously discussed restructuring and impairment charges ($7.1 million). Increased incentive-based compensation expenses, driven by improved year-over-year Company financial results and increased Company common stock values, led to the higher fringe benefit expenses. Consulting expenses declined $5.2 million between years principally due to no external resources being used in 2016 for the Company’s DRIVE efficiency efforts.
Deferred compensation was $16.8 million of expense for 2016 compared to $6.5 million of expense for 2015. The higher expense primarily resulted from a $31.79 per share increase in the value of Company common stock over the twelve months ended December 31, 2016, compared to a $9.61 per share increase for the same period of 2015. The following table presents the year-end Company common stock market prices used in the computation of deferred compensation expense:
|
|
|
December 31 |
|
|||||||||
|
|
|
2016 |
|
|
2015 |
|
|
2014 |
|
|||
|
Company Stock Price |
|
$ |
81.48 |
|
|
$ |
49.69 |
|
|
$ |
40.08 |
|
2015 Compared with 2014
Summary
Net income attributable to the Company for 2015 increased 33 percent to $76.0 million, or $3.32 per diluted share, from $57.1 million, or $2.49 per diluted share, for 2014. Adjusted net income for 2015 increased 38 percent to $79.4 million, or $3.46 per diluted share, from $57.7 million, or $2.52 per diluted share, for 2014 (See the “Reconciliations of Non-GAAP Adjusted Net Income and Dilutive Earnings per Share” section of this MD&A for reconciliations between non-GAAP adjusted net income and adjusted earnings per diluted share and reported net income attributable to the Company and reported earnings per diluted share). Below is a summary discussion of the major factors leading to the year-over-year changes in net sales, profits and expenses. A detailed discussion of segment operating performance for 2015 compared to 2014 follows the summary.
Consolidated net sales for 2015 declined $151.0 million, or eight percent, from consolidated net sales for 2014. A five percent increase in sales volume favorably affected the year-over-year net sales change by $96.6 million. All three segments contributed to the
27
consolidated sales volume improvement. Sales volumes for Surfactants and Polymers grew five percent each, and sales volumes for the Specialty Products segment increased two percent. The positive effect of increased sales volume was more than offset by the unfavorable effects of foreign currency translation and lower selling prices, which accounted for $131.8 million and $115.8 million, respectively, of the year-over-year net sales decline. The unfavorable foreign currency translation effect reflected a stronger U.S. dollar against all currencies of countries where the Company has foreign operations. Selling prices were lower primarily related to certain pass-through contract requirements associated with lower raw materials costs. Overall margins improved slightly. The decline in raw material costs reflected the impacts of decreases in the cost of crude oil and of diminished demand from sluggish economies in China and other emerging market countries.
Operating income for 2015 increased $32.1 million, or 35 percent, over operating income reported for 2014, largely due to improved results for Surfactants and Polymers. Increased deferred compensation expense and the effects of foreign currency translation negatively affected the year-over-year operating income change by $18.4 million and $13.2 million, respectively. Included in the 2015 results was a $2.9 million gain on the divestiture of the Company’s specialty polyurethane systems product line (part of the Polymers segment). See Note 21 to the consolidated financial statements for additional information regarding the sale. In addition, operating income for 2014 was unfavorably affected by $4.0 million of restructuring and asset impairment charges and a $2.4 million bad debt charge necessitated when a major Polymer customer filed for bankruptcy protection.
Operating expenses for 2015 increased $33.5 million, or 22 percent, over operating expenses for 2014. Higher deferred compensation, incentive-based compensation and consulting expenses were the major contributors to the increase. The following summarizes the year-over-year changes in the individual income statement line items that comprise the Company’s operating expenses:
|
|
• |
Selling expenses increased $0.8 million, or one percent, year over year primarily due to higher global fringe benefit expenses, largely offset by the favorable impact of foreign currency translation ($3.9 million) and a reduction in bad debt expense. U.S. fringe benefit expenses, which accounted for the largest share of the fringe benefit expense increase, were up $5.8 million primarily due to increased incentive-based compensation. Bad debt expense for 2014 included a $2.4 million charge for a Polymer customer that filed for bankruptcy protection. |
|
|
• |
Administrative expenses increased $9.5 million, or 14 percent, year over year due to increases for consulting ($5.9 million), fringe benefits ($4.7 million), talent acquisition/relocation ($1.5 million), expatriate ($0.8 million), salaries ($0.7 million) and the accumulation of a number of smaller expense increases. Administrative expenses were up $0.7 million in China, where a new plant is being constructed. Administrative expenses for both Europe and Brazil operations were generally up, but the increases were offset by the favorable effects of foreign currency translation. Partially offsetting the increases were lower environmental remediation expenses ($6.4 million). |
The increase in consulting expenses was related to the Company’s ongoing initiative to improve efficiency across the Company’s global organization (the initiative is referred to as DRIVE within the Company). Higher incentive-based compensation costs accounted for the increase in fringe benefit expenses. With respect to the decline in environmental remediation expenses, 2014 included a $7.1 million charge to increase the remediation liability for the Company’s Maywood, New Jersey, site. The U.S. Environmental Protection Agency issued its record of decision for soil remediation at that site in September 2014, which led to the higher liability compared to 2015.
|
|
• |
Research, development and technical service (R&D) expenses increased $4.8 million, or 11 percent, year over year primarily due to higher fringe benefit expenses ($6.2 million) partially offset by the favorable effects of foreign currency translation ($1.1 million). Increased incentive-based compensation expenses accounted for most of the higher fringe benefit expenses. |
|
|
• |
Deferred compensation plan activity resulted in $6.5 million of expense in 2015 compared to $11.9 million of income in 2014. An increase in the value of Company stock for 2015 compared to a decrease in the value of Company common stock for 2014 led to the year-over-year swing in deferred compensation results (see the ‘Overview’ and ‘Corporate Expenses’ sections of this MD&A for further details). |
Net interest expense for 2015 increased $3.1 million, or 27 percent, over net interest expense for 2014. Higher average debt levels resulting from the July 2015 issuance of $100.0 million in unsecured debt was the principal contributor to the increase. See Note 6 to the consolidated financial statements for further information regarding the 2015 private placement debt.
The loss from the Company’s 50-percent equity joint venture (TIORCO) increased $2.0 million year over year largely due to the Company’s $2.4 million-share of exit costs recorded by TIORCO in the fourth quarter of 2015. The costs were precipitated by the joint venture partners’ agreement to dissolve the venture. See Note 24 to the consolidated financial statements for further information regarding the dissolution of TIORCO.
Other, net income for 2015 increased $0.3 million, or 23 percent, over other, net income for 2014. Foreign exchange activity resulted in a $0.7 million gain in 2015 compared to a $0.2 million loss in 2014. Investment income (including realized and unrealized
28
gains and losses) for the Company’s deferred compensation and supplemental defined contribution mutual fund assets declined $0.6 million between years to $0.9 million in 2015 from $1.5 million in 2014.
The effective tax rate was 26.1 percent in 2015 compared to 24.4 percent in 2014. The increase was attributable to certain favorable foreign tax benefits recorded in 2014 that were nonrecurring in 2015, an unrecognized tax benefit recorded in 2015 for prior tax years, and a less favorable geographical mix of income in 2015. The 2015 tax rate was also negatively impacted by the lower tax benefit realized on nontaxable foreign interest income due to higher consolidated income. These items were partially offset by higher U.S. tax credits recorded in 2015. U.S. tax credits included the current year R&D credit, which was permanently extended on December 18, 2015, and the Agricultural Chemicals Security Credit related to the 2011 and 2012 tax returns. See Note 9 to the consolidated financial statements for a reconciliation of the statutory U.S. federal income tax rate to the effective tax rate.
Segment Results
|
(Dollars in thousands) |
|
For the Year Ended |
|
|
|
|
|
|
|
|
|
|||||
|
Net Sales |
|
December 31, 2015 |
|
|
December 31, 2014 |
|
|
(Decrease) |
|
|
Percent Change |
|
||||
|
Surfactants |
|
$ |
1,205,849 |
|
|
$ |
1,296,638 |
|
|
$ |
(90,789 |
) |
|
|
-7 |
|
|
Polymers |
|
|
491,488 |
|
|
|
550,966 |
|
|
|
(59,478 |
) |
|
|
-11 |
|
|
Specialty Products |
|
|
78,830 |
|
|
|
79,609 |
|
|
|
(779 |
) |
|
|
-1 |
|
|
Total Net Sales |
|
$ |
1,776,167 |
|
|
$ |
1,927,213 |
|
|
$ |
(151,046 |
) |
|
|
-8 |
|
|
(Dollars in thousands) |
|
For the Year Ended |
|
|
|
|
|
|
|
|
|
|||||
|
Operating Income |
|
December 31, 2015 |
|
|
December 31, 2014 |
|
|
Increase (Decrease) |
|
|
Percent Change |
|
||||
|
Surfactants |
|
$ |
104,080 |
|
|
$ |
60,778 |
|
|
$ |
43,302 |
|
|
|
71 |
|
|
Polymers |
|
|
80,942 |
|
|
|
60,690 |
|
|
|
20,252 |
|
|
|
33 |
|
|
Specialty Products |
|
|
4,397 |
|
|
|
10,487 |
|
|
|
(6,090 |
) |
|
|
-58 |
|
|
Segment Operating Income |
|
$ |
189,419 |
|
|
$ |
131,955 |
|
|
$ |
57,464 |
|
|
|
44 |
|
|
Corporate Expenses, Excluding Deferred Compensation and Restructuring |
|
|
60,129 |
|
|
|
49,155 |
|
|
|
10,974 |
|
|
|
22 |
|
|
Deferred Compensation Expense (Income) |
|
|
6,500 |
|
|
|
(11,903 |
) |
|
|
18,403 |
|
|
NM |
|
|
|
Business Restructuring |
|
|
— |
|
|
|
4,009 |
|
|
|
(4,009 |
) |
|
|
-100 |
|
|
Total Operating Income |
|
$ |
122,790 |
|
|
$ |
90,694 |
|
|
$ |
32,096 |
|
|
|
35 |
|
Surfactants
Surfactants 2015 net sales declined $90.8 million, or seven percent, from 2014 net sales. Sales volume increased five percent between years, which had a $67.0 million positive effect on the year-over-year net sales change. All regions contributed to the sales volume improvement. Foreign currency translation and decreased selling prices had negative effects of $97.9 million and $59.9 million, respectively, on the net sales change. Compared to 2014, the U.S. dollar was stronger against all currencies of the segment’s foreign operations. Selling prices were lower primarily related to certain pass-through contract requirements associated with lower raw materials costs. Overall margins improved slightly. A year-over-year comparison of net sales by region follows:
|
|
|
For the Year Ended |
|
|
|
|
|
|
|
|
|
|||||
|
(Dollars in thousands) |
|
December 31, 2015 |
|
|
December 31, 2014 |
|
|
Increase (Decrease) |
|
|
Percent Change |
|
||||
|
North America |
|
$ |
737,713 |
|
|
$ |
792,244 |
|
|
$ |
(54,531 |
) |
|
|
-7 |
|
|
Europe |
|
|
258,841 |
|
|
|
287,592 |
|
|
|
(28,751 |
) |
|
|
-10 |
|
|
Latin America |
|
|
148,812 |
|
|
|
160,076 |
|
|
|
(11,264 |
) |
|
|
-7 |
|
|
Asia |
|
|
60,483 |
|
|
|
56,726 |
|
|
|
3,757 |
|
|
|
7 |
|
|
Total Surfactants Segment |
|
$ |
1,205,849 |
|
|
$ |
1,296,638 |
|
|
$ |
(90,789 |
) |
|
|
-7 |
|
Net sales for North American operations declined seven percent between years. Sales volume increased three percent, which favorably affected the change in net sales by $26.2 million. The sales volume impact was more than offset by a nine percent decline in average selling prices and the unfavorable effects of foreign currency translation, which led to year-over-year net sales decreases of $72.8 million and $7.9 million, respectively. The improved sales volume resulted from increased sales of laundry and cleaning and personal care products, partially offset by decreased sales of functional surfactants and household, industrial and institutional (HI&I) products. The increase in laundry and cleaning sales volume was largely due to additional volumes resulting from the Company’s 2015 long-term supply agreement with a large customer. Personal care sales volumes increased principally due to higher demand from
29
existing customers. The decline in sales volumes for functional surfactants was principally due to lower sales of products used in oil field and agricultural applications. Decreased sales volumes to EOR customers, driven by the decline in crude oil prices, led to the lower oil field sales volume. The decline in agricultural chemicals sales volume was largely due to customers’ carryover inventory from 2014 and to farmers’ efforts to reduce spraying costs due to lower crop prices. HI&I sales volume was down mainly due to some lost business. The drop in selling prices was primarily attributable to decreases in raw material costs. The negative foreign currency translation effect reflected a stronger U.S. dollar relative to the Canadian dollar.
Net sales for European operations declined ten percent between years. Sales volume was up six percent, which favorably affected year-over-year net sales by $16.8 million. The sales volume impact was more than offset by the unfavorable effects of foreign currency translation and a two percent decline in selling prices, which accounted for $40.7 million and $4.9 million of the year-over-year net sales decline. An increase in sales of laundry and cleaning and agricultural chemical products, due to stronger demand from existing customers and new business, led to the improvement in sales volume. A stronger U.S. dollar against the European euro and British pound sterling led to the foreign currency translation result.
Net sales for Latin American operations declined seven percent between years due to a $48.0 million unfavorable effect of foreign currency translation. A 12 percent increase in sales volume and a 10 percent increase in selling prices offset the foreign currency translation impact by $18.8 million and $17.9 million, respectively. Brazil operations accounted for most of the increased Latin American sales volume, with stronger demand from existing customers and business gained as a result of the P&G Brazil acquisition finalized in the second quarter of 2015. Sales volume was up for Colombia operations but was partially offset by a decline in sales volume in Mexico. The foreign currency translation effect resulted from the year-over-year weakening of the Brazilian real as well as the Colombian and Mexican pesos against the U.S. dollar.
Net sales for Asian operations increased seven percent due to increased selling prices and a three percent increase in sales volume, which accounted for $3.4 million and $1.7 million, respectively, of the year-over-year increase in net sales. The increase in sales volume was primarily attributable to the Company’s Philippines operation, partially offset by lower sales volume for Singapore operations. The unfavorable effects of foreign currency translation offset the effects of higher sales volume and selling prices by $1.3 million.
Surfactants operating income for 2015 increased $43.3 million, or 71 percent, over operating income for 2014. Gross profit increased $48.0 million largely due to strong improvement for North American operations. All other regions except Asia also reported increased profits. Foreign currency translation reduced the year-over-year gross profit and operating income increase by $16.7 million and $10.4 million, respectively. Year-over-year comparisons of gross profit by region and total segment operating expenses and operating income follow:
|
|
|
For the Year Ended |
|
|
|
|
|
|
|
|
|
|||||
|
(Dollars in thousands) |
|
December 31, 2015 |
|
|
December 31, 2014 |
|
|
Increase (Decrease) |
|
|
Percent Change |
|
||||
|
Gross Profit and Operating Income |
|
|
|
|
|
|
|
|
|
|
|
|
|
|
|
|
|
North America |
|
$ |
124,522 |
|
|
$ |
84,118 |
|
|
$ |
40,404 |
|
|
|
48 |
|
|
Europe |
|
|
31,363 |
|
|
|
27,392 |
|
|
|
3,971 |
|
|
|
14 |
|
|
Latin America |
|
|
25,366 |
|
|
|
19,741 |
|
|
|
5,625 |
|
|
|
28 |
|
|
Asia |
|
|
12,254 |
|
|
|
14,269 |
|
|
|
(2,015 |
) |
|
|
-14 |
|
|
Surfactants Segment Gross Profit |
|
$ |
193,505 |
|
|
$ |
145,520 |
|
|
$ |
47,985 |
|
|
|
33 |
|
|
Operating Expenses |
|
|
89,425 |
|
|
|
84,742 |
|
|
|
4,683 |
|
|
|
6 |
|
|
Operating Income |
|
$ |
104,080 |
|
|
$ |
60,778 |
|
|
$ |
43,302 |
|
|
|
71 |
|
Gross profit for North American operations increased 48 percent year over year primarily due to improved operations, the three percent sales volume increase and better sales margins. The improved sales margin resulted from lower raw material and transportation costs. Costs for all major surfactant raw materials declined year-over-year. In 2014, the Company incurred additional transportation expenses due to higher fuel costs and to carrier delays and suboptimal supply chain movements related to the effects of severe winter weather and to upgrades at the Anaheim, California, plant that resulted in shifting production to other Company locations. Other items contributing to the year-over-year increase in gross profit were the favorable 2015 resolution of a previously recorded customer claim and $1.8 million of accelerated depreciation recorded in 2014 related to the Company’s 2013 restructuring plan. The effect of foreign currency translation on the year-over-year change in gross profit was an unfavorable $1.7 million.
Gross profit for European operations increased 14 percent between years principally due to the six percent increase in sales volume and to sales margin improvement. The margin improvement reflected a more favorable mix of sales (growth in agricultural sales volume) and declines in raw material costs. Foreign currency translation had a $5.4 million unfavorable effect on the year-over-year change in gross profit.
30
Gross profit for Latin American operations increased 28 percent largely due to a more profitable mix of sales, higher selling prices and the 12 percent increase in sales volume that more than offset an unfavorable foreign currency translation impact of $9.5 million.
Asia gross profit declined 14 percent largely due to a less profitable mix of sales reflecting lower sales out of Singapore.
Operating expenses for the Surfactants segment increased $4.7 million, or six percent, year over year. Excluding the effects of foreign currency translation, operating expenses increased $11.1 million. North American operations, European operations and Latin American operations accounted for $7.1 million, $1.9 million and $1.7 million of the increase, respectively. Higher fringe benefits, particularly incentive-based compensation, accounted for a large portion of the operating expense increases. Reimbursement from new consortium members of past European product registration fees ($1.3 million) favorably impacted current year expenses.
Polymers
Polymers net sales for 2015 declined $59.5 million, or 11 percent, from net sales for 2014. Sales volume was up five percent, which had a $25.2 million favorable effect on the year-over-year change in net sales. All regions reported improved volumes. Lower selling prices and the effects of foreign currency translation negatively impacted the year-over-year net sales change by $53.4 million and $31.3 million, respectively. Selling prices were lower primarily related to certain pass-through contract requirements associated with lower raw materials costs. Overall margins improved slightly. The foreign currency translation effect reflected a stronger U.S. dollar against the currencies of the segment’s foreign operations. A year-over-year comparison of net sales by region follows:
|
|
|
For the Year Ended |
|
|
|
|
|
|
|
|
|
|||||
|
(Dollars in thousands) |
|
December 31, 2015 |
|
|
December 31, 2014 |
|
|
(Decrease) |
|
|
Percent Change |
|
||||
|
North America |
|
$ |
317,580 |
|
|
$ |
347,447 |
|
|
$ |
(29,867 |
) |
|
|
-9 |
|
|
Europe |
|
|
150,654 |
|
|
|
175,862 |
|
|
|
(25,208 |
) |
|
|
-14 |
|
|
Asia and Other |
|
|
23,254 |
|
|
|
27,657 |
|
|
|
(4,403 |
) |
|
|
-16 |
|
|
Total Polymers Segment |
|
$ |
491,488 |
|
|
$ |
550,966 |
|
|
$ |
(59,478 |
) |
|
|
-11 |
|
Net sales for North American operations declined nine percent. Sales volume increased three percent, which had a $10.0 million favorable effect on the year-over-year net sales change. Selling prices declined 11 percent, which unfavorably affected year-over-year net sales by $39.9 million. Sales volume of polyols used in rigid foam applications increased one percent, while sales volume of specialty polyols declined five percent. A drop in sales for products used in lower-margin flexible foam applications led to the decline in specialty polyol sales volume. Phthalic anhydride sales volume increased 10 percent as the result of new business coupled with stronger demand from existing customers. The reduction in sales prices reflected decreases in the costs of major raw materials.
Net sales for European operations declined 14 percent between years. Sales volume increased eight percent, which positively affected the year-over-year net sales change by $14.3 million. Increased sales of rigid polyols used in insulation board and metal panels accounted for the volume improvement. The unfavorable effects of foreign currency translation and a five percent decline in selling prices negatively affected the year-over-year change in net sales by $29.7 million and $9.8 million, respectively. The foreign currency translation effect reflected a stronger U.S. dollar relative to the Polish zloty. The selling price decline was principally attributable to decreases in raw material costs.
Net sales for Asia and Other operations declined 16 percent due to lower selling prices and the unfavorable effects of foreign currency translation, which accounted for $3.3 million and $1.5 million of the year-over-year net sales decrease, respectively. Reduced raw material costs led to the lower selling prices. Sales volume increased two percent, which had a $0.5 million positive impact on the net sales change. The volume gain reflected increased sales volume in Asia.
31
Polymer 2015 operating income increased $20.3 million, or 33 percent, over 2014 operating income. The $2.9 million gain on the sale of the Company’s specialty polyurethane systems product line, the effects of lower raw material costs, the five percent sales volume increase and reduced 2015 bad debt expense, partially offset by a $3.1 million unfavorable effect of foreign currency translation and by higher incentive-based compensation, led to the improvement in operating income. Bad debt expense for 2014 included a $2.4 million charge for a customer that filed for bankruptcy protection. Year-over-year comparisons of gross profit by region and total segment operating expenses and operating income follow:
|
|
|
For the Year Ended |
|
|
|
|
|
|
|
|
|
|||||
|
(Dollars in thousands) |
|
December 31, 2015 |
|
|
December 31, 2014 |
|
|
Increase |
|
|
Percent Change |
|
||||
|
Gross Profit and Operating Income |
|
|
|
|
|
|
|
|
|
|
|
|
|
|
|
|
|
North America |
|
$ |
83,213 |
|
|
$ |
64,532 |
|
|
$ |
18,681 |
|
|
|
29 |
|
|
Europe |
|
|
22,357 |
|
|
|
22,193 |
|
|
|
164 |
|
|
|
1 |
|
|
Asia and Other |
|
|
2,276 |
|
|
|
1,868 |
|
|
|
408 |
|
|
|
22 |
|
|
Polymers Segment Gross Profit |
|
$ |
107,846 |
|
|
$ |
88,593 |
|
|
$ |
19,253 |
|
|
|
22 |
|
|
Less: Operating Expenses |
|
|
29,766 |
|
|
|
27,903 |
|
|
|
1,863 |
|
|
|
7 |
|
|
Add: Gain on Sale of Product Line |
|
|
2,862 |
|
|
|
— |
|
|
|
2,862 |
|
|
|
100 |
|
|
Operating Income |
|
$ |
80,942 |
|
|
$ |
60,690 |
|
|
$ |
20,252 |
|
|
|
33 |
|
Gross profit for North American operations increased 29 percent year over year due to improved sales margins, increased sales volume and operating efficiencies. The sales margin improvement reflected lower costs for all major raw materials, better inventory cost positions throughout the year and manufacturing fee increases aimed at partially offsetting the increasing cost of maintaining the polymer production facilities. Less outsourcing during the year also contributed to the more favorable results. In addition to the foregoing, 2015 gross profit included the recognition of $1.0 million of previously deferred revenue due to the satisfaction of contractual requirements.
Gross profit for European operations increased one percent. The effects of the eight percent sales volume increase and lower raw material costs were largely offset by an unfavorable $4.4 million foreign currency translation impact.
The increase in gross profit for Asia and Other operations was primarily due to lower outsourcing and raw material costs and increased sales volume that more than offset the negative effects of foreign currency translation.
Operating expenses for the Polymers segment increased $1.9 million, or seven percent, year over year. Much of the increase was attributable to higher incentive-based pay. In addition, operating expenses in China, where a new plant was being constructed, increased $1.1 million year over year. The higher expenses were partially offset by a $2.2 million decrease in bad debt expense. Bad debt expense for 2014 included a $2.4 million bad debt charge for a customer that filed for bankruptcy. Foreign exchange translation had a favorable $1.6 million effect on the year-over-year operating expense change.
Specialty Products
Net sales for 2015 declined $0.8 million, or one percent, from net sales for 2014. The decline in net sales was due to a $2.7 million unfavorable foreign currency translation effect partially offset by higher average selling prices and a two percent increase in sales volume. All product lines reported slightly improved sales volumes year over year, principally due to a stronger fourth quarter. The increase in average selling prices reflected a more favorable mix of sales. Operating income decreased $6.1 million, or 58 percent, between years due to higher raw material costs and operating expenses, particularly for the food ingredient and nutritional supplement product lines. Fourth quarter 2015 operating income improved $1.0 million over fourth quarter 2014 operating income largely due to a 26 percent increase in sales volume and to a more profitable mix of sales.
Corporate Expenses
Corporate expenses increased $29.4 million to $66.6 million for 2015 from $37.2 million for 2014. The significant contributors to the year-over-year increase in corporate expenses included higher deferred compensation ($18.4 million), consulting ($5.9 million), fringe benefit ($5.4 million), talent acquisition/relocation ($1.5 million), expatriate ($0.8 million) and salaries ($0.7 million) expenses, along with the accumulation of a number of smaller expense increases. The increased expenses were partially offset by lower environmental remediation charges ($6.4 million).
Deferred compensation was $6.5 million of expense for 2015 compared to $11.9 million of income for 2014. The change between years was largely attributable to a $9.61 per share increase in the value of Company common stock in 2015 compared to a $25.55 per
32
share decrease in 2014. The following table presents the year-end Company common stock market prices used in the computation of deferred compensation expense:
|
|
|
December 31 |
|
|||||||||
|
|
|
2015 |
|
|
2014 |
|
|
2013 |
|
|||
|
Company Stock Price |
|
$ |
49.69 |
|
|
$ |
40.08 |
|
|
$ |
65.63 |
|
The increase in fringe benefit expenses resulted primarily from higher incentive-based compensation (both short- and long-term). In 2014, a limited amount of annual bonuses were paid because the Company failed to meet its financial performance targets. Consulting expenses increased largely due to the Company’s ongoing DRIVE initiative to improve efficiency across the Company’s global organization.
With respect to the decline in environmental remediation expenses, 2014 included $7.1 million of charges to increase the best estimate of the remediation liability for the Company’s Maywood site. The U.S. Environmental Protection Agency issued its record of decision for soil remediation at that site in September 2014, which led to the higher 2014 liability.
Liquidity and Financial Condition
Overview
Historically, the Company's principal sources of liquidity have included cash flows from operating activities, available cash and cash equivalents and the use of available borrowing facilities. The Company's principal uses of cash have included funding operating activities, capital investments and acquisitions.
For the year ended December 31, 2016, operating activities were a source of $212.2 million versus a source of $183.3 million for the comparable period in 2015. For the current year, investing cash outflows totaled $130.5 million and financing activities were a use of $29.8 million. Cash increased by $49.6 million with exchange rates reducing cash by $2.3 million.
At December 31, 2016, the Company’s cash and cash equivalents totaled $225.7 million including $38.6 million in two separate money market funds, each of which was rated AAA by Standard and Poor’s and/or Aaa by Moody’s. Cash in U.S. demand deposit accounts totaled $88.9 million and cash of the Company’s non-U.S. subsidiaries held outside the U.S. totaled $98.2 million as of December 31, 2016.
Operating Activity
For 2016, net income increased by $10.2 million and working capital was a source of $18.8 million versus a source of $24.8 million in 2015. The Company’s working capital investment is heavily influenced by the cost of crude oil and natural oils, from which many of its raw materials are derived. Fluctuations in raw material costs translate directly to inventory carrying costs and indirectly to customer selling prices and accounts receivable.
Working capital requirements were lower in 2016 compared to the same period in 2015 due to higher accounts payable and accrued liabilities, partially offset by increased inventory quantities and price.
For 2016, accounts receivable were a use of $17.2 million compared to a source of $4.2 million for the comparable period in 2015. Inventories were a use of $3.8 million in 2016 versus a source of $2.9 million in 2015. Accounts payable and accrued liabilities were a source of $38.3 million in 2016 compared to a source of $21.2 million in 2015.
The 2016 accounts receivable increase was principally driven by higher sales quantities. The inventory increase for the year was driven by higher raw material prices and higher inventory levels resulting from planned increases to support customer service levels. It is management’s opinion that the Company’s liquidity is sufficient to provide for potential increases in working capital during 2017.
Investing Activity
Cash outflows for investing activities increased by $4.6 million year over year.
Cash outflows from investing activities for the current year included capital expenditures of $103.1 million compared to $119.3 million for the comparable period last year. All other investing activities consumed $27.4 million in 2016 versus $6.6 million in 2015. Other investing activities in 2016 included $23.5 million used to acquire a production facility (Tebras) and a commercial business (PBC) in Brazil.
For 2017, the Company estimates that capital expenditures will range from $100 million to $120 million including capacity expansions in the United States and Germany.
33
Cash flow from financing activities was a use of $29.8 million in 2016 compared to a source of $42.9 million in 2015. The year-over-year swing in financing activity was primarily the result of borrowing $100.0 million via an unsecured private placement loan in 2015. No such borrowings were made in 2016. The effect of the borrowing on the year-over-year change in financing activity was partially offset by lower debt repayments made in 2016 compared to 2015.
The Company purchases its common stock in the open market from time to time to fund its own benefit plans and also to mitigate the dilutive effect of new shares issued under its benefit plans. The Company may, from time to time, seek to retire or purchase additional amounts of the Company’s outstanding equity and/or debt securities through cash purchases and/or exchanges for other securities, in open market purchases, privately negotiated transactions or otherwise, including pursuant to a Rule 10b5-1 plan. Such repurchases or exchanges, if any, will depend on prevailing market conditions, the Company’s liquidity requirements, contractual restrictions and other factors. The amounts involved may be material. For the twelve months ended December 31, 2016, the Company purchased 43,835 shares in the open market at a total cost of $2.4 million. At December 31, 2016, there were 717,929 shares remaining under the current share repurchase authorization.
Debt and Credit Facilities
Consolidated balance sheet debt (including debt issuance costs) decreased by $14.4 million for the current year, from $331.4 million to $317.0 million primarily due to a decrease of domestic debt by $11.3 million. Net debt (which is defined as total debt minus cash – See the “Reconciliation of Non-GAAP Net Debt” section of this MD&A) decreased by $63.9 million for the current year, from $155.2 million to $91.3 million.
As of December 31, 2016, the ratio of total debt to total debt plus shareholders’ equity was 33.3 percent compared to 37.3 percent at December 31, 2015. As of December 31, 2016, the ratio of net debt to net debt plus shareholders’ equity was 12.6 percent, compared to 21.8 percent at December 31, 2015. At December 31, 2016, the Company’s debt included $310.7 million of unsecured private placement loans with maturities extending from 2017 through 2027. These loans are the Company’s primary source of long-term debt financing and are supplemented by bank credit facilities to meet short and medium-term needs.
The Company has a committed $125.0 million multi-currency syndicated revolving credit agreement. The credit agreement allows the Company to make unsecured borrowings, as requested from time to time, for working capital and other corporate purposes. This unsecured facility is the Company’s primary source of short-term borrowings and is committed through July 10, 2019. As of December 31, 2016, the Company had outstanding letters of credit of $4.8 million under this agreement, and no borrowings, with $120.2 million remaining available. The Company anticipates that cash from operations, committed credit facilities and cash on hand will be sufficient to fund anticipated capital expenditures, working capital, dividends and other planned financial commitments for the foreseeable future.
Certain foreign subsidiaries of the Company maintain short-term bank lines of credit in their respective local currencies to meet working capital requirements as well as to fund capital expenditure programs and acquisitions. At December 31, 2016, the Company’s foreign subsidiaries had outstanding debt of $7.4 million based on the applicable ending currency exchange rates at that date.
The Company has material debt agreements that require the maintenance of minimum interest coverage and minimum net worth. These agreements also limit the incurrence of additional debt as well as the payment of dividends and repurchase of treasury shares. Testing for these agreements is based on the combined financial statements of the U.S. operations of the Company, Stepan Canada Inc., Stepan Quimica Ltda., Stepan Specialty Products, LLC, Stepan Specialty Products B.V. and Stepan Asia Pte. Ltd. (collectively, the “Restricted Group”). Under the most restrictive of these debt covenants:
|
|
1. |
The Restricted Group must maintain a minimum interest coverage ratio, as defined within the agreements, of 1.75 to 1.00, for the preceding four calendar quarters. |
|
|
2. |
The Restricted Group must maintain net worth of at least $325.0 million. |
|
|
3. |
The Restricted Group must maintain a ratio of long-term debt to total capitalization, as defined in the agreements, not to exceed 60 percent. |
|
|
4. |
The Restricted Group may pay dividends and purchase treasury shares after December 31, 2013, in amounts of up to $100.0 million plus 100 percent of net income and cash proceeds of stock option exercises, measured cumulatively after June 30, 2014. The maximum amount of dividends that could have been paid within this limitation is disclosed as unrestricted retained earnings in Note 6 to the consolidated financial statements. |
34
The Company believes it was in compliance with all of its loan agreements as of December 31, 2016. Based on current projections, the Company believes it will be in compliance with its loan agreements throughout 2017.
Contractual Obligations
At December 31, 2016, the Company’s contractual obligations, including estimated payments by period, were as follows:
|
|
|
Payments Due by Period |
|
|||||||||||||||||
|
(In thousands) |
|
Total |
|
|
Less than 1 year |
|
|
1-3 years |
|
|
3-5 years |
|
|
More than 5 years |
|
|||||
|
Long-term debt obligations (a) |
|
$ |
318,154 |
|
|
$ |
28,154 |
|
|
$ |
50,000 |
|
|
$ |
72,858 |
|
|
$ |
167,142 |
|
|
Interest payments on debt obligations (b) |
|
|
72,489 |
|
|
|
13,467 |
|
|
|
23,320 |
|
|
|
17,917 |
|
|
|
17,785 |
|
|
Operating lease obligations |
|
|
47,592 |
|
|
|
7,761 |
|
|
|
11,974 |
|
|
|
8,581 |
|
|
|
19,276 |
|
|
Purchase obligations (c) |
|
|
8,275 |
|
|
|
7,078 |
|
|
|
1,197 |
|
|
|
— |
|
|
|
— |
|
|
Other (d) |
|
|
27,234 |
|
|
|
9,287 |
|
|
|
2,221 |
|
|
|
1,842 |
|
|
|
13,884 |
|
|
Total |
|
$ |
473,744 |
|
|
$ |
65,747 |
|
|
$ |
88,712 |
|
|
$ |
101,198 |
|
|
$ |
218,087 |
|
|
(a) |
Excludes unamortized debt issuance costs of $1.1 million. |
|
(b) |
Interest payments on debt obligations represent interest on all Company debt at December 31, 2016. The interest payment amounts related to the variable rate component of the Company’s debt assume that interest will be paid at the rates prevailing at December 31, 2016. Future interest rates may change, and, therefore, actual interest payments could differ from those disclosed in the above table. |
|
(c) |
Purchase obligations consist of raw material, utility and telecommunication service purchases made in the normal course of business. |
|
(d) |
The “Other” category comprises deferred revenues that represent commitments to deliver products, expected 2017 required contributions to the Company’s funded defined benefit pension plans, estimated payments related to the Company’s unfunded defined benefit supplemental executive and outside director pension plans, estimated payments (undiscounted) related to the Company’s asset retirement obligations, and environmental remediation payments for which amounts and periods can be reasonably estimated. |
The above table does not include $106.5 million of other non-current liabilities recorded on the balance sheet at December 31, 2016, as summarized in Note 15 to the consolidated financial statements. The significant non-current liabilities excluded from the table are defined benefit pension, deferred compensation, environmental and legal liabilities and unrecognized tax benefits for which payment periods cannot be reasonably determined. In addition, deferred income tax liabilities are excluded from the table due to the uncertainty of their timing.
Pension Plans
The Company sponsors a number of defined benefit pension plans, the most significant of which cover employees in its U.S. and U.K. locations. The U.S. and U.K. plans are frozen, and service benefit accruals are no longer being made. The funded status (pretax) of the Company’s defined benefit pension plans improved $10.2 million year over year, from $37.5 million underfunded at December 31, 2015, to $27.3 million underfunded at December 31, 2016. Better pension asset performance led to the improved funded status. A change in the mortality tables also contributed to the better funded status. The impacts of the pension asset returns and the change in mortality tables were partially offset by the effects of year-over-year decreases in the discount rates used to measure pension obligations (22- and 140-basis point decreases for the U.S. and U.K. plans, respectively).
The Company contributed $0.4 million to its funded defined benefit plans in 2016. In 2017, the Company expects to contribute a total of $0.3 million to the U.K. defined benefit plan. As a result of pension funding relief included in the Highway and Transportation Funding Act of 2014, the Company has no 2017 contribution requirement to the U.S. pension plans. Payments to participants in the unfunded non-qualified plans should approximate $0.2 million in 2017, which is the same as payments made in 2016.
Letters of Credit
The Company maintains standby letters of credit under its workers’ compensation insurance agreements and for other purposes as needed. The insurance letters of credit are renewed annually and amended to the amounts required by the insurance agreements. As of December 31, 2016, the Company had a total of $4.8 million available under its outstanding standby letters of credit.
Off-Balance Sheet Arrangements
The Securities and Exchange Commission requires disclosure of off-balance sheet arrangements that either have, or are reasonably likely to have, a current or future effect on the Company’s financial condition, changes in financial condition, revenues or expenses, results of operations, liquidity, capital expenditures or capital resources that is material to investors. During the periods covered by this Form 10-K, the Company was not party to any such off-balance sheet arrangements.
35
Environmental and Legal Matters
The Company’s operations are subject to extensive federal, state and local environmental laws and regulations or similar laws in the other countries in which the Company does business. Although the Company’s environmental policies and practices are designed to ensure compliance with these regulations, future developments and increasingly stringent environmental regulation may require the Company to make additional unforeseen environmental expenditures. The Company will continue to invest in the equipment and facilities necessary to comply with existing and future regulations. During 2016, the Company’s expenditures for capital projects related to the environment were $1.7 million. Expenditures related to capital projects related to the environment projects are capitalized and depreciated over their estimated useful lives, which are typically 10 years. Recurring costs associated with the operation and maintenance of facilities for waste treatment and disposal and managing environmental compliance in ongoing operations at the Company’s manufacturing locations were approximately $25.0 million for 2016, $22.1 million for 2015 and $21.2 million for 2014. While difficult to project, it is not anticipated that these recurring expenses will increase significantly in the near future.
Over the years, the Company has received requests for information related to or has been named by government authorities as a potentially responsible party at a number of waste disposal sites where cleanup costs have been or may be incurred under the U.S. Comprehensive Environmental Response, Compensation and Liability Act of 1980 (CERCLA) and similar state or foreign statutes. In addition, damages are being claimed against the Company in general liability actions for alleged personal injury or property damage in the case of some disposal and plant sites. The Company believes that it has made adequate provisions for the costs it may incur with respect to the sites. See the Critical Accounting Policies section that follows for a discussion of the Company’s environmental liabilities accounting policy. After partial remediation payments at certain sites, the Company has estimated a range of possible environmental and legal losses from $25.7 million to $46.5 million at December 31, 2016, compared to $20.9 million to $41.4 million at December 31, 2015. At December 31, 2016, the Company’s accrued liability for such losses, which represented the Company’s best estimate within the estimated range of possible environmental and legal losses, was $25.8 million compared to $20.9 million at December 31, 2015. Because the liabilities accrued are estimates, actual amounts could differ from the amounts reported. During 2016, cash outlays related to legal and environmental matters approximated $1.4 million compared to $2.7 million expended in 2015.
For certain sites, the Company has responded to information requests made by federal, state or local government agencies but has received no response confirming or denying the Company’s stated positions. As such, estimates of the total costs, or range of possible costs, of remediation, if any, or the Company’s share of such costs, if any, cannot be determined with respect to these sites. Consequently, the Company is unable to predict the effect thereof on the Company’s financial position, cash flows and results of operations. Given the information available, management believes the Company has no liability at these sites. However, in the event of one or more adverse determinations with respect to such sites in any annual or interim period, the effect on the Company’s cash flows and results of operations for those periods could be material. Based upon the Company’s present knowledge with respect to its involvement at these sites, the possibility of other viable entities’ responsibilities for cleanup, and the extended period over which any costs would be incurred, the Company believes that these matters, individually and in the aggregate, will not have a material effect on the Company’s financial position.
See Item 3, Legal Proceedings, in this Form 10-K and Note 16, Contingencies, in the Notes to Consolidated Financial Statements for a summary of the significant environmental proceedings related to certain environmental sites.
Outlook
After record results in 2016, management believes that the Company is positioned for further growth in 2017. Although the Company had several events that negatively impacted the fourth quarter of 2016, the Company’s base business remains strong. Benefits from the Company’s product and end market diversification efforts, continued growth in core polymer markets, and enhanced internal efficiencies should positively impact the Company’s results in 2017.
Climate Change Legislation
Based on currently available information, the Company does not believe that existing or pending climate change legislation or regulation is reasonably likely to have a material effect on the Company’s financial condition, results of operations or cash flows.
Critical Accounting Policies
The Company prepares its financial statements in accordance with accounting principles generally accepted in the United States of America (generally accepted accounting principles or GAAP). Preparation of financial statements in accordance with generally accepted accounting principles requires the Company to make estimates and assumptions that affect the reported amounts of assets and liabilities and disclosure of contingent assets and liabilities at the date of the financial statements and the reported amounts of
36
revenues and expenses during the reporting period. The following is a summary of the accounting policies the Company believes are the most important to aid in understanding its financial results:
Deferred Compensation
The Company sponsors deferred compensation plans that allow management employees to defer receipt of their annual bonuses and outside directors to defer receipt of their fees until retirement, departure from the Company or as elected by the participant. The plans allow for the deferred compensation to grow or decline based on the results of investment options chosen by the participants. The investment options include Company common stock and a limited selection of mutual funds. The Company funds the obligations associated with these plans by purchasing investment assets that match the investment choices made by the plan participants. A sufficient number of shares of treasury stock are maintained on hand to cover the equivalent number of shares that result from participants electing the Company common stock investment option. As a result, the Company must periodically purchase its common shares in the open market. Upon retirement or departure from the Company, participants receive cash amounts equivalent to the payment date value of the investment choices they have made or Company common stock shares equal to the number of share equivalents held in the accounts.
Some plan distributions may be made in cash or Company common stock at the option of the participant. Other plan distributions can only be made in Company common stock. For deferred compensation obligations that may be settled in cash, the Company must record appreciation in the market value of the investment choices made by participants as additional compensation expense. Conversely, declines in the value of Company stock or the mutual funds result in a reduction of compensation expense since such declines reduce the cash obligation of the Company as of the date of the financial statements. These market price movements may result in significant period-to-period fluctuations in the Company’s income. The increases or decreases in compensation expenses attributable to market price movements are reported in the operating expenses section of the consolidated statements of income. Because the obligations that must be settled only in Company common stock are treated as equity instruments, fluctuations in the market price of the underlying Company stock do not affect earnings.
At December 31, 2016, the Company’s deferred compensation liability was $60.3 million, of which approximately 63 percent represented deferred compensation tied to the performance of the Company’s common stock; the remainder of the deferred compensation liability was tied to the chosen mutual fund investment assets. A $1.00 increase in the market price of the Company’s common stock will result in approximately $0.5 million of additional compensation expense. A $1.00 reduction in the market price of the common stock will reduce compensation expense by a like amount. The expense or income associated with the mutual fund component will generally fluctuate in line with the overall percentage increase or decrease of the U.S. stock markets.
The mutual fund assets related to the deferred compensation plans are recorded on the Company’s balance sheet at cost when acquired and adjusted to their market values at the end of each reporting period. As allowed by generally accepted accounting principles, the Company elected the fair value option for recording the mutual fund investment assets. Therefore, market value changes for the mutual fund investment assets are recorded in the income statement in the same periods that the offsetting changes in the deferred compensation liabilities are recorded. Dividends, capital gains distributed by the mutual funds and realized and unrealized gains and losses related to mutual fund shares are recognized as investment income or loss in the other, net line of the consolidated statements of income.
Environmental Liabilities
It is the Company’s accounting policy to record environmental liabilities when environmental assessments and/or remedial efforts are probable and the cost or range of possible costs can be reasonably estimated. When no amount within a range of possible costs is a better estimate than any other amount, the minimum amount in the range is accrued. Some of the factors on which the Company bases its estimates include information provided by feasibility studies, potentially responsible party negotiations and the development of remedial action plans.
Estimates for environmental liabilities are subject to potentially significant fluctuations as new facts emerge related to the various sites where the Company is exposed to liability for the remediation of environmental contamination. See the Environmental and Legal Matters section of this MD&A for discussion of the Company’s recorded liabilities and range of loss estimates.
Revenue Recognition
Revenue is recognized upon shipment of goods to customers, at which time title and risk of loss pass to the customer. For arrangements where the Company consigns product to a customer location, revenue is recognized when the customer uses the inventory. The Company records shipping and handling billed to a customer in a sales transaction as revenue. Costs incurred for shipping and handling are recorded in cost of sales. Volume discounts due customers are estimated and recorded in the same period as the sales to which the discounts relate and are reported as reductions of revenue in the consolidated statements of income.
37
Recent Accounting Pronouncements
See Note 1 to the consolidated financial statements, included in Part II, Item 8, for information on recent accounting pronouncements which affect the Company.
Reconciliations of Non-GAAP Adjusted Net Income and Dilutive Earnings per Share
|
|
|
Twelve Months Ended December 31 |
|
|||||||||||||||||||||
|
(In millions, except per share amounts) |
|
2016 |
|
|
2015 |
|
|
2014 |
|
|||||||||||||||
|
|
|
Net Income |
|
|
Diluted EPS |
|
|
Net Income |
|
|
Diluted EPS |
|
|
Net Income |
|
|
Diluted EPS |
|
||||||
|
Net Income Attributable to the Company as Reported |
|
$ |
86.2 |
|
|
$ |
3.73 |
|
|
$ |
76.0 |
|
|
$ |
3.32 |
|
|
$ |
57.1 |
|
|
$ |
2.49 |
|
|
|
|
|
|
|
|
|
|
|
|
|
|
|
|
|
|
|
|
|
|
|
|
|
|
|
|
Deferred Compensation Expense (Income) |
|
|
16.1 |
|
|
|
0.70 |
|
|
|
5.6 |
|
|
|
0.24 |
|
|
|
(13.4 |
) |
|
|
(0.58 |
) |
|
Business Restructuring and Asset Impairments |
|
|
7.1 |
|
|
|
0.30 |
|
|
|
— |
|
|
|
— |
|
|
|
4.0 |
|
|
|
0.18 |
|
|
Contract Termination Settlement |
|
|
(4.3 |
) |
|
|
(0.18 |
) |
|
|
— |
|
|
|
— |
|
|
|
— |
|
|
|
— |
|
|
Environmental Remediation Expense |
|
|
— |
|
|
|
— |
|
|
|
0.5 |
|
|
|
0.02 |
|
|
|
7.1 |
|
|
|
0.31 |
|
|
Gain on Divestiture of Product Line |
|
|
— |
|
|
|
— |
|
|
|
(2.9 |
) |
|
|
(0.13 |
) |
|
|
— |
|
|
|
— |
|
|
TIORCO JV Dissolution |
|
|
— |
|
|
|
— |
|
|
|
2.4 |
|
|
|
0.10 |
|
|
|
— |
|
|
|
— |
|
|
Customer Bankruptcy Bad Debt Expense |
|
|
— |
|
|
|
— |
|
|
|
— |
|
|
|
— |
|
|
|
2.4 |
|
|
|
0.10 |
|
|
Cumulative Tax Effect on Above Adjustment Items |
|
|
(6.9 |
) |
|
|
(0.30 |
) |
|
|
(2.2 |
) |
|
|
(0.09 |
) |
|
|
0.5 |
|
|
|
0.02 |
|
|
Adjusted Net Income |
|
$ |
98.2 |
|
|
$ |
4.25 |
|
|
$ |
79.4 |
|
|
$ |
3.46 |
|
|
$ |
57.7 |
|
|
$ |
2.52 |
|
The Company believes that certain non-GAAP measures, when presented in conjunction with comparable GAAP measures, are useful for evaluating the Company’s operating performance and provide better clarity on the impact of non-operational items. Internally, the Company uses this non-GAAP information as an indicator of business performance and evaluates management’s effectiveness with specific reference to these indicators. These measures should be considered in addition to, not a substitute for or superior to, measures of financial performance prepared in accordance with GAAP. The cumulative tax effect was calculated using the statutory tax rates for the jurisdictions in which the transactions occurred.
Reconciliations of Non-GAAP Net Debt
|
(In millions) |
|
December 31 |
|
|||||
|
|
|
2016 |
|
|
2015 |
|
||
|
Current Maturities of Long-Term Debt as Reported |
|
$ |
28.1 |
|
|
$ |
18.8 |
|
|
Long-Term Debt as Reported |
|
|
288.9 |
|
|
|
312.6 |
|
|
Total Debt as Reported |
|
|
317.0 |
|
|
|
331.4 |
|
|
Less Cash and Cash Equivalents as Reported |
|
|
(225.7 |
) |
|
|
(176.2 |
) |
|
Net Debt |
|
$ |
91.3 |
|
|
$ |
155.2 |
|
Management uses the non-GAAP net debt metric to gain a more complete picture of the Company’s overall liquidity, financial flexibility and leverage level. This adjusted measure should be considered supplemental to and not a substitute for financial information prepared in accordance with GAAP. The Company's definition of this adjusted measure may differ from similarly titled measures used by other entities.
38
Item 7A. Quantitative and Qualitative Disclosures About Market Risk
Foreign Currency Exchange Risk
Because the Company operates globally, its cash flows and operating results are subject to movements in foreign currency exchange rates. Except for the financial transactions, balances and forward contracts referred to below, most of the Company’s foreign subsidiaries’ financial instruments are denominated in their respective functional currencies.
The Company uses forward contracts to mitigate the exposure of certain foreign currency transactions and balances to fluctuating exchange rates. At December 31, 2016, the Company had forward contracts with an aggregated notional amount of $33.4 million. Except for the Company’s subsidiaries in Brazil, China and Colombia, foreign currency exposures are substantially hedged by forward contracts. The fair value of all forward contracts as of December 31, 2016, was a net liability of $0.02 million. As of December 31, 2016, the potential reduction in the Company’s earnings resulting from the impact of hypothetical adverse changes in exchange rates on the fair value of its outstanding foreign currency contracts of 10 percent for all currencies would have been $2.9 million.
Interest Rates
The Company’s debt was made up of fixed-rate and variable-rate borrowings totaling $310.7 million and $7.4 million, respectively, as of December 31, 2016. For 2017, it is projected that interest on short-term variable-rate borrowings will total approximately $0.2 million. A hypothetical 10 percent average change to short-term interest rates would result in less than a $0.1 million increase or decrease to interest expense for 2017.
The fair value of the Company’s long term fixed-rate debt, including current maturities, was estimated to be $310.7 million as of December 31, 2016, which was approximately $1.8 million below the carrying value. Market risk was estimated as the potential increase to the fair value that would result from a hypothetical 10 percent decrease in the Company’s weighted average long-term borrowing rates at December 31, 2016, or $18.3 million.
Commodity Price Risk
Certain raw materials used in the manufacture of the Company’s products are subject to price volatility caused by weather, petroleum price fluctuations, general economic demand and other unpredictable factors. Increased raw material costs are recovered from customers as quickly as the marketplace allows; however, certain contractual arrangements allow for price changes only on a quarterly basis, and competitive pressures sometimes prevent the recovery of cost increases from customers, particularly in periods where there is excess industry capacity. As a result, for some product lines or market segments it may take time to recover raw material price increases. Periodically, firm purchase commitments are entered into which fix the price of a specific commodity that will be delivered at a future time. Forward purchase contracts are used to aid in managing the Company’s natural gas costs. At December 31, 2016, the Company had open forward contracts for the purchase of 0.8 million dekatherms of natural gas at a cost of $2.3 million. Because the Company has agreed to fixed prices for the noted quantity of natural gas, a hypothetical 10 percent fluctuation in the price of natural gas would cause the Company’s actual natural gas cost to be $0.2 million higher or lower than the cost at market price.
39
Item 8. Financial Statements and Supplementary Data
The following statements and data are included in this item:
Report of Independent Registered Public Accounting Firm
Consolidated Statements of Income (For years ended December 31, 2016, 2015 and 2014)
Consolidated Statements of Comprehensive Income (For years ended December 31, 2016, 2015 and 2014)
Consolidated Balance Sheets (December 31, 2016 and 2015)
Consolidated Statements of Cash Flow (For years ended December 31, 2016, 2015 and 2014)
Consolidated Statements of Stockholders’ Equity (For years ended December 31, 2016, 2015 and 2014)
Notes to Consolidated Financial Statements
Selected Quarterly Financial Data
40
Report of Independent Registered Public Accounting Firm
To the Board of Directors and Stockholders of
Stepan Company
Northfield, Illinois
We have audited the accompanying consolidated balance sheets of Stepan Company and subsidiaries (the “Company”) as of December 31, 2016 and 2015, and the related consolidated statements of income, comprehensive income, equity, and cash flows for each of the three years in the period ended December 31, 2016. These financial statements are the responsibility of the Company’s management. Our responsibility is to express an opinion on the financial statements based on our audits.
We conducted our audits in accordance with the standards of the Public Company Accounting Oversight Board (United States). Those standards require that we plan and perform the audit to obtain reasonable assurance about whether the financial statements are free of material misstatement. An audit includes examining, on a test basis, evidence supporting the amounts and disclosures in the financial statements. An audit also includes assessing the accounting principles used and significant estimates made by management, as well as evaluating the overall financial statement presentation. We believe that our audits provide a reasonable basis for our opinion.
In our opinion, such consolidated financial statements present fairly, in all material respects, the financial position of Stepan Company and subsidiaries as of December 31, 2016 and 2015, and the results of their operations and their cash flows for each of the three years in the period ended December 31, 2016, in conformity with accounting principles generally accepted in the United States of America.
We have also audited, in accordance with the standards of the Public Company Accounting Oversight Board (United States), the Company’s internal control over financial reporting as of December 31, 2016, based on the criteria established in Internal Control – Integrated Framework (2013) issued by the Committee of Sponsoring Organizations of the Treadway Commission and our report dated February 24, 2017 expressed an unqualified opinion on the Company’s internal control over financial reporting.
|
/s/ Deloitte & Touche LLP |
|
DELOITTE & TOUCHE LLP |
Chicago, Illinois
February 24, 2017
41
Consolidated Statements of Income
For the years ended December 31, 2016, 2015 and 2014
|
(In thousands, except per share amounts) |
|
2016 |
|
|
2015 |
|
|
2014 |
|
|||
|
Net Sales (Note 1) |
|
$ |
1,766,166 |
|
|
$ |
1,776,167 |
|
|
$ |
1,927,213 |
|
|
Cost of Sales |
|
|
1,427,621 |
|
|
|
1,467,926 |
|
|
|
1,677,650 |
|
|
Gross Profit |
|
|
338,545 |
|
|
|
308,241 |
|
|
|
249,563 |
|
|
Operating Expenses: |
|
|
|
|
|
|
|
|
|
|
|
|
|
Selling (Note 1) |
|
|
57,212 |
|
|
|
55,522 |
|
|
|
54,763 |
|
|
Administrative (Note 1) |
|
|
75,185 |
|
|
|
76,048 |
|
|
|
66,549 |
|
|
Research, development and technical services (Note 1) |
|
|
56,086 |
|
|
|
50,243 |
|
|
|
45,451 |
|
|
Deferred compensation expense (income) |
|
|
16,805 |
|
|
|
6,500 |
|
|
|
(11,903 |
) |
|
|
|
|
205,288 |
|
|
|
188,313 |
|
|
|
154,860 |
|
|
Gain on sale of product line |
|
|
— |
|
|
|
2,862 |
|
|
|
— |
|
|
Business restructuring and asset impairments (Note 22) |
|
|
(7,064 |
) |
|
|
— |
|
|
|
(4,009 |
) |
|
Operating Income |
|
|
126,193 |
|
|
|
122,790 |
|
|
|
90,694 |
|
|
Other Income (Expense): |
|
|
|
|
|
|
|
|
|
|
|
|
|
Interest, net (Note 6) |
|
|
(13,205 |
) |
|
|
(14,533 |
) |
|
|
(11,441 |
) |
|
Loss from equity in joint ventures (Notes 1 and 25) |
|
|
— |
|
|
|
(6,985 |
) |
|
|
(5,008 |
) |
|
Other, net (Note 8) |
|
|
828 |
|
|
|
1,584 |
|
|
|
1,290 |
|
|
|
|
|
(12,377 |
) |
|
|
(19,934 |
) |
|
|
(15,159 |
) |
|
Income Before Provision for Income Taxes |
|
|
113,816 |
|
|
|
102,856 |
|
|
|
75,535 |
|
|
Provision for Income Taxes (Note 9) |
|
|
27,618 |
|
|
|
26,819 |
|
|
|
18,454 |
|
|
Net Income |
|
|
86,198 |
|
|
|
76,037 |
|
|
|
57,081 |
|
|
Net (Income) Loss Attributable to Noncontrolling Interests (Note 1) |
|
|
(7 |
) |
|
|
(69 |
) |
|
|
20 |
|
|
Net Income Attributable to Stepan Company |
|
$ |
86,191 |
|
|
$ |
75,968 |
|
|
$ |
57,101 |
|
|
|
|
|
|
|
|
|
|
|
|
|
|
|
|
Net Income Per Common Share Attributable to Stepan Company (Note 18): |
|
|
|
|
|
|
|
|
|
|
|
|
|
Basic |
|
$ |
3.78 |
|
|
$ |
3.34 |
|
|
$ |
2.51 |
|
|
Diluted |
|
$ |
3.73 |
|
|
$ |
3.32 |
|
|
$ |
2.49 |
|
|
Shares Used to Compute Net Income Per Common Share Attributable to Stepan Company (Note 18): |
|
|
|
|
|
|
|
|
|
|
|
|
|
Basic |
|
|
22,793 |
|
|
|
22,730 |
|
|
|
22,758 |
|
|
Diluted |
|
|
23,094 |
|
|
|
22,858 |
|
|
|
22,917 |
|
The accompanying Notes to Consolidated Financial Statements are an integral part of these statements.
42
Consolidated Statements of Comprehensive Income
For the years ended December 31, 2016, 2015 and 2014
|
(In thousands) |
|
2016 |
|
|
2015 |
|
|
2014 |
|
|||
|
Net Income |
|
$ |
86,198 |
|
|
$ |
76,037 |
|
|
$ |
57,081 |
|
|
Other Comprehensive Income (Loss): |
|
|
|
|
|
|
|
|
|
|
|
|
|
Foreign currency translation adjustments (Note 19) |
|
|
(8,533 |
) |
|
|
(45,490 |
) |
|
|
(31,980 |
) |
|
Defined benefit pension plans: |
|
|
|
|
|
|
|
|
|
|
|
|
|
Net actuarial gain (loss) arising in period (net of taxes of $3,391, $568 and $14,227 for 2016, 2015 and 2014, respectively) |
|
|
3,818 |
|
|
|
1,311 |
|
|
|
(24,186 |
) |
|
Amortization of prior service cost included in pension expense (net of taxes of $4, $6 and $6 for 2016, 2015 and 2014, respectively) |
|
|
10 |
|
|
|
11 |
|
|
|
14 |
|
|
Amortization of actuarial loss included in pension expense (net of taxes of $1,301, $1,755 and $1,032 for 2016, 2015 and 2014, respectively) |
|
|
2,207 |
|
|
|
3,002 |
|
|
|
1,695 |
|
|
Net defined benefit pension plan activity (Note 19) |
|
|
6,035 |
|
|
|
4,324 |
|
|
|
(22,477 |
) |
|
Cash flow hedges: |
|
|
|
|
|
|
|
|
|
|
|
|
|
Losses arising in period (net of taxes of $9, $26, $0 in 2016, 2015 and 2014, respectively) |
|
|
(19 |
) |
|
|
(49 |
) |
|
|
— |
|
|
Reclassifications to income in period (net of taxes of $28, $8 and $7 in 2016, 2015 and 2014, respectively) |
|
|
45 |
|
|
|
5 |
|
|
|
3 |
|
|
Net cash flow hedge activity (Note 19) |
|
|
26 |
|
|
|
(44 |
) |
|
|
3 |
|
|
Other Comprehensive Loss |
|
|
(2,472 |
) |
|
|
(41,210 |
) |
|
|
(54,454 |
) |
|
Comprehensive Income |
|
|
83,726 |
|
|
|
34,827 |
|
|
|
2,627 |
|
|
Comprehensive (Income) Loss Attributable to Noncontrolling Interests |
|
|
88 |
|
|
|
(2 |
) |
|
|
57 |
|
|
Comprehensive Income Attributable to Stepan Company |
|
$ |
83,814 |
|
|
$ |
34,825 |
|
|
$ |
2,684 |
|
The accompanying Notes to Consolidated Financial Statements are an integral part of these statements.
43
December 31, 2016 and 2015
|
(In thousands, except share and per share amounts) |
|
2016 |
|
|
2015 |
|
||
|
Assets |
|
|
|
|
|
|
|
|
|
Current Assets: |
|
|
|
|
|
|
|
|
|
Cash and cash equivalents |
|
$ |
225,743 |
|
|
$ |
176,143 |
|
|
Receivables, less allowances of $9,755 in 2016 and $8,046 in 2015 |
|
|
263,408 |
|
|
|
249,602 |
|
|
Inventories (Note 5) |
|
|
173,663 |
|
|
|
170,424 |
|
|
Other current assets |
|
|
22,727 |
|
|
|
23,404 |
|
|
Total current assets |
|
|
685,541 |
|
|
|
619,573 |
|
|
Property, Plant and Equipment: |
|
|
|
|
|
|
|
|
|
Land |
|
|
15,779 |
|
|
|
15,132 |
|
|
Buildings and improvements |
|
|
184,773 |
|
|
|
173,964 |
|
|
Machinery and equipment |
|
|
1,241,838 |
|
|
|
1,161,051 |
|
|
Construction in progress |
|
|
71,088 |
|
|
|
95,951 |
|
|
|
|
|
1,513,478 |
|
|
|
1,446,098 |
|
|
Less: accumulated depreciation |
|
|
(930,764 |
) |
|
|
(890,635 |
) |
|
Property, plant and equipment, net |
|
|
582,714 |
|
|
|
555,463 |
|
|
Goodwill, net (Note 4) |
|
|
25,308 |
|
|
|
11,265 |
|
|
Other intangible assets, net (Note 4) |
|
|
22,339 |
|
|
|
17,957 |
|
|
Long-term investments (Note 2) |
|
|
24,055 |
|
|
|
20,910 |
|
|
Other non-current assets (a) |
|
|
13,933 |
|
|
|
13,224 |
|
|
Total Assets |
|
$ |
1,353,890 |
|
|
$ |
1,238,392 |
|
|
|
|
|
|
|
|
|
|
|
|
Liabilities and Equity |
|
|
|
|
|
|
|
|
|
Current Liabilities: |
|
|
|
|
|
|
|
|
|
Current maturities of long-term debt (Note 6) |
|
$ |
28,154 |
|
|
$ |
18,806 |
|
|
Accounts payable |
|
|
158,316 |
|
|
|
128,605 |
|
|
Accrued liabilities (Note 14) |
|
|
110,795 |
|
|
|
95,833 |
|
|
Total current liabilities |
|
|
297,265 |
|
|
|
243,244 |
|
|
Deferred income taxes (Note 9) |
|
|
12,497 |
|
|
|
9,455 |
|
|
Long-term debt, less current maturities (Note 6) (a) |
|
|
288,859 |
|
|
|
312,548 |
|
|
Other non-current liabilities (Note 15) |
|
|
119,353 |
|
|
|
114,761 |
|
|
|
|
|
|
|
|
|
|
|
|
Commitments and Contingencies (Note 16) |
|
|
|
|
|
|
|
|
|
|
|
|
|
|
|
|
|
|
|
Equity (Note 10): |
|
|
|
|
|
|
|
|
|
Common stock, $1 par value; authorized 60,000,000 shares; issued 25,894,782 shares in 2016 and 25,709,391 shares in 2015 |
|
|
25,895 |
|
|
|
25,709 |
|
|
Additional paid-in capital |
|
|
158,042 |
|
|
|
144,601 |
|
|
Accumulated other comprehensive loss (Note 19) |
|
|
(127,465 |
) |
|
|
(125,088 |
) |
|
Retained earnings |
|
|
649,070 |
|
|
|
580,208 |
|
|
Less: Common treasury stock, at cost, 3,470,084 shares in 2016 and 3,428,541 shares in 2015 |
|
|
(70,938 |
) |
|
|
(68,446 |
) |
|
Total Stepan Company stockholders’ equity |
|
|
634,604 |
|
|
|
556,984 |
|
|
Noncontrolling interests |
|
|
1,312 |
|
|
|
1,400 |
|
|
Total equity |
|
|
635,916 |
|
|
|
558,384 |
|
|
Total Liabilities and Equity |
|
$ |
1,353,890 |
|
|
$ |
1,238,392 |
|
|
|
(a) |
The 2015 amounts have been changed from the amounts originally reported at December 31, 2015, due to the Company’s January 1, 2016, adoption of the new U.S. accounting guidance regarding the classification of debt issuance costs. See Note 1 to the consolidated financial statements for additional information regarding Accounting Standards Update No. 2015-3. |
|
The accompanying Notes to Consolidated Financial Statements are an integral part of these statements.
44
Consolidated Statements of Cash Flows
For the years ended December 31, 2016, 2015 and 2014
|
(In thousands) |
|
2016 |
|
|
2015 |
|
|
2014 |
|
|||
|
Cash Flows From Operating Activities |
|
|
|
|
|
|
|
|
|
|
|
|
|
Net income |
|
$ |
86,198 |
|
|
$ |
76,037 |
|
|
$ |
57,081 |
|
|
Adjustments to reconcile net income to net cash provided by operating activities: |
|
|
|
|
|
|
|
|
|
|
|
|
|
Depreciation and amortization |
|
|
74,967 |
|
|
|
66,985 |
|
|
|
63,804 |
|
|
Deferred compensation |
|
|
16,805 |
|
|
|
6,500 |
|
|
|
(11,903 |
) |
|
Realized and unrealized gain on long-term investments |
|
|
(152 |
) |
|
|
(21 |
) |
|
|
(241 |
) |
|
Stock-based compensation |
|
|
12,618 |
|
|
|
4,374 |
|
|
|
(68 |
) |
|
Deferred income taxes |
|
|
(8,426 |
) |
|
|
3,001 |
|
|
|
5,306 |
|
|
Other non-cash items |
|
|
7,334 |
|
|
|
3,830 |
|
|
|
8,260 |
|
|
Changes in assets and liabilities, excluding effects of acquisitions: |
|
|
|
|
|
|
|
|
|
|
|
|
|
Receivables, net |
|
|
(17,180 |
) |
|
|
4,160 |
|
|
|
(21,229 |
) |
|
Inventories |
|
|
(3,774 |
) |
|
|
2,851 |
|
|
|
(18,521 |
) |
|
Other current assets |
|
|
1,471 |
|
|
|
(3,410 |
) |
|
|
1,430 |
|
|
Accounts payable and accrued liabilities |
|
|
38,261 |
|
|
|
21,219 |
|
|
|
(4,376 |
) |
|
Pension liabilities |
|
|
607 |
|
|
|
932 |
|
|
|
(2,709 |
) |
|
Environmental and legal liabilities |
|
|
4,561 |
|
|
|
(1,398 |
) |
|
|
6,493 |
|
|
Deferred revenues |
|
|
(1,128 |
) |
|
|
(1,345 |
) |
|
|
(732 |
) |
|
Net Cash Provided By Operating Activities (a) |
|
|
212,162 |
|
|
|
183,715 |
|
|
|
82,595 |
|
|
Cash Flows From Investing Activities |
|
|
|
|
|
|
|
|
|
|
|
|
|
Expenditures for property, plant and equipment |
|
|
(103,076 |
) |
|
|
(119,349 |
) |
|
|
(101,819 |
) |
|
Business acquisitions, net of cash acquired (Note 20) |
|
|
(23,510 |
) |
|
|
(5,133 |
) |
|
─ |
|
|
|
Proceeds from sale of product line (Note 21) |
|
|
— |
|
|
|
3,262 |
|
|
─ |
|
|
|
Other, net |
|
|
(3,935 |
) |
|
|
(4,750 |
) |
|
|
(7,402 |
) |
|
Net Cash Used In Investing Activities |
|
|
(130,521 |
) |
|
|
(125,970 |
) |
|
|
(109,221 |
) |
|
Cash Flows From Financing Activities |
|
|
|
|
|
|
|
|
|
|
|
|
|
Revolving debt and bank overdrafts, net |
|
|
1,292 |
|
|
|
(26,217 |
) |
|
|
14,219 |
|
|
Other debt borrowings |
|
|
— |
|
|
|
100,000 |
|
|
|
4,923 |
|
|
Other debt repayments |
|
|
(15,069 |
) |
|
|
(13,098 |
) |
|
|
(12,656 |
) |
|
Dividends paid |
|
|
(17,329 |
) |
|
|
(16,300 |
) |
|
|
(15,387 |
) |
|
Company stock repurchased |
|
|
(2,408 |
) |
|
|
(2,000 |
) |
|
|
(7,924 |
) |
|
Stock option exercises |
|
|
4,017 |
|
|
|
777 |
|
|
|
1,754 |
|
|
Other, net |
|
|
(275 |
) |
|
|
(673 |
) |
|
|
(421 |
) |
|
Net Cash Provided By (Used In) Financing Activities (a) |
|
|
(29,772 |
) |
|
|
42,489 |
|
|
|
(15,492 |
) |
|
Effect of Exchange Rate Changes on Cash |
|
|
(2,269 |
) |
|
|
(9,306 |
) |
|
|
(6,014 |
) |
|
Net Increase (Decrease) in Cash and Cash Equivalents |
|
|
49,600 |
|
|
|
90,928 |
|
|
|
(48,132 |
) |
|
Cash and Cash Equivalents at Beginning of Year |
|
|
176,143 |
|
|
|
85,215 |
|
|
|
133,347 |
|
|
Cash and Cash Equivalents at End of Year |
|
$ |
225,743 |
|
|
$ |
176,143 |
|
|
$ |
85,215 |
|
|
|
|
|
|
|
|
|
|
|
|
|
|
|
|
Supplemental Cash Flow Information |
|
|
|
|
|
|
|
|
|
|
|
|
|
Cash payments of income taxes, net of refunds |
|
$ |
30,581 |
|
|
$ |
21,784 |
|
|
$ |
23,142 |
|
|
Cash payments of interest |
|
$ |
14,730 |
|
|
$ |
11,943 |
|
|
$ |
12,447 |
|
(a) Amounts for 2015 and 2014 have been changed from the amounts originally reported for the years ended December 31, 2015 and 2014 as a result of the Company’s adoption of the new accounting guidance regarding stock-based compensation. See Note 1 to the consolidated financial statements for additional information regarding Accounting Standards Update No. 2016-9.
The accompanying Notes to Consolidated Financial Statements are an integral part of these statements.
45
Consolidated Statements of Equity
For the years ended December 31, 2016, 2015 and 2014
|
|
|
|
|
|
|
|
|
|
|
|
|
|||||||||||||||||
|
(In thousands, except share and per share amounts) |
|
Total |
|
|
Common Stock |
|
|
Additional Paid-in Capital |
|
|
Treasury Stock |
|
|
Accumulated Other Comprehensive Income (Loss) |
|
|
Retained Earnings |
|
|
Noncontrolling Interest |
|
|||||||
|
Balance, December 31, 2013 |
|
$ |
553,741 |
|
|
$ |
25,564 |
|
|
$ |
135,693 |
|
|
$ |
(58,269 |
) |
|
$ |
(29,528 |
) |
|
$ |
478,826 |
|
|
$ |
1,455 |
|
|
|
|
|
|
|
|
|
|
|
|
|
|
|
|
|
|
|
|
|
|
|
|
|
|
|
|
|
|
|
|
Issuance of 67,029 shares of common stock under stock option plan |
|
|
1,754 |
|
|
|
67 |
|
|
|
1,687 |
|
|
|
— |
|
|
|
— |
|
|
|
— |
|
|
|
— |
|
|
|
|
|
|
|
|
|
|
|
|
|
|
|
|
|
|
|
|
|
|
|
|
|
|
|
|
|
|
|
|
Purchase of 60,595 shares of common stock |
|
|
(7,924 |
) |
|
|
— |
|
|
|
— |
|
|
|
(7,924 |
) |
|
|
— |
|
|
|
— |
|
|
|
— |
|
|
|
|
|
|
|
|
|
|
|
|
|
|
|
|
|
|
|
|
|
|
|
|
|
|
|
|
|
|
|
|
Stock-based and deferred compensation |
|
|
1,493 |
|
|
|
9 |
|
|
|
1,553 |
|
|
|
(69 |
) |
|
|
— |
|
|
|
— |
|
|
|
— |
|
|
|
|
|
|
|
|
|
|
|
|
|
|
|
|
|
|
|
|
|
|
|
|
|
|
|
|
|
|
|
|
Net income |
|
|
57,081 |
|
|
|
— |
|
|
|
— |
|
|
|
— |
|
|
|
— |
|
|
|
57,101 |
|
|
|
(20 |
) |
|
|
|
|
|
|
|
|
|
|
|
|
|
|
|
|
|
|
|
|
|
|
|
|
|
|
|
|
|
|
|
Other comprehensive income |
|
|
(54,454 |
) |
|
|
— |
|
|
|
— |
|
|
|
— |
|
|
|
(54,417 |
) |
|
|
— |
|
|
|
(37 |
) |
|
|
|
|
|
|
|
|
|
|
|
|
|
|
|
|
|
|
|
|
|
|
|
|
|
|
|
|
|
|
|
Cash dividends paid: |
|
|
|
|
|
|
|
|
|
|
|
|
|
|
|
|
|
|
|
|
|
|
|
|
|
|
|
|
|
Common stock ($0.69 per share) |
|
|
(15,387 |
) |
|
|
— |
|
|
|
— |
|
|
|
— |
|
|
|
— |
|
|
|
(15,387 |
) |
|
|
— |
|
|
|
|
|
|
|
|
|
|
|
|
|
|
|
|
|
|
|
|
|
|
|
|
|
|
|
|
|
|
|
|
Non-qualified stock option and stock award income tax benefit |
|
|
640 |
|
|
|
— |
|
|
|
640 |
|
|
|
— |
|
|
|
— |
|
|
|
— |
|
|
|
— |
|
|
Balance, December 31, 2014 |
|
$ |
536,944 |
|
|
$ |
25,640 |
|
|
$ |
139,573 |
|
|
$ |
(66,262 |
) |
|
$ |
(83,945 |
) |
|
$ |
520,540 |
|
|
$ |
1,398 |
|
The accompanying Notes to Consolidated Financial Statements are an integral part of these statements.
46
Consolidated Statements of Equity
For the years ended December 31, 2016, 2015 and 2014
|
|
|
|
|
|
|
STEPAN COMPANY SHAREHOLDERS |
|
|
|
||||||||||||||||||||
|
(In thousands, except share and per share amounts) |
|
Total |
|
|
|
Common Stock |
|
|
Additional Paid-in Capital |
|
|
Treasury Stock |
|
|
Accumulated Other Comprehensive Income (Loss) |
|
|
Retained Earnings |
|
|
Noncontrolling Interest |
|
|||||||
|
Balance, December 31, 2014 |
|
$ |
536,944 |
|
|
|
$ |
25,640 |
|
|
$ |
139,573 |
|
|
$ |
(66,262 |
) |
|
$ |
(83,945 |
) |
|
$ |
520,540 |
|
|
$ |
1,398 |
|
|
|
|
|
|
|
|
|
|
|
|
|
|
|
|
|
|
|
|
|
|
|
|
|
|
|
|
|
|
|
|
|
Issuance of 45,289 shares of common stock under stock option plan |
|
|
777 |
|
|
|
|
45 |
|
|
|
732 |
|
|
|
— |
|
|
|
— |
|
|
|
— |
|
|
|
— |
|
|
|
|
|
|
|
|
|
|
|
|
|
|
|
|
|
|
|
|
|
|
|
|
|
|
|
|
|
|
|
|
|
Purchase of 41,915 shares of common stock |
|
|
(2,000 |
) |
|
|
|
— |
|
|
|
— |
|
|
|
(2,000 |
) |
|
|
— |
|
|
|
— |
|
|
|
— |
|
|
|
|
|
|
|
|
|
|
|
|
|
|
|
|
|
|
|
|
|
|
|
|
|
|
|
|
|
|
|
|
|
Stock-based and deferred compensation |
|
|
3,694 |
|
|
|
|
24 |
|
|
|
3,854 |
|
|
|
(184 |
) |
|
|
— |
|
|
|
— |
|
|
|
— |
|
|
|
|
|
|
|
|
|
|
|
|
|
|
|
|
|
|
|
|
|
|
|
|
|
|
|
|
|
|
|
|
|
Net income |
|
|
76,037 |
|
|
|
|
— |
|
|
|
— |
|
|
|
— |
|
|
|
— |
|
|
|
75,968 |
|
|
|
69 |
|
|
|
|
|
|
|
|
|
|
|
|
|
|
|
|
|
|
|
|
|
|
|
|
|
|
|
|
|
|
|
|
|
Other comprehensive income |
|
|
(41,210 |
) |
|
|
|
— |
|
|
|
— |
|
|
|
— |
|
|
|
(41,143 |
) |
|
|
— |
|
|
|
(67 |
) |
|
|
|
|
|
|
|
|
|
|
|
|
|
|
|
|
|
|
|
|
|
|
|
|
|
|
|
|
|
|
|
|
Cash dividends paid: |
|
|
|
|
|
|
|
|
|
|
|
|
|
|
|
|
|
|
|
|
|
|
|
|
|
|
|
|
|
|
Common stock ($0.73 per share) |
|
|
(16,300 |
) |
|
|
|
— |
|
|
|
— |
|
|
|
— |
|
|
|
— |
|
|
|
(16,300 |
) |
|
|
— |
|
|
|
|
|
|
|
|
|
|
|
|
|
|
|
|
|
|
|
|
|
|
|
|
|
|
|
|
|
|
|
|
|
Non-qualified stock option and stock award income tax benefit |
|
|
442 |
|
|
|
|
— |
|
|
|
442 |
|
|
|
— |
|
|
|
— |
|
|
|
— |
|
|
|
— |
|
|
Balance, December 31, 2015 |
|
$ |
558,384 |
|
|
|
$ |
25,709 |
|
|
$ |
144,601 |
|
|
$ |
(68,446 |
) |
|
$ |
(125,088 |
) |
|
$ |
580,208 |
|
|
$ |
1,400 |
|
The accompanying Notes to Consolidated Financial Statements are an integral part of these statements.
47
Consolidated Statements of Equity
For the years ended December 31, 2016, 2015 and 2014
|
|
|
|
|
|
|
STEPAN COMPANY SHAREHOLDERS |
|
|
|
|
|
|||||||||||||||||
|
(In thousands, except share and per share amounts) |
|
Total |
|
|
Common Stock |
|
|
Additional Paid-in Capital |
|
|
Treasury Stock |
|
|
Accumulated Other Comprehensive Income (Loss) |
|
|
Retained Earnings |
|
|
Noncontrolling Interest |
|
|||||||
|
Balance, December 31, 2015 |
|
$ |
558,384 |
|
|
$ |
25,709 |
|
|
$ |
144,601 |
|
|
$ |
(68,446 |
) |
|
$ |
(125,088 |
) |
|
$ |
580,208 |
|
|
$ |
1,400 |
|
|
|
|
|
|
|
|
|
|
|
|
|
|
|
|
|
|
|
|
|
|
|
|
|
|
|
|
|
|
|
|
Issuance of 167,675 shares of common stock under stock option plan |
|
|
4,017 |
|
|
|
168 |
|
|
|
3,849 |
|
|
|
— |
|
|
|
— |
|
|
|
— |
|
|
|
— |
|
|
|
|
|
|
|
|
|
|
|
|
|
|
|
|
|
|
|
|
|
|
|
|
|
|
|
|
|
|
|
|
Purchase of 43,835 shares of common stock |
|
|
(2,408 |
) |
|
|
— |
|
|
|
— |
|
|
|
(2,408 |
) |
|
|
— |
|
|
|
— |
|
|
|
— |
|
|
|
|
|
|
|
|
|
|
|
|
|
|
|
|
|
|
|
|
|
|
|
|
|
|
|
|
|
|
|
|
Stock-based and deferred compensation |
|
|
9,526 |
|
|
|
18 |
|
|
|
9,592 |
|
|
|
(84 |
) |
|
|
— |
|
|
|
— |
|
|
|
— |
|
|
|
|
|
|
|
|
|
|
|
|
|
|
|
|
|
|
|
|
|
|
|
|
|
|
|
|
|
|
|
|
Net income |
|
|
86,198 |
|
|
|
— |
|
|
|
— |
|
|
|
— |
|
|
|
— |
|
|
|
86,191 |
|
|
|
7 |
|
|
|
|
|
|
|
|
|
|
|
|
|
|
|
|
|
|
|
|
|
|
|
|
|
|
|
|
|
|
|
|
Other comprehensive income |
|
|
(2,472 |
) |
|
|
— |
|
|
|
— |
|
|
|
— |
|
|
|
(2,377 |
) |
|
|
— |
|
|
|
(95 |
) |
|
|
|
|
|
|
|
|
|
|
|
|
|
|
|
|
|
|
|
|
|
|
|
|
|
|
|
|
|
|
|
Cash dividends paid: |
|
|
|
|
|
|
|
|
|
|
|
|
|
|
|
|
|
|
|
|
|
|
|
|
|
|
|
|
|
Common stock ($0.78 per share) |
|
|
(17,329 |
) |
|
|
— |
|
|
|
— |
|
|
|
— |
|
|
|
— |
|
|
|
(17,329 |
) |
|
|
— |
|
|
|
|
|
|
|
|
|
|
|
|
|
|
|
|
|
|
|
|
|
|
|
|
|
|
|
|
|
|
|
|
Balance, December 31, 2016 |
|
$ |
635,916 |
|
|
$ |
25,895 |
|
|
$ |
158,042 |
|
|
$ |
(70,938 |
) |
|
$ |
(127,465 |
) |
|
$ |
649,070 |
|
|
$ |
1,312 |
|
The accompanying Notes to Consolidated Financial Statements are an integral part of these statements.
48
Notes to Consolidated Financial Statements
For the years ended December 31, 2016, 2015 and 2014
1. Summary of Significant Accounting Policies
Nature of Operations
Stepan Company (the Company) operations consist predominantly of the production and sale of specialty and intermediate chemicals, which are sold to other manufacturers for use in a variety of end products. Principal markets for all products are manufacturers of cleaning and washing compounds (including detergents, shampoos, fabric softeners, toothpastes and household cleaners), paints, cosmetics, food, beverages, nutritional supplements, agricultural products, plastics, furniture, automotive equipment, insulation and refrigeration.
Use of Estimates
The preparation of financial statements in conformity with accounting principles generally accepted in the United States of America (GAAP) requires Company management to make estimates and assumptions that affect the reported amounts of assets and liabilities and disclosure of contingent assets and liabilities at the date of the financial statements and the reported amounts of revenues and expenses during the reporting period. Actual results could differ from those estimates.
Principles of Consolidation
The consolidated financial statements include the accounts of the Company and all wholly and majority-owned subsidiaries in which the Company exercises controlling influence. The equity method is used to account for investments in which the Company exercises significant but noncontrolling influence. Intercompany balances and transactions are eliminated in consolidation.
The Company has an 80 percent ownership interest in the Nanjing Stepan Jinling Chemical Limited Liability Company (a joint venture) and exercises controlling influence over the entity. Therefore, Nanjing Stepan Jinling Chemical Limited Liability Company’s accounts are included in the Company’s consolidated financial statements. The partner’s interest in the joint venture’s net income is reported in the net income attributable to noncontrolling interests line of the consolidated statements of income. The partner’s interest in the net assets of the joint venture is reported in the noncontrolling interests line (a component of equity separate from Company equity) of the consolidated balance sheets.
Prior to 2016, the Company and Nalco Company (a subsidiary of Ecolab Inc.) equally owned and controlled TIORCO, LLC, a joint venture operated out of Denver, Colorado. In October 2015, the Company and Nalco Company made the decision to dissolve TIORCO, LLC. See Note 24 for information regarding the dissolution of the joint venture. Prior to the dissolution of the joint venture, the Company’s investment in TIORCO, LLC was accounted for using the equity method and was included in the other non-current assets line on the consolidated balance sheets. The Company’s share of joint venture’s net earnings was included in the loss from equity in joint ventures line of the consolidated statements of income.
Cash and Cash Equivalents
The Company considers all highly liquid investments with purchased maturities of three months or less to be cash equivalents.
At December 31, 2016, the Company’s cash and cash equivalents totaled $225.7 million including $38.6 million in two separate money market funds, each of which was rated AAA by Standard and Poor’s and Aaa by Moody’s. Cash in U.S. demand deposit accounts totaled $88.9 million and cash of the Company’s non-U.S. subsidiaries held outside the U.S. totaled $98.2 million as of December 31, 2016.
Receivables and Credit Risk
Receivables are stated net of allowances for doubtful accounts and other allowances and primarily include trade receivables from customers, as well as nontrade receivables from suppliers, governmental tax agencies and others.
The Company is exposed to credit risk on accounts receivable balances. This risk is mitigated by the Company’s large, diverse customer base, which is dispersed over various geographic regions and industrial sectors. No single customer comprised more than 10 percent of the Company’s consolidated net sales in 2016, 2015 or 2014.
The Company maintains allowances for potential credit losses. Specific customer allowances are recorded when a review of customer creditworthiness and current economic conditions indicate that collection is doubtful. In addition, the Company maintains a
49
general allowance as a percentage of total trade receivables. The general allowance percentage is periodically reviewed and adjusted based on historical bad debt losses of the Company.
The Company also maintains other customer allowances that occur in the normal course of business. Such allowances are based on historical averages and trade receivable levels.
The following is an analysis of the allowance for doubtful accounts and other accounts receivable allowances for the years ended December 31, 2016, 2015 and 2014:
|
(In thousands) |
|
2016 |
|
|
2015 |
|
|
2014 |
|
|||
|
Balance at January 1 |
|
$ |
8,046 |
|
|
$ |
10,011 |
|
|
$ |
5,945 |
|
|
Provision charged to income |
|
|
1,917 |
|
|
|
1,106 |
|
|
|
4,625 |
|
|
Accounts written off, net of recoveries |
|
|
(208) |
|
|
|
(3,071 |
) |
|
|
(559 |
) |
|
Balance at December 31 |
|
$ |
9,755 |
|
|
$ |
8,046 |
|
|
$ |
10,011 |
|
The 2014 provision charged to income included a $2,388,000 bad debt allowance for a major Polymer customer that filed for protection under Chapter 11 of the U.S. Bankruptcy Code in September 2014. Also included in the 2014 provision charged to income were additional allowances for certain high risk accounts and for general reserves. The accounts written off for 2015 included the write-off of the Polymer customer’s uncollectible receivable balance.
Inventories
Inventories are valued at cost, which is not in excess of market value, and include material, labor and plant overhead costs. The last-in, first-out (LIFO) method is used to determine the cost of the Company’s U.S. inventories. The first-in, first-out (FIFO) method is used for all other inventories. Inventories priced at LIFO as of December 31, 2016 and 2015, accounted for 66 and 72 percent of total inventories, respectively.
Property, Plant and Equipment
Depreciation of property, plant and equipment is provided on a straight-line basis over the estimated useful lives of the assets. Lives used for calculating depreciation are generally 30 years for buildings and 15 years for building improvements. For assets classified as machinery and equipment, lives generally used for calculating depreciation expense range from 10 to 15 years for manufacturing equipment, five to 10 years for furniture and fixtures, three to five years for vehicles and three to 10 years for computer equipment and software. Manufacturing of chemicals is capital intensive with a large majority of the assets included in machinery and equipment representing manufacturing equipment. Major renewals and betterments are capitalized in the property accounts, while maintenance and repairs ($51,530,000, $52,549,000, and $55,923,000 in 2016, 2015 and 2014, respectively), which do not renew or extend the life of the respective assets, are charged to operations as incurred. Land is not depreciated. The cost of property retired or sold and the related accumulated depreciation are removed from the accounts and any resulting gain or loss is reflected in income.
Included in the computer equipment and software component of machinery and equipment are costs related to the acquisition and development of internal-use software. Capitalized costs for internal-use software include external direct costs of materials and services consumed in obtaining and developing the software. For development projects where major internal resources are committed, payroll and payroll-related costs incurred during the application development phase of the project are also capitalized. The capitalized costs are amortized over the useful lives of the software, which are generally three to 10 years. Costs incurred in the preliminary project phase are expensed.
Interest charges on borrowings applicable to major construction projects are capitalized.
Property, plant and equipment assets are tested for impairment when events indicate that impairment may have occurred. See Note 22 for 2016 and 2014 asset impairments.
Fair Value Measurements
GAAP defines fair value as the price that would be received to sell an asset or paid to transfer a liability in an orderly transaction between market participants at the measurement date. Furthermore, GAAP establishes a framework, in the form of a three-level hierarchy, for measuring fair value that prioritizes the inputs to valuation techniques used to measure fair value. The following describes the hierarchy levels:
Level 1 - quoted prices in active markets for identical assets and liabilities.
50
Level 2 - inputs other than quoted prices included within Level 1 that are directly or indirectly observable for the asset or liability, such as quoted prices for similar assets or liabilities in active markets, quoted prices for identical or similar assets and liabilities in markets that are not active, or other inputs that are observable or can be corroborated by observable market data.
Level 3 - unobservable inputs which reflect the entity’s own assumptions about the assumptions market participants use in pricing the assets and liabilities.
The Company applies the fair value measurement provisions of GAAP to any of its financial assets and liabilities that are carried at fair value on the consolidated balance sheets (see Note 2), its outstanding debt for disclosure purposes (also Note 2) and its pension plan assets (see Note 13).
The Company also applies the fair value measurement requirements to nonrecurring fair value measurements of nonfinancial assets and liabilities recorded in conjunction with business combinations and as part of impairment reviews for goodwill and other long-lived assets.
Revenue Recognition
Revenue is recognized upon shipment of goods to customers, at which time title and risk of loss pass to the customer. For arrangements where the Company consigns product to a customer location, revenue is recognized when the customer uses the inventory. The Company records shipping and handling billed to a customer in a sales transaction as revenue. Costs incurred for shipping and handling are reported in cost of sales. Volume discounts due customers are estimated and recorded in the same period as the sales to which the discounts relate and reported as reductions of revenue in the consolidated statements of income.
Cost of Sales
Cost of sales comprises raw material costs (including inbound freight expense to deliver the raw materials), manufacturing plant labor expenses and various manufacturing overhead expenses, such as utility, maintenance, operating supply, amortization and manufacturing asset depreciation expenses. Cost of sales also includes outbound shipping and handling expenses, inter-plant transfer costs and warehouse expenses.
Operating Expenses
Selling expense comprises salary and the related fringe benefit expenses for marketing and sales personnel and operating costs, such as outside agent commissions, automobile rental and travel-related expenses, which support the sales and marketing functions. Bad debt charges and any depreciation expenses related to marketing assets (e.g., computers) are also classified as selling expense.
Administrative expense comprises salary and the related fringe benefit expenses and operating costs for the Company’s various administrative functions, which include information services, finance, legal, and human resources. Environmental remediation expenses are also classified as administrative expense.
The Company’s research and development costs are expensed as incurred. These expenses are aimed at discovery and commercialization of new knowledge with the intent that such effort will be useful in developing a new product or in bringing about a significant improvement to an existing product or process. Total research and development expenses were $34,856,000, $30,315,000 and $27,236,000 in 2016, 2015 and 2014, respectively. The remainder of research, development and technical service expenses reflected on the consolidated statements of income relates to technical services, which include routine product testing, quality control and sales support service.
Compensation expense or income related to the Company’s deferred compensation plans is presented in the deferred compensation expense (income) line in the Consolidated Statements of Income.
Environmental Expenditures
Environmental expenditures that relate to current operations are expensed in cost of sales. Expenditures that mitigate or prevent environmental contamination and that benefit future operations are capitalized as assets and depreciated on a straight-line basis over the estimated useful lives of the assets, which are typically 10 years.
Estimated future expenditures that relate to an existing condition caused by past operations, and which do not contribute to current or future revenue generation, are recorded as liabilities, with the corresponding charge recorded in administrative expenses, when environmental assessments and/or remedial efforts are probable and the cost or range of possible costs can be reasonably estimated. When no amount within the range is a better estimate than any other amount, the minimum amount in the range is accrued.
51
Some of the factors on which the Company bases its estimates include information provided by feasibility studies, potentially responsible party negotiations and the development of remedial action plans. Legal costs related to environmental matters are expensed as incurred (see Note 16 for environmental contingencies).
Goodwill and Other Intangible Assets
The Company’s intangible assets include patents, agreements not to compete, trademarks, customer lists and relationships, technological and manufacturing know-how, supply contracts and goodwill, all of which were acquired as part of business or product line acquisitions. Intangible assets other than goodwill are determined to have either finite or indefinite useful lives. The Company currently has no indefinite-life intangible assets. The values for intangible assets with finite lives are amortized over the useful lives of the assets. Currently, the useful lives for Company’s finite-lived intangible assets are as follows: patents – 10-15 years; non-compete agreements – five years; trademarks – 11 years; customer relationships – 10-13 years; supply contracts – four years and know-how – eight years. In addition, finite-life intangible assets are tested for impairment when events or changes in circumstances indicate that the carrying value of an intangible asset may not be recoverable. Goodwill is not amortized but is tested for impairment at least annually or more frequently if an event occurs or circumstances change that would more likely than not reduce the fair value of a reporting unit to which goodwill relates below the reporting unit’s carrying value. See Note 4 for detailed information about goodwill and other intangible assets.
Income Taxes
The provision for income taxes is determined using the asset and liability method, under which deferred tax assets and liabilities are recognized for the expected future tax consequences of temporary differences between the financial reporting and tax bases of assets and liabilities. Deferred tax assets or liabilities are computed using the currently enacted tax rates that apply to taxable income in effect for the years in which those tax assets and liabilities are expected to be realized or settled. Deferred tax assets and liabilities are adjusted for changes in tax rates or laws, and the effects of the changes are recorded in income in the period of enactment. Valuation allowances are recorded to reduce deferred tax assets when the Company determines that it is more likely than not that a tax benefit will not be realized.
The Company recognizes the tax benefit from an uncertain tax position only if it is more likely than not that the tax position will be sustained upon examination by tax authorities. If the tax position meets the more-likely-than-not threshold, the tax benefit recognized in the consolidated financial statements is measured at the largest amount of benefit that is greater than 50 percent likely of being realized upon effective settlement. Unrecognized tax benefits, which are differences between the tax position taken on a tax return and the amounts recognized in the financial statements, are recorded either as an increase to a tax liability or as a decrease to an income tax receivable. The Company includes estimated interest and penalty amounts related to the unrecognized tax benefits in the tax provision.
See Note 9 for detailed information about income taxes.
Translation of Foreign Currencies
For the Company’s consolidated foreign subsidiaries whose functional currency is the local foreign currency, assets and liabilities are translated into U.S. dollars at exchange rates in effect at year end and revenues and expenses are translated at average exchange rates for the year. Any resulting translation adjustments are included in the consolidated balance sheets in the accumulated other comprehensive loss line of stockholders’ equity. Gains or losses on foreign currency transactions are reflected in the other, net caption of the consolidated statements of income. The Company has one foreign subsidiary whose functional currency is the U.S. dollar. For this subsidiary, nonmonetary assets and liabilities are translated at historical rates, monetary assets and liabilities are translated at exchange rates in effect at year end, revenues and expenses are translated at average exchange rates for the year and translation gains and losses are included in the other, net caption of the consolidated statements of income.
Stock-Based Compensation
The Company grants stock options, stock awards (including performance-based stock awards) and stock appreciation rights (SARs) to certain employees under its incentive compensation plans. The Company calculates the fair values of stock options, stock awards and SARs on the date such instruments are granted. The fair values of the stock options and stock awards are then recognized as compensation expense over the vesting periods of the instruments. The Company’s SARs granted before 2015 settle in cash. The cash-settled SARs are accounted for as liabilities that must be re-measured at fair value at the end of each reporting period. Compensation expense for each reporting period is calculated as the period-to-period change (or portion of the change, depending on the proportion of the vesting period that has been completed at the reporting date) in the fair value of the cash-settled SARs. SARs granted subsequent to 2014 are settled in shares of Company common stock. Compensation expense for the stock-settled SARs is calculated in the same way as compensation expense for stock options. See ‘Recent Accounting Pronouncements’ of Note 1 for a
52
discussion of the Company’s early adoption of the new accounting guidance for stock-based compensation. Also, see Note 11 for detailed information about the Company’s stock-based compensation.
Earnings Per Share
Basic earnings per share amounts are computed as net income attributable to the Company divided by the weighted-average number of common shares outstanding. Diluted earnings per share amounts are based on the weighted-average number of common shares outstanding plus the weighted-average of net common shares (under the treasury stock method) that would be outstanding assuming the exercise of outstanding stock options and stock-settled SARs, the vesting of unvested stock awards that have no performance or market condition and the issuance of contingent performance stock awards. See Note 18 for detailed information about the Company’s earnings per share calculations.
Comprehensive Income and Accumulated Other Comprehensive Income
Comprehensive income includes net income and all other non-owner changes in equity that are not reported in net income. Comprehensive income is disclosed in the consolidated statements of comprehensive income. Accumulated other comprehensive income (AOCI) is reported as a component of stockholders’ equity in the Company’s consolidated balance sheets. See Note 19 for detailed information regarding changes in the Company’s AOCI and reclassifications out of AOCI to income.
Segment Reporting
The Company reports financial and descriptive information about its reportable operating segments. Operating segments are components of the Company that have separate financial information that is regularly evaluated by the chief operating decision maker to assess segment performance and allocate resources. The Company discloses segment revenue, operating income, assets, capital expenditures and depreciation and amortization expenses. Enterprise-wide financial information about the geographic locations in which the Company earns revenues and holds assets is also disclosed (see Note 17).
Derivative Instruments
Derivative instruments are recognized in the consolidated balance sheets as either assets or liabilities measured at fair value. For derivative instruments that are not designated as hedging instruments, changes in the fair values of the derivative instruments are recognized currently in earnings. For derivative instruments designated as hedging instruments, depending on the nature of the hedge, changes in the fair values of the derivative instruments are either offset in earnings against changes in the fair values of the hedged items or recognized in AOCI until the hedged transaction is recognized in earnings. At the time a hedging relationship is designated, the Company establishes the method it will use for assessing the effectiveness of the hedge and the measurement approach for determining the ineffective aspect of the hedge. Company policy prohibits the use of derivative instruments for trading or speculative purposes. See Note 3 for further information regarding the Company’s use of derivatives.
At December 31, 2016, the Company held open forward contracts for the purchase of 0.8 million dekatherms of natural gas in 2017 at a cost of $2,285,000. The Company uses forward contracts to minimize its exposure to volatile natural gas prices. Because the Company anticipates taking delivery of the natural gas for use in its operations, the forward contracts qualify for the normal purchase exception provided under U.S. GAAP for derivative instruments. The Company has elected the exception for such contracts. As a result, the forward contracts are not accounted for as derivative instruments. The cost of natural gas is charged to expense at the time the natural gas is delivered and used.
Recent Accounting Pronouncements
Accounting Guidance Adopted in the Quarter Ended December 31, 2016
In March 2016, the Financial Accounting Standards Board (FASB) issued Accounting Standards Update (ASU) No. 2016-9, Compensation – Stock Compensation (Topic 718): Improvements to Employee Share-Based Payment Accounting. The ASU was issued to simplify various facets of the accounting for employee share-based payment transactions. The new guidance requires excess tax benefits and tax deficiencies to be recorded in the income statement when the awards vest or are settled. Cash flows related to excess tax benefits will no longer be separately classified as a financing activity on the statement of cash flows but will be presented with all other income tax cash flows as an operating activity. The new guidance also provides an accounting policy election to account for forfeitures as they occur. Finally, the updated standard also allows the Company to repurchase more of an employee’s shares for tax withholding purposes without triggering liability accounting and clarifies that all cash tax payments made on an employee’s behalf for withheld shares should be presented as financing activities on the statement of cash flows. For the Company, ASU 2016-9 is effective for annual periods beginning after December 15, 2016, and interim periods within those annual periods.
53
The Company elected to early-adopt the guidance in ASU No. 2016-9 in the fourth quarter ended December 31, 2016, which required the Company to reflect adjustments arising from the adoption of the new guidance as of January 1, 2016, the beginning of the annual period that included the interim period of adoption. The primary impact of adoption was the recognition of excess tax benefits in the provision for income taxes rather than additional paid-in capital for all periods in fiscal year 2016. Additional amendments to the accounting for income taxes had no impact on retained earnings as of January 1, 2016, where the cumulative effect of these changes are required to be recorded, as all excess tax benefits had been previously recognized as a reduction of taxes payable. The Company has elected to continue to estimate forfeitures expected to occur to determine the amount of compensation cost to be recognized in each period.
In addition to the foregoing, the Company elected to apply the presentation requirements for cash flows related to excess tax benefits retrospectively to all periods presented, which resulted in an increase to both net cash provided by operating activities and net cash used in financing activities of $442,000 and $640,000 for the years ended December 31, 2015 and 2014, respectively. The presentation requirements for cash flows related to employee taxes paid for withheld shares had no impact on the statements of cash flows since the Company has historically presented such payments as financing activities.
Adoption of ASU No. 2016-9 resulted in the recognition of excess tax benefits in the Company’s provision for income taxes (i.e., a reduction in the tax provision) rather than additional paid-in capital of $2,025,000 for the year ended December 31, 2016. Adoption of the new guidance also affected the calculation of 2016 diluted earnings per share, as excess tax benefits, due to their inclusion in earnings, are now excluded from the calculation of assumed proceeds available to repurchase shares under the treasury stock method.
Other Accounting Guidance
In May 2014, the Financial Accounting Standards Board (FASB) issued Accounting Standards Update (ASU) No. 2014-9, Revenue from Contracts with Customers (Topic 606). The new update was later amended by ASU No. 2015-14, Revenue from Contracts with Customers (Topic 606): Deferral of the Effective Date. The standard outlines a single comprehensive model for entities to use in accounting for revenue arising from contracts with customers. In addition, the ASU requires expanded disclosures about revenue recognition that enable the users of the financial statements to understand the nature, amount, timing and uncertainty of revenue and cash flows arising from contracts with customers. ASU No. 2014-09 supersedes most of the previous revenue recognition guidance. For public entities, the new guidance, as amended, is effective for annual reporting periods beginning after December 15, 2017, including interim periods within that reporting period. An entity may use either a full retrospective or a modified retrospective approach to adopt the requirements of the new standard. Although the Company continues the process of determining the effects, if any, that adoption of ASU No. 2014-9 will have on Company financial statements, adoption of the new guidance is not currently expected to have a major effect on the Company’s financial position, results of operations and cash flows
In April 2015, the FASB issued ASU No. 2015-3, Interest – Imputation of Interest (Subtopic 835-30): Simplifying the Presentation of Debt Issuance Costs. The amendments in this update change the presentation of debt issuance costs in financial statements. Under this ASU, an entity is required to present debt issuance costs in the balance sheet as a direct deduction from the related debt liability rather than as an asset. Amortization of the costs is to be reported as interest expense, which is where the Company has historically reported such costs. The guidance in ASU No. 2015-3 was effective for fiscal years, and interim periods within those fiscal years, beginning after December 15, 2015. The new guidance was to be applied retrospectively to all prior periods. Therefore, upon adoption of ASU No. 2015-03 on January 1, 2016, the Company reclassified $1,269,000 of its unamortized debt issuance costs at December 31, 2015, from the other non-current assets line of the consolidated balance sheet to the long-term debt, less current maturities line (see Note 12). Other than the reclassification of unamortized debt issuance costs, the adoption of ASU No. 2015-3 did not have an effect on the Company’s consolidated financial statements.
In July 2015, the FASB issued ASU No. 2015-11, Inventory (Topic 330), Simplifying the Measurement of Inventory, which requires an entity to measure inventory within the scope of the update at the lower of cost and net realizable value. Prior guidance required inventory to be measured at the lower of cost or market. Net realizable value is the estimated selling prices in the ordinary course of business, less reasonably predictable costs of completion, disposal, and transportation. Subsequent measurement is unchanged for inventory measured using LIFO or the retail inventory method. For public entities, ASU No. 2015-11 is effective prospectively for annual periods beginning after December 15, 2016, and interim periods therein. Early adoption is permitted. Adoption of ASU No. 2015-11 will not have a material effect on the Company’s financial position, results of operations or cash flows.
In September 2015, the FASB issued ASU No. 2015-16, Business Combinations (Topic 805), Simplifying the Accounting for Measurement-Period Adjustments. The update requires that the acquirer in a business combination recognize adjustments to provisional amounts that are identified during the measurement period in the reporting period in which the adjustment amounts are determined (not retrospectively as with prior guidance). Additionally, the acquirer must record in the same period’s financial statements the effect on earnings of changes in depreciation, amortization or other income effects as a result of the change to the
54
provisional amounts, calculated as if the accounting had been completed at the time of acquisition. The acquiring entity is required to disclose, on the face of the financial statements or in the footnotes to the financial statements, the portion of the amount recorded in current period earnings, by financial statement line item, that would have been recorded in previous reporting periods if the adjustment to the provisional amounts had been recognized as of the acquisition date. The guidance in ASU No. 2015-16 was effective for fiscal years beginning after December 15, 2015, including interim periods within those fiscal years. Adoption of ASU No. 2015-16 did not have an effect on the Company’s financial position, results of operations or cash flows.
In February 2016, the FASB issued ASU No. 2016-2, Leases (Topic 842). This guidance requires a dual approach for lessee accounting whereby a lessee will account for lease arrangements with terms greater than 12 months as either finance leases or operating leases. Both finance leases and operating leases will be recognized on the lessee’s balance sheet as right-of-use assets and corresponding lease liabilities, with differing methodologies for income statement recognition. In addition, the ASU requires expanded qualitative and quantitative disclosures about the Company’s lease arrangements. This guidance is effective for public business entities for fiscal years, and interim periods within those years, beginning after December 15, 2018. Early adoption is permitted. A modified retrospective approach is required for all leases existing or entered into after the beginning of the earliest comparative period in the consolidated financial statements. Most of the Company’s operating leases will be required to be placed on the balance sheet. The Company is assessing the quantitative impact that adoption of ASU No. 2016-2 will have on its financial position, results of operations and cash flows.
In August 2016, the FASB issued ASU No. 2016-15, Statement of Cash Flows (Topic 230): Classification of Certain Cash Receipts and Cash Payments, which adds or clarifies guidance on the classification of eight specific types of cash flows. The update is intended to reduce the existing diversity in practice with respect to the specific cash flow items. The amendments in ASU No. 2016-15 are effective for fiscal years beginning after December 15, 2017, including interim periods within those fiscal years. Early adoption is permitted. The Company is assessing the impact that adoption of ASU No. 2016-15 will have on its cash flow presentation. ASU No. 2016-15 is not expected to have an effect on the Company’s financial position or results of operations.
In October 2016, the FASB issued ASU No. 2016-16, Income Taxes (Topic 740): Intra-Entity Transfers of Assets Other Than Inventory. The update requires an entity to recognize the income tax consequences of an intra-entity transfer of an asset other than inventory when the transfer occurs. Current accounting guidance prohibits the recognition of current and deferred income taxes for an intra-entity asset transfer until the asset has been sold to an outside party. The amendments in ASU No. 2016-16 are effective for fiscal years beginning after December 15, 2017, including interim periods within those fiscal years. Early adoption is permitted for all entities as of the beginning of an annual reporting period for which financial statements (interim or annual) have not been issued or made available for issuance. That is, earlier adoption should be in the first interim period if an entity issues interim financial statements. The amendments in this update should be applied on a modified retrospective basis through a cumulative-effect adjustment directly to retained earnings as of the beginning of the period of adoption. The Company is assessing the impact that adoption of ASU No. 2016-16 will have on its financial position, results of operations and cash flows.
In January 2017, the FASB issued ASU No. 2017-4, Intangibles – Goodwill and Other (Topic 350): Simplifying the Test for Goodwill Impairment, which eliminates Step 2 from the goodwill impairment test. When an indication of impairment was identified after performing the first step of the goodwill impairment test, Step 2 required that an entity determine the fair value at the impairment testing date of its assets and liabilities (including unrecognized assets and liabilities) using the same procedure that would be required in determining the fair value of assets acquired and liabilities assumed in a business combination. Under the amendments in ASU No. 2017-4, an entity would perform its annual, or interim, goodwill impairment test by comparing the fair value of a reporting unit with its carrying value. An entity would recognize an impairment charge for the amount by which the carrying value exceeds the reporting unit’s fair value. In addition, an entity must consider income tax effects from any tax deductible goodwill on the carrying amount of the reporting unit when measuring the goodwill impairment loss, if applicable. A public business entity that is a U.S. Securities and Exchange commission filer should adopt the amendments in ASU No. 2017-4 for its annual, or any interim, goodwill impairment tests in fiscal years beginning after December 15, 2019. It is not expected that the adoption of the guidance in ASU No. 2017-4 will have a material effect on the Company’s financial position, results of operations or cash flows.
2. Fair Value Measurements
The following were the financial instruments held by the Company at December 31, 2016 and 2015, and the methods and assumptions used to estimate the instruments’ fair values:
Cash and cash equivalents
Carrying value approximated fair value because of the short maturity of the instruments.
55
Derivative assets and liabilities
Derivative assets and liabilities included the foreign currency exchange and interest rate contracts discussed in Note 3. Fair value and carrying value were the same because the contracts were recorded at fair value. The fair values of the foreign currency contracts were calculated as the difference between the applicable forward foreign exchange rates at the reporting date and the contracted foreign exchange rates multiplied by the contracted notional amounts. The fair values of the interest rate swaps were calculated as the difference between the contracted swap rate and the current market replacement swap rate multiplied by the present value of one basis point for the notional amount of the contract. See the table that follows the financial instrument descriptions for the reported fair values of derivative assets and liabilities.
Long-term investments
Long-term investments included the mutual fund assets the Company held to fund a portion of its deferred compensation liabilities and all of its non-qualified supplemental executive defined contribution obligations (see the defined contribution plans section of Note 13). Fair value and carrying value were the same because the mutual fund assets were recorded at fair value in accordance with the FASB’s fair value option guidance. Fair values for the mutual funds were calculated using the published market price per unit at the reporting date multiplied by the number of units held at the reporting date. See the table that follows the financial instrument descriptions for the reported fair value of long-term investments.
Debt obligations
The fair value of debt with original maturities greater than one year comprised the combined present values of scheduled principal and interest payments for each of the various loans, individually discounted at rates equivalent to those which could be obtained by the Company for new debt issues with durations equal to the average life to maturity of each loan. The fair values of the remaining Company debt obligations approximated their carrying values due to the short-term nature of the debt. The Company’s fair value measurements for debt fall in level 2 of the fair value hierarchy.
At December 31, 2016 and 2015, the fair values and related carrying values of debt, including current maturities, were as follows (the fair value and carrying value amounts are presented without regard to unamortized debt issuance costs of $1,141,000 and $1,269,000 as of December 31, 2016 and 2015, respectively):
|
(In thousands) |
|
December 31 |
|
|||||
|
|
|
2016 |
|
|
2015 |
|
||
|
Fair value |
|
$ |
316,364 |
|
|
$ |
331,183 |
|
|
|
|
|
|
|
|
|
|
|
|
Carrying value |
|
|
318,154 |
|
|
|
332,623 |
|
The following tables present financial assets and liabilities measured on a recurring basis at fair value as of December 31, 2016 and 2015, and the level within the fair value hierarchy in which the fair value measurement falls:
|
(In thousands) |
|
December 2016 |
|
|
Level 1 |
|
|
Level 2 |
|
|
Level 3 |
|
||||
|
Mutual fund assets |
|
$ |
24,055 |
|
|
$ |
24,055 |
|
|
$ |
— |
|
|
$ |
— |
|
|
Derivative assets: |
|
|
|
|
|
|
|
|
|
|
|
|
|
|
|
|
|
Foreign currency contracts |
|
|
453 |
|
|
|
— |
|
|
|
453 |
|
|
|
— |
|
|
Total assets at fair value |
|
$ |
24,508 |
|
|
$ |
24,055 |
|
|
$ |
453 |
|
|
$ |
— |
|
|
|
|
|
|
|
|
|
|
|
|
|
|
|
|
|
|
|
|
Derivative liabilities: |
|
|
|
|
|
|
|
|
|
|
|
|
|
|
|
|
|
Foreign currency contracts |
|
$ |
469 |
|
|
$ |
— |
|
|
$ |
469 |
|
|
$ |
— |
|
56
|
|
December 2015 |
|
|
Level 1 |
|
|
Level 2 |
|
|
Level 3 |
|
|||||
|
Mutual fund assets |
|
$ |
20,910 |
|
|
$ |
20,910 |
|
|
$ |
— |
|
|
$ |
— |
|
|
Derivative assets: |
|
|
|
|
|
|
|
|
|
|
|
|
|
|
|
|
|
Foreign currency contracts |
|
|
112 |
|
|
|
— |
|
|
|
112 |
|
|
|
— |
|
|
Total assets at fair value |
|
$ |
21,022 |
|
|
$ |
20,910 |
|
|
$ |
112 |
|
|
$ |
— |
|
|
|
|
|
|
|
|
|
|
|
|
|
|
|
|
|
|
|
|
Derivative liabilities: |
|
|
|
|
|
|
|
|
|
|
|
|
|
|
|
|
|
Foreign currency contracts |
|
$ |
305 |
|
|
$ |
— |
|
|
$ |
305 |
|
|
$ |
— |
|
|
Interest rate contracts |
|
|
53 |
|
|
|
— |
|
|
|
53 |
|
|
|
— |
|
|
Total liabilities at fair value |
|
$ |
358 |
|
|
$ |
— |
|
|
$ |
358 |
|
|
$ |
— |
|
3. Derivative Instruments
The Company is exposed to certain risks relating to its ongoing business operations. The primary risk managed by the use of derivative instruments is foreign currency exchange risk. The Company holds forward foreign currency exchange contracts that are not designated as any type of accounting hedge as defined by U.S. generally accepted accounting principles. The Company uses these contracts to manage its exposure to exchange rate fluctuations on certain Company subsidiary cash, accounts receivable, accounts payable and other obligation balances that are denominated in currencies other than the entities’ functional currencies. The forward foreign exchange contracts are recognized on the balance sheet as either an asset or a liability measured at fair value. Gains and losses arising from recording the foreign exchange contracts at fair value are reported in earnings as offsets to the losses and gains reported in earnings arising from the re-measurement of the receivable and payable balances into the applicable functional currencies. At December 31, 2016 and 2015, the Company had open forward foreign currency exchange contracts, all with durations of one to three months, to buy or sell foreign currencies with a U.S. dollar equivalent of $33,372,000 and $31,194,000, respectively.
The Company is exposed to volatility in short-term interest rates and, at times, mitigates certain portions of that risk by using interest rate swaps and designating such swaps as cash flow hedges. The interest rate swaps are recognized on the balance sheet as either an asset or a liability measured at fair value. Period-to-period changes in the fair value of interest rate swap hedges are recognized as gains or losses in AOCI, to the extent effective. As each interest rate swap hedge contract is settled, the corresponding gain or loss is reclassified out of AOCI into earnings in that settlement period. The Company held no interest rate contracts at December 31, 2016. The Company held an interest rate swap contract with a notional value of $ $3,724,000 at December 31, 2015. In the fourth quarter of 2016, the underlying loan that was hedged with the interest rate swap contract was paid in full, and the contract was terminated. The loss realized from the termination of the interest rate swap was immaterial.
The fair values of the derivative instruments held by the Company on December 31, 2016, and December 31, 2015, are disclosed in Note 2. Derivative instrument gains and losses for the years ended December 31, 2016, 2015 and 2014, were immaterial. For amounts reclassified out of AOCI into earnings for the years ended December 31, 2016, 2015 and 2014, see Note 19.
4. Goodwill and Other Intangible Assets
The changes in the carrying value of goodwill for the years ended December 31, 2016 and 2015, were as follows:
|
(In thousands) |
|
Surfactants Segment |
|
|
Polymer Segment |
|
|
Specialty Products Segment |
|
|
Total |
|
||||||||||||||||||||
|
|
|
2016 |
|
|
2015 |
|
|
2016 |
|
|
2015 |
|
|
2016 |
|
|
2015 |
|
|
2016 |
|
|
2015 |
|
||||||||
|
Balance as of January 1 |
|
|
|
|
|
|
|
|
|
|
|
|
|
|
|
|
|
|
|
|
|
|
|
|
|
|
|
|
|
|
|
|
|
Goodwill |
|
$ |
8,869 |
|
|
$ |
9,025 |
|
|
$ |
5,380 |
|
|
$ |
5,461 |
|
|
$ |
483 |
|
|
$ |
483 |
|
|
$ |
14,732 |
|
|
$ |
14,969 |
|
|
Accumulated impairment loss |
|
|
(3,467 |
) |
|
|
(3,467 |
) |
|
|
— |
|
|
|
— |
|
|
|
— |
|
|
|
— |
|
|
|
(3,467 |
) |
|
|
(3,467 |
) |
|
Goodwill, net |
|
|
5,402 |
|
|
|
5,558 |
|
|
|
5,380 |
|
|
|
5,461 |
|
|
|
483 |
|
|
|
483 |
|
|
|
11,265 |
|
|
|
11,502 |
|
|
Goodwill acquired (a) |
|
|
14,327 |
|
|
|
— |
|
|
|
— |
|
|
|
— |
|
|
|
— |
|
|
|
— |
|
|
|
14,327 |
|
|
|
— |
|
|
Foreign currency translation |
|
|
(238 |
) |
|
|
(156 |
) |
|
|
(46 |
) |
|
|
(81 |
) |
|
|
— |
|
|
|
— |
|
|
|
(284 |
) |
|
|
(237 |
) |
|
Balance as of December 31 |
|
|
|
|
|
|
|
|
|
|
|
|
|
|
|
|
|
|
|
|
|
|
|
|
|
|
|
|
|
|
|
|
|
Goodwill |
|
|
22,958 |
|
|
|
8,869 |
|
|
|
5,334 |
|
|
|
5,380 |
|
|
|
483 |
|
|
|
483 |
|
|
|
28,775 |
|
|
|
14,732 |
|
|
Accumulated impairment loss |
|
|
(3,467 |
) |
|
|
(3,467 |
) |
|
|
— |
|
|
|
— |
|
|
|
— |
|
|
|
— |
|
|
|
(3,467 |
) |
|
|
(3,467 |
) |
|
Goodwill, net |
|
$ |
19,491 |
|
|
$ |
5,402 |
|
|
$ |
5,334 |
|
|
$ |
5,380 |
|
|
$ |
483 |
|
|
$ |
483 |
|
|
$ |
25,308 |
|
|
$ |
11,265 |
|
|
|
(a) |
See Note 20 for information regarding the goodwill acquired in a business combination. |
57
The Company tests its goodwill balances for impairment in the second quarter of each calendar year. The 2016 and 2015 tests indicated no impairment.
The following table presents the components of other intangible assets, all of which have finite lives, as of December 31, 2016 and 2015. The year-over-year changes in gross carrying values resulted from the 2016 acquisition disclosed in Note 20 and the effects of foreign currency translation.
|
(In thousands) |
|
Gross Carrying Value |
|
|
Accumulated Amortization |
|
||||||||||
|
|
|
December 31 |
|
|
December 31 |
|
||||||||||
|
|
|
2016 |
|
|
2015 |
|
|
2016 |
|
|
2015 |
|
||||
|
Other Intangible Assets: |
|
|
|
|
|
|
|
|
|
|
|
|
|
|
|
|
|
Patents |
|
$ |
6,947 |
|
|
$ |
6,947 |
|
|
$ |
3,294 |
|
|
$ |
2,696 |
|
|
Non-compete agreements (a) |
|
|
461 |
|
|
$ |
— |
|
|
|
15 |
|
|
$ |
— |
|
|
Trademarks |
|
|
4,087 |
|
|
|
4,087 |
|
|
|
1,525 |
|
|
|
1,150 |
|
|
Customer lists and relationships (a) |
|
|
12,238 |
|
|
|
8,026 |
|
|
|
3,337 |
|
|
|
2,621 |
|
|
Supply contract (a) |
|
|
2,521 |
|
|
|
— |
|
|
|
105 |
|
|
|
— |
|
|
Know-how (b) |
|
|
8,043 |
|
|
|
8,245 |
|
|
|
3,682 |
|
|
|
2,881 |
|
|
Total |
|
$ |
34,297 |
|
|
$ |
27,305 |
|
|
$ |
11,958 |
|
|
$ |
9,348 |
|
|
|
(a) |
See Note 20 for information regarding the intangibles acquired in a business combination. |
|
|
|
(b) |
Know-how includes intellectual property rights covering proprietary information, written formulae, trade secrets or secret processes, inventions and developmental products (whether patentable or not), discoveries, improvements, compositions, manufacturing processes, manuals, specifications and technical data. |
|
Aggregate amortization expense for the years ended December 31, 2016, 2015 and 2014, was $2,845,000, $2,816,000 and $2,841,000, respectively. Estimated amortization expense for identifiable intangibles assets for each of the five succeeding fiscal years is as follows:
|
(In thousands) |
|
|
|
|
|
For year ended 12/31/17 |
|
$ |
3,604 |
|
|
For year ended 12/31/18 |
|
|
3,604 |
|
|
For year ended 12/31/19 |
|
|
3,604 |
|
|
For year ended 12/31/20 |
|
|
3,452 |
|
|
For year ended 12/31/21 |
|
|
2,737 |
|
5. Inventories
The composition of inventories was as follows:
|
|
|
December 31 |
|
|||||
|
(In thousands) |
|
2016 |
|
|
2015 |
|
||
|
Finished products |
|
$ |
127,597 |
|
|
$ |
124,481 |
|
|
Raw materials |
|
|
46,066 |
|
|
|
45,943 |
|
|
Total inventories |
|
$ |
173,663 |
|
|
$ |
170,424 |
|
Inventories are primarily priced using the last-in, first-out (LIFO) inventory valuation method. If the first-in, first-out (FIFO) inventory valuation method had been used for all inventories, inventory balances would have been approximately $25,872,000 and $18,171,000 higher than reported at December 31, 2016 and 2015, respectively.
58
Debt comprised the following at December 31, 2016 and 2015:
|
(In thousands) |
|
Maturity Dates |
|
December 31, 2016 |
|
|
December 31, 2015 (1) |
|
||
|
Unsecured private placement notes |
|
|
|
|
|
|
|
|
|
|
|
3.95% (net of unamortized debt issuance cost of $382 and $383 for 2016 and 2015, respectively) |
|
2021-2027 |
|
$ |
99,618 |
|
|
$ |
99,617 |
|
|
3.86% (net of unamortized debt issuance cost of $390 and $440 for 2016 and 2015, respectively) |
|
2019-2025 |
|
|
99,610 |
|
|
|
99,560 |
|
|
4.86% (net of unamortized debt issuance cost of $225 and $260 for 2016 and 2015, respectively) |
|
2017-2023 |
|
|
64,775 |
|
|
|
64,740 |
|
|
5.88% (net of unamortized debt issuance cost of $116 and $140 for 2016 and 2015, respectively) |
|
2017-2022 |
|
|
34,170 |
|
|
|
39,860 |
|
|
5.69% (net of unamortized debt issuance cost of $28 and $46 for 2016 and 2015, respectively) |
|
2017-2018 |
|
|
11,400 |
|
|
|
17,096 |
|
|
Debt of foreign subsidiaries |
|
|
|
|
|
|
|
|
|
|
|
Unsecured bank debt, foreign currency |
|
2017 |
|
|
432 |
|
|
|
4,810 |
|
|
Unsecured bank term loan, foreign currency |
|
2021 |
|
|
— |
|
|
|
3,724 |
|
|
Secured bank debt, foreign currency |
|
2017 |
|
|
7,008 |
|
|
|
1,947 |
|
|
Total debt |
|
|
|
$ |
317,013 |
|
|
$ |
331,354 |
|
|
Less current maturities |
|
|
|
|
28,154 |
|
|
|
18,806 |
|
|
Long-term debt |
|
|
|
$ |
288,859 |
|
|
$ |
312,548 |
|
|
|
(1) |
Certain balances have been reclassified from those originally presented at December 31, 2015, due to the Company’s January 1, 2016, adoption of the new U.S. GAAP guidance regarding the classification of debt issuance costs. See Note 1 for additional information regarding ASU No. 2015-3. |
|
The majority of the Company’s long-term debt financing is composed of unsecured private placement notes issued to insurance companies, totaling $310,714,000 as of December 31, 2016. These notes are denominated in U.S. dollars and have fixed interest rates ranging from 3.86 percent to 5.88 percent. At inception, these notes had final maturities of 12 to 13 years with remaining amortization scheduled from 2017 to 2027.
The Company has a committed $125,000,000 multi-currency five-year revolving credit agreement with JPMorgan Chase Bank, N.A., as administrative agent, and four U.S. banks named as lenders thereunder. This unsecured facility is the Company’s primary source of short-term borrowings, which the Company may draw on as needed to finance certain acquisitions, working capital and for general corporate purposes. This facility is secured through July 10, 2019. As of December 31, 2016, the Company had outstanding letters of credit of $4,802,000 and no borrowings under this agreement with $120,198,000 remaining available.
Loans under the credit agreement may be incurred, at the discretion of the Company, with terms to maturity of 1 to 180 days. The Company may choose from several interest rate options, including (1) LIBOR applicable to each currency plus spreads ranging from 0.975 percent to 1.525 percent, depending on the Company’s leverage ratio or (2) the prime rate plus zero percent to 0.525 percent, depending on the leverage ratio. The credit agreement requires the Company to pay a facility fee ranging from 0.150 percent to 0.350 percent, which also depends on the leverage ratio. The credit agreement requires the maintenance of certain financial ratios and compliance with certain other covenants that are similar to the Company’s existing debt agreements, including net worth, interest coverage and leverage financial covenants and limitations on restricted payments, indebtedness and liens.
In addition to the unsecured private placement notes and the revolving credit facility, the Company’s foreign subsidiaries had $432,000 of unsecured debt and $7,008,000 of secured debt at December 31, 2016. The secured foreign debt is secured only by the assets of the respective entities.
The Company’s loan agreements in the U.S. and Philippines contain provisions, which, among others, require maintenance of certain financial ratios and place limitations on additional debt, investments and payment of dividends. Based on the loan agreement provisions that place limitations on dividend payments, unrestricted retained earnings (i.e., retained earnings available for dividend distribution) were $157,606,000 and $119,891,000 at December 31, 2016, and 2015, respectively.
Debt at December 31, 2016, matures as follows: $28,154,000 in 2017; $20,714,000 in 2018; $29,286,000 in 2019; $29,286,000 in 2020; $43,572,000 in 2021 and $167,142,000 after 2021. Debt maturing in 2017 includes $20,714,000 of scheduled repayments
59
under long-term debt agreements and $7,440,000 of debt of foreign subsidiaries under short-term working capital loans. These short-term loan agreements are routinely renewed, but could be supplemented or replaced, if necessary, by the Company’s $125,000,000 revolving credit agreement.
Net interest expense for the years ended December 31, 2016, 2015 and 2014, comprised the following:
|
(In thousands) |
|
2016 |
|
|
2015 |
|
|
2014 |
|
|||
|
Interest expense |
|
$ |
15,240 |
|
|
$ |
15,488 |
|
|
$ |
12,542 |
|
|
Interest income |
|
|
(1,247 |
) |
|
|
(217 |
) |
|
|
(262 |
) |
|
|
|
|
13,993 |
|
|
|
15,271 |
|
|
|
12,280 |
|
|
Capitalized interest |
|
|
(788 |
) |
|
|
(738 |
) |
|
|
(839 |
) |
|
Interest expense, net |
|
$ |
13,205 |
|
|
$ |
14,533 |
|
|
$ |
11,441 |
|
7. Leased Properties
The Company leases certain property and equipment (primarily transportation equipment, buildings and land) under operating leases, which are denominated in local currencies. Total rental expense was $8,595,000, $7,097,000 and $6,660,000 in 2016, 2015 and 2014, respectively.
Consolidated Company minimum future rental payments under operating leases with initial or remaining noncancelable lease terms in excess of one year as of December 31, 2016, are:
|
|
|
(In thousands) |
|
|
|
Year |
|
Amount |
|
|
|
2017 |
|
$ |
7,761 |
|
|
2018 |
|
|
6,413 |
|
|
2019 |
|
|
5,561 |
|
|
2020 |
|
|
4,879 |
|
|
2021 |
|
|
3,702 |
|
|
Subsequent to 2021 |
|
|
19,276 |
|
|
Total minimum future rental payments |
|
$ |
47,592 |
|
8. Other, Net
Other, net in the consolidated statements of income included the following for the years ended December 31, 2016, 2015 and 2014:
|
(In thousands) |
|
2016 |
|
|
2015 |
|
|
2014 |
|
|||
|
Foreign exchange gains (losses) |
|
$ |
(14 |
) |
|
$ |
686 |
|
|
$ |
(220 |
) |
|
Investment income |
|
|
690 |
|
|
|
877 |
|
|
|
1,269 |
|
|
Realized and unrealized gains on investments |
|
|
152 |
|
|
|
21 |
|
|
|
241 |
|
|
Other, net |
|
$ |
828 |
|
|
$ |
1,584 |
|
|
$ |
1,290 |
|
60
The provisions for taxes on income and the related income before taxes for the years ended December 31, 2016, 2015 and 2014, were as follows:
|
(In thousands) |
|
2016 |
|
|
2015 |
|
|
2014 |
|
|||
|
Taxes on Income |
|
|
|
|
|
|
|
|
|
|
|
|
|
Federal |
|
|
|
|
|
|
|
|
|
|
|
|
|
Current |
|
$ |
18,811 |
|
|
$ |
7,697 |
|
|
$ |
3,362 |
|
|
Deferred |
|
|
(3,192 |
) |
|
|
3,890 |
|
|
|
4,338 |
|
|
State |
|
|
|
|
|
|
|
|
|
|
|
|
|
Current |
|
|
2,273 |
|
|
|
1,559 |
|
|
|
782 |
|
|
Deferred |
|
|
(1,171 |
) |
|
|
(225 |
) |
|
|
643 |
|
|
Foreign |
|
|
|
|
|
|
|
|
|
|
|
|
|
Current |
|
|
14,960 |
|
|
|
14,562 |
|
|
|
9,004 |
|
|
Deferred |
|
|
(4,063 |
) |
|
|
(664 |
) |
|
|
325 |
|
|
Total |
|
$ |
27,618 |
|
|
$ |
26,819 |
|
|
$ |
18,454 |
|
|
Income before Taxes |
|
|
|
|
|
|
|
|
|
|
|
|
|
Domestic |
|
$ |
64,675 |
|
|
$ |
48,721 |
|
|
$ |
34,091 |
|
|
Foreign |
|
|
49,141 |
|
|
|
54,135 |
|
|
|
41,444 |
|
|
Total |
|
$ |
113,816 |
|
|
$ |
102,856 |
|
|
$ |
75,535 |
|
The variations between the effective and statutory U.S. federal income tax rates are summarized as follows:
|
(In thousands) |
|
2016 Amount |
|
|
% |
|
|
2015 Amount |
|
|
% |
|
|
2014 Amount |
|
|
% |
|
||||||
|
Federal income tax provision at statutory tax rate |
|
$ |
39,836 |
|
|
|
35.0 |
|
|
$ |
36,000 |
|
|
|
35.0 |
|
|
$ |
26,437 |
|
|
|
35.0 |
|
|
State tax provision on income less applicable federal tax benefit |
|
|
716 |
|
|
|
0.6 |
|
|
|
867 |
|
|
|
0.8 |
|
|
|
926 |
|
|
|
1.2 |
|
|
Foreign income taxed at different rates |
|
|
(6,325 |
) |
|
|
(5.6 |
) |
|
|
(5,060 |
) |
|
|
(4.9 |
) |
|
|
(5,416 |
) |
|
|
(7.2 |
) |
|
Unrecognized tax benefits |
|
|
23 |
|
|
|
0.0 |
|
|
|
1,536 |
|
|
|
1.5 |
|
|
|
241 |
|
|
|
0.3 |
|
|
Domestic production activities deduction |
|
|
(1,633 |
) |
|
|
(1.4 |
) |
|
|
(884 |
) |
|
|
(0.9 |
) |
|
|
(312 |
) |
|
|
(0.4 |
) |
|
Nontaxable foreign interest income |
|
|
(2,030 |
) |
|
|
(1.8 |
) |
|
|
(2,106 |
) |
|
|
(2.0 |
) |
|
|
(2,435 |
) |
|
|
(3.2 |
) |
|
Stock based compensation, excess tax benefits(a) |
|
|
(1,878 |
) |
|
|
(1.7 |
) |
|
|
— |
|
|
|
— |
|
|
|
— |
|
|
|
— |
|
|
U.S. tax credits |
|
|
(1,100 |
) |
|
|
(1.0 |
) |
|
|
(3,465 |
) |
|
|
(3.4 |
) |
|
|
(1,086 |
) |
|
|
(1.4 |
) |
|
Non-deductible expenses and other items, net(b) |
|
|
9 |
|
|
|
0.2 |
|
|
|
(69 |
) |
|
|
0.0 |
|
|
|
99 |
|
|
|
0.1 |
|
|
Total income tax provision |
|
$ |
27,618 |
|
|
|
24.3 |
|
|
$ |
26,819 |
|
|
|
26.1 |
|
|
$ |
18,454 |
|
|
|
24.4 |
|
|
(a) |
Excess tax benefits related to employee share-based payment transactions recognized in 2016 resulting from early adoption of ASU No. 2016-9, as described in Note 1. There is no effect for 2014 and 2015 because the recognition of excess tax benefits in the tax provision is to be done only on a prospective basis, beginning with the year of adopting the new guidance. |
|
(b) |
Certain 2014 amounts have been reclassified to conform to the current year presentation. |
61
At December 31, 2016 and 2015, the tax effects of significant temporary differences representing deferred tax assets and liabilities were as follows:
|
(In thousands) |
|
2016 |
|
|
2015 |
|
||
|
Deferred Tax Liabilities: |
|
|
|
|
|
|
|
|
|
Depreciation |
|
$ |
(75,973 |
) |
|
$ |
(69,975 |
) |
|
Unrealized foreign exchange loss |
|
|
(631 |
) |
|
|
(614 |
) |
|
Other |
|
|
(2,756 |
) |
|
|
(950 |
) |
|
|
|
$ |
(79,360 |
) |
|
$ |
(71,539 |
) |
|
Deferred Tax Assets: |
|
|
|
|
|
|
|
|
|
Pensions |
|
$ |
12,077 |
|
|
$ |
16,698 |
|
|
Deferred revenue |
|
|
940 |
|
|
|
1,377 |
|
|
Other accruals and reserves |
|
|
20,590 |
|
|
|
17,171 |
|
|
Inventories |
|
|
1,815 |
|
|
|
1,833 |
|
|
Legal and environmental accruals |
|
|
11,503 |
|
|
|
9,303 |
|
|
Deferred compensation |
|
|
24,485 |
|
|
|
17,828 |
|
|
Bad debt and rebate reserves |
|
|
4,195 |
|
|
|
3,685 |
|
|
Subsidiaries net operating loss carryforwards |
|
|
1,201 |
|
|
|
602 |
|
|
Tax credit carryforwards |
|
|
1,599 |
|
|
|
1,120 |
|
|
|
|
$ |
78,405 |
|
|
$ |
69,617 |
|
|
Valuation Allowance |
|
$ |
(1,815 |
) |
|
$ |
(1,443 |
) |
|
Net Deferred Tax Liabilities |
|
$ |
(2,770 |
) |
|
$ |
(3,365 |
) |
|
Reconciliation to Consolidated Balance Sheet: |
|
|
|
|
|
|
|
|
|
Non-current deferred tax assets (in other non-current assets) |
|
|
9,727 |
|
|
|
6,090 |
|
|
Non-current deferred tax liabilities |
|
|
(12,497 |
) |
|
|
(9,455 |
) |
|
Net Deferred Tax Liabilities |
|
$ |
(2,770 |
) |
|
$ |
(3,365 |
) |
Undistributed earnings of foreign subsidiaries and related companies that are deemed to be permanently reinvested amounted to $309,047,000 at December 31, 2016, compared to $266,317,000 at December 31, 2015. In general, the Company reinvests earnings of foreign subsidiaries in their operations indefinitely. However, the Company will repatriate earnings from a subsidiary where excess cash has accumulated and it is advantageous for tax or foreign exchange reasons. Because of the probable availability of foreign tax credits, it is not practicable to estimate the amount, if any, of the deferred tax liability on earnings reinvested indefinitely.
The Company has tax loss carryforwards of $4,655,000 (pretax) as of December 31, 2016, and $2,224,000 as of December 31, 2015, that are available for use by the Company between 2017 and 2024. The Company has tax credit carryforwards of $1,599,000 as of December 31, 2016, and $1,120,000 as of December 31, 2015, that are available for use by the Company between 2017 and 2026.
At December 31, 2016, the Company had valuation allowances of $1,815,000, which were primarily attributable to deferred tax assets in China, India and the Philippines. The realization of deferred tax assets is dependent on the generation of sufficient taxable income in the appropriate tax jurisdictions. The Company believes that it is more likely than not that the related deferred tax assets will not be realized.
As of December 31, 2016 and 2015, unrecognized tax benefits totaled $1,931,000 and $1,958,000, respectively. The amount of unrecognized tax benefits that, if recognized, would favorably affect the Company’s effective income tax rate in any future periods, net of the federal benefit on state issues, was approximately $1,921,000, $1,948,000 and $454,000 at December 31, 2016, 2015 and 2014, respectively. The Company believes it is reasonably possible that the amount of unrecognized tax benefits related to its current uncertain tax positions could decrease by a range of approximately $0 to $1,500,000 over the next 12 months as a result of ongoing audits.
The Company recognizes accrued interest and penalties related to unrecognized tax benefits as income tax expense. In 2016, the Company recognized net interest and penalty expense of $9,000 compared to $6,000 of net interest and penalty expense in 2015 and $6,000 of net interest and penalty income in 2014. At December 31, 2016 the liability for interest and penalties was $53,000 compared to $44,000 at December 31, 2015.
The Company files income tax returns in the U.S. federal jurisdiction and various states and foreign jurisdictions. The Company is not subject to U.S. federal income tax examinations by tax authorities for years before 2011. In addition, 2013 is no longer subject
62
to U.S. federal income tax examinations. Some foreign jurisdictions and various U.S. states jurisdictions may be subject to examination back to 2010.
During 2016, the Internal Revenue Service started its audit of the 2011 and 2012 tax years. As of December 31, 2016, these audits were still open and the Company had not been notified of any significant proposed adjustments.
Below are reconciliations of the January 1 and December 31 balances of unrecognized tax benefits for 2016, 2015 and 2014:
|
(In thousands) |
|
2016 |
|
|
2015 |
|
|
2014 |
|
|||
|
Unrecognized tax benefits, opening balance |
|
$ |
1,958 |
|
|
$ |
464 |
|
|
$ |
240 |
|
|
Gross increases – tax positions in prior period |
|
|
— |
|
|
|
1,526 |
|
|
|
— |
|
|
Gross increases – current period tax positions |
|
|
35 |
|
|
|
29 |
|
|
|
261 |
|
|
Foreign currency translation |
|
|
(43 |
) |
|
|
(37 |
) |
|
|
(13 |
) |
|
Lapse of statute of limitations |
|
|
(19 |
) |
|
|
(24 |
) |
|
|
(24 |
) |
|
Unrecognized tax benefits, ending balance |
|
$ |
1,931 |
|
|
$ |
1,958 |
|
|
$ |
464 |
|
10. Stockholders’ Equity
At December 31, 2016 and 2015, treasury stock consisted of 3,470,084 shares and 3,428,541 shares of common stock, respectively. During 2016, 43,835 shares of Company common stock were purchased in the open market, and 5,295 shares were received to settle employees’ minimum statutory withholding taxes related to performance stock awards and deferred compensation distribution. Also, 7,587 shares of treasury stock were distributed to participants under the Company’s deferred compensation plan.
11. Stock-based Compensation
On December 31, 2016, the Company had stock options and stock awards outstanding under its 2006 Incentive Compensation Plan (2006 Plan) and stock options, stock awards and SARs under its 2011 Incentive Compensation Plan (2011 Plan). Stock options, stock awards and SARs are currently granted to Company executives and other key employees. No further options or awards may be granted under the 2006 Plan. The 2011 Plan authorized the award of 2,600,000 shares of the Company’s common stock for stock options, SARs and stock awards. At December 31, 2016, there were 1,217,210 shares available for grant under the 2011 Plan.
Compensation expense (income) recorded in the consolidated statements of income for all plans was $12,618,000, $4,374,000 and $(69,000) for the years ended December 31, 2016, 2015 and 2014, respectively. The increase in stock-based compensation from year to year was primarily due to the increase in compensation related to SARs and performance awards. Due to an increase in the market value of Company common stock (from $49.69 at December 31, 2015 to $81.48 at December 31, 2016), the fair value of SARs increased, resulting in an increase of the Company’s SARs liability. Performance awards stock-based compensation expenses increased between years due to management’s assessment that the profitability metrics for certain grants would be achieved at greater levels than previously estimated.
The total income tax benefit (expense) recognized in the income statement for share-based compensation arrangements was $4,761,000, $1,654,000 and $(26,000) for the years ended December 31, 2016, 2015 and 2014, respectively.
63
Under all plans, stock option awards are granted with an exercise price equal to the market price of the Company’s stock at the date of grant. The market price is defined and calculated as the average of the opening and closing prices for Company common stock on the grant date as reported in the New York Stock Exchange – Composite Transactions. Stock option awards outstanding at December 31, 2016, generally vest based on two years of continuous service and have 8- to 10-year contractual terms. The fair value of each option award was estimated on the date of grant using the Black-Scholes option valuation model incorporating the weighted-average assumptions noted in the following table. Expected volatility is based on the historical volatility of the Company’s stock. The Company also uses historical data to estimate the expected term of options granted. The risk-free rate is the U.S. Treasury note rate that corresponds to the expected option term at the date of grant. The following are the weighted-average assumptions used to calculate the grant-date fair values of stock option awards granted in the years ended December 31, 2016, 2015 and 2014:
|
|
|
For the Years Ended December 31 |
||||
|
|
|
2016 |
|
2015 |
|
2014 |
|
Expected dividend yield |
|
1.45% |
|
1.53% |
|
1.77% |
|
Expected volatility |
|
35.62% |
|
40.32% |
|
42.04% |
|
Expected term |
|
7.3 years |
|
7.3 years |
|
7.3 years |
|
Risk-free interest rate |
|
1.52% |
|
1.96% |
|
2.18% |
A summary of stock option activity for the year ended December 31, 2016 is presented below:
|
|
|
Shares |
|
|
Weighted- Average Exercise Price |
|
|
Weighted- Average Remaining Contractual Term |
|
|
Aggregate Intrinsic Value ($000) |
|
||||
|
Options |
|
|
|
|
|
|
|
|
|
|
|
|
|
|
|
|
|
Outstanding at January 1, 2016 |
|
|
507,084 |
|
|
$ |
36.57 |
|
|
|
|
|
|
|
|
|
|
Granted |
|
|
103,709 |
|
|
|
44.03 |
|
|
|
|
|
|
|
|
|
|
Exercised |
|
|
(167,675 |
) |
|
|
23.95 |
|
|
|
|
|
|
|
|
|
|
Forfeited |
|
|
(6,992 |
) |
|
|
45.36 |
|
|
|
|
|
|
|
|
|
|
Outstanding at December 31, 2016 |
|
|
436,126 |
|
|
|
42.99 |
|
|
|
5.80 |
|
|
$ |
16,785 |
|
|
Vested or expected to vest at December 31, 2016 |
|
|
432,181 |
|
|
|
42.68 |
|
|
|
5.86 |
|
|
|
13,022 |
|
|
Exercisable at December 31, 2016 |
|
|
258,093 |
|
|
|
43.12 |
|
|
|
3.82 |
|
|
|
9,900 |
|
The weighted-average grant-date fair values of options awarded during the years ended December 31, 2016, 2015 and 2014, were $14.70, $15.59 and $23.77, respectively. The total intrinsic values of options exercised during the years ended December 31, 2016, 2015, and 2014 were $6,620,000, $1,426,000, and $2,071,000, respectively.
As of December 31, 2016, the total unrecognized compensation cost for unvested stock options was $895,000. That cost is expected to be recognized over a weighted-average period of 1.1 years.
Cash received from stock option exercises under the Company’s stock option plans for the years ended December 31, 2016, 2015, and 2014 was $4,017,000, $777,000 and $1,754,000, respectively. The actual tax benefit realized for the tax deductions from stock option exercises totaled $1,899,000, $351,000, and $568,000 for the years ended December 31, 2016, 2015 and 2014, respectively.
Stock Awards
In 2014, 2015, and 2016, the Company granted stock awards under the 2011 Plan. Most Company stock awards are granted in the form of performance awards. The performance stock awards vest only upon the Company’s achievement of certain Board of Director approved levels of financial performance by the end of specified measurement periods. The number of Company shares of common stock ultimately distributed, if any, is contingent upon the Company’s actual financial performance attained by the end of the measurement period relative to the Board of Director approved targets. The fair value of performance stock awards equals the grant-date market price of the Company’s common stock, discounted for the estimated amount of dividends that would not be received during the measurement period. Compensation expense is recorded each reporting period based on the probable number of awards that will ultimately vest given the projected level of financial performance. If at the end of the measurement period the performance objectives are not met, no compensation cost is recognized and any compensation expense recorded in prior periods is reversed. Periodically, the Company also grants stock awards that have no performance conditions associated with their vesting. These stock awards vest based on the service time established for the given grant.
64
A summary of stock award activity for the year ended December 31, 2016, is presented below:
|
|
|
Shares |
|
|
Weighted-Average Grant Date Fair Value |
|
||
|
Stock Awards |
|
|
|
|
|
|
|
|
|
Unvested at January 1, 2016 |
|
|
208,503 |
|
|
$ |
46.55 |
|
|
Granted |
|
|
142,242 |
|
|
|
41.81 |
|
|
Vested |
|
|
(32,319 |
) |
|
|
59.41 |
|
|
Forfeited |
|
|
(61,660 |
) |
|
|
53.05 |
|
|
Unvested at December 31, 2016 |
|
|
256,766 |
|
|
|
40.74 |
|
The weighted-average grant-date fair values of stock awards granted during the years ended December 31, 2016, 2015 and 2014, were $41.81, $39.11 and $59.52, respectively. As of December 31, 2016, under the current Company assumption as to the number of stock award shares that will vest at the measurement periods ended December 31, 2017 and 2018, there was $5,514,000 of unrecognized compensation cost for unvested stock awards. That cost is expected to be recognized over a period of 1.7 years.
SARs
At December 31, 2016, the Company had both cash-settled and Company stock-settled SARs outstanding. SARs granted prior to 2015 are cash-settled, and SARs granted after 2014 are stock-settled. SARs outstanding at December 31, 2016, cliff vest after two years of continuous service and expire ten years from the grant date. Upon the exercise of a SARs award, a participant receives in cash (for cash-settled SARs) or Company common stock (for stock-settled SARs) an amount that equals or shares of Company stock that are valued at the excess of the fair market value of a share of Company common stock at the date of exercise over the fair market value of a share of Company common stock at the date of grant (the exercise price). Cash-settled SARs are accounted for as liabilities that must be re-measured at fair value at the end of every reporting period until settlement. Compensation expense for each reporting period is based on the period-to-period change (or portion of the change, depending on the proportion of the vesting period that has been completed at the reporting date) in the fair value of the SARs. Compensation expense for stock-settled SARs is based on the grant-date value of the awards allocated over the proportion of the vesting period that has been completed at the reporting date. Because stock-settled SARs are considered equity instruments, they are not re-measured at fair value at the end of each reporting period.
The following is a summary of SARs activity for the year ended December 31, 2016:
|
|
|
Shares |
|
|
Weighted- Average Exercise Price |
|
|
Weighted- Average Remaining Contractual Term |
|
|
Aggregate Intrinsic Value ($000) |
|
||||
|
SARs |
|
|
|
|
|
|
|
|
|
|
|
|
|
|
|
|
|
Outstanding at January 1, 2016 |
|
|
389,955 |
|
|
$ |
50.30 |
|
|
|
|
|
|
|
|
|
|
Granted |
|
|
215,288 |
|
|
|
43.95 |
|
|
|
|
|
|
|
|
|
|
Exercised |
|
|
(27,596 |
) |
|
|
54.17 |
|
|
|
|
|
|
|
|
|
|
Forfeited |
|
|
(24,065 |
) |
|
|
34.58 |
|
|
|
|
|
|
|
|
|
|
Outstanding at December 31, 2016 |
|
|
553,582 |
|
|
|
47.81 |
|
|
|
7.94 |
|
|
$ |
18,642 |
|
The weighted-average grant-date fair values of SARs granted during the years 2016, 2015 and 2014 were $14.69, $15.60 and $23.74, respectively. The fair value for each SARs award was estimated using the Black-Scholes valuation model incorporating the same assumptions as noted for stock options.
As of December 31, 2016 and 2015, the liability for cash-settled SARs recorded on the consolidated balance sheet (non-current liabilities) was $5,832,000 and $2,593,000, respectively. At December 31, 2016, there was $1,859,000 of total unrecognized compensation cost related to all unvested SARs. That cost is to be recognized over a weighted-average period of 1.1 years.
In general, it is the Company’s policy to issue new shares of its common stock upon the exercise of stock options and stock-settled SARs or the vesting of stock awards.
65
The Company sponsors deferred compensation plans that allow management employees to defer receipt of their annual bonuses and outside directors to defer receipt of their fees until retirement, departure from the Company or as otherwise elected. Compensation expense and the related deferred compensation obligation are recorded when the underlying compensation is earned. Over time, the deferred obligation may increase or decrease based on the performance results of investment options chosen by the plan participants. The investment options include Company common stock and a limited selection of mutual funds. The Company maintains sufficient shares of treasury stock to cover the equivalent number of shares that result from participants elections of the Company common stock investment option. As a result, the Company must periodically purchase its common shares in the open market. The Company purchases shares of the applicable mutual funds to fund the portion of its deferred compensation liabilities tied to such investments.
Some plan distributions may be made in cash or Company common stock at the option of the participant. Other plan distributions can only be made in Company common stock. For deferred compensation obligations that may be settled in cash or Company common stock at the option of the participant, the Company must record appreciation in the market values of the investment choices made by participants as additional compensation expense. Conversely, declines in the market values of the investment choices reduce compensation expense. Increases and decreases of compensation expense that result from fluctuations in the underlying investments are recorded as part of operating expenses in the consolidated statements of income. The additional compensation expense or income resulting from the changes in the market values and earnings of the selected investment options was $16,805,000 expense in 2016, $6,500,000 expense in 2015 and $11,903,000 income in 2014. The increase in expense between 2016 and 2015 was primarily attributable to an increase in the market value of the Company’s common stock. The obligations that must be settled only in Company common stock are treated as equity instruments; therefore, fluctuations in the market price of the underlying Company stock do not affect earnings. The Company’s deferred compensation liability was $60,328,000 and $43,988,000 at December 31, 2016 and 2015, respectively.
13. Postretirement Benefit Plans
Defined Benefit Plans
The Company sponsors various funded qualified and unfunded non-qualified defined benefit pension plans, the most significant of which cover employees in the U.S. and U.K. locations. The various U.S. defined benefit pension plans were amended in 2005-2008 to freeze the plans by stopping the accrual of service benefits. The U.K. defined benefit pension plan was frozen in 2006. Benefits earned through the freeze dates are available to participants when they retire, in accordance with the terms of the plans. The Company established defined contribution plans to replace the frozen defined benefit pension plans.
Obligations and Funded Status at December 31
|
(In thousands) |
|
United States |
|
|
United Kingdom |
|
||||||||||
|
|
|
2016 |
|
|
2015 |
|
|
2016 |
|
|
2015 |
|
||||
|
Change in benefit obligation |
|
|
|
|
|
|
|
|
|
|
|
|
|
|
|
|
|
Benefit obligation at beginning of year |
|
$ |
160,789 |
|
|
$ |
169,407 |
|
|
$ |
19,950 |
|
|
$ |
22,983 |
|
|
Interest cost |
|
|
6,934 |
|
|
|
6,815 |
|
|
|
733 |
|
|
|
789 |
|
|
Actuarial (gain) loss |
|
|
1,538 |
|
|
|
(9,315 |
) |
|
|
5,614 |
|
|
|
(1,763 |
) |
|
Benefits paid |
|
|
(6,534 |
) |
|
|
(6,118 |
) |
|
|
(513 |
) |
|
|
(891 |
) |
|
Foreign exchange impact |
|
|
— |
|
|
|
— |
|
|
|
(3,750 |
) |
|
|
(1,168 |
) |
|
Benefit obligation at end of year |
|
$ |
162,727 |
|
|
$ |
160,789 |
|
|
$ |
22,034 |
|
|
$ |
19,950 |
|
|
(In thousands) |
|
United States |
|
|
United Kingdom |
|
||||||||||
|
|
|
2016 |
|
|
2015 |
|
|
2016 |
|
|
2015 |
|
||||
|
Change in plan assets |
|
|
|
|
|
|
|
|
|
|
|
|
|
|
|
|
|
Fair value of plan assets at beginning of year |
|
$ |
121,835 |
|
|
$ |
126,369 |
|
|
$ |
21,425 |
|
|
$ |
22,858 |
|
|
Actual return on plan assets |
|
|
21,612 |
|
|
|
1,374 |
|
|
|
2,758 |
|
|
|
72 |
|
|
Employer contributions |
|
|
179 |
|
|
|
210 |
|
|
|
378 |
|
|
|
605 |
|
|
Benefits paid |
|
|
(6,534 |
) |
|
|
(6,118 |
) |
|
|
(513 |
) |
|
|
(891 |
) |
|
Foreign exchange impact |
|
|
— |
|
|
|
— |
|
|
|
(3,712 |
) |
|
|
(1,219 |
) |
|
Fair value of plan assets at end of year |
|
$ |
137,092 |
|
|
$ |
121,835 |
|
|
$ |
20,336 |
|
|
$ |
21,425 |
|
|
|
|
|
|
|
|
|
|
|
|
|
|
|
|
|
|
|
|
Over (Under) funded status at end of year |
|
$ |
(25,635 |
) |
|
$ |
(38,954 |
) |
|
$ |
(1,698 |
) |
|
$ |
1,475 |
|
66
The amounts recognized in the consolidated balance sheets at December 31 consisted of
|
(In thousands) |
|
United States |
|
|
United Kingdom |
|
||||||||||
|
|
|
2016 |
|
|
2015 |
|
|
2016 |
|
|
2015 |
|
||||
|
Non-current asset |
|
$ |
— |
|
|
$ |
— |
|
|
$ |
— |
|
|
$ |
1,475 |
|
|
Current liability |
|
|
(166 |
) |
|
|
(198 |
) |
|
|
— |
|
|
|
— |
|
|
Non-current liability |
|
|
(25,469 |
) |
|
|
(38,756 |
) |
|
|
(1,698 |
) |
|
|
— |
|
|
Net amount recognized |
|
$ |
(25,635 |
) |
|
$ |
(38,954 |
) |
|
$ |
(1,698 |
) |
|
$ |
1,475 |
|
The amounts recognized in accumulated other comprehensive income at December 31 consisted of
|
(In thousands) |
|
United States |
|
|
United Kingdom |
|
||||||||||
|
|
|
2016 |
|
|
2015 |
|
|
2016 |
|
|
2015 |
|
||||
|
Net actuarial loss |
|
$ |
40,022 |
|
|
$ |
54,470 |
|
|
$ |
7,443 |
|
|
$ |
3,764 |
|
Below is information for pension plans with projected benefit obligations in excess of plan assets at December 31:
|
(In thousands) |
|
United States |
|
|
United Kingdom |
|
||||||||||
|
|
|
2016 |
|
|
2015 |
|
|
2016 |
|
|
2015 |
|
||||
|
Projected benefit obligation |
|
$ |
162,727 |
|
|
$ |
160,789 |
|
|
$ |
22,034 |
|
|
$ |
— |
|
|
Accumulated benefit obligation |
|
|
162,727 |
|
|
|
160,789 |
|
|
|
22,034 |
|
|
|
— |
|
|
Fair value of plan assets |
|
|
137,092 |
|
|
|
121,835 |
|
|
|
20,336 |
|
|
|
— |
|
Components of Net Periodic Benefit Cost and Other Amounts Recognized in Other Comprehensive Income
Net periodic benefit costs for the years ended December 31, 2016, 2015 and 2014, were as follows:
|
(In thousands) |
|
United States |
|
|
United Kingdom |
|
||||||||||||||||||
|
|
|
2016 |
|
|
2015 |
|
|
2014 |
|
|
2016 |
|
|
2015 |
|
|
2014 |
|
||||||
|
Interest cost |
|
$ |
6,934 |
|
|
$ |
6,815 |
|
|
$ |
6,936 |
|
|
$ |
733 |
|
|
$ |
789 |
|
|
$ |
964 |
|
|
Expected return on plan assets |
|
|
(9,012 |
) |
|
|
(9,579 |
) |
|
|
(9,523 |
) |
|
|
(900 |
) |
|
|
(1,054 |
) |
|
|
(1,303 |
) |
|
Amortization of net actuarial loss |
|
|
3,386 |
|
|
|
4,534 |
|
|
|
2,687 |
|
|
|
77 |
|
|
|
179 |
|
|
|
— |
|
|
Net periodic benefit cost |
|
$ |
1,308 |
|
|
$ |
1,770 |
|
|
$ |
100 |
|
|
$ |
(90 |
) |
|
$ |
(86 |
) |
|
$ |
(339 |
) |
Other changes in plan assets and benefit obligations recognized in other comprehensive income for the years ended December 31, 2016, 2015 and 2014, were as follows:
|
(In thousands) |
|
United States |
|
|
United Kingdom |
|
||||||||||||||||||
|
|
|
2016 |
|
|
2015 |
|
|
2014 |
|
|
2016 |
|
|
2015 |
|
|
2014 |
|
||||||
|
Net actuarial (gain) loss |
|
$ |
(11,062 |
) |
|
$ |
(1,110 |
) |
|
$ |
35,999 |
|
|
$ |
3,756 |
|
|
$ |
(781 |
) |
|
$ |
2,577 |
|
|
Amortization of net actuarial loss |
|
|
(3,386 |
) |
|
|
(4,534 |
) |
|
|
(2,687 |
) |
|
|
(77 |
) |
|
|
(179 |
) |
|
|
— |
|
|
Total recognized in other comprehensive income |
|
$ |
(14,448 |
) |
|
$ |
(5,644 |
) |
|
$ |
33,312 |
|
|
$ |
3,679 |
|
|
$ |
(960 |
) |
|
$ |
2,577 |
|
|
Total recognized in net periodic benefit cost and other comprehensive income |
|
$ |
(13,140 |
) |
|
$ |
(3,874 |
) |
|
$ |
33,412 |
|
|
$ |
3,589 |
|
|
$ |
(1,046 |
) |
|
$ |
2,238 |
|
The estimated amounts that will be reclassified from accumulated other comprehensive income into net periodic benefit cost in 2017 are as follows:
|
(In thousands) |
|
United States |
|
|
United Kingdom |
|
||
|
Net actuarial loss |
|
$ |
3,152 |
|
|
$ |
365 |
|
67
Estimated Future Benefit Payments
|
(In thousands) |
|
United States |
|
|
United Kingdom |
|
||
|
2017 |
|
$ |
7,065 |
|
|
$ |
491 |
|
|
2018 |
|
|
7,550 |
|
|
|
500 |
|
|
2019 |
|
|
8,048 |
|
|
|
506 |
|
|
2020 |
|
|
8,502 |
|
|
|
517 |
|
|
2021 |
|
|
9,008 |
|
|
|
541 |
|
|
2022-2026 |
|
|
50,435 |
|
|
|
3,386 |
|
Assumptions
The weighted-average assumptions used to determine benefit obligations at December 31 were as follows:
|
|
|
United States |
|
|
United Kingdom |
|
||||||||||
|
|
|
2016 |
|
|
2015 |
|
|
2016 |
|
|
2015 |
|
||||
|
Discount rate |
|
|
4.17 |
% |
|
|
4.39 |
% |
|
|
2.60 |
% |
|
|
4.00 |
% |
The weighted-average assumptions used to determine net periodic benefit costs for years ended December 31 were as follows:
|
|
|
United States |
|
|
United Kingdom |
|
||||||||||||||||||
|
|
|
2016 |
|
|
2015 |
|
|
2014 |
|
|
2016 |
|
|
2015 |
|
|
2014 |
|
||||||
|
Discount rate |
|
|
4.39 |
% |
|
|
4.09 |
% |
|
|
4.87 |
% |
|
|
4.00 |
% |
|
|
3.50 |
% |
|
|
4.60 |
% |
|
Expected long-term return on plan assets |
|
|
7.00 |
% |
|
|
7.50 |
% |
|
|
7.75 |
% |
|
|
4.59 |
% |
|
|
4.66 |
% |
|
|
5.84 |
% |
In addition to the above assumptions, the Company uses a market-related value of assets approach to calculate the expected return on plan assets component of U.S. net periodic benefit cost. The market-related value equals the fair value of plan assets with five-year smoothing of asset gains or losses. Asset gains are subtracted or losses added in the following way: 80 percent of the prior year’s gain or loss; 60 percent of the second preceding year’s gain or loss; 40 percent of the third preceding year’s gain or loss; and 20 percent of the fourth preceding year’s gain or loss. Gains or losses for the year are calculated as the difference between the expected fair value of assets and the actual fair value of assets.
Investment Strategies and Policies
U.S. Plans
Plan assets are predominantly invested using active investment strategies, as compared to passive or index investing. An investment management firm hires and monitors underlying investment management firms for each asset category. Equity managers within each category cover a range of investment styles and approaches, including both active and passive, and are combined in a way that controls for capitalization, style biases, and country exposure versus benchmark indexes, while active managers focus primarily on stock selection to improve returns. Fixed income managers seek to reduce the volatility of the plan’s funded status by matching the duration with the plan’s liability while seeking to improve returns through security selection, sector allocation and yield curve management. Real estate uses public core real estate strategies, which provide stable and high levels of current income and enhanced core strategies, which seek slightly higher returns by emphasizing appreciation. Commodity managers are used to further diversify the portfolio and may serve as an inflation hedge and are benchmarked to a diversified commodities index.
Risk is controlled through diversification among multiple asset categories, managers, styles, and securities. The investment management firm recommends asset allocations based on the time horizon available for investment, the nature of the plan cash flows and liabilities and other factors that affect risk tolerance. The asset allocation targets are approved by the Company’s Plan Committee. Risk is further controlled both at the manager and asset category level by assigning targets for risk versus investment returns.
Allowable investment categories include:
Equities: Common stocks of large, medium, and small companies, including both U.S. and non-U.S. based companies. The long-term target allocation for equities, excluding Company stock, is 34 percent.
Fixed Income (Debt): Bonds or notes issued or guaranteed by the U.S. government, and to a lesser extent, by non-U.S. governments, or by their agencies or branches, mortgage-backed securities, including collateralized mortgage obligations, corporate bonds, municipal bonds and dollar-denominated debt securities issued in the U.S. by non-U.S. banks and corporations. A small
68
percentage of the fixed income assets may be in debt securities that are below investment grade. The target allocation for fixed income is 35 percent.
Real Estate: Public real estate funds using office, apartment, industrial, retail, and other property types. The target allocation for real estate is 4 percent.
Commodities: Commodity funds that match the index using commodity-linked derivative instruments including swap agreements, commodity options, futures, options on futures and commodity-linked notes, while seeking to enhance overall returns through the use of fixed income securities. The target allocation for commodities is 2 percent.
Employer Securities: The retirement plans also hold shares of the Company’s common stock, which are purchased or sold by the trustee from time to time, as directed by the Plan Committee. At the direction of the Plan Committee, the plans sold 56,894 common shares to the Company’s ESOP trust on February 23, 2016, and 39,360 common shares on February 18, 2015. The target allocation for employer securities is 25 percent.
In addition to these primary investment types, excess cash may be invested in futures in order to efficiently achieve more fully invested portfolio positions. Otherwise, a small number of investment managers make limited use of derivatives, including futures contracts, options on futures and interest rate swaps in place of direct investment in securities to efficiently achieve equivalent market positions. Derivatives are not used to leverage portfolios.
U.K. Plan
The objective of the U.K. defined benefit pension fund investment strategy is to maximize the long-term rate of return on plan assets within a medium level of risk in order to minimize the cost of providing pension benefits. To that end, the plan assets are invested in an actively managed pooled fund of funds that diversifies its holdings among equity securities, debt securities, property and cash. Essentially, the plan is to hold equity instruments to back the benefits of participants yet to retire and bonds and cash to back current pensioners. Although there are no formal target allocations for the plan assets, the fund will generally be heavily invested in equity securities. Equity securities are selected from U.K., European, U.S. and emerging market companies. Bonds include U.K. and other countries’ government notes and corporate debt of U.K and non-U.K. companies. There are no specific prohibited investments, but the current managed fund will not allocate assets to derivatives or other financial hedging instruments. Plan trustees meet regularly with the fund manager to assess the fund’s performance and to reassess investment strategy. At December 31, 2016, the pension asset allocation was 58 percent equities, 30 percent fixed income, eight percent insurance contracts, three percent real estate and one percent cash.
Included in plan assets are insurance contracts purchased by the plan trustees to provide pension payments for specific retirees. In past years, at the time a plan participant retired, the plan trustee would periodically purchase insurance contracts to cover the future payments due the retiree. This practice is no longer followed. The contracts are revocable, and the related plan obligations are not considered settled. Therefore, the plan assets and obligations include the insured amounts.
69
U.S. Plans
The Company’s asset allocations for its U.S. pension plans at December 31, 2016 and 2015, by asset category, were as follows:
|
|
|
December 31, 2016 |
|
|||||||||||||
|
(In thousands) |
|
Level 1 |
|
|
Level 2 |
|
|
Level 3 |
|
|
Total |
|
||||
|
Cash and Cash Equivalents |
|
$ |
3,633 |
|
|
$ |
275 |
|
|
$ |
— |
|
|
$ |
3,908 |
|
|
Equity Securities |
|
|
|
|
|
|
|
|
|
|
|
|
|
|
|
|
|
U.S. Equities |
|
|
29,390 |
|
|
|
— |
|
|
|
— |
|
|
|
29,390 |
|
|
Non-U.S. Equities |
|
|
14,637 |
|
|
|
— |
|
|
|
— |
|
|
|
14,637 |
|
|
Employer Securities |
|
|
36,018 |
|
|
|
— |
|
|
|
— |
|
|
|
36,018 |
|
|
Total Equities |
|
|
80,045 |
|
|
|
— |
|
|
|
— |
|
|
|
80,045 |
|
|
Fixed Income Securities |
|
|
|
|
|
|
|
|
|
|
|
|
|
|
|
|
|
U.S. Corporate Bonds |
|
|
— |
|
|
|
28,278 |
|
|
|
— |
|
|
|
28,278 |
|
|
U.S. Government and Agency Bonds |
|
|
8,309 |
|
|
|
971 |
|
|
|
— |
|
|
|
9,280 |
|
|
Other Bonds |
|
|
— |
|
|
|
7,696 |
|
|
|
— |
|
|
|
7,696 |
|
|
Total Fixed Income |
|
|
8,309 |
|
|
|
36,945 |
|
|
|
— |
|
|
|
45,254 |
|
|
Mutual Funds |
|
|
|
|
|
|
|
|
|
|
|
|
|
|
|
|
|
Real Estate |
|
|
5,362 |
|
|
|
— |
|
|
|
— |
|
|
|
5,362 |
|
|
Commodities |
|
|
2,523 |
|
|
|
— |
|
|
|
— |
|
|
|
2,523 |
|
|
Other |
|
|
— |
|
|
|
— |
|
|
|
— |
|
|
|
— |
|
|
Total Mutual Funds |
|
|
7,885 |
|
|
|
— |
|
|
|
— |
|
|
|
7,885 |
|
|
Total |
|
$ |
99,872 |
|
|
$ |
37,220 |
|
|
$ |
— |
|
|
$ |
137,092 |
|
|
|
|
December 31, 2015 |
|
|||||||||||||
|
(In thousands) |
|
Level 1 |
|
|
Level 2 |
|
|
Level 3 |
|
|
Total |
|
||||
|
Cash and Cash Equivalents |
|
$ |
— |
|
|
$ |
1,989 |
|
|
$ |
— |
|
|
$ |
1,989 |
|
|
Equity Securities |
|
|
|
|
|
|
|
|
|
|
|
|
|
|
|
|
|
U.S. Equities |
|
|
33,076 |
|
|
|
— |
|
|
|
— |
|
|
|
33,076 |
|
|
Non-U.S. Equities |
|
|
10,630 |
|
|
|
— |
|
|
|
— |
|
|
|
10,630 |
|
|
Employer Securities |
|
|
24,792 |
|
|
|
— |
|
|
|
— |
|
|
|
24,792 |
|
|
Total Equities |
|
|
68,498 |
|
|
|
— |
|
|
|
— |
|
|
|
68,498 |
|
|
Fixed Income Securities |
|
|
|
|
|
|
|
|
|
|
|
|
|
|
|
|
|
U.S. Corporate Bonds |
|
|
— |
|
|
|
26,389 |
|
|
|
— |
|
|
|
26,389 |
|
|
U.S. Government and Agency Bonds |
|
|
365 |
|
|
|
9,371 |
|
|
|
— |
|
|
|
9,736 |
|
|
Other Bonds |
|
|
— |
|
|
|
7,378 |
|
|
|
— |
|
|
|
7,378 |
|
|
Total Fixed Income |
|
|
365 |
|
|
|
43,138 |
|
|
|
— |
|
|
|
43,503 |
|
|
Mutual Funds |
|
|
|
|
|
|
|
|
|
|
|
|
|
|
|
|
|
Real Estate |
|
|
5,222 |
|
|
|
— |
|
|
|
— |
|
|
|
5,222 |
|
|
Commodities |
|
|
1,481 |
|
|
|
— |
|
|
|
— |
|
|
|
1,481 |
|
|
Other |
|
|
1,142 |
|
|
|
— |
|
|
|
— |
|
|
|
1,142 |
|
|
Total Mutual Funds |
|
|
7,845 |
|
|
|
— |
|
|
|
— |
|
|
|
7,845 |
|
|
Total |
|
$ |
76,708 |
|
|
$ |
45,127 |
|
|
$ |
— |
|
|
$ |
121,835 |
|
Plan Asset Valuation Methodology
Following is a description of the valuation methodologies used for plan assets measured at fair value.
Individual equity securities, including employer securities, are valued by Standard & Poor’s Securities Evaluations as determined by quoted market prices on the New York Stock Exchange or other active markets. Both market pricing and future cash flow analysis may be used in the pricing process as follows:
Level 1 – Equities represent the largest asset category and are valued according to the exchange-quoted market prices of the underlying investments. Level 1 fixed income securities are U.S. government securities and are valued according to quoted prices from active markets.
70
Level 2 – Fixed income investments without equivalent trading exchanges are valued primarily through a technique known as “future cash flow approach” which is based on what bondholders can reasonably expect to receive based upon an issuer’s current financial condition. Pricing analysts prepare cash-flow forecasts and utilize one or two pricing models to arrive at an evaluated price. Evaluated bid modeling includes factors such as the interest rate on the coupon, maturity, rating, cash flow projections and other factors.
Level 3 – no investments held during 2016 or 2015 were categorized as Level 3.
U.K. Plan
The Company’s asset allocations for its U.K. pension plans at December 31, 2016 and 2015, by asset category, were as follows:
|
|
|
December 31, 2016 |
|
|||||||||||||
|
(In thousands) |
|
Level 1 |
|
|
Level 2 |
|
|
Level 3 |
|
|
Total |
|
||||
|
Cash |
|
$ |
243 |
|
|
$ |
— |
|
|
$ |
— |
|
|
$ |
243 |
|
|
Equity Securities |
|
|
|
|
|
|
|
|
|
|
|
|
|
|
|
|
|
Pooled Pension Funds |
|
|
— |
|
|
|
11,760 |
|
|
|
— |
|
|
|
11,760 |
|
|
Fixed Income |
|
|
|
|
|
|
|
|
|
|
|
|
|
|
|
|
|
Pooled Pension Funds |
|
|
— |
|
|
|
6,015 |
|
|
|
— |
|
|
|
6,015 |
|
|
Real Estate |
|
|
|
|
|
|
|
|
|
|
|
|
|
|
|
|
|
Pooled Pension Funds |
|
|
— |
|
|
|
559 |
|
|
|
— |
|
|
|
559 |
|
|
Insurance Contracts |
|
|
— |
|
|
|
— |
|
|
|
1,759 |
|
|
|
1,759 |
|
|
Total |
|
$ |
243 |
|
|
$ |
18,334 |
|
|
$ |
1,759 |
|
|
$ |
20,336 |
|
|
|
|
December 31, 2015 |
|
|||||||||||||
|
(In thousands) |
|
Level 1 |
|
|
Level 2 |
|
|
Level 3 |
|
|
Total |
|
||||
|
Cash |
|
$ |
833 |
|
|
$ |
— |
|
|
$ |
— |
|
|
$ |
833 |
|
|
Equity Securities |
|
|
|
|
|
|
|
|
|
|
|
|
|
|
|
|
|
Pooled Pension Funds |
|
|
— |
|
|
|
12,397 |
|
|
|
— |
|
|
|
12,397 |
|
|
Fixed Income |
|
|
|
|
|
|
|
|
|
|
|
|
|
|
|
|
|
Pooled Pension Funds |
|
|
— |
|
|
|
5,740 |
|
|
|
— |
|
|
|
5,740 |
|
|
Real Estate |
|
|
|
|
|
|
|
|
|
|
|
|
|
|
|
|
|
Pooled Pension Funds |
|
|
— |
|
|
|
486 |
|
|
|
— |
|
|
|
486 |
|
|
Insurance Contracts |
|
|
— |
|
|
|
— |
|
|
|
1,969 |
|
|
|
1,969 |
|
|
Total |
|
$ |
833 |
|
|
$ |
18,623 |
|
|
$ |
1,969 |
|
|
$ |
21,425 |
|
Units of each of the pooled funds are valued by the trustee based on quoted market prices of the underlying investments (the underlying assets are either exchange traded or have readily available markets).
Fair value changes within asset categories for which fair value measurements use significant unobservable inputs (Level 3) were as follows during 2015 and 2016:
|
(In thousands) |
|
Insurance Contracts |
|
|
|
Fair value, December 31, 2014 |
|
$ |
2,241 |
|
|
Sale proceeds (benefit payments) |
|
|
(168 |
) |
|
Change in unrealized gain |
|
|
11 |
|
|
Foreign exchange impact |
|
|
(115 |
) |
|
Fair value, December 31, 2015 |
|
$ |
1,969 |
|
|
Sale proceeds (benefit payments) |
|
|
(144 |
) |
|
Change in unrealized gain |
|
|
265 |
|
|
Foreign exchange impact |
|
|
(331 |
) |
|
Fair value, December 31, 2016 |
|
$ |
1,759 |
|
Long-term Rate of Return for Plan Assets
U.S. Plans
The overall expected long-term rate of return on assets of 7.00 percent that was used to develop the 2016 pension expense is based on plan asset allocation, capital markets forecasts and expected benefits of active investment management. For fixed income, the
71
expected return is 4.62 percent. This assumption includes the yield on the five-year zero-coupon U.S. Treasury bond as the base rate along with historical data from the U.S. Treasury yield curve. For equities, the expected return is 7.32 percent for U.S. and international equities. This return is based on a blended average of three different statistical models that each incorporates multiple factors including, for example, inflation, Gross Domestic Product and the Fed Funds Target Rate. For real estate, the expected return is 4.80 percent. For commodities, the expected return is 2.20 percent.
The overall investment return forecast reflects the target allocations and the capital markets forecasts for each asset category, plus a premium for active asset management expected over the long-term.
U.K. Plan
The overall expected long-term return on plan assets is a weighted-average of the expected long-term returns for equity securities, debt securities and other assets. The redemption yield at the measurement date on U.K. government fixed interest bonds and the yield on corporate bonds are used as proxies for the return on the debt portfolio. The returns for equities and property are estimated as a premium of 3.0 percent added to the risk-free rate. Cash is assumed to have a long-term return of 4.0 percent.
Other Defined Benefit Plans
The Company maintains funded and unfunded defined benefit plans in other foreign locations. The liabilities and expenses associated with these plans, individually and collectively, are not material to the Company’s consolidated financial statements. Discount rates for these plans are determined based on local interest rates and plan participant data.
Cash Flows
As a result of pension funding relief included in the Highway and Transportation Funding Act of 2014, the Company expects to make no 2017 contributions to the funded U.S. qualified defined benefit plans. $166,000 is expected to be paid in 2017 related to the unfunded non-qualified U.S. pension plans. The Company expects to contribute $300,000 to the U.K. defined benefit plan in 2017.
Defined Contribution Plans
The Company sponsors retirement savings defined contribution plans that cover U.S. and U.K. employees. The Company also sponsors a profit sharing plan for its U.S. employees. Profit sharing contributions are determined each year using a formula that is applied to Company earnings. The contributions, which are made partly in cash and partly in Company common stock, are allocated to participant accounts on the basis of participant base earnings. The retirement savings and profit sharing defined contribution plans each include a qualified plan and a non-qualified supplemental executive plan.
Defined contribution plan expenses for the Company’s retirement savings plans and profit sharing plan were as follows:
|
(In thousands) |
|
2016 |
|
|
2015 |
|
|
2014 |
|
|||
|
Retirement savings plans |
|
$ |
4,902 |
|
|
$ |
4,644 |
|
|
$ |
4,565 |
|
|
Profit sharing plan |
|
|
6,230 |
|
|
|
4,972 |
|
|
|
3,619 |
|
|
Total |
|
$ |
11,132 |
|
|
$ |
9,616 |
|
|
$ |
8,184 |
|
The Company has a rabbi trust to fund the obligations of its non-qualified supplemental executive defined contribution plans (supplemental plans). The trust comprises various mutual fund investments selected by the participants of the supplemental plans. In accordance with the accounting guidance for rabbi trust arrangements, the assets of the trust and the obligations of the supplemental plans are reported on the Company’s consolidated balance sheet. The Company elected the fair value option for the mutual fund investment assets so that offsetting changes in the mutual fund values and defined contribution plan obligations would be recorded in earnings in the same period. Therefore, the mutual funds are reported at fair value with any subsequent changes in fair value recorded in the income statement. The supplemental plan liabilities increase (i.e., supplemental plan expense is recognized) when the value of the trust assets appreciates and decrease (i.e., supplemental plan income is recognized) when the value of the trust assets declines. At December 31, 2016 and 2015, the trust asset balances were $1,692,000 and $1,762,000, respectively, and the supplemental plan liability balances were $1,767,000 and $1,827,000, respectively. The differences between the trust asset balances and the supplemental liability balances were due to estimated liabilities that were not funded until after the end of the year when the actual liabilities were determined.
In addition to the Company sponsored profit sharing plan, certain foreign locations are required by law to make profit sharing contributions to employees based on statutory formulas. For the years ended December 31, 2016, 2015 and 2014, the Company recognized $290,000, $1,375,000 and $145,000, respectively, of statutory profit sharing expense.
72
14. Accrued Liabilities
The composition of accrued liabilities was as follows:
|
|
|
December 31 |
|
|||||
|
(In thousands) |
|
2016 |
|
|
2015 |
|
||
|
Accrued payroll and benefits |
|
$ |
66,575 |
|
|
$ |
53,691 |
|
|
Accrued customer rebates |
|
|
18,553 |
|
|
|
16,561 |
|
|
Other accrued liabilities |
|
|
25,667 |
|
|
|
25,581 |
|
|
Total accrued liabilities |
|
$ |
110,795 |
|
|
$ |
95,833 |
|
The year-over-year change in the accruals for payroll and benefits was largely attributable to increased liabilities for short-term incentive-based compensation.
15. Other Non-Current Liabilities
The composition of other non-current liabilities was as follows:
|
|
|
December 31 |
|
|||||
|
(In thousands) |
|
2016 |
|
|
2015 |
|
||
|
Deferred revenue |
|
$ |
1,863 |
|
|
$ |
2,988 |
|
|
Environmental and legal matters |
|
|
22,703 |
|
|
|
18,258 |
|
|
Deferred compensation liability |
|
|
53,133 |
|
|
|
43,042 |
|
|
Pension liability |
|
|
29,494 |
|
|
|
41,252 |
|
|
Other non-current liabilities |
|
|
12,160 |
|
|
|
9,221 |
|
|
Total other non-current liabilities |
|
$ |
119,353 |
|
|
$ |
114,761 |
|
16. Contingencies
There are a variety of legal proceedings pending or threatened against the Company. Some of these proceedings may result in fines, penalties, judgments or costs being assessed against the Company at some future time. The Company’s operations are subject to extensive local, state and federal regulations, including the U.S. Comprehensive Environmental Response, Compensation and Liability Act of 1980 (CERCLA) and the Superfund amendments of 1986 (Superfund). Over the years, the Company has received requests for information related to or has been named by government authorities as a PRP at a number of waste disposal and manufacturing sites where cleanup costs have been or may be incurred under CERCLA and similar state statutes. In addition, damages are being claimed against the Company in general liability actions for alleged personal injury or property damage in the case of some disposal and plant sites. The Company believes that it has made adequate provisions for the costs it may incur with respect to these sites.
As of December 31, 2016, the Company estimated a range of possible environmental and legal losses of $25.7 million to $46.5 million. The Company’s accrued liability for such losses, which represented the Company’s best estimate within the estimated range of possible environmental and legal losses, was $25.8 million at December 31, 2016, compared to $20.9 million at December 31, 2015. During 2016, cash outlays related to legal and environmental matters approximated $1.4 million compared to $2.7 million in 2015.
For certain sites, the Company has responded to information requests made by federal, state or local government agencies but has received no response confirming or denying the Company’s stated positions. As such, estimates of the total costs, or range of possible costs, of remediation, if any, or the Company’s share of such costs, if any, cannot be determined with respect to these sites. Consequently, the Company is unable to predict the effect thereof on the Company’s financial position, cash flows and results of operations. Given the information available, management believes the Company has no liability at these sites. However, in the event of one or more adverse determinations with respect to such sites in any annual or interim period, the effect on the Company’s cash flows and results of operations for those periods could be material. Based upon the Company’s present knowledge with respect to its involvement at these sites, the possibility of other viable entities’ responsibilities for cleanup, and the extended period over which any costs would be incurred, the Company believes that these matters, individually and in the aggregate, will not have a material effect on the Company’s financial position.
73
Following are summaries of the major contingencies at December 31, 2016:
Maywood, New Jersey Site
The Company’s property in Maywood, New Jersey and property formerly owned by the Company adjacent to its current site and other nearby properties (Maywood site) were listed on the National Priorities List in September 1993 pursuant to the provisions of CERCLA because of certain alleged chemical contamination. Pursuant to an Administrative Order on Consent entered into between USEPA and the Company for property formerly owned by the Company, and the issuance of an order by USEPA to the Company for property currently owned by the Company, the Company has completed various Remedial Investigation Feasibility Studies (RI/FS), and on September 24, 2014, USEPA issued its Record of Decision (“ROD”) for chemically-contaminated soil. USEPA has not yet issued a ROD for chemically-contaminated groundwater for Maywood site. Based on the most current information available, the Company believes its recorded liability represents its best estimate of the cost of remediation for the Maywood site. The best estimate of the cost of remediation for the Maywood site could change as the Company continues to hold discussions with USEPA, as the design of the remedial action progresses, if a groundwater ROD is issued or if other PRPs are identified. The ultimate amount for which the Company is liable could differ from the Company’s current recorded liability.
In April 2015, the Company entered into an Administrative Settlement Agreement and Administrative Order on Consent with USEPA which requires payment of certain costs and performance of certain investigative and design work for chemically-contaminated soil. Based on the Company’s review and analysis of this order, no changes to the Company’s current recorded liability for claims associated with soil remediation of chemical contamination were required.
In addition, under the terms of a settlement agreement reached on November 12, 2004, the United States Department of Justice and the Company agreed to fulfill the terms of a Cooperative Agreement reached in 1985 under which the United States will take title to and responsibility for radioactive waste removal at the Maywood site, including past and future remediation costs incurred by the United States. As such, the Company recorded no liability related to this settlement agreement.
D’Imperio Property Site
During the mid-1970’s, Jerome Lightman and the Lightman Drum Company disposed of hazardous substances at several sites in New Jersey. The Company was named as a PRP in a lawsuit in the U.S. District court for the district of New Jersey that involved the D’Imperio Property Site located in New Jersey. In 2016, the PRPs were provided with updated remediation cost estimates which were considered in the Company’s determination of its range of estimated possible losses and liability balance. The changes in range of possible losses and liability balance were immaterial. Remediation work is continuing at this site. Based on current information, the Company believes that its recorded liability represents its best estimate of the cost of remediation for the D’Imperio site. Depending on the ultimate cost of the remediation at this site, the amount for which the Company is liable could differ from the current estimates.
Wilmington Site
The Company is currently contractually obligated to contribute to the response costs associated with the Company’s formerly-owned site at 51 Eames Street, Wilmington, Massachusetts. Remediation at this site is being managed by its current owner to whom the Company sold the property in 1980. Under the agreement, once total site remediation costs exceed certain levels, the Company is obligated to contribute up to five percent of future response costs associated with this site with no limitation on the ultimate amount of contributions. The Company has paid the current owner $2.5 million for the Company’s portion of environmental response costs through December 31, 2016. The Company has recorded a liability for its portion of the estimated remediation costs for the site. Depending on the ultimate cost of the remediation at this site, the amount for which the Company is liable could differ from the current estimates.
The Company and other prior owners also entered into an agreement in April 2004 waiving certain statute of limitations defenses for claims which may be filed by the Town of Wilmington, Massachusetts, in connection with this site. While the Company has denied any liability for any such claims, the Company agreed to this waiver while the parties continue to discuss the resolution of any potential claim which may be filed.
The Company believes that based on current information it has adequate reserves for the claims related to this site. However, depending on the ultimate cost of the remediation at this site, the amount for which the Company is liable could differ from the current estimates.
74
Through the regular environmental monitoring of its plant production sites, the Company discovered levels of chemical contamination that were above thresholds allowed by law at two of its U.S plants. The Company voluntarily reported its results to the applicable state environmental agencies. As a result, the Company is required to perform self-remediation of the affected areas. In the fourth quarter of 2016, the Company recognized a charge for the estimated cost of remediating the sites. The charge was not material to the Company’s results of operations. Based on current information, the Company believes that its recorded liability for the remediation is adequate. However, actual costs could differ from current estimates.
Mexico Value-Added Tax
During a 2015 examination of the Company’s 2009 and 2010 Mexico subsidiary financial records, local tax authority auditors determined that the Company’s treatment of value-added tax (VAT) for purchase transactions with a certain vendor was incorrect. As a result, the tax authorities concluded that the Company owed past VAT from 2009 through 2010 along with assessed inflation, penalty and interest charges. In 2015, the Company recorded a liability and corresponding income statement charge for the VAT inflation, penalty and interest charges for 2009 through 2014. No exposure for 2015 existed as the Company remedied the underlying problem. The amount recorded in 2015 was not material to the Company’s results of operations. No charge was recorded for the past unpaid VAT because the Company believes the amount will be recoverable through the normal VAT process. In 2016, the Company reached agreement with Mexico’s tax authorities on the amount of inflation, penalty and interest charged for 2009 through 2014. No significant adjustments were required to the previously recorded liability as a result of these agreements. At December 31, 2016, the Company had no recorded liability for this issue. Additional charges could potentially be incurred by the Company if the amount of unpaid VAT related to this issue is not fully recovered through the normal VAT process.
75
The Company has three reportable segments: Surfactants, Polymers and Specialty Products. Each segment provides distinct products and requires separate management due to unique markets, technologies and production processes. Surfactants are used in a variety of consumer and industrial cleaning compounds as well as in agricultural products, lubricating ingredients, oil field chemicals and other specialized applications. Polymers are used primarily in plastics, building materials, refrigeration systems and CASE applications. Specialty Products are used in food, flavoring, nutritional supplement and pharmaceutical applications.
The Company evaluates the performance of its segments and allocates resources based on operating income before interest expense, other income/expense items and income tax provision. The accounting policies of the reportable segments are the same as those described in the summary of significant accounting policies.
The following is segment data for the three years ended December 31, 2016, 2015 and 2014:
|
(In thousands) |
|
Surfactants |
|
|
Polymers |
|
|
Specialty Products |
|
|
Segment Totals |
|
||||
|
2016 |
|
|
|
|
|
|
|
|
|
|
|
|
|
|
|
|
|
Net sales |
|
$ |
1,181,563 |
|
|
$ |
498,826 |
|
|
$ |
85,777 |
|
|
$ |
1,766,166 |
|
|
Operating income |
|
|
99,796 |
|
|
|
96,788 |
|
|
|
10,698 |
|
|
|
207,282 |
|
|
Assets |
|
|
831,324 |
|
|
|
301,890 |
|
|
|
75,483 |
|
|
|
1,208,697 |
|
|
Capital expenditures |
|
|
64,121 |
|
|
|
31,890 |
|
|
|
4,194 |
|
|
|
100,205 |
|
|
Depreciation and amortization expenses |
|
|
48,643 |
|
|
|
20,275 |
|
|
|
4,204 |
|
|
|
73,122 |
|
|
|
|
|
|
|
|
|
|
|
|
|
|
|
|
|
|
|
|
2015 |
|
|
|
|
|
|
|
|
|
|
|
|
|
|
|
|
|
Net sales |
|
$ |
1,205,849 |
|
|
$ |
491,488 |
|
|
$ |
78,830 |
|
|
$ |
1,776,167 |
|
|
Operating income |
|
|
104,080 |
|
|
|
80,942 |
|
|
|
4,397 |
|
|
|
189,419 |
|
|
Assets |
|
|
758,524 |
|
|
|
293,790 |
|
|
|
72,604 |
|
|
|
1,124,918 |
|
|
Capital expenditures |
|
|
79,171 |
|
|
|
31,309 |
|
|
|
6,387 |
|
|
|
116,867 |
|
|
Depreciation and amortization expenses |
|
|
42,122 |
|
|
|
19,541 |
|
|
|
3,659 |
|
|
|
65,322 |
|
|
|
|
|
|
|
|
|
|
|
|
|
|
|
|
|
|
|
|
2014 |
|
|
|
|
|
|
|
|
|
|
|
|
|
|
|
|
|
Net sales |
|
$ |
1,296,638 |
|
|
$ |
550,966 |
|
|
$ |
79,609 |
|
|
$ |
1,927,213 |
|
|
Operating income |
|
|
60,778 |
|
|
|
60,690 |
|
|
|
10,487 |
|
|
|
131,955 |
|
|
Assets |
|
|
741,677 |
|
|
|
320,640 |
|
|
|
67,588 |
|
|
|
1,129,905 |
|
|
Capital expenditures |
|
|
70,796 |
|
|
|
22,409 |
|
|
|
5,618 |
|
|
|
98,823 |
|
|
Depreciation and amortization expenses |
|
|
41,483 |
|
|
|
18,433 |
|
|
|
2,792 |
|
|
|
62,708 |
|
76
Below are reconciliations of segment data to the consolidated financial statements:
|
(In thousands) |
|
2016 |
|
|
2015 |
|
|
2014 |
|
|||
|
Operating income - segment totals |
|
$ |
207,282 |
|
|
$ |
189,419 |
|
|
$ |
131,955 |
|
|
Business restructuring and asset impairments (a) |
|
|
(7,064 |
) |
|
|
— |
|
|
|
(4,009 |
) |
|
Unallocated corporate expenses (b) |
|
|
(74,025 |
) |
|
|
(66,629 |
) |
|
|
(37,252 |
) |
|
Total operating income |
|
|
126,193 |
|
|
|
122,790 |
|
|
|
90,694 |
|
|
Interest expense, net |
|
|
(13,205 |
) |
|
|
(14,533 |
) |
|
|
(11,441 |
) |
|
Loss from equity in joint ventures |
|
|
— |
|
|
|
(6,985 |
) |
|
|
(5,008 |
) |
|
Other, net |
|
|
828 |
|
|
|
1,584 |
|
|
|
1,290 |
|
|
Consolidated income before income taxes |
|
$ |
113,816 |
|
|
$ |
102,856 |
|
|
$ |
75,535 |
|
|
|
|
|
|
|
|
|
|
|
|
|
|
|
|
Assets - segment totals |
|
$ |
1,208,697 |
|
|
$ |
1,124,918 |
|
|
$ |
1,129,905 |
|
|
Unallocated corporate assets (c) (d) |
|
|
145,193 |
|
|
|
113,474 |
|
|
|
32,109 |
|
|
Consolidated assets (d) |
|
$ |
1,353,890 |
|
|
$ |
1,238,392 |
|
|
$ |
1,162,014 |
|
|
|
|
|
|
|
|
|
|
|
|
|
|
|
|
Capital expenditures - segment totals |
|
$ |
100,205 |
|
|
$ |
116,867 |
|
|
$ |
98,823 |
|
|
Unallocated corporate expenditures |
|
|
2,871 |
|
|
|
2,482 |
|
|
|
2,996 |
|
|
Consolidated capital expenditures |
|
$ |
103,076 |
|
|
$ |
119,349 |
|
|
$ |
101,819 |
|
|
|
|
|
|
|
|
|
|
|
|
|
|
|
|
Depreciation and amortization expenses – segment totals |
|
$ |
73,122 |
|
|
$ |
65,322 |
|
|
$ |
62,708 |
|
|
Unallocated corporate depreciation expenses |
|
|
1,845 |
|
|
|
1,663 |
|
|
|
1,096 |
|
|
Consolidated depreciation and amortization expenses |
|
$ |
74,967 |
|
|
$ |
66,985 |
|
|
$ |
63,804 |
|
|
|
(a) |
See Note 22 regarding business restructuring and asset impairment costs. |
|
|
|
(b) |
Unallocated corporate expenses primarily comprise corporate administrative expenses (e.g., corporate finance, legal, human resources, information systems, deferred compensation and environmental remediation) that are not included in segment operating income and not used to evaluate segment performance. |
|
|
|
(c) |
The changes in unallocated corporate assets between 2016, 2015 and 2014 were primarily attributable to changes in the balance of U.S. cash and cash equivalents, which are not allocated to segments. |
|
|
|
(d) |
The 2015 amounts in the noted line items have been changed from the amounts originally reported due to the reclassification of debt issuance costs pursuant to the Company’s adoption of ASU No. 2015-3. See Note 1 for further information. |
|
77
Below is certain Company-wide geographic data for the years ended December 31, 2016, 2015 and 2014:
|
(In thousands) |
|
2016 |
|
|
2015 |
|
|
2014 |
|
|||
|
Net sales (a) |
|
|
|
|
|
|
|
|
|
|
|
|
|
United States |
|
$ |
1,076,259 |
|
|
$ |
1,069,526 |
|
|
$ |
1,146,405 |
|
|
France |
|
|
151,031 |
|
|
|
169,072 |
|
|
|
183,896 |
|
|
Poland |
|
|
153,986 |
|
|
|
150,654 |
|
|
|
175,862 |
|
|
United Kingdom |
|
|
86,458 |
|
|
|
89,757 |
|
|
|
103,696 |
|
|
Brazil |
|
|
74,961 |
|
|
|
63,439 |
|
|
|
65,165 |
|
|
All other countries |
|
|
223,471 |
|
|
|
233,719 |
|
|
|
252,189 |
|
|
Total |
|
$ |
1,766,166 |
|
|
$ |
1,776,167 |
|
|
$ |
1,927,213 |
|
|
|
|
|
|
|
|
|
|
|
|
|
|
|
|
Long-lived assets (b) |
|
|
|
|
|
|
|
|
|
|
|
|
|
United States |
|
$ |
411,023 |
|
|
$ |
387,744 |
|
|
$ |
360,921 |
|
|
Germany |
|
|
27,475 |
|
|
|
30,268 |
|
|
|
36,156 |
|
|
Singapore |
|
|
36,270 |
|
|
|
39,181 |
|
|
|
41,909 |
|
|
Brazil (c) |
|
|
58,106 |
|
|
|
26,721 |
|
|
|
25,991 |
|
|
China |
|
|
29,508 |
|
|
|
25,689 |
|
|
|
10,674 |
|
|
United Kingdom |
|
|
20,309 |
|
|
|
22,943 |
|
|
|
23,040 |
|
|
All other countries |
|
|
47,670 |
|
|
|
52,139 |
|
|
|
57,809 |
|
|
Total |
|
$ |
630,361 |
|
|
$ |
584,685 |
|
|
$ |
556,500 |
|
|
|
(a) |
Net sales are attributed to countries based on the location of the Company facility making the sales. |
|
|
|
(b) |
Includes net property, plant and equipment, goodwill and other intangible assets. |
|
|
|
(c) |
The change between 2016 and 2015 was attributable to the acquisition described in Note 20. |
|
18. Earnings Per Share
Below is the computation of basic and diluted earnings per share for the years ended December 31, 2016, 2015 and 2014 (see the discussion regarding the adoption of ASU No. 2016-9 and its effect on the calculation of 2016 diluted earnings per share in Note 1):
|
(In thousands, except per share amounts) |
|
2016 |
|
|
2015 |
|
|
2014 |
|
|||
|
Computation of Basic Earnings per Share |
|
|
|
|
|
|
|
|
|
|
|
|
|
Net income attributable to Stepan Company |
|
$ |
86,191 |
|
|
$ |
75,968 |
|
|
$ |
57,101 |
|
|
Weighted-average number of shares outstanding |
|
|
22,793 |
|
|
|
22,730 |
|
|
|
22,758 |
|
|
Basic earnings per share |
|
$ |
3.78 |
|
|
$ |
3.34 |
|
|
$ |
2.51 |
|
|
Computation of Diluted Earnings per Share |
|
|
|
|
|
|
|
|
|
|
|
|
|
Net income attributable to Stepan Company |
|
$ |
86,191 |
|
|
$ |
75,968 |
|
|
$ |
57,101 |
|
|
Weighted-average number of shares outstanding |
|
|
22,793 |
|
|
|
22,730 |
|
|
|
22,758 |
|
|
Add weighted-average net shares from assumed exercise of options (under treasury share method) (a) |
|
|
159 |
|
|
|
118 |
|
|
|
148 |
|
|
Add weighted-average net shares related to unvested stock awards (under treasury share method) |
|
|
6 |
|
|
|
3 |
|
|
|
11 |
|
|
Add weighted-average net shares from assumed exercise of SARs (under treasury share method) |
|
|
68 |
|
|
|
1 |
|
|
─ |
|
|
|
Add weighted-average contingently issuable net shares related to performance stock awards (under treasury share method) |
|
|
68 |
|
|
|
6 |
|
|
─ |
|
|
|
Weighted-average shares applicable to diluted earnings |
|
|
23,094 |
|
|
|
22,858 |
|
|
|
22,917 |
|
|
Diluted earnings per share |
|
$ |
3.73 |
|
|
$ |
3.32 |
|
|
$ |
2.49 |
|
|
|
(a) |
Options to purchase 43,715, 124,531 and 99,044 shares of common stock were not included in the computations of diluted earnings per share for the years ended December 31, 2016, 2015 and 2014, respectively. The options’ exercise prices were greater than the average market price for the common stock and the effect of the options on earnings per share would have been antidilutive. |
|
78
19. Accumulated Other Comprehensive Income (Loss)
Below is the change in the Company’s accumulated other comprehensive income (loss) (AOCI) balance by component (net of income taxes) for the years ended December 31, 2016, 2015 and 2014:
|
(In thousands) |
|
Foreign Currency Translation Adjustments |
|
|
Defined Benefit Pension Plan Adjustments |
|
|
Cash Flow Hedge Adjustments |
|
|
Total |
|
||||
|
|
|
|
|
|
|
|
|
|
|
|
|
|
|
|
|
|
|
Balance at December 31, 2013 |
|
$ |
(10,971 |
) |
|
$ |
(18,672 |
) |
|
$ |
115 |
|
|
$ |
(29,528 |
) |
|
|
|
|
|
|
|
|
|
|
|
|
|
|
|
|
|
|
|
Other comprehensive income before reclassifications |
|
|
(31,943 |
) |
|
|
(24,186 |
) |
|
|
0 |
|
|
|
(56,129 |
) |
|
|
|
|
|
|
|
|
|
|
|
|
|
|
|
|
|
|
|
Amounts reclassified from AOCI |
|
|
— |
|
|
|
1,709 |
|
|
|
3 |
|
|
|
1,712 |
|
|
|
|
|
|
|
|
|
|
|
|
|
|
|
|
|
|
|
|
Net current period other comprehensive income |
|
|
(31,943 |
) |
|
|
(22,477 |
) |
|
|
3 |
|
|
|
(54,417 |
) |
|
|
|
|
|
|
|
|
|
|
|
|
|
|
|
|
|
|
|
Balance at December 31, 2014 |
|
$ |
(42,914 |
) |
|
$ |
(41,149 |
) |
|
$ |
118 |
|
|
$ |
(83,945 |
) |
|
|
|
|
|
|
|
|
|
|
|
|
|
|
|
|
|
|
|
Other comprehensive income before reclassifications |
|
|
(45,423 |
) |
|
|
1,311 |
|
|
|
(49 |
) |
|
|
(44,161 |
) |
|
|
|
|
|
|
|
|
|
|
|
|
|
|
|
|
|
|
|
Amounts reclassified from AOCI |
|
|
— |
|
|
|
3,013 |
|
|
|
5 |
|
|
|
3,018 |
|
|
|
|
|
|
|
|
|
|
|
|
|
|
|
|
|
|
|
|
Net current period other comprehensive income |
|
|
(45,423 |
) |
|
|
4,324 |
|
|
|
(44 |
) |
|
|
(41,143 |
) |
|
|
|
|
|
|
|
|
|
|
|
|
|
|
|
|
|
|
|
Balance at December 31, 2015 |
|
$ |
(88,337 |
) |
|
$ |
(36,825 |
) |
|
$ |
74 |
|
|
$ |
(125,088 |
) |
|
|
|
|
|
|
|
|
|
|
|
|
|
|
|
|
|
|
|
Other comprehensive income before reclassifications |
|
|
(8,438 |
) |
|
|
3,818 |
|
|
|
(19 |
) |
|
|
(4,639 |
) |
|
|
|
|
|
|
|
|
|
|
|
|
|
|
|
|
|
|
|
Amounts reclassified from AOCI |
|
|
— |
|
|
|
2,217 |
|
|
|
45 |
|
|
|
2,262 |
|
|
Net current period other comprehensive income |
|
|
(8,438 |
) |
|
|
6,035 |
|
|
|
26 |
|
|
|
(2,377 |
) |
|
|
|
|
|
|
|
|
|
|
|
|
|
|
|
|
|
|
|
Balance at December 31, 2016 |
|
$ |
(96,775 |
) |
|
$ |
(30,790 |
) |
|
$ |
100 |
|
|
$ |
(127,465 |
) |
Amounts reclassified out of AOCI for the three years ended December 31, 2016, 2015 and 2014, is displayed below:
|
|
|
Amounts Reclassified from AOCI (a) |
|
|
|
|||||||||
|
(In thousands) |
|
|
|
|
|
|
|
|
|
|
|
|
|
Affected Line Item in Consolidated |
|
|
|
2016 |
|
|
2015 |
|
|
2014 |
|
|
Statements of Income |
|||
|
Amortization of defined pension items: |
|
|
|
|
|
|
|
|
|
|
|
|
|
|
|
Prior service cost |
|
$ |
(14 |
) |
|
$ |
(17 |
) |
|
$ |
(20 |
) |
|
|
|
Actuarial loss |
|
|
(3,508 |
) |
|
|
(4,757 |
) |
|
|
(2,727 |
) |
|
|
|
|
|
$ |
(3,522 |
) |
|
|
(4,774 |
) |
|
|
(2,747 |
) |
|
Total before tax (b) |
|
|
|
|
1,305 |
|
|
|
1,761 |
|
|
|
1,038 |
|
|
Tax benefit |
|
|
|
$ |
(2,217 |
) |
|
$ |
(3,013 |
) |
|
$ |
(1,709 |
) |
|
Net of tax |
|
|
|
|
|
|
|
|
|
|
|
|
|
|
|
|
|
Gains and losses on cash flow hedges: |
|
|
|
|
|
|
|
|
|
|
|
|
|
|
|
Interest rate contracts |
|
$ |
(82 |
) |
|
$ |
(22 |
) |
|
$ |
(20 |
) |
|
Interest, net |
|
Foreign exchange contracts |
|
|
9 |
|
|
|
9 |
|
|
|
10 |
|
|
Cost of sales |
|
|
|
|
(73 |
) |
|
|
(13 |
) |
|
|
(10 |
) |
|
Total before tax |
|
|
|
|
28 |
|
|
|
8 |
|
|
|
7 |
|
|
Tax benefit |
|
|
|
$ |
(45 |
) |
|
$ |
(5 |
) |
|
$ |
(3 |
) |
|
Net of tax |
|
Total reclassifications for the period |
|
$ |
(2,262 |
) |
|
$ |
(3,018 |
) |
|
$ |
(1,712 |
) |
|
Net of tax |
|
|
(a) |
Amounts in parentheses denote expense to statement of income. |
|
|
(b) |
This component of accumulated other comprehensive income is included in the computation of net periodic benefit cost (see Note 13 for details regarding net periodic benefit costs for the Company’s U.S. and U.K. defined benefit plans). |
|
79
2016 Business Acquisitions
On October 3, 2016, the Company’s subsidiary in Brazil acquired the commercial business of Tebras Tensoativos do Brazil Ltda. (Tebras) and the sulfonation production facility of PBC Industria Quimica Ltda. (PBC). The purchase price of the acquisitions, including adjustments for working capital, was R$93,309,000 (approximately $29,075,000), of which R$70,000,000 (approximately $21,812,000) was paid from cash on hand, R$9,000,000 (approximately $2,804,000) was deposited in escrow to cover certain potential losses as specified in the purchase agreement and R$14,309,000 (approximately $4,459,000) for working capital adjustments is unpaid pending agreement on the adjustment amounts. (All U.S. dollar equivalents were calculated using the October 3, 2016 exchange rates.) The combined entities have 25,000 metric tons of sulfonation capacity and a large, diverse customer portfolio. The acquisition is expected to expand and diversify the Company’s customer base for sulfonated products in Brazil and to provide an opportunity to sell the Company’s broader surfactant portfolio to over 1,200 new customers who will benefit from the Company’s technical service and formulation support. The acquired businesses are included in the Company’s Surfactants segment. The acquired entities’ contributions to Company net sales and net income for the year ended December 31, 2016, were insignificant.
In addition to the purchase price paid, the Company incurred approximately $250,000 of acquisition-related expenses for legal, consulting, valuation, accounting and environmental testing services. These costs were included in the administrative expenses line of the Company’s consolidated statement of net income for the year ended December 31, 2016.
The acquisitions were accounted for as a business combination, and, accordingly, the assets acquired and liabilities assumed as part of the acquisition were measured and recorded at their estimated fair values. The following table summarizes the assets acquired and liabilities assumed:
|
(Dollars in thousands) |
|
October 3, 2016 |
|
|
|
Assets: |
|
|
|
|
|
Current assets |
|
$ |
5,165 |
|
|
Property, plant and equipment |
|
|
5,716 |
|
|
Identifiable intangible assets |
|
|
7,354 |
|
|
Goodwill |
|
|
14,327 |
|
|
Total assets acquired |
|
$ |
32,562 |
|
|
|
|
|
|
|
|
Liabilities: |
|
|
|
|
|
Current liabilities |
|
$ |
408 |
|
|
Deferred tax liability |
|
|
3,079 |
|
|
Total liabilities assumed |
|
$ |
3,487 |
|
|
Net assets acquired |
|
$ |
29,075 |
|
The acquired goodwill, which was assigned entirely to the Company’s Surfactant segment, is not tax deductible. The goodwill reflects the opportunity of introducing the Company’s broad line of surfactant products to the acquired entities’ large customer base. Identifiable intangible assets included customer relationships ($4,331,000), a supply contract ($2,555,000) and non-compete agreements ($468,000). The amortization period for these intangibles at the time of acquisition were 13 years, four years and five years, respectively. The Company continues to evaluate the purchase price allocation, including the estimated fair values of assets acquired and liabilities assumed. Any changes to these amounts during the measurement period may result in an adjustment to the recorded amount of goodwill.
Tebras and PBC generated approximately $28,000,000 in net sales in 2015, with net income of less than $2,000,000. Pro forma financial information for 2015 and 2016 has not been included because revenues and earnings of the Company would not have been significantly different than reported had the acquisition date been January 1, 2015.
2015 Acquisitions
Business Acquisition
On June 15, 2015, the Company acquired Procter & Gamble do Brasil S.A.’s (P&G Brazil’s) sulfonation production facility in Bahia, Brazil. The facility is located in northeastern Brazil and has 30,000 metric tons of surfactants capacity. The acquired business is included in the Company’s Surfactant segment. The new business complements the Company’s existing Vespasiano, Brazil, plant and provides opportunities to serve growing northeastern Brazil. The purchase price was cash of $5,133,000. The acquisition was accounted for as a business combination and, accordingly, the assets acquired and liabilities assumed as part of the acquisition were measured and recorded at their estimated fair values. The purchase included property, plant and equipment valued at $6,007,000 and the assumption of liabilities valued at $874,000. No intangibles or goodwill were acquired in the business combination. The purchase price allocation is final, and no allocation adjustments were made to the amounts recorded at the acquisition date. Other acquisition-
80
related expenses were not material. Post-acquisition financial results for the acquired business were insignificant. Pro forma financial information has not been included because revenues and earnings of the Company would not have been significantly different than reported had the acquisition date been January 1, 2014. See Note 22 for information regarding the subsequent impairment of assets at the Bahia, Brazil, site.
Asset Acquisition
In 2015, the Company purchased select chemical manufacturing assets and land from The Sun Products Corporation’s Pasadena, Texas, manufacturing site. The Company intends to redeploy the manufacturing assets as needed to reduce future capital expenditures. The Company is currently planning on making nonionic surfactants at the site. The purchase price of the land and manufacturing assets was $13,000,000 cash, of which $3,377,000 was allocated to land and $9,623,000 was allocated to manufacturing assets.
21. Sale of Product Line
In January 2015, the Company sold its specialty polyurethane systems product line (kits) to J6 Polymers, LLC (J6) for cash of $3,262,000. Kits were part of the Company’s Polymers segment and accounted for approximately $2,800,000 of the Company’s 2014 net sales. The sale of kits included inventory, customer and supplier lists, formulations, manufacturing procedures and all other intellectual property associated with the manufacturing and selling of kits. As a result of the sale, Company operating income for the year ended December 31, 2015, included a gain of $2,862,000. The gain was attributed to the Polymer segment. J6 is a business wholly-owned and operated by members of the immediate family of Robert J. Wood, a former Company executive who retired from the Company in April 2014. Mr. Wood is a managing member of J6.
22. Business Restructuring and Asset Impairments
2016 Restructuring
In May 2016, the Company announced plans to shut down its Longford Mills, Ontario, Canada (Longford Mills) manufacturing facility, a part of the Surfactant reportable segment, by December 31, 2016. Production of goods manufactured at the facility was moved to other Company North American production sites. The plant closure is expected to enable the Company to improve its asset utilization in North America and to reduce the Company’s fixed cost base. In 2016, $2,817,000 of restructuring expense was recognized, which reflected termination benefits for approximately 30 employees and expenses for asset decommissioning costs. Decommissioning activities are expected to extend into 2017. In total, restructuring expenses related to the Longford Mills shutdown are expected to approximate $4,000,000 to $4,500,000.
Below is a reconciliation of the beginning and ending balances of the Longford Mills restructuring liability:
|
(In thousands) |
|
Termination Benefits |
|
|
Other Expense |
|
|
Total |
|
|||
|
Restructuring liability at January 1, 2016 |
|
$ |
— |
|
|
$ |
— |
|
|
$ |
— |
|
|
Expense recognized |
|
|
1,594 |
|
|
|
1,223 |
|
|
|
2,817 |
|
|
Amounts paid |
|
|
— |
|
|
|
(781 |
) |
|
|
(781 |
) |
|
Foreign currency translation |
|
|
(46 |
) |
|
|
(5 |
) |
|
|
(51 |
) |
|
Restructuring liability at December 31, 2016 |
|
$ |
1,548 |
|
|
$ |
437 |
|
|
$ |
1,985 |
|
In addition to the restructuring costs, the Company reduced the useful lives of the manufacturing assets in the Longford Mills plant. As a result, the Company recognized $4,471,000 of additional depreciation expense for the year ended December 31, 2016. The expense was included in the cost of sales line of the consolidated statements of income. No additional future depreciation related to the change in the useful lives of the assets is expected.
81
In the fourth quarter of 2016, the Company recorded pretax charges for asset impairments of $4,247,000, all related to the Company’s Surfactant segment (although the charges were excluded from the Surfactant segment operating results). In the United States, $2,297,000 of engineering and design costs associated with a planned nonionic surfactants plant construction project in Louisiana were written off from the Company’s construction-in-process account, as management decided to make nonionic surfactants at the site in Pasadena, Texas, acquired in 2015 from The Sun Products Corporation. In Brazil, the major customer for the Bahia plant exited the product line for which that plant supplied them product. As a result, the Company was required to recognize $1,950,000 of asset impairment expenses for the facility. Because the customer was under contract with the Company, a negotiated agreement was reached in 2016 whereby the customer agreed to compensate the Company in the lump-sum amount of $4,250,000 for lost future revenues. The compensation was reported in net sales for the year ended December 31, 2016.
2014 Restructuring
In the fourth quarter of 2014, a restructuring plan was approved that affected certain Company functions, principally the research and development function and to a lesser extent product safety and compliance and plant site accounting functions (primarily impacting the Surfactant reportable segment). The objective of the plan was to better align staffing resources with the needs of the Company’s diversification and growth initiatives. In implementing the plan, management offered a voluntary retirement incentive to employees of the affected functions. By December 31, 2014, 13 employees accepted the voluntary termination incentive. As a result, the Company recognized a $1,722,000 charge against income for the three and twelve months ended December 31, 2014. The restructuring was not considered a cost savings initiative but rather an opportunity to create some staffing flexibility to reposition roles to meet changing business needs. The severance payouts were completed by June 30, 2015. Other costs for the restructuring were not material.
The following is a reconciliation of the beginning and ending balances of the restructuring liability:
|
(In thousands) |
|
Severance Expense |
|
|
|
Restructuring liability at December 31, 2014 |
|
$ |
1,722 |
|
|
Amounts paid |
|
|
(1,695 |
) |
|
Foreign currency translation |
|
|
(18 |
) |
|
Expense adjustment |
|
|
(9 |
) |
|
Restructuring liability at December 31, 2015 |
|
$ |
— |
|
2014 Asset Impairments
In the fourth quarter of 2014, the Company wrote off the net book values of three assets, resulting in a pretax charge against income of $2,287,000 for the three and twelve months ended December 31, 2014. All three assets were part of the Company’s Surfactant segment, although the write-off charges were excluded from Surfactants segment operating results. At the Company’s Singapore location, $1,316,000 of engineering costs for an asset expansion project were reversed out of the Company’s construction-in-process account and into expense because management determined that, given the business environment at that time, the magnitude of the project could no longer be economically justified. At the Company’s Millsdale, Illinois, plant, a reactor used to manufacture certain surfactant products was no longer required and was retired and removed from service. The book value of the asset was $714,000. The remaining $257,000 of impairment charges related to an administrative building at the Company’s United Kingdom site that was vacated and abandoned in place.
23. Customer Claim Losses
In the fourth quarter of 2016, the Company reached negotiated settlements for two customer claims which alleged that product manufactured by the Company caused performance problems with the customers’ products. The combined amount of the negotiated settlements was $7,367,000, which was recorded as a reduction of net sales in the year ended December 31, 2016. Both claims related to the Company’s Surfactant segment. The Company is in discussions with its insurance carriers to determine whether these losses are covered under the Company’s insurance policies. No expected benefits from insurance recovery were recorded for these incidents in 2016.
82
24. Statement of Cash Flows – Noncash Investing and Financing Activities
Noncash investing activities included liabilities (accounts payable) incurred for fixed asset acquisitions of approximately $10,410,000, $9,515,000 and $17,797,000 that were unpaid at December 31, 2016, 2015 and 2014, respectively. Noncash investing activities also included $4,459,000 for unpaid working capital adjustments related to the Company’s 2016 acquisitions in Brazil (see Note 20). Noncash financing activities were immaterial for the years ended December 31, 2016, 2015 and 2014.
25. TIORCO, LLC Joint Venture
In October 2015, the Company and its partner, Nalco Company (a subsidiary of Ecolab Inc.), made the decision to dissolve their equally owned and operated TIORCO, LLC (TIORCO) enhanced oil recovery joint venture. As a result of the dissolution, TIORCO incurred fourth quarter 2015 exit costs, which included termination pay, lease termination costs and asset impairments. The Company’s share of the exit costs was $2,356,000, which was reported in the ‘Loss from equity in joint venture’ line of the consolidated statement of income for the year ended December 31, 2015. The Company made a final cash investment of $2,900,000 to TIORCO during the three-month period ended March 31, 2016, to fund the exit costs and other final cash requirements for dissolving the joint venture. Legal dissolution of TIORCO is finalized.
83
Selected Quarterly Financial Data
(In thousands, except per share data)
Unaudited
|
|
|
2016 |
|
|||||||||||||||||
|
Quarter |
|
First |
|
|
Second |
|
|
Third |
|
|
Fourth |
|
|
Year |
|
|||||
|
Net Sales |
|
$ |
445,897 |
|
|
$ |
454,603 |
|
|
$ |
445,030 |
|
|
$ |
420,636 |
|
|
$ |
1,766,166 |
|
|
Gross Profit |
|
|
93,499 |
|
|
|
92,931 |
|
|
|
83,395 |
|
|
|
68,720 |
|
|
|
338,545 |
|
|
Operating Income |
|
|
44,607 |
|
|
|
42,916 |
|
|
|
28,738 |
|
|
|
9,932 |
|
|
|
126,193 |
|
|
Interest, net |
|
|
(3,614 |
) |
|
|
(3,417 |
) |
|
|
(2,824 |
) |
|
|
(3,350 |
) |
|
|
(13,205 |
) |
|
Income Before Income Taxes |
|
|
40,468 |
|
|
|
39,196 |
|
|
|
27,143 |
|
|
|
7,009 |
|
|
|
113,816 |
|
|
Net Income (a) |
|
|
27,919 |
|
|
|
28,501 |
|
|
|
21,367 |
|
|
|
8,411 |
|
|
|
86,198 |
|
|
Net Income Attributable to Stepan Company (a) |
|
|
27,916 |
|
|
|
28,496 |
|
|
|
21,362 |
|
|
|
8,417 |
|
|
|
86,191 |
|
|
Per Diluted Share (a) |
|
|
1.22 |
|
|
|
1.24 |
|
|
|
0.92 |
|
|
|
0.36 |
|
|
|
3.73 |
|
|
|
|
2015 |
|
|||||||||||||||||
|
Quarter |
|
First |
|
|
Second |
|
|
Third |
|
|
Fourth |
|
|
Year |
|
|||||
|
Net Sales |
|
$ |
460,451 |
|
|
$ |
452,414 |
|
|
$ |
444,011 |
|
|
$ |
419,291 |
|
|
$ |
1,776,167 |
|
|
Gross Profit |
|
|
76,442 |
|
|
|
79,512 |
|
|
|
77,598 |
|
|
|
74,689 |
|
|
|
308,241 |
|
|
Operating Income |
|
|
35,178 |
|
|
|
28,595 |
|
|
|
38,794 |
|
|
|
20,223 |
|
|
|
122,790 |
|
|
Interest, net |
|
|
(4,054 |
) |
|
|
(2,869 |
) |
|
|
(3,837 |
) |
|
|
(3,773 |
) |
|
|
(14,533 |
) |
|
Income Before Income Taxes |
|
|
30,536 |
|
|
|
24,146 |
|
|
|
33,113 |
|
|
|
15,061 |
|
|
|
102,856 |
|
|
Net Income |
|
|
21,286 |
|
|
|
16,941 |
|
|
|
24,934 |
|
|
|
12,876 |
|
|
|
76,037 |
|
|
Net Income Attributable to Stepan Company |
|
|
21,270 |
|
|
|
16,914 |
|
|
|
24,912 |
|
|
|
12,872 |
|
|
|
75,968 |
|
|
Per Diluted Share |
|
|
0.93 |
|
|
|
0.74 |
|
|
|
1.09 |
|
|
|
0.56 |
|
|
|
3.32 |
|
|
|
(a) |
The amounts for net income, net income attributable to Stepan Company and net income attributable to Stepan Company per diluted share for the first, second and third quarters of 2016 have been changed from the amounts originally reported as a result of the Company’s early adoption of ASU No. 2016-9, Compensation – Stock Compensation (Topic 718): Improvement to Employee Share-Based Payment Accounting. See Note 1 for additional information regarding ASU No. 2016-9. Below are the originally reported amounts for the items that changed: |
|
|
|
|
2016 |
|
|
|||||||||||
|
(In thousands, except per share data) |
|
First |
|
|
|
Second |
|
|
|
Third |
|
|
|||
|
|
|
|
|
|
|
|
|
|
|
|
|
|
|
|
|
|
Net Income |
|
$ |
27,657 |
|
|
|
$ |
27,870 |
|
|
|
$ |
20,432 |
|
|
|
Net Income Attributable to Stepan Company |
|
|
27,654 |
|
|
|
|
27,865 |
|
|
|
|
20,427 |
|
|
|
Per Diluted Share |
|
|
1.21 |
|
|
|
|
1.21 |
|
|
|
|
0.89 |
|
|
84
Item 9. Changes in and Disagreements with Accountants on Accounting and Financial Disclosure
None
Item 9A. Controls and Procedures
|
|
a. |
Evaluation of Disclosure Controls and Procedures |
We have conducted an evaluation of the effectiveness of the design and operation of our disclosure controls and procedures, as defined in Rules 13a-15(e) and 15d-15(e) under the Securities Exchange Act of 1934, as amended (the “Exchange Act”), as of December 31, 2016. Based on this evaluation of our disclosure controls and procedures, our Chief Executive Officer and our Chief Financial Officer have concluded that our disclosure controls and procedures were effective as of December 31, 2016, such that the information required to be disclosed in our Securities and Exchange Commission reports is recorded, processed, summarized and reported within the time periods specified by the rules and forms of the Exchange Act and is accumulated and communicated to management, including our Chief Executive Officer and our Chief Financial Officer, as appropriate to allow timely decisions regarding required disclosures.
|
|
b. |
Management’s Annual Report on Internal Control over Financial Reporting |
The management of the Company is responsible for establishing and maintaining adequate internal control over financial reporting. The Company’s internal control system was designed to provide reasonable assurance to the Company’s management and board of directors regarding the preparation and fair presentation of published financial statements.
All internal control systems, no matter how well designed, have inherent limitations. Therefore, even those systems determined to be effective can provide only reasonable assurance with respect to financial statement preparation and presentation.
The Company’s management assessed the effectiveness of the Company’s internal control over financial reporting as of December 31, 2016. In making this assessment, it used the criteria set forth by the Committee of Sponsoring Organizations of the Treadway Commission (COSO) in Internal Control – Integrated Framework (2013). Based on our assessment we believe that, as of December 31, 2016, the Company’s internal controls over financial reporting were effective based on those criteria.
The Company’s independent registered public accounting firm that audited the financial statements included in this Form 10-K has issued an attestation report on the Company’s internal control over financial reporting. This report follows:
|
|
c. |
Report of Independent Registered Public Accounting Firm |
To the Board of Directors and Stockholders of
Stepan Company
Northfield, Illinois
We have audited the internal control over financial reporting of Stepan Company and subsidiaries (the “Company”) as of December 31, 2016, based on criteria established in Internal Control — Integrated Framework (2013) issued by the Committee of Sponsoring Organizations of the Treadway Commission. The Company’s management is responsible for maintaining effective internal control over financial reporting and for its assessment of the effectiveness of internal control over financial reporting, included in the accompanying Management’s Annual Report on Internal Control over Financial Reporting. Our responsibility is to express an opinion on the Company’s internal control over financial reporting based on our audit.
We conducted our audit in accordance with the standards of the Public Company Accounting Oversight Board (United States). Those standards require that we plan and perform the audit to obtain reasonable assurance about whether effective internal control over financial reporting was maintained in all material respects. Our audit included obtaining an understanding of internal control over financial reporting, assessing the risk that a material weakness exists, testing and evaluating the design and operating effectiveness of internal control based on the assessed risk, and performing such other procedures as we considered necessary in the circumstances. We believe that our audit provides a reasonable basis for our opinion.
A company's internal control over financial reporting is a process designed by, or under the supervision of, the company's principal executive and principal financial officers, or persons performing similar functions, and effected by the company's board of directors, management, and other personnel to provide reasonable assurance regarding the reliability of financial reporting and the preparation of financial statements for external purposes in accordance with generally accepted accounting principles. A company's internal control over financial reporting includes those policies and procedures that (1) pertain to the maintenance of records that, in reasonable detail, accurately and fairly reflect the transactions and dispositions of the assets of the company; (2) provide reasonable assurance that transactions are recorded
85
as necessary to permit preparation of financial statements in accordance with generally accepted accounting principles, and that receipts and expenditures of the company are being made only in accordance with authorizations of management and directors of the company; and (3) provide reasonable assurance regarding prevention or timely detection of unauthorized acquisition, use, or disposition of the company's assets that could have a material effect on the financial statements.
Because of the inherent limitations of internal control over financial reporting, including the possibility of collusion or improper management override of controls, material misstatements due to error or fraud may not be prevented or detected on a timely basis. Also, projections of any evaluation of the effectiveness of the internal control over financial reporting to future periods are subject to the risk that the controls may become inadequate because of changes in conditions, or that the degree of compliance with the policies or procedures may deteriorate.
In our opinion, the Company maintained, in all material respects, effective internal control over financial reporting as of December 31, 2016, based on the criteria established in Internal Control — Integrated Framework (2013) issued by the Committee of Sponsoring Organizations of the Treadway Commission.
We have also audited, in accordance with the standards of the Public Company Accounting Oversight Board (United States), the consolidated financial statements as of and for the year ended December 31, 2016 of the Company and our report dated February 24, 2017 expressed an unqualified opinion on those financial statements.
|
/s/ Deloitte & Touche LLP |
|
DELOITTE & TOUCHE LLP |
Chicago, Illinois
February 24, 2017
|
|
d. |
Changes in Internal Control Over Financial Reporting |
There were no changes in the Company’s internal controls over financial reporting (as defined in Rule 13a-15(f) under the Exchange Act) that occurred during the quarter ended December 31, 2016, that have materially affected, or are reasonably likely to materially affect, our internal control over financial reporting.
On February 21, 2017, the Compensation and Development Committee of the Board of Directors of the Company approved amended forms of the Non-Qualified Stock Option Agreement and the Stock Appreciation Rights Agreement (the “Form Award Agreements”) under the Stepan Company 2011 Incentive Compensation Plan, as amended (the “Plan”). The Form Award Agreements were amended to provide that future awards made pursuant to such agreements will vest ratably over a three-year period. The Form Award Agreements did not include any other material changes.
The foregoing summary is qualified in its entirety by the complete texts of the Form Award Agreements, which are attached as Exhibits 10.14 and 10.18 to this Annual Report on Form 10-K and incorporated herein by reference.
86
Item 10. Directors, Executive Officers and Corporate Governance
|
|
(a) |
Directors |
See the Company’s Proxy Statement for the Annual Meeting of Stockholders to be held April 25, 2017, for information on the Directors of the Registrant, which is incorporated by reference herein.
|
|
(b) |
Executive Officers |
See “Executive Officers of the Registrant” in Part I above for the identification of the Executive Officers of the Registrant. See the Company’s Proxy Statement for the Annual Meeting of Stockholders to be held April 25, 2017, for other information on Executive Officers of the Registrant, which is incorporated by reference herein.
|
|
(c) |
Audit Committee Financial Expert |
See the Company’s Proxy Statement for the Annual Meeting of Stockholders to be held April 25, 2017, for information on the Company’s Audit Committee Financial Expert, which is incorporated by reference herein.
|
|
(d) |
Code of Conduct7 |
See the Company’s Proxy Statement for the Annual Meeting of Stockholders to be held April 25, 2017, for information on the Company’s Code of Conduct, which is incorporated by reference herein.
Item 11. Executive Compensation
See the Company’s Proxy Statement for the Annual Meeting of Stockholders to be held April 25, 2017, for information on the Compensation of Executive Officers and Directors, which is incorporated by reference herein.
Item 12. Security Ownership of Certain Beneficial Owners and Management and Related Stockholder Matters
See the Company’s Proxy Statement for the Annual Meeting of Stockholders to be held April 25, 2017, for information on Security Ownership, which is incorporated by reference herein.
Item 13. Certain Relationships and Related Transactions, and Director Independence
See the Company’s Proxy Statement for the Annual Meeting of Stockholders to be held April 25, 2017, for information on Transactions with Related Persons, Promoters and Certain Control Persons and for Corporate Governance Principles and Board Matters, which are incorporated by reference herein.
Item 14. Principal Accounting Fees and Services
See the Company’s Proxy Statement for the Annual Meeting of Stockholders to be held April 25, 2017, for information on Accounting and Auditing Matters, which is incorporated by reference herein.
87
Item 15. Exhibits, Financial Statement Schedules
|
|
(a) |
Financial Statements |
See Item 8 for the Consolidated Financial Statements and supplementary data included in this Form 10-K.
|
|
(b) |
Exhibits |
See Exhibit Index filed herewith
None
88
Pursuant to the requirements of Section 13 or 15(d) of the Securities Exchange Act of 1934, the Registrant has duly caused this report to be signed on its behalf by the undersigned, thereunto duly authorized.
|
STEPAN COMPANY |
||
|
|
|
|
|
By: |
|
/s/ Scott D. Beamer |
|
|
|
Scott D. Beamer Vice President and Chief Financial Officer |
February 24, 2017
Pursuant to the requirements of the Securities Exchange Act of 1934, this report has been signed below by the following persons on behalf of the Registrant and in the capacities and on the dates indicated.
|
/s/ F. Quinn Stepan, Jr. |
|
Chairman, President and Chief Executive Officer |
|
February 24, 2017 |
|
F. Quinn Stepan, Jr. |
|
(Principal Executive Officer) |
|
|
|
|
|
|
||
|
/s/ Scott D. Beamer |
|
Vice President and Chief Financial Officer |
|
February 24, 2017 |
|
Scott D. Beamer |
|
(Principal Financial and Accounting Officer) |
|
|
|
|
|
|
||
|
/s/ Michael R. Boyce |
|
Director |
|
February 24, 2017 |
|
Michael R. Boyce |
|
|
|
|
|
|
|
|
||
|
/s/ Randall S. Dearth |
|
Director |
|
February 24, 2017 |
|
Randall S. Dearth |
|
|
|
|
|
|
|
|
||
|
/s/ Joaquin Delgado |
|
Director |
|
February 24, 2017 |
|
Joaquin Delgado |
|
|
|
|
|
|
|
|
||
|
/s/ Gregory E. Lawton |
|
Director |
|
February 24, 2017 |
|
Gregory E. Lawton |
|
|
|
|
|
|
|
|
||
|
/s/ Jan Stern Reed |
|
Director |
|
February 24, 2017 |
|
Jan Stern Reed |
|
|
|
|
|
|
|
|
||
|
/s/ F. Quinn Stepan |
|
Director |
|
February 24, 2017 |
|
F. Quinn Stepan |
|
|
||
|
|
|
|
||
|
/s/ Edward J. Wehmer |
|
Director |
|
February 24, 2017 |
|
Edward J. Wehmer |
|
|
|
|
Scott D. Beamer, pursuant to powers of attorney executed by each of the directors and officers listed above, does hereby execute this report on behalf of each of such directors and officers in the capacity in which the name of each appears above.
|
February 24, 2017 |
|
/s/ Scott D. Beamer |
|
|
|
Scott D. Beamer |
|
Exhibit No. |
|
Description |
|
|
|
|
|
3.1 |
|
Restated Certificate of Incorporation of Stepan Company, filed October 21, 2013, with the State of Delaware (filed with the Company’s Quarterly Report on Form 10-Q for the quarter ended September 30, 2013 (File No. 001-4462), and incorporated herein by reference.) |
|
|
|
|
|
3.2 |
|
Amended and Restated Bylaws of Stepan Company (Amended as of November 13, 2015) (filed with the Company’s Current Report on Form 8-K filed on November 17, 2015 (File No. 001-4462), and incorporated herein by reference.) |
|
|
|
|
|
10.1 |
|
Stepan Company Directors’ Deferred Compensation Plan amended and restated as of January 1, 2005 (filed with the Company’s Annual Report on Form 10-K for the year ended December 31, 2006 (File No. 001-4462), and incorporated herein by reference) |
|
|
|
|
|
10.2 |
|
First Amendment of the Stepan Company Directors’ Deferred Compensation Plan (filed with the Company’s Annual Report on Form 10-K for the year ended December 31, 2008 (File No. 001-4462), and incorporated herein by reference) |
|
|
|
|
|
10.3+ |
|
Management Incentive Plan (As Amended and Restated Effective January 1, 2015) (filed with the Company’s Quarterly Report on Form 10-Q for the quarter ended June 30, 2015 (File No. 001-4462), and incorporated herein by reference) |
|
|
|
|
|
10.4 |
|
Settlement Agreement, which provided information with respect to the Company’s agreement with the United States regarding environmental remediation work to be completed at Stepan’s site in Maywood, New Jersey (filed with the Company’s Current Report on Form 8-K filed on November 18, 2004 (File No. 001-4462), and incorporated herein by reference) |
|
|
|
|
|
10.5+ |
|
Stepan Company 2006 Incentive Compensation Plan (filed with the Company’s Proxy Statement on Schedule 14A filed on March 23, 2006 (File No. 001-4462), and incorporated herein by reference) |
|
|
|
|
|
10.6 |
|
Form of Non-Employee Director Non-Qualified Stock Option Agreement under Stepan Company 2006 Incentive Compensation Plan (filed with the Company’s Current Report on Form 8-K filed on April 27, 2006 (File No. 001-4462), and incorporated herein by reference) |
|
|
|
|
|
10.7+ |
|
Form of Non-Qualified Stock Option Agreement under Stepan Company 2006 Incentive Compensation Plan (filed with the Company’s Current Report on Form 8-K filed on February 16, 2007 (File No. 001-4462), and incorporated herein by reference) |
|
|
|
|
|
10.8+ |
|
First Amendment of the Stepan Company 2006 Incentive Compensation Plan (filed with the Company’s Annual Report on Form 10-K for the year ended December 31, 2008 (File No. 001-4462), and incorporated herein by reference) |
|
|
|
|
|
10.9+ |
|
Second Amendment of the Stepan Company 2006 Incentive Compensation Plan (filed with the Company’s Annual Report on Form 10-K for the year ended December 31, 2009 (File No. 001-4462), and incorporated herein by reference) |
|
|
|
|
|
10.10+ |
|
Third Amendment of the Stepan Company 2006 Incentive Compensation Plan (filed with the Company’s Annual Report on Form 10-K for the year ended December 31, 2009 (File No. 001-4462), and incorporated herein by reference) |
|
|
|
|
|
10.11+ |
|
Fourth Amendment of the Stepan Company 2006 Incentive Compensation Plan (filed with the Company’s Annual Report on Form 10-K for the year ended December 31, 2009 (File No. 001-4462), and incorporated herein by reference) |
|
|
|
|
*Filed herewith
+Management contract or compensatory plan