Attached files
Table of Contents
UNITED STATES
SECURITIES AND EXCHANGE COMMISSION
Washington, D.C. 20549
FORM 10-K
(MARK ONE)
| x | ANNUAL REPORT PURSUANT TO SECTION 13 OR 15(d) OF THE SECURITIES EXCHANGE ACT OF 1934 |
FOR THE FISCAL YEAR ENDED DECEMBER 31, 2010
OR
| ¨ | TRANSITION REPORT PURSUANT TO SECTION 13 OR 15(d) OF THE SECURITIES EXCHANGE ACT OF 1934 |
FOR THE TRANSITION PERIOD FROM TO
Commission File Number 1-4462
STEPAN COMPANY
(Exact name of registrant as specified in its charter)
| Delaware | 36-1823834 | |
| (State or other jurisdiction of incorporation or organization) |
(I.R.S. Employer Identification Number) | |
| Edens and Winnetka Road, Northfield, Illinois | 60093 | |
| (Address of principal executive offices) | (Zip Code) | |
Registrant’s telephone number including area code: 847-446-7500
Securities registered pursuant to Section 12 (b) of the Act:
| Title of Each Class |
Name of Each Exchange on Which Registered | |
| Common Stock, $1 par value | New York Stock Exchange Chicago Stock Exchange | |
| 5 1/2% Convertible Preferred Stock, no par value | New York Stock Exchange Chicago Stock Exchange |
Securities registered pursuant to Section 12 (g) of the Act:
None
Indicate by check mark if the registrant is a well-known seasoned issuer, as defined in Rule 405 of the Securities Act Yes ¨ No x
Indicate by check mark if the registrant is not required to file reports pursuant to Section 13 or Section 15(d) of the Act Yes ¨ No x
Indicate by check mark whether the registrant (1) has filed all reports required to be filed by Section 13 or 15(d) of the Securities Exchange Act of 1934 during the preceding 12 months (or for such shorter period that the registrant was required to file such reports), and (2) has been subject to such filing requirements for the past 90 days. Yes x No ¨
Indicate by check mark if disclosure of delinquent filers pursuant to Item 405 of Regulation S-K is not contained herein, and will not be contained, to the best of registrant’s knowledge, in definitive proxy or information statements incorporated by reference in part III of this Form 10-K or any amendment to this Form 10-K. ¨.
Indicate by check mark whether the registrant has submitted electronically and posted on its corporate Web site, if any, every Interactive Data File required to be submitted and posted pursuant to Rule 405 of Regulation S-T (§232.405 of this chapter) during the preceding 12 months (or for such shorter period that the registrant was required to submit and post such files). Yes ¨ No ¨
Indicate by check mark whether the registrant is a large accelerated filer, an accelerated filer, a non-accelerated filer or a smaller reporting company. See definitions of “large accelerated filer”, “accelerated filer” and “smaller reporting company” in Rule 12b-2 of the Exchange Act. (Check one):
| Large accelerated filer | ¨ | Accelerated filer | x | |||
| Non-accelerated filer | ¨ |
Smaller reporting company | ¨ | |||
Indicate by check mark whether the registrant is a shell company (as defined in Rule 12b-2 of the Exchange Act) Yes ¨ No x
Aggregate market value at June 30, 2010, of voting and non-voting common stock held by nonaffiliates of the registrant: $563,689,385*
Number of shares outstanding of each of the registrant’s classes of common stock as of January 31, 2011:
| Class |
Outstanding at January 31, 2011 | |
| Common Stock, $1 par value | 10,107,948 |
Documents Incorporated by Reference
| Part of Form 10-K |
Document Incorporated | |
| Part III, Items 10-14 | Proxy Statement for Annual Meeting of Stockholders to be held May 3, 2011. |
| * | Based on reported ownership by all directors, officers and beneficial owners of more than 5% of registrant’s voting stock. However, this determination does not constitute an admission of affiliate status for any of these holders. |
Table of Contents
ANNUAL REPORT ON FORM 10-K
December 31, 2010
Table of Contents
PART I
| Item 1. | Business |
Stepan Company, which was incorporated under the laws of the state of Delaware on February 19, 1959, and its subsidiaries (the “Company”) produce specialty and intermediate chemicals, which are sold to other manufacturers and then made into a variety of end products. The Company has three reportable segments: surfactants, polymers and specialty products.
Surfactants refer to chemical agents that affect the interaction between two surfaces; they can provide actions such as detergency (i.e., the ability of water to remove soil from another surface), wetting and foaming, dispersing, emulsification (aiding two dissimilar liquids to mix), demulsification, viscosity modifications and biocidal disinfectants. Surfactants are the basic cleaning agent in detergents for washing clothes, dishes, carpets, fine fabrics, floors and walls. Surfactants are also used for the same purpose in shampoos and conditioners, fabric softeners, toothpastes, cosmetics and other personal care products. Commercial and industrial applications include emulsifiers for agricultural products, emulsion polymers such as floor polishes and latex foams and coatings, wetting and foaming agents for wallboard manufacturing, surfactants for enhanced oil recovery and biodiesel. In July 2010, the Company purchased the manufacturing assets of Peter Cremer GmbH located on Singapore’s Jurong Island. The Company plans to install methyl esters fractionation capability on the Singapore site. Methyl esters are a core building block of the Company’s surfactants segment. Production at the site is expected to begin in April 2012. In July 2010, the Company acquired controlling interest in the Company’s Stepan Philippines Inc. (“SPI”) joint venture. The ownership interest of SPI was increased from 50 percent to 88.8 percent. SPI produces laundry and cleaning products, fabric softeners and functional surfactants for the Philippines, Southeast Asia and other countries.
Polymers, which include two primary product lines, polyols and phthalic anhydride, are used in multiple types of specialty polymers. In July 2010, the Company’s Stepan Europe subsidiary acquired 100 percent of the shares of Alfa Systems Sp. z o.o. The purchase included a plant located in Brzeg Dolny, Poland, which specializes in the manufacture of aromatic polyester polyol from recycled polyethylene terephthalate.
Specialty products include chemicals used in food, flavoring and pharmaceutical applications.
MARKETING AND COMPETITION
Principal markets for surfactants are manufacturers of detergents, shampoos, lotions, fabric softeners, toothpastes and cosmetics. In addition, surfactants are sold to the producers of emulsifiers, lubricating products and biodiesel fuel. The Company also is a principal provider of polymers used in construction, refrigeration, automotive, boating and other consumer product industries. Polymer products are also used in the flexible foam industry as well as the coatings, adhesives, sealants and elastomer industries. Specialty products are used primarily by food and pharmaceutical manufacturers.
The Company does not sell directly to the retail market, but sells to a wide range of manufacturers in many industries and has many competitors. The principal methods of competition are product performance, price, technical assistance and adaptability to the specific needs of individual customers. These factors allow the Company to compete on a basis other than price alone, reducing the severity of competition as experienced in the sales of commodity
1
Table of Contents
chemicals having identical performance characteristics. The Company is a leading merchant producer of surfactants in the United States. In the case of surfactants, much of the Company’s competition comes from several large global and regional producers and the internal divisions of larger customers. In the manufacture of polymers, the Company competes with the chemical divisions of several large companies, as well as with other small specialty chemical manufacturers. In specialty products, the Company competes with several large firms plus numerous small companies.
MAJOR CUSTOMER AND BACKLOG
The Company does not have any one customer whose business represents more than 10 percent of the Company’s consolidated revenue. Most of the Company’s business is essentially on the “spot delivery basis” and does not involve a significant backlog. The Company does have contract arrangements with certain customers, but purchases are generally contingent on purchaser requirements.
ENERGY SOURCES
Substantially all of the Company’s manufacturing plants operate on electricity and interruptable natural gas. During peak heating demand periods, gas service to all plants may be temporarily interrupted for varying periods ranging from a few days to several months. The plants operate on fuel oil during these periods of interruption. The Company’s domestic operations and its wholly-owned subsidiaries have not experienced any plant shutdowns or adverse effects upon its business in recent years that were caused by a lack of available energy sources, other than temporary service interruptions brought on by mechanical failure.
RAW MATERIALS
The most important raw materials used by the Company are petroleum or plant based. For 2011, the Company has contracts with suppliers that cover the majority of its forecasted requirements for major raw materials and is not substantially dependent upon any one supplier.
RESEARCH AND DEVELOPMENT
The Company maintains an active research and development program to assist in the discovery and commercialization of new knowledge with the intent that such efforts will be useful in developing a new product or in bringing about a significant improvement to an existing product or process. Total expenses for research and development during 2010, 2009 and 2008 were $24.2 million, $23.4 million, and $22.1 million, respectively. The remainder of research, development and technical service expenses reflected on the consolidated statements of income relates to technical services, which include routine product testing, analytical methods development and sales support service.
2
Table of Contents
ENVIRONMENTAL COMPLIANCE
Compliance with applicable federal, state and local regulations regarding the discharge of materials into the environment, or otherwise relating to the protection of the environment, resulted in capital expenditures by the Company of approximately $1.6 million during 2010. These expenditures represented approximately two percent of the Company’s total 2010 capital expenditures. Capitalized environmental expenditures are depreciated and charged on a straight-line basis to pretax earnings over their estimated useful lives, which are typically 10 years. Recurring costs associated with the operation and maintenance of facilities for waste treatment and disposal and managing environmental compliance in ongoing operations at our manufacturing locations were approximately $15.7 million in 2010. Compliance with such regulations is not expected to have a material adverse effect on the Company’s earnings and competitive position in the foreseeable future.
EMPLOYMENT
At December 31, 2010 and 2009, the Company employed 1,768 and 1,594 persons, respectively.
FOREIGN OPERATIONS AND REPORTING SEGMENTS
See Note 18, Segment Reporting, of the Consolidated Financial Statements (Item 8 of this Form 10-K).
WEBSITE
The Company’s website address is www.stepan.com. The Company makes available free of charge on or through its website its code of conduct, annual report on Form 10-K, quarterly reports on Form 10-Q, current reports on Form 8-K, and all amendments to those reports as soon as reasonably practicable after such material is electronically filed with or furnished to the Securities and Exchange Commission. The website also includes the Company’s corporate governance guidelines and the charters for the audit, nominating and corporate governance and compensation and development committees of the Board of Directors.
3
Table of Contents
| Item 1A. | Risk Factors |
The following discussion identifies the most significant factors that may adversely affect the Company’s business, financial condition, results of operations and cash flows. These and other factors, many of which are beyond the Company’s control, may cause future results of operations to differ materially from those currently expected or desired. The following information should be read in conjunction with Part II, Item 7, Management Discussion and Analysis and the consolidated financial statements and related notes included in this Form 10-K.
The Company’s forecasts and other forward-looking statements are based on a variety of assumptions and estimates that are subject to significant uncertainties. The Company’s performance may not be consistent with these forecasts or forward-looking statements.
From time to time in press releases and other documents filed with the SEC, the Company publishes forecasts or other forward-looking statements regarding its future results, including estimated revenues, net earnings and other operating and financial metrics.
Any forecast or forward-looking statement related to the Company’s future performance reflects various assumptions and estimates, which are subject to significant uncertainties, and the achievement of any forecast or forward-looking statement depends on numerous risks and other factors, including those described in this Annual Report on Form 10-K, many of which are beyond the Company’s control. If these assumptions and estimates prove to be incorrect, or any of the risks or other factors occur, then the Company’s performance may not be consistent with these forecasts or forward-looking statements.
You are cautioned not to rely solely on such forward-looking statements, but instead are encouraged to utilize the entire mix of publicly available historical and forward-looking information, as well as other available information affecting the Company, the Company’s services and the Company’s industry, when evaluating the Company’s forecasts and other forward-looking statements relating to the Company’s operations and financial performance.
Natural disasters, including earthquakes, fires and flooding, work stoppages and terrorism could severely damage the Company’s systems and facilities or interrupt the Company’s operations and result in a material adverse effect on the Company’s business, financial position, results of operations and cash flows.
Natural disasters, such as fires, flooding, earthquakes and tornadoes, power loss, break-ins, work stoppages, acts of war, terrorism or other similar events, could severely damage the Company’s systems and facilities or interrupt the Company’s operations, potentially resulting in temporary or permanent loss of the Company’s manufacturing capability. Some of the Company’s products cannot currently be made, or made in the volume required, at more than one of the Company’s locations. For some of these products, the Company has access to external market suppliers, but the Company cannot guarantee that these products will be available to it in amounts sufficient to meet its requirements or at a cost that is competitive with the Company’s cost of manufacturing these products. While the Company maintains insurance coverage, there can be no assurance that it would be sufficient to cover any or all losses resulting from the occurrence of any of these events or that carriers would not deny coverage for these losses even if they are insured. There is also a risk, beyond the reasonable control of the Company, that an insurance carrier may not have the financial resources to cover an insurable loss. As a result, the occurrence of any of these events could have a material adverse effect on the Company’s business, financial position, results of operations and cash flows.
4
Table of Contents
The Company faces significant global competition in each of its operating segments. If the Company cannot successfully compete in the marketplace, its profitability, business, financial position, results of operations and cash flows may be materially and adversely affected.
The Company faces significant competition from numerous global companies as well as national, regional and local companies within some or all of its product categories in each market it serves. In addition, some of the Company’s customers have internal manufacturing capabilities that allow them to achieve make-versus-buy economics, which may result at times in the Company gaining or losing business with these customers in volumes that could adversely affect its profitability.
To achieve expected profitability levels, the Company must, among other things, maintain the service levels, product quality and performance and competitive pricing necessary to retain existing customers and attract new customers. The Company’s inability to do so could place it at a competitive disadvantage relative to its competitors, and if the Company cannot successfully compete in the marketplace, its business, financial position, results of operations and cash flows may be materially and adversely affected.
The volatility of raw material, natural gas and electricity costs as well as any disruption in their supply may materially and adversely affect the Company’s business, financial position, results of operations and cash flows.
The costs of raw materials, natural gas and electricity represent a substantial portion of the Company’s operating costs. The principal raw materials used in the Company’s products are petroleum-based or plant-based. Natural gas is used in the Company’s manufacturing sites primarily to generate steam for its manufacturing processes. The prices of many of these raw materials have recently been very volatile. These fluctuations in prices may be affected by supply and demand factors, such as general economic conditions, manufacturers’ ability to meet demand, restrictions on the transport of raw material (some of which may be viewed as hazardous), currency exchange rates, political instability and terrorist attacks, all of which are beyond the Company’s control. The Company may not be able to pass increased raw material and natural gas prices on to customers through increases in product prices as a result of arrangements the Company has with certain customers and competitive pressures in the market. If the Company is unable to minimize the effects of increased raw material and energy costs or pass such increased costs on to customers, its business, financial position, results of operations and cash flows may be materially and adversely affected.
5
Table of Contents
The Company relies heavily on third party transportation to deliver raw materials to Company manufacturing facilities and ship products to Company customers. Disruptions in transportation or significant changes in transportation costs could affect the Company’s operating results.
The Company relies heavily on railroads, barges and other over-the-road shipping methods to transport raw materials to its manufacturing facilities and to ship finished product to customers. Transport operations are exposed to various risks, such as extreme weather conditions, work stoppages and operating hazards, as well as interstate transportation regulations. If the Company is unable to ship finished product or unable to obtain raw materials due to transportation problems, or if there are significant changes in the cost of these services, the Company may not be able to arrange efficient alternatives and timely means to obtain raw materials or ship product, which could result in an adverse effect on Company revenues, costs and operating results.
Customer product reformulations can reduce the demand for the Company’s products.
The Company’s products are used in a broad range of customer product applications. Customer product reformulations may lead to reduced consumption of Company-produced products or make some Company products unnecessary. It is imperative that the Company develops new products to replace the sales of products that mature and decline in use. The Company’s business, results of operations and cash flows could be materially and adversely affected if the Company is unable to manage successfully the maturation of existing products and the introduction of new products.
If the Company is unable to keep and protect its intellectual property rights, the Company’s ability to compete may be negatively impacted.
The Company relies on intellectual property rights for the manufacture, distribution and sale of its products in all three of its reportable segments. Although most of the Company’s intellectual property rights are registered in the United States and in the foreign countries in which it operates, the Company may not be able to assert these rights successfully in the future or guarantee that they will not be invalidated, circumvented or challenged. Other parties may infringe on the Company’s intellectual property rights, which may dilute the value of such rights. Any infringement on the Company’s intellectual property rights would also likely result in diversion of management’s time and the Company’s resources to protect these rights through litigation or otherwise. In addition, the laws of some foreign countries may not protect the Company’s intellectual property rights to the same extent as the laws of the United States. Any loss of protection of these intellectual property rights could adversely affect the future financial position, results of operations and cash flows of the Company.
The Company is subject to risks related to its operations outside the U.S.
The Company has substantial operations outside the U.S. In the year ended December 31, 2010, the Company’s sales outside of the U.S. constituted approximately 40 percent of the Company’s net sales. In addition to the risks described in this Annual Report on Form 10-K that are common to both the Company’s U.S. and non-U.S. operations, the Company faces, and will continue to face, risks related to the Company’s foreign operations such as:
| • | foreign currency fluctuations; |
6
Table of Contents
| • | unstable political, economic, financial and market conditions; |
| • | import and export license requirements; |
| • | trade restrictions; |
| • | increases in tariffs and taxes; |
| • | high levels of inflation; |
| • | restrictions on repatriating foreign profits back to the U.S.; |
| • | greater difficulty collecting accounts receivable and longer payment cycles; |
| • | less favorable intellectual property laws; |
| • | changes in foreign laws and regulations; and |
| • | changes in labor conditions and difficulties in staffing and managing international operations. |
All of these risks have affected the Company’s business in the past and may have a material adverse effect on the Company’s business, financial position, results of operations and cash flows in the future.
The Company is also exposed to fluctuations in exchange rates. The Company’s results of operations are reported in U.S. dollars. However, outside the U.S., the Company’s sales and costs are denominated in a variety of currencies including the European euro, British pound, Canadian dollar, Mexican peso, Colombian peso, Philippine peso, Brazilian real, Polish zloty and Chinese RMB. Fluctuations in exchange rates may materially and adversely affect the Company’s business, financial position, results of operations and cash flows.
In all jurisdictions in which the Company operates, the Company is also subject to laws and regulations that govern foreign investment, foreign trade and currency exchange transactions. These laws and regulations may limit the Company’s ability to repatriate cash as dividends or otherwise to the U.S. and may limit the Company’s ability to convert foreign currency cash flows into U.S. dollars. A weakening of the currencies in which the Company generates sales relative to the foreign currencies in which the Company’s costs are denominated may lower the Company’s operating profits and cash flows.
We are subject to a variety of environmental, health and safety and product registration laws that expose the Company to potential financial liability and increased operating costs.
The Company’s operations are regulated under a number of federal, state, local and foreign environmental, health and safety laws and regulations that govern, among other things, the discharge of hazardous materials into the air, soil and water as well as the use, handling, storage and disposal of these materials. These laws and regulations include, but are not limited to, the U.S. Clean Air Act, the Clean Water Act, the Resource Conservation and Recovery Act, the Comprehensive Environmental Response, Compensation and Liability Act, as well as analogous state, local and foreign laws, and the Registration, Evaluation, Authorization and Restriction of Chemical Substances Act (REACH). Compliance with these environmental laws and regulations is a major consideration for the Company because the Company uses hazardous
7
Table of Contents
materials in some of the Company’s manufacturing processes. In addition, compliance with environmental laws could restrict the Company’s ability to expand its facilities or require the Company to acquire additional costly pollution control equipment, incur other significant expenses or modify its manufacturing processes. The Company has incurred and will continue to incur capital expenditures and operating costs in complying with these laws and regulations. In addition, because the Company generates hazardous wastes during some of its manufacturing processes, the Company, along with any other entity that disposes or arranges for the disposal of the Company’s wastes, may be subject to financial exposure for costs associated with any investigation and remediation of sites at which the Company has disposed or arranged for the disposal of hazardous wastes if those sites become contaminated, even if the Company fully complied with applicable environmental laws at the time of disposal. In the event that new contamination is discovered, the Company may become subject to additional requirements with respect to existing contamination or the Company’s clean-up obligations.
The Company is also subject to numerous federal, state, local and foreign laws that regulate the manufacture, storage, distribution and labeling of many of the Company’s products, including some of the Company’s disinfecting, sanitizing and antimicrobial products. Some of these laws require the Company to have operating permits for the Company’s production facilities, warehouse facilities and operations. Various federal, state, local and foreign laws and regulations also require the Company to register the Company’s products and to comply with specified requirements with respect to those products. If the Company fails to comply with any of these laws and regulations, it may be liable for damages and the costs of remedial actions in excess of the Company’s reserves, and may also be subject to fines, injunctions or criminal sanctions or to revocation, non-renewal or modification of the Company’s operating permits and revocation of the Company’s product registrations. Any such revocation, modification or non-renewal may require the Company to cease or limit the manufacture and sale of its products at one or more of the Company’s facilities, which may limit or prevent the Company’s ability to meet product demand or build new facilities and may have a material adverse effect on the Company’s business, financial position, results of operations and cash flows. Any such revocation, non-renewal or modification may also result in an event of default under the indenture for the Company’s notes or under the Company’s credit facilities, which, if not cured or waived, may result in the acceleration of all the Company’s indebtedness.
In addition to the costs of complying with environmental, health and safety requirements, the Company has incurred and may incur in the future costs defending against environmental litigation brought by government agencies and private parties. The Company may be a defendant in lawsuits brought by parties in the future alleging environmental damage, personal injury or property damage. A significant judgment against the Company could harm its business, financial position, results of operations and cash flows. Although the Company has insurance that may cover some of these potential losses, there is always uncertainty as to whether such insurance may be available to the Company based on case-specific factors and the specific provisions of the Company’s insurance policies.
The potential cost to the Company relating to environmental, health and safety and product registration matters, including the cost of complying with the foregoing legislation and remediating contamination, is uncertain due to factors such as the unknown magnitude and type of possible contamination and clean-up costs, the complexity and evolving nature of laws and regulations relating to the environment, health and safety and product registration, including those outside of the U.S., and the timing, variable costs and effectiveness of clean-up and compliance methods. Environmental and product registration laws may also become more
8
Table of Contents
stringent over time, imposing greater compliance costs and increasing risks and penalties associated with any violation, as well as restricting or prohibiting the sale of existing or new products, which may also negatively impact the Company’s operating results. Without limiting the foregoing, these laws or regulations may restrict or prohibit the use of non-renewable or carbon-based substances, or impose fees or penalties for the use of these substances. Accordingly, the Company may become subject to additional liabilities and increased operating costs in the future under these laws and regulations. The impact of any such changes, which are unknown at this time, may have a material adverse effect on the Company’s business, financial position, results of operations and cash flows.
Other laws and regulations that apply to the Company may be changed to impose additional requirements beyond those that apply under current laws and regulations, and/or impose additional costs or have negative financial effects on the Company. Such changes, which are unknown at this time and beyond the Company’s reasonable control, could have a material impact on the Company.
The Company’s inability to estimate and maintain appropriate levels of reserves for existing and future contingencies may materially and adversely affect the Company’s business, financial position, results of operations and cash flows.
The levels of reserves maintained by the Company for pending and threatened legal proceedings are estimates based on various assumptions. An adverse ruling or external forces such as changes in the rate of inflation, the regulatory environment and other factors that could prove such assumptions to be incorrect may affect the accuracy of these estimates. Given the uncertainties inherent in such estimates, the Company’s actual liabilities could differ significantly from the amounts the Company reserved to cover any existing and future contingencies. If the Company’s actual liability is higher than estimated or any new legal proceeding is initiated, it could materially and adversely affect the Company’s business, financial position, results of operations and cash flows.
We have a significant amount of indebtedness and may incur additional indebtedness, or need to refinance existing indebtedness, in the future, which may adversely affect the Company’s business and operations.
The Company has a significant amount of indebtedness and may incur additional indebtedness in the future. As of December 31, 2010, the Company had $191.6 million of debt on its balance sheet. U.S. debt included $106.9 million in unsecured promissory notes with maturities extending from 2011 until 2022, $27.0 million in a bank term loan and $11.4 million in other financing obligations. In addition, to provide liquidity, the Company has a $60 million revolving credit facility, under which there were no borrowings and $2.6 million of outstanding letters of credit as of December 31, 2010.
The Company’s foreign subsidiaries also maintain bank term loans and short-term bank lines of credit in their respective countries to meet working capital requirements as well as to fund capital expenditure programs and acquisitions. As of December 31, 2010, the Company’s foreign subsidiaries’ aggregate outstanding debt totaled $46.3 million.
The Company’s current indebtedness and any additional indebtedness incurred in the future may materially and adversely affect its business and operations. For example, it could:
| • | require the Company to dedicate a substantial portion of cash flow from operations to pay principal and interest on the Company’s debt, which would reduce funds available to fund future working capital, capital expenditures and other general operating requirements; |
9
Table of Contents
| • | limit the Company’s ability to borrow funds that may be needed to operate and expand its business; |
| • | limit the Company’s flexibility in planning for or reacting to changes in the Company’s business and the industries in which the Company operates; |
| • | increase the Company’s vulnerability to general adverse economic and industry conditions or a downturn in the Company’s business; and |
| • | place the Company at a competitive disadvantage compared to its competitors that have less debt. |
The Company’s loan agreements contain provisions, which, among others, require maintenance of certain financial ratios and place limitations on additional debt, investments and payment of dividends. Failure to comply with these loan agreements would require debt restructuring that could be materially adverse to the Company’s financial position, results of operations and cash flows. Additionally, any future disruptions in the credit and financial markets may reduce the availability of debt financing or refinancing and increase the costs associated with such financing. If the Company is unable to secure financing on satisfactory terms, or at all, its financial positions, results of operations and cash flows may be adversely affected.
Downturns in certain industries and general economic downturns may have an adverse effect on the Company’s business, financial position, results of operations and cash flows.
Recent disruptions in the credit markets have had a significant negative impact on global financial markets that have resulted in a global economic downturn. Economic downturns adversely affect some users of the variety of end products that are manufactured using the Company’s products and the industries in which end products are used. These users may reduce their volume of purchases of such end products during economic downturns, which would reduce demand for the Company’s products. Additionally, current conditions in the credit markets pose a risk to the overall economy that may impact consumer and customer demand of some of the Company’s products, as well as the Company’s ability to manage normal commercial relationships with its customers, suppliers and creditors. Some of the Company’s customers may not be able to meet the terms of sale and suppliers may not be able to fully perform their contractual obligations due to tighter credit markets or a general slowdown in economic activity.
In the event that the current conditions of the financial and credit markets continue or worsen, or result in a prolonged economic downturn or recession, the Company’s results of operations, cash flows and financial position may be materially and adversely affected.
Various liability claims could materially and adversely affect the Company’s financial position, operating results and cash flows.
The Company may be required to pay for losses or injuries purportedly caused by its products. The Company faces an inherent exposure to various types of claims including general
10
Table of Contents
liability, product liability, toxic tort and environmental (“claims”), among others, if its products, or the end products that are manufactured with the Company’s products, result in property damage, injury or death. In addition, because the Company conducts business in multiple jurisdictions, the Company also faces an inherent exposure to other general claims based on its operations in those jurisdictions and the laws of those jurisdictions, including but not limited to claims arising from its relationship with employees, distributors, agents and customers, and other parties with whom it has a business relationship, directly or indirectly. Many of these claims may be made against the Company even if there is no evidence of a loss from that claim, and these claims may be either made by individual entities, or potentially a group of plaintiffs in a class action. Defending these claims could result in significant legal expenses relating to defense costs and/or damage awards and diversion of management’s time and the Company’s resources. Any claim brought against the Company, net of potential insurance recoveries, could materially and adversely affect the Company’s financial position, results of operations and cash flows.
11
Table of Contents
| Item 1B. | Unresolved Staff Comments |
None
| Item 2. | Properties |
The following properties are owned by the Company:
| Name of Facility |
Location |
Site Size | Product | |||||||
| 1. | Millsdale | Millsdale (Joliet), Illinois |
492 acres | Surfactants/Polymers | ||||||
| 2. | Fieldsboro | Fieldsboro, New Jersey | 45 acres | Surfactants | ||||||
| 3. | Anaheim | Anaheim, California |
8 acres | Surfactants | ||||||
| 4. | Winder | Winder, Georgia |
202 acres | Surfactants | ||||||
| 5. | Maywood | Maywood, New Jersey |
19 acres | Surfactants / Specialty Products | ||||||
| 6. | Stepan France | Grenoble, France |
20 acres | Surfactants | ||||||
| 7. | Stepan Mexico | Matamoros, Mexico |
13 acres | Surfactants | ||||||
| 8. | Stepan Germany | Cologne, Germany |
12 acres | Surfactants/Polymers | ||||||
| 9. | Stepan UK | Stalybridge (Manchester), United Kingdom |
11 acres | Surfactants | ||||||
| 10. | Stepan Colombia | Manizales, Colombia |
5 acres | Surfactants | ||||||
| 11. | Company’s Headquarters and Central Research Laboratories | Northfield, Illinois |
8 acres | N/A | ||||||
| 12. | Company’s Corporate Supply Chain, Human Resources, Legal and Finance Functions | Northbrook, Illinois |
3.25 acres | N/A | ||||||
In addition, Stepan Canada Inc., which manufactures surfactants, is located on a 70 acre leased, with an option to purchase, site in Longford Mills, Ontario, Canada. Also, Stepan Canada Inc. maintains a leased sales office in Burlington, Ontario, Canada. Stepan Mexico maintains a leased sales office in Mexico City, Mexico. Stepan China, a majority-owned joint venture that produces polymers, is located on a four acre leased site in Nanjing, China. Stepan China also maintains a leased sales office in Shanghai, China. Under the terms of the purchase contract for its January 2005 acquisition, Stepan Brazil leases a surfactants manufacturing facility on 27 acres of land in Vespasiano, Minas Gerais, Brazil. At the end of the 10-year lease agreement, the assets will be transferred and assigned to Stepan Brazil. The Company’s 88.8 percent owned joint venture in the Philippines manufactures surfactants on nine acres of land leased under a long term agreement with the Company’s joint venture partner. Stepan Poland operates a polymers manufacturing facility on four acres of leased land in Brzeg Dolny, Poland. Stepan Asia’s manufacturing facility located on Jurong Island, Singapore, will operate on eight acres of leased land.
12
Table of Contents
| Item 3. | Legal Proceedings |
There are a variety of legal proceedings pending or threatened against the Company that occur in the normal course of the Company’s business, the majority of which relate to environmental matters. Some of these proceedings may result in fines, penalties, judgments or costs being assessed against the Company at some future time. The Company’s operations are subject to extensive local, state and federal regulations, including the U.S. Comprehensive Environmental Response, Compensation and Liability Act of 1980 (“CERCLA”) and the Superfund amendments of 1986 (Superfund). Over the years, the Company has received requests for information relative to or has been named by the government as a potentially responsible party at a number of sites where cleanup costs have been or may be incurred under CERCLA and similar state statutes. In addition, damages are being claimed against the Company in general liability actions for alleged personal injury or property damage in the case of some disposal and plant sites. The Company believes that it has made adequate provisions for the costs it may incur with respect to these sites. For most of these sites, the involvement of the Company is expected to be minimal. The most significant sites are described below:
Maywood, New Jersey Site
The Company’s property in Maywood, New Jersey and property formerly owned by the Company adjacent to its current site and other nearby properties (Maywood site) were listed on the National Priorities List in September 1993 pursuant to the provisions of CERCLA because of certain alleged chemical contamination. Pursuant to an Administrative Order on Consent entered into between USEPA and the Company for property formerly owned by the Company, and the issuance of an order by USEPA to the Company for property currently owned by the Company, the Company completed a Remedial Investigation Feasibility Study (RI/FS) in 1994. The Company submitted the Draft Feasibility Study for Soil and Source Areas (Operable Unit 1) in September 2002. In addition, the Company has submitted other documentation and information as requested by USEPA, including a Draft Final FS for Groundwater (Operable Unit 2) in June 2003, additional information regarding groundwater in May 2007, submission of a Draft Feasibility Study for Soil and Groundwater (Operable Units 1 and 2) in March 2009, and additional requested information regarding soil and groundwater in February 2010 and June 2010. The Company also submitted another Draft Feasibility Study for Soil and Groundwater (Operable Units 1 and 2) in September 2010. The Company is awaiting the issuance of a Record of Decision from USEPA. In addition, the Company was informed that certain work included in the remediation cost estimates would not be required. As a result, the Company was able to reduce its remediation liability for this site by $0.8 million in the third quarter of 2010.
The Company believes it has adequate reserves for claims associated with the Maywood site, and has recorded a liability for the estimated probable costs it expects to incur at the Maywood site related to remediation of chemical contamination. However, depending on the results of the ongoing discussions with USEPA, the final cost of such remediation could differ from the current estimates.
In addition, under the terms of a settlement agreement reached on November 12, 2004, the United States Department of Justice and the Company agreed to fulfill the terms of a Cooperative Agreement reached in 1985 under which the United States will take title to and responsibility for radioactive waste removal at the Maywood site, including past and future remediation costs incurred by the United States.
13
Table of Contents
D’Imperio Property Site
During the mid-1970’s, Jerome Lightman and the Lightman Drum Company disposed of hazardous substances at several sites in New Jersey. The Company was named as a potentially responsible party (PRP) in the case United States v. Lightman (1:92-cv-4710 D.N.J.), which involved the D’Imperio Property Site located in New Jersey. In the second quarter of 2007, the Company reached an agreement with respect to the past costs and future allocation percentage in said litigation for costs related to the D’Imperio site, including costs to comply with USEPA’s Unilateral Administrative Orders. The Company paid the settlement amount in the third quarter of 2007. The resolution of the Company’s liability for this litigation did not have a material impact on the financial position, results of operations or cash flows of the Company. In December 2007, the Company received updated remediation cost estimates, which were considered in the Company’s determination of its range of estimated possible losses and reserve balance.
Remediation work is continuing at this site. Based on current information, the Company believes that it has adequate reserves for claims associated with the D’Imperio site. However, actual costs could differ from current estimates.
Ewan Property Site
The case United States v. Lightman (1:92-cv-4710 D.N.J.), described above for the D’Imperio site, also involved the Ewan Property Site located in New Jersey. The agreement described above also included a settlement with respect to the past costs and future allocation percentage in said litigation for costs related to the past costs and allocation percentage at the Ewan site. The Company paid the settlement amount in the third quarter of 2007. The resolution of the Company’s liability for this litigation did not have a material impact on the financial position, results of operations or cash flows of the Company.
In addition, the NJDEP filed a natural resource damages complaint in June 2007 against the Company and other entities regarding the Ewan site. The Company was served with the complaint in May 2008. The parties, including the Company, settled this litigation in the fourth quarter of 2010. The resolution of the Company’s liability for this litigation did not have a material impact on the financial position, results of operations or cash flows of the Company.
There is some monitoring and operational work continuing at the Ewan site. Based on current information, the Company believes that it has adequate reserves for claims associated with the Ewan site. However, actual costs could differ from current estimates.
Lightman Drum Company Superfund Site
The Company received a Section 104(e) Request for Information from USEPA dated March 21, 2000, regarding the Lightman Drum Company Superfund Site located in Winslow Township, New Jersey. The Company responded to this request on May 18, 2000. In addition, the Company received a Notice of Potential Liability and Request to Perform RI/FS dated June 30, 2000, from USEPA. The Company participated in the performance of the RI/FS as a member of the Lightman Yard PRP Group. The RI/FS was performed under an interim allocation.
In the fourth quarter of 2007, the PRPs who agreed to conduct the interim remedial action entered into an Administrative Settlement Agreement and Order on Consent for Removal Action with USEPA, and these PRPs also entered into a Supplemental Lightman Yard Participation and
14
Table of Contents
Interim Funding Agreement to fund the agreed-upon removal action. The Company paid a soil removal assessment upon execution of the agreements which did not have a material impact on the financial position, results of operations or cash flows of the Company. The soil removal action was completed and USEPA approved it in October 2009. A final Feasibility Study was submitted to USEPA in February 2009 and was approved in March 2009. In June 2009, USEPA issued a Proposed Plan for Remediation. In September 2009, USEPA signed the Record of Decision. USEPA issued an Administrative Order for Remedial Design and Remedial Action to some of the PRPs in June 2010 which requires the PRPs to implement the remedy USEPA selected in the Record of Decision. The Company executed a Master PRP agreement with a final allocation which was effective September 30, 2010. As a result of receiving the final allocation, the Company was able to decrease its liability for this site by $0.7 million in the third quarter of 2010.
The Company believes that based on current information it has adequate reserves for claims associated with the Lightman site. However, actual costs could differ from current estimates.
Wilmington Site
The Company is currently contractually obligated to contribute to the response costs associated with the Company’s formerly-owned site at 51 Eames Street, Wilmington, Massachusetts. Remediation at this site is being managed by its current owner to whom the Company sold the property in 1980. Under the agreement, once total site remediation costs exceed certain levels, the Company is obligated to contribute up to five percent of future response costs associated with this site with no limitation on the ultimate amount of contributions. To date, the Company has paid the current owner $1.9 million for the Company’s portion of environmental response costs through the third quarter of 2010 (the current owner of the site bills the Company one calendar quarter in arrears). The Company has recorded a liability for its portion of the estimated remediation costs for the site. Depending on the ultimate cost of the remediation at this site, the amount for which the Company is liable could differ from the current estimates.
In addition, in response to the special notice letter received by the PRPs in June 2006 from USEPA seeking performance of an RI/FS at the site, certain PRPs, including the Company, signed an Administrative Settlement Agreement and Order on Consent for the RI/FS effective July 2007, which sets forth the obligations of the PRPs to perform the RI/FS.
The Company and other prior owners also entered into an agreement in April 2004 waiving certain statute of limitations defenses for claims which may be filed by the Town of Wilmington, Massachusetts, in connection with this site. While the Company has denied any liability for any such claims, the Company agreed to this waiver while the parties continue to discuss the resolution of any potential claim which may be filed.
The Company believes that based on current information it has adequate reserves for the claims related to this site. However, actual costs could differ from current estimates.
15
Table of Contents
Other Matters
The Company has been named as a de minimis PRP at other sites, and as such the Company believes that a resolution of its liability will not have a material impact on the financial position, results of operations or cash flows of the Company.
In addition, in May 2010, the Company entered into a Consent Agreement and Final Order with USEPA with respect to alleged violations of the Federal Insecticide, Fungicide and Rodenticide Act (FIFRA). Under the Consent Agreement and Final Order, the Company paid $272,800 to USEPA.
16
Table of Contents
| Item 4. | (Removed and Reserved) |
Executive Officers of the Registrant
The Company’s executive officers are elected annually by the Board of Directors at the first meeting following the Annual Meeting of Stockholders to serve through the next annual meeting of the Board and until their respective successors are duly elected and qualified.
The executive officers of the Company, their ages as of February 28, 2011, and certain other information are as follows:
| Name |
Age | Title |
Year
First Elected Officer | |||
| F. Quinn Stepan |
73 | Chairman | 1967 | |||
| F. Quinn Stepan, Jr. |
50 | President and Chief Executive Officer | 1997 | |||
| John V. Venegoni |
52 | Vice President and General Manager – Surfactants | 1999 | |||
| Robert J. Wood |
53 | Vice President and General Manager – Polymers | 2001 | |||
| James E. Hurlbutt |
57 | Vice President and Chief Financial Officer | 2002 | |||
| Frank Pacholec |
55 | Vice President, Research and Development and Corporate Sustainability Officer | 2003 | |||
| Gregory Servatius |
51 | Vice President, Human Resources | 2006 | |||
| H. Edward Wynn |
50 | Vice President, General Counsel and Secretary | 2007 | |||
| Scott C. Mason |
52 | Vice President, Supply Chain | 2010 | |||
F. Quinn Stepan is an executive officer of the Company and Chairman of the Company’s Board of Directors. He served the Company as Chairman and Chief Executive Officer from October 1984 through December 2005. He served as President from 1973 until February 1999.
F. Quinn Stepan, Jr., has served the Company as President and Chief Executive Officer since January 2006. He served the Company as President and Chief Operating Officer from 1999 through 2005. From January 1997 until February 1999 he served as Vice President and General Manager – Surfactants. From May 1996 until January 1997 he served as Vice President – Global Laundry and Cleaning Products. From May 1992 until May 1996 he served as Director – Business Management.
John V. Venegoni has served the Company as Vice President and General Manager – Surfactants since February 1999. From May 1996 until February 1999 he served as Director – Global Personal Care. From May 1992 until May 1996 he served as Senior Business Manager – Consumer Products.
Robert J. Wood has served the Company as Vice President and General Manager – Polymers since January 2001. From March 1996 until January 2001, he served as Director – Polyols. From April 1988 until March 1996, he served as Business Manager – Polyols.
17
Table of Contents
James E. Hurlbutt has served the Company as Vice President and Chief Financial Officer since February 12, 2008. From February 2005 until February 2008, he served the Company as Vice President – Finance. From February 2002 until February 2005, he served the Company as Vice President and Controller. From August 1996 until February 2002, he served as Controller – International and Tax Accounting.
Frank Pacholec has served the Company as Vice President, Research and Development since April 2003. In May 2010 he was appointed Corporate Sustainability Officer. From November 1983 until April 2003, he was employed with Monsanto and Solutia in the Research and Development area.
Gregory Servatius has served the Company as Vice President, Human Resources since February 2006. From April 2003 until January 2006, he served as Vice President, Surfactant Sales. From October 2001 until April 2003, he served as Vice President Functional Products. From 1998 to 2001, he served as the Managing Director of Stepan’s European operation.
H. Edward Wynn has served the Company as Vice President, General Counsel and Secretary since January 9, 2007. From 2005 until 2006, he served as Chief Administrative Officer and General Counsel of Heritage Development Partners, LLC.
Scott C. Mason has served the Company as Vice President, Supply Chain since March 10, 2010. From January 2006 until December 2009, he served as Senior Vice President Global Supply Chain and President, Alternative Channels of Nalco Company.
18
Table of Contents
PART II
| Item 5. | Market for Registrant’s Common Equity, Related Stockholder Matters and Issuer Purchases of Equity Securities |
| (a) | The Company’s common stock is listed and traded on the New York Stock Exchange and the Chicago Stock Exchange. See table below for New York Stock Exchange quarterly market price information. |
| Quarterly Stock Data |
||||||||||||||||
| Stock Price Range | ||||||||||||||||
| 2010 | 2009 | |||||||||||||||
| Quarter |
High | Low | High | Low | ||||||||||||
| First |
$ | 67.67 | $ | 45.99 | $ | 48.41 | $ | 22.80 | ||||||||
| Second |
$ | 79.75 | $ | 54.95 | $ | 45.99 | $ | 26.34 | ||||||||
| Third |
$ | 72.17 | $ | 53.55 | $ | 62.98 | $ | 39.74 | ||||||||
| Fourth |
$ | 76.99 | $ | 59.00 | $ | 67.98 | $ | 54.23 | ||||||||
| Year |
$ | 79.75 | $ | 45.99 | $ | 67.98 | $ | 22.80 | ||||||||
The Company’s 5 1/2 percent convertible preferred stock is listed and traded on the New York Stock Exchange and the Chicago Stock Exchange. See Note 11, Stockholders’ Equity of the Consolidated Financial Statements (Item 8 of this Form 10-K) for a description of the preferred stockholders’ rights.
On February 11, 2009, the Company’s Board of Directors authorized the Company to repurchase up to 500,000 shares of its outstanding common stock, or the equivalent in shares of the Company’s preferred stock. The timing and amount of the repurchases will be determined by the Company’s management based on its evaluation of market conditions and share price. Shares will be repurchased with cash in open market or private transactions in accordance with applicable securities and stock exchange rules. The repurchase authorization represented approximately five percent of the Company’s total shares of common stock outstanding at February 11, 2009. This repurchase authorization replaced the 300,000 share authorization approved on February 10, 2004, of which the remaining unutilized repurchase authorization of 111,256 shares was cancelled. During 2010, 92,845 shares of Company common stock were purchased in the open market, 17,811 shares of common stock were received in lieu of cash from employees exercising stock options and 21,126 shares of common stock were received to settle employees’ minimum statutory withholding taxes related to performance stock awards. The purchased and received shares were recorded as treasury stock in the Company’s balance sheet. As of December 31, 2010, 268,657 shares may be purchased under the repurchase authorization.
| (b) | On January 31, 2011, there were 1,327 holders of record of common stock of the Company. |
19
Table of Contents
| (c) | Below is a summary by month of share purchases by the Company during the fourth quarter of 2010: |
| Period |
Total Number of Shares Purchased |
Average Price Paid per Share |
Total Number of Shares Purchased as Part of Publicly Announced Plans or Programs |
Maximum Number of Shares that May Yet Be Purchased Under the Plans or Programs |
||||||||||||
| October |
— | — | — | — | ||||||||||||
| November |
— | — | — | — | ||||||||||||
| December |
16,442 | (a) | $ | 76.70 | — | — | ||||||||||
| (a) | Represents shares tendered in lieu of cash for stock option exercises. The shares tendered were held by the individual exercising the options for more than six months. |
| (d) | See table below for quarterly dividend information. Also, see Note 7, Debt and Note 11, Stockholders’ Equity of the Consolidated Financial Statements (Item 8 of this Form 10-K), which sets forth certain restrictive covenants regarding the Company’s payment of dividends. |
Dividends Declared Per Common Share
| Quarter |
2010 | 2009 | ||||||
| First |
$ | 0.24 | $ | 0.22 | ||||
| Second |
$ | 0.24 | $ | 0.22 | ||||
| Third |
$ | 0.24 | $ | 0.22 | ||||
| Fourth |
$ | 0.26 | $ | 0.24 | ||||
| Year |
$ | 0.98 | $ | 0.90 | ||||
20
Table of Contents
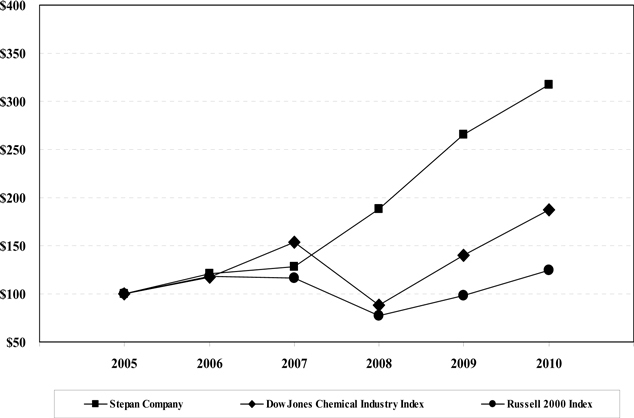
| (e) | Stock Performance Graph |
The following stock performance graph compares the yearly change since December 31, 2005, in cumulative return on the common stock of the Company on a dividend reinvested basis to the Dow Jones Chemical Industry Index and the Russell 2000 Index. The Dow Jones Chemical Industry Index is a market-capitalization weighted grouping of 37 chemical companies, including major manufacturers of both basic and specialty products. The Company is not included in the Dow Jones Chemical Industry Index. The Russell 2000 Index is a market-capitalization weighted grouping of 2,000 small to medium sized companies in a broad range of industries. The Company was a part of the Russell 2000 Index during 2010. The graph assumes $100 was invested on December 31, 2005, and shows the cumulative total return as of each December 31 thereafter.
21
Table of Contents
| Item 6. | Selected Financial Data |
See the table below for selected financial information.
(In thousands, except per share and employee data)
| For the Year |
2010 | 2009 | 2008 | 2007 | 2006 | |||||||||||||||
| Net Sales |
$ | 1,431,122 | $ | 1,276,382 | $ | 1,600,130 | $ | 1,329,901 | $ | 1,172,583 | ||||||||||
| Operating Income |
107,897 | 104,888 | 70,680 | 35,095 | 15,853 | |||||||||||||||
| Percent of Net Sales |
7.5 | % | 8.2 | % | 4.4 | % | 2.6 | % | 1.4 | % | ||||||||||
| Income Before Provision for Income Taxes |
101,479 | 97,131 | 54,878 | 23,715 | 7,389 | |||||||||||||||
| Percent of Net Sales |
7.1 | % | 7.6 | % | 3.4 | % | 1.8 | % | 0.6 | % | ||||||||||
| Provision for Income Taxes |
35,888 | 34,028 | 17,615 | 8,687 | 900 | |||||||||||||||
| Net Income Attributable to Stepan Company |
65,427 | 63,049 | 37,172 | 15,118 | 6,670 | |||||||||||||||
| Per Diluted Share (a) |
5.90 | 5.84 | 3.52 | 1.50 | 0.63 | |||||||||||||||
| Percent of Net Sales |
4.6 | % | 4.9 | % | 2.3 | % | 1.1 | % | 0.6 | % | ||||||||||
| Percent to Total Stepan Company Stockholders’ Equity (b) |
20.5 | % | 25.3 | % | 17.9 | % | 7.8 | % | 3.8 | % | ||||||||||
| Percent Return on Invested Capital (c) |
14.62 | % | 14.41 | % | 8.21 | % | 5.92 | % | 4.51 | % | ||||||||||
| Cash Dividends Paid |
10,570 | 9,557 | 8,863 | 8,431 | 8,149 | |||||||||||||||
| Per Common Share |
0.9800 | 0.9000 | 0.8500 | 0.8250 | 0.8050 | |||||||||||||||
| Depreciation and Amortization |
40,351 | 37,171 | 36,928 | 37,176 | 38,384 | |||||||||||||||
| Capital Expenditures |
73,748 | 42,631 | 49,778 | 39,815 | 45,970 | |||||||||||||||
| Weighted-average Common Shares Outstanding (Diluted) |
11,090 | 10,796 | 10,549 | 10,113 | 9,284 | |||||||||||||||
| As of Year End |
||||||||||||||||||||
| Working Capital |
$ | 222,199 | $ | 186,297 | $ | 116,288 | $ | 92,954 | $ | 87,974 | ||||||||||
| Current Ratio |
2.1 | 2.1 | 1.5 | 1.5 | 1.5 | |||||||||||||||
| Property, Plant and Equipment, net |
353,585 | 248,618 | 238,166 | 234,062 | 225,604 | |||||||||||||||
| Total Assets |
811,431 | 634,203 | 611,897 | 573,185 | 546,055 | |||||||||||||||
| Long-term Debt Obligations |
159,963 | 93,911 | 104,725 | 96,939 | 107,403 | |||||||||||||||
| Total Stepan Company Stockholders’ Equity |
349,491 | 289,285 | 208,144 | 206,051 | 180,786 | |||||||||||||||
| Per share (d) |
32.59 | 27.36 | 20.27 | 20.69 | 18.33 | |||||||||||||||
| Number of Employees |
1,768 | 1,594 | 1,578 | 1,525 | 1,528 | |||||||||||||||
| (a) | Based on weighted-average number of common shares outstanding during the year. |
| (b) | Based on average equity. |
| (c) | Defined as net operating profit after taxes divided by invested capital. |
| (d) | Based on common shares and the assumed conversion of the convertible preferred shares outstanding at year end. |
22
Table of Contents
| Item 7. | Management’s Discussion and Analysis of Financial Condition and Results of Operations |
Except for the historical statements contained in this report, the matters discussed in the following discussion and analysis are forward-looking statements that are subject to certain risks, uncertainties and assumptions. Such forward-looking statements are intended to be identified in this document by the words, “anticipate,” “believe,” “estimate,” “expect,” “intend,” “may,” “objective,” “outlook,” “plan,” “project,” “possible,” “potential,” “should” and similar expressions. Actual results may vary materially.
Forward-looking statements speak only as of the date they are made, and the Company does not undertake any obligation to update them to reflect changes that occur after that date. Factors that could cause actual results to differ materially include the items described above under the header “Risk Factors” in Item 1A of the Annual Report.
Overview
The Company produces and sells intermediate chemicals that are used in a wide variety of applications worldwide. The overall business comprises three reportable segments:
| • | Surfactants – Surfactants, which accounted for 74 percent of consolidated net sales in 2010, are principal ingredients in consumer and industrial cleaning products such as detergents for washing clothes, dishes, carpets, floors and walls, as well as shampoos, body washes, toothpastes and fabric softeners. Other applications include germicidal quaternary compounds, lubricating ingredients, emulsifiers (for spreading agricultural products), plastics and composites and biodiesel. Surfactants are manufactured at six North American sites (five in the U.S. and one in Canada), three European sites (United Kingdom, France and Germany), three Latin American sites (Mexico, Brazil and Colombia) and one Asian site (Philippines; the Company acquired controlling interest in Stepan Philippines Inc. on July 19, 2010). Also in the third quarter of 2010, the Company purchased assets in Singapore and initiated the development of a methyl esters plant in that location. See the ‘2010 Acquisitions’ section for a discussion of the Company’s acquisition activities. The Company also holds a 50 percent ownership interest in a joint venture, TIORCO, LLC, that markets chemical solutions for increased production of crude oil and natural gas from existing fields. The joint venture is accounted for under the equity method, and its financial results are excluded from surfactant segment operating results. |
| • | Polymers – Polymers, which accounted for 23 percent of consolidated net sales in 2010, include two primary product lines: polyols and phthalic anhydride. Polyols are used in the manufacture of laminate insulation board for the construction industry and are also sold to the appliance, flexible foam and coatings, adhesives, sealants and elastomers (C.A.S.E.) industries. Phthalic anhydride is used in unsaturated polyester resins, alkyd resins and plasticizers for applications in construction materials and components of automotive, boating and other consumer products. In the U.S., polymer product lines are manufactured at the Company’s Millsdale, Illinois, site. Polyols are also manufactured at the Company’s Wesseling (Cologne), Germany, facility, its 80-percent owned joint venture in Nanjing, China and its recently acquired site in Brzeg Dolny, Poland. See the ‘2010 Acquisitions’ section for a discussion of the Company’s acquisition activities. |
23
Table of Contents
| • | Specialty Products – Specialty products, which accounted for three percent of consolidated net sales in 2010, include flavors, emulsifiers and solubilizers used in the food and pharmaceutical industries. Specialty products are manufactured primarily at the Company’s Maywood, New Jersey, site. |
2010 Acquisitions
On July 2, 2010, the Company purchased the manufacturing assets of Peter Cremer GmbH’s 100,000 ton per year methyl esters plant located on Jurong Island in Singapore. The Company plans to install methyl esters fractionation capability on the site. Methyl esters are a core building block of the Company’s surfactants segment, and the acquisition of the Jurong Island manufacturing assets provides the Company an opportunity to reach its global customer base with methyl esters and value added derivatives made from tropical oils available in the region. The Company plans for the site to begin methyl esters production in the second quarter of 2012. The purchase price of the manufacturing assets was $10.4 million, which the Company paid from available cash.
On July 15, 2010, the Company’s Stepan Europe subsidiary acquired all the shares of Alfa Systems Sp. z o.o. (Alfa Systems). The purchase included a plant in Brzeg Dolny, Poland, which specializes in the manufacture of aromatic polyester polyol from recycled polyethylene terephthalate. Polyester polyols are the most significant component of the Company’s polymers segment. The acquisition of Alfa Systems provides the Company manufacturing capability in Eastern Europe and the ability to economically and effectively serve customers in Central and Eastern Europe. The purchase price of the acquisition was €9.1 million (approximately $11.8 million). The Company paid €6.6 million (approximately $8.5 million) at the time of acquisition. An additional €2.0 million may be paid pending the outcome of certain contractual adjustments. The acquisition was financed using bank debt in France.
On July 19, 2010, the Company acquired controlling interest of Stepan Philippines Inc. (SPI), raising the Company’s ownership interest in the entity from 50 percent to 88.8 percent. The Company paid $3.7 million of cash to acquire the interests of one owner, transferred $2.0 million of cash to SPI as an additional capital investment and capitalized a $3.9 million liability originally due the Company pursuant to a royalty agreement between the Company and SPI. The Company also guaranteed approximately $8.7 million of debt owed by SPI to a related party of the selling partner.
The financial impact of the new entities on 2010 earnings was insignificant. The Company does not believe the acquisitions will have a significant effect on 2011 earnings, but will support the Company’s longer term global growth strategy. See Note 2 in the Notes to Consolidated Financial Statements for additional information regarding the foregoing acquisitions.
24
Table of Contents
Deferred Compensation Plans
The accounting for the Company’s deferred compensation plans can cause period-to-period fluctuations in Company expenses and profits. For 2010, compensation expense related to the Company’s deferred compensation plans, which is reported in the administrative expense line of the consolidated income statement, was $2.0 million lower and $4.8 million higher than deferred compensation expense reported for 2009 and 2008, respectively. The Company common stock price, to which a large portion of the deferred compensation obligation is tied, was $76.27 at December 31, 2010, compared to $64.81 at December 31, 2009 and $46.99 at December 31, 2008. The pretax effect of all deferred compensation-related activities (which includes realized and unrealized gains and losses on the mutual fund assets held to fund the deferred compensation obligations) and the income statement line items in which the effects were recorded are displayed below (see the ‘Corporate Expenses’ section of this management discussion and analysis for further details):
| (Dollars in millions) | (Income)
Expense For the Years Ended December 31 |
|||||||||||
| 2010 | 2009 | 2008 | ||||||||||
| Deferred Compensation (Administrative expense) |
$ | 5.0 | $ | 7.0 | $ | 0.2 | ||||||
| Investment Income (Other, net) |
(0.1 | ) | (0.1 | ) | (0.3 | ) | ||||||
| Realized/Unrealized (Gains) Losses on Investments (Other, net) |
(1.4 | ) | (1.9 | ) | 5.0 | |||||||
| Net Pretax Income Effect |
$ | 3.5 | $ | 5.0 | $ | 4.9 | ||||||
Effects of Foreign Currency Translation
The Company’s foreign subsidiaries transact business and report financial results in their respective local currencies. As a result, foreign subsidiary income statements are translated into U.S. dollars at average foreign exchange rates appropriate for the reporting period. Because foreign exchange rates fluctuate against the U.S. dollar over time, foreign currency translation affects period-to-period comparisons of financial statement items (i.e., because foreign exchange rates fluctuate, similar period-to-period local currency results for a foreign subsidiary may translate into different U.S. dollar results). Below are tables that present the effect that foreign currency translation had on the changes in consolidated net sales and various income line items for 2010 compared to 2009 and 2009 compared to 2008:
| Year Ended December 31 |
Increase | Increase Due to Foreign Translation |
||||||||||||||
| (In millions) | 2010 | 2009 | ||||||||||||||
| Net Sales |
$ | 1,431.1 | $ | 1,276.4 | $ | 154.7 | $ | 3.9 | ||||||||
| Gross Profit |
236.0 | 233.1 | 2.9 | 1.4 | ||||||||||||
| Operating Income |
107.9 | 104.9 | 3.0 | 1.3 | ||||||||||||
| Pretax Income |
101.5 | 97.1 | 4.4 | 1.1 | ||||||||||||
25
Table of Contents
| Year Ended December 31 |
Increase (Decrease) |
Decrease Due to Foreign Translation |
||||||||||||||
| (In millions) | 2009 | 2008 | ||||||||||||||
| Net Sales |
$ | 1,276.4 | $ | 1,600.1 | $ | (323.7 | ) | $ | (49.2 | ) | ||||||
| Gross Profit |
233.1 | 169.5 | 63.6 | (7.8 | ) | |||||||||||
| Operating Income |
104.9 | 70.7 | 34.2 | (5.2 | ) | |||||||||||
| Pretax Income |
97.1 | 54.9 | 42.2 | (5.4 | ) | |||||||||||
Other Significant Transactions during the Reporting Periods
Sale of Commodity Polyurethane Systems Product Lines
On July 31, 2008, the Company sold select polyurethane system product lines, which were a part of the polymer segment, to Bayer MaterialScience LLC (Bayer). No manufacturing assets were included in the sale and no employees were terminated. The sold product lines were insulation materials used in appliances, water heaters, doors, roofs, picnic coolers and other similar applications, and represented approximately $16.0 million in Company annual net sales. The products, which were manufactured at the Company’s Millsdale, Illinois, facility, continued to be produced for Bayer during a two-year transition period ended in 2010. The sale was for $9.9 million of cash, which the Company reported as a pretax gain in the third quarter ended September 30, 2008. The Company continues to produce and sell polyurethane systems for specialty applications. See Note 20 in the Notes to Consolidated Financial Statements for additional information.
Sale of Land
In September 2008, the Company sold 88 acres of land at its Millsdale manufacturing facility in Elwood, Illinois, to an industrial park developer for $8.6 million. The land had a cost basis of $0.1 million, so the Company recorded a pretax gain of $8.5 million in the third quarter ended September 30, 2008. The gain was not attributed to any reportable segment. For income tax purposes, the land disposition and the acquisition of an office building near the Company’s corporate headquarters were structured as a tax-deferred like-kind exchange, pursuant to Section 1031 of the Internal Revenue Code. See Note 21 in the Notes to Consolidated Financial Statements for additional information.
26
Table of Contents
RESULTS OF OPERATIONS
2010 Compared with 2009
Summary
Net income attributable to the Company for 2010 increased four percent to a record $65.4 million, or $5.90 per diluted share, compared to $63.0 million, or $5.84 per diluted share, for 2009. Below is a summary discussion of the major factors leading to the year-over-year changes in net sales, profits and expenses. A detailed discussion of segment operating performance for 2010 follows the summary.
Consolidated net sales for 2010 increased $154.7 million, or 12 percent, over net sales for 2009. Higher average selling prices, higher sales volumes and the effects of foreign currency translation accounted for approximately $82.8 million, $68.0 million and $3.9 million, respectively, of the year-over-year increase in net sales. Average selling prices increased due primarily to rising raw material costs. Sales volumes grew five percent, due to increases for both the surfactants and polymers segments. Specialty products reported a small year-over-year sales volume decrease.
Operating income for 2010 improved by $3.0 million, or three percent, over operating income for 2009. Gross profit increased $2.9 million, or one percent. Gross profits were up between years for polymers and specialty products, but down for surfactants. Higher raw material costs negatively impacted profit margins for both the surfactants and polymers segments. In addition, 2010 gross profit included expenses related to a lockout of the hourly workers at the Company’s Millsdale (Illinois) manufacturing site. A labor agreement dispute led to the lockout. During the lockout period the plant was operated by salaried personnel. The effects of foreign currency translation contributed $1.4 million to the year-over-year consolidated gross profit improvement.
Operating expenses declined $0.1 million, or less than one percent, year over year due to the following:
| • | Marketing expenses decreased $0.2 million, or less than one percent, year over year. Bad debt expense declined $2.3 million, which reflected lower provision requirements throughout the Company’s global organization. The lower bad debt expense was largely offset by increased salary expense, including increased headcount to support the acquisition in Singapore. |
| • | Administrative expenses declined $1.8 million, or three percent, due to a $2.1 million decline in environmental remediation expenses and a $2.0 million reduction in deferred compensation expense. The decrease in environmental remediation expenses resulted primarily from the reduction of the Company’s liabilities for the clean-up costs at two sites. The reduction in deferred compensation expense was primarily attributable to changes in the price of Company common stock to which a large part of the deferred compensation obligation is tied. See the ‘Overview’ and ‘Corporate Expenses’ sections of this management discussion and analysis for further details. The impact of the foregoing was partially offset by the first-time consolidation of administrative expenses of the facilities in Poland, Singapore and Philippines ($1.4 million) and higher global consulting expenses ($0.5 million). |
27
Table of Contents
| • | Research and development expenses increased $1.8 million, or five percent, primarily due to increased expenses for salaries, product testing and compliance and the registration of Company products under Europe’s Registration, Evaluation, Authorization and Restriction of Chemical Substances (REACH) regulation. |
Interest expense for 2010 was $0.1 million, or one percent, higher than interest expense for 2009. Higher average debt levels led to the increase. The higher debt levels reflected $40 million in new private placement notes entered into in June 2010. The Company secured the additional long-term notes to take advantage of the current low interest rate environment and to support global growth initiatives. Other debt obligations, including a seller-financed agreement for the purchase of storage tanks in Singapore and a build-to-suit obligation for a new warehouse at the Company’s Millsdale plant, will also contribute to increased interest expense in future periods. See the ‘Liquidity and Capital Resources’ section of this management discussion and analysis.
The loss from equity joint ventures, which includes results for the 50-percent owned SPI (through July 19, 2010, when the Company acquired controlling interest in SPI) and TIORCO joint ventures, declined $2.0 million between years. Equity in SPI’s income improved $2.3 million year over year. The improvement was attributable in part to higher sales volumes and margins. In addition, the Company recorded a $0.7 million gain related to revaluing its original 50 percent interest in the joint venture as part of the Company’s acquisition of controlling interest in SPI. The prior year SPI results included approximately $1.2 million of expense for the reserve of value added tax receivable balances that were in dispute with the Philippine tax authorities. The equity loss in TIORCO increased $0.3 million between years. The Company also sells surfactant products to TIORCO and its customers. The sales and resulting income from the sales are included in the Company’s surfactants segment operating results.
The other, net line item of the consolidated statement of income includes investment related income (i.e., dividends, interest and realized and unrealized gains and losses) associated with the Company’s mutual fund assets held for the deferred compensation plans and foreign exchange gains and losses. Other, net was income of $1.6 million for 2010 compared to income of $2.2 million for 2009. Most of the decline was attributable to investment related income that was $0.6 million lower in 2010 than in 2009.
The effective tax rate was 35.4 percent in 2010 compared to 35.0 percent in 2009. The increase in the effective tax rate was primarily attributable to a lower tax benefit realized on foreign joint venture equity income and tax provided on a dividend from the Company’s subsidiary in Colombia. These increases were partially offset by an increase in the domestic production activities deduction. Higher Illinois corporate income tax rates were enacted for 2011, which could add 0.5 percent to the 2011 effective tax rate. See Note 10 to the consolidated financial statements for a reconciliation of the statutory U.S. federal income tax rate to the effective tax rate.
28
Table of Contents
Segment Results
| (Dollars in thousands) | Surfactants | Polymers | Specialty Products |
Segment Results |
Corporate | Total | ||||||||||||||||||
| For the year ended December 31, 2010 |
||||||||||||||||||||||||
| Net sales |
$ | 1,057,982 | $ | 330,416 | $ | 42,724 | $ | 1,431,122 | — | $ | 1,431,122 | |||||||||||||
| Operating income |
93,010 | 36,904 | 14,499 | 144,413 | (36,516 | ) | 107,897 | |||||||||||||||||
| For the year ended December 31, 2009 |
||||||||||||||||||||||||
| Net sales |
$ | 972,647 | $ | 260,770 | $ | 42,965 | $ | 1,276,382 | — | $ | 1,276,382 | |||||||||||||
| Operating income |
98,947 | 33,957 | 12,621 | 145,525 | (40,637 | ) | 104,888 | |||||||||||||||||
Surfactants
Surfactants net sales for 2010 increased $85.3 million, or nine percent, over net sales for 2009. Higher average selling prices, a four percent increase in sales volume and the effects of foreign currency translation accounted for $39.8 million, $36.2 million and $9.3 million, respectively, of the net sales change. A year-to-year comparison of net sales by region follows:
| For the Year Ended | ||||||||||||||||
| (Dollars in thousands) | ||||||||||||||||
| December 31, 2010 |
December 31, 2009 |
Increase | Percent Change |
|||||||||||||
| North America |
$ | 679,810 | $ | 647,304 | $ | 32,506 | +5 | |||||||||
| Europe |
248,749 | 226,138 | 22,611 | +10 | ||||||||||||
| Latin America |
110,896 | 99,205 | 11,691 | +12 | ||||||||||||
| Asia |
18,527 | — | 18,527 | NM | ||||||||||||
| Total Surfactants Segment |
$ | 1,057,982 | $ | 972,647 | $ | 85,335 | +9 | |||||||||
Net sales for North American operations increased five percent due to a three percent increase in average selling prices, the effects of foreign currency translation and a small increase in sales volume (less than one percent), which accounted for $22.1 million, $7.4 million and $3.0 million, respectively, of the net sales change. The higher average selling prices reflected higher raw material costs. The cost of raw materials, which fell significantly during the economic recession of 2009, moved higher throughout 2010. Sales volume, which was essentially unchanged between years, reflected fourth quarter sales volume that was nine percent below the sales volume reported in the fourth quarter of 2009. The quarter-over-quarter decline was primarily attributable to weaker demand for the Company’s consumer products (i.e., laundry, cleaning and personal care products) due to weaker retail demand and customers’ year-end inventory adjustments. The foreign currency translation effect resulted from the strengthening of the Canadian dollar against the U.S. dollar.
Net sales for European operations increased 10 percent due to a 10 percent increase in average selling prices and a three percent increase in sales volume, which accounted for $22.3 million and $7.5 million, respectively, of the net sales change. Higher raw material costs caused the increase in average selling prices. The effects of foreign currency, which reflected a weakening of European euro against the U.S. dollar, reduced the net sales change by $7.2 million.
29
Table of Contents
Net sales for Latin American operations were up 12 percent between years due to the effects of foreign currency translation and a five percent increase in sales volume, which accounted for $9.1 million and $4.6 million, respectively, of the net sales change. A two percent decline in average selling prices reduced the net sales change by $2.0 million. The favorable currency translation effect resulted from the strengthening of the currencies for all three Latin American locations against the U.S. dollar. New business at the region’s Brazil subsidiary was a major contributor to the year-over-year sales volume growth. Increased fabric softener sales also contributed.
The $18.5 million of net sales for Asia operations reflected sales by the Company’s Philippine subsidiary for the period after the Company acquired controlling interest in July 2010.
Surfactants operating income for 2010 declined $5.9 million, or six percent, from operating income for 2009. Gross profit declined $5.2 million, or three percent. The decline was primarily attributable to lower margins in Europe, coupled with higher costs in North America brought about by a labor dispute. Year-to-year comparisons of gross profit by region and total segment operating expenses and operating income follow:
| (Dollars in thousands) | For the Year Ended | |||||||||||||||
| December 31, 2010 |
December 31, 2009 |
Increase (Decrease) |
Percent Change |
|||||||||||||
| Gross Profit |
||||||||||||||||
| North America |
$ | 124,456 | $ | 126,160 | $ | (1,704 | ) | –1 | ||||||||
| Europe |
24,451 | 30,067 | (5,616 | ) | –19 | |||||||||||
| Latin America |
14,697 | 13,756 | 941 | +7 | ||||||||||||
| Asia |
1,201 | — | 1,201 | NM | ||||||||||||
| Total Surfactants Segment |
$ | 164,805 | $ | 169,983 | $ | (5,178 | ) | –3 | ||||||||
| Operating Expenses |
71,795 | 71,036 | 759 | +1 | ||||||||||||
| Operating Income |
$ | 93,010 | $ | 98,947 | $ | (5,937 | ) | –6 | ||||||||
Gross profit for North American operations declined one percent due primarily to costs related to a lockout of hourly workers at the Company’s Millsdale (Illinois) manufacturing site related to a labor agreement dispute. The previously noted decrease in fourth quarter sales volume also contributed to the decline. The effect of foreign currency translation reduced the unfavorable year-over-year gross profit change by $1.2 million.
Gross profit for European operations declined 19 percent as a result of the negative impact of higher raw material costs, which more than offset the effect of the three percent sales growth. Selling price have been increased, but have not kept pace with the rising costs of materials. The effect of foreign currency translation added $0.7 million to the year-over-year gross profit decline.
Gross profit for Latin American operations was up seven percent due to the favorable effects of foreign currency translation, which accounted for $1.4 million of the year-to year gross profit change. The remainder of the change (i.e. a $0.4 million decline in gross profit) was attributable to higher raw material costs and manufacturing expenses. The higher manufacturing expenses related to a maintenance turnaround at the Brazil plant.
30
Table of Contents
The $1.2 million of gross profit for Asia operations reflected profits earned by the Company’s Philippine subsidiary for the period after the Company acquired controlling interest in July 2010.
Operating expenses for the surfactants segment were up $0.8 million, or one percent, year over year. The increase primarily consisted of $1.7 million of higher research and development expenses partially offset by a $0.8 million decline in marketing expenses. The rise in research and development expenses included increases of $0.9 million and $0.8 million for North American and European operations, respectively. The higher research and development expenses for North American operations reflected the Company’s continued commitment to drive commercial success of its innovation projects, which resulted in higher salaries and travel expenses. Most of the increase in research and development expense for European operations was due to expenses related to registering the Company’s products under Europe’s REACH regulation. The lower marketing expenses resulted from a decline in bad debt expenses in North America ($1.5 million) and Europe ($0.6 million). The reduction in bad debt expenses was attributable to a decline in provisions for identified high-risk accounts. Partially offsetting the decline in bad debt expense were higher North America operation expenses for salaries, travel and consulting expenses reflecting increased resources to support the Company’s Asian growth initiatives.
Polymers
Polymers net sales for 2010 increased $69.6 million, or 27 percent, over net sales for 2009. Higher average selling prices and a 14 percent increase in sales volume accounted for $38.0 million and $37.0 million, respectively, of the increase in net sales. The effects of foreign currency translation reduced the year-over-year change in net sales by $5.4 million. A year-to-year comparison of net sales by region is displayed below:
| For the Year Ended | ||||||||||||||||
| (Dollars in thousands) | ||||||||||||||||
| December 31, 2010 |
December 31, 2009 |
Increase | Percent Change |
|||||||||||||
| North America |
$ | 213,223 | $ | 175,915 | $ | 37,308 | +21 | |||||||||
| Europe |
96,463 | 72,229 | 24,234 | +34 | ||||||||||||
| Asia and Other |
20,730 | 12,626 | 8,104 | +64 | ||||||||||||
| Total Polymers Segment |
$ | 330,416 | $ | 260,770 | $ | 69,646 | +27 | |||||||||
Net sales for North American operations grew 21 percent due to a 12 percent increase in average selling prices and an eight percent increase in sales volume, which accounted for $23.5 million and $13.8 million, respectively, of the increase in net sales. Higher raw material costs led to the increase in average selling prices. Sales volume for polyols and phthalic anhydride increased 13 percent and two percent, respectively, which reflected improved economic conditions in the industries to which the polymer segment sells as well as new business for polyols.
31
Table of Contents
Net sales for European operations increased 34 percent due to a 25 percent increase in sales volume and a 13 percent increase in average selling prices, which accounted for $18.3 million and $11.5 million, respectively, of the net sales increase. New business and improved demand for polyol used in rigid insulation foam led to the growth in sales volume. The region’s recently acquired Poland facility was an insignificant contributor to the year’s sales results. The average selling price increase was primarily attributable to higher raw material costs. The effects of foreign currency translation reduced the year-to-year net sales change by $5.6 million, which reflected the weakening of the European euro against the U.S. dollar.
Asia and Other operations’ net sales were up 64 percent year over year due largely to a 44 percent increase in sales volume. The growth in sales volume was primarily due to new business for the Company’s China subsidiary. An improved economy also contributed.
Polymers operating income for 2010 increased $2.9 million, or nine percent, from operating income for 2009. Gross profit grew $3.7 million, or seven percent, due primarily to improvement in North America. Operating expenses increased $0.8 million, or four percent, year over year. Below are year-to-year comparisons of gross profit by region and total segment operating expenses and operating income:
| (Dollars in thousands) | For the Year Ended | |||||||||||||||
| December 31, 2010 |
December 31, 2009 |
Increase (Decrease) |
Percent Change |
|||||||||||||
| Gross Profit |
||||||||||||||||
| North America |
$ | 41,821 | $ | 33,821 | $ | 8,000 | +24 | |||||||||
| Europe |
12,087 | 16,424 | (4,337 | ) | –26 | |||||||||||
| Asia and Other |
1,434 | 1,382 | 52 | +4 | ||||||||||||
| Total Polymers Segment |
$ | 55,342 | $ | 51,627 | $ | 3,715 | +7 | |||||||||
| Operating Expenses |
18,438 | 17,670 | 768 | +4 | ||||||||||||
| Operating Income |
$ | 36,904 | $ | 33,957 | $ | 2,947 | +9 | |||||||||
Gross profit for North American operations increased 24 percent due largely to the eight percent improvement in sales volume and better profit margins for the region’s phthalic anhydride product line. Phthalic anhydride margins were detrimentally affected in 2009 by lower than usual production volumes and high priced material in inventory that was accumulated near the end of 2008 (and carried over into 2009) prior to the significant recession-driven decline in commodity costs. Partially offsetting the effects of improved phthalic anhydride profitability was the negative impact that rising raw material costs have had on profit margins for polyol products. Selling prices for polyols were increased during 2010, but did not keep pace with raw material costs that increased on average by about 20 percent.
European operations’ gross profit declined 26 percent despite the 25 percent increase in sales volume. The negative effects of rising raw material costs and the outsourcing of product from the segment’s North American operations due to capacity constraints more than offset the positive impact of the growth in sales volume. As previously noted, selling price increases were made, but did not keep pace with increases in raw material costs. The project to expand capacity at the region’s Germany location is scheduled to be completed early in the second quarter of 2011. The addition of the Poland subsidiary to the region had little effect on year-over-year results.
32
Table of Contents
Asia and Other operations’ gross profit increased four percent due to increased sales volume.
The $0.8 million increase in operating expenses was due largely to higher expenses for North American ($0.6 million) and European operations ($0.5 million), partially offset by the effects of foreign currency translation ($0.2 million). Increased marketing expenses, due to higher salary ($0.3 million) and travel related ($0.3 million) expenses, caused the North American expense increase. The addition of the Poland subsidiary’s operating expenses led to the increase in European operations’ expenses.
Specialty Products
Net sales for 2010 were $0.2 million, or one percent, lower than net sales for 2009. Lower sales volume led to the decline. Sales volume declined two percent, which was primarily driven by lower sales of products used in food and flavoring applications. Operating income was up $1.9 million, or 15 percent, year over year due to lower raw material costs and increased sales of higher margin products.
Corporate Expenses
Corporate expenses, which include operating expenses that are not allocated to the reportable segments, declined $4.1 million, or 10 percent, to $36.5 million in 2010 from $40.6 million in 2009. Year-over-year decreases of $2.1 million for environmental remediation expense and $2.0 for deferred compensation expense accounted for most of the corporate expense reduction. The $2.1 million decline in environmental remediation expense resulted primarily from the reduction of the estimated remediation liabilities for two sites. New information related to the Company’s clean-up costs at the two sites led to the liability reductions. Deferred compensation expense was $5.0 million in 2010 compared to $7.0 million in 2009. The decline in deferred compensation expense was principally attributable to changes in the values of Company common stock to which a large portion of the deferred compensation obligation is tied (the accounting for the deferred compensation plan results in income when the values of Company common stock or mutual funds held in the plan fall and expense when values rise). 2010 deferred compensation expense reflected an $11.46 per share increase in Company common stock from $64.81 per share at December 31, 2009, to $76.27 per share at December 31, 2010, compared to 2009 when the Company’s common stock price increased $17.82 per share from $46.99 per share at December 31, 2008, to $64.81 per share at December 31, 2009.
33
Table of Contents
2009 Compared with 2008
Summary
Net income attributable to the Company for 2009 improved 70 percent to $63.0 million, or $5.84 per diluted share, compared to $37.2 million, or $3.52 per diluted share, for 2008. Net income for 2008 benefited from $11.3 million (net of tax) of gains on the sales of the polyurethane systems product lines and Millsdale land. Below is a summary discussion of the major factors leading to the year-to-year changes in net sales, profits and expenses. A detailed discussion of segment operating performance for 2009 follows the summary.
Consolidated net sales for 2009 declined $323.7 million, or 20 percent, from net sales for 2008. A decline in average selling prices, lower sales volume and the effects of foreign currency translation accounted for approximately $142.5 million, $132.0 million and $49.2 million, respectively, of the year-to-year decrease in net sales. Sales volumes fell eight percent, reflecting the effects of the global recession. By segment, polymer and surfactant sales volumes dropped 16 percent and seven percent, respectively, while sales volume for specialty products was up nine percent year over year. The decline in average selling prices was principally the result of falling commodity raw material costs.
Operating income for 2009 was $34.2 million, or 48 percent, greater than operating income for 2008 despite the 2008 $9.9 million and $8.5 million gains reported on the sales of the polyurethane systems product lines and Millsdale land, respectively. Gross profit was up $63.6 million, or 37 percent. All three segments contributed to the improvement in gross profit. Surfactants segment gross profit was up $48.3 million, or 40 percent; polymers segment gross profit increased $9.7 million, or 23 percent; and gross profit for the specialty products segment was up $7.0 million, or 77 percent. Lower raw material and freight costs and Company cost reduction initiatives benefited all segments. The effects of foreign currency translation reduced the year-to-year consolidated gross profit improvement by approximately $7.8 million.
Operating expenses increased $29.4 million, or 30 percent. Major items accounting for the expense increase were as follows:
| (Dollars in millions) | Increase / (Decrease) |
|||
| 2008 Gain on Sale of Product Lines |
$ | 9.9 | ||
| 2008 Gain on Sale of Land |
8.5 | |||
| Deferred Compensation Expense |
6.8 | |||
| Incentive-based Compensation |
5.3 | |||
| Foreign Currency Translation |
(2.3 | ) | ||
| Transition Pension Expense |
(1.2 | ) | ||
| Legal/Environmental Expense |
1.1 | |||
| Other |
1.3 | |||
| Total |
$ | 29.4 | ||
The gains on sales of product lines and land are explained in the ‘Overview’ section of this MD&A. The increase in deferred compensation expense is discussed in detail in the ‘Corporate Expenses’ section of this MD&A. Improved operating results caused the rise in incentive-based compensation, which includes stock-based pay, bonuses and profit sharing. The decline in
34
Table of Contents
transition pension expense was principally attributable to the 2008 acceleration of a portion of discretionary Company contributions established to compensate certain employees for benefits lost when the Company froze its defined benefit plans in 2006 (no such accelerated benefits were paid in 2009). Legal/environmental expenses were up mainly due to increases in estimated environmental remediation reserve requirements for existing sites.
Interest expense for 2009 was $3.2 million, or 34 percent, less than interest expense for 2008. The decline was caused by lower average debt levels, resulting from a decrease in working capital requirements brought on by lower raw material costs.
The loss from equity joint ventures, which included results for the 50-percent owned SPI and TIORCO joint ventures, increased $1.0 million, or 38 percent, from 2008 to 2009. SPI reported an equity loss of $1.2 million for 2009, which was $1.1 million less than the loss reported in the 2008. The results for 2009 included $1.2 million of expense to reserve for value added tax receivable balances that were in dispute with Philippine tax authorities. TIORCO, which was formed in September 2008, reported $2.5 million of equity loss, which was $2.1 million higher than the loss reported in 2008. Planned start-up expenses coupled with lower prices for crude oil in the first six months of 2009 caused the TIORCO result.
Other, net was $2.2 million of income for 2009 compared to $3.6 million of expense for 2008. A $6.7 million favorable swing in investment related income, partially offset by a $0.9 million decline in foreign exchange gains, accounted for the $5.8 million favorable other, net change. Unrealized and realized gains related to the mutual funds held for the Company’s deferred compensation plans accounted for the change in investment related income as $1.9 million of gains were posted in 2009 compared to losses of $5.0 million for 2008. Dividend income declined $0.2 million. Foreign exchange activity resulted in $0.2 million of gains for 2009 compared to $1.1 million of gains for 2008.
The effective tax rate was 35.0 percent in 2009 compared to 32.1 percent in 2008. The increase in the effective tax rate was primarily attributable to a greater percentage of consolidated income being generated in the U.S. where the effective tax rate is higher and the reduction of the tax benefit realized on tax credits and deductions as percentage of income. See Note 10 to the consolidated financial statements for a reconciliation of the statutory U.S. federal income tax rate to the effective tax rate.
Segment Results
| (Dollars in thousands) | Surfactants | Polymers | Specialty Products |
Segment Results |
Corporate | Total | ||||||||||||||||||
| For the year ended December 31, 2009 |
||||||||||||||||||||||||
| Net sales |
$ | 972,647 | $ | 260,770 | $ | 42,965 | $ | 1,276,382 | — | $ | 1,276,382 | |||||||||||||
| Operating income |
98,947 | 33,957 | 12,621 | 145,525 | (40,637 | ) | 104,888 | |||||||||||||||||
| For the year ended December 31, 2008 |
||||||||||||||||||||||||
| Net sales |
$ | 1,199,438 | $ | 359,014 | $ | 41,678 | $ | 1,600,130 | — | $ | 1,600,130 | |||||||||||||
| Operating income |
52,261 | 34,103 | 5,949 | 92,313 | (21,633 | ) | 70,680 | |||||||||||||||||
35
Table of Contents
Surfactants
Surfactants net sales for 2009 declined $226.8 million, or 19 percent, from net sales for 2008. A nine percent decline in average selling prices, a seven percent decrease in sales volume and the effects of foreign currency translation accounted for approximately $100.3 million, $81.4 million and $45.1 million, respectively, of the net sales change. A year-to-year comparison of net sales by region follows:
| For the Year Ended | ||||||||||||||||
| (Dollars in thousands) | ||||||||||||||||
| December 31, 2009 |
December 31, 2008 |
Increase / (Decrease) |
Percent Change |
|||||||||||||
| North America |
$ | 647,304 | $ | 810,509 | $ | (163,205 | ) | –20 | ||||||||
| Europe |
226,138 | 269,524 | (43,386 | ) | –16 | |||||||||||
| Latin America |
99,205 | 119,405 | (20,200 | ) | –17 | |||||||||||
| Total Surfactants Segment |
$ | 972,647 | $ | 1,199,438 | $ | (226,791 | ) | –19 | ||||||||
The 20 percent decline in net sales for North American operations was primarily attributable to a 10 percent decrease in sales volume and a nine percent decline in average selling prices, which accounted for $83.6 million and $75.5 million, respectively, of the net sales change. In addition, the effects of foreign currency translation contributed $4.1 million (or one percent) to the decline. A significant drop in biodiesel sales volume accounted for about 51 percent of the total decrease in North American volume. The remaining decrease in sales volume reflected reduced demand for surfactants that have industrial or construction applications, which were negatively impacted by the poor economy. Sales volumes for consumer products, the regions largest market segment, dropped less than one percent despite the difficult economy. Sales of surfactants used in agricultural applications rose eight percent. The decrease in average selling prices reflected lower raw material costs.
Net sales for European operations declined 16 percent due to the effects of foreign currency translation and an eight percent decrease in average selling prices, which accounted for $25.5 million and $20.6 million, respectively, of the net sales decline. The foreign currency impact was caused by the weakening of the European euro and the U.K. pound sterling against the U.S. dollar. Lower raw material costs led to the decline in average selling prices. Sales volume rose one percent, mitigating the net sales decline by $2.7 million.
Net sales for Latin American operations declined 17 percent due to the negative effects of foreign currency translation and a five percent decline in average selling prices, which accounted for $15.6 million and $6.6 million, respectively, of the decrease. The currencies for all three Latin American locations weakened against the U.S. dollar, causing the currency translation impact. The lower average selling prices were attributable to sales mix and lower raw material costs. Sales volume was up two percent, which offset the net sales decline by $2.0 million. Increased sales volume for the Company’s Brazil subsidiary, partially offset by declines at the Company’s Mexico and Colombia subsidiaries, led to the modest volume gain.
36
Table of Contents
Surfactants operating income for 2009 was $46.7 million greater than operating income for 2008. Gross profit increased $48.3 million due principally to lower raw material costs. Reduced freight expenses and cost reduction initiatives also contributed to the profit improvement. Operating expenses increased $1.6 million, or two percent. Year-to-year comparisons of gross profit by region and total segment operating expenses and operating income follow:
| (Dollars in thousands) | For the Year Ended | |||||||||||||||
| December 31, 2009 |
December 31, 2008 |
Increase / (Decrease) |
Percent Change |
|||||||||||||
| Gross Profit |
||||||||||||||||
| North America |
$ | 126,160 | $ | 85,982 | $ | 40,178 | +47 | |||||||||
| Europe |
30,067 | 17,843 | 12,224 | +69 | ||||||||||||
| Latin America |
13,756 | 17,872 | (4,116 | ) | –23 | |||||||||||
| Total Surfactants Segment |
$ | 169,983 | $ | 121,697 | $ | 48,286 | +40 | |||||||||
| Operating Expenses |
71,036 | 69,436 | 1,600 | +2 | ||||||||||||
| Operating Income |
$ | 98,947 | $ | 52,261 | $ | 46,686 | +89 | |||||||||
The increase in gross profit for North American operations was largely attributable to the effects of reduced raw material costs. Lower freight costs and cost saving initiatives also contributed to the improved profitability. The impact of the economic recession moved raw material costs lower since the end of the third quarter of 2008 when costs were at their peak. Lower fuel costs led to the lower freight expenses. The previously discussed 10 percent decline in sales volume partially offset the effect of the lower costs.
The improvement in gross profit for European operations was due to the positive impact of lower raw material and freight costs. A more favorable product mix, which reflected increased fabric softener sales, and the slight sales volume increase, also contributed. The effects of foreign currency translation reduced Europe’s profit improvement by approximately $3.9 million.
Gross profit for Latin American operations declined due to a $2.1 million negative effect of foreign currency translation and a less favorable mix of sales. The modest increase in sales volume and lower raw material costs partially offset the unfavorable effects of foreign currency translation and sales mix.
Operating expenses for the surfactants segment were up $1.6 million, or two percent, between years. The expense increase was primarily attributable to a $3.4 million increase for European operations reflecting higher marketing ($1.3 million), administrative ($1.3 million) and research and development ($0.8 million) expenses. Increased bad debt provisions and salary expense accounted for the higher marketing expenses. Statutory profit sharing and business tax expenses led to the higher administrative expenses. Higher regulatory compliance costs caused the increase in research and development expenses. Operating expenses for North American operations increased $1.1 million due in large part to higher incentive-based compensation, reflecting the strong profitability of the region. Partially offsetting the foregoing increases were reduced operating expenses for Latin American operations ($0.8 million), due in large part to lower bad debt provisions. The effects of foreign currency translation decreased the year-to-year change in Surfactants segment operating expenses by $2.1 million.
37
Table of Contents
Polymers
Polymers net sales for 2009 declined $98.2 million, or 27 percent, from net sales for 2008. A 16 percent drop in sales volume, driven by the global economic recession, lower average selling prices and the effects of foreign currency translation accounted for $57.0 million, $37.1 million and $4.1 million, respectively, of the net sales decline. A year-to-year comparison of net sales by region is displayed below:
| For the Year Ended | ||||||||||||||||
| (Dollars in thousands) | ||||||||||||||||
| December 31, 2009 |
December 31, 2008 |
Increase / (Decrease) |
Percent Change |
|||||||||||||
| North America |
$ | 175,915 | $ | 253,514 | $ | (77,599 | ) | –31 | ||||||||
| Europe |
72,229 | 93,072 | (20,843 | ) | –22 | |||||||||||
| Asia and Other |
12,626 | 12,428 | 198 | +2 | ||||||||||||
| Total Polymers Segment |
$ | 260,770 | $ | 359,014 | $ | (98,244 | ) | –27 | ||||||||
Net sales for North American operations fell 31 percent due to a 21 percent decrease in sales volume coupled with a 12 percent decrease in average selling prices. The reductions in sales volume and average selling prices accounted for $53.2 million and $24.4 million of the net sales decline, respectively. Sales volume for polyols and phthalic anhydride fell 28 percent and five percent, respectively, as a result of the negative impact of the economy. Sales volume for polyurethane systems fell 58 percent as a result of the July 2008 sale of the Company’s commodity system product lines. The 12 percent decrease in average selling prices for North American operations reflected lower raw material costs, particularly for phthalic anhydride.
Net sales for European operations declined 22 percent due to a 14 percent drop in average selling prices, a five percent decrease in polyol sales volume and the effects of foreign currency translation, which accounted for $12.0 million, $4.7 million and $4.1 million, respectively, of the reduction in net sales. Lower raw material costs led to the drop in average selling prices. The decrease in sales volume reflected the negative effects that the global recession had on rigid insulation board end-users, particularly in the first half of the year. Sales volumes for the second half of 2009 were up 12 percent from the same period of 2008.
Asia and Other operations’ net sales were up two percent due to increased sales volume for the China joint venture partially offset by a decline in average selling prices brought on by lower raw material costs.
38
Table of Contents
Polymer operating income for 2009 declined $0.1 million from operating income reported in 2008. Gross profit increased $9.7 million, or 23 percent, due principally to improved second-half profitability resulting from raw material costs that fell from the historically high levels of 2008. The effects of foreign currency translation reduced the improvement in gross profit by about $1.2 million. Operating expenses increased $9.9 million as 2008 expenses included the $9.9 million gain on the sale of the polyurethane systems product lines. Below are year-to-year comparisons of gross profit by region and total segment operating expenses and operating income:
| (Dollars in thousands) | For the Year Ended | |||||||||||||||
| December 31, 2009 |
December 31, 2008 |
Increase / (Decrease) |
Percent Change |
|||||||||||||
| Gross Profit |
||||||||||||||||
| North America |
$ | 33,821 | $ | 25,932 | $ | 7,889 | +30 | |||||||||
| Europe |
16,424 | 14,497 | 1,927 | +13 | ||||||||||||
| Asia and Other |
1,382 | 1,471 | (89 | ) | –6 | |||||||||||
| Total Polymers Segment |
$ | 51,627 | $ | 41,900 | $ | 9,727 | +23 | |||||||||
| Operating Expenses (1) |
17,670 | 7,797 | 9,873 | +127 | ||||||||||||
| Operating Income |
$ | 33,957 | $ | 34,103 | $ | (146 | ) | — | ||||||||
| (1) | 2008 includes the $9.9 million gain on the sale of the commodity polyurethane systems product lines. |
Gross profit for North American operations improved 30 percent due to the positive impact of lower raw material costs that more than offset the effects of lower sales volume. Raw material costs rose significantly throughout the first three quarters of 2008, resulting in profit margin erosion. Raw material prices dropped significantly in the fourth quarter of 2008 as the effects of the economic recession moved commodity prices downward. Lower freight expenses, caused by lower fuel costs, also contributed to the gross profit improvement.
Gross profit for European operations increased 13 percent despite the five percent drop in sales volume due primarily to the effects of raw material cost declines caused by the global recession. The negative effect of foreign currency translation tempered the gross profit improvement by $1.1 million.
The $9.9 million increase in operating expenses was due to the positive effect that the gain on the product line sale had on third quarter 2008 expenses. Other expenses were essentially unchanged between years.
Specialty Products
Net sales for 2009 were $1.3 million, or three percent, higher than net sales for 2008. Higher sales volumes for all product lines led to the improvement in net sales. Operating income was up $6.7 million, or 112 percent, due to higher sales volumes, lower raw material costs, an improved sales mix resulting from increased sales of higher margin pharmaceutical products and lower plant costs due to the restructuring activities completed in 2007 and 2008.
39
Table of Contents
Corporate Expenses
Corporate expenses increased $19.0 million, or 88 percent, to $40.6 million for 2009 from $21.6 million for 2008. The following table depicts the major items that accounted for the year-to-year increase in corporate expenses:
| (Dollars in millions) | Increase / (Decrease) |
|||
| 2008 Gain on Land Sale |
$ | 8.5 | (a) | |
| Deferred Compensation |
6.8 | (b) | ||
| Legal/Environmental |
1.1 | (c) | ||
| Incentive-Based Compensation |
1.1 | (d) | ||
| Electric Contract Fair Value Loss |
0.9 | (e) | ||
| Other |
0.6 | |||
| Total |
$ | 19.0 | ||
| (a) | Reflects the 2008 gain on the sale of 88 acres of the Millsdale manufacturing facility’s land. No such gains were reported in 2009. |
| (b) | Due to increases in the values of Company common stock and the mutual fund assets to which the Company’s deferred compensation obligations are tied. The value of Company common stock increased $17.82 per share, from $46.99 per share at December 31, 2008, to $64.81 per share at December 31, 2009. |
| (c) | Primarily due to increases in estimated environmental remediation reserve requirements for existing sites. |
| (d) | Includes stock-based compensation, bonuses and profit sharing, all of which increased due to the improvement in Company earnings. |
| (e) | Reflects the marking of the value of U.S. electric contracts (treated as derivative instruments for accounting purposes) to market at December 31, 2009 (included in cost of sales). |
Outlook
In 2010, the Company made significant investments to grow its business in emerging markets and energy and through innovation. The Company’s surfactants segment has completed the expansion of its plant in Brazil, and its new Singapore plant will undergo conversion to a methyl ester facility during 2011 and will start production in 2012. The Company remains optimistic about the surfactants market for enhanced oil recovery. In 2011, the Company will continue to invest to scale this business.
40
Table of Contents
The polymers segment anticipates that continuing global recovery of the insulation market should provide growth within the Company’s polyol business. The expanded capacity for polyol at the Company’s plant in Germany will be available in April 2011.
The Company has a healthy balance sheet and will continue to pursue both organic growth and acquisition opportunities.
Liquidity and Financial Condition
For full-year 2010, cash flow from operating activities of $66.1 million plus net debt activities of $52.9 million were used to fund investing cash outflows of $97.3 million and non-debt financing outflows of $10.5 million. Year-over-year, net income was up by $2.5 million for 2010 versus 2009 while working capital was unfavorable by $94.7 million. Cash flow from operating activities decreased by $100.3 million between years mainly due to a significant swing between years in cash flows for working capital. During 2010, cash increased by $12.7 million including $1.4 million due to the effect of exchange rates.
During 2010, changes in accounts receivable resulted in a cash use of $34.4 million compared to a cash source of $36.4 million during 2009. Inventories were a use of $17.0 million versus a source of $31.8 million for 2009. Accounts payable and accrued liabilities were a source of $7.4 million for 2010 compared to a use of $17.5 million for 2009.
During 2010, higher sales volumes and higher raw material costs were responsible for increased cash outflows for working capital compared to our experience in 2009, when lower raw material costs and lower sales volumes had the opposite effect. For the current year, higher raw material costs and higher sales volumes resulted in higher inventory carrying costs, despite faster inventory turnover. Accounts receivable was unfavorable to cash flow due to both higher selling prices and increased sales volumes. During 2010, customer payment timing was adversely impacted by relatively higher sales growth outside the U.S. where terms of sale are typically longer than in the U.S. Raw material costs continue to be a key driver to the Company’s working capital, with a direct impact on inventory carrying costs as well as an indirect impact on accounts receivable through higher selling prices. The Company has not changed its own payment practices related to its payables. It is management’s opinion that the Company’s liquidity is sufficient to provide for potential increases in working capital during 2011.
Investing activities for 2010 were a net use of $97.3 million compared to a net use of $34.7 million for 2009. For 2010, capital expenditures totaled $73.7 million, an increase of $31.1 million compared to 2009. The current year increase in capital spending was driven mainly by capacity expansions for surfactants in Brazil and for polyols in Germany. Investing activities for 2010 also included $10.4 million for the purchase of manufacturing assets in Singapore and $9.8 million for acquisitions of 100 percent of Alfa Systems Sp. z o.o., in Brzeg Dolny, Poland, and an additional 38.8 percent of the Company’s Stepan Philippines Inc. joint venture. During 2010, the Company liquidated $0.8 million of investments for benefit plan participant payouts versus $3.6 million in 2009. During 2009, the Company recovered $8.5 million of restricted cash relating to a 2008 Internal Revenue Code section 1031 like-kind exchange, a singular cash inflow. For 2011, the Company estimates that full-year capital expenditures will be in a range of $95 million to $100 million, including a capacity expansion in Singapore and the purchase of a leased warehouse at the Company’s Millsdale (Joliet), Illinois, manufacturing site.
The Company purchases its common shares in the open market from time to time to fund its own benefit plans and also to mitigate the dilutive effect of new shares issued under its benefit plans. The Company may also make open market repurchases as cash flows permit when, in
41
Table of Contents
management’s opinion, the Company’s shares are undervalued in the market. During 2010, the Company purchased 92,845 common shares for the treasury in the open market at a total cost of $4.9 million. As of December 31, 2010, there were 268,657 shares remaining under the current share repurchase authorization.
As of December 31, 2010, the Company’s cash and cash equivalents totaled $111.2 million, including $77.0 million in two U.S. money market funds, each of which was rated AAA by Standard and Poor’s and Aaa by Moody’s. Cash in U.S. demand deposit accounts totaled $15.6 million and cash of the Company’s non-U.S. subsidiaries held outside the U.S. totaled $18.6 million at December 31, 2010.
Consolidated debt increased by $87.5 million during 2010, from $104.1 million to $191.6 million, reflecting increases of $42.9 million in U.S. debt and $44.6 million in foreign debt. The U.S. debt increase included a $40.0 million private placement loan completed in June 2010 and the addition of $11.4 million in build-to-suit lease obligations, less scheduled repayments of $8.5 million. The $44.6 million increase in foreign debt was driven primarily by the Alfa Systems acquisition, the German polyol expansion, the Singapore storage facility acquisition and the consolidation of the Company’s Philippine joint venture as of July 19, 2010. Net debt, which is total debt minus cash, increased by $74.8 million during 2010, from $5.6 million to $80.4 million, including a cash increase of $12.7 million. At December 31, 2010, the ratio of total debt to total debt plus shareholders’ equity was 35.2 percent, compared to 26.4 percent at December 31, 2009. The ratio of net debt to net debt plus shareholders’ equity was 18.5 percent at December 31, 2010, compared to 1.9 percent at December 31, 2009.
As of December 31, 2010, the Company’s debt included $106.9 million of unsecured private placement loans with maturities extending from 2010 through 2022. These loans are the Company’s primary source of long-term debt financing, and are supplemented by bank credit facilities to meet short and medium term needs. The Company’s debt also included a $27.0 million term loan with its U.S. banks, which has maturities from 2011 through 2013.
On August 27, 2010, the Company entered into a new committed $60.0 million revolving credit agreement with three U.S. banks. This new agreement is the Company’s primary source of short-term borrowings and replaced a similar facility that would have expired on April 20, 2011 and which was cancelled upon signing the new agreement. The new facility is unsecured, committed through August 27, 2013 and has terms and conditions that are substantially equivalent to those of the Company’s other U.S. loan agreements. As of December 31, 2010, the Company had outstanding letters of credit of $2.6 million and no outstanding debt under this agreement. There was $57.4 million available under this revolving credit agreement as of December 31, 2010. The Company anticipates that cash from operations and cash on hand, as well as committed credit facilities, will be sufficient to fund anticipated capital expenditures, working capital, dividends and other planned financial commitments for the foreseeable future.
On June 1, 2010, the Company completed a new $40.0 million private placement loan with three insurance companies, with loan proceeds to be used for capital expenditures and other corporate purposes. This new loan bears fixed interest at 5.88 percent per annum payable semi-annually with equal annual principal repayments from 2016 through final maturity in 2022. Terms and conditions of this agreement are substantially the same as those in the agreement covering the Company’s 5.69 percent notes issued in 2005.
Certain foreign subsidiaries of the Company maintain term loans and short-term bank lines of credit in their respective local currencies to meet working capital requirements as well as to fund capital expenditure programs and acquisitions. As of December 31, 2010, the Company’s European subsidiaries had bank term loans of $6.4 million with maturities through 2015 and
42
Table of Contents
short-term bank debt of $18.1 million with available short-term borrowing capacity of $18.6 million. The Company’s Latin American subsidiaries had no outstanding debt, with $10.2 million of short-term borrowing capacity as of that date. As of December 31, 2010, the Company’s Singapore subsidiary was obligated for $13.0 million under an asset purchase agreement that took effect on November 4, 2010. The Company’s majority-owned joint ventures in the Philippines and China had debt totaling $8.8 million and available borrowing capacity of $8.5 million. Stepan Company has guaranteed the debt obligations of its Singapore subsidiary and of its majority-owned joint ventures in the Philippines and China.
As of December 31, 2010, the Company’s debt also included an $11.4 million build-to-suit lease obligation for a warehouse at the Company’s Millsdale (Joliet), Illinois, manufacturing site. The agreement was entered into in January 2010 and the Company established occupancy as tenant during October 2010. The Company intends to purchase this warehouse during 2011 pursuant to the terms of the lease agreement.
The Company has material debt agreements that require the maintenance of minimum interest coverage and minimum net worth. These agreements also limit the incurrence of additional debt as well as the payment of dividends and repurchase of treasury shares. Testing for these agreements is based on the combined financial statements of the U.S. operations of Stepan Company and Stepan Canada Inc. (the “Restricted Group”). Under the most restrictive of these debt covenants:
| 1. | The Restricted Group must maintain a minimum interest coverage ratio, as defined within the agreements, of 2.0 to 1.0, for the preceding four calendar quarters. |
| 2. | The Restricted Group must maintain net worth of at least $175.0 million. |
| 3. | The Restricted Group must maintain a ratio of long-term debt to total capitalization, as defined in the agreements, not to exceed 55 percent. |
| 4. | The Restricted Group may pay dividends and purchase treasury shares in amounts of up to $30.0 million plus 100 percent of net income and cash proceeds of stock option exercises, measured cumulatively beginning December 31, 2001. The maximum amount of dividends that could have been paid within this limitation is disclosed as unrestricted retained earnings in Note 7, Debt, in the Notes to Consolidated Financial Statements. |
The Company was in compliance with all of its loan agreements as of December 31, 2010. Based on current projections, the Company believes it will be in compliance with its loan agreements throughout 2011.
43
Table of Contents
Contractual Obligations
At December 31, 2010, the Company’s contractual obligations, including estimated payments by period, were as follows:
| Payments Due by Period | ||||||||||||||||||||
| (Dollars in thousands) | Total | Less than 1 year |
1-3 years | 3-5 years | More than 5 years |
|||||||||||||||
| Long-term debt obligations |
$ | 191,572 | $ | 31,609 | $ | 68,086 | $ | 24,283 | $ | 67,594 | ||||||||||
| Interest payments on debt obligations (a) |
50,161 | 8,822 | 14,587 | 10,090 | 16,662 | |||||||||||||||
| Capital lease obligations |
1,333 | 333 | 667 | 333 | — | |||||||||||||||
| Operating lease obligations |
16,933 | 2,965 | 4,548 | 2,930 | 6,490 | |||||||||||||||
| Purchase obligations (b) |
21,102 | 17,895 | 3,207 | — | — | |||||||||||||||
| Other (c) |
23,013 | 7,069 | 2,628 | 968 | 12,348 | |||||||||||||||
| Total |
$ | 304,114 | $ | 68,693 | $ | 93,723 | $ | 38,604 | $ | 103,094 | ||||||||||
| (a) | Interest payments on debt obligations represent interest on all Company debt at December 31, 2010. The interest payment amounts related to the variable rate component of the Company’s debt assume that interest will be paid at the rates prevailing at December 31, 2010. Future interest rates may change, and therefore, actual interest payments would differ from those disclosed in the above table. |
| (b) | Purchase obligations consist of raw material, utility and telecommunication service purchases made in the normal course of business. |
| (c) | The “Other” category comprises deferred revenues that represent commitments to deliver products; expected 2011 required contributions to the Company’s funded defined benefit pension plans; estimated payments related to the Company’s unfunded defined benefit supplemental executive and outside director pension plans; estimated payments (undiscounted) related to the Company’s asset retirement obligations; and environmental remediation payments for which amounts and periods can be reasonably estimated. |
The above table does not include $73.7 million of other non-current liabilities recorded on the balance sheet at December 31, 2010, as summarized in Note 16 to the consolidated financial statements. The significant non-current liabilities excluded from the table are defined benefit pension, deferred compensation, environmental and legal liabilities and unrecognized tax benefits for which payment periods can not be reasonably determined. In addition, deferred income tax liabilities are excluded from the table due to the uncertainty of their timing.
Pension Plans
The Company has a number of defined benefit pension plans, the most significant of which cover employees in its U.S. and U.K. locations. The U.S. and U.K. plans have been frozen, and service benefit accruals are no longer being made. The underfunded status of the Company’s defined benefit pension plans increased from $31.5 million at December 31, 2009, to $32.7 million at December 31, 2010. Year-over-year declines in the discount rates used to measure pension obligations (60 and 10 basis point declines for the U.S. and U.K. plans, respectively), partially offset by positive plan asset returns and Company contributions, caused the increase in the underfunded status. The Company contributed $3.8 million to its funded defined benefit pension plans in 2010. The Company expects to contribute approximately $5.1 million to the plans in 2011. Payments related to the unfunded non-qualified plans will approximate $0.3 million in 2011 compared to $0.2 million in 2010.
44
Table of Contents
Letters of Credit
The Company maintains standby letters of credit under its workers’ compensation insurance agreements and for other purposes as needed from time to time. The insurance letters of credit are renewed annually and amended to the amounts required by the insurance agreements. As of December 31, 2010, the Company had a total of $2.6 million in outstanding standby letters of credit.
Off-Balance Sheet Arrangements
The Securities and Exchange Commission requires disclosure of off-balance sheet arrangements that either have, or are reasonably likely to have, a current or future effect on the Company’s financial condition, changes in financial condition, revenues or expenses, results of operations, liquidity, capital expenditures or capital resources that is material to investors. During the periods covered by this Form 10-K, the Company was not party to any such off-balance sheet arrangements.
Environmental and Legal Matters
The Company’s operations are subject to extensive local, state and federal regulations. Although the Company’s environmental policies and practices are designed to ensure compliance with these laws and regulations, future developments and increasingly stringent environmental regulation could require the Company to make additional unforeseen environmental expenditures. The Company will continue to invest in the equipment and facilities necessary to comply with existing and future regulations. During 2010, the Company’s expenditures for capital projects related to the environment were $1.6 million. These projects are capitalized and depreciated over their estimated useful lives, which are typically 10 years. Recurring costs associated with the operation and maintenance of facilities for waste treatment and disposal and managing environmental compliance in ongoing operations at the Company’s manufacturing locations were approximately $15.7 million for 2010 and $15.4 million for both 2009 and 2008. While difficult to project, it is not anticipated that these recurring expenses will increase significantly in the future.
Over the years, the Company has received requests for information related to or has been named by the government as a potentially responsible party at a number of waste disposal sites where cleanup costs have been or may be incurred under CERCLA and similar state statutes. In addition, damages are being claimed against the Company in general liability actions for alleged personal injury or property damage in the case of some disposal and plant sites. The Company believes that it has made adequate provisions for the costs it may incur with respect to the sites. See the Critical Accounting Policies section that follows for a discussion of the Company’s environmental liabilities accounting policy. After partial remediation payments at certain sites, the Company has estimated a range of possible environmental and legal losses from $10.0 million to $29.7 million at December 31, 2010, compared to $7.8 million to $31.9 million at December 31, 2009. At December 31, 2010, the Company’s accrued liability for such losses, which represents the Company’s best estimate within the estimated range of possible environmental and legal losses, was $15.9 million compared to $17.1 million at December 31, 2009. Because reported liabilities are recorded based on estimates, actual amounts could differ from those estimates. During 2010, cash outlays related to legal and environmental matters approximated $2.7 million compared to $3.1 million expended in 2009.
45
Table of Contents
For certain sites, estimates of the total costs of compliance or the Company’s share of such costs cannot be determined; consequently, the Company is unable to predict the effect thereof on the Company’s cash flows or results of operations. Management believes that in the event of one or more adverse determinations in any annual or interim period, the impact on the Company’s cash flows or results of operations for those periods could be material. However, based upon the Company’s present belief as to its relative involvement at these sites, other viable entities’ responsibilities for cleanup and the extended period over which any costs would be incurred, the Company believes that these matters will not have a material effect on the Company’s financial position. Certain of these matters are discussed in Item 3, Legal Proceedings, in this Form 10-K and in other filings of the Company with the Securities and Exchange Commission, which are available upon request from the Company. See also Note 17, Contingencies, in the Notes to Consolidated Financial Statements for a summary of the environmental proceedings related to certain environmental sites.
Climate Change Legislation
Based on currently available information, the Company does not believe that existing or pending climate change legislation or regulation is reasonably likely to have a material effect on the Company’s financial condition, results of operations or cash flows.
Critical Accounting Policies
The Company prepares its financial statements in accordance with accounting principles generally accepted in the United States of America (generally accepted accounting principles). Preparation of financial statements in accordance with generally accepted accounting principles requires the Company to make estimates and assumptions that affect the reported amounts of assets and liabilities and disclosure of contingent assets and liabilities at the date of the financial statements and the reported amounts of revenues and expenses during the reporting period. The following is a summary of the accounting policies the Company believes are the most important to aid in understanding its financial results.
Deferred Compensation
The Company sponsors deferred compensation plans that allow management employees to defer receipt of their bonuses and outside directors to defer receipt of their director fees until retirement, departure from the Company or as elected by the participant. The Company funds its obligations associated with these plans by purchasing investment assets that match the investment choices made by the plan participants. The investment options include Company common stock and a limited selection of mutual funds. The Company maintains sufficient shares of treasury stock to cover the equivalent number of shares resulting from participants electing the Company common stock option. As a result, the Company must periodically purchase its common shares on the open market. The plans allow for the deferred compensation to grow or decline based on the results of the investment options chosen by the participants. Some plan distributions may be made in cash or Company common stock at the election of the participant. Certain plan distributions can only be made in Company common stock. Upon
46
Table of Contents
retirement or departure from the Company, participants receive cash amounts equivalent to the payment date value of the investment choices they have made or Company common stock shares equal to the number of share equivalents held in their account. For deferred compensation obligations that may be settled in cash, appreciation in the value of Company common stock or the mutual fund options under the plan results in additional compensation expense to the Company. Conversely, declines in the value of Company stock or the mutual funds result in a reduction of compensation expense since such declines reduce the cash obligation of the Company as of the date of the financial statements. These market price movements may result in significant period-to-period fluctuations in the Company’s income. Because the obligations that must be settled only in Company common stock are treated as equity instruments, fluctuations in the market price of the underlying Company stock do not affect earnings.
At December 31, 2010, the Company’s deferred compensation liability was $32.3 million, of which approximately 62 percent represented deferred compensation tied to the performance of the Company’s common stock; the remainder was tied to the mutual fund investment choices. A $1.00 increase in the market price of the Company’s common stock will result in approximately $0.3 million of additional compensation expense. A $1.00 reduction in the market price of the common stock will reduce compensation expense by a like amount. The expense or income associated with the mutual fund component will generally fluctuate in line with the overall percentage increase or decrease of the U.S. stock markets.
The mutual fund assets are recorded on the Company’s balance sheet at cost when acquired and adjusted to their market values at the end of each reporting period. Since 2008, when the Company elected the fair value option provided by generally accepted accounting principles for the mutual fund investment assets related to its deferred compensation plans, market value changes for the mutual fund investment assets are recorded in the income statement in the same periods that the offsetting changes in the deferred compensation liabilities are recorded. Prior to 2008, value changes for the mutual fund investments were recorded as direct adjustments to shareholders’ equity in accumulated other comprehensive income. The accounting treatment for the portions of the deferred compensation liabilities that are tied to the Company’s common stock values was not affected by the fair value election. Dividends, capital gains distributed by the mutual funds, unrealized gains and losses and realized gains and losses from sales of mutual fund shares, are recognized as investment income/loss in the other, net line of the consolidated statements of income.
Environmental Liabilities
It is the Company’s accounting policy to record environmental liabilities when environmental assessments and/or remedial efforts are probable and the cost or range of possible costs can be reasonably estimated. When no amount within a range of possible costs is a better estimate than any other amount, the minimum is accrued. Some of the factors on which the Company bases its estimates include information provided by feasibility studies, potentially responsible party negotiations and the development of remedial action plans.
Estimates for environmental liabilities are subject to significant fluctuations as new facts emerge related to the various sites where the Company is exposed to liability for the remediation of environmental contamination. See the Environmental and Legal Matters section of this MD&A for discussion of the Company’s reserves and range of loss estimates.
47
Table of Contents
Revenue Recognition
Revenue is recognized upon shipment of goods to customers, at which time title and risk of loss pass to the customer. For arrangements where the Company consigns product to a customer location, revenue is recognized when the customer uses the inventory. The Company records shipping and handling billed to a customer in a sales transaction as revenue. Costs incurred for shipping and handling are recorded in cost of sales. Volume discounts due customers are estimated and recorded in the same period as the sales to which the discounts relate and reported as reductions of revenue in the consolidated statements of income.
Recent Accounting Pronouncements
See Note 1 to the consolidated financial statements, included in Part II, Item 8, for information on recent accounting pronouncements, which affect the Company.
48
Table of Contents
| Item 7A. | Quantitative and Qualitative Disclosures About Market Risk |
FOREIGN CURRENCY EXCHANGE RISK
Because the Company operates globally, its cash flows and operating results are subject to movements in foreign currency exchange rates. The Company manufactures and sells products in many foreign locations and, therefore, believes its currency exchange risk is well diversified. Except as noted below, substantially all the Company’s foreign subsidiaries’ financial instruments are denominated in their respective functional currencies. Gains and losses on unhedged foreign currency transactions are recorded in income.
The Company uses forward contracts to mitigate the exposure of certain foreign currency transactions and balances to fluctuating exchange rates. At December 31, 2010, the Company had one forward contract to sell $20.0 million on behalf of its Canadian subsidiary, one contract to purchase €1.6 million on behalf of its U.K. subsidiary, and contracts to buy $2.5 million and $0.4 million on behalf of its French and German subsidiaries, respectively.
Periodically, the Company and its subsidiaries issue U.S. dollar and euro denominated trade receivables or loans to each other. Gains and losses on these transactions are included in income. Foreign currency exposures for the Company’s Canadian and European subsidiaries are essentially all covered by forward contracts as noted above. As of December 31, 2010, the Company had net receivables of $8.6 million due from its Brazilian subsidiary. Hypothetical fluctuations of 10 percent in the exchange rate of the Brazilian real would result in a gain or loss of $0.9 million.
INTEREST RATES
The Company’s debt was made up of fixed-rate and variable-rate borrowings totaling $137.7 million and $53.9 million, respectively, as of December 31, 2010. For 2011, it is projected that interest on short-term variable-rate borrowings will total approximately $0.8 million. A hypothetical 10 percent average change to short-term interest rates would result in a $0.1 million increase or decrease to interest expense for 2011.
The fair value of the Company’s long term fixed-rate debt, including current maturities, was estimated to be $122.0 million as of December 31, 2010, which was approximately $8.7 million above the carrying value. Market risk was estimated as the potential increase to the fair value that would result from a hypothetical 10 percent decrease in the Company’s weighted average long-term borrowing rates at December 31, 2010, or $2.4 million.
The Company’s long-term debt also includes a $27.0 million unsecured bank term loan that carries a contractual interest rate of LIBOR plus 125 basis points. The current market spread over LIBOR for this type of loan would be approximately 225 basis points. As of December 31, 2010, the fair value of this term loan was approximately $0.6 million less than the carrying value. A hypothetical 10 percent decrease in the market borrowing rate would increase the fair value of this term loan by $0.2 million.
49
Table of Contents
COMMODITY PRICE RISK
Certain raw materials used in the manufacture of the Company’s products are subject to price volatility caused by weather, petroleum prices, general economic demand and other unpredictable factors. Increased raw material costs are recovered from customers as quickly as the marketplace allows; however, certain customers have arrangements that allow for price changes only on a quarterly basis, and competitive pressures sometimes prevent the recovery of cost increases from customers, particularly in periods where there is excess industry capacity. As a result, for some product lines or market segments it may take time to recover raw material price increases. Periodically, firm purchase commitments are entered into which fix the price of a specific commodity that will be delivered at a future time. Forward contracts are used to aid in managing the Company’s natural gas and electric costs. At December 31, 2010, the Company had open forward contracts for the purchase of 1.1 million dekatherms of natural gas at a cost of $6.2 million. Because the Company has agreed to fixed prices for the noted quantity of natural gas, a hypothetical 10 percent fluctuation in the price of natural gas would cause the Company’s actual natural gas cost to be $0.6 million higher or lower than the market price. Also at December 31, 2010, the Company had contracts to purchase approximately 48,000 megawatt hours of electricity at a cost of $3.6 million. Because the Company has agreed to fixed prices for the noted quantity of electricity, a hypothetical 10 percent fluctuation in the price of electricity would cause the Company’s actual electric cost to be $0.4 million higher or lower than the market price.
50
Table of Contents
| Item 8. | Financial Statements and Supplementary Data |
The following statements and data are included in this item:
Report of Independent Registered Public Accounting Firm
Consolidated Statements of Income (For years ended December 31, 2010, 2009 and 2008)
Consolidated Balance Sheets (December 31, 2010 and 2009)
Consolidated Statements of Cash Flow (For years ended December 31, 2010, 2009 and 2008)
Consolidated Statements of Stockholders’ Equity (For years ended December 31, 2010, 2009 and 2008)
Notes to Consolidated Financial Statements
Selected Quarterly Financial Data
51
Table of Contents
Report of Independent Registered Public Accounting Firm
To the Board of Directors and Stockholders of
Stepan Company
Northfield, Illinois
We have audited the accompanying consolidated balance sheets of Stepan Company and subsidiaries (the “Company”) as of December 31, 2010 and 2009, and the related consolidated statements of income, stockholders’ equity, and cash flows for each of the three years in the period ended December 31, 2010. These financial statements are the responsibility of the Company’s management. Our responsibility is to express an opinion on the financial statements based on our audits.
We conducted our audits in accordance with the standards of the Public Company Accounting Oversight Board (United States). Those standards require that we plan and perform the audit to obtain reasonable assurance about whether the financial statements are free of material misstatement. An audit includes examining, on a test basis, evidence supporting the amounts and disclosures in the financial statements. An audit also includes assessing the accounting principles used and significant estimates made by management, as well as evaluating the overall financial statement presentation. We believe that our audits provide a reasonable basis for our opinion.
In our opinion, such consolidated financial statements present fairly, in all material respects, the financial position of Stepan Company and subsidiaries as of December 31, 2010 and 2009, and the results of their operations and their cash flows for each of the three years in the period ended December 31, 2010, in conformity with accounting principles generally accepted in the United States of America.
We have also audited, in accordance with the standards of the Public Company Accounting Oversight Board (United States), the Company’s internal control over financial reporting as of December 31, 2010, based on criteria established in Internal Control – Integrated Framework issued by the Committee of Sponsoring Organizations of the Treadway Commission and our report dated February 28, 2011, expressed an unqualified opinion on the Company’s internal control over financial reporting.
| /s/ Deloitte & Touche LLP |
| DELOITTE & TOUCHE LLP |
| Chicago, Illinois |
| February 28, 2011 |
52
Table of Contents
Stepan Company
Consolidated Statements of Income
For the years ended December 31, 2010, 2009 and 2008
| (In thousands, except per share amounts) |
2010 | 2009 | 2008 | |||||||||
| Net Sales (Note 1) |
$ | 1,431,122 | $ | 1,276,382 | $ | 1,600,130 | ||||||
| Cost of Sales |
1,195,144 | 1,043,279 | 1,430,593 | |||||||||
| Gross Profit |
235,978 | 233,103 | 169,537 | |||||||||
| Operating Expenses: |
||||||||||||
| Marketing (Note1) |
40,273 | 40,434 | 41,218 | |||||||||
| Administrative (Note 1) |
49,501 | 51,287 | 41,600 | |||||||||
| Research, development and technical services (Note 1) |
38,307 | 36,494 | 34,437 | |||||||||
| Sale of land (Note 21) |
— | — | (8,469 | ) | ||||||||
| Sale of product lines (Note 20) |
— | — | (9,929 | ) | ||||||||
| 128,081 | 128,215 | 98,857 | ||||||||||
| Operating Income |
107,897 | 104,888 | 70,680 | |||||||||
| Other Income (Expense): |
||||||||||||
| Interest, net (Note 7) |
(6,341 | ) | (6,271 | ) | (9,514 | ) | ||||||
| Loss from equity in joint ventures (Note 1) |
(1,663 | ) | (3,709 | ) | (2,697 | ) | ||||||
| Other, net (Note 9) |
1,586 | 2,223 | (3,591 | ) | ||||||||
| (6,418 | ) | (7,757 | ) | (15,802 | ) | |||||||
| Income Before Provision for Income Taxes |
101,479 | 97,131 | 54,878 | |||||||||
| Provision for income taxes (Note 10) |
35,888 | 34,028 | 17,615 | |||||||||
| Net Income |
65,591 | 63,103 | 37,263 | |||||||||
| Net Income Attributable to Noncontrolling Interests (Note 1) |
(164 | ) | (54 | ) | (91 | ) | ||||||
| Net Income Attributable to Stepan Company |
$ | 65,427 | $ | 63,049 | $ | 37,172 | ||||||
| Net Income Per Common Share Attributable to Stepan Company (Note 19): |
||||||||||||
| Basic |
$ | 6.36 | $ | 6.31 | $ | 3.81 | ||||||
| Diluted |
$ | 5.90 | $ | 5.84 | $ | 3.52 | ||||||
| Shares Used to Compute Net Income Per Common Share Attributable to Stepan Company (Note 19): |
||||||||||||
| Basic |
10,163 | 9,870 | 9,566 | |||||||||
| Diluted |
11,090 | 10,796 | 10,549 | |||||||||
The accompanying Notes to Consolidated Financial Statements are an integral part of these statements.
53
Table of Contents
Stepan Company
Consolidated Balance Sheets
December 31, 2010 and 2009
| (Dollars in thousands) |
2010 | 2009 | ||||||
| Assets |
||||||||
| Current Assets: |
||||||||
| Cash and cash equivalents |
$ | 111,198 | $ | 98,518 | ||||
| Receivables, less allowances of $6,145 in 2010 and $6,762 in 2009 |
199,245 | 157,117 | ||||||
| Inventories (Note 6) |
96,552 | 74,693 | ||||||
| Deferred income taxes (Note 10) |
8,170 | 9,036 | ||||||
| Other current assets |
12,661 | 10,228 | ||||||
| Total current assets |
427,826 | 349,592 | ||||||
| Property, Plant and Equipment: |
||||||||
| Land |
11,917 | 12,211 | ||||||
| Buildings and improvements |
139,384 | 109,357 | ||||||
| Machinery and equipment |
832,427 | 791,254 | ||||||
| Construction in progress |
71,825 | 23,355 | ||||||
| 1,055,553 | 936,177 | |||||||
| Less: accumulated depreciation |
701,968 | 687,559 | ||||||
| Property, plant and equipment, net |
353,585 | 248,618 | ||||||
| Goodwill, net (Note 5) |
6,717 | 4,502 | ||||||
| Other intangible assets, net (Note 5) |
5,257 | 4,931 | ||||||
| Long-term investments (Note 3) |
11,904 | 10,539 | ||||||
| Other non-current assets |
6,142 | 16,021 | ||||||
| Total assets |
$ | 811,431 | $ | 634,203 | ||||
| Liabilities and Stockholders’ Equity |
||||||||
| Current Liabilities: |
||||||||
| Current maturities of long-term debt (Note 7) |
$ | 31,609 | $ | 10,173 | ||||
| Accounts payable |
115,248 | 94,666 | ||||||
| Accrued liabilities (Note 15) |
58,770 | 58,456 | ||||||
| Total current liabilities |
205,627 | 163,295 | ||||||
| Deferred income taxes (Note 10) |
5,154 | 2,837 | ||||||
| Long-term debt, less current maturities (Note 7) |
159,963 | 93,911 | ||||||
| Other non-current liabilities (Note 16) |
87,616 | 83,733 | ||||||
| Commitments and Contingencies (Note 17) |
||||||||
| Stockholders’ Equity (Note 11): |
||||||||
| 5 1/2 percent convertible preferred stock, cumulative, voting, without par value; authorized 2,000,000 shares; issued and outstanding 520,089 shares in 2010 and 546,396 shares in 2009 |
13,002 | 13,660 | ||||||
| Common stock, $1 par value; authorized 30,000,000 shares; issued 11,511,829 shares in 2010 and 11,229,261 shares in 2009 |
11,512 | 11,229 | ||||||
| Additional paid-in capital |
83,852 | 71,267 | ||||||
| Accumulated other comprehensive loss (Note 1) |
(25,599 | ) | (25,893 | ) | ||||
| Retained earnings |
305,830 | 250,973 | ||||||
| Less: Common treasury stock, at cost, 1,406,081 shares in 2010 and 1,281,046 shares in 2009 |
(39,106 | ) | (31,951 | ) | ||||
| Total Stepan Company stockholders’ equity |
349,491 | 289,285 | ||||||
| Noncontrolling interests |
3,580 | 1,142 | ||||||
| Total stockholders’ equity |
353,071 | 290,427 | ||||||
| Total liabilities and stockholders’ equity |
$ | 811,431 | $ | 634,203 | ||||
The accompanying Notes to Consolidated Financial Statements are an integral part of these statements.
54
Table of Contents
Stepan Company
Consolidated Statements of Cash Flows
For the years ended December 31, 2010, 2009 and 2008
| (Dollars in thousands) |
2010 | 2009 | 2008 | |||||||||
| Cash Flows From Operating Activities |
||||||||||||
| Net income |
$ | 65,591 | $ | 63,103 | $ | 37,263 | ||||||
| Adjustments to reconcile net income to net cash provided by operating activities: |
||||||||||||
| Depreciation and amortization |
40,351 | 37,171 | 36,928 | |||||||||
| Deferred compensation |
5,020 | 7,010 | 211 | |||||||||
| Realized and unrealized (gain) loss on long-term investments |
(1,367 | ) | (1,929 | ) | 4,966 | |||||||
| Stock-based compensation |
3,789 | 4,754 | 3,700 | |||||||||
| Deferred income taxes |
5,365 | 8,190 | 1,278 | |||||||||
| Sale of land |
— | — | (8,469 | ) | ||||||||
| Gain on sale of product line |
— | — | (9,929 | ) | ||||||||
| Equity in earnings of joint ventures and other non-cash items |
1,292 | 5,799 | 2,646 | |||||||||
| Changes in assets and liabilities, excluding effects of acquisitions: |
||||||||||||
| Receivables, net |
(34,449 | ) | 36,397 | (19,058 | ) | |||||||
| Inventories |
(16,975 | ) | 31,819 | (24,044 | ) | |||||||
| Other current assets |
(576 | ) | (652 | ) | (1,017 | ) | ||||||
| Accounts payable and accrued liabilities |
7,409 | (17,461 | ) | 7,761 | ||||||||
| Pension liabilities |
(2,252 | ) | (4,537 | ) | 1,828 | |||||||
| Environmental and legal liabilities |
(2,481 | ) | 429 | (578 | ) | |||||||
| Deferred revenues |
(1,404 | ) | (645 | ) | (1,398 | ) | ||||||
| Excess tax benefit from stock options and awards |
(3,187 | ) | (3,007 | ) | (2,958 | ) | ||||||
| Net Cash Provided By Operating Activities |
66,126 | 166,441 | 29,130 | |||||||||
| Cash Flows From Investing Activities |
||||||||||||
| Expenditures for property, plant and equipment |
(73,748 | ) | (42,631 | ) | (49,778 | ) | ||||||
| Asset acquisition (Note 2) |
(10,400 | ) | — | — | ||||||||
| Business acquisitions, net of cash acquired (Note 2) |
(9,835 | ) | — | — | ||||||||
| Proceeds from sale of product line |
— | — | 9,929 | |||||||||
| Change in restricted cash |
— | 8,477 | (8,477 | ) | ||||||||
| Sale of mutual funds |
780 | 3,594 | 933 | |||||||||
| Proceeds from sale of land |
— | — | 8,634 | |||||||||
| Other, net |
(4,051 | ) | (4,182 | ) | (4,287 | ) | ||||||
| Net Cash Used In Investing Activities |
(97,254 | ) | (34,742 | ) | (43,046 | ) | ||||||
| Cash Flows From Financing Activities |
||||||||||||
| Revolving debt and bank overdrafts, net |
16,849 | (24,082 | ) | 756 | ||||||||
| Term loan |
40,000 | — | 30,000 | |||||||||
| Other debt borrowings |
6,449 | 1,777 | 4,150 | |||||||||
| Other debt repayments |
(10,427 | ) | (16,690 | ) | (17,507 | ) | ||||||
| Dividends paid |
(10,570 | ) | (9,557 | ) | (8,863 | ) | ||||||
| Company stock repurchased |
(4,906 | ) | (1,927 | ) | — | |||||||
| Stock option exercises |
4,335 | 6,908 | 6,813 | |||||||||
| Excess tax benefit from stock options and awards |
3,187 | 3,007 | 2,958 | |||||||||
| Other, net |
(2,544 | ) | (1,396 | ) | (1,200 | ) | ||||||
| Net Cash Provided By (Used In) Financing Activities |
42,373 | (41,960 | ) | 17,107 | ||||||||
| Effect of Exchange Rate Changes on Cash |
1,435 | 521 | (672 | ) | ||||||||
| Net Increase in Cash and Cash Equivalents |
12,680 | 90,260 | 2,519 | |||||||||
| Cash and Cash Equivalents at Beginning of Year |
98,518 | 8,258 | 5,739 | |||||||||
| Cash and Cash Equivalents at End of Year |
$ | 111,198 | $ | 98,518 | $ | 8,258 | ||||||
| Supplemental Cash Flow Information |
||||||||||||
| Cash payments of income taxes, net of refunds |
$ | 25,091 | $ | 28,809 | $ | 7,634 | ||||||
| Cash payments of interest |
$ | 6,630 | $ | 6,887 | $ | 9,619 | ||||||
The accompanying Notes to Consolidated Financial Statements are an integral part of these statements.
55
Table of Contents
Stepan Company
Consolidated Statements of Stockholders’ Equity
For the years ended December 31, 2010, 2009 and 2008
| (Dollars in thousands) | STEPAN COMPANY SHAREHOLDERS | |||||||||||||||||||||||||||||||||||
| Total | Comprehensive Income |
Convertible Preferred Stock |
Common Stock |
Additional Paid-in Capital |
Treasury Stock |
Accumulated Other Comprehensive Income (Loss) |
Retained Earnings |
Noncontrolling Interest |
||||||||||||||||||||||||||||
| Balance, January 1, 2008 |
$ | 206,727 | $ | — | $ | 14,194 | $ | 10,457 | $ | 37,618 | $ | (24,801 | ) | $ | 245 | $ | 168,338 | $ | 676 | |||||||||||||||||
| Adoption of fair value option - unrealized investment gains transition adjustment |
— | — | — | — | — | — | (834 | ) | 834 | — | ||||||||||||||||||||||||||
| Additional interest in Stepan China joint venture |
231 | — | — | — | — | — | — | — | 231 | |||||||||||||||||||||||||||
| Issuance of 364,000 shares of common stock under stock option plan |
9,518 | — | — | 364 | 9,154 | — | — | — | — | |||||||||||||||||||||||||||
| Purchase of 77,685 shares of common stock |
(3,689 | ) | — | — | — | — | (3,689 | ) | — | — | — | |||||||||||||||||||||||||
| Conversion of preferred stock to common stock |
— | — | (433 | ) | 20 | 413 | — | — | — | — | ||||||||||||||||||||||||||
| Stock-based compensation |
3,700 | — | — | — | 3,700 | — | — | — | — | |||||||||||||||||||||||||||
| Deferred compensation |
692 | — | — | — | 692 | — | — | — | — | |||||||||||||||||||||||||||
| Profit sharing (transfer of 16,859 shares of treasury stock) |
541 | — | — | — | 177 | 364 | — | — | — | |||||||||||||||||||||||||||
| Net income |
37,263 | 37,263 | — | — | — | — | — | 37,172 | 91 | |||||||||||||||||||||||||||
| Other comprehensive income: |
||||||||||||||||||||||||||||||||||||
| Foreign currency translation adjustments |
(21,581 | ) | (21,581 | ) | — | — | — | — | (21,672 | ) | — | 91 | ||||||||||||||||||||||||
| Defined benefit pension plans: |
||||||||||||||||||||||||||||||||||||
| Net actuarial loss arising in period (net of taxes of $11,410) |
(18,669 | ) | (18,669 | ) | — | — | — | — | (18,669 | ) | — | — | ||||||||||||||||||||||||
| Less: Amortization of prior service cost included in pension expense (net of taxes of $6) |
16 | 16 | — | — | — | — | 16 | — | — | |||||||||||||||||||||||||||
| Amortization of actuarial loss included in pension expense (net of taxes of $230) |
367 | 367 | — | — | — | — | 367 | — | — | |||||||||||||||||||||||||||
| Amortization of transitional obligation included in pension expense (net of taxes $9) |
22 | 22 | — | — | — | — | 22 | — | — | |||||||||||||||||||||||||||
| Net defined pension plan activity in period |
(18,264 | ) | (18,264 | ) | — | — | — | — | (18,264 | ) | — | — | ||||||||||||||||||||||||
| Comprehensive income |
(2,582 | ) | (2,582 | ) | — | — | — | — | — | — | — | |||||||||||||||||||||||||
| Comprehensive income attributable to the noncontrolling interest |
182 | 182 | — | — | — | — | — | — | — | |||||||||||||||||||||||||||
| Comprehensive income attributable to Stepan Company |
(2,764 | ) | (2,764 | ) | — | — | — | — | — | — | — | |||||||||||||||||||||||||
| Cash dividends paid: |
||||||||||||||||||||||||||||||||||||
| Preferred stock ($1.375 per share) |
(769 | ) | — | — | — | — | — | — | (769 | ) | — | |||||||||||||||||||||||||
| Common stock ($0.85 per share) |
(8,094 | ) | — | — | — | — | — | — | (8,094 | ) | — | |||||||||||||||||||||||||
| Non-qualified stock option income tax benefit |
2,958 | — | — | — | 2,958 | — | — | — | — | |||||||||||||||||||||||||||
| Balance, December 31, 2008 |
$ | 209,233 | $ | — | $ | 13,761 | $ | 10,841 | $ | 54,712 | $ | (28,126 | ) | $ | (40,525 | ) | $ | 197,481 | $ | 1,089 | ||||||||||||||||
56
Table of Contents
Stepan Company
Consolidated Statements of Stockholders’ Equity
For the years ended December 31, 2010, 2009 and 2008
| (Dollars in thousands) | STEPAN COMPANY SHAREHOLDERS | |||||||||||||||||||||||||||||||||||
| Total | Comprehensive Income |
Convertible Preferred Stock |
Common Stock |
Additional Paid-in Capital |
Treasury Stock |
Accumulated Other Comprehensive Income (Loss) |
Retained Earnings |
Noncontrolling Interest |
||||||||||||||||||||||||||||
| Balance, December 31, 2008 |
$ | 209,233 | $ | — | $ | 13,761 | $ | 10,841 | $ | 54,712 | $ | (28,126 | ) | $ | (40,525 | ) | $ | 197,481 | $ | 1,089 | ||||||||||||||||
| Issuance of 335,644 shares of common stock under stock option plan |
8,052 | — | — | 336 | 7,716 | — | — | — | — | |||||||||||||||||||||||||||
| Purchase of 99,561 shares of common stock |
(4,466 | ) | — | — | — | — | (4,466 | ) | — | — | — | |||||||||||||||||||||||||
| Conversion of preferred stock to common stock |
— | — | (101 | ) | 6 | 95 | — | — | — | — | ||||||||||||||||||||||||||
| Stock-based compensation |
4,754 | — | — | 46 | 4,708 | — | — | — | — | |||||||||||||||||||||||||||
| Deferred compensation |
689 | — | — | — | 689 | — | — | — | — | |||||||||||||||||||||||||||
| Profit sharing (transfer of 27,372 shares of treasury stock) |
981 | — | — | — | 340 | 641 | — | — | — | |||||||||||||||||||||||||||
| Net income |
63,103 | 63,103 | — | — | — | — | — | 63,049 | 54 | |||||||||||||||||||||||||||
| Other comprehensive income: |
||||||||||||||||||||||||||||||||||||
| Foreign currency translation adjustments |
12,595 | 12,595 | — | — | — | — | 12,596 | — | (1 | ) | ||||||||||||||||||||||||||
| Defined benefit pension plans: |
||||||||||||||||||||||||||||||||||||
| Net actuarial gain arising in period (net of taxes of $1,216) |
1,184 | 1,184 | — | — | — | — | 1,184 | — | — | |||||||||||||||||||||||||||
| Less: Amortization of prior service cost included in pension expense (net of taxes of $5) |
12 | 12 | — | — | — | — | 12 | — | — | |||||||||||||||||||||||||||
| Amortization of actuarial loss included in pension expense (net of taxes of $498) |
822 | 822 | — | — | — | — | 822 | — | — | |||||||||||||||||||||||||||
| Amortization of transitional obligation included in pension expense (net of taxes $7) |
18 | 18 | — | — | — | — | 18 | — | — | |||||||||||||||||||||||||||
| Net defined pension plan activity in period |
2,036 | 2,036 | — | — | — | — | 2,036 | — | — | |||||||||||||||||||||||||||
| Comprehensive income |
77,734 | 77,734 | — | — | — | — | — | — | — | |||||||||||||||||||||||||||
| Comprehensive income attributable to the noncontrolling interest |
53 | 53 | — | — | — | — | — | — | — | |||||||||||||||||||||||||||
| Comprehensive income attributable to Stepan Company |
77,681 | 77,681 | — | — | — | — | — | — | — | |||||||||||||||||||||||||||
| Cash dividends paid: |
||||||||||||||||||||||||||||||||||||
| Preferred stock ($1.375 per share) |
(755 | ) | — | — | — | — | — | — | (755 | ) | — | |||||||||||||||||||||||||
| Common stock ($0.90 per share) |
(8,802 | ) | — | — | — | — | — | — | (8,802 | ) | — | |||||||||||||||||||||||||
| Non-qualified stock option and stock award income tax benefit |
3,007 | — | — | — | 3,007 | — | — | — | — | |||||||||||||||||||||||||||
| Balance, December 31, 2009 |
$ | 290,427 | $ | — | $ | 13,660 | $ | 11,229 | $ | 71,267 | $ | (31,951 | ) | $ | (25,893 | ) | $ | 250,973 | $ | 1,142 | ||||||||||||||||
57
Table of Contents
Stepan Company
Consolidated Statements of Stockholders’ Equity
For the years ended December 31, 2010, 2009 and 2008
| (Dollars in thousands) | STEPAN COMPANY SHAREHOLDERS | |||||||||||||||||||||||||||||||||||
| Total | Comprehensive Income |
Convertible Preferred Stock |
Common Stock |
Additional Paid-in Capital |
Treasury Stock |
Accumulated Other Comprehensive Income (Loss) |
Retained Earnings |
Noncontrolling Interest |
||||||||||||||||||||||||||||
| Balance, December 31, 2009 |
$ | 290,427 | $ | — | $ | 13,660 | $ | 11,229 | $ | 71,267 | $ | (31,951 | ) | $ | (25,893 | ) | $ | 250,973 | $ | 1,142 | ||||||||||||||||
| Issuance of 187,254 shares of common stock under stock option plan |
5,006 | — | — | 187 | 4,819 | — | — | — | — | |||||||||||||||||||||||||||
| Acquisition of controlling interest in Stepan Philippines, Inc |
2,090 | — | — | — | — | — | — | — | 2,090 | |||||||||||||||||||||||||||
| Purchase of 125,035 shares of common stock, net of re-issuances |
(7,155 | ) | — | — | — | — | (7,155 | ) | — | — | — | |||||||||||||||||||||||||
| Conversion of preferred stock to common stock |
— | — | (658 | ) | 30 | 628 | — | — | — | — | ||||||||||||||||||||||||||
| Stock-based compensation |
3,789 | — | — | 66 | 3,723 | — | — | — | — | |||||||||||||||||||||||||||
| Deferred compensation |
228 | — | — | — | 228 | — | — | — | — | |||||||||||||||||||||||||||
| Net income |
65,591 | 65,591 | — | — | — | — | — | 65,427 | 164 | |||||||||||||||||||||||||||
| Other comprehensive income: |
||||||||||||||||||||||||||||||||||||
| Foreign currency translation adjustments |
2,585 | 2,585 | — | — | — | — | 2,401 | — | 184 | |||||||||||||||||||||||||||
| Defined benefit pension plans: |
||||||||||||||||||||||||||||||||||||
| Net actuarial loss arising in period (net of taxes of $2,349) |
(3,618 | ) | (3,618 | ) | — | — | — | — | (3,618 | ) | — | — | ||||||||||||||||||||||||
| Less: Amortization of prior service cost included in pension expense (net of taxes of $6) |
13 | 13 | — | — | — | — | 13 | — | — | |||||||||||||||||||||||||||
| Amortization of actuarial loss included in pension expense (net of taxes of $866) |
1,479 | 1,479 | — | — | — | — | 1,479 | — | — | |||||||||||||||||||||||||||
| Amortization of transitional obligation included in pension expense (net of taxes $8) |
19 | 19 | — | — | — | — | 19 | — | — | |||||||||||||||||||||||||||
| Net defined pension plan activity in period |
(2,107 | ) | (2,107 | ) | — | — | — | — | (2,107 | ) | — |
|
— |
| ||||||||||||||||||||||
| Comprehensive income |
66,069 | 66,069 | — | — | — | — | — | — | — | |||||||||||||||||||||||||||
| Comprehensive income attributable to the noncontrolling interest |
348 | 348 | — | — | — | — | — | — | — | |||||||||||||||||||||||||||
| Comprehensive income attributable to Stepan Company |
65,721 | 65,721 | — | — | — | — | — | — | — | |||||||||||||||||||||||||||
| Cash dividends paid: |
||||||||||||||||||||||||||||||||||||
| Preferred stock ($1.375 per share) |
(747 | ) | — | — | — | — | — | — | (747 | ) | — | |||||||||||||||||||||||||
| Common stock ($0.98 per share) |
(9,823 | ) | — | — | — | — | — | — | (9,823 | ) | — | |||||||||||||||||||||||||
| Non-qualified stock option and stock award income tax benefit |
3,187 | — | — | — | 3,187 | — | — | — | — | |||||||||||||||||||||||||||
| Balance, December 31, 2010 |
$ | 353,071 | $ | — | $ | 13,002 | $ | 11,512 | $ | 83,852 | $ | (39,106 | ) | $ | (25,599 | ) | $ | 305,830 | $ | 3,580 | ||||||||||||||||
The accompanying Notes to Consolidated Financial Statements are an integral part of these statements.
58
Table of Contents
Notes to Consolidated Financial Statements
For the years ended December 31, 2010, 2009 and 2008
1. Summary of Significant Accounting Policies
Nature of Operations
Stepan Company (the Company) operations consist predominantly of the production and sale of specialty and intermediate chemicals, which are sold to other manufacturers for use in a variety of end products. Principal markets for all products are manufacturers of cleaning and washing compounds (including detergents, shampoos, fabric softeners, toothpastes and household cleaners), paints, cosmetics, food and beverages, agricultural products, plastics, furniture, automotive equipment, insulation and refrigeration.
Use of Estimates
The preparation of financial statements in conformity with accounting principles generally accepted in the United States of America requires Company management to make estimates and assumptions that affect the reported amounts of assets and liabilities and disclosure of contingent assets and liabilities at the date of the financial statements and the reported amounts of revenues and expenses during the reporting period. Actual results could differ from those estimates.
Principles of Consolidation
The consolidated financial statements include the accounts of the Company and all wholly and majority-owned subsidiaries in which the Company exercises controlling influence. The equity method is used to account for investments in which the Company exercises significant but noncontrolling influence. See Joint Ventures below. All intercompany balances and transactions have been eliminated in consolidation.
Joint Ventures
The Company is a partner in three joint ventures: Nanjing Stepan Jinling Chemical Limited Liability Company (“Stepan China”) in Nanjing, China; Stepan Philippines, Inc. (“SPI”) in Bauan, Batangas, Philippines; and TIORCO, LLC in Denver, Colorado. Stepan China was formed to manufacture the Company’s aromatic polyester polyols for China’s domestic market. In May 2008, the Company increased its controlling ownership interest in Stepan China from 55 percent to 80 percent. See Note 22. The Company includes Stepan China’s accounts in its consolidated financial statements, and the joint venture partner’s interests in Stepan China’s income and net assets are reported in the noncontrolling interest lines of the consolidated statements of income and balance sheets, respectively.
SPI owns and operates a manufacturing facility, which produces surfactants that are sold in the Philippines, Southeast Asia and other countries. On July 19, 2010, the Company acquired controlling interest in SPI, raising its ownership interest to 88.8 percent from 50 percent. See Note 2. Prior to July 19, 2010, the Company’s investment in SPI was accounted for under the equity method and was included in the other non-current assets line on the consolidated balance
59
Table of Contents
sheets. The Company’s share of SPI’s net earnings was included in the loss from equity in joint ventures line of the consolidated statements of income. Since July 19, 2010, the Company has included SPI’s accounts in its consolidated financial statements, and the joint venture partner’s interests in SPI’s income and net assets are reported in the noncontrolling interest lines of the consolidated statements of income and balance sheets, respectively.
In September 2008, the Company entered into an agreement with Nalco Company (Nalco) to form a joint venture, TIORCO, LLC, that markets chemical solutions for increased production of crude oil and natural gas from existing fields. The joint venture is equally owned and controlled by the Company and Nalco. The Company’s investment in TIORCO, LLC is accounted for using the equity method and is included in the other non-current assets line on the consolidated balance sheets. The Company’s share of TIORCO, LLC’s net earnings is included in the loss from equity in joint ventures line of the consolidated statements of income.
Noncontrolling Interests
Noncontrolling interests are reported in the balance sheet as a component of stockholders’ equity, separate from the parent company’s equity. In the statement of income, net income is reported on a consolidated basis that includes amounts attributable to the parent and the noncontrolling interest.
Cash and Cash Equivalents
The Company considers all highly liquid investments with purchased maturities of three months or less to be cash equivalents.
At December 31, 2010, the Company’s cash and cash equivalents totaled $111.2 million, including $77.0 million in two separate U.S. money market funds, each of which was rated AAA by Standard and Poor’s and Aaa by Moody’s. Cash in U.S. demand deposit accounts totaled $15.6 million and cash of the Company’s non-U.S. subsidiaries held outside the U.S. totaled $18.6 million as of December 31, 2010.
Receivables and Credit Risk
Receivables are stated net of allowances for doubtful accounts and other allowances and include primarily trade receivables, as well as nontrade receivables from suppliers, governmental tax agencies and others.
The Company is exposed to credit risk on accounts receivable balances. This risk is mitigated by the Company’s large, diverse customer base, which is dispersed over various geographic regions and industrial sectors. No single customer comprised more than 10 percent of the Company’s consolidated net sales in 2010, 2009 or 2008.
The Company maintains provisions for potential credit losses. Losses have historically been within the Company’s expectations. Specific customer provisions are made when a review of customer creditworthiness and current economic conditions indicate that collection is doubtful. In addition, the Company maintains a general provision in a percentage range of total trade receivables. The general provision range is periodically reviewed and adjusted based on relevant macroeconomic risk factors, including business bankruptcy rates, as well as the Company’s historical collection experience.
60
Table of Contents
The Company also maintains provisions for allowances to active customers that occur in the normal course of business. Such provisions are based on historical averages for similar allowances as well as trade receivable levels.
Below is an analysis of the allowance for doubtful accounts and other accounts receivable allowances for the years ended December 31, 2010, 2009 and 2008:
| (In thousands) | 2010 | 2009 | 2008 | |||||||||
| Balance at beginning of year |
$ | 6,762 | $ | 5,247 | $ | 3,443 | ||||||
| Provision charged (credited) to income |
(108 | ) | 2,232 | 2,474 | ||||||||
| Accounts written off, net of recoveries |
(509 | ) | (717 | ) | (670 | ) | ||||||
| Balance at end of year |
$ | 6,145 | $ | 6,762 | $ | 5,247 | ||||||
Inventories
Inventories are valued at cost, which is not in excess of market value, and include material, labor and plant overhead costs. The last-in, first-out (LIFO) method is used to determine the cost of the Company’s U.S. inventories. The first-in, first-out (FIFO) method is used for all other inventories. Inventories priced at LIFO as of December 31, 2010 and 2009, amounted to 66 and 70 percent of total inventories, respectively.
Property, Plant and Equipment
Depreciation of physical properties is provided on a straight-line basis over the estimated useful lives of the assets. Lives used for calculating depreciation are generally 30 years for buildings and 15 years for building improvements. For assets classified as machinery and equipment, lives generally used for calculating depreciation expense are from 10 to 15 years for manufacturing equipment, five to 10 years for furniture and fixtures, three to five years for vehicles and three to 10 years for computer equipment and software. Manufacturing of chemicals is capital intensive with over 90 percent of the assets included in machinery and equipment representing manufacturing equipment. Major renewals and betterments are capitalized in the property accounts, while maintenance and repairs ($36,912,000, $37,946,000, and $35,170,000 in 2010, 2009 and 2008, respectively), which do not renew or extend the life of the respective assets, are charged to operations as incurred. The cost of property retired or sold and the related accumulated depreciation are removed from the accounts and any resulting gain or loss is reflected in income.
Included in the computer equipment and software component of machinery and equipment are costs related to the acquisition and development of internal-use software. Capitalized costs include external direct costs of materials and services consumed in obtaining and developing the software. For development projects where major internal resources are committed, payroll and payroll-related costs incurred during the application development phase of the project are also capitalized. The capitalized costs are amortized over the useful lives of the software, which are generally three to 10 years. Costs incurred in the preliminary project phase are expensed.
Interest charges on borrowings applicable to major construction projects are capitalized.
61
Table of Contents
Operating assets are tested for impairment when events indicate that an impairment may have occurred.
Fair Value Measurements
U.S. generally accepted accounting principles (GAAP) define fair value as the price that would be received to sell an asset or paid to transfer a liability in an orderly transaction between market participants at the measurement date. Furthermore, GAAP establishes a framework, in the form of a three-level hierarchy, for measuring fair value that prioritizes the inputs to valuation techniques used to measure fair value. The following describes the hierarchy levels:
Level 1 - quoted prices in active markets for identical assets and liabilities.
Level 2 - inputs other than quoted prices included within Level 1 that are directly or indirectly observable for the asset or liability, such as quoted prices for similar assets or liabilities in active markets, quoted prices for identical or similar assets and liabilities in markets that are not active, or other inputs that are observable or can be corroborated by observable market data.
Level 3 - unobservable inputs which reflect the entity’s own assumptions about the assumptions market participants use in pricing the assets and liabilities.
The Company applies the fair value measurement provisions of GAAP to the financial assets and liabilities carried at fair value on its consolidated balance sheets (see Note 3), its debt for disclosure purposes (also Note 7) and its pension plan assets (see Note 14).
The Company also applies the fair value measurement requirements to nonrecurring fair value measurements of nonfinancial assets and liabilities such as goodwill, intangible assets and other long-lived assets recorded in conjunction with business combinations and as part of impairment reviews for goodwill and long-lived assets.
Revenue Recognition
Revenue is recognized upon shipment of goods to customers, at which time title and risk of loss pass to the customer. For arrangements where the Company consigns product to a customer location, revenue is recognized when the customer uses the inventory. The Company records shipping and handling billed to a customer in a sales transaction as revenue. Costs incurred for shipping and handling are recorded in cost of sales. Volume discounts due customers are estimated and recorded in the same period as the sales to which the discounts relate and reported as reductions of revenue in the consolidated statements of income.
Cost of Sales
Cost of sales comprises raw material costs, including inbound freight expense to deliver the raw materials, manufacturing plant labor expenses and various manufacturing overhead expenses, which include utility, maintenance, operating supply, amortization and manufacturing asset depreciation expenses. Cost of sales also includes outbound freight expenses, purchasing and receiving costs, quality assurance expenses, inter-plant transfer costs and warehouse expenses.
62
Table of Contents
Operating Expenses
Marketing expense comprises salary and the related fringe benefit expenses for marketing and sales personnel and operating costs, such as outside agent commissions, automobile rental and travel-related expenses, which support the sales and marketing functions. Bad debt charges and any depreciation expenses related to marketing assets (e.g., computers) are also classified as marketing expense.
Administrative expense comprises salary and the related fringe benefit expenses and operating costs for the Company’s various administrative functions, which include information services, finance, legal, and human resources. Compensation expense related to the Company’s deferred compensation plans and legal and environmental remediation expenses are also classified as administrative expense.
The Company’s research and development costs are expensed as incurred. These expenses are aimed at discovery and commercialization of new knowledge with the intent that such effort will be useful in developing a new product or in bringing about a significant improvement to an existing product or process. Total research and development expenses were $24,218,000, $23,441,000 and $22,071,000 in 2010, 2009 and 2008, respectively. The remainder of research, development and technical service expenses reflected on the consolidated statements of income relates to technical services, which include routine product testing, quality control and sales support service.
Operating expenses for 2008 included a $9,929,000 gain on the sale of the Company’s commodity polyurethane systems product lines and an $8,469,000 gain on the sale of land at the Company’s Millsdale manufacturing site.
Environmental Expenditures
Environmental expenditures that relate to current operations are expensed in cost of sales or capitalized as appropriate. Expenditures that mitigate or prevent environmental contamination and that benefit future operations are capitalized. Capitalized expenditures are depreciated generally utilizing a 10 year life. Expenditures that relate to an existing condition caused by past operations, and which do not contribute to current or future revenue generation, are expensed to administrative expense. Liabilities are recorded when environmental assessments and/or remedial efforts are probable and the cost or range of possible costs can be reasonably estimated. When no amount within the range is a better estimate than any other amount, the minimum is accrued. Some of the factors on which the Company bases its estimates include information provided by feasibility studies, potentially responsible party negotiations and the development of remedial action plans. Because reported liabilities are recorded based on estimates, actual amounts could significantly differ from those estimates. Legal costs related to environmental matters are expensed as incurred (see Note 17 for environmental contingencies).
63
Table of Contents
Goodwill and Other Intangible Assets
Intangible assets include patents, agreements not to compete, trademarks, customer lists, technological and manufacturing know-how and goodwill, all of which were acquired as part of business or product line acquisitions. The Company separately identifies intangible assets other than goodwill and amortizes them in accordance with their useful lives, generally ranging from five to 15 years. Goodwill is not amortized. Goodwill is tested for impairment in the second quarter of each calendar year or more frequently if an event indicates that impairment may have occurred. Finite life intangible assets are tested for impairment when events indicate that impairment may have occurred. For more details see Note 5.
Income Taxes
The provision for income taxes includes federal, foreign, state and local income taxes currently payable and those deferred because of temporary differences between the financial statement and tax bases of assets and liabilities. Deferred tax assets or liabilities are computed by applying enacted marginal tax rates to differences between the financial statement and income tax bases of assets and liabilities. Valuation allowances are recorded to reduce deferred tax assets when it is more likely than not that a tax benefit will not be realized. Deferred income tax expenses or credits are based on the period-to-period changes in the asset or liability.
In addition, the Company evaluates each tax position it has taken or is expected to take to determine whether it is more likely than not that the tax position will be sustained upon examination by tax authorities. If the tax position meets the more-likely-than-not threshold, the tax benefit recognized in the financial statements is measured at the largest amount of benefit that is greater than 50 percent likely of being realized upon effective settlement. Unrecognized tax benefits, which are differences between the tax position taken on a tax return and the amounts recognized in the financial statements, are recorded either as an increase to a tax liability or as a decrease to an income tax receivable. The Company includes estimated interest and penalty amounts related to the unrecognized tax benefits in the tax provision. See Note 10 for detailed information about income taxes.
Translation of Foreign Currencies
Assets and liabilities of consolidated foreign subsidiaries are translated into U.S. dollars at exchange rates in effect at year end. The resulting translation adjustments are included in stockholders’ equity. Revenues and expenses for the consolidated foreign subsidiaries are translated at average exchange rates prevailing during the year. Gains or losses on foreign currency transactions are reflected in the other, net caption of the consolidated statements of income. The foreign exchange gains recognized by year were $107,000 in 2010, $189,000 in 2009 and $1,070,000 in 2008.
64
Table of Contents
Stock-Based Compensation
The Company grants stock options and performance stock awards to certain employees under its incentive compensation plans. The Company calculates the fair values of stock options and performance stock awards on the date such instruments are granted. The fair values of the stock option and performance stock awards are then recognized as compensation expense over the vesting periods of the instruments. See Note 12 for detailed information about the Company’s stock-based compensation.
Earnings Per Share
Basic earnings per share amounts are computed based on the weighted-average number of common shares outstanding. Net income used in computing basic earnings per share is net income attributable to the Company reduced by dividends paid to preferred stockholders. Diluted earnings per share amounts are based on the weighted-average number of common shares outstanding plus the increased number of common shares that would be outstanding assuming the exercise of certain outstanding stock options (under the treasury stock method), the conversion of the convertible preferred stock (when such conversion would have the effect of reducing earnings per share), and contingent stock awards that are part of incentive stock-based compensation program (see Note 19).
Comprehensive Income and Accumulated Other Comprehensive Income
Comprehensive income includes net income and all other non-owner changes in equity that are not reported in net income. Comprehensive income is disclosed in the consolidated statements of stockholders’ equity.
Accumulated other comprehensive loss attributable to the Company as reported in the consolidated balance sheets at December 31, 2010 and 2009, comprised the following:
| (Dollars in thousands) | December 31 | |||||||
| 2010 | 2009 | |||||||
| Foreign currency translation gains |
$ | 3,485 | $ | 1,084 | ||||
| Pension liability adjustments |
(29,084 | ) | (26,977 | ) | ||||
| Total accumulated other comprehensive loss |
$ | (25,599 | ) | $ | (25,893 | ) | ||
Segment Reporting
The Company reports financial and descriptive information about its reportable operating segments. Operating segments are components of the Company that have separate financial information that is regularly evaluated by the chief operating decision maker to assess segment performance and allocate resources. The Company discloses segment revenue, operating income, assets, capital expenditures and depreciation and amortization expenses. Enterprise-wide
65
Table of Contents
financial information about the revenues derived from the Company’s products, the geographic locations in which the Company earns revenues and holds assets is also disclosed (see Note 18).
Derivative Instruments
Derivative instruments are recognized on the balance sheet as either an asset or a liability measured at fair value. For derivative instruments that are not designated as hedging instruments, changes in the fair values of the derivative instruments are recognized currently in earnings. See Note 4 for details regarding the Company’s use of derivative instruments that are not designated as hedges. For derivative instruments designated as hedging instruments, depending on the nature of the hedge, changes in the fair values of the derivative instruments are either offset in earnings against changes in the fair values of the hedged items or recognized in accumulated other comprehensive income until the hedged transaction is recognized in earnings. At the time a hedging relationship is designated, the Company establishes the method it will use for assessing the effectiveness of the hedge and the measurement approach for determining the ineffective aspect of the hedge. The Company held no derivative instruments designated as hedges for the years ended December 31, 2010 and 2009. For the year ended, December 31, 2008, the Company’s use of derivative instruments designated as hedges was insignificant. Company policy prohibits the use of derivative instruments for trading or speculative purposes.
At December 31, 2010, the Company held open forward contracts for the purchase of 1.1 million dekatherms of natural gas in 2011 at a cost of $6,204,000 and contracts to purchase approximately 24,000 megawatt hours of electricity in 2011 at a cost of $1,853,000 and 24,000 megawatts of electricity in 2012 at a cost of $1,782,000. The Company uses forward purchase contracts to minimize its exposure to volatile natural gas and electric prices. Because the Company anticipates taking delivery of the gas and electricity for use in its operations, the contracts qualify for the normal purchase exception provided under the accounting rules for derivative instruments. As a result, the contracts are not accounted for as derivative instruments. The costs of the natural gas and electricity are charged to expense at the time the gas and electricity are delivered and used.
Recent Accounting Pronouncements
In June 2009, the Financial Accounting Standards Board (FASB) issued amendments to the accounting rules for variable interest entities (VIEs), which are intended to improve financial reporting by providing additional guidance to companies involved with VIEs and by requiring additional disclosures about a company’s involvement in VIEs. These amendments were effective for interim and annual periods beginning after November 15, 2009. After considering the provisions of the VIE amendments, the Company concluded that none of the unconsolidated entities in which the Company holds an ownership interest were required to be treated as VIEs. Therefore, adoption of these amendments did not have an effect on the Company’s financial position, results of operations or cash flows.
In December 2010, the FASB issued Accounting Standards Update No. 2010-29, “Business Combinations (Topic 805): Disclosures of Supplementary Pro Forma Information for Business Combinations” (ASU 2010-29), which specifies that pro forma disclosures for business
66
Table of Contents
combinations are to be reported as if the business combinations that occurred during the current year had occurred as of the beginning of the comparable prior annual reporting period. The pro forma disclosures must also include a description of material, nonrecurring pro forma adjustments. ASU 2010-29 is effective for business combinations with an acquisition date of January 1, 2011 or later. The Company will apply the pro forma requirements for any business combinations it enters into on or subsequent to the effective date. Adoption of the new requirement will not have an effect on the Company’s financial position, results of operations or cash flows.
2. Acquisitions
Asset acquisition
On July 2, 2010, the Company purchased the manufacturing assets of Peter Cremer GmbH located on Jurong Island in Singapore. The purchase price of the manufacturing assets was $10.4 million, which the Company paid from available cash. The Company plans to install methyl esters fractionation capability on the site. Methyl esters are a core building block of the Company’s surfactants segment, and the acquisition of the Jurong Island manufacturing assets provides the Company an opportunity to reach its global customer base with methyl esters and value added derivatives made from tropical oils available in the region. The Company plans for the site to begin methyl esters production in the second quarter of 2012.
Business acquisitions
On July 15, 2010, the Company’s Stepan Europe subsidiary acquired 100 percent of the shares of Alfa Systems Sp. z o.o. (Alfa Systems). The purchase included a plant in Brzeg Dolny, Poland, which specializes in the manufacture of aromatic polyester polyols from the recycled polyethylene telephthalate (PET). Polyester polyols are the most significant component of the Company’s polymers segment. The acquisition of Alfa Systems provides the Company with manufacturing capability in Eastern Europe and the ability to economically and effectively serve customers in this region. As of the acquisition date, the new entity became a part of the Company’s polymers reportable segment.
The total purchase price of the acquisition was approximately $11.8 million (€9.1 million). The Company paid approximately $8.5 million (€6.6 million) at the time of acquisition. An additional $3.3 million (€2.5 million) in contingent consideration may be paid pending the outcome of certain contractual adjustments. Approximately $1.6 million of the contingent consideration was recognized at the time of acquisition. The contingent consideration arrangements were as follows:
| • | Environmental remediation – See the ‘Poland Manufacturing Site’ discussion included in Note 17, Contingencies. No amount related to the environmental remediation arrangement in the purchase agreement was recognized as contingent consideration. |
67
Table of Contents
| • | Nonspecific claims – Potential additional consideration of up to $1.6 million if no additional claims relating to pre-acquisition activity arise over the two years following the acquisition. The Company recognized the entire $1.6 million of this arrangement as consideration. |
| • | Working capital balance – Potential additional consideration of up to $0.6 million depending on the amount by which the audited working capital balance at the time of acquisition deviated from the agreed upon working capital in the purchase agreement. The Company recognized under $0.1 million as consideration for the working capital arrangement, which was finalized in December 2010. |
In addition to the purchase price paid, the Company incurred $0.7 million of acquisition-related costs, including legal, consulting and accounting expenses. These costs were reflected in administrative expenses on the Company’s statement of income.
The Alfa Systems acquisition was accounted for as a business combination and, accordingly, the assets acquired and liabilities assumed as part of the acquisition were measured and recorded at their estimated fair values. The following table summarizes the assets acquired and liabilities assumed:
| (Dollars in thousands) | July 15, 2010 | |||
| Assets: |
||||
| Current assets |
$ | 1,188 | ||
| Property, plant and equipment |
11,208 | |||
| Inventory |
893 | |||
| Identifiable intangible assets |
649 | |||
| Goodwill |
925 | |||
| Other assets |
49 | |||
| Total assets acquired |
$ | 14,912 | ||
| Liabilities: |
||||
| Current liabilities |
$ | 4,735 | ||
| Non-current liabilities |
71 | |||
| Total liabilities assumed |
$ | 4,806 | ||
| Net assets acquired |
$ | 10,106 | ||
The acquired goodwill, which relates entirely to the Company’s polymer segment, is not deductable for tax purposes. The goodwill reflects the potential positive effects of the ability to manufacture and sell the Company’s current polymer products as well as the PET-based polymer products to the European marketplace. Identifiable intangible assets included a non-compete agreement (approximately $0.4 million) and technological know-how (approximately $0.2 million). The amortization periods for these intangibles are three and five years, respectively.
The current liabilities amount included the assumed environmental contingent liability of $1.1 million discussed in the ‘Poland Manufacturing Site’ section of Note 17. The Company continues to evaluate the purchase price allocation, including the estimate of the environmental obligation, which may result in an adjustment to the recorded amount of goodwill.
68
Table of Contents
The post-acquisition financial results for the new subsidiary, which were included in the Company’s consolidated financial statements for the year ended December 31, 2010, were insignificant. Pro forma financial information has not been included because revenues and earnings of the Company’s consolidated entity would not have been significantly different than reported had the acquisition date been January 1, 2008.
On July 19, 2010, the Company acquired controlling interest in the Company’s Stepan Philippines, Inc. (SPI) joint venture, raising the Company’s ownership interest in the venture from 50 percent to 88.8 percent. SPI produces laundry and cleaning products, fabric softeners and functional surfactants for the Philippines and other global markets. The increase in SPI ownership will allow the Company to further diversify the product offering at the Philippines location and capitalize on synergies with the manufacturing facility being developed in Singapore. As of the date controlling interest was obtained, SPI became a part of the Company’s surfactants reportable segment.
As part of the purchase agreement, the Company paid $3.7 million of cash to acquire the interest of one owner, transferred $2.0 million of cash to SPI as an additional capital investment (subscription of new shares) and forgave a $3.9 million liability originally due to the Company pursuant to a royalty agreement between the Company and SPI. The Company also guaranteed approximately $8.7 million of debt owed by SPI to a related party of the selling partner.
In addition to the purchase price paid, the Company incurred $0.1 million of acquisition-related costs, including consulting and legal expenses. These costs were reflected in administrative expenses on the Company’s statement of income.
The acquisition of controlling interest in SPI was accounted for as a business combination and, accordingly, the assets acquired and liabilities assumed as part of the acquisition were measured and recorded at their estimated fair values. The following table summarizes the assets acquired and liabilities assumed:
| (Dollars in thousands) | July 19, 2010 | |||
| Assets: |
||||
| Current assets |
$ | 12,841 | ||
| Property, plant and equipment |
18,685 | |||
| Inventory |
3,232 | |||
| Identifiable intangible assets |
1,200 | |||
| Goodwill |
1,101 | |||
| Other assets |
167 | |||
| Total assets acquired |
$ | 37,226 | ||
| Liabilities: |
||||
| Current liabilities |
$ | 8,466 | ||
| Non-current liabilities |
9,973 | |||
| Total liabilities assumed |
$ | 18,439 | ||
| Net assets acquired |
$ | 18,787 | ||
| Less noncontrolling interest in SPI |
(2,090 | ) | ||
| Net assets less noncontrolling interest |
$ | 16,697 | ||
69
Table of Contents
The acquired goodwill, which relates entirely to the Company’s surfactants segment, is not deductable for tax purposes. The goodwill primarily reflects expected growth synergies in Asia resulting from the manufacturing capabilities in the Philippines and Singapore. The $1.2 million of identifiable intangible assets comprised customer relationships. The intangible amount will be amortized over a period of 10 years.
Because the purchase transaction moved the Company from noncontrolling interest in SPI to controlling interest, the Company revalued the original 50 percent investment in SPI to its acquisition-date fair value. The fair value of the Company’s original interest in SPI was estimated to be $7.1 million. As a result of this transaction, the Company recorded a $0.7 million gain, which was reported in the equity from joint ventures line in the statement of income for the year ended December 31, 2010. The fair value of the original interest in SPI was estimated by applying the income approach. The estimate was based on significant inputs that were not observable in the market, making the fair value calculation a Level 3 measurement as defined by generally accepted accounting principles in the U.S.
Also in accordance with the accounting principles for business combinations, the Company measured and recorded the remaining noncontrolling interest in SPI (i.e., the 11.2 percent interest held by the Company’s remaining joint venture partner) at its acquisition-date fair value. The fair value of the noncontrolling interest was estimated to be $2.1 million, which was determined by applying the same income approach measurement noted in the immediately preceding paragraph plus an adjustment for lack of control.
The post-acquisition financial results for SPI, which were included in the Company’s consolidated financial statements for the year ended December 31, 2010, were insignificant. Pro forma financial information has not been included because revenues and earnings of the Company’s consolidated entity would not have been significantly different than reported had the acquisition date been January 1, 2008.
3. Financial Instruments
The following are the financial instruments held by the Company at December 31, 2010 and 2009, and descriptions of the methods and assumptions used to estimate the instruments’ fair values:
Cash and cash equivalents
Carrying value approximated fair value because of the short maturity of the instruments.
Derivative assets and liabilities
Derivative assets and liabilities included the foreign currency exchange and forward electric contracts discussed in Note 4. Fair value and carrying value were the same because the contracts were recorded at fair value. The fair value of the foreign currency contracts was calculated as the difference between the present value of the forward foreign exchange rate at the reporting date and the contracted foreign exchange rate multiplied by the contracted notional amount. The Company held no derivative forward electric contracts at December 31, 2010. For 2009, the fair value of the electric contracts was calculated by applying the December 31, 2009, market rate for contracts of similar terms to the open electric quantities. See the table that follows these financial instrument descriptions for the reported fair values of derivative assets and liabilities.
70
Table of Contents
Long-term investments
Long-term investments comprised the mutual fund assets the Company holds to fund a portion of its deferred compensation liabilities. Fair value and carrying value were the same because the mutual fund assets were recorded at fair value in accordance with the 2008 fair value election of the Company made under the FASB’s fair value option rules. Fair values for the mutual funds were calculated using the published market price per unit at the reporting date multiplied by the number of units held at the reporting date. See the table that follows these financial instrument descriptions for the reported fair value of long-term investments.
For the year ended December 31, 2010, the Company recognized $1,376,000 of unrealized gains on the mutual fund assets compared to $3,240,000 of unrealized gains on the mutual fund assets for the year ended December 31, 2009 and $4,999,000 of unrealized losses for the year ended December 31, 2008. The unrealized gains/losses were recorded in the other, net line of the consolidated statements of income.
Debt obligations
The Company’s primary source of long-term debt financing is unsecured private placement notes with fixed interest rates and maturities. The fair value of fixed interest rate debt comprised the combined present values of scheduled principal and interest payments for each of the various loans, individually discounted at rates equivalent to those which could be obtained by the Company for new debt issues with durations equal to the average life to maturity of each loan. The discount rates were based on applicable duration U.S. Treasury rates plus market interest rate spreads to borrowers with credit ratings equivalent to those of the Company. The fair values of the Company’s fixed-rate debt at December 31, 2010 and 2009, including current maturities, was estimated to be $122,044,000 and $78,545,000, respectively, compared to carrying values of $113,359,000 and $73,896,000, respectively.
Debt also included $27,000,000 for an unsecured term loan that carries a variable interest rate of LIBOR plus a spread of 125 basis points as of December 31, 2010. The current market spread over LIBOR for entities with credit ratings similar to the Company’s is approximately 225 basis points. Using the current market spread to discount the scheduled principal and interest payment outflows calculated under the contractual spread, the Company estimated the fair value of the variable interest unsecured term loan at December 31, 2010, at approximately $26,390,000 compared to a carrying value of $27,000,000. At December 31, 2009, the fair value of the variable interest unsecured term loan was $26,929,000 compared to a carrying value of $28,500,000.
Also included in debt as of December 31, 2010 was $8,805,000 of term debt of the Company’s Philippine subsidiary, comprised of two bank loans guaranteed by the Company. Using the current market spread for loans to companies with credit ratings similar to the Company’s to discount the scheduled principal and interest payment outflows calculated under the contractual spreads, the Company estimates the combined fair value of these variable interest secured term loans at December 31, 2010, to be approximately $9,028,000 versus a carrying value of $8,805,000.
71
Table of Contents
The fair values of the remaining Company debt obligations approximated their carrying values due to either the short-term nature of the debt or the close proximity of the start of the financing transaction to the December 31, 2010, measurement date.
The following tables present financial assets and liabilities measured at fair value as of December 31, 2010 and December 31, 2009 and the level within the fair value hierarchy in which the fair value measurements fell:
| (Dollars in thousands) | December 2010 |
Level 1 | Level 2 | Level 3 | ||||||||||||
| Mutual fund assets |
$ | 11,904 | $ | 11,904 | $ | — | $ | — | ||||||||
| Derivative assets: (1) |
||||||||||||||||
| Foreign currency contracts |
30 | — | 30 | — | ||||||||||||
| Total assets at fair value |
$ | 11,934 | $ | 11,904 | $ | 30 | $ | — | ||||||||
| Derivative liabilities: (2) |
||||||||||||||||
| Foreign currency contracts |
$ | 43 | $ | — | $ | 43 | $ | — | ||||||||
| Total liabilities at fair value |
$ | 43 | $ | — | $ | 43 | $ | — | ||||||||
| (Dollars in thousands) | December 2009 |
Level 1 | Level 2 | Level 3 | ||||||||||||
| Mutual fund assets |
$ | 10,539 | $ | 10,539 | $ | — | $ | — | ||||||||
| Derivative assets: (1) |
||||||||||||||||
| Foreign currency contracts |
3 | — | 3 | — | ||||||||||||
| Total assets at fair value |
$ | 10,542 | $ | 10,539 | $ | 3 | $ | — | ||||||||
| Derivative liabilities: (2) |
||||||||||||||||
| Foreign currency contracts |
$ | 244 | $ | — | $ | 244 | $ | — | ||||||||
| Forward electric contracts |
893 | — | 893 | — | ||||||||||||
| Total liabilities at fair value |
$ | 1,137 | $ | — | $ | 1,137 | $ | — | ||||||||
| (1) | Included in the receivables, net line in the condensed consolidated balance sheets. |
| (2) | Included in the accounts payable line in the condensed consolidated balance sheets. |
4. Derivative Instruments
The Company is exposed to certain risks relating to its ongoing business operations. The primary risk managed by the use of derivative instruments is foreign currency exchange risk. Specifically, the Company holds forward foreign currency exchange contracts that are not designated as any type of accounting hedge, as defined by U.S. generally accepted accounting principles. The Company uses these contracts to manage its exposure to exchange rate fluctuations on certain Company subsidiary accounts payable and accounts receivable balances that are denominated in currencies other than the entities’ functional currencies. The forward foreign exchange contracts are recognized on the balance sheet as either an asset or a liability measured at fair value. Gains and losses arising from recording the foreign exchange contracts at fair value are reported in earnings as offsets to the losses and gains reported in earnings arising from the remeasurement of
72
Table of Contents
the accounts payable and accounts receivable balances into the applicable functional currencies. At December 31, 2010 and 2009, the Company had open forward foreign currency exchange contracts, all with expiration dates of three months or less, to buy or sell foreign currencies with a U.S. dollar equivalent of $25,014,000 and $30,332,000, respectively.
At December 31, 2009, the Company also held open forward electric contracts to purchase 107,000 megawatts of electricity at fixed prices in 2010. The Company entered into the contracts to help manage the volatile cost of electricity. The electric contracts were not designated as accounting hedges and did not qualify for the normal purchase exception. No such electric contracts were open at December 31, 2010.
See Note 3 for the fair values and line item presentations of derivative instruments reported in the December 31, 2010 and 2009 consolidated balance sheets.
Derivative instrument gains and losses reported in the consolidated income statements for the years ended December 31, 2010, 2009 and 2008, are displayed in the table below.
| (Dollars in thousands) | Income Statement |
|||||||||||||
| Derivative Instrument |
Line Item | Gain / (Loss) | ||||||||||||
| 2010 | 2009 | 2008 | ||||||||||||
| Foreign Currency Contracts |
Other, net | $ | 444 | $ | 2,178 | $ | 566 | |||||||
| Forward Electric Contracts |
Cost of Sales | $ | 893 | $ | (893 | ) | — | |||||||
5. Goodwill and Other Intangible Assets
The changes in carrying value of goodwill for the years ended December 31, 2010 and 2009 are as follows:
| Surfactants Segment | Polymer Segment | Total | ||||||||||||||||||||||
| 2010 | 2009 | 2010 | 2009 | 2010 | 2009 | |||||||||||||||||||
| Balance as of January 1 |
||||||||||||||||||||||||
| Goodwill |
$ | 7,969 | $ | 7,877 | $ | — | $ | — | $ | 7,969 | $ | 7,877 | ||||||||||||
| Accumulated impairment losses |
(3,467 | ) | (3,467 | ) | — | — | (3,467 | ) | (3,467 | ) | ||||||||||||||
| 4,502 | 4,410 | — | — | 4,502 | 4,410 | |||||||||||||||||||
| Goodwill acquired (1) |
1,101 | — | 925 | — | 2,026 | — | ||||||||||||||||||
| Foreign currency translation |
136 | 92 | 53 | — | 189 | 92 | ||||||||||||||||||
| Balance as of December 31 |
||||||||||||||||||||||||
| Goodwill |
9,206 | 7,969 | 978 | — | 10,184 | 7,969 | ||||||||||||||||||
| Accumulated impairment losses |
(3,467 | ) | (3,467 | ) | — | — | (3,467 | ) | (3,467 | ) | ||||||||||||||
| $ | 5,739 | $ | 4,502 | $ | 978 | — | $ | 6,717 | $ | 4,502 | ||||||||||||||
| (1) | See Note 2 for information regarding the goodwill acquired in business combinations. |
73
Table of Contents
The Company tests its goodwill balances for impairment in the second quarter of each calendar year. The 2010, 2009 and 2008 tests indicated no impairment of goodwill.
The following table reflects the components of all other intangible assets, which all have finite lives, as of December 31, 2010 and 2009. The year-to-year changes in gross carrying values resulted from the 2010 acquisitions disclosed in Note 2 and the effects of currency translation.
| (In thousands) | Gross Carrying Value | Accumulated Amortization | ||||||||||||||
| December 31 | December 31 | |||||||||||||||
| 2010 |
2009 |
2010 |
2009 |
|||||||||||||
| Other Intangible Assets: |
||||||||||||||||
| Patents |
$ | 2,000 | $ | 2,000 | $ | 1,667 | $ | 1,533 | ||||||||
| Trademarks |
5,555 | 5,539 | 4,716 | 4,368 | ||||||||||||
| Customer lists |
6,499 | 5,254 | 4,868 | 4,636 | ||||||||||||
| Know-how (a) |
8,811 | 8,543 | 7,169 | 6,578 | ||||||||||||
| Non-compete agreements |
1,267 | 909 | 455 | 199 | ||||||||||||
| Total |
$ | 24,132 | $ | 22,245 | $ | 18,875 | $ | 17,314 | ||||||||
| (a) | Know-how includes intellectual property rights covering proprietary information, written formulae, trade secrets or secret processes, inventions and developmental products (whether patentable or not), discoveries, improvements, compositions, manufacturing processes, manuals, specifications and technical data. |
Aggregate amortization expense for the years ended December 31, 2010, 2009 and 2008, was $1,549,000, $1,427,000 and $1,294,000, respectively. Estimated amortization expense for identifiable intangibles assets for each of the five succeeding fiscal years is as follows:
| (In thousands) | ||||
| For year ended 12/31/11 |
$ | 1,735 | ||
| For year ended 12/31/12 |
$ | 1,707 | ||
| For year ended 12/31/13 |
$ | 921 | ||
| For year ended 12/31/14 |
$ | 183 | ||
| For year ended 12/31/15 |
$ | 160 | ||
74
Table of Contents
6. Inventories
The composition of inventories at December 31, 2010 and 2009, was as follows:
| December 31 | ||||||||
| (Dollars in thousands) |
2010 | 2009 | ||||||
| Finished products |
$ | 62,685 | $ | 45,842 | ||||
| Raw materials |
33,867 | 28,851 | ||||||
| Total inventories |
$ | 96,552 | $ | 74,693 | ||||
Inventories are primarily priced using the last-in, first-out (LIFO) inventory valuation method. If the first-in, first-out (FIFO) inventory valuation method had been used for all inventories, inventory balances would have been approximately $34,280,000 and $24,182,000 higher than reported at December 31, 2010 and 2009, respectively. In 2009, a reduction of U.S. inventories resulted in the liquidation of previous years’ LIFO inventory quantities. The effect of the liquidation was a $799,000 reduction in 2009 pretax profits.
7. Debt
Debt comprised the following at December 31, 2010 and 2009:
| (Dollars in thousands) | December 31 | |||||||||||
| Maturity Dates | 2010 | 2009 | ||||||||||
| Unsecured private placement notes |
||||||||||||
| 5.88% |
2016-2022 | $ | 40,000 | $ | — | |||||||
| 5.69% |
2012-2018 | 40,000 | 40,000 | |||||||||
| 6.86% |
2011-2015 | 21,428 | 25,714 | |||||||||
| 6.59% |
2011-2012 | 5,454 | 8,182 | |||||||||
| Unsecured bank term loan |
2011-2013 | 27,000 | 28,500 | |||||||||
| Build-to-suit obligation |
2011-2030 | 11,384 | — | |||||||||
| Debt of foreign subsidiaries |
||||||||||||
| Secured bank term loans, foreign currency |
2011-2015 | 8,156 | 776 | |||||||||
| Secured bank term loan, U.S. dollars |
2011-2014 | 7,000 | — | |||||||||
| Other loans, foreign currency |
2011-2015 | 18,142 | 912 | |||||||||
| Seller note, foreign currency |
2011-2013 | 13,008 | — | |||||||||
| Total debt |
$ | 191,572 | $ | 104,084 | ||||||||
| Less current maturities |
31,609 | 10,173 | ||||||||||
| Long-term debt |
$ | 159,963 | $ | 93,911 | ||||||||
The majority of the Company’s long-term debt financing is composed of unsecured private placement notes issued to insurance companies, totaling $106,882,000 as of December 31, 2010. These notes are denominated in U.S. dollars and have fixed interest rates ranging from 5.69 percent to 6.86 percent. At inception, these notes had final maturities of 13 to 15 years with remaining amortization scheduled from 2011 to 2022.
75
Table of Contents
The Company has a $60,000,000 U.S. revolving credit agreement scheduled to expire in August 2013. The Company also maintains standby letters of credit under its workers’ compensation insurance agreements and for other purposes, as needed from time to time, which are issued under the revolving credit agreement. As of December 31, 2010, the Company had outstanding letters of credit totaling $2,612,000 and no outstanding debt under this agreement. There was $57,388,000 available under the revolving credit agreement as of December 31, 2010.
During 2010, the Company had no domestic revolver borrowings. The U.S. revolving credit agreement contains three interest rate options from which the Company may choose: 1) LIBOR plus spreads ranging from 1.70 percent to 2.50 percent, depending on the Company’s leverage ratio, 2) the prime rate or 3) market rates in effect from time to time. This agreement requires a facility fee ranging from 0.30 percent to 0.50 percent, which also depends on the leverage ratio.
The Company also carries an unsecured term loan with three U.S. banks. This loan matures in 2013 with remaining amortization of $1,500,000 per year in 2011 through 2012 and $24,000,000 in 2013. This agreement contains two interest rate options from which the Company may choose: 1) LIBOR plus spreads ranging from 1.70 percent to 2.50 percent, depending on the Company’s leverage ratio or 2) the prime rate plus spreads ranging from 0.70 percent to 1.50 percent.
On January 19, 2010, the Company entered into a build-to-suit lease agreement for the construction of a warehouse at its Millsdale (Joliet), Illinois, manufacturing site. For accounting purposes, the Company was considered the owner of the asset during the construction period. At the end of construction, the Company had an asset and a financial obligation recorded on its financial statements. Payments for the obligation commenced in October 2010 and continue through September 2030. The Company has the right to purchase the warehouse within the first 10 years of the agreement.
During 2010, debt of the Company’s foreign subsidiaries increased by $44,618,000. Of this increase, $23,684,000 occurred in Europe to fund capital expenditures, an acquisition, and working capital requirements. As of December 31, 2010, European debt included a bank term loan for $6,351,000, which matures in 2015 and bears a fixed interest rate of 2.15 percent. Debt in Europe also included short-term borrowings of $18,115,000 as of December 31, 2010, with variable interest rates of 90-day EURIBOR plus spreads ranging from 0.30 and 0.50 percent. Debt in Singapore included $13,008,000 for a seller note for the purchase of capital assets. This seller note bears a fixed interest rate of 4.00 percent, has repayments scheduled through 2013, and is guaranteed by the Company. As a result of the consolidation of the Philippine joint venture, Company debt also included $8,805,000 comprised of two bank term loans with quarterly amortization through 2014 and which are guaranteed by the Company. One of these term loans, for $7,000,000, has a variable interest rate of 90-day LIBOR plus a spread of 3.50 percent. The other term loan, for $1,805,000 in local currency, bears a variable interest rate comprised of a base rate and a spread of 5.25 percent. The balance of the Company’s foreign debt is secured only by the assets of the respective entities.
The Company’s loan agreements in the U.S., France, and the Philippines contain provisions, which, among others, require maintenance of certain financial ratios and place limitations on additional debt, investments and payment of dividends. The Company was in compliance with all of its loan agreements as of December 31, 2010. Unrestricted retained earnings were $138,727,000 and $95,653,000 at December 31, 2010 and 2009, respectively.
76
Table of Contents
Debt at December 31, 2010, matures as follows: $31,609,000 in 2011; $20,706,000 in 2012; $47,380,000 in 2013; $13,028,000 in 2014; $11,255,000 in 2015 and $67,594,000 after 2015. Debt maturing in 2011 includes $13,494,000 of scheduled repayments under long-term debt agreements and $18,115,000 of debt of foreign subsidiaries under short-term working capital loans. These short-term loans are routinely renewed, but could be supplemented or replaced, if necessary, by the Company’s $60,000,000 revolving credit agreement.
Net interest expense for the years ended December 31, 2010, 2009 and 2008, comprised the following:
| (Dollars in thousands) | 2010 | 2009 | 2008 | |||||||||
| Interest expense |
$ | 7,145 | $ | 6,901 | $ | 9,798 | ||||||
| Interest income |
(439 | ) | (349 | ) | (244 | ) | ||||||
| 6,706 | 6,552 | 9,554 | ||||||||||
| Capitalized interest |
(365 | ) | (281 | ) | (40 | ) | ||||||
| Interest expense, net |
$ | 6,341 | $ | 6,271 | $ | 9,514 | ||||||
8. Leased Properties
The Company leases certain property and equipment (primarily transportation equipment, buildings and land) under operating leases, which are denominated in local currencies. Total rental expense was $5,335,000, $5,445,000 and $5,120,000 in 2010, 2009 and 2008, respectively.
Consolidated Company minimum future rental payments under operating leases with terms in excess of one year as of December 31, 2010, are:
| (Dollars in thousands) |
Year | Amount | ||||||
| 2011 | $ | 2,965 | ||||||
| 2012 | 2,510 | |||||||
| 2013 | 2,038 | |||||||
| 2014 | 1,653 | |||||||
| 2015 | 1,277 | |||||||
| Subsequent to 2015 | 6,490 | |||||||
| Total minimum future rental payments |
|
$ | 16,933 | |||||
77
Table of Contents
9. Other, Net
Other, net in the consolidated statements of income included the following:
| (Dollars in thousands) |
2010 | 2009 | 2008 | |||||||||
| Foreign exchange gain |
$ | 107 | $ | 189 | $ | 1,070 | ||||||
| Investment related income |
112 | 105 | 305 | |||||||||
| Realized and unrealized gain (loss) on investments |
1,367 | 1,929 | (4,966 | ) | ||||||||
| Other, net |
$ | 1,586 | $ | 2,223 | $ | (3,591 | ) | |||||
10. Income Taxes
The provisions for taxes on income and the related income before taxes for the years ended December 31, 2010, 2009 and 2008 were as follows:
| (Dollars in thousands) |
2010 | 2009 | 2008 | |||||||||
| Taxes on Income |
||||||||||||
| Federal |
||||||||||||
| Current |
$ | 17,706 | $ | 11,969 | $ | 5,232 | ||||||
| Deferred |
4,020 | 5,896 | 1,251 | |||||||||
| State |
||||||||||||
| Current |
2,327 | 2,407 | 1,086 | |||||||||
| Deferred |
453 | 607 | (188 | ) | ||||||||
| Foreign |
||||||||||||
| Current |
10,490 | 11,462 | 10,019 | |||||||||
| Deferred |
892 | 1,687 | 215 | |||||||||
| Total |
$ | 35,888 | $ | 34,028 | $ | 17,615 | ||||||
| Income before Taxes |
||||||||||||
| Domestic |
$ | 65,690 | $ | 57,507 | $ | 23,380 | ||||||
| Foreign |
35,789 | 39,624 | 31,498 | |||||||||
| Total |
$ | 101,479 | $ | 97,131 | $ | 54,878 | ||||||
78
Table of Contents
The variations between the effective and statutory U.S. federal income tax rates are summarized as follows:
| (Dollars in thousands) |
2010 Amount |
% | 2009 Amount |
% | 2008 Amount |
% | ||||||||||||||||||
| Federal income tax provision at statutory tax rate |
$ | 35,518 | 35.0 | $ | 33,996 | 35.0 | $ | 19,207 | 35.0 | |||||||||||||||
| State tax provision on income less applicable federal tax benefit |
1,807 | 1.8 | 1,959 | 2.0 | 584 | 1.1 | ||||||||||||||||||
| Foreign income taxed at different rates |
(1,144 | ) | (1.1 | ) | (720 | ) | (0.7 | ) | (789 | ) | (1.4 | ) | ||||||||||||
| Effect of equity in foreign joint venture |
954 | 0.9 | 425 | 0.4 | (122 | ) | (0.2 | ) | ||||||||||||||||
| Repatriation of foreign earnings |
543 | 0.5 | 53 | 0.1 | — | — | ||||||||||||||||||
| Domestic production activities deduction |
(1,446 | ) | (1.4 | ) | (699 | ) | (0.7 | ) | — | — | ||||||||||||||
| U.S. tax credits |
(969 | ) | (1.0 | ) | (837 | ) | (0.9 | ) | (1,308 | ) | (2.4 | ) | ||||||||||||
| Non-deductible expenses and other items, net |
625 | 0.7 | (149 | ) | (0.2 | ) | 43 | — | ||||||||||||||||
| Total income tax provision |
$ | 35,888 | 35.4 | $ | 34,028 | 35.0 | $ | 17,615 | 32.1 | |||||||||||||||
At December 31, 2010 and 2009, the tax effects of significant temporary differences representing deferred tax assets and liabilities were as follows:
| (Dollars in thousands) |
2010 | 2009 | ||||||
| Deferred Tax Assets: |
||||||||
| Pensions |
$ | 13,021 | $ | 12,856 | ||||
| State income tax accrual |
— | 171 | ||||||
| Deferred revenue |
494 | 1,489 | ||||||
| Other accruals and reserves |
9,003 | 8,707 | ||||||
| Inventories |
113 | — | ||||||
| Legal and environmental accruals |
6,896 | 7,739 | ||||||
| Deferred compensation |
13,930 | 12,434 | ||||||
| Bad debt and rebate reserves |
2,527 | 2,234 | ||||||
| Subsidiaries net operating loss carryforwards |
510 | 71 | ||||||
| Tax credit carryforward |
178 | 358 | ||||||
| Other |
— | 3 | ||||||
| $ | 46,672 | $ | 46,062 | |||||
| Deferred Tax Liabilities: |
||||||||
| Depreciation |
$ | (40,169 | ) | $ | (36,338 | ) | ||
| Other |
(976 | ) | (216 | ) | ||||
| $ | (41,145 | ) | $ | (36,554 | ) | |||
| Valuation Allowance |
$ | — | $ | — | ||||
| Net Deferred Tax Assets |
$ | 5,527 | $ | 9,508 | ||||
| Reconciliation to Consolidated Balance Sheet: |
||||||||
| Current deferred tax assets |
$ | 8,170 | $ | 9,036 | ||||
| Non-current deferred tax assets (in other non-current assets) |
2,511 | 3,309 | ||||||
| Non-current deferred tax liabilities |
(5,154 | ) | (2,837 | ) | ||||
| Net Deferred Tax Assets |
$ | 5,527 | $ | 9,508 | ||||
79
Table of Contents
Undistributed earnings of foreign subsidiaries and related companies that are deemed to be permanently reinvested amounted to $123,949,000 at December 31, 2010, compared to $104,624,000 at December 31, 2009. In general, the Company reinvests earnings of foreign subsidiaries in their operations indefinitely. However, the Company will repatriate earnings from a subsidiary where excess cash has accumulated and it is advantageous for tax or foreign exchange reasons. Because of the probable availability of foreign tax credits, it is not practicable to estimate the amount, if any, of the deferred tax liability on earnings reinvested indefinitely.
Tax loss carryforwards at December 31, 2010, amounted to $510,000 compared with $255,000 at the end of 2009. Of the tax loss carryforwards, $122,000 expire in 2013, $154,000 expire in 2014 and $234,000 expire in 2015. Tax credit carryforwards at December 31, 2010, amounted to $178,000 compared to $358,000 at December 31, 2009. Of the tax credit carryforwards, $91,000 expire in 2015, $5,000 expire in 2017, $59,000 expire in 2018, $17,000 expire in 2019, and $6,000 expire in 2020.
At December 31, 2010 and 2009, the Company had no valuation allowances.
As of December 31, 2010 and 2009, unrecognized tax benefits totaled $2,390,000 and $2,566,000, respectively. The amount of unrecognized tax benefits that, if recognized, would favorably affect the Company’s effective income tax rate in any future periods, net of the federal benefit on state issues, was approximately $2,096,000, $2,274,000 and $1,111,000 at December 31, 2010, 2009 and 2008, respectively. The Company does not believe that the amount of unrecognized tax benefits related to its current uncertain tax positions will change significantly over the next 12 months.
The Company recognizes interest and penalties accrued related to unrecognized tax benefits as income tax expense. In 2010, $26,000 of net interest and penalty income was recognized compared to $79,000 of net interest and penalty expense in 2009 and $28,000 of net interest and penalty income in 2008. At December 31, 2010, the liability for interest and penalties was $488,000 compared to $514,000 at December 31, 2009.
The Company files income tax returns in the U.S. federal jurisdiction and various states and foreign jurisdictions. The Company is not subject to U.S. federal income tax examinations by tax authorities for years before 2007. Some foreign jurisdictions and various U.S. states jurisdictions may be subject to examination back to 2004.
Below are reconciliations of the January 1 and December 31 balances of unrecognized tax benefits for 2010, 2009 and 2008:
| (Dollars in thousands) | 2010 | 2009 | 2008 | |||||||||
| Unrecognized tax benefits, opening balance |
$ | 2,566 | $ | 1,347 | $ | 1,705 | ||||||
| Gross increases – tax positions in prior period |
— | 921 | 67 | |||||||||
| Gross decreases – tax positions in prior period |
(57 | ) | — | — | ||||||||
| Gross increases – current period tax positions |
189 | 554 | 38 | |||||||||
| Settlements |
— | — | (4 | ) | ||||||||
| Lapse of statute of limitations |
(308 | ) | (256 | ) | (459 | ) | ||||||
| Unrecognized tax benefits, ending balance |
$ | 2,390 | $ | 2,566 | $ | 1,347 | ||||||
80
Table of Contents
11. Stockholders’ Equity
The Company’s preferred stock is convertible at the option of the holder at any time (unless previously redeemed) into shares of common stock at a conversion of 1.14175 shares of common stock for each share of preferred stock. Dividends on preferred stock, which are cumulative from the date of original issue, accrue at a rate of $1.375 per share per annum. The Company may not declare and pay any dividend or make any distribution of assets (other than dividends or other distribution payable in shares of common stock) or redeem, purchase or otherwise acquire, shares of common stock, unless all accumulated and unpaid preferred dividends have been paid or are contemporaneously declared and paid. The preferred stock is subject to optional redemption by the Company, in whole or in part, at any time, at a redemption price of $25 per share plus accrued and unpaid dividends thereon to the date fixed for redemption. Preferred stock is entitled to 1.14175 votes per share on all matters submitted to stockholders for action and votes together with the common stock as a single class, except as otherwise provided by law or the Certificate of Incorporation of the Company. There is no mandatory redemption or sinking fund obligation with respect to the preferred stock.
12. Stock-based Compensation
On December 31, 2010, the Company had stock options outstanding under its 2000 Stock Option Plan (2000 Plan) and stock options and stock awards outstanding under its 2006 Incentive Compensation Plan (2006 Plan). Stock options and stock awards are granted to executives, key employees and outside directors. No further options or awards may be granted under the 2000 Plan. The 2006 Plan authorized the award of 1,000,000 shares of the Company’s common stock for stock options, stock appreciation rights and stock awards. At December 31, 2010, there were 278,143 shares available for grant under the 2006 Plan. Compensation expense charged against income for all plans was $3,789,000, $4,754,000 and $3,700,000 for the years ended December 31, 2010, 2009 and 2008, respectively. The total income tax benefit recognized in the income statement for share-based compensation arrangements was $1,465,000, $1,821,000 and $1,467,000 for the years ended December 31, 2010, 2009 and 2008, respectively. The following provides information regarding the stock option and stock award grants.
Stock Options
Under all plans, stock option awards are granted with an exercise price equal to the market price of the Company’s stock at the date of grant. The market price is defined and calculated as the average of the opening and closing prices for Company common stock on the grant date as reported in the New York Stock Exchange – Composite Transactions. The option awards generally vest based on two years of continuous service and have 8- to 10-year contractual terms. The fair value of each option award is estimated on the date of grant using the Black-Scholes option valuation model incorporating the assumptions noted in the following table. Expected volatility is based on the historical volatility of the Company’s stock. The Company also uses historical data to estimate the expected term of options granted. The risk-free rate is the U.S. Treasury note rate that corresponds to the expected option term at the date of grant.
81
Table of Contents
| For the Years Ended December 31 | ||||||||||||
| 2010 | 2009 | 2008 | ||||||||||
| Expected dividend yield |
2.70 | % | 2.80 | % | 2.87 | % | ||||||
| Expected volatility |
41.79 | % | 38.20 | % | 30.56 | % | ||||||
| Expected life |
6.5 years | 6.5 years | 6.1 years | |||||||||
| Risk-free interest rate |
2.87 | % | 2.22 | % | 3.01 | % | ||||||
A summary of option activity under the Company’s stock option plans for the year ended December 31, 2010, is presented below:
| Shares | Weighted- Average Exercise Price |
Weighted- Average Remaining Contractual Term |
Aggregate Intrinsic Value ($000) |
|||||||||||||
| Options |
||||||||||||||||
| Outstanding at January 1, 2010 |
788,782 | $ | 28.91 | |||||||||||||
| Granted |
94,736 | 51.70 | ||||||||||||||
| Exercised |
187,254 | 26.72 | ||||||||||||||
| Cancelled/Forfeited |
17,136 | 38.72 | ||||||||||||||
| Outstanding at December 31, 2010 |
679,128 | 32.44 | 4.43 | 29,766 | ||||||||||||
| Vested or expected to vest at December 31, 2010 |
674,992 | 32.35 | 4.42 | 29,649 | ||||||||||||
| Exercisable at December 31, 2010 |
455,968 | 27.25 | 3.40 | 22,352 | ||||||||||||
The weighted-average grant-date fair values of options awarded during the years ended December 31, 2010, 2009 and 2008 were $17.76, $11.15 and $8.13, respectively. The total intrinsic values of options exercised during the years ended December 31, 2010, 2009, and 2008 were $8,446,000, $9,976,000, and $7,806,000, respectively.
As of December 31, 2010, there was $972,000 of total unrecognized compensation cost related to unvested stock options granted under the Company’s stock option plans. That cost is expected to be recognized over a weighted-average period of 1.0 year.
Cash received from stock option exercises under the Company’s stock option plans for the years ended December 31, 2010, 2009, and 2008 was $4,335,000, $6,908,000 and $6,813,000, respectively. The actual tax benefit realized for the tax deductions from stock option exercises totaled $2,704,000, $2,844,000, and $2,958,000 for the years ended December 31, 2010, 2009 and 2008, respectively.
Stock Awards
In 2008, 2009, and 2010, the Company granted stock awards under the 2006 Incentive Compensation Plan. The stock awards vest only upon the Company’s achievement of certain levels of consolidated net income and return on invested capital by the end of the specified measurement period, which is December 31, 2010, 2011 and 2012 for the 2008, 2009 and 2010 awards, respectively. The number of Company shares of common stock ultimately distributed, if
82
Table of Contents
any, is contingent upon the level of consolidated net income and return on invested capital attained. The fair value of stock awards equals the grant-date market price of the Company’s common stock, discounted for the estimated amount of dividends that would not be received during the measurement period. Compensation expense is recorded each reporting period based on the probable number of awards that will ultimately vest given the projected level of consolidated net income and return on invested capital. If at the end of the measurement period the performance objectives are not met, no compensation cost is recognized and any compensation expense recorded in prior periods is reversed.
A summary of stock award activity for the year ended December 31, 2010, is presented below:
| Shares | Weighted-Average Grant
Date Fair Value |
|||||||
| Unvested Stock Awards |
||||||||
| Unvested at January 1, 2010 |
161,361 | $ | 31.67 | |||||
| Granted |
81,308 | 48.19 | ||||||
| Vested |
(89,348 | ) | 29.66 | |||||
| Forfeited |
(5,534 | ) | 39.52 | |||||
| Unvested at December 31, 2010 |
147,787 | 41.68 | ||||||
As of December 31, 2010, under the current Company assumption as to the number of stock award shares that will probably vest at the measurement periods ended December 31, 2011 and 2012, there was $2,234,000 of unrecognized compensation cost related to unvested stock awards. That cost is expected to be recognized over a period of 1.9 years.
In general, it is the Company’s policy to issue new shares of its common stock upon the exercise of stock options or the vesting of stock awards.
13. Deferred Compensation
The Company sponsors deferred compensation plans that allow management to defer receipt of its annual bonuses and outside directors to defer receipt of their fees until retirement, departure from the Company or as elected. Compensation expense and the related deferred compensation obligation are recorded when the underlying compensation is earned. Over time, the deferred obligation may increase or decrease based on the performance results of investment options chosen by the plan participants. The investment options include Company common stock and a limited selection of mutual funds. The Company maintains sufficient shares of treasury stock to cover the equivalent number of shares that result from participants elections of the Company common stock investment option. As a result, the Company must periodically purchase its common shares in the open market. The Company purchases shares of the applicable mutual funds to fund the portion of its deferred compensation liabilities tied to such investments.
Some plan distributions may be made in cash or Company common stock at the option of the participant. Certain plan distributions can only be made in Company common stock. For deferred compensation obligations that may be settled in cash, the Company must record appreciation in the market value of the investment choices made by participants as additional compensation expense. Conversely, declines in the market value of the investment choices reduce compensation expense. Increases and decreases of compensation expense that result from
83
Table of Contents
fluctuations in the underlying investments are recorded in the administrative expense line of the consolidated statements of income. The additional compensation expense resulting from the appreciation of the market value and earnings of the selected investment options was $5,020,000 in 2010, $7,010,000 in 2009 and $211,000 in 2008. The Company’s deferred compensation liability was $32,333,000 and $27,619,000 at December 31, 2010 and 2009, respectively.
Because the obligations that must be settled only in Company common stock are treated as equity instruments, fluctuations in the market price of the underlying Company stock do not affect earnings.
14. Postretirement Benefit Plans
Defined Benefit Plans
The Company sponsors various funded qualified and unfunded non-qualified defined benefit pension plans, the most significant of which cover employees in the U.S. and U.K. locations. The U.S. and U.K. defined benefit pension plans were frozen and service benefits ceased to accrue in the following years:
| • | 2005 – Outside Directors Plan (unfunded) |
| • | 2006 – U.S. Salaried Plan (funded), Maywood Hourly Plan (funded), Supplemental Executive Plan (unfunded) and Stepan UK Plan (funded) |
| • | 2007 – Millsdale portion of the Millsdale/Anaheim Hourly Plan (funded) |
| • | 2008 – Anaheim portion of the Millsdale/Anaheim Hourly Plan (funded) |
Benefits earned through the applicable freeze date are available to participants when they retire, in accordance with the terms of the plan. In addition, the Company established defined contribution plans to replace the frozen defined benefit pension plans.
84
Table of Contents
Obligations and Funded Status at December 31
| (Dollars in thousands) | United States | United Kingdom | ||||||||||||||
| 2010 | 2009 | 2010 | 2009 | |||||||||||||
| Change in benefit obligation |
||||||||||||||||
| Benefit obligation at beginning of year |
$ | 119,559 | $ | 110,935 | $ | 19,056 | $ | 13,042 | ||||||||
| Interest cost |
7,030 | 6,963 | 1,037 | 856 | ||||||||||||
| Actuarial loss |
9,778 | 5,436 | 48 | 3,904 | ||||||||||||
| Benefits paid |
(4,065 | ) | (3,775 | ) | (403 | ) | (355 | ) | ||||||||
| Foreign exchange impact |
— | — | (658 | ) | 1,609 | |||||||||||
| Benefit obligation at end of year |
$ | 132,302 | $ | 119,559 | $ | 19,080 | $ | 19,056 | ||||||||
| (Dollars in thousands) | United States | United Kingdom | ||||||||||||||
| 2010 | 2009 | 2010 | 2009 | |||||||||||||
| Change in plan assets |
||||||||||||||||
| Fair value of plan assets at beginning of year |
$ | 93,516 | $ | 75,680 | $ | 13,622 | $ | 9,015 | ||||||||
| Actual return on plan assets |
10,953 | 18,213 | 1,713 | 1,686 | ||||||||||||
| Employer contributions |
2,937 | 3,398 | 880 | 2,144 | ||||||||||||
| Benefits paid |
(4,065 | ) | (3,775 | ) | (403 | ) | (355 | ) | ||||||||
| Foreign exchange impact |
— | — | (454 | ) | 1,132 | |||||||||||
| Fair value of plan assets at end of year |
$ | 103,341 | $ | 93,516 | $ | 15,358 | $ | 13,622 | ||||||||
| Funded status at end of year |
$ | (28,961 | ) | $ | (26,043 | ) | $ | (3,722 | ) | $ | (5,434 | ) | ||||
The amounts recognized in the consolidated balance sheets at December 31 consisted of
| (Dollars in thousands) | United States | United Kingdom | ||||||||||||||
| 2010 | 2009 | 2010 | 2009 | |||||||||||||
| Current liability |
$ | (268 | ) | $ | (350 | ) | $ | — | $ | — | ||||||
| Non-current liability |
(28,693 | ) | (25,693 | ) | (3,722 | ) | (5,434 | ) | ||||||||
| Net amount recognized |
$ | (28,961 | ) | $ | (26,043 | ) | $ | (3,722 | ) | $ | (5,434 | ) | ||||
The amounts recognized in accumulated other comprehensive income at December 31 consisted of
| (Dollars in thousands) | United States | United Kingdom | ||||||||||||||
| 2010 | 2009 | 2010 | 2009 | |||||||||||||
| Net actuarial loss |
$ | 41,702 | $ | 37,086 | $ | 4,583 | $ | 5,658 | ||||||||
85
Table of Contents
Below is information for pension plans with accumulated benefit obligations in excess of plan assets at December 31:
| (Dollars in thousands) | United States | United Kingdom | ||||||||||||||
| 2010 | 2009 | 2010 | 2009 | |||||||||||||
| Projected benefit obligation |
$ | 132,302 | $ | 119,559 | $ | 19,080 | $ | 19,056 | ||||||||
| Accumulated benefit obligation |
132,302 | 119,559 | 19,080 | 19,056 | ||||||||||||
| Fair value of plan assets |
103,341 | 93,516 | 15,358 | 13,622 | ||||||||||||
Components of Net Periodic Benefit Cost and Other Amounts Recognized in Other Comprehensive Income
Net periodic benefit costs for the years ended December 31, 2010, 2009 and 2008 were as follows:
| (Dollars in thousands) | United States | United Kingdom | ||||||||||||||||||||||
| 2010 | 2009 | 2008 | 2010 | 2009 | 2008 | |||||||||||||||||||
| Service cost |
$ | — | $ | — | $ | 2 | $ | — | $ | — | $ | — | ||||||||||||
| Interest cost |
7,030 | 6,963 | 6,524 | 1,037 | 856 | 986 | ||||||||||||||||||
| Expected return on plan assets |
(7,860 | ) | (7,487 | ) | (7,915 | ) | (866 | ) | (599 | ) | (920 | ) | ||||||||||||
| Amortization of net actuarial loss |
2,068 | 1,244 | 599 | 276 | 81 | — | ||||||||||||||||||
| Net periodic benefit cost (income) |
$ | 1,238 | $ | 720 | $ | (790 | ) | $ | 447 | $ | 338 | $ | 66 | |||||||||||
Other changes in plan assets and benefit obligations recognized in other comprehensive income for the years ended December 31, 2010, 2009 and 2008, were as follows:
| (Dollars in thousands) | United States | United Kingdom | ||||||||||||||||||||||
| 2010 | 2009 | 2008 | 2010 | 2009 | 2008 | |||||||||||||||||||
| Net actuarial (gain) loss |
$ | 6,684 | $ | (5,290 | ) | $ | 28,247 | $ | (799 | ) | $ | 2,817 | $ | 1,910 | ||||||||||
| Amortization of net actuarial loss |
(2,068 | ) | (1,244 | ) | (599 | ) | (276 | ) | (81 | ) | — | |||||||||||||
| Total recognized in other comprehensive income |
$ | 4,616 | $ | (6,534 | ) | $ | 27,648 | $ | (1,075 | ) | $ | 2,736 | $ | 1,910 | ||||||||||
| Total recognized in net periodic benefit cost and other comprehensive income |
$ | 5,854 | $ | (5,814 | ) | $ | 26,858 | $ | (628 | ) | $ | 3,074 | $ | 1,976 | ||||||||||
86
Table of Contents
The estimated amounts that will be amortized from accumulated other comprehensive income into net periodic benefit cost in 2011 are as follows:
| (Dollars in thousands) | United States | United Kingdom | ||||||
| Net actuarial loss |
$ | 3,141 | $ | 200 | ||||
Estimated Future Benefit Payments
| (Dollars in thousands) | United States | United Kingdom | ||||||
| 2011 |
$ | 5,033 | $ | 343 | ||||
| 2012 |
5,689 | 360 | ||||||
| 2013 |
6,262 | 396 | ||||||
| 2014 |
6,792 | 454 | ||||||
| 2015 |
7,271 | 494 | ||||||
| 2016 – 2020 |
42,378 | 3,251 | ||||||
Assumptions
The weighted-average assumptions used to determine benefit obligations at December 31 were as follows:
| United States | United Kingdom | |||||||||||||||
| 2010 | 2009 | 2010 | 2009 | |||||||||||||
| Discount rate |
5.40 | % | 6.00 | % | 5.60 | % | 5.70 | % | ||||||||
The weighted-average assumptions used to determine net periodic benefit costs for years ended December 31 were as follows:
| (Dollars in thousands) | United States | United Kingdom | ||||||||||||||||||||||
| 2010 | 2009 | 2008 | 2010 | 2009 | 2008 | |||||||||||||||||||
| Discount rate |
6.00 | % | 6.50 | % | 6.40 | % | 5.70 | % | 6.20 | % | 5.80 | % | ||||||||||||
| Expected long-term return on plan assets |
8.00 | % | 8.00 | % | 8.50 | % | 6.50 | % | 5.88 | % | 6.76 | % | ||||||||||||
In addition to the above assumptions, the Company uses a market-related value of assets approach to calculate the expected return on plan assets component of U.S. net periodic benefit cost. The market-related value equals the fair value of plan assets with five-year smoothing of asset gains or losses. Asset gains are subtracted or losses added in the following way: 80 percent of the prior year’s gain or loss; 60 percent of the second preceding year’s gain or loss; 40 percent of the third preceding year’s gain or loss; and 20 percent of the fourth preceding year’s gain or loss. Gains or losses for the year are calculated as the difference between the expected fair value of assets and the actual fair value of assets.
87
Table of Contents
Investment Strategies and Policies
U.S. Plans
Plan assets are invested using active investment strategies, as compared to passive or index investing. An investment management firm hires and monitors underlying investment management firms for each asset category. Managers within each asset category cover a range of investment styles and approaches and are combined in a way that controls for capitalization and style biases (for equities), and interest rate risk (for fixed income, or bonds) versus benchmark indexes, while focusing primarily on stock and bond selection to improve returns. International equities use the same capitalization and style biases, but do so for non-US companies from developed countries. Real estate uses private core real estate strategies, which provide stable and high levels of current income and enhanced core strategies, which seek slightly higher returns emphasizing appreciation. Absolute return investments produces low volatility returns with a low correlation to traditional assets by combining individual hedge funds that can generate positive returns in a variety of markets.
Risk is controlled through diversification among multiple asset categories, managers, styles, and securities. The investment management firm recommends asset allocations based on the Company’s plan needs and benchmark data for similar plans. The asset allocation targets are approved by the Company’s Plan Committee. Risk is further controlled both at the manager and asset category level by assigning targets for risk versus investment returns. Real estate uses guidelines for advisor allocation, investment size, geographic diversification and leverage. Absolute return investments invest in multiple funds using one of five different strategies. The investment manager evaluates performance by the underlying managers against these targets.
88
Table of Contents
Allowable investment categories include:
Equities: Common stocks of large, medium, and small companies, including both U.S. and non-U.S. based companies. The long-term target allocation for equities, excluding Company stock, is 43 percent.
Fixed Income (Debt): Bonds or notes issued or guaranteed by the U.S. government, and to a lesser extent, by non-U.S. governments, or by their agencies or branches, mortgage backed securities, including collateralized mortgage obligations, corporate bonds and dollar-denominated debt securities issued in the U.S. by non-U.S. banks and corporations. Up to 20 percent of the fixed income assets may be in debt securities that are below investment grade. The target allocation for fixed income is 30 percent.
Real Estate: Private real estate funds using office, apartment, industrial, retail, and other property types. The target allocation for real estate is four percent. No greater than 40 percent of the amount invested in real estate funds can be invested with any advisor, no more than 33 percent in any fund, no greater than 33 percent in any of eight U.S. regions, and portfolio leverage is generally targeted at less than 30 percent.
Absolute Return Investments (Hedge Funds): Utilizes fund of funds approach using long/short, market neutral, event-driven, convertible arbitrage, and fixed income arbitrage strategies. The target allocation for absolute return is zero percent.
Employer Securities: The retirement plans also hold shares of the Company’s common stock, which are purchased or sold by the trustee from time to time, as directed by the Plan Committee. At the direction of the Plan Committee, the plans sold 45,376 common shares to the Company’s ESOP trust on February 22, 2010. The plans did not purchase or sell employer securities during 2009. The target allocation for employer securities is 23 percent.
In addition to these primary investment types, excess cash may be invested in futures in order to efficiently achieve more fully invested portfolio positions. Otherwise, a small number of investment managers make limited use of derivatives, including futures contracts, options on futures and interest rate swaps in place of direct investment in securities to efficiently achieve equivalent market positions. Derivatives are not used to leverage portfolios.
U.K. Plan
The objective of the U.K. defined benefit pension fund investment strategy is to maximize the long-term rate of return on plan assets within a medium level of risk in order to minimize the cost of providing pension benefits. To that end, the plan assets are invested in an actively managed pooled fund of funds that diversifies its holdings among equity securities, debt securities, property and cash. Essentially, the plan is to hold equity instruments to back the benefits of participants yet to retire and bonds and cash to back current pensioners. Although there are no formal target allocations for the plan assets, the fund will generally be heavily invested in equity securities. Equity securities are selected from U.K., European, U.S. and
89
Table of Contents
emerging market companies. Bonds include U.K. and other countries’ government notes and corporate debt of U.K and non-U.K. companies. There are no specific prohibited investments, but the current managed fund will not allocate assets to derivatives or other financial hedging instruments. Plan trustees meet regularly with the fund manager to assess the fund’s performance and to reassess investment strategy.
At December 31, 2010, equities within the pooled pension fund comprised 65 percent U.K. companies, 12 percent other European companies, 15 percent U.S. companies and eight percent companies from other regions of the world. The equities are spread across growth and value styles. Fixed income instruments included a mix of 79 percent U.K. bonds (split between government fixed interest securities and high-grade corporate bonds) and 21 percent bonds of corporations and government agencies outside the U.K. (primarily U.S. and Europe).
Included in plan assets are insurance contracts purchased by the plan trustees to provide pension payments for specific retirees. In past years, at the time a plan participant retired, the plan trustee would at times purchase insurance contracts to cover the future payments due the retiree. This practice is no longer followed. The contracts are revocable, and the related plan obligations are not considered settled. Therefore, the plan assets and obligations include the insured amounts.
Plan Assets
U.S. Plans
The Company’s asset allocations for its pension plans at December 31, 2010 and 2009, by asset category, were as follows:
| December 31, 2010 | ||||||||||||||||
| Dollars in thousands |
Level 1 | Level 2 | Level 3 | Total | ||||||||||||
| Equity securities |
||||||||||||||||
| Common/Collective Trust Funds |
$ | — | $ | 43,499 | $ | — | $ | 43,499 | ||||||||
| Employer securities |
28,234 | — | — | 28,234 | ||||||||||||
| Fixed income |
||||||||||||||||
| Common/Collective Trust Funds |
— | 28,417 | — | 28,417 | ||||||||||||
| Hedge Fund |
— | — | 40 | 40 | ||||||||||||
| Real Estate |
||||||||||||||||
| Common/Collective Trust Funds |
— | — | 3,151 | 3,151 | ||||||||||||
| Total |
$ | 28,234 | $ | 71,916 | $ | 3,191 | $ | 103,341 | ||||||||
90
Table of Contents
| December 31, 2009 | ||||||||||||||||
| Dollars in thousands |
Level 1 | Level 2 | Level 3 | Total | ||||||||||||
| Equity securities |
||||||||||||||||
| Common/Collective Trust Funds |
$ | — | $ | 40,765 | $ | — | $ | 40,765 | ||||||||
| Employer securities |
26,933 | — | — | 26,933 | ||||||||||||
| Fixed income |
||||||||||||||||
| Common/Collective Trust Funds |
— | 23,326 | — | 23,326 | ||||||||||||
| Hedge Fund |
— | — | 354 | 354 | ||||||||||||
| Real Estate |
||||||||||||||||
| Common/Collective Trust Funds |
— | — | 2,138 | 2,138 | ||||||||||||
| Total |
$ | 26,933 | $ | 64,091 | $ | 2,492 | $ | 93,516 | ||||||||
Following is a description of the valuation methodologies used for plan assets measured at fair value. There have been no changes in the methodologies used at December 31, 2010.
Individual equity securities, including employer securities, are valued as determined by quoted market prices on the New York Stock Exchange.
Units of collective trusts, pooled investments by institutional investors, are valued by the trustee based primarily on price data for the underlying investments as provided by third-party pricing vendors. Assets in collective trusts consist mainly of equities, fixed income and real estate, which are valued as follows:
| 1. | Equities represent the largest asset category and are valued according to the exchange-quoted market prices of the underlying investments. |
| 2. | Fixed income investments do not have equivalent trading exchanges. Instead, fixed income investments are valued primarily through a technique known as “evaluated bid” to produce a price that would be reflected in the market. Evaluated bid modeling includes factors such as the interest rate on the coupon, maturity, rating, cash flow projections and other factors. A very small percentage of fixed income assets may be valued by broker quotes from a list of brokers approved in advance by the trustee. |
| 3. | Real estate investments are valued using specific market value information generated from the underlying funds in which the collective fund invests. This information is compiled and combined with other assets and/or liabilities of the fund to determine the real estate fund’s unit value. |
91
Table of Contents
Fair value changes within asset categories for which fair value measurements use significant unobservable inputs (Level 3) were as follows during 2009 and 2010:
| Dollars in thousands |
Real Estate Equity Fund |
Hedge Fund | Total | |||||||||
| Fair value, December 31, 2008 |
$ | 3,759 | $ | 986 | $ | 4,745 | ||||||
| Purchases at cost |
— | — | — | |||||||||
| Sale proceeds |
(136 | ) | (449 | ) | (585 | ) | ||||||
| Realized gain (loss) |
21 | (141 | ) | (120 | ) | |||||||
| Change in unrealized gain (loss) |
(1,506 | ) | (42 | ) | (1,548 | ) | ||||||
| Transfers in (out) of Level 3 |
— | — | — | |||||||||
| Fair value, December 31, 2009 |
$ | 2,138 | $ | 354 | $ | 2,492 | ||||||
| Purchases at cost |
865 | — | 865 | |||||||||
| Sale proceeds |
— | (136 | ) | (136 | ) | |||||||
| Realized gain (loss) |
— | (85 | ) | (85 | ) | |||||||
| Change in unrealized gain (loss) |
148 | (93 | ) | 55 | ||||||||
| Transfers in (out) of Level 3 |
— | — | — | |||||||||
| Fair value, December 31, 2010 |
$ | 3,151 | $ | 40 | $ | 3,191 | ||||||
U.K. Plan
| December 31, 2010 | ||||||||||||||||
| Dollars in thousands |
Level 1 | Level 2 | Level 3 | Total | ||||||||||||
| Cash |
$ | 314 | $ | — | $ | — | $ | 314 | ||||||||
| Equity securities |
||||||||||||||||
| Pooled Pension Funds |
— | 9,114 | — | 9,114 | ||||||||||||
| Fixed income |
||||||||||||||||
| Pooled Pension Funds |
— | 2,514 | — | 2,514 | ||||||||||||
| Real Estate |
||||||||||||||||
| Pooled Pension Funds |
— | 1,228 | — | 1,228 | ||||||||||||
| Insurance Contracts |
— | — | 2,188 | 2,188 | ||||||||||||
| Total |
$ | 314 | $ | 12,856 | $ | 2,188 | $ | 15,358 | ||||||||
92
Table of Contents
| December 31, 2009 | ||||||||||||||||
| Dollars in thousands |
Level 1 | Level 2 | Level 3 | Total | ||||||||||||
| Cash |
$ | 1,207 | $ | — | $ | — | $ | 1,207 | ||||||||
| Equity securities |
||||||||||||||||
| Pooled Pension Funds |
— | 6,981 | — | 6,981 | ||||||||||||
| Fixed income |
||||||||||||||||
| Pooled Pension Funds |
— | 2,310 | — | 2,310 | ||||||||||||
| Real Estate |
||||||||||||||||
| Pooled Pension Funds |
— | 861 | — | 861 | ||||||||||||
| Insurance Contracts |
— | — | 2,263 | 2,263 | ||||||||||||
| Total |
$ | 1,207 | $ | 10,152 | $ | 2,263 | $ | 13,622 | ||||||||
Units of each of the pooled funds are valued by the trustee based on quoted market prices of the underlying investments (the underlying assets are either exchange traded or have readily available markets).
Fair value changes within asset categories for which fair value measurements use significant unobservable inputs (Level 3) were as follows during 2009 and 2010:
| (Dollars in thousands) | Insurance Contracts | |||
| Fair value, December 31, 2008 |
$ | 1,792 | ||
| Sale proceeds (benefit payments) |
(154 | ) | ||
| Change in unrealized gain(loss) |
420 | |||
| Foreign exchange impact |
205 | |||
| Fair value, December 31, 2009 |
$ | 2,263 | ||
| Sale proceeds (benefit payments) |
(154 | ) | ||
| Change in unrealized gain(loss) |
159 | |||
| Foreign exchange impact |
(80 | ) | ||
| Fair value, December 31, 2010 |
$ | 2,188 | ||
Long-term Rate of Return for Plan Assets
U.S. Plans
The overall expected long-term rate of return on assets of 8.0 percent is based on plan asset allocation, capital markets forecasts and expected benefits of active investment management. For fixed income, the expected return is 5.0 percent. This assumption includes the yield on the five-year zero-coupon U.S. Treasury bond as the base rate along with historical data from the U.S. Treasury yield curve. For equities, the expected return is 8.3 percent for U.S. equities and
93
Table of Contents
8.4 percent for international equities. This return is based on a blended average of three different statistical models that each incorporates multiple factors including, for example, inflation, Gross Domestic Product and the Fed Funds Target Rate. For real estate, the expected return is 8.4 percent. For absolute return, the expected return is 5.2 percent.
The overall investment return forecast reflects the target allocations and the capital markets forecasts for each asset category, plus a premium for active asset management expected over the long-term.
U.K. Plan
The overall expected long term return on plan assets is a weighted average of the expected long term returns for equity securities, debt securities and other assets. The redemption yield at the measurement date on U.K. government fixed interest bonds and the yield on corporate bonds are used as proxies for the return on the debt portfolio. The returns for equities and property are estimated as a premium of three percent added to the risk-free rate. Cash is assumed to have a long-term return of four percent.
Other Defined Benefit Plans
The Company maintains unfunded defined benefit plans in other foreign locations. The liabilities and expenses associated with these plans are not material to the Company’s consolidated financial statements. Discount rates for these plans are determined based on local interest rates and plan participant data.
Cash Flows
The Company expects to contribute approximately $4,225,000 and $889,000 to its funded U.S. qualified and U.K. defined benefit pension plans, respectively, in 2011. The Company also expects to pay $268,000 in 2011 related to its unfunded non-qualified pension plans.
Defined Contribution Plans
Defined contribution plan expense was $4,309,000 for the year ended December 31, 2010, compared to $4,811,000 for the year ended December 31, 2009 and $7,351,000 for the year ended December 31, 2008. Expense for 2008 was greater than expense for 2010 and 2009 due primarily to the acceleration of discretionary transition contributions. When the Company froze its U.S. salaried defined benefit pension plan in 2006, a funded defined contribution plan was established that provided for fixed Company contributions and additional discretionary transition contributions to employee retirement accounts. The additional discretionary transition contributions were instituted to partially compensate certain U.S. employees for the loss in benefits resulting from freezing the defined benefit plans. In September 2008, the Company’s Board of Directors approved an acceleration of a portion of the transition contribution. As a result, $1,927,000 of additional transition contribution expense was recorded in the third quarter ended September 30, 2008.
94
Table of Contents
The Company also sponsors a funded qualified profit sharing plan for its U.S. salaried employees and for some hourly employees. Company contributions are determined each year using a formula that is tied to Company profits. The contributions are allocated to participant accounts on the basis of participant base earnings. Profit sharing expense was $5,061,000, $4,985,000 and $2,158,000 for the years ended December 31, 2010, 2009 and 2008, respectively.
In addition to the Company sponsored profit sharing plan, certain foreign locations are required by law to make profit sharing contributions to employees based on statutory formulas. In 2010, the Company recognized $800,000 of expense related to the statutory plans compared to $1,572,000 in 2009 and $526,000 in 2008.
15. Accrued Liabilities
The composition of accrued liabilities was as follows:
| December 31 | ||||||||
| (Dollars in thousands) |
2010 | 2009 | ||||||
| Accrued payroll and benefits |
$ | 34,521 | $ | 36,143 | ||||
| Accrued customer rebates |
10,014 | 7,858 | ||||||
| Other accrued liabilities |
14,235 | 14,455 | ||||||
| Total accrued liabilities |
$ | 58,770 | $ | 58,456 | ||||
16. Other Non-Current Liabilities
The composition of other non-current liabilities was as follows:
| December 31 | ||||||||
| (Dollars in thousands) |
2010 | 2009 | ||||||
| Deferred revenue |
$ | 1,767 | $ | 2,881 | ||||
| Environmental and legal matters |
13,719 | 15,854 | ||||||
| Deferred compensation liability |
31,514 | 26,556 | ||||||
| Pension liability |
34,293 | 32,878 | ||||||
| Other non-current liabilities |
6,323 | 5,564 | ||||||
| Total other non-current liabilities |
$ | 87,616 | $ | 83,733 | ||||
17. Contingencies
There are a variety of legal proceedings pending or threatened against the Company. Some of these proceedings may result in fines, penalties, judgments or costs being assessed against the Company at some future time. The Company’s operations are subject to extensive local, state and federal regulations, including the U.S. Comprehensive Environmental Response, Compensation and Liability Act of 1980 (CERCLA) and the Superfund amendments of 1986 (“Superfund”). Over the years, the Company has received requests for information related to or has been named by the government as a PRP at a number of waste disposal sites where clean up costs have been or may be incurred under CERCLA and similar state statutes. In addition,
95
Table of Contents
damages are being claimed against the Company in general liability actions for alleged personal injury or property damage in the case of some disposal and plant sites. The Company believes that it has made adequate provisions for the costs it may incur with respect to these sites.
The Company has estimated a range of possible environmental and legal losses from $10.0 million to $29.7 million at December 31, 2010. At December 31, 2010, the Company’s accrued liability for such losses, which represents the Company’s best estimate within the estimated range of possible environmental and legal losses, was $15.9 million compared to $17.1 million at December 31, 2009. During 2010, cash outlays related to legal and environmental matters approximated $2.7 million compared to $3.1 million expended in 2009.
For certain sites, estimates cannot be made of the total costs of compliance, or the Company’s share of such costs; consequently, the Company is unable to predict the effect thereof on the Company’s financial position, cash flows and results of operations. Management believes that in the event of one or more adverse determinations in any annual or interim period, the impact on the Company’s cash flows and results of operations for those periods could be material. However, based upon the Company’s present belief as to its relative involvement at these sites, other viable entities’ responsibilities for cleanup, and the extended period over which any costs would be incurred, the Company believes that these matters, individually and in the aggregate, will not have a material effect on the Company’s financial position.
Following are summaries of the material contingencies at December 31, 2010:
Maywood, New Jersey Site
The Company’s property in Maywood, New Jersey and property formerly owned by the Company adjacent to its current site and other nearby properties (Maywood site) were listed on the National Priorities List in September 1993 pursuant to the provisions of CERCLA because of certain alleged chemical contamination. Pursuant to an Administrative Order on Consent entered into between USEPA and the Company for property formerly owned by the Company, and the issuance of an order by USEPA to the Company for property currently owned by the Company, the Company completed a Remedial Investigation Feasibility Study (RI/FS) in 1994. The Company submitted the Draft Feasibility Study for Soil and Source Areas (Operable Unit 1) in September 2002. In addition, the Company has submitted other documentation and information as requested by USEPA, including a Draft Final FS for Groundwater (Operable Unit 2) in June 2003, additional information regarding groundwater in May 2007, submission of a Draft Feasibility Study for Soil and Groundwater (Operable Units 1 and 2) in March 2009, and additional requested information regarding soil and groundwater in February 2010 and June 2010. The Company also submitted another Draft Feasibility Study for Soil and Groundwater (Operable Units 1 and 2) in September 2010. The Company is awaiting the issuance of a Record of Decision from USEPA. In addition, the Company was informed that certain work included in the remediation cost estimates would not be required. As a result, the Company was able to reduce its remediation liability for this site by $0.8 million in the third quarter of 2010.
The Company believes it has adequate reserves for claims associated with the Maywood site, and has recorded a liability for the estimated probable costs it expects to incur at the Maywood site related to remediation of chemical contamination. However, depending on the results of the ongoing discussions with USEPA, the final cost of such remediation could differ from the current estimates.
96
Table of Contents
In addition, under the terms of a settlement agreement reached on November 12, 2004, the United States Department of Justice and the Company agreed to fulfill the terms of a Cooperative Agreement reached in 1985 under which the United States will take title to and responsibility for radioactive waste removal at the Maywood site, including past and future remediation costs incurred by the United States.
D’Imperio Property Site
During the mid-1970’s, Jerome Lightman and the Lightman Drum Company disposed of hazardous substances at several sites in New Jersey. The Company was named as a potentially responsible party (PRP) in the case United States v. Lightman (1:92-cv-4710 D.N.J.), which involved the D’Imperio Property Site located in New Jersey. In the second quarter of 2007, the Company reached an agreement with respect to the past costs and future allocation percentage in said litigation for costs related to the D’Imperio site, including costs to comply with USEPA’s Unilateral Administrative Orders. The Company paid the settlement amount in the third quarter of 2007. The resolution of the Company’s liability for this litigation did not have a material impact on the financial position, results of operations or cash flows of the Company. In December 2007, the Company received updated remediation cost estimates, which were considered in the Company’s determination of its range of estimated possible losses and reserve balance.
Remediation work is continuing at this site. Based on current information, the Company believes that it has adequate reserves for claims associated with the D’Imperio site. However, actual costs could differ from current estimates.
Ewan Property Site
The case United States v. Lightman (1:92-cv-4710 D.N.J.), described above for the D’Imperio site, also involved the Ewan Property Site located in New Jersey. The agreement described above also included a settlement with respect to the past costs and future allocation percentage in said litigation for costs related to the past costs and allocation percentage at the Ewan site. The Company paid the settlement amount in the third quarter of 2007. The resolution of the Company’s liability for this litigation did not have a material impact on the financial position, results of operations or cash flows of the Company.
In addition, the NJDEP filed a natural resource damages complaint in June 2007 against the Company and other entities regarding the Ewan site. The Company was served with the complaint in May 2008. The parties, including the Company, settled this litigation in the fourth quarter of 2010. The resolution of the Company’s liability for this litigation did not have a material impact on the financial position, results of operations or cash flows of the Company.
There is some monitoring and operational work continuing at the Ewan site. Based on current information, the Company believes that it has adequate reserves for claims associated with the Ewan site. However, actual costs could differ from current estimates.
97
Table of Contents
Lightman Drum Company Superfund Site
The Company received a Section 104(e) Request for Information from USEPA dated March 21, 2000, regarding the Lightman Drum Company Superfund Site located in Winslow Township, New Jersey. The Company responded to this request on May 18, 2000. In addition, the Company received a Notice of Potential Liability and Request to Perform RI/FS dated June 30, 2000, from USEPA. The Company participated in the performance of the RI/FS as a member of the Lightman Yard PRP Group. The RI/FS was performed under an interim allocation.
In the fourth quarter of 2007, the PRPs who agreed to conduct the interim remedial action entered into an Administrative Settlement Agreement and Order on Consent for Removal Action with USEPA, and these PRPs also entered into a Supplemental Lightman Yard Participation and Interim Funding Agreement to fund the agreed-upon removal action. The Company paid a soil removal assessment upon execution of the agreements which did not have a material impact on the financial position, results of operations or cash flows of the Company. The soil removal action was completed and USEPA approved it in October 2009. A final Feasibility Study was submitted to USEPA in February 2009 and was approved in March 2009. In June 2009, USEPA issued a Proposed Plan for Remediation. In September 2009, USEPA signed the Record of Decision. USEPA issued an Administrative Order for Remedial Design and Remedial Action to some of the PRPs in June 2010 which requires the PRPs to implement the remedy USEPA selected in the Record of Decision. The Company executed a Master PRP agreement with a final allocation which was effective September 30, 2010. As a result of receiving the final allocation, the Company was able to decrease its liability for this site by $0.7 million in the third quarter of 2010.
The Company believes that based on current information it has adequate reserves for claims associated with the Lightman site. However, actual costs could differ from current estimates.
Wilmington Site
The Company is currently contractually obligated to contribute to the response costs associated with the Company’s formerly-owned site at 51 Eames Street, Wilmington, Massachusetts. Remediation at this site is being managed by its current owner to whom the Company sold the property in 1980. Under the agreement, once total site remediation costs exceed certain levels, the Company is obligated to contribute up to five percent of future response costs associated with this site with no limitation on the ultimate amount of contributions. To date, the Company has paid the current owner $1.9 million for the Company’s portion of environmental response costs through the third quarter of 2010 (the current owner of the site bills the Company one calendar quarter in arrears). The Company has recorded a liability for its portion of the estimated remediation costs for the site. Depending on the ultimate cost of the remediation at this site, the amount for which the Company is liable could differ from the current estimates.
In addition, in response to the special notice letter received by the PRPs in June 2006 from USEPA seeking performance of an RI/FS at the site, certain PRPs, including the Company, signed an Administrative Settlement Agreement and Order on Consent for the RI/FS effective July 2007, which sets forth the obligations of the PRPs to perform the RI/FS.
98
Table of Contents
The Company and other prior owners also entered into an agreement in April 2004 waiving certain statute of limitations defenses for claims which may be filed by the Town of Wilmington, Massachusetts, in connection with this site. While the Company has denied any liability for any such claims, the Company agreed to this waiver while the parties continue to discuss the resolution of any potential claim which may be filed.
The Company believes that based on current information it has adequate reserves for the claims related to this site. However, actual costs could differ from current estimates.
Poland Manufacturing Site
During the due diligence phase of the Company’s acquisition of Alfa Systems in Brzeg Dolny, Poland, some soil contamination in levels above allowable standards in Poland was discovered on the plant site, and there is legal obligation to conduct further investigation and remediation. Based on environmental engineering estimates, it was determined that the cost of remediation would range from approximately $1.1 million to $1.7 million. To expedite the purchase of Alfa Systems the Company agreed to assume the remediation obligation. As part of the purchase agreement, the Company negotiated a purchase price holdback provision of $1.1 million, wherein any portion of the holdback not spent for soil remediation after one year following the acquisition date (i.e., July 15, 2011) would be remitted to the previous owners of Alfa Systems. The Company’s environmental liability balance at December 31, 2010 included a $1.1 million remediation reserve for the Poland site. On the basis of current information, the Company believes the recorded liability is adequate, but actual costs could differ from current estimates.
99
Table of Contents
18. Segment Reporting
The Company has three reportable segments: surfactants, polymers and specialty products. Each segment provides distinct products and requires separate management due to unique markets, technologies and production processes. Surfactants are used in a variety of consumer and industrial cleaning compounds as well as in agricultural products, lubricating ingredients, biodiesel and other specialized applications. Polymers generates its revenues primarily from the sale of polyols and phthalic anhydride used in plastics, building materials and refrigeration systems. Specialty products are used in food, flavoring and pharmaceutical applications.
The Company evaluates the performance of its segments and allocates resources based on operating income before interest income/expense, other income/expense items and income tax provisions. The accounting policies of the reportable segments are the same as those described in the summary of significant accounting policies.
Segment data for the three years ended December 31, 2010, 2009 and 2008, are as follows:
| (Dollars in thousands) |
Surfactants | Polymers | Specialty Products |
Segment Totals |
||||||||||||
| 2010 |
||||||||||||||||
| Net sales |
$ | 1,057,982 | $ | 330,416 | $ | 42,724 | $ | 1,431,122 | ||||||||
| Operating income |
93,010 | 36,904 | 14,499 | 144,413 | ||||||||||||
| Assets |
548,297 | 157,114 | 26,427 | 731,838 | ||||||||||||
| Capital expenditures |
56,562 | 23,895 | 1,462 | 81,919 | ||||||||||||
| Depreciation and amortization expenses |
27,260 | 9,519 | 1,442 | 38,221 | ||||||||||||
| 2009 |
||||||||||||||||
| Net sales |
$ | 972,647 | $ | 260,770 | $ | 42,965 | $ | 1,276,382 | ||||||||
| Operating income |
98,947 | 33,957 | 12,621 | 145,525 | ||||||||||||
| Assets |
406,772 | 113,892 | 24,147 | 544,811 | ||||||||||||
| Capital expenditures |
26,788 | 12,635 | 923 | 40,346 | ||||||||||||
| Depreciation and amortization expenses |
25,043 | 8,663 | 1,461 | 35,167 | ||||||||||||
| 2008 |
||||||||||||||||
| Net sales |
$ | 1,199,438 | $ | 359,014 | $ | 41,678 | $ | 1,600,130 | ||||||||
| Operating income |
52,261 | 34,103 | (a) | 5,949 | 92,313 | |||||||||||
| Assets |
434,515 | 121,973 | 25,004 | 581,492 | ||||||||||||
| Capital expenditures |
25,666 | 16,271 | 1,196 | 43,133 | ||||||||||||
| Depreciation and amortization expenses |
26,749 | 6,721 | 1,399 | 34,869 | ||||||||||||
| (a) | Includes $9.9 million gain on sale of polyurethane systems product lines. |
100
Table of Contents
Below are reconciliations of segment data to the consolidated financial statements:
| (Dollars in thousands) |
2010 | 2009 | 2008 | |||||||||
| Operating income - segment totals |
$ | 144,413 | $ | 145,525 | $ | 92,313 | ||||||
| Unallocated corporate expenses (a) |
(36,516 | ) | (40,637 | ) | (21,633 | ) (b) | ||||||
| Total operating income |
107,897 | 104,888 | 70,680 | |||||||||
| Interest expense, net |
(6,341 | ) | (6,271 | ) | (9,514 | ) | ||||||
| Loss from equity in joint ventures |
(1,663 | ) | (3,709 | ) | (2,697 | ) | ||||||
| Other, net |
1,586 | 2,223 | (3,591 | ) | ||||||||
| Consolidated income before income taxes |
$ | 101,479 | $ | 97,131 | $ | 54,878 | ||||||
| Assets - segment totals |
$ | 731,838 | $ | 544,811 | $ | 581,492 | ||||||
| Unallocated corporate assets |
79,593 | 89,392 | 30,405 | |||||||||
| Consolidated assets |
$ | 811,431 | $ | 634,203 | $ | 611,897 | ||||||
| Capital expenditures - segment totals |
$ | 81,919 | $ | 40,346 | $ | 43,133 | ||||||
| Unallocated corporate expenditures |
2,229 | 2,285 | 6,645 | |||||||||
| Consolidated capital expenditures |
$ | 84,148 | $ | 42,631 | $ | 49,778 | ||||||
| Depreciation and amortization expenses – segment totals |
$ | 38,221 | $ | 35,167 | $ | 34,869 | ||||||
| Unallocated corporate depreciation expenses |
2,130 | 2,004 | 2,059 | |||||||||
| Consolidated depreciation and amortization expenses |
$ | 40,351 | $ | 37,171 | $ | 36,928 | ||||||
| (a) | Unallocated corporate expenses primarily comprise corporate administrative expenses (e.g., corporate finance, legal, human resources, information systems) that are not included in segment operating income and not used to evaluate segment performance. |
| (b) | Includes $8.5 million gain on sale of land. |
101
Table of Contents
Below is certain Company-wide geographic data for the years ended December 31, 2010, 2009 and 2008:
| (Dollars in thousands) |
2010 | 2009 | 2008 | |||||||||
| Net sales (a) |
||||||||||||
| United States |
$ | 863,780 | $ | 808,035 | $ | 1,051,551 | ||||||
| France |
238,310 | 206,677 | 250,804 | |||||||||
| United Kingdom |
104,071 | 91,690 | 111,795 | |||||||||
| All other countries |
224,961 | 169,980 | 185,980 | |||||||||
| Total |
$ | 1,431,122 | $ | 1,276,382 | $ | 1,600,130 | ||||||
| Long-lived assets (b) |
||||||||||||
| United States |
$ | 204,137 | $ | 181,475 | $ | 176,904 | ||||||
| Germany (c) |
28,751 | 17,479 | 14,973 | |||||||||
| Singapore (d) |
25,174 | — | — | |||||||||
| Philippines |
22,284 | — | — | |||||||||
| Brazil (e) |
21,061 | 5,435 | 3,964 | |||||||||
| United Kingdom |
17,750 | 18,655 | 17,880 | |||||||||
| All other countries |
46,402 | 35,007 | 35,162 | |||||||||
| Total |
$ | 365,559 | $ | 258,051 | $ | 248,883 | ||||||
| (a) | Net sales are attributed to countries based on selling location. |
| (b) | Includes property, plant and equipment, goodwill and other intangible assets. |
| (c) | The growth in asset values reflects the expansion of polyol manufacturing capacity that is projected to be completed in the second quarter of 2011. |
| (d) | The Singapore assets reflect the development of a methyl esters fractionation facility that is projected to be operational in the second quarter of 2012. |
| (e) | The growth in asset values reflects expansion of neutralization capacity at the Company’s subsidiary in Brazil. The neutralizer is expected to begin producing commercially in the first quarter of 2011. |
102
Table of Contents
19. Earnings Per Share
Below is the computation of basic and diluted earnings per share for the years ended December 31, 2010, 2009 and 2008:
| (In thousands, except per share amounts) |
2010 | 2009 | 2008 | |||||||||
| Computation of Basic Earnings per Share |
||||||||||||
| Net income attributable to Stepan Company |
$ | 65,427 | $ | 63,049 | $ | 37,172 | ||||||
| Deduct dividends on preferred stock |
747 | 755 | 769 | |||||||||
| Income applicable to common stock |
$ | 64,680 | $ | 62,294 | $ | 36,403 | ||||||
| Weighted-average number of shares outstanding |
10,163 | 9,870 | 9,566 | |||||||||
| Basic earnings per share |
$ | 6.36 | $ | 6.31 | $ | 3.81 | ||||||
| Computation of Diluted Earnings per Share |
||||||||||||
| Net income attributable to Stepan Company |
$ | 65,427 | $ | 63,049 | $ | 37,172 | ||||||
| Weighted-average number of shares outstanding |
10,163 | 9,870 | 9,566 | |||||||||
| Add net shares from assumed exercise of options (under treasury stock method) |
|
258 |
|
|
248 |
|
|
318 |
| |||
| Add contingently issuable net shares related to performance stock awards (under treasury stock method) |
50 | 51 | 27 | |||||||||
| Add weighted-average shares from assumed conversion of convertible preferred stock |
619 | 627 | 638 | |||||||||
| Shares applicable to diluted earnings |
11,090 | 10,796 | 10,549 | |||||||||
| Diluted earnings per share |
$ | 5.90 | $ | 5.84 | $ | 3.52 | ||||||
20. Sale of Product Lines
On July 31, 2008, the Company sold select polyurethane system product lines to Bayer MaterialScience LLC (Bayer). The product lines that were sold comprised products used as insulation materials for appliances, water heaters, doors, roofs, picnic coolers and other similar applications, and represented approximately $16,000,000 in Company annual net sales. The sale consisted primarily of Company-developed customer lists and product formulations related to the product lines. No manufacturing or other physical assets were included in the sale, and no personnel reductions were made. As consideration for the sale, the Company received $9,929,000 of cash, all of which was recorded as a pretax gain in the third quarter ended September 30, 2008. The gain was attributed to the polymer segment. In addition to the sale of the product lines, the Company and Bayer entered into a separate manufacturing agreement whereby the Company would produce the divested products on Bayer’s behalf and at Bayer’s option for a period of up to two years to allow Bayer time to transition the manufacture of the
103
Table of Contents
products to its own facilities. The original manufacturing agreement expired in 2010. No take-or-pay or minimum purchase requirements were included in the agreement. Other than acting as a contract manufacturer for Bayer during the term of the manufacturing agreement, the Company has no continuing involvement with the divested product lines.
21. Land Sale and Office Building Acquisition
In September 2008, the Company sold 88 acres of land at its Millsdale manufacturing facility in Elwood, Illinois, to an industrial park developer for $8,634,000. The land had a cost basis of $165,000, so the Company recorded a pretax gain of $8,469,000. The gain was not attributed to any reportable segment. Also in September 2008, the Company purchased a 64,000 square foot office building along with 3.25 acres of land near its corporate headquarters for $6,442,000. For income tax purposes, the Millsdale land sale and the office building purchase were structured as a tax-deferred, like-kind exchange pursuant to section 1031 of the U.S. Internal Revenue Code. To accomplish the tax deferred exchange, the Company directed that the land sale proceeds ($8,634,000) be deposited with and held by a qualified intermediary until consummation of the exchange, which occurred when renovations to the office building were finalized in March 2009. The proceeds held by the intermediary were classified as restricted cash until completion of the tax-free exchange, at which time the restricted designation was lifted.
22. Investment in China Joint Venture
On May 15, 2008, the Company increased its controlling ownership interest in the Stepan China joint venture (a reporting unit within the Company’s polymer reportable segment) from 55 percent to 80 percent. The Company achieved the increase in ownership by contributing an additional $3,109,000 of capital (all cash) to Stepan China. By agreement, the minority joint venture partner made no additional capital contribution, thereby reducing its noncontrolling interest in the Stepan China joint venture from 45 percent to 20 percent. The Company accounted for this transaction as a step acquisition, applying purchase accounting treatment in accordance with the acquisition accounting rules in effect at that time. No intangible assets or goodwill were acquired as a result of the step acquisition. Stepan China’s accounts have been included in the Company’s Consolidated Financial Statements since the formation of the joint venture, when the Company first obtained controlling interest.
23. Statement of Cash Flows – Noncash Investing and Financing Activities
Noncash financing activities for the years ended December 31, 2010, 2009 and 2008, included the receipt of shares of the Company’s common stock tendered in lieu of cash by employees exercising stock options. The tendered shares, which were owned by employees for more than six months, had values of $1,361,000 in 2010 (17,811 shares), $2,073,000 in 2009 (35,235 shares) and $3,690,000 in 2008 (77,685 shares) and were recorded as treasury stock. Noncash financing activities for the years ended December 31, 2010 and 2009, also included the issuance of 62,478 shares and 45,769 shares, respectively, of Company common stock (value of $3,130,000 and $1,538,000, respectively) related to the Company’s performance stock award plan. Noncash investing activities included unpaid liabilities (accounts payable) incurred for
104
Table of Contents
fixed asset acquisitions of approximately $9,959,000 in 2010, $6,574,000 in 2009 and $8,241,000 in 2008. Noncash financing and investing activities for the year ended December 31, 2010, also included an $11,413,000 warehouse acquisition in the U.S. under a build-to-suit lease arrangement and a $13,008,000 equipment acquisition in Singapore under a seller-financed purchase agreement.
105
Table of Contents
Selected Quarterly Financial Data
(Dollars in thousands, except per share data)
Unaudited
| 2010 | ||||||||||||||||||||
| Quarter |
First | Second | Third | Fourth | Year | |||||||||||||||
| Net Sales |
$ | 337,030 | $ | 366,504 | $ | 366,800 | $ | 360,788 | $ | 1,431,122 | ||||||||||
| Gross Profit |
63,552 | 63,478 | 58,429 | 50,519 | 235,978 | |||||||||||||||
| Interest, net |
(1,256 | ) | (1,510 | ) | (2,004 | ) | (1,571 | ) | (6,341 | ) | ||||||||||
| Income Before Income Taxes |
31,606 | 26,387 | 31,280 | 12,206 | 101,479 | |||||||||||||||
| Net Income |
20,681 | 17,069 | 19,223 | 8,618 | 65,591 | |||||||||||||||
| Net Income Attributable to Stepan Company |
20,660 | 17,046 | 19,230 | 8,491 | 65,427 | |||||||||||||||
| Per Diluted Share |
1.88 | 1.53 | 1.73 | 0.76 | 5.90 | |||||||||||||||
| 2009 | ||||||||||||||||||||
| Quarter |
First | Second | Third | Fourth | Year | |||||||||||||||
| Net Sales |
$ | 318,143 | $ | 321,199 | $ | 326,225 | $ | 310,815 | $ | 1,276,382 | ||||||||||
| Gross Profit |
48,695 | 65,658 | 68,931 | 49,819 | 233,103 | |||||||||||||||
| Interest, net |
(1,842 | ) | (1,585 | ) | (1,508 | ) | (1,336 | ) | (6,271 | ) | ||||||||||
| Income Before Income Taxes |
23,251 | 30,627 | 30,431 | 12,822 | 97,131 | |||||||||||||||
| Net Income |
15,158 | 19,560 | 19,588 | 8,797 | 63,103 | |||||||||||||||
| Net Income Attributable to Stepan Company |
15,153 | 19,584 | 19,545 | 8,767 | 63,049 | |||||||||||||||
| Per Diluted Share |
1.43 | 1.83 | 1.80 | 0.80 | 5.84 | |||||||||||||||
106
Table of Contents
| Item 9. | Changes in and Disagreements with Accountants on Accounting and Financial Disclosure |
None
| Item 9A. | Controls and Procedures |
| a. | Evaluation of Disclosure Controls and Procedures |
Based on their evaluation of our disclosure controls and procedures as of the end of the most recent fiscal quarter covered by this Form 10-K, our Chief Executive Officer and our Chief Financial Officer have concluded that our disclosure controls and procedures (as defined in Rules 13a-15(e) and 15d-15(e) promulgated under the Securities Exchange Act of 1934) were effective as of December 31, 2010.
| b. | Management’s Annual Report on Internal Control over Financial Reporting |
The management of Stepan Company (the Company) is responsible for establishing and maintaining adequate internal control over financial reporting. The Company’s internal control system was designed to provide reasonable assurance to the Company’s management and board of directors regarding the preparation and fair presentation of published financial statements.
All internal control systems, no matter how well designed, have inherent limitations. Therefore, even those systems determined to be effective can provide only reasonable assurance with respect to financial statement preparation and presentation.
The Company’s management assessed the effectiveness of the Company’s internal control over financial reporting as of December 31, 2010. In making this assessment, it used the criteria set forth by the Committee of Sponsoring Organizations of the Treadway Commission (COSO) in Internal Control – Integrated Framework. Based on our assessment we believe that, as of December 31, 2010, the Company’s internal controls over financial reporting were effective based on those criteria.
The Company’s independent registered public accounting firm that audited the financial statements included in this Form 10-K has issued an attestation report on the Company’s internal control over financial reporting. This report follows:
| c. | Report of Independent Registered Public Accounting Firm |
To the Board of Directors and Stockholders of
Stepan Company
Northfield, Illinois
107
Table of Contents
We have audited the internal control over financial reporting of Stepan Company and subsidiaries (the “Company”) as of December 31, 2010, based on criteria established in Internal Control – Integrated Framework issued by the Committee of Sponsoring Organizations of the Treadway Commission. The Company’s management is responsible for maintaining effective internal control over financial reporting and for its assessment of the effectiveness of internal control over financial reporting, included in the accompanying Management’s Annual Report on Internal Control over Financial Reporting. Our responsibility is to express an opinion on the Company’s internal control over financial reporting based on our audit.
We conducted our audit in accordance with the standards of the Public Company Accounting Oversight Board (United States). Those standards require that we plan and perform the audit to obtain reasonable assurance about whether effective internal control over financial reporting was maintained in all material respects. Our audit included obtaining an understanding of internal control over financial reporting, assessing the risk that a material weakness exists, testing and evaluating the design and operating effectiveness of internal control based on the assessed risk, and performing such other procedures as we considered necessary in the circumstances. We believe that our audit provides a reasonable basis for our opinion.
A company’s internal control over financial reporting is a process designed by, or under the supervision of, the company’s principal executive and principal financial officers, or persons performing similar functions, and effected by the company’s board of directors, management, and other personnel to provide reasonable assurance regarding the reliability of financial reporting and the preparation of financial statements for external purposes in accordance with generally accepted accounting principles. A company’s internal control over financial reporting includes those policies and procedures that (1) pertain to the maintenance of records that, in reasonable detail, accurately and fairly reflect the transactions and dispositions of the assets of the company; (2) provide reasonable assurance that transactions are recorded as necessary to permit preparation of financial statements in accordance with generally accepted accounting principles, and that receipts and expenditures of the company are being made only in accordance with authorizations of management and directors of the company; and (3) provide reasonable assurance regarding prevention or timely detection of unauthorized acquisition, use, or disposition of the company’s assets that could have a material effect on the financial statements.
108
Table of Contents
Because of the inherent limitations of internal control over financial reporting, including the possibility of collusion or improper management override of controls, material misstatements due to error or fraud may not be prevented or detected on a timely basis. Also, projections of any evaluation of the effectiveness of the internal control over financial reporting to future periods are subject to the risk that the controls may become inadequate because of changes in conditions, or that the degree of compliance with the policies or procedures may deteriorate.
In our opinion, the Company maintained, in all material respects, effective internal control over financial reporting as of December 31, 2010, based on the criteria established in Internal Control – Integrated Framework issued by the Committee of Sponsoring Organizations of the Treadway Commission.
We have also audited, in accordance with the standards of the Public Company Accounting Oversight Board (United States), the accompanying consolidated financial statements of Stepan Company and subsidiaries as of and for the year ended December 31, 2010, and our report dated February 28, 2011 expressed an unqualified opinion on those financial statements.
/s/ Deloitte & Touche LLP
DELOITTE & TOUCHE LLP
Chicago, Illinois
February 28, 2011
| d. | Changes in Internal Control Over Financial Reporting |
There were no significant changes in internal controls that occurred during our most recent fiscal quarter that have materially affected, or are reasonably likely to materially affect, our internal control over financial reporting.
| Item 9B. | Other Information |
None
109
Table of Contents
PART III
| Item 10. | Directors, Executive Officers and Corporate Governance |
| (a) | Directors |
See Company’s Proxy Statement for Annual Meeting of Stockholders to be held May 3, 2011, for Directors of the Registrant, which is incorporated by reference herein.
| (b) | Executive Officers |
See Executive Officers of the Registrant in Part I above for the identification of the Executive Officers of the Registrant. See Company’s Proxy Statement for Annual Meeting of Stockholders to be held May 3, 2011, for other information on Executive Officers of the Registrant, which is incorporated by reference herein.
| (c) | Audit Committee Financial Expert |
See Company’s Proxy Statement for Annual Meeting of Stockholders to be held May 3, 2011, for Audit Committee Financial Expert, which is incorporated by reference herein.
| (d) | Code of Conduct |
See Company’s Proxy Statement for Annual Meeting of Stockholders to be held May 3, 2011, for Code of Conduct, which is incorporated by reference herein.
| Item 11. | Executive Compensation |
See Company’s Proxy Statement for Annual Meeting of Stockholders to be held May 3, 2011, for Compensation of Executive Officers and Directors, which is incorporated by reference herein.
| Item 12. | Security Ownership of Certain Beneficial Owners and Management and Related Stockholder Matters |
See Company’s Proxy Statement for Annual Meeting of Stockholders to be held May 3, 2011, for Security Ownership, which is incorporated by reference herein.
| Item 13. | Certain Relationships and Related Transactions, and Director Independence |
See Company’s Proxy Statement for Annual Meeting of Stockholders to be held May 3, 2011, for Transactions with Related Persons, Promoters and Certain Control Persons and for Corporate Governance Principles and Board Matters, which are incorporated by reference herein.
110
Table of Contents
| Item 14. | Principal Accounting Fees and Services |
See Company’s Proxy Statement for Annual Meeting of Stockholders to be held May 3, 2011, for Accounting and Auditing Matters, which is incorporated by reference herein.
111
Table of Contents
PART IV
| Item 15. | Exhibits, Financial Statement Schedules |
| (a) | Financial Statements |
See Item 8 for the Consolidated Financial Statements and supplementary data included in this Form 10-K.
| (b) | Exhibits |
See Exhibit Index filed herewith
112
Table of Contents
Pursuant to the requirements of Section 13 or 15(d) of the Securities Exchange Act of 1934, the Registrant has duly caused this report to be signed on its behalf by the undersigned, thereunto duly authorized.
| STEPAN COMPANY | ||
| /s/ James E. Hurlbutt | ||
| By: | James E. Hurlbutt Vice President and Chief Financial Officer | |
February 28, 2011
Pursuant to the requirements of the Securities Exchange Act of 1934, this report has been signed below by the following persons on behalf of the Registrant and in the capacities and on the dates indicated.
| /s/ F. Quinn Stepan F. Quinn Stepan |
Chairman and Director | February 28, 2011 | ||
| /s/ F. Quinn Stepan, Jr. F. Quinn Stepan, Jr. |
President, Chief Executive Officer and Director (Principal Executive Officer) |
February 28, 2011 | ||
| /s/ James E. Hurlbutt James E. Hurlbutt |
Vice President and Chief Financial Officer (Principal Financial and Accounting Officer) |
February 28, 2011 | ||
| /s/ Michael R. Boyce Michael R. Boyce |
Director | February 28, 2011 | ||
| /s/ Thomas F. Grojean Thomas F. Grojean |
Director | February 28, 2011 | ||
| /s/ Gary E. Hendrickson Gary E. Hendrickson |
Director | February 28, 2011 | ||
| /s/ Gregory E. Lawton Gregory E. Lawton |
Director | February 28, 2011 | ||
| /s/ Edward J. Wehmer Edward J. Wehmer |
Director | February 28, 2011 | ||
James E. Hurlbutt, pursuant to powers of attorney executed by each of the directors and officers listed above, does hereby execute this report on behalf of each of such directors and officers in the capacity in which the name of each appears above.
| February 28, 2011 | /s/ James E. Hurlbutt | |
| James E. Hurlbutt |
113
Table of Contents
EXHIBIT INDEX
| Exhibit |
Description | |
| (3)a | Copy of Restated Certificate of Incorporation of Stepan Company, dated December 27, 2005. (Note 13) | |
| (3)b | Copy of Amended and Restated Bylaws of Stepan Company, dated October 21, 2008. (Note 23) | |
| (4)a(1) | Copy of Certificate of Designation, Preferences and Rights of the 5 1/2% Convertible Preferred Stock, without Par Value and the Amended Certificate, dated August 12, 1992 and April 28, 1993. (Note 4) | |
| (4)a(2) | Copy of Issuer Tender Offer Statement on Schedule 13E-4, dated August 13, 1992. (Note 3) | |
| (4)a(3) | Copy of Amendment No. 1 to Schedule 13E-4 (see also (4)a(2) above), dated September 23, 1992. (Note 3) | |
| (4)a(4) | Copy of the Company’s Form 8-A, dated August 13, 1992. (Note 3) | |
| (10)a | Copy of Stepan Company Directors’ Deferred Compensation Plan amended and restated as of January 1, 2005. (Note 19) | |
| (10)a(1) | Copy of the First Amendment of the Stepan Company Directors’ Deferred Compensation Plan. (Note 24) | |
| (10)b | Copy of Stepan Company Management Incentive Plan (As Amended and Restated Effective as of January 1, 2005). (Note 18) | |
| (10)b(1) | Copy of the First Amendment of the Stepan Company Management Incentive Plan (As Amended and Restated Effective as of January 1, 2005), effective as of January 1, 2008. (Note 22) | |
| (10)b(2) | Copy of the Second Amendment of the Stepan Company Management Incentive Plan (As Amended and Restated Effective as of January 1, 2005), effective as of January 1, 2008. (Note 24) | |
| (10)b(3) | Copy of Management Incentive Plan (As Amended and Restated Effective January 1, 2010) (Note 25) | |
| (10)c | Copy of Leveraged Employee Stock Ownership Plan. (Note 1) | |
114
Table of Contents
| Exhibit |
Description | |
| (10)d | Copy of the Company’s 1992 Stock Option Plan. (Note 2) | |
| (10)e | Copy of the Company’s 2000 Stock Option Plan. (Note 5) | |
| (10)e(1) | Copy of the Amendment to Stepan Company 2000 Stock Option Plan. (Note 10) | |
| (10)e(2) | Form of Incentive Stock Option Agreement under Stepan Company 2000 Option Plan. (Note 10) | |
| (10)e(3) | Form of Non-Qualified Stock Option Agreement under Stepan Company 2000 Option Plan. (Note 10) | |
| (10)e(4) | Copy of Form of Restricted Stock Agreement under 2000 Option Plan. (Note 14) | |
| (10)e(5) | Copy of the First Amendment of the Stepan Company 2000 Stock Option Plan. (Note 24) | |
| (10)f | Copy of Settlement Agreement, which provided information with respect to the Company’s agreement with the United States regarding environmental remediation work to be completed at Stepan’s site in Maywood, New Jersey. (Note 9) | |
| (10)g | Copy of Stepan Company 2006 Incentive Compensation Plan. (Note 15) | |
| (10)g(1) | Copy of Form of Non-Employee Director Non-Qualified Stock Option Agreement under Stepan Company 2006 Incentive Compensation Plan. (Note 17) | |
| (10)g(2) | Copy of Form of Incentive Stock Option Agreement under Stepan Company 2006 Incentive Compensation Plan. (Note 20) | |
| (10)g(3) | Copy of Form of Non-Qualified Stock Option Agreement under Stepan Company 2006 Incentive Compensation Plan. (Note 20) | |
| (10)g(4) | Copy of Form of Restricted Stock Agreement under Stepan Company 2006 Incentive Compensation Plan. (Note 20) | |
| (10)g(5) | Copy of the First Amendment of the Stepan Company 2006 Incentive Compensation Plan. (Note 24) | |
| (10)g(6) | Copy of the Second Amendment of the Stepan Company 2006 Incentive Compensation Plan. (Note 25) | |
115
Table of Contents
| Exhibit |
Description | |
| (10)g(7) | Copy of the Third Amendment of the Stepan Company 2006 Incentive Compensation Plan. (Note 25) | |
| (10)g(8) | Copy of the Fourth Amendment of the Stepan Company 2006 Incentive Compensation Plan. (Note 25) | |
| (10)h | Copy of the Performance Award Deferred Compensation Plan (Effective January 1, 2008). (Note 23) | |
| (10)i | Copy of Term Credit Agreement, dated as of June 26, 2008, with JP Morgan Chase Bank, N.A., Bank of America, N.A., and The Northern Trust Company. (Note 21) | |
| (10)i(1) | Copy of Amended and Restated Term Credit Agreement, dated August 27, 2010. (Note 28) | |
| (10)j | Copy of Amended and Restated Note Agreement, dated as of December 1, 2002, regarding 7.69% Amended and Restated Senior Notes, Series A, due June 30, 2005 and 7.77% Amended and Restated Senior Notes, Series B, due June 30, 2010 (amending Loan Agreement dated June 15, 1995, with the parties listed on Schedule I thereto. (Note 7) | |
| (10)k | Copy of Note Purchase Agreement, dated as of September 1, 2002, with The Northwestern Mutual Life Insurance Company, Thrivent Financial for Lutherans, Connecticut General Life Insurance Company and MONY Life Insurance Company. (Note 6) | |
| (10)l | Copy of Amended and Restated Note Agreement, dated as of December 1, 2002, regarding 6.59% Amended and Restated Senior Notes, due October 1, 2013 (amending Term Loan Agreement dated October 1, 1998, with the parties listed on Schedule I thereto. (Note 7) | |
| (10)m | Copy of First Amendment, dated as of February 27, 2004, to Amended 1993 Note Agreement, Amended 1995 Note Agreement, Amended 1998 Note Agreement and 2002 Note Purchase Agreement. (Note 8) | |
| (10)m(1) | Copy of Second Amendment, dated as of May 3, 2004, to Amended 1993 Note Agreement, Amended 1995 Note Agreement, Amended 1998 Note Agreement and 2002 Note Purchase Agreement. (Note 11) | |
| (10)m(2) | Copy of Third Amendment, dated as of December 28, 2010, to Amended 1998 Note Agreement and 2002 Note Purchase Agreement. | |
116
Table of Contents
| Exhibit |
Description | |
| (10)n | Copy of Note Purchase Agreement, dated as of September 29, 2005, with Connecticut General Life Insurance Company, Life Insurance Company of North America, MONY Life Insurance Company, AXA Equitable Life Insurance Company and Horizon Blue Cross Blue Shield of New Jersey. (Note 12) | |
| (10)n(1) | Copy of First Supplement to Note Purchase Agreement (September 29, 2005), dated as of June 1, 2010, regarding 5.88% series 2010-A Senior Notes with The Prudential Insurance Company of America, Prudential Retirement Insurance and Annuity Company, Forethought Life Insurance Company, AXA Equitable Life Insurance Company, Connecticut General Life Insurance Company and Life Insurance Company of North America. (Note 27) | |
| (10)o | Copy of Credit Agreement, dated as of April 20, 2006, with JP Morgan Chase Bank, N.A., Bank of America, N.A. and Harris, N.A. (Note 16) | |
| (10)p | Copy of Credit Agreement, dated as of August 27, 2010, with JP Morgan Chase Bank, N.A., Bank of America, N.A. and The Northern Trust Company. (Note 28) | |
| (21) | Subsidiaries of Registrant at December 31, 2010. | |
| (23) | Consent of Independent Registered Public Accounting Firm. | |
| (24) | Power of Attorney. | |
| (31.1) | Certification of President and Chief Executive Officer. | |
| (31.2) | Certification of Vice President and Chief Financial Officer (Principal Financial Officer). | |
| (32) | Certification of President and Chief Executive Officer (Principal Executive Officer) and Vice President and Chief Financial Officer (Principal Financial Officer) pursuant to Section 906 of the Sarbanes-Oxley Act of 2002. | |
117
Table of Contents
Notes To Exhibit Index
| Note No. |
||
| 1. | Filed with the Company’s Annual Report on Form 10-K for the year ended December 31, 1989 (File No. 1-4462), and incorporated herein by reference. | |
| 2. | Filed with the Company’s Quarterly Report on Form 10-Q for the quarter ended March 31, 1992 (File No. 1-4462), and incorporated herein by reference. | |
| 3. | Filed with the Company’s Quarterly Report on Form 10-Q for the quarter ended September 30, 1992 (File No. 1-4462), and incorporated herein by reference. | |
| 4. | Filed with the Company’s Current Report on Form 8-K filed on April 28, 1993 (File No. 1-4462), and incorporated herein by reference. | |
| 5. | Filed with the Company’s Proxy Statement on Schedule 14A filed on March 30, 2000 (File No. 1-4462), and incorporated herein by reference. | |
| 6. | Filed with the Company’s Quarterly Report on Form 10-Q for the quarter ended September 30, 2002 (File No. 1-4462), and incorporated herein by reference. | |
| 7. | Filed with the Company’s Annual Report on Form 10-K for the year ended December 31, 2002 (File No. 1-4462), and incorporated herein by reference. | |
| 8. | Filed with the Company’s Annual Report on Form 10-K for the year ended December 31, 2003 (File No. 1-4462), and incorporated herein by reference. | |
| 9. | Filed with the Company’s Current Report on Form 8-K filed on November 18, 2004 (File No. 1-4462), and incorporated herein by reference. | |
| 10. | Filed with the Company’s Current Report on Form 8-K filed on December 23, 2004 (File No. 1-4462), and incorporated herein by reference. | |
| 11. | Filed with the Company’s Quarterly Report on Form 10-Q for the quarter ended June 30, 2004 (File No. 1-4462), and incorporated herein by reference. | |
| 12. | Filed with the Company’s Current report on Form 8-K filed on October 3, 2005 (File No. 1-4462), and incorporated herein by reference. | |
| 13. | Filed with the Company’s Current Report on Form 8-K filed on December 28, 2005 (File No. 1-4462), and incorporated herein by reference. | |
118
Table of Contents
| Note |
||
| 14. | Filed with the Company’s Current Report on Form 8-K filed on February 21, 2006, and incorporated herein by reference. | |
| 15. | Filed with the Company’s Proxy Statement on Schedule 14A filed on March 23, 2006, and incorporated herein by reference. | |
| 16. | Filed with the Company’s Current report on Form 8-K filed on April 26, 2006, and incorporated herein by reference. | |
| 17. | Filed with the Company’s Current Report on Form 8-K filed on April 27, 2006, and incorporated herein by reference. | |
| 18. | Filed with the Company’s Current Report on Form 8-K filed on January 5, 2007, and incorporated herein by reference. | |
| 19. | Filed with the Company’s Annual Report on Form 10-K for the year ended December 31, 2006, and incorporated herein by reference. | |
| 20. | Filed with the Company’s Current Report on Form 8-K filed on February 16, 2007, and incorporated herein by reference. | |
| 21. | Filed with the Company’s Current Report on Form 8-K filed on July 1, 2008, and incorporated herein by reference. | |
| 22. | Filed with the Company’s Current Report on Form 8-K filed on September 16, 2008, and incorporated herein by reference. | |
| 23. | Filed with the Company’s Current Report on Form 8-K filed on October 24, 2008, and incorporated herein by reference. | |
| 24. | Filed with the Company’s Annual Report on Form 10-K for the year ended December 31, 2008, and incorporated herein by reference. | |
| 25. | Filed with the Company’s Annual Report on Form 10-K for the year ended December 31, 2009, and incorporated herein by reference. | |
| 26. | Filed with the Company’s Quarterly Report on Form 10-Q for the quarter ended March 31, 2010, and incorporated herein by reference. | |
| 27. | Filed with the Company’s Current Report on Form 8-K filed on June 3, 2010, and incorporated herein by reference. | |
| 28. | Filed with the Company’s Current Report on Form 8-K filed on September 2, 2010, and incorporated herein by reference. | |
119