Attached files
| file | filename |
|---|---|
| EX-99.1 - EXHIBIT 99.1 - RE/MAX Holdings, Inc. | v460269_ex99-1.htm |
| 8-K - FORM 8-K - RE/MAX Holdings, Inc. | v460269_8k.htm |
Exhibit 99.2

February 24, 2017 Fourth Quarter and Full - Year 2016 Earnings
2 Forward - Looking Statements and Non - GAAP Information This presentation includes “forward - looking statements” within the meaning of the “safe harbor” provisions of the United States Private Securities Litigation Reform Act of 1995 . Forward - looking statements may be identified by the use of words such as “believe,” “intend,” “expect,” “estimate,” “plan,” “outlook,” “project” and other similar words and expressions that predict or indicate future events or trends that are not statements of historical matters . These forward - looking statements include statements regarding the Company’s outlook for the first quarter and full fiscal year, including expectations regarding agent count, revenue, SO&A (Selling, operating and administrative) expenses, and Adjusted EBITDA margins for its first quarter of 2017 and full fiscal year ; the Company’s optimism for agent recruitment, investment, acquisitions (including the integration of regional acquisitions), Motto Mortgage, and improving housing conditions ; the expected benefits related to refinancing the Company’s credit facility ; the factors working to continue the Company’s momentum ; the Company’s channels for long - term organic growth ; the absences of extraordinary items or unanticipated events in future time periods ; currency exchange rates ; the productivity of the agent network ; the focus on growing the highest quality real estate network in the world ; and consistent execution of the Company’s plan and continued success ; as well as other statements regarding the Company’s strategic and operational plans and business models . Forward - looking statements should not be read as a guarantee of future performance or results, and will not necessarily be accurate indications of the times at, or by, which such performance or results will be achieved . Forward - looking statements are based on information available at the time those statements are made and/or management’s good faith belief as of that time with respect to future events, and are subject to risks and uncertainties that could cause actual performance or results to differ materially from those expressed in or suggested by the forward - looking statements . Such risks and uncertainties include, without limitation, ( 1 ) changes in business and economic activity in general, ( 2 ) changes in the real estate market, including changes due to interest rates and availability of financing, ( 3 ) the Company’s ability to attract and retain quality franchisees, ( 4 ) the Company’s franchisees’ ability to recruit and retain real estate agents and mortgage loan originators, ( 5 ) changes in laws and regulations that may affect the Company’s business or the real estate market, ( 6 ) failure to maintain, protect and enhance the RE/MAX and Motto Mortgage brands, ( 7 ) fluctuations in foreign currency exchange rates, as well as those risks and uncertainties described in the sections entitled “Risk Factors” and “Management’s Discussion and Analysis of Financial Condition and Results of Operations” in the most recent Annual Report on Form 10 - K filed with the Securities and Exchange Commission (“SEC”) and similar disclosures in subsequent periodic and current reports filed with the SEC, which are available on the investor relations page of the Company’s website at www . remax . com and on the SEC website at www . sec . gov . Readers are cautioned not to place undue reliance on forward - looking statements, which speak only as of the date on which they are made . Except as required by law, the Company does not intend, and undertakes no duty, to update this information to reflect future events or circumstances . This presentation refers to “Adjusted EBITDA,” “Adjusted Net Income ”, “Free Cash Flow”, “Free Cash Flow less Distributions to RIHI” and “Unencumbered Cash . ” Adjusted EBITDA, Adjusted Net Income, Adjusted EPS, Free Cash Flow, Free Cash Flow less Distributions to RIHI and Unencumbered Cash are not measures of financial performance or liquidity under generally accepted accounting principles (“GAAP”) and the use of Adjusted EBITDA, Adjusted Net Income, Free Cash Flow, Free Cash Flow less Distributions to RIHI and Unencumbered Cash is limited because they do not include certain material costs necessary to operate this business . In addition, Adjusted EBITDA, Adjusted Net Income, Adjusted EPS, Free Cash Flow, Free Cash Flow less Distributions to RIHI and Unencumbered Cash, as presented, may not be comparable to similarly titled measures of other companies . See the Appendix for a reconciliation of Adjusted EBITDA, Adjusted Net Income, Free Cash Flow, Free Cash Flow less Distributions to RIHI and Unencumbered Cash with the most directly comparable measure under GAAP .
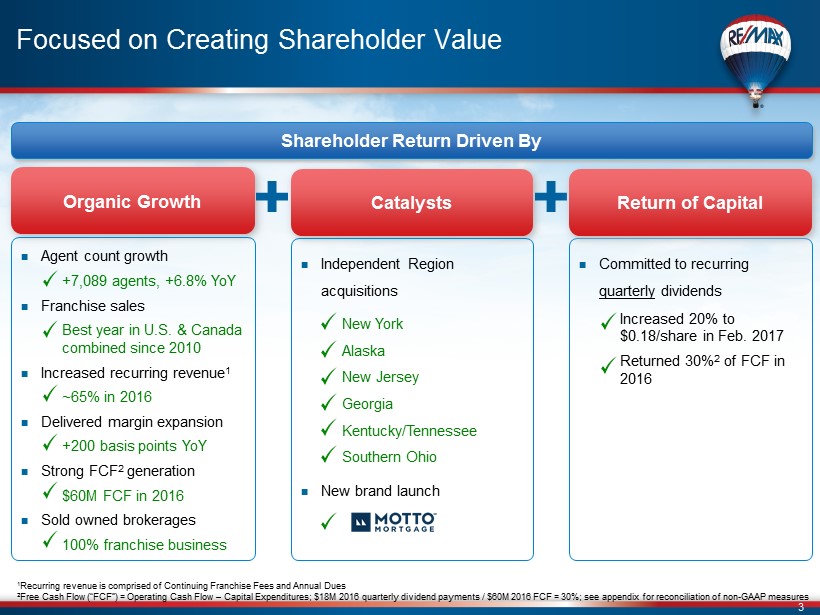
3 Focused on Creating Shareholder Value Organic Growth Catalysts Shareholder Return Driven By Agent count g rowth +7,089 agents, +6.8% YoY Franchise sales Best year in U.S. & Canada combined since 2010 Increased recurring revenue 1 ~65% in 2016 Delivered margin expansion +200 basis points YoY Strong FCF 2 generation $60M FCF in 2016 Sold owned brokerages 100% franchise business Independent Region acquisitions New York Alaska New Jersey Georgia Kentucky/Tennessee Southern Ohio New brand launch Committed to recurring quarterly dividends Increased 20% to $0.18/share in Feb. 2017 Returned 30% 2 of FCF in 2016 1 Recurring revenue is comprised of Continuing Franchise Fees and Annual Dues 2 Free Cash Flow (“FCF”) = Operating Cash Flow – Capital Expenditures ; $ 18 M 2016 quarterly dividend payments / $ 60 M 2016 FCF = 30 % ; see appendix for reconciliation of non - GAAP measures Return of Capital
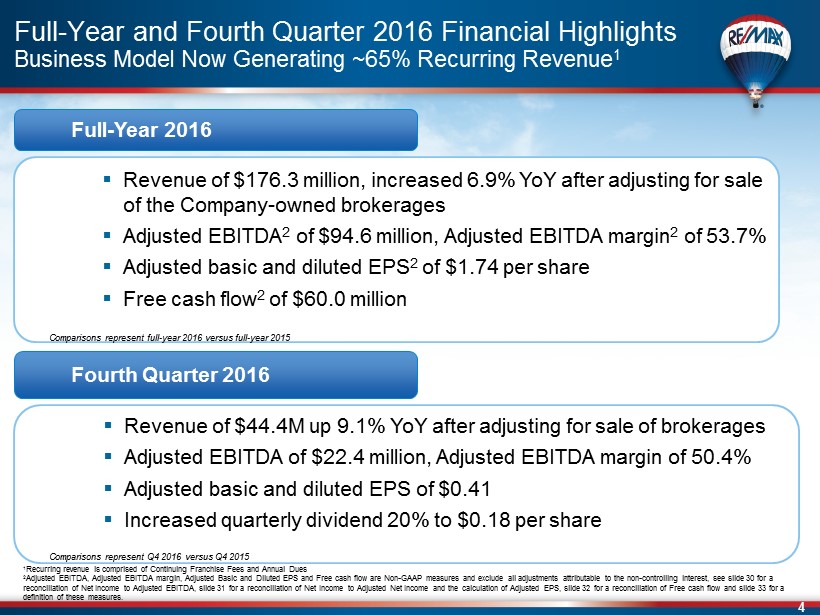
4 Full - Year and Fourth Quarter 2016 Financial Highlights Business Model Now Generating ~65% Recurring Revenue 1 ▪ Revenue of $176.3 million, increased 6.9% YoY after adjusting for sale of the Company - owned brokerages ▪ Adjusted EBITDA 2 of $94.6 million, Adjusted EBITDA margin 2 of 53.7% ▪ Adjusted basic and diluted EPS 2 of $1.74 per share ▪ Free cash flow 2 of $60.0 million ▪ Revenue of $44.4M up 9.1% YoY after adjusting for sale of brokerages ▪ Adjusted EBITDA of $22.4 million, Adjusted EBITDA margin of 50.4% ▪ Adjusted basic and diluted EPS of $0.41 ▪ Increased quarterly dividend 20% to $0.18 per share Fourth Quarter 2016 Full - Year 2016 Comparisons represent Q4 2016 versus Q4 2015 Comparisons represent full - year 2016 versus full - year 2015 1 Recurring revenue is comprised of Continuing Franchise Fees and Annual Dues 2 Adjusted EBITDA, Adjusted EBITDA margin, Adjusted Basic and Diluted EPS and Free cash flow are Non - GAAP measures and exclude all adjustments attributable to the non - controlling interest, see slide 30 for a reconciliation of Net Income to Adjusted EBITDA, slide 31 for a reconciliation of Net Income to Adjusted Net Income and the calculation of Adjusted EPS, slide 32 for a reconciliation of Free cash flow and slide 33 for a definition of these measures.

5 Motto Mortgage Update Growing the Brand with Each New Franchise Sale Sold 19 franchises Became registered to sell franchises in all 50 states Trained first two classes of franchisees & loan originators Completed sales tours of east and west coasts Scaled the team as the business has grown Interest in owning a Motto Mortgage franchise remains high and our sales pipeline is robust In the first 120 days, we:
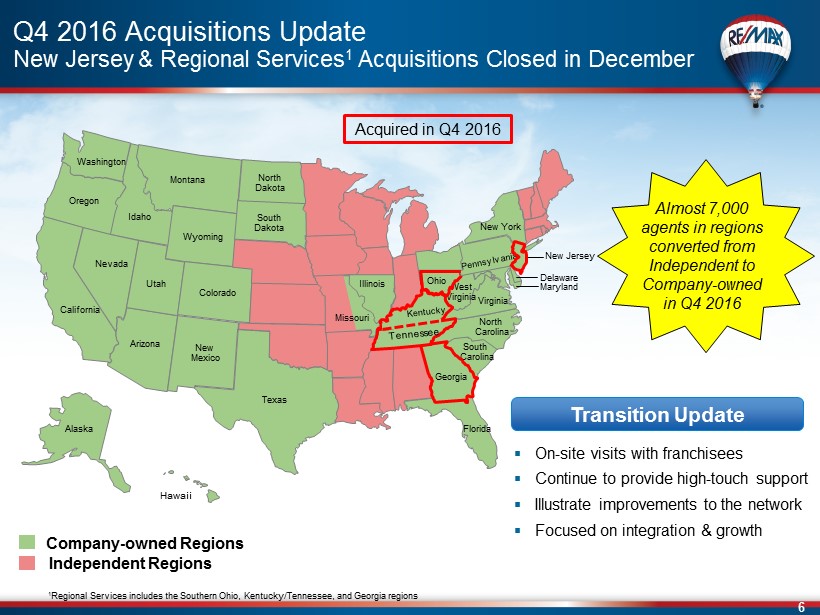
6 ▪ On - site visits with franchisees ▪ Continue to provide high - touch support ▪ Illustrate improvements to the network ▪ Focused on integration & growth Q4 2016 Acquisitions Update New Jersey & Regional Services 1 Acquisitions Closed in December Hawaii Acquired in Q4 2016 Washington Oregon Idaho Montana California Colorado Utah Wyoming South Dakota North Dakota Texas Delaware Florida North Carolina South Carolina Nevada Arizona New Mexico Maryland Virginia Missouri Illinois New Jersey Georgia West Virginia New York Company - owned Regions Independent Regions Transition Update Ohio Almost 7 ,000 a gents in regions converted from Independent to Company - owned in Q4 2016 Alaska 1 Regional Services includes the Southern Ohio, Kentucky/Tennessee, and Georgia regions
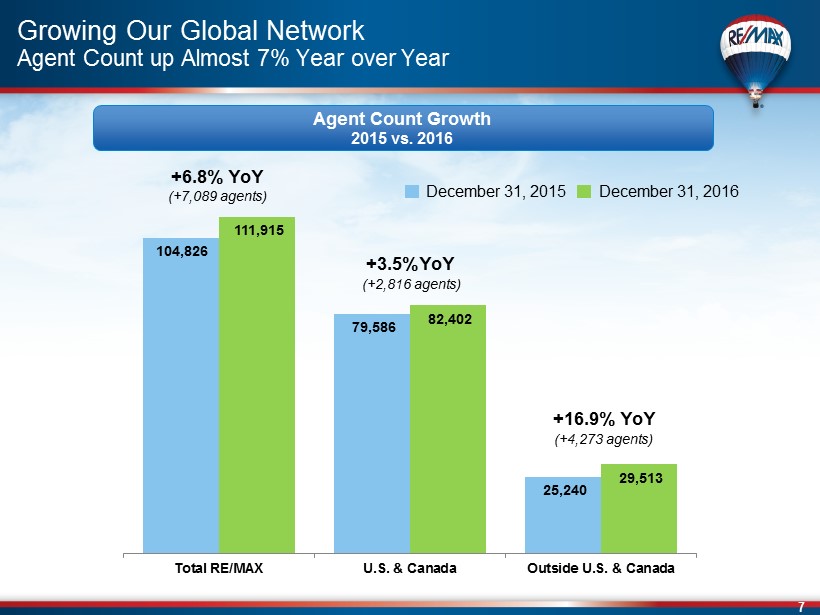
7 104,826 79,586 25,240 111,915 82,402 29,513 Total RE/MAX U.S. & Canada Outside U.S. & Canada Growing Our Global Network Agent Count up Almost 7% Year over Year Agent Count Growth 2015 vs. 2016 (+7,089 agents) +6.8% YoY +3.5%YoY (+2,816 agents) +16.9% YoY (+4,273 agents) December 31, 2015 December 31, 2016
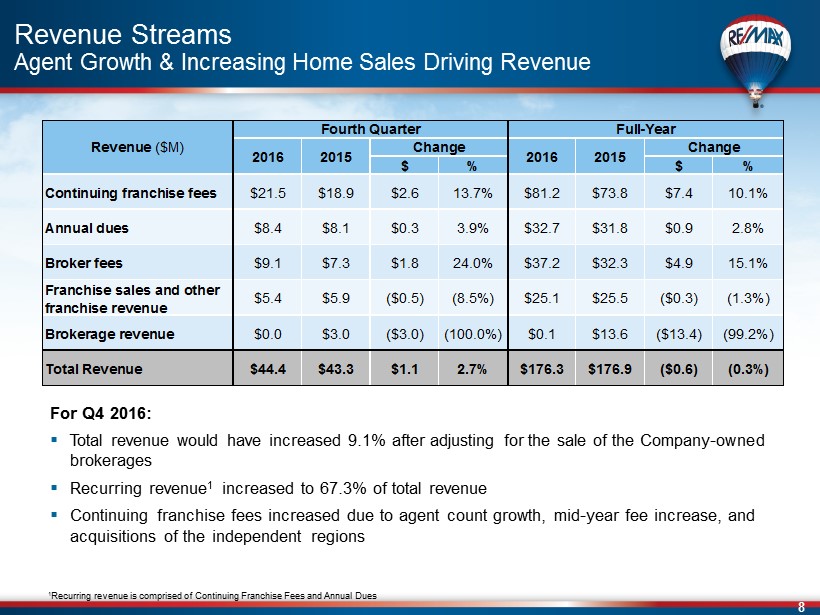
8 Revenue Streams Agent Growth & Increasing Home Sales Driving Revenue For Q4 2016: ▪ Total revenue would have increased 9.1% after adjusting for the sale of the Company - owned brokerages ▪ Recurring revenue 1 increased to 67.3% of total revenue ▪ Continuing franchise fees increased due to agent count growth, mid - year fee increase, and acquisitions of the independent regions 1 Recurring revenue is comprised of Continuing Franchise Fees and Annual Dues $ % $ % Continuing franchise fees $21.5 $18.9 $2.6 13.7% $81.2 $73.8 $7.4 10.1% Annual dues $8.4 $8.1 $0.3 3.9% $32.7 $31.8 $0.9 2.8% Broker fees $9.1 $7.3 $1.8 24.0% $37.2 $32.3 $4.9 15.1% Franchise sales and other franchise revenue $5.4 $5.9 ($0.5) (8.5%) $25.1 $25.5 ($0.3) (1.3%) Brokerage revenue $0.0 $3.0 ($3.0) (100.0%) $0.1 $13.6 ($13.4) (99.2%) Total Revenue $44.4 $43.3 $1.1 2.7% $176.3 $176.9 ($0.6) (0.3%) Revenue ($M) Fourth Quarter Full-Year 2016 2015 Change 2016 2015 Change
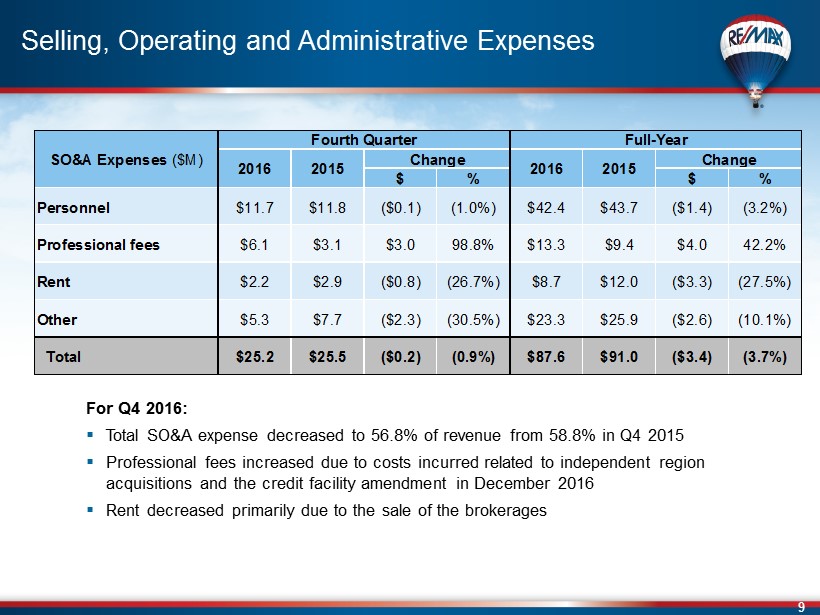
9 Selling, Operating and Administrative Expenses For Q4 2016: ▪ Total SO&A expense decreased to 56.8% of revenue from 58.8% in Q4 2015 ▪ Professional fees increased due to costs incurred related to independent region acquisitions and the credit facility amendment in December 2016 ▪ Rent decreased primarily due to the sale of the brokerages $ % $ % Personnel $11.7 $11.8 ($0.1) (1.0%) $42.4 $43.7 ($1.4) (3.2%) Professional fees $6.1 $3.1 $3.0 98.8% $13.3 $9.4 $4.0 42.2% Rent $2.2 $2.9 ($0.8) (26.7%) $8.7 $12.0 ($3.3) (27.5%) Other $5.3 $7.7 ($2.3) (30.5%) $23.3 $25.9 ($2.6) (10.1%) Total $25.2 $25.5 ($0.2) (0.9%) $87.6 $91.0 ($3.4) (3.7%) SO&A Expenses ($M) Fourth Quarter Full-Year 2016 2015 Change 2016 2015 Change
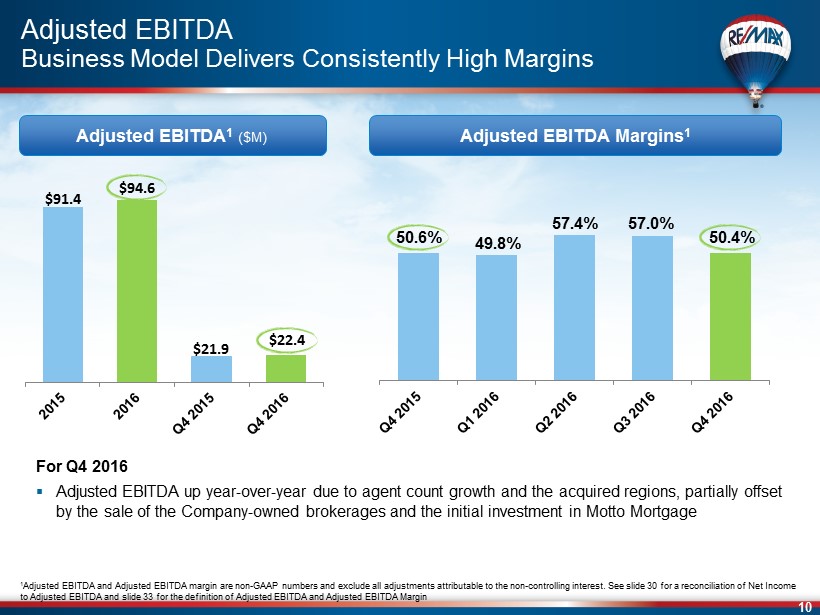
10 50.6% 49.8% 57.4% 57.0% 50.4% $91.4 $94.6 $21.9 $22.4 Adjusted EBITDA 1 ($M) Adjusted EBITDA Margins 1 1 Adjusted EBITDA and Adjusted EBITDA margin are non - GAAP numbers and exclude all adjustments attributable to the non - controlling interest. See slide 30 for a reconciliation of Net Income to Adjusted EBITDA and slide 33 for the definition of Adjusted EBITDA and Adjusted EBITDA Margin For Q4 2016 ▪ Adjusted EBITDA up year - over - year due to agent count growth and the acquired regions, partially offset by the sale of the Company - owned brokerages and the initial investment in Motto Mortgage Adjusted EBITDA Business Model Delivers Consistently High Margins
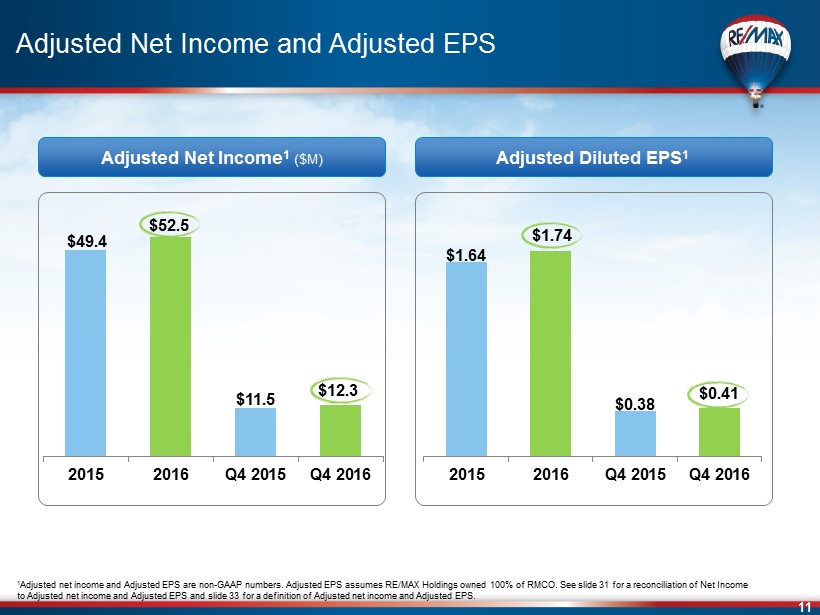
11 $1.64 $1.74 $0.38 $0.41 2015 2016 Q4 2015 Q4 2016 $49.4 $52.5 $11.5 $12.3 2015 2016 Q4 2015 Q4 2016 Adjusted Net Income 1 ($M) Adjusted Net Income and Adjusted EPS Adjusted Diluted EPS 1 1 Adjusted net income and Adjusted EPS are non - GAAP numbers. Adjusted EPS assumes RE/MAX Holdings owned 100% of RMCO. See slide 31 for a reconciliation of Net Income to Adjusted net income and Adjusted EPS and slide 33 for a definition of Adjusted net income and Adjusted EPS.
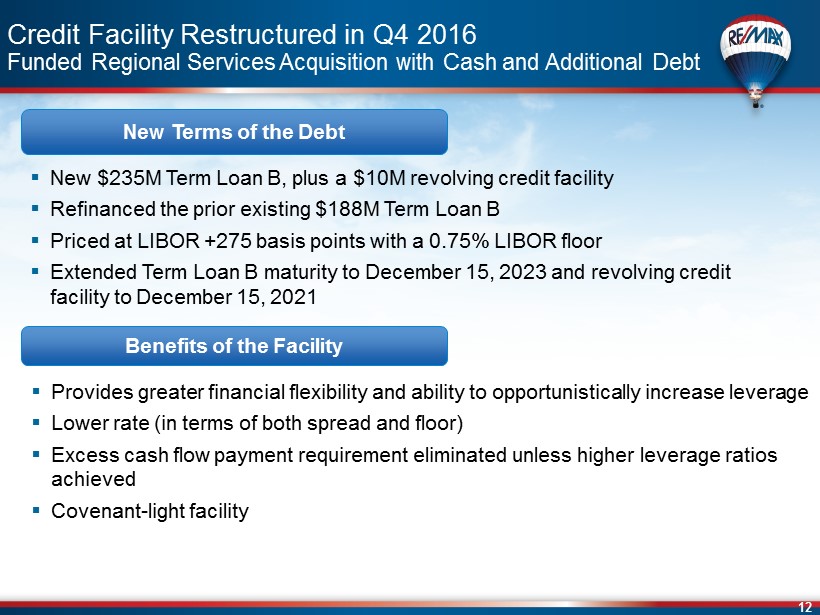
12 New Terms of the Debt ▪ New $ 235M Term Loan B, plus a $10M revolving credit facility ▪ Refinanced the prior existing $188M Term Loan B ▪ Priced at LIBOR +275 basis points with a 0.75% LIBOR floor ▪ Extended Term Loan B maturity to December 15, 2023 and revolving credit facility to December 15, 2021 Benefits of the Facility ▪ Provides greater financial flexibility and ability to opportunistically increase leverage ▪ Lower rate (in terms of both spread and floor) ▪ Excess cash flow payment requirement eliminated unless higher leverage ratios achieved ▪ Covenant - light facility Credit Facility Restructured in Q4 2016 Funded Regional Services Acquisition with Cash and Additional Debt

13 Maximizing Returns Through Acquisitions, Re - Investment & Return of Capital to Shareholders Balance Sheet & Leverage ▪ Cash balance of $57.6 million on December 31, 2016, down $52.6 million from December 31, 2015, primarily due to acquisitions in 2016 ▪ $ 230.8 million in term loans 1 and no revolving loans outstanding ▪ Total Debt / Adjusted EBITDA of 2.4x 2 ▪ Net Debt / Adjusted EBITDA of 1.8x 3 Dividend ▪ Returned ~$18M in dividends to shareholders in 2016 ─ Paid out ~30 % of FCF ▪ Raised quarterly dividend 20% to $0.18 per share in Q1 2017 ▪ Our business model generates sufficient capital to grow our business and return capital to shareholders 1 Net of unamortized debt discount and debt issuance costs 2 Based on twelve months ended December 31, 2016, Adjusted EBITDA of $94.6M and total debt of $230.8M, net of unamortized debt discount and debt issuance costs 3 Based on twelve months ended December 31, 2016, Adjusted EBITDA of $ 94.6M and net debt of $173.2M, net of unamortized debt discount, debt issuance costs and cash balance at December 31, 2016
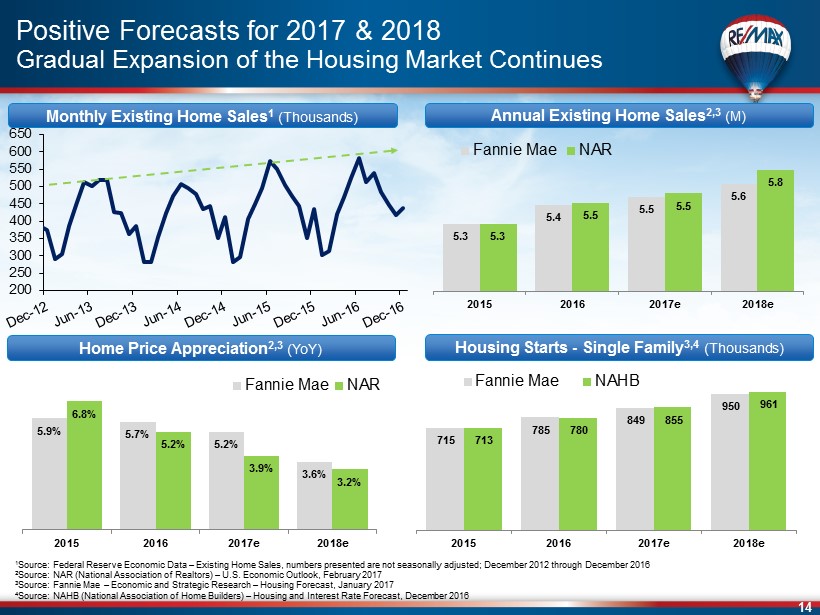
14 200 250 300 350 400 450 500 550 600 650 Positive Forecasts for 2017 & 2018 Gradual Expansion of the Housing Market Continues 1 Source : Federal Reserve Economic Data – Existing Home Sales, numbers presented are n ot s easonally adjusted ; December 2012 through December 2016 2 Source: NAR (National Association of Realtors) – U.S. Economic Outlook, February 2017 3 Source: Fannie Mae – Economic and Strategic Research – Housing Forecast, January 2017 4 Source : NAHB (National Association of Home Builders) – Housing and Interest Rate Forecast, December 2016 Monthly Existing Home Sales 1 (Thousands) Annual Existing Home Sales 2,3 (M) Housing Starts - Single Family 3,4 (Thousands) Home Price Appreciation 2,3 (YoY) 5.3 5.4 5.5 5.6 5.3 5.5 5.5 5.8 2015 2016 2017e 2018e Fannie Mae NAR 5.9% 5.7% 5.2% 3.6% 6.8% 5.2% 3.9% 3.2% 2015 2016 2017e 2018e Fannie Mae NAR 715 785 849 950 713 780 855 961 2015 2016 2017e 2018e Fannie Mae NAHB
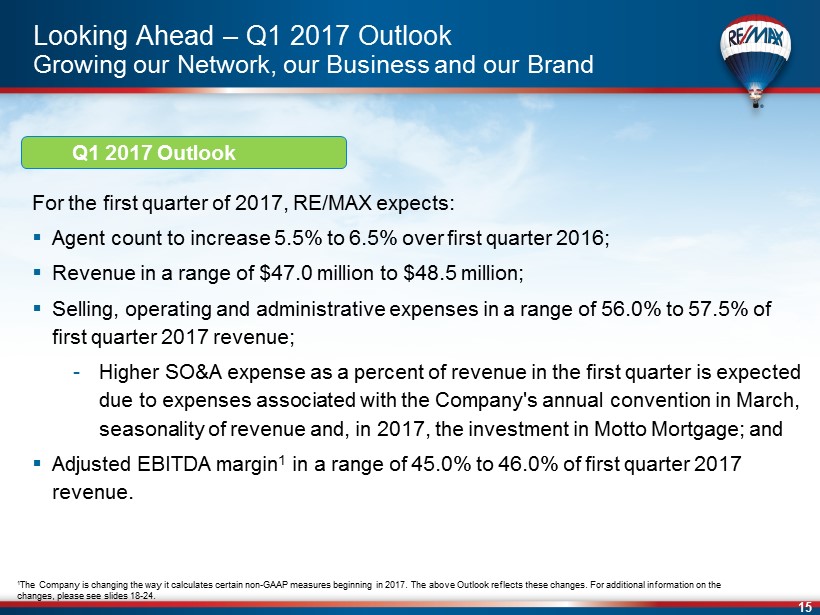
15 For the first quarter of 2017, RE/MAX expects: ▪ Agent count to increase 5.5% to 6.5% over first quarter 2016; ▪ Revenue in a range of $ 47.0 million to $ 48.5 million; ▪ Selling, operating and administrative expenses in a range of 56.0% to 57.5 % of first quarter 2017 revenue; - Higher SO&A expense as a percent of revenue in the first quarter is expected due to expenses associated with the Company's annual convention in March, seasonality of revenue and, in 2017, the investment in Motto Mortgage; and ▪ Adjusted EBITDA margin 1 in a range of 45.0 % to 46.0% of first quarter 2017 revenue. Looking Ahead – Q1 2017 Outlook Growing our Network, our Business and our Brand Q1 2017 Outlook 1 The Company is changing the way it calculates certain non - GAAP measures beginning in 2017. The above Outlook reflects these changes. For additional information on the changes, please see slides 18 - 24.
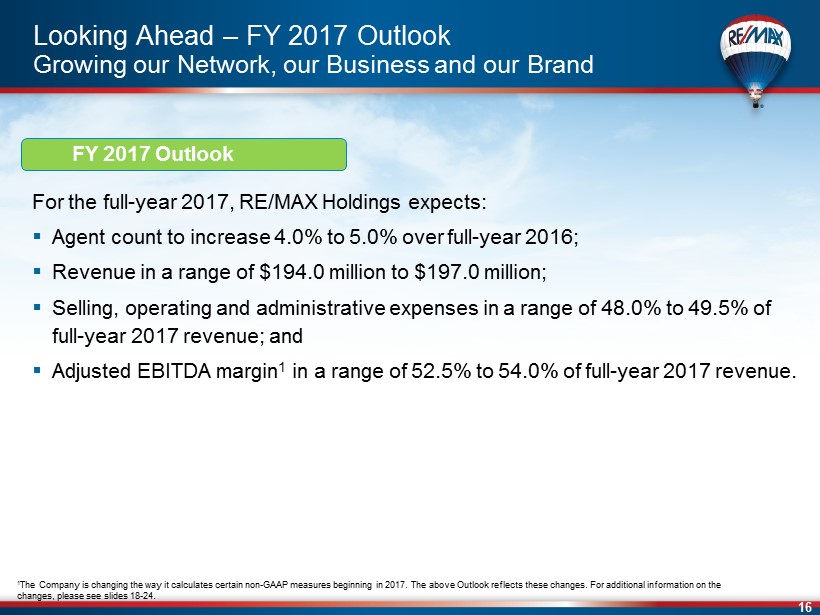
16 Looking Ahead – FY 2017 Outlook Growing our Network, our Business and our Brand FY 2017 Outlook For the full - year 2017, RE/MAX Holdings expects: ▪ Agent count to increase 4.0% to 5.0% over full - year 2016 ; ▪ Revenue in a range of $194.0 million to $197.0 million; ▪ Selling, operating and administrative expenses in a range of 48.0% to 49.5% of full - year 2017 revenue ; and ▪ Adjusted EBITDA margin 1 in a range of 52.5% to 54.0% of full - year 2017 revenue. 1 The Company is changing the way it calculates certain non - GAAP measures beginning in 2017. The above Outlook reflects these changes. For additional information on the changes, please see slides 18 - 24.

17 Best - in - class n etwork of more than 110,000 a gents Unmatched global footprint Resilient, recurring fee streams based on agent count High Adjusted EBITDA margins Strong free cash flow generation Low fixed - cost structure Asset - light franchise business Attractive Franchise Model Leading Real Estate Franchise with Recurring Revenues, High Margins & Strong Free Cash Flow
18 Additional information on non - GAAP measures
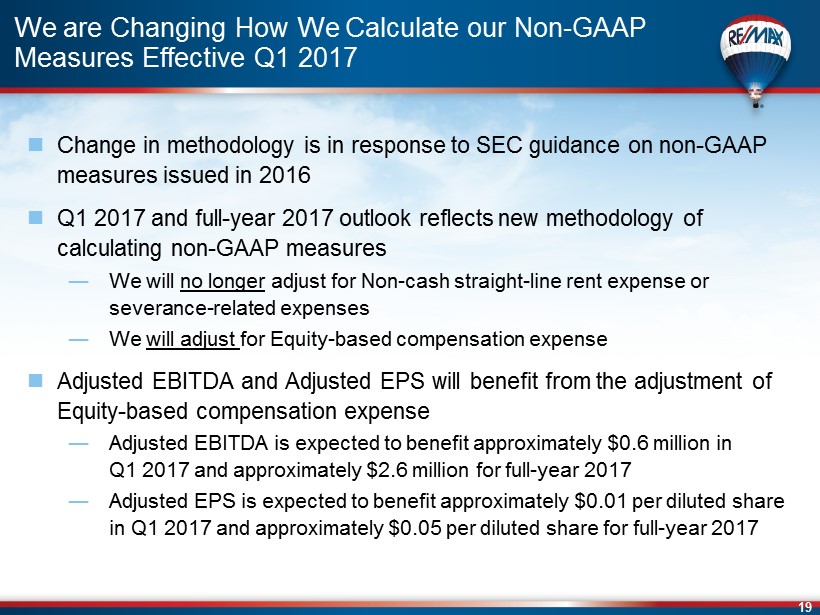
19 We are Changing How We Calculate our Non - GAAP Measures Effective Q1 2017 Change in methodology is in response to SEC guidance on n on - GAAP measures issued in 2016 Q1 2017 and f ull - year 2017 o utlook reflects new methodology of calculating non - GAAP measures ― We will no longer adjust for Non - cash straight - line rent expense or severance - related expenses ― We will adjust for Equity - based compensation expense Adjusted EBITDA and Adjusted EPS will benefit from the adjustment of E quity - based compensation expense ― Adjusted EBITDA is expected to benefit approximately $0.6 million in Q1 2017 and approximately $2.6 million for full - year 2017 ― Adjusted EPS is expected to benefit approximately $ 0.01 per diluted share in Q1 2017 and approximately $0.05 per diluted share for full - year 2017
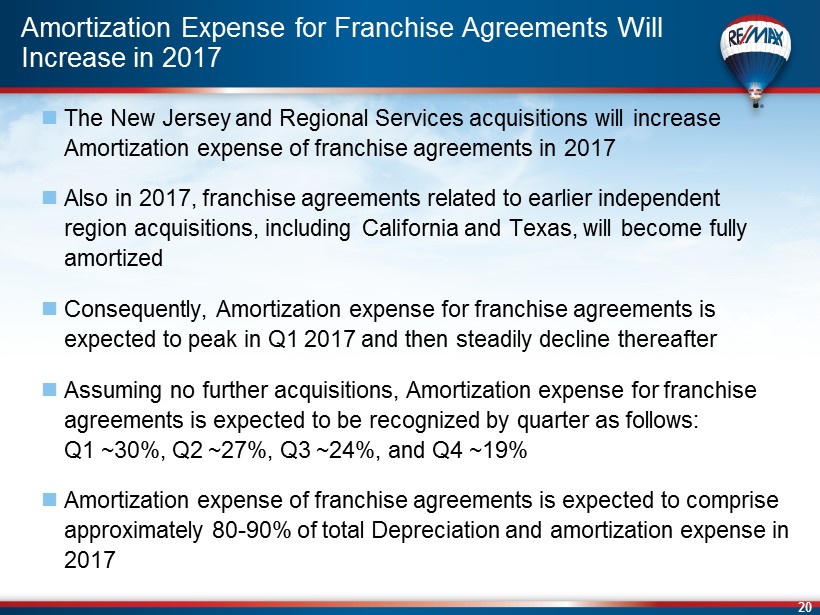
20 Amortization Expense for Franchise Agreements Will Increase in 2017 The New Jersey and Regional Services acquisitions will increase Amortization expense of franchise agreements in 2017 Also in 2017, franchise agreements related to earlier independent region acquisitions, including California and Texas, will become fully amortized Consequently, Amortization expense for franchise agreements is expected to peak in Q1 2017 and then steadily decline thereafter Assuming no further acquisitions, Amortization expense for franchise agreements is expected to be recognized by quarter as follows: Q1 ~30%, Q2 ~27%, Q3 ~24%, and Q4 ~19% Amortization expense of franchise agreements is expected to comprise approximately 80 - 90% of total Depreciation and amortization expense in 2017
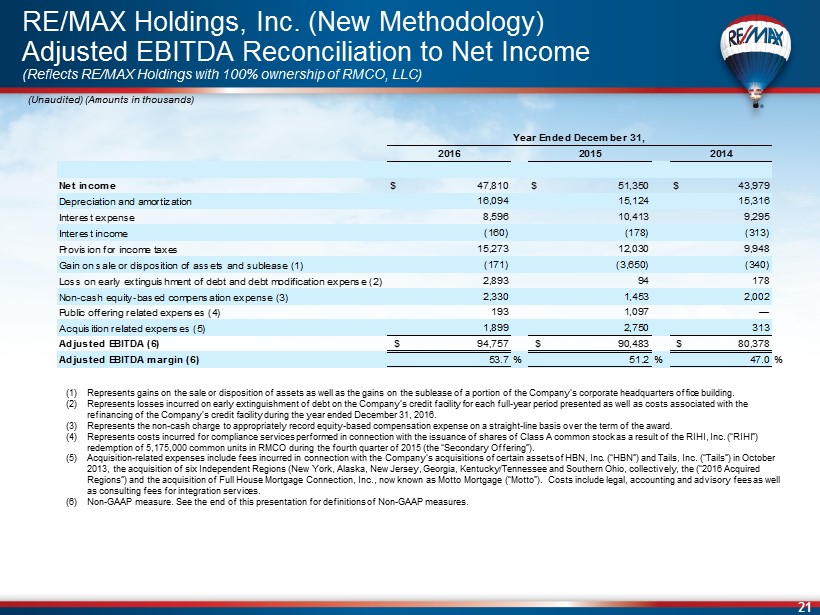
21 (Unaudited) (Amounts in thousands) RE/MAX Holdings, Inc. (New Methodology) Adjusted EBITDA Reconciliation to Net Income (Reflects RE/MAX Holdings with 100% ownership of RMCO, LLC) (1) Represents gains on the sale or disposition of assets as well as the gains on the sublease of a portion of the Company’s corporate headquarter s o ffice building. (2) Represents losses incurred on early extinguishment of debt on the Company’s credit facility for each full - year period presented as well as costs associated with the refinancing of the Company’s credit facility during the year ended December 31, 2016. (3) Represents the non - cash charge to appropriately record equity - based compensation expense on a straight - line basis over the term of the awar d. (4) Represents costs incurred for compliance services performed in connection with the issuance of shares of Class A common stock as a result of the RIHI, Inc. (“RIHI”) redemption of 5,175,000 common units in RMCO during the fourth quarter of 2015 (the “Secondary Offering ”). (5) Acquisition - related expenses include fees incurred in connection with the Company’s acquisitions of certain assets of HBN, Inc. (“HBN”) and Tails , I nc. (“Tails”) in October 2013, the acquisition of six Independent Regions (New York, Alaska, New Jersey, Georgia, Kentucky/Tennessee and Southern Ohio , c ollectively, the (“2016 Acquired Regions”) and the acquisition of Full House Mortgage Connection, Inc., now known as Motto Mortgage (“Motto”). Costs include leg al, accounting and advisory fees as well as consulting fees for integration services. (6) Non - GAAP measure. See the end of this presentation for definitions of Non - GAAP measures. Net income $ 47,810 $ 51,350 $ 43,979 Depreciation and amortization 16,094 15,124 15,316 Interest expense 8,596 10,413 9,295 Interest income (160) (178) (313) Provision for income taxes 15,273 12,030 9,948 Gain on sale or disposition of assets and sublease (1) (171) (3,650) (340) Loss on early extinguishment of debt and debt modification expense (2) 2,893 94 178 Non-cash equity-based compensation expense (3) 2,330 1,453 2,002 Public offering related expenses (4) 193 1,097 — Acquisition related expenses (5) 1,899 2,750 313 Adjusted EBITDA (6) $ 94,757 $ 90,483 $ 80,378 Adjusted EBITDA margin (6) 53.7% 51.2% 47.0% 2014 Year Ended December 31, 2016 2015

22 (Unaudited) (Amounts in thousands) RE/MAX Holdings, Inc. ( New Methodology) Adjusted EBITDA Reconciliation to Net Income (Reflects RE/MAX Holdings with 100% ownership of RMCO, LLC) (1) Represents losses (gains) on the sale or disposition of assets as well as the gains on the sublease of a portion of the Company’s corporate headquarter s o ffice building. (2) Represents losses incurred on early extinguishment of debt on the Company’s credit facility for each period presented as well as costs associated with the refinancing of the Company’s credit facility during the year ended December 31, 2016. (3) Represents the non - cash charge to appropriately record equity - based compensation expense on a straight - line basis over the term of the awar d. (4) Represents costs incurred for compliance services performed in connection with the Secondary Offering. (5) Acquisition - related expenses include fees incurred in connection with the Company’s acquisitions of certain assets of HBN and Tails in October 2013, the 2016 Acquired Regions and the acquisition of Motto. Costs include legal, accounting and advisory fees as well as consulting fees for integration services. (6) Non - GAAP measure. See the end of this presentation for definitions of Non - GAAP measures. Net income $ 8,514 $ 14,520 $ 14,380 $ 10,396 $ 10,969 $ 15,193 $ 16,058 $ 9,130 Depreciation and amortization 4,612 3,889 3,872 3,721 3,740 3,765 3,808 3,811 Interest expense 2,103 2,121 2,091 2,281 2,965 2,338 2,301 2,809 Interest income (42) (32) (35) (51) (42) (36) (33) (67) Provision for income taxes 3,097 4,632 4,285 3,259 3,148 3,277 3,457 2,148 Loss (Gain) on sale or disposition of assets and sublease (1) 4 (99) (99) 23 (2,877) (66) (664) (43) Loss on early extinguishment of debt and debt modification expense (2) 2,757 — — 136 — — — 94 Non-cash equity-based compensation expense (3) 518 501 545 766 355 430 526 142 Public offering related expenses (4) — — — 193 1,097 — — — Acquisition related expenses (5) 1,200 169 246 284 2,673 — (106) 183 Adjusted EBITDA (6) $ 22,763 $ 25,701 $ 25,285 $ 21,008 $ 22,028 $ 24,901 $ 25,347 $ 18,207 Adjusted EBITDA margin (6) 51.2% 56.4% 58.3% 49.0% 50.9% 55.2% 57.2% 41.2% 6/30/2015 3/31/2015 Three Months Ended 6/30/2016 3/31/2016 12/31/2015 9/30/201512/31/2016 9/30/2016
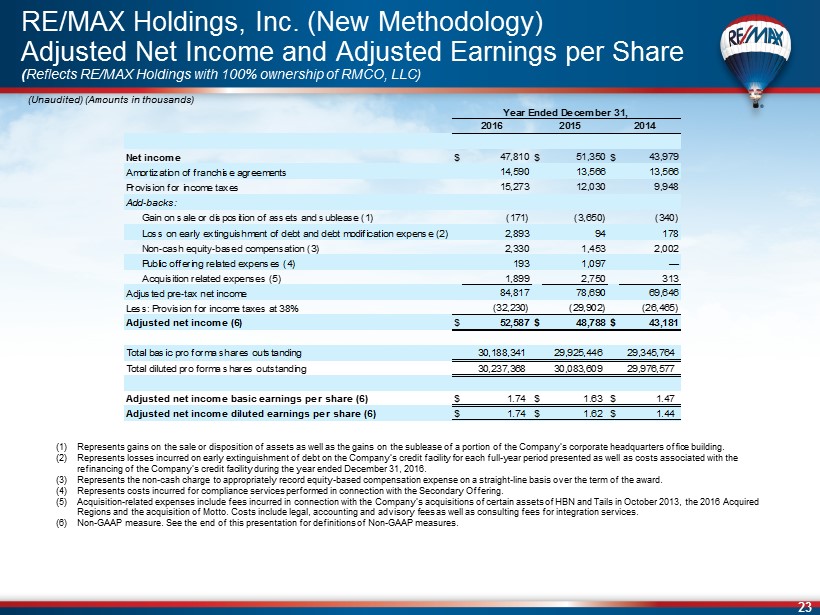
23 (Unaudited) (Amounts in thousands) RE/MAX Holdings, Inc. (New Methodology) Adjusted Net Income and Adjusted Earnings per Share ( Reflects RE/MAX Holdings with 100% ownership of RMCO, LLC ) (1) Represents gains on the sale or disposition of assets as well as the gains on the sublease of a portion of the Company’s corporate headquarter s o ffice building. (2) Represents losses incurred on early extinguishment of debt on the Company’s credit facility for each full - year period presented as well as costs associated with the refinancing of the Company’s credit facility during the year ended December 31, 2016. (3) Represents the non - cash charge to appropriately record equity - based compensation expense on a straight - line basis over the term of the awar d. (4) Represents costs incurred for compliance services performed in connection with the Secondary Offering. (5) Acquisition - related expenses include fees incurred in connection with the Company’s acquisitions of certain assets of HBN and Tails in October 2013, the 2016 Acquired Regions and the acquisition of Motto. Costs include legal, accounting and advisory fees as well as consulting fees for integration services. (6) Non - GAAP measure. See the end of this presentation for definitions of Non - GAAP measures. Net income $ 47,810 $ 51,350 $ 43,979 Amortization of franchise agreements 14,590 13,566 13,566 Provision for income taxes 15,273 12,030 9,948 Add-backs: Gain on sale or disposition of assets and sublease (1) (171) (3,650) (340) Loss on early extinguishment of debt and debt modification expense (2) 2,893 94 178 Non-cash equity-based compensation (3) 2,330 1,453 2,002 Public offering related expenses (4) 193 1,097 — Acquisition related expenses (5) 1,899 2,750 313 Adjusted pre-tax net income 84,817 78,690 69,646 Less: Provision for income taxes at 38% (32,230) (29,902) (26,465) Adjusted net income (6) $ 52,587 $ 48,788 $ 43,181 Total basic pro forma shares outstanding 30,188,341 29,925,446 29,345,764 Total diluted pro forma shares outstanding 30,237,368 30,083,609 29,976,577 Adjusted net income basic earnings per share (6) $ 1.74 $ 1.63 $ 1.47 Adjusted net income diluted earnings per share (6) $ 1.74 $ 1.62 $ 1.44 2016 2015 2014 Year Ended December 31,
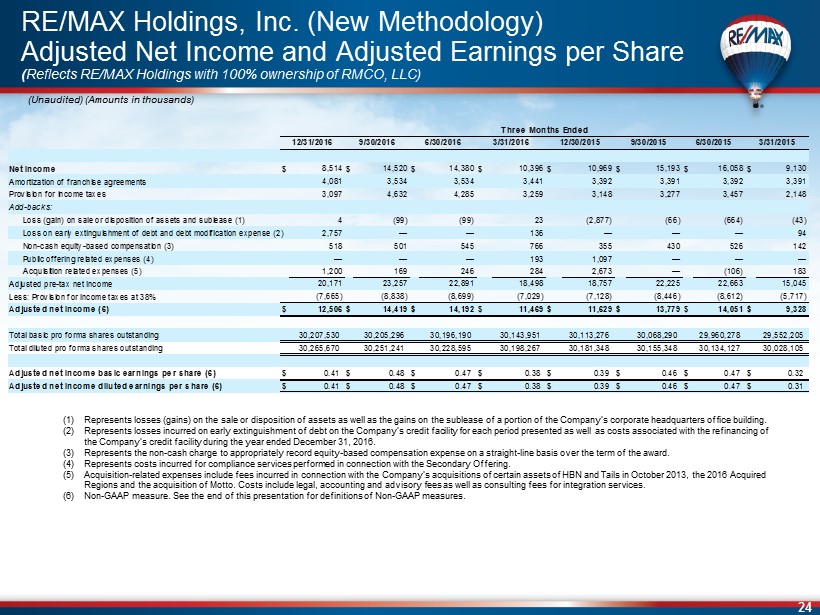
24 (Unaudited) (Amounts in thousands) RE/MAX Holdings, Inc. (New Methodology) Adjusted Net Income and Adjusted Earnings per Share ( Reflects RE/MAX Holdings with 100% ownership of RMCO, LLC ) (1) Represents losses (gains) on the sale or disposition of assets as well as the gains on the sublease of a portion of the Company’s corporate headquarter s o ffice building. (2) Represents losses incurred on early extinguishment of debt on the Company’s credit facility for each period presented as well as costs associated with the refinancing of the Company’s credit facility during the year ended December 31, 2016. (3) Represents the non - cash charge to appropriately record equity - based compensation expense on a straight - line basis over the term of the awar d. (4) Represents costs incurred for compliance services performed in connection with the Secondary Offering. (5) Acquisition - related expenses include fees incurred in connection with the Company’s acquisitions of certain assets of HBN and Tails in October 2013, the 2016 Acquired Regions and the acquisition of Motto. Costs include legal, accounting and advisory fees as well as consulting fees for integration services. (6) Non - GAAP measure. See the end of this presentation for definitions of Non - GAAP measures. Net income $ 8,514 $ 14,520 $ 14,380 $ 10,396 $ 10,969 $ 15,193 $ 16,058 $ 9,130 Amortization of franchise agreements 4,081 3,534 3,534 3,441 3,392 3,391 3,392 3,391 Provision for income taxes 3,097 4,632 4,285 3,259 3,148 3,277 3,457 2,148 Add-backs: Loss (gain) on sale or disposition of assets and sublease (1) 4 (99) (99) 23 (2,877) (66) (664) (43) Loss on early extinguishment of debt and debt modification expense (2) 2,757 — — 136 — — — 94 Non-cash equity-based compensation (3) 518 501 545 766 355 430 526 142 Public offering related expenses (4) — — — 193 1,097 — — — Acquisition related expenses (5) 1,200 169 246 284 2,673 — (106) 183 Adjusted pre-tax net income 20,171 23,257 22,891 18,498 18,757 22,225 22,663 15,045 Less: Provision for income taxes at 38% (7,665) (8,838) (8,699) (7,029) (7,128) (8,446) (8,612) (5,717) Adjusted net income (6) $ 12,506 $ 14,419 $ 14,192 $ 11,469 $ 11,629 $ 13,779 $ 14,051 $ 9,328 Total basic pro forma shares outstanding 30,207,530 30,205,296 30,196,190 30,143,951 30,113,276 30,068,290 29,960,278 29,552,205 Total diluted pro forma shares outstanding 30,265,670 30,251,241 30,228,595 30,198,267 30,181,348 30,155,348 30,134,127 30,028,105 Adjusted net income basic earnings per share (6) $ 0.41 $ 0.48 $ 0.47 $ 0.38 $ 0.39 $ 0.46 $ 0.47 $ 0.32 Adjusted net income diluted earnings per share (6) $ 0.41 $ 0.48 $ 0.47 $ 0.38 $ 0.39 $ 0.46 $ 0.47 $ 0.31 6/30/2015 3/31/2015 Three Months Ended 12/31/2016 9/30/2016 6/30/2016 3/31/2016 12/30/2015 9/30/2015

25 Appendix
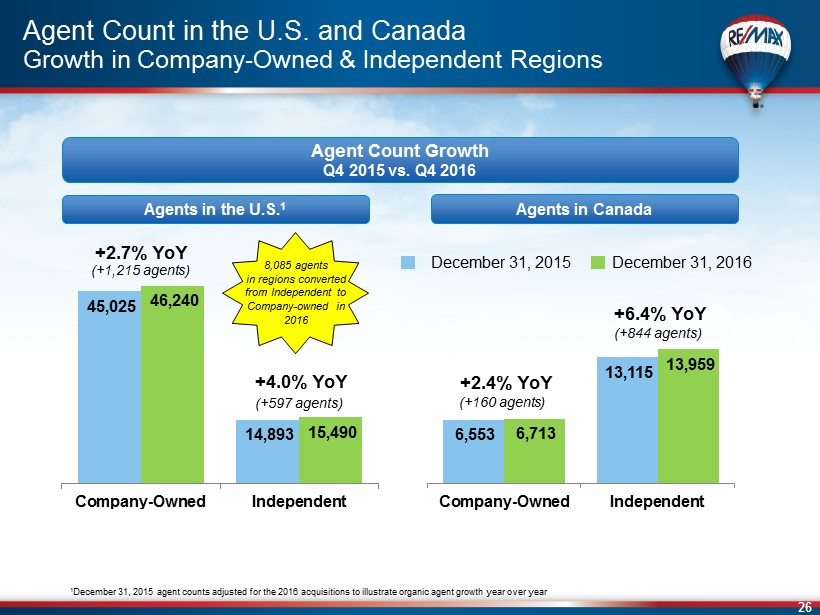
26 6,553 13,115 6,713 13,959 Company-Owned Independent 45,025 14,893 46,240 15,490 Company-Owned Independent Agent Count in the U.S. and Canada Growth in Company - Owned & Independent Regions Agents in the U.S. 1 Agents in Canada Agent Count Growth Q4 2015 v s . Q4 2016 (+1,215 agents) +2.7% YoY +4.0% YoY (+597 agents) +2.4% YoY (+160 agents) +6.4% YoY (+844 agents) December 31, 2015 December 31, 2016 8,085 agents in regions converted from Independent to Company - owned in 2016 1 December 31, 2015 agent counts adjusted for the 2016 acquisitions to illustrate organic agent growth year over year
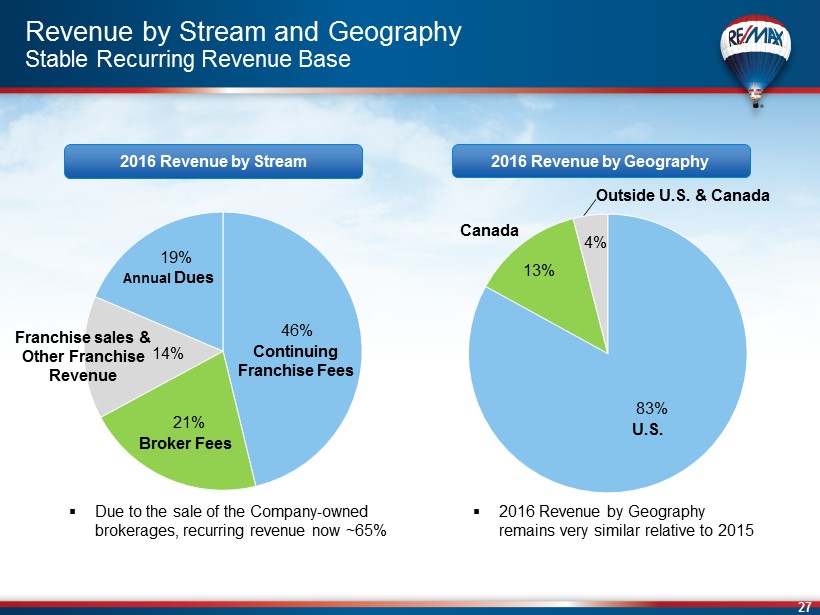
27 46% 21% 14% 19% 83% 13% 4% Revenue by Stream and Geography Stable Recurring Revenue Base 2016 Revenue by Stream 2016 Revenue by Geography U.S. Canada Outside U.S. & Canada Franchise sales & Other F ranchise R evenue Broker Fees Annual D ues Continuing Franchise F ees ▪ 2016 Revenue by Geography remains very similar relative to 2015 ▪ Due to the sale of the Company - owned brokerages, recurring revenue now ~65%
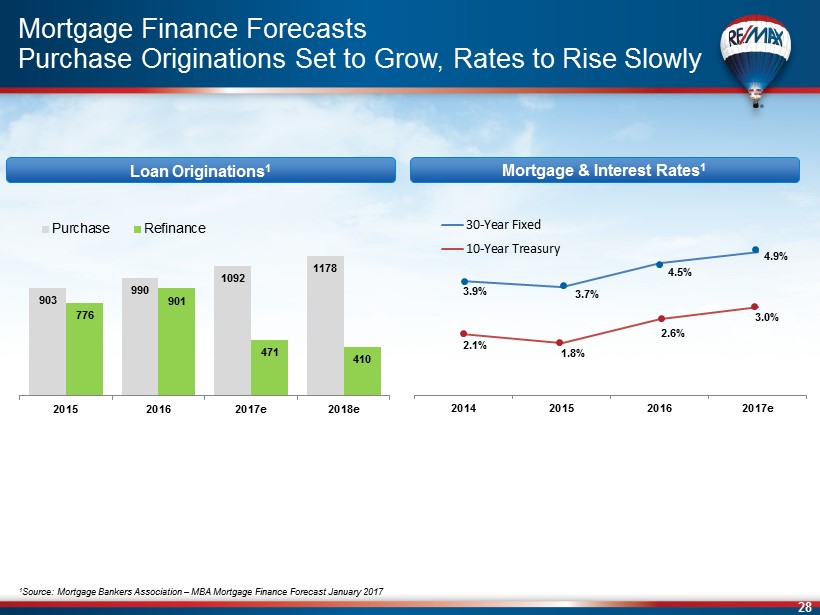
28 Mortgage Finance Forecasts Purchase Originations Set to Grow, Rates to Rise Slowly 1 Source: Mortgage Bankers Association – MBA Mortgage Finance Forecast January 2017 Loan Originations 1 Mortgage & Interest Rates 1 3.9% 3.7% 4.5% 4.9% 2.1% 1.8% 2.6% 3.0% 2014 2015 2016 2017e 30-Year Fixed 10-Year Treasury 903 990 1092 1178 776 901 471 410 2015 2016 2017e 2018e Purchase Refinance
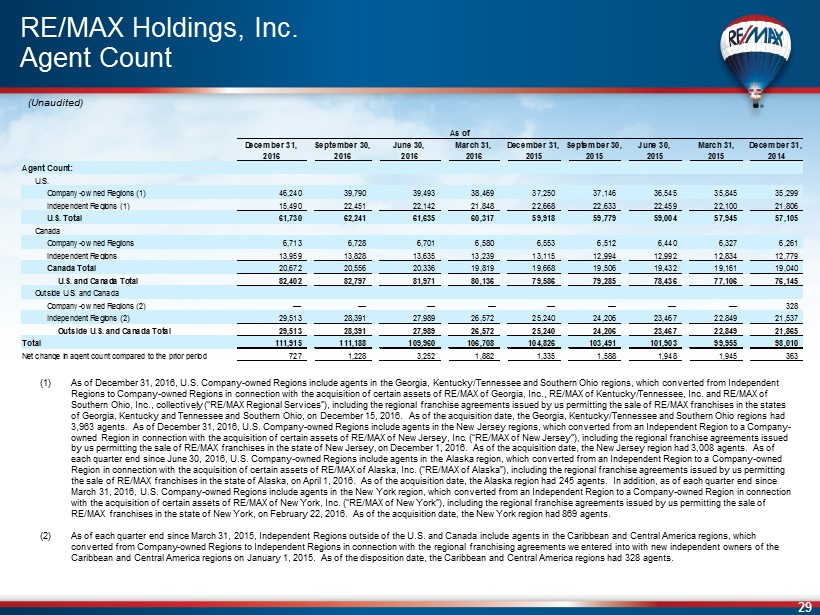
29 RE/MAX Holdings, Inc. Agent Count (1) As of December 31, 2016, U.S. Company - owned Regions include agents in the Georgia, Kentucky/Tennessee and Southern Ohio regions, wh ich converted from Independent Regions to Company - owned Regions in connection with the acquisition of certain assets of RE/MAX of Georgia, Inc., RE/MAX of Kent ucky/Tennessee, Inc. and RE/MAX of Southern Ohio, Inc., collectively (“RE/MAX Regional Services”), including the regional franchise agreements issued by us perm itt ing the sale of RE/MAX franchises in the states of Georgia, Kentucky and Tennessee and Southern Ohio, on December 15, 2016. As of the acquisition date, the Georgia, Kentuck y/T ennessee and Southern Ohio regions had 3,963 agents. As of December 31, 2016, U.S. Company - owned Regions include agents in the New Jersey regions, which converted fro m an Independent Region to a Company - owned Region in connection with the acquisition of certain assets of RE/MAX of New Jersey, Inc. (“RE/MAX of New Jersey”), inc lud ing the regional franchise agreements issued by us permitting the sale of RE/MAX franchises in the state of New Jersey, on December 1, 2016. As of the acquisition date, the New Jersey region had 3,008 agents. As of each quarter end since June 30, 2016, U.S. Company - owned Regions include agents in the Alaska region, which converted from an In dependent Region to a Company - owned Region in connection with the acquisition of certain assets of RE/MAX of Alaska, Inc. (“RE/MAX of Alaska”), including the reg ion al franchise agreements issued by us permitting the sale of RE/MAX franchises in the state of Alaska, on April 1, 2016. As of the acquisition date, the Alaska region had 24 5 a gents. In addition, as of each quarter end since March 31, 2016, U.S. Company - owned Regions include agents in the New York region, which converted from an Independent Region to a Company - owned Region in connection with the acquisition of certain assets of RE/MAX of New York, Inc. (“RE/MAX of New York”), including the regional franchise a gre ements issued by us permitting the sale of RE/MAX franchises in the state of New York, on February 22, 2016. As of the acquisition date, the New York region had 869 ag ent s . (2) As of each quarter end since March 31, 2015, Independent Regions outside of the U.S. and Canada include agents in the Caribbean and Central America regions, which converted from Company - owned Regions to Independent Regions in connection with the regional franchising agreements we entered in to with new independent owners of the Caribbean and Central America regions on January 1, 2015. As of the disposition date, the Caribbean and Central America regi ons had 328 agents. (Unaudited) December 31, September 30, June 30, March 31, December 31, September 30, June 30, March 31, December 31, 2016 2016 2016 2016 2015 2015 2015 2015 2014 Agent Count: U.S. Company-owned Regions (1) 46,240 39,790 39,493 38,469 37,250 37,146 36,545 35,845 35,299 Independent Regions (1) 15,490 22,451 22,142 21,848 22,668 22,633 22,459 22,100 21,806 U.S. Total 61,730 62,241 61,635 60,317 59,918 59,779 59,004 57,945 57,105 Canada Company-owned Regions 6,713 6,728 6,701 6,580 6,553 6,512 6,440 6,327 6,261 Independent Regions 13,959 13,828 13,635 13,239 13,115 12,994 12,992 12,834 12,779 Canada Total 20,672 20,556 20,336 19,819 19,668 19,506 19,432 19,161 19,040 U.S. and Canada Total 82,402 82,797 81,971 80,136 79,586 79,285 78,436 77,106 76,145 Outside U.S. and Canada Company-owned Regions (2) — — — — — — — — 328 Independent Regions (2) 29,513 28,391 27,989 26,572 25,240 24,206 23,467 22,849 21,537 Outside U.S. and Canada Total 29,513 28,391 27,989 26,572 25,240 24,206 23,467 22,849 21,865 Total 111,915 111,188 109,960 106,708 104,826 103,491 101,903 99,955 98,010 Net change in agent count compared to the prior period 727 1,228 3,252 1,882 1,335 1,588 1,948 1,945 363 As of
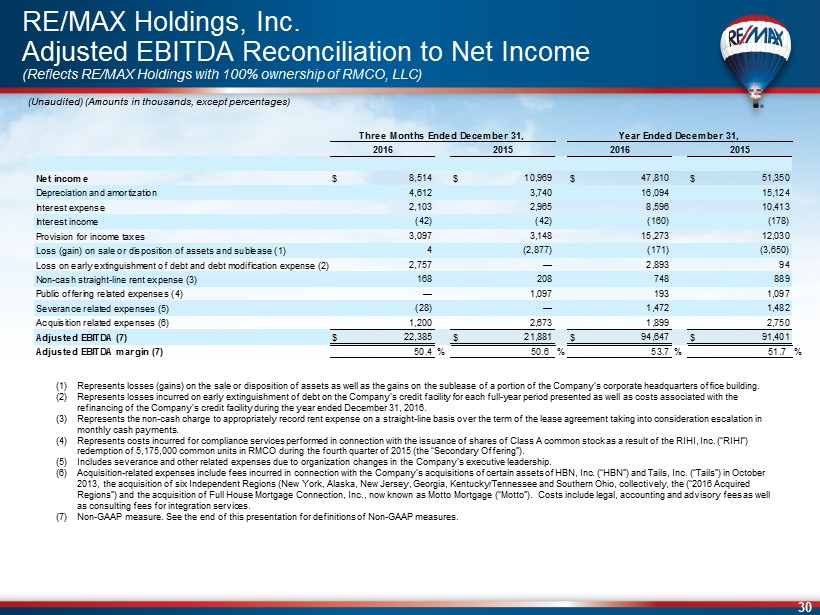
30 RE/MAX Holdings, Inc. Adjusted EBITDA Reconciliation to Net Income (Reflects RE/MAX Holdings with 100% ownership of RMCO, LLC) (Unaudited) (Amounts in thousands, except percentages) (1) Represents losses (gains) on the sale or disposition of assets as well as the gains on the sublease of a portion of the Company’s corpor ate headquarters office building . (2) Represents losses incurred on early extinguishment of debt on the Company’s credit facility for each full - year period presented as well as costs associated with the refinancing of the Company’s credit facility during the year ended December 31, 2016. (3) Represents the non - cash charge to appropriately record rent expense on a straight - line basis over the term of the lease agreement taking in to consideration escalation in monthly cash payments. (4) Represents costs incurred for compliance services performed in connection with the issuance of shares of Class A common stock as a resul t o f the RIHI, Inc. (“RIHI”) redemption of 5,175,000 common units in RMCO during the fourth quarter of 2015 (the “Secondary Offering ”). (5) Includes severance and other related expenses due to organization changes in the Company’s executive leadership. (6) Acquisition - related expenses include fees incurred in connection with the Company’s acquisitions of certain assets of HBN, Inc. (“HBN”) and Tails , I nc. (“Tails”) in October 2013, the acquisition of six Independent Regions (New York, Alaska, New Jersey, Georgia, Kentucky/Tennessee and Southern Ohio , c ollectively, the (“2016 Acquired Regions”) and the acquisition of Full House Mortgage Connection, Inc., now known as Motto Mortgage (“Motto”). Costs include leg al, accounting and advisory fees as well as consulting fees for integration services . (7) Non - GAAP measure. See the end of this presentation for definitions of Non - GAAP measures . Net income $ 8,514 $ 10,969 $ 47,810 $ 51,350 Depreciation and amortization 4,612 3,740 16,094 15,124 Interest expense 2,103 2,965 8,596 10,413 Interest income (42) (42) (160) (178) Provision for income taxes 3,097 3,148 15,273 12,030 Loss (gain) on sale or disposition of assets and sublease (1) 4 (2,877) (171) (3,650) Loss on early extinguishment of debt and debt modification expense (2) 2,757 — 2,893 94 Non-cash straight-line rent expense (3) 168 208 748 889 Public offering related expenses (4) — 1,097 193 1,097 Severance related expenses (5) (28) — 1,472 1,482 Acquisition related expenses (6) 1,200 2,673 1,899 2,750 Adjusted EBITDA (7) $ 22,385 $ 21,881 $ 94,647 $ 91,401 Adjusted EBITDA margin (7) 50.4% 50.6 % 53.7% 51.7 % 2016 2015 Three Months Ended December 31, Year Ended December 31, 2016 2015
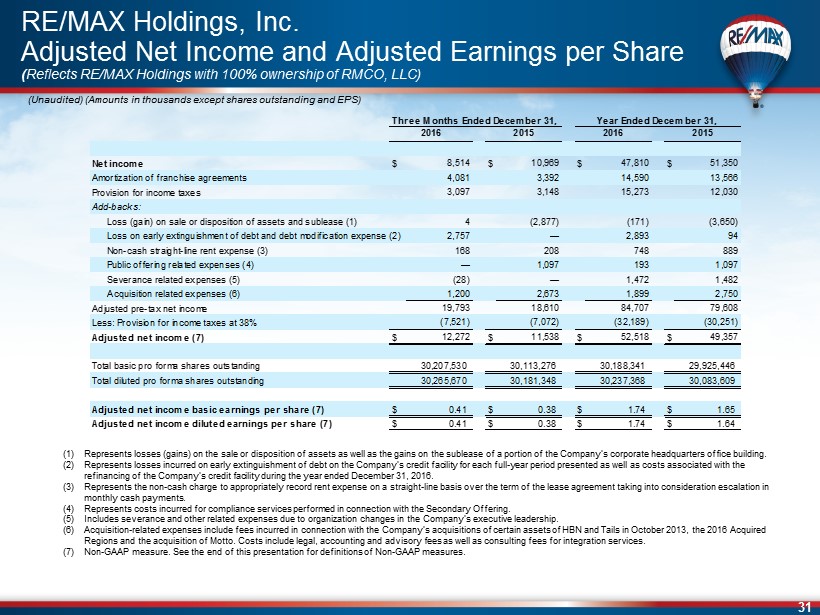
31 RE/MAX Holdings, Inc. Adjusted Net Income and Adjusted Earnings per Share ( Reflects RE/MAX Holdings with 100% ownership of RMCO, LLC ) (Unaudited) (Amounts in thousands except shares outstanding and EPS) (1) Represents losses (gains) on the sale or disposition of assets as well as the gains on the sublease of a portion of the Company’s corporate headquarter s o ffice building. (2) Represents losses incurred on early extinguishment of debt on the Company’s credit facility for each full - year period presented as well as costs associated with the refinancing of the Company’s credit facility during the year ended December 31, 2016. (3) Represents the non - cash charge to appropriately record rent expense on a straight - line basis over the term of the lease agreement taking in to consideration escalation in monthly cash payments. (4) Represents costs incurred for compliance services performed in connection with the Secondary Offering. (5) Includes severance and other related expenses due to organization changes in the Company’s executive leadership. (6) Acquisition - related expenses include fees incurred in connection with the Company’s acquisitions of certain assets of HBN and Tails in October 2013, the 2016 Acquired Regions and the acquisition of Motto. Costs include legal, accounting and advisory fees as well as consulting fees for integration services. (7) Non - GAAP measure. See the end of this presentation for definitions of Non - GAAP measures. Net income $ 8,514 $ 10,969 $ 47,810 $ 51,350 Amortization of franchise agreements 4,081 3,392 14,590 13,566 Provision for income taxes 3,097 3,148 15,273 12,030 Add-backs: Loss (gain) on sale or disposition of assets and sublease (1) 4 (2,877) (171) (3,650) Loss on early extinguishment of debt and debt modification expense (2) 2,757 — 2,893 94 Non-cash straight-line rent expense (3) 168 208 748 889 Public offering related expenses (4) — 1,097 193 1,097 Severance related expenses (5) (28) — 1,472 1,482 Acquisition related expenses (6) 1,200 2,673 1,899 2,750 Adjusted pre-tax net income 19,793 18,610 84,707 79,608 Less: Provision for income taxes at 38% (7,521) (7,072) (32,189) (30,251) Adjusted net income (7) $ 12,272 $ 11,538 $ 52,518 $ 49,357 Total basic pro forma shares outstanding 30,207,530 30,113,276 30,188,341 29,925,446 Total diluted pro forma shares outstanding 30,265,670 30,181,348 30,237,368 30,083,609 Adjusted net income basic earnings per share (7) $ 0.41 $ 0.38 $ 1.74 $ 1.65 Adjusted net income diluted earnings per share (7) $ 0.41 $ 0.38 $ 1.74 $ 1.64 2016 2015 Three Months Ended December 31, Year Ended December 31, 2016 2015
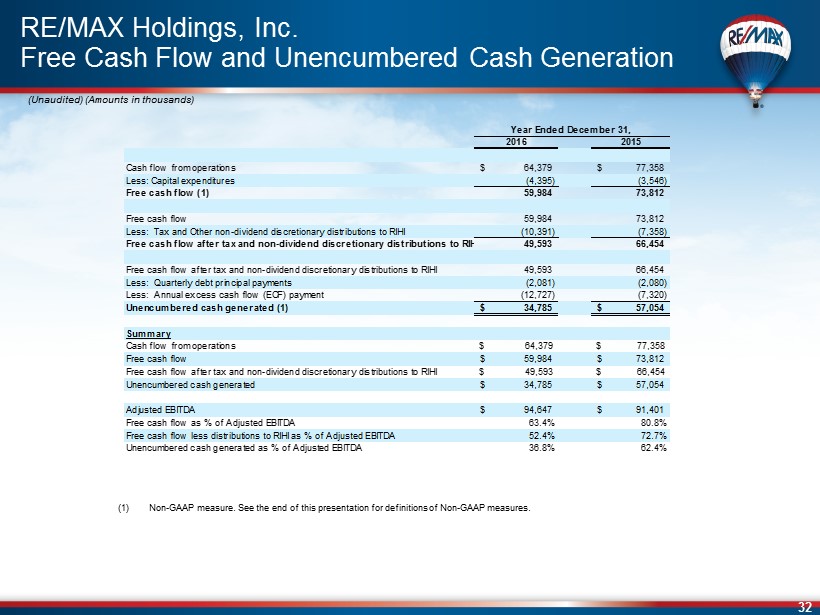
32 RE/MAX Holdings, Inc. Free Cash Flow and Unencumbered Cash Generation (Unaudited) (Amounts in thousands) (1) Non - GAAP measure . See the end of this presentation for definitions of Non - GAAP measures . 2016 2015 Cash flow from operations 64,379$ 77,358$ Less: Capital expenditures (4,395) (3,546) Free cash flow (1) 59,984 73,812 Free cash flow 59,984 73,812 Less: Tax and Other non-dividend discretionary distributions to RIHI (10,391) (7,358) Free cash flow after tax and non-dividend discretionary distributions to RIHI (1) 49,593 66,454 Free cash flow after tax and non-dividend discretionary distributions to RIHI 49,593 66,454 Less: Quarterly debt principal payments (2,081) (2,080) Less: Annual excess cash flow (ECF) payment (12,727) (7,320) Unencumbered cash generated (1) 34,785$ 57,054$ Summary Cash flow from operations $ 64,379 $ 77,358 Free cash flow 59,984$ 73,812$ Free cash flow after tax and non-dividend discretionary distributions to RIHI $ 49,593 $ 66,454 Unencumbered cash generated 34,785$ 57,054$ Adjusted EBITDA 94,647$ 91,401$ Free cash flow as % of Adjusted EBITDA 63.4% 80.8% Free cash flow less distributions to RIHI as % of Adjusted EBITDA 52.4% 72.7% Unencumbered cash generated as % of Adjusted EBITDA 36.8% 62.4% Year Ended December 31,
33 Non - GAAP Financial Measures The SEC has adopted rules to regulate the use in filings with the SEC and in public disclosures of financial measures not in accordance with U . S . GAAP, such as Adjusted EBITDA and the ratios related thereto, Adjusted net income, Adjusted basic and diluted earnings per share (Adjusted EPS) and Free cash flow . These measures are derived on the basis of methodologies other than in accordance with U . S . GAAP . The Company defines Adjusted EBITDA as EBITDA (consolidated net income before depreciation and amortization, interest expense, interest income and the provision for income taxes, each of which is presented in the audited consolidated financial statements included in the Annual Report on Form 10 - K), adjusted for the impact of the following items that the Company does not consider representative of its ongoing operating performance : loss or gain on sale or disposition of assets and sublease, loss on early extinguishment of debt, non - cash straight - line rent expense, professional fees and certain expenses incurred in connection with the IPO and subsequent secondary offering, acquisition related expenses and severance related expenses . During the third quarter of 2014 , the Company revised its definition of Adjusted EBITDA to eliminate the adjustment of equity - based compensation expense incurred for equity awards granted since the IPO, and Adjusted EBITDA in prior periods was revised to reflect this change for consistency of presentation . During the fourth quarter of 2014 , the Company revised its definition of Adjusted EBITDA to include an adjustment for severance related charges incurred during or after such quarter . Because Adjusted EBITDA omits certain non - cash items and other non - recurring cash charges or other items, the Company believes that it is less susceptible to variances that affect its operating performance resulting from depreciation, amortization and other non - cash and non - recurring cash charges or other items and is more reflective of other factors that affect its operating performance . The Company presents Adjusted EBITDA because the Company believes it is useful as a supplemental measure in evaluating the performance of the operating businesses and provides greater transparency into the Company’s results of operations . The Company’s management uses Adjusted EBITDA as a factor in evaluating the performance of the business . Adjusted EBITDA has limitations as an analytical tool, and you should not consider Adjusted EBITDA either in isolation or as a substitute for analyzing the Company’s results as reported under U . S . GAAP . Some of these limitations are : this measure does not reflect changes in, or cash requirements for, the Company’s working capital needs ; this measure does not reflect the Company’s interest expense, or the cash requirements necessary to service interest or principal payments on its debt ; this measure does not reflect the Company’s income tax expense or the cash requirements to pay its taxes ; this measure does not reflect historical cash expenditures or future requirements for capital expenditures or contractual commitments ; this measure does not reflect the cash requirements to pay dividends to stockholders of the Company’s Class A common stock and tax and other cash distributions to its non - controlling unitholders ; this measure does not reflect the cash requirements to pay RIHI Inc . and Oberndorf pursuant to the tax receivable agreements, although depreciation and amortization are non - cash charges, the assets being depreciated and amortized will often require replacement in the future, and these measures do not reflect any cash requirements for such replacements ; and other companies may calculate this measure differently so they may not be comparable . Adjusted EBITDA margin represents Adjusted EBITDA as a percentage of Revenue . Adjusted net income is defined as net income plus primarily non - cash items and other items that management does not consider to be useful in assessing our operating performance (e . g . , amortization of franchise agreements, gain on sale or disposition of assets and sub - lease, loss on debt extinguishment, non - cash straight - line rent expense, public offering related expenses, severance - related expenses, and acquisition - related costs) . Adjusted basic and diluted earnings per share (Adjusted EPS) are defined as Adjusted net income (as defined above) divided by pro forma basic and diluted weighted average shares, as applicable . Free cash flow is defined as operating cash flow minus capital expenditures . Free cash flow after tax and non - dividend discretionary distributions to RIHI is defined as free cash flow minus tax and other discretionary non - dividend distributions paid to RIHI to enable RIHI to satisfy its income tax obligations . Unencumbered cash generated is defined as free cash flow after tax and non - dividend discretionary distributions to RIHI minus quarterly debt principal payments minus annual excess cash flow payment on debt, as applicable . The Company’s Adjusted EBITDA margin guidance does not include certain charges and costs . The adjustments to EBITDA margin in future periods are generally expected to be similar to the kinds of charges and costs excluded from Adjusted EBITDA margin in prior quarters, such as gain on sale or disposition of assets and sublease and acquisition related expenses, among others . The exclusion of these charges and costs in future periods will have a significant impact on the Company’s Adjusted EBITDA margin . The Company is not able to provide a reconciliation of the Company’s non - GAAP financial guidance to the corresponding U . S . GAAP measures without unreasonable effort because of the uncertainty and variability of the nature and amount of these future charges and costs .