Attached files
| file | filename |
|---|---|
| EX-12 - EXHIBIT 12 - WESTAR ENERGY INC /KS | wr-12312016x10kexhibit12.htm |
| EX-32 - EXHIBIT 32 - WESTAR ENERGY INC /KS | wr-12312016x10kexhibit32.htm |
| EX-31.B - EXHIBIT 31.B - WESTAR ENERGY INC /KS | wr-12312016x10kexhibit31b.htm |
| EX-31.A - EXHIBIT 31.A - WESTAR ENERGY INC /KS | wr-12312016x10kexhibit31a.htm |
| EX-23 - EXHIBIT 23 - WESTAR ENERGY INC /KS | wr-12312016x10kexhibit23.htm |
| EX-21 - EXHIBIT 21 - WESTAR ENERGY INC /KS | wr-12312016x10kexhibit21.htm |
| EX-10.G - EXHIBIT 10.G - WESTAR ENERGY INC /KS | wr-12312016x10kexhibit10gx.htm |
| EX-10.F - EXHIBIT 10.F - WESTAR ENERGY INC /KS | wr-12312016x10kexhibit10fx.htm |
UNITED STATES SECURITIES AND EXCHANGE COMMISSION
Washington, D.C. 20549
FORM 10-K
[X] | ANNUAL REPORT PURSUANT TO SECTION 13 or 15(d) OF THE SECURITIES EXCHANGE ACT OF 1934 |
For the fiscal year ended December 31, 2016
OR
[ ] | TRANSITION REPORT PURSUANT TO SECTION 13 OR 15(d) OF THE SECURITIES EXCHANGE ACT OF 1934 |
For the transition period from to
Commission File Number 1-3523

WESTAR ENERGY, INC.
(Exact name of registrant as specified in its charter)
Kansas | 48-0290150 | |
(State or other jurisdiction of incorporation or organization) | (I.R.S. Employer Identification Number) | |
818 South Kansas Avenue, Topeka, Kansas 66612 | (785) 575-6300 | |
(Address, including Zip code and telephone number, including area code, of registrant’s principal executive offices) | ||
Securities registered pursuant to section 12(b) of the Act:
Common Stock, par value $5.00 per share | New York Stock Exchange | |
(Title of each class) | (Name of each exchange on which registered) | |
Securities registered pursuant to section 12(g) of the Act: None
Indicate by check mark whether the registrant is a well-known seasoned issuer (as defined in Rule 405 of the Act). Yes X No ____
Indicate by check mark whether the registrant is not required to file reports pursuant to Section 13 or Section 15(d) of the Act. Yes No X
Indicate by check mark whether the registrant (1) has filed all reports required to be filed by Section 13 or 15(d) of the Securities Exchange Act of 1934 during the preceding 12 months (or for such shorter period that the registrant was required to file such reports), and (2) has been subject to such filing requirements for the past 90 days. Yes X No ____
Indicate by check mark whether the registrant has submitted electronically and posted on its corporate Web site, if any, every Interactive Data File required to be submitted and posted pursuant to Rule 405 of Regulation S-T during the preceding 12 months (or for such shorter period that the registrant was required to submit and post such files). Yes X No ____
Indicate by check mark if disclosure of delinquent filers pursuant to Item 405 of Regulation S-K is not contained herein, and will not be contained, to the best of registrant’s knowledge, in definitive proxy or information statements incorporated by reference in Part III of this Form 10-K or any amendment to this Form 10-K. [X]
Indicate by check mark whether the registrant is a large accelerated filer, an accelerated filer, a non-accelerated filer, or a smaller reporting company (as defined in Rule 12b-2 of the Act). Check one:
Large accelerated filer X Accelerated filer Non-accelerated filer Smaller reporting company
Indicate by check mark whether the registrant is a shell company (as defined in Rule 12b-2 of the Act). Yes No X
The aggregate market value of the voting common equity held by non-affiliates of the registrant was approximately $7,947,449,144 at June 30, 2016.
Indicate the number of shares outstanding of each of the registrant’s classes of common stock, as of the latest practicable date.
Common Stock, par value $5.00 per share | 142,045,033 shares | |
(Class) | (Outstanding at February 15, 2017) | |
DOCUMENTS INCORPORATED BY REFERENCE:
Information required by Items 10-14 of Part III of this Form 10-K will be incorporated by reference to Westar Energy, Inc.’s definitive proxy statement with respect to its 2017 Annual Meeting of Shareholders, if such definitive proxy statement is filed with the Securities and Exchange Commission on or before April 30, 2017. Due to the pending merger with Great Plains Energy Incorporated, we may not be required to file a definitive proxy statement, in which case we will file an amendment to this Form 10-K on or before April 30, 2017 to include the information that is otherwise incorporated by reference.
1
TABLE OF CONTENTS
Page | ||
Item 1. | ||
Item 1A. | ||
Item 1B. | ||
Item 2. | ||
Item 3. | ||
Item 4. | ||
Item 5. | ||
Item 6. | ||
Item 7. | ||
Item 7A. | ||
Item 8. | ||
Item 9. | ||
Item 9A. | ||
Item 9B. | ||
Item 10. | ||
Item 11. | ||
Item 12. | ||
Item 13. | ||
Item 14. | ||
Item 15. | ||
Item 16. | ||
2
GLOSSARY OF TERMS
The following is a glossary of frequently used abbreviations or acronyms that are found throughout this report.
Abbreviation or Acronym | Definition | |
AFUDC | Allowance for funds used during construction | |
ARO | Asset retirement obligation | |
ASU | Accounting Standard Update | |
BNSF | BNSF Railway Company | |
Btu | British thermal units | |
CAA | Clean Air Act | |
CCR | Coal combustion residuals | |
CO | Carbon monoxide | |
CO2 | Carbon dioxide | |
COLI | Corporate-owned life insurance | |
CPP | Clean Power Plan | |
CWA | Clean Water Act | |
CWIP | Construction work in progress | |
DOE | Department of Energy | |
DSPP | Direct Stock Purchase Plan | |
EPA | Environmental Protection Agency | |
EPS | Earnings per share | |
Exchange Act | Securities Exchange Act of 1934 | |
FASB | Financial Accounting Standards Board | |
FERC | Federal Energy Regulatory Commission | |
GAAP | Generally Accepted Accounting Principles | |
GHG | Greenhouse gas | |
Great Plains Energy | Great Plains Energy Incorporated | |
HSR Act | Hart-Scott-Rodino Antitrust Improvements Act | |
IM | Integrated Marketplace | |
JEC | Jeffrey Energy Center | |
KCC | Kansas Corporation Commission | |
KCPL | Kansas City Power & Light Company | |
KDHE | Kansas Department of Health and Environment | |
KGE | Kansas Gas and Electric Company | |
La Cygne | La Cygne Generating Station | |
LTISA Plan | Long-term incentive and share award plan | |
MATS | Mercury and Air Toxics Standards | |
Merger | Pending acquisition of Westar Energy, Inc. by Great Plains Energy Incorporated | |
MPSC | Public Service Commission of the State of Missouri | |
MMBtu | Millions of British thermal units | |
Moody’s | Moody’s Investors Service | |
MW | Megawatt(s) | |
MWh | Megawatt hour(s) | |
NAAQS | National Ambient Air Quality Standards | |
NAV | Net Asset Value | |
NDT | Nuclear Decommissioning Trust | |
NEIL | Nuclear Electric Insurance Limited | |
NOx | Nitrogen oxides | |
NRC | Nuclear Regulatory Commission | |
3
OPC | Office of Public Counsel | |
PCB | Polychlorinated biphenyl | |
PM | Particulate matter | |
PPB | Parts per billion | |
PRB | Powder River Basin | |
Prairie Wind | Prairie Wind Transmission, LLC | |
ROE | Return on equity | |
RSU | Restricted share unit | |
RTO | Regional transmission organization | |
S&P | Standard & Poor’s Ratings Services | |
S&P 500 | Standard & Poor’s 500 Index | |
S&P Electric Utilities | Standard & Poor’s Electric Utility Index | |
SEC | Securities and Exchange Commission | |
SO2 | Sulfur dioxide | |
SPP | Southwest Power Pool, Inc. | |
SSCGP | Southern Star Central Gas Pipeline | |
TFR | Transmission formula rate | |
VaR | Value-at-Risk | |
VIE | Variable interest entity | |
Wolf Creek | Wolf Creek Generating Station | |
4
FORWARD-LOOKING STATEMENTS
Certain matters discussed in this Annual Report on Form 10-K are “forward-looking statements.” The Private Securities Litigation Reform Act of 1995 has established that these statements qualify for safe harbors from liability. Forward-looking statements may include words like we “believe,” “anticipate,” “target,” “expect,” “estimate,” “intend” and words of similar meaning. Forward-looking statements describe our future plans, objectives, expectations or goals. Such statements address future events and conditions concerning matters such as, but not limited to:
- | the pending acquisition (merger) of Westar Energy, Inc. by Great Plains Energy Incorporated (Great Plains Energy), |
- | amount, type and timing of capital expenditures, |
- | earnings, |
- | cash flow, |
- | liquidity and capital resources, |
- | litigation, |
- | accounting matters, |
- | compliance with debt and other restrictive covenants, |
- | interest rates and dividends, |
- | environmental matters, |
- | regulatory matters, |
- | nuclear operations, and |
- | the overall economy of our service area and its impact on our customers’ demand for electricity and their ability to pay for service. |
What happens in each case could vary materially from what we expect because of such things as:
- | risks related to operating in a heavily regulated industry that is subject to unpredictable political, legislative, judicial and regulatory developments, which can impact our operations, results of operations, and financial condition, |
- | the difficulty of predicting the magnitude and timing of changes in demand for electricity, including with respect to emerging competing services and technologies and conservation and energy efficiency measures, |
- | the impact of weather conditions, including as it relates to sales of electricity and prices of energy commodities, |
- | equipment damage from storms and extreme weather, |
- | economic and capital market conditions, including the impact of inflation or deflation, changes in interest rates, the cost and availability of capital and the market for trading wholesale energy, |
- | the impact of changes in market conditions on employee benefit liability calculations and funding obligations, as well as actual and assumed investment returns on invested plan assets, |
- | the impact of changes in estimates regarding our Wolf Creek Generating Station (Wolf Creek) decommissioning obligation, |
- | the existence or introduction of competition into markets in which we operate, |
- | the impact of changing laws and regulations relating to air and greenhouse gas (GHG) emissions, water emissions, waste management and other environmental matters, |
- | risks associated with execution of our planned capital expenditure program, including timing and receipt of regulatory approvals necessary for planned construction and expansion projects as well as the ability to complete planned construction projects within the terms and time frames anticipated, |
- | cost, availability and timely provision of equipment, supplies, labor and fuel we need to operate our business, |
- | availability of generating capacity and the performance of our generating plants, |
- | changes in regulation of nuclear generating facilities and nuclear materials and fuel, including possible shutdown or required modification of nuclear generating facilities, |
- | additional regulation due to Nuclear Regulatory Commission (NRC) oversight to ensure the safe operation of Wolf Creek, either related to Wolf Creek’s performance, or potentially relating to events or performance at a nuclear plant anywhere in the world, |
- | uncertainty regarding the establishment of interim or permanent sites for spent nuclear fuel storage and disposal, |
- | homeland and information and operating systems security considerations, |
- | our inability to fully utilize expected tax credits, |
- | changes in accounting requirements and other accounting matters, |
- | changes in the energy markets in which we participate and the effect of the retroactive repricing of transactions in such markets following execution because of changes or adjustments in market pricing mechanisms by regional transmission organizations (RTOs) and independent system operators, |
5
- | reduced demand for coal-based energy because of actual or potential climate impacts and the development of alternate energy sources, |
- | current and future litigation, regulatory investigations, proceedings or inquiries, |
- | cost of fuel used in generation and wholesale electricity prices, |
- | certain risks and uncertainties associated with the merger, including, without limitation, those related to: |
- | the timing of, and the conditions imposed by, regulatory approvals required for the merger, |
- | the occurrence of any event, change or other circumstances that could give rise to the termination of the merger agreement or could otherwise cause the failure of the merger to close, |
- | the failure of Great Plains Energy to obtain all financing necessary to complete the merger, |
- | the outcome of any legal proceedings, regulatory proceedings or enforcement matters that have been or may be instituted in connection with the merger, |
- | the receipt of an unsolicited offer from another party to acquire our assets or capital stock (or those of Great Plains Energy) that could interfere with the proposed merger, |
- | the timing to consummate the proposed transaction, |
- | disruption from the proposed transaction making it more difficult to maintain relationships with customers, employees, regulators or suppliers, |
- | the diversion of management time and attention on the transaction, |
- | the amount of costs, fees, expenses and charges related to the merger, and |
- | the effect and timing of changes in laws or in governmental regulations (including environmental laws and regulations) that could adversely affect our participation in the merger, and |
- | other factors discussed elsewhere in this report, including in “Item 1A. Risk Factors” and “Item 7. Management’s Discussion and Analysis of Financial Condition and Results of Operations,” and in other reports we file from time to time with the Securities and Exchange Commission (SEC), including the proxy statement and other materials that we have filed or will file with the SEC in connection with the merger. |
These lists are not all-inclusive because it is not possible to predict all factors. This report should be read in its entirety and in conjunction with the other reports we file from time to time with the SEC. No one section of this report deals with all aspects of the subject matter and additional information on some matters that could impact our consolidated financial results may be included in the other reports we file from time to time with the SEC. The reader should not place undue reliance on any forward-looking statement, as forward-looking statements speak only as of the date such statements were made. We undertake no obligation to update any forward-looking statement to reflect events or circumstances after the date on which such statement was made.
6
PART I
ITEM 1. BUSINESS
GENERAL
Overview
We are the largest electric utility in Kansas. Unless the context otherwise indicates, all references in this Annual Report on Form 10-K to “the Company,” “we,” “us,” “our” and similar words are to Westar Energy, Inc. and its consolidated subsidiaries. The term “Westar Energy” refers to Westar Energy, Inc., a Kansas corporation incorporated in 1924, alone and not together with its consolidated subsidiaries.
We provide electric generation, transmission and distribution services to approximately 704,000 customers in Kansas. Westar Energy provides these services in central and northeastern Kansas, including the cities of Topeka, Lawrence, Manhattan, Salina and Hutchinson. Kansas Gas and Electric Company (KGE), Westar Energy’s wholly-owned subsidiary, provides these services in south-central and southeastern Kansas, including the city of Wichita. Both Westar Energy and KGE conduct business using the name Westar Energy. Our corporate headquarters is located at 818 South Kansas Avenue, Topeka, Kansas 66612.
Strategy
We expect to continue operating as a vertically integrated, regulated electric utility. Significant elements of our strategy include maintaining a flexible, clean and diverse energy supply portfolio. In doing so, we continue to expand renewable generation, build and upgrade our energy infrastructure and develop systems and programs with regard to how our customers use energy and interact with us. In addition, we have entered into an agreement and plan of merger with Great Plains Energy pursuant to which, at closing, we would become a wholly-owned subsidiary of Great Plains Energy. The closing of the merger is subject to customary closing conditions, including receipt of regulatory approvals. See “Item 1A. Risk Factors” and Note 3 of the Notes to Consolidated Financial Statements, “Pending Merger,” for additional information.
OPERATIONS
General
As noted above, we supply electric energy at retail to customers in Kansas. We also supply electric energy at wholesale to municipalities and electric cooperatives in Kansas, and have contracts for the sale or purchase of wholesale electricity with other utilities.
Following is the percentage of our revenues by customer classification. Classification of customers as residential, commercial and industrial requires judgment and our classifications may be different from other companies. Assignment of tariffs is not dependent on classification.
Year Ended December 31, | |||||||||
2016 | 2015 | 2014 | |||||||
Residential | 33 | % | 31 | % | 31 | % | |||
Commercial | 29 | % | 29 | % | 28 | % | |||
Industrial | 16 | % | 16 | % | 16 | % | |||
Wholesale | 12 | % | 13 | % | 15 | % | |||
Transmission | 9 | % | 10 | % | 9 | % | |||
Other | 1 | % | 1 | % | 1 | % | |||
Total | 100 | % | 100 | % | 100 | % | |||
7
The percentage of our retail electricity sales by customer class was as follows:
Year Ended December 31, | |||||||||
2016 | 2015 | 2014 | |||||||
Residential | 33 | % | 33 | % | 34 | % | |||
Commercial | 39 | % | 39 | % | 38 | % | |||
Industrial | 28 | % | 28 | % | 28 | % | |||
Total | 100 | % | 100 | % | 100 | % | |||
Generating Capability and Firm Capacity Purchases
We have 6,292 megawatts (MW) of generating capability in service. See “Item 2. Properties” for additional information about our generating units. Further, we purchase electricity pursuant to long-term contracts from renewable generation facilities with an installed design capacity of 1,231 MW. Our generating capability and net generation by source as of December 31, 2016, are summarized below.
Source | Capability (MW) | Percent of Total Capability | Net Generation (MWh) | Percent of Total Net Generation | ||||||||
Coal | 3,235 | 43 | % | 15,902,924 | 63 | % | ||||||
Nuclear | 551 | 7 | % | 3,875,637 | 16 | % | ||||||
Natural gas/diesel | 2,357 | 32 | % | 1,724,276 | 7 | % | ||||||
Renewable (a) | 1,380 | 18 | % | 3,448,091 | 14 | % | ||||||
Total | 7,523 | 100 | % | 24,950,928 | 100 | % | ||||||
_______________
(a) | Due to the intermittent nature of wind generation, 191 MW of net accredited generating capacity is associated with our wind generation facilities. |
In March 2017, we expect to complete construction and start operation of Western Plains Wind Farm, a wind generating facility with a designed installed capability of 281 MW.
Our aggregate 2016 peak system net load of 5,184 MW occurred in July 2016. Our net accredited generating capacity, combined with firm capacity purchases and sales and potentially interruptible load, provided a capacity margin of 17% above system peak responsibility at the time of our 2016 peak system net load, which satisfied Southwest Power Pool, Inc. (SPP) planning requirements.
Under wholesale agreements, we provide firm generating capacity to other entities as set forth below.
Utility (a) | Capacity (MW) | Expiration | |||
Midwest Energy, Inc. | 120 | May 2017 | |||
Midwest Energy, Inc. | 35 | May 2017 | |||
Mid-Kansas Electric Company, LLC | 172 | January 2019 | |||
Midwest Energy, Inc. (b) | 115 | May 2022 | |||
Kansas Power Pool | 59 | December 2022 | |||
Midwest Energy, Inc. | 150 | May 2025 | |||
Total | 651 | ||||
_______________
(a) | Under a wholesale agreement that expires in May 2039, we provide base load capacity to the city of McPherson, Kansas, and in return the city provides peaking capacity to us. During 2016, we provided approximately 90 MW to, and received approximately 147 MW from, the city. The amount of base load capacity provided to the city is based on a fixed percentage of its annual peak system load. The city is a full requirements customer of Westar Energy. The agreement for the city to provide capacity to us is treated as a capital lease. |
(b) | Effective June 2017. |
8
Fuel Matters
The effectiveness of a fuel to produce heat is measured in British thermal units (Btu). The higher the Btu content of a fuel, the smaller the volume of fuel that is required to produce a given amount of electricity. We measure the quantity of heat consumed during the generation of electricity in millions of British thermal units (MMBtu).
The table below provides our weighted average cost of fuel, including transportation costs.
2016 | 2015 | 2014 | |||||||||
Per MMBtu: | |||||||||||
Nuclear | $ | 0.68 | $ | 0.66 | $ | 0.66 | |||||
Coal | 1.80 | 1.77 | 1.80 | ||||||||
Natural gas | 3.24 | 3.64 | 5.71 | ||||||||
Diesel | 11.51 | 15.55 | 21.31 | ||||||||
All generating stations | 1.76 | 1.74 | 1.90 | ||||||||
Per MWh Generation: | |||||||||||
Nuclear | $ | 6.91 | $ | 6.72 | $ | 6.79 | |||||
Coal | 19.71 | 19.78 | 20.04 | ||||||||
Natural gas/diesel | 31.80 | 37.16 | 62.84 | ||||||||
All generating stations | 18.37 | 18.44 | 20.27 | ||||||||
Our wind production, which produced 14% of our total generation, has no associated fuel costs and is, therefore, not included in the table above.
Fossil Fuel Generation
Coal
Jeffrey Energy Center (JEC): The three coal-fired units at JEC have an aggregate capacity of 2,178 MW, of which we own or consolidate through a variable interest entity (VIE) a combined 92% share, or 2,004 MW. We have a long-term coal supply contract with Alpha Natural Resources, Inc. to supply coal to JEC from surface mines located in the Powder River Basin (PRB) in Wyoming. The contract contains a schedule of minimum annual MMBtu quantities or assesses a charge to the extent the minimum quantities are not achieved. All of the coal used at JEC is purchased under this contract, which expires December 31, 2020. The contract provides for price escalation based on certain costs of production. The price for quantities purchased in excess of the scheduled annual minimum is subject to renegotiation every five years to provide an adjusted price for the ensuing five years that reflects the market prices at the time of renegotiation. The most recent price adjustment was effective January 1, 2013.
The BNSF Railway Company (BNSF) and Union Pacific Railroad Company transport coal to JEC under a long-term rail transportation contract. The contract term continues through December 31, 2020, at which time we plan to enter into a new contract. The contract provides for minimum annual deliveries or assesses a charge to the extent the minimum deliveries are not achieved. The contract price is subject to price escalation based on certain costs incurred by the railroads.
La Cygne Generating Station (La Cygne): The two coal-fired units at La Cygne have an aggregate generating capacity of 1,384 MW. Our share of the units is 50%, or 692 MW, of which we either own directly or consolidate through a VIE. La Cygne uses primarily PRB coal but one of the two units also uses a small portion of locally-mined coal. The operator of La Cygne, Kansas City Power & Light Company (KCPL), arranges coal purchases and transportation services for La Cygne. Approximately 100% and 30% of La Cygne’s PRB coal requirements are under contract for 2017 and 2018, respectively. About 90% and 100% of those commitments under contract are fixed price for 2017 and 2018, respectively. As the PRB coal contracts expire, we anticipate that KCPL will negotiate new supply contracts or purchase coal on the spot market.
All of the La Cygne PRB coal is transported under KCPL’s rail transportation agreements with BNSF through 2018 and Kansas City Southern Railroad through 2020. These contracts provide for minimum annual deliveries or assess a charge to the extent the minimum deliveries are not achieved.
9
Lawrence and Tecumseh Energy Centers: Lawrence and Tecumseh Energy Centers have an aggregate generating capacity of 539 MW. We purchase PRB coal for these energy centers under a contract with Arch Coal, Inc. that provides for 100% of the coal requirements for these facilities through 2017. The contract provides for minimum annual deliveries or assesses a charge to the extent the minimum deliveries are not achieved. BNSF transports coal for these energy centers under a contract that expires in December 2020.
Natural Gas
We use natural gas as a primary fuel at our Gordon Evans, Murray Gill, Hutchinson, Spring Creek and Emporia Energy Centers and at the State Line facility. We can also use natural gas as a supplemental fuel in the coal-fired units at Lawrence and Tecumseh Energy Centers. Natural gas accounted for approximately 7% of the total MMBtu of fuel we consumed and approximately 14% of our total fuel expense in 2016. From time to time, we may enter into contracts, including the use of derivatives, in an effort to manage the cost of natural gas. For additional information about our exposure to commodity price risks, see “Item 7A. Quantitative and Qualitative Disclosures About Market Risk.”
We maintain a natural gas transportation arrangement for Hutchinson Energy Center with Kansas Gas Service. The agreement has historically expired on April 30 of each year and is renegotiated for an additional one-year term. We meet a portion of our natural gas transportation requirements for Gordon Evans, Murray Gill, Lawrence, Tecumseh and Emporia Energy Centers through firm natural gas transportation capacity agreements with Southern Star Central Gas Pipeline (SSCGP). We meet all of the natural gas transportation requirements for the State Line facility through a firm transportation agreement with SSCGP. The firm transportation agreement that serves Gordon Evans and Murray Gill Energy Centers expires in April 2020, and the agreement for Lawrence and Tecumseh Energy Centers expires in April 2030. The agreement for the State Line facility extends through October 2022, while the agreement for Emporia Energy Center is in place until December 2028, and is renewable for five-year terms thereafter. We meet all of the natural gas transportation requirements for Spring Creek Energy Center through an interruptible month-to-month transportation agreement with ONEOK Gas Transportation, LLC.
Diesel
We use diesel to start some of our coal generating stations, as a primary fuel in the Hutchinson No. 4 combustion turbine and in our diesel generators. We purchase No. 2 diesel in the spot market. We maintain quantities in inventory that we believe will allow us to facilitate economic dispatch of power and satisfy emergency requirements. We do not use significant amounts of diesel in our operations.
Nuclear Generation
General
Wolf Creek is a 1,172 MW nuclear power plant located near Burlington, Kansas. KGE owns a 47% interest in Wolf Creek, or 551 MW. Wolf Creek’s operating license, issued by the NRC, is effective until 2045. Wolf Creek Nuclear Operating Corporation, an operating company owned by each of the plant’s owners in proportion to their ownership share of the plant, operates the plant. The plant’s owners pay operating costs proportionate to their respective ownership share.
Fuel Supply
Wolf Creek has on hand or under contract all of the uranium and conversion services needed to operate through March 2027. The owners also have under contract 97% of the uranium enrichment and all of the fabrication services required to operate Wolf Creek through March 2027 and September 2025, respectively. All such agreements have been entered into in the ordinary course of business.
Operations and Regulation
Plant performance, including extended or unscheduled shutdowns of Wolf Creek, could cause us to purchase replacement power, rely more heavily on our other generating units and/or reduce amounts of power available for us to sell in the wholesale market. Plant performance also affects the degree of regulatory oversight and related costs.
10
Wolf Creek normally operates on an 18-month planned refueling and maintenance outage schedule. As authorized by our regulators, incremental maintenance costs of planned refueling and maintenance outages are deferred and amortized ratably over the period between planned refueling and maintenance outages. In the fall of 2016, Wolf Creek underwent a planned refueling and maintenance outage. Our share of the outage costs was approximately $24.2 million. The next refueling and maintenance outage is planned for the spring of 2018.
The NRC evaluates, monitors and rates various inspection findings and performance indicators for Wolf Creek based on safety significance. Although not expected, the NRC could impose an unscheduled plant shutdown due to security or safety concerns. Those concerns need not be related to Wolf Creek specifically, but could be due to concerns about nuclear power generally or circumstances at other nuclear plants in which we have no ownership.
See Note 14 of the Notes to Consolidated Financial Statements, “Commitments and Contingencies,” for additional information regarding our nuclear operations.
Wind Generation
Wind is our primary source of renewable energy. As of December 31, 2016, we owned approximately 149 MW of designed installed wind capability and had under contract the purchase of wind energy produced from approximately 1,225 MW of designed installed wind capability. In March 2017, we expect to complete construction and start operation of Western Plains Wind Farm, a wind generating facility with a designed installed capability of 281 MW.
Purchased Power
In addition to generating electricity, we also purchase power. Factors that cause us to purchase power include contractual arrangements, planned and unscheduled outages at our generating plants, favorable wholesale energy prices compared to our costs of production, weather conditions and other factors. In 2016, purchased power comprised approximately 32% of our total fuel and purchased power expense. Our weighted average cost of purchased power per Megawatt hour (MWh) was $24.82 in 2016, $27.28 in 2015 and $37.26 in 2014.
Transmission
Regional Transmission Organization
The Federal Energy Regulatory Commission (FERC) requires owners of regulated transmission assets to allow third parties nondiscriminatory access to their transmission systems. We are a member of the SPP RTO and transferred the functional control of our transmission system, including the approval of transmission service, to the SPP. The SPP coordinates the operation of our transmission system within an interconnected transmission system that covers all or portions of 14 states. The SPP collects revenues for the use of each transmission owner’s transmission system. Transmission customers transmit power purchased and generated for sale or bought for resale in the wholesale market throughout the entire SPP system. Transmission capacity is sold on a first come/first served non-discriminatory basis. All transmission customers are charged rates applicable to the transmission system in the zone where energy is delivered, including transmission customers that may sell power inside our certificated service territory. The SPP then distributes as revenue to transmission owners the amounts it collects from transmission users less an amount it retains to cover administrative expenses.
Southwest Power Pool Integrated Marketplace
We participate in the SPP Integrated Marketplace (IM), which is similar to organized power markets currently operating in other RTOs. The IM impacts how we commit and sell the output from our generation facilities and buy power to meet the needs of our customers. The SPP has the authority to start and stop generating units participating in the market and selects the lowest cost resource mix to meet the needs of the various SPP customers while ensuring reliable operations of the transmission system.
Transmission Investments
We own a 50% interest in Prairie Wind Transmission, LLC (Prairie Wind), which is a joint venture between us and Electric Transmission America, LLC, which itself is a joint venture between affiliates of American Electric Power Company, Inc. and Berkshire Hathaway Energy Company. In 2014, Prairie Wind completed construction on, and energized, a 108-mile 345 kV double-circuit transmission line that is now being used to provide transmission service in the SPP.
11
In 2011, the FERC issued Order No. 1000, which revised the FERC’s existing regulations governing the process for planning enhancements and expansions of the electric transmission grid, along with the corresponding process for allocating the costs of such expansions. Among other things, Order No. 1000 sets forth a framework pursuant to which certain transmission projects that are approved by the RTOs become subject to a competitive bidding process whereby qualified entities can build and own the transmission facilities, even if the entities are not located in the service territory covered by the transmission facilities. This process is complicated, and is governed by Order No. 1000 and the tariff each RTO has with the FERC. In addition, notwithstanding the competitive processes created by Order No. 1000, incumbent utilities maintain a right of first refusal for certain transmission projects, depending on, among other things, the date by which the projects must be completed, the size of the projects and whether the incumbent utilities have pre-existing facilities that are being impacted by the projects.
We are participating in transmission planning activities and implementation of Order No. 1000 in areas where we believe it makes sense to do so. We believe we have opportunities to develop transmission infrastructure, including projects pursuant to which we, as the incumbent, have a right of first refusal and those projects that are subject to the Order No. 1000 competitive processes. However, due in part to the long-term nature of transmission planning activities, the uncertainty surrounding the implementation of the Clean Power Plan (CPP) and its impact on the region’s generating fleet and the infancy of implementation of Order No. 1000, we are unable to predict the impact of Order No. 1000. Accordingly, in our forecasted capital expenditure table, there are no dollars of investment associated with Order No. 1000 projects. In addition, the merger will change the manner and extent to which we continue to participate in the Order No. 1000 process.
Regulation and Our Prices
Kansas law gives the Kansas Corporation Commission (KCC) general regulatory authority over our retail prices, extensions and abandonments of service and facilities, the classification of accounts, the issuance of some securities and various other matters. We are also subject to the jurisdiction of FERC, which has authority over wholesale electricity sales, including prices, the transmission of electric power and the issuance of some securities. We are subject to the jurisdiction of the NRC for nuclear plant operations and safety. Regulatory authorities have established various methods permitting adjustments to our prices for the recovery of costs. For portions of our cost of service, regulators allow us to adjust our prices periodically through the application of a formula that tracks changes in our costs, which reduces the time between making expenditures or investments and reflecting them in the prices we charge customers. However, for the remaining portions of our cost of service, we must file a general rate review, which lengthens the period of time between when we make and recover expenditures and a return on our investments. See Note 4 of the Notes to Consolidated Financial Statements, “Rate Matters and Regulation,” for information regarding our rate proceedings with the KCC and FERC.
Environmental Matters
We are subject to various federal, state and local environmental laws and regulations. Environmental laws and regulations affecting our operations are overlapping, complex, subject to changes, have become more stringent over time and are expensive to implement. Such laws and regulations relate primarily to air quality, water quality, the use of water and the handling, disposal and clean-up of hazardous and non-hazardous substances and wastes, including coal combustion residuals (CCRs). These laws and regulations oftentimes require a lengthy and complex process for obtaining licenses, permits and approvals from governmental agencies for new, existing or modified facilities. If we fail to comply with such laws, regulations and permits, or fail to obtain and maintain necessary permits, we could be fined or otherwise sanctioned by regulators, and such fines or the cost of sanctions may not be recoverable in our prices. We have incurred and will continue to incur capital and other expenditures to comply with environmental laws and regulations.
See “Item 1A. Risk Factors” and Notes 4 and 14 of the Notes to Consolidated Financial Statements, “Rate Matters and Regulation - KCC Proceedings - Environmental Costs” and “Commitments and Contingencies - Environmental Matters,” respectively, for more information regarding environmental trends, risks and laws and regulations.
Safety and Health Regulation
The safety and health of our employees is vital to our business. We are subject to a number of federal and state laws and regulations, including the Occupational Safety and Health Act of 1970. We have measures in place to promote the safety and health of our employees and to monitor our compliance with such laws and regulations.
12
Information Technology
We rely upon information technology networks and systems to process, transmit and store electronic information, and to manage or support a variety of business processes and activities, including the generation, transmission and distribution of electricity, supply chain functions and the invoicing and collection of payments from our customers. These networks and systems are in some cases owned or managed by third-party service providers. Cybersecurity breaches, criminal activity, terrorist attacks and other disruptions to our information technology infrastructure, including infrastructure owned by third-parties we utilize, could interfere with our operations, could expose us or our customers or employees to a risk of loss and could expose us to liability or regulatory penalties or cause us reputational damage or other harm to our business. We have taken measures to secure our network and systems, but such measures may not be sufficient, especially due to the increasing sophistication of cyberattacks. See “Item 1A. Risk Factors” for additional information.
SEASONALITY
Our electricity sales and revenues are seasonal, with the third quarter typically accounting for the greatest of each. Our electricity sales are impacted by weather conditions, the economy of our service territory and other factors affecting customers’ demand for electricity.
EMPLOYEES
As of February 15, 2017, we had 2,254 employees, 1,157 of which were covered by a contract with Locals 304 and 1523 of the International Brotherhood of Electrical Workers that extends through June 30, 2018.
ACCESS TO COMPANY INFORMATION
Our Annual Reports on Form 10-K, Quarterly Reports on Form 10-Q and Current Reports on Form 8-K are available free of charge either on our Internet website at www.westarenergy.com or through requests addressed to our investor relations department. These reports are available as soon as reasonably practicable after such material is electronically filed with, or furnished to, the SEC. The information contained on our Internet website is not part of this document.
13
EXECUTIVE OFFICERS OF THE COMPANY
Name | Age | Present Office | Other Offices or Positions Held During the Past Five Years | ||||
Mark A. Ruelle | 55 | Director, President and Chief Executive Officer (since August 2011) | |||||
Bruce A. Akin | 52 | Senior Vice President, Power Delivery (since January 2015) | Westar Energy, Inc. Vice President, Power Delivery (February 2012 to December 2014) Vice President, Operations Strategy and Support (July 2007 to February 2012) | ||||
Jerl L. Banning | 56 | Senior Vice President, Operations Support and Administration (since January 2015) | Westar Energy, Inc. Vice President, Human Resources and IT (January 2014 to December 2014) Vice President, Human Resources (February 2010 to December 2013) | ||||
John T. Bridson | 47 | Senior Vice President, Generation and Marketing (since January 2015) | Westar Energy, Inc. Vice President, Generation (February 2011 to December 2014) | ||||
Gregory A. Greenwood | 51 | Senior Vice President, Strategy (since August 2011) | |||||
Anthony D. Somma | 53 | Senior Vice President, Chief Financial Officer and Treasurer (since August 2011) | |||||
Larry D. Irick | 60 | Vice President, General Counsel and Corporate Secretary (since February 2003) | |||||
Kevin L. Kongs | 54 | Vice President, Controller (since November 2013) | Westar Energy, Inc. Assistant Controller (October 2006 to November 2013) | ||||
Executive officers serve at the pleasure of the board of directors. There are no family relationships among any of the executive officers, nor any arrangements or understandings between any executive officer and other persons pursuant to which he was appointed as an executive officer.
14
ITEM 1A. RISK FACTORS
We operate in market and regulatory environments that involve significant risks, many of which are beyond our control. In addition to other information in this Form 10-K, including “Item 1. Business” and “Item 7. Management’s Discussion and Analysis of Financial Condition and Results of Operations,” and in other documents we file with the SEC from time to time, the following factors may affect our results of operations, our cash flows and the value of our equity and debt securities. These factors may cause results to differ materially from those expressed in any forward-looking statements made by us or on our behalf. The factors listed below are not intended to be an exhaustive discussion of all such risks, and the statements below must be read together with factors discussed elsewhere in this document and in our other filings with the SEC.
Risks Relating to our Business
Weather conditions, including mild and severe weather, may adversely impact our consolidated financial results.
Weather conditions directly influence the demand for electricity. Our customers use electricity for heating in winter months and cooling in summer months. Because of air conditioning demand, typically we produce our highest revenues in the third quarter. Milder temperatures reduce demand for electricity and have a corresponding impact on our revenues. Unusually mild weather in the future could adversely affect our consolidated financial results.
In addition, severe weather conditions can produce storms that can inflict extensive damage to our equipment and facilities, which can require us to incur additional operating and maintenance expense and additional capital expenditures. Our prices may not always be adjusted timely or adequately to reflect these higher costs. Additionally, because many of our power plants use water for cooling, persistent or severe drought conditions could result in limited power production. High water conditions can also impair planned deliveries of fuel to our plants.
Our prices are subject to regulatory review and may not prove adequate to recover our costs and provide a fair return.
We must obtain from state and federal regulators the authority to establish terms and prices for our services. The KCC and, for most of our wholesale customers, FERC, use a cost-of-service approach that takes into account operating expenses, fixed obligations and recovery of and return on capital investments. Using this approach, the KCC and FERC set prices at levels calculated to recover such costs and a permitted return on investment. Except for wholesale transactions for which the price is not so regulated, and except to the extent the KCC and FERC permit us to modify our prices through the application of a formula that tracks changes in certain of our costs, our prices generally remain fixed until changed following a rate review. Further, the adjustments may be modified, limited or eliminated by regulatory or legislative actions. We may apply to change our prices or intervening parties may request that our prices be reviewed for possible adjustment.
Rate proceedings through which our prices and terms of service are determined typically involve numerous parties including electricity consumers, consumer advocates and governmental entities, some of whom take positions that are adverse to us. In addition, regulators’ decisions may be appealed to the courts by us or other parties to the proceedings. These factors may lead to uncertainty and delays in obtaining or implementing changes to our prices or terms of service. There can be no assurance that our regulators will find all of our costs to have been prudently incurred. A finding that costs have been imprudently incurred can lead to disallowance of recovery for those costs. Further, the prices approved by the applicable regulatory body may not be sufficient for us to recover our costs and to provide for an adequate return on and of capital investments.
We cannot predict the outcome of any rate review or the actions of our regulators. The outcome of rate proceedings, or delays in implementing price changes to reflect changes in our costs, could have a material effect on our consolidated financial results.
15
Our costs of compliance with environmental laws and regulations, including those relating to GHG emissions, are significant, and the future costs of compliance with environmental laws and regulations could adversely impact our operations and consolidated financial results.
We are subject to extensive federal, state and local environmental laws and regulations relating to air quality, water quality, the use of water, the handling, disposal and clean-up of hazardous and non-hazardous substances and wastes, natural resources and health and safety. Compliance with these legal requirements, which change frequently and have tended to become more restrictive, requires us to commit significant capital and operating resources toward permitting, emission fees, environmental monitoring, installation and operation of air and water quality control equipment and purchases of air emission allowances and/or offsets. These laws and regulations oftentimes require a lengthy and complex process for obtaining licenses, permits and approvals from governmental agencies for new, existing or modified facilities. If we fail to comply with such laws, regulations and permits, or fail to obtain and maintain necessary permits, we could be fined or otherwise sanctioned by regulators, and such fines or the cost of sanctions may not be recoverable in our prices.
Costs of compliance with environmental laws and regulations or fines or penalties resulting from non-compliance, if not recovered in our prices, could adversely impact our operations and/or consolidated financial results, especially if emission and/or discharge limits are tightened, more extensive permitting requirements are imposed, additional substances become regulated or the number and types of assets we operate increases. We cannot estimate our compliance costs or any possible fines or penalties with certainty, or the degree to which such costs might be recovered in our prices, due to our inability to predict the requirements and timing of implementation of environmental rules or regulations. See “Item 1. Business - Environmental Matters,” “Item 7. Management’s Discussion and Analysis of Financial Condition and Results of Operations - Executive Summary - Current Trends and Uncertainties - Environmental Regulation” and Notes 4 and 14 of the Notes to Consolidated Financial Statements, “Rate Matters and Regulation - KCC Proceedings - Environmental Costs” and “Commitments and Contingencies - Environmental Matters,” respectively, for additional information. In addition, compliance with environmental laws and regulations could alter the manner in which we had planned to manage our assets, which in turn could require us to retire assets earlier than expected or record asset retirement obligations (AROs).
In addition, we combust large amounts of fossil fuels as we produce electricity. This results in significant emissions of carbon dioxide (CO2) and other GHGs through the operation of our power plants. Federal legislation regulates the emission of GHGs and numerous states and regions have adopted programs to stabilize or reduce GHG emissions. The Environmental Protection Agency (EPA) regulates GHGs under the Clean Air Act. In October 2015, the EPA published a rule establishing new source performance standards that limit CO2 emissions for new, modified and reconstructed coal and natural gas fueled electric generating units to various levels per MWh depending on various characteristics of the units. In October 2015, the EPA also published a rule establishing guidelines for states to regulate CO2 emissions from existing power plants. The standards for existing plants are known as the CPP. Under the CPP, interim emissions performance rates must be achieved beginning in 2022 and final emissions performance rates must be achieved by 2030. Legal challenges to the CPP were filed by groups of states and industry members, including us, and in February 2016 the U.S. Supreme Court temporarily stayed implementation of the CPP. See Note 14 of the Notes to Consolidated Financial Statements, “Commitments and Contingencies - Environmental Matters” for additional information. We believe these rules, if implemented, could have a material impact on our operations and consolidated financial results.
Further, in the course of operating our coal generation plants, we produce CCRs, including fly ash, gypsum and bottom ash, which we must handle, recycle, process or dispose of. We historically have recycled some of our ash production, principally by selling to the aggregate industry. The EPA published a rule to regulate CCRs in April 2015, which will require additional CCR handling, processing and storage equipment and potential closure of certain ash disposal areas. We have recorded, and may need to record additional AROs, in connection with the rule. See Note 14 of the Notes to Consolidated Financial Statements, “Commitments and Contingencies - Environmental Matters” for additional information. The impact of this rule on our operations and consolidated financial results could be material.
We could be subject to penalties as a result of mandatory reliability standards, which could adversely affect our consolidated financial results.
As a result of the Energy Policy Act of 2005, owners and operators of the bulk power transmission system, including Westar Energy and KGE, are subject to mandatory reliability standards promulgated by the North American Electric Reliability Corporation and enforced by FERC. If we were found to be out of compliance with the mandatory reliability standards, we could be subject to sanctions, including substantial monetary penalties, which we might not be able to recover in the prices we charge our customers. This could have a material adverse effect on our consolidated financial results.
16
Adverse economic conditions could adversely impact our operations and consolidated financial results.
Our operations are impacted by economic conditions. Adverse economic conditions, including a prolonged recession, no or low economic growth or capital market disruptions, may:
• | reduce demand for our service; |
• | increase delinquencies or non-payment by customers; |
• | adversely impact the financial condition of suppliers, which may in turn limit our access to inventory, including coal and natural gas, or capital equipment or increase our costs; and |
• | increase deductibles and premiums and result in more restrictive policy terms under insurance policies regarding risks we typically insure against, or make insurance claims more difficult to collect. |
A number of commercial and industrial customers have geographically dispersed facilities, and localized factors, including economic conditions, governmental or other incentives and other factors that influence customer operating or capital expenses, which may cause these customers to curtail or eliminate operations at facilities in our service territory and move them to other facilities with competitive advantages. In addition, unexpectedly strong economic conditions can result in increased costs and shortages. Any of the aforementioned events, and others we may not be able to identify, could have an adverse impact on our consolidated financial results.
We are exposed to various risks associated with the ownership and operation of Wolf Creek, any of which could adversely impact our consolidated financial results.
Through KGE’s ownership interest in Wolf Creek, we are subject to the risks of nuclear generation, which include:
• | the risks associated with storing, handling and disposing of radioactive materials and the current lack of a long-term off-site disposal solution for radioactive materials; |
• | limitations on the amounts and types of insurance commercially available to cover losses that might arise in connection with nuclear operations; |
• | uncertainties with respect to the technological and financial aspects of decommissioning Wolf Creek at the end of its life; and |
• | costs of measures associated with public safety. |
The NRC has authority to impose licensing and safety-related requirements for the operation of nuclear generation facilities. In the event of non-compliance, the NRC has authority to impose fines or shut down a unit, or both, depending upon its assessment of the severity of the situation, until compliance is achieved. Revised safety requirements enacted by the NRC could necessitate substantial capital expenditures at Wolf Creek.
An incident at Wolf Creek could have a material impact on our consolidated financial results. Furthermore, the non-compliance of other nuclear facilities operators with applicable regulations or the occurrence of a serious nuclear incident at other facilities anywhere in the world could result in increased regulation of the industry or a retrospective premium assessment under our nuclear insurance coverage, both of which could increase Wolf Creek’s costs and impact our consolidated financial results. Such events could also result in a shutdown of Wolf Creek.
Significant decisions about capital investments are based on forecasts of long-term demand for energy incorporating assumptions about multiple, uncertain factors. Our actual experience may differ significantly from our assumptions, which may adversely impact our consolidated financial results.
We attempt to forecast demand to determine the timing and adequacy of our energy and energy delivery resources. Long-term forecasts involve risks because they rely on assumptions we make concerning uncertain factors including weather, technological change, environmental and other regulatory requirements, economic conditions, social pressures and the responsiveness of customers’ electricity demand to conservation measures and prices. Both actual future demand and our ability to satisfy such demand depend on these and other factors and may vary materially from our forecasts. If our actual experience varies significantly from our forecasts, we could be required to record AROs or impairment charges, and our consolidated financial results may be adversely impacted.
17
Our planned capital investment for the next few years is large in relation to our size, subjecting us to significant risks.
Our anticipated capital expenditures for 2017 through 2019 are approximately $2.3 billion. In addition to risks discussed above associated with recovering capital investments through our prices, and risks associated with our reliance on the capital markets and short-term credit to fund those investments, our capital expenditure program poses risks, including, but not necessarily limited to:
• | shortages, disruption in the delivery and inconsistent quality of equipment, materials and labor; |
• | contractor or supplier non-performance; |
• | delays in or failure to receive necessary permits, approvals and other regulatory authorizations; |
• | impacts of new and existing laws and regulations, including environmental and health and safety laws, regulations and permit requirements; |
• | adverse weather; |
• | unforeseen engineering problems or changes in project design or scope; |
• | environmental and geological conditions; and |
• | unanticipated cost increases with respect to labor or materials, including basic commodities needed for our infrastructure such as steel, copper and aluminum. |
These and other factors, or any combination of them, could cause us to defer or limit our capital expenditure program and could adversely impact our consolidated financial results.
Our ability to fund our capital expenditures and meet our working capital and liquidity needs may be limited by conditions in the bank and capital markets, by our credit ratings or the market price of Westar Energy’s common stock. Further, capital market conditions can cause fluctuations in the values of assets set aside for employee benefit obligations and the Wolf Creek nuclear decommissioning trust (NDT) and may increase our funding requirements related to these obligations.
To fund our capital expenditures and for working capital and liquidity, we rely on access to capital markets and to short-term credit. Disruption in capital markets, deterioration in the financial condition of the financial institutions on which we rely, any credit rating downgrade or any decrease in the market price of Westar Energy’s common stock may make capital more difficult and costly for us to obtain, may restrict liquidity available to us, may require us to defer or limit capital investments or impact operations or may reduce the value of our financial assets. These could adversely impact our business and consolidated financial results, including our ability to pay dividends and to make investments or undertake programs necessary to meet regulatory mandates and customer demand.
Further, we have significant future financial obligations with respect to employee benefit obligations and the Wolf Creek NDT. The value of the assets needed to meet those obligations are subject to market fluctuations and will yield uncertain returns, which may fall below our expectations for meeting our obligations. Additionally, inflation and changes in interest rates impact the value of future liabilities. In general, when interest rates decline, the value of future liabilities increase. While the KCC allows us to implement a regulatory accounting mechanism to track certain of our employee benefit plan expenses, this mechanism does not allow us to make automatic price adjustments. Only in future rate proceedings may we be allowed to adjust our prices to reflect changes in our funding requirements. Further, the tracking mechanism for these benefit plan expenses is part of our overall rate structure, and as such, it is subject to KCC review and may be modified, limited or eliminated in the future. If these assets are not managed successfully, our consolidated financial results and cash flows could be adversely impacted.
Physical and cybersecurity breaches, criminal activity, terrorist attacks and other disruptions to our facilities or our information technology infrastructure could interfere with our operations, expose us or our customers or employees to a risk of loss and expose us to liability or regulatory penalties or cause reputational damage and other harm to our business.
We rely upon information technology networks and systems to process, transmit and store electronic information, and to manage or support a variety of business processes and activities, including the generation, transmission and distribution of electricity, supply chain functions, and the invoicing and collection of payments from our customers. We also use information technology networks and systems to record, process and summarize financial information and results of operations for internal reporting purposes and to comply with financial reporting, legal and tax requirements. These networks and systems are in some cases owned or managed by third-party service providers. In the ordinary course of business, we collect, store and transmit sensitive data including operating information, proprietary business information belonging to us and third parties and personal information belonging to our customers and employees.
18
Our information technology networks and infrastructure, as well as the networks and infrastructure belonging to third-party service providers that we utilize, may be vulnerable to damage, disruptions or shutdowns due to attacks or breaches by hackers or other unauthorized third parties; error or malfeasance by one or more of our or our service providers’ employees; software or hardware upgrades; additions or replacements; malicious software code; telecommunication failures; natural disasters or other catastrophic events. The occurrence of any of these events could, among other things, impact the reliability or safety of our generation, transmission and distribution systems; result in the erasure of data or render our equipment unusable; impact our ability to conduct business in the ordinary course; expose us and our customers, employees and vendors to a risk of loss or misuse of information; and result in legal claims or proceedings, liability or regulatory penalties against us, damage our reputation or otherwise harm our business. We can provide no assurance that we will identify and remedy all security or system vulnerabilities or that unauthorized access or error will be identified and remedied.
Additionally, we cannot predict the impact that any future information technology or terrorist attack may have on the energy industry in general. Our facilities could be direct targets or indirect casualties of such attacks. The effects of such attacks could include disruption to our generation, transmission and distribution systems or to the electrical grid in general, and could increase the cost of insurance coverage or result in a decline in the U.S. economy. Any of the foregoing could adversely impact our operations or financial results.
Equipment failures and other events beyond our control may cause extended or unplanned plant outages, which may adversely impact our consolidated financial results.
The generation, distribution and transmission of electricity require the use of expensive and complicated equipment, much of which is aged, and all of which requires significant ongoing maintenance. Our power plants and equipment are subject to extended outages because of equipment failure, weather, transmission system disruption, operator error, contractor or subcontractor failure and other factors. In such events, we must either produce replacement power from our other plants, which may be less efficient or more expensive to operate, purchase power from others at unpredictable and potentially higher costs in order to meet our sales obligations, or suffer outages. Such events could also limit our ability to make sales to customers. Therefore, the occurrence of extended or unplanned outages could adversely affect our consolidated financial results.
We may not be able to fully utilize net operating loss, tax credit or other tax carryforwards, or realize expected production tax credits related to our wind farms, all of which could adversely impact our consolidated financial results and liquidity.
Our income tax obligations have been reduced due to the continued use of bonus depreciation provisions that allow for an acceleration of deductions for tax purposes and recent IRS guidance on tax deductions for repairs. We estimate our ability to use tax benefits, including those in the form of net operating loss, tax credit and other tax carryforwards, that are recorded as deferred tax assets on our balance sheets. A disallowance of these tax benefits resulting from a legislative change or adverse determination by a taxing jurisdiction could have an adverse impact on our consolidated financial results and liquidity. Additionally, changes in corporate income tax rates or policy changes, as well as any inability to generate enough taxable income in the future to use all of our tax benefits before they expire, could have an adverse impact on our consolidated financial results and liquidity.
In addition, we operate wind farms that generate production tax credits for us to use to reduce our federal income tax obligations. The amount of production tax credits we earn is dependent on the level of electricity output generated by our wind farms and the applicable tax credit rate. A variety of operating and economic parameters, including transmission constraints, adverse weather conditions and breakdown or failure of equipment, could significantly reduce the production tax credits generated by our wind farms, which could have an adverse impact on our consolidated financial results.
19
Our regulated business model may be threatened by technological advancements that could adversely affect our financial condition and results of operations.
Significant technological advancements have taken and will continue to take place in the electric industry, including advancements related to self-generation and distributed energy technologies such as fuel cells, micro turbines, wind turbines and solar cells, as well as related to the storage of energy produced by these systems. Adoption of these technologies may increase because of advancements or government subsidies reducing the cost of generating or storing electricity through these technologies to a level that is competitive with our current methods of generating electricity. There is also a perception that generating or storing electricity through these technologies is more environmentally friendly than generating electricity with fossil fuels. Increased adoption of these technologies could reduce electricity demand and the pool of customers from whom fixed costs are recovered, resulting in under recovery of our fixed costs. Increased self-generation and the related use of net energy metering, which allows self-generating customers to receive bill credits for surplus power, could put upward price pressure on our remaining customers. If we were unable to adjust our prices to reflect reduced electricity demand and increased self-generation and net energy metering, our financial condition and results of operations could be adversely affected.
Risks Relating to the Pending Merger
We cannot provide any assurance that the merger will be completed.
The closing of the merger is subject to certain conditions, including, among others, (i) receipt of all required regulatory approvals, including from the FERC, the NRC and the KCC (provided that such approvals do not result in a material adverse effect on Great Plains Energy and its subsidiaries after giving effect to the merger), (ii) the absence of any law or judgment that prevents, makes illegal or prohibits the closing of the merger, (iii) the continued effectiveness of the Great Plains Energy registration statement on Form S-4 that was filed with the SEC, (iv) the absence of any material adverse effect with respect to us and our subsidiaries and (v) subject to certain materiality exceptions, the accuracy of the representations and warranties of, and compliance and covenants by, each of the parties to the merger agreement.
Although we and Great Plains Energy have agreed in the merger agreement to use our reasonable best efforts to take, or cause to be taken, all actions, and do, or cause to be done, and assist and cooperate with the other parties in doing, all things necessary to cause the conditions to the closing of the merger to be satisfied or to effect the closing of the merger as promptly as reasonably practicable, the conditions to the merger may not be satisfied and the merger agreement could be terminated. In addition, satisfying the conditions to the merger may take longer than, and could cost more than, we and Great Plains Energy expect. The occurrence of any of these events individually or in combination may adversely affect the benefits that we and Great Plains Energy expect to achieve from the merger and the trading price of our common stock.
The merger is subject to the receipt of consent or approval from governmental entities that could delay the completion of the merger or impose conditions that could have a material adverse effect on the combined company.
Completion of the merger is conditioned upon receipt of consents, orders, approvals or clearances, as required, from, among others, the FERC, the NRC and the KCC (provided that such approvals do not result in a material adverse effect on Great Plains Energy and its subsidiaries after giving effect to the merger).
On June 28, 2016, we and Great Plains Energy filed a joint application with the KCC requesting approval of the merger. Unless otherwise agreed to by the applicants, Kansas law imposes a 300-day time limit on the KCC’s review of the joint application. On September 27, 2016, KCC issued an order setting a procedural schedule for the application, with a KCC order date of April 24, 2017.
On December 16, 2016, KCC staff and its representatives filed testimony that, among other things, objected to the proposed merger, stated that no changes could be made to the joint application filed by us and Great Plains Energy that would satisfy the KCC staff and recommended that the KCC reject the merger. A number of intervening parties also filed testimony against approval of the merger.
On January 9, 2017, we and Great Plains Energy filed rebuttal testimony in response to KCC staff and the other intervenors explaining why we and Great Plains Energy believe the joint application meets the KCC’s merger standards and why the merger is in the public interest. An evidentiary hearing was held at the KCC from January 30, 2017 to February 7, 2017.
20
In addition, there are two open dockets in Missouri related to the merger. In the first docket, Great Plains Energy sought approval from the Public Service Commission of the State of Missouri (MPSC) to waive certain affiliate transaction rules following the closing of the merger. In this docket, on October 12, 2016, and on October 26, 2016, the MPSC staff and the Office of Public Counsel (OPC), respectively, announced that each had entered into a Stipulation and Agreement with Great Plains Energy that, among other things, provided that MPSC staff and the OPC would not file a complaint, or support another complaint, to assert that the MPSC has jurisdiction over the merger. The Stipulation and Agreements are subject to approval by the MPSC. Regarding the second docket, on October 11, 2016, a consumer group filed complaints against us and Great Plains Energy with the MPSC seeking to have the MPSC assert jurisdiction over the merger, and various parties have intervened in these complaints. The MPSC dismissed the complaint against us on December 6, 2016, but the complaint against Great Plains Energy remains open. On February 16, 2017, the MPSC indicated at a public meeting that it would assert jurisdiction over the merger, and it requested that an order be prepared to assert jurisdiction. Accordingly, we believe Great Plains Energy will also need approval of the MPSC in order to consummate the merger.
On July 11, 2016, we and Great Plains filed a joint application with the FERC requesting approval of the merger. Approval of the merger application requires action by the FERC commissioners because it is a contested application. The Federal Power Act requires a quorum of three or more commissioners to act on a contested application. Following the resignation of the FERC Chairman effective February 3, 2017, the FERC commission is comprised only of two commissioners and is therefore unable to act on the application. A new commissioner must be appointed by the President of the United States, with the advice and consent of the United States Senate, before FERC will be able to act on the application. If the FERC commissioners do not issue an order on the application within 180 days after the application was deemed complete because of the lack of a quorum, approval of the application may be deemed granted by operation of law, unless an order is issued extending the time for review. The FERC staff has authority to issue an order extending the period for review of the application. Under these circumstances, we do not believe it is likely that the FERC staff will allow approval of our application to be deemed granted. We are unable to predict when FERC will regain a quorum or how the change in commissioners will impact the review of the application.
In addition, completion of the merger is conditioned upon the expiration or termination of the waiting period under the Hart-Scott-Rodino Antitrust Improvements Act (HSR Act). We and Great Plains Energy filed the antitrust notifications required under the HSR Act on September 26, 2016, and received early termination of the statutory waiting period under the HSR Act on October 21, 2016. Under the HSR Act, a new statutory waiting period will start one year from the date on which an existing waiting period expires, or October 21, 2017. Accordingly, if the merger has not closed prior to October 21, 2017, we and Great Plains Energy will need to re-file the necessary HSR Act notifications. Although the United States Department of Justice allowed the statutory waiting period under the HSR Act to terminate following our initial HSR Act notification, there can be no assurance that it would do so again, or that it would not impose burdensome terms or conditions on the merger that may prevent the merger from occurring or eliminate the potential benefits of the merger.
A substantial delay in obtaining satisfactory approvals or the imposition of unfavorable terms or conditions in connection with such approvals could adversely affect the business, financial condition or results of operations of us or Great Plains Energy or may result in the termination of the merger agreement. Failure to receive satisfactory approvals may also make any alternative future strategic transaction more challenging, which could in turn negatively impact the price of our common stock.
For additional information on the status of various approvals in connection with the pending merger, see Notes 4 and 14 of the Notes to Consolidated Financial Statements, “Pending Merger” and “Commitments and Contingencies,” respectively.
Failure to complete the merger could negatively affect the trading price of our common stock and our future business and financial results.
Completion of the merger is not assured and is subject to risks. If the merger is not completed, it could negatively affect the trading price of our common stock and our future business and financial results, and could subject us to additional risks, including the following:
• | negative reactions from the financial markets, including declines in the price of our common stock due to the fact that the current price may reflect a market assumption that the merger will be completed; |
• | performance shortfalls and missed opportunities as a result of the diversion of our management’s attention by the merger; and |
• | potential payments by us to Great Plains Energy for damages, or if the merger agreement is terminated under certain circumstances, a termination fee of $280.0 million. |
21
The anticipated benefits of combining the companies may not be realized.
We entered into the merger agreement with the expectation that the merger would result in various benefits, including, among other things, synergies, cost savings and operating efficiencies. However, the achievement of the anticipated benefits of the merger, including the synergies, cannot be assured or may take longer than expected to materialize. In addition, we may not be able to integrate our operations with Great Plains Energy’s existing operations without encountering difficulties, including inconsistencies in standards, systems and controls, and without diverting management’s focus and resources from ordinary business activities and opportunities. Any of the foregoing could have a material adverse effect on the combined company.
We will incur significant transaction and transition costs in connection with the merger.
We and Great Plains Energy expect to incur significant transaction and transition costs in connection with the consummation of the merger and the subsequent integration of the companies. Prior to consummation of the merger, we may also incur additional costs to maintain employee morale and to retain key employees. Great Plains Energy will also incur significant fees and expenses relating to the financing arrangements in connection with the merger. These expenses could reduce or eliminate the savings that we expect to achieve from the merger, and accordingly, any net benefits may not be achieved in the near term or at all. These transaction and transition expenses may result in significant charges taken against earnings by us prior to completion of the merger and by the combined company following the completion of the merger.
We will be subject to business uncertainties and contractual restrictions while the merger is pending, which could adversely affect our business.
Uncertainty about the impact of the merger, including on employees and customers, may have an adverse effect on us and Great Plains Energy and, consequently, on the combined company. These uncertainties may impair our and Great Plains Energy’s ability to attract, retain and motivate personnel, and could cause customers, suppliers and others that deal with us to seek to change existing business relationships with us and/or Great Plains Energy. If employees depart, our business or the combined company’s business could be harmed. In addition, the merger agreement restricts us, without the consent of Great Plains Energy, from taking specified actions until we complete the merger or the merger agreement terminates. These restrictions may prevent us from pursuing otherwise attractive business opportunities and making other changes to our business.
Pending litigation against us and Great Plains Energy may adversely affect the combined company’s business, financial condition or results of operations following the merger.
Following the announcement of the merger agreement, two putative class action lawsuits were filed in the District Court of Shawnee County, Kansas, against Westar Energy, the members of our board of directors and Great Plains Energy, alleging breaches of various fiduciary duties by the members of our board of directors in connection with the proposed merger and alleging that we and Great Plains Energy aided and abetted such alleged breaches of fiduciary duties. A third putative derivative lawsuit was filed in the District Court of Shawnee County, Kansas, against the members of our board of directors, Great Plains Energy and a subsidiary of Great Plains Energy, alleging breaches of various fiduciary duties by members of our board of directors in connection with the proposed merger and alleging that Great Plains Energy and a subsidiary of Great Plains Energy aided and abetted such alleged breaches of fiduciary duties. Among other remedies, the plaintiffs in each case sought to enjoin the merger and rescind the merger agreement, in addition to certain unspecified damages and reimbursement of costs. On September 21, 2016, the parties in the consolidated putative class action and the putative derivative complaint independently agreed to withdraw requests for injunctive relief and otherwise agreed in principle to dismissing the actions with prejudice and to providing releases. In the future the parties will prepare and present to the court for approval Stipulations of Settlement that will, if accepted by the court, settle the actions in their entirety. The outcome of litigation is inherently uncertain. The defense or settlement of any lawsuit or claim that remains unresolved at the time the merger closes may adversely affect the combined company’s business, financial condition or results of operation. See Note 16 of the Notes to Consolidated Financial Statements, “Legal Proceedings,” for additional information.
The exchange of our common stock for Great Plains Energy common stock and cash will be a taxable transaction for U.S. Federal income tax purposes.
The exchange of our common stock for shares of Great Plains Energy common stock and cash will be a taxable transaction for U.S. federal income tax purposes. In general, U.S. shareholders will recognize gain or loss in an amount equal to the difference, if any, between (1) the sum of the fair market value of the Great Plains Energy common stock as of the effective time of the merger and the cash received and (2) such U.S. shareholder’s adjusted tax basis in the Company’s common stock exchanged therefor.
22
ITEM 1B. UNRESOLVED STAFF COMMENTS
None.
23
ITEM 2. PROPERTIES
Unit Capability (MW) By Owner (a) | |||||||||||
Name | Location | Unit No. | Year Installed | Principal Source | Westar Energy | KGE | Total Company Generation | Renewable Purchased Power | Total Generation and Renewable Purchased Power | ||
Renewable Generation: | |||||||||||
Cedar Bluff | Ness & Trego Counties, KS | (a) | 2015 | Wind | — | — | — | 199 | 199 | ||
Central Plains | Wichita County, KS | (a) | 2009 | Wind | 99 | — | 99 | — | 99 | ||
Flat Ridge | Barber County, KS | (a) | 2009 | Wind | 50 | — | 50 | 50 | 100 | ||
Ironwood | Ford County, KS | (a) | 2012 | Wind | — | — | — | 168 | 168 | ||
Kay Wind | Kay County, OK | (a) | 2015 | Wind | — | — | — | 200 | 200 | ||
Kingman II | Kingman County, KS | (a) | 2016 | Wind | — | — | — | 103 | 103 | ||
Meridian Way | Cloud County, KS | (a) | 2008 | Wind | — | — | — | 96 | 96 | ||
Ninnescah | Pratt County, KS | (a) | 2016 | Wind | — | — | — | 208 | 208 | ||
Post Rock | Ellsworth & Lincoln Counties, KS | (a) | 2012 | Wind | — | — | — | 201 | 201 | ||
Rolling Meadows | Shawnee County, KS | 2010 | Landfill Gas | — | — | — | 6 | 6 | |||
Western Plains | Ford County, KS | (a) | (b) | 2017 | Wind | 281 | — | 281 | — | 281 | |
Nuclear: | |||||||||||
Wolf Creek Generating Station (47%): | Burlington, KS | 1 | (c) | 1985 | Uranium | — | 551 | 551 | — | 551 | |
Coal: | |||||||||||
Jeffrey Energy Center (92%): | St. Marys, KS | ||||||||||
Steam Turbines | 1 | (c) | 1978 | Coal | 524 | 146 | 670 | — | 670 | ||
2 | (c) | 1980 | Coal | 528 | 147 | 675 | — | 675 | |||
3 | (c) | 1983 | Coal | 516 | 143 | 659 | — | 659 | |||
La Cygne Station (50%): | La Cygne, KS | ||||||||||
Steam Turbines | 1 | (c) | 1973 | Coal | — | 368 | 368 | — | 368 | ||
2 | (d) | 1977 | Coal | — | 324 | 324 | — | 324 | |||
Lawrence Energy Center: | Lawrence, KS | ||||||||||
Steam Turbines | 4 | 1960 | Coal | 108 | — | 108 | — | 108 | |||
5 | 1971 | Coal | 370 | — | 370 | — | 370 | ||||
Tecumseh Energy Center: | Tecumseh, KS | ||||||||||
Steam Turbines | 7 | 1957 | Coal | 61 | — | 61 | — | 61 | |||
(a) Capability (except for wind generating facilities) represents accredited net generating capacity approved by the SPP. Capability for our wind generating facilities represents the installed design capacity. Due to the intermittent nature of wind generation, these facilities are associated with a total of 205 MW of accredited generating capacity. | |||||||||||
(b) In March 2017, we expect to complete construction and start operation of Western Plains Wind Farm. | |||||||||||
(c) Westar Energy jointly owns State Line (40%) while KGE jointly owns La Cygne unit 1 (50%) and Wolf Creek (47%). We jointly own and consolidate as a VIE 92% of JEC. Unit capacity amounts reflect our ownership and leased percentages only. | |||||||||||
(d) In 1987, KGE entered into a sale-leaseback transaction involving its 50% interest in the La Cygne unit 2. We consolidate the leasing entity as a VIE as discussed in Note 18 of the Notes to Consolidated Financial Statements, “Variable Interest Entities.” | |||||||||||
24
Unit Capability (MW) By Owner (a) | |||||||||||
Name | Location | Unit No. | Year Installed | Principal Source | Westar Energy | KGE | Total Company Generation | Renewable Purchased Power | Total Generation and Renewable Purchased Power | ||
Gas and Diesel: | |||||||||||
Emporia Energy Center: | Emporia, KS | ||||||||||
Combustion Turbines | 1 | 2008 | Gas | 45 | — | 45 | — | 45 | |||
2 | 2008 | Gas | 44 | — | 44 | — | 44 | ||||
3 | 2008 | Gas | 43 | — | 43 | — | 43 | ||||
4 | 2008 | Gas | 44 | — | 44 | — | 44 | ||||
5 | 2008 | Gas | 158 | — | 158 | — | 158 | ||||
6 | 2009 | Gas | 155 | — | 155 | — | 155 | ||||
7 | 2009 | Gas | 156 | — | 156 | — | 156 | ||||
Gordon Evans Energy Center: | Colwich, KS | ||||||||||
Steam Turbines | 1 | 1961 | Gas | — | 154 | 154 | — | 154 | |||
2 | 1967 | Gas | — | 376 | 376 | — | 376 | ||||
Combustion Turbines | 1 | 2000 | Gas | 73 | — | 73 | — | 73 | |||
2 | 2000 | Gas | 71 | — | 71 | — | 71 | ||||
3 | 2001 | Gas | 148 | — | 148 | — | 148 | ||||
Hutchinson Energy Center: | Hutchinson, KS | ||||||||||
Combustion Turbines | 1 | 1974 | Gas | 52 | — | 52 | — | 52 | |||
2 | 1974 | Gas | 55 | — | 55 | — | 55 | ||||
3 | 1974 | Gas | 54 | — | 54 | — | 54 | ||||
4 | 1975 | Diesel | 70 | — | 70 | — | 70 | ||||
Murray Gill Energy Center: | Wichita, KS | ||||||||||
Steam Turbines | 3 | 1956 | Gas | — | 104 | 104 | — | 104 | |||
4 | 1959 | Gas | — | 86 | 86 | — | 86 | ||||
Spring Creek Energy Center: | Edmond, OK | ||||||||||
Combustion Turbines | 1 | 2001 | Gas | 69 | — | 69 | — | 69 | |||
2 | 2001 | Gas | 69 | — | 69 | — | 69 | ||||
3 | 2001 | Gas | 67 | — | 67 | — | 67 | ||||
4 | 2001 | Gas | 68 | — | 68 | — | 68 | ||||
State Line (40%): | Joplin, MO | ||||||||||
Combined Cycle | 2-1 | (c) | 2001 | Gas | 62 | — | 62 | — | 62 | ||
2-2 | (c) | 2001 | Gas | 63 | — | 63 | — | 63 | |||
2-3 | (c) | 2001 | Gas | 71 | — | 71 | — | 71 | |||
Total | 4,174 | 2,399 | 6,573 | 1,231 | 7,804 | ||||||
(a) Capability (except for wind generating facilities) represents accredited net generating capacity approved by the SPP. Capability for our wind generating facilities represents the installed design capacity. Due to the intermittent nature of wind generation, these facilities are associated with a total of 205 MW of accredited generating capacity. | |||||||||||
(b) In March 2017, we expect to complete construction and start operation of Western Plains Wind Farm. | |||||||||||
(c) Westar Energy jointly owns State Line (40%) while KGE jointly owns La Cygne unit 1 (50%) and Wolf Creek (47%). We jointly own and consolidate as a VIE 92% of JEC. Unit capacity amounts reflect our ownership and leased percentages only. | |||||||||||
25
We own and have in service approximately 6,400 miles of transmission lines, approximately 24,000 miles of overhead distribution lines and approximately 5,000 miles of underground distribution lines.
Substantially all of our utility properties are encumbered by first priority mortgages pursuant to which bonds have been issued and are outstanding.
ITEM 3. LEGAL PROCEEDINGS
Information on legal proceedings is set forth in Notes 4, 14 and 16 of the Notes to Consolidated Financial Statements, “Rate Matters and Regulation,” “Commitments and Contingencies” and “Legal Proceedings,” respectively, which are incorporated herein by reference.
ITEM 4. MINE SAFETY DISCLOSURES
Not Applicable.
26
PART II
ITEM 5. MARKET FOR REGISTRANT’S COMMON EQUITY AND RELATED STOCKHOLDER MATTERS
STOCK TRADING
Westar Energy’s common stock is listed on the New York Stock Exchange and traded under the ticker symbol WR. As of February 15, 2017, Westar Energy had 16,325 common shareholders of record. For information regarding quarterly common stock price ranges for 2016 and 2015, see Note 20 of the Notes to Consolidated Financial Statements, “Quarterly Results (Unaudited).”
STOCK PERFORMANCE GRAPH
The following graph compares the performance of Westar Energy’s common stock during the period that began on December 31, 2011, and ended on December 31, 2016, to the performance of the Standard & Poor’s 500 Index (S&P 500) and the Standard & Poor’s Electric Utility Index (S&P Electric Utilities). The graph assumes a $100 investment in Westar Energy’s common stock and in each of the indices at the beginning of the period and a reinvestment of dividends paid on such investments throughout the period.
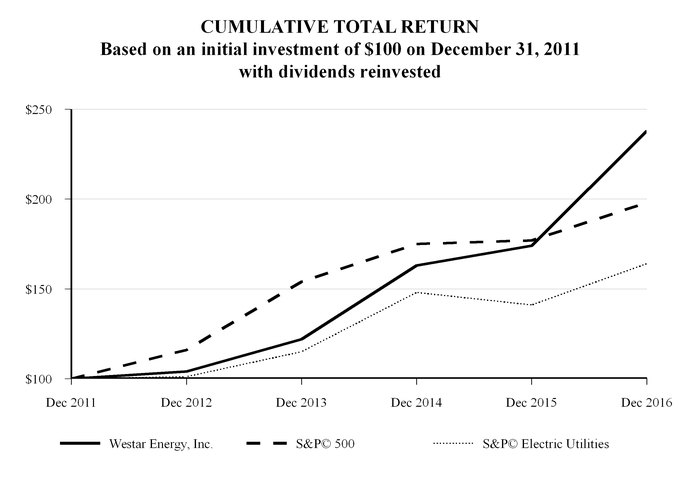
Dec 2011 | Dec 2012 | Dec 2013 | Dec 2014 | Dec 2015 | Dec 2016 | |
Westar Energy, Inc. | $100 | $104 | $122 | $163 | $174 | $238 |
S&P© 500 | $100 | $116 | $154 | $175 | $177 | $198 |
S&P© Electric Utilities | $100 | $101 | $115 | $148 | $141 | $164 |
27
DIVIDENDS
Holders of Westar Energy’s common stock are entitled to dividends when and as declared by Westar Energy’s board of directors.
Quarterly dividends on common stock have historically been paid on or about the first business day of January, April, July and October to shareholders of record as of or about the ninth day of the preceding month. Westar Energy’s board of directors reviews the common stock dividend policy from time to time. Among the factors the board of directors considers in determining Westar Energy’s dividend policy are earnings, cash flows, capitalization ratios, regulation, competition and financial loan covenants. In 2016, Westar Energy’s board of directors declared four quarterly dividends of $0.38 per share, reflecting an annual dividend of $1.52 per share, compared to four quarterly dividends of $0.36 per share in 2015, reflecting an annual dividend of $1.44 per share. On February 22, 2017, Westar Energy’s board of directors declared a quarterly dividend of $0.40 per share payable to shareholders on April 3, 2017. The indicated annual dividend rate is $1.60 per share.
The merger agreement includes certain restrictions and limitations on our ability to declare dividend payments. The merger agreement, without prior approval of Great Plains Energy, limits our quarterly dividends declared in 2017 to $0.40 per share, which represents an annualized increase of $0.08 per share, consistent with last year’s dividend increase.
28
ITEM 6. SELECTED FINANCIAL DATA
Year Ended December 31, | |||||||||||||||||||
2016 | 2015 | 2014 | 2013 | 2012 | |||||||||||||||
(In Thousands) | |||||||||||||||||||
Income Statement Data: | |||||||||||||||||||
Total revenues | $ | 2,562,087 | $ | 2,459,164 | $ | 2,601,703 | $ | 2,370,654 | $ | 2,261,470 | |||||||||
Net income | 361,200 | 301,796 | 322,325 | 300,863 | 282,462 | ||||||||||||||
Net income attributable to Westar Energy, Inc. | 346,577 | 291,929 | 313,259 | 292,520 | 273,530 | ||||||||||||||
As of December 31, | |||||||||||||||||||
2016 | 2015 | 2014 | 2013 | 2012 | |||||||||||||||
(In Thousands) | |||||||||||||||||||
Balance Sheet Data: | |||||||||||||||||||
Total assets | $ | 11,487,074 | $ | 10,705,666 | $ | 10,288,906 | $ | 9,530,903 | $ | 9,238,759 | |||||||||
Long-term obligations (a) | 3,699,328 | 3,379,219 | 3,433,320 | 3,466,984 | 3,098,359 | ||||||||||||||
Year Ended December 31, | |||||||||||||||||||
2016 | 2015 | 2014 | 2013 | 2012 | |||||||||||||||
Common Stock Data: | |||||||||||||||||||
Basic earnings per share available for common stock | $ | 2.43 | $ | 2.11 | $ | 2.40 | $ | 2.29 | $ | 2.15 | |||||||||
Diluted earnings per share available for common stock | 2.43 | 2.09 | 2.35 | 2.27 | 2.15 | ||||||||||||||
Dividends declared per share | 1.52 | 1.44 | 1.40 | 1.36 | 1.32 | ||||||||||||||
Book value per share | 26.84 | 25.87 | 25.02 | 23.88 | 22.89 | ||||||||||||||
Average equivalent common shares outstanding (in thousands) (b) (c) | 142,068 | 137,958 | 130,015 | 127,463 | 126,712 | ||||||||||||||
_______________
(a) | Includes long-term debt, net, current maturities of long-term debt, capital leases, long-term debt of VIEs, net and current maturities of long-term debt of VIEs. See Note 18 of the Notes to Consolidated Financial Statements, “Variable Interest Entities,” for additional information regarding VIEs. |
(b) | In 2014, Westar Energy issued and sold approximately 3.4 million shares of common stock realizing proceeds of $87.7 million. |
(c) | In 2015, Westar Energy issued and sold approximately 9.7 million shares of common stock realizing proceeds of $258.0 million. |
29
ITEM 7. MANAGEMENT’S DISCUSSION AND ANALYSIS OF FINANCIAL CONDITION AND RESULTS OF OPERATIONS
Certain matters discussed in Management’s Discussion and Analysis are “forward-looking statements.” The Private Securities Litigation Reform Act of 1995 has established that these statements qualify for safe harbors from liability. Forward-looking statements may include words like we “believe,” “anticipate,” “target,” “expect,” “estimate,” “intend” and words of similar meaning. Forward-looking statements describe our future plans, objectives, expectations or goals. See “Forward-Looking Statements” above for additional information.
EXECUTIVE SUMMARY
Description of Business
We are the largest electric utility in Kansas. We produce, transmit and sell electricity at retail to approximately 704,000 customers in Kansas under the regulation of the KCC. We also supply electric energy at wholesale to municipalities and electric cooperatives in Kansas under the regulation of FERC. We have contracts for the sale or purchase of wholesale electricity with other utilities.
Proposed Merger with Great Plains Energy
On May 29, 2016, we entered into an agreement and plan of merger with Great Plains Energy, providing for the merger of a wholly-owned subsidiary of Great Plains Energy with and into Westar Energy, with Westar Energy surviving as a wholly-owned subsidiary of Great Plains Energy. At the closing of the merger, our shareholders will receive cash and shares of Great Plains Energy. Each issued and outstanding share of our common stock, other than certain restricted shares, will be canceled and automatically converted into $51.00 in cash, without interest, and a number of shares of Great Plains Energy common stock equal to an exchange ratio that may vary between 0.2709 and 0.3148, based upon the volume-weighted average share price of Great Plains Energy common stock on the New York Stock Exchange for the 20 consecutive full trading days ending on (and including) the third trading day immediately prior to the closing date of the transaction. Based on the closing price per share of Great Plains Energy common stock on the trading day prior to announcement of the merger, our shareholders would receive an implied $60.00 for each share of Westar Energy common stock. The closing of the merger is subject to customary closing conditions, including receipt of regulatory approvals. For more information, see Notes 3, 14 and 16 of the Notes to Consolidated Financial Statements, “Pending Merger,” “Commitments and Contingencies” and “Legal Proceedings,” respectively, and Item “1A. Risk Factors.”
Earnings Per Share
Following is a summary of our net income and basic earnings per share (EPS) for the years ended December 31, 2016 and 2015.
Year Ended December 31, | ||||||||||||
2016 | 2015 | Change | ||||||||||
(Dollars In Thousands, Except Per Share Amounts) | ||||||||||||
Net income attributable to Westar Energy, Inc. | $ | 346,577 | $ | 291,929 | $ | 54,648 | ||||||
Earnings per common share, basic | 2.43 | 2.11 | 0.32 | |||||||||
Net income attributed to Westar Energy, Inc. and basic EPS for the year ended December 31, 2016, increased due primarily to higher retail prices and corporate-owned life insurance (COLI) proceeds. Partially offsetting these increases was higher operating and maintenance costs at our coal fired plants due to scheduled outages and higher depreciation and amortization due to air quality control additions at La Cygne.
30
Key Factors Affecting Our Performance
The principal business, economic and other factors that affect our operations and financial performance include:
• | weather conditions; |
• | the economy; |
• | customer conservation efforts; |
• | the performance, operation and maintenance of our electric generating facilities and network; |
• | conditions in the fuel, wholesale electricity and energy markets; |
• | rate and other regulations and costs of addressing public policy initiatives including environmental laws and regulations; |
• | the availability of and our access to liquidity and capital resources; and |
• | capital market conditions. |
Strategy
We expect to continue operating as a vertically integrated, regulated electric utility. Significant elements of our strategy include maintaining a flexible, clean and diverse energy supply portfolio. In doing so, we continue to expand renewable generation, build and upgrade our energy infrastructure and develop systems and programs with regard to how our customers use energy and interact with us. In addition, we have entered into an agreement and plan of merger with Great Plains Energy pursuant to which, at closing, we would become a wholly-owned subsidiary of Great Plains Energy. The closing of the merger is subject to customary closing conditions, including receipt of regulatory approvals. See “Item 1A. Risk Factors” and Note 3 of the Notes to Consolidated Financial Statements, “Pending Merger,” for additional information.
Current Trends and Uncertainties
Environmental Regulation
We are subject to various federal, state and local environmental laws and regulations. Environmental laws and regulations affecting our operations are overlapping, complex, subject to changes, have become more stringent over time and are expensive to implement. There are a variety of final and proposed laws and regulations that could have a material adverse effect on our operations and consolidated financial results, including those relating to:
• | further regulation of GHGs by the EPA, including regulations pursuant to the CPP, and future legislation that could be proposed by the U.S. Congress; |
• | various proposed and expected regulations governing air emissions including those relating to National Ambient Air Quality Standards (particularly those relating to particulate matter, nitrogen oxide, ozone, carbon monoxide and sulfur dioxide); and |
• | the regulation of CCR. |
See Note 14 of the Notes to Consolidated Financial Statements, “Commitments and Contingencies—Environmental Matters,” for a discussion of environmental costs, laws, regulations and other contingencies.
Allowance for Funds Used During Construction
AFUDC represents the allowed cost of capital used to finance utility construction activity. We compute AFUDC by applying a composite rate to qualified construction work in progress (CWIP). We credit other income (for equity funds) and interest expense (for borrowed funds) for the amount of AFUDC capitalized as construction cost on the accompanying consolidated statements of income as follows:
Year Ended December 31, | |||||||||||
2016 | 2015 | 2014 | |||||||||
(In Thousands) | |||||||||||
Borrowed funds | $ | 9,964 | $ | 3,505 | $ | 12,044 | |||||
Equity funds | 11,630 | 2,075 | 17,029 | ||||||||
Total | $ | 21,594 | $ | 5,580 | $ | 29,073 | |||||
Average AFUDC Rates | 4.2 | % | 2.7 | % | 6.7 | % | |||||
31
We expect AFUDC for both borrowed funds and equity funds to fluctuate based on the timing and manner in which we finance our capital expenditures.
Interest Expense
We expect interest expense to modestly increase over the next several years as we issue new debt securities to fund our capital expenditure program. We continue to believe this increase will be reflected in the prices we are permitted to charge customers, as cost of capital will be a component of future rate proceedings and is also recognized in some of the other rate adjustments we are permitted to make. In addition, short-term interest rates are low by historical standards. We cannot predict to what extent these conditions will continue. See Note 10 of the Notes to Consolidated Financial Statements, “Long-Term Debt” for additional information regarding the issuance of long-term debt.
Customer Growth and Usage
Retail customer additions have been growing approximately 0.5% the past few years. Additionally, weather normalized retail sales growth has largely grown in line with customer growth. With the numerous energy efficiency policy initiatives promulgated through federal, state and local governments, as well as industry initiatives, environmental regulations and the need to strengthen and modernize the grid, which will increase our prices, we believe customers will continue to adopt more energy efficiency and conservation measures, which will slow or possibly suppress the growth of demand for electricity.
2017 Outlook
In 2017, we expect to maintain our current business strategy and regulatory approach. Assuming normal weather, we expect 2017 retail electricity sales to be in line with our projected retail customer growth of about 0.5%.
Absent increases in SPP transmission expense and property tax expense, which are increasing at a much higher rate than inflation and are offset with higher revenues pursuant to our regulatory mechanisms and absent incremental merger-related expenses, we anticipate operating and maintenance and selling, general and administrative expenses to be relatively flat in 2017 as compared to 2016. To help fund our capital spending as provided under “—Future Cash Requirements” below, in 2017 we may issue long-term debt, and utilize short-term borrowings by issuing commercial paper until permanent financing is in place.
CRITICAL ACCOUNTING ESTIMATES
Our discussion and analysis of financial condition and results of operations are based on our consolidated financial statements, which have been prepared in conformity with Generally Accepted Accounting Principles (GAAP). Note 2 of the Notes to Consolidated Financial Statements, “Summary of Significant Accounting Policies,” contains a summary of our significant accounting policies, many of which require the use of estimates and assumptions by management. The policies highlighted below have an impact on our reported results that may be material due to the levels of judgment and subjectivity necessary to account for uncertain matters or their susceptibility to change.
Regulatory Accounting
We apply accounting standards that recognize the economic effects of rate regulation. Accordingly, we have recorded regulatory assets and liabilities when required by a regulatory order or based on regulatory precedent. Regulatory assets represent incurred costs that have been deferred because they are probable of future recovery in our prices. Regulatory liabilities represent probable future reductions in revenue or refunds to customers.
The deferral of costs as regulatory assets is appropriate only when the future recovery of such costs is probable. In assessing probability, we consider such factors as specific regulatory orders, regulatory precedent and the current regulatory environment. If we deem it no longer probable that we would recover such costs, we would record a charge against income in the amount of the related regulatory assets.
As of December 31, 2016, we had recorded regulatory assets currently subject to recovery in future prices of approximately $879.9 million and regulatory liabilities of $239.5 million, as discussed in greater detail in Note 4 of the Notes to Consolidated Financial Statements, “Rate Matters and Regulation.”
32
Pension and Post-Retirement Benefit Plans Actuarial Assumptions
We and Wolf Creek calculate our pension benefit and post-retirement medical benefit obligations and related costs using actuarial concepts within the guidance provided by GAAP.
In accounting for our retirement plans and post-retirement benefits, we make assumptions regarding the valuation of benefit obligations and the performance of plan assets. The reported costs of our pension plans are impacted by estimates regarding earnings on plan assets, contributions to the plan, discount rates used to determine our projected benefit obligation and pension costs and employee demographics including age, life expectancy and compensation levels and employment periods. Changes in these assumptions result primarily in changes to regulatory assets, regulatory liabilities or the amount of related pension and post-retirement benefit liabilities reflected on our consolidated balance sheets. Such changes may also require cash contributions.
The following table shows the impact of a 0.5% change in our pension plan discount rate, salary scale and rate of return on plan assets.
Actuarial Assumption | Change in Assumption | Change in Projected Benefit Obligation (a) | Annual Change in Projected Pension Costs (a) | |||||||
(Dollars In Thousands) | ||||||||||
Discount rate | 0.5% decrease | $ | 94,763 | $ | 8,390 | |||||
0.5% increase | (84,504 | ) | (7,585 | ) | ||||||
Compensation | 0.5% decrease | (18,439 | ) | (3,561 | ) | |||||
0.5% increase | 19,717 | 3,822 | ||||||||
Rate of return on plan assets | 0.5% decrease | — | 4,041 | |||||||
0.5% increase | — | (4,041 | ) | |||||||
_______________
(a) | Increases or decreases due to changes in actuarial assumptions result primarily in changes to regulatory assets and liabilities. |
The following table shows the impact of a 0.5% change in the discount rate and rate of return on plan assets and a 1% change in the annual medical trend on our post-retirement benefit plans.
Actuarial Assumption | Change in Assumption | Change in Projected Benefit Obligation (a) | Annual Change in Projected Post-retirement Costs (a) | |||||||
(Dollars In Thousands) | ||||||||||
Discount rate | 0.5% decrease | $ | 7,823 | $ | 325 | |||||
0.5% increase | (7,094 | ) | (309 | ) | ||||||
Rate of return on plan assets | 0.5% decrease | — | 573 | |||||||
0.5% increase | — | (573 | ) | |||||||
Annual medical trend | 1.0% decrease | 133 | 20 | |||||||
1.0% increase | (125 | ) | (19 | ) | ||||||
_______________
(a) | Increases or decreases due to changes in actuarial assumptions result primarily in changes to regulatory assets and liabilities. |
33
Revenue Recognition
We record revenue at the time we deliver electricity to customers. We determine the amounts delivered to individual customers through systematic monthly readings of customer meters. At the end of each month, we estimate how much electricity we have delivered since the prior meter reading and record the corresponding unbilled revenue.
Our unbilled revenue estimate is affected by factors including fluctuations in energy demand, weather, line losses and changes in the composition of customer classes. We recorded estimated unbilled revenue of $74.4 million as of December 31, 2016 and $66.0 million as of December 31, 2015.
Income Taxes
We use the asset and liability method of accounting for income taxes. Under this method, we recognize deferred tax assets and liabilities for the future tax consequences attributable to temporary differences between the financial statement carrying amounts and the tax basis of existing assets and liabilities. We recognize the future tax benefits to the extent that realization of such benefits is more likely than not. We amortize deferred investment tax credits over the lives of the related properties as required by tax laws and regulatory practices. We recognize production tax credits in the year that electricity is generated to the extent that realization of such benefits is more likely than not.
We record deferred tax assets to the extent capital losses, operating losses or tax credits will be carried forward to future periods. However, when we believe based on available evidence that we do not, or will not, have sufficient future capital gains or taxable income in the appropriate taxing jurisdiction to realize the entire benefit during the applicable carryforward period, we record a valuation allowance against the deferred tax asset.
The application of income tax law is complex. Laws and regulations in this area are voluminous and often ambiguous. Accordingly, we must make judgments regarding income tax exposure. Interpretations of and guidance surrounding income tax laws and regulations change over time. As a result, changes in our judgments can materially affect amounts we recognize in our consolidated financial statements. See Note 11of the Notes to Consolidated Financial Statements, “Taxes,” for additional detail on our accounting for income taxes.
Asset Retirement Obligations
Legal Liability
We have recognized legal obligations associated with the disposal of long-lived assets that result from the acquisition, construction, development or normal operation of such assets. Concurrent with the recognition of the liability, the estimated cost of the ARO is capitalized and depreciated over the remaining life of the asset. We estimate our AROs based on the fair value of the AROs we incurred at the time the related long-lived assets were either acquired, placed in service or when regulations establishing the obligation became effective. The recording of AROs for regulated operations has no income statement impact due to the deferral of the adjustments through the establishment of a regulatory asset or an offset to a regulatory liability.
We initially recorded AROs at fair value for the estimated cost to decommission Wolf Creek (our 47% share), retire our wind generating facilities, dispose of asbestos insulating material at our power plants, remediate ash disposal ponds, close ash landfills and dispose of polychlorinated biphenyl contaminated oil. ARO refers to a legal obligation to perform an asset retirement activity in which the timing and/or method of settlement may be conditional on a future event that may or may not be within the control of the entity. In determining our AROs, we make assumptions regarding probable future disposal costs. A change in these assumptions could have a significant impact on the AROs reflected on our consolidated balance sheets.
As of December 31, 2016 and 2015, we have recorded AROs of $324.0 million and $275.3 million, respectively. For additional information on our legal AROs, see Note 15 of the Notes to Consolidated Financial Statements, “Asset Retirement Obligations.”
34
Contingencies and Litigation
We and our subsidiaries are involved in various legal, environmental and regulatory proceedings, and we have estimated the probable cost for the resolution of these proceedings. These estimates are based on an analysis of potential results, assuming a combination of litigation and settlement strategies. It is possible that our future consolidated financial results could be materially affected by changes in our assumptions. See Notes 4, 14 and 16 of the Notes to Consolidated Financial Statements, “Rate Matters and Regulations,” “Commitments and Contingencies” and “Legal Proceedings,” respectively, for additional information.
35
OPERATING RESULTS
We evaluate operating results based on EPS. We have various classifications of revenues, defined as follows:
Retail: Sales of electricity to residential, commercial and industrial customers. Classification of customers as residential, commercial or industrial requires judgment and our classifications may be different from other companies. Assignment of tariffs is not dependent on classification. Other retail sales of electricity include lighting for public streets and highways, net of revenue subject to refund.
Wholesale: Sales of electricity to electric cooperatives, municipalities, other electric utilities and RTOs, the prices for which are either based on cost or prevailing market prices as prescribed by FERC authority. Revenues from these sales are either included in the retail energy cost adjustment or used in the determinations of base rates at the time of our next general rate review.
Transmission: Reflects transmission revenues, including those based on tariffs with the SPP.
Other: Miscellaneous electric revenues including ancillary service revenues and rent from electric property leased to others. This category also includes transactions unrelated to the production of our generating assets and fees we earn for services that we provide for third parties.
Electric utility revenues are impacted by things such as rate regulation, fuel costs, technology, customer behavior, the economy and competitive forces. Changing weather also affects the amount of electricity our customers use as electricity sales are seasonal. As a summer peaking utility, the third quarter typically accounts for our greatest electricity sales. Hot summer temperatures and cold winter temperatures prompt more demand, especially among residential and commercial customers, and to a lesser extent, industrial customers. Mild weather reduces customer demand. Our wholesale revenues are impacted by, among other factors, demand, cost and availability of fuel and purchased power, price volatility, available generation capacity, transmission availability and weather.
36
2016 Compared to 2015
Below we discuss our operating results for the year ended December 31, 2016, compared to the results for the year ended December 31, 2015. Significant changes in results of operations shown in the table immediately below are further explained in the descriptions that follow.
Year Ended December 31, | ||||||||||||||
2016 | 2015 | Change | % Change | |||||||||||
(Dollars In Thousands, Except Per Share Amounts) | ||||||||||||||
REVENUES: | ||||||||||||||
Residential | $ | 838,998 | $ | 768,618 | $ | 70,380 | 9.2 | |||||||
Commercial | 741,066 | 712,400 | 28,666 | 4.0 | ||||||||||
Industrial | 413,298 | 400,687 | 12,611 | 3.1 | ||||||||||
Other retail | (15,013 | ) | (17,155 | ) | 2,142 | 12.5 | ||||||||
Total Retail Revenues | 1,978,349 | 1,864,550 | 113,799 | 6.1 | ||||||||||
Wholesale | 304,871 | 318,371 | (13,500 | ) | (4.2 | ) | ||||||||
Transmission | 253,713 | 241,835 | 11,878 | 4.9 | ||||||||||
Other | 25,154 | 34,408 | (9,254 | ) | (26.9 | ) | ||||||||
Total Revenues | 2,562,087 | 2,459,164 | 102,923 | 4.2 | ||||||||||
OPERATING EXPENSES: | ||||||||||||||
Fuel and purchased power | 509,496 | 561,065 | (51,569 | ) | (9.2 | ) | ||||||||
SPP network transmission costs | 232,763 | 229,043 | 3,720 | 1.6 | ||||||||||
Operating and maintenance | 346,313 | 330,289 | 16,024 | 4.9 | ||||||||||
Depreciation and amortization | 338,519 | 310,591 | 27,928 | 9.0 | ||||||||||
Selling, general and administrative | 261,451 | 250,278 | 11,173 | 4.5 | ||||||||||
Taxes other than income tax | 191,662 | 156,901 | 34,761 | 22.2 | ||||||||||
Total Operating Expenses | 1,880,204 | 1,838,167 | 42,037 | 2.3 | ||||||||||
INCOME FROM OPERATIONS | 681,883 | 620,997 | 60,886 | 9.8 | ||||||||||
OTHER INCOME (EXPENSE): | ||||||||||||||
Investment earnings | 9,013 | 7,799 | 1,214 | 15.6 | ||||||||||
Other income | 34,582 | 19,438 | 15,144 | 77.9 | ||||||||||
Other expense | (18,012 | ) | (17,636 | ) | (376 | ) | (2.1 | ) | ||||||
Total Other Income | 25,583 | 9,601 | 15,982 | 166.5 | ||||||||||
Interest expense | 161,726 | 176,802 | (15,076 | ) | (8.5 | ) | ||||||||
INCOME BEFORE INCOME TAXES | 545,740 | 453,796 | 91,944 | 20.3 | ||||||||||
Income tax expense | 184,540 | 152,000 | 32,540 | 21.4 | ||||||||||
NET INCOME | 361,200 | 301,796 | 59,404 | 19.7 | ||||||||||
Less: Net income attributable to noncontrolling interests | 14,623 | 9,867 | 4,756 | 48.2 | ||||||||||
NET INCOME ATTRIBUTABLE TO WESTAR ENERGY, INC. | $ | 346,577 | $ | 291,929 | $ | 54,648 | 18.7 | |||||||
BASIC EARNINGS PER AVERAGE COMMON SHARE OUTSTANDING ATTRIBUTABLE TO WESTAR ENERGY, INC. | $ | 2.43 | $ | 2.11 | $ | 0.32 | 15.2 | |||||||
DILUTED EARNINGS PER AVERAGE COMMON SHARE OUTSTANDING ATTRIBUTABLE TO WESTAR ENERGY, INC. | $ | 2.43 | $ | 2.09 | $ | 0.34 | 16.3 | |||||||
37
Rate Review Agreement
In September 2015, the KCC issued an order in our state general rate review allowing us to adjust our prices to include, among other things, additional investment in La Cygne environmental upgrades and investment to extend the life of Wolf Creek. The new prices were effective late October 2015 and are expected to increase our annual retail revenues by approximately $78.3 million.
Gross Margin
Fuel and purchased power costs fluctuate with electricity sales and unit costs. As permitted by regulators, we adjust our retail prices to reflect changes in the costs of fuel and purchased power. Fuel and purchased power costs for wholesale customers are recovered at prevailing market prices or based on a predetermined formula with a price adjustment approved by FERC. As a result, changes in fuel and purchased power costs are offset in revenues with minimal impact on net income. In addition, SPP network transmission costs fluctuate due primarily to investments by us and other members of the SPP for upgrades to the transmission grid within the SPP RTO. As with fuel and purchased power costs, changes in SPP network transmission costs are mostly reflected in the prices we charge customers with minimal impact on net income. For these reasons, we believe gross margin is useful for understanding and analyzing changes in our operating performance from one period to the next. We calculate gross margin as total revenues, including transmission revenues, less the sum of fuel and purchased power costs and amounts billed by the SPP for network transmission costs. Accordingly, gross margin reflects transmission revenues and costs on a net basis. The following table summarizes our gross margin for the years ended December 31, 2016 and 2015.
Year Ended December 31, | ||||||||||||||
2016 | 2015 | Change | % Change | |||||||||||
(Dollars In Thousands) | ||||||||||||||
Revenues | $ | 2,562,087 | $ | 2,459,164 | $ | 102,923 | 4.2 | |||||||
Less: Fuel and purchased power expense | 509,496 | 561,065 | (51,569 | ) | (9.2 | ) | ||||||||
SPP network transmission costs | 232,763 | 229,043 | 3,720 | 1.6 | ||||||||||
Gross Margin | $ | 1,819,828 | $ | 1,669,056 | $ | 150,772 | 9.0 | |||||||
The following table reflects changes in electricity sales for the years ended December 31, 2016 and 2015. No electricity sales are shown for transmission or other as they are not directly related to the amount of electricity we sell.
Year Ended December 31, | |||||||||||
2016 | 2015 | Change | % Change | ||||||||
(Thousands of MWh) | |||||||||||
ELECTRICITY SALES: | |||||||||||
Residential | 6,434 | 6,364 | 70 | 1.1 | |||||||
Commercial | 7,544 | 7,500 | 44 | 0.6 | |||||||
Industrial | 5,499 | 5,502 | (3 | ) | (0.1 | ) | |||||
Other retail | 77 | 84 | (7 | ) | (8.3 | ) | |||||
Total Retail | 19,554 | 19,450 | 104 | 0.5 | |||||||
Wholesale | 8,299 | 8,492 | (193 | ) | (2.3 | ) | |||||
Total | 27,853 | 27,942 | (89 | ) | (0.3 | ) | |||||
Gross margin increased due primarily to higher retail prices, which increased approximately 6%. Gross margin also increased slightly due to weather that was modestly favorable relative to 2015. During 2016, there were approximately 10% more cooling degree days compared to 2015.
38
Income from operations, which is calculated and presented in accordance with GAAP in our consolidated statements of income, is the most directly comparable measure to our presentation of gross margin, which is a non-GAAP measure. Our presentation of gross margin should not be considered in isolation or as a substitute for income from operations. Additionally, our presentation of gross margin may not be comparable to similarly titled measures reported by other companies. The following table reconciles income from operations with gross margin for the years ended December 31, 2016 and 2015.
Year Ended December 31, | |||||||||||||
2016 | 2015 | Change | % Change | ||||||||||
(Dollars In Thousands) | |||||||||||||
Income from operations | $ | 681,883 | $ | 620,997 | $ | 60,886 | 9.8 | ||||||
Plus: Operating and maintenance expense | 346,313 | 330,289 | 16,024 | 4.9 | |||||||||
Depreciation and amortization expense | 338,519 | 310,591 | 27,928 | 9.0 | |||||||||
Selling, general and administrative expense | 261,451 | 250,278 | 11,173 | 4.5 | |||||||||
Taxes other than income tax | 191,662 | 156,901 | 34,761 | 22.2 | |||||||||
Gross Margin | $ | 1,819,828 | $ | 1,669,056 | $ | 150,772 | 9.0 | ||||||
Operating Expenses and Other Income and Expense Items
Year Ended December 31, | |||||||||||||
2016 | 2015 | Change | % Change | ||||||||||
(Dollars in Thousands) | |||||||||||||
Operating and maintenance expense | $ | 346,313 | $ | 330,289 | $ | 16,024 | 4.9 | ||||||
Operating and maintenance expense increased due primarily to:
• | higher operating and maintenance costs at our coal fired plants of $14.1 million, due primarily to scheduled outages; |
• | higher transmission and distribution operating and maintenance costs of $4.3 million due partially to improving long-term reliability; and |
• | higher decommissioning costs of $3.0 million for Wolf Creek which is offset in retail revenues; however, |
• | partially offsetting these increases was a $9.8 million decrease in operating and maintenance costs related to our having retired three generating units in late 2015. |
Year Ended December 31, | |||||||||||||
2016 | 2015 | Change | % Change | ||||||||||
(Dollars in Thousands) | |||||||||||||
Depreciation and amortization expense | $ | 338,519 | $ | 310,591 | $ | 27,928 | 9.0 | ||||||
Depreciation and amortization expense increased due primarily to air quality control additions at La Cygne.
39
Year Ended December 31, | |||||||||||||
2016 | 2015 | Change | % Change | ||||||||||
(Dollars in Thousands) | |||||||||||||
Selling, general and administrative expense | $ | 261,451 | $ | 250,278 | $ | 11,173 | 4.5 | ||||||
Selling, general and administrative expense increased due primarily to:
• | incurring $10.2 million of merger-related expenses in 2016; |
• | an increase in the allowance for uncollectible accounts of $3.5 million; and |
• | an increase of $2.7 million in outside services related principally to technology services; however, |
• | partially offsetting these increases was lower employee benefit costs of $7.6 million due primarily to reduced post-retirement medical costs. |
Year Ended December 31, | |||||||||||||
2016 | 2015 | Change | % Change | ||||||||||
(Dollars in Thousands) | |||||||||||||
Taxes other than income tax | $ | 191,662 | $ | 156,901 | $ | 34,761 | 22.2 | ||||||
Taxes other than income tax increased due primarily to a $36.1 million increase in property tax expense, which is mostly offset in retail revenues.
Year Ended December 31, | |||||||||||||
2016 | 2015 | Change | % Change | ||||||||||
(Dollars in Thousands) | |||||||||||||
Other income | $ | 34,582 | $ | 19,438 | $ | 15,144 | 77.9 | ||||||
Other income increased due primarily to an increase in equity AFUDC of $9.6 million and our having recorded $7.2 million more in COLI benefits.
Year Ended December 31, | ||||||||||||||
2016 | 2015 | Change | % Change | |||||||||||
(Dollars in Thousands) | ||||||||||||||
Interest expense | $ | 161,726 | $ | 176,802 | $ | (15,076 | ) | (8.5 | ) | |||||
Interest expense decreased due primarily to a $6.5 million increase in debt AFUDC, a $5.7 million decrease in interest on long-term debt of VIEs due to refinancing long-term debt of the La Cygne VIE and a $4.8 million decrease in interest expense on long-term debt due to refinancing long-term debt at lower rates.
Year Ended December 31, | |||||||||||||
2016 | 2015 | Change | % Change | ||||||||||
(Dollars in Thousands) | |||||||||||||
Income tax expense | $ | 184,540 | $ | 152,000 | $ | 32,540 | 21.4 | ||||||
Income tax expense increased due principally to higher income before income taxes.
40
2015 Compared to 2014
Below we discuss our operating results for the year ended December 31, 2015, compared to the results for the year ended December 31, 2014. Significant changes in results of operations shown in the table immediately below are further explained in the descriptions that follow.
Year Ended December 31, | ||||||||||||||
2015 | 2014 | Change | % Change | |||||||||||
(Dollars In Thousands, Except Per Share Amounts) | ||||||||||||||
REVENUES: | ||||||||||||||
Residential | $ | 768,618 | $ | 793,586 | $ | (24,968 | ) | (3.1 | ) | |||||
Commercial | 712,400 | 727,964 | (15,564 | ) | (2.1 | ) | ||||||||
Industrial | 400,687 | 414,997 | (14,310 | ) | (3.4 | ) | ||||||||
Other retail | (17,155 | ) | (24,180 | ) | 7,025 | 29.1 | ||||||||
Total Retail Revenues | 1,864,550 | 1,912,367 | (47,817 | ) | (2.5 | ) | ||||||||
Wholesale | 318,371 | 392,730 | (74,359 | ) | (18.9 | ) | ||||||||
Transmission | 241,835 | 256,838 | (15,003 | ) | (5.8 | ) | ||||||||
Other | 34,408 | 39,768 | (5,360 | ) | (13.5 | ) | ||||||||
Total Revenues | 2,459,164 | 2,601,703 | (142,539 | ) | (5.5 | ) | ||||||||
OPERATING EXPENSES: | ||||||||||||||
Fuel and purchased power | 561,065 | 705,450 | (144,385 | ) | (20.5 | ) | ||||||||
SPP network transmission costs | 229,043 | 218,924 | 10,119 | 4.6 | ||||||||||
Operating and maintenance | 330,289 | 367,188 | (36,899 | ) | (10.0 | ) | ||||||||
Depreciation and amortization | 310,591 | 286,442 | 24,149 | 8.4 | ||||||||||
Selling, general and administrative | 250,278 | 250,439 | (161 | ) | (0.1 | ) | ||||||||
Taxes other than income tax | 156,901 | 140,302 | 16,599 | 11.8 | ||||||||||
Total Operating Expenses | 1,838,167 | 1,968,745 | (130,578 | ) | (6.6 | ) | ||||||||
INCOME FROM OPERATIONS | 620,997 | 632,958 | (11,961 | ) | (1.9 | ) | ||||||||
OTHER INCOME (EXPENSE): | ||||||||||||||
Investment earnings | 7,799 | 10,622 | (2,823 | ) | (26.6 | ) | ||||||||
Other income | 19,438 | 31,522 | (12,084 | ) | (38.3 | ) | ||||||||
Other expense | (17,636 | ) | (18,389 | ) | 753 | 4.1 | ||||||||
Total Other Income (Expense) | 9,601 | 23,755 | (14,154 | ) | (59.6 | ) | ||||||||
Interest expense | 176,802 | 183,118 | (6,316 | ) | (3.4 | ) | ||||||||
INCOME BEFORE INCOME TAXES | 453,796 | 473,595 | (19,799 | ) | (4.2 | ) | ||||||||
Income tax expense | 152,000 | 151,270 | 730 | 0.5 | ||||||||||
NET INCOME | 301,796 | 322,325 | (20,529 | ) | (6.4 | ) | ||||||||
Less: Net income attributable to noncontrolling interests | 9,867 | 9,066 | 801 | 8.8 | ||||||||||
NET INCOME ATTRIBUTABLE TO WESTAR ENERGY. INC. | $ | 291,929 | $ | 313,259 | $ | (21,330 | ) | (6.8 | ) | |||||
BASIC EARNINGS PER AVERAGE COMMON SHARE OUTSTANDING ATTRIBUTABLE TO WESTAR ENERGY, INC. | $ | 2.11 | $ | 2.40 | $ | (0.29 | ) | (12.1 | ) | |||||
DILUTED EARNINGS PER AVERAGE COMMON SHARE OUTSTANDING ATTRIBUTABLE TO WESTAR ENERGY, INC. | $ | 2.09 | $ | 2.35 | $ | (0.26 | ) | (11.1 | ) | |||||
41
Gross Margin
The following table summarizes our gross margin for the years ended December 31, 2015 and 2014.
Year Ended December 31, | ||||||||||||||
2015 | 2014 | Change | % Change | |||||||||||
(Dollars In Thousands) | ||||||||||||||
Revenues | $ | 2,459,164 | $ | 2,601,703 | $ | (142,539 | ) | (5.5 | ) | |||||
Less: Fuel and purchased power expense | 561,065 | 705,450 | (144,385 | ) | (20.5 | ) | ||||||||
SPP network transmission costs | 229,043 | 218,924 | 10,119 | 4.6 | ||||||||||
Gross Margin | $ | 1,669,056 | $ | 1,677,329 | $ | (8,273 | ) | (0.5 | ) | |||||
The following table reflects changes in electricity sales for the years ended December 31, 2015 and 2014. No electricity sales are shown for transmission or other as they are not directly related to the amount of electricity we sell.
Year Ended December 31, | |||||||||||
2015 | 2014 | Change | % Change | ||||||||
(Thousands of MWh) | |||||||||||
ELECTRICITY SALES: | |||||||||||
Residential | 6,364 | 6,580 | (216 | ) | (3.3 | ) | |||||
Commercial | 7,500 | 7,521 | (21 | ) | (0.3 | ) | |||||
Industrial | 5,502 | 5,601 | (99 | ) | (1.8 | ) | |||||
Other retail | 84 | 86 | (2 | ) | (2.3 | ) | |||||
Total Retail | 19,450 | 19,788 | (338 | ) | (1.7 | ) | |||||
Wholesale | 8,492 | 9,544 | (1,052 | ) | (11.0 | ) | |||||
Total | 27,942 | 29,332 | (1,390 | ) | (4.7 | ) | |||||
Gross margin decreased due primarily to an estimated $13.8 million transmission revenues refund obligation associated with a FERC proceeding. Energy marketing margin decreased $11.2 million due to greater volatility in 2014 of wholesale power prices. Also contributing to the decrease in gross margin was lower retail electricity sales. The lower residential and commercial electric sales were due to warm winter weather. During 2015, there were approximately 19% fewer heating degree days compared to 2014. The lower industrial sales were due to a few of our larger customers who experienced weaker global demand for their products.
Income from operations, which is calculated and presented in accordance with GAAP in our consolidated statements of income, is the most directly comparable measure to our presentation of gross margin, which is a non-GAAP measure. Our presentation of gross margin should not be considered in isolation or as a substitute for income from operations. Additionally, our presentation of gross margin may not be comparable to similarly titled measures reported by other companies. The following table reconciles income from operations with gross margin for the years ended December 31, 2015 and 2014.
Year Ended December 31, | ||||||||||||||
2015 | 2014 | Change | % Change | |||||||||||
(Dollars In Thousands) | ||||||||||||||
Income from operations | $ | 620,997 | $ | 632,958 | $ | (11,961 | ) | (1.9 | ) | |||||
Plus: Operating and maintenance expense | 330,289 | 367,188 | (36,899 | ) | (10.0 | ) | ||||||||
Depreciation and amortization expense | 310,591 | 286,442 | 24,149 | 8.4 | ||||||||||
Selling, general and administrative expense | 250,278 | 250,439 | (161 | ) | (0.1 | ) | ||||||||
Taxes other than income tax | 156,901 | 140,302 | 16,599 | 11.8 | ||||||||||
Gross margin | $ | 1,669,056 | $ | 1,677,329 | $ | (8,273 | ) | (0.5 | ) | |||||
42
Operating Expenses and Other Income and Expense Items
Year Ended December 31, | ||||||||||||||
2015 | 2014 | Change | % Change | |||||||||||
(Dollars in Thousands) | ||||||||||||||
Operating and maintenance expense | $ | 330,289 | $ | 367,188 | $ | (36,899 | ) | (10.0 | ) | |||||
Operating and maintenance expense decreased due principally to:
• | lower transmission and distribution operations and maintenance expense of $14.8 million due partially to focus on capital replacement for longer term grid resiliency; |
• | lower costs at our coal fired plants of $10.5 million, which were principally the result of higher operating and maintenance costs incurred during a 2014 scheduled outage at JEC; and |
• | lower costs at Wolf Creek of $10.3 million, which were principally the result of higher operating and maintenance costs incurred during a 2014 scheduled outage. |
Year Ended December 31, | |||||||||||||
2015 | 2014 | Change | % Change | ||||||||||
(Dollars in Thousands) | |||||||||||||
Depreciation and amortization expense | $ | 310,591 | $ | 286,442 | $ | 24,149 | 8.4 | ||||||
Depreciation and amortization expense increased due to additions at our power plants, including air quality controls, additions at Wolf Creek to enhance reliability and the addition of transmission facilities. Depreciation related to environmental equipment placed in-service at La Cygne, as approved by the KCC, was deferred until new retail prices became effective in late October 2015.
Year Ended December 31, | ||||||||||||||
2015 | 2014 | Change | % Change | |||||||||||
(Dollars in Thousands) | ||||||||||||||
Selling, general and administrative expense | $ | 250,278 | $ | 250,439 | $ | (161 | ) | (0.1 | ) | |||||
Selling, general and administrative expense decreased due primarily to a reduction of $4.2 million in amortization for previously deferred amounts with various energy efficiency programs; however, partially offsetting this decrease was higher labor and employee benefit costs of $5.1 million partially related to restructuring charges.
Year Ended December 31, | |||||||||||||
2015 | 2014 | Change | % Change | ||||||||||
(Dollars in Thousands) | |||||||||||||
Taxes other than income tax | $ | 156,901 | $ | 140,302 | $ | 16,599 | 11.8 | ||||||
Taxes other than income tax increased due primarily to an increase of $16.9 million in property tax expense. This increase is mostly offset in retail revenue.
Year Ended December 31, | ||||||||||||
2015 | 2014 | Change | % Change | |||||||||
(Dollars in Thousands) | ||||||||||||
Investment earnings | 7,799 | 10,622 | $ | (2,823 | ) | (26.6 | ) | |||||
Investment earnings decreased due primarily to recording a $2.2 million lower gain on a trust to secure certain retirement benefit obligations.
43
Year Ended December 31, | ||||||||||||||
2015 | 2014 | Change | % Change | |||||||||||
(Dollars in Thousands) | ||||||||||||||
Other income | $ | 19,438 | $ | 31,522 | $ | (12,084 | ) | (38.3 | ) | |||||
Other income decreased due primarily to our having recorded about $15.0 million less in equity AFUDC due primarily to completion of major construction projects. The decrease was partially offset by our having recorded $2.7 million more in COLI benefits.
Year Ended December 31, | |||||||||||||
2015 | 2014 | Change | % Change | ||||||||||
(Dollars in Thousands) | |||||||||||||
Interest expense | 176,802 | $ | 183,118 | $ | (6,316 | ) | (3.4 | ) | |||||
Interest expense decreased due primarily to a decrease in long-term interest expense of $14.7 million due to refinancing debt. However, partially offsetting this decrease was a reduction in debt AFUDC of $8.5 million primarily due to reduced CWIP.
Financial Condition
A number of factors affected amounts recorded on our balance sheet as of December 31, 2016, compared to December 31, 2015.
As of December 31, | |||||||||||||
2016 | 2015 | Change | % Change | ||||||||||
(Dollars in Thousands) | |||||||||||||
Property, plant and equipment, net | $ | 9,248,359 | $ | 8,524,902 | $ | 723,457 | 8.5 | ||||||
Property, plant and equipment, net of accumulated depreciation, increased due primarily to the construction of Western Plains Wind Farm and plant additions for capital improvements to improve long-term reliability.
44
As of December 31, | ||||||||||||||
2016 | 2015 | Change | % Change | |||||||||||
(Dollars in Thousands) | ||||||||||||||
Regulatory assets | $ | 879,862 | $ | 860,918 | $ | 18,944 | 2.2 | |||||||
Regulatory liabilities | 239,453 | 292,811 | (53,358 | ) | (18.2 | ) | ||||||||
Net regulatory assets | $ | 640,409 | $ | 568,107 | $ | 72,302 | 12.7 | |||||||
Total regulatory assets increased due primarily to the following items:
• | a $32.5 million increase in amounts to be collected from our customers for the deferred cost of fuel and purchased power; |
• | a $27.3 million increase in deferred employee benefit costs; and |
• | a $7.0 million increase in unrecovered amounts related to the retirement of analog meters prior to the end of their remaining useful lives due to modernization of meter technology; however, |
• | partially offsetting these decreases was a $26.8 million decrease in amounts deferred for property taxes; and |
• | a $20.1 million decrease in amounts due from customers for future income taxes. |
Total regulatory liabilities decreased due primarily to the following items:
• | spending $48.2 million more than collected for the cost to remove retired plant assets; and |
• | a $12.7 million decrease in our refund obligations related to amounts we have collected from our customers in excess of our actual cost of fuel and purchased power; however, |
• | partially offsetting these decreases was a $5.0 million increase in amounts recognized in setting our prices in excess of actual pension and post-retirement expense; and |
• | a $1.2 million increase for the FERC settlement refund obligation and a $1.3 million increase for the KCC approved refund obligation related to the reduced return on equity in our transmission formula rate. See Note 4 of the Notes to Consolidated Financial Statements, “Rate Matters and Regulation,” for a discussion of these refund obligations. |
As of December 31, | |||||||||||||
2016 | 2015 | Change | % Change | ||||||||||
(Dollars in Thousands) | |||||||||||||
Short-term debt | $ | 366,700 | $ | 250,300 | $ | 116,400 | 46.5 | ||||||
Short-term debt increased due to increased issuances of commercial paper primarily used to fund capital expenditures, such as the construction of Western Plains Wind Farm.
As of December 31, | |||||||||||||
2016 | 2015 | Change | % Change | ||||||||||
(Dollars in Thousands) | |||||||||||||
Current maturities of long-term debt | $ | 125,000 | $ | — | $ | 125,000 | — | ||||||
Long-term debt, net | 3,388,670 | 3,163,950 | 224,720 | 7.1 | |||||||||
Total long-term debt | $ | 3,513,670 | $ | 3,163,950 | $ | 349,720 | 11.1 | ||||||
Total long-term debt increased due to Westar Energy issuing $350.0 million in principal amount of first mortgage bonds. For more information on our long-term debt, see Note 10 of the Notes to Consolidated Financial Statements, “Long-term Debt.”
45
As of December 31, | ||||||||||||||
2016 | 2015 | Change | % Change | |||||||||||
(Dollars in Thousands) | ||||||||||||||
Current maturities of long-term debt of variable interest entities | $ | 26,842 | $ | 28,309 | $ | (1,467 | ) | (5.2 | ) | |||||
Long-term debt of variable interest entities | 111,209 | 138,097 | (26,888 | ) | (19.5 | ) | ||||||||
Total long-term debt of variable interest entities | $ | 138,051 | $ | 166,406 | $ | (28,355 | ) | (17.0 | ) | |||||
Total long-term debt of VIEs decreased due principally to the VIEs that hold the JEC and La Cygne leasehold interests having made principal payments totaling $28.3 million.
As of December 31, | |||||||||||||
2016 | 2015 | Change | % Change | ||||||||||
(Dollars in Thousands) | |||||||||||||
Deferred income tax liabilities | $ | 1,752,776 | $ | 1,591,430 | $ | 161,346 | 10.1 | ||||||
Long-term deferred income tax liabilities increased due primarily to the utilization of accelerated depreciation methods as well as the utilization of previously deferred net operating losses during the period.
As of December 31, | |||||||||||||
2016 | 2015 | Change | % Change | ||||||||||
(Dollars in Thousands) | |||||||||||||
Accrued employee benefits | $ | 512,412 | $ | 462,304 | $ | 50,108 | 10.8 | ||||||
Accrued employee benefits increased due primarily to higher pension and post-retirement benefit obligations as a result of a decrease in the discount rates used to calculate our and Wolf Creek’s pension benefit obligations.
As of December 31, | |||||||||||||
2016 | 2015 | Change | % Change | ||||||||||
(Dollars in Thousands) | |||||||||||||
Asset retirement obligations | $ | 323,951 | $ | 275,285 | $ | 48,666 | 17.7 | ||||||
AROs increased due primarily to a $39.9 million revision in our AROs related to the regulation of CCRs. See Note 14 of the Notes to Consolidated Financial Statements, “Commitments and Contingencies.” and Note 15 of the Notes to Consolidated Financial Statements, “Asset Retirement Obligations,” for additional information.
46
LIQUIDITY AND CAPITAL RESOURCES
Overview
Available sources of funds to operate our business include internally generated cash, short-term borrowings under Westar Energy’s commercial paper program and revolving credit facilities and access to capital markets. We expect to meet our day-to-day cash requirements including, among other items, fuel and purchased power, dividends, interest payments, income taxes and pension contributions, using primarily internally generated cash and short-term borrowings. To meet the cash requirements for our capital investments, we expect to use internally generated cash, short-term borrowings and proceeds from the issuance of debt and equity securities in the capital markets. When such balances are of sufficient size and it makes economic sense to do so, we also use proceeds from the issuance of long-term debt and equity securities to repay short-term borrowings, which are principally related to investments in capital equipment and the redemption of bonds and for working capital and general corporate purposes. In 2017, we expect to continue our significant capital spending program and plan to contribute to our pension trust. We continue to believe that we will have the ability to pay dividends. Although the agreement and plan of merger with Great Plains Energy contains customary restrictions on our ability to raise capital and pay dividends, we do not believe these restrictions will materially adversely impact our liquidity or ability to pay dividends in 2017. Uncertainties affecting our ability to meet cash requirements include, among others, factors affecting revenues described in “Item 1A. Risk Factors” and “—Operating Results” above, economic conditions, regulatory actions, compliance with environmental regulations and conditions in the capital markets. For additional information on our future cash requirements, see “—Future Cash Requirements” below.
Capital Structure
As of December 31, 2016 and 2015, our capital structure, excluding short-term debt, was as follows:
As of December 31, | |||
2016 | 2015 | ||
Common equity | 51% | 52% | |
Noncontrolling interests | <1% | <1% | |
Long-term debt, including VIEs | 49% | 48% | |
Short-Term Borrowings
Westar Energy maintains a commercial paper program pursuant to which it may issue commercial paper up to a maximum aggregate amount outstanding at any one time of $1.0 billion. This program is supported by Westar Energy’s revolving credit facilities. Maturities of commercial paper issuances may not exceed 365 days from the date of issuance and proceeds from such issuances will be used to temporarily fund capital expenditures, to redeem debt on an interim basis, for working capital and/or for other general corporate purposes. As of February 15, 2017, Westar Energy had $498.3 million of commercial paper issued and outstanding.
Westar Energy has two revolving credit facilities in the amounts of $730.0 million and $270.0 million. The $730.0 million facility will expire in September 2019, $20.7 million of which will expire in September 2017. In December 2016, Westar Energy extended the term of the $270.0 million facility by one year to terminate in February 2018. As long as there is no default under the facilities, the $730.0 million and $270.0 million facilities may be extended an additional year and the aggregate amount of borrowings under the $730.0 million and $270.0 million facilities may be increased to $1.0 billion and $400.0 million, respectively, subject to lender participation. All borrowings under the facilities are secured by KGE first mortgage bonds. Total combined borrowings under the revolving credit facilities and the commercial paper program may not exceed $1.0 billion at any given time. As of February 15, 2017, no amounts were borrowed and $12.3 million of letters of credit had been issued under the $730.0 million facility. No amounts were borrowed and no letters of credit were issued under the $270.0 million facility as of the same date.
A default by Westar Energy or KGE under other indebtedness totaling more than $25.0 million would be a default under both revolving credit facilities. Westar Energy is required to maintain a consolidated indebtedness to consolidated capitalization ratio of 65% or less at all times. At December 31, 2016, our ratio was 51%. See Note 9 of the Notes to Consolidated Financial Statements, “Short-Term Debt,” for additional information regarding our short-term borrowings.
47
Long-Term Debt Financing
As of December 31, 2016, we had $121.9 million of variable rate, tax-exempt bonds outstanding. While the interest rates for these bonds have been low, we continue to monitor the credit markets and evaluate our options with respect to these bonds.
In January 2017, Westar Energy retired $125.0 million in principal amount of first mortgage bonds bearing a stated interest at 5.15% maturing January 2017.
In June 2016, Westar Energy issued $350.0 million in principal amount of first mortgage bonds bearing a stated interest at 2.55% and maturing July 2026. The bonds were issued as “Green Bonds,” and all proceeds from the bonds will be used in renewable energy projects, primarily the construction of the Western Plains Wind Farm.
Also in June 2016, KGE redeemed and reissued $50.0 million in principal amount pollution control bonds maturing June 2031. The stated rate of the bonds was reduced from 4.85% to 2.50%.
In February 2016, KGE, as lessee to the La Cygne sale-leaseback, effected a redemption and reissuance of $162.1 million in outstanding bonds held by the trustee of the lease maturing March 2021. The stated interest rate of the bonds was reduced from 5.647% to 2.398%. See Note 18 of the Notes to Consolidated Financial Statements, “Variable Interest Entities,” for additional information regarding our La Cygne sale-leaseback.
The Westar Energy and KGE mortgages each contain provisions restricting the amount of first mortgage bonds that can be issued by each entity. We must comply with such restrictions prior to the issuance of additional first mortgage bonds or other secured indebtedness.
Under the Westar Energy mortgage, the issuance of bonds is subject to limitations based on the amount of bondable property additions. In addition, so long as any bonds issued prior to January 1, 1997, remain outstanding, the mortgage prohibits additional first mortgage bonds from being issued, except in connection with certain refundings, unless Westar Energy’s unconsolidated net earnings available for interest, depreciation and property retirement (which as defined, does not include earnings or losses attributable to the ownership of securities of subsidiaries), for a period of 12 consecutive months within 15 months preceding the issuance, are not less than the greater of twice the annual interest charges on or 10% of the principal amount of all first mortgage bonds outstanding after giving effect to the proposed issuance. As of December 31, 2016, approximately $931.6 million principal amount of additional first mortgage bonds could be issued under the most restrictive provisions in the mortgage, except in connection with certain refundings.
Under the KGE mortgage, the amount of first mortgage bonds authorized is limited to a maximum of $3.5 billion and the issuance of bonds is subject to limitations based on the amount of bondable property additions. In addition, the mortgage prohibits additional first mortgage bonds from being issued, except in connection with certain refundings, unless KGE’s net earnings before income taxes and before provision for retirement and depreciation of property for a period of 12 consecutive months within 15 months preceding the issuance are not less than either two and one-half times the annual interest charges on or 10% of the principal amount of all KGE first mortgage bonds outstanding after giving effect to the proposed issuance. As of December 31, 2016, approximately $1.5 billion principal amount of additional KGE first mortgage bonds could be issued under the most restrictive provisions in the mortgage, except in connection with certain refundings.
Some of our debt instruments contain restrictions that require us to maintain leverage ratios as defined in the credit agreements. We calculate these ratios in accordance with the agreements and they are used to determine compliance with our various debt covenants. We were in compliance with these covenants as of December 31, 2016.
Impact of Credit Ratings on Debt Financing
Moody’s Investors Service (Moody’s) and Standard & Poor’s Ratings Services (S&P) are independent credit-rating agencies that rate our debt securities. These ratings indicate each agency’s assessment of our ability to pay interest and principal when due on our securities.
In general, more favorable credit ratings increase borrowing opportunities and reduce the cost of borrowing. Under Westar Energy’s revolving credit facilities and commercial paper program, our cost of borrowings is determined in part by credit ratings. However, Westar Energy’s ability to borrow under the credit facilities and commercial paper program are not conditioned on maintaining a particular credit rating. We may enter into new credit agreements that contain credit rating conditions, which could affect our liquidity and/or our borrowing costs.
48
Factors that impact our credit ratings include a combination of objective and subjective criteria. Objective criteria include typical financial ratios, such as total debt to total capitalization and funds from operations to total debt, among others, future capital expenditures and our access to liquidity including committed lines of credit. Subjective criteria include such items as the quality and credibility of management, the political and regulatory environment we operate in and an assessment of our governance and risk management practices.
As of February 15, 2017, our ratings with the agencies are as shown in the table below.
Westar Energy First Mortgage Bond Rating | KGE First Mortgage Bond Rating | Westar Energy Commercial Paper | Rating Outlook | ||||
Moody’s | A2 | A2 | P-2 | Stable | |||
S&P (a) | A | A | A-2 | Negative | |||
_______________
(a) | In May 2016, following the public announcement of the proposed merger with Great Plains Energy, S&P revised its outlook for Westar Energy and KGE to negative from stable, pending the outcome of the merger. |
Common Stock
Westar Energy’s Restated Articles of Incorporation, as amended, provide for 275.0 million authorized shares of common stock. As of December 31, 2016, Westar Energy had 141.8 million shares issued and outstanding.
Summary of Cash Flows
Year Ended December 31, | ||||||||||||
2016 | 2015 | 2014 | ||||||||||
(In Thousands) | ||||||||||||
Cash flows from (used in): | ||||||||||||
Operating activities | $ | 822,420 | $ | 715,850 | $ | 825,230 | ||||||
Investing activities | (1,012,760 | ) | (649,704 | ) | (838,748 | ) | ||||||
Financing activities | 190,175 | (67,471 | ) | 13,587 | ||||||||
Net (decrease) increase in cash and cash equivalents | $ | (165 | ) | $ | (1,325 | ) | $ | 69 | ||||
Cash Flows from Operating Activities
Cash flows from operating activities increased $106.6 million in 2016 compared to 2015 due principally to our having paid $92.8 million less for coal and natural gas and $27.0 million less for interest, while having received $91.2 million more from retail customers. Partially offsetting these increases was our having received $32.7 million less for wholesale power sales and transmission services, while having paid $20.2 million more for purchase power and transmission services and $13.5 million more in income tax payments.
Cash flows from operating activities decreased $109.4 million in 2015 compared to 2014 due principally to our having received $62.8 million less for wholesale power sales and transmission services, $51.8 million less from retail customers and$10.0 million less for energy marketing activities, while having paid $25.2 million more for the Wolf Creek refueling outage. Partially offsetting these decreases was our having paid $40.1 million less for coal and natural gas.
Cash Flows used in Investing Activities
Cash flows used in investing activities increased $363.1 million in 2016 compared to 2015 due primarily to our having invested $386.7 million more in additions to property, plant and equipment primarily related to the construction of Western Plains Wind Farm. Partially offsetting these increase was our having received $25.9 million more from our investment in COLI.
49
Cash flows used in investing activities decreased $189.0 million in 2015 compared to 2014 due primarily to our having invested $151.8 million less in additions to property, plant and equipment and our having received $23.6 million more from our investment in COLI.
Cash Flows from (used in) Financing Activities
Cash flows from financing activities increased $257.6 million in 2016 compared to 2015. The increase was due principally to our having redeemed $585.9 million less in long-term debt, issued $162.0 million more in long-term debt of VIEs and issued $123.5 million more in commercial paper. Partially offsetting these increases was our having issued $255.6 million less in common stock, redeemed $162.4 million more in long-term debt of VIEs, issued $147.6 million less in long-term debt, repaid $24.7 million more for borrowings against the cash surrender value of COLI and paid $18.2 million more in dividends.
Cash flows from financing activities decreased $81.1 million in 2015 compared to 2014. The decrease was due primarily to our having redeemed $208.4 million more in long-term debt, issuing $129.7 million less in commercial paper, and repaying $23.3 million more for borrowings against the cash surrender value of COLI. Partially offsetting these decreases was our having issued $170.3 million more in common stock and issuing $125.9 million more in long-term debt.
Future Cash Requirements
Our business requires significant capital investments. Through 2019, we expect to need cash primarily for utility construction programs designed to improve and expand facilities related to providing electric service, which include, but are not limited to, expenditures to develop new transmission lines and other improvements to our power plants, transmission and distribution lines and equipment. We expect to meet these cash needs with internally generated cash, short-term borrowings and the issuance of securities in the capital markets.
Capital expenditures for 2016 and anticipated capital expenditures, including costs of removal, for 2017 through 2019 are shown in the following table.
Actual | Projected | ||||||||||||||
2016 | 2017 | 2018 | 2019 | ||||||||||||
(In Thousands) | |||||||||||||||
Generation: | |||||||||||||||
Replacements and other | $ | 151,083 | $ | 173,500 | $ | 187,000 | $ | 148,900 | |||||||
Environmental | 62,307 | 25,000 | 28,300 | 18,600 | |||||||||||
Wind development | 340,535 | 10,800 | 5,900 | 6,300 | |||||||||||
Nuclear fuel | 20,021 | 45,300 | 21,100 | 24,800 | |||||||||||
Transmission | 212,168 | 253,300 | 246,300 | 243,700 | |||||||||||
Distribution | 237,107 | 206,500 | 184,100 | 236,500 | |||||||||||
Other | 63,749 | 88,600 | 87,300 | 75,200 | |||||||||||
Total capital expenditures | $ | 1,086,970 | $ | 803,000 | $ | 760,000 | $ | 754,000 | |||||||
We prepare these estimates for planning purposes and revise them from time to time. Actual expenditures will differ, perhaps materially, from our estimates due to changes following the closing of the proposed merger with Great Plains Energy, changing regulatory requirements, changing costs, delays or advances in engineering, construction or permitting, changes in the availability and cost of capital and other factors discussed in “Item 1A. Risk Factors.” We and our generating plant co-owners periodically evaluate these estimates and this may result in material changes in actual costs.
50
We will also need significant amounts of cash in the future to meet our long-term debt obligations. The principal amounts of our long-term debt maturities as of December 31, 2016, are as follows.
Year | Long-term debt | Long-term debt of VIEs | ||||||
(In Thousands) | ||||||||
2017 | $ | 125,000 | $ | 26,842 | ||||
2018 | — | 28,538 | ||||||
2019 | 300,000 | 31,485 | ||||||
2020 | 250,000 | 32,254 | ||||||
2021 | — | 18,843 | ||||||
Thereafter | 2,876,940 | — | ||||||
Total maturities | $ | 3,551,940 | $ | 137,962 | ||||
Pension Obligation
The amount we contribute to our pension plan for future periods is not yet known, however, in general we expect to fund our pension plan each year at least to a level equal to current year pension expense. We must also meet minimum funding requirements under the Employee Retirement Income Security Act, as amended by the Pension Protection Act. We may contribute additional amounts from time to time as deemed appropriate.
We contributed $20.2 million to our pension trust in 2016 and $41.0 million in 2015. We expect to contribute approximately $25.2 million in 2017. In 2016 and 2015, we also funded $14.8 million and $5.8 million, respectively, of Wolf Creek’s pension plan contributions. In 2017, we plan to contribute $10.8 million to fund Wolf Creek’s pension plan contributions. See Notes 12 and 13 of the Notes to Consolidated Financial Statements, “Employee Benefit Plans” and “Wolf Creek Employee Benefit Plans,” for additional discussion of Westar Energy and Wolf Creek benefit plans, respectively.
OFF-BALANCE SHEET ARRANGEMENTS
We have off-balance sheet arrangements in the form of operating leases and letters of credit entered into in the ordinary course of business. We did not have any additional off-balance sheet arrangements as of December 31, 2016.
CONTRACTUAL OBLIGATIONS AND COMMERCIAL COMMITMENTS
In the course of our business activities, we enter into a variety of contracts and commercial commitments. Some of these result in direct obligations reflected on our consolidated balance sheets while others are commitments, some firm and some based on uncertainties, not reflected in our underlying consolidated financial statements.
51
Contractual Cash Obligations
The following table summarizes the projected future cash payments for our contractual obligations existing as of December 31, 2016.
Total | 2017 | 2018 - 2019 | 2020 - 2021 | Thereafter | |||||||||||||||
(In Thousands) | |||||||||||||||||||
Long-term debt (a) | $ | 3,551,940 | $ | 125,000 | $ | 300,000 | $ | 250,000 | $ | 2,876,940 | |||||||||
Long-term debt of VIEs (a) | 137,962 | 26,842 | 60,023 | 51,097 | — | ||||||||||||||
Interest on long-term debt (b) | 2,739,464 | 152,758 | 288,482 | 245,582 | 2,052,642 | ||||||||||||||
Interest on long-term debt of VIEs | 8,184 | 3,070 | 4,050 | 1,064 | — | ||||||||||||||
Long-term debt, including interest | 6,437,550 | 307,670 | 652,555 | 547,743 | 4,929,582 | ||||||||||||||
Pension and post-retirement benefit expected contributions (c) | 36,600 | 36,600 | — | — | — | ||||||||||||||
Capital leases (d) | 77,507 | 5,803 | 10,823 | 8,385 | 52,496 | ||||||||||||||
Operating leases (e) | 56,176 | 13,007 | 21,933 | 13,391 | 7,845 | ||||||||||||||
Other obligations of VIEs (f) | 10,316 | 5,760 | 4,556 | — | — | ||||||||||||||
Fossil fuel (g) | 765,187 | 198,644 | 342,753 | 176,907 | 46,883 | ||||||||||||||
Nuclear fuel (h) | 210,641 | 38,018 | 34,832 | 36,882 | 100,909 | ||||||||||||||
Wind development obligations | 38,076 | 38,076 | — | — | — | ||||||||||||||
Unconditional purchase obligations | 379,295 | 272,635 | 98,560 | 8,100 | — | ||||||||||||||
Total contractual obligations (i) | $ | 8,011,348 | $ | 916,213 | $ | 1,166,012 | $ | 791,408 | $ | 5,137,715 | |||||||||
_______________
(a) | See Note 10 of the Notes to Consolidated Financial Statements, “Long-Term Debt,” for individual maturities. |
(b) | We calculate interest on our variable rate debt based on the effective interest rates as of December 31, 2016. |
(c) | Our contribution amounts for future periods are not yet known. See Notes 12 and 13 of the Notes to Consolidated Financial Statements, “Employee Benefit Plans” and “Wolf Creek Employee Benefit Plans,” for additional information regarding pension and post-retirement benefits. |
(d) | Includes principal and interest on capital leases. |
(e) | Includes leases for operating facilities, operating equipment, office space, office equipment, vehicles and rail cars as well as other miscellaneous commitments. |
(f) | See Note 18 of the Notes to Consolidated Financial Statements, “Variable Interest Entities,” for additional information on VIEs. |
(g) | Coal and natural gas commodity and transportation contracts. |
(h) | Uranium concentrates, conversion, enrichment and fabrication. |
(i) | We have $1.6 million of unrecognized income tax benefits that are not included in this table because we cannot reasonably estimate the timing of the cash payments to taxing authorities assuming those unrecognized income tax benefits are settled at the amounts accrued as of December 31, 2016. |
OTHER INFORMATION
Changes in Prices
See Note 4 of the Notes to Consolidated Financial Statements, “Rate Matters and Regulation,” for information on our prices.
Wolf Creek Outage
Wolf Creek normally operates on an 18-month planned refueling and maintenance outage schedule. As authorized by our regulators, incremental maintenance costs of planned refueling and maintenance outages are deferred and amortized ratably over the period between planned refueling and maintenance outages. In fall of 2016, Wolf Creek underwent a planned refueling and maintenance outage. Our share of the outage costs was approximately $24.2 million. The next refueling and maintenance outage is planned for the spring of 2018.
52
Stock-Based Compensation
We use two types of restricted share units (RSUs) for our stock-based compensation awards; those with service requirements and those with performance measures. See Note 12 of the Notes to Consolidated Financial Statements, “Employee Benefit Plans,” for additional information. Total unrecognized compensation cost related to RSU awards with only service requirements was $5.0 million as of December 31, 2016, and we expect to recognize these costs over a remaining weighted-average period of 1.8 years. Total unrecognized compensation cost related to RSU awards with performance measures was $4.5 million as of December 31, 2016, and we expect to recognize these costs over a remaining weighted-average period of 1.7 years. Upon consummation of the merger, all unrecognized compensation costs for outstanding RSU awards will be expensed on our income statement.
ITEM 7A. QUANTITATIVE AND QUALITATIVE DISCLOSURES ABOUT MARKET RISK
Our fuel procurement and energy marketing activities involve primary market risk exposures, including commodity price risk, credit risk and interest rate risk. Commodity price risk is the potential adverse price impact related to the purchase or sale of electricity and energy-related products. Credit risk is the potential adverse financial impact resulting from non-performance by a counterparty of its contractual obligations. Interest rate risk is the potential adverse financial impact related to changes in interest rates. In addition, our investments in trusts to fund nuclear plant decommissioning and to fund non-qualified retirement benefits give rise to security price risk. Many of the securities in these trusts are exposed to price fluctuations in the capital markets.
Commodity Price Risk
We engage in both financial and physical trading with the goal of managing our commodity price risk, enhancing system reliability and increasing profits. We procure and trade electricity, coal, natural gas and other energy-related products by utilizing energy commodity contracts and a variety of financial instruments, including futures contracts, options and swaps.
We use various types of fuel, including coal, natural gas, uranium and diesel to operate our plants and also purchase power to meet customer demand. Our prices and consolidated financial results are exposed to market risks from commodity price changes for electricity and other energy-related products as well as from interest rates. Volatility in these markets impacts our costs of purchased power, costs of fuel for our generating plants and our participation in energy markets. We strive to manage our customers’ and our exposure to these market risks through regulatory, operating and financing activities and, when we deem appropriate, we economically hedge a portion of these risks through the use of derivative financial instruments for non-trading purposes.
Factors that affect our commodity price exposure are the quantity and availability of fuel used for generation, the availability of our power plants and the quantity of electricity customers consume. Quantities of fossil fuel we use to generate electricity fluctuate from period to period based on availability, price and deliverability of a given fuel type, as well as planned and unscheduled outages at our generating plants that use fossil fuels. Our commodity price exposure is also affected by our nuclear plant refueling and maintenance schedule. Our customers’ electricity usage also varies based on weather, the economy and other factors.
We trade various types of fuel primarily to reduce exposure related to the volatility of commodity prices. A significant portion of our coal requirements is purchased under long-term contracts to hedge much of the fuel exposure for customers. If we were unable to generate an adequate supply of electricity for our customers, we would purchase power in the wholesale market to the extent it is available, subject to possible transmission constraints, and/or implement curtailment or interruption procedures as permitted in our tariffs and terms and conditions of service.
53
One way by which we manage and measure the commodity price risk of our trading portfolio is by using a variance/covariance value-at-risk (VaR) model. In addition to VaR, we employ additional risk control processes such as stress testing, daily loss limits, credit limits and position limits. We expect to use similar control processes in the future. The use of VaR requires assumptions, including the selection of a confidence level and a measure of volatility associated with potential losses and the estimated holding period. We express VaR as a potential dollar loss based on a 95% confidence level using a one-day holding period and a 20-day historical observation period. It is possible that actual results may differ significantly from assumptions. Accordingly, VaR may not accurately reflect our levels of exposure. The energy trading portfolio VaR amounts for 2016 and 2015 were as follows:
2016 | 2015 | ||||||
(In Thousands) | |||||||
High | $ | 644 | $ | 514 | |||
Low | 123 | 56 | |||||
Average | 292 | 199 | |||||
Interest Rate Risk
We have entered into numerous fixed and variable rate debt obligations. For details, see Note 10 of the Notes to Consolidated Financial Statements, “Long-Term Debt.” We manage our interest rate risk related to these debt obligations by limiting our exposure to variable interest rate debt, diversifying maturity dates and entering into treasury yield hedge transactions. We may also use other financial derivative instruments such as interest rate swaps. We compute and present information about the sensitivity to changes in interest rates for variable rate debt and current maturities of fixed rate debt by assuming a 100 basis point change in the current interest rates applicable to such debt over the remaining time the debt is outstanding.
We had approximately $640.5 million of variable rate debt and current maturities of fixed rate debt as of December 31, 2016. A 100 basis point change in interest rates applicable to this debt would impact income before income taxes on an annualized basis by approximately $6.3 million. As of December 31, 2016, we had $121.9 million of variable rate bonds insured by bond insurers. Interest rates payable under these bonds are normally set through periodic auctions. However, conditions in the credit markets over the past few years caused a dramatic reduction in the demand for auction bonds, which led to failed auctions. The contractual provisions of these securities set forth an indexing formula method by which interest will be paid in the event of an auction failure. Depending on the level of these reference indices, our interest costs may be higher or lower than what they would have been had the securities been auctioned successfully. Additionally, should insurers of those bonds experience a decrease in their credit ratings, such event could increase our borrowing costs. Furthermore, a decline in interest rates generally can serve to increase our pension and post-retirement benefit obligations.
Security Price Risk
We maintain the NDT, as required by the NRC and Kansas statute, to fund certain costs of nuclear plant decommissioning. As of December 31, 2016, investments in the NDT were allocated 49% to equity securities, 30% to debt securities, 7% to combination debt/equity/other securities, 9% to alternative investments, 5% to real estate securities and less than 1% to cash equivalents. As of December 31, 2016 and 2015, the fair value of the NDT investments was $200.1 million and $184.1 million, respectively. Changes in interest rates and/or other market changes resulting in a 10% decrease in the value of the securities would have resulted in a $20.0 million decrease in the value of the NDT as of December 31, 2016.
We also maintain a trust to fund non-qualified retirement benefits. As of December 31, 2016, investments in the trust were comprised of 66% equity securities, 33% debt securities and less than 1% cash equivalents. The fair value of the investments in this trust was $34.5 million as of December 31, 2016, and $33.9 million as of December 31, 2015. Changes in interest rates and/or other market changes resulting in a 10% decrease in the value of the securities would have resulted in a $3.4 million decrease in the value of the trust as of December 31, 2016.
By maintaining diversified portfolios of securities, we seek to optimize the returns to fund the aforementioned obligations within acceptable risk tolerances, including interest rate risk. However, many of the securities in the portfolios are exposed to price fluctuations in the capital markets. If the value of the securities diminishes, the cost of funding the obligations rises. We actively monitor the portfolios by benchmarking the performance of the investments against relevant indices and by maintaining and periodically reviewing the asset allocations in relation to established policy targets. Our exposure to security price risk related to the NDT is in part mitigated because we are currently allowed to recover decommissioning costs in the prices we charge our customers.
54
ITEM 8. FINANCIAL STATEMENTS AND SUPPLEMENTARY DATA
TABLE OF CONTENTS | PAGE |
Financial Statements: | |
Westar Energy, Inc. and Subsidiaries: | |
Financial Schedules: | |
SCHEDULES OMITTED
The following schedules are omitted because of the absence of the conditions under which they are required or the information is included in our consolidated financial statements and schedules presented:
I, III, IV and V.
55
MANAGEMENT’S REPORT ON INTERNAL CONTROL OVER FINANCIAL REPORTING
We are responsible for establishing and maintaining adequate internal control over financial reporting. Internal control over financial reporting is defined in Rules 13a-15(f) promulgated under the Securities Exchange Act of 1934 as a process designed by, or under the supervision of, the company’s principal executive and principal financial officers and effected by the company’s board of directors, management and other personnel, to provide reasonable assurance regarding the reliability of financial reporting and the preparation of financial statements for external purposes in accordance with generally accepted accounting principles (GAAP) and includes those policies and procedures that:
• | Pertain to the maintenance of records that in reasonable detail accurately and fairly reflect the transactions and dispositions of the assets of the company; |
• | Provide reasonable assurance that transactions are recorded as necessary to permit preparation of financial statements in accordance with GAAP, and that receipts and expenditures of the company are being made only in accordance with authorizations of management and directors of the company; and |
• | Provide reasonable assurance regarding prevention or timely detection of unauthorized acquisition, use or disposition of the company’s assets that could have a material effect on the financial statements. |
Because of its inherent limitations, internal control over financial reporting may not prevent or detect misstatements. Projections of any evaluation of effectiveness to future periods are subject to the risk that controls may become inadequate because of changes in conditions, or that the degree of compliance with the policies or procedures may deteriorate.
We assessed the effectiveness of our internal control over financial reporting as of December 31, 2016. In making this assessment, we used the criteria set forth in Internal Control - Integrated Framework (2013) issued by the Committee of Sponsoring Organizations of the Treadway Commission. Based on the assessment, we concluded that, as of December 31, 2016, our internal control over financial reporting is effective based on those criteria. Our independent registered public accounting firm has issued an audit report on the company’s internal control over financial reporting.
56
REPORT OF INDEPENDENT REGISTERED PUBLIC ACCOUNTING FIRM
To the Board of Directors and Stockholders of
Westar Energy, Inc.
Topeka, Kansas
We have audited the internal control over financial reporting of Westar Energy, Inc. and subsidiaries (the “Company”) as of December 31, 2016, based on criteria established in Internal Control - Integrated Framework (2013) issued by the Committee of Sponsoring Organizations of the Treadway Commission. The Company’s management is responsible for maintaining effective internal control over financial reporting and for its assessment of the effectiveness of internal control over financial reporting, included in the accompanying management’s report on internal control over financial reporting. Our responsibility is to express an opinion on the Company’s internal control over financial reporting based on our audit.
We conducted our audit in accordance with the standards of the Public Company Accounting Oversight Board (United States). Those standards require that we plan and perform the audit to obtain reasonable assurance about whether effective internal control over financial reporting was maintained in all material respects. Our audit included obtaining an understanding of internal control over financial reporting, assessing the risk that a material weakness exists, testing and evaluating the design and operating effectiveness of internal control based on the assessed risk, and performing such other procedures as we considered necessary in the circumstances. We believe that our audit provides a reasonable basis for our opinion.
A company’s internal control over financial reporting is a process designed by, or under the supervision of, the company’s principal executive and principal financial officers, or persons performing similar functions, and effected by the company’s board of directors, management, and other personnel to provide reasonable assurance regarding the reliability of financial reporting and the preparation of financial statements for external purposes in accordance with generally accepted accounting principles. A company’s internal control over financial reporting includes those policies and procedures that (1) pertain to the maintenance of records that, in reasonable detail, accurately and fairly reflect the transactions and dispositions of the assets of the company; (2) provide reasonable assurance that transactions are recorded as necessary to permit preparation of financial statements in accordance with generally accepted accounting principles, and that receipts and expenditures of the company are being made only in accordance with authorizations of management and directors of the company; and (3) provide reasonable assurance regarding prevention or timely detection of unauthorized acquisition, use, or disposition of the company’s assets that could have a material effect on the financial statements.
Because of the inherent limitations of internal control over financial reporting, including the possibility of collusion or improper management override of controls, material misstatements due to error or fraud may not be prevented or detected on a timely basis. Also, projections of any evaluation of the effectiveness of the internal control over financial reporting to future periods are subject to the risk that the controls may become inadequate because of changes in conditions, or that the degree of compliance with the policies or procedures may deteriorate.
In our opinion, the Company maintained, in all material respects, effective internal control over financial reporting as of December 31, 2016, based on the criteria established in Internal Control - Integrated Framework (2013) issued by the Committee of Sponsoring Organizations of the Treadway Commission.
We have also audited, in accordance with the standards of the Public Company Accounting Oversight Board (United States), the consolidated financial statements and financial statement schedule of the Company as of and for the year ended December 31, 2016 and our report dated February 22, 2017 expressed an unqualified opinion on those financial statements and financial statement schedule.
/s/ Deloitte & Touche LLP
Kansas City, Missouri
February 22, 2017
57
REPORT OF INDEPENDENT REGISTERED PUBLIC ACCOUNTING FIRM
To the Board of Directors and Stockholders of
Westar Energy, Inc.
Topeka, Kansas
We have audited the accompanying consolidated balance sheets of Westar Energy, Inc. and subsidiaries (the “Company”) as of December 31, 2016 and 2015, and the related consolidated statements of income, changes in equity, and cash flows for each of the three years in the period ended December 31, 2016. Our audits also included the financial statement schedule listed in the Index at Item 15. These financial statements and financial statement schedule are the responsibility of the Company’s management. Our responsibility is to express an opinion on the financial statements and financial statement schedule based on our audits.
We conducted our audits in accordance with the standards of the Public Company Accounting Oversight Board (United States). Those standards require that we plan and perform the audit to obtain reasonable assurance about whether the financial statements are free of material misstatement. An audit includes examining, on a test basis, evidence supporting the amounts and disclosures in the financial statements. An audit also includes assessing the accounting principles used and significant estimates made by management, as well as evaluating the overall financial statement presentation. We believe that our audits provide a reasonable basis for our opinion.
In our opinion, such consolidated financial statements present fairly, in all material respects, the financial position of Westar Energy, Inc. and subsidiaries as of December 31, 2016 and 2015, and the results of their operations and their cash flows for each of the three years in the period ended December 31, 2016, in conformity with accounting principles generally accepted in the United States of America. Also, in our opinion, such financial statement schedule, when considered in relation to the basic consolidated financial statements taken as a whole, presents fairly, in all material respects, the information set forth therein.
We have also audited, in accordance with the standards of the Public Company Accounting Oversight Board (United States), the Company’s internal control over financial reporting as of December 31, 2016, based on the criteria established in Internal Control-Integrated Framework (2013) issued by the Committee of Sponsoring Organizations of the Treadway Commission and our report dated February 22, 2017 expressed an unqualified opinion on the Company's internal control over financial reporting.
/s/ Deloitte & Touche LLP
Kansas City, Missouri
February 22, 2017
58
WESTAR ENERGY, INC.
CONSOLIDATED BALANCE SHEETS
(Dollars in Thousands, Except Par Values)
As of December 31, | |||||||
2016 | 2015 | ||||||
ASSETS | |||||||
CURRENT ASSETS: | |||||||
Cash and cash equivalents | $ | 3,066 | $ | 3,231 | |||
Accounts receivable, net of allowance for doubtful accounts of $6,667 and $5,294, respectively | 288,579 | 258,286 | |||||
Fuel inventory and supplies | 300,125 | 301,294 | |||||
Taxes receivable | 13,000 | — | |||||
Prepaid expenses | 16,528 | 16,864 | |||||
Regulatory assets | 117,383 | 109,606 | |||||
Other | 29,701 | 27,860 | |||||
Total Current Assets | 768,382 | 717,141 | |||||
PROPERTY, PLANT AND EQUIPMENT, NET | 9,248,359 | 8,524,902 | |||||
PROPERTY, PLANT AND EQUIPMENT OF VARIABLE INTEREST ENTITIES, NET | 257,904 | 268,239 | |||||
OTHER ASSETS: | |||||||
Regulatory assets | 762,479 | 751,312 | |||||
Nuclear decommissioning trust | 200,122 | 184,057 | |||||
Other | 249,828 | 260,015 | |||||
Total Other Assets | 1,212,429 | 1,195,384 | |||||
TOTAL ASSETS | $ | 11,487,074 | $ | 10,705,666 | |||
LIABILITIES AND EQUITY | |||||||
CURRENT LIABILITIES: | |||||||
Current maturities of long-term debt | $ | 125,000 | $ | — | |||
Current maturities of long-term debt of variable interest entities | 26,842 | 28,309 | |||||
Short-term debt | 366,700 | 250,300 | |||||
Accounts payable | 220,522 | 220,969 | |||||
Accrued dividends | 52,885 | 49,829 | |||||
Accrued taxes | 85,729 | 83,773 | |||||
Accrued interest | 72,519 | 71,426 | |||||
Regulatory liabilities | 15,760 | 25,697 | |||||
Other | 81,236 | 106,632 | |||||
Total Current Liabilities | 1,047,193 | 836,935 | |||||
LONG-TERM LIABILITIES: | |||||||
Long-term debt, net | 3,388,670 | 3,163,950 | |||||
Long-term debt of variable interest entities, net | 111,209 | 138,097 | |||||
Deferred income taxes | 1,752,776 | 1,591,430 | |||||
Unamortized investment tax credits | 210,654 | 209,763 | |||||
Regulatory liabilities | 223,693 | 267,114 | |||||
Accrued employee benefits | 512,412 | 462,304 | |||||
Asset retirement obligations | 323,951 | 275,285 | |||||
Other | 83,326 | 88,825 | |||||
Total Long-Term Liabilities | 6,606,691 | 6,196,768 | |||||
COMMITMENTS AND CONTINGENCIES (See Notes 14 and 16) | |||||||
EQUITY: | |||||||
Westar Energy, Inc. Shareholders’ Equity: | |||||||
Common stock, par value $5 per share; authorized 275,000,000 shares; issued and outstanding 141,791,153 shares and 141,353,426 shares, respective to each date | 708,956 | 706,767 | |||||
Paid-in capital | 2,018,317 | 2,004,124 | |||||
Retained earnings | 1,078,602 | 945,830 | |||||
Total Westar Energy, Inc. Shareholders’ Equity | 3,805,875 | 3,656,721 | |||||
Noncontrolling Interests | 27,315 | 15,242 | |||||
Total Equity | 3,833,190 | 3,671,963 | |||||
TOTAL LIABILITIES AND EQUITY | $ | 11,487,074 | $ | 10,705,666 | |||
The accompanying notes are an integral part of these consolidated financial statements.
59
WESTAR ENERGY, INC.
CONSOLIDATED STATEMENTS OF INCOME
(Dollars in Thousands, Except Per Share Amounts)
Year Ended December 31, | |||||||||||
2016 | 2015 | 2014 | |||||||||
REVENUES | $ | 2,562,087 | $ | 2,459,164 | $ | 2,601,703 | |||||
OPERATING EXPENSES: | |||||||||||
Fuel and purchased power | 509,496 | 561,065 | 705,450 | ||||||||
SPP network transmission costs | 232,763 | 229,043 | 218,924 | ||||||||
Operating and maintenance | 346,313 | 330,289 | 367,188 | ||||||||
Depreciation and amortization | 338,519 | 310,591 | 286,442 | ||||||||
Selling, general and administrative | 261,451 | 250,278 | 250,439 | ||||||||
Taxes other than income tax | 191,662 | 156,901 | 140,302 | ||||||||
Total Operating Expenses | 1,880,204 | 1,838,167 | 1,968,745 | ||||||||
INCOME FROM OPERATIONS | 681,883 | 620,997 | 632,958 | ||||||||
OTHER INCOME (EXPENSE): | |||||||||||
Investment earnings | 9,013 | 7,799 | 10,622 | ||||||||
Other income | 34,582 | 19,438 | 31,522 | ||||||||
Other expense | (18,012 | ) | (17,636 | ) | (18,389 | ) | |||||
Total Other Income | 25,583 | 9,601 | 23,755 | ||||||||
Interest expense | 161,726 | 176,802 | 183,118 | ||||||||
INCOME BEFORE INCOME TAXES | 545,740 | 453,796 | 473,595 | ||||||||
Income tax expense | 184,540 | 152,000 | 151,270 | ||||||||
NET INCOME | 361,200 | 301,796 | 322,325 | ||||||||
Less: Net income attributable to noncontrolling interests | 14,623 | 9,867 | 9,066 | ||||||||
NET INCOME ATTRIBUTABLE TO WESTAR ENERGY, INC. | $ | 346,577 | $ | 291,929 | $ | 313,259 | |||||
BASIC AND DILUTED EARNINGS PER AVERAGE COMMON SHARE OUTSTANDING ATTRIBUTABLE TO WESTAR ENERGY (see Note 2): | |||||||||||
Basic earnings per common share | $ | 2.43 | $ | 2.11 | $ | 2.40 | |||||
Diluted earnings per common share | $ | 2.43 | $ | 2.09 | $ | 2.35 | |||||
AVERAGE EQUIVALENT COMMON SHARES OUTSTANDING | 142,067,558 | 137,957,515 | 130,014,941 | ||||||||
DIVIDENDS DECLARED PER COMMON SHARE | $ | 1.52 | $ | 1.44 | $ | 1.40 | |||||
The accompanying notes are an integral part of these consolidated financial statements.
60
WESTAR ENERGY, INC.
CONSOLIDATED STATEMENTS OF CASH FLOWS
(Dollars in Thousands)
Year Ended December 31, | |||||||||||
2016 | 2015 | 2014 | |||||||||
CASH FLOWS FROM (USED IN) OPERATING ACTIVITIES: | |||||||||||
Net income | $ | 361,200 | $ | 301,796 | $ | 322,325 | |||||
Adjustments to reconcile net income to net cash provided by operating activities: | |||||||||||
Depreciation and amortization | 338,519 | 310,591 | 286,442 | ||||||||
Amortization of nuclear fuel | 26,714 | 26,974 | 26,051 | ||||||||
Amortization of deferred regulatory gain from sale leaseback | (5,495 | ) | (5,495 | ) | (5,495 | ) | |||||
Amortization of corporate-owned life insurance | 18,042 | 19,850 | 20,202 | ||||||||
Non-cash compensation | 9,353 | 8,345 | 7,280 | ||||||||
Net deferred income taxes and credits | 185,229 | 151,332 | 151,451 | ||||||||
Allowance for equity funds used during construction | (11,630 | ) | (2,075 | ) | (17,029 | ) | |||||
Changes in working capital items: | |||||||||||
Accounts receivable | (30,294 | ) | 9,042 | (17,291 | ) | ||||||
Fuel inventory and supplies | 1,790 | (53,263 | ) | (8,773 | ) | ||||||
Prepaid expenses and other | (7,431 | ) | (23,145 | ) | 36,717 | ||||||
Accounts payable | (8,149 | ) | 6,636 | 6,189 | |||||||
Accrued taxes | (5,942 | ) | 13,073 | 6,596 | |||||||
Other current liabilities | (86,359 | ) | (80,396 | ) | (31,624 | ) | |||||
Changes in other assets | 18,346 | 2,199 | 6,378 | ||||||||
Changes in other liabilities | 18,527 | 30,386 | 35,811 | ||||||||
Cash Flows from Operating Activities | 822,420 | 715,850 | 825,230 | ||||||||
CASH FLOWS FROM (USED IN) INVESTING ACTIVITIES: | |||||||||||
Additions to property, plant and equipment | (1,086,970 | ) | (700,228 | ) | (852,052 | ) | |||||
Purchase of securities - trusts | (46,581 | ) | (37,557 | ) | (9,075 | ) | |||||
Sale of securities - trusts | 47,026 | 37,930 | 11,125 | ||||||||
Investment in corporate-owned life insurance | (14,648 | ) | (14,845 | ) | (16,250 | ) | |||||
Proceeds from investment in corporate-owned life insurance | 92,677 | 66,794 | 43,234 | ||||||||
Investment in affiliated company | (655 | ) | (575 | ) | (8,000 | ) | |||||
Other investing activities | (3,609 | ) | (1,223 | ) | (7,730 | ) | |||||
Cash Flows used in Investing Activities | (1,012,760 | ) | (649,704 | ) | (838,748 | ) | |||||
CASH FLOWS FROM (USED IN) FINANCING ACTIVITIES: | |||||||||||
Short-term debt, net | 116,162 | (7,300 | ) | 122,406 | |||||||
Proceeds from long-term debt | 396,290 | 543,881 | 417,943 | ||||||||
Proceeds from long-term debt of variable interest entities | 162,048 | — | — | ||||||||
Retirements of long-term debt | (50,000 | ) | (635,891 | ) | (427,500 | ) | |||||
Retirements of long-term debt of variable interest entities | (190,357 | ) | (27,933 | ) | (27,479 | ) | |||||
Repayment of capital leases | (3,104 | ) | (2,591 | ) | (3,340 | ) | |||||
Borrowings against cash surrender value of corporate-owned life insurance | 57,850 | 59,431 | 59,766 | ||||||||
Repayment of borrowings against cash surrender value of corporate-owned life insurance | (89,284 | ) | (64,593 | ) | (41,249 | ) | |||||
Issuance of common stock | 2,439 | 257,998 | 87,669 | ||||||||
Distributions to shareholders of noncontrolling interests | (2,550 | ) | (1,076 | ) | (1,030 | ) | |||||
Cash dividends paid | (204,340 | ) | (186,120 | ) | (171,507 | ) | |||||
Other financing activities | (4,979 | ) | (3,277 | ) | (2,092 | ) | |||||
Cash Flows from (used in) Financing Activities | 190,175 | (67,471 | ) | 13,587 | |||||||
NET (DECREASE) INCREASE IN CASH AND CASH EQUIVALENTS | (165 | ) | (1,325 | ) | 69 | ||||||
CASH AND CASH EQUIVALENTS: | |||||||||||
Beginning of period | 3,231 | 4,556 | 4,487 | ||||||||
End of period | $ | 3,066 | $ | 3,231 | $ | 4,556 | |||||
The accompanying notes are an integral part of these consolidated financial statements.
61
WESTAR ENERGY, INC.
CONSOLIDATED STATEMENTS OF CHANGES IN EQUITY
(Dollars in Thousands)
Westar Energy, Inc. Shareholders | |||||||||||||||||||||||
Common stock shares | Common stock | Paid-in capital | Retained earnings | Non-controlling interests | Total equity | ||||||||||||||||||
Balance as of December 31, 2013 | 128,254,229 | $ | 641,271 | $ | 1,696,727 | $ | 724,776 | $ | 5,757 | $ | 3,068,531 | ||||||||||||
Net income | — | — | — | 313,259 | 9,066 | 322,325 | |||||||||||||||||
Issuance of stock | 3,026,239 | 15,131 | 72,538 | — | — | 87,669 | |||||||||||||||||
Issuance of stock for compensation and reinvested dividends | 406,986 | 2,035 | 7,120 | — | — | 9,155 | |||||||||||||||||
Tax withholding related to stock compensation | — | — | (2,092 | ) | — | — | (2,092 | ) | |||||||||||||||
Dividends declared on common stock ($1.40 per share) | — | — | — | (182,736 | ) | — | (182,736 | ) | |||||||||||||||
Stock compensation expense | — | — | 7,193 | — | — | 7,193 | |||||||||||||||||
Tax benefit on stock compensation | — | — | 875 | — | — | 875 | |||||||||||||||||
Deconsolidation of noncontrolling interests | — | — | — | — | (7,342 | ) | (7,342 | ) | |||||||||||||||
Distributions to shareholders of noncontrolling interests | — | — | — | — | (1,030 | ) | (1,030 | ) | |||||||||||||||
Other | — | — | (1,241 | ) | — | — | (1,241 | ) | |||||||||||||||
Balance as of December 31, 2014 | 131,687,454 | 658,437 | 1,781,120 | 855,299 | 6,451 | 3,301,307 | |||||||||||||||||
Net income | — | — | — | 291,929 | 9,867 | 301,796 | |||||||||||||||||
Issuance of stock | 9,249,986 | 46,250 | 211,748 | — | — | 257,998 | |||||||||||||||||
Issuance of stock for compensation and reinvested dividends | 415,986 | 2,080 | 8,373 | — | — | 10,453 | |||||||||||||||||
Tax withholding related to stock compensation | — | — | (3,277 | ) | — | — | (3,277 | ) | |||||||||||||||
Dividends declared on common stock ($1.44 per share) | — | — | — | (201,398 | ) | — | (201,398 | ) | |||||||||||||||
Stock compensation expense | — | — | 8,250 | — | — | 8,250 | |||||||||||||||||
Tax benefit on stock compensation | — | — | 1,307 | — | — | 1,307 | |||||||||||||||||
Distributions to shareholders of noncontrolling interests | — | — | — | — | (1,076 | ) | (1,076 | ) | |||||||||||||||
Other | — | — | (3,397 | ) | — | — | (3,397 | ) | |||||||||||||||
Balance as of December 31, 2015 | 141,353,426 | 706,767 | 2,004,124 | 945,830 | 15,242 | 3,671,963 | |||||||||||||||||
Net income | — | — | — | 346,577 | 14,623 | 361,200 | |||||||||||||||||
Issuance of stock | 48,101 | 241 | 2,198 | — | — | 2,439 | |||||||||||||||||
Issuance of stock for compensation and reinvested dividends | 389,626 | 1,948 | 7,737 | — | — | 9,685 | |||||||||||||||||
Tax withholding related to stock compensation | — | — | (4,979 | ) | — | — | (4,979 | ) | |||||||||||||||
Dividends declared on common stock ($1.52 per share) | — | — | — | (217,131 | ) | — | (217,131 | ) | |||||||||||||||
Stock compensation expense | — | — | 9,237 | — | — | 9,237 | |||||||||||||||||
Distributions to shareholders of noncontrolling interests | — | — | — | — | (2,550 | ) | (2,550 | ) | |||||||||||||||
Cumulative effect of accounting change - stock compensation | — | — | — | 3,326 | — | 3,326 | |||||||||||||||||
Balance as of December 31, 2016 | 141,791,153 | $ | 708,956 | $ | 2,018,317 | $ | 1,078,602 | $ | 27,315 | $ | 3,833,190 | ||||||||||||
The accompanying notes are an integral part of these consolidated financial statements.
62
WESTAR ENERGY, INC.
NOTES TO CONSOLIDATED FINANCIAL STATEMENTS
1. DESCRIPTION OF BUSINESS
We are the largest electric utility in Kansas. Unless the context otherwise indicates, all references in this Annual Report on Form 10-K to “the Company,” “we,” “us,” “our” and similar words are to Westar Energy, Inc. and its consolidated subsidiaries. The term “Westar Energy” refers to Westar Energy, Inc., a Kansas corporation incorporated in 1924, alone and not together with its consolidated subsidiaries.
We provide electric generation, transmission and distribution services to approximately 704,000 customers in Kansas. Westar Energy provides these services in central and northeastern Kansas, including the cities of Topeka, Lawrence, Manhattan, Salina and Hutchinson. Kansas Gas and Electric Company (KGE), Westar Energy’s wholly-owned subsidiary, provides these services in south-central and southeastern Kansas, including the city of Wichita. Both Westar Energy and KGE conduct business using the name Westar Energy. Our corporate headquarters is located at 818 South Kansas Avenue, Topeka, Kansas 66612.
2. SUMMARY OF SIGNIFICANT ACCOUNTING POLICIES
Principles of Consolidation
We prepare our consolidated financial statements in accordance with generally accepted accounting principles (GAAP) for the United States of America. Our consolidated financial statements include all operating divisions, majority owned subsidiaries and variable interest entities (VIEs) of which we maintain a controlling interest or are the primary beneficiary reported as a single reportable segment. Undivided interests in jointly-owned generation facilities are included on a proportionate basis. Intercompany accounts and transactions have been eliminated in consolidation.
Use of Management’s Estimates
When we prepare our consolidated financial statements, we are required to make estimates and assumptions that affect the reported amounts of assets, liabilities, revenues and expenses, and related disclosure of contingent assets and liabilities, at the date of our consolidated financial statements and the reported amounts of revenues and expenses during the reporting period. We evaluate our estimates on an ongoing basis, including those related to depreciation, unbilled revenue, valuation of investments, forecasted fuel costs included in our retail energy cost adjustment billed to customers, income taxes, pension and post-retirement benefits, our asset retirement obligations (AROs) including the decommissioning of Wolf Creek Generating Station (Wolf Creek), environmental issues, VIEs, contingencies and litigation. Actual results may differ from those estimates under different assumptions or conditions.
Regulatory Accounting
We apply accounting standards that recognize the economic effects of rate regulation. Accordingly, we have recorded regulatory assets and liabilities when required by a regulatory order or based on regulatory precedent. See Note 4, “Rate Matters and Regulation,” for additional information regarding our regulatory assets and liabilities.
Cash and Cash Equivalents
We consider investments that are highly liquid and have maturities of three months or less when purchased to be cash equivalents.
63
Fuel Inventory and Supplies
We state fuel inventory and supplies at average cost. Following are the balances for fuel inventory and supplies stated separately.
As of December 31, | |||||||
2016 | 2015 | ||||||
(In Thousands) | |||||||
Fuel inventory | $ | 107,086 | $ | 113,438 | |||
Supplies | 193,039 | 187,856 | |||||
Fuel inventory and supplies | $ | 300,125 | $ | 301,294 | |||
Property, Plant and Equipment
We record the value of property, plant and equipment, including that of VIEs, at cost. For plant, cost includes contracted services, direct labor and materials, indirect charges for engineering and supervision and an allowance for funds used during construction (AFUDC). AFUDC represents the allowed cost of capital used to finance utility construction activity. We compute AFUDC by applying a composite rate to qualified construction work in progress. We credit other income (for equity funds) and interest expense (for borrowed funds) for the amount of AFUDC capitalized as construction cost on the accompanying consolidated statements of income as follows:
Year Ended December 31, | |||||||||||
2016 | 2015 | 2014 | |||||||||
(Dollars In Thousands) | |||||||||||
Borrowed funds | $ | 9,964 | $ | 3,505 | $ | 12,044 | |||||
Equity funds | 11,630 | 2,075 | 17,029 | ||||||||
Total | $ | 21,594 | $ | 5,580 | $ | 29,073 | |||||
Average AFUDC Rates | 4.2 | % | 2.7 | % | 6.7 | % | |||||
We charge maintenance costs and replacements of minor items of property to expense as incurred, except for maintenance costs incurred for our planned refueling and maintenance outages at Wolf Creek. As authorized by regulators, we defer and amortize to expense ratably over the period between planned outages incremental maintenance costs incurred for such outages. When a unit of depreciable property is retired, we charge to accumulated depreciation the original cost less salvage value.
Depreciation
We depreciate utility plant using a straight-line method. The depreciation rates are based on an average annual composite basis using group rates that approximated 2.4% in 2016, 2.5% in 2015 and 2.4% in 2014.
Depreciable lives of property, plant and equipment are as follows.
Years | ||||
Fossil fuel generating facilities | 6 | to | 78 | |
Nuclear fuel generating facility | 55 | to | 71 | |
Wind generating facilities | 19 | to | 20 | |
Transmission facilities | 15 | to | 75 | |
Distribution facilities | 22 | to | 68 | |
Other | 5 | to | 30 | |
64
Nuclear Fuel
We record as property, plant and equipment our share of the cost of nuclear fuel used in the process of refinement, conversion, enrichment and fabrication. We reflect this at original cost and amortize such amounts to fuel expense based on the quantity of heat consumed during the generation of electricity as measured in millions of British thermal units. The accumulated amortization of nuclear fuel in the reactor was $40.0 million as of December 31, 2016, and $59.1 million as of December 31, 2015. The cost of nuclear fuel charged to fuel and purchased power expense was $26.8 million in 2016, $27.3 million in 2015 and $27.3 million in 2014.
Cash Surrender Value of Life Insurance
We recorded on our consolidated balance sheets in other long-term assets the following amounts related to corporate-owned life insurance (COLI) policies.
As of December 31, | |||||||
2016 | 2015 | ||||||
(In Thousands) | |||||||
Cash surrender value of policies | $ | 1,267,349 | $ | 1,299,408 | |||
Borrowings against policies | (1,137,360 | ) | (1,168,794 | ) | |||
Corporate-owned life insurance, net | $ | 129,989 | $ | 130,614 | |||
We record as income increases in cash surrender value and death benefits. We offset against policy income the interest expense that we incur on policy loans. Income from death benefits is highly variable from period to period.
Revenue Recognition
We record revenue at the time we deliver electricity to customers. We determine the amounts delivered to individual customers through systematic monthly readings of customer meters. At the end of each month, we estimate how much electricity we have delivered since the prior meter reading and record the corresponding unbilled revenue.
Our unbilled revenue estimate is affected by factors including fluctuations in energy demand, weather, line losses and changes in the composition of customer classes. We recorded estimated unbilled revenue of $74.4 million as of December 31, 2016, and $66.0 million as of December 31, 2015.
Allowance for Doubtful Accounts
We determine our allowance for doubtful accounts based on the age of our receivables. We charge receivables off when they are deemed uncollectible, which is based on a number of factors including specific facts surrounding an account and management’s judgment.
Income Taxes
We use the asset and liability method of accounting for income taxes. Under this method, we recognize deferred tax assets and liabilities for the future tax consequences attributable to temporary differences between the financial statement carrying amounts and the tax basis of existing assets and liabilities. We recognize the future tax benefits to the extent that realization of such benefits is more likely than not. We amortize deferred investment tax credits over the lives of the related properties as required by tax laws and regulatory practices. We recognize production tax credits in the year that electricity is generated to the extent that realization of such benefits is more likely than not.
We record deferred tax assets to the extent capital losses, operating losses or tax credits will be carried forward to future periods. However, when we believe based on available evidence that we do not, or will not, have sufficient future capital gains or taxable income in the appropriate taxing jurisdiction to realize the entire benefit during the applicable carryforward period, we record a valuation allowance against the deferred tax asset.
The application of income tax law is complex. Laws and regulations in this area are voluminous and often ambiguous. Accordingly, we must make judgments regarding income tax exposure. Interpretations of and guidance surrounding income tax laws and regulations change over time. As a result, changes in our judgments can materially affect amounts we recognize in our consolidated financial statements. See Note 11, “Taxes,” for additional detail on our accounting for income taxes.
65
Sales Tax
We account for the collection and remittance of sales tax on a net basis. As a result, we do not reflect sales tax in our consolidated statements of income.
Earnings Per Share
We have participating securities in the form of unvested restricted share units (RSUs) with nonforfeitable rights to dividend equivalents that receive dividends on an equal basis with dividends declared on common shares. As a result, we apply the two-class method of computing basic and diluted earnings per share (EPS).
To compute basic EPS, we divide the earnings allocated to common stock by the weighted average number of common shares outstanding. Diluted EPS includes the effect of issuable common shares resulting from our forward sale agreements, if any, and RSUs with forfeitable rights to dividend equivalents. We compute the dilutive effect of potential issuances of common shares using the treasury stock method.
The following table reconciles our basic and diluted EPS from net income.
Year Ended December 31, | |||||||||||
2016 | 2015 | 2014 | |||||||||
(Dollars In Thousands, Except Per Share Amounts) | |||||||||||
Net income | $ | 361,200 | $ | 301,796 | $ | 322,325 | |||||
Less: Net income attributable to noncontrolling interests | 14,623 | 9,867 | 9,066 | ||||||||
Net income attributable to Westar Energy, Inc. | 346,577 | 291,929 | 313,259 | ||||||||
Less: Net income allocated to RSUs | 714 | 646 | 790 | ||||||||
Net income allocated to common stock | $ | 345,863 | $ | 291,283 | $ | 312,469 | |||||
Weighted average equivalent common shares outstanding – basic | 142,067,558 | 137,957,515 | 130,014,941 | ||||||||
Effect of dilutive securities: | |||||||||||
RSUs | 407,123 | 299,198 | 181,397 | ||||||||
Forward sale agreements | — | 1,021,510 | 2,628,187 | ||||||||
Weighted average equivalent common shares outstanding – diluted (a) | 142,474,681 | 139,278,223 | 132,824,525 | ||||||||
Earnings per common share, basic | $ | 2.43 | $ | 2.11 | $ | 2.40 | |||||
Earnings per common share, diluted | $ | 2.43 | $ | 2.09 | $ | 2.35 | |||||
_______________
(a) | For the years ended December 31, 2016, 2015 and 2014, we had no antidilutive securities. |
66
Supplemental Cash Flow Information
Year Ended December 31, | |||||||||||
2016 | 2015 | 2014 | |||||||||
(In Thousands) | |||||||||||
CASH PAID FOR (RECEIVED FROM): | |||||||||||
Interest on financing activities, net of amount capitalized | $ | 139,029 | $ | 161,484 | $ | 160,292 | |||||
Interest on financing activities of VIEs | 5,846 | 10,430 | 12,183 | ||||||||
Income taxes, net of refunds | 13,103 | (410 | ) | 458 | |||||||
NON-CASH INVESTING TRANSACTIONS: | |||||||||||
Property, plant and equipment additions | 151,474 | 105,169 | 143,192 | ||||||||
Property, plant and equipment of VIEs | — | — | (7,342 | ) | |||||||
NON-CASH FINANCING TRANSACTIONS: | |||||||||||
Issuance of stock for compensation and reinvested dividends | 9,685 | 10,453 | 9,155 | ||||||||
Deconsolidation of VIEs | — | — | (7,342 | ) | |||||||
Assets acquired through capital leases | 2,744 | 3,130 | 8,717 | ||||||||
New Accounting Pronouncements
We prepare our consolidated financial statements in accordance with GAAP for the United States of America. To address current issues in accounting, the Financial Accounting Standards Board (FASB) issued the following new accounting pronouncements that may affect our accounting and/or disclosure.
Statement of Cash Flows
In August 2016, the FASB issued Accounting Standard Update (ASU) No. 2016-15, which clarifies how certain cash receipts and cash payments are presented and classified in the statement of cash flows. Among other clarifications, the guidance requires that cash proceeds received from the settlement of COLI policies be classified as cash inflows from investing activities and that cash payments for premiums on COLI policies may be classified as cash outflows for investing activities, operating activities or a combination of both. The guidance is effective for fiscal years beginning after December 15, 2017, with early adoption permitted. Retrospective application is required. We are evaluating the guidance and do not expect it to have a material impact on our consolidated financial statements.
Stock-based Compensation
In March 2016, the FASB issued ASU No. 2016-09 as part of its simplification initiative. The areas for simplification involve several aspects of the accounting for stock-based payment transactions, including the income tax consequences, classification of awards as either equity or liabilities, and classification on the statement of cash flows. The guidance is effective for fiscal years beginning after December 15, 2016, with early adoption permitted. We have elected to adopt effective January 1, 2016.
Prior to the adoption of ASU 2016-09, if the tax deduction for a stock-based payment award exceeded the compensation cost recorded for financial reporting, the additional tax benefit was recognized in additional paid-in capital and referred to as an excess tax benefit. Tax deficiencies were recognized either as an offset to the accumulated excess tax benefits, if any, or as reduction of income. The issuance of this ASU reflects the FASB’s decision that all prospective excess tax benefits and tax deficiencies should be recognized as income tax benefits or expense, respectively. Prior to the adoption of the ASU, additional paid-in-capital was not recognized to the extent that an excess tax benefit had not be realized (e.g., due to a carryforward of a net operating loss). Under the ASU, all excess tax benefits previously unrecognized because the related tax deduction had not reduced taxes payable are recognized on a modified retrospective basis as a cumulative-effect adjustment to retained earnings as of the date of adoption. Upon initial adoption, we recorded a $3.3 million cumulative effect adjustment to retained earnings for excess tax benefits that had not previously been recognized as well as a $3.3 million increase in deferred tax assets.
67
Further, the issuance of this ASU reflects the FASB’s decision that cash flows related to excess tax benefits should be classified as cash flows from operating activities on the consolidated statements of cash flows. Upon adoption, we have retrospectively presented cash flows from operating activities on the accompanying consolidated statements of cash flows for the years ended December 31, 2015 and 2014, as $1.3 million and $0.9 million higher than as previously reported, respectively. We have retrospectively presented cash flows used in financing activities as $1.3 million higher for the year ended December 31, 2015, than as previously reported and cash flows from financing activities as $0.9 million lower for the year ended December 31, 2014, than as previously reported.
Leases
In February 2016, the FASB issued ASU No. 2016-02, which requires a lessee to recognize right-of-use assets and lease liabilities, initially measured at present value of the lease payments, on its balance sheet for leases with terms longer than 12 months. Leases are to be classified as either financing or operating leases, with that classification affecting the pattern of expense recognition in the income statement. Accounting for leases by lessors is largely unchanged. The criteria used to determine lease classification will remain substantially the same, but will be more subjective under the new guidance. The guidance is effective for fiscal years beginning after December 15, 2018, with early adoption permitted. The guidance requires a modified retrospective approach for all leases existing at the earliest period presented, or entered into by the date of initial adoption, with certain practical expedients permitted. In 2016, we started evaluating our current leases to assess the initial impact on our consolidated financial results. We continue to evaluate the guidance and believe application of the guidance will result in an increase to our assets and liabilities on our consolidated balance sheet, with minimal impact to our consolidated statement of income. We also continue to monitor unresolved industry issues, including renewables and PPAs, pole attachments, easements and right-of-ways, and will analyze the related impacts.
Financial Instruments - Credit Losses
In June 2016, the FASB issued ASU No. 2016-13, which requires financial assets measured at amortized cost be presented at the net amount expected to be collected. The allowance for credit losses is a valuation account that is deducted from the amortized cost basis. The measurement of expected losses is based upon historical experience, current conditions, and reasonable and supportable forecasts that affect the collectability of the reported amount. This guidance is effective for fiscal years beginning after December 15, 2019, with early adoption permitted. We are evaluating the guidance and have not yet determined the impact on our consolidated financial statements.
Financial Instruments - Net Asset Value
In May 2015, the FASB issued ASU No. 2015-07, which removes the requirement to categorize certain investments measured at net asset value (NAV) per share within the fair value hierarchy. The guidance is effective for fiscal years beginning after December 15, 2015. We have adopted this guidance as of January 1, 2016. The guidance was adopted retrospectively. The adoption was limited to disclosure and does not have a material impact on our consolidated financial statements. See Note 5, “Financial Instruments and Trading Securities.”
Revenue Recognition
In May 2014, the FASB issued ASU No. 2014-09, which addresses revenue from contracts with customers. Subsequent ASUs have been released providing modifications and clarifications to ASU No. 2014-09. The objective of the new guidance is to establish principles to report useful information to users of financial statements about the nature, amount, timing and uncertainty of revenue from contracts with customers. Under the new standard, an entity must identify the performance obligations in a contract, determine the transaction price and allocate the price to specific performance obligations to recognize the revenue when the obligation is completed. This guidance is effective for fiscal years beginning after December 15, 2017. Early application of the standard is permitted for fiscal years beginning after December 15, 2016. The standard permits the use of either the retrospective application or cumulative effect transition method. We have not yet selected a transition method. We continue to analyze the impact of the new revenue standard and related ASUs. During 2016, initial revenue contract assessments were completed. In summary, material revenue streams were identified and representative contract/transaction types were sampled. We also continue to monitor unresolved industry issues, including items related to contributions in aid of construction, collectability and alternative revenue programs, and will analyze the related impacts to revenue recognition. Based upon our completed assessments, we do not expect the impact on our consolidated financial statements to be material.
68
3. PENDING MERGER
On May 29, 2016, we entered into an agreement and plan of merger (merger) with Great Plains Energy Incorporated (Great Plains Energy), a Missouri corporation, providing for the merger of a wholly-owned subsidiary of Great Plains Energy with and into Westar Energy, with Westar Energy surviving as a wholly-owned subsidiary of Great Plains Energy. At the closing of the merger, our shareholders will receive cash and shares of Great Plains Energy. Each issued and outstanding share of our common stock, other than certain restricted shares, will be canceled and automatically converted into $51.00 in cash, without interest, and a number of shares of Great Plains Energy common stock equal to an exchange ratio that may vary between 0.2709 and 0.3148, based upon the volume-weighted average share price of Great Plains Energy common stock on the New York Stock Exchange for the 20 consecutive full trading days ending on (and including) the third trading day immediately prior to the closing date of the transaction. Based on the closing price per share of Great Plains Energy common stock on the trading day prior to announcement of the merger, our shareholders would receive an implied $60.00 for each share of Westar Energy common stock.
The merger agreement includes certain restrictions and limitations on our ability to declare dividend payments. The merger agreement, without prior approval of Great Plains Energy, limits our quarterly dividends declared in 2017 to $0.40 per share, which represents an annualized increase of $0.08 per share, consistent with last year’s dividend increase.
The closing of the merger is subject to customary conditions including, among others, receipt of required regulatory approvals. On June 28, 2016, we and Great Plains Energy filed a joint application with the Kansas Corporation Commission (KCC) requesting approval of the merger. Unless otherwise agreed to by the applicants, Kansas law imposes a 300-day time limit on the KCC’s review of the joint application. On September 27, 2016, the KCC issued an order setting a procedural schedule for the application, with a KCC order date of April 24, 2017. On December 16, 2016, KCC staff and its representatives filed testimony that, among other things, objected to the proposed merger, stated that no changes could be made to the joint application filed by us and Great Plains Energy that would satisfy the KCC staff and recommended that the KCC reject the merger. A number of intervening parties also filed testimony against approval of the merger. On January 9, 2017, we and Great Plains Energy filed rebuttal testimony in response to the KCC staff and the other intervenors explaining why we and Great Plains Energy believe the joint application meets the KCC’s merger standards and why the merger is in the public interest. An evidentiary hearing was held at the KCC from January 30, 2017 to February 7, 2017.
In addition, there are two open dockets in Missouri related to the merger. In the first docket, Great Plains Energy sought approval from the Public Service Commission of the State of Missouri (MPSC) to waive certain affiliate transaction rules following the closing of the merger. In this docket, on October 12, 2016, and on October 26, 2016, the MPSC staff and the Office of Public Counsel (OPC), respectively, announced that each had entered into a Stipulation and Agreement with Great Plains Energy that, among other things, provided that MPSC staff and the OPC would not file a complaint, or support another complaint, to assert that the MPSC has jurisdiction over the merger. The Stipulation and Agreements are subject to approval by the MPSC. Regarding the second docket, on October 11, 2016, a consumer group filed complaints against us and Great Plains Energy with the MPSC seeking to have the MPSC assert jurisdiction over the merger, and various parties have intervened in these complaints. The MPSC dismissed the complaint against us on December 6, 2016, but the complaint against Great Plains Energy remains open. On February 16, 2017, the MPSC indicated at a public meeting that it would assert jurisdiction over the merger, and it requested that an order be prepared to assert jurisdiction. Accordingly, we believe Great Plains Energy will also need approval of the MPSC in order to consummate the merger.
On July 11, 2016, we and Great Plains filed a joint application with the Federal Energy Regulatory Commission (FERC) requesting approval of the merger. Approval of the merger application requires action by the FERC commissioners because it is a contested application. The Federal Power Act requires a quorum of three or more commissioners to act on a contested application. Following the resignation of the FERC Chairman effective February 3, 2017, the FERC commission is comprised only of two commissioners and is therefore unable to act on the application. A new commissioner must be appointed by the President of the United States, with the advice and consent of the United States Senate, before FERC will be able to act on the application. If the FERC commissioners do not issue an order on the application within 180 days after the application was deemed complete because of the lack of a quorum, approval of the application may be deemed granted by operation of law, unless an order is issued extending the time for review. The FERC staff has authority to issue an order extending the period for review of the application. Under these circumstances, we do not believe it is likely that the FERC staff will allow approval of our application to be deemed granted. We are unable to predict when FERC will regain a quorum or how the change in commissioners will impact the review of the application.
On July 22, 2016, Wolf Creek filed a request with the Nuclear Regulatory Commission (NRC) to approve an indirect transfer of control of Wolf Creek’s operating license.
69
On September 26, 2016, we and Great Plains Energy filed the antitrust notifications required under the Hart-Scott-Rodino Antitrust Improvements Act (HSR Act) to complete the merger. We and Great Plains Energy received early termination of the statutory waiting period under the HSR Act on October 21, 2016. Under the HSR Act, a new statutory waiting period will start one year from the date on which an existing waiting period expires, or October 21, 2017. Accordingly, if the merger has not closed prior to October 21, 2017, we and Great Plains Energy will need to re-file the necessary HSR Act notifications.
Also on September 26, 2016, the proposed merger was approved by our shareholders. Concurrently, shareholders of Great Plains Energy approved various matters necessary for Great Plains Energy to complete the merger.
The merger agreement, which contains customary representations, warranties and covenants, may be terminated by either party if the merger has not occurred by May 31, 2017. The termination date may be extended six months in order to obtain regulatory approvals. If the merger agreement is terminated under these circumstances, including the failure to obtain regulatory approvals, Great Plains Energy must pay us a termination fee of $380.0 million.
The merger agreement also provides for certain other termination rights for both us and Great Plains Energy. If (a) the merger agreement is terminated by either party because the end date occurred, or by us because Great Plains Energy is in breach of the merger agreement and (b) prior to such termination, an alternative acquisition proposal is made to Great Plains Energy or its board of directors or has been publicly disclosed and not withdrawn and within 12 months after termination of the merger agreement Great Plains Energy enters into an acquisition proposal, Great Plains Energy must pay us a termination fee of $180.0 million. In addition, if either party terminates the merger agreement because the end date occurred, or if Great Plains Energy terminates the merger agreement because we are in breach of the merger agreement, and (a) prior to such termination, an alternative acquisition proposal is made to us or our board of directors or is publicly disclosed and not withdrawn, and (b) within 12 months after termination of the merger agreement, we enter into a definitive agreement or consummate a transaction with respect to an acquisition proposal, we must pay Great Plains Energy a termination fee of $280.0 million.
In connection with this transaction, we have incurred merger-related expenses. During 2016, we incurred approximately $10.2 million of merger-related expenses, which are included in our selling, general, and administrative expenses. We expect total merger-related expenses will be approximately $30.0 million, with the majority of the expenses to coincide with the closing of the merger.
See also Note 16, “Legal Proceedings,” for more information on litigation related to the merger.
70
4. RATE MATTERS AND REGULATION
Regulatory Assets and Regulatory Liabilities
Regulatory assets represent incurred costs that have been deferred because they are probable of future recovery in customer prices. Regulatory liabilities represent probable future reductions in revenue or refunds to customers through the price setting process. Regulatory assets and liabilities reflected on our consolidated balance sheets are as follows.
As of December 31, | |||||||
2016 | 2015 | ||||||
(In Thousands) | |||||||
Regulatory Assets: | |||||||
Deferred employee benefit costs | $ | 381,129 | $ | 353,785 | |||
Amounts due from customers for future income taxes, net | 124,020 | 144,120 | |||||
Debt reacquisition costs | 115,502 | 121,631 | |||||
Depreciation | 63,171 | 65,797 | |||||
Asset retirement obligations | 35,487 | 31,996 | |||||
Retail energy cost adjustment | 32,451 | — | |||||
Treasury yield hedges | 25,927 | 25,634 | |||||
Wolf Creek outage | 20,316 | 16,561 | |||||
Ad valorem tax | 17,637 | 44,455 | |||||
Disallowed plant costs | 15,453 | 15,639 | |||||
La Cygne environmental costs | 14,370 | 15,446 | |||||
Analog meter unrecovered investment | 8,500 | 1,454 | |||||
Energy efficiency program costs | 7,097 | 7,922 | |||||
Other regulatory assets | 18,802 | 16,478 | |||||
Total regulatory assets | $ | 879,862 | $ | 860,918 | |||
Regulatory Liabilities: | |||||||
Deferred regulatory gain from sale leaseback | $ | 70,065 | $ | 75,560 | |||
Pension and other post-retirement benefits costs | 37,172 | 32,181 | |||||
Nuclear decommissioning | 34,094 | 30,659 | |||||
Jurisdictional allowance for funds used during construction | 33,119 | 32,673 | |||||
La Cygne leasehold dismantling costs | 27,742 | 25,330 | |||||
Kansas tax credits | 13,142 | 12,857 | |||||
Purchase power agreement | 9,265 | 9,972 | |||||
Removal costs | 5,663 | 53,834 | |||||
Retail energy cost adjustment | — | 12,686 | |||||
Other regulatory liabilities | 9,191 | 7,059 | |||||
Total regulatory liabilities | $ | 239,453 | $ | 292,811 | |||
Below we summarize the nature and period of recovery for each of the regulatory assets listed in the table above.
• | Deferred employee benefit costs: Includes $354.6 million for pension and post-retirement benefit obligations and $26.5 million for actual pension expense in excess of the amount of such expense recognized in setting our prices. The increase from 2015 to 2016 is attributable primarily to a decrease in the discount rates used to calculate our and Wolf Creek’s pension benefit obligations. During 2017, we will amortize to expense approximately $27.9 million of the benefit obligations and approximately $6.8 million of the excess pension expense. We are amortizing the excess pension expense over a five-year period. We do not earn a return on this asset. |
71
• | Amounts due from customers for future income taxes, net: In accordance with various orders, we have reduced our prices to reflect the income tax benefits associated with certain income tax deductions, thereby passing on these benefits to customers at the time we receive them. We believe it is probable that the net future increases in income taxes payable will be recovered from customers when these temporary income tax benefits reverse in future periods. We have recorded a regulatory asset, net of the regulatory liability, for these amounts. We also have recorded a regulatory liability for our obligation to customers for income taxes recovered in earlier periods when corporate income tax rates were higher than current income tax rates. This benefit will be returned to customers as these temporary differences reverse in future periods. The income tax-related regulatory assets and liabilities as well as unamortized investment tax credits are also temporary differences for which deferred income taxes have been provided. These items are measured by the expected cash flows to be received or settled in future prices. We do not earn a return on this net asset. |
• | Debt reacquisition costs: Includes costs incurred to reacquire and refinance debt. These costs are amortized over the term of the new debt. We do not earn a return on this asset. |
• | Depreciation: Represents the difference between regulatory depreciation expense and depreciation expense we record for financial reporting purposes. We earn a return on this asset and amortize the difference over the life of the related plant. |
• | Asset retirement obligations: Represents amounts associated with our AROs as discussed in Note 15, “Asset Retirement Obligations.” We recover these amounts over the life of the related plant. We do not earn a return on this asset. |
• | Retail energy cost adjustment: We are allowed to adjust our retail prices to reflect changes in the |
cost of fuel and purchased power needed to serve our customers. This item represents the actual cost
of fuel consumed in producing electricity and the cost of purchased power in excess of the amounts we
have collected from customers. We expect to recover in our prices this shortfall over a one-year
period. We do not earn a return on this asset.
• | Treasury yield hedges: Represents the effective portion of treasury yield hedge transactions. This amount will be amortized to interest expense over the term of the related debt. We do not earn a return on this asset. |
• | Wolf Creek outage: We defer the expenses associated with Wolf Creek’s scheduled refueling and maintenance outages and amortize these expenses during the period between planned outages. We do not earn a return on this asset. |
• | Ad valorem tax: Represents actual costs incurred for property taxes in excess of amounts collected in our prices. We expect to recover these amounts in our prices over a one-year period. We do not earn a return on this asset. |
• | Disallowed plant costs: Originally there was a decision to disallow certain costs related to the Wolf Creek plant. Subsequently, in 1987, the KCC revised its original conclusion and provided for recovery of an indirect disallowance with no return on investment. This regulatory asset represents the present value of the future expected revenues to be provided to recover these costs, net of the amounts amortized. |
• | La Cygne environmental costs: Represents the deferral of depreciation and amortization expense and associated carrying charges related to the La Cygne Generating Station (La Cygne) environmental project from the in-service date until late October 2015, the effective date of our state general rate review. This amount will be amortized over the life of the related asset. We earn a return on this asset. |
• | Analog meter unrecovered investment: Represents the deferral of unrecovered investment of analog meters retired between October 2015 and the next general rate case. Once these amounts are included in base rates established in our next general rate case, we will amortize these amounts over a five-year period. No return on this regulatory asset is allowed. |
72
• | Energy efficiency program costs: We accumulate and defer for future recovery costs related to our various energy efficiency programs. We will amortize such costs over a one-year period. We do not earn a return on this asset. |
• | Other regulatory assets: Includes various regulatory assets that individually are small in relation to the total regulatory asset balance. Other regulatory assets have various recovery periods. We do not earn a return on any of these assets. |
Below we summarize the nature and period of amortization for each of the regulatory liabilities listed in the table above.
• | Deferred regulatory gain from sale leaseback: Represents the gain KGE recorded on the 1987 sale and leaseback of its 50% interest in La Cygne unit 2. We amortize the gain over the lease term. |
• | Pension and other post-retirement benefits costs: Includes $7.4 million for pension and post-retirement benefit obligations and $29.8 million for pension and post-retirement expense recognized in setting our prices in excess of actual pension and post-retirement expense. During 2017, we will amortize to expense approximately $0.6 million of the benefit obligations and approximately $3.4 million of the excess pension and post-retirement expense recognized in setting our prices. We will amortize the excess pension and post-retirement expense over a five-year period. |
• | Nuclear decommissioning: We have a legal obligation to decommission Wolf Creek at the end of its useful life. This amount represents the difference between the fair value of the assets held in a decommissioning trust and the amount recorded for the accumulated accretion and depreciation expense associated with our ARO. See Notes 5, 6 and 15, “Financial Instruments and Trading Securities,” “Financial Investments” and “Asset Retirement Obligations,” respectively, for information regarding our nuclear decommissioning trust (NDT) and our ARO. |
• | Jurisdictional allowance for funds used during construction: This item represents AFUDC that is accrued subsequent to the time the associated construction charges are included in our rates and prior to the time the related assets are placed in service. The AFUDC is amortized to depreciation expense over the useful life of the asset that is placed in service. |
• | La Cygne leasehold dismantling costs: We are contractually obligated to dismantle a portion of La Cygne unit 2. This item represents amounts collected but not yet spent to dismantle this unit and the obligation will be discharged as we dismantle the unit. |
• | Kansas tax credits: This item represents Kansas tax credits on investments in utility plant. Amounts will be credited to customers subsequent to their realization over the remaining lives of the utility plant giving rise to the tax credits. |
• | Purchase power agreement: This item represents the amount included in retail electric rates from customers in excess of the costs incurred by us under the purchase power agreement with Westar Generating. We amortize the amount over a three-year period. |
• | Removal costs: Represents amounts collected, but not yet spent, to dispose of plant assets that do not represent legal retirement obligations. This liability will be discharged as removal costs are incurred. |
• | Retail energy cost adjustment: We are allowed to adjust our retail prices to reflect changes in the cost of fuel and purchased power needed to serve our customers. We bill customers based on our estimated costs. This item represents the amount we collected from customers that was in excess of our actual cost of fuel and purchased power. We will refund to customers this excess recovery over a one-year period. |
• | Other regulatory liabilities: Includes various regulatory liabilities that individually are relatively small in relation to the total regulatory liability balance. Other regulatory liabilities will be credited over various periods. |
73
KCC Proceedings
General and Abbreviated Rate Reviews
In October 2016, we filed an abbreviated rate review with the KCC to update our prices to include capital costs related to La Cygne environmental upgrades, investment to extend the life of Wolf Creek, costs related to programs to improve grid resiliency and costs associated with investments in other environmental projects during 2015. If approved, we estimate that the new prices will increase our annual retail revenues by approximately $17.4 million. The KCC is required to issue an order on our request within 240 days of our filing, which is in June 2017.
In September 2015, the KCC issued an order in our state general rate review allowing us to adjust our prices to include, among other things, additional investment in La Cygne environmental upgrades and investment to extend the life of Wolf Creek. The new prices were effective late October 2015 and are expected to increase our annual retail revenues by approximately $78.3 million.
Environmental Costs
In October 2015, in connection with the state general rate review, we agreed to no longer make annual filings with the KCC to adjust our prices to include costs associated with investments in air quality equipment made during the prior year. The existing balance of costs associated with these investments were rolled into our base prices. In the future, we will need to seek approval from the KCC for individual projects. In the most recent three years, the KCC issued orders related to such filings allowing us to increase our annual retail revenues by approximately:
• | $10.8 million effective in June 2015; and |
• | $11.0 million effective in June 2014. |
Transmission Costs
We make annual filings with the KCC to adjust our prices to include updated transmission costs as reflected in our transmission formula rate (TFR) discussed below. In the most recent three years, the KCC issued orders related to such filings allowing us to increase our annual retail revenues by approximately:
• | $7.0 million effective in April 2016; |
• | $7.2 million effective in April 2015; and |
• | $41.0 million effective in April 2014. |
In June 2016, the KCC approved an order allowing us to adjust our retail prices to include updated transmission costs as reflected in the TFR, along with the reduced return on equity (ROE) as described below. The updated prices were retroactively effective April 2016. We have begun refunding our previously-recorded refund obligation and as of December 31, 2016, we have a remaining refund obligation of $1.3 million, which is included in current regulatory liabilities on our balance sheet.
Property Tax Surcharge
We make annual filings with the KCC to adjust our prices to include the cost incurred for property taxes. In October 2015, in connection with the state general rate review, the existing balance of costs incurred for property taxes were rolled into our base prices. In the most recent four years, the KCC issued orders related to such filings allowing us to adjust our annual retail revenues by approximately:
• | $26.8 million decrease effective in January 2017; |
• | $5.0 million increase effective in January 2016; |
• | $4.9 million increase effective in January 2015; and |
• | $12.7 million increase effective in January 2014. |
74
FERC Proceedings
In October of each year, we post an updated TFR that includes projected transmission capital expenditures and operating costs for the following year. This rate provides the basis for our annual request with the KCC to adjust our retail prices to include updated transmission costs as noted above. In the most recent four years, we posted our TFR, which was expected to adjust our annual transmission revenues by approximately:
• | $29.6 million increase effective in January 2017; |
• | $24.0 million increase effective in January 2016; |
• | $4.6 million decrease effective in January 2015; and |
• | $44.3 million increase effective in January 2014. |
In March 2016, the FERC approved a settlement reducing our base ROE used in determining our TFR. The settlement results in an ROE of 10.3%, which consists of a 9.8% base ROE plus a 0.5% incentive ROE for participation in a regional transmission organization (RTO). The updated prices were retroactively effective January 2016. This adjustment also reflects estimated recovery of increased transmission capital expenditures and operating costs. We have begun refunding our previously recorded refund obligation and as of December 31, 2016, we have a remaining refund obligation of $1.2 million, which is included in current regulatory liabilities on our balance sheet.
5. FINANCIAL INSTRUMENTS AND TRADING SECURITIES
Values of Financial Instruments
GAAP establishes a hierarchical framework for disclosing the transparency of the inputs utilized in measuring assets and liabilities at fair value. Our assessment of the significance of a particular input to the fair value measurement requires judgment and may affect the classification of assets and liabilities within the fair value hierarchy levels. In addition, we measure certain investments that do not have a readily determinable fair value at NAV, which are not included in the fair value hierarchy. Further explanation of these levels and NAV is summarized below.
• | Level 1 - Quoted prices are available in active markets for identical assets or liabilities. The types of assets and liabilities included in level 1 are highly liquid and actively traded instruments with quoted prices, such as equities listed on public exchanges. |
• | Level 2 - Pricing inputs are not quoted prices in active markets, but are either directly or indirectly observable. The types of assets and liabilities included in level 2 are typically liquid investments in funds which have a readily determinable fair value calculated using daily NAVs, other financial instruments that are comparable to actively traded securities or contracts, such as treasury securities with pricing interpolated from recent trades of similar securities, or other financial instruments priced with models using highly observable inputs. |
• | Level 3 - Significant inputs to pricing have little or no transparency. The types of assets and liabilities included in level 3 are those with inputs requiring significant management judgment or estimation. |
• | Net Asset Value - Investments that do not have a readily determinable fair value are measured at NAV. These investments do not consider the observability of inputs, therefore, they are not included within the fair value hierarchy. We include in this category investments in private equity, real estate and alternative investment funds that do not have a readily determinable fair value. The underlying alternative investments include collateralized debt obligations, mezzanine debt and a variety of other investments. |
We record cash and cash equivalents, short-term borrowings and variable-rate debt on our consolidated balance sheets at cost, which approximates fair value. We measure the fair value of fixed-rate debt, a level 2 measurement, based on quoted market prices for the same or similar issues or on the current rates offered for instruments of the same remaining maturities and redemption provisions. The recorded amount of accounts receivable and other current financial instruments approximates fair value.
75
We measure fair value based on information available as of the measurement date. The following table provides the carrying values and measured fair values of our fixed-rate debt.
As of December 31, 2016 | As of December 31, 2015 | ||||||||||||||
Carrying Value | Fair Value | Carrying Value | Fair Value | ||||||||||||
(In Thousands) | |||||||||||||||
Fixed-rate debt | $ | 3,430,000 | $ | 3,597,441 | $ | 3,080,000 | $ | 3,259,533 | |||||||
Fixed-rate debt of VIEs | 137,962 | 139,733 | 166,271 | 179,030 | |||||||||||
76
Recurring Fair Value Measurements
The following table provides the amounts and their corresponding level of hierarchy for our assets that are measured at fair value.
As of December 31, 2016 | Level 1 | Level 2 | Level 3 | NAV | Total | |||||||||||||||
(In Thousands) | ||||||||||||||||||||
Nuclear Decommissioning Trust: | ||||||||||||||||||||
Domestic equity funds | $ | — | $ | 56,312 | $ | — | $ | 5,056 | $ | 61,368 | ||||||||||
International equity funds | — | 35,944 | — | — | 35,944 | |||||||||||||||
Core bond fund | — | 27,423 | — | — | 27,423 | |||||||||||||||
High-yield bond fund | — | 18,188 | — | — | 18,188 | |||||||||||||||
Emerging market bond fund | — | 14,738 | — | — | 14,738 | |||||||||||||||
Combination debt/equity/other funds | — | 13,484 | — | — | 13,484 | |||||||||||||||
Alternative investment fund | — | — | — | 18,958 | 18,958 | |||||||||||||||
Real estate securities fund | — | — | — | 9,946 | 9,946 | |||||||||||||||
Cash equivalents | 73 | — | — | — | 73 | |||||||||||||||
Total Nuclear Decommissioning Trust | 73 | 166,089 | — | 33,960 | 200,122 | |||||||||||||||
Trading Securities: | ||||||||||||||||||||
Domestic equity funds | — | 18,364 | — | — | 18,364 | |||||||||||||||
International equity fund | — | 4,467 | — | — | 4,467 | |||||||||||||||
Core bond fund | — | 11,504 | — | — | 11,504 | |||||||||||||||
Cash equivalents | 156 | — | — | — | 156 | |||||||||||||||
Total Trading Securities | 156 | 34,335 | — | — | 34,491 | |||||||||||||||
Total Assets Measured at Fair Value | $ | 229 | $ | 200,424 | $ | — | $ | 33,960 | $ | 234,613 | ||||||||||
As of December 31, 2015 | Level 1 | Level 2 | Level 3 | NAV | Total | |||||||||||||||
(In Thousands) | ||||||||||||||||||||
Nuclear Decommissioning Trust: | ||||||||||||||||||||
Domestic equity funds | $ | — | $ | 50,872 | $ | — | $ | 6,050 | $ | 56,922 | ||||||||||
International equity funds | — | 33,595 | — | — | 33,595 | |||||||||||||||
Core bond fund | — | 25,976 | — | — | 25,976 | |||||||||||||||
High-yield bond fund | — | 15,288 | — | — | 15,288 | |||||||||||||||
Emerging market bond fund | — | 13,584 | — | — | 13,584 | |||||||||||||||
Combination debt/equity/other funds | — | 11,343 | — | — | 11,343 | |||||||||||||||
Alternative investment fund | — | — | — | 16,439 | 16,439 | |||||||||||||||
Real estate securities fund | — | — | — | 10,823 | 10,823 | |||||||||||||||
Cash equivalents | 87 | — | — | — | 87 | |||||||||||||||
Total Nuclear Decommissioning Trust | 87 | 150,658 | — | 33,312 | 184,057 | |||||||||||||||
Trading Securities: | ||||||||||||||||||||
Domestic equity funds | — | 17,876 | — | — | 17,876 | |||||||||||||||
International equity fund | — | 4,430 | — | — | 4,430 | |||||||||||||||
Core bond fund | — | 11,423 | — | — | 11,423 | |||||||||||||||
Cash equivalents | 159 | — | — | — | 159 | |||||||||||||||
Total Trading Securities | 159 | 33,729 | — | — | 33,888 | |||||||||||||||
Total Assets Measured at Fair Value | $ | 246 | $ | 184,387 | $ | — | $ | 33,312 | $ | 217,945 | ||||||||||
77
Some of our investments in the NDT are measured at NAV and do not have readily determinable fair values. These investments are either with investment companies or companies that follow accounting guidance consistent with investment companies. In certain situations, these investments may have redemption restrictions. The following table provides additional information on these investments.
As of December 31, 2016 | As of December 31, 2015 | As of December 31, 2016 | |||||||||||||||||
Fair Value | Unfunded Commitments | Fair Value | Unfunded Commitments | Redemption Frequency | Length of Settlement | ||||||||||||||
(In Thousands) | |||||||||||||||||||
Nuclear Decommissioning Trust: | |||||||||||||||||||
Domestic equity funds | $ | 5,056 | $ | 3,529 | $ | 6,050 | $ | 1,948 | (a) | (a) | |||||||||
Alternative investment fund (b) | 18,958 | — | 16,439 | — | Quarterly | 65 days | |||||||||||||
Real estate securities fund (b) | 9,946 | — | 10,823 | — | Quarterly | 65 days | |||||||||||||
Total Nuclear Decommissioning Trust | $ | 33,960 | $ | 3,529 | $ | 33,312 | $ | 1,948 | |||||||||||
_______________
(a) | This investment is in four long-term private equity funds that do not permit early withdrawal. Our investments in these funds cannot be distributed until the underlying investments have been liquidated, which may take years from the date of initial liquidation. Two funds have begun to make distributions. Our initial investment in the third fund occurred in 2013. Our initial investment in the fourth fund occurred in the second quarter of 2016. The term of the third and fourth fund is 15 years, subject to the general partner’s right to extend the term for up to three additional one-year periods. |
(b) | There is a holdback on final redemptions. |
Derivative Instruments
Price Risk
We use various types of fuel, including coal, natural gas, uranium and diesel to operate our plants and also purchase power to meet customer demand. Our prices and consolidated financial results are exposed to market risks from commodity price changes for electricity and other energy-related products as well as from interest rates. Volatility in these markets impacts our costs of purchased power, costs of fuel for our generating plants and our participation in energy markets. We strive to manage our customers’ and our exposure to market risks through regulatory, operating and financing activities and, when we deem appropriate, we economically hedge a portion of these risks through the use of derivative financial instruments for non-trading purposes.
Interest Rate Risk
We have entered into numerous fixed and variable rate debt obligations. For details, see Note 10, “Long-Term Debt.” We manage our interest rate risk related to these debt obligations by limiting our exposure to variable interest rate debt, diversifying maturity dates and entering into treasury yield hedge transactions. We may also use other financial derivative instruments such as interest rate swaps.
6. FINANCIAL INVESTMENTS
We report our investments in equity and debt securities at fair value and use the specific identification method to determine their realized gains and losses. We classify these investments as either trading securities or available-for-sale securities as described below.
Trading Securities
We hold equity and debt investments that we classify as trading securities in a trust used to fund certain retirement benefit obligations. These obligations totaled $26.8 million and $27.4 million as of December 31, 2016 and 2015, respectively. For additional information on our benefit obligations, see Note 12, “Employee Benefit Plans.”
As of December 31, 2016 and 2015, we measured the fair value of trust assets at $34.5 million and $33.9 million, respectively. We include unrealized gains or losses on these securities in investment earnings on our consolidated statements of
78
income. For the years ended December 31, 2016, 2015 and 2014, we recorded unrealized gains of $2.5 million, $0.4 million and $2.6 million, respectively, on assets still held.
Available-for-Sale Securities
We hold investments in a trust for the purpose of funding the decommissioning of Wolf Creek. We have classified these investments as available-for-sale and have recorded all such investments at their fair market value as of December 31, 2016 and 2015.
Using the specific identification method to determine cost, we realized a loss on our available-for-sale securities of $1.5 million and $0.9 million in 2016 and 2015, respectively. In 2014, we realized a gain on our available-for-sale securities of $0.1 million. We record net realized and unrealized gains and losses in regulatory liabilities on our consolidated balance sheets. This reporting is consistent with the method we use to account for the decommissioning costs we recover in our prices. Gains or losses on assets in the trust fund are recorded as increases or decreases, respectively, to regulatory liabilities and could result in lower or higher funding requirements for decommissioning costs, which we believe would be reflected in the prices paid by our customers.
The following table presents the cost, gross unrealized gains and losses, fair value and allocation of investments in the NDT fund as of December 31, 2016 and 2015.
Gross Unrealized | |||||||||||||||||||
Security Type | Cost | Gain | Loss | Fair Value | Allocation | ||||||||||||||
(Dollars In Thousands) | |||||||||||||||||||
As of December 31, 2016: | |||||||||||||||||||
Domestic equity funds | $ | 53,192 | $ | 8,295 | $ | (119 | ) | $ | 61,368 | 31 | % | ||||||||
International equity funds | 34,502 | 2,075 | (633 | ) | 35,944 | 18 | % | ||||||||||||
Core bond fund | 27,952 | — | (529 | ) | 27,423 | 14 | % | ||||||||||||
High-yield bond fund | 18,358 | — | (170 | ) | 18,188 | 9 | % | ||||||||||||
Emerging market bond fund | 16,397 | — | (1,659 | ) | 14,738 | 7 | % | ||||||||||||
Combination debt/equity/other funds | 9,171 | 4,313 | — | 13,484 | 7 | % | |||||||||||||
Alternative investment fund | 15,000 | 3,958 | — | 18,958 | 9 | % | |||||||||||||
Real estate securities fund | 9,500 | 446 | — | 9,946 | 5 | % | |||||||||||||
Cash equivalents | 73 | — | — | 73 | <1% | ||||||||||||||
Total | $ | 184,145 | $ | 19,087 | $ | (3,110 | ) | $ | 200,122 | 100 | % | ||||||||
As of December 31, 2015: | |||||||||||||||||||
Domestic equity funds | $ | 49,488 | $ | 7,436 | $ | (2 | ) | $ | 56,922 | 32 | % | ||||||||
International equity funds | 33,458 | 1,372 | (1,235 | ) | 33,595 | 18 | % | ||||||||||||
Core bond fund | 26,397 | — | (421 | ) | 25,976 | 14 | % | ||||||||||||
High-yield bond fund | 17,047 | — | (1,759 | ) | 15,288 | 8 | % | ||||||||||||
Emerging market bond fund | 16,306 | — | (2,722 | ) | 13,584 | 7 | % | ||||||||||||
Combination debt/equity/other funds | 8,239 | 3,104 | — | 11,343 | 6 | % | |||||||||||||
Alternative investment fund | 15,000 | 1,439 | — | 16,439 | 9 | % | |||||||||||||
Real estate securities fund | 11,026 | — | (203 | ) | 10,823 | 6 | % | ||||||||||||
Cash equivalents | 87 | — | — | 87 | <1% | ||||||||||||||
Total | $ | 177,048 | $ | 13,351 | $ | (6,342 | ) | $ | 184,057 | 100 | % | ||||||||
79
The following table presents the fair value and the gross unrealized losses of the available-for-sale securities held in the NDT fund aggregated by investment category and the length of time that individual securities have been in a continuous unrealized loss position as of December 31, 2016 and 2015.
Less than 12 Months | 12 Months or Greater | Total | |||||||||||||||||||||
Fair Value | Gross Unrealized Losses | Fair Value | Gross Unrealized Losses | Fair Value | Gross Unrealized Losses | ||||||||||||||||||
(In Thousands) | |||||||||||||||||||||||
As of December 31, 2016: | |||||||||||||||||||||||
Domestic equity funds | $ | 1,788 | $ | (119 | ) | $ | — | $ | — | $ | 1,788 | $ | (119 | ) | |||||||||
International equity funds | — | — | 7,489 | (633 | ) | 7,489 | (633 | ) | |||||||||||||||
Core bond funds | 27,423 | (529 | ) | — | — | 27,423 | (529 | ) | |||||||||||||||
High-yield bond fund | — | — | 18,188 | (170 | ) | 18,188 | (170 | ) | |||||||||||||||
Emerging market bond fund | — | — | 14,738 | (1,659 | ) | 14,738 | (1,659 | ) | |||||||||||||||
Total | $ | 29,211 | $ | (648 | ) | $ | 40,415 | $ | (2,462 | ) | $ | 69,626 | $ | (3,110 | ) | ||||||||
As of December 31, 2015: | |||||||||||||||||||||||
Domestic equity funds | $ | — | $ | — | $ | 668 | $ | (2 | ) | $ | 668 | $ | (2 | ) | |||||||||
International equity funds | — | — | 6,717 | (1,235 | ) | 6,717 | (1,235 | ) | |||||||||||||||
Core bond funds | 25,976 | (421 | ) | — | — | 25,976 | (421 | ) | |||||||||||||||
High-yield bond fund | 15,288 | (1,759 | ) | — | — | 15,288 | (1,759 | ) | |||||||||||||||
Emerging market bond fund | — | — | 13,584 | (2,722 | ) | 13,584 | (2,722 | ) | |||||||||||||||
Real estate securities fund | — | — | 10,823 | (203 | ) | 10,823 | (203 | ) | |||||||||||||||
Total | $ | 41,264 | $ | (2,180 | ) | $ | 31,792 | $ | (4,162 | ) | $ | 73,056 | $ | (6,342 | ) | ||||||||
7. PROPERTY, PLANT AND EQUIPMENT
The following is a summary of our property, plant and equipment balance.
As of December 31, | |||||||
2016 | 2015 | ||||||
(In Thousands) | |||||||
Electric plant in service | $ | 11,986,046 | $ | 11,449,933 | |||
Electric plant acquisition adjustment | 802,318 | 802,318 | |||||
Accumulated depreciation | (4,404,977 | ) | (4,178,885 | ) | |||
8,383,387 | 8,073,366 | ||||||
Construction work in progress | 773,095 | 349,402 | |||||
Nuclear fuel, net | 61,952 | 68,349 | |||||
Plant to be retired, net (a) | 29,925 | 33,785 | |||||
Net property, plant and equipment | $ | 9,248,359 | $ | 8,524,902 | |||
_______________
(a) Represents the planned retirement of analog meters prior to the end of their remaining useful lives due to modernization of meter technology.
80
The following is a summary of property, plant and equipment of VIEs.
As of December 31, | |||||||
2016 | 2015 | ||||||
(In Thousands) | |||||||
Electric plant of VIEs | $ | 497,999 | $ | 497,999 | |||
Accumulated depreciation of VIEs | (240,095 | ) | (229,760 | ) | |||
Net property, plant and equipment of VIEs | $ | 257,904 | $ | 268,239 | |||
We recorded depreciation expense on property, plant and equipment of $316.7 million in 2016, $287.9 million in 2015 and $263.8 million in 2014. Approximately $9.5 million, $9.6 million and $9.7 million of depreciation expense in 2016, 2015 and 2014, respectively, was attributable to property, plant and equipment of VIEs.
8. JOINT OWNERSHIP OF UTILITY PLANTS
Under joint ownership agreements with other utilities, we have undivided ownership interests in four electric generating stations. Energy generated and operating expenses are divided on the same basis as ownership with each owner reflecting its respective costs in its statements of income and each owner responsible for its own financing. Information relative to our ownership interests in these facilities as of December 31, 2016, is shown in the table below.
Plant | In-Service Dates | Investment | Accumulated Depreciation | Construction Work in Progress | Net MW | Ownership Percentage | |||||||||||||
(Dollars in Thousands) | |||||||||||||||||||
La Cygne unit 1 (a) | June 1973 | $ | 613,348 | $ | 163,234 | $ | 39,096 | 368 | 50 | ||||||||||
JEC unit 1 (a) | July 1978 | 817,402 | 203,410 | 7,131 | 670 | 92 | |||||||||||||
JEC unit 2 (a) | May 1980 | 567,298 | 200,296 | 4,198 | 675 | 92 | |||||||||||||
JEC unit 3 (a) | May 1983 | 740,170 | 325,701 | 4,108 | 659 | 92 | |||||||||||||
Wolf Creek (b) | Sept. 1985 | 1,922,877 | 842,595 | 82,756 | 551 | 47 | |||||||||||||
State Line (c) | June 2001 | 111,444 | 62,332 | 861 | 196 | 40 | |||||||||||||
Total | $ | 4,772,539 | $ | 1,797,568 | $ | 138,150 | 3,119 | ||||||||||||
_______________
(a) | Jointly owned with Kansas City Power & Light Company (KCPL). Our 8% leasehold interest in Jeffrey Energy Center (JEC) that is consolidated as a VIE is reflected in the net megawatts (MW) and ownership percentage provided above, but not in the other amounts in the table. |
(b) | Jointly owned with KCPL and Kansas Electric Power Cooperative, Inc. |
(c) Jointly owned with Empire District Electric Company.
We include in operating expenses on our consolidated statements of income our share of operating expenses of the above plants. Our share of fuel expense for the above plants is generally based on the amount of power we take from the respective plants. Our share of other transactions associated with the plants is included in the appropriate classification on our consolidated financial statements.
In addition, we also consolidate a VIE that holds our 50% leasehold interest in La Cygne unit 2, which represents 324 MW of net capacity. The VIE’s investment in the 50% interest was $392.1 million and accumulated depreciation was $208.7 million as of December 31, 2016. We include these amounts in property, plant and equipment of VIEs, net on our consolidated balance sheets. See Note 18, “Variable Interest Entities,” for additional information about VIEs.
9. SHORT-TERM DEBT
In December 2016, Westar Energy extended the term of the $270.0 million revolving credit facility to terminate in February 2018. So long as there is no default under the facility, Westar Energy may extend the facility up to an additional year and may increase the aggregate amount of borrowings under the facility to $400.0 million, subject to lender participation. All borrowings under the facility are secured by KGE first mortgage bonds. As of December 31, 2016 and 2015, Westar Energy had no borrowed amounts or letters of credit outstanding under this revolving credit facility.
81
In September 2015, Westar Energy extended the term of its $730.0 million revolving credit facility to terminate in September 2019, $20.7 million of which will expire in September 2017. As long as there is no default under the facility, Westar Energy may extend the facility up to an additional year and may increase the aggregate amount of borrowings under the facility to $1.0 billion, both subject to lender participation. All borrowings under the facility are secured by KGE first mortgage bonds. As of December 31, 2016, no amounts had been borrowed and $12.3 million of letters of credit had been issued under this revolving credit facility. As of December 31, 2015, no amounts had been borrowed and $19.2 million of letters of credit had been issued under this revolving credit facility.
Westar Energy maintains a commercial paper program pursuant to which it may issue commercial paper up to a maximum aggregate amount outstanding at any one time of $1.0 billion. This program is supported by Westar Energy’s revolving credit facilities. Maturities of commercial paper issuances may not exceed 365 days from the date of issuance and proceeds from such issuances will be used to temporarily fund capital expenditures, to redeem debt on an interim basis, for working capital and/or for other general corporate purposes. Westar Energy had $366.7 million and $250.3 million of commercial paper issued and outstanding as of December 31, 2016 and 2015, respectively.
In addition, total combined borrowings under Westar Energy’s commercial paper program and revolving credit facilities may not exceed $1.0 billion at any given time. The weighted average interest rate on short-term borrowings outstanding as of December 31, 2016 and 2015, was 0.96% and 0.77%, respectively. Additional information regarding our short-term debt is as follows.
Year Ended December 31, | |||||||
2016 | 2015 | ||||||
(Dollars in Thousands) | |||||||
Weighted average short-term debt outstanding | $ | 284,700 | $ | 350,380 | |||
Weighted daily average interest rates, excluding fees | 0.78 | % | 0.48 | % | |||
Our interest expense on short-term debt was $3.6 million in 2016, $3.0 million in 2015 and $2.0 million in 2014.
82
10. LONG-TERM DEBT
Outstanding Debt
The following table summarizes our long-term debt outstanding.
As of December 31, | |||||||
2016 | 2015 | ||||||
(In Thousands) | |||||||
Westar Energy | |||||||
First mortgage bond series: | |||||||
5.15% due 2017 | $ | 125,000 | $ | 125,000 | |||
5.10% due 2020 | 250,000 | 250,000 | |||||
3.25% due 2025 | 250,000 | 250,000 | |||||
2.55% due 2026 | 350,000 | — | |||||
4.125% due 2042 | 550,000 | 550,000 | |||||
4.10% due 2043 | 430,000 | 430,000 | |||||
4.625% due 2043 | 250,000 | 250,000 | |||||
4.25% due 2045 | 300,000 | 300,000 | |||||
2,505,000 | 2,155,000 | ||||||
Pollution control bond series: | |||||||
Variable due 2032, 1.14% as of December 31, 2016; 0.02% as of December 31, 2015 | 45,000 | 45,000 | |||||
Variable due 2032, 1.32% as of December 31, 2016; 0.02% as of December 31, 2015 | 30,500 | 30,500 | |||||
75,500 | 75,500 | ||||||
KGE | |||||||
First mortgage bond series: | |||||||
6.70% due 2019 | 300,000 | 300,000 | |||||
6.15% due 2023 | 50,000 | 50,000 | |||||
6.53% due 2037 | 175,000 | 175,000 | |||||
6.64% due 2038 | 100,000 | 100,000 | |||||
4.30% due 2044 | 250,000 | 250,000 | |||||
875,000 | 875,000 | ||||||
Pollution control bond series: | |||||||
Variable due 2027, 1.46% as of December 31, 2016; 0.02% as of December 31, 2015 | 21,940 | 21,940 | |||||
4.85% due 2031 | — | 50,000 | |||||
2.50% due 2031 | 50,000 | — | |||||
Variable due 2032, 1.46% as of December 31, 2016; 0.02% as of December 31, 2015 | 14,500 | 14,500 | |||||
Variable due 2032, 1.46% as of December 31, 2016; 0.02% as of December 31, 2015 | 10,000 | 10,000 | |||||
96,440 | 96,440 | ||||||
Total long-term debt | 3,551,940 | 3,201,940 | |||||
Unamortized debt discount (a) | (10,358 | ) | (10,374 | ) | |||
Unamortized debt issuance expense (a) | (27,912 | ) | (27,616 | ) | |||
Long-term debt due within one year | (125,000 | ) | — | ||||
Long-term debt, net | $ | 3,388,670 | $ | 3,163,950 | |||
Variable Interest Entities | |||||||
5.92% due 2019 (b) | $ | 1,157 | $ | 4,223 | |||
5.647% due 2021 (b) | — | 162,048 | |||||
2.398% due 2021 (b) | 136,805 | — | |||||
Total long-term debt of variable interest entities | 137,962 | 166,271 | |||||
Unamortized debt premium (a) | 89 | 135 | |||||
Long-term debt of variable interest entities due within one year | (26,842 | ) | (28,309 | ) | |||
Long-term debt of variable interest entities, net | $ | 111,209 | $ | 138,097 | |||
_______________
(a) We amortize debt discounts and issuance expense to interest expense over the term of the respective issues.
(b) Portions of our payments related to this debt reduce the principal balances each year until maturity.
The Westar Energy and KGE mortgages each contain provisions restricting the amount of first mortgage bonds that could be issued by each entity. We must comply with such restrictions prior to the issuance of additional first mortgage bonds or other secured indebtedness.
83
The amount of Westar Energy first mortgage bonds authorized by its Mortgage and Deed of Trust, dated July 1, 1939, as supplemented, is subject to certain limitations as described below. The amount of KGE first mortgage bonds authorized by the KGE Mortgage and Deed of Trust, dated April 1, 1940, as supplemented and amended, is limited to a maximum of $3.5 billion, unless amended further. First mortgage bonds are secured by utility assets. Amounts of additional bonds that may be issued are subject to property, earnings and certain restrictive provisions, except in connection with certain refundings, of each mortgage. As of December 31, 2016, approximately $931.6 million principal amount of additional first mortgage bonds could be issued under the most restrictive provisions in Westar Energy’s mortgage. As of December 31, 2016, approximately $1.5 billion principal amount of additional KGE first mortgage bonds could be issued under the most restrictive provisions in KGE’s mortgage.
As of December 31, 2016, we had $121.9 million of variable rate, tax-exempt bonds outstanding. While the interest rates for these bonds have been low, we continue to monitor the credit markets and evaluate our options with respect to these bonds.
In January 2017, Westar Energy retired $125.0 million in principal amount of first mortgage bonds bearing a stated interest at 5.15% maturing January 2017.
In June 2016, Westar Energy issued $350.0 million in principal amount of first mortgage bonds bearing a stated interest at 2.55% and maturing July 2026. The bonds were issued as “Green Bonds,” and all proceeds from the bonds will be used in renewable energy projects, primarily the construction of the Western Plains Wind Farm.
Also in June 2016, KGE redeemed and reissued $50.0 million in principal amount pollution control bonds maturing June 2031. The stated rate of the bonds was reduced from 4.85% to 2.50%.
In February 2016, KGE, as lessee to the La Cygne sale-leaseback, effected a redemption and reissuance of $162.1 million in outstanding bonds held by the trustee of the lease maturing March 2021. The stated interest rate of the bonds was reduced from 5.647% to 2.398%. See Note 18, “Variable Interest Entities,” for additional information regarding our La Cygne sale-leaseback.
In November 2015, Westar Energy issued $250.0 million in principal amount of first mortgage bonds bearing stated interest at 3.25% and maturing December 2025. Concurrently, Westar Energy issued $300.0 million in principal amount of first mortgage bonds bearing stated interest at 4.25% and maturing December 2045.
Also in November 2015, Westar Energy redeemed $300.0 million in principal amount of first mortgage bonds bearing stated interest at 8.625% maturing in December 2018 for $360.9 million which included a call premium. The call premium was recorded as a regulatory asset and is being amortized over the term of the new bonds.
In August 2015, Westar Energy redeemed $150.0 million in principal amount of first mortgage bonds bearing stated interest at 5.875% and maturing July 2036.
In January 2015, Westar Energy redeemed $125.0 million in principal amount of first mortgage bonds bearing stated interest at 5.95% and maturing January 2035.
With the exception of Green Bonds, proceeds from issuances were used to repay short-term debt, which was used to purchase capital equipment, to redeem bonds and for working capital and general corporate purposes.
84
Maturities
The principal amounts of our long-term debt maturities as of December 31, 2016, are as follows.
Year | Long-term debt | Long-term debt of VIEs | ||||||
(In Thousands) | ||||||||
2017 | $ | 125,000 | $ | 26,842 | ||||
2018 | — | 28,538 | ||||||
2019 | 300,000 | 31,485 | ||||||
2020 | 250,000 | 32,254 | ||||||
2021 | — | 18,843 | ||||||
Thereafter | 2,876,940 | — | ||||||
Total maturities | $ | 3,551,940 | $ | 137,962 | ||||
Interest expense on long-term debt, net of debt AFUDC, was $141.4 million in 2016, $152.7 million in 2015 and $158.8 million in 2014. Interest expense on long-term debt of VIEs was $4.2 million in 2016, $9.8 million in 2015 and $11.4 million in 2014.
11. TAXES
Income tax expense is comprised of the following components.
Year Ended December 31, | |||||||||||
2016 | 2015 | 2014 | |||||||||
(In Thousands) | |||||||||||
Income Tax Expense (Benefit): | |||||||||||
Current income taxes: | |||||||||||
Federal | $ | (1,007 | ) | $ | 327 | $ | 416 | ||||
State | 318 | 341 | (597 | ) | |||||||
Deferred income taxes: | |||||||||||
Federal | 155,230 | 124,891 | 124,923 | ||||||||
State | 32,892 | 29,484 | 29,657 | ||||||||
Investment tax credit amortization | (2,893 | ) | (3,043 | ) | (3,129 | ) | |||||
Income tax expense | $ | 184,540 | $ | 152,000 | $ | 151,270 | |||||
85
The tax effect of the temporary differences and carryforwards that comprise our deferred tax assets and deferred tax liabilities are summarized in the following table.
As of December 31, | |||||||
2016 | 2015 | ||||||
(In Thousands) | |||||||
Deferred tax assets: | |||||||
Tax credit carryforward (a) | $ | 265,750 | $ | 266,963 | |||
Deferred employee benefit costs | 137,337 | 122,757 | |||||
Net operating loss carryforward (b) | 86,693 | 129,232 | |||||
Deferred state income taxes | 73,294 | 67,307 | |||||
Deferred compensation | 31,981 | 27,266 | |||||
Deferred regulatory gain on sale-leaseback | 30,868 | 33,287 | |||||
Alternative minimum tax carryforward (c) | 29,412 | 26,725 | |||||
Accrued liabilities | 21,757 | 21,115 | |||||
LaCygne dismantling cost | 10,972 | 10,018 | |||||
Disallowed costs | 9,600 | 10,211 | |||||
Capital loss carryforward | — | 1,668 | |||||
Other | 47,200 | 41,319 | |||||
Total gross deferred tax assets | 744,864 | 757,868 | |||||
Less: Valuation allowance | — | 1,668 | |||||
Deferred tax assets | $ | 744,864 | $ | 756,200 | |||
Deferred tax liabilities: | |||||||
Accelerated depreciation | $ | 1,925,270 | $ | 1,787,457 | |||
Acquisition premium | 147,868 | 155,881 | |||||
Deferred employee benefit costs | 137,337 | 122,757 | |||||
Amounts due from customers for future income taxes, net | 124,020 | 144,120 | |||||
Deferred state income taxes | 61,110 | 59,787 | |||||
Debt reacquisition costs | 41,753 | 42,314 | |||||
Pension expense tracker | 5,560 | 12,051 | |||||
Other | 54,722 | 23,263 | |||||
Total deferred tax liabilities | $ | 2,497,640 | $ | 2,347,630 | |||
Net deferred income tax liabilities | $ | 1,752,776 | $ | 1,591,430 | |||
_______________
(a) | Based on filed tax returns and amounts expected to be reported in current year tax returns (December 31, 2016), we had available federal general business tax credits of $88.4 million and state investment tax credits of $177.3 million. The federal general business tax credits were primarily generated from production tax credits. These tax credits expire beginning in 2020 and ending in 2036. The state investment tax credits expire beginning in 2021 and ending in 2032. |
(b) | As of December 31, 2016, we had a federal net operating loss carryforward of $198.1 million, which is available to offset federal taxable income. The net operating losses will expire beginning in 2032 and ending in 2035. |
(c) | As of December 31, 2016, we had available an alternative minimum tax credit carryforward of $29.4 million, which has an unlimited carryforward period. |
In accordance with various orders, we have reduced our prices to reflect the income tax benefits associated with certain accelerated income tax deductions. We believe it is probable that the net future increases in income taxes payable will be recovered from customers when these temporary income tax benefits reverse. We have recorded a regulatory asset for these amounts. We also have recorded a regulatory liability for our obligation to reduce the prices charged to customers for deferred income taxes recovered from customers at corporate income tax rates higher than current income tax rates. The price reduction will occur as the temporary differences resulting in the excess deferred income tax liabilities reverse. The income tax-related regulatory assets and liabilities as well as unamortized investment tax credits are also temporary differences for which deferred income taxes have been provided. The net deferred income tax liability related to these temporary differences is classified above as amounts due from customers for future income taxes, net.
86
Our effective income tax rates are computed by dividing total federal and state income taxes by the sum of such taxes and net income. The difference between the effective income tax rates and the federal statutory income tax rates are as follows.
Year Ended December 31, | ||||||||
2016 | 2015 | 2014 | ||||||
Statutory federal income tax rate | 35.0 | % | 35.0 | % | 35.0 | % | ||
Effect of: | ||||||||
COLI policies | (4.2 | ) | (4.4 | ) | (4.0 | ) | ||
State income taxes | 4.0 | 4.3 | 4.0 | |||||
Flow through depreciation for plant-related differences | 3.1 | 2.6 | 2.0 | |||||
Production tax credits | (1.8 | ) | (2.1 | ) | (2.1 | ) | ||
Non-controlling interest | (0.9 | ) | (0.8 | ) | (0.7 | ) | ||
AFUDC equity | (0.8 | ) | (0.2 | ) | (1.3 | ) | ||
Amortization of federal investment tax credits | (0.5 | ) | (0.7 | ) | (0.7 | ) | ||
Share based payments | (0.5 | ) | (0.1 | ) | — | |||
Capital loss utilization carryforward | 0.4 | (0.1 | ) | (0.3 | ) | |||
Liability for unrecognized income tax benefits | — | — | (0.2 | ) | ||||
Other | — | — | 0.2 | |||||
Effective income tax rate | 33.8 | % | 33.5 | % | 31.9 | % | ||
We file income tax returns in the U.S. federal jurisdiction as well as various state jurisdictions. The income tax returns we file will likely be audited by the Internal Revenue Service or other tax authorities. With few exceptions, the statute of limitations with respect to U.S. federal or state and local income tax examinations by tax authorities remains open for tax year 2013 and forward.
The unrecognized income tax benefits decreased from $2.9 million at December 31, 2015, to $2.8 million at December 31, 2016. The decrease for unrecognized income tax benefits was primarily attributable to tax positions expected to be taken with respect to potential deductions related to an environmental settlement agreement in a tax period for which the statute of limitations has closed. We do not expect significant changes in the unrecognized income tax benefits in the next 12 months. A reconciliation of the beginning and ending amounts of unrecognized income tax benefits is as follows:
2016 | 2015 | 2014 | |||||||||
(In Thousands) | |||||||||||
Unrecognized income tax benefits as of January 1 | $ | 2,901 | $ | 3,188 | $ | 1,703 | |||||
Additions based on tax positions related to the current year | 434 | 410 | 872 | ||||||||
Additions for tax positions of prior years | — | — | 813 | ||||||||
Reductions for tax positions of prior years | (1 | ) | (86 | ) | (200 | ) | |||||
Lapse of statute of limitations | (568 | ) | (611 | ) | — | ||||||
Settlements | — | — | — | ||||||||
Unrecognized income tax benefits as of December 31 | $ | 2,766 | $ | 2,901 | $ | 3,188 | |||||
The amounts of unrecognized income tax benefits that, if recognized, would favorably impact our effective income tax rate, were $2.7 million, $2.9 million and $3.2 million (net of tax) as of December 31, 2016, 2015 and 2014, respectively.
Interest related to income tax uncertainties is classified as interest expense and accrued interest liability. As of December 31, 2016 and 2015, we had no amounts accrued for interest related to unrecognized income tax benefits. We accrued no penalties at either December 31, 2016 or 2015.
As of December 31, 2016 and 2015, we had recorded $1.5 million for probable assessments of taxes other than income taxes.
87
12. EMPLOYEE BENEFIT PLANS
Pension and Post-Retirement Benefit Plans
We maintain a qualified non-contributory defined benefit pension plan covering substantially all of our employees. For the majority of our employees, pension benefits are based on years of service and an employee’s compensation during the 60 highest paid consecutive months out of 120 before retirement. Non-union employees hired after December 31, 2001, and union employees hired after December 31, 2011, are covered by the same defined benefit pension plan; however, their benefits are derived from a cash balance account formula. We also maintain a non-qualified Executive Salary Continuation Plan for the benefit of certain retired executive officers. We have discontinued accruing any future benefits under this non-qualified plan.
The amount we contribute to our pension plan for future periods is not yet known, however, we expect to fund our pension plan each year at least to a level equal to current year pension expense. We must also meet minimum funding requirements under the Employee Retirement Income Security Act, as amended by the Pension Protection Act. We may contribute additional amounts from time to time as deemed appropriate.
In addition to providing pension benefits, we provide certain post-retirement health care and life insurance benefits for substantially all retired employees. We accrue and recover in our prices the costs of post-retirement benefits during an employee’s years of service. In 2014 and prior years, our retirees were covered under a health insurance policy. In January 2015, we began giving our retirees a fixed annual allowance, which provides them the flexibility to obtain health coverage in the marketplace that is tailored to their needs.
As a co-owner of Wolf Creek, KGE is indirectly responsible for 47% of the liabilities and expenses associated with the Wolf Creek pension and post-retirement benefit plans. See Note 13, “Wolf Creek Employee Benefit Plans,” for information about Wolf Creek’s benefit plans.
88
The following tables summarize the status of our pension and post-retirement benefit plans.
Pension Benefits | Post-retirement Benefits | |||||||||||||||
As of December 31, | 2016 | 2015 | 2016 | 2015 | ||||||||||||
(In Thousands) | ||||||||||||||||
Change in Benefit Obligation: | ||||||||||||||||
Benefit obligation, beginning of year | $ | 965,193 | $ | 1,030,645 | $ | 126,284 | $ | 141,516 | ||||||||
Service cost | 18,563 | 21,392 | 1,084 | 1,443 | ||||||||||||
Interest cost | 43,723 | 43,014 | 5,571 | 5,691 | ||||||||||||
Plan participants’ contributions | — | — | 395 | 582 | ||||||||||||
Benefits paid | (63,540 | ) | (44,945 | ) | (7,697 | ) | (6,549 | ) | ||||||||
Actuarial losses (gains) | 51,482 | (90,644 | ) | 3,926 | (16,399 | ) | ||||||||||
Amendments | (3,397 | ) | 5,731 | — | — | |||||||||||
Benefit obligation, end of year (a) | $ | 1,012,024 | $ | 965,193 | $ | 129,563 | $ | 126,284 | ||||||||
Change in Plan Assets: | ||||||||||||||||
Fair value of plan assets, beginning of year | $ | 653,945 | $ | 661,141 | $ | 115,416 | $ | 121,349 | ||||||||
Actual return on plan assets | 45,181 | (6,948 | ) | 7,274 | (208 | ) | ||||||||||
Employer contributions | 20,200 | 41,000 | — | — | ||||||||||||
Plan participants’ contributions | — | — | 356 | 534 | ||||||||||||
Benefits paid | (60,852 | ) | (41,248 | ) | (7,427 | ) | (6,259 | ) | ||||||||
Fair value of plan assets, end of year | $ | 658,474 | $ | 653,945 | $ | 115,619 | $ | 115,416 | ||||||||
Funded status, end of year | $ | (353,550 | ) | $ | (311,248 | ) | $ | (13,944 | ) | $ | (10,868 | ) | ||||
Amounts Recognized in the Balance Sheets Consist of: | ||||||||||||||||
Current liability | $ | (2,260 | ) | $ | (2,745 | ) | $ | (284 | ) | $ | (344 | ) | ||||
Noncurrent liability | (351,290 | ) | (308,503 | ) | (13,660 | ) | (10,524 | ) | ||||||||
Net amount recognized | $ | (353,550 | ) | $ | (311,248 | ) | $ | (13,944 | ) | $ | (10,868 | ) | ||||
Amounts Recognized in Regulatory Assets Consist of: | ||||||||||||||||
Net actuarial loss (gain) | $ | 282,462 | $ | 254,085 | $ | (7,603 | ) | $ | (12,208 | ) | ||||||
Prior service cost | 3,913 | 8,078 | 2,674 | 3,130 | ||||||||||||
Net amount recognized | $ | 286,375 | $ | 262,163 | $ | (4,929 | ) | $ | (9,078 | ) | ||||||
_______________
(a) As of December 31, 2016 and 2015, pension benefits include non-qualified benefit obligations of $26.8 million and $27.4 million, respectively, which are funded by a trust containing assets of $34.5 million and $33.9 million, respectively, classified as trading securities. The assets in the aforementioned trust are not included in the table above. See Notes 5 and 6, “Financial Instruments and Trading Securities” and “Financial Investments,” respectively, for additional information regarding these amounts.
Pension Benefits | Post-retirement Benefits | |||||||||||||||
As of December 31, | 2016 | 2015 | 2016 | 2015 | ||||||||||||
(Dollars in Thousands) | ||||||||||||||||
Pension Plans With a Projected Benefit Obligation In Excess of Plan Assets: | ||||||||||||||||
Projected benefit obligation | $ | 1,012,024 | $ | 965,193 | $ | — | $ | — | ||||||||
Fair value of plan assets | 658,474 | 653,945 | — | — | ||||||||||||
Pension Plans With an Accumulated Benefit Obligation In Excess of Plan Assets: | ||||||||||||||||
Accumulated benefit obligation | $ | 905,661 | $ | 864,263 | $ | — | $ | — | ||||||||
Fair value of plan assets | 658,474 | 653,945 | — | — | ||||||||||||
Post-retirement Plans With an Accumulated Post-retirement Benefit Obligation In Excess of Plan Assets: | ||||||||||||||||
Accumulated post-retirement benefit obligation | $ | — | $ | — | $ | 129,563 | $ | 126,284 | ||||||||
Fair value of plan assets | — | — | 115,619 | 115,416 | ||||||||||||
Weighted-Average Actuarial Assumptions used to Determine Net Periodic Benefit Obligation: | ||||||||||||||||
Discount rate | 4.25 | % | 4.60 | % | 4.15 | % | 4.51 | % | ||||||||
Compensation rate increase | 4.00 | % | 4.00 | % | — | — | ||||||||||
89
We use a measurement date of December 31 for our pension and post-retirement benefit plans. The discount rate used to determine the current year pension obligation and the following year’s pension expense is based on a bond selection-settlement portfolio approach. This approach develops a discount rate by selecting a portfolio of high quality, non-callable corporate bonds that generate sufficient cash flow to provide for the projected benefit payments of the plan. After the bond portfolio is selected, a single interest rate is determined that equates the present value of the plan’s projected benefit payments discounted at this rate with the market value of the bonds selected. The decrease in the discount rates used as of December 31, 2016, increased the pension and post-retirement benefit obligations by approximately $50.2 million and $5.0 million, respectively.
We amortize prior service cost on a straight-line basis over the average future service of the active employees (plan participants) benefiting under the plan at the time of the amendment. We amortize the net actuarial gain or loss on a straight-line basis over the average future service of active plan participants benefiting under the plan without application of an amortization corridor. The KCC allows us to record a regulatory asset or liability to track the cumulative difference between current year pension and post-retirement benefits expense and the amount of such expense recognized in setting our prices. We accumulate such regulatory asset or liability between general rate reviews and amortize the accumulated amount as part of resetting our base prices. Following is additional information regarding our pension and post-retirement benefit plans.
Pension Benefits | Post-retirement Benefits | |||||||||||||||||||||||
Year Ended December 31, | 2016 | 2015 | 2014 | 2016 | 2015 | 2014 | ||||||||||||||||||
(Dollars in Thousands) | ||||||||||||||||||||||||
Components of Net Periodic Cost (Benefit): | ||||||||||||||||||||||||
Service cost | $ | 18,563 | $ | 21,392 | $ | 16,218 | $ | 1,084 | $ | 1,443 | $ | 1,381 | ||||||||||||
Interest cost | 43,723 | 43,014 | 41,600 | 5,571 | 5,691 | 6,351 | ||||||||||||||||||
Expected return on plan assets | (42,653 | ) | (40,236 | ) | (36,438 | ) | (6,835 | ) | (6,614 | ) | (6,576 | ) | ||||||||||||
Amortization of unrecognized: | ||||||||||||||||||||||||
Prior service costs | 768 | 520 | 526 | 455 | 455 | 2,524 | ||||||||||||||||||
Actuarial loss (gain), net | 20,577 | 32,131 | 19,362 | (1,118 | ) | 379 | (742 | ) | ||||||||||||||||
Net periodic cost (benefit) before regulatory adjustment | 40,978 | 56,821 | 41,268 | (843 | ) | 1,354 | 2,938 | |||||||||||||||||
Regulatory adjustment (a) | 14,528 | 6,886 | 15,479 | (1,922 | ) | 4,096 | 4,499 | |||||||||||||||||
Net periodic cost (benefit) | $ | 55,506 | $ | 63,707 | $ | 56,747 | $ | (2,765 | ) | $ | 5,450 | $ | 7,437 | |||||||||||
Other Changes in Plan Assets and Benefit Obligations Recognized in Regulatory Assets: | ||||||||||||||||||||||||
Current year actuarial loss (gain) | $ | 48,954 | $ | (43,459 | ) | $ | 162,569 | $ | 3,486 | $ | (9,576 | ) | $ | 15,896 | ||||||||||
Amortization of actuarial (loss) gain | (20,577 | ) | (32,379 | ) | (19,362 | ) | 1,118 | (379 | ) | 742 | ||||||||||||||
Current year prior service cost | (3,397 | ) | 5,730 | — | — | — | (7,834 | ) | ||||||||||||||||
Amortization of prior service costs | (768 | ) | (520 | ) | (526 | ) | (455 | ) | (455 | ) | (2,524 | ) | ||||||||||||
Other adjustments | — | 352 | — | — | — | — | ||||||||||||||||||
Total recognized in regulatory assets | $ | 24,212 | $ | (70,276 | ) | $ | 142,681 | $ | 4,149 | $ | (10,410 | ) | $ | 6,280 | ||||||||||
Total recognized in net periodic cost and regulatory assets | $ | 79,718 | $ | (6,569 | ) | $ | 199,428 | $ | 1,384 | $ | (4,960 | ) | $ | 13,717 | ||||||||||
Weighted-Average Actuarial Assumptions used to Determine Net Periodic Cost (Benefit): | ||||||||||||||||||||||||
Discount rate | 4.60 | % | 4.17 | % | 5.07 | % | 4.51 | % | 4.10 | % | 4.88 | % | ||||||||||||
Expected long-term return on plan assets | 6.50 | % | 6.50 | % | 6.50 | % | 6.00 | % | 6.00 | % | 6.00 | % | ||||||||||||
Compensation rate increase | 4.00 | % | 4.00 | % | 4.00 | % | 4.00 | % | 4.00 | % | 4.00 | % | ||||||||||||
_______________
(a) | The regulatory adjustment represents the difference between current period pension or post-retirement benefit expense and the amount of such expense recognized in setting our prices. |
90
We estimate that we will amortize the following amounts from regulatory assets and regulatory liabilities into net periodic cost in 2017.
Pension Benefits | Post-retirement Benefits | ||||||
(In Thousands) | |||||||
Actuarial loss (gain) | $ | 21,956 | $ | (780 | ) | ||
Prior service cost | 683 | 455 | |||||
Total | $ | 22,639 | $ | (325 | ) | ||
We base the expected long-term rate of return on plan assets on historical and projected rates of return for current and planned asset classes in the plans’ investment portfolios. We select assumed projected rates of return for each asset class after analyzing long-term historical experience and future expectations of the volatility of the various asset classes. Based on target asset allocations for each asset class, we develop an overall expected rate of return for the portfolios, adjusted for historical and expected experience of active portfolio management results compared to benchmark returns and for the effect of expenses paid from plan assets.
Plan Assets
We believe we manage pension and post-retirement benefit plan assets in a prudent manner with regard to preserving principal while providing reasonable returns. We have adopted a long-term investment horizon such that the chances and duration of investment losses are weighed against the long-term potential for appreciation of assets. Part of our strategy includes managing interest rate sensitivity of plan assets relative to the associated liabilities. The primary objective of the pension plan is to provide a source of retirement income for its participants and beneficiaries, and the primary financial objective of the plan is to improve its funded status. The primary objective of the post-retirement benefit plan is growth in assets and preservation of principal, while minimizing interim volatility, to meet anticipated claims of plan participants. We delegate the management of our pension and post-retirement benefit plan assets to independent investment advisors who hire and dismiss investment managers based upon various factors. The investment advisors are instructed to diversify investments across asset classes, sectors and manager styles to minimize the risk of large losses, based upon objectives and risk tolerance specified by management, which include allowable and/or prohibited investment types. We measure and monitor investment risk on an ongoing basis through quarterly investment portfolio reviews and annual liability measurements.
We have established certain prohibited investments for our pension and post-retirement benefit plans. Such prohibited investments include loans to the company or its officers and directors as well as investments in the company’s debt or equity securities, except as may occur indirectly through investments in diversified mutual funds. In addition, to reduce concentration of risk, the pension plan will not invest in any fund that holds more than 25% of its total assets to be invested in the securities of one or more issuers conducting their principal business activities in the same industry. This restriction does not apply to investments in securities issued or guaranteed by the U.S. government or its agencies.
Target allocations for our pension plan assets are approximately 39% to debt securities, 39% to equity securities, 12% to alternative investments such as real estate securities, hedge funds and private equity investments, and the remaining 10% to a fund which provides tactical portfolio overlay by investing in futures related to debt, equity and foreign currency. Our investments in equity include investment funds with underlying investments in domestic and foreign large-, mid- and small-cap companies, derivatives related to such holdings, private equity investments including late-stage venture investments and other investments. Our investments in debt include core and high-yield bonds. Core bonds are comprised of investment funds with underlying investments in investment grade debt securities of corporate entities, obligations of U.S. and foreign governments and their agencies and other debt securities. High-yield bonds include investment funds with underlying investments in non-investment grade debt securities of corporate entities, obligations of foreign governments and their agencies, private debt securities and other debt securities. Real estate securities consist primarily of funds invested in core real estate throughout the U.S. while alternative funds invest in wide ranging investments including equity and debt securities of domestic and foreign corporations, debt securities issued by U.S. and foreign governments and their agencies, structured debt, warrants, exchange-traded funds, derivative instruments, private investment funds and other investments.
Target allocations for our post-retirement benefit plan assets are 65% to equity securities and 35% to debt securities. Our investments in equity securities include investment funds with underlying investments primarily in domestic and foreign large-, mid- and small-cap companies. Our investments in debt securities include a core bond fund with underlying investments in investment grade debt securities of domestic and foreign corporate entities, obligations of U.S. and foreign governments and their agencies, private placement securities and other investments.
91
Similar to other assets measured at fair value, GAAP establishes a hierarchal framework for disclosing the transparency of the inputs utilized in measuring pension and post-retirement benefit plan assets at fair value. From time to time, the pension and post-retirement benefits trusts may buy and sell investments resulting in changes within the hierarchy. See Note 5, “Financial Instruments and Trading Securities,” for a description of the hierarchal framework.
The following table provides the fair value of our pension plan assets and the corresponding level of hierarchy as of December 31, 2016 and 2015.
As of December 31, 2016 | Level 1 | Level 2 | Level 3 | NAV | Total | |||||||||||||||
(In Thousands) | ||||||||||||||||||||
Assets: | ||||||||||||||||||||
Domestic equity funds | $ | — | $ | 168,407 | $ | — | $ | 23,580 | $ | 191,987 | ||||||||||
International equity fund | — | 83,738 | — | — | 83,738 | |||||||||||||||
Emerging market equity fund | — | 21,055 | — | — | 21,055 | |||||||||||||||
Domestic bond fund | — | 101,200 | — | — | 101,200 | |||||||||||||||
Core bond funds | — | 86,109 | — | — | 86,109 | |||||||||||||||
High-yield bond fund | — | 30,729 | — | — | 30,729 | |||||||||||||||
Emerging market bond fund | — | 23,584 | — | — | 23,584 | |||||||||||||||
Combination debt/equity/other fund | — | 37,851 | — | — | 37,851 | |||||||||||||||
Alternative investment funds | — | — | — | 43,686 | 43,686 | |||||||||||||||
Real estate securities fund | — | — | — | 32,390 | 32,390 | |||||||||||||||
Cash equivalents | — | 6,145 | — | — | 6,145 | |||||||||||||||
Total Assets Measured at Fair Value | $ | — | $ | 558,818 | $ | — | $ | 99,656 | $ | 658,474 | ||||||||||
As of December 31, 2015 | Level 1 | Level 2 | Level 3 | NAV | Total | |||||||||||||||
Assets: | (In Thousands) | |||||||||||||||||||
Domestic equity funds | $ | — | $ | 165,506 | $ | — | $ | 25,277 | $ | 190,783 | ||||||||||
International equity fund | — | 75,453 | — | — | 75,453 | |||||||||||||||
Emerging market equity fund | — | 20,798 | — | — | 20,798 | |||||||||||||||
Domestic bond fund | — | 105,279 | — | — | 105,279 | |||||||||||||||
Core bond funds | — | 99,726 | — | — | 99,726 | |||||||||||||||
High-yield bond fund | — | 28,288 | — | — | 28,288 | |||||||||||||||
Emerging market bond fund | — | 23,019 | — | — | 23,019 | |||||||||||||||
Combination debt/equity/other fund | — | 36,151 | — | — | 36,151 | |||||||||||||||
Alternative investment funds | — | — | — | 39,557 | 39,557 | |||||||||||||||
Real estate securities fund | — | — | — | 30,173 | 30,173 | |||||||||||||||
Cash equivalents | — | 4,718 | — | — | 4,718 | |||||||||||||||
Total Assets Measured at Fair Value | $ | — | $ | 558,938 | $ | — | $ | 95,007 | $ | 653,945 | ||||||||||
92
The following table provides the fair value of our post-retirement benefit plan assets and the corresponding level of hierarchy as of December 31, 2016 and 2015.
As of December 31, 2016 | Level 1 | Level 2 | Level 3 | NAV | Total | |||||||||||||||
(In Thousands) | ||||||||||||||||||||
Assets: | ||||||||||||||||||||
Domestic equity funds | $ | — | $ | 61,055 | $ | — | $ | — | $ | 61,055 | ||||||||||
International equity fund | — | 15,034 | — | — | 15,034 | |||||||||||||||
Core bond funds | — | 38,952 | — | — | 38,952 | |||||||||||||||
Cash equivalents | — | 578 | — | — | 578 | |||||||||||||||
Total Assets Measured at Fair Value | $ | — | $ | 115,619 | $ | — | $ | — | $ | 115,619 | ||||||||||
As of December 31, 2015 | Level 1 | Level 2 | Level 3 | NAV | Total | |||||||||||||||
(In Thousands) | ||||||||||||||||||||
Assets: | ||||||||||||||||||||
Domestic equity funds | $ | — | $ | 59,946 | $ | — | $ | — | $ | 59,946 | ||||||||||
International equity fund | — | 14,419 | — | — | 14,419 | |||||||||||||||
Core bond funds | — | 40,475 | — | — | 40,475 | |||||||||||||||
Cash equivalents | — | 576 | — | — | 576 | |||||||||||||||
Total Assets Measured at Fair Value | $ | — | $ | 115,416 | $ | — | $ | — | $ | 115,416 | ||||||||||
Cash Flows
The following table shows the expected cash flows for our pension and post-retirement benefit plans for future years.
Pension Benefits | Post-retirement Benefits | |||||||||||||||
To/(From) Trust | (From) Company Assets | To/(From) Trust | (From) Company Assets | |||||||||||||
(In Millions) | ||||||||||||||||
Expected contributions: | ||||||||||||||||
2017 | $ | 25.2 | $ | — | ||||||||||||
Expected benefit payments: | ||||||||||||||||
2017 | $ | (55.7 | ) | $ | (2.3 | ) | $ | (7.8 | ) | $ | (0.3 | ) | ||||
2018 | (58.1 | ) | (2.3 | ) | (7.9 | ) | (0.3 | ) | ||||||||
2019 | (60.2 | ) | (2.3 | ) | (8.1 | ) | (0.3 | ) | ||||||||
2020 | (62.7 | ) | (2.2 | ) | (8.2 | ) | (0.2 | ) | ||||||||
2021 | (64.4 | ) | (2.2 | ) | (8.3 | ) | (0.2 | ) | ||||||||
2022-2026 | (325.1 | ) | (10.8 | ) | (40.2 | ) | (0.9 | ) | ||||||||
Savings Plans
We maintain a qualified 401(k) savings plan in which most of our employees participate. We match employees’ contributions in cash up to specified maximum limits. Our contributions to the plan are deposited with a trustee and invested at the direction of plan participants into one or more of the investment alternatives we provide under the plan. Our contributions totaled $8.0 million in 2016, $7.7 million in 2015 and $7.0 million in 2014.
93
Stock-Based Compensation Plans
We have a long-term incentive and share award plan (LTISA Plan), which is a stock-based compensation plan in which employees and directors are eligible for awards. The LTISA Plan was implemented as a means to attract, retain and motivate employees and directors. Under the LTISA Plan, we may grant awards in the form of stock options, dividend equivalents, share appreciation rights, RSUs, performance shares and performance share units to plan participants. Up to 8.3 million shares of common stock may be granted under the LTISA Plan. As of December 31, 2016, awards of approximately 5.2 million shares of common stock had been made under the plan.
All stock-based compensation is measured at the grant date based on the fair value of the award and is recognized as an expense in the consolidated statement of income over the requisite service period. The requisite service periods range from one to four years. However, upon consummation of the merger, all unrecognized compensation costs for outstanding RSU awards will be expensed on our income statement. The table below shows compensation expense and income tax benefits related to stock-based compensation arrangements that are included in our net income.
Year Ended December 31, | |||||||||||
2016 | 2015 | 2014 | |||||||||
(In Thousands) | |||||||||||
Compensation expense | $ | 9,237 | $ | 8,250 | $ | 7,193 | |||||
Income tax benefits related to stock-based compensation arrangements | 3,653 | 3,263 | 2,845 | ||||||||
We use RSU awards for our stock-based compensation awards. RSU awards are grants that entitle the holder to receive shares of common stock as the awards vest. These RSU awards are defined as nonvested shares and do not include restrictions once the awards have vested.
RSU awards with only service requirements vest solely upon the passage of time. We measure the fair value of these RSU awards based on the market price of the underlying common stock as of the grant date. RSU awards with only service conditions that have a graded vesting schedule are recognized as an expense in the consolidated statement of income on a straight-line basis over the requisite service period for the entire award. Nonforfeitable dividend equivalents, or the rights to receive cash equal to the value of dividends paid on Westar Energy’s common stock, are paid on these RSUs during the vesting period.
RSU awards with performance measures vest upon expiration of the award term. The number of shares of common stock awarded upon vesting will vary from 0% to 200% of the RSU award, with performance tied to our total shareholder return relative to the total shareholder return of our peer group. We measure the fair value of these RSU awards using a Monte Carlo simulation technique that uses the closing stock price at the valuation date and incorporates assumptions for inputs of the expected volatility and risk-free interest rates. Expected volatility is based on historical volatility over three years using daily stock price observations. The risk-free interest rate is based on treasury constant maturity yields as reported by the Federal Reserve and the length of the performance period. For the 2016 valuation, inputs for expected volatility ranged from 16.9% to 22.4% and the risk-free interest rate was approximately 0.9%. For the 2015 valuation, inputs for expected volatility ranged from 14.6% to 19.1% and the risk-free interest rate was approximately 1.0%. For these RSU awards, dividend equivalents accumulate over the vesting period and are paid in cash based on the number of shares of common stock awarded upon vesting.
94
During the years ended December 31, 2016, 2015 and 2014, our RSU activity for awards with only service requirements was as follows.
As of December 31, | ||||||||||||||||||||
2016 | 2015 | 2014 | ||||||||||||||||||
Shares | Weighted- Average Grant Date Fair Value | Shares | Weighted- Average Grant Date Fair Value | Shares | Weighted- Average Grant Date Fair Value | |||||||||||||||
(Shares In Thousands) | ||||||||||||||||||||
Nonvested balance, beginning of year | 309.9 | $ | 35.21 | 342.2 | $ | 31.38 | 352.5 | $ | 28.38 | |||||||||||
Granted | 99.3 | 46.35 | 115.7 | 39.50 | 131.5 | 34.53 | ||||||||||||||
Vested | (115.9 | ) | 32.33 | (115.4 | ) | 28.77 | (118.2 | ) | 26.19 | |||||||||||
Forfeited | (3.9 | ) | 40.95 | (32.6 | ) | 33.07 | (23.6 | ) | 30.00 | |||||||||||
Nonvested balance, end of year | 289.4 | 40.11 | 309.9 | 35.21 | 342.2 | 31.38 | ||||||||||||||
Total unrecognized compensation cost related to RSU awards with only service requirements was $5.0 million and $4.5 million as of December 31, 2016 and 2015, respectively. Absent the merger, we expect to recognize these costs over a remaining weighted-average period of 1.8 years. The total fair value of RSUs with only service requirements that vested during the years ended December 31, 2016, 2015 and 2014, was $5.2 million, $4.7 million and $3.9 million, respectively.
During the years ended December 31, 2016, 2015 and 2014, our RSU activity for awards with performance measures was as follows.
As of December 31, | ||||||||||||||||||||
2016 | 2015 | 2014 | ||||||||||||||||||
Shares | Weighted- Average Grant Date Fair Value | Shares | Weighted- Average Grant Date Fair Value | Shares | Weighted- Average Grant Date Fair Value | |||||||||||||||
(Shares In Thousands) | ||||||||||||||||||||
Nonvested balance, beginning of year | 299.1 | $ | 36.00 | 345.1 | $ | 32.31 | 350.1 | $ | 30.35 | |||||||||||
Granted | 100.9 | 46.03 | 94.8 | 40.26 | 126.1 | 35.97 | ||||||||||||||
Vested | (98.5 | ) | 31.59 | (109.0 | ) | 28.99 | (108.2 | ) | 30.56 | |||||||||||
Forfeited | (3.8 | ) | 41.57 | (31.8 | ) | 34.03 | (22.9 | ) | 30.70 | |||||||||||
Nonvested balance, end of year | 297.7 | 40.79 | 299.1 | 36.00 | 345.1 | 32.31 | ||||||||||||||
As of December 31, 2016 and 2015, total unrecognized compensation cost related to RSU awards with performance measures was $4.5 million and $4.0 million, respectively. Absent the merger, we expect to recognize these costs over a remaining weighted-average period of 1.7 years. The total fair value of RSUs with performance measures that vested during the years ended December 31, 2016, 2015 and 2014, was $7.5 million, $3.1 million and $0.5 million, respectively.
Another component of the LTISA Plan is the Executive Stock for Compensation program under which, in the past, eligible employees were entitled to receive deferred common stock in lieu of current cash compensation. Although this plan was discontinued in 2001, dividends will continue to be paid to plan participants on their outstanding plan balance until distribution. Plan participants were awarded 170 shares of common stock for dividends in 2016, 296 shares in 2015 and 403 shares in 2014. Participants received common stock distributions of 2,110 shares in 2016, 2,024 shares in 2015 and 1,944 shares in 2014.
95
13. WOLF CREEK EMPLOYEE BENEFIT PLANS
Pension and Post-Retirement Benefit Plans
As a co-owner of Wolf Creek, KGE is indirectly responsible for 47% of the liabilities and expenses associated with the Wolf Creek pension and post-retirement benefit plans. KGE accrues its 47% share of Wolf Creek’s cost of pension and post-retirement benefits during the years an employee provides service. The following tables summarize the status of KGE’s 47% share of the Wolf Creek pension and post-retirement benefit plans.
Pension Benefits | Post-retirement Benefits | |||||||||||||||
As of December 31, | 2016 | 2015 | 2016 | 2015 | ||||||||||||
(In Thousands) | ||||||||||||||||
Change in Benefit Obligation: | ||||||||||||||||
Benefit obligation, beginning of year | $ | 206,418 | $ | 210,320 | $ | 7,793 | $ | 8,240 | ||||||||
Service cost | 6,748 | 7,595 | 127 | 138 | ||||||||||||
Interest cost | 9,655 | 9,016 | 325 | 314 | ||||||||||||
Plan participants’ contributions | — | — | 989 | 934 | ||||||||||||
Benefits paid | (6,974 | ) | (6,217 | ) | (1,531 | ) | (1,622 | ) | ||||||||
Actuarial losses (gains) | 13,178 | (14,296 | ) | (488 | ) | (211 | ) | |||||||||
Benefit obligation, end of year | $ | 229,025 | $ | 206,418 | $ | 7,215 | $ | 7,793 | ||||||||
Change in Plan Assets: | ||||||||||||||||
Fair value of plan assets, beginning of year | $ | 121,622 | $ | 124,660 | $ | 105 | $ | 6 | ||||||||
Actual return on plan assets | 8,967 | (2,879 | ) | (4 | ) | — | ||||||||||
Employer contributions | 14,820 | 5,805 | 458 | 787 | ||||||||||||
Plan participants’ contributions | — | — | 989 | 934 | ||||||||||||
Benefits paid | (6,721 | ) | (5,964 | ) | (1,531 | ) | (1,622 | ) | ||||||||
Fair value of plan assets, end of year | $ | 138,688 | $ | 121,622 | $ | 17 | $ | 105 | ||||||||
Funded status, end of year | $ | (90,337 | ) | $ | (84,796 | ) | $ | (7,198 | ) | $ | (7,688 | ) | ||||
Amounts Recognized in the Balance Sheets Consist of: | ||||||||||||||||
Current liability | $ | (248 | ) | $ | (247 | ) | $ | (538 | ) | $ | (597 | ) | ||||
Noncurrent liability | (90,089 | ) | (84,549 | ) | (6,660 | ) | (7,091 | ) | ||||||||
Net amount recognized | $ | (90,337 | ) | $ | (84,796 | ) | $ | (7,198 | ) | $ | (7,688 | ) | ||||
Amounts Recognized in Regulatory Assets Consist of: | ||||||||||||||||
Net actuarial loss (gain) | $ | 66,324 | $ | 56,747 | $ | (654 | ) | $ | (184 | ) | ||||||
Prior service cost | 446 | 501 | — | — | ||||||||||||
Net amount recognized | $ | 66,770 | $ | 57,248 | $ | (654 | ) | $ | (184 | ) | ||||||
96
Pension Benefits | Post-retirement Benefits | |||||||||||||||
As of December 31, | 2016 | 2015 | 2016 | 2015 | ||||||||||||
(Dollars in Thousands) | ||||||||||||||||
Pension Plans With a Projected Benefit Obligation In Excess of Plan Assets: | ||||||||||||||||
Projected benefit obligation | $ | 229,025 | $ | 206,418 | $ | — | $ | — | ||||||||
Fair value of plan assets | 138,688 | 121,622 | — | — | ||||||||||||
Pension Plans With an Accumulated Benefit Obligation In Excess of Plan Assets: | ||||||||||||||||
Accumulated benefit obligation | $ | 201,963 | $ | 180,718 | $ | — | $ | — | ||||||||
Fair value of plan assets | 138,688 | 121,622 | — | — | ||||||||||||
Post-retirement Plans With an Accumulated Post-retirement Benefit Obligation In Excess of Plan Assets: | ||||||||||||||||
Accumulated post-retirement benefit obligation | $ | — | $ | — | $ | 7,215 | $ | 7,793 | ||||||||
Fair value of plan assets | — | — | 17 | 105 | ||||||||||||
Weighted-Average Actuarial Assumptions used to Determine Net Periodic Benefit Obligation: | ||||||||||||||||
Discount rate | 4.26 | % | 4.61 | % | 3.95 | % | 4.27 | % | ||||||||
Compensation rate increase | 4.00 | % | 4.00 | % | — | % | — | % | ||||||||
Wolf Creek uses a measurement date of December 31 for its pension and post-retirement benefit plans. The discount rate used to determine the current year pension obligation and the following year’s pension expense is based on a bond selection-settlement portfolio approach. This approach develops a discount rate by selecting a portfolio of high quality, non-callable corporate bonds that generate sufficient cash flow to provide for the projected benefit payments of the plan. After the bond portfolio is selected, a single interest rate is determined that equates the present value of the plan’s projected benefit payments discounted at this rate with the market value of the bonds selected. The decrease in the discount rates used as of December 31, 2016, increased Wolf Creek’s pension and post-retirement benefit obligations by approximately $11.2 million and $0.2 million, respectively.
97
The prior service cost is amortized on a straight-line basis over the average future service of the active employees (plan participants) benefiting under the plan at the time of the amendment. The net actuarial gain or loss is amortized on a straight-line basis over the average future service of active plan participants benefiting under the plan without application of an amortization corridor. Following is additional information regarding KGE’s 47% share of the Wolf Creek pension and other post-retirement benefit plans.
Pension Benefits | Post-retirement Benefits | |||||||||||||||||||||||
Year Ended December 31, | 2016 | 2015 | 2014 | 2016 | 2015 | 2014 | ||||||||||||||||||
(Dollars in Thousands) | ||||||||||||||||||||||||
Components of Net Periodic Cost (Benefit): | ||||||||||||||||||||||||
Service cost | $ | 6,748 | $ | 7,595 | $ | 5,695 | $ | 127 | $ | 138 | $ | 173 | ||||||||||||
Interest cost | 9,655 | 9,016 | 8,469 | 325 | 314 | 464 | ||||||||||||||||||
Expected return on plan assets | (9,722 | ) | (9,044 | ) | (8,084 | ) | — | — | — | |||||||||||||||
Amortization of unrecognized: | ||||||||||||||||||||||||
Prior service costs | 55 | 57 | 58 | — | — | — | ||||||||||||||||||
Actuarial loss (gain), net | 4,357 | 5,930 | 2,987 | (14 | ) | 3 | 165 | |||||||||||||||||
Net periodic cost before regulatory adjustment | 11,093 | 13,554 | 9,125 | 438 | 455 | 802 | ||||||||||||||||||
Regulatory adjustment (a) | 1,886 | (1,485 | ) | 2,328 | — | — | — | |||||||||||||||||
Net periodic cost | $ | 12,979 | $ | 12,069 | $ | 11,453 | $ | 438 | $ | 455 | $ | 802 | ||||||||||||
Other Changes in Plan Assets and Benefit Obligations Recognized in Regulatory Assets: | ||||||||||||||||||||||||
Current year actuarial loss (gain) | $ | 13,934 | $ | (2,373 | ) | $ | 38,833 | $ | (484 | ) | $ | (211 | ) | $ | (1,881 | ) | ||||||||
Amortization of actuarial (gain) loss | (4,357 | ) | (5,930 | ) | (2,987 | ) | 14 | (3 | ) | (165 | ) | |||||||||||||
Amortization of prior service cost | (55 | ) | (57 | ) | (58 | ) | — | — | — | |||||||||||||||
Total recognized in regulatory assets | $ | 9,522 | $ | (8,360 | ) | $ | 35,788 | $ | (470 | ) | $ | (214 | ) | $ | (2,046 | ) | ||||||||
Total recognized in net periodic cost and regulatory assets | $ | 22,501 | $ | 3,709 | $ | 47,241 | $ | (32 | ) | $ | 241 | $ | (1,244 | ) | ||||||||||
Weighted-Average Actuarial Assumptions used to Determine Net Periodic Cost: | ||||||||||||||||||||||||
Discount rate | 4.61 | % | 4.20 | % | 5.11 | % | 4.27 | % | 3.89 | % | 4.70 | % | ||||||||||||
Expected long-term return on plan assets | 7.50 | % | 7.50 | % | 7.50 | % | — | % | — | % | — | % | ||||||||||||
Compensation rate increase | 4.00 | % | 4.00 | % | 4.00 | % | — | % | — | % | — | % | ||||||||||||
_______________
(a) | The regulatory adjustment represents the difference between current period pension or post-retirement benefit expense and the amount of such expense recognized in setting our prices. |
We estimate that we will amortize the following amounts from regulatory assets and regulatory liabilities into net periodic cost in 2017.
Pension Benefits | Post-retirement Benefits | ||||||
(In Thousands) | |||||||
Actuarial loss (gain) | $ | 4,979 | $ | (50 | ) | ||
Prior service cost | 55 | — | |||||
Total | $ | 5,034 | $ | (50 | ) | ||
The expected long-term rate of return on plan assets is based on historical and projected rates of return for current and planned asset classes in the plans’ investment portfolios. Assumed projected rates of return for each asset class were selected after analyzing long-term historical experience and future expectations of the volatility of the various asset classes. Based on target asset allocations for each asset class, the overall expected rate of return for the portfolios was developed, adjusted for historical and expected experience of active portfolio management results compared to benchmark returns and for the effect of expenses paid from plan assets.
98
For measurement purposes, the assumed annual health care cost growth rates were as follows.
As of December 31, | |||||
2016 | 2015 | ||||
Health care cost trend rate assumed for next year | 6.5 | % | 7.0 | % | |
Rate to which the cost trend rate is assumed to decline (the ultimate trend rate) | 5.0 | % | 5.0 | % | |
Year that the rate reaches the ultimate trend rate | 2020 | 2020 | |||
The health care cost trend rate affects the projected benefit obligation. A 1% change in assumed health care cost growth rates would have effects shown in the following table.
One-Percentage- Point Increase | One-Percentage- Point Decrease | ||||||
(In Thousands) | |||||||
Effect on total of service and interest cost | $ | (7 | ) | $ | 7 | ||
Effect on post-retirement benefit obligation | (126 | ) | 133 | ||||
Plan Assets
Wolf Creek’s pension and post-retirement plan investment strategy is to manage assets in a prudent manner with regard to preserving principal while providing reasonable returns. It has adopted a long-term investment horizon such that the chances and duration of investment losses are weighed against the long-term potential for appreciation of assets. Part of its strategy includes managing interest rate sensitivity of plan assets relative to the associated liabilities. The primary objective of the pension plan is to provide a source of retirement income for its participants and beneficiaries, and the primary financial objective of the plan is to improve its funded status. The primary objective of the post-retirement benefit plan is growth in assets and preservation of principal, while minimizing interim volatility, to meet anticipated claims of plan participants. Wolf Creek delegates the management of its pension and post-retirement benefit plan assets to independent investment advisors who hire and dismiss investment managers based upon various factors. The investment advisors are instructed to diversify investments across asset classes, sectors and manager styles to minimize the risk of large losses, based upon objectives and risk tolerance specified by Wolf Creek, which include allowable and/or prohibited investment types. It measures and monitors investment risk on an ongoing basis through quarterly investment portfolio reviews and annual liability measurements.
The target allocations for Wolf Creek’s pension plan assets are 31% to international equity securities, 25% to domestic equity securities, 25% to debt securities, 10% to real estate securities, 5% to commodity investments and 4% to other investments. The investments in both international and domestic equity include investments in large-, mid- and small-cap companies and investment funds with underlying investments similar to those previously mentioned. The investments in debt include core and high-yield bonds. Core bonds include funds invested in investment grade debt securities of corporate entities, obligations of U.S. and foreign governments and their agencies and private debt securities. High-yield bonds include a fund with underlying investments in non-investment grade debt securities of corporate entities, private placements and bank debt. Real estate securities include funds invested in commercial and residential real estate properties while commodity investments include funds invested in commodity-related instruments.
Similar to other assets measured at fair value, GAAP establishes a hierarchal framework for disclosing the transparency of the inputs utilized in measuring pension and post-retirement benefit plan assets at fair value. From time to time, the Wolf Creek pension trust may buy and sell investments resulting in changes within the hierarchy. See Note 5, “Financial Instruments and Trading Securities,” for a description of the hierarchal framework.
99
The following table provides the fair value of KGE’s 47% share of Wolf Creek’s pension plan assets and the corresponding level of hierarchy as of December 31, 2016 and 2015.
As of December 31, 2016 | Level 1 | Level 2 | Level 3 | NAV | Total | |||||||||||||||
(In Thousands) | ||||||||||||||||||||
Assets: | ||||||||||||||||||||
Domestic equity funds | $ | — | $ | 34,586 | $ | — | $ | — | $ | 34,586 | ||||||||||
International equity funds | — | 43,269 | — | — | 43,269 | |||||||||||||||
Core bond funds | — | 35,048 | — | — | 35,048 | |||||||||||||||
Real estate securities fund | — | — | — | 6,948 | 6,948 | |||||||||||||||
Alternative investment fund | — | 14,073 | — | 4,164 | 18,237 | |||||||||||||||
Cash equivalents | — | 600 | — | — | 600 | |||||||||||||||
Total Assets Measured at Fair Value | $ | — | $ | 127,576 | $ | — | $ | 11,112 | $ | 138,688 | ||||||||||
As of December 31, 2015 | Level 1 | Level 2 | Level 3 | NAV | Total | |||||||||||||||
(In Thousands) | ||||||||||||||||||||
Assets: | ||||||||||||||||||||
Domestic equity funds | $ | — | $ | 30,503 | $ | — | $ | — | $ | 30,503 | ||||||||||
International equity funds | — | 37,682 | — | — | 37,682 | |||||||||||||||
Core bond funds | — | 30,287 | — | — | 30,287 | |||||||||||||||
Real estate securities fund | — | 6,123 | — | 6,434 | 12,557 | |||||||||||||||
Commodities fund | — | 5,811 | — | — | 5,811 | |||||||||||||||
Alternative investment fund | — | — | — | 4,258 | 4,258 | |||||||||||||||
Cash equivalents | — | 524 | — | — | 524 | |||||||||||||||
Total Assets Measured at Fair Value | $ | — | $ | 110,930 | $ | — | $ | 10,692 | $ | 121,622 | ||||||||||
Cash Flows
The following table shows our expected cash flows for KGE’s 47% share of Wolf Creek’s pension and post-retirement benefit plans for future years.
Expected Cash Flows | Pension Benefits | Post-retirement Benefits | ||||||||||||||
To/(From) Trust | (From) Company Assets | To/(From) Trust | (From) Company Assets | |||||||||||||
(In Millions) | ||||||||||||||||
Expected contributions: | ||||||||||||||||
2017 | $ | 10.8 | $ | 0.6 | ||||||||||||
Expected benefit payments: | ||||||||||||||||
2017 | $ | (7.2 | ) | $ | (0.3 | ) | $ | (2.0 | ) | $ | — | |||||
2018 | (8.1 | ) | (0.3 | ) | (2.3 | ) | — | |||||||||
2019 | (9.0 | ) | (0.3 | ) | (2.6 | ) | — | |||||||||
2020 | (9.8 | ) | (0.3 | ) | (2.9 | ) | — | |||||||||
2021 | (10.7 | ) | (0.3 | ) | (3.2 | ) | — | |||||||||
2022 - 2026 | (66.0 | ) | (1.3 | ) | (20.2 | ) | — | |||||||||
Savings Plan
Wolf Creek maintains a qualified 401(k) savings plan in which most of its employees participate. Wolf Creek matches employees’ contributions in cash up to specified maximum limits. Wolf Creek’s contributions to the plan are deposited with a trustee and invested at the direction of plan participants into one or more of the investment alternatives provided under the plan. KGE’s portion of the expense associated with Wolf Creek’s matching contributions was $1.6 million in 2016, $1.6 million in 2015 and $1.4 million in 2014.
100
14. COMMITMENTS AND CONTINGENCIES
Purchase Orders and Contracts
As part of our ongoing operations and capital expenditure program, we have purchase orders and contracts, excluding fuel and transmission, which are discussed below under “—Fuel and Purchased Power Commitments.” These commitments relate to purchase obligations issued and outstanding at year-end.
The yearly detail of the aggregate amount of required payments as of December 31, 2016, was as follows.
Committed Amount | |||
(In Thousands) | |||
2017 | $ | 310,711 | |
2018 | 73,149 | ||
2019 | 25,411 | ||
Thereafter | 8,100 | ||
Total amount committed | $ | 417,371 | |
Environmental Matters
Set forth below are descriptions of contingencies related to environmental matters that may impact us or our financial results. Our assessment of these contingencies, which are based on federal and state statutes and regulations, and regulatory agency and judicial interpretations and actions, has evolved over time. Since his inauguration in January 2017, reports and other information that have been released suggest that President Trump may alter federal environmental policy, including through executive orders and influencing changes to statutes, regulations and agency priorities. Due in part to the preliminary nature of information that is available to us, as well as the complex nature of environmental regulation, we are unable to assess the impact of potential changes that may develop with respect to the environmental contingencies described below.
Federal Clean Air Act
We must comply with the federal Clean Air Act (CAA), state laws and implementing federal and state regulations that impose, among other things, limitations on emissions generated from our operations, including sulfur dioxide (SO2), particulate matter (PM), nitrogen oxides (NOx), carbon monoxide (CO), mercury and acid gases.
Emissions from our generating facilities, including PM, SO2 and NOx, have been determined by regulation to reduce visibility by causing or contributing to regional haze. Under federal laws, such as the Clean Air Visibility Rule, and pursuant to an agreement with the Kansas Department of Health and Environment (KDHE) and the Environmental Protection Agency (EPA), we are required to install, operate and maintain controls to reduce emissions found to cause or contribute to regional haze.
Sulfur Dioxide and Nitrogen Oxide
Through the combustion of fossil fuels at our generating facilities, we emit SO2 and NOx. Federal and state laws and regulations, including those noted above, and permits issued to us limit the amount of these substances we can emit. If we exceed these limits, we could be subject to fines and penalties. In order to meet SO2 and NOx regulations applicable to our generating facilities, we use low-sulfur coal and natural gas and have equipped the majority of our fossil fuel generating facilities with equipment to control such emissions.
We are subject to the SO2 allowance and trading program under the federal Clean Air Act Acid Rain Program. Under this program, each unit must have enough allowances to cover its SO2 emissions for that year. In 2016, we had adequate SO2 allowances to meet generation and we expect to have enough to cover emissions under this program in 2017.
101
Cross-State Air Pollution Update Rule
In September 2016, the EPA finalized the Cross-State Air Pollution Update Rule. The final rule addresses interstate transport of NOx emissions in 22 states including Kansas, Missouri and Oklahoma during the ozone season and the impact from the formation of ozone on downwind states with respect to the 2008 ozone National Ambient Air Quality Standards (NAAQS). Starting with the 2017 ozone season, the final rule will revise the existing ozone season allowance budgets for Missouri and Oklahoma and will establish an ozone season budget for Kansas. We do not believe this rule will have a material impact on our operations and consolidated financial results.
National Ambient Air Quality Standards
Under the federal CAA, the EPA sets NAAQS for certain emissions known as the “criteria pollutants” considered harmful to public health and the environment, including two classes of PM, ozone, NOx (a precursor to ozone), CO and SO2, which result from fossil fuel combustion. Areas meeting the NAAQS are designated attainment areas while those that do not meet the NAAQS are considered nonattainment areas. Each state must develop a plan to bring nonattainment areas into compliance with the NAAQS. NAAQS must be reviewed by the EPA at five-year intervals.
In October 2015, the EPA strengthened the ozone NAAQS by lowering the standards from 75 parts per billion (ppb) to 70 ppb. In September 2016, the KDHE recommended to the EPA that they designate the state of Kansas as in attainment or in attainment/unclassifiable with the standard. The EPA is required to make attainment/nonattainment designations for the revised standards by October 2017. If the EPA agrees with an attainment or attainment/unclassifiable designation for the state of Kansas, we do not believe this will have a material impact on our consolidated financial results.
In December 2012, the EPA strengthened an existing NAAQS for one class of PM. In December 2014, the EPA designated the entire state of Kansas as unclassifiable/in attainment with the standard. We do not believe this will have a material impact on our operations or consolidated financial results.
In 2010, the EPA revised the NAAQS for SO2. In March 2015, a federal court approved a consent decree between the EPA and environmental groups. The decree includes specific SO2 emissions criteria for certain electric generating plants that, if met, required the EPA to promulgate attainment/nonattainment designations for areas surrounding these plants. Tecumseh Energy Center is our only generating station that meets this criteria. In June 2016, the EPA accepted the State of Kansas recommendation to designate the areas surrounding the facility as unclassifiable, completing the second round of the designation process. In addition, in January 2017, KDHE formally recommended to the EPA a 2,000 ton per year limit for Tecumseh Energy Center Unit 7 in order to satisfy the requirements of the 1-hour SO2 Data Requirements Rule which governs the next round of the designations. By agreeing to the ton per year limitation, no further characterization of the area surrounding the plant is required. We continue to communicate with our regulatory agencies regarding these standards and evaluate what impact the revised NAAQS could have on our operations and consolidated financial results. If areas surrounding our facilities are designated in the future as nonattainment and/or we are required to install additional equipment to control emissions at our facilities, it could have a material impact on our operations and consolidated financial results.
Greenhouse Gases
Burning coal and other fossil fuels releases carbon dioxide (CO2) and other gases referred to as greenhouse gases (GHG). Various regulations under the federal CAA limit CO2 and other GHG emissions, and other measures are being imposed or offered by individual states, municipalities and regional agreements with the goal of reducing GHG emissions.
102
In October 2015, the EPA published a rule establishing new source performance standards that limit CO2 emissions for new, modified and reconstructed coal and natural gas fueled electric generating units to various levels per Megawatt hour depending on various characteristics of the units. Also in October 2015, the EPA published a rule establishing guidelines for states to regulate CO2 emissions from existing power plants. The standards for existing plants are known as the Clean Power Plan (CPP). Under the CPP, interim emissions performance rates must be achieved beginning in 2022 and final emissions performance rates must be achieved by 2030. Legal challenges to the CPP were filed by groups of states and industry members, including our Company, in the U.S. Court of Appeals for the D.C. Circuit beginning in October 2015. In February 2016, after the U.S. Court of Appeals for the D.C. Circuit denied requests to stay the CPP, the U.S. Supreme Court issued an order granting a stay of the rule pending resolution of the legal challenges. In September 2016, oral arguments were heard before the U.S. Court of Appeals for the D.C. Circuit to review the CPP and to conduct the review en banc. Despite the stay, the EPA issued a proposed rule formalizing the details of the CPP’s Clean Energy Incentive Program. In January 2017, the EPA denied our Petition for Reconsideration and Administrative Stay of the CPP. Due to the future uncertainty of the CPP, we cannot at this time determine the impact on our operations or consolidated financial results, but we believe the cost to comply with the CPP could be material.
Water
We discharge some of the water used in our operations. This water may contain substances deemed to be pollutants. Revised rules governing such discharges from coal-fired power plants were issued in November 2015. The final rule establishes limitations or forces the elimination of wastewater associated with coal combustion residual (CCR) handling. Implementation timelines for these requirements will vary from 2019 to 2023. We are evaluating the final rule at this time and cannot predict the resulting impact on our operations or consolidated financial results, but believe costs to comply could be material.
In October 2014, the EPA’s final standards for cooling intake structures at power plants to protect aquatic life took effect. The standards, based on Section 316(b) of the federal Clean Water Act (CWA), require subject facilities to choose among seven best available technology options to reduce fish impingement. In addition, some facilities must conduct studies to assist permitting authorities to determine whether and what site-specific controls, if any, would be required to reduce entrainment of aquatic organisms. Our current analysis indicates this rule will not have a significant impact on our coal plants that employ cooling towers. Biological monitoring may be required for La Cygne and Wolf Creek. We are currently evaluating the rule’s impact on those two plants and cannot predict the resulting impact on our operations or consolidated financial results, but we do not expect it to be material.
In June 2015, the EPA along with the U.S. Army Corps of Engineers issued a final rule, effective August 2015, defining the Waters of the United States for purposes of the CWA. This rulemaking has the potential to impact all programs under the CWA. Expansion of regulated waterways is possible under the rule depending on regulating authority interpretation, which could impact several permitting programs. Various states have filed lawsuits challenging the rule and, in October 2015, the U.S. Court of Appeals for the Sixth Circuit issued an order that temporarily stays implementation of the rule nationwide pending the outcome of the various legal challenges. It is believed the stay will last into 2017. We are currently evaluating the final rule. We do not believe the rule will have a material impact on our operations or consolidated financial results.
Regulation of Coal Combustion Residuals
In the course of operating our coal generation plants, we produce CCRs, including fly ash, gypsum and bottom ash. We recycle some of our ash production, principally by selling to the aggregate industry. The EPA published a rule to regulate CCRs in April 2015, which we believe will require additional CCR handling, processing and storage equipment and closure of certain ash disposal ponds. Impacts to operations will be dependent on the development of groundwater monitoring of CCR units being completed in 2017. We have recorded an ARO for our current estimate for closure of ash disposal ponds but may be required to record additional AROs in the future due to changes in existing CRR regulations, changes in interpretation of existing CCR regulations or changes in the timing or cost to close ash disposal ponds. If additional AROs are necessary, we believe the impact on our operations or consolidated financial results could be material. See Note 15, “Asset Retirement Obligations,” for additional information.
103
SPP Revenue Crediting
We are a member of the Southwest Power Pool, Inc. (SPP) RTO, which coordinates the operation of a multi-state interconnected transmission system. The SPP has recently completed the process of allocating revenue credits under its Open Access Transmission Tariff to sponsors of certain transmission system upgrades. Qualifying upgrades are those that are not financed through general rates paid by all customers and that result in additional revenue to the SPP. The SPP has determined sponsors are entitled to revenue credits for previously completed upgrades, and members are obligated to pay for revenue credits attributable to these historical upgrades. As a result, we paid the SPP in November 2016 $7.6 million related to revenue credits attributable to historical upgrades from March 2008 to August 2016. Most of the related charges will be recovered from our customers in future prices.
Nuclear Decommissioning
Nuclear decommissioning is a nuclear industry term for the permanent shutdown of a nuclear power plant and the removal of radioactive components in accordance with NRC requirements. The NRC will terminate a plant’s license and release the property for unrestricted use when a company has reduced the residual radioactivity of a nuclear plant to a level mandated by the NRC. The NRC requires companies with nuclear plants to prepare formal financial plans to fund nuclear decommissioning. These plans are designed so that sufficient funds required for nuclear decommissioning will be accumulated prior to the expiration of the license of the related nuclear power plant. Wolf Creek files a nuclear decommissioning site study with the KCC every three years.
The KCC reviews nuclear decommissioning plans in two phases. Phase one is the approval of the updated nuclear decommissioning study including the estimated costs to decommission the plant. Phase two involves the review and approval of a funding schedule prepared by the owner of the plant detailing how it plans to fund the future-year dollar amount of its pro rata share of the decommissioning costs.
In 2014, Wolf Creek updated the nuclear decommissioning cost study. Based on the study, our share of decommissioning costs, including decontamination, dismantling and site restoration, is estimated to be approximately $360.0 million. This amount compares to the prior site study estimate of $296.2 million. The site study cost estimate represents the estimate to decommission Wolf Creek as of the site study year. The actual nuclear decommissioning costs may vary from the estimates because of changes in regulations and technologies as well as changes in costs for labor, materials and equipment.
We are allowed to recover nuclear decommissioning costs in our prices over a period equal to the operating license of Wolf Creek, which is through 2045. The NRC requires that funds sufficient to meet nuclear decommissioning obligations be held in a trust. We believe that the KCC approved funding level will also be sufficient to meet the NRC requirement. Our consolidated financial results would be materially affected if we were not allowed to recover in our prices the full amount of the funding requirement.
We recovered in our prices and deposited in an external trust fund for nuclear decommissioning approximately $5.0 million in 2016, $2.8 million in 2015 and $2.8 million in 2014. We record our investment in the NDT fund at fair value, which approximated $200.1 million and $184.1 million as of December 31, 2016 and 2015, respectively.
Storage of Spent Nuclear Fuel
Under the Nuclear Waste Policy Act of 1982, the Department of Energy (DOE) is responsible for the permanent disposal of spent nuclear fuel. In 2010, the DOE filed a motion with the NRC to withdraw its then pending application to construct a national repository for the disposal of spent nuclear fuel and high-level radioactive waste at Yucca Mountain, Nevada. An NRC board denied the DOE’s motion to withdraw its application and the DOE appealed that decision to the full NRC. In 2011, the NRC issued an evenly split decision on the appeal and also ordered the licensing board to close out its work on the DOE’s application by the end of 2011 due to a lack of funding. These agency actions prompted the states of Washington and South Carolina, and a county in South Carolina, to file a lawsuit in a federal Court of Appeals asking the court to compel the NRC to resume its license review and to issue a decision on the license application. In August 2013, the court ordered the NRC to resume its review of the DOE’s application. The NRC has not yet issued its decision.
Wolf Creek is currently evaluating alternatives for expanding its existing on-site spent nuclear fuel storage to provide additional capacity prior to 2025. Wolf Creek is in discussions with the DOE to determine which of its incremental costs may be reimbursable. We cannot predict when, or if, an off-site storage site or alternative disposal site will be available to receive Wolf Creek’s spent nuclear fuel and will continue to monitor this activity.
104
Nuclear Insurance
We maintain nuclear liability, property and accidental outage insurance for Wolf Creek. These policies contain certain industry standard terms, conditions and exclusions, including, but not limited to, ordinary wear and tear and war. An industry aggregate limit of $3.2 billion for nuclear events ($1.8 billion of non-nuclear events) plus any reinsurance, indemnity or any other source recoverable by Nuclear Electric Insurance Limited (NEIL), our property and accidental outage insurance provider, exists for acts of terrorism affecting Wolf Creek or any other NEIL insured plant within 12 months from the date of the first act. In addition, we are required to participate in industry-wide retrospective assessment programs as discussed below.
Nuclear Liability Insurance
Pursuant to the Price-Anderson Act, we insure against public nuclear liability claims resulting from nuclear incidents to the required limit of public liability, which is approximately $13.4 billion. This limit of liability consists of the maximum available commercial insurance of $375.0 million and the remaining $13.0 billion is provided through mandatory participation in an industry-wide retrospective assessment program. For incidents after January 1, 2017, this commercial insurance limit increased to $450.0 million. Under this retrospective assessment program, the owners of Wolf Creek are jointly and severally subject to an assessment of up to $127.3 million (our share is $59.8 million), payable at no more than $19.0 million (our share is $8.9 million) per incident per year per reactor for any commercial U.S. nuclear reactor qualifying incident. Both the total and yearly assessment is subject to an inflationary adjustment every five years with the next adjustment in 2018. In addition, Congress could impose additional revenue-raising measures to pay claims.
Nuclear Property and Accidental Outage Insurance
The owners of Wolf Creek carry decontamination liability, nuclear property damage and premature nuclear decommissioning liability insurance for Wolf Creek totaling approximately $2.8 billion. Insurance coverage for non-nuclear property damage accidents total approximately $2.3 billion. In the event of an extraordinary nuclear accident, insurance proceeds must first be used for reactor stabilization and site decontamination in accordance with a plan mandated by the NRC. Our share of any remaining proceeds can be used to pay for property damage or, if certain requirements are met, including decommissioning the plant, toward a shortfall in the NDT fund. The owners also carry additional insurance with NEIL to help cover costs of replacement power and other extra expenses incurred during a prolonged outage resulting from accidental property damage at Wolf Creek. If significant losses were incurred at any of the nuclear plants insured under the NEIL policies, we may be subject to retrospective assessments under the current policies of approximately $37.5 million (our share is $17.6 million).
Nuclear Insurance Considerations
Although we maintain various insurance policies to provide coverage for potential losses and liabilities resulting from an accident or an extended outage, our insurance coverage may not be adequate to cover the costs that could result from a catastrophic accident or extended outage at Wolf Creek. Any substantial losses not covered by insurance, to the extent not recoverable in our prices, would have a material effect on our consolidated financial results.
Fuel and Purchased Power Commitments
To supply a portion of the fuel requirements for our power plants, the owners of Wolf Creek have entered into various contracts to obtain nuclear fuel and we have entered into various contracts to obtain coal and natural gas. Some of these contracts contain provisions for price escalation and minimum purchase commitments. As of December 31, 2016, our share of Wolf Creek’s nuclear fuel commitments was approximately $16.5 million for uranium concentrates expiring in 2017, $2.5 million for conversion expiring in 2017, $80.3 million for uranium hexafluoride expiring in 2024, $81.6 million for enrichment expiring in 2027 and $29.7 million for fabrication expiring in 2025. In January 2017, Wolf Creek entered into a new nuclear fuel agreement resulting in an additional commitment, at our share, of approximately $16.4 million for uranium concentrates expiring 2024 and $1.7 million for conversion expiring 2024.
As of December 31, 2016, our coal and coal transportation contract commitments under the remaining terms of the contracts were approximately $659.4 million. The contracts are for plants that we operate and expire at various times through 2020.
105
As of December 31, 2016, our natural gas transportation contract commitments under the remaining terms of the contracts were approximately $105.8 million. The natural gas transportation contracts provide firm service to several of our natural gas burning facilities and expire at various times through 2030.
We have power purchase agreements with the owners of nine separate wind generation facilities with installed design capabilities of approximately 1,328 MW expiring in 2028 through 2036. Each of the agreements provide for our receipt and purchase of energy produced at a fixed price per unit of output. We estimate that our annual cost of energy purchased from these wind generation facilities will be approximately $140.1 million.
FERC Proceedings
See Note 4, “Rate Matters and Regulation - FERC Proceedings,” for information regarding a settlement of a complaint that was filed by the KCC against us with the FERC.
15. ASSET RETIREMENT OBLIGATIONS
Legal Liability
We have recognized legal obligations associated with the disposal of long-lived assets that result from the acquisition, construction, development or normal operation of such assets. Concurrent with the recognition of the liability, the estimated cost of the ARO is capitalized and depreciated over the remaining life of the asset. We estimate our AROs based on the fair value of the AROs we incurred at the time the related long-lived assets were either acquired, placed in service or when regulations establishing the obligation became effective. The recording of AROs for regulated operations has no income statement impact due to the deferral of the adjustments through the establishment of a regulatory asset or an offset to a regulatory liability.
We initially recorded AROs at fair value for the estimated cost to decommission Wolf Creek (KGE’s 47% share), retire our wind generation facilities, dispose of asbestos insulating material at our power plants, remediate ash disposal ponds, close ash landfills and dispose of polychlorinated biphenyl (PCB)-contaminated oil. ARO refers to a legal obligation to perform an asset retirement activity in which the timing and/or method of settlement may be conditional on a future event that may or may not be within the control of the entity. In determining our AROs, we make assumptions regarding probable future disposal costs. A change in these assumptions could have significant impact on the AROs reflected on our consolidated balance sheet.
The following table summarizes our legal AROs included on our consolidated balance sheets in long-term liabilities.
As of December 31, | |||||||
2016 | 2015 | ||||||
(In Thousands) | |||||||
Beginning ARO | $ | 275,285 | $ | 230,668 | |||
Increase in ARO liabilities | — | 34,440 | |||||
Liabilities settled | (5,372 | ) | (1,553 | ) | |||
Accretion expense | 14,165 | 12,964 | |||||
Revisions in estimated cash flows | 39,873 | (1,234 | ) | ||||
Ending ARO | $ | 323,951 | $ | 275,285 | |||
In 2015, we recorded an approximately $34.4 million increase in our ARO in response to the EPA’s published rule to regulate CCRs. In 2016, we revised our ARO to include an additional $39.9 million to recognize costs associated with closure and post-closure of ash disposal ponds. See Note 14, “Commitments and Contingencies - Regulation of Coal Combustion Residuals,” for additional information.
We have an obligation to retire our wind generation facilities and remove the foundations. The ARO related to our owned wind generation facilities was determined based upon the date each wind generation facility was placed into service.
The amount of the retirement obligation related to asbestos disposal was recorded as of 1990, the date when the EPA published the “National Emission Standards for Hazardous Air Pollutants: Asbestos NESHAP Revision; Final Rule.”
106
We operate, as permitted by the state of Kansas, ash landfills and ash disposal ponds at several of our power plants. The retirement obligations for the ash landfills and ash disposal ponds were determined based upon the date each landfill was originally placed in service.
PCB-contaminated oil is contained within company electrical equipment, primarily transformers. The PCB retirement obligation was determined based upon the PCB regulations that originally became effective in 1978.
Non-Legal Liability - Cost of Removal
We collect in our prices the costs to dispose of plant assets that do not represent legal retirement obligations. As of December 31, 2016 and 2015, we had $5.7 million and $53.8 million, respectively, in amounts collected, but not yet spent, for removal costs classified as a regulatory liability.
16. LEGAL PROCEEDINGS
We and our subsidiaries are involved in various legal, environmental and regulatory proceedings. We believe that adequate provisions have been made and accordingly believe that the ultimate disposition of such matters will not have a material effect on our consolidated financial results. See Notes 4 and 14, “Rate Matters and Regulation” and “Commitments and Contingencies,” for additional information.
Pending Merger
Following the announcement of the merger agreement, two putative class action complaints (which were consolidated and superseded by a consolidated complaint) and one putative derivative complaint challenging the merger were filed in the District Court of Shawnee County, Kansas.
The consolidated putative class action complaint, filed on July 25, 2016, is captioned In re Westar Energy, Inc. Stockholder Litigation, Case No. 2016-CV-000457. This complaint names as defendants Westar Energy, the members of our board of directors and Great Plains Energy. The complaint asserts that the members of our board of directors breached their fiduciary duties to our shareholders in connection with the proposed merger. It also asserts that Westar Energy and Great Plains Energy aided and abetted such breaches of fiduciary duties. The complaint alleges, among other things, that (i) the merger consideration deprives our shareholders of fair consideration for their shares, (ii) the merger agreement contains deal protection provisions that unfairly favor Great Plains Energy and discourage third parties from submitting potentially superior proposals, (iii) the disclosures are misleading and/or omit material information necessary for our shareholders to make an informed decision whether to vote in favor of the proposed transaction and (iv) if the proposed transaction is consummated, certain of our directors and officers stand to receive significant benefits. The complaint seeks, among other remedies, (i) injunctive relief enjoining the merger, (ii) rescission of the merger agreement or rescissory damages, (iii) a directive to members of our board of directors to account for all damages caused by them as a result of their breaches of their fiduciary duties and (iv) an award for costs and disbursements, including attorneys’ fees and experts’ fees.
The putative derivative complaint, filed on July 5, 2016, and as amended on August 25, 2016, is captioned Braunstein v. Chandler et al., Case No. 2016-CV-000502. This putative derivative action names as defendants the members of our board of directors, Great Plains Energy and a subsidiary of Great Plains Energy, with Westar Energy named as a nominal defendant. The complaint asserts that the members of our board of directors breached their fiduciary duties to our shareholders in connection with the proposed merger. It also asserts that Great Plains Energy and a subsidiary of Great Plains Energy aided and abetted such breaches of fiduciary duties. The complaint alleges, among other things, that the members of our board of directors failed to obtain the best possible price for our shareholders because of a flawed process that discouraged third parties from submitting potentially superior proposals, and that the disclosures are false or misleading due to the omission of certain information. The complaint seeks, among other remedies, (i) a direction that the director defendants exercise their fiduciary duties to obtain a transaction which is in the best interests of us and our shareholders, (ii) a declaration that the proposed transaction was entered into in breach of the fiduciary duties of the defendants and is therefore unlawful and unenforceable, (iii) rescission of the merger agreement, (iv) the imposition of a constructive trust in favor of the plaintiff, on behalf of us, upon any benefits improperly received by the named defendants as a result of their wrongful conduct, (v) award for costs, including attorneys’ fees and experts’ fees, and (vi) the imposition of an injunction against the defendants and others from consummating the merger on the terms proposed.
On September 21, 2016, the parties in the consolidated putative class action and the putative derivative complaint independently agreed to withdraw requests for injunctive relief and otherwise agreed in principle to dismissing the actions with
107
prejudice and to providing releases. In exchange, the parties in the putative derivative complaint agreed that we would make supplemental disclosures to the shareholders, which disclosures were made in a Form 8-K filed on September 21, 2016, and the parties in the consolidated putative class action agreed that we would (i) make the disclosures in the Form 8-K filed on September 21, 2016, and (ii) grant waivers of the prohibition on requesting a waiver of the standstill provisions in the confidentiality and standstill agreements executed by the bidders that participated in the our sale process. These agreements do not constitute any admission by any of the defendants as to the merits of any claims. In the future the parties will prepare and present to the court for approval Stipulations of Settlement that will, if accepted by the court, settle the actions in their entirety.
17. COMMON STOCK
General
Westar Energy’s Restated Articles of Incorporation, as amended, provide for 275.0 million authorized shares of common stock. As of December 31, 2016 and 2015, Westar Energy had issued 141.8 million shares and 141.4 million shares, respectively.
Westar Energy has a direct stock purchase plan (DSPP). Shares of common stock sold pursuant to the DSPP may be either original issue shares or shares purchased in the open market. During 2016 and 2015, Westar Energy issued 0.4 million shares and 0.5 million shares, respectively, through the DSPP and other stock-based plans operated under the long-term incentive and share award plan. As of December 31, 2016 and 2015, a total of 1.0 million shares and 1.2 million shares, respectively, were available under the DSPP registration statement.
Issuances
In September 2013, Westar Energy entered into two forward sale agreements with two banks. Under the terms of the agreements, the banks, as forward sellers, borrowed 8.0 million shares of Westar Energy’s common stock from third parties and sold them to a group of underwriters for $31.15 per share. Pursuant to over-allotment options granted to the underwriters, the underwriters purchased in October 2013 an additional 0.9 million shares from the banks as forward sellers, increasing the total number of shares under the forward sale agreements to approximately 8.9 million. The underwriters received a commission equal to 3.5% of the sales price of all shares sold under each agreement.
In March 2013, Westar Energy entered into a three-year sales agency financing agreement and master forward sale agreement with a bank. Both agreements expired in March 2016. The maximum amount that Westar Energy could have offered and sold under the master agreement was the lesser of an aggregate of $500.0 million or approximately 25.0 million shares, subject to adjustment for share splits, share combinations and share dividends. Under the terms of the sales agency financing agreement, Westar Energy could have offered and sold shares of its common stock from time to time. The agent received a commission equal to 1% of the sales price of all shares sold under the agreements.
The following table summarizes our common stock activity pursuant to the two forward sale agreements. There was no common stock sale activity under these agreements in 2016.
Year Ended December 31, | |||||
2015 | 2014 | ||||
Shares that could be settled at beginning of year | 9,160,500 | 12,052,976 | |||
Transactions settled (a) | 9,160,500 | 2,892,476 | |||
Shares that could be settled at end of year | — | 9,160,500 | |||
_______________ | |||||
(a) The shares settled during the years ended December 31, 2015 and 2014, were settled with a physical settlement amount of approximately $254.6 million and $82.9 million, respectively. | |||||
108
The forward sale transactions were entered into at market prices; therefore, the forward sale agreements had no initial fair value. Westar Energy did not receive any proceeds from the sale of common stock under the forward sale agreements until transactions were settled. Westar Energy settled the forward sale transactions through physical share settlement and recorded the forward sale agreements within equity. The shares under the forward sale agreements were initially priced when the transactions were entered into and were subject to certain fixed pricing adjustments during the term of the agreements. The net proceeds from the forward sale transactions represent the prices established by the forward sale agreements applicable to the time periods in which physical settlement occurred.
Westar Energy used the proceeds from the transactions described above to repay short-term borrowings, with such borrowed amounts principally used for investments in capital equipment, as well as for working capital and general corporate purposes.
18. VARIABLE INTEREST ENTITIES
In determining the primary beneficiary of a VIE, we assess the entity’s purpose and design, including the nature of the entity’s activities and the risks that the entity was designed to create and pass through to its variable interest holders. A reporting enterprise is deemed to be the primary beneficiary of a VIE if it has (a) the power to direct the activities of the VIE that most significantly impact the VIE’s economic performance and (b) the obligation to absorb losses or right to receive benefits from the VIE that could potentially be significant to the VIE. The primary beneficiary of a VIE is required to consolidate the VIE. The trusts holding our 8% interest in JEC and our 50% interest in La Cygne unit 2 are VIEs of which we are the primary beneficiary.
We assess all entities with which we become involved to determine whether such entities are VIEs and, if so, whether or not we are the primary beneficiary of the entities. We also continuously assess whether we are the primary beneficiary of the VIEs with which we are involved. Prospective changes in facts and circumstances may cause us to reconsider our determination as it relates to the identification of the primary beneficiary.
8% Interest in Jeffrey Energy Center
Under an agreement that expires in January 2019, we lease an 8% interest in JEC from a trust. The trust was financed with an equity contribution from an owner participant and debt issued by the trust. The trust was created specifically to purchase the 8% interest in JEC and lease it to a third party, and does not hold any other assets. We meet the requirements to be considered the primary beneficiary of the trust. In determining the primary beneficiary of the trust, we concluded that the activities of the trust that most significantly impact its economic performance and that we have the power to direct include (1) the operation and maintenance of the 8% interest in JEC, (2) our ability to exercise a purchase option at the end of the agreement at the lesser of fair value or a fixed amount and (3) our option to require refinancing of the trust’s debt. We have the potential to receive benefits from the trust that could potentially be significant if the fair value of the 8% interest in JEC at the end of the agreement is greater than the fixed amount. The possibility of lower interest rates upon refinancing the debt also creates the potential for us to receive significant benefits.
50% Interest in La Cygne Unit 2
Under an agreement that expires in September 2029, KGE entered into a sale-leaseback transaction with a trust under which the trust purchased KGE’s 50% interest in La Cygne unit 2 and subsequently leased it back to KGE. The trust was financed with an equity contribution from an owner participant and debt issued by the trust. The trust was created specifically to purchase the 50% interest in La Cygne unit 2 and lease it back to KGE, and does not hold any other assets. We meet the requirements to be considered the primary beneficiary of the trust. In determining the primary beneficiary of the trust, we concluded that the activities of the trust that most significantly impact its economic performance and that we have the power to direct include (1) the operation and maintenance of the 50% interest in La Cygne unit 2 and (2) our ability to exercise a purchase option at the end of the agreement at the lesser of fair value or a fixed amount. We have the potential to receive benefits from the trust that could potentially be significant if the fair value of the 50% interest in La Cygne unit 2 at the end of the agreement is greater than the fixed amount. In February 2016, KGE effected a redemption and reissuance of the $162.1 million in outstanding bonds maturing March 2021. See Note 10, “Long-term Debt,” for additional information.
109
Financial Statement Impact
We have recorded the following assets and liabilities on our consolidated balance sheets related to the VIEs described above.
As of December 31, | |||||||
2016 | 2015 | ||||||
(In Thousands) | |||||||
Assets: | |||||||
Property, plant and equipment of variable interest entities, net | $ | 257,904 | $ | 268,239 | |||
Regulatory assets (a) | 10,396 | 9,088 | |||||
Liabilities: | |||||||
Current maturities of long-term debt of variable interest entities | $ | 26,842 | $ | 28,309 | |||
Accrued interest (b) | 867 | 2,457 | |||||
Long-term debt of variable interest entities, net | 111,209 | 138,097 | |||||
_______________
(a) Included in long-term regulatory assets on our consolidated balance sheets.
(b) Included in accrued interest on our consolidated balance sheets.
All of the liabilities noted in the table above relate to the purchase of the property, plant and equipment. The assets of the VIEs can be used only to settle obligations of the VIEs and the VIEs’ debt holders have no recourse to our general credit. We have not provided financial or other support to the VIEs and are not required to provide such support. We did not record any gain or loss upon initial consolidation of the VIEs.
19. LEASES
Operating Leases
We lease office buildings, computer equipment, vehicles, railcars and other property and equipment. In determining lease expense, we recognize the effects of scheduled rent increases on a straight-line basis over the minimum lease term.
Rental expense and estimated future commitments under operating leases are as follows.
Year Ended December 31, | Total Operating Leases | |||
(In Thousands) | ||||
Rental expense: | ||||
2014 | $ | 14,143 | ||
2015 | 14,035 | |||
2016 | 13,563 | |||
Future commitments: | ||||
2017 | $ | 13,007 | ||
2018 | 11,659 | |||
2019 | 10,274 | |||
2020 | 7,615 | |||
2021 | 5,776 | |||
Thereafter | 7,845 | |||
Total future commitments | $ | 56,176 | ||
110
Capital Leases
We identify capital leases based on defined criteria. For both vehicles and computer equipment, new leases are signed each month based on the terms of master lease agreements.
Assets recorded under capital leases are listed below.
As of December 31, | |||||||
2016 | 2015 | ||||||
(In Thousands) | |||||||
Vehicles | $ | 15,595 | $ | 17,345 | |||
Computer equipment | 1,073 | 1,204 | |||||
Generation plant | 40,048 | 40,048 | |||||
Accumulated amortization | (13,542 | ) | (13,477 | ) | |||
Total capital leases | $ | 43,174 | $ | 45,120 | |||
Capital leases are treated as operating leases for rate making purposes. Minimum annual rental payments, excluding administrative costs such as property taxes, insurance and maintenance, under capital leases are listed below.
Year Ended December 31, | Total Capital Leases | |||
(In Thousands) | ||||
2017 | $ | 5,803 | ||
2018 | 5,722 | |||
2019 | 5,101 | |||
2020 | 4,443 | |||
2021 | 3,942 | |||
Thereafter | 52,496 | |||
77,507 | ||||
Amounts representing imputed interest | (29,900 | ) | ||
Present value of net minimum lease payments under capital leases | 47,607 | |||
Less: Current portion | 3,179 | |||
Total long-term obligation under capital leases | $ | 44,428 | ||
111
20. QUARTERLY RESULTS (UNAUDITED)
Our business is seasonal in nature and, in our opinion, comparisons between the quarters of a year do not give a true indication of overall trends and changes in operations.
2016 | First | Second | Third | Fourth | |||||||||||
(In Thousands, Except Per Share Amounts) | |||||||||||||||
Revenues (a) | $ | 569,450 | $ | 621,448 | $ | 764,654 | $ | 606,535 | |||||||
Net income (a) | 68,708 | 76,144 | 158,553 | 57,795 | |||||||||||
Net income attributable to Westar Energy, Inc. (a) | 65,585 | 72,340 | 154,720 | 53,932 | |||||||||||
Per Share Data (a): | |||||||||||||||
Basic: | |||||||||||||||
Earnings available | $ | 0.46 | $ | 0.51 | $ | 1.09 | $ | 0.38 | |||||||
Diluted: | |||||||||||||||
Earnings available | $ | 0.46 | $ | 0.51 | $ | 1.08 | $ | 0.38 | |||||||
Cash dividend declared per common share | $ | 0.38 | $ | 0.38 | $ | 0.38 | $ | 0.38 | |||||||
Market price per common share: | |||||||||||||||
High | $ | 50.38 | $ | 57.25 | $ | 56.95 | $ | 57.50 | |||||||
Low | $ | 40.01 | $ | 48.92 | $ | 52.52 | $ | 54.41 | |||||||
_______________
(a) | Items are computed independently for each of the periods presented and the sum of the quarterly amounts may not equal the total for the year. |
2015 | First | Second | Third | Fourth | |||||||||||
(In Thousands, Except Per Share Amounts) | |||||||||||||||
Revenues (a) | $ | 590,807 | $ | 589,563 | $ | 732,829 | $ | 545,965 | |||||||
Net income (a) | 53,163 | 66,243 | 140,564 | 41,826 | |||||||||||
Net income attributable to Westar Energy, Inc. (a) | 50,980 | 63,710 | 138,003 | 39,235 | |||||||||||
Per Share Data (a): | |||||||||||||||
Basic: | |||||||||||||||
Earnings available | $ | 0.38 | $ | 0.47 | $ | 0.97 | $ | 0.28 | |||||||
Diluted: | |||||||||||||||
Earnings available | $ | 0.38 | $ | 0.46 | $ | 0.97 | $ | 0.28 | |||||||
Cash dividend declared per common share | $ | 0.36 | $ | 0.36 | $ | 0.36 | $ | 0.36 | |||||||
Market price per common share: | |||||||||||||||
High | $ | 44.03 | $ | 39.65 | $ | 40.22 | $ | 43.56 | |||||||
Low | $ | 36.58 | $ | 33.88 | $ | 34.17 | $ | 37.55 | |||||||
_______________
(a) | Items are computed independently for each of the periods presented and the sum of the quarterly amounts may not equal the total for the year. |
112
ITEM 9. CHANGES IN AND DISAGREEMENTS WITH ACCOUNTANTS ON ACCOUNTING AND FINANCIAL DISCLOSURE
None.
ITEM 9A. CONTROLS AND PROCEDURES
We maintain a set of disclosure controls and procedures designed to ensure that information required to be disclosed in reports that we file or submit under the Securities Exchange Act of 1934, as amended (Exchange Act), is recorded, processed, summarized and reported within the time periods specified in SEC rules and forms. In addition, the disclosure controls and procedures include, without limitation, controls and procedures designed to ensure that information required to be disclosed by us in reports under the Exchange Act is accumulated and communicated to management, including the chief executive officer and the chief financial officer, allowing timely decisions regarding required disclosure. As of the end of the period covered by this report, based on an evaluation carried out under the supervision and with the participation of management, including the chief executive officer and the chief financial officer, of the effectiveness of our disclosure controls and procedures, the chief executive officer and the chief financial officer have concluded that our disclosure controls and procedures were effective.
There were no changes in our internal control over financial reporting during the three months ended December 31, 2016, that materially affected, or are reasonably likely to materially affect, our internal control over financial reporting.
See “Item 8. Financial Statements and Supplementary Data” for Management’s Report On Internal Control Over Financial Reporting and the Independent Registered Public Accounting Firm’s report with respect to the effectiveness of internal control over financial reporting.
ITEM 9B. OTHER INFORMATION
Investors should note that we announce material financial information in SEC filings, press releases and public conference calls. In accordance with SEC guidance, we may also use the Investor Relations section of our website (http://www.WestarEnergy.com, under “Investors”) to communicate with investors about our company. It is possible that the financial and other information we post there could be deemed to be material information. The information on our website is not part of this document.
113
PART III
Information required by Items 10-14 of Part III of this Form 10-K will be incorporated by reference to our definitive proxy statement with respect to our 2017 Annual Meeting of Shareholders (2017 Proxy Statement), if such definitive proxy statement is filed with the SEC on or before April 30, 2017. Due to the pending Merger with Great Plains Energy, we may not be required to file the 2017 Proxy Statement, in which case we will file an amendment to this Form 10-K on or before April 30, 2017, to include the information that is otherwise incorporated by reference.
ITEM 10. DIRECTORS AND EXECUTIVE OFFICERS OF THE REGISTRANT
The information concerning directors required by Item 401 of Regulation S-K will be included under the caption Election of Directors in our 2017 Proxy Statement, and that information is incorporated by reference in this Form 10-K. Information concerning executive officers required by Item 401 of Regulation S-K is located under Part I, Item 1 of this Form 10-K. The information required by Item 405 of Regulation S-K concerning compliance with Section 16(a) of the Exchange Act will be included under the caption Additional Information - Section 16(a) Beneficial Ownership Reporting Compliance in our 2017 Proxy Statement, and that information is incorporated by reference in this Form 10-K. The information required by Item 406, 407(c)(3), (d)(4) and (d)(5) of Regulation S-K will be included under the captions Election of Directors - Corporate Governance Matters and - Board Meetings and Committees of the Board of Directors in our 2017 Proxy Statement, and that information is incorporated by reference in this Form 10-K.
ITEM 11. EXECUTIVE COMPENSATION
The information required by Item 11 will be set forth in our 2017 Proxy Statement under the captions Compensation Discussion and Analysis, Compensation Committee Report, Compensation of Executive Officers, Director Compensation and Compensation Committee Interlocks and Insider Participation, and that information is incorporated by reference in this Form 10-K.
ITEM 12. SECURITY OWNERSHIP OF CERTAIN BENEFICIAL OWNERS AND MANAGEMENT
The information required by Item 12 will be set forth in our 2017 Proxy Statement under the captions Beneficial Ownership of Voting Securities and Equity Compensation Plan Information, and that information is incorporated by reference in this Form 10-K.
ITEM 13. CERTAIN RELATIONSHIPS AND RELATED TRANSACTIONS
The information required by Item 13 will be set forth in our 2017 Proxy Statement under the caption Election of Directors - Corporate Governance Matters, and that information is incorporated by reference in this Form 10-K.
ITEM 14. PRINCIPAL ACCOUNTANT FEES AND SERVICES
The information required by Item 14 will be set forth in our 2017 Proxy Statement under the caption of Ratification and Confirmation of Deloitte and Touche LLP as Our Independent Registered Public Accounting Firm for 2017 and its subsections captioned Independent Registered Accounting Firm Fees and Audit Committee Pre-Approval Policies and Procedures, and that information is incorporated by reference in this Form 10-K.
114
PART IV
ITEM 15. EXHIBITS AND FINANCIAL STATEMENT SCHEDULES
FINANCIAL STATEMENTS INCLUDED HEREIN
Westar Energy, Inc.
Management’s Report on Internal Control Over Financial Reporting
Reports of Independent Registered Public Accounting Firm
Consolidated Balance Sheets as of December 31, 2016 and 2015
Consolidated Statements of Income for the years ended December 31, 2016, 2015 and 2014
Consolidated Statements of Cash Flows for the years ended December 31, 2016, 2015 and 2014
Consolidated Statements of Changes in Equity for the years ended December 31, 2016, 2015 and 2014
Notes to Consolidated Financial Statements
SCHEDULES
Schedule II - Valuation and Qualifying Accounts
Schedules omitted as not applicable or not required under the Rules of Regulation S-X: I, III, IV and V.
EXHIBIT INDEX
All exhibits marked “I” are incorporated herein by reference. All exhibits marked with “*” are management contracts or compensatory plans or arrangements required to be identified by Item 15(a)(3) of Form 10-K. All exhibits marked “#” are filed with this Form 10-K.
Description
2 | Agreement and Plan of Merger, dated as of May 29, 2016, by and among Westar Energy, Inc., Great Plains Energy Incorporated and a subsidiary of Great Plains Energy Incorporated (filed as Exhibit 2.1 to the Form 8-K filed on May 31, 2016) | I | ||
3(a) | By-laws of Westar Energy, Inc., as amended April 28, 2004 (filed as Exhibit 3(a) to the Form 10-Q for the period ended June 30, 2004 filed on August 4, 2004) | I | ||
3(b) | Restated Articles of Incorporation of Westar Energy, Inc., as amended through May 25, 1988 (filed as Exhibit 4 to the Form S-8 Registration Statement, SEC File No. 33-23022 filed on July 15, 1988) | I | ||
3(c) | Certificate of Amendment to Restated Articles of Incorporation of Westar Energy, Inc. (filed as Exhibit 3 to the Form 10-K405 for the period ended December 31, 1998 filed on April 14, 1999) | I | ||
3(d) | Certificate of Correction to Restated Articles of Incorporation of Westar Energy, Inc. (filed as Exhibit 3(b) to the Form 10-K for the period ended December 31, 1991 filed on March 30, 1992) | I | ||
3(e) | Certificate of Amendment to Restated Articles of Incorporation of Westar Energy, Inc. (filed as Exhibit 3(c) to the Form 10-K for the period ended December 31, 1994 filed on March 30, 1995) | I | ||
3(f) | Certificate of Amendment to Restated Articles of Incorporation of Westar Energy, Inc. (filed as Exhibit 3 to the Form 10-Q for the period ended June 30, 1994 filed on August 11, 1994) | I | ||
3(g) | Certificate of Amendment to Restated Articles of Incorporation of Westar Energy, Inc. (filed as Exhibit 3(a) to the Form 10-Q for the period ended June 30, 1996 filed on August 14, 1996) | I | ||
3(h) | Certificate of Amendment to Restated Articles of Incorporation of Westar Energy, Inc. (filed as Exhibit 3 to the Form 10-Q for the period ended March 31, 1998 filed on May 12, 1998) | I | ||
3(i) | Certificate of Amendment to Restated Articles of Incorporation of Westar Energy, Inc. (filed as Exhibit 3(l) to the Form 10-K for the period ended December 31, 2002 filed on April 11, 2003) | I | ||
3(j) | Certificate of Amendment to Restated Articles of Incorporation of Westar Energy, Inc. (filed as Exhibit 3(m) to the Form 10-K for the period ended December 31, 2002 filed on April 11, 2003) | I | ||
115
3(k) | Certificate of Amendment to Restated Articles of Incorporation of Westar Energy, Inc. (filed as Exhibit 3(m) to the Form S-3 Registration Statement No. 333-125828 filed on June 15, 2005) | I | ||
3(l) | Certificate of Amendment to Restated Articles of Incorporation of Westar Energy, Inc. (filed as Exhibit 3(m) to the Form 10-K for the period ended December 31, 2011 filed on February 23, 2012) | I | ||
4(a) | Mortgage and Deed of Trust dated July 1, 1939 between Westar Energy, Inc. and Harris Trust and Savings Bank, Trustee (filed as Exhibit 4(a) to Registration Statement No. 33-21739) | I | ||
4(b) | First and Second Supplemental Indentures dated July 1, 1939 and April 1, 1949, respectively (filed as Exhibit 4(b) to Registration Statement No. 33-21739) | I | ||
4(c) | Sixth Supplemental Indenture dated October 4, 1951 (filed as Exhibit 4(b) to Registration Statement No. 33-21739) | I | ||
4(d) | Fourteenth Supplemental Indenture dated May 1, 1976 (filed as Exhibit 4(b) to Registration Statement No. 33-21739) | I | ||
4(e) | Twenty-Eighth Supplemental Indenture dated July 1, 1992 (filed as Exhibit 4(o) to the Form 10-K for the period ended December 31, 1992 filed on March 30, 1993) | I | ||
4(f) | Thirty-Second Supplemental Indenture dated April 15, 1994 (filed as Exhibit 4(s) to the Form 10-K for the period ended December 31, 1994 filed on March 30, 1995) | I | ||
4(g) | Senior Indenture dated August 1, 1998 (filed as Exhibit 4.1 to the Form 10-Q for the period ended June 30, 1998 filed on August 12, 1998) | I | ||
4(h) | Form of Senior Note (included in Exhibit 4(g)) | I | ||
4(i) | Thirty-Fourth Supplemental Indenture dated June 28, 2000 (filed as Exhibit 4(v) to the Form 10-K for the period ended December 31, 2000 filed on April 2, 2001) | I | ||
4(j) | Thirty-Sixth Supplemental Indenture dated as of June 1, 2004, between Westar Energy, Inc. and BNY Midwest Trust Company (as successor to Harris Trust and Savings Bank), to its Mortgage and Deed of Trust dated July 1, 1939 (filed as Exhibit 4.1 to the Form 8-K filed on January 18, 2005) | I | ||
4(k) | Thirty-Eighth Supplemental Indenture, dated as of January 18, 2005, between Westar Energy, Inc. and BNY Midwest Trust Company (as successor to Harris Trust and Savings Bank), to its Mortgage and Deed of Trust dated July 1, 1939 (filed as Exhibit 4.3 to the Form 8-K filed on January 18, 2005) | I | ||
4(l) | Thirty-Ninth Supplemental Indenture dated June 30, 2005 between Westar Energy, Inc. and BNY Midwest Trust Company (as successor to Harris Trust and Savings Bank) to its Mortgage and Deed of Trust dated July 1, 1939 (filed as Exhibit 4.1 to the Form 8-K filed on July 1, 2005) | I | ||
4(m) | Form of Forty-Second Supplemental Indenture, dated as of March 1, 2012 by and among Westar Energy, Inc., The Bank of New York Mellon Trust Company, N.A. and Judith L. Bartolini (filed as Exhibit 4.1 to the Form 8-K filed on February 29, 2012) | I | ||
4(n) | Form of Forty-Second Supplemental (Reopening) Indenture, dated as of May 17, 2012 by and among Westar Energy, Inc., The Bank of New York Mellon Trust Company, N.A. and Judith L. Bartolini (filed as Exhibit 4.1 to the Form 8-K filed on May 16, 2012) | I | ||
4(o) | Form of Forty-Third Supplemental Indenture, dated as of March 28, 2013, by and among Westar Energy, Inc. and The Bank of New York Mellon Trust Company, N.A., as successor trustee to Harris Trust and Savings Bank (filed as Exhibit 4.1 to the Form 8-K filed on March 22, 2013) | I | ||
4(p) | Form of Forty-Fourth Supplemental Indenture, dated as of August 19, 2013, by and among Westar Energy, Inc. and The Bank of New York Mellon Trust Company, N.A., as successor trustee to Harris Trust and Savings Bank (filed as Exhibit 4.1 to the Form 8-K filed on August 14, 2013) | I | ||
4(q) | Form of Forty-Fifth Supplemental Indenture, dated as of November 13, 2015, by and among Westar Energy, Inc. and The Bank of New York Mellon Trust Company, N.A., as successor to Harris Trust and Savings Bank (filed as Exhibit 4.1 to the Form 8-K filed on November 6, 2015) | I | ||
4(r) | Form of Forty-Sixth Supplemental Indenture, dated as of June 20, 2016, by and among Westar Energy, Inc. and The Bank of New York Mellon Trust Company, N.A., as successor to Harris Trust and Savings Bank (filed as Exhibit 4.1 to the Form 8-K filed on June 17, 2016) | I | ||
Instruments defining the rights of holders of other long-term debt not required to be filed as Exhibits will be furnished to the Commission upon request. | ||||
10(a) | Executive Salary Continuation Plan of Western Resources, Inc., as revised, effective September 22, 1995 (filed as Exhibit 10(j) to the Form 10-K for the period ended December 31, 1995 filed on March 27, 1996)* | I | ||
10(b) | Amended and Restated Long-Term Incentive and Share Award Plan (filed as Exhibit 10 to the Form 8-K filed on May 6, 2011)* | I | ||
10(c) | Amended and Restated Long-Term Incentive and Share Award Plan, effective January 1, 2016 (filed as Appendix B to the Proxy Statement filed on April 1, 2016)* | I | ||
116
10(d) | Westar Energy, Inc. Form of Restricted Share Units Award (Grant Dates Prior to February 22, 2017) (filed as Exhibit 10(f) to the Form 10-K for the period ended December 31, 2014 filed on February 25, 2015)* | I | ||
10(e) | Westar Energy, Inc. Form of Performance Based Restricted Share Units Award (Grant Dates Prior to February 22, 2017) (filed as Exhibit 10(g) to the Form 10-K for the period ended December 31, 2014 filed on February 25, 2015)* | I | ||
10(f) | Westar Energy, Inc. Form of Restricted Share Units Award (Grant Dates February 22, 2017 Forward)* | # | ||
10(g) | Westar Energy, Inc. Form of Performance Based Restricted Share Units Award (Grant Dates February 22, 2017 Forward)* | # | ||
10(h) | Westar Energy, Inc. Non-Employee Director Deferred Compensation Plan, as amended and restated, dated as of October 20, 2004 (filed as Exhibit 10.1 to the Form 8-K filed on October 21, 2004)* | I | ||
10(i) | Summary of Westar Energy, Inc. Non-Employee Director Compensation (filed as Exhibit 10(f) to the Form 10-K for the period ended December 31, 2015 filed on February 24, 2016)* | I | ||
10(j) | Form of Amended and Restated Change in Control Agreement with Officers of Westar Energy, Inc. (filed as Exhibit 10(g) to the Form 10-K for the period ended December 31, 2015 filed on February 24, 2016)* | I | ||
10(k) | Westar Energy, Inc. Retirement Benefit Restoration Plan (filed as Exhibit 10.1 to the Form 8-K filed on April 2, 2010)* | I | ||
10(l) | Westar Energy, Inc. 401(k) Benefit Restoration Plan (filed as Exhibit 10(l) to the Form 10-K for the period ended December 31, 2014 filed on February 25, 2015)* | I | ||
10(m) | Credit Agreement dated as of February 18, 2011, among Westar Energy, Inc. and several banks and other financial institutions or entities from time to time parties to the Agreement (filed as Exhibit 10.1 to the Form 8-K filed on February 22, 2011) | I | ||
10(n) | First Extension Agreement dated as of February 12, 2013, among Westar Energy, Inc. and several banks and other financial institutions party thereto (filed as Exhibit 10.1 to the Form 8-K filed on February 15, 2013) | I | ||
10(o) | Second Extension Agreement dated as of February 14, 2014, among Westar Energy, Inc. and several banks and other financial institutions or entities from time to time parties to the Agreement (filed as Exhibit 10(v) to the Form 10-K for the period ended December 31, 2013 filed on February 26, 2014) | I | ||
10(p) | First Amendment to Credit Agreement and Lender Joinder Agreement, dated December 19, 2016, by and among Westar Energy, Inc. and the several banks and other financial institutions or entities from time to time parties thereto (filed as Exhibit 10.1 to the Form 8-K filed on December 20, 2016) | I | ||
10(q) | Fourth Amended and Restated Credit Agreement dated as of September 29, 2011, among Westar Energy, Inc. and several banks and other financial institutions or entities from time to time parties to the Agreement (filed as Exhibit 10.1 to the Form 8-K filed on September 29, 2011) | I | ||
10(r) | First Extension Agreement dated as of July 19, 2013, among Westar Energy, Inc. and several banks and other financial institutions or entities from time to time parties to the Agreement (filed as Exhibit 10(a) to the Form 10-Q for the period ended September 30, 2014 filed on November 5, 2014) | I | ||
10(s) | Second Extension Agreement dated as of September 18, 2014, among Westar Energy, Inc. and several banks and other financial institutions or entities from time to time parties to the Agreement (filed as Exhibit 10(b) to the Form 10-Q for the period ended September 30, 2014 filed on November 5, 2014) | I | ||
10(t) | Third Extension Agreement dated as of September 17, 2015, among Westar Energy, Inc. and several banks and other financial institutions or entities from time to time parties to the Agreement (filed as Exhibit 10 to the Form 10-Q for the period ended September 30, 2015 filed on November 3, 2015) | I | ||
10(u) | Amendment Agreement, dated December 19, 2016, by and among Westar Energy, Inc. and the several banks and other financial institutions or entities from time to time parties thereto (filed as Exhibit 10.2 to the Form 8-K filed on December 20, 2016) | I | ||
12 | Computations of Ratio of Consolidated Earnings to Fixed Charges | # | ||
21 | Subsidiaries of the Registrant | # | ||
23 | Consent of Independent Registered Public Accounting Firm, Deloitte & Touche LLP | # | ||
31(a) | Certification of Principal Executive Officer pursuant to Section 302 of the Sarbanes-Oxley Act of 2002 | # | ||
31(b) | Certification of Principal Financial Officer pursuant to Section 302 of the Sarbanes-Oxley Act of 2002 | # | ||
32 | Certifications pursuant to Section 906 of the Sarbanes-Oxley Act of 2002 (furnished and not to be considered filed as part of the Form 10-K) | # | ||
101.INS | XBRL Instance Document | # | ||
101.SCH | XBRL Taxonomy Extension Schema Document | # | ||
101.CAL | XBRL Taxonomy Extension Calculation Linkbase Document | # | ||
117
101.DEF | XBRL Taxonomy Extension Definition Linkbase Document | # | ||
101.LAB | XBRL Taxonomy Extension Label Linkbase Document | # | ||
101.PRE | XBRL Taxonomy Extension Presentation Linkbase Document | # | ||
118
WESTAR ENERGY, INC.
SCHEDULE II — VALUATION AND QUALIFYING ACCOUNTS
Description | Balance at Beginning of Period | Charged to Costs and Expenses | Deductions (a) | Balance at End of Period | ||||||||||||
(In Thousands) | ||||||||||||||||
Year ended December 31, 2014 | ||||||||||||||||
Allowances deducted from assets for doubtful accounts | $ | 4,596 | $ | 9,752 | $ | (9,039 | ) | $ | 5,309 | |||||||
Year ended December 31, 2015 | ||||||||||||||||
Allowances deducted from assets for doubtful accounts | $ | 5,309 | $ | 8,614 | $ | (8,629 | ) | $ | 5,294 | |||||||
Year ended December 31, 2016 | ||||||||||||||||
Allowances deducted from assets for doubtful accounts | $ | 5,294 | $ | 12,197 | $ | (10,824 | ) | $ | 6,667 | |||||||
_______________
(a) | Result from write-offs of accounts receivable. |
119
ITEM 16. FORM 10-K SUMMARY
None.
120
SIGNATURE
Pursuant to the requirements of Sections 13 or 15(d) of the Securities Exchange Act of 1934, the registrant has duly caused this report to be signed on its behalf by the undersigned, thereunto duly authorized.
WESTAR ENERGY, INC. | ||||||
Date: | February 22, 2017 | By: | /s/ ANTHONY D. SOMMA | |||
Anthony D. Somma | ||||||
Senior Vice President, Chief Financial Officer and Treasurer | ||||||
121
SIGNATURES
Pursuant to the requirements of the Securities Exchange Act of 1934, this report has been signed below by the following persons on behalf of the registrant and in the capacities and on the dates indicated.
Signature | Title | Date | ||
/S/ MARK A. RUELLE | Director, President and Chief Executive Officer (Principal Executive Officer) | February 22, 2017 | ||
(Mark A. Ruelle) | ||||
/S/ ANTHONY D. SOMMA | Senior Vice President, Chief Financial Officer and Treasurer (Principal Financial and Accounting Officer) | February 22, 2017 | ||
(Anthony D. Somma) | ||||
/S/ CHARLES Q. CHANDLER IV | Chairman of the Board | February 22, 2017 | ||
(Charles Q. Chandler IV) | ||||
/S/ MOLLIE H. CARTER | Director | February 22, 2017 | ||
(Mollie H. Carter) | ||||
/S/ R. A. EDWARDS III | Director | February 22, 2017 | ||
(R. A. Edwards III) | ||||
/S/ JERRY B. FARLEY | Director | February 22, 2017 | ||
(Jerry B. Farley) | ||||
/S/ RICHARD L. HAWLEY | Director | February 22, 2017 | ||
(Richard L. Hawley) | ||||
/S/ B. ANTHONY ISAAC | Director | February 22, 2017 | ||
(B. Anthony Isaac) | ||||
/S/ SANDRA A. J. LAWRENCE | Director | February 22, 2017 | ||
(Sandra A. J. Lawrence) | ||||
/S/ S. CARL SODERSTROM JR. | Director | February 22, 2017 | ||
(S. Carl Soderstrom Jr.) | ||||
122