Attached files
| file | filename |
|---|---|
| EX-32.2 - CERTIFICATION OF THE CFO SECTION 906 - WABCO Holdings Inc. | wbcexhibit322_12312016.htm |
| EX-32.1 - CERTIFICATION OF THE CEO SECTION 906 - WABCO Holdings Inc. | wbcexhibit321_12312016.htm |
| EX-31.2 - CERTIFICATION OF THE CFO SECTION 302 - WABCO Holdings Inc. | wbcexhibit312_12312016.htm |
| EX-31.1 - CERTIFICATION OF THE CEO SECTION 302 - WABCO Holdings Inc. | wbcexhibit311_12312016.htm |
| EX-24.1 - POWERS OF ATTORNEY - WABCO Holdings Inc. | powerofattorneybod2016.htm |
| EX-23.1 - CONSENT OF ERNST & YOUNG - WABCO Holdings Inc. | consentofey2016.htm |
| EX-21.1 - SUBSIDIARIES OF THE COMPANY - WABCO Holdings Inc. | exhibit211subsidiariesofth.htm |
UNITED STATES
SECURITIES AND EXCHANGE COMMISSION
WASHINGTON D.C. 20549
FORM 10-K
x ANNUAL REPORT PURSUANT TO SECTION 13 OR 15(d) OF THE SECURITIES EXCHANGE ACT OF 1934
For the fiscal year ended December 31, 2016
OR
o TRANSITION REPORT PURSUANT TO SECTION 13 OR 15(d) OF THE SECURITIES EXCHANGE ACT OF 1934
For the transition period from to .
Commission file number 1-33332
WABCO Holdings Inc.
(Exact name of registrant as specified in its charter)
Delaware | 20-8481962 | |
(State or other jurisdiction of incorporation or organization) | (I.R.S. Employer Identification No.) | |
Chaussee de la Hulpe 166 1170 Brussels, Belgium | ||
2770 Research Drive, Rochester Hills, MI | 48309-3511 | |
(Address of principal executive offices) | (Zip Code) | |
Registrant’s telephone number, including area code +32 2 663 98 00
Securities registered pursuant to Section 12(b) of the Act:
Title of each class | Name of each exchange on which registered | |
Common stock, par value $0.01 per share | New York Stock Exchange | |
Securities registered pursuant to Section 12(g) of the Act:
Title of each class | ||
None | ||
Indicate by check mark if the registrant is a well-known seasoned issuer, as defined in Rule 405 of the Securities Act. x Yes o No
Indicate by check mark if the registrant is not required to file reports pursuant to Section 13 or Section 15(d) of the Act. o Yes x No
Indicate by check mark whether the registrant (1) has filed all reports required to be filed by Section 13 or 15(d) of the Securities Exchange Act of 1934 during the preceding 12 months (or for such shorter period that the registrant was required to file such reports), and (2) has been subject to such filing requirements for the past 90 days. x Yes o No
Indicate by check mark whether the registrant has submitted electronically and posted on its corporate Web site, if any, every Interactive Data File required to be submitted and posted pursuant to Rule 405 of Regulation S-T (§232.405 of this
chapter) during the preceding 12 months (or for such shorter period that the registrant was required to submit and post such files). x Yes o No
Indicate by check mark if disclosure of delinquent filers pursuant to Item 405 of Regulation S-K (Section 229.405 of this chapter) is not contained herein, and will not be contained, to the best of registrant's knowledge, in definitive proxy or information statements incorporated by reference in Part III of this Form 10-K or any amendment to this Form 10-K. x
Indicate by check mark whether the registrant is a large accelerated filer, an accelerated filer, a non-accelerated filer, or a smaller reporting company. See the definitions of “large accelerated filer,” “accelerated filer,” and “smaller reporting company” in Rule 12b-2 of the Exchange Act (Check one).
Large Accelerated Filer | x | Accelerated Filer | o | |||
Non-Accelerated Filer | o | Smaller Reporting Company | o | |||
Indicate by check mark whether the registrant is a shell company (as defined in Rule 12b-2 of the Exchange Act). o Yes x No
The aggregate market value of the voting stock (Common Stock) held by non-affiliates of the registrant as of the close of business on June 30, 2016, the last business day of the registrant's most recently completed second fiscal quarter, was approximately $5.1 billion based on the closing sale price of the common stock on the New York Stock Exchange on that date. The registrant does not have any non-voting common equity.
Indicate the number of shares outstanding of each of the issuer’s classes of common stock, as of the latest practicable date.
Common stock, $.01 par value, outstanding at | ||||
February 9, 2017 | 54,522,122 | shares | ||
DOCUMENTS INCORPORATED BY REFERENCE
Part III incorporates information from certain portions of the registrant's definitive proxy statement to be filed with the Securities and Exchange Commission within 120 days after the fiscal year end of December 31, 2016.
WABCO HOLDINGS INC. AND SUBSIDIARIES
FORM 10-K
Year ended December 31, 2016
TABLE OF CONTENTS | ||
Page | ||
Item 1. | ||
Item 1A. | ||
Item 1B. | ||
Item 2. | ||
Item 3. | ||
Item 4. | ||
Item 4A. | ||
Item 5. | ||
Item 6. | ||
Item 7. | ||
Item 7A. | ||
Item 8. | ||
Item 9. | ||
Item 9A. | ||
Item 9B. | ||
Item 10. | ||
Item 11. | ||
Item 12. | ||
Item 13. | ||
Item 14. | ||
Item 15. | ||
2
Information Concerning Forward Looking Statements
Certain of the statements contained in this report (other than the historical financial data and other statements of historical fact), including, without limitation, statements as to management's expectations and beliefs, are forward-looking statements. These forward-looking statements were based on various facts and were derived utilizing numerous important assumptions and other important factors, and changes in such facts, assumptions or factors could cause actual results to differ materially from those in the forward-looking statements. Forward-looking statements include the information concerning our future financial performance, financial condition, liquidity, business strategy, projected plans and objectives. Statements preceded by, followed by or that otherwise include the words “believes”, “expects”, “anticipates”, “strategies”, “prospects”, “intends”, “projects”, “estimates”, "continues", "evaluates", “forecasts”, “seeks”, “plans”, "goals", "potential", “may increase”, “may fluctuate”, and similar expressions or future or conditional verbs such as “will,” “should,” “would,” “may” and “could” are generally forward looking in nature and not historical facts. This report includes important information as to risk factors in “Item 1. Business”, “Item 1A. Risk Factors”, and “Item 7. Management's Discussion and Analysis of Financial Condition and Results of Operations.” Many important factors could cause actual results to differ materially from management's expectations, including:
• | the actual level of commercial vehicle production in our end-markets; |
• | adverse developments in the business of our key customers; |
• | periodic changes to contingent liabilities; |
• | adverse developments in general business, economic and political conditions or any outbreak or escalation of hostilities on a national, regional or international basis; |
• | changes in international or U.S. economic conditions, such as inflation, interest rate fluctuations, foreign exchange rate fluctuations or recessions in our markets; |
• | unpredictable difficulties or delays in the development of new product technology; |
• | pricing changes to our products or those of our competitors, and other competitive pressures on pricing and sales; |
• | our ability to receive components and parts from our suppliers of a reasonable quality level or to obtain them at reasonable price levels due to fluctuations in the costs of the underlying raw materials; |
• | our ability to access credit markets or capital markets on a favorable basis or at all; |
• | our ability to service our debt obligations; |
• | changes in the environmental regulations that affect our current and future products; |
• | competition in our existing and future lines of business and the financial resources of competitors; |
• | our failure to comply with regulations and any changes in regulations; |
• | our failure to complete potential future acquisitions, collaborations and cooperations or to realize benefits from completed acquisitions, collaborations and cooperations; |
• | our inability to implement our growth plan; |
• | our ability to service our pension obligations; |
• | the loss of any of our senior management; |
• | difficulties in obtaining or retaining the management and other human resource competencies that we need to achieve our business objectives; |
• | the success of, and costs and savings associated with, our current streamlining initiatives; |
• | labor relations; |
• | our ability to mitigate any tax risks, including, but not limited to those risks associated with changes in legislation, tax audits and the loss of the benefits associated with our tax rulings and incentives in certain jurisdictions; |
• | risks inherent in operating in foreign countries, including exposure to local economic conditions, government regulation, currency restrictions and other restraints, changes in tax laws and rulings, expropriation, political instability and diminished ability to legally enforce our contractual rights. |
We undertake no obligation to release publicly any revisions to any forward-looking statements, to report events or to report the occurrence of unanticipated events unless we are required to do so by law.
3
PART I
ITEM 1. BUSINESS
Overview
Except as otherwise indicated or unless context otherwise requires “WABCO”, “WABCO Holdings Inc.,” “we,” “us,” “our,” and “the Company” refer to WABCO Holdings Inc. and its consolidated subsidiaries.
WABCO is a leading global supplier of electronic, mechanical, electro-mechanical and aerodynamic products for the world's major manufacturers of commercial trucks, buses and trailers, as well as passenger cars. We engineer, develop, manufacture and sell integrated systems controlling advanced braking, stability, suspension, transmission automation, as well as air compression and processing. These systems improve vehicle safety, efficiency and performance while reducing overall vehicle operating costs. We estimate that approximately two out of every three commercial vehicles with advanced and conventional vehicle control systems worldwide are equipped with our products. For passenger cars, including sports utility vehicles (SUVs), we supply products for sophisticated, niche applications. We continue to grow in more parts of the world as we increasingly provide additional components and systems throughout the life of a vehicle, from design and development to the aftermarket. By leveraging fleet connectivity, WABCO mobilizes vehicle intelligence to advance fleet safety, efficiency and security.
History of Our Company
WABCO was founded in the United States in 1869 as Westinghouse Air Brake Company. We were purchased by American Standard Companies Inc. (American Standard) in 1968 and operated as the Vehicle Control Systems business division within American Standard until we were spun off from American Standard on July 31, 2007. Subsequent to our spin-off, American Standard changed its name to Trane Inc., which we herein refer to as “Trane.” On June 5, 2008, Trane was acquired in a merger with Ingersoll-Rand Company Limited (Ingersoll Rand) and exists today as a wholly owned subsidiary of Ingersoll Rand.
Products and Services
We engineer, develop, manufacture and sell advanced braking, stability, suspension and transmission automation and air management systems primarily for commercial vehicles. Our largest-selling products are pneumatic anti-lock braking systems (ABS), electronic braking systems (EBS), electronic stability control (ESC) systems, brake controls, automated manual transmission (AMT) systems, air disc brakes, and a large variety of conventional mechanical products such as actuators, air compressors and air control valves for medium- and heavy-duty trucks, buses and trailers.
In addition, we supply commercial vehicle aftermarket distributors and service partners as well as fleet operators with replacement parts, fleet management solutions, diagnostic tools, training and other expert services. We provide innovative control functions by leveraging rich data from onboard mission-critical systems to advance fleet safety, efficiency and security. Furthermore, we supply advanced electronic suspension controls and vacuum pumps to the passenger car and SUV markets in Europe, North America and Asia. We also provide remanufacturing services globally.
WABCO is the first supplier of advanced emergency braking systems (AEBS) homologated in Europe in accordance with European Union regulations. WABCO's OnGuardACTIVE™ AEBS for trucks and buses complies with European Union regulations that came into effect at the tail end of 2015. It detects moving, stopping and stationary vehicles ahead. It alerts the driver via acoustic, visual and haptic signals. OnGuardACTIVE autonomously applies the brakes and can bring the vehicle to a complete stop, helping to prevent or mitigate rear-end collisions.
Starting at the end of 2015, the European Union also mandated lane departure warning systems (LDWS) on new commercial vehicles. This new regulation is addressed by WABCO’s OnLane™, our camera-based LDWS technology. Once it detects unintended lane drift, OnLane prompts the driver via acoustic, visual and haptic signals to take corrective measures. It also features an advanced option to warn against driver drowsiness.
In 2016, WABCO acquired MICO, Inc. (MICO), a global market leader in hydraulic components, controls and brake systems for heavy-duty, off-highway vehicles in agriculture, construction, mining and similar industries. WABCO is expanding its product offerings through the acquisition to become the first and only supplier with a portfolio of complete pneumatic and hydraulic braking and control systems for off-highway vehicles worldwide.
4
In 2016, WABCO acquired Laydon Composites Ltd. (LCL), a manufacturer of aerodynamic devices for heavy-duty trucks and trailers. Through the acquisition, WABCO is the only supplier that provides a full range of aerodynamic devices for commercial vehicles worldwide. Aerodynamic products reduce air drag of commercial trucks traveling long distances at highway speeds, thereby lowering fuel consumption and CO2 emissions. Aerodynamic devices help commercial vehicle fleet operators to improve their operational efficiency and environmental performance
In 2016, WABCO demonstrated the proof of concept of a breakthrough collision avoidance technology for commercial vehicles. Jointly developed with ZF, the Evasive Maneuver Assist (EMA) combines WABCO's world-class braking, stability and vehicle dynamics control systems on trucks and trailers with ZF's top active steering technology - an industry first. EMA leverages the capabilities of WABCO's industry-leading OnGuardACTIVE and marks a critical step toward enabling autonomous driving in the commercial vehicle industry. EMA engages to help the driver to safely steer around an obstructing vehicle and to bring truck and trailer to a complete and safe stop.
In 2016, WABCO reported that it has signed a Memorandum of Understanding (MoU) with a global tier-one automotive industry supplier headquartered in Asia to bring active steering and other technologies to the commercial industry through a new joint venture (JV). The MoU sets a framework to establish a JV agreement for a new business that will develop, manufacture and sell electronically controlled active steering systems for the global truck and bus market. The JV will leverage WABCO's industry-leading braking, vehicle control and advanced driver assistance systems expertise with its partner's world-class steering system technology and capabilities. This integration will result in significant innovation for advanced safety-enabling solutions that support automated driving through intelligent control of both the longitudinal and lateral movements of vehicles.
In 2016, WABCO also announced that it has entered into a long-term cooperation framework agreement with Mobileye N.V. to develop solutions for commercial vehicles that leverage advanced emergency braking ADAS functionalities and Mobileye's Road Experience Management (REM) technology that provides real-time data for precise localization and high-definition lane data. The solutions will combine Mobileye's leading vision system and mapping technology with the control and actuation technologies from WABCO's industry-leading portfolio of electronic braking, stability and emergency braking systems in combination with capability for active steering control. The WABCO-Mobileye solution will benefit commercial vehicle manufacturers and operators through more advanced safety capability to help reduce the risk of accidents.
In 2016, WABCO announced that it is working with Peloton Technology to advance an innovative solution for truck platooning, integrating commercial vehicle-to-vehicle communication and other automation technologies that further improve safety and fuel efficiency. By electronically linking two or more tractor-trailers to form virtual road-trains on highways, platooning increases fuel economy by more than 7%, namely up to 4.5% for the lead truck and up to 10% for following trucks due to improved aerodynamics, according to independent evaluation by the North American Council on Freight Efficiency and further validation by the U.S. Department of Energy and U.S. Department of Transportation. WABCO will contribute to this work with its industry-leading portfolio of braking, advanced stability and emergency braking systems, including predictive cruise control. Peloton will bring its proprietary platooning technologies, which are currently under testing on U.S. highways.
In 2016, WABCO also announced its OnCity™ Urban Turning Assist system concept, the Company's breakthrough technology to help protect pedestrians and cyclists in city traffic. OnCity, a unique and convenient single-sensor solution invented by WABCO, is the commercial vehicle industry's first collision avoidance system that uses LiDAR technology for the purpose of object detection. Innovatively engineered for trucks, buses and tractor-trailers, WABCO's OnCity advanced driver assistance system also delivers the industry's widest field-of-view - up to 180 degrees - using a single sensor for safety monitoring to help protect vulnerable road users located on the vehicle's blindside. OnCity detects and distinguishes moving and stationary objects, including pedestrians and cyclists.
Our key product groups and functions are described below.
5
WABCO KEY PRODUCT GROUPS | ||
SYSTEM / PRODUCT | FUNCTION | |
Actuator | Converts energy stored in compressed air into mechanical force applied to foundation brake to slow or stop commercial vehicles | |
Air Compressor and Air Processing/Air Management System | Provides compressed, dried air for braking, suspension and other pneumatic systems on trucks, buses and trailers | |
Foundation Brake | Transmits braking force to slow, stop or hold vehicles | |
Anti-lock Braking System (ABS) | Prevents wheel locking during braking to ensure steerability and stability | |
Conventional Braking System | Mechanical and pneumatic devices for control of braking systems in commercial vehicles | |
Electronic Braking System (EBS) | Electronic controls of braking systems for commercial vehicles | |
Electronic and Conventional Air Suspension Systems | Level and pressure control of air springs in trucks, buses, trailers and cars | |
Transmission Automation | Automates transmission gear shifting for trucks and buses including clutch operation | |
Vehicle Electronic Stability Control (ESC) and Roll Stability Support (RSS) | Enhances driving stability | |
Advanced Driver Assistance Systems (ADAS) | Promotes driver safety through lane departure warnings, collision mitigation and emergency braking systems | |
Fleet Management Solutions (FMS) | Improves vehicle safety and efficiency for fleet managers through real-time online commercial vehicle telematics and communications | |
Key Markets and Trends
Electronically controlled products and systems are important for the growth of our business. Our markets are driven primarily by the electronics content of control systems in commercial vehicles. At the same time, major original equipment manufacturers (OEMs) are transforming toward modularization of their various vehicle platforms. Modularity enables more efficiency and cost-effectiveness in development, manufacturing and marketing of their commercial vehicles. These trends have been increasing steadily with each successive vehicle platform introduction, as OEMs seek to improve vehicle safety, efficiency and performance through added functionalities, and to meet evolving and rising regulatory standards around the world. Overall, engineering trends in commercial vehicle design show a shift in demand toward increased electronics content and platform modularity. Although their pace varies by region, these trends are similar in all major geographies.
In particular, braking systems are part of this shift from conventional to advanced electronic systems on the path towards fully autonomous driverless trucks. In addition to increasing safety, improving stopping distances, and reducing installation complexity, electronic braking systems also enable new functionalities to be integrated more cost effectively. New functionalities include stability control, adaptive cruise control, transmission automation, brake performance warning, vehicle diagnostics, driver assistance systems as well as engine braking and engine speed controls, among others. Our industry-leading automated transmission controls optimize gear shifting, resulting in better fuel efficiency, less component wear and fewer parts. This technology further enhances driver safety and comfort through less physical effort.
The global commercial vehicle industry is also trending toward environmental sustainability. WABCO's technology leadership continues to deliver products and systems that increase fuel efficiency, reduce emissions, decrease vehicle weight and optimize energy recovery, among other advancements that enhance environmental compliance of trucks, buses and trailers over the lifetime of the vehicle. For example, a truck equipped with all of WABCO's green technologies can improve fuel efficiency by more than 18%. These include advanced transmission automation systems, innovative aerodynamic solutions, sophisticated electronic driver assistance systems, electronic control of air suspension and breakthrough air compression technologies, among others. We reduce vehicle weight and recuperate energy through industry-leading engineering and lighter materials, resulting in higher fuel efficiency and reduction in emissions.
Customers value how WABCO has been laying the foundation for autonomous driving of commercial vehicles as well as WABCO's extensive track record for mobilizing vehicle intelligence, making WABCO a leading partner of choice globally for
6
the development and systems integration of sensor, control and actuation technology alongside its expertise in local product application.
WABCO is also privileged to increasingly contribute to the sustained success of commercial and government-owned fleets worldwide. WABCO empowers fleets through its differentiated and expanding portfolio of leading fleet management solutions, its industry award-winning Intelligent Trailer Program offering more than 40 different key trailer functions, and WABCO's growing connectivity between off-vehicle data analytics support and intelligent on-vehicle safety and efficiency systems. Fleets are also empowered through big data from WABCO's onboard electronic braking, stability, efficiency and driver assistance systems integrated with fleet management solutions.
A fundamental driver of demand for our products is commercial truck and bus production. The number of new commercial vehicles built fluctuates from year to year in different regions of the world. Nonetheless, over the last five years, we have demonstrated our ability to outperform the market by increasing the amount of WABCO content on each vehicle. During the five year period through 2016, WABCO's European sales to truck and bus (T&B) OEM customers, excluding the impact of foreign currency exchange rates, outperformed the rate of European T&B production by an average of 4% per year.
Year to Year Change | 2012 | 2013 | 2014 | 2015 | 2016 | ||||||||||
Sales to European T&B OEMs (at a constant FX rate) | (10 | )% | 13 | % | (7 | )% | 8 | % | 8 | % | |||||
European T&B Production | (9 | )% | 5 | % | (9 | )% | 6 | % | 1 | % | |||||
Customers
We sell our products primarily to four groups of customers around the world:
• | Truck and bus OEMs; |
• | Commercial vehicle aftermarket distributors for replacement parts and services and commercial vehicle fleet operators for management solutions and services; |
• | Trailer OEMs, and |
• | Major car manufacturers. |
Our largest customer is Daimler, which accounted for approximately 10% of our sales in both 2016 and 2015. Other key customers include Volvo, Ashok Leyland, BMW, China National Heavy Truck Corporation (CNHTC), Cummins, Fiat (Iveco), Hino, Hyundai, Krone, MAN Nutzfahrzeuge AG (MAN), Meritor, Meritor WABCO (a joint venture), Paccar (DAF Trucks N.V. (DAF), Kenworth, Leyland and Peterbilt), First Automobile Works, Otto Sauer Achsenfabrik (SAF), Scania, Schmitz Cargobull AG, TATA Motors and ZF Friedrichshafen AG (ZF). For the fiscal years ended December 31, 2016 and 2015, our top 10 customers accounted for approximately 44% and 48% of our sales, respectively.
The largest group of our customers, representing approximately 59% of sales (57% in 2015), consists of truck and bus OEMs who are large, increasingly global and few in numbers due to industry consolidation, as well as a smaller number of off-highway (agricultural and construction) OEMs. As truck and bus OEMs grow globally, they expect suppliers to expand with them beyond their traditional markets and become reliable partners, especially in the development of new technologies. WABCO has a strong reputation for technological innovation and collaborates closely with major OEM customers to design, develop and deliver technologies used in their products. Our products play an important role in enabling further vehicle safety and efficiency. At the same time, there are few other suppliers who compete across the breadth of products that we supply globally.
The second largest group, representing approximately 25% of sales (26% in 2015), consists of the aftermarket distributor network that provides commercial vehicle operators with replacement parts as well as a range of services. This distributor network is a fragmented and diverse group of customers, covering a broad spectrum from large OEM-affiliated or OEM-owned distributors to small independent local distributors. The increasing number of trucks, buses and trailers on the road worldwide that are equipped with our products continuously increases market demand for replacement parts and services, which generates a growing stream of recurring aftermarket sales. In addition, we continue to develop an array of service offerings - such as diagnostics, training and fleet management solutions - for repair shops and fleet operators that further enhance our presence and growth in the commercial vehicle aftermarket.
7
The next largest group, representing approximately 10% of sales (11% in 2015), consists of trailer manufacturers, a particularly fragmented group of local or regional players that are widely diverse in business size, focus and operation. Smaller trailer manufacturers are highly dependent on suppliers such as WABCO to provide technical expertise and product knowledge. Similar to truck and bus OEMs, trailer manufacturers rely significantly on WABCO products for safety and efficiency functions through superior technologies and customized applications of such technologies.
The smallest group, representing approximately 6% of sales (6% in 2015), consists of passenger car and SUV manufacturers that purchase our electronic air suspension systems and vacuum pumps. Electronic air suspension is a luxury feature with increasing penetration that exceeds market growth. Vacuum pumps are used with diesel and gasoline direct injection (GDI) engines; as a result, WABCO's vacuum pumps have above-average growth rates due to increasing diesel and GDI applications in Europe, Asia and North America. These customers are typically large, global and sophisticated; they demand high quality in products and services.
We address our customers through a global sales force. It is organized around key accounts and customer groups and it interfaces with product marketing and management to identify opportunities and meet customer needs across our product portfolio and throughout different regions of the world.
Europe represented approximately 54% of our sales in 2016 (56% in 2015), the remainder coming primarily from Asia and the Americas. Our products are also manufactured in Europe, Asia and the Americas. WABCO's growth in Asia is enhanced by our strong roots in China and India where we have achieved leading market positions through close connectivity to customers. We are further strengthened in Asia by an outstanding network of suppliers, manufacturing sites and engineering hubs.
WABCO SALES | ||||||||||
By Geography | FY 2016 % of Sales | FY 2015 % of Sales | By Major End-Market | FY 2016 % of Sales | FY 2015 % of Sales | |||||
Europe | 54 | % | 56 | % | Truck & Bus Products (OEMs) | 59 | % | 57 | % | |
Asia | 24 | % | 22 | % | Aftermarket | 25 | % | 26 | % | |
North America | 14 | % | 17 | % | Trailer Products | 10 | % | 11 | % | |
South America | 3 | % | 3 | % | Car Products | 6 | % | 6 | % | |
Other | 5 | % | 2 | % | ||||||
Additional information on the geographic distribution of our sales and our long-lived assets for the past three years may be found in Note 19 ("Geographic Information") in Notes to the Consolidated Financial Statements.
Backlog
Information on our backlog is set forth under Item 7. “Management's Discussion and Analysis of Financial Condition and Results of Operations - Backlog” of this annual report.
Seasonality
Information on the seasonality of our business is set forth under Item 7 “Management's Discussion and Analysis of Financial Condition and Results of Operations - Seasonality” of this annual report.
8
Growth Strategy
In 2016, WABCO continued its three-pillar strategy - technology innovation, geographic expansion, and excellence in execution - which further differentiates WABCO within the global commercial vehicle industry. Key drivers of excellence in execution are discussed in “Manufacturing and Operations” below.
Technology
WABCO remains focused on global technology trends that are relevant to our customers. Our technology strategy has three pillars to create value for manufacturers of commercial vehicles and fleet customers in every region of the world. The first pillar is advanced vehicle and driver safety to reduce the number of accidents involving commercial vehicles. The second pillar is vehicle efficiency to improve the environmental sustainability of trucks, buses and trailers, and to reduce their total cost of operation through better fuel economy and other improvements. Solidly anchored in the fully autonomous driverless vehicle vision, the third pillar is connectivity that cuts across the other two pillars to enable WABCO to mobilize vehicle efficiency and empower fleets around the world leveraging off-vehicle data analytics support and intelligent on-vehicle safety and efficiency systems.
We continue to drive market outperformance by leveraging our industry-leading expertise in developing electronic systems that control braking, stability, suspension, transmission automation and air management. We have a strong track record of innovation and we are responsible for many of the commercial vehicle industry's most important innovations including:
• | First heavy-duty truck anti-lock braking system (ABS) |
• | First electronically controlled air suspension (ECAS) system for commercial vehicles |
• | First commercial vehicle automated manual transmission (AMT) controls system |
• | First electronic stability control (ESC) system for heavy-duty commercial vehicles |
• | First collision safety system with active braking developed for the North American market based on Adaptive Cruise Control (ACC) technology |
• | First hydraulic ABS integrated with ESC for medium-duty commercial vehicles |
• | First modular braking system platform (mBSP™) that enables vehicle makers to interchangeably equip their truck and bus platforms with either ABS or electronic braking systems (EBS) anywhere in the world |
• | First technology (TX-TRAILERGUARD™) that provides comprehensive operating data on the performance of the truck, trailer and driver in a single integrated real-time view |
• | First technology (OptiLink™) that provides a single user interface via a mobile device, such as a smartphone, to monitor and control multiple functions on both the truck and trailer |
• | First door lock control technology (OptiLock™) that provides high security locking systems for trailers and container doors seamlessly connected with telematics systems |
• | Breakthrough collision avoidance technology for commercial vehicles jointly developed with ZF, the Evasive Maneuver Assist (EMA) combines WABCO's world-class braking, stability and vehicle dynamics control systems on trucks and trailers with ZF's top active steering technology - an industry first |
• | Breakthrough OnCity™ Urban Turning Assist system, the Company's technology engineered for trucks, buses and tractor-trailers to help protect pedestrians and cyclists in city traffic |
We continue to expand our technology portfolio by introducing new product applications and functionalities, and by improving the market penetration of our existing technologies. Advanced products and functionalities are typically developed and adopted first in Europe and then migrated to North America and emerging economies. Examples include the adoption of ABS and automated transmission systems. These technologies were first widely adopted in European markets before starting to penetrate North America as well as China, India and other emerging markets. In terms of commitment to innovation, WABCO expended approximately $135.2 million in 2016 for product engineering, including research activities and product development.
We are also focused on long-term opportunities as WABCO continues to anticipate and fulfill our industry's constant search for technology that advances vehicle safety and efficiency in mature and emerging markets on a cost-competitive basis.
WABCO safety technologies encompass braking systems, stability control, collision mitigation as well as accident mitigation and prevention. In 2016 - among other major accomplishments - we completed acquisitions, formed new alliances, announced
9
breakthrough technologies and further strengthened existing partnerships. We also continued to expand and enrich our portfolio of differentiated capabilities that improve the safety, efficiency and connectivity of commercial vehicles.
As our customers converge toward intelligent vehicles and autonomous driving, WABCO is firmly positioned in the sweet spot for the future of our industry - mobilizing vehicle intelligence. This means leveraging WABCO’s breadth and depth of capabilities to further enable the continued success of OEMs and fleet operators in every region of the world.
In 2016, we further strengthened our market leadership in collision mitigation and advanced emergency braking through OnGuard™ and OnGuardACTIVE™ systems respectively. WABCO’s mBSP, the industry's first modular braking system platform, is at the heart of a commercial vehicle's braking system. It enables commercial vehicle makers to interchangeably equip their diverse global truck and bus platforms with ABS or EBS systems anywhere in the world. WABCO's mBSP uniquely features commonality of components and electronics, enabling truck and bus builders to save development time and production costs, and to bring new vehicles to market faster in every region of the world.
In 2016, WABCO continued to increase adoption of our breakthrough MAXX™ air disc brakes (ADB), the industry’s lightest and highest performing single-piston ADB for commercial vehicles. Compactly engineered, MAXX braking technology fits virtually every wheel size for commercial trucks, buses and trailers around the globe. In particular, WABCO expanded ADB market penetration for trucks in North America, Europe and China where major customers value industry-leading MAXX differentiators such as shorter stopping distances compared with drum brakes.
WABCO efficiency technologies deliver fuel economy, emissions reduction, energy recovery, weight reduction, lower maintenance costs and increased driver capability. As of 2016, 3.5 million WABCO AMT systems have been sold, including our industry award-winning OptiDrive™ system - our modular automated manual transmission technology - which increases fuel economy up to 5% through optimized gear shifting. In 2016, WABCO increased adoption of OptiDrive systems at original equipment makers in emerging economies such as India and China. OptiRide™ is an electronically controlled air suspension (ECAS) technology that identifies axle overload, provides automatic load transfer and improves traction, which helps to reduce vehicle wear-and-tear and other operational costs. WABCO’s OptiRide delivers fuel savings up to 3% under certain conditions, while providing optimal ride performance. As of 2016, OptiRide remains the global industry’s best-selling solution for electronic control of air suspension. In 2016, we complemented our OptiFlow™ product range offering efficiency to trailer builders and major fleets through aerodynamic devices with the acquisition of LCL. Aerodynamic products reduce air drag of commercial trucks traveling long distances at highway speeds, thereby lowering fuel consumption by up to 7% as well as CO2 emissions.
Geographic Expansion
Americas
WABCO’s regional headquarters for the Americas is located in Rochester Hills, Michigan. It further anchors WABCO as a global technology leader and tier-one supplier to the commercial vehicle and automotive industries. It also further demonstrates WABCO’s commitment to closely connect with original equipment manufacturers and fleet operators in North and South America by leveraging our local capabilities and distribution channels for our vehicle safety and efficiency products and services.
North America remains a long-term growth market for WABCO, particularly in the United States, due to its expected volume of truck and bus production and the increasing adoption of vehicle safety and efficiency technologies. We participate in this market through a dual approach. Our North American joint venture, Meritor WABCO, is focused on the application and delivery of WABCO’s braking and active safety systems, electronic suspension control and air management products. At the same time, WABCO North America, which in 2016 marked its fourth full year, provides further focus on business expansion and enhancement of WABCO’s positioning in the market. For example, in 2016, we increased WABCO's ADB penetration and market share at both Daimler and Hendrickson. A major commercial fleet also expanded adoption of high-performance ADB in North America. All in, ADB units sold increased by 56% versus 2015. WABCO also invested $17 million into WABCO ADB localization in North America by building a new state-of-the-art factory in Charleston, South Carolina where we will continue local manufacturing of air compressors and braking system components in response to increased demand for our advanced ADBs by major original equipment manufacturers and fleets in North America. During 2016, WABCO’s AMT also continued its successful penetration through sales to Daimler Trucks North America and Volvo. WABCO also signed a new long-term agreement with Cummins to manufacture and supply high-performance (and energy efficient) air-compressor technology for trucks, buses and industrial equipment, significantly expanding the volume and variety of demand for WABCO’s air-compression technologies. Lastly, WABCO acquired MICO and LCL, further expanding its North America footprint.
WABCO marked a major milestone of more than 120,000 OnGuard collision mitigation systems sold in North America through Meritor WABCO. Used extensively in heavy-duty trucks since 2007, WABCO’s OnGuard is North America's leading
10
collision mitigation system. More than 200 fleets are currently utilizing the system to help keep their truck drivers, vehicles, and fellow motorists safe. Heavy-duty truck fleets have reported up to 87% reduction in accidents and up to an 89% reduction in accident costs since adopting OnGuard.
South America remains a long-term growth market for WABCO, particularly Brazil, due to its expected volume of truck and bus production and the increasing adoption of vehicle safety and efficiency technologies. WABCO continued in 2016 as market leader for ABS and a range of our other technologies. WABCO has more than 30 years of ABS experience in Brazil and a leading position to help vehicle manufacturers comply with Brazilian legislation that now mandates ABS on all new trucks, buses and trailers. In 2016, new business launches for Tristop products and Air Processing units significantly supported a double digit outperformance in a declining market. WABCO's South American headquarters near São Paulo serves as a regional hub in the manufacturing and sales network of WABCO products and systems. It also has a world-class production facility and a distribution center in the Campinas region. WABCO South America’s enhanced capabilities include product and applications engineering, aftermarket service, supply chain management and manufacturing. WABCO connects with the specific needs of customers in South America through specially developed and locally adapted systems and products for emerging markets.
China
China remains a long-term growth market for WABCO due to its expected volume of truck and bus production and the increasing adoption of vehicle safety and efficiency technologies. In 2016, WABCO continued to outperform the China market double digit. This was due to its position as market leader and supplier of choice for control systems for trucks, buses and trailers in China, the world’s largest market for commercial vehicles. As the leading provider of anti-lock braking systems (ABS) in China, WABCO is well positioned for growth driven by the continued local enforcement of existing regulations making ABS mandatory on trucks, buses and trailers, as well as additional future regulations to cover more classes of vehicles. For instance, WABCO anticipated the light and medium duty ABS regulation enforcement and upgrade trend in China and successfully won new business with Foton. WABCO strengthened its traditional partnership with leading OEMs (CNHTC, Yutong) but furthered with additional growth potential OEMs like Dongfeng Liuzhou Motor Company (DFLQ) and FAST to lay solid foundation for future growth. In 2016 WABCO signed a long term agreement with FAST strengthening WABCO’s leading position of OptiDrive™ in China.
Since 2014, WABCO remains the first and only supplier of ECAS systems for truck and bus manufacturers in China. Several major Chinese heavy duty truck manufacturers - including China National Heavy Truck Corporation (CNHTC), DFLQ and Shaanqi - continue to increase adoption of OptiRide electronically controlled air suspension (ECAS) in series production. Also, WABCO signed in 2016 a new multi-year agreement to supply industry-leading vacuum pumps for Geely, one of China’s largest car makers, thus further enlarging WABCO’s car business growth prospects in the region.
Customers value WABCO’s local capabilities for product application development and engineering as our strategy is to “design for China,” which also involves our four world-class factories located there. This strategy delivers optimal localized solutions to improve vehicle safety and efficiency, enhance driver effectiveness and sustain environmental friendliness.
India
India remains a long-term growth market for WABCO due to its expected volume of truck and bus production and the increasing adoption of vehicle safety and efficiency technologies. We participate in this market through our subsidiary WABCO INDIA, which has a 53-year track record of local market leadership in conventional braking products, advanced braking systems, air-assisted products, and automated manual transmission systems. In particular, all local commercial vehicle manufacturers in India relied on WABCO’s test track located in Chennai to homologate anti-lock braking systems (ABS) to comply with the new national ABS regulation that came into effect at the end of 2015 for trucks weighing more than 12 tons and buses above 5 tons. WABCO strengthened its market leadership position in 2016 by expanding its product portfolio through Hydraulic ABS, Wiring Harness, Pole Wheel, Telematics for the aftermarket and extension of products to car OEMs and independent luxury bus manufacturers.
WABCO INDIA connects with global OEMs based both in India and in other regions of the world through five world-class manufacturing sites located in Ambattur, Jamshedpur, Mahindra World City, Pantnagar and Lucknow, as well as a facility in Chennai for software engineering. In India, over 500 engineers also support the local design of new products, applications and systems to meet the technical and economic needs of customers in emerging markets around the world. At the same time, they continue to contribute to global development of WABCO’s advanced technologies. Furthermore, WABCO INDIA continued in 2016 to be recognized by multiple major customers for its excellence in innovation, quality, cost and overall performance, among other attributes that further differentiate WABCO as a leading supplier based on customer satisfaction. Also, WABCO INDIA remains a market leader in its domestic aftermarket through an extensive national distribution network of more than 7,000 WABCO outlets nationally, to provide fleet customers with broad access to full product and services support. To enhance connectivity,
11
WABCO INDIA launched in 2016 its indigenous Fleet Management Solutions and has been able to connect more than 3,000 units in the aftermarket channel.
Eastern Europe
Eastern Europe is another long-term growth market for WABCO. Truck and bus production there is mainly in the Commonwealth of Independent States (CIS), which includes Russia as its major market. Headquartered in Moscow, WABCO Russia has a factory in Miass and a distribution center in the Moscow region, supplying makers of trucks, trailers and buses, as well as aftermarket customers. In 2016, WABCO delivered 100% of braking systems (ADB, APU, ABS and all conventional valves) for the newest platforms of trucks and buses for Russia’s largest medium-duty commercial vehicle manufacture. WABCO was also able to secure ABS, EBS, ESC and ECAS business for new heavy-duty platforms to be introduced by one of Russia’s largest heavy-duty commercial vehicle manufacturers.
WABCO is further differentiated in Russia, among other reasons, because our local engineers support customers throughout product development and completion of successful homologation. WABCO has been connecting with markets within the CIS for more than 40 years. WABCO Russia alone also has five regional sales offices, 25 dealers, over 170 authorized WABCO shops and more than 190 Service Partners across the country.
Competition
Given the importance of technological leadership, vehicle life-cycle expertise, reputation for quality and reliability, and the growing joint collaboration between OEMs and suppliers to drive new product development, the space in which we mostly operate has not historically had a large number of competitors. Our principal competitors are Knorr-Bremse (Knorr's U.S. subsidiary is Bendix Commercial Vehicle Systems) and, in certain categories, Haldex. In the advanced electronics categories, automotive players such as Bosch (automotive) and Continental have recently been present in some commercial vehicle applications. In the mechanical product categories, several Asian competitors are emerging, primarily in China, who are focused on such products. In each of our product categories, we compete on the basis of product design, manufacturing and distribution capabilities, product quality and reliability, price, delivery and service.
Manufacturing and Operations
Most of our manufacturing sites and distribution centers produce and/or house a broad range of products and serve different types of customers. Currently, approximately 72% of our manufacturing workforce is located in best cost countries such as China, India, Brazil and Poland up from approximately 45% in 2007. Facilities in best cost countries have historically helped to reduce costs on more labor-intensive products, while our facilities in Western Europe are generally producing more technologically advanced products. However, the increasing need for more advanced products and systems in emerging markets leads us to expand local supply chain capabilities to progressively cover more complex manufacturing.
All facilities worldwide are deploying Six Sigma Lean initiatives and global standards to continuously generate productivity and improve service levels. By applying Six Sigma policy, methodologies and tools, we seek to improve quality and predictability of our processes on a continual basis. Lean is geared toward eliminating waste in our supply chain, manufacturing and administrative processes. Methodologies are customer driven and data based. In addition, our global supply chain team is tightly connected throughout regions and at each site. They make decisions on where to manufacture which products taking into account such factors as local and export demand, customer approvals, cost, key supplier locations and factory capabilities. WABCO's global manufacturing and logistics also support our customers in the aftermarket as we continue to perform at industry-leading levels for on-time delivery and inventory fulfillment, among other drivers of customer satisfaction.
As announced in 2015 within the framework of preserving WABCO competitiveness in conventional mechanical products, 2016 saw the end of manufacturing activities and shutdown of operations in Meppel (Netherlands). Following the completion of the formal regulatory approval process in France, production at our Claye-Souilly (France) plant will cease in the second half of 2017, with production also being transferred to other facilities within WABCO’s globally integrated supply chain.
WABCO also invested $17 million to build a new state-of-the-art factory in Charleston, South Carolina where we will continue local manufacturing of air compressors and braking system components in response to increased demand for our advanced Air Disc Brakes by major original equipment manufacturers and fleets in North America.
Our global sourcing organization purchases a wide variety of components, including electrical, electro-mechanical and cast aluminum products, as well as parts containing materials such as steel, copper, rubber and plastic. These items represent a substantial portion of manufacturing costs. We source products on a global basis from three key regions: Western Europe, Central and Eastern
12
Europe, and Asia. To support WABCO's continuing shift of manufacturing to best cost countries, we also continue to migrate more of our sourcing to best cost regions. Under the leadership of the global sourcing organization, which is organized around commodity and product groups, we identify and develop key suppliers and seek to integrate them as partners within our extended enterprise. Many of our Western European suppliers are accompanying us toward best cost countries. Since 2007, the share of our sourcing from best cost regions has increased from 36% to approximately 46%.
We have developed a strong position in the engineering, design, development and testing of products, components and systems. We are generally regarded within our global industry as a systems expert. This recognition reflects our in-depth technical knowledge and capabilities to support the development of advanced technology applications that are appropriately and optimally integrated with all of the vehicle's other systems and controls. Key customers depend on us and will typically involve us very early in the development process as they begin designing next generation platforms. We have approximately 2,382 employees - of which approximately 54% is located in best cost countries - dedicated to engineering and developing new products, components and systems as well as supporting and enhancing technology applications and manufacturing processes. These include 228 software engineers in India who support the local design of new products and systems for emerging markets and contributes to the global development of advanced technologies for commercial vehicles. They are dedicated to continuously improving the cost effectiveness and efficiency of WABCO's business processes and operations worldwide through services that are optimally leveraged and shared within our own organization and connected with suppliers, customers and others.
Our global sales organization hosts application engineers that are based near customers in different regions around the world and are partially resident at some customer locations. We also have significant resources in best cost countries where we perform functions such as drawings, testing and software component development. We operate test tracks in Germany and India as well as in Finland for extreme weather-proving conditions.
Joint Ventures
We use joint ventures globally to expand and enhance our access to customers. Our important joint ventures are:
• | A majority-owned joint venture (90%) in Japan with Sanwa-Seiki (WABCO Japan, Inc.) that distributes WABCO's products in the local market. |
• | A majority-owned (70%) manufacturing partnership in the United States with Cummins Engine Co. (WABCO Compressor Manufacturing Co.) formed to produce air compressors designed by WABCO. |
• | A majority-owned joint venture (70%) with Guangdong FUWA Heavy Industry Co., Ltd., (FUWA) formed to produce air disc brakes for commercial trailers in China. FUWA is the largest manufacturer of commercial trailer axles in China and in the world. |
• | A 50% owned joint venture in Germany with Wurth Group (WABCOWURTH Workshop Services GmbH) that supplies commercial vehicle workshops, fleet owners and operators and end users internationally with multi-brand technology diagnostic systems. |
• | A 50% owned partnership in North America with Meritor, Inc. (Meritor WABCO) that markets ABS and other vehicle control products. |
• | A 49% owned partnership in South Africa with Sturrock & Robson Ltd (WABCO Automotive South Africa), a distributor of braking systems products. |
Employees
We have 12,860 employees. Approximately 46% of our employees are salaried and 54% are hourly. Approximately 49% of our workforce is in Europe, 44% is in Asia, and the remaining 7% is in the Americas. As discussed above in "Manufacturing and Operations", in 2015, we announced restructuring proposals to cease manufacturing at two of our production facilities, which would result in a total reduction in workforce of approximately 320 employees.
Employees located in our sites in Europe, Asia and South America are subject to collective bargaining, with internal company agreements or external agreements or laws at the region or country level. Currently approximately 50% of our workforce is covered by collective bargaining agreements. The employees' right to strike is typically protected by law and union membership is confidential information which does not have to be provided to the employer. The collective bargaining agreements are typically renegotiated on an annual basis. Our U.S. facilities are non-union. We have maintained good relationships with our employees around the world and historically have experienced very few work stoppages.
13
Intellectual Property
Patents and other proprietary rights are important to our business. We also rely upon trade secrets, manufacturing know-how, continuing technological innovations, and licensing opportunities to maintain and improve our competitive position. We review third-party proprietary rights, including patents and patent applications, as available, in an effort to develop an effective intellectual property strategy, avoid infringement of third-party proprietary rights, identify licensing opportunities, and monitor the intellectual property claims of others.
We own a large portfolio of patents that principally relate to our products and technologies, and we have, from time to time, licensed some of our patents. Patents for individual products and processes extend for varying periods according to the date of patent filing or grant and the legal term of patents in various countries where patent protection is obtained.
We protect our brands by trademark registrations in key markets in which our products are sold. Such trademark protections apply to our generic brands like the WABCO brand as well as many of our product names.
While we consider our patents and trademarks to be valuable assets, we do not believe that our competitive position is materially dependent upon any single patent or group of related patents. At the same time, we recognize that technical leadership is an ongoing pillar of success and our intellectual property portfolio will continue to grow in importance for the company as a whole as a result. We continue to focus on successful patent prosecution and defense, trademark protection and the exploitation and protection of other intellectual property rights.
Environmental Regulation
Our operations are subject to local, state, federal and foreign environmental laws and regulations that govern activities or operations that may have adverse environmental effects and which impose liability for clean-up costs resulting from past spills, disposals or other releases of hazardous wastes and environmental compliance. Generally, the international requirements that impact the majority of our operations tend to be no more restrictive than those in effect in the U.S.
Throughout the world, we have been dedicated to being an environmentally responsible manufacturer, neighbor and employer. We have a number of proactive programs in place to minimize our impact on the environment and believe that we are in substantial compliance with environmental laws and regulations. Manufacturing facilities are audited on a regular basis. Twenty of our manufacturing sites have Environmental Management Systems (EMS), which have been certified as ISO 14001 compliant. In addition, both our test tracks as well as our largest distribution center (DC) have also been certified as ISO 14001 compliant. These sites are those located in:
Campinas, Brazil | Gronau, Germany | Pantnagar, India |
Jinan, China (2 plants) | Mannheim, Germany | Stanowice, Poland |
Qingdao, China | Jeverson, Germany (test track) | Wroclaw, Poland (2 plants) |
Taishan, China | Ambattur, India | Charleston, United States |
Claye-Souilly, France | Jamshedpur, India | Rochester Hills, United States |
Meppel, Netherlands | Mahindra World City, India | North Mankato, United States |
Hanover, Germany | Lucknow, India | Pyungtaek, Korea |
Langehagen, Germany (DC) | Chennai, India (test track) | |
A number of our facilities are undertaking responsive actions to address groundwater and soil issues. Expenditures in 2016 to evaluate and remediate these sites were not material, and are also not expected to be material in 2017. Additional sites may be identified for environmental remediation in the future, including properties previously transferred and with respect to which the Company may have contractual indemnification obligations.
Available Information
Our web site is located at www.wabco-auto.com. Our periodic reports and all amendments to those reports required to be filed or furnished pursuant to Section 13(a) or 15(d) of the Securities Exchange Act of 1934 are available free of charge through the web site. During the period covered by this report, we posted our periodic reports on Form 10-Q and our current reports on Form 8-K and any amendments to those documents to our web site as soon as such reports were filed or furnished electronically with the Securities Exchange Commission (SEC). We will continue to post to our web site such reports and amendments as soon as reasonably practicable after such reports are filed with or furnished to the SEC.
14
The Separation of WABCO from Trane
The spin-off by Trane of its Vehicle Control Systems business became effective on July 31, 2007, through a distribution of 100% of the common stock of WABCO to Trane's shareholders (the Distribution). The Distribution was effected through a separation and distribution agreement pursuant to which Trane distributed all of the shares of WABCO common stock as a dividend on Trane common stock, in the amount of one share of WABCO common stock for every three shares of outstanding Trane common stock to each shareholder on the record date. Trane received a private letter ruling from the Internal Revenue Service (IRS) and an opinion from tax counsel indicating that the spin-off was tax free to the shareholders of Trane and WABCO.
Code of Conduct and Ethics
Our Code of Conduct and Ethics, which applies to all employees, including all executive officers and senior financial officers and directors, is posted on our web site www.wabco-auto.com. The Code of Conduct and Ethics is compliant with Item 406 of SEC Regulation S-K and the NYSE corporate governance listing standards. Any changes to the Code of Conduct and Ethics that affect the provisions required by Item 406 of Regulation S-K will also be disclosed on the web site.
Any waivers of the Code of Conduct and Ethics for our executive officers, directors or senior financial officers must be approved by our Audit Committee and those waivers, if any are ever granted, would be disclosed on our web site under the caption “Exemptions to the Code of Conduct and Ethics.” There have been no waivers to the Code of Conduct and Ethics.
15
ITEM 1A. RISK FACTORS
Any of the following factors could have a material adverse effect on our future operating results as well as other factors included in “Management's Discussion and Analysis of Financial Condition and Results of Operations - Information Concerning Forward Looking Statements.”
Risks Relating to Our Business
Our sales could decline due to macro-economic factors, downturns in the industry, regulatory changes, and other factors outside of our control.
Changes in economic conditions, significant downturns in our industry, regulatory changes impacting our supply chain and the purchasing patterns of commercial vehicles, including the ability to trade across borders and import and export our products, and changes in the local economies of the countries or regions in which we sell our products, such as changes in consumer confidence, increases in interest rates, inflation and increases in unemployment, could affect demand for our products, which could negatively affect our business and results of operations.
Demand for new trucks and buses in the markets in which we operate has a significant impact on our sales. Adverse economic conditions in our markets, particularly in Europe, and other factors may cause our customers to reduce truck and bus production, which could have an adverse effect on our results of operations and financial condition.
A global recession would negatively impact our customers and result in reduced demand for our products, which would therefore have a significant negative impact on our business.
During the 2008-2009 recession, the credit markets experienced a period of unprecedented turmoil and upheaval characterized by significantly reduced availability of credit and increased borrowing costs. The disruptions in the credit markets and impacts of the global recession negatively impacted consumer spending patterns and caused our customers to reduce truck and bus production. During 2012, the commercial vehicle industry experienced an abrupt slowdown to the significant recovery seen in 2010 and 2011 in our more developed markets, in addition to double digit declines in some of our emerging markets, namely Brazil and China. A further global recession could cause our customers to again reduce truck and bus production, which would have a negative impact on our business and results of operations, our operating cash flows and our financial condition.
Our exposure to exchange rate fluctuations on cross border transactions and the translation of local currency results into U.S. Dollars could negatively impact our results of operations.
We conduct business through subsidiaries in many different countries, including most of the major countries of Western and Eastern Europe, Brazil, Russia, China, South Korea, India, Thailand and Japan, and fluctuations in currency exchange rates have a significant impact on the reported results of our operations, which are presented in U.S. Dollars. In 2016, approximately 86% of our combined sales occurred outside of the United States. A significant and growing portion of our products are manufactured in best-cost countries and sold in various countries. Cross border transactions, both with external parties and intercompany relationships, result in exposure to foreign currency exchange effects. Accordingly, fluctuations in the currency exchange rates could negatively impact our results of operations, especially fluctuations in the exchange rates of the currencies for the countries referred to above. Additionally, our results of operations are translated into U.S. Dollars for reporting purposes. The strengthening or weakening of the U.S. Dollar results in unfavorable or favorable translation effects as the results of foreign locations are translated into U.S. Dollars.
Our annual cash tax rate will likely increase, perhaps significantly in future years, as a result of the European Commission’s decision on the Belgian excess profit ruling program which would negatively impact our results of operations.
Our overall effective tax rate is equal to our total tax expense as a percentage of our total profit or loss before tax. However, tax expenses and benefits are determined separately for each tax paying entity or group of entities that is consolidated for tax purposes in each jurisdiction. A substantial majority of our profits are earned in jurisdictions with a lower rate than the U.S. statutory rate. The country that has a material impact on lowering our global effective tax rate is Belgium, the location of our global headquarters.
The Belgian Tax Code contains provisions to reduce the taxable base of companies, through rulings granted by the Belgian Government under the excess profit ruling (EPR) program. WABCO qualified for the EPR program in 2012. On January 11, 2016, the European Commission ruled that the EPR program permitted under Belgian law is illegal and incompatible with European State Aid law (hereinafter referred to as the "Decision"). As a result, the European Commission required Belgium to stop applying
16
the EPR program and to recover all past tax benefits received by applicable companies under the program (i.e. a “clawback”). The Company recorded an income tax provision of $69.3 million during 2016 with respect to the clawback of all the tax benefits obtained under the EPR program for tax years 2012 to 2014. This income tax provision did not have any cash impact because the Company had net operating losses (NOLs) available to deduct against the incremental taxable profit. The fact that the Belgium NOLs were utilized to offset the EPR clawback means they are no longer available to reduce our future cash tax rate and the amount of tax WABCO pays in Belgium is likely to increase significantly in future years which could have a material adverse effect on our results of operations.
See Management’s Discussion & Analysis of Financial Condition and Results of Operations for a discussion of the Company’s appeal against the Decision and the impact on the Company's financial results in 2016.
Our annual effective tax rate may increase, perhaps significantly in future years, if the European Commission decides that the Belgian Patent Income Deduction (PID) program is incompatible with European State Aid rules.
In July 2016, WABCO received a ruling from the Belgium Government confirming that it may claim a PID tax relief for both 2015 and 2016. The benefit for 2016 remains within our 2016 provision and the benefit for 2015 was recognized for the first time in Q3 2016 upon filing the Belgium tax return. Under current Belgium law, WABCO should be able to qualify for the PID until July 2021. There can be no guarantee that the European Commission will not later decide that the PID program in Belgium, like the EPR program, constitutes illegal state aid. If we lose the benefit of the PID program, it would increase our effective tax rate which could have a material adverse effect on our results of operations. See Management’s Discussion and Analysis of Financial Condition and Results of Operations for a discussion of the Company’s ability to claim PID relief.
The value of our deferred tax assets could become impaired, which could materially and adversely affect our operating results.
As of December 31, 2016, we had approximately $70.0 million in net deferred tax assets. These deferred tax assets include post-retirement and other employee benefits and net operating loss carryovers that can be used to offset taxable income in future periods and reduce income taxes payable in those future periods. Each quarter, we determine the probability of the realization of deferred tax assets, using significant judgments and estimates with respect to, among other things, historical operating results and expectations of future earnings and tax planning strategies. If we determine in the future that there is insufficient evidence to support the valuation of these assets, due to the risk factors described herein or other factors, we may be required to record or further adjust a valuation allowance to revalue our deferred tax assets. Such a revaluation could result in material non-cash expense in the period in which the valuation allowance is adjusted and could have a material adverse effect on our results of operations.
The Company could be subject to an increase in its tax rates following the adoption of new U.S. or international tax legislation.
The Company is subject to taxes in the U.S. and numerous foreign jurisdictions, including Belgium, where a number of the Company’s subsidiaries are organized. Due to economic and political conditions, the tax rate in various jurisdictions may be subject to significant changes. The Company’s overall effective tax rate could be affected by changes in the mix of earnings in countries with different statutory tax rates or changes in tax laws or their interpretation.
The OECD, which represents a coalition of member countries, has recommended changes to numerous long-standing tax principles relating to Base Erosion and Profit Shifting (BEPS). These changes are being adopted and implemented by many of the countries in which we do business and may increase our taxes in these countries. In addition, the European Commission has launched several initiatives to implement BEPS actions including an anti-tax avoidance directive and having a common (consolidated) corporate tax base. It is unclear at present if all or any of these initiatives will be implemented by the EU countries. Comprehensive U.S. tax reform has been stated to be a priority by President Trump and the U.S. Congress. Changes in U.S. tax laws or their interpretation, if adopted, could significantly increase our consolidated effective tax rate and adversely affect our financial results particularly if the proposed border tax denying corporate tax relief on imports is introduced.
The occurrence of tax liabilities arising from tax audits in the jurisdictions in which we operate could materially and adversely affect our overall effective tax rate and our results of operations.
The Company is subject to tax audits in all major countries that it does business. While the Company believes it complies with all local country tax laws, there are many transactions and calculations where the ultimate tax determination is uncertain. Although the Company believes its tax estimates are reasonable, the final determination of tax audits and any related litigation in the jurisdictions where the Company is subject to taxation could be materially different from its historical income tax provisions and accruals. The results of an audit or litigation could have a material effect on the Company’s consolidated financial statements in the period or periods in which the determination is made.
17
We may have exposure to additional tax liabilities as a result of the Company no longer meeting the requirements for certain tax rulings it has been granted.
WABCO has received a number of tax rulings and incentives in countries in which it is carrying out significant operations. If these incentives are revoked or if the Company no longer complies with the tax incentive requirements, it may have a significant impact on the Company’s global effective tax rate which could have a material adverse effect on our results of operations.
We are subject to general risks associated with our foreign operations.
In addition to the currency exchange risks inherent in operating in many different foreign countries, there are other risks inherent in our international operations.
The risks related to our foreign operations that we more often face in the normal course of business include:
• | increases in non-U.S. tax rates and the amount of non-U.S. earnings relative to total combined earnings could change and impact our combined tax rate; |
• | foreign earnings may be subject to withholding requirements or the imposition of tariffs, price or exchange controls, or other restrictions; |
• | general economic and political conditions in countries where we operate may have an adverse effect on our operations in those countries; |
• | governmental actions (such as restrictions on transfer of funds and trade protection measures, including export duties, quotas and customs duties and tariffs); |
• | we may have difficulty complying with a variety of foreign laws and regulations, some of which may conflict with United States law, and the uncertainty created by this legal environment could limit our ability to effectively enforce our rights in certain markets; and |
• | in several of the countries in which we do business, we rely upon the ongoing performance of our joint venture partners who bear risks similar to our risks and also may include obligations they have under related shareholders' agreements and risk of being denied access to the capital markets which could lead to resource demands on the Company in order to maintain or advance its strategy. |
The ability to manage these risks could be difficult and may limit our operations and make the manufacture and distribution of our products internationally more difficult, which could negatively affect our business and results of operations.
Increasing our financial leverage could affect our operations and profitability.
As of December 31, 2016, our total debt balance was $959.1 million compared to $503.7 million as of our prior fiscal year end. Of this amount, $460.1 million related to our issuance of senior unsecured notes during the fourth quarter of 2016. Our indebtedness could affect our business and financial condition in various ways, including:
• | increasing our interest expense under our revolving credit facilities or other variable-rate borrowing if interest rates were to rise; and |
• | potentially limiting our ability to borrow additional funds on favorable terms, or at all. |
While we believe we will have the ability to service our debt, respect all of the covenants contained in the facilities and obtain additional capital in the future if and when needed, that will depend upon our results of operations and financial position at the time, the then-current state of the credit and financial markets, and other factors that may be beyond our control. If we are unable to service our debt or obtain additional capital in the future on favorable terms, our financial condition and results of operations would be adversely affected.
Changes in factors that impact the determination of our non-U.S. pension liabilities may adversely affect us.
Certain of our non-U.S. subsidiaries sponsor defined benefit pension plans, which generally provide benefits based on negotiated amounts for each year of service. The Company’s pension expense and its required contributions to its pension plans are directly affected by the value of plan assets, the projected and actual rates of return on plan assets and the actuarial assumptions the Company uses to measure its defined benefit pension plan obligations, including the discount rate at which future projected
18
and accumulated pension obligations are discounted to a present value and the inflation rate. The Company could experience increased pension expense due to a combination of factors, including the decreased investment performance of its pension plan assets, decreases in the discount rate and changes in its assumptions relating to the expected return on plan assets. The Company could also experience increased other post-retirement expense due to decreases in the discount rate, increases in the health care trend rate and changes in demographics. If the actual trends in these factors are less favorable than our assumptions, this could have an adverse effect on our results of operations and financial condition.
We purchase components and parts containing base metals and other commodities. If we are unable to obtain such components and parts or obtain them at reasonable price levels due to fluctuations in the costs of the underlying raw materials, our ability to maintain existing sales margins may be affected.
We purchase a broad range of materials and components and parts throughout the world in connection with our manufacturing activities. Major items include electronic components and parts containing aluminum, steel, copper, zinc, rubber and plastics. The cost of components and parts, which reflect the cost of the raw materials used therein, represents a significant portion of our total costs. Price increases of the underlying commodities may adversely affect our results of operations. Although we maintain alternative sources for components and parts, our business is subject to the risk of price fluctuations and periodic delays in the delivery of certain raw materials to our suppliers. The sudden inability of a supplier to deliver components or to do so at reasonable prices could have a temporary adverse effect on our production of certain products or the cost at which we can produce those products. In addition, any change in the supply or price of raw materials could materially adversely affect our future business and results of operations.
If we are not able to maintain good relations with our employees, we could suffer work stoppages that could negatively affect our business and results of operations.
Employees located in our sites in Europe, Asia and South America are subject to collective bargaining, with internal company agreements or external agreements at the region or country level. Currently approximately 50% of our workforce is covered by collective bargaining agreements. These employees' right to strike is typically protected by law and union membership is confidential information which does not have to be provided to the employer. Our U.S. facilities are non-union. Any disputes with our employee base could result in work stoppages or labor protests, which could disrupt our operations. Any such labor disputes could negatively affect our business and results of operations.
We are dependent on key customers.
We rely on several key customers. For the fiscal year ending December 31, 2016, sales to our top ten customers accounted for approximately 44% of our sales. Many of our customers place orders for products on an as-needed basis and operate in cyclical industries and, as a result, their order levels have varied from period to period in the past and may vary significantly in the future. Such customer orders are dependent upon their markets and customers and may be subject to delays or cancellations. As a result of dependence on our key customers, we have experienced and could experience in the future a material adverse effect on our business and results of operations if any of the following were to occur:
• | the loss of any key customer, in whole or in part; |
• | a declining market in which customers reduce orders or demand reduced prices; or |
• | a strike or work stoppage at a key customer facility, which could affect both its suppliers and customers. |
We are subject to price reduction demands from our OEM customers. These price reductions could adversely affect the results of our operations
Downward pricing pressure is a characteristic of the automotive industry, and as with other suppliers to commercial vehicle OEMs, we continue to experience price reduction demands from our customers. In the face of lower prices to customers, we must reduce our operating costs in order to maintain profitability. Whilst we have successfully implemented cost reduction initiatives, we anticipate our customers will continue to pursue aggressive pricing strategies. Customers may also request that we pay for design, engineering and tooling costs that are incurred prior to the start of production and recover these costs through amortization in the price per unit of the applicable component. If the Company is unable to offset customer price reductions through improved operating efficiencies, new manufacturing processes, sourcing alternatives, technology enhancements and other initiatives, if a given program is not launched or is launched with significantly lower volumes than planned, or if we are unable to avoid price reductions from our customers, the results of our operations could be adversely affected.
19
If there are changes in the environmental or other regulations that affect one or more of our current or future products, it could have a negative impact on our business and results of operations.
We are currently subject to various environmental and other regulations in the U.S. and internationally. A risk of environmental liability is inherent in our current and former manufacturing activities. Under certain environmental laws, we could be held jointly and severally responsible for the remediation of any hazardous substance contamination at our past and present facilities and at third party waste disposal sites and could also be held liable for damages to natural resources and any consequences arising out of human exposure to such substances or other environmental damage. While we have a number of proactive programs underway to minimize the impact of the production and use of our products on the environment and believe that we are in substantial compliance with environmental laws and regulations, we cannot predict whether there will be changes in the environmental regulations affecting our products.
Any changes in the environmental and other regulations which affect our current or future products could have a negative impact on our business if we are unable to adjust our product offering to comply with such regulatory changes. In addition, it is possible that we will incur increased costs as a result of complying with environmental regulations, which could have a material adverse effect on our business, results of operations and financial condition.
We may be subject to product liability, warranty and recall claims, which may increase the costs of doing business and adversely affect our business, financial condition and results of operations.
We are subject to a risk of product liability or warranty claims if our products actually or allegedly fail to perform as expected, whether or not due to defective supplier parts, or the use of our products results, or are alleged to result, in bodily injury and/or property damage. While we maintain reasonable limits of insurance coverage to appropriately respond to such exposures, large product liability claims, if made, could exceed our insurance coverage limits and insurance may not continue to be available on commercially acceptable terms, if at all. We may incur significant costs to defend these claims and may not be able to recover related costs from suppliers. We may also experience any product liability losses in the future. In addition, if any of our designed products are or are alleged to be defective, we may be required to participate in recalls and exchanges of such products. In the past five years, our warranty expense has fluctuated between approximately 0.8% and 1.1% of sales on an annual basis. Individual quarters were above or below the annual averages. The future cost associated with providing product warranties and/or bearing the cost of repair or replacement of our products could exceed our historical experience and have a material adverse effect on our business, financial condition and results of operations.
We are required to plan our capacity well in advance of production and our success depends on having available capacity and effectively using it.
We principally compete for new business at the beginning of the development of our customers' new products. Our customers' new product development generally begins significantly prior to the marketing and production of their new products and our supply of our products generally lasts for the life of our customers' products. Nevertheless, our customers may move business to other suppliers or request price reductions during the life cycle of a product. The long development and sales cycle of our new products, combined with the specialized nature of many of our facilities and the resulting difficulty in shifting work from one facility to another, could result in variances in capacity utilization. In order to meet our customers' requirements, we may be required to supply our customers regardless of the actual cost to us and consequently we may suffer an adverse impact on our operating profit margins and results of operations.
We must continue to make technological advances, or we may not be able to successfully compete in our industry.
We operate in an industry in which technological advancements are necessary to remain competitive. Accordingly, we devote substantial resources and collaborate with technology development partners to improve already technologically complex products and to remain a leader in technological innovation. However, if we fail to continue to make technological improvements or our competitors develop technologically superior products, it could have an adverse effect on our operating results or financial condition.
A disruption in our information technology systems including one related to cyber security could pose a risk to the security of our systems, products and services and could adversely affect our business and financial performance.
We rely on the accuracy, capacity and security of our information technology systems. Despite our efforts to protect data or information, our products, services, and systems, and those of our third-party service providers, may be vulnerable to failures, security breaches, theft, misplaced or lost data, programming and/or human errors. A system failure, security breach or error could result in:
• | the unauthorized access, use, disclosure, modification or destruction of information; |
20
• | the compromising of sensitive, confidential or personal data or information, including our intellectual property or trade secrets; |
• | the improper use of our systems, software solutions or networks; and |
• | production downtimes and operational disruptions. |
We may incur significant costs related to the threat of any unauthorized access to or malfunction of our systems, products or services, including but not limited to, costs of protecting our products and systems. To the extent that data is inappropriately used or disclosed, lost, modified or destroyed, our business may be interrupted and we may incur significant costs, fines or penalties related to defective products, regulatory investigations, and litigation. Our reputation and brand names could be materially damaged by the threat or perpetration of cyber crime and the sales of our products and services may decrease. Each of these outcomes could adversely affect our competitive position, relationships with our customers, financial condition and results of operations.
We may not be successful in executing and integrating acquisitions into our operations, which could harm our results of operations and financial condition.
We routinely evaluate potential acquisitions and may pursue acquisition opportunities, some of which could be material to our business. We cannot provide assurance whether we will be successful in pursuing any acquisition opportunities or what the consequences of any acquisition would be. We may encounter various risks in any acquisitions, including:
• | the possible inability to integrate an acquired business into our operations; |
• | diversion of management’s attention; |
• | loss of key management personnel; |
• | unanticipated problems or liabilities; and |
• | increased labor and regulatory compliance costs of acquired businesses. |
Some or all of those risks could impair our results of operations and impact our financial condition. We may finance any future acquisitions from internally generated funds, bank borrowings, public offerings or private placements of equity or debt securities, or a combination of the foregoing. Acquisitions may involve the expenditure of significant funds and management time.
Acquisitions may also require us to increase our borrowings under our bank credit facilities or other debt instruments, or to seek new sources of liquidity. Increased borrowings would correspondingly increase our financial leverage, and could result in lower credit ratings and increased future borrowing costs. These risks could also reduce our flexibility to respond to changes in the industry or in general economic conditions. If we are unable to identify or execute on appropriate opportunities for acquisition, investment or growth, our business could be materially adversely affected.
The Public Company Accounting Oversight Board, or PCAOB, is currently unable to inspect the audit work and practices of auditors operating in Belgium, including our auditor.
Our auditors, Ernst & Young Bedrijfsrevisoren BCVBA/Reviseurs d'Entreprises SCCRL, are registered with the Public Company Accounting Oversight Board (PCAOB). Our auditors, like any other independent registered public accounting firms operating in Belgium, are not yet permitted, because of Belgian regulation impediments, to be subject to inspections by the PCAOB that assess their compliance with U.S. law and professional standards in connection with performance of audits of financial statements filed with the SEC. As a result, our investors may not realize the potential benefits of such inspections.
Risks Relating to the Separation
We are responsible for certain of Trane's contingent and other corporate liabilities.
Under the Indemnification and Cooperation Agreement, the Separation and Distribution Agreement and the Tax Sharing Agreement, our wholly-owned subsidiary WABCO Europe BVBA has assumed and is responsible for certain contingent liabilities related to Trane's business (including certain associated costs and expenses, whether arising prior to, at or after the Distribution) and will indemnify Trane for these liabilities. Among the contingent liabilities against which we will indemnify Trane and the other indemnities, are liabilities associated with certain non-U.S. tax liabilities and certain U.S. and non-U.S. environmental liabilities associated with certain Trane entities.
Risks Relating to Our Common Stock
21
Your percentage ownership in WABCO may be diluted in the future.
Your percentage ownership in WABCO may be diluted in the future because of equity awards that have already been granted and that we expect will be granted to our directors and officers in the future under our Omnibus Incentive Plan. In addition, we may in the future issue additional equity securities in order to fund working capital needs, capital expenditures and product development, or to make acquisitions and other investments, which may dilute your ownership interest.
We cannot assure you that we will repurchase shares or pay any dividends.
While we have historically returned value to shareholders in the form of share repurchases and/or dividends, our ability to repurchase shares and pay dividends is limited by available cash, contingent liabilities and surplus. Moreover, all decisions regarding the declaration and payment of dividends and share repurchases will be at the sole discretion of our Board and will be evaluated from time to time in light of our financial condition, earnings, capital requirements of our business, covenants associated with certain debt obligations, legal requirements, regulatory constraints, industry practice and other factors that our Board deems relevant.
Our shareholder rights plan and provisions in our amended and restated certificate of incorporation and amended and restated by-laws, and of Delaware law may prevent or delay an acquisition of our company, which could decrease the trading price of our common stock.
Our amended and restated certificate of incorporation, amended and restated by-laws and Delaware law contain provisions that are intended to deter coercive takeover practices and inadequate takeover bids by making such practices or bids unacceptably expensive to the raider and to encourage prospective acquirers to negotiate with our Board of Directors rather than to attempt a hostile takeover. These provisions include, among others:
• | a Board of Directors that is divided into three classes with staggered terms; |
• | elimination of the right of our shareholders to act by written consent; |
• | rules regarding how shareholders may present proposals or nominate directors for election at shareholder meetings; |
• | the right of our Board to issue preferred stock without shareholder approval; and |
• | limitations on the right of shareholders to remove directors. |
Delaware law also imposes some restrictions on mergers and other business combinations between us and any holder of 15% or more of our outstanding common stock.
On July 13, 2007, our Board adopted a shareholder rights plan, which provides, among other things, that when specified events occur, our shareholders will be entitled to purchase from us a newly created series of junior preferred stock. The preferred stock purchase rights are triggered by the earlier to occur of (i) ten business days (or a later date determined by our Board of Directors before the rights are separated from our common stock) after the public announcement that a person or group has become an “acquiring person” by acquiring beneficial ownership of 15% or more of our outstanding common stock or (ii) ten business days (or a later date determined by our Board before the rights are separated from our common stock) after a person or group begins a tender or exchange offer that, if completed, would result in that person or group becoming an acquiring person. The issuance of preferred stock pursuant to the shareholder rights plan would cause substantial dilution to a person or group that attempts to acquire us on terms not approved by our Board of Directors. The shareholder rights plan expires on July 16, 2017.
We believe these provisions protect our shareholders from coercive or otherwise unfair takeover tactics by requiring potential acquirers to negotiate with our Board and by providing our Board with more time to assess any acquisition proposal. These provisions are not intended to make our company immune from takeovers. However, these provisions apply even if the offer may be considered beneficial by some shareholders and could delay or prevent an acquisition that our Board determines is not in the best interests of our shareholders and our company.
ITEM 1B. UNRESOLVED STAFF COMMENTS
None.
22
ITEM 2. PROPERTIES
As of February 17, 2017, our manufacturing activities are located at 27 sites in 13 countries.
Site Location | Major Products Manufactured at Location | |
Campinas, Brazil | Vehicle control systems | |
Jinan, China (2 plants) | Braking systems and compressors | |
Qingdao, China | Braking systems | |
Taishan, China | Foundation brakes | |
Claye-Souilly, France | Vehicle control systems | |
Hanover, Germany | Vehicle control systems | |
Gronau, Germany | Compressors and hydraulics | |
Mannheim, Germany | Foundation brakes | |
Ambattur, India | Vehicle control systems | |
Jamshedpur, India | Vehicle control systems | |
Mahindra World City, India | Vehicle control systems | |
Pantnagar, India | Vehicle control systems | |
Lucknow, India | Vehicle control systems | |
Pyungtaek, Korea | Braking systems | |
Stanowice, Poland | Remanufactured products | |
Wroclaw, Poland (2 plants) | Vehicle control systems | |
Miass, Russia | Actuators and foundation brakes | |
Rayong, Thailand | Actuators and foundation brakes | |
Charleston, United States | Air compressors and braking system components | |
Rochester Hills, United States | Remanufactured products | |
North Mankato, United States | Braking systems | |
Nogales, United States | Braking systems | |
Pershore, United Kingdom | Braking systems | |
Empalme, Mexico | Braking systems | |
Toronto, Canada | Aerodynamic products | |
We own all of the plants described above, except for Jinan, China; Taishan, China; Stanowice, Poland; Miass, Russia; Rayong, Thailand; Rochester Hills, U.S.; Charleston, U.S.; Nogales, U.S.; and Empalme, Mexico which are leased. Our properties are generally in good condition, are well maintained, and are generally suitable and adequate to carry out our business. In 2016, the manufacturing plants, taken as a whole, met our capacity needs.
We also own or lease warehouse and office space for administrative and sales staff. Our headquarters, located in Brussels, Belgium, and our executive offices, located in Rochester Hills, Michigan, are leased.
ITEM 3. LEGAL PROCEEDINGS
We may be party to a variety of legal proceedings with respect to environmental related, employee related, product related, and general liability and automotive litigation related matters that arise in the normal course of our business. While the results of these legal proceedings cannot be predicted with certainty, management believes that the final outcome of these proceedings will not have a material adverse effect on our combined results of operations or financial position. For more information on current legal proceedings, refer to Note 15 of Notes to the Consolidated Financial Statements.
ITEM 4. MINE SAFETY DISCLOSURES
None.
23
ITEM 4A. EXECUTIVE OFFICERS OF THE REGISTRANT
The following sets forth certain information as of February 17, 2017 with respect to each person who is an executive officer of the Company:
Name | Age | Position(s) |
Jacques Esculier | 57 | Chairman of the Board of Directors and Chief Executive Officer |
Prashanth Mahendra-Rajah | 47 | Chief Financial Officer |
Mazen Mazraani | 48 | Chief Human Resources Officer |
Nicolas Bardot | 45 | Chief Supply Chain Officer |
Lisa Brown | 38 | Chief Legal Officer and Secretary |
Jorge Solis | 44 | President, Truck, Bus & Car OEMs |
Nick Rens | 52 | President, Trailer Systems, Aftermarket & Off-Highway |
Sean Deason | 45 | Vice President, Controller and Assistant Secretary |
Each officer of the Company is appointed by the Board of Directors to a term of office expiring on the date of the first Board meeting after the Annual Meeting of Shareholders next succeeding his or her appointment or such officer's earlier resignation or removal.
Jacques Esculier has served as our Chief Executive Officer and director since July 2007. In May 2009, he was appointed Chairman of our Board of Directors. Prior to July 2007, Mr. Esculier served as Vice President of Trane and President of its Vehicle Control Systems business, a position he had held since January 2004. Prior to holding that position, Mr. Esculier served in the capacity of Business Leader for the Trane Commercial Systems' Europe, Middle East, Africa, India & Asia Region from 2002 through January 2004. Prior to joining Trane in 2002, Mr. Esculier spent more than six years in leadership positions at AlliedSignal/Honeywell. He was Vice President and General Manager of Environmental Control and Power Systems Enterprise based in Los Angeles, and Vice President of Aftermarket Services-Asia Pacific based in Singapore.
Prashanth Mahendra-Rajah has served as our Chief Financial Officer since June 2014. Prior to joining WABCO, Mr. Mahendra-Rajah served as Corporate Vice President and Segment CFO for the Silicon Systems Group, a division of Applied Materials, from April 2012. Prior to this, Mr. Mahendra-Rajah served as Vice President Finance, Head of Global Planning & Reporting for Visa for two years. Before then, Mr. Mahendra-Rajah spent 12 years at United Technologies where he served as Vice President, Finance, Planning and Analysis, UTC Fire and Security and Vice President and Chief Financial Officer, Building Systems and Services, Carrier Corporation.
Mazen Mazraani has served as our Chief Human Resources Officer since September 2016, having served as our Interim Chief Human Resources Officer since October 2015. Prior to this, Mr. Mazraani served as our Compensation and Benefits Leader, a position he had held since November 2008, and as our Compensation & Benefits Manager from June 2007 when he joined WABCO. Before joining WABCO, Mr. Mazraani served as Head of Compensation & Benefits for Dexia, a Belgian-French Bank specialized in public financing. Before taking up his in-house roles, Mr Mazraani worked for 7 years as a tax consultant at Coopers & Lybrand and Ernst & Young. Graduated in Journalism and Communication from Brussels University, he holds a Bachelors degree in Business Administration and a Master in Tax Management from Solvay Business School in Brussels.
Nicolas Bardot was appointed as our Chief Supply Chain Officer in September 2016. Prior to this, Mr. Bardot served as our Vice President, Sourcing and Purchasing, since September 2013. Prior to holding this position, Mr. Bardot was our Strategic Purchasing Leader since joining WABCO in November 2011. Prior to joining WABCO, Mr. Bardot worked in France, the Czech Republic and China, and was a business purchasing leader for Valeo Group, a global automotive supplier. Overall, he has gained more than 17 years of experience in positions of increasing responsibility within sourcing and business management. Mr. Bardot holds a Master’s degree in Purchasing and Supply Chain Management from ESSEC Business School and completed executive training in business administration and management at INSEAD, both located in Paris, France.
Lisa Brown has served as our Chief Legal Officer and Secretary since June 2016 after holding the role of Vice President, Legal and Secretary since April 2015. Prior to this, Ms. Brown served as our Senior Legal Counsel since February 2012. Prior to joining WABCO, Ms. Brown served as Legal Director and Company Secretary since March 2011 for the largest pet care retailer in the United Kingdom. From 2006 to 2011, she held various legal leadership roles for SSL International Plc, one the world’s leading providers of consumer healthcare products. Ms. Brown held the position of Group Head of Legal and Intellectual Property and was responsible for creating and driving legal strategy and risk management across the global operations, including research and development, manufacturing, and sales. Before taking up her in-house roles, Ms. Brown worked in private practice as an
24
Intellectual Property Attorney specializing in brand and copyright protection. Ms. Brown is a registered trademark attorney. She holds a Bachelor of Laws degree, as well as a Diploma in Legal Practice from Nottingham Law School in Nottingham, United Kingdom.
Jorge Solis has served as our President, Truck, Bus & Car OEMs since September 2016, adding to his existing role as Vice President, Vehicle Dynamics and Controls, which he has held since September 2015. Previously, Mr. Solis served as Vice President, Driveline and Suspension Controls, from September 2013, and as Vice President, Sourcing and Purchasing, from October 2011. Prior to this, Mr. Solis served as our Strategic Purchasing Leader, a role he had held since joining WABCO in August 2010. Prior to joining WABCO, Mr. Solis worked in Mexico, the United States and France, and was a business purchasing leader for Valeo Group. Overall, he has gained more than 20 years of experience in positions of increasing responsibility within sourcing, quality, manufacturing, and business management. Mr. Solis holds a Master’s degree in engineering from Technical University in Monterrey (ITESM), Mexico. In addition, he completed educational programs in international marketing at ITESM, as well as executive training in business administration and management at INSEAD.
Nick Rens has served as our President, Trailer Systems, Aftermarket & Off-Highway since July 2014. Prior to this, Mr. Rens served as our Vice President, Aftermarket since November 2008. This was in addition to his role as Vice President, Trailer Systems, a role which he had held since 2005. He also assumed the role of Vice President, Driveline Controls, from January 2013 to September 2013. Previously, Mr. Rens worked for three years as our regional trailer sales leader for southern and western Europe based in Claye Souilly, France. Since 1999, Mr. Rens has also been Managing Director of WABCO Belgium where he held several sales leadership roles both in the Aftermarket and Original Equipment sales organizations. Mr. Rens has worked at the Company for almost his entire career, having joined the Company in 1989 as a product line specialist.
Sean Deason has served as our Vice President, Controller and Assistant Secretary since June 2015. Prior to joining WABCO, Mr. Deason spent 4 years with Evraz N.A. where he served as Vice President, Financial Planning & Analysis. Prior to Evraz, Mr. Deason spent 12 years with Lear Corporation where he served as Director, Finance, Corporate Business Planning & Analysis, Director, Finance, Asia Pacific Operations, Assistant Treasurer, and held various other positions of increasing responsibility from August 1999. Mr. Deason is a Certified Management Accountant.
25
PART II
ITEM 5. | MARKET FOR THE REGISTRANT'S COMMON EQUITY, RELATED STOCKHOLDER MATTERS AND ISSUER PURCHASES OF EQUITY SECURITIES |
Our common stock is listed on NYSE under the symbol “WBC”. Our Certificate of Incorporation, as amended, authorizes the Company to issue up to 400,000,000 shares of common stock, par value $.01 per share, and 4,000,000 shares of preferred stock, par value $.01 per share, all of which have been designated by our Board of Directors as a series of Junior Participating Cumulative Preferred Stock. We also have a rights agreement. Pursuant to the rights agreement, when triggered in certain takeover situations, one preferred stock purchase right will be issued for each outstanding share of our common stock.
We estimate that there are approximately 379 holders of record of the Company's common stock. A significant number of the outstanding shares of common stock which are beneficially owned by individuals or entities are registered in the name of a nominee of The Depository Trust Company, a securities depository for banks and brokerage firms. As of February 6, 2017, there were 51,213 beneficial owners of our common stock.
We have not declared or paid any cash dividends in 2016 or 2015. Our last cash dividend was paid ($0.07 per share) in the first quarter of 2009. We continuously consider ways to return capital to our stockholders, either through our open market repurchase program and/or through the payment of cash dividends.
Set forth below are the high and low sales prices for shares of our common stock for each quarterly period of 2016 and 2015.
2016 | 2015 | ||||||||||||||
High | Low | High | Low | ||||||||||||
First quarter | $ | 108.78 | $ | 81.66 | $ | 122.53 | $ | 92.86 | |||||||
Second quarter | 115.15 | 85.16 | 133.31 | 118.73 | |||||||||||
Third quarter | 113.85 | 84.48 | 126.39 | 100.34 | |||||||||||
Fourth quarter | 114.16 | 96.10 | 115.80 | 95.60 | |||||||||||
ISSUER PURCHASES OF EQUITY SECURITIES
Our Board of Directors has approved an open market stock repurchase program consisting of the following share repurchase program authorizations as also discussed in Note 6 of Notes to Consolidated Financial Statements:
(Amounts in millions) | ||||||||
Date of authorization | Authorized amount | Date of commencement | Date of expiration | |||||
May 26, 2011 | $ | 400.0 | June 1, 2011 | May 31, 2013 | ||||
October 26, 2012 | 400.0 | October 26, 2012 | December 31, 2014 | |||||
October 29, 2013 | 200.0 | October 29, 2013 | December 31, 2014 | |||||
December 5, 2014 | 500.0 | December 5, 2014 | December 31, 2016 | |||||
December 2, 2016 | 600.0 | January 1, 2017 | December 31, 2018 | |||||
A summary of the repurchase activity for 2016 is as follows:
26
Period | Total Number of Shares Purchased (a) | Average price Paid per Share | Total Number of Shares Purchased as Part of Publicly Announced Plans or Programs (a) | Maximum Dollar Value of Shares that May Yet Be Purchased Under the Plans or Programs (a) | |||||||||
Total through December 31, 2015 | 15,783,712 | $ | 77.36 | 15,783,712 | $ | 250,810,529 | |||||||
January 1 - January 31 | 280,000 | 280,000 | |||||||||||
February 1 - February 29 | 225,000 | 225,000 | |||||||||||
March 1 - March 31 | 177,000 | 177,000 | |||||||||||
Total first quarter | 682,000 | $ | 91.64 | 682,000 | $ | 188,308,930 | |||||||
April 1 - April 30 | 10,800 | 10,800 | |||||||||||
May 1 - May 31 | 269,900 | 269,900 | |||||||||||
June 1 - June 30 | 345,500 | 345,500 | |||||||||||
Total second quarter | 626,200 | $ | 102.63 | 626,200 | $ | 124,040,499 | |||||||
July 1 - July 31 | 111,000 | 111,000 | |||||||||||
August 1 - August 31 | 299,000 | 299,000 | |||||||||||
September 1 - September 30 | 185,000 | 185,000 | |||||||||||
Total third quarter | 595,000 | $ | 102.07 | 595,000 | $ | 63,308,241 | |||||||
October 1 - October 31 | 51,000 | 51,000 | |||||||||||
November 1 - November 30 | 359,000 | 359,000 | |||||||||||
December 1 - December 31 | 199,000 | 199,000 | |||||||||||
Total fourth quarter | 609,000 | $ | 102.60 | 609,000 | $ | — | |||||||
Total through December 31, 2016 | 18,295,912 | $ | 80.40 | 18,295,912 | $ | — | |||||||
(a) Relates to the approved share repurchase programs as discussed above.
All share repurchases were effected in accordance with the safe harbor provisions of Rule 10b-18 of the Exchange Act.
27
PERFORMANCE GRAPH
The following graph and table compare the cumulative total shareholder's return on our common stock from December 31, 2011 through December 31, 2016, with the Standard & Poor's 500 Index and the Standard & Poor's Auto Parts & Equipment Index. The graph and table use data supplied by S&P Capital IQ.
The comparisons reflected in the graph and table are not intended to forecast the future performance of the common stock and may not be indicative of such future performance.
Total Shareholder Returns
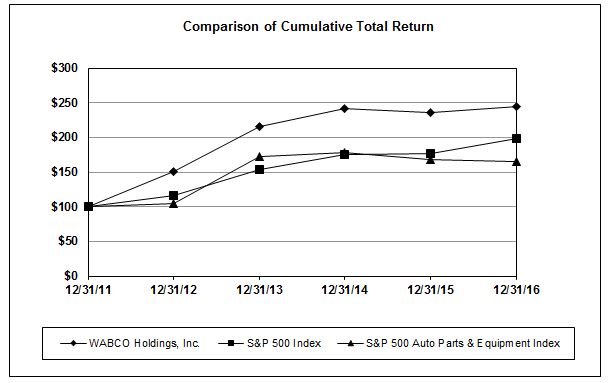
12/31/2011 | 12/31/2012 | 12/31/2013 | 12/31/2014 | 12/31/2015 | 12/31/2016 | |
WABCO Holdings Inc. | 100 | 150.21 | 215.23 | 241.43 | 235.62 | 244.59 |
S&P 500 Index | 100 | 116.00 | 153.57 | 174.60 | 177.01 | 198.18 |
S&P 500 Auto Parts & Equipment Index | 100 | 104.45 | 172.09 | 178.41 | 168.33 | 164.62 |
28
ITEM 6. | SELECTED FINANCIAL DATA |
(Amounts in millions, except share and per share data) | Year Ended December 31, | |||||||||||||||||||
2016 | 2015 | 2014 | 2013 | 2012 | ||||||||||||||||
Income Statement Data: | ||||||||||||||||||||
Sales | $ | 2,810.0 | $ | 2,627.5 | $ | 2,851.0 | $ | 2,720.5 | $ | 2,477.4 | ||||||||||
Cost of sales | 1,925.0 | 1,797.2 | 1,968.3 | 1,906.2 | 1,732.0 | |||||||||||||||
Streamlining expenses | 10.9 | 44.8 | 11.0 | 5.2 | 5.2 | |||||||||||||||
Gross profit | 874.1 | 785.5 | 871.7 | 809.1 | 740.2 | |||||||||||||||
Costs and expenses: | ||||||||||||||||||||
Selling and administrative expenses | 372.2 | 344.7 | 370.8 | 345.1 | 300.5 | |||||||||||||||
Product engineering expenses | 135.2 | 139.5 | 145.0 | 119.4 | 104.3 | |||||||||||||||
Streamlining expenses | 5.5 | 23.7 | 16.0 | 7.7 | 7.7 | |||||||||||||||
Other operating expense, net | 5.3 | 6.7 | 8.9 | 5.0 | 3.2 | |||||||||||||||
Operating income | 355.9 | 270.9 | 331.0 | 331.9 | 324.5 | |||||||||||||||
European Commission fine reimbursement | — | — | — | 279.5 | — | |||||||||||||||
Equity income of unconsolidated joint ventures | 24.8 | 32.1 | 23.8 | 17.7 | 18.1 | |||||||||||||||
Other non-operating income/(expense), net | 1.1 | 1.6 | 1.8 | 6.9 | (5.0 | ) | ||||||||||||||
Interest (expense)/income, net | (12.7 | ) | (7.1 | ) | 0.2 | 4.9 | (1.5 | ) | ||||||||||||
Income before income taxes | 369.1 | 297.5 | 356.8 | 640.9 | 336.1 | |||||||||||||||
Income tax expense/(benefit) | 121.8 | 11.5 | 55.6 | (21.0 | ) | 23.6 | ||||||||||||||
Net income including noncontrolling interests | 247.3 | 286.0 | 301.2 | 661.9 | 312.5 | |||||||||||||||
Less: net income attributable to noncontrolling interests | 24.3 | 10.8 | 9.7 | 8.7 | 10.5 | |||||||||||||||
Net income | $ | 223.0 | $ | 275.2 | $ | 291.5 | $ | 653.2 | $ | 302.0 | ||||||||||
Per share: | ||||||||||||||||||||
Basic | $ | 4.00 | $ | 4.76 | $ | 4.87 | $ | 10.46 | $ | 4.73 | ||||||||||
Diluted | $ | 3.98 | $ | 4.72 | $ | 4.81 | $ | 10.31 | $ | 4.62 | ||||||||||
Average number of outstanding common shares: | ||||||||||||||||||||
Basic | 55,695,738 | 57,768,018 | 59,907,763 | 62,474,493 | 63,906,992 | |||||||||||||||
Diluted | 55,981,816 | 58,274,987 | 60,546,454 | 63,382,564 | 65,323,389 | |||||||||||||||
Balance Sheet Data (at end of period): | ||||||||||||||||||||
Total assets | $ | 3,056.0 | $ | 2,589.9 | $ | 2,432.7 | $ | 2,392.8 | $ | 1,747.0 | ||||||||||
Total debt | $ | 959.1 | $ | 503.7 | $ | 315.2 | $ | 87.1 | $ | 76.2 | ||||||||||
Total shareholders' equity | $ | 701.4 | $ | 786.7 | $ | 841.6 | $ | 1,152.8 | $ | 676.4 | ||||||||||
Cash dividends per common share | $ | — | $ | — | $ | — | $ | — | $ | — | ||||||||||
For a comparative analysis of certain line items in the Income Statement Data section of this table, see Item 7. “Management's Discussion and Analysis of Financial Condition and Results of Operations” which follows.
29
ITEM 7. | MANAGEMENT'S DISCUSSION AND ANALYSIS OF FINANCIAL CONDITION AND RESULTS OF OPERATIONS |
This discussion summarizes the significant factors affecting the results of operations and financial condition of WABCO during the years ended December 31, 2016, 2015 and 2014 and should be read in conjunction with our consolidated financial statements and related notes thereto included elsewhere herein. Certain information in this discussion and analysis regarding industry outlook, our expectations regarding the future performance of our business and other non-historical statements are forward-looking statements. These forward-looking statements are subject to numerous risks and uncertainties, including, but not limited to, the risks and uncertainties described in “Risk Factors” above. Our actual results may differ materially from those contained in any forward-looking statements. You should read the following discussion together with the sections entitled “Risk Factors”, “Information Concerning Forward-Looking Statements”, “Selected Financial Information”, “Liquidity and Capital Resources” and consolidated financial statements and related notes thereto included elsewhere herein.
Executive Overview
In 2016, WABCO continued to strongly outperform the global market. During this year, global production of trucks and buses greater than six tons increased by an estimated 6% globally, primarily driven by a 27% increase in China where, unfortunately, the available content-per-vehicle for our products is still the lowest across all regions. WABCO's sales during the full year 2016 increased by 6.9% (8.7% excluding foreign currency translation effects) compared with 2015, of which 1.9% was contributed by our acquisitions both on a reported basis and excluding foreign currency translation effects. Our global aftermarket sales increased by 4.9% (6.3% excluding foreign currency translation effects) over this same period.
WABCO is the first supplier of advanced emergency braking systems (AEBS) homologated in Europe in accordance with European Union regulations. WABCO's OnGuardACTIVE™ AEBS for trucks and buses complies with European Union regulations that went into effect in 2016. It detects moving, stopping and stationary vehicles ahead. It alerts the driver via acoustic, visual and haptic signals. OnGuardACTIVE autonomously applies the brakes and can bring the vehicle to a complete stop, helping to prevent or mitigate rear-end collisions.
The European Union also enforced during 2016 a mandated lane departure warning systems (LDWS) on new commercial vehicles. This new regulation is addressed by WABCO’s OnLane™, our camera-based LDWS technology. Once it detects unintended lane drift, OnLane prompts the driver via acoustic, visual and haptic signals to take corrective measures. It also features an advanced option to warn against driver drowsiness.
Also, all commercial vehicle manufacturers in India relied on WABCO’s test track located in Chennai to homologate anti-lock braking systems (ABS) to comply with the new national ABS regulation that was implemented in Q4 2015 for trucks weighing more than 12 tons and buses above 5 tons. This regulation, combined with our strong market leader position, contributed to outperformance in the first three quarters of 2016.
In 2016 - among other major accomplishments - we completed acquisitions, formed new alliances and announced breakthrough technologies. We also continued to expand and enrich our portfolio of differentiated capabilities that improve the safety, efficiency and connectivity of commercial vehicles.
Also in 2016, we announced our OnCity™ Urban Turning Assist system concept, the Company's breakthrough technology to help protect pedestrians and cyclists in city traffic. OnCity, a unique and convenient single-sensor solution invented by WABCO, is the commercial vehicle industry's first collision avoidance system that uses LiDAR technology for the purpose of object detection. Innovatively engineered for trucks, buses and tractor-trailers, it also delivers the industry's widest field-of-view - up to 180 degrees - using a single sensor for safety monitoring to help protect vulnerable road users located on the vehicle's blindside.
WABCO continued to deliver strong profitability throughout 2016. WABCO's Operating System continued to provide fast and flexible responses to major market changes, delivering $83.0 million of materials and conversion productivity. Gross materials productivity in 2016 represented 5.5% of total materials cost with the impact of commodity deflation increasing net materials productivity to 5.9%. This commodity deflation covers the cost reduction of U.S. Dollar denominated commodities, more than offset by the increase of the U.S. Dollar versus most of the currencies that we purchase in. Conversion productivity in our factories in 2016 represented 7.0%, a new annual record for WABCO.
The corporate tax environment globally has been subject to review and discussion over recent years, including at both the U.S. and European level and by international bodies such as the Organization for Economic Co-operation and Development (OECD). Against this background, the European Commission has launched several investigations into tax laws and arrangements
30
within several European countries. The European Commission has used its powers under State Aid control to address fiscal laws in some European countries, Belgium being one of them.
The Belgian Tax Code contains provisions to reduce the taxable base of companies, through rulings granted by the Belgian Government under the excess profit ruling (EPR) program. The EPR program has been part of Belgian law since 2004. We understand approximately 35 companies of varying size, activities and geographical operations participate in the EPR program.
On January 11, 2016, the European Commission ruled that the EPR program permitted under Belgian law is illegal and incompatible with European State Aid law (hereinafter referred to as the "Decision"). As a result, the European Commission requires Belgium to stop applying the EPR program and to recover all past tax benefits received by applicable companies under the program (i.e. a “clawback”). The Company recorded an income tax provision of $69.3 million during 2016 with respect to the clawback of the tax benefits obtained under the EPR program for tax years 2012 to 2014. This income tax provision did not have any cash impact because the Company had net operating losses available to deduct against the incremental taxable profit.
The Belgium Government has announced that it has submitted an appeal of the Decision to the General Court of the European Union (General Court). During Q3 2016 the Company submitted a separate appeal, since it is directly affected by the Decision. The European Commission responded rejecting the arguments in the Company’s Appeal in December 2016. The Company provided its Reply in January 2017. If the appeal is successful, the EPR tax reserve of $69.3 million may be entirely or partly reversed. The income tax provision of $69.3 million provision consists of $86.4 million established during Q1 2016 which was reduced by $17.1 million during Q3 2016 as a result of filing the 2015 Belgian tax return without claiming the EPR benefit.
The Company is actively considering ways to mitigate the impact of the Decision including whether it would be eligible to claim a Patent Income Deduction (PID) tax relief.
After several months of discussions with the Belgian government, on July 12, 2016, WABCO received a ruling from the Belgium Government confirming that it may claim a PID tax relief for both 2015 and 2016. The benefit for 2016 remains within our 2016 provision and the benefit for 2015 was recognized for the first time in Q3 2016 upon filing the Belgium tax return. We are currently exploring whether a PID would be available in 2013 and 2014. We will only recognize the PID benefits related to prior years when it is probable that they can be claimed and amended tax returns have been submitted to the Belgium tax authorities.
The PID program has been available in Belgium for many years to provide an incentive to carry out research and development activities in Belgium. It is available to all corporate tax payers and has been recently amended in order to give effect to the OECD's Base Erosion and Profit Shifting (BEPS) initiatives and to other parallel discussions. It has been announced that the existing PID program will expire at the end of June 2021. WABCO should be able to qualify for the PID until this date. A replacement patent income program has been introduced in Belgium with effect from July 2016 that WABCO could potentially qualify for after July 2021. Our current assessment is that the requirements of the new patent income program could materially reduce the amount of tax relief we are able to claim in Belgium from July 2021.
Our Markets and Our Customers
Our sales are affected by changes in truck and bus (T&B) production. Europe is our largest geographic market and sales to T&B OEMs represent our largest customer group. The table below shows the relationship between our sales to European T&B OEMs, which include aftermarket parts and account for approximately 52% of our global sales to T&B OEMs, and European T&B production for the last five years. Sales data is shown at a constant Euro to U.S. Dollar exchange rate for year to year comparability and to make comparisons to unit production meaningful. Over the past five years, our sales have outperformed the rate of European T&B production by an average of 4% per year.
Year to Year Change | 2012 | 2013 | 2014 | 2015 | 2016 | ||||||||||
Sales to European T&B OEMs (at constant FX rates) | (10 | )% | 13 | % | (7 | )% | 8 | % | 8 | % | |||||
European T&B Production | (9 | )% | 5 | % | (9 | )% | 6 | % | 1 | % | |||||
In general, our sales track directionally with T&B builds. However, individual year to year sales changes are also influenced by other factors such as timing of orders and deliveries to T&B OEM customers, application content, new product introduction, price and introduction of new customer platforms. The level of truck build activity is influenced by general economic conditions, including interest rate levels and inflation.
31
Our aftermarket sales account for approximately 25% of total sales and are affected by a variety of factors: content on specific vehicles and breadth of our product range, number of commercial trucks in active operation, truck age, type of vehicles built, miles driven, demand for transported goods and overall economic activity. On average, our aftermarket sales (based on a constant exchange rate to the U.S. Dollar rate) have grown by 7% annually for the last five years as shown in the table below.
Year to Year Change | 2012 | 2013 | 2014 | 2015 | 2016 | Average Change | ||||||
Aftermarket Sales (at constant FX rates) | 8 | % | 5 | % | 5 | % | 13 | % | 6 | % | 7 | % |
Distribution of WABCO's Sales by Major End-Markets, Product Types and Geography
2016 | 2015 | 2014 | ||||||
Major End-Markets | ||||||||
OE Manufacturers: | ||||||||
Truck & Bus products | 59 | % | 57 | % | 60 | % | ||
Trailer products | 10 | % | 11 | % | 10 | % | ||
Car products | 6 | % | 6 | % | 4 | % | ||
Aftermarket | 25 | % | 26 | % | 26 | % | ||
100 | % | 100 | % | 100 | % | |||
Geography: | ||||||||
Europe | 54 | % | 56 | % | 59 | % | ||
North America | 14 | % | 17 | % | 13 | % | ||
South America | 3 | % | 3 | % | 6 | % | ||
Asia | 24 | % | 22 | % | 19 | % | ||
Other | 5 | % | 2 | % | 3 | % | ||
100 | % | 100 | % | 100 | % | |||
Our largest customer is Daimler, which accounts for approximately 10% of our sales. Other key customers include Volvo, Ashok Leyland, BMW, China National Heavy Truck Corporation (CNHTC), Cummins, Fiat (Iveco), Hino, Hyundai, Krone, MAN Nutzfahrzeuge AG (MAN), Meritor, Meritor WABCO (a joint venture), Paccar (DAF Trucks N.V. (DAF), Kenworth, Leyland and Peterbilt), First Automobile Works, Otto Sauer Achsenfabrik (SAF), Scania, Schmitz Cargobull AG, TATA Motors and ZF Friedrichshafen AG (ZF). For the fiscal years ended December 31, 2016, 2015 and 2014, our top 10 customers accounted for approximately 44%, 48% and 54% of our sales, respectively.
32
Results of Operations
Approximately 86% of our sales are outside the United States and therefore, changes in exchange rates can have a significant impact on the reported results of our operations, which are presented in U.S. Dollars. Year-over-year changes in sales and expenses for 2016 compared with 2015 and 2015 compared with 2014 are presented both with and without the effects of foreign currency translation. Changes in sales and expenses excluding foreign exchange effects are calculated using current year sales and expenses translated at prior year exchange rates. Presenting changes in sales and expenses excluding the effects of foreign currency translation is not in conformity with U.S. Generally Accepted Accounting Principles (U.S. GAAP), but we analyze this data because it is useful to us in understanding the operating performance of our business. We believe this data is also useful to shareholders for the same reason. The changes in sales and expenses excluding the effects of foreign exchange translation are not meant to be a substitute for measurements prepared in conformity with U.S. GAAP, nor to be considered in isolation. Management believes that presenting these non-U.S. GAAP financial measures is useful to shareholders because it enhances their understanding of how management assesses the operating performance of the Company's business.
Results of Operations for 2016 Compared with 2015
The following table is a summary of sales, cost of sales, gross profit, operating expenses and other selected results of operations for the periods indicated.
Year ended December 31, | Excluding Foreign Exchange Translation ** | ||||||||||||||||
(Amounts in millions) | 2016 | 2015 | % change reported | 2016 adjusted amount | % change adjusted | ||||||||||||
Sales | $ | 2,810.0 | $ | 2,627.5 | 6.9 | % | $ | 2,855.7 | 8.7 | % | |||||||
Cost of sales | 1,935.9 | 1,842.0 | 5.1 | % | 1,967.8 | 6.8 | % | ||||||||||
Gross profit | 874.1 | 785.5 | 11.3 | % | 887.9 | 13.0 | % | ||||||||||
Operating expenses | 518.2 | 514.6 | 0.7 | % | 524.9 | 2.0 | % | ||||||||||
Equity in net income of unconsolidated joint ventures | 24.8 | 32.1 | (22.7 | )% | 24.8 | (22.7 | )% | ||||||||||
Interest expense, net | (12.7 | ) | (7.1 | ) | 78.9 | % | (12.5 | ) | 76.1 | % | |||||||
Income tax expense | 121.8 | 11.5 | * | 118.2 | * | ||||||||||||
Net income attributable to noncontrolling interests | 24.3 | 10.8 | 125.0 | % | 24.6 | 127.8 | % | ||||||||||
* Percentage change not considered meaningful
** Amounts translated using 2015 average exchange rates for comparability
Sales
Our sales for 2016 were $2,810.0 million, an increase of 6.9% (8.7% excluding foreign currency translation effects) from $2,627.5 million in 2015. The increase, excluding foreign currency translation effects, was mainly driven by increased WABCO content per vehicle. Contribution from market growth was limited since there was a strong growth in markets with limited content per vehicle and a severe drop in the U.S. which is a market with high content per vehicle.
Total sales in Europe, our largest market, increased 6.3% (6.3% excluding foreign currency translation effects) for the full year 2016, where the vehicle production of European OEMs above six tons was up 1% in year on year comparison. The sales growth was primarily driven by increased content per vehicle from further ramp-up of air disc brakes (ADB) at a key customer as well as from the advanced emergency braking systems (AEBS) mandate and an increase of our market share of automated manual transmission (AMT).
Sales in North America decreased 6.2% (3.7% excluding foreign currency translation effects), primarily driven by the estimated 18% decrease in production of new trucks and buses greater than six tons, partially offset by our acquired companies MICO and LCL. Total sales in South America decreased 1.3% (increased 5.3% excluding foreign currency translation effects). While the estimated production of new trucks and buses decreased 15%, the impact from the declining markets was more than offset by strong aftermarket sales and increased value per vehicle.
Total sales in Asia increased 18.9% (21.6% excluding foreign currency translation effects) and outperformed the market, driven primarily by increases in WABCO content per vehicle in all key markets alongside the ABS mandate for light and medium
33
duty trucks in China and the ABS mandate in India. The strongest contributor to vehicle production growth was China with an estimated 27% increase in truck and bus production, followed by India. This was partially offset by downward trends in Japan and South Korea in production of new trucks and buses greater than six tons. Sales in China increased 23.9% (31.5% excluding foreign currency translation effects), India increased 23.6% (29.6% excluding foreign currency translation effects), Japan decreased 14.7% (3.0% excluding foreign currency translation effects), and South Korea decreased 9.0% (6.6% excluding foreign currency translation effects).
WABCO's global aftermarket sales, included in the geographic numbers provided above, increased 4.9% (6.3% excluding foreign currency translation effects). This increase, excluding foreign currency translation effects, demonstrates the continued success of the Company's aftermarket strategies.
Cost of Sales and Gross Profit
Within cost of sales, our largest expense is material costs, which mainly represents the purchase of components and parts. Our continued focus on productivity generated 5.5% of material savings before the impact of commodity deflation, which had a positive impact of 0.4%, bringing net materials productivity to 5.9% for the year.
(Amounts in millions) | Cost of Sales | Gross Profit | |||||
Cost of sales / gross profit for the year ended December 31, 2015 | $ | 1,842.0 | $ | 785.5 | |||
Increase/(decrease) due to: | |||||||
Sales price reductions | — | (46.6 | ) | ||||
Volume, mix and absorption | 230.3 | 44.5 | |||||
Material productivity | (55.0 | ) | 55.0 | ||||
Conversion productivity | (28.0 | ) | 28.0 | ||||
Labor inflation | 14.1 | (14.1 | ) | ||||
Foreign exchange effects | (41.6 | ) | (4.1 | ) | |||
Other | (25.9 | ) | 25.9 | ||||
Net increase | 93.9 | 88.6 | |||||
Cost of sales / gross profit for the year ended December 31, 2016 | $ | 1,935.9 | $ | 874.1 | |||
Sales price reductions as % of sales | 1.6 | % | |||||
Foreign exchange impacts include both translational and transactional effects. Cost variances included in "Other" above consisted mainly of lower streamlining charges of $33.2 million primarily due to costs recorded in 2015 related to the planned closure of the Meppel and Claye-Souilly manufacturing facilities.
Operating Expenses
Operating expenses include selling and administrative expenses, product engineering expenses and other operating expenses.
34
(Amounts in millions) | |||
Operating expenses for the year ended December 31, 2015 | $ | 514.6 | |
Increase/(decrease) due to: | |||
Labor inflation | 13.6 | ||
Incentive compensation | (0.3 | ) | |
Incremental costs from acquisition | 14.0 | ||
Streamlining expenses | (20.0 | ) | |
Employee-related costs | 0.7 | ||
Foreign exchange translation | (6.7 | ) | |
Other | 2.3 | ||
Net increase | 3.6 | ||
Operating expenses for the year ended December 31, 2016 | $ | 518.2 | |
Equity in Net Income of Unconsolidated Joint Ventures
Equity in net income of unconsolidated joint ventures decreased $7.3 million to $24.8 million in 2016 as compared to $32.1 million in 2015. This decrease was primarily driven by lower income from our North American joint venture.
Interest Expense, net
The Company recorded net interest expense of $12.7 million in 2016 compared to $7.1 million in 2015. This was primarily due to a full year of interest expense incurred on our 2015 issuance of $500 million of Senior Notes, as well as interest expense on our 2016 issuance of €440 million Senior EUR Notes. See Note 14 of Notes to the Consolidated Financial Statements for further discussion.
Income Taxes
The income tax provision for 2016 was $121.8 million on $369.1 million of pre-tax income before adjusting for noncontrolling interest, compared with an income tax provision of $11.5 million on pre-tax income of $297.5 million before adjusting for noncontrolling interest in 2015. The 2016 increase in income tax expense is primarily the result of higher pre-tax income, the claw-back of Belgian EPR tax relief for 2012-2014, changes in uncertain tax positions and the effect of U.S. and foreign deferred taxes on unremitted foreign earnings, which was partially offset by a change in the valuation allowance and by a PID claimed in Belgium.
See “Executive Overview” above for a discussion of the European Commission’s recent decision to invalidate the Belgian EPR program that the Company has participated in since 2012, the impact of such decision on our effective tax rate and our deferred tax assets and the actions we are considering to potentially mitigate the impact of such decision on our effective tax rate and deferred tax assets.
A valuation allowance against deferred tax assets has been recorded for $12.6 million and $13.5 million in 2016 and 2015, respectively. Management has determined that it is more likely than not that it will not realize its deferred tax assets in other foreign jurisdictions since evidence such as historical operating profits resulted in a cumulative loss position during the most recent three-year period and lack of projected earnings provided sufficient negative evidence to record a valuation allowance against such deferred tax assets.
Net Income Attributable to Noncontrolling Interests
Net income attributable to noncontrolling interests increased $13.5 million to $24.3 million in 2016 as compared to $10.8 million in 2015 primarily due to a $12.3 million out-of-period, non-cash adjustment recorded for a correction in our noncontrolling interest attributable to one of our consolidated affiliates. See Note 2 of Notes to the Consolidated Financial Statements for further discussion.
35
Backlog
Backlog represents sales orders that have not yet been filled as of the end of the reporting period. This amounted to $1.3 billion at the end of 2016, a slight decrease of 2.1% (1.9% excluding foreign currency translation effects) from the end of 2015, driven by a change in the mix of regional growth leading to a shorter average order lead time. Backlog is not necessarily predictive of future business as it relates only to some of our products, and customers may still change orders and future delivery dates.
Results of Operations for 2015 Compared with 2014
The following table is a summary of sales, cost of sales, gross profit, operating expenses and other selected results of operations for the periods indicated.
Year ended December 31, | Excluding Foreign Exchange Translation ** | ||||||||||||||||
(Amounts in millions) | 2015 | 2014 | % change reported | 2015 adjusted amount | % change adjusted | ||||||||||||
Sales | $ | 2,627.5 | $ | 2,851.0 | (7.8 | )% | $ | 3,039.9 | 6.6 | % | |||||||
Cost of sales | 1,842.0 | 1,979.3 | (6.9 | )% | 2,125.7 | 7.4 | % | ||||||||||
Gross profit | 785.5 | 871.7 | (9.9 | )% | 914.2 | 4.9 | % | ||||||||||
Operating expenses | 514.6 | 540.7 | (4.8 | )% | 600.8 | 11.1 | % | ||||||||||
Equity in net income of unconsolidated joint ventures | 32.1 | 23.8 | 34.9 | % | 32.3 | 35.7 | % | ||||||||||
Interest (expense)/income, net | (7.1 | ) | 0.2 | * | (6.8 | ) | * | ||||||||||
Income tax expense | 11.5 | 55.6 | (79.3 | )% | 14.6 | (73.7 | )% | ||||||||||
* Percentage change not considered meaningful
** Amounts translated using 2014 average exchange rates for comparability
Sales
Our sales for 2015 were $2,627.5 million, a decrease of 7.8% (increase of 6.6% excluding foreign currency translation effects) from $2,851.0 million in 2014. The increase, excluding foreign currency translation effects, was mainly driven by increased WABCO content per vehicle partially offset by an estimated 7% decline in the global production of new trucks and buses greater than six tons.
Total sales in Europe, our largest market, decreased 11.2% (increased 6.6% excluding foreign currency translation effects) for the full year 2015, driven mainly by aftermarket growth and increased WABCO content per vehicle, partially offset by increased dual sourcing on some EURO VI platforms. Sales in North America increased 8.5% (18.1% excluding foreign currency translation effects) due primarily to increased production of new trucks and buses. Total sales in South America decreased 48.5% (29.3% excluding foreign currency translation effects) driven by an estimated 44% decline in the production of new trucks and buses in Brazil, partially offset by growth in aftermarket sales.
Total sales in Asia increased 4.8% (11.8% excluding foreign currency translation effects) and outperformed the market, driven primarily by increases in WABCO content per vehicle in all key markets except Korea. We also saw an increase in the production of new trucks and buses greater than six tons in India, partially offset by lower vehicle production in Japan, China and Korea: sales in India increased 32.9% (40.1% excluding foreign currency translation effects), Japan decreased 10.9% (increased 2.2% excluding foreign currency translation effects), China increased 5.7% (7.8% excluding foreign currency translation effects) and South Korea decreased 25.2% (18.1% excluding foreign currency translation effects).
WABCO's global aftermarket sales, included in the geographic numbers provided above, decreased 9.8% (increased 6.8% excluding foreign currency translation effects). This increase, excluding foreign currency translation effects, demonstrates the continued success of the Company's aftermarket strategies.
36
Cost of Sales and Gross Profit
Within cost of sales, our largest expense is material costs, which mainly represents the purchase of components and parts. Our continued focus on productivity generated 5.5% of material savings before the impact of commodity inflation, which had a negative impact of 0.8%, bringing net materials productivity to 4.7% for the year.
(Amounts in millions) | Cost of Sales | Gross Profit | |||||
Cost of sales / gross profit for the year ended December 31, 2014 | $ | 1,979.3 | $ | 871.7 | |||
Increase/(decrease) due to: | |||||||
Sales price reductions | — | (44.0 | ) | ||||
Volume, mix and absorption | 175.9 | 57.0 | |||||
Material productivity | (44.8 | ) | 44.8 | ||||
Conversion productivity | (27.7 | ) | 27.7 | ||||
Labor inflation | 16.7 | (16.7 | ) | ||||
Foreign exchange effects | (302.2 | ) | (110.2 | ) | |||
Other | 44.8 | (44.8 | ) | ||||
Net decrease | (137.3 | ) | (86.2 | ) | |||
Cost of sales / gross profit for the year ended December 31, 2015 | $ | 1,842.0 | $ | 785.5 | |||
Sales price reductions as % of sales | 1.4 | % | |||||
Foreign exchange impacts include both translational and transactional effects. Cost variances included in "Other" above consisted mainly of higher streamlining charges of $41.1 million primarily related to the Company's streamlining proposals announced in 2015 which are expected to result in the closure of the Meppel and Claye-Souilly manufacturing facilities.
Operating Expenses
Operating expenses include selling and administrative expenses, product engineering expenses and other operating expenses.
(Amounts in millions) | |||
Operating expenses for the year ended December 31, 2014 | $ | 540.7 | |
Increase/(decrease) due to: | |||
Labor inflation | 15.4 | ||
Pension expense | 15.6 | ||
Incentive compensation | 5.3 | ||
Streamlining expenses | 11.4 | ||
Research and development investments, net | 9.9 | ||
Foreign exchange translation | (86.2 | ) | |
Other | 2.5 | ||
Net decrease | (26.1 | ) | |
Operating expenses for the year ended December 31, 2015 | $ | 514.6 | |
Equity in Net Income of Unconsolidated Joint Ventures
Equity in net income of unconsolidated joint ventures increased $8.3 million to $32.1 million in 2015 as compared to $23.8 million in 2014. This increase was primarily driven by higher income from our North American joint venture, partially offset by a decrease in income from our South African joint venture.
37
Interest Expense/Income, net
The Company recorded net interest expense of $7.1 million in 2015 compared to net interest income of $0.2 million in 2014. This was primarily due to interest expense incurred on $500 million of Senior Notes issued in 2015. See Note 14 of Notes to the Consolidated Financial Statements for further discussion.
Income Taxes
The income tax provision for 2015 was $11.5 million on $297.5 million of pre-tax income before adjusting for noncontrolling interest, compared with an income tax provision of $55.6 million on pre-tax income of $356.8 million before adjusting for noncontrolling interest in 2014. The 2015 decrease in income tax expense is primarily the result of lower pre-tax income, changes in uncertain tax positions, and the effect of U.S. and foreign deferred taxes on unremitted foreign earnings.
A valuation allowance against deferred tax assets has been recorded for $13.5 million and $9.0 million in 2015 and 2014, respectively, Management has determined that it is more likely than not that it will not realize its deferred tax assets in other foreign jurisdictions since evidence such as historical operating profits resulted in a cumulative loss position during the most recent three-year period and lack of projected earnings provided sufficient negative evidence to record a valuation allowance against such deferred tax assets.
Backlog
Backlog represents sales orders that have not yet been filled as of the end of the reporting period. This amounted to $1.3 billion at the end of 2015, a decrease of 2.4% (increase of 7.3% excluding foreign currency translation effects) from the end of 2014. Backlog is not necessarily predictive of future business as it relates only to some of our products, and customers may still change orders and future delivery dates.
38
Liquidity and Capital Resources
We employ several means to manage our liquidity, and we are not dependent upon any one source of funding. Our sources of financing include cash flows from operations, cash and cash equivalents, our senior unsecured notes and revolving credit facilities.
We believe the combination of expected cash flows, the funding received from our senior unsecured notes and the revolving credit facilities being committed until 2019 and 2021 will provide us with adequate liquidity to support the Company's operations. The Company also has the ability to access a wide range of additional external financing instruments.
Specifically for 2017, we expect an increase of up to 10% in our capital spending primarily due to the planned completion of the construction of a new product engineering facility in Germany. In addition, approximately $11.7 million was paid into an escrow account in January 2017 with the Brazilian government due to legislative changes requiring a cash deposit in lieu of a bank guarantee for outstanding litigation.
Outside of our capital expenditures, cash flows related to our senior unsecured notes and acquisitions and, as previously discussed, relating to the European Commission's decision and the payment made to the Brazilian government, our overall cash flow is expected to be in line with the Company's 2016 cash flow profile, and there are no known trends or uncertainties that are reasonably expected to have a material effect on the separate sources and uses of cash.
As of December 31, 2016, $698.2 million of the $862.5 million of cash and cash equivalents on the consolidated balance sheets was held by foreign subsidiaries. The Company considers the earnings of substantially all of its foreign subsidiaries to be permanently reinvested outside the United States and as such no additional U.S. tax cost has been provided. The Company has provided for tax at the U.S. tax rate for its Brazilian affiliate's current year earnings in 2016. The Company continues to assert permanent reinvestment outside the U.S. with respect to the remainder of its foreign earnings and at this time, does not have any plans or needs to repatriate additional earnings from its foreign subsidiaries except for Brazil. In addition, a tax provision was also provided on unremitted foreign earnings of $300 million in a Belgian affiliate for which the Company does not assert permanent reinvestment outside the United States. This assertion is resulting from the Company recognizing earnings in the fourth quarter of 2013 from the receipt of an exceptional refund including interest from the European Commission related to the Company’s appeal of a fine previously assessed by the European Commission as discussed in our 2013 Form 10-K. The Company estimates the amount of its unremitted foreign earnings permanently reinvested outside the U.S. to be approximately $1.1 billion as of December 31, 2016; however, it is not practicable to estimate the tax liability that would arise if the earnings that are considered permanently reinvested were remitted to the U.S.
Cash Flows for 2016 Compared with 2015
Operating activities - Net cash provided by operating activities was $405.4 million for 2016. This is in comparison with net cash provided by operating activities of $400.3 million for 2015. We recorded net income including noncontrolling interests of $247.3 million for 2016 compared with net income including noncontrolling interests of $286.0 million for 2015. Net income for 2016 included noncash elements such as depreciation and amortization of $98.0 million and pension and post-retirement benefit expense of $44.2 million. We paid $21.6 million in 2016 towards our pension and post-retirement benefit obligations compared with $22.8 million in 2015, the lower level of payments driven primarily by a stronger U.S. Dollar. Interest expense including the amortization of debt issuance costs amounted to $17.7 million in 2016 compared to $7.8 million in 2015, driven by a full year outstanding on our Senior Notes as well as the fourth quarter issuance of our Senior EUR Notes as discussed in Note 14 of Notes to the Consolidated Financial Statements. We also recorded $1.4 million of impairment charges on fixed assets in 2016, part of which related to our expected production site closures.
Our working capital increased by $43.7 million, due primarily to a higher level of accounts receivables from increased business, partially offset by a higher level of accounts payable. Other accrued liabilities and taxes increased $63.9 million for 2016 compared to $23.1 million for 2015. The major drivers of this increase were accruals for tax-related items, customer bonuses as well as an increase in the current portion of our warranty reserve. Other current and long-term assets for 2016 decreased $40.7 million compared to $18.4 million for 2015, driven mainly by tax-related items. The change in other long-term liabilities for 2016 was a decrease of $45.8 million compared to an increase of $13.5 million for 2015, primarily for lower accruals related to the long-term portion of our streamlining liabilities as well as tax-related items.
Investing activities - The net cash used in investing activities amounted to $251.8 million in 2016 compared to $202.2 million in 2015. For 2016, the net cash usage includes capital expenditures of $39.9 million of investments in tooling, $64.1 million on plant and equipment including the construction of a new research and development center in Germany and $10.0
39
million in software to support the Company's long-term growth strategies. This is in comparison with $40.3 million of investments in tooling, $50.0 million on plant and equipment and $10.9 million in software in 2015. We also received $7.0 million in proceeds from the disposal of property, plant and equipment in 2016 primarily for the sale of assets from our site closure in Meppel as well as by our acquired company MICO. Proceeds from disposal of property, plant and equipment in 2015 were immaterial.
In 2016, we invested a total of $159.8 million in repurchase agreements, of which $31.1 million have matured during the year. The repurchase agreements are classified within other current assets on the consolidated balance sheets. We also received proceeds of $108.2 million from the sale of our short-term investments and the redemption of our repurchase agreements that were outstanding in 2015. This is in comparison to $120.1 million of investments made and $38.5 million of proceeds received in 2015 related to short-term investments and repurchase agreements.
We increased our minority stake in SmartDrive Systems, a video-based analytics company headquartered in the U.S. by $0.9 million in 2016 from our original investment of $20.0 million made in 2015. We also paid $92.3 million in 2016 related to our acquisitions of MICO, LCL and Trans-Safety LOCKS as discussed in Note 21 of Notes to the Consolidated Financial Statements.
Financing activities - The net cash proceeds from financing activities during 2016 amounted to $220.6 million compared to a net cash usage of $54.0 million during 2015. Our total third-party debt increased $464.2 million for 2016 compared to $189.3 million for 2015, driven primarily by the 2016 issuance of our Euro-denominated unsecured senior notes. Cash proceeds of $15.2 million were also received in 2016 for the settlement of a forward contract entered into in relation to these unsecured senior notes.
We repurchased shares for a total amount of $250.0 million and $249.2 million in 2016 and 2015, respectively. We also received $3.9 million of stock option proceeds and withheld $6.0 million of shares related to employee tax payments made for equity award vestings in 2016 compared to $17.3 million and $5.0 million in 2015, respectively.
Dividends paid to noncontrolling interests amounted to $6.7 million and $6.4 million in 2016 and 2015, respectively.
Cash Flows for 2015 Compared with 2014
Operating activities - Net cash provided by operating activities was $400.3 million for 2015. This is in comparison with net cash provided by operating activities of $314.4 million for 2014. We recorded net income including noncontrolling interests of $286.0 million for 2015 compared with net income including noncontrolling interests of $301.2 million for 2014. Net income for 2015 included noncash elements such as depreciation and amortization of $96.7 million and post-retirement benefit expense of $43.1 million. We paid $22.8 million in 2015 towards our post-retirement benefit obligations compared with $33.0 million in 2014, the lower level of payments driven primarily by a stronger U.S. Dollar combined with reduced funding requirements on our funded plans. The issuance of our senior unsecured notes in the second quarter of 2015 gave rise to interest expense and amortization of debt issuance costs of $7.8 million, with the interest payable in the first quarter of 2016. We also recorded $7.7 million of impairment charges on fixed assets relating to our expected production site closures.
Our working capital increased by $32.4 million, due primarily to a higher level of accounts receivables and inventory resulting from increased business, partially offset by a higher level of accounts payable. Other accrued liabilities and taxes increased $23.1 million for 2015 compared to $15.2 million for 2014. The major drivers of this increase were accruals for streamlining and tax-related items, partially offset by lower payroll-related accruals. Other current and long-term assets for 2015 increased $18.4 million compared to a decrease of $27.5 million for 2014, driven mainly by tax-related items. The change in other long-term liabilities for 2015 was an increase of $13.5 million compared to a decrease of $8.0 million for 2014, primarily for accruals related to long-term streamlining liabilities on our expected production site closures.
Investing activities - The net cash used in investing activities amounted to $202.2 million in 2015 compared to $211.1 million in 2014. The net cash usage for 2015 includes capital expenditures of $40.3 million of investments in tooling, $50.0 million on plant and equipment and $10.9 million in software to support the Company's long-term growth strategies. This compared with $45.0 million of investments in tooling, $78.8 million on plant and equipment including construction of a new plant in Poland and $12.1 million in software in 2014.
In 2015, we invested a total of $120.1 million in short-term investments and repurchase agreements. The repurchase agreements are classified within other assets on the consolidated balance sheets. We also received proceeds of $38.5 million from the redemption of a repurchase agreement which matured during the year as compared to $50.7 million of proceeds received in 2014 from the sale of our short-term investments.
40
We acquired a $20.0 million minority stake in 2015 in SmartDrive Systems, a video-based analytics company headquartered in the U.S. We also paid $125.9 million in 2014 related to the acquisition of Tavares as discussed in our 2015 Form 10-K.
Financing activities - The net cash used by financing activities during 2015 amounted to $54.0 million compared to $121.4 million during 2014. Our total third-party debt increased $189.3 million for 2015 compared to $226.4 million for 2014. This increase was primarily driven by our issuance of $500 million of senior unsecured notes, net of $2.1 million of debt issuance costs, of which a portion of the proceeds were used to repay the outstanding balance on our revolving credit facilities.
We repurchased shares for a total amount of $249.2 million and $351.5 million in 2015 and 2014, respectively. We also received $17.3 million of stock option proceeds in 2015 compared to $15.0 million in 2014. Dividends paid to noncontrolling interests amounted to $6.4 million and $5.6 million in 2015 and 2014, respectively. We also paid $5.7 million during 2014 for the acquisition of the remaining ownership interest in Transics as discussed in our 2015 Form 10-K.
Senior Unsecured Notes
On November 15, 2016, the Company issued €440.0 million in aggregate principal amount of senior unsecured notes, comprised of €190.0 million of 0.84% senior unsecured notes due 2023, €80.0 million of 1.20% senior unsecured notes due 2026 and €170.0 million of 1.36% senior unsecured notes due 2028. The Company paid $1.4 million of debt issuance costs in connection with these senior unsecured notes. Interest on these notes is payable semi-annually on January 1 and July 1 of each year commencing July 1, 2017.
On June 25, 2015, the Company issued $500.0 million in aggregate principal amount of senior unsecured notes, comprised of $150 million of 2.83% senior unsecured notes due 2022, $200 million of 3.08% senior unsecured notes due 2025 and $150 million of 3.18% senior unsecured notes due 2027. The Company paid $2.1 million of debt issuance costs in connection with these senior unsecured notes. Interest on these notes is payable semi-annually on January 1 and July 1 of each year commencing January 1, 2016.
The proceeds from the above issuances of senior unsecured notes were partially utilized to repay the outstanding balance on our revolving credit facilities, with the remaining proceeds intended to fund our share repurchase program, finance acquisitions, refinance existing indebtedness and meet general financing requirements.
Credit Facilities
On July 8, 2011, the Company entered into a $400 million multi-currency five-year senior unsecured revolving credit facility which was amended and restated on September 30, 2015 (the 2015 Facility) to, among other things, extend the original expiry date to September 30, 2021 subject to two 1-year extension options and amend the applicable margins on the original revolving credit facility.
On December 17, 2014, the Company entered into a new $100 million multi-currency five-year senior unsecured revolving credit facility (the 2014 Facility) which will expire on December 17, 2019.
Under the revolving credit facilities, the Company may borrow, on a revolving basis, loans in an aggregate principal amount at any one time outstanding not in excess of $500 million. As of December 31, 2016, the Company had the ability to borrow an incremental $500.0 million under the revolving credit facilities and was in compliance with all the covenants. The proceeds from the revolving credit facilities are available to finance acquisitions, refinance existing indebtedness and meet general financing requirements.
As of December 31, 2016, various subsidiaries also had borrowings from banks totaling $0.8 million, of which $0.6 million was classified as long-term debt. The remaining $0.2 million supports local working requirements.
Derivative Instruments and Hedging Activities
Foreign exchange contracts are used by the Company to offset the earnings impact relating to the variability in exchange rates on certain assets and liabilities denominated in non-functional currencies and have not been designated as relationship hedges. As of December 31, 2016, forward contracts for an aggregate notional amount of €146.9 million ($154.1 million at December 31, 2016 exchange rates) were outstanding with an average duration of one month. The majority of these exchange contracts were entered into on December 29, 2016.
41
During the first quarter of 2015, the Company also entered into and settled treasury rate lock agreements which were designated as cash flow hedges. As of December 31, 2016, a loss related to these cash flow hedges of $1.0 million, net of taxes, has been recognized in accumulated other comprehensive income.
During the third and fourth quarters of 2016, the Company also entered into various forward contracts with an aggregate notional amount of €440.0 million that were designated as partial hedges of the foreign currency exposure of its investments in certain Euro-denominated wholly-owned subsidiaries. All of these contracts had matured as of December 31, 2016. Due to the high degree of effectiveness between the hedging instrument and the exposure being hedged, a gain of $9.3 million, net of taxes of $5.8 million, related to these contracts was recognized in cumulative translation adjustment within other comprehensive income for the year ended December 31, 2016.
Off-Balance Sheet Arrangements
We did not engage in any off-balance sheet financial arrangements as of December 31, 2016.
Contractual Obligations
The following table summarizes our expected cash outflows resulting from financial contracts and commitments as of December 31, 2016.
The amounts below exclude liabilities for uncertain tax positions of $2.9 million as of December 31, 2016. The table below also excludes probable indemnification liabilities of $0.1 million as of December 31, 2016, that the Company is responsible for under a Tax Sharing Agreement between Trane and WABCO. Both these amounts are classified as long-term, and we are unable to estimate the timing of future payments relating to these obligations. See Note 16 and Note 17 of Notes to the Consolidated Financial Statements for further discussion.
We also had $51.2 million of streamlining liabilities as of December 31, 2016. While we expect the majority of payments to be made by 2018, we are unable to estimate the timing of all future payments. See Note 5 of Notes to the Consolidated Financial Statements for further discussion.
Aggregate Contractual Obligations
As of December 31, 2016
(in millions)
Payments due by period (1) | ||||||||||||||||||||
Contractual Obligation | Total | 2017 | 2018 and 2019 | 2020 and 2021 | Beyond 2021 | |||||||||||||||
Debt obligations (excluding interest) | $ | 959.1 | $ | 0.2 | $ | 0.4 | $ | 0.2 | $ | 958.3 | ||||||||||
Lease obligations (2) | 74.7 | 16.3 | 26.6 | 22.1 | 9.7 | |||||||||||||||
Purchase obligations (3) | 200.0 | 200.0 | — | — | — | |||||||||||||||
Pension and post-retirement benefits (4) | 260.9 | 25.8 | 49.2 | 51.3 | 134.6 | |||||||||||||||
Total | $ | 1,494.7 | $ | 242.3 | $ | 76.2 | $ | 73.6 | $ | 1,102.6 | ||||||||||
(1) | The amounts and timing of such obligations, as shown in the table may vary substantially from amounts that will actually be paid in future years. For example, the actual amount to be paid under debt obligations will depend on the amount of debt drawn under our revolving credit facilities in each year. |
(2) | Amounts include future rental commitments under all non-cancelable operating leases in effect at December 31, 2016. |
(3) | In the normal course of business we expect to purchase approximately $1.8 billion in 2017 of materials and services, and estimate that on average no more than approximately $200 million is outstanding at any one time in the form of legally binding commitments. We spent approximately $1.7 billion, $1.5 billion and $1.7 billion on materials and services in 2016, 2015 and 2014, respectively. |
(4) | Amounts represent undiscounted projected benefit payments over the next ten years. The expected benefit payments are estimated based on the same assumptions used to measure our accumulated benefit obligation at the end of 2016 and include benefits attributable to estimated future service of current employees. |
42
Capital Expenditures
We believe our capital spending in recent years has been sufficient to maintain efficient production capacity, to implement important product and process redesigns and to expand capacity to meet increased demand. Productivity projects have freed up capacity in our manufacturing facilities and are expected to continue to do so. We expect to continue investing to expand and modernize our existing facilities and invest in our facilities to create capacity for new product development. Specifically for 2017, we expect an increase of up to 10% in our capital spending as previously discussed.
Pending Adoptions of Recently Issued Accounting Standards
Refer to Note 3 of Notes to the Consolidated Financial Statements for a complete description of recent accounting standards which we have not yet been required to implement and which may be applicable to our operations.
Critical Accounting Policies and Estimates
Our discussion and analysis of our financial condition and results of operations are based upon our consolidated financial statements, which have been prepared in accordance with U.S. GAAP. The preparation of financial statements in conformity with those accounting principles requires us to make judgments and estimates that affect the amounts reported in the consolidated financial statements and accompanying notes. Those judgments and estimates have a significant effect on the consolidated financial statements because they result primarily from the need to make estimates about the effects of matters that are inherently uncertain. Actual results could differ from those estimates. We frequently re-evaluate our judgments and estimates that are based upon historical experience and on various other assumptions that we believe to be reasonable under the circumstances.
We believe that of our significant accounting policies, the ones that may involve a higher degree of uncertainty, judgment and complexity pertain to revenue recognition for multiple-element arrangements, inventory reserves, goodwill, stock-based compensation, post-retirement benefits, warranties, business combinations, valuation of equity and cost method investments, income taxes, and contingencies. See Note 2 of Notes to the Consolidated Financial Statements for additional discussion of our accounting policies.
Revenue Recognition - The Company recognizes revenue when title and risk of loss have transferred, persuasive evidence of arrangement exists, the sales price is fixed or determinable and collectibility is reasonably assured. Certain of the Company's product offerings contain multiple deliverables including hardware with embedded firmware, back office hosting services, unspecified software upgrades and enhancements related to the software embedded in these products through service contracts, which are considered separate units of accounting. For products under these arrangements, the software and non-software components function together to deliver the tangible product’s essential functionality.
The Company allocates revenue to each element in these multiple-element arrangements based upon the relative selling prices of each deliverable. In applying the relative selling price method, the Company determines the selling price for each deliverable using vendor specific objective evidence (VSOE), if it exists, or third-party evidence (TPE) of selling price. If neither VSOE nor TPE of selling price exist for a deliverable, the best estimate of selling price (BESP) is then used for that element. BESP represents the price at which the Company would transact a sale if the element were sold on a standalone basis. The Company determines BESP for an element by considering multiple factors including, but not limited to, the Company's go-to-market strategy, pricing practices, internal costs, gross margin, market conditions and geographies. Revenue allocated to each element is then recognized when the other revenue recognition criteria are met for that element.
Inventory Reserves - On a quarterly basis, the Company tests its inventory for slow moving and obsolete stock by considering both the historical and expected sales and the Company will record a provision, if needed. Historically, this policy has given a close approximation of the Company's experience with slow moving and obsolete inventory. From time to time unusual buying patterns or shifts in demand may cause large movements in the reserve.
Goodwill - The Company has a significant amount of goodwill on its balance sheet that is not amortized, but subject to impairment tests each fiscal year on October 1 or more often when events or circumstances indicate that the carrying amount of goodwill may not be recoverable. The Company's impairment tests utilize the two-step approach. The first step of the goodwill impairment test compares fair value of a reporting unit with its carrying amount, including goodwill. If the fair value of a reporting unit exceeds its carrying amount, goodwill of the reporting unit is not considered impaired and thus the second step of the impairment test is unnecessary. If the carrying amount of a reporting unit exceeds its fair value, the second step of the goodwill impairment test shall be performed to measure the amount of impairment loss, if any. The second step of the goodwill impairment test compares the implied fair value of reporting unit goodwill with the carrying amount of that goodwill. If the carrying amount
43
of reporting unit goodwill exceeds the implied fair value of that goodwill, an impairment loss shall be recognized in an amount equal to that excess.
The recoverability of goodwill is measured based on one reporting unit for the total Company. WABCO's plants, engineering, technical support, distribution centers and other support functions are shared among various product families and serve all distribution channels with many customers. Based on the organizational structure, as well as the nature of financial information available and reviewed by the Company's chief operating decision maker to assess performance and make decisions about resource allocations, the Company has concluded that its total WABCO operations represent one reportable unit. In order to approximate the fair value of the reporting unit for purposes of testing recoverability, we use the total market capitalization of the Company, a market approach, which is then compared to the total book value of the Company. In the event the Company's fair value has fallen below book value, the Company will compare the estimated fair value of goodwill to its book value. If the book value of goodwill exceeds the estimated fair value of goodwill, the Company will recognize the difference as an impairment loss in operating income. There has been no impairment of goodwill during 2016, and the Company's goodwill was not at risk for failing the first step of its impairment test.
Stock-Based Compensation - The Company measures and recognizes in its consolidated statements of operations the expense associated with all share-based payment awards made to employees and directors including stock options, restricted stock units, performance stock units and restricted stock grants based on estimated fair values.
The vesting of the Company's performance stock units (PSUs) occurs at levels ranging from none to 200% of the number of granted PSUs depending upon the achievement of three-year cumulative earnings per share goals approved by the Compensation, Nominating and Governance Committee of the Board of Directors. The Company assesses the expected achievement levels at the end of each reporting period and accrues for the associated compensation expense where the Company believes it is probable that the performance conditions will be met.
Pension and Post-Retirement Benefits - The Company has significant pension and post-retirement benefit costs and liabilities that are developed from actuarial valuations. Inherent in these valuations are key assumptions including discount rates, expected return on plan assets, mortality rates, merit and promotion increases and the health care cost trend rate. The Company is required to consider current market conditions, including changes in interest rates and health care costs, in making its assumptions. Changes in the related pension and post-retirement benefit costs or liabilities may occur in the future due to changes in the assumptions. The assumptions as to the expected long-term rates of return on plan assets are based upon the composition of plan assets, historical long-term rates of return on similar assets and current and expected market conditions. The discount rate used for U.S. plans reflects the market rate for high-quality fixed-income investments on the Company's annual measurement date (December 31) and is subject to change each year. The discount rate was determined by matching, on an approximate basis, the coupons and maturities for a portfolio of corporate bonds (rated AA or better by Moody's Investor Services) to the expected plan benefit payments defined by the projected benefit obligation. The discount rates used for plans outside the United States are based on a combination of relevant indices regarding corporate and government securities, the duration of the liability and appropriate judgment. The impact of Health Care Reform legislation in the United States is immaterial to the Company. See the disclosures about pension and post-retirement obligations, the composition of plan assets, assumptions and other matters in Note 13 of Notes to the Consolidated Financial Statements.
Warranties - Products sold by WABCO are covered by a basic limited warranty with terms and conditions that vary depending upon the product and country in which it was sold. The limited warranty covers the equipment, parts and labor (in certain cases) necessary to satisfy the warranty obligation generally for a period of two years. Estimated product warranty expenses are accrued in cost of goods sold at the time the related sale is recognized. Estimates of warranty expenses are based primarily on warranty claims experience and specific customer contracts. Warranty expenses include accruals for basic warranties for product sold, as well as accruals for product recalls, service campaigns and other related events when they are known and estimable, less costs recoverable from suppliers related to warranty claims. To the extent we experience changes in warranty claim activity or costs associated with servicing those claims, our warranty accrual is adjusted accordingly. Warranty accrual estimates are updated based upon the most current warranty claims information available. The Company's warranty costs as a percentage of net sales totaled 0.8% in 2016, 1.0% in 2015 and 0.9% in 2014. We do not expect this percentage to change materially in the near future. See Note 15 of Notes to the Consolidated Financial Statements for a three-year summary of warranty costs.
Business Combinations - We allocate the fair value of purchase consideration to the assets acquired, liabilities assumed, and non-controlling interests in the acquiree generally based on their fair values at the acquisition date. The excess of the fair value of purchase consideration over the fair value of these assets acquired, liabilities assumed and non-controlling interests in the acquiree is recorded as goodwill. When determining the fair values of assets acquired, liabilities assumed, and non-controlling interests in the acquiree, management makes significant estimates and assumptions, especially with respect to intangible assets. Critical estimates in valuing intangible assets include, but are not limited to, expected future cash flows, which includes
44
consideration of future growth rates and margins, attrition rates, future changes in technology and brand awareness, loyalty and position, and discount rates. Fair value estimates are based on the assumptions management believes a market participant would use in pricing the asset or liability. Amounts recorded in a business combination may change during the measurement period, which is a period not to exceed one year from the date of acquisition, as additional information about conditions existing at the acquisition date becomes available.
Valuation of Equity and Cost Method Investments - We monitor our equity and cost method investments for impairment indicators on an ongoing basis based on projections of anticipated future cash flows, including future profitability assessments when events and circumstances warrant such a review. If impairment indicators exist, we perform the required impairment analysis by comparing the undiscounted cash flows expected to be generated from the investment to the related carrying value. If the carrying value of the investment exceeds the undiscounted cash flows, an impairment loss is measured and recognized. An impairment loss is measured as the difference between the carrying value and the estimated fair value of the investment. We estimate cash flows and fair value using internal budgets, cash flows and profitability forecasts as well as other market information including valuations of similar companies, where available. Any differences in actual results from the estimates could result in fair values different from the estimated fair values, which could materially impact our future results of operations and financial condition. We believe that the projections of anticipated future cash flows and fair value assumptions are reasonable; however, changes in assumptions underlying these estimates could affect our valuations. There has been no impairment of equity or cost method investments during 2016. The Company's equity method investments were not at risk of impairment. The Company's fair value calculation of the cost method investment exceeded its carrying value of $20.9 million by approximately 6% as of December 31, 2016. The fair value calculation is dependent on sales and cost forecasts being met and includes numerous assumptions.
Income Taxes - We record a valuation allowance to reduce our deferred tax assets to the amount that we believe is more likely than not to be realized. While we have considered future taxable income and ongoing prudent and feasible tax planning strategies in assessing the need for the valuation allowance, in the event we were to determine that we would not be able to realize all or part of our net deferred tax assets in the future, an adjustment to decrease the net deferred tax assets would be charged to income in the period such determination was made. Likewise, should we determine that we would be able to realize our deferred tax assets in the future in excess of our net recorded amount, an adjustment to increase the net deferred tax assets would increase income in the period such determination was made. We calculate a valuation allowance in accordance with the provisions of ASC 740, Income Taxes, which requires an assessment of both positive and negative evidence regarding the realizability of these deferred tax assets, when measuring the need for a valuation allowance. In determining net deferred tax assets and valuation allowances, management is required to make judgments and estimates related to projections of profitability, the timing and extent of the utilization of net operating loss carry-forwards, applicable tax rates and tax planning strategies. We review the valuation allowance quarterly and maintain it until sufficient positive evidence exists to support a reversal. Also, our plans for the permanent reinvestment or eventual repatriation of the accumulated earnings of certain of our non-U.S. operations could change. Such changes could have a material effect on tax expense in future years.
We also estimate our effective income tax rate quarterly, considering all known factors and the estimated effects of future events or tax planning strategies that can cause that rate to vary from the statutory rate. Estimating the outcome of future events is inherently uncertain and final resolution of those events can cause the effective tax rate to vary significantly. In addition, changes in U.S. or foreign tax laws or rulings may have a significant impact on our effective tax rate.
A tax position is a position in a previously filed tax return or a position expected to be taken in a future tax filing that is reflected in measuring current or deferred income tax assets and liabilities. Tax positions shall be recognized only when it is more likely than not (likelihood of greater than 50%), based on technical merits, that the position will be sustained. Tax positions that meet the more likely than not threshold should be measured using a probability weighted approach as the largest amount of tax benefit that is greater than 50% likely of being realized upon settlement. Whether the more-likely-than-not recognition threshold is met for a tax position, is a matter of judgment based on the individual facts and circumstances of that position evaluated in light of all available evidence. Tax positions are not permitted to be recognized, derecognized, or remeasured due to changes subsequent to the balance sheet date, but prior to the issuance of the financial statements. Rather, these changes are recorded in the period the change occurs with appropriate disclosure of such subsequent events, if significant. The Company accrues interest and penalties related to unrecognized tax benefits in income tax expense.
In situations where the Company has tax deductions that would otherwise increase a deferred tax asset related to net operating losses, a tax deduction which is treated as an uncertain tax position is recorded as a reduction of the deferred tax asset on the balance sheet. In this regard, although the uncertain tax position is not reflected as an unrecognized tax benefit in the balance sheet as a recorded liability, it is disclosed in the tabular rollforward for unrecognized tax benefits in Note 16 of Notes to the Consolidated Financial Statements.
45
The Company has operations and a taxable presence in 28 countries outside the United States and all of these countries have a tax rate that is lower than the rate in the U.S. The countries in which the Company has a material presence include Belgium, China, Germany, India, the Netherlands and Poland. Belgium has historically had the largest impact on the Company’s effective tax rate primarily because of the Company’s participation in the Belgian Excess Profit Ruling and Patent Income Deduction programs. The Company has also benefited from notional interest deductions in Belgium although this tax incentive has reduced significantly in recent years due to lower interest rates. In addition, the Company benefits from various tax rulings and incentives the most significant of which are China’s granting of High and New Technology Enterprise status that reduces China’s corporate tax rate on local manufacturing profits by 10% and a hybrid Dutch/U.S. intra group financing structure. The impact of how these foreign tax rulings and benefits impact our tax rates is set out in detail in Note 16 of the Notes to the Consolidated Financial Statements.
Contingencies - We are subject to proceedings, lawsuits and other claims related to products and other matters. We are required to assess the likelihood of any adverse judgments or outcomes to these matters as well as potential ranges of probable and reasonably possible losses. A determination of the amount of liability to be recorded, if any, for these contingencies is made after careful analysis of each individual issue. It is reasonably possible that the Company could incur losses in excess of the amounts accrued. Although this amount cannot be estimated, we believe that any additional losses would not have a material adverse impact on the consolidated financial statements.
In conjunction with the Tax Sharing Agreement, as further discussed in Note 17 of Notes to the Consolidated Financial Statements, WABCO is responsible for certain tax and indemnification liabilities. These liabilities include indemnification liabilities to Trane of $0.1 million.
Seasonality
Our operations are directly related to the commercial vehicle industry. We may experience seasonal variations in the demand for our products to the extent that OEM vehicle production fluctuates, such as during July, August and December when North American and European OEM plants may close for summer shutdowns and holiday periods. Shut-down periods in the rest of the world may vary by country.
46
ITEM 7A. QUANTITATIVE AND QUALITATIVE DISCLOSURES ABOUT MARKET RISK
We are exposed to financial risk resulting from volatility in foreign currency exchange rates, interest rates and commodity prices. All of those risks are closely monitored.
Foreign Currency Exchange Rates
We conduct operations through controlled subsidiaries in most of the major countries of Western and Eastern Europe, Brazil, China, South Korea, India, Thailand and Japan as well as the United States. In addition, we conduct business in many countries through cross border sales and purchases, affiliated companies and partnerships in which we own 50% or less of the stock or partnership interest. As our financial statements are presented in U.S. Dollars, fluctuations in currency exchange rates can have a significant impact on the reported results of our operations, especially for the countries and currencies referred to above. Applying a Value-At-Risk (VAR) methodology to our foreign currency exchange rate exposure, across the translational and transactional exposures for the year 2016, the potential maximum loss in earnings is estimated to be $20 million which is based on a one-year horizon and a 95% confidence level. The VAR model is a risk analysis tool and does not purport to represent actual losses in fair value that could be incurred by us, nor does it consider the potential effect of favorable changes in market factors or our ability to pass on foreign exchange effects to commercial counterparties. See also Note 19 of Notes to the Consolidated Financial Statements.
Interest Rate Sensitivity
As of December 31, 2016, we had an aggregate outstanding debt balance of $959.1 million related primarily to our issuance of fixed-rate senior unsecured notes which are not exposed to any interest rate fluctuations. We had no outstanding floating rate debt under our revolving credit facilities.
We had $862.5 million of cash, cash equivalents and short-term investments on hand as of December 31, 2016. These balances are predominantly invested in interest bearing short-term instruments. Due to increased volatility in interest rates, a 1% change of the interest rates would have the effect of increasing or decreasing interest income by approximately $10 million.
Commodity Exposures
We are also exposed to fluctuations in commodity prices through the purchase of base metals and steel, mainly through contractual agreements with component suppliers. As we do not purchase these commodities directly, changes in their prices could affect our financial results with a time lag of up to 6 months.
Applying a VAR methodology to our 2016 commodity exposure, the potential maximum loss in earnings is estimated to be $29 million which is based on a one-year horizon and a 95% confidence level. The VAR model is a risk analysis tool and does not purport to represent actual losses in fair value that could be incurred by us, nor does it consider the potential effect of favorable changes in market factors or our ability to pass on effects to commercial counterparties.
47
Item 8. | Financial Statements and Supplementary Data |
Report of Independent Registered Public Accounting Firm
The Board of Directors and Shareholders of WABCO Holdings Inc. and Subsidiaries
We have audited the accompanying consolidated balance sheets of WABCO Holdings Inc. and subsidiaries as of December 31, 2016 and 2015, and the related consolidated statements of operations, comprehensive income, cash flows and shareholders' equity for each of the three years in the period ended December 31, 2016. Our audits also included the financial statement schedule listed in the Index at Item 15(a). These financial statements and schedule are the responsibility of the Company's management. Our responsibility is to express an opinion on these financial statements and schedule based on our audits.
We conducted our audits in accordance with the standards of the Public Company Accounting Oversight Board (United States). Those standards require that we plan and perform the audit to obtain reasonable assurance about whether the financial statements are free of material misstatement. An audit includes examining, on a test basis, evidence supporting the amounts and disclosures in the financial statements. An audit also includes assessing the accounting principles used and significant estimates made by management, as well as evaluating the overall financial statement presentation. We believe that our audits provide a reasonable basis for our opinion.
In our opinion, the financial statements referred to above present fairly, in all material respects, the consolidated financial position of WABCO Holdings Inc. and subsidiaries at December 31, 2016 and 2015, and the consolidated results of their operations and their cash flows for each of the three years in the period ended December 31, 2016, in conformity with U.S. generally accepted accounting principles. Also, in our opinion, the related financial statement schedule, when considered in relation to the basic financial statements taken as a whole, presents fairly in all material respects the information set forth therein.
We also have audited, in accordance with the standards of the Public Company Accounting Oversight Board (United States), WABCO Holdings Inc. and subsidiaries' internal control over financial reporting as of December 31, 2016, based on criteria established in the Internal Control-Integrated Framework issued by the Committee of Sponsoring Organizations of the Treadway Commission (2013 Framework) and our report dated February 17, 2017 expressed an unqualified opinion thereon.
Ernst & Young Bedrijfsrevisoren BCVBA/Reviseurs d'Entreprises SCCRL
Represented by:
/s/ Wim Van Gasse, Partner *
Brussels, Belgium
February 17, 2017
* Acting on behalf of a BVBA/SPRL
48
WABCO HOLDINGS INC. AND SUBSIDIARIES
CONSOLIDATED STATEMENTS OF OPERATIONS
Year Ended December 31, | |||||||||||
(Amounts in millions, except share and per share data) | 2016 | 2015 | 2014 | ||||||||
Sales | $ | 2,810.0 | $ | 2,627.5 | $ | 2,851.0 | |||||
Cost of sales | 1,935.9 | 1,842.0 | 1,979.3 | ||||||||
Gross Profit | 874.1 | 785.5 | 871.7 | ||||||||
Costs and expenses: | |||||||||||
Selling and administrative expenses | 377.7 | 368.4 | 386.8 | ||||||||
Research, development and engineering expenses | 135.2 | 139.5 | 145.0 | ||||||||
Other operating expense, net | 5.3 | 6.7 | 8.9 | ||||||||
Operating income | 355.9 | 270.9 | 331.0 | ||||||||
Equity income of unconsolidated joint ventures, net | 24.8 | 32.1 | 23.8 | ||||||||
Other non-operating income, net | 1.1 | 1.6 | 1.8 | ||||||||
Interest (expense)/income, net | (12.7 | ) | (7.1 | ) | 0.2 | ||||||
Income before income taxes | 369.1 | 297.5 | 356.8 | ||||||||
Income tax expense | 121.8 | 11.5 | 55.6 | ||||||||
Net income including noncontrolling interests | 247.3 | 286.0 | 301.2 | ||||||||
Less: net income attributable to noncontrolling interests | 24.3 | 10.8 | 9.7 | ||||||||
Net income attributable to Company | $ | 223.0 | $ | 275.2 | $ | 291.5 | |||||
Net income attributable to Company per common share | |||||||||||
Basic | $ | 4.00 | $ | 4.76 | $ | 4.87 | |||||
Diluted | $ | 3.98 | $ | 4.72 | $ | 4.81 | |||||
Cash dividends per share of common stock | $ | — | $ | — | $ | — | |||||
Weighted average common shares outstanding | |||||||||||
Basic | 55,695,738 | 57,768,018 | 59,907,763 | ||||||||
Diluted | 55,981,816 | 58,274,987 | 60,546,454 | ||||||||
See Notes to the Consolidated Financial Statements.
49
WABCO HOLDINGS INC. AND SUBSIDIARIES
CONSOLIDATED STATEMENTS OF COMPREHENSIVE INCOME
Year Ended December 31, | |||||||||||
(Amounts in millions) | 2016 | 2015 | 2014 | ||||||||
Net income including noncontrolling interests | $ | 247.3 | $ | 286.0 | $ | 301.2 | |||||
Currency translation adjustments | (55.0 | ) | (130.6 | ) | (144.9 | ) | |||||
Employee benefit plans adjustment, net | (15.9 | ) | 24.4 | (135.9 | ) | ||||||
Unrealized gains/(losses) on hedges, net | 0.2 | (1.2 | ) | — | |||||||
Unrealized gains on investment | — | — | 0.2 | ||||||||
Comprehensive income | $ | 176.6 | $ | 178.6 | $ | 20.6 | |||||
Less: Comprehensive income attributable to noncontrolling interests | 23.0 | 8.6 | 8.4 | ||||||||
Comprehensive income attributable to Company | $ | 153.6 | $ | 170.0 | $ | 12.2 | |||||
See Notes to the Consolidated Financial Statements.
50
WABCO HOLDINGS INC. AND SUBSIDIARIES
CONSOLIDATED BALANCE SHEETS
December 31, 2016 | December 31, 2015 | ||||||
(Amounts in millions, except share data) | |||||||
ASSETS | |||||||
Current assets: | |||||||
Cash and cash equivalents | $ | 862.5 | $ | 515.2 | |||
Short-term investments | — | 43.8 | |||||
Accounts receivable, less allowance for doubtful accounts of $6.5 in 2016 and $5.9 in 2015 | 493.7 | 444.0 | |||||
Inventories | 223.6 | 212.7 | |||||
Taxes receivable on income | — | 13.2 | |||||
VAT receivable | 65.1 | 37.9 | |||||
Guaranteed notes receivable | 53.6 | 53.9 | |||||
Investments in repurchase agreements | 128.7 | 38.3 | |||||
Other current assets | 46.8 | 27.4 | |||||
Total current assets | 1,874.0 | 1,386.4 | |||||
Property, plant and equipment, less accumulated depreciation | 408.6 | 398.0 | |||||
Goodwill | 399.2 | 377.7 | |||||
Deferred tax assets | 208.8 | 280.8 | |||||
Investments in unconsolidated joint ventures | 20.8 | 24.7 | |||||
Intangible assets, net | 78.9 | 62.8 | |||||
Other assets | 65.7 | 59.5 | |||||
TOTAL ASSETS | $ | 3,056.0 | $ | 2,589.9 | |||
LIABILITIES AND EQUITY | |||||||
Current liabilities: | |||||||
Loans payable to banks | $ | 0.2 | $ | 5.0 | |||
Accounts payable | 171.9 | 159.7 | |||||
Accrued payroll | 101.8 | 105.2 | |||||
Current portion of warranties | 32.2 | 23.1 | |||||
VAT payable | 40.1 | 23.0 | |||||
Accrued expenses | 69.4 | 61.9 | |||||
Promotion and customer incentives | 31.9 | 13.9 | |||||
Other accrued liabilities | 83.4 | 73.0 | |||||
Total current liabilities | 530.9 | 464.8 | |||||
Long-term debt | 958.9 | 498.7 | |||||
Pension and post-retirement benefits | 590.6 | 552.7 | |||||
Deferred tax liabilities | 138.8 | 137.1 | |||||
Long-term income tax liabilities | 2.9 | 16.3 | |||||
Other liabilities | 66.6 | 84.0 | |||||
Total liabilities | 2,288.7 | 1,753.6 | |||||
Shareholders’ equity: | |||||||
Preferred stock, 4,000,000 shares authorized; none issued and outstanding | — | — | |||||
Common stock, $.01 par value, 400,000,000 shares authorized; shares issued: 78,701,273 in 2016; 78,500,084 in 2015; and shares outstanding: 54,491,918 in 2016; 56,759,566 in 2015 | 0.8 | 0.8 | |||||
Capital surplus | 861.2 | 852.6 | |||||
Treasury stock, at cost: 24,209,355 shares in 2016; 21,740,518 shares in 2015 | (1,744.4 | ) | (1,497.3 | ) | |||
Retained earnings | 2,161.1 | 1,938.5 | |||||
Accumulated other comprehensive loss | (577.3 | ) | (507.9 | ) | |||
Total shareholders’ equity | 701.4 | 786.7 | |||||
Noncontrolling interests | 65.9 | 49.6 | |||||
Total equity | 767.3 | 836.3 | |||||
TOTAL LIABILITIES AND EQUITY | $ | 3,056.0 | $ | 2,589.9 | |||
See Notes to the Consolidated Financial Statements.
51
WABCO HOLDINGS INC. AND SUBSIDIARIES
CONSOLIDATED STATEMENTS OF CASHFLOWS
See Notes to the Consolidated Financial Statements.
Year Ended December 31, | |||||||||||
(Amounts in millions) | 2016 | 2015 | 2014 | ||||||||
Operating activities: | |||||||||||
Net income including noncontrolling interests | $ | 247.3 | $ | 286.0 | $ | 301.2 | |||||
Adjustments to reconcile net income to net cash provided by operating activities: | |||||||||||
Depreciation | 74.7 | 77.5 | 81.7 | ||||||||
Amortization of intangibles | 23.3 | 19.2 | 19.9 | ||||||||
Equity in earnings of unconsolidated joint ventures, net of dividends received | 3.9 | (4.7 | ) | (0.2 | ) | ||||||
Non-cash stock compensation | 13.1 | 12.0 | 15.5 | ||||||||
Non-cash interest expense and debt issuance cost amortization | 17.7 | 7.8 | — | ||||||||
Deferred income tax expense/(benefit) | 68.3 | (11.7 | ) | 4.5 | |||||||
Post-retirement benefit expense | 44.2 | 43.1 | 32.6 | ||||||||
Impairment of property, plant and equipment | 1.4 | 7.7 | 0.8 | ||||||||
(Gain)/loss on sale or disposal of property, plant and equipment | (0.6 | ) | 0.4 | 1.4 | |||||||
Changes in assets and liabilities: | |||||||||||
Accounts receivable, net | (61.5 | ) | (41.8 | ) | (123.9 | ) | |||||
Inventories | (3.9 | ) | (42.7 | ) | (2.5 | ) | |||||
Accounts payable | 21.7 | 52.1 | (18.3 | ) | |||||||
Other accrued liabilities and taxes | 63.9 | 23.1 | 15.2 | ||||||||
Other current and long-term assets | (40.7 | ) | (18.4 | ) | 27.5 | ||||||
Other long-term liabilities | (45.8 | ) | 13.5 | (8.0 | ) | ||||||
Pension and post-retirement benefit payments | (21.6 | ) | (22.8 | ) | (33.0 | ) | |||||
Net cash provided by operating activities | 405.4 | 400.3 | 314.4 | ||||||||
Investing activities: | |||||||||||
Purchases of property, plant and equipment | (104.0 | ) | (90.3 | ) | (123.8 | ) | |||||
Investments in capitalized software | (10.0 | ) | (10.9 | ) | (12.1 | ) | |||||
Proceeds from disposal of property, plant and equipment | 7.0 | 0.6 | — | ||||||||
(Purchases)/sales of short-term investments | (51.6 | ) | (81.6 | ) | 50.7 | ||||||
Cost of preferred stock investment | (0.9 | ) | (20.0 | ) | — | ||||||
Acquisition of businesses, net | (92.3 | ) | — | (125.9 | ) | ||||||
Net cash used by investing activities | (251.8 | ) | (202.2 | ) | (211.1 | ) | |||||
Financing activities: | |||||||||||
Borrowings of long-term debt and revolving credit facilities | 730.1 | 577.0 | 259 | ||||||||
Repayments of long-term revolving credit facilities | (261.0 | ) | (385.0 | ) | — | ||||||
Net repayments of short-term debt | (4.9 | ) | (2.7 | ) | (32.6 | ) | |||||
Settlement of forward contract | 15.2 | — | — | ||||||||
Taxes withheld and paid on employee stock award vestings | (6.0 | ) | (5.0 | ) | — | ||||||
Purchases of treasury stock | (250.0 | ) | (249.2 | ) | (351.5 | ) | |||||
Purchase of subsidiary shares from noncontrolling interest | — | — | (5.7 | ) | |||||||
Dividends to noncontrolling interest holders | (6.7 | ) | (6.4 | ) | (5.6 | ) | |||||
Proceeds from exercise of stock options | 3.9 | 17.3 | 15 | ||||||||
Net cash provided/(used) by financing activities | 220.6 | (54.0 | ) | (121.4 | ) | ||||||
Effect of exchange rate changes on cash and cash equivalents | (26.9 | ) | (40.6 | ) | (43.0 | ) | |||||
Net increase/(decrease) in cash and cash equivalents | 347.3 | 103.5 | (61.1 | ) | |||||||
Cash and cash equivalents at beginning of period | 515.2 | 411.7 | 472.8 | ||||||||
Cash and cash equivalents at end of period | $ | 862.5 | $ | 515.2 | $ | 411.7 | |||||
Cash paid during the period for: | |||||||||||
Interest | $ | 16.5 | $ | 10.1 | $ | 2.0 | |||||
Income taxes | $ | 50.8 | $ | 49.4 | $ | 48.4 | |||||
Non cash items for the period: | |||||||||||
Unrealized gains on investments | $ | — | $ | — | $ | 0.2 | |||||
52
WABCO HOLDINGS INC. AND SUBSIDIARIES
CONSOLIDATED STATEMENTS OF SHAREHOLDERS' EQUITY
(Amounts in millions) | Common Stock | Capital Surplus | Treasury Stock | Retained Earnings | Accumulated Other Comprehensive Income | Non Controlling Interests | Total | |||||||||||||||||||||
Balance at December 31, 2013 | $ | 0.8 | $ | 800.2 | $ | (896.6 | ) | $ | 1,371.8 | $ | (123.4 | ) | $ | 44.6 | $ | 1,197.4 | ||||||||||||
Net income | — | — | — | 291.5 | — | 9.7 | 301.2 | |||||||||||||||||||||
Other comprehensive loss | — | — | — | — | (279.3 | ) | (1.3 | ) | (280.6 | ) | ||||||||||||||||||
Treasury stock purchased | — | — | (351.5 | ) | — | — | (351.5 | ) | ||||||||||||||||||||
Stock options exercised | — | 14.9 | — | — | — | — | 14.9 | |||||||||||||||||||||
Stock-based compensation | — | 13.2 | — | — | — | — | 13.2 | |||||||||||||||||||||
Dividends paid | — | — | — | — | — | (5.6 | ) | (5.6 | ) | |||||||||||||||||||
Balance at December 31, 2014 | $ | 0.8 | $ | 828.3 | $ | (1,248.1 | ) | $ | 1,663.3 | $ | (402.7 | ) | $ | 47.4 | $ | 889.0 | ||||||||||||
Net income | — | — | — | 275.2 | — | 10.8 | 286.0 | |||||||||||||||||||||
Other comprehensive loss | — | — | — | — | (105.2 | ) | (2.2 | ) | (107.4 | ) | ||||||||||||||||||
Treasury stock purchased | — | — | (249.2 | ) | — | — | — | (249.2 | ) | |||||||||||||||||||
Stock options exercised | — | 17.3 | — | — | — | — | 17.3 | |||||||||||||||||||||
Stock-based compensation | — | 7.0 | — | — | — | — | 7.0 | |||||||||||||||||||||
Dividends paid | — | (6.4 | ) | (6.4 | ) | |||||||||||||||||||||||
Balance at December 31, 2015 | $ | 0.8 | $ | 852.6 | $ | (1,497.3 | ) | $ | 1,938.5 | $ | (507.9 | ) | $ | 49.6 | $ | 836.3 | ||||||||||||
Net income | — | — | — | 223.0 | — | 24.3 | 247.3 | |||||||||||||||||||||
Other comprehensive loss | — | — | — | — | (69.4 | ) | (1.3 | ) | (70.7 | ) | ||||||||||||||||||
Treasury stock purchased | — | — | (250.0 | ) | — | — | — | (250.0 | ) | |||||||||||||||||||
Stock options exercised | — | 3.9 | — | — | — | — | 3.9 | |||||||||||||||||||||
Treasury stock reissued | — | (2.9 | ) | 2.9 | — | — | — | — | ||||||||||||||||||||
Stock-based compensation (1) | — | 7.6 | — | (0.4 | ) | — | — | 7.2 | ||||||||||||||||||||
Dividends paid | — | — | — | — | — | (6.7 | ) | (6.7 | ) | |||||||||||||||||||
Balance at December 31, 2016 | $ | 0.8 | $ | 861.2 | $ | (1,744.4 | ) | $ | 2,161.1 | $ | (577.3 | ) | $ | 65.9 | $ | 767.3 | ||||||||||||
(1) Includes the impact of the adoption on a modified retrospective basis of the provisions under ASU 2016-09 related to forfeiture rates amounting to $0.4 million as discussed in Note 3 of Notes to the Consolidated Financial Statements.
See Notes to the Consolidated Financial Statements.
53
WABCO HOLDINGS INC. AND SUBSIDIARIES
NOTES TO THE CONSOLIDATED FINANCIAL STATEMENTS
December 31, 2016
NOTE 1. | Description of Company |
WABCO Holdings Inc. and its subsidiaries (collectively WABCO or the Company) engineers, develops, manufactures and sells integrated systems controlling advanced braking, stability, suspension and transmission automation as well as air compression and processing primarily for commercial vehicles. WABCO’s largest selling products are pneumatic ABS, EBS, ESC, automated manual transmission systems, air disc brakes and a large variety of conventional mechanical products such as actuators, air compressors and air control valves for medium- and heavy-duty trucks, buses and trailers. In addition, we supply commercial vehicle aftermarket distributors and service partners as well as fleet operators with replacement parts, fleet management solutions, diagnostic tools, training and other expert services. WABCO sells its products to four groups of customers around the world: truck and bus OEMs, trailer OEMs, commercial vehicle aftermarket distributors of replacement parts and services and commercial vehicle fleet operators for management solutions and services, and major automotive OEMs. We also provide remanufacturing services globally.
WABCO was founded in the United States in 1869 as Westinghouse Air Brake Company. The Company was purchased by American Standard Companies Inc. (American Standard) in 1968 and operated as the Vehicle Control Systems business division within American Standard until the Company was spun off from American Standard on July 31, 2007. Subsequent to the spin-off, American Standard changed its name to Trane Inc., which is herein referred to as “Trane.” On June 5, 2008, Trane was acquired in a merger with Ingersoll-Rand Company Limited (Ingersoll Rand) and exists today as a wholly owned subsidiary of Ingersoll Rand.
The spin-off by Trane of its Vehicle Control Systems business became effective on July 31, 2007, through a distribution of 100% of the common stock of WABCO to Trane's shareholders (the Distribution). The Distribution was effected through a separation and distribution agreement pursuant to which Trane distributed all of the shares of WABCO common stock as a dividend on Trane common stock, in the amount of one share of WABCO common stock for every three shares of outstanding Trane common stock to each shareholder on the record date. Trane received a private letter ruling from the Internal Revenue Service and an opinion from tax counsel indicating that the spin-off was tax free to the shareholders of Trane and WABCO.
Based on the organizational structure, as well as the nature of financial information available and reviewed by the Company’s chief operating decision maker to assess performance and make decisions about resource allocations, the Company has concluded that its total WABCO operations represent one reportable segment.
NOTE 2. | Summary of Significant Accounting Policies |
Use of Estimates - The preparation of consolidated financial statements in conformity with U.S. GAAP requires management to make estimates and assumptions that affect the amounts reported in the consolidated financial statements and accompanying notes. Management believes the most complex and sensitive judgments, because of their significance to the condensed consolidated financial statements, result primarily from the need to make estimates about the effects of matters that are inherently uncertain. Actual results could differ from those estimates. Some of the most significant estimates included in the preparation of the consolidated financial statements are related to revenue recognition, inventory reserves, goodwill, warranties, post-retirement benefits, valuation of equity and cost method investments, income taxes, business combinations and stock-based compensation. Allocation methods are described in the notes to these consolidated financial statements where appropriate.
Principles of Consolidation and Presentation - All majority owned or controlled subsidiaries of WABCO are included in the consolidated financial statements and intercompany transactions are eliminated upon consolidation. WABCO investments in unconsolidated joint ventures are included at cost plus its equity in undistributed earnings in accordance with the equity method of accounting and reflected as investments in unconsolidated joint ventures in the consolidated balance sheets. Certain amounts in the prior years' consolidated financial statements have been reclassified to conform to the current year presentation.
Out-Of-Period Noncontrolling Interest Correction - In December 2016, the Company identified an error to net income attributable to noncontrolling interests recognized in its prior period financial statements from 2011 through 2015. The Company determined that a portion of income on one of our consolidated affiliates had been incorrectly attributed to WABCO instead of the noncontrolling interest. The cumulative impact of this prior period error as of December 31, 2016 was an understatement of net income attributable to noncontrolling interest of $12.3 million. The Company assessed the materiality of this non-cash error
54
on the consolidated financial statements considering the relevant quantitative and qualitative factors, and concluded that the error was not material to any of its prior period financial statements. The Company also concluded that recording an out-of-period correction to the consolidated financial statements for the fiscal year ended December 31, 2016 would not be material to the current period financial statements. Consequently, the out-of-period correction of this error was recorded in the fourth quarter ended December 31, 2016 by increasing net income attributable to noncontrolling interests and noncontrolling interests on the balance sheet by $12.3 million.
Foreign Currency Translation - Adjustments resulting from translating foreign functional currency assets and liabilities into U.S. Dollars at exchange rates in effect as of the balance sheet date, and income and expense accounts at the average exchange rates in effect during the period, are recorded in a separate component of shareholders' equity as accumulated other comprehensive income. Gains or losses resulting from transactions in other than the functional currency are reflected in the consolidated statements of operations as part of other non-operating income or expense, except for intercompany transactions of a long-term investment nature where the foreign exchange gains or losses from the remeasurement of such intercompany transactions is recorded within accumulated other comprehensive income.
Revenue Recognition - Sales of products are recorded when (i) title and risk of loss have transferred to the customer, (ii) persuasive evidence of an arrangement exists with the customer, (iii) the sales price is fixed and determinable, and (iv) the collectability of the sales price is reasonably assured. Amounts billed to customers for shipping and handling costs are included in sales.
Certain of the Company's product offerings contain multiple deliverables including hardware with embedded firmware, back office hosting services, unspecified software upgrades and enhancements related to these products through service contracts, which are considered separate units of accounting. For products under these arrangements, the software and non-software components function together to deliver the tangible product’s essential functionality. The Company allocates revenue to each element in these multiple-element arrangements based upon the relative selling prices of each deliverable.
In evaluating the revenue recognition for the Company's multiple-element arrangements, the Company determined that in certain cases, vendor specific objective evidence (VSOE) of selling price could not be established for some or all deliverables in the arrangement as the Company infrequently sold each element on a standalone basis, did not price products within a narrow range, or had a limited sales history. When VSOE cannot be established for an element, the Company attempts to establish the selling price of the element using third-party evidence (TPE) based on competitor prices for similar deliverables sold separately. However, the Company is typically not able to establish TPE as we are unable to reliably determine the standalone selling prices of similar competitor products.
When neither VSOE nor TPE can be established for an element, the Company uses its best estimate of selling price (BESP) in the allocation of arrangement consideration. BESP represents the price at which the Company would transact a sale if the element were sold on a standalone basis. The Company determines BESP for an element by considering multiple factors including, but not limited to, the Company's go-to-market strategy, pricing practices, internal costs, gross margin, market conditions and geographies. Revenue allocated to each element is then recognized when the other revenue recognition criteria are met for that element.
The Company records cooperative advertising allowances, rebates and other forms of sales incentives as a reduction of sales at the later of the date of the sale or the date the incentive is offered. For these costs, the Company recorded $53.8 million, $43.2 million and $43.0 million in 2016, 2015 and 2014, respectively, in the accompanying consolidated statements of operations.
In most countries where WABCO operates, sales are subject to VAT taxes. Sales are presented net of VAT in the consolidated statements of operations.
Shipping and Handling Costs - Shipping, handling, receiving, inspecting, warehousing, internal transfer, procurement and other costs of distribution are included in cost of sales in the consolidated statements of operations.
Cash and Cash Equivalents - Cash equivalents include all highly liquid investments with maturity of three months or less when purchased. The Company classifies cash and cash equivalents that are restricted from operating use for the next twelve months as restricted cash. Amounts restricted for longer than twelve months are classified as other assets. When restrictions are no longer in place, the amounts are reclassified to cash and cash equivalents.
Available-for-Sale Investments - Investments may consist of mutual funds or deposit funds holding primarily term deposits, certificates of deposit and short-term bonds. The investments are classified as available-for-sale and are recorded in the consolidated financial statements at market value with changes in market value included in other comprehensive income. The Company
55
classifies its investments as either short-term or long-term based on the nature of the investments, its availability of use in current operations and the Company's holding intention. The fair value of the investments is determined based on readily available pricing sources for identical instruments in less active markets (Level 2). In the event the investments experience an other-than-temporary impairment in value, such impairment is recognized as a loss in the consolidated statements of operations. As of December 31, 2016, the Company had no short-term investments and had $2.6 million of long-term investments that have been included in "other assets" on the consolidated balance sheets.
Allowance for Doubtful Accounts - The Company performs ongoing credit evaluations on its customers. In determining the allowance for doubtful accounts, on a monthly basis, WABCO analyzes the aging of accounts receivable, historical bad debts, customer creditworthiness, availability of credit insurance and current economic trends.
Transfers of Financial Instruments - The Company accounts for sales and transfers of financial instruments under ASC 860, Transfers and Servicing. ASC 860 states that a transfer of financial assets (either all or a portion of a financial asset) in which the transferor surrenders control over those financial assets shall be accounted for as a sale to the extent that consideration other than beneficial interests in the transferred assets is received in exchange. The Company may sell receivables to the bank which qualify as financial assets since they are associated with the sale of products by the subsidiaries of the Company and accepted by the Company's customers in the ordinary course of business. Where such receivables sold to the bank, the risks of collection of such receivables reside with the bank. Therefore, upon sale of the receivables to the bank, the appropriate reversal of any applicable accounts receivable allowances is recorded by the Company.
Inventory Reserves - Inventory costs are determined by the use of the last-in, first-out (LIFO) method, and are stated at the lower of such cost or market. The LIFO method is used as it provides a better matching of the costs to the sales. Inventories are categorized as finished products, products-in-process and raw materials. On a quarterly basis, the Company tests its inventory for slow moving and obsolete stock by considering both the historical and expected sales and the Company will record a provision, if needed.
Property, Plant & Equipment - Property, plant and equipment balances, including tooling, are stated at cost less accumulated depreciation. WABCO capitalizes costs, including interest during construction of fixed asset additions, improvements, and betterments that add to productive capacity or extend the asset life. WABCO assesses facilities for impairment when events or circumstances indicate that the carrying amount of these assets may not be recoverable. Maintenance and repair expenditures are expensed as incurred. Depreciation and amortization are computed on the straight-line method based on the estimated useful life of the asset or asset group, which are 40 years for buildings, 3 to 5 years for tooling and 5 to 15 years for machinery and equipment.
Capitalized Software Costs - WABCO capitalizes the costs of obtaining or developing internal-use computer software, including directly related payroll costs. The Company amortizes those costs on a straight-line basis over periods of up to seven years, beginning when the software is ready for its intended use. The Company assesses capitalized software costs for impairment when events or circumstances indicate that the carrying amount of these assets may not be recoverable.
Equity and Cost Method Investments - We have investments that are accounted for using the equity method. Our proportionate share of income or losses from investments accounted for under the equity method is recorded in the consolidated statements of operations. We write down or write off an investment and recognize a loss when events or circumstances indicate there is impairment in the investment that is other-than-temporary. This includes assessing the investees’ financial condition as well as the investees’ historical and projected results of operations and cash flows. If the actual outcomes for the investees are significantly different from projections, we may incur future charges for the impairment of these investments. Our investment in equity method investees was $20.8 million and $24.7 million at December 31, 2016 and 2015, respectively, net of our proportionate share of the results of their operations and dividends received. Investments for which we do not have significant influence are accounted for under the cost method, the aggregate balance of which was $20.9 million and $20.0 million at December 31, 2016 and December 31, 2015, respectively.
There has been no impairment of equity or cost method investments during each of the years presented in the consolidated statements of operations. The Company's equity method investments were not at risk of impairment. The Company's fair value calculation of the cost method investment exceeded its carrying value of $20.9 million by approximately 6% as of December 31, 2016. The fair value calculation is dependent on sales and cost forecasts being met and includes numerous assumptions.
Goodwill - The Company has a significant amount of goodwill on its balance sheet that is not amortized, but subject to impairment tests each fiscal year on October 1 or more often when events or circumstances indicate that the carrying amount of goodwill may not be recoverable. The Company's impairment tests utilize the two-step approach. The first step of the goodwill impairment test compares fair value of a reporting unit with its carrying amount, including goodwill. If the fair value of a reporting unit exceeds its carrying amount, goodwill of the reporting unit is not considered impaired and thus the second step of the impairment
56
test is unnecessary. If the carrying amount of a reporting unit exceeds its fair value, the second step of the goodwill impairment test shall be performed to measure the amount of impairment loss, if any. The second step of the goodwill impairment test compares the implied fair value of reporting unit goodwill with the carrying amount of that goodwill. If the carrying amount of reporting unit goodwill exceeds the implied fair value of that goodwill, an impairment loss shall be recognized in an amount equal to that excess.
The recoverability of goodwill is measured based on one reporting unit for the total Company. Our plants, engineering, technical support, distribution centers and other support functions are shared among various product families and serve all distribution channels with many customers. Based on the organizational structure, as well as the nature of financial information available and reviewed by the Company's chief operating decision maker to assess performance and make decisions about resource allocations, the Company has concluded that its total WABCO operations represent one reportable segment. In order to approximate the fair value of the reporting unit for purposes of testing recoverability, we use the total market capitalization of the Company, a market approach, which is then compared to the total book value of the Company. In the event the Company's fair value has fallen below book value, the Company will compare the estimated fair value of goodwill to its book value. If the book value of goodwill exceeds the estimated fair value of goodwill, the Company will recognize the difference as an impairment loss in operating income. There has been no impairment of goodwill during each of the years presented in the consolidated statements of operations.
Other Intangible Assets with Determinable Lives - Other intangible assets with determinable lives consist of customer and distribution relationships, patented and unpatented technology, in-process research and development, and other intangibles and are amortized on a straight-line basis over their estimated useful lives, ranging from 1 to 20 years. WABCO assesses intangible assets for impairment when events or circumstances indicate that the carrying amount of these assets may not be recoverable.
Warranties - Products sold by WABCO are covered by a basic limited warranty with terms and conditions that vary depending upon the product and country in which it was sold. The limited warranty covers the equipment, parts and labor (in certain cases) necessary to satisfy the warranty obligation generally for a period of two years. Estimated product warranty expenses are accrued in cost of sales at the time the related sale is recognized. Estimates of warranty expenses are based primarily on warranty claims experience and specific customer contracts. Warranty expenses include accruals for basic warranties for product sold, as well as accruals for product recalls, service campaigns and other related events when they are known and estimable, less costs recoverable from suppliers related to warranty claims. To the extent WABCO experiences changes in warranty claim activity or costs associated with servicing those claims, its warranty accrual is adjusted accordingly. Warranty accrual estimates are updated based upon the most current warranty claims information available. The Company's warranty costs as a percentage of sales totaled 0.8% in 2016, 1.0% in 2015 and 0.9% in 2014. See Note 15 for a summary of warranties.
Pension and Post-retirement Benefits - All pension and post-retirement benefits are accounted for on an accrual basis using actuarial assumptions. Pension and post-retirement pension benefits are provided for substantially all employees of WABCO, both in the United States and abroad through plans specific to each of WABCO's legal entities. In addition, in the United States, certain employees receive post-retirement health care and life insurance benefits. The impact of Health Care Reform legislation in the United States is immaterial to the Company. The costs of the benefits provided through plans of WABCO are included in the accompanying consolidated financial statements and summarized in detail along with other information pertaining to these plans in Note 13. Pension plans are primarily concentrated in the United Kingdom, Austria, Germany, Switzerland and Belgium.
WABCO is also required to measure a defined benefit post-retirement plan's assets and obligations that determine its funded status as of the end of the employer's fiscal year, and recognize changes in the funded status of a defined benefit post-retirement plan in comprehensive income in the year in which the changes occur.
Fair Value of Financial Instruments - Financial instruments consist mainly of cash, accounts receivable, accounts payable and loans payable to banks. As of December 31, 2016 and 2015, the carrying amounts of these instruments approximated their fair values. Long-term debt also approximated fair value as of December 31, 2016 and 2015.
Derivative Instruments and Hedging Activities - The Company recognizes all derivative financial instruments in the consolidated financial statements at fair value. Changes in the fair value of derivative financial instruments which qualify for hedge accounting are recorded as an offset to the changes in fair value of the underlying hedged item and are included in other non-operating expense, net or other operating expense, net. See Note 20 for further details on derivative instruments.
Research, Development and Engineering Expenses - Research and development costs are expensed as incurred. WABCO expended approximately $135.2 million in 2016, $139.5 million in 2015 and $145.0 million in 2014 for research activities, product development and for product engineering.
57
Business Combinations - We allocate the fair value of purchase consideration to the assets acquired, liabilities assumed, and non-controlling interests in the acquiree generally based on their fair values at the acquisition date. The excess of the fair value of purchase consideration over the fair value of these assets acquired, liabilities assumed and non-controlling interests in the acquiree is recorded as goodwill. When determining the fair values of assets acquired, liabilities assumed, and non-controlling interests in the acquiree, management makes significant estimates and assumptions, especially with respect to intangible assets. Critical estimates in valuing intangible assets include, but are not limited to, expected future cash flows, which includes consideration of future growth rates and margins, attrition rates, future changes in technology and brand awareness, loyalty and position, and discount rates. Fair value estimates are based on the assumptions management believes a market participant would use in pricing the asset or liability. Amounts recorded in a business combination may change during the measurement period, which is a period not to exceed one year from the date of acquisition, as additional information about conditions existing at the acquisition date becomes available.
Income Taxes - Deferred income taxes are determined on the liability method, and are recognized for all temporary differences between the tax basis of assets and liabilities and their reported amounts in the consolidated financial statements. No provision is made for U.S. income taxes applicable to undistributed earnings of foreign subsidiaries that are permanently reinvested outside of the U.S., except for Brazil's current year earnings and $300 million of unremitted foreign earnings related to a Belgian affiliate resulting from the receipt of an exceptional refund including interest from the European Commission related to the Company’s appeal of a fine previously assessed by the European Commission as discussed in our 2013 Form 10-K. This deferred U.S tax on undistributed earnings is offset by applicable deferred foreign taxes to enable our Dutch international holding company or its subsidiaries to make the $300 million distribution to the U.S. and to enable additional investments in foreign operations.
A tax position is a position in a previously filed tax return or a position expected to be taken in a future tax filing that is reflected in measuring current or deferred income tax assets and liabilities. Tax positions are recognized only when it is more likely than not (likelihood of greater than 50%) based on technical merits, that the position will be sustained upon examination. Tax positions that meet the more likely than not threshold are measured using a probability weighted approach as the largest amount of tax benefit that is greater than 50% likely of being realized upon settlement. Tax positions are not permitted to be recognized, derecognized, or remeasured due to changes subsequent to the balance sheet date, but prior to the issuance of the financial statements. Rather, these changes are recorded in the period the change occurs with appropriate disclosure of such subsequent events, if significant.
We record a valuation allowance to reduce our deferred tax assets to the amount that we believe is more likely than not to be realized. We calculate this valuation allowance in accordance with the provisions of ASC 740, Income Taxes, which requires an assessment of both positive and negative evidence regarding the realizability of these deferred tax assets, when measuring the need for a valuation allowance. While we have considered future taxable income and ongoing prudent and feasible tax planning strategies in assessing the need for the valuation allowance, in the event we were to determine that we would not be able to realize all or part of our net deferred tax assets in the future, an adjustment to decrease the net deferred tax assets would be charged to income in the period such determination was made. Likewise, should we determine that we would be able to realize our deferred tax assets in the future in excess of our net recorded amount, an adjustment to increase the net deferred tax assets would increase income in the period such determination was made.
Earnings Per Share - Basic net income per share has been computed using the weighted average number of WABCO common shares outstanding. The average number of outstanding shares of common stock used in computing diluted net income per share includes weighted average incremental shares when the impact is not anti-dilutive. The weighted average incremental shares represent the net amount of shares the Company would issue upon the assumed exercise of in-the-money stock options and vesting of restricted stock units (RSUs) and deferred stock units (DSUs) after assuming that the Company would use the proceeds from the exercises to repurchase stock. The weighted average incremental shares also includes the net amount of shares issuable for performance stock units (PSUs) at the end of the reporting period, if any at all, based on the number of shares issuable if the end of the period were the end of the vesting period.
Anti-dilutive shares, if applicable, are excluded and represent those options, RSUs, PSUs and DSUs whose assumed proceeds were greater than the average price of the Company's common stock.
Year Ended December 31, | ||||||
2016 | 2015 | 2014 | ||||
Weighted average incremental shares included | 286,078 | 506,969 | 638,691 | |||
Shares excluded due to anti-dilutive effect | 472 | — | — | |||
58
Comprehensive Income/(Loss) - Comprehensive income/(loss) consists of net income, foreign currency translation adjustments (including that on intercompany transactions of a long-term investment nature), pension liability adjustments, unrecognized gains or losses on post-retirement benefit plans, unrecognized gains or losses on investments and unrecognized gains or losses on hedges, and is presented in the accompanying consolidated statements of shareholders' equity and comprehensive income.
Stock-Based Compensation - WABCO measures and recognizes in its consolidated statements of operations the expense associated with all share-based payment awards made to employees and directors including stock options, RSUs, PSUs, DSUs and restricted stock grants based on estimated fair values.
All options granted prior to 2007 were adjusted upon the Distribution into two separate options, one relating to the Company's common stock and one relating to Trane common stock. This adjustment was made such that immediately following the Distribution (i) the number of shares relating to the Company options were equal to the number of shares of Company common stock that the option holder would have received in the Distribution had Trane options represented outstanding shares of Trane common stock, and (ii) the per share option exercise price of the original Trane stock option was proportionally allocated between the two types of stock options based upon the relative per share trading prices of the Company and Trane immediately following the Distribution. Thus, upon the Distribution, WABCO options are being held by both WABCO and Trane employees and Trane options continued to be held by WABCO employees. Options granted to WABCO employees in 2007 were equitably adjusted upon Distribution so as to relate solely to shares of the Company's common stock. These adjustments preserved the economic value of the awards immediately prior to the Distribution. All Company options issued as part of this adjustment and the Trane options are fully vested at this time. Further, for purposes of vesting and the post-termination exercise periods applicable to such stock options, the Trane Inc. Management Development and Compensation Committee determined that continued employment with the Company will be viewed as continued employment with the issuer of the options.
Outstanding WABCO options held by non-WABCO employees or directors that arose as a result of the Distribution are not reflected in compensation expense recognized by the Company. Consequently, these stock options do not result in any tax benefits to the Company at any time. The WABCO options held by non-employees or directors are considered in the Company's diluted EPS calculation.
NOTE 3. | Recently Issued Accounting Standards |
Recently Adopted Accounting Standards
The adoption of recently issued accounting standards did not have a material impact on the consolidated financial statements.
In March 2016, the FASB issued Accounting Standards Update 2016-09 (ASU 2016-09) Compensation - Stock Compensation, in order to simplify certain aspects of the accounting for share-based payment award transactions, including income tax consequences, classification of awards as either equity or liability, classification of excess tax benefits, and taxes withheld and paid on employee stock award vestings on the statement of cash flows. ASU 2016-09 requires that companies elect to account for forfeitures based on an estimate of the number of awards for which the requisite service period will not be rendered or to account for forfeitures as they occur. ASU 2016-09 is effective for the interim and annual periods ending after December 15, 2016. Early adoption is permitted, and the Company adopted the provisions of ASU 2016-09 as of January 1, 2016. The impact from adoption of the provisions related to forfeiture rates was reflected in the Company's consolidated financial statements on a modified retrospective basis, resulting in an adjustment of $0.4 million to retained earnings as of January 1, 2016. Provisions related to income taxes were adopted prospectively resulting in a tax benefit of $1.3 million for 2016. Provisions related to the statement of cash flows were also adopted retrospectively.
In November 2015, the FASB issued ASU 2015-17 Balance Sheet Classification of Deferred Taxes, which requires that deferred tax assets and deferred tax liabilities be classified as noncurrent in the balance sheet. ASU 2015-17 is effective for the interim and annual periods ending after December 15, 2016. Early adoption is permitted, and the Company adopted the provisions of ASU 2015-17 as of December 31, 2015.
In June 2015, the FASB issued ASU 2015-10 Technical Corrections and Improvements, which clarifies various topics in the FASB Accounting Standards Codification. ASU 2015-10 is effective for the interim and annual periods ending after December 15, 2015. The Company adopted the provisions of ASU 2015-10 as of December 31, 2015. There was no impact from adoption of this guidance on the Company's consolidated financial statements.
59
In April 2015, the FASB issued ASU 2015-03 Simplifying the Presentation of Debt Issuance Costs, which require debt issuance costs to be presented in the balance sheet as a direct deduction from the carrying value of the associated debt liability, consistent with the presentation of a debt discount. ASU 2015-03 is effective for the interim and annual periods ending after December 15, 2015. Early adoption is permitted, and the Company adopted the provisions of ASU 2015-03 retrospectively as of June 30, 2015. There was no impact from adoption of this guidance on prior period information presented in the Company's consolidated financial statements.
In August 2014, the FASB issued ASU 2014-15 Presentation of Financial Statements - Going Concern, which provide guidance about management's responsibility in evaluating whether there is substantial doubt relating to an entity’s ability to continue as a going concern and to provide related footnote disclosures as applicable. ASU 2014-15 is effective for the interim and annual periods ending after December 15, 2016 and the Company adopted the provisions of ASU 2014-15 as of December 31, 2016. There was no impact from adoption of this guidance on the Company's consolidated financial statements.
Pending Adoptions of Recently Issued Accounting Standards
In October 2016, the FASB issued ASU 2016-16 Intra-entity Transfer of Assets Other the Inventory, which requires the recognition of the income tax consequences of an intra-entity transfer of an asset, other than inventory, when the transfer occurs. ASU 2016-16 is effective for interim and annual periods beginning after December 15, 2017. Early adoption is permitted. The Company does not expect any material impact from adoption of this guidance on the Company's consolidated financial statements.
In August 2016, the FASB issued ASU 2016-15 Statement of Cash Flows - Classification of Certain Cash Receipts and Cash Payments, which provides guidance on the presentation of certain cash receipts and cash payments in the statement of cash flows in order to reduce diversity in existing practice. ASU 2016-15 is effective for interim and annual periods beginning after December 15, 2017. Early adoption is permitted. The Company does not expect any material impact from adoption of this guidance on the Company's consolidated financial statements.
In February 2016, the FASB issued ASU 2016-02 Leases, which requires lessees to recognize most leases on the balance sheet. ASU 2016-02 is effective for the interim and annual periods in fiscal years beginning after December 15, 2018. The Company is currently assessing the potential impact of the adoption of this guidance on the Company's consolidated financial statements.
In May 2014, the FASB issued ASU 2014-09 Revenue from Contracts with Customers, which is a new comprehensive revenue recognition standard on the financial reporting requirements for revenue from contracts entered into with customers. ASU 2014-09 requires revenue to be recognized when a customer obtains control of promised goods or services at an amount that reflects the consideration which the Company expects to receive in exchange for those goods or services. In addition, ASU 2014-09 requires certain additional disclosure around the nature, amount, timing, and uncertainty of revenue and cash flows arising from contracts with customers.
ASU 2014-09 was initially effective for interim and annual periods beginning after December 15, 2016. The FASB subsequently deferred the effective date of this standard to December 15, 2017 with early adoption permitted as of December 15, 2016. The Company currently anticipates adopting ASU 2014-09 in the annual period beginning January 1, 2018.
ASU 2014-09 permits two methods of adoption, either retrospectively to each prior reporting period presented (full retrospective method), or retrospectively with the cumulative effect of initially applying the guidance recognized at the date of initial application (the modified retrospective method). We currently anticipate adopting ASU 2014-09 using the full retrospective method along with a number of practical expedients available under the standard. Successful adoption of ASU 2014-09 is contingent on the completion of the analysis of cumulative impact on prior periods’ financial information as well as accounting information system upgrades, including software procured from third-party providers being completed on schedule.
While we are still evaluating all potential impacts of ASU 2014-09, we currently believe the most significant impact relates to our accounting for revenue in relation to our product engineering activities, and from our sales to OEM customers. Specifically, under ASU 2014-09 we expect to recognize certain reimbursements received from customers related to product engineering as revenue. We are also assessing whether revenue from product sales to OEM customers with no alternative use should be recognized over time instead of at a point in time. Due to the complexity of certain of our agreements with OEM customers, the actual revenue recognition treatment required under ASU 2014-09 will be dependent on contract-specific terms, and may vary in some instances.
We do not expect the pending adoption of other recently issued accounting standards to have an impact on the consolidated financial statements.
60
NOTE 4. | Accumulated Other Comprehensive Loss |
The table below presents the changes in accumulated other comprehensive loss for the years ended December 31, 2016, 2015 and 2014:
Year Ended December 31, | |||||||||||
(Amount in millions) | 2016 | 2015 | 2014 | ||||||||
Foreign currency translation adjustments (1): | |||||||||||
Balance at beginning of period | $ | (271.2 | ) | $ | (148.1 | ) | $ | (5.5 | ) | ||
Adjustment for the period | (57.5 | ) | (123.1 | ) | (142.6 | ) | |||||
Balance at end of period | (328.7 | ) | (271.2 | ) | (148.1 | ) | |||||
Losses on intra-entity transactions (2): | |||||||||||
Balance at beginning of period | (15.2 | ) | (9.9 | ) | (8.9 | ) | |||||
Adjustment for the period | 3.8 | (5.3 | ) | (1.0 | ) | ||||||
Balance at end of period | (11.4 | ) | (15.2 | ) | (9.9 | ) | |||||
Unrealized gains on investments: | |||||||||||
Balance at beginning of period | 0.2 | 0.2 | — | ||||||||
Adjustment for the period | — | — | 0.4 | ||||||||
Amounts reclassified to earnings, net | — | — | (0.2 | ) | |||||||
Balance at end of period | 0.2 | 0.2 | 0.2 | ||||||||
Unrealized losses on hedges: | |||||||||||
Balance at beginning of period | (1.2 | ) | — | — | |||||||
Adjustment for the period (3) | — | (1.3 | ) | — | |||||||
Amounts reclassified to earnings, net | 0.2 | 0.1 | — | ||||||||
Balance at end of period | (1.0 | ) | (1.2 | ) | — | ||||||
Pension and Post-retirement Plans: | |||||||||||
Balance at beginning of period | (220.5 | ) | (244.9 | ) | (109.0 | ) | |||||
Other comprehensive income before reclassifications | (26.5 | ) | 12.9 | (140.1 | ) | ||||||
Amounts reclassified to earnings, net (4) | 10.6 | 11.5 | 4.2 | ||||||||
Balance at end of period | (236.4 | ) | (220.5 | ) | (244.9 | ) | |||||
Accumulated other comprehensive loss at end of period | $ | (577.3 | ) | $ | (507.9 | ) | $ | (402.7 | ) | ||
(1) This accumulated other comprehensive loss component includes the realized gain on settled forward contracts accounted for as net investment hedges of $9.3 million, net of taxes of $5.8 million. Additionally, this component includes the unrealized gain on the Senior EUR notes, which have been designated as a net investment hedge, of $6.3 million, net of taxes of $3.9 million. See Note 20 for further discussion.
(2) Relates to intra-entity foreign currency transactions that are of a long term investment nature, when the entities to the transaction are consolidated, combined or accounted for by the equity method in the Company's financial statements.
(3) The adjustment for the period is net of taxes of $0.7 million for the year ended December 31, 2015. See Note 20 for further discussion.
61
(4) This accumulated other comprehensive income component, net of taxes of $4.5 million, $4.6 million and $1.9 million for the years ended December 31, 2016, 2015 and 2014, respectively, is included in the computation of net periodic pension cost. See Note 13 for additional details.
NOTE 5. | Streamlining |
The Company accounts for employee-related streamlining charges as either a one-time benefit arrangement or an ongoing benefit arrangement as appropriate. From time to time the Company also has streamlining charges that are not related to employees, such as facility exit costs.
In the third quarter of 2015, the Company announced proposals to cease manufacturing at two production facilities to preserve the Company's global competitiveness for certain mechanical products. These proposals would result in a workforce reduction of approximately 320 positions and includes a smaller program initiated in the fourth quarter of 2014 (the 2014/2015 Program). Depending on the timing of the outcome of formal processes in accordance with local labor laws and practices, production at both facilities could be transferred to other facilities within the Company's globally integrated supply chain by the end of 2017.
Based on the Company’s efforts to maintain our global footprint, the Company has periodically entered into other streamlining programs as deemed necessary which may include workforce reductions, site closures and rotation of manufacturing footprint to low cost regions (Other Programs).
The following is a summary of changes in the Company’s streamlining program liabilities for the year ended December 31, 2016.
(Amounts in millions) | |||
2014 / 2015 Program | |||
Balance as of December 31, 2015 | $ | 43.8 | |
Charges during 2016 | 6.1 | ||
Payments during 2016 | (20.5 | ) | |
Noncash writeoffs during 2016 | (0.6 | ) | |
FX effects | (1.0 | ) | |
Balance as of December 31, 2016 | $ | 27.8 | |
Other Programs | |||
Balance as of December 31, 2015 | $ | 24.9 | |
Charges during 2016 | 10.3 | ||
Payments during 2016 | (10.9 | ) | |
FX effects | (0.9 | ) | |
Balance as of December 31, 2016 | $ | 23.4 | |
Total streamlining liability as of December 31, 2016 | $ | 51.2 | |
A balance of $33.7 million is included in other liabilities (non-current) and $17.5 million is included in other accrued liabilities (current) as of December 31, 2016.
The following is a summary of the streamlining costs recorded for the years ended December 31, 2016, 2015 and 2014 :
Charges for Year Ended December 31, 2016 | Charges for Year Ended December 31, 2015 | Charges for Year Ended December 31, 2014 | |||||||||||||||||||||
(Amounts in millions) | 2014/2015 Program | Other Programs | 2014/2015 Program | Other Programs | 2014/2015 Program | Other Programs | |||||||||||||||||
Employee-related charges – cost of sales | $ | 4.0 | $ | 6.9 | $ | 32.9 | $ | 7.4 | $ | 1.1 | $ | 8.8 | |||||||||||
Employee-related charges – selling and administrative | (0.2 | ) | 3.2 | 4.0 | 15.3 | 7.9 | 8.1 | ||||||||||||||||
Asset write-offs | 0.6 | — | 7.7 | — | 0.8 | — | |||||||||||||||||
Other streamlining charges | 1.7 | 0.2 | 0.8 | 0.4 | 0.2 | 0.1 | |||||||||||||||||
Total program costs | $ | 6.1 | $ | 10.3 | $ | 45.4 | $ | 23.1 | $ | 10.0 | $ | 17.0 | |||||||||||
62
Streamlining costs incurred for other programs include primarily charges related to headcount reductions and footprint relocations to low cost regions. For the years ended December 31, 2016, 2015 and 2014, the Company recorded $6.8 million, $16.5 million and $11.9 million, respectively, related to headcount reductions primarily driven by its continued cost optimization efforts. The Company also recorded restructuring charges of $3.5 million, $6.6 million and $4.8 million for the years ended December 31, 2016, 2015 and 2014, respectively, related to footprint relocations including the transfer of certain product lines and business processes to best cost countries including India and Poland. Amounts recorded for each of these years related to site closures were not significant.
NOTE 6. | Capital Stock |
The following is a summary of net shares outstanding and shares issued or reacquired during the years ending December 31, 2016, 2015 and 2014.
Number of Shares of Common Stock | ||||||||
Total Shares | Treasury Shares | Net Shares Outstanding | ||||||
Balance, December 31, 2013 | 77,471,174 | (16,112,149 | ) | 61,359,025 | ||||
Shares issued upon exercise of stock options | 394,899 | — | 394,899 | |||||
Shares issued upon vesting of RSUs | 91,235 | — | 91,235 | |||||
Shares issued for DSUs | 2,932 | — | 2,932 | |||||
Shares issued for stock awards | 800 | — | 800 | |||||
Shares purchased for treasury | — | (3,423,018 | ) | (3,423,018 | ) | |||
Balance, December 31, 2014 | 77,961,040 | (19,535,167 | ) | 58,425,873 | ||||
Shares issued upon exercise of stock options | 414,782 | — | 414,782 | |||||
Shares issued upon vesting of RSUs | 117,830 | — | 117,830 | |||||
Shares issued for DSUs | 6,432 | — | 6,432 | |||||
Shares issued for stock awards | — | — | — | |||||
Shares purchased for treasury | — | (2,205,351 | ) | (2,205,351 | ) | |||
Balance, December 31, 2015 | 78,500,084 | (21,740,518 | ) | 56,759,566 | ||||
Shares issued upon exercise of stock options | 87,047 | 16,400 | 103,447 | |||||
Shares issued upon vesting of RSUs | 38,723 | 9,288 | 48,011 | |||||
Shares issued upon vesting of PSUs | 67,219 | 17,675 | 84,894 | |||||
Shares issued for DSUs | 7,100 | — | 7,100 | |||||
Shares issued for stock awards | 1,100 | — | 1,100 | |||||
Shares purchased for treasury | — | (2,512,200 | ) | (2,512,200 | ) | |||
Balance, December 31, 2016 | 78,701,273 | (24,209,355 | ) | 54,491,918 | ||||
The Company accounts for purchases of treasury stock under the cost method with the costs of such share purchases reflected in treasury stock in the accompanying consolidated balance sheets. When treasury shares are reissued, they are recorded at the average cost of the treasury shares acquired since the inception of the share buy back programs, net of shares previously reissued and the Company reflects the difference between the average cost paid and the amount received for the reissued shares in capital
63
surplus. As of December 31, 2016, the Company has reissued a total of 43,363 treasury shares related to certain employee vestings under its equity incentive program.
The share repurchase programs approved by the Board of Directors are as follow:
(Amounts in millions) | ||||||||
Date of authorization | Authorized amount | Date of commencement | Date of expiration | |||||
May 26, 2011 | $ | 400.0 | June 1, 2011 | May 31, 2013 | ||||
October 26, 2012 | 400.0 | October 26, 2012 | December 31, 2014 | |||||
October 29, 2013 | 200.0 | October 29, 2013 | December 31, 2014 | |||||
December 5, 2014 | 500.0 | December 5, 2014 | December 31, 2016 | |||||
December 2, 2016 | 600.0 | January 1, 2017 | December 31, 2018 | |||||
$ | 2,100.0 | |||||||
As of December 31, 2016, the Company has repurchased a total of $1,471.0 million of shares under the four repurchase programs effective through this date, with no unexpended balance available for share repurchases as of December 31, 2016. Between January 1, 2017 and February 17, 2017, the Company repurchased an additional 274,000 shares for a total of $29.4 million. The Company plans to continue to repurchase shares at prevailing market prices. The timing and amount of share repurchases, if any, will depend on a variety of factors including, among other things, share price, market conditions and applicable regulatory requirements.
NOTE 7. | Stock-Based Compensation |
The Company's Certificate of Incorporation authorizes the Company to issue up to 400,000,000 shares of common stock, par value $0.01 per share and 4,000,000 shares of preferred stock, par value $0.01 per share.
The Company paid no dividends on our common stock in 2016, 2015 and 2014.
The WABCO Holdings Inc. 2007 Omnibus Incentive Plan (the 2007 Omnibus Plan), was formally adopted by our Board of Directors prior to the Distribution. The 2007 Omnibus Plan was replaced in May 2009 by the WABCO Holdings Inc. 2009 Omnibus Incentive Plan (the 2009 Omnibus Plan), and further amended in May 2013 (the 2009 Restated Omnibus Plan) as approved by the shareholders at the Annual Meeting of Shareholders.
The 2009 Restated Omnibus plan is intended to promote our long-term financial success and increase shareholder value by providing us with greater flexibility to implement the optimal mix of annual and long-term cash, equity and equity-based incentives. It is also intended to align the interests of our employees with the interests of our shareholders by affording them certain opportunities to acquire an interest in our stock. We believe that these incentives and opportunities will encourage our executives and other key employees to continue in our employment, by providing them with a competitive level of compensation that varies based on our performance.
Under the 2009 Omnibus Plan and 2009 Restated Omnibus Plan, the Company may issue the following types of awards: stock options, stock appreciation rights (sometimes referred to as SARs), RSUs, PSUs, DSUs, restricted shares, annual incentive awards and long-term incentive awards. The maximum number of shares or units that may be issued under the 2009 Restated Omnibus Plan is 5,100,000. No participant shall be granted stock options, stock appreciation rights, or both with respect to more than 750,000 shares during any calendar year. No individual shall be granted restricted shares or restricted stock units, with respect to 200,000 shares or units as the case may be during any calendar year. If an award under either the 2007 Omnibus Plan, the 2009 Omnibus Plan or the 2009 Restated Omnibus Plan expires or becomes unexercisable without having been exercised in full, or, with respect to full-value incentive awards, is forfeited to or repurchased by the Company, the unpurchased shares will become available for future grant or sale under the 2009 Restated Omnibus Plan.
As of December 31, 2016, a total of 640,614 stock options, RSUs, PSUs and DSUs were outstanding and there were 2,954,527 shares remaining available for grant under the 2009 Restated Omnibus Plan.
The PSUs granted as part of the Company's equity incentive awards vest at levels ranging from none to 200% of the number of granted PSUs depending upon the achievement of three-year cumulative earnings per share goals as approved by the Compensation, Nominating and Governance Committee of the Board of Directors. The Company assesses the expected
64
achievement levels at the end of each reporting period. As of December 31, 2016, the Company believes it is probable that the performance conditions will be met and has accrued for the compensation expense accordingly.
The DSUs are granted to our non-management directors as part of the equity portion of their annual retainer and are fully vested at grant. Each DSU provides the right to the issuance of a share of our common stock, within ten days after the earlier of the director's death or disability, the 13-month anniversary of the grant date or the director's separation from service. Each director may also elect within a month after the grant date to defer the receipt of shares for five or more years. No election can be made to accelerate the issuance of stock from a DSU.
The Company records stock-based compensation based on the estimated fair value of the award at the grant date and is recognized as an expense in the consolidated statements of operations over the requisite service period. The estimated fair value of the award is based on the closing market price of the Company’s common stock on the date of grant. For PSUs, the grant date fair value of the number of awards expected to vest based on the Company’s best estimate of ultimate performance against the respective targets is recognized as compensation expense on a straight-line basis over the requisite vesting period of the awards. In addition, as discussed in Note 3, the Company adopted the provisions of ASU 2016-09 as of January 1, 2016, including the election to account for forfeitures as they occur.
Total stock-based compensation cost recognized during the years ended December 31, 2016, 2015 and 2014 was as follows:
Year Ended December 31, | |||||||||||
(Amounts in millions) | 2016 | 2015 | 2014 | ||||||||
Stock-based compensation | $ | 13.1 | $ | 12.0 | $ | 15.5 | |||||
The following tables summarize the stock options, RSUs, PSUs, DSUs and stock awards activity for each of the periods presented:
Underlying Shares | Weighted - Average Exercise Price | Weighted - Average Grant Date Fair Value | ||||||||||||||
WABCO employees | Trane employees | Total | ||||||||||||||
Options Outstanding December 31, 2013 | 886,917 | 325,616 | 1,212,533 | $ | 41.20 | |||||||||||
Options Granted | — | — | — | $ | — | $ | — | |||||||||
Options Exercised | (298,032 | ) | (98,611 | ) | (396,643 | ) | $ | 38.01 | ||||||||
Options Forfeited | (8,036 | ) | (200 | ) | (8,236 | ) | $ | 58.54 | ||||||||
Options Outstanding December 31, 2014 | 580,849 | 226,805 | 807,654 | $ | 42.60 | |||||||||||
Options Granted | — | — | — | $ | — | $ | — | |||||||||
Options Exercised | (284,817 | ) | (130,882 | ) | (415,699 | ) | $ | 41.87 | ||||||||
Options Forfeited | — | (336 | ) | (336 | ) | $ | 38.97 | |||||||||
Options Outstanding December 31, 2015 | 296,032 | 95,587 | 391,619 | $ | 43.37 | |||||||||||
Options Granted | — | — | — | $ | — | $ | — | |||||||||
Options Exercised | (49,466 | ) | (54,494 | ) | (103,960 | ) | $ | 38.70 | ||||||||
Options Forfeited | — | (128 | ) | (128 | ) | $ | 32.38 | |||||||||
Options Outstanding December 31, 2016 | 246,566 | 40,965 | 287,531 | $ | 45.07 | |||||||||||
Exercisable at December 31, 2016 | 246,566 | 40,965 | 287,531 | $ | 45.07 | |||||||||||
65
Underlying Shares | Weighted - Average Grant Date Fair Value | |||||
RSUs Outstanding December 31, 2013 | 288,467 | $ | 64.72 | |||
RSUs Granted | 93,070 | $ | 100.78 | |||
RSUs Vested | (114,485 | ) | $ | 64.39 | ||
RSUs Forfeited | (14,584 | ) | $ | 75.08 | ||
RSUs Outstanding December 31, 2014 | 252,468 | $ | 77.56 | |||
RSUs Granted | 78,664 | $ | 116.46 | |||
RSUs Vested | (157,585 | ) | $ | 70.81 | ||
RSUs Forfeited | (20,460 | ) | $ | 96.95 | ||
RSUs Outstanding December 31, 2015 | 153,087 | $ | 101.91 | |||
RSUs Granted | 94,033 | $ | 92.59 | |||
RSUs Vested | (73,358 | ) | $ | 91.60 | ||
RSUs Forfeited | (13,452 | ) | $ | 100.55 | ||
RSUs Outstanding December 31, 2016 | 160,310 | $ | 101.27 | |||
Underlying Shares | Weighted - Average Grant Date Fair Value | |||||
PSUs Outstanding December 31, 2013 | 84,410 | $ | 68.10 | |||
PSUs Granted | 65,508 | $ | 103.41 | |||
PSUs Forfeited | (10,940 | ) | $ | 77.38 | ||
PSUs Outstanding December 31, 2014 | 138,978 | $ | 84.01 | |||
PSUs Granted | 58,630 | $ | 116.38 | |||
PSUs Forfeited | (24,896 | ) | $ | 95.65 | ||
PSUs Outstanding December 31, 2015 | 172,712 | $ | 93.31 | |||
PSUs Granted | 152,010 | $ | 82.76 | |||
PSUs Vested | (126,840 | ) | $ | 68.10 | ||
PSUs Forfeited | (22,192 | ) | $ | 102.46 | ||
PSUs Outstanding December 31, 2016 | 175,690 | $ | 101.31 | |||
Underlying Shares | Weighted - Average Grant Date Fair Value | |||||
DSUs Outstanding December 31, 2013 | 11,280 | $ | 63.00 | |||
DSUs Granted | 7,156 | $ | 107.70 | |||
DSUs Issued | (2,932 | ) | $ | 75.12 | ||
DSUs Outstanding December 31, 2014 | 15,504 | $ | 78.11 | |||
DSUs Granted | 5,917 | $ | 129.94 | |||
DSUs Issued | (6,432 | ) | $ | 106.59 | ||
DSUs Outstanding December 31, 2015 | 14,989 | $ | 86.35 | |||
DSUs Granted | 9,194 | $ | 105.52 | |||
DSUs Issued | (7,100 | ) | $ | 88.10 | ||
DSUs Outstanding December 31, 2016 | 17,083 | $ | 95.93 | |||
66
Shares | Weighted - Average Grant Date Fair Value | |||||
Stock Awards granted: | ||||||
Year ended December 31, 2014 | 800 | $ | 96.37 | |||
Year ended December 31, 2015 | — | $ | — | |||
Year ended December 31, 2016 | 1,100 | $ | 107.47 | |||
The table below shows the vesting schedule of the RSUs granted for each of the periods presented:
Vesting Schedule | |||||||||
Equal installments over 3 years | After 2 years | After 3 years | Total | ||||||
RSUs granted in 2014 | 78,966 | 1,934 | 12,170 | 93,070 | |||||
RSUs granted in 2015 | 74,394 | 814 | 3,456 | 78,664 | |||||
RSUs granted in 2016 | 86,123 | — | 7,910 | 94,033 | |||||
As discussed above, the PSUs granted in each of the years ended December 31, 2016, 2015 and 2014 vest, if at all, and at levels depending upon, the achievement of certain three-year cumulative earnings per share goals. To the extent that the PSUs vest at a level greater (or lesser) than 100% as a result of the final performance achievement, the Company considers the increment (or reduction) in shares vested as additional grants (or forfeitures) in the year of vesting.
The DSUs granted in each of the years ended December 31, 2016, 2015 and 2014 vest immediately upon grant.
As of December 31, 2016, all outstanding stock option awards were fully vested and had a total aggregate intrinsic value of $17.6 million. Aggregate intrinsic value is calculated by subtracting the exercise price of the option from the closing price of the Company's common stock on December 31, 2016, multiplied by the number of shares per each option.
The total intrinsic value of options exercised was $6.4 million, $32.7 million and $24.9 million for the years ended December 31, 2016, 2015 and 2014, respectively. Total fair value of shares vested was $19.3 million, $20.1 million and $11.8 million for the years ended December 31, 2016, 2015 and 2014 respectively. The 336,000 of unvested options, RSUs and PSUs as of December 31, 2016 will result in the recognition of $16.8 million of compensation cost to be recognized over a weighted average period of 1.8 years.
The contractual life of all options is 10.0 years. The weighted average remaining contractual life of options outstanding as of December 31, 2016 was 3.0 years. The tax benefit from stock options exercised during the period was immaterial for each of the years ended December 31, 2016, 2015 and 2014.
NOTE 8. | Other Operating and Non-Operating Expense / (Income), Net |
Other expense/(income) was as follows:
Year Ended December 31, | |||||||||||
(Amounts in millions) | 2016 | 2015 | 2014 | ||||||||
Operating expense: | |||||||||||
Bank charges | $ | 1.6 | $ | 1.7 | $ | 2.2 | |||||
Miscellaneous taxes | 4.2 | 4.1 | 5.7 | ||||||||
Other (income)/expense, net | (0.5 | ) | 0.9 | 1.0 | |||||||
$ | 5.3 | $ | 6.7 | $ | 8.9 | ||||||
Non-operating (income)/expense: | |||||||||||
Indemnification settlements, net | $ | — | $ | (1.0 | ) | $ | (4.3 | ) | |||
Securitization and receivable discount fees | 0.4 | 0.3 | 0.9 | ||||||||
Foreign exchange gains | (1.5 | ) | (0.9 | ) | (0.9 | ) | |||||
Other expense, net | — | — | 2.5 | ||||||||
$ | (1.1 | ) | $ | (1.6 | ) | $ | (1.8 | ) | |||
NOTE 9. | Inventories |
The components of inventories, which are carried on a last-in, first-out (LIFO) basis, are as follows:
Year Ended December 31, | |||||||||
(Amounts in millions) | 2016 | 2015 | |||||||
Finished products | $ | 102.9 | $ | 95.7 | |||||
Products in process | 14.2 | 7.8 | |||||||
Raw materials | 106.5 | 109.2 | |||||||
Inventories at cost | $ | 223.6 | $ | 212.7 | |||||
Inventory costs are primarily comprised of direct material and labor costs, as well as material overhead such as inbound freight and custom and excise duties. The current replacement cost approximated the LIFO carrying cost for 2016 and 2015.
Reserves for slow moving and obsolete inventory amounted to $16.3 million and $12.2 million for the years ended December 31, 2016 and December 31, 2015, respectively. Reserves for LIFO amounted to $1.2 million for the years ended December 31, 2016 and 2015.
67
NOTE 10. | Property, Plant and Equipment |
The components of property, plant and equipment, at cost, are as follow:
Year Ended December 31, | |||||||
(Amounts in millions) | 2016 | 2015 | |||||
Land | $ | 22.2 | $ | 21.7 | |||
Buildings | 169.0 | 172.5 | |||||
Machinery and equipment | 800.2 | 775.2 | |||||
Improvements in progress | 76.4 | 65.6 | |||||
Gross property, plant and equipment | 1,067.8 | 1,035.0 | |||||
Less: accumulated depreciation | 659.2 | 637.0 | |||||
Net property, plant and equipment | $ | 408.6 | $ | 398.0 | |||
Depreciation expense for owned assets, including those under capital leases, for the years ended December 31, 2016, 2015 and 2014 was $74.7 million, $77.5 million and $81.7 million, respectively.
Net property, plant and equipment includes tooling investments of $69.1 million and $69.9 million for the years ended December 31, 2016 and 2015 respectively.
NOTE 11. | Financing Receivables |
The Company's receivables available for financing include sales to reputable state owned and public enterprises in China that are settled through bankers acceptance drafts which are registered and endorsed to the Company. These notes receivable are fully guaranteed by banks and generally have contractual maturities of six months or less, but the ultimate recourse remains against the trade debtor. These guaranteed notes are available for discounting with banking institutions in China or transferring to suppliers to settle liabilities. The total amount of notes receivable discounted or transferred for the years ended December 31, 2016, 2015 and 2014 was $114.3 million, $80.7 million and $63.8 million, respectively. Expenses related to discounting these notes amounted to $0.3 million, $0.2 million and $0.1 million for the years ended December 31, 2016, 2015 and 2014, respectively, which are included in “other non-operating expense, net”. The fair value of these guaranteed notes receivable is determined based on Level 2 inputs including credit ratings and other criteria observable in the market. The fair value of these notes equal their carrying amounts of $53.6 million and $53.9 million as of December 31, 2016 and 2015, respectively, and are included in “other current assets” on the consolidated balance sheets.
The Company monitors the credit quality of both the drawers of the draft and guarantors on a monthly basis by reviewing various factors such as payment history, level of state involvement in the institution, size, national importance as well as current economic conditions in China. Since the Company has not experienced any historical losses nor is the Company expecting future credit losses based on a review of the various credit quality indicators described above, we have not established a loss provision against these receivables as of December 31, 2016 or 2015.
NOTE 12. | Goodwill and Intangible Assets |
The following table summarizes the changes in the carrying amount of goodwill for the years ended December 31, 2016 and 2015.
Year Ended December 31, | |||||||
(Amounts in millions) | 2016 | 2015 | |||||
Balance of goodwill, beginning of year | $ | 377.7 | $ | 421.0 | |||
Acquisitions | 35.6 | — | |||||
Foreign exchange translation | (14.1 | ) | (43.3 | ) | |||
Balance of goodwill, end of year | $ | 399.2 | $ | 377.7 | |||
68
The changes in the carrying value of intangible assets for the years ended December 31 are as follow:
Capitalized Software | Other Intangible Assets | Total | ||||||||||
Gross intangible assets as of: | ||||||||||||
December 31, 2013 | $ | 115.0 | $ | 51.8 | $ | 166.8 | ||||||
Additions | 12.7 | 53.4 | 66.1 | |||||||||
Disposals | (17.7 | ) | — | (17.7 | ) | |||||||
Foreign exchange translation | (14.5 | ) | (11.6 | ) | (26.1 | ) | ||||||
December 31, 2014 | 95.5 | 93.6 | 189.1 | |||||||||
Additions | 10.9 | — | 10.9 | |||||||||
Disposals | (0.8 | ) | — | (0.8 | ) | |||||||
Foreign exchange translation | (9.8 | ) | (8.6 | ) | (18.4 | ) | ||||||
December 31, 2015 | 95.8 | 85.0 | 180.8 | |||||||||
Additions | 10.0 | 31.4 | 41.4 | |||||||||
Disposals | (3.8 | ) | — | (3.8 | ) | |||||||
Foreign exchange translation | (4.1 | ) | (3.8 | ) | (7.9 | ) | ||||||
December 31, 2016 | $ | 97.9 | $ | 112.6 | $ | 210.5 | ||||||
Accumulated amortization as of: | ||||||||||||
December 31, 2013 | $ | (85.4 | ) | $ | (37.1 | ) | $ | (122.5 | ) | |||
Amortization expense | (9.1 | ) | (12.4 | ) | (21.5 | ) | ||||||
Disposals | 17.7 | — | 17.7 | |||||||||
Foreign exchange translation | 10.7 | 4.9 | 15.6 | |||||||||
December 31, 2014 | (66.1 | ) | (44.6 | ) | (110.7 | ) | ||||||
Amortization expense | (8.7 | ) | (10.5 | ) | (19.2 | ) | ||||||
Disposals | 0.7 | — | 0.7 | |||||||||
Foreign exchange translation | 6.9 | 4.3 | 11.2 | |||||||||
December 31, 2015 | (67.2 | ) | (50.8 | ) | (118.0 | ) | ||||||
Amortization expense | (9.1 | ) | (12.9 | ) | (22.0 | ) | ||||||
Disposals | 3.0 | — | 3.0 | |||||||||
Foreign exchange translation | 2.9 | 2.5 | 5.4 | |||||||||
December 31, 2016 | $ | (70.4 | ) | $ | (61.2 | ) | $ | (131.6 | ) | |||
Net intangible assets as of: | ||||||||||||
December 31, 2016 | $ | 27.5 | $ | 51.4 | $ | 78.9 | ||||||
The Company expects to incur approximately $20 million to $25 million of amortization expense for each of the next five fiscal years excluding any amortization that may arise from future acquisitions.
NOTE 13. | Pension and Post-retirement Benefits |
WABCO employees participate in a number of benefit plans. The plans include a 401(k) savings plan for the Company's U.S. salaried and hourly employees, which is an individual-account defined contribution plan. WABCO employees in certain countries including Germany, the United Kingdom and Switzerland, participate in defined benefit plans or retiree medical plans sponsored by local WABCO legal entities. WABCO has also assumed responsibility for certain retiree medical plans in the United States and a pension plan in Germany relating to former employees of Trane's Bath & Kitchen division. In addition, in 2016, certain legislative changes in Belgium to employee benefit plans require that these plans be accounted for as defined benefit plans.
69
Benefits under defined benefit pension plans on a worldwide basis are generally based on years of service and either employee compensation during the last years of employment or negotiated benefit levels. WABCO recognizes in its consolidated balance sheets an asset for a defined benefit post-retirement plan's overfunded status or a liability for a plan's underfunded status. The long-term liability of $590.6 million on the consolidated balance sheets is primarily due to the underfunded plan in Germany, where the majority of the Company's prior and current employees are based.
The following table provides a reconciliation of the changes in pension and retirement health and life insurance benefit obligations and fair value of assets for the years ending December 31, 2016 and 2015, and a statement of the funded status as of December 31, 2016 and 2015.
2016 | 2016 | 2015 | 2015 | ||||||||||||
(Amounts in millions) | Health & Life Ins. Benefits | Pension Benefits | Health & Life Ins. Benefits | Pension Benefits | |||||||||||
Reconciliation of benefit obligation: | |||||||||||||||
Obligation at beginning of year | $ | 14.7 | $ | 715.5 | $ | 13.3 | $ | 777.8 | |||||||
Service cost | 1.0 | 17.1 | 0.2 | 16.7 | |||||||||||
Interest cost | 0.4 | 17.4 | 0.4 | 17.6 | |||||||||||
Participant contributions | 0.2 | 0.2 | 0.2 | 0.2 | |||||||||||
Curtailments | — | — | — | (1.4 | ) | ||||||||||
Actuarial (gain) / loss | (3.0 | ) | 78.9 | 3.9 | (2.4 | ) | |||||||||
Benefit payments | (1.5 | ) | (24.9 | ) | (3.3 | ) | (26.2 | ) | |||||||
Foreign exchange effects | — | (52.1 | ) | — | (66.6 | ) | |||||||||
Other (1) | — | 9.9 | — | (0.2 | ) | ||||||||||
Obligation at end of year | $ | 11.8 | $ | 762.0 | $ | 14.7 | $ | 715.5 | |||||||
2016 | 2016 | 2015 | 2015 | ||||||||||||
(Amounts in millions) | Health & Life Ins. Benefits | Pension Benefits | Health & Life Ins. Benefits | Pension Benefits | |||||||||||
Reconciliation of fair value of plan assets: | |||||||||||||||
Fair value of plan assets at beginning of year | $ | — | $ | 173.3 | $ | — | $ | 188.1 | |||||||
Actual return on assets | — | 27.3 | — | (0.4 | ) | ||||||||||
Employer contributions | 1.3 | 20.3 | 3.1 | 19.7 | |||||||||||
Participant contributions | 0.2 | 0.2 | 0.2 | 0.2 | |||||||||||
Benefit payments | (1.5 | ) | (24.9 | ) | (3.3 | ) | (26.2 | ) | |||||||
Foreign exchange effects | — | (29.0 | ) | — | (7.5 | ) | |||||||||
Other (1) | — | 9.8 | — | (0.6 | ) | ||||||||||
Fair value of plan assets at end of year | $ | — | $ | 177.0 | $ | — | $ | 173.3 | |||||||
Funded Status at December 31 | $ | (11.8 | ) | $ | (585.0 | ) | $ | (14.7 | ) | $ | (542.2 | ) | |||
Amounts recognized in the balance sheet: | |||||||||||||||
Noncurrent assets | $ | — | $ | 13.9 | $ | — | $ | 16.3 | |||||||
Current liabilities | (1.0 | ) | (19.1 | ) | (1.6 | ) | (18.9 | ) | |||||||
Noncurrent liabilities | (10.8 | ) | (579.8 | ) | (13.1 | ) | (539.6 | ) | |||||||
Net amounts recognized in balance sheet: | $ | (11.8 | ) | $ | (585.0 | ) | $ | (14.7 | ) | $ | (542.2 | ) | |||
Cumulative amounts recognized in other comprehensive income consist of: | |||||||||||||||
Prior service cost | $ | 0.1 | $ | 1.5 | $ | 0.1 | $ | 1.7 | |||||||
Net actuarial loss | 9.4 | 325.0 | 11.5 | 300.1 | |||||||||||
Total (before tax effects) | $ | 9.5 | $ | 326.5 | $ | 11.6 | $ | 301.8 | |||||||
70
(1) Amounts in "Other" for the year ended December 31, 2016 primarily reflect accounting for employee benefit plans in Belgium as defined benefit plans for the first time subsequent to legislation changes in 2016 as previously discussed.
$22.0 million of the amount in other comprehensive income as of December 31, 2016 is expected to be recognized as post-retirement costs in 2017.
The following table provides a summary of pension plans with accumulated benefit obligations in excess of assets as of December 31:
2016 | 2015 | |||||
(Amounts in millions) | Foreign Pension Plans | Foreign Pension Plans | ||||
For all plans: | ||||||
Accumulated benefit obligation | $ | 689.6 | $ | 599.7 | ||
For pension plans with accumulated benefit obligations in excess of plan assets: | ||||||
Accumulated benefit obligation | $ | 560.6 | $ | 470.1 | ||
Total post-retirement costs are shown below:
Year Ended December 31, | |||||||||||
(Amounts in millions) | 2016 | 2015 | 2014 | ||||||||
Foreign pensions | $ | 42.3 | $ | 42.0 | $ | 31.6 | |||||
Health & Life insurance benefits | 1.9 | 1.1 | 1.0 | ||||||||
Total post-retirement costs, including accretion expense | $ | 44.2 | $ | 43.1 | $ | 32.6 | |||||
Components of post-retirement costs are broken out in the tables below:
Pension Benefit Costs
Year Ended December 31, | |||||||||||
(Amounts in millions) | 2016 | 2015 | 2014 | ||||||||
Service cost-benefits earned during period | $ | 17.1 | $ | 16.7 | $ | 12.3 | |||||
Interest cost on projected benefit obligation | 17.4 | 17.6 | 21.6 | ||||||||
Less: assumed return on plan assets | (6.7 | ) | (7.9 | ) | (8.1 | ) | |||||
Amortization of prior service cost | 0.1 | 0.5 | (0.1 | ) | |||||||
Amortization of net loss | 14.4 | 15.1 | 5.9 | ||||||||
Net defined benefit plan cost after amendments | $ | 42.3 | $ | 42.0 | $ | 31.6 | |||||
Other Post-Retirement Benefit Costs
Year Ended December 31, | |||||||||||
(Amounts in millions) | 2016 | 2015 | 2014 | ||||||||
Interest and service cost on projected benefit obligation | $ | 1.4 | $ | 0.6 | $ | 0.6 | |||||
Amortization of net loss | 0.5 | 0.5 | 0.4 | ||||||||
Defined benefit plan cost | $ | 1.9 | $ | 1.1 | $ | 1.0 | |||||
For plans where the total unrecognized net gain or loss exceeds the greater of 10% of the projected benefit obligation or 10% of the plan assets, the excess is amortized on a straight-line basis over the average expected future working lifetime of the active participants of that plan. For plans without active participants, the amortization period is the average life expectancy of plan participants.
Major assumptions used in determining the benefit obligation and net cost for post-retirement plans are presented below as weighted averages:
71
Benefit Obligation at December 31 | 2016 Health & Life Ins. Benefits | 2016 Foreign Pension Plans | 2015 Health & Life Ins. Benefits | 2015 Foreign Pension Plans | |||||||
Discount rate | 4.00 | % | 1.79 | % | 3.75 | % | 2.50 | % | |||
Salary growth | N/A | 3.04 | % | N/A | 2.95 | % | |||||
Net Periodic Pension Cost for the year | |||||||||||
Discount rate | 3.75 | % | 2.51 | % | 3.50 | % | 2.43 | % | |||
Salary growth | N/A | 2.94 | % | N/A | 3.03 | % | |||||
Expected return on plan assets | N/A | 4.54 | % | N/A | 4.89 | % | |||||
The discount rate assumption in this chart changed from 2015 to 2016, resulting in a change in the pension benefit obligation. In the chart above that reconciles the change in benefit obligations for the year, the impact of the discount rate change is included in the actuarial loss/(gain) line item. The discount rate noted for foreign pension plans is a weighted average rate based on each of the applicable country's rates.
The assumed rate of return is a long-term investment return that takes into account the classes of assets held by the plan and expected returns for each class of assets. Return expectations reflect forward-looking analysis as well as historical experience.
WABCO's asset management strategy focuses on maintaining a diversified portfolio using various classes of assets to generate attractive returns while managing risk. The Company periodically reviews its target asset allocations for a given plan to ensure it aligns with the asset management strategy. In determining the target asset allocation for a given plan, consideration is given to the nature of its liabilities, and portfolios are periodically rebalanced with reference to the target level.
Asset Allocation | 2016 | 2015 | 2016 Target | 2015 Target | |||||||
Equity securities | 12 | % | 30 | % | 13 | % | 28 | % | |||
Debt securities | 22 | % | 7 | % | 22 | % | 11 | % | |||
Insurance contracts | 52 | % | 47 | % | 51 | % | 46 | % | |||
Investments in collective foundations | 13 | % | 14 | % | 12 | % | 14 | % | |||
Other * | 2 | % | 2 | % | 2 | % | 1 | % | |||
* Included in "other" above are mutual funds held in real estate.
All assets are measured at the current fair value. The fair values of the insurance contract and investments in collective foundations are determined based on applicable discount rates and other observable inputs (Level 2). For all other assets, the Company determines fair value for each class of assets in its entirety using quoted prices in active markets for identical assets (Level 1). The Company has not changed the valuation techniques and inputs used during the periods presented. The fair values for each class of assets are presented below:
(Amounts in millions) | 2016 | 2015 | |||||
Equity securities | $ | 21.9 | $ | 52.5 | |||
Debt securities | 38.4 | 12.1 | |||||
Insurance contracts | 91.4 | 80.6 | |||||
Investments in collective foundations | 22.3 | 24.8 | |||||
Other * | 3.0 | 3.3 | |||||
Total fair value of plan assets | $ | 177.0 | $ | 173.3 | |||
* Included in "other" above are mutual funds held in real estate.
WABCO makes contributions to funded pension plans that at a minimum, meet all statutory funding requirements. Contributions, including payment of benefits incurred by unfunded plans and health and life insurance benefits, totaled $21.6 million in 2016 compared to $22.8 million in 2015. Contributions in 2017 are expected to be in line with the contributions made during 2016.
Expected future benefit payments from our pension and retirement health and life insurance benefit plans are shown in the table below:
72
(Amounts in millions) | 2017 | 2018 | 2019 | 2020 | 2021 | 2022-2026 | ||||||||||||
Domestic plans without subsidy | $ | 1.0 | $ | 1.0 | $ | 0.9 | $ | 0.9 | $ | 0.9 | $ | 4.3 | ||||||
Foreign pension plans | $ | 24.8 | $ | 23.6 | $ | 23.7 | $ | 24.5 | $ | 25.0 | $ | 130.3 | ||||||
The weighted average annual assumed rate of increase in the health care cost trend rate was 6.5% for 2015, 7.5% for 2016 and is assumed to increase to 7.3% in 2017 and then gradually decline to 4.75% by 2027. The health care cost trend rate assumption has the following effect:
(Amounts in millions) | 1% Increase | 1% Decrease | ||||
Effect on the health care component of accumulated post-retirement obligation | $ | 1.2 | $ | (1.0 | ) | |
Effect on total of service and interest cost components of net periodic post-retirement health care benefit costs | $ | 0.2 | $ | (0.2 | ) | |
NOTE 14. | Debt |
Senior EUR Notes
On October 17, 2016, the Company entered into a note purchase agreement (the EUR Note Purchase Agreement) relating to the issuance of an aggregate amount of €440.0 million of senior unsecured notes (collectively, the Senior EUR Notes). Funding occurred on November 15, 2016, resulting in an aggregate amount of Senior EUR Notes of $471.8 million at the exchange rates of that day.
(Amounts in EUR millions) | Face value | Coupon | Maturity Date | |||||
Series D Notes | € | 190.0 | 0.84 | % | November 15, 2023 | |||
Series E Notes | 80.0 | 1.20 | % | November 15, 2026 | ||||
Series F Notes | 170.0 | 1.36 | % | November 15, 2028 | ||||
€ | 440.0 | |||||||
The Company paid approximately $1.4 million of debt issuance costs in connection with the Senior EUR Notes, which has been presented in the consolidated balance sheets as a direct reduction of the related debt liability. Interest on the Senior EUR Notes will be payable semi-annually on January 1 and July 1 of each year, commencing July 1, 2017. As of December 31, 2016, the outstanding debt balance net of unamortized debt issuance costs was $460.1 million.
The proceeds from the Senior EUR Notes are expected to be partially utilized to repay outstanding balances on our revolving credit facilities. The remaining proceeds are intended to fund our share repurchase program, finance acquisitions and meet general financing requirements.
Subject to certain conditions, the Company may, at its option, prepay all or part of the Senior EUR Notes plus any accrued and unpaid interest to the date of prepayment and certain penalties as defined in the EUR Note Purchase Agreement. The Company may also be required, subject to certain events and conditions, to make an offer to prepay all of the Senior EUR Notes including any accrued and unpaid interest to the date of prepayment. Each holder has the option to accept or reject such offer to prepay.
The EUR Note Purchase Agreement contains customary affirmative and negative covenants, and financial covenants consisting of a consolidated net indebtedness to consolidated EBITDA (earnings before interest, taxes, depreciation and amortization adjusted for certain items) ratio of not more than three times at the end of fiscal quarter based upon the preceding twelve consecutive months, as well as a consolidated EBITDA to consolidated net interest expense ratio of not less than three times at the end of fiscal quarter based upon the preceding twelve consecutive months. The EUR Note Purchase Agreement also provides for customary events of default, the occurrence of which could result in an acceleration of the Company's obligations under the EUR Note Purchase Agreement. We were in compliance with all of the covenants as of December 31, 2016.
The Company also agreed to indemnify the note purchasers holding Senior EUR Notes that are subject to a swap agreement for certain losses associated with swap breakage resulting from a prepayment of the Senior EUR Notes or from an acceleration of the Senior EUR Notes as a result of an event of default.
73
Senior Notes
On May 8, 2015, the Company entered into a note purchase agreement (the Note Purchase Agreement) relating to the issuance of an aggregate amount of $500.0 million of senior unsecured notes (collectively, the Senior Notes) as follows:
(Amounts in millions) | Face value | Coupon | Maturity Date | |||||
Series A Notes | $ | 150.0 | 2.83 | % | June 25, 2022 | |||
Series B Notes | 200.0 | 3.08 | % | June 25, 2025 | ||||
Series C Notes | 150.0 | 3.18 | % | June 25, 2027 | ||||
500.0 | ||||||||
The Company paid approximately $2.1 million of debt issuance costs in connection with the Senior Notes, which has been presented in the consolidated balance sheets as a direct reduction of the related debt liability. Interest on the Senior Notes is payable semi-annually on January 1 and July 1 of each year, commencing January 1, 2016. As of December 31, 2016, the outstanding debt balance net of unamortized debt issuance costs was $498.2 million.
The proceeds from the Senior Notes were partially utilized to repay the outstanding balance on our revolving credit facilities. The remaining proceeds are intended to fund our share repurchase program, finance acquisitions, refinance existing indebtedness and meet general financing requirements.
Subject to certain conditions, the Company may, at its option, prepay all or part of the Senior Notes plus any accrued and unpaid interest to the date of prepayment and certain penalties as defined in the Note Purchase Agreement. The Company may also be required, subject to certain events and conditions, to make an offer to prepay all of the Senior Notes including any accrued and unpaid interest to the date of prepayment. Each holder has the option to accept or reject such offer to prepay.
The Note Purchase Agreement contains customary affirmative and negative covenants, and financial covenants consisting of a consolidated net indebtedness to consolidated EBITDA (earnings before interest, taxes, depreciation and amortization adjusted for certain items) ratio and a consolidated EBITDA to consolidated net interest expense ratio of not more than three times at the end of fiscal quarter, always based upon the preceding twelve consecutive months. The Note Purchase Agreement also provides for customary events of default, the occurrence of which could result in an acceleration of the Company's obligations under the Note Purchase Agreement. We were in compliance with all of the covenants as of December 31, 2016.
Revolving Credit Facilities
On July 8, 2011, the Company entered into a $400 million multi-currency five-year senior unsecured revolving credit facility which was amended and restated on September 30, 2015 (the 2015 Facility, previously referred to as the 2011 Facility) to, among other things, extend the original expiry date subject to two 1-year extension options and amend the applicable margins on the original revolving credit facility. As of December 31, 2016, this is our principal bank credit facility and will expire on September 30, 2021.
On December 17, 2014, the Company entered into a new $100 million multi-currency five-year senior unsecured revolving credit facility (the 2014 Facility) which will expire on December 17, 2019.
Under the revolving credit facilities, the Company may borrow, on a revolving basis, loans in an aggregate principal amount at any one time outstanding not in excess of $500 million. Up to $30 million under the 2015 Facility may be used for issuing letters of credit, of which $30 million was unused as of December 31, 2016, and up to $50 million is available in the form of swing line loans, all $50 million of which was available for use as of December 31, 2016.
As of December 31, 2016 and 2015, there were no balances outstanding on these facilities and an incremental ability to borrow $500 million.
Interest on loans under the revolving credit facilities will be calculated at a rate per annum equal to an applicable margin - which can vary from 0.45% to 1.00% for both the 2014 Facility and the 2015 Facility based on the Company's leverage ratio, plus LIBOR for loans denominated in U.S. Dollars, EURIBOR for loans denominated in Euros, HIBOR for loans denominated in Hong Kong Dollars and SIBOR for loans denominated in Singapore Dollars, plus mandatory costs, if any.
74
The revolving credit facilities contain terms and provisions (including representations, covenants and conditions) customary for credit agreements of this type. Our primary financial covenant is a leverage test which requires net indebtedness not to exceed three times adjusted four quarter trailing EBITDA. Additional financial covenants include an interest coverage test and a maximum subsidiary indebtedness test. The interest coverage test requires three times interest expense not to exceed adjusted four quarter trailing EBITDA. The maximum subsidiary indebtedness test limits the total aggregate amount of indebtedness of WABCO's subsidiaries, excluding indebtedness under the facilities, to $500 million under both the 2014 Facility and the 2015 Facility, of which not more than $150 million may be secured. All cash, cash equivalents and short-term investments on the balance sheet can be deducted for net indebtedness purposes. In addition, expenses and payments related to any streamlining of WABCO’s operations are excluded when calculating the four quarter trailing adjusted EBITDA. Other covenants include delivery of financial reports and other information, compliance with laws including environmental laws and permits, ERISA and U.S. regulations, limitations on liens, mergers and sales of assets and change of business. We were in compliance with all the covenants as of December 31, 2016.
Other Debt
As of December 31, 2016, the Company's various subsidiaries had borrowings from banks totaling $0.8 million, of which $0.6 million was classified as long-term debt. The remaining $0.2 million supports local working requirements. This is in comparison to $5.7 million as of December 31, 2015, of which $0.7 million was classified as long-term debt.
NOTE 15. | Warranties, Guarantees, Commitments and Contingencies |
Warranties
Products sold by WABCO are covered by a basic limited warranty with terms and conditions that vary depending upon the product and country in which it was sold. The limited warranty covers the equipment, parts and labor (in certain cases) necessary to satisfy the warranty obligation generally for a period of two years. Estimated product warranty expenses are accrued in cost of goods sold at the time the related sale is recognized. Estimates of warranty expenses are based primarily on warranty claims experience and specific customer contracts. Warranty expenses include accruals for basic warranties for product sold, as well as accruals for product recalls, service campaigns and other related events when they are known and estimable. To the extent WABCO experiences changes in warranty claim activity or costs associated with servicing those claims, its warranty accrual is adjusted accordingly. Warranty accrual estimates and the allocation of warranty between short and long term are updated based upon the most current warranty claims information available.
The following is a summary of changes in the Company’s product warranty liability for the years ended December 31, 2016, 2015 and 2014.
Year Ended December 31, | |||||||||||
(Amounts in millions) | 2016 | 2015 | 2014 | ||||||||
Balance of warranty costs accrued, beginning of period | $ | 40.9 | $ | 45.2 | $ | 51.6 | |||||
Warranty costs accrued | 48.9 | 24.4 | 27.1 | ||||||||
Warranty claims settled | (38.1 | ) | (24.3 | ) | (28.0 | ) | |||||
Foreign exchange translation effects | (2.4 | ) | (4.4 | ) | (5.5 | ) | |||||
Balance of warranty costs accrued, end of period | $ | 49.3 | $ | 40.9 | $ | 45.2 | |||||
Current liability, included in current portion of warranties | $ | 32.2 | $ | 23.1 | $ | 25.8 | |||||
Long-term liability, included in other liabilities | $ | 17.1 | $ | 17.8 | $ | 19.4 | |||||
Warranty costs accrued | $ | 48.9 | $ | 24.4 | $ | 27.1 | |||||
Less: received and anticipated recoveries from suppliers | (27.4 | ) | $ | — | $ | (2.2 | ) | ||||
Warranty costs net of received and anticipated recoveries | $ | 21.5 | $ | 24.4 | $ | 24.9 | |||||
In the third quarter of 2016, the Company initiated a recall and service campaign related to certain defects in components from one of our suppliers. The defective parts impacted certain shipments to our customers over a two month period. The Company currently estimates the costs of the warranty campaign to be $26.5 million. These costs have almost entirely been offset by anticipated supplier recoveries of $26.4 million. The Company currently expects the majority of this campaign to conclude in the second quarter of 2017.
75
Guarantees and Commitments
Future minimum rental commitments under all non-cancelable operating leases with original terms in excess of one year in effect as of December 31, 2016, are: $16.3 million in 2017; $13.8 million in 2018; $12.8 million in 2019; $11.8 million in 2020; $10.3 million in 2021 and $9.7 million thereafter, amounting to a total of $74.7 million. Net rental expense for all operating leases was $17.8 million, $17.0 million and $20.4 million for the years ended December 31, 2016, 2015 and 2014, respectively.
The Company has bank guarantees for $44.9 million which is comprised of uncollateralized bank guarantees. Of this total, $40.7 million is related to statutorily-required guarantees for tax and other litigation, out of which $11.7 million was paid into an escrow account in January 2017 with the Brazilian government subsequent to legislative changes requiring a cash deposit in lieu of a bank guarantee. Of the remaining balance of uncollateralized bank guarantees, $0.3 million is related to letters of credit and $3.9 million is related to other items.
Right of Recourse
In the ordinary course of business, the Company may receive banker's acceptance drafts from customers in China in payment of outstanding accounts receivable. These banker's acceptance drafts are non-interest bearing obligations of the issuing bank and generally have contractual maturities of six months or less. The Company may use these banker's acceptance drafts prior to the scheduled maturity date to settle outstanding accounts payable with vendors. Banker's acceptance drafts transferred to vendors are subject to customary right of recourse provisions prior to their scheduled maturity date. As of December 31, 2016 and 2015, the Company had approximately $24.3 million and $18.0 million, respectively, of banker's acceptance drafts subject to customary right of recourse provisions, which were transferred to vendors and had not reached their scheduled maturity date. Historically, the banker's acceptance drafts have settled upon maturity without any claim of recourse against the Company.
Contingencies
General
We are subject to proceedings, lawsuits and other claims related to products and other matters. We are required to assess the likelihood of any adverse judgments or outcomes to these matters as well as potential ranges of probable and reasonably possible losses. A determination of the amount of liability to be recorded, if any, for these contingencies is made after careful analysis of each individual issue.
Other
In conjunction with the Tax Sharing Agreement, as further discussed in Note 17, WABCO is responsible for certain tax and indemnification liabilities. These liabilities include probable indemnification liabilities to Trane of $0.1 million as of December 31, 2016. It is reasonably possible that the Company could incur losses in excess of the amounts accrued. Although this amount cannot be estimated, we believe that any additional losses would not have a material adverse impact on the consolidated financial statements.
NOTE 16. | Income Taxes |
Income before income taxes and the applicable provision for income taxes were :
76
Year Ended December 31, | |||||||||||
(Amounts in millions) | 2016 | 2015 | 2014 | ||||||||
Income before income taxes: | |||||||||||
Domestic | $ | 14.0 | $ | 62.9 | $ | 49.8 | |||||
Foreign | 355.1 | 234.6 | 307.0 | ||||||||
$ | 369.1 | $ | 297.5 | $ | 356.8 | ||||||
Provision/(benefit) for income taxes: | |||||||||||
Current: | |||||||||||
Domestic | $ | 1.5 | $ | (22.0 | ) | $ | 18.0 | ||||
Foreign | 52.0 | 45.2 | 33.1 | ||||||||
$ | 53.5 | $ | 23.2 | $ | 51.1 | ||||||
Deferred: | |||||||||||
Domestic | $ | (16.0 | ) | $ | (3.0 | ) | $ | 3.0 | |||
Foreign | 84.3 | (8.7 | ) | 1.5 | |||||||
$ | 68.3 | $ | (11.7 | ) | $ | 4.5 | |||||
Total provision | $ | 121.8 | $ | 11.5 | $ | 55.6 | |||||
A reconciliation between the actual income tax expense provided and the income taxes computed by applying the statutory federal income tax rate of 35.0% in 2016, 2015 and 2014 to the income before income taxes is as follows:
Year Ended December 31, | |||||||||||
(Amounts in millions) | 2016 | 2015 | 2014 | ||||||||
Tax provision at statutory rate | $ | 129.2 | $ | 104.1 | $ | 124.9 | |||||
State income taxes | 0.2 | 1.1 | 0.7 | ||||||||
Foreign earnings taxed at other than 35% | (28.5 | ) | (22.6 | ) | (35.7 | ) | |||||
Increase/(decrease) in valuation allowance | — | 4.5 | (1.1 | ) | |||||||
Unremitted foreign earnings | (0.5 | ) | (5.9 | ) | (3.6 | ) | |||||
Excess Profit Ruling (EPR) | — | — | (20.9 | ) | |||||||
Uncertain tax position for 2012-2014 EPR | 69.3 | — | — | ||||||||
Patent Income Deduction (PID) | (20.8 | ) | (16.9 | ) | — | ||||||
High & New Technology Enterprise (HNTE) grant | (7.6 | ) | (6.0 | ) | (4.8 | ) | |||||
Hybrid financing structure | (11.1 | ) | (10.9 | ) | (12.7 | ) | |||||
Notional Interest Deduction (NID) | (2.9 | ) | (4.0 | ) | (7.9 | ) | |||||
(Increase)/decrease in other uncertain tax positions | (10.6 | ) | (32.6 | ) | 3.3 | ||||||
Equity compensation | 4.6 | 3.8 | 4.8 | ||||||||
Other, net | 0.5 | (3.1 | ) | 8.6 | |||||||
Total provision | $ | 121.8 | $ | 11.5 | $ | 55.6 | |||||
The effective income tax rates for 2016, 2015 and 2014 were 33.0%, 3.9% and 15.6%, respectively.
The Company has operations and a taxable presence in 28 countries outside the United States and all of these countries have a tax rate that is lower than the rate in the U.S. The countries in which the Company has a material presence include Belgium, China, Germany, India, the Netherlands and Poland. Belgium has historically had the largest impact on the Company’s effective tax rate primarily because of the Company’s participation in the Belgian EPR and PID programs. The Company has also benefited from notional interest deductions in Belgium although this tax incentive has reduced significantly in recent years due to lower interest rates. In addition, the Company benefits from various tax rulings and incentives the most significant of which are China’s granting of HNTE status that reduces China’s corporate tax rate on local manufacturing profits by 10% and a hybrid Dutch/U.S. intragroup financing structure.
The income tax provision for 2016 includes the net result of taxes on the mix of earnings in multiple tax jurisdictions; the claw-back of Belgian tax losses for 2012-2014 following the EPR decision of the European Commission; U.S. and foreign deferred
77
taxes on unremitted foreign earnings, the Belgium PID, the China HNTE status, the hybrid Dutch/U.S. financing structure, the Belgium NIDs; non-tax deductible employee equity compensation and the release of a tax reserve following the expiration of a statute of limitation offset by the accrual of interest on uncertain tax positions. The Company continues to assert permanent reinvestment of unremitted foreign earnings outside of the U.S. and currently does not have any plans or needs to repatriate additional earnings to the U.S. from its foreign subsidiaries except for Brazil.
In 2015, the tax provision was prepared assuming the Company would claim EPR equal to $16.9 million of tax; however - in the 2015 Belgium tax return submitted in Q3 2016 - no EPR was claimed and instead the PID benefit was deducted from taxable profits. The column for 2015 in the tax rate reconciliation table above has been revised to reflect this change.
The nature of the reconciling item "Foreign earnings taxed at other than 35%" is net of permanent differences including non-taxable income in foreign jurisdictions, foreign tax credits and rulings, resulting in a net tax benefit.
Management has determined that it is more likely than not that it will not realize $12.6 million of its deferred tax assets in other foreign jurisdictions since evidence such as historical operating profits resulted in a lack of taxable earnings during the most recent three-year period ended December 31, 2016, the lack of projected earnings and an arbitration claim related to tax deductions taken in a previous year provided sufficient negative evidence to record a valuation allowance against such deferred tax assets related to carryforwards for net operating losses.
In 2015, the income tax provision includes the net result of taxes on the mix of earnings in multiple tax jurisdictions; U.S. and foreign deferred taxes on unremitted foreign earnings; tax benefits from the Belgium PID, China HNTE status, the hybrid Dutch/U.S. financing structure and the Belgium NIDs; non-tax deductible employee equity compensation and a tax benefit related principally related to the settlement of a U.S. tax audit offset by the accrual of interest on uncertain tax positions.
In 2014, the income tax provision includes the net result of taxes on the mix of earnings in multiple tax jurisdictions; U.S. and foreign deferred taxes on unremitted foreign earnings; tax benefits from the Belgium EPR, China HNTE status, the hybrid Dutch/US financing structure and the Belgium NIDs; non-tax deductible employee equity compensation; increased tax reserves and the accrual of interest on uncertain tax positions.
The following table details the gross deferred tax liabilities and assets and the related valuation allowances:
Year Ended December 31, | |||||||
(Amounts in millions) | 2016 | 2015 | |||||
Deferred tax liabilities: | |||||||
Basis difference in noncontrolling interest | $ | 9.0 | $ | 9.4 | |||
Facilities (accelerated depreciation, capitalized interest and purchase accounting differences) | 14.1 | 14.4 | |||||
Unremitted foreign earnings | 96.3 | 97.0 | |||||
Intangibles | 19.4 | 16.3 | |||||
$ | 138.8 | $ | 137.1 | ||||
Deferred tax assets: | |||||||
Foreign net operating losses and tax credits | $ | 33.5 | $ | 136.0 | |||
Post-retirement and other employee benefits | 117.6 | 101.5 | |||||
Intangibles | 52.1 | 46.8 | |||||
Inventory | 2.0 | 0.6 | |||||
Warranties | 2.0 | 1.7 | |||||
Other | 14.2 | 7.7 | |||||
$ | 221.4 | $ | 294.3 | ||||
Valuation allowances | (12.6 | ) | (13.5 | ) | |||
Net deferred tax assets | $ | 70.0 | $ | 143.7 | |||
As of December 31, 2016, the Company has $292.8 million of net operating loss carry forwards (NOLs) available for utilization in future years. Approximately $287.5 million of such NOLs have an unlimited life and the remainder of $5.3 million is available for periods of up to 9 years. As of December 31, 2016, the Company has provided a valuation allowance of $0.9 million and $11.7 million representing the value of the associated deferred tax assets with regard to $5.3 million of NOLs and tax credits available for up to 9 years and $34.4 million of NOLs with an unlimited carryforward, respectively. An unrecognized tax
78
benefit related to uncertain foreign tax positions (principally the EPR NOLs clawback) equal to $203.8 million (or $67.3 million of unrecognized tax benefits) has been offset against the net deferred tax asset.
Unrecognized tax benefits as of December 31, 2016 amounted to $70.2 million of which $67.3 million has been offset against deferred tax assets as stated above. The Company is currently unable to estimate the timing of payment of the remaining unrecognized tax benefit of $2.9 million.
There are no material unrecognized tax benefits related to WABCO obligations directly to tax authorities for Trane’s Bath & Kitchen business as further discussed in Note 17. There was no interest related to unrecognized tax benefits recorded in the consolidated statements of operations in 2016, as compared to $0.3 million and $1.0 million in 2015 and 2014, respectively. Total accrued interest as of December 31, 2016, 2015 and 2014 was approximately $0.8 million, $1.7 million and $7.0 million, respectively. The Company recognizes accrued interest and penalties related to unrecognized tax benefits in income tax expense.
A reconciliation of the beginning and ending balances of unrecognized tax benefits is as follows (exclusive of interest):
Year Ended December 31, | ||||||||||
(Amounts in millions) | 2016 | 2015 | 2014 | |||||||
Beginning balance, January 1 | $ | 14.6 | $ | 41.5 | $ | 39.3 | ||||
Additions for tax positions related to current year | 66.7 | 5.1 | 2.2 | |||||||
Additions for tax positions related to prior years | — | — | 25.8 | |||||||
Reductions for tax positions related to prior years | (1.1 | ) | (27.3 | ) | — | |||||
Cash settlements | — | (2.3 | ) | — | ||||||
Expirations of statute of limitations | (10.8 | ) | (2.4 | ) | (25.8 | ) | ||||
Ending balance, December 31 | $ | 69.4 | $ | 14.6 | $ | 41.5 | ||||
During 2016, the Company recorded an unrecognized tax benefit related to the EPR clawback of $69.3 million net of $4.1 million of cumulative translation adjustments. Further, during 2016, the Company reversed unrecognized tax benefits due primarily to the expiration of the applicable statute of limitation of $11.9 million net of $0.6 million of cumulative translation adjustments. In 2015, the Company reversed $32.0 million of unrecognized benefits due mainly to the settlement of a U.S. tax audit. In 2014, the Company reversed $25.8 million of unrecognized tax benefits due to the expiration of the applicable statute of limitation. This expiration also had a correlative impact on other unrecognized tax benefits which resulted in the Company recording an unrecognized tax benefit of $25.8 million (excluding penalties and interest) during 2014.
As of December 31, 2016, 2015 and 2014, there were $69.4 million, $14.6 million and $41.5 million of unrecognized tax benefits that, if recognized, would impact the annual effective tax rate.
We conduct business globally and, as a result, WABCO or one or more of our subsidiaries file income tax returns in the U.S. federal, state and local, and foreign jurisdictions. In the normal course of business, we are subject to examination by taxing authorities throughout the world, including such major jurisdictions as Belgium, Brazil, China, France, Germany, India, the Netherlands, Poland, the United Kingdom and the U.S. The Internal Revenue Service (IRS) has concluded its examination for all years prior to 2015. With no material exceptions, the Company is no longer subject to examinations by foreign tax authorities for years before 2008.
As a result of the allocation of purchase accounting (principally goodwill) to foreign subsidiaries, the book basis in the net assets of the foreign subsidiaries exceeds the related U.S. tax basis in the subsidiaries' stock. Such investments are considered permanent in duration and accordingly, no deferred taxes have been provided on such differences, which are significant. As stated above, no provision is made for U.S. income taxes applicable to undistributed earnings of foreign subsidiaries that are permanently reinvested outside of the U.S., except for Brazil's current year earnings. The Company continues to assert permanent reinvestment outside the U.S. with respect to the remainder of its foreign earnings and at this time, does not have any plans or needs to repatriate additional earnings to the U.S. from its foreign subsidiaries except for Brazil.
In addition, due to the receipt in the fourth quarter of 2013 of an exceptional refund including interest from the European Commission that increased earnings beyond these operational, strategic and other needs outside the U.S., the Company has previously recorded a tax provision on $300.0 million of its Belgian affiliate’s earnings for which the Company does not assert permanent reinvestment outside the U.S. This deferred U.S tax on undistributed earnings is offset by applicable deferred foreign taxes to enable our Dutch international holding company or its subsidiaries to make the $300.0 million distribution to the U.S. and to enable additional investments in foreign operations. The Company estimates the amount of its permanently reinvested
79
unremitted foreign earnings to be approximately $1.1 billion as of December 31, 2016; however, it is not practicable to estimate the U.S. and foreign taxes that would arise if the earnings that are considered permanently reinvested were remitted to the U.S.
NOTE 17. | Tax and Indemnification Liabilities Transferred from Trane to WABCO |
Pursuant to the Tax Sharing Agreement between Trane and WABCO, entered into on July 16, 2007, and other agreements with Trane as filed in WABCO’s Form 10 prior to its spin-off from Trane, WABCO is responsible for certain tax contingencies and indemnification liabilities. As of December 31, 2016, the Company had probable indemnification liabilities of $0.1 million, compared to $0.7 million as of December 31, 2015, all of which are classified within long-term liabilities on the balance sheet. It is reasonably possible that the Company could incur losses in excess of the amounts accrued. Although this amount cannot be estimated, we believe that any additional losses would not have a material adverse impact on the consolidated financial statements.
For the year ended December 31, 2016, no indemnification liabilities were reversed, as compared to $1.2 million and $4.3 million reversed for the years ended December 31, 2015 and 2014, respectively, due to the settlement of foreign tax audits and expiration of statutes of limitations. We also paid indemnification liabilities of $0.5 million during 2016 in relation to the above.
Under an indemnification agreement, WABCO Brazil is responsible for certain claims related to its business for periods prior to the spin-off of WABCO from American Standard. In particular, there are tax claims pending in various stages of the Brazilian legal process related to income, social contribution and/or value added taxes for which a contingency exists and which may or may not ultimately be incurred by the Company. The estimated total amount of the claims as of December 31, 2016 was $51.2 million including interest. However, based on management’s assessment and advice of our external legal counsel, the Company believes that it has valid arguments in all of these cases and the likelihood of loss is not probable and thus no accrual is required at this time.
NOTE 18. Related Party Transactions
Investments in and Advances to Unconsolidated Joint Ventures
WABCO has three investments in affiliates that are accounted for under the equity method:
• | Meritor WABCO, in which WABCO has a 50% equity ownership. Meritor WABCO markets braking systems products and sells the majority of WABCO products in the United States. |
• | WABCO Automotive South Africa (WABCO SA), in which WABCO has a 49% equity ownership. WABCO SA is a distributor of breaking systems products and sells WABCO products primarily in South Africa. |
• | WABCOWURTH Workshop Services GmbH (WABCOWURTH), in which WABCO has a 50% equity ownership. WABCOWURTH supplies commercial vehicle workshops, fleet owners and operators and end users internationally with its multi-brand technology diagnostic system. |
As of December 31, 2016, WABCO has net investments in and advances to Meritor WABCO of $15.2 million, WABCO SA of $4.2 million and WABCOWURTH of $0.1 million. WABCO received dividends from the joint ventures of $29.8 million, $27.5 million and $23.4 million for the years ended December 31, 2016, 2015 and 2014, respectively.
(Amounts in millions) | WABCO Sales to | WABCO Purchases from | |||||||||||||||||||||
Joint Venture | 2016 | 2015 | 2014 | 2016 | 2015 | 2014 | |||||||||||||||||
Meritor WABCO | $ | 167.6 | $ | 228.7 | $ | 218.7 | $ | 0.1 | $ | — | $ | 0.7 | |||||||||||
WABCO SA | 3.6 | 4.8 | 4.5 | 4.3 | 3.9 | — | |||||||||||||||||
WABCOWURTH | 0.2 | 0.2 | 0.2 | 0.3 | 0.2 | 0.3 | |||||||||||||||||
(Amounts in millions) | WABCO Receivables from | WABCO Payables to | |||||||||||||
Joint Venture | 2016 | 2015 | 2016 | 2015 | |||||||||||
Meritor WABCO | $ | 27.1 | $ | 35.6 | $ | 0.2 | $ | 0.2 | |||||||
WABCO SA | 1.0 | 1.6 | — | — | |||||||||||
WABCOWURTH | — | — | — | — | |||||||||||
80
Consolidated Joint Ventures
WABCO has three fully consolidated joint ventures as of December 31, 2016. The first of these joint ventures is in Japan with Sanwa-Seiki where the joint venture distributes WABCO's products in the local market. WABCO's ownership interest in the joint venture with Sanwa-Seiki is 90%.
The second joint venture is in the United States with Cummins Engine Co. (Cummins), a manufacturing partnership formed to produce air compressors designed by WABCO. WABCO's ownership interest in the joint venture with Cummins is 70%.
The third joint venture is with Guangdong FUWA Heavy Industry Co., Ltd., (FUWA) to produce air disc brakes for commercial trailers in China. FUWA is the largest manufacturer of commercial trailer axles in China and in the world. WABCO's ownership interest in the joint venture with FUWA is 70%.
(Amounts in millions) | WABCO Sales to | WABCO Purchases from | |||||||||||||||||||||
Joint Venture | 2016 | 2015 | 2014 | 2016 | 2015 | 2014 | |||||||||||||||||
Sanwa-Seiki | $ | — | $ | — | $ | — | $ | 22.8 | $ | 25.7 | $ | 31.3 | |||||||||||
Cummins | 75.7 | 88.7 | 86.0 | 0.1 | — | — | |||||||||||||||||
FUWA | 7.1 | 7.1 | 6.3 | — | — | — | |||||||||||||||||
NOTE 19. Geographic Information
WABCO is a fully integrated global business with management structures established in a variety of ways, including around products, distribution channels and key customers. Our largest customer is Daimler, which accounted for 10% of our sales in 2016 and 2015 and 11% in 2014. Volvo, our next largest customer, accounted for 8% of our sales in 2016 and 2015 and 10% in 2014. WABCO's plants, engineering, technical support, distribution centers and other support functions are shared among various product families and serve all distribution channels with many customers. Based on the organizational structure, as well as the nature of financial information available and reviewed by the Company's chief operating decision maker to assess performance and make decisions about resource allocations, the Company has concluded that its total WABCO operations represent one reportable segment.
European sales for the years ended December 31, 2016, 2015 and 2014 accounted for 54%, 56% and 59% of total sales, respectively. Asian sales for the years ended December 31, 2016, 2015 and 2014 accounted for 24%, 22% and 19% of total sales, respectively. We are strongly rooted in China and India and have achieved a leading position in the marketplace through increasingly close connectivity to customers. We continue to be strengthened in Asia by an outstanding network of suppliers, manufacturing sites and engineering hubs.
81
Geographic Data
Year Ended December 31, | |||||||||||
(Amounts in millions) | 2016 | 2015 | 2014 | ||||||||
Product Sales: | |||||||||||
OEM | $ | 2,101.0 | $ | 1,949.8 | $ | 2,099.4 | |||||
Aftermarket | 709.0 | 677.7 | 751.6 | ||||||||
Sales - Geographic distribution (a): | |||||||||||
United States | $ | 399.9 | $ | 437.1 | $ | 383.5 | |||||
Europe (countries below are included in this total) | 1,509.2 | 1,464.3 | 1,668.5 | ||||||||
Germany | 618.9 | 588.3 | 698.7 | ||||||||
France | 83.6 | 83.9 | 89.8 | ||||||||
Netherlands | 108.8 | 96.1 | 101.0 | ||||||||
Sweden | 185.9 | 176.4 | 206.8 | ||||||||
Other (countries below are included in this total) | 900.9 | 726.1 | 799.0 | ||||||||
Japan | 107.7 | 93.9 | 105.4 | ||||||||
China | 290.4 | 233.9 | 221.8 | ||||||||
Brazil | 71.4 | 73.7 | 156.7 | ||||||||
India | 202.1 | 168.8 | 127.1 | ||||||||
Total sales | $ | 2,810.0 | $ | 2,627.5 | $ | 2,851.0 | |||||
(a) | Sales to external customers are classified by country of destination. |
As of December 31, | |||||||||||
(Amounts in millions) | 2016 | 2015 | 2014 | ||||||||
Long-lived Assets (b) | |||||||||||
Geographic distribution: | |||||||||||
United States | $ | 92.6 | $ | 46.2 | $ | 22.0 | |||||
Europe (countries below are included in this total) | 623.6 | 660.2 | 727.4 | ||||||||
Germany | 262.0 | 268.9 | 284.9 | ||||||||
Poland | 126.0 | 130.0 | 127.6 | ||||||||
Other (countries below are included in this total) | 236.2 | 191.6 | 212.5 | ||||||||
India | 94.6 | 95.0 | 97.2 | ||||||||
China | 54.6 | 61.6 | 66.0 | ||||||||
Total long-lived assets | $ | 952.4 | $ | 898.0 | $ | 961.9 | |||||
(b) | Amounts are presented on a net basis and exclude deferred tax assets and investments in unconsolidated joint ventures. |
NOTE 20. Derivative Instruments and Hedging Activities
ASC 815, Derivatives and Hedging, requires a company to recognize all of its derivative instruments as either assets or liabilities on the balance sheet at fair value. The accounting for changes in the fair value of a derivative instrument depends on whether it qualifies and has been designated as a relationship hedge. For those derivative instruments that are designated and qualify as hedging instruments, a company must designate the hedging instrument, based upon the exposure being hedged, as a fair value hedge, cash flow hedge, or a hedge of a net investment in a foreign operation.
The Company recognizes all derivative financial instruments in the consolidated balance sheets at fair value using Level 2 inputs and these are classified as “other current assets,” “other assets,” “other accrued liabilities” or “other liabilities” on the consolidated balance sheets. Level 2 inputs used by the Company in valuing its derivative instruments include model-based valuation techniques for which all significant assumptions are observable in the market.
The earnings impact resulting from changes in the fair value of derivative instruments is recorded in the same line item in the consolidated statements of operations as the underlying exposure being hedged or in accumulated other comprehensive income
82
(AOCI) for derivatives that qualify and have been designated as cash flow hedges or hedges of a net investment in a foreign operation. Any ineffective portion of a financial instrument's change in fair value is recognized in earnings together with changes in the fair value of any derivatives not designated as relationship hedges.
Cash Flow Hedges
During the first quarter of 2015, the Company entered into and settled treasury rate lock agreements which were designated as cash flow hedges in anticipation of issuing the Senior Notes as discussed in Note 14. A loss related to these cash flow hedges of $1.3 million, net of taxes of $0.7 million, has been recognized in other comprehensive income upon settlement of these treasury rate lock agreements in 2015. The related amount of hedge ineffectiveness was immaterial. The amount of unrealized loss reclassified to earnings for the years ended December 31, 2016 and 2015 was $0.2 million and $0.1 million, respectively.
Net Investment Hedges
During the third and fourth quarters of 2016, the Company entered into various forward contracts with an aggregate notional amount of €440.0 million that were designated as partial hedges of the foreign currency exposure of its investments in certain Euro-denominated wholly-owned subsidiaries. All of these contracts had matured as of December 31, 2016. Due to the the high degree of effectiveness between the hedging instrument and the exposure being hedged, a gain of $9.3 million, net of taxes of $5.8 million, related to these contracts has been recognized in cumulative translation adjustment within accumulated other comprehensive income (AOCI) for the year ended December 31, 2016.
On November 15, 2016, the Company issued EUR Senior Notes of an aggregate amount of €440.0 million as previously discussed in Note 14, that were also designated as partial hedges of the foreign currency exposure of its investments in certain Euro-denominated wholly-owned subsidiaries. As of December 31, 2016, there was no hedge ineffectiveness and a gain of $6.3 million, net of taxes of $3.9 million, related to these notes has been recognized in cumulative translation adjustment within AOCI.
Derivatives Not Designated as Hedges
Foreign exchange contracts are also used by the Company to offset the earnings impact relating to the variability in exchange rates on certain assets and liabilities denominated in non-functional currencies and have not been designated as relationship hedges. As of December 31, 2016 and 2015, the Company had the following outstanding notional amounts related to foreign currency forward contracts:
(Amount in millions) | As of December 31, 2016 | As of December 31, 2015 | ||||||||||||
Foreign Currency | Unit of Measure | Quantity Hedged | Notional Amount (USD Equivalent) | Quantity Hedged | Notional Amount (USD Equivalent) | |||||||||
Chinese Yuan | CNY | 495.0 | 64.2 | 194.0 | 24.4 | |||||||||
Hong Kong Dollar | HKD | 294.5 | 34.6 | 295.0 | 31.8 | |||||||||
British Pound | GBP | 12.7 | 14.2 | 11.2 | 13.9 | |||||||||
Brazilian Real | BRL | 43.1 | 11.7 | * | * | |||||||||
* No significant outstanding foreign currency forward contracts
The Company had additional foreign currency forward contracts with notional amounts that individually amounted to less than $10 million. As of December 31, 2016 and 2015, respectively, the aggregate notional amount of forward contracts outstanding was €146.9 million ($154.1 million at December 31, 2016 exchange rates) and €107.7 million ($117.7 million at December 31, 2015 exchange rates) with an average duration of one month. The fair value of the derivatives was immaterial as of December 31, 2016 and 2015.
For the years ended December 31, 2016 and 2015, the Company recognized net gains on its derivative instruments of $1.6 million and $6.0 million, respectively. When combined with the revaluation of assets and liabilities, these foreign exchange contracts resulted in a net non-operating loss of $0.2 million in 2016 and a net non-operating gain of $0.3 million in 2015.
83
NOTE 21. Business Combinations
Acquisition of MICO, Inc.
On February 1, 2016, the Company acquired MICO, Inc. (MICO) for cash consideration of $66.4 million, excluding cash acquired of $6.4 million, resulting in net cash paid of $60.8 million. MICO manufactures and markets hydraulic components, controls and brake systems for heavy-duty, off-highway vehicles in agriculture, construction, mining and similar industries.
The allocation of the purchase consideration to the assets acquired and liabilities assumed as of the acquisition date is final as of December 31, 2016. The following table summarizes the allocation of the net purchase consideration:
(Amounts in millions) | |||
Cash and cash equivalents | $ | 6.4 | |
Trade receivables | 5.8 | ||
Inventory | 11.8 | ||
Property, plant and equipment | 17.5 | ||
Intangible assets | 14.3 | ||
Other assets acquired | 3.0 | ||
Other liabilities assumed | (7.4 | ) | |
Identifiable net assets acquired | $ | 51.4 | |
Goodwill | 15.0 | ||
Net purchase consideration | $ | 66.4 | |
The intangible assets include amounts recognized for the fair value of trade name, customer-based and technology-related assets. The fair values of the intangible assets were determined based on an income and cost approach. The intangible assets are being amortized over a weighted-average useful life of approximately 11 years and are deductible for tax purposes. The goodwill generated is primarily attributable to expected synergies and is deductible for tax purposes. The transaction-related costs were expensed as incurred and were recorded within other non-operating expense. The pro forma effects of this acquisition would not materially impact the Company's reported results for any period presented and as a result, no pro forma financial statements have been presented.
Acquisition of Laydon Composites Ltd.
On April 15, 2016, the Company acquired Laydon Composites Ltd. (LCL), a manufacturer of aerodynamic devices for heavy-duty trucks and trailers, for total consideration of $34.2 million. The Company paid $31.1 million, excluding cash acquired of $0.8 million, with additional contingent consideration of up to $4.3 million contingent upon the achievement of certain goals tied to annual and cumulative sales and earnings over a three year period. The range of undiscounted amounts the Company could be required to pay under this arrangement is between $0 and $4.3 million. As of the closing date of the acquisition, the contingent consideration was assigned a fair value of approximately $3.1 million.
The allocation of the purchase consideration to the assets acquired and liabilities assumed as of the acquisition date is provisional as of December 31, 2016 pending receipt of a final valuation of tangible and intangible assets. The following table summarizes the preliminary allocation of the net purchase consideration:
84
(Amounts in millions) | |||
Purchase price, cash consideration | $ | 31.1 | |
Purchase price, fair value of contingent consideration | 3.1 | ||
Net purchase consideration | $ | 34.2 | |
Cash and cash equivalents | $ | 0.8 | |
Intangible assets | 16.3 | ||
Other assets acquired | 3.2 | ||
Deferred tax liabilities | (4.3 | ) | |
Other liabilities assumed | (1.0 | ) | |
Identifiable net assets acquired | $ | 15.0 | |
Goodwill | 19.2 | ||
Net purchase consideration | $ | 34.2 | |
The intangible assets include amounts recognized for the fair value of trade name, customer-based and technology-related assets. The fair values of the intangible assets were determined based on an income and cost approach. The intangible assets are being amortized over a weighted-average useful life of approximately 18 years and are not deductible for tax purposes. The goodwill generated is primarily attributable to expected synergies and is not deductible for tax purposes. The transaction-related costs were expensed as incurred and were recorded within other non-operating expense. The pro forma effects of this acquisition would not materially impact the Company's reported results for any period presented and as a result, no pro forma financial statements have been presented.
Other Acquisitions
On February 1, 2016, the Company acquired assets from Trans-Safety LOCKS GmbH for $1.9 million.
85
NOTE 22. Quarterly Data (Unaudited)
Year 2016 | |||||||||||||||
(Amounts in millions) | First | Second | Third | Fourth | |||||||||||
Sales | $ | 688.7 | $ | 732.2 | $ | 675.4 | $ | 713.7 | |||||||
Cost of sales | 475.2 | 502.2 | 462.7 | 495.8 | |||||||||||
Gross profit | 213.5 | 230.0 | 212.7 | 217.9 | |||||||||||
Income before income taxes | 91.3 | 99.3 | 83.9 | 94.5 | |||||||||||
Income tax expense/(benefit) | 101.1 | 20.4 | (16.4 | ) | 16.7 | ||||||||||
Net (loss)/income attributable to Company | $ | (13.4 | ) | $ | 75.1 | $ | 98.1 | $ | 63.1 | ||||||
Net (loss)/income per common share | |||||||||||||||
Basic | $ | (0.24 | ) | $ | 1.34 | $ | 1.77 | $ | 1.15 | ||||||
Diluted | $ | (0.24 | ) | $ | 1.33 | $ | 1.76 | $ | 1.15 | ||||||
Year 2015 | |||||||||||||||
(Amounts in millions) | First | Second | Third | Fourth | |||||||||||
Sales | $ | 652.2 | $ | 661.1 | $ | 643.6 | $ | 670.6 | |||||||
Cost of sales | 438.6 | 453.6 | 479.0 | 470.8 | |||||||||||
Gross profit | 213.6 | 207.5 | 164.6 | 199.8 | |||||||||||
Income before income taxes | 93.3 | 86.8 | 36.1 | 81.3 | |||||||||||
Income tax expense/(benefit) | 18.5 | 18.5 | (5.2 | ) | (20.3 | ) | |||||||||
Net income attributable to Company | $ | 71.9 | $ | 65.8 | $ | 38.8 | $ | 98.7 | |||||||
Net income per common share | |||||||||||||||
Basic | $ | 1.23 | $ | 1.13 | $ | 0.67 | $ | 1.73 | |||||||
Diluted | $ | 1.22 | $ | 1.12 | $ | 0.67 | $ | 1.71 | |||||||
The sum of each value line for the four quarters does not necessarily equal the amount reported for the full year because of rounding.
86
ITEM 9. CHANGES IN AND DISAGREEMENTS WITH ACCOUNTANTS ON ACCOUNTING AND FINANCIAL DISCLOSURE
None.
ITEM 9A. CONTROLS AND PROCEDURES
The Company has established a Disclosure Controls Committee that assists the Chief Executive Officer and Chief Financial Officer in their evaluation of the Company's disclosure controls and procedures. Our Chief Executive Officer and Chief Financial Officer have concluded, based on their evaluation as of the end of the period covered by this report, that our disclosure controls and procedures, as defined in the Securities Exchange Act of 1934, Rule 13a-15(e), are effective to ensure that the information required to be disclosed in the reports that the Company files or submits under the Securities Exchange Act of 1934 is recorded, processed, summarized and reported, within the time periods specified in the Securities and Exchange Commission's (SEC) rules and forms, and (ii) is accumulated and communicated to the Company's management, including our Chief Executive Officer and Chief Financial Officer, as appropriate to allow timely decisions regarding required disclosure. There have been no changes in internal control over financial reporting during the most recent fiscal quarter that have materially affected, or are reasonably likely to materially affect, our internal control over financial reporting.
Management's Report On Internal Control Over Financial Reporting
Our management is responsible for establishing and maintaining adequate internal control over financial reporting for the Company. The Company's internal control over financial reporting is designed to provide reasonable assurance regarding the reliability of financial reporting and the preparation of consolidated financial statements for external purposes in accordance with generally accepted accounting principles. The Company's internal control over financial reporting includes those policies and procedures that:
(i) | pertain to the maintenance of records that, in reasonable detail, accurately and fairly reflect the transactions and dispositions of the assets of the Company, |
(ii) | provide reasonable assurance that transactions are recorded as necessary to permit preparation of consolidated financial statements in accordance with generally accepted accounting principles, and that receipts and expenditures of the Company are being made only in accordance with authorizations of management and directors of the Company, and |
(iii) | provide reasonable assurance regarding prevention or timely detection of unauthorized acquisition, use or disposition of the Company's assets that could have a material effect on the consolidated financial statements. |
Due to its inherent limitations, internal control over financial reporting may not prevent or detect misstatements. Also, projections of any evaluation of effectiveness to future periods are subject to the risk that controls may become inadequate because of changes in conditions, or that the degree of compliance with the policies and procedures included in such controls may deteriorate.
The Company conducted an evaluation of the effectiveness of its internal control over financial reporting based upon the 2013 framework in Internal Control - Integrated Framework issued by the Committee of Sponsoring Organizations of the Treadway Commission (COSO). During 2016, we acquired MICO and LCL as discussed in Note 21 of Notes to the Consolidated Financial Statements. Total assets as of December 31, 2016 and total revenues for the year ended December 31, 2016 related to these acquired operations were $109.6 million and $49.8 million, respectively. As permitted by the SEC, we have elected to exclude MICO and LCL from our assessment of internal control over financial reporting as of December 31, 2016. Based upon such evaluation, our management concluded that the Company's internal control over financial reporting was effective as of December 31, 2016.
The Company's effectiveness of its internal control over financial reporting as of December 31, 2016, has been audited by Ernst & Young Bedrijfsrevisoren BCVBA/Reviseurs d'Entreprises SCCRL, an independent registered public accounting firm, as stated in their attestation report which is included immediately below.
WABCO Holdings Inc.
February 17, 2017
87
Report of Independent Registered Public Accounting Firm
The Board of Directors and Shareholders of WABCO Holdings Inc. and Subsidiaries
We have audited WABCO Holdings Inc. and subsidiaries' internal control over financial reporting as of December 31, 2016, based on criteria established in the Internal Control-Integrated Framework issued by the Committee of Sponsoring Organizations of the Treadway Commission (2013 Framework) (the COSO criteria). WABCO Holdings Inc. and subsidiaries' management is responsible for maintaining effective internal control over financial reporting, and for its assessment of the effectiveness of internal control over financial reporting included in the accompanying Management's Report on Internal Control over Financial Reporting. Our responsibility is to express an opinion on the company's internal control over financial reporting based on our audit.
We conducted our audit in accordance with the standards of the Public Company Accounting Oversight Board (United States). Those standards require that we plan and perform the audit to obtain reasonable assurance about whether effective internal control over financial reporting was maintained in all material respects. Our audit included obtaining an understanding of internal control over financial reporting, assessing the risk that a material weakness exists, testing and evaluating the design and operating effectiveness of internal control based on the assessed risk, and performing such other procedures as we considered necessary in the circumstances. We believe that our audit provides a reasonable basis for our opinion.
A company's internal control over financial reporting is a process designed to provide reasonable assurance regarding the reliability of financial reporting and the preparation of financial statements for external purposes in accordance with generally accepted accounting principles. A company's internal control over financial reporting includes those policies and procedures that (1) pertain to the maintenance of records that, in reasonable detail, accurately and fairly reflect the transactions and dispositions of the assets of the company; (2) provide reasonable assurance that transactions are recorded as necessary to permit preparation of financial statements in accordance with generally accepted accounting principles, and that receipts and expenditures of the company are being made only in accordance with authorizations of management and directors of the company; and (3) provide reasonable assurance regarding prevention or timely detection of unauthorized acquisition, use, or disposition of the company's assets that could have a material effect on the financial statements.
Because of its inherent limitations, internal control over financial reporting may not prevent or detect misstatements. Also, projections of any evaluation of effectiveness to future periods are subject to the risk that controls may become inadequate because of changes in conditions, or that the degree of compliance with the policies or procedures may deteriorate.
As indicated in the accompanying Management’s Report On Internal Control Over Financial Reporting, management’s assessment of and conclusion on the effectiveness of internal control over financial reporting did not include the internal controls of MICO, Inc. and Laydon Composites Ltd., which are included in the December 31, 2016 consolidated financial statements of WABCO Holdings Inc. and subsidiaries and constituted $109.6 million of total assets as of December 31, 2016 and $49.8 million of revenues for the year then ended. Our audit of internal control over financial reporting of WABCO Holdings Inc. and subsidiaries also did not include an evaluation of the internal control over financial reporting of MICO Inc. and Laydon Composites Ltd.
In our opinion, WABCO Holdings Inc. and subsidiaries maintained, in all material respects, effective internal control over financial reporting as of December 31, 2016, based on the COSO criteria.
We also have audited, in accordance with the standards of the Public Company Accounting Oversight Board (United States), the consolidated balance sheets of WABCO Holdings Inc. and subsidiaries as of December 31, 2016 and 2015, and the related consolidated statements of operations, comprehensive income, cash flows and shareholders' equity for each of the three years in the period ended December 31, 2016 and our report dated February 17, 2017 expressed an unqualified opinion thereon.
Ernst & Young Bedrijfsrevisoren BCVBA/Reviseurs d'Entreprises SCCRL
Represented by:
/s/ Wim Van Gasse, Partner *
Brussels, Belgium
February 17, 2017
* Acting on behalf of a BVBA/SPRL
88
ITEM 9B. OTHER INFORMATION
None.
89
PART III
ITEM 10. | DIRECTORS, EXECUTIVE OFFICERS AND CORPORATE GOVERNANCE |
Pursuant to instruction G(3) to Form 10-K, the information required by Item 10 with respect to the Directors of the Company set forth under the heading “Proposal 1 - Election of Directors” and “Directors” in the Company's definitive proxy statement to be filed within 120 days following the end of the fiscal year covered by this report is incorporated herein by reference.
The information required by Item 10 with respect to the executive officers of the Company has been included in Part I of this Form 10-K (as Item 4A) under the heading “Executive Officers of the Registrant” in reliance on Instruction G(3) of Form 10-K and Instruction 3 to Item 401(b) of Regulation S-K.
Pursuant to instruction G(3) to Form 10-K, information concerning the Audit Committee and audit committee financial expert disclosure set forth under the headings “Governance - Board Matters and Committee Membership” and “- Committees of the Board - Audit Committee” in the Company's definitive proxy statement to be filed within 120 days following the end of the fiscal year covered by this report is incorporated herein by reference.
Pursuant to instruction G(3) to Form 10-K, information concerning compliance with Section 16(a) of the Securities Exchange Act of 1934 by officers and directors of the Company set forth under the heading “Certain Relationships or Related Person Transactions and Section 16 Reporting Compliance - Section 16(a) Beneficial Ownership Reporting Compliance” in the Company's definitive proxy statement to be filed within 120 days following the end of the fiscal year covered by this report is incorporated herein by reference.
Information regarding our Code of Conduct and Ethics set forth under the caption “Code of Conduct and Ethics” in Item 1 of Part I of this Form 10-K is incorporated herein by reference.
ITEM 11. | EXECUTIVE COMPENSATION |
Pursuant to Instruction G(3) to Form 10-K, information concerning director and officer executive compensation and related matters set forth under the headings “Report of the Compensation, Nominating and Governance Committee,” “Compensation Discussion and Analysis,” “Executive Compensation” and “Director Compensation” in the Company's definitive proxy statement to be filed within 120 days following the end of the fiscal year covered by this report is incorporated herein by reference.
Pursuant to instruction G(3) to Form 10-K, information concerning compensation committee interlocks and insider participation set forth under the headings “Governance - Compensation Committee Interlocks and Insider Participation” in the Company's definitive proxy statement to be filed within 120 days following the end of the fiscal year covered by this report is incorporated herein by reference.
ITEM 12. | SECURITY OWNERSHIP OF CERTAIN BENEFICIAL OWNERS AND MANAGEMENT AND RELATED STOCKHOLDER MATTERS |
Pursuant to Instruction G(3) to Form 10-K, information concerning shares of common stock of the Company beneficially owned by management and significant shareholders set forth under the heading “Common Stock Ownership of Officers, Directors and Significant Shareholders” in the Company's definitive proxy statement to be filed within 120 days following the end of the fiscal year covered by this report is incorporated herein by reference.
Pursuant to Instruction G(3) to Form 10-K, information concerning securities authorized for issuance under equity compensation plans set forth under the heading “Equity Compensation Plans” in the Company's definitive proxy statement to be filed within 120 days following the end of the fiscal year covered by this report is incorporated herein by reference.
ITEM 13. | CERTAIN RELATIONSHIPS AND RELATED TRANSACTIONS AND, DIRECTOR INDEPENDENCE |
Pursuant to Instruction G(3) to Form 10-K, information concerning certain relationships and related party transactions and director independence set forth under the headings “Certain Relationships or Related Person Transactions and Section 16 Reporting Compliance - Certain Relationships and Related Person Transactions,” and “Governance - Independence Standards for Board
90
Service” and “Availability of Corporate Governance Materials” in the Company's definitive proxy statement to be filed within 120 days following the end of the fiscal year covered by this report is incorporated herein by reference.
ITEM 14. | PRINCIPAL ACCOUNTING FEES AND SERVICES |
Pursuant to Instruction G(3) to Form 10-K, information concerning principal accounting fees and services set forth under the heading “Audit Committee Matters - Audit Committee's Pre-Approval Policies and Procedures” and “Audit and Non-Audit Fees” in the Company's definitive proxy statement to be filed within 120 days following the end of the fiscal year covered by this report is incorporated herein by reference.
91
PART IV
ITEM 15. | EXHIBITS AND FINANCIAL STATEMENT SCHEDULES |
(a) | 1. and 2. Financial statements and financial statement schedules |
The financial statements and financial statement schedule listed in the Index to Financial Statements and Financial Statement Schedule on the following page are incorporated herein by reference.
(b) The exhibits to this Report are listed on the accompanying Index to Exhibits and are incorporated herein by reference or are file as part of this Annual Report on Form 10-K.
92
INDEX TO FINANCIAL STATEMENTS AND FINANCIAL STATEMENT SCHEDULE
Page No. | ||
1 | Financial Statements: | |
Report of Independent Registered Public Accounting Firm | ||
Consolidated Statements of Operations for years ended December 31, 2016, 2015 and 2014 | ||
Consolidated Statements of Comprehensive Income for years ended December 31, 2016, 2015 and 2014 | ||
Consolidated Balance Sheets at December 31, 2016 and 2015 | ||
Consolidated Statements of Cash Flows for years ended December 31, 2016, 2015 and 2014 | ||
Consolidated Statements of Shareholders' Equity for years ended December 31, 2016, 2015 and 2014 | ||
Notes to Financial Statements | ||
2 | Financial statement schedule, years ended December 31, 2016, 2015 and 2014 | |
Schedule II - Valuation and Qualifying Accounts | ||
All other schedules have been omitted because the information is not applicable or is not material or because the information required is included in the financial statements or the notes thereto.
93
SCHEDULE II - VALUATION AND QUALIFYING ACCOUNTS
Years ended December 31, 2016, 2015 and 2014
(Amounts in thousands)
Description | Balance Beginning of Period | Additions Charged to Expense | Deductions | Other Additions (a) | Foreign Currency Translation Effects | Balance End of Period | ||||||||||||
2016: | ||||||||||||||||||
Reserve deducted from assets: | ||||||||||||||||||
Allowance for doubtful accounts receivable | 5,895 | 1,591 | (830 | ) | — | (177 | ) | 6,479 | ||||||||||
2015: | ||||||||||||||||||
Reserve deducted from assets: | ||||||||||||||||||
Allowance for doubtful accounts receivable | 5,524 | 974 | (159 | ) | — | (444 | ) | 5,895 | ||||||||||
2014: | ||||||||||||||||||
Reserve deducted from assets: | ||||||||||||||||||
Allowance for doubtful accounts receivable | 4,999 | 384 | (817 | ) | 1,463 | (505 | ) | 5,524 | ||||||||||
(a) Relates to allowances for doubtful accounts receivable assumed through the acquisition of Tavares in 2014 as discussed in Note 21 of Notes to the Consolidated Financial Statements of the Company's 2015 Form 10-K.
94
SIGNATURES
Pursuant to the requirements of Section 13 or 15(d) of the Securities Exchange Act of 1934, the registrant has duly caused this report to be signed on its behalf by the undersigned, thereunto duly authorized.
WABCO HOLDINGS INC.
By: /s/ Jacques Esculier
Jacques Esculier
Chief Executive Officer and Director
Pursuant to the requirements of the Securities Exchange Act of 1934, this report has been signed below by the following persons on behalf of the registrant and in the capacities and on the dates indicated.
Signatures | Title | Date |
/s/ Jacques Esculier | Chief Executive Officer and Chairman of the Board of Directors | February 17, 2017 |
Jacques Esculier | (Principal Executive Officer) | |
/s/ Prashanth Mahendra-Rajah | Chief Financial Officer | February 17, 2017 |
Prashanth Mahendra-Rajah | ||
/s/ Sean Deason | Vice President, Controller & Assistant Secretary | February 17, 2017 |
Sean Deason | ||
* | Director | February 17, 2017 |
Jean-Paul L. Montupet | ||
* | Director | February 17, 2017 |
G. Peter D'Aloia | ||
* | Director | February 17, 2017 |
Dr. Juergen Gromer | ||
* | Director | February 17, 2017 |
Mary Petrovich | ||
* | Director | February 17, 2017 |
Henry R. Keizer | ||
* | Director | February 17, 2017 |
Michael T. Smith | ||
* | Director | February 17, 2017 |
Thomas Gross | ||
* | Director | February 17, 2017 |
David N. ("Nick") Reilly | ||
* Signed by Attorney-in-fact
/s/ Lisa J. Brown |
Lisa J. Brown Attorney-in-fact |
95
WABCO HOLDINGS INC. AND SUBSIDIARIES
INDEX TO EXHIBITS
(The File Number of the Registrant, WABCO Holdings Inc., is 1-33332)
Certain of the following exhibits, designated with an asterisk (*) are filed herewith. The exhibits not so designated have been previously filed by the registrant with the Commission and are incorporated herein by reference to the documents indicated in parentheses, following the descriptions of such exhibits. Certain of the following exhibits, designated with a double asterisk (**) are management contracts or compensatory plans or arrangements.
Exhibit No. | Description |
2.1 | Separation and Distribution Agreement, dated as of July 16, 2007, by and between Trane Inc. and WABCO Holdings Inc. (previously filed as Exhibit 2.1 to the Company's Form 8-K (File No. 001-33332), filed on July 20, 2007 and herein incorporated by reference). |
3.1 | Amended and Restated Certificate of Incorporation (previously filed as Exhibit 3.1 to the Company's Form 8-K (File No. 001-33332), filed on July 18, 2007 and herein incorporated by reference). |
3.2 | Amended and Restated By-Laws of WABCO Holdings Inc. (previously filed as Exhibit 3.2 to the Company’s Form 10-K (File No. 001-33332), filed on February 15, 2013 and herein incorporated by reference). |
4.1 | Rights Agreement, dated as of July 16, 2007, by and between WABCO Holdings Inc. and The Bank of New York (previously filed as Exhibit 4.1 to the Company's Form 8-K (File No. 001-33332), filed on July 18, 2007 and herein incorporated by reference). |
4.2 | Certificate of Designation of Junior Participating Cumulative Preferred Stock (previously filed as Exhibit 4.2 to the Company's Form 8-K (File No. 001-33332), filed on July 18, 2007 and herein incorporated by reference). |
4.3 | Right Certificate (attached as an exhibit to the Rights Agreement, dated as of July 16, 2007, by and between WABCO Holdings Inc. and the Bank of New York (previously filed as Exhibit 4.1 to the Company's Form 8-K (File No. 001-33332), filed on July 18, 2007 and herein incorporated by reference). |
4.4 | Form of Specimen Common Stock Certificate (previously filed as Exhibit 4.4 to the Company's Form 10-Q (File No. 001-33332), filed on November 8, 2007 and herein incorporated by reference). |
10.1 | Tax Sharing Agreement, entered into as of July 16, 2007, by and among Trane Inc. and certain of its subsidiaries and WABCO Holdings Inc. and certain of its subsidiaries (previously filed as Exhibit 10.1 to the Company's Form 8-K (File No. 001-33332), filed on July 20, 2007 and herein incorporated by reference). |
10.2 | Employee Matters Agreement, dated as of July 16, 2007, by and between Trane Inc. and WABCO Holdings Inc. (previously filed as Exhibit 10.3 to the Company's Form 8-K (File No. 001-33332), filed on July 20, 2007 and herein incorporated by reference). |
10.3 | Indemnification and Cooperation Agreement, made and entered into as of July 16, 2007, by and among Trane Inc. and certain of its subsidiaries and WABCO Holdings Inc. and certain of its subsidiaries (previously filed as Exhibit 10.4 to the Company's Form 8-K (File No. 001-33332), filed on July 20, 2007 and herein incorporated by reference). |
10.4 | WABCO Holdings Inc. Omnibus Incentive Plan (previously filed as Exhibit 10.1 to the Company's Form S-8 (File No. 333-144906), filed on July 27, 2007 and herein incorporated by reference).** |
10.5 | Amendment to WABCO Holdings Inc. Omnibus Incentive Plan (previously filed as Exhibit 10.5 to the Company's Form 10-K, as amended (File No. 001-33332), filed on February 17, 2012 and herein incorporated by reference).** |
10.6 | Amended and Restated WABCO Holdings Inc.2009 Omnibus Incentive Plan (previously filed as Appendix C to the Company's Definitive Proxy Statement on Schedule 14A (File No. 001-33332), filed on April 19, 2013 and herein incorporated by reference).** |
96
10.7 | Form of Indemnification Agreement for executive officers and members of the Board of Directors (previously filed as Exhibit 10.6 to the Company's Form 10-12B, as amended (File No. 001-33332), filed on May 23, 2007 and herein incorporated by reference).** |
10.8 | Form of WABCO Holdings Inc. Stock Option Grant Agreement for U.S. Employees (previously filed as Exhibit 10.7 to the Company's Form 10-Q (File No. 001-33332), filed on November 8, 2007 and herein incorporated by reference).** |
10.9 | Form of WABCO Holdings Inc. Stock Option Grant Agreement for Non-U.S. Employees (previously filed as Exhibit 10.8 to the Company's Form 10-Q (File No. 001-33332), filed on November 8, 2007 and herein incorporated by reference).** |
10.10 | Form of WABCO Holdings Inc. Restricted Unit Grant Agreement for U.S. Employees (previously filed as Exhibit 10.9 to the Company's Form 10-Q (File No. 001-33332), filed on November 8, 2007 and herein incorporated by reference).** |
10.11 | Form of WABCO Holdings Inc. Restricted Unit Grant Agreement for Non-U.S. Employees (previously filed as Exhibit 10.10 to the Company's Form 10-Q (File No. 001-33332), filed on November 8, 2007 and herein incorporated by reference).** |
10.12 | Form of WABCO Holdings Inc 2009 Omnibus Incentive Plan Performance-Based Restricted Unit Grant Agreement (previously filed as Exhibit 10.1 to the Company's Form 10-Q (File No. 001-33332), filed on July 28, 2011 and herein incorporated by reference).** |
10.13 | Form of Director Deferred Stock Unit Award Agreement under the WABCO Holdings Inc 2009 Omnibus Incentive Plan (previously filed as Exhibit 10.2 to the Company's Form 10-Q (File No. 001-33332), filed on July 26, 2013 and herein incorporated by reference).** |
10.14 | WABCO Holdings Inc. Change of Control Severance Plan (previously filed as Exhibit 10.11 to the Company's Form 10-Q (File No. 001-33332), filed on November 8, 2007 and herein incorporated by reference).** |
10.15 | Amendment No. 1 to WABCO Holdings Inc. Change of Control Severance Plan, (previously filed as Exhibit 10.1 to the Company's Form 8-K (File No. 001-33332), filed on July 14, 2008 and herein incorporated by reference).** |
10.16 | Amendment No. 2 to WABCO Holdings Inc. Change of Control Severance Plan, effective as of December 31, 2008 (previously filed as Exhibit 10.14 to the Company's Form 10-K (File No. 001-33332), filed on February 24, 2009 and herein incorporated by reference).** |
10.17 | Amendment No. 3 to WABCO Holdings Inc. Change of Control Severance Plan, effective as of January 1, 2012 (previously filed as Exhibit 10.17 to the Company's Form 10-K, as amended (File No. 001-33332), filed on February 17, 2012 and herein incorporated by reference).** |
10.18 | Amendment No. 4 to WABCO Holdings Inc. Change of Control Severance Plan, effective as of November 30, 2012 (previously filed as Exhibit 10.18 to the Company’s Form 10-K (File No. 001-33332), filed on February 15, 2013 and herein incorporated by reference).** |
10.19 | WABCO Holdings Inc. Deferred Compensation Plan (previously filed as Exhibit 10.1 to the Company's Form S-8 (File No. 333-148972), filed on January 31, 2008 and herein incorporated by reference).** |
10.20 | Amendment to WABCO Holdings Inc. Deferred Compensation Plan, effective as of December 31, 2008 (previously filed as Exhibit 10.16 to the Company's Form 10-K (File No. 001-33332), filed on February 24, 2009 and herein incorporated by reference).** |
10.21 | WABCO Holdings Inc. Supplemental Savings Plan (previously filed as Exhibit 10.20 to the Company's Form 10-Q (File No. 001-33332), filed on November 8, 2007 and herein incorporated by reference).** |
10.22 | Amendment to WABCO Holdings Inc. Supplemental Savings Plan, effective as of December 31, 2008 (previously filed as Exhibit 10.18 to the Company's Form 10-K (File No. 001-33332), filed on February 24, 2009 and herein incorporated by reference).** |
10.23 | Non-Qualified Deferred Compensation Program for Belgian Executives (Summary of French Language Program Document) (previously filed as Exhibit 10.1 to the Company's Form 10-Q (File No. 001-33332), filed on May 7, 2009 and herein incorporated by reference).** |
97
10.24 | Partnership Agreement, dated January 9, 1990, as amended by Amendment No. 1 thereto, dated May 29, 1990, and Amendment No. 2 thereto, entered into as of May 10, 2006, of Meritor WABCO Vehicle Control Systems (formerly known as Rockwell WABCO Vehicle Control Systems), by and between WABCO Automotive Control Systems, Inc. and ArvinMeritor Brake Holdings, Inc. (successor-in-interest to Rockwell Brake Systems, Inc.) (previously filed as Exhibit 10.5 to the Company's Form 10-12B (File No. 001-33332), filed on May 23, 2007 and herein incorporated by reference). |
10.25 | $100,000,000 Facility Agreement dated December 17, 2014, for WABCO Holdings Inc. arranged by Bank of America N.A., London Branch, Citigroup Global Markets Limited, BNP Paribas Fortis Bank S.A./N.V., The Bank of Tokyo-Mitsubishi UFJ, Ltd. and Unicredit Bank AG with Citigroup Global Markets Limited acting as coordinator and Citibank International Limited acting as agent (previously filed as Exhibit 10.1 to the Company’s Form 8-K (File No. 001-33332), filed on December 19, 2014 and herein incorporated by reference). |
10.26 | Management Agreement, effective as of January 1, 2012 between WABCO Europe SPRL/BVBA and Jacques Esculier (previously filed as Exhibit 10.31 to the Company’s Form 10-K (File No. 001-33332), filed on February 15, 2013 and herein incorporated by reference).** |
10.27 | Offer letter from the Company to Prashanth Mahendra-Rajah, dated March 20, 2014 (previously filed as Exhibit 10.2 to the Company’s Form 10-Q (File No. 001-33332), filed on April 25, 2014 and herein incorporated by reference).** |
10.28 | Offer letter from the Company to Leon Liu, dated June 5, 2014 (previously filed as Exhibit 10.1 to the Company’s Form 10-Q (File No. 001-33332), filed on July 25, 2014 and herein incorporated by reference).** |
10.29 | Management Agreement effective January 1, 2012 between WABCO Europe SPRL/BVBA and Nick Rens (previously filed as Exhibit 10.2 to the Company’s Form 10-Q (File No. 001-33332), filed on October 20, 2016 and herein incorporated by reference).** |
10.30 | Stock Purchase Agreement, made on February 12, 2014, among Creafund Transics Shares Stille Maatschap, Ludwig Lemenu, Walter Mastelinck, Cassel BVBA, Uniholding SA and WABCO Europe BVBA (previously filed as Exhibit 10.1 to the Company’s Form 10-Q (File No. 001-33332), filed on April 25, 2014 and herein incorporated by reference). |
10.31 | Note Purchase Agreement, dated May 8, 2015, among WABCO Holdings Inc. and each of the purchasers party thereto (previously filed as Exhibit 10.1 to the Company's Current Report on Form 8-K (File No. 001-33332), filed on May 11, 2015 and herein incorporated by reference). |
10.32 | Offer letter from WABCO Holdings Inc. to Sean Deason, dated April 24, 2015 (previously filed as Exhibit 10.2 to the Company’s Form 10-Q (File No. 001-33332), filed on July 24, 2015 and herein incorporated by reference).** |
10.33 | Amendment Agreement dated September 30, 2015 relating to a $400,000,000 Amended and Restated Facility Agreement for WABCO Holdings Inc. arranged by Citibank, N.A., London Branch, ING Belgium S.A./N.V., Bank of America Merrill Lynch International Limited, The Bank of Tokyo-Mitsubishi UFJ, Ltd., BNP Paribas Fortis S.A./N.V., Credit Lyonnais, The Royal Bank of Scotland Plc and UniCredit AG as Lenders (previously filed as Exhibit 10.1 to the Company’s Current Report on Form 8-K (File No. 001-33332), filed on October 6, 2015 and herein incorporated by reference). |
10.34 | Note Purchase Agreement, dated October 17, 2016, among WABCO Holdings Inc. and each of the purchasers party thereto (previously filed as Exhibit 10.1 to the Company's Form 8-K (File No. 001-33332), filed on October 20, 2016 and herein incorporated by reference). |
21.1 | Subsidiaries of the Company.* |
23.1 | Consent of Ernst & Young Bedrijfsrevisoren BCVBA/Réviseurs d'Entreprises SCCRL.* |
24.1 | Powers of Attorney (G. Peter D'Aloia, Dr. Juergen Gromer, Henry R. Keizer, Mary Petrovich, Michael T. Smith, Thomas Gross, Jean-Paul L. Montupet and David N. ("Nick") Reilly).* |
98
31.1 | Certification of the Chief Executive Officer pursuant to Section 302 of the Sarbanes-Oxley Act of 2002.* |
31.2 | Certification of the Chief Financial Officer pursuant to Section 302 of the Sarbanes-Oxley Act of 2002.* |
32.1 | Certification of the Chief Executive Officer pursuant to Section 906 of the Sarbanes-Oxley Act of 2002.* |
32.2 | Certification of the Chief Financial Officer pursuant to Section 906 of the Sarbanes-Oxley Act of 2002.* |
101 | The following financial information from WABCO Holdings Inc.'s Annual Report on Form 10-K for the period ended December 31, 2016, filed with the SEC on February 17, 2017, formatted in Extensible Business Reporting Language (XBRL): (i) the Consolidated Statements of Operations, (ii) the Consolidated Statements of Comprehensive Income, (iii) the Consolidated Balance Sheets, (iv) the Consolidated Statements of Cash Flows, (v) the Consolidated Statements of Shareholders' Equity, and (vi) Notes to the Consolidated Financial Statements. |
99