Attached files
Table of Contents
UNITED STATES
SECURITIES AND EXCHANGE COMMISSION
WASHINGTON D.C. 20549
FORM 10-K
| x | ANNUAL REPORT PURSUANT TO SECTION 13 OR 15(d) OF THE SECURITIES EXCHANGE ACT OF 1934 |
For the fiscal year ended December 31, 2009
OR
| ¨ | TRANSITION REPORT PURSUANT TO SECTION 13 OR 15(d) OF THE SECURITIES EXCHANGE ACT OF 1934 |
For the transition period from to .
Commission file number 1-33332
WABCO Holdings Inc.
(Exact name of Registrant as specified in its charter)
| Delaware | 20-8481962 | |
| (State or other jurisdiction of incorporation or organization) |
(I.R.S. Employer Identification No.) | |
| Chaussée de Wavre, 1789 1160 Brussels, Belgium |
||
| One Centennial Avenue, P.O. Box 6820, Piscataway, NJ |
08855-6820 | |
| (Address of principal executive offices) | (Zip Code) |
Registrant’s telephone number, including area code +32 2 663 98 00
Securities registered pursuant to Section 12(b) of the Act:
| Title of each class |
Name of each exchange on which registered | |
| Common stock, par value $0.01 per share |
New York Stock Exchange | |
| Securities registered pursuant to Section 12(g) of the Act: |
||
| Title of each class |
||
| None |
||
Indicate by check mark if the Registrant is a well-known seasoned issuer, as defined in Rule 405 of the Securities Act. x Yes ¨ No
Indicate by check mark if the Registrant is not required to file reports pursuant to Section 13 or Section 15(d) of the Act. ¨ Yes x No
Indicate by check mark whether the Registrant (1) has filed all reports required to be filed by Section 13 or 15(d) of the Securities Exchange Act of 1934 during the preceding 12 months (or for such shorter period that the Registrant was required to file such reports), and (2) has been subject to such filing requirements for the past 90 days. x Yes ¨ No
Indicate by check mark whether the Registrant has submitted electronically and posted on its corporate Web site, if any, every Interactive Data File required to be submitted and posted pursuant to Rule 405 of Regulation S-T (§232.405 of this chapter) during the preceding 12 months (or for such shorter period that the registrant was required to submit and post such files). ¨ Yes ¨ No
Indicate by check mark if disclosure of delinquent filers pursuant to Item 405 of Regulation S-K (Section 229.405 of this chapter) is not contained herein, and will not be contained, to the best of Registrant’s knowledge, in definitive proxy or information statements incorporated by reference in Part III of this Form 10-K or any amendment to this Form 10-K. ¨
Indicate by check mark whether the Registrant is a large accelerated filer, an accelerated filer, a non-accelerated filer or a smaller reporting company. See the definitions of “large accelerated filer,” “accelerated filer,” “non-accelerated filer” and “smaller reporting company” in Rule 12b-2 of the Exchange Act (check one).
| Large Accelerated filer x |
Accelerated filer ¨ | |
| Non-Accelerated filer ¨ |
Smaller reporting company ¨ |
Indicate by check mark whether the Registrant is a shell company (as defined in Rule 12b-2 of the Exchange Act). ¨ Yes x No
The aggregate market value of the voting stock (Common Stock) held by non-affiliates of the Registrant as of the close of business on June 30, 2009 was approximately $1.2 billion based on the closing sale price of the common stock on the New York Stock Exchange on that date. The Registrant does not have any non-voting common equity.
Indicate the number of shares outstanding of the Registrant’s common stock, as of the latest practicable date.
| Common stock, $.01 par value, outstanding at |
||
| February 12, 2010 |
64,087,311 shares |
DOCUMENTS INCORPORATED BY REFERENCE
Part III incorporates information from certain portions of the Registrant’s definitive proxy statement to be filed with the Securities and Exchange Commission within 120 days after the fiscal year end of December 31, 2009.
Table of Contents
i
Table of Contents
Information Concerning Forward Looking Statements
Certain of the statements contained in this report (other than the historical financial data and other statements of historical fact), including, without limitation, statements as to management’s expectations and beliefs, are forward-looking statements. These forward-looking statements were based on various facts and were derived utilizing numerous important assumptions and other important factors, and changes in such facts, assumptions or factors could cause actual results to differ materially from those in the forward-looking statements. Forward-looking statements include the information concerning our future financial performance, financial condition, liquidity, business strategy, projected plans and objectives. Statements preceded by, followed by or that otherwise include the words “believes,” “expects,” “anticipates,” “strategies,” “prospects,” “intends,” “projects,” “estimates,” “plans,” “may increase,” “may fluctuate,” and similar expression or future or conditional verbs such as “will,” “should,” “would,” “may” and “could” are generally forward looking in nature and not historical facts. This report includes important information as to risk factors in “Item 1. Business”, “Item 1A. Risk Factors”, and “Item 7. Management’s Discussion and Analysis of Financial Condition and Results of Operations.” Many important factors could cause actual results to differ materially from management’s expectations, including:
| • | the actual level of commercial vehicle production in our end-markets; |
| • | adverse developments in the business of our key customers; |
| • | periodic changes to contingent liabilities, including those associated with litigation matters and government investigations; |
| • | the amount of the fine assessed by the European Commission and our ability to fund the payment of the fine; |
| • | our ability to access credit markets or capital markets on a favorable basis or at all; |
| • | continued turmoil and instability in the credit markets; |
| • | adverse developments in general business, economic and political conditions or any outbreak or escalation of hostilities on a national, regional or international basis; |
| • | changes in international or U.S. economic conditions, such as inflation, interest rate fluctuations, foreign exchange rate fluctuations or recessions in our markets; |
| • | unpredictable difficulties or delays in the development of new product technology; |
| • | pricing changes to our supplies or products or those of our competitors, and other competitive pressures on pricing and sales; |
| • | changes in the environmental regulations that affect our current and future products; |
| • | competition in our existing and future lines of business and the financial resources of competitors; |
| • | our failure to comply with regulations and any changes in regulations; |
| • | our failure to complete potential future acquisitions or to realize benefits from completed acquisitions; |
| • | our inability to implement our growth plan; |
| • | the loss of any of our senior management; |
| • | difficulties in obtaining or retaining the management and other human resource competencies that we need to achieve our business objectives; |
| • | labor relations; and |
| • | risks inherent in operating in foreign countries, including exposure to local economic conditions, government regulation, currency restrictions and other restraints, changes in tax laws, expropriation, political instability and diminished ability to legally enforce our contractual rights. |
We undertake no obligation to release publicly any revisions to any forward-looking statements, to report events or to report the occurrence of unanticipated events unless we are required to do so by law.
1
Table of Contents
| ITEM 1. | BUSINESS |
Overview
Except as otherwise indicated or unless context otherwise requires “WABCO”, “WABCO Holdings Inc.,” “we,” “us,” “our,” and “our company” refer to WABCO Holdings Inc. and its consolidated subsidiaries.
WABCO is a leading provider of electronic, mechanical and mechatronic products for the world’s leading commercial truck, trailer, bus and passenger car manufacturers. We manufacture and sell control systems, including advanced braking, stability, suspension, transmission control and air compressing and processing systems, that improve vehicle performance and safety and reduce overall vehicle operating costs. We estimate that our products are included in approximately two out of three commercial vehicles with advanced vehicle control systems and offered in sophisticated, niche applications in cars and sport utility vehicles (SUVs). We continue to grow in more parts of the world as we provide more components and systems throughout the life of a vehicle, from design and development to the aftermarket.
History of Our Company
WABCO was founded in the United States in 1869 as Westinghouse Air Brake Company. We were purchased by American Standard Companies Inc. (or “American Standard”) in 1968 and operated as the Vehicle Control Systems business division within American Standard until we were spun off from American Standard on July 31, 2007. Subsequent to our spin-off, American Standard changed its name to Trane Inc., which we herein refer to as “Trane”. On June 5, 2008, Trane was acquired in a merger with Ingersoll-Rand Company Limited (“Ingersoll Rand”) and exists today as a wholly owned subsidiary of Ingersoll-Rand.
The Separation of WABCO from Trane
The spin-off by Trane of its Vehicle Control Systems business became effective on July 31, 2007, through a distribution of 100% of the common stock of WABCO to Trane’s shareholders (the “Distribution”). The Distribution was effected through a separation and distribution agreement pursuant to which Trane distributed all of the shares of WABCO common stock as a dividend on Trane common stock, in the amount of one share of WABCO common stock for every three shares of outstanding Trane common stock to each shareholder on the record date. Trane received a private letter ruling from the Internal Revenue Service and an opinion from tax counsel indicating that the spin-off was tax free to the shareholders of Trane and WABCO. Please refer to Item 1A. “Risk Factors” below for information on the tax risks associated with the spin-off from Trane.
Our Relationship with Trane
On July 16, 2007, we entered into definitive agreements with Trane that, among other things, set forth the terms and conditions of our separation from Trane (“Separation”) and provide a framework for the relationship between WABCO and Trane following the Separation. The agreements provide for the allocation between WABCO and Trane of assets, liabilities and obligations attributable to periods prior to the Separation. In addition to the Separation and Distribution Agreement, which contains many of the key provisions related to the Separation of WABCO and the Distribution of WABCO’s common stock to Trane’s shareholders, the parties also entered into a Tax Sharing Agreement, a Transition Services Agreement, an Employee Matters Agreement and an Indemnification and Cooperation Agreement. A summary of the agreements with continued relevance is set forth below:
Separation and Distribution Agreement – sets forth WABCO’s agreements with Trane regarding principal transactions necessary to separate WABCO from Trane. This agreement also sets forth the other agreements that govern certain aspects of WABCO’s relationship with Trane after the completion of the Separation from Trane and provides for the allocation of certain assets to be transferred, liabilities to be assumed and contracts to be assigned to WABCO and Trane as part of the Separation.
Tax Sharing Agreement – governs the parties’ respective rights, responsibilities and obligations after the Distribution with respect to taxes, including ordinary course of business taxes and taxes, if any, incurred as a result of any failure of the Distribution of all of the common shares of WABCO to qualify as a tax-free distribution for U.S. federal income tax purposes within the meaning of Section 355 of the Internal Revenue Code of 1986, as amended.
2
Table of Contents
Indemnification and Cooperation Agreement – Pursuant to this agreement, WABCO Europe BVBA (an indirect wholly-owned subsidiary of WABCO), has agreed to be responsible for and to indemnify certain American Standard and Bath and Kitchen companies which were named in a Statement of Objections alleging infringements of European Union competition regulations, as well as their respective affiliates, successors and assigns, against any fines related to the European Commission’s investigation, as outlined in the Statement of Objections received by American Standard and certain of its European subsidiaries on March 28, 2007. For further detail, please refer to Legal Proceedings below and Note 13—Warranties, Guarantees, Commitments and Contingencies in the notes to the consolidated financial statements.
Products and Services
We develop, manufacture and sell advanced braking, stability, suspension and transmission control systems primarily for commercial vehicles. Our largest-selling products are pneumatic anti-lock braking systems (ABS), electronic braking systems (EBS), automated manual transmission systems, air disk brakes, and a large variety of conventional mechanical products such as actuators, air compressors and air control valves for heavy- and medium-sized trucks, trailers and buses. We also supply advanced electronic suspension controls and vacuum pumps to the car and SUV markets in Europe, North America and Asia. In addition, we sell replacement parts, diagnostic tools, training and other services to commercial vehicle aftermarket distributors, repair shops, and fleet operators.
WABCO is a leader in improving highway safety, with products that help drivers prevent accidents by enhancing vehicle responsiveness and stability. For example, we offer a stability control system for trucks and buses that constantly monitors the vehicle’s motion and dynamic stability. If the system detects vehicle instability, such as the driver swerving to avoid another vehicle, it responds by applying the brakes at specific wheels, or slowing the vehicle down to minimize the risk of instability or a rollover. Additionally, we have created the commercial vehicle industry’s first autonomous emergency braking system, OnGuardMAX™, which assists in collision imminent situations with moving or stopped vehicles. This highly technological system fuses data from video and laser sensors, integrates with braking, the engine, transmission and stability control systems to assist the driver in reducing risks of collision.
3
Table of Contents
Our key product groups and functions are described below.
| WABCO KEY PRODUCT GROUPS | ||
| SYSTEM / PRODUCT | FUNCTION | |
| Actuator |
Converts Energy Stored in Compressed Air into Mechanical Force Applied to Foundation Brake to Slow or Stop Commercial Vehicles | |
| Air Compressor and Air Processing/Air Management System |
Provides Compressed, Dried Air for Braking, Suspension and other Pneumatic Systems on Trucks, Buses and Trailers | |
| Foundation Brake |
Transmits Braking Force to a Disc or Drum (Connected to the Wheel) to Slow, Stop or Hold Vehicles | |
| Anti-lock Braking System (ABS) |
Prevents Wheel Locking during Braking to Ensure Steerability and Stability | |
| Conventional Braking System |
Mechanical and Pneumatic Devices for Control of Braking Systems in Commercial Vehicles | |
| Electronic Braking System (EBS) |
Electronic Controls of Braking Systems for Commercial Vehicles | |
| Electronic and Conventional Air Suspension Systems |
Level Control of Air Springs in Trucks, Buses, Trailers and Cars | |
| Transmission Automation |
Automates Transmission Gear Shifting for Trucks and Buses | |
| Vehicle Electronic Architecture (VEA) |
Central Electronic Modules Integrating Multiple Vehicle Control Functions | |
| Vehicle Electronic Stability Control (ESC) and Roll Stability Support (RSS) |
Enhances Driving Stability | |
Key Markets and Trends
Electronically controlled products and systems are important for the growth of our business. The market for these products is driven primarily by the growing electronics content of control systems in commercial vehicles. The electronics content has been increasing steadily with each successive platform introduction, as original equipment manufacturers (OEMs) look to improve safety and performance through added functionalities, and meet evolving regulatory safety standards. Overall the trends in commercial vehicle design show a shift in demand towards electronics content. Although the pace varies, this is a trend in all major geographies, and braking systems are part of this broader shift from conventional to advanced electronic systems. In addition to increasing safety, improving stopping distances, and reducing installation complexity, advanced EBS also allow for new functionality to be introduced into vehicles at a lower price. The new functionality includes stability control, adaptive cruise control, automated transmission controls, brake performance warning, vehicle diagnostics, driver assistance systems and engine braking/speed control. Adaptive cruise control uses sensors to detect proximity to other vehicles and automatically adjusts speed. Automated transmission controls reduce the amount of gear shifting, resulting in less physical effort and training required for drivers, less component wear, fewer parts, better fuel efficiency, and enhanced driver safety and comfort.
A fundamental driver of demand for our products is commercial truck production. Commercial truck production generally follows a multi-year cyclical pattern. While the number of new commercial vehicles built fluctuates each year, we have over the last five years demonstrated the ability to grow in excess of these fluctuations by increasing the amount of content on each vehicle. Due to the unprecedented decline in the commercial vehicle industry in 2009, WABCO’s European sales to truck and bus (“T&B”) OEM customers were down 58%, which still outperformed Western European T&B production that declined 62% in 2009. During the five year period through
4
Table of Contents
2009, WABCO’s European sales to T&B OEM customers, excluding the impact of foreign currency exchange rates, outperformed the rate of Western European T&B production by an average of 3% per year.
| Year to Year Change |
2005 | 2006 | 2007 | 2008 | 2009 | ||||||||||
| Sales to European T&B OEMs (at a constant FX rate) |
+6 | % | +10 | % | +12 | % | +4 | % | -58 | % | |||||
| Western European T&B Production |
+5 | % | +5 | % | +10 | % | +4 | % | -62 | % |
Customers
We sell our products primarily to four groups of customers around the world: truck and bus (OEMs), trailer (OEMs), commercial vehicle aftermarket distributors for replacement parts and services, and major car manufacturers. Our largest customer is Daimler, which accounts for approximately 12% of our sales. Other key customers include Arvin Meritor, Ashok Leyland, China National Heavy Truck Corporation (CNHTC), Cummins, Fiat (Iveco), Hino, Hyundai, MAN Nutzfahrzeuge AG (MAN), Meritor WABCO (a joint venture), Nissan Diesel, Paccar (DAF Trucks N.V. (DAF), Kenworth, Leyland and Peterbilt), Otto Sauer Achsenfabrik (SAF), Scania, TATA Motors, Volvo (Mack and Renault) and ZF Friedrichshafen AG (ZF). For the fiscal year ended December 31, 2009, our top 10 customers accounted for approximately 48% of our sales.
The largest group of our customers, representing approximately 55% of sales (62% in 2008), consists of truck and bus OEMs who are large, increasingly global and few in numbers due to industry consolidation. As truck and bus OEMs grow globally, they expect suppliers to grow with them beyond their traditional markets and become reliable partners, especially in the development of new technologies. WABCO has a strong reputation for technological innovation and often collaborates closely with major OEM customers to design and develop the technologies used in their products. Our products play an important role in vehicle safety and there are few other suppliers who compete across the breadth of products that we supply.
The second largest group, representing approximately 32% of sales (21% in 2008), consists of the commercial vehicle aftermarket distributor network that provides replacement parts to commercial vehicle operators. This distributor network is a fragmented and diverse group of customers, covering a broad spectrum from large OE-affiliated or owned distributors to small independent local distributors. The increasing number of commercial trucks in operation world-wide that are equipped with our products continuously increases demand for replacement parts and services, thus generating a growing stream of recurring aftermarket sales. Additionally, we continue to develop an array of service offerings such as diagnostics, training and other services to repair shops and fleet operators that will further enhance our presence and growth in the commercial vehicle aftermarket.
The next largest group, representing approximately 9% of sales (13% in 2008), consists of trailer manufacturers. Trailer manufacturers are also a fragmented group of local or regional players with great diversity in business size, focus and operation. Trailer manufacturers are highly dependent on suppliers such as WABCO to provide technical expertise and product knowledge. Similar to truck and bus OEMs, trailer manufacturers rely heavily on our products for important safety functions and superior technology.
The smallest group, representing approximately 4% of sales (4% in 2008), consists of car and SUV manufacturers to whom WABCO sells electronic air suspension systems and vacuum pumps. Electronic air suspension is a luxury feature with increasing penetration and above market growth. Vacuum pumps are used with diesel and GDI engines and, therefore, enjoy higher than average growth rates associated with increasing diesel and GDI applications in Europe and Asia. These customers are typically large, global, sophisticated and demand high product quality and overall service levels.
We address our customers through a global sales force that is organized around key accounts and customer groups and interfaces with product marketing and management to identify opportunities and meet customer needs across its product portfolio.
Europe represented approximately 65% of our sales in 2009, down from 76% in 2008, and ended the year representing only 60% of sales in the fourth quarter of 2009. The severe decline that occurred in the industry in Europe in 2009, combined with the less severe decline in India and improving market in China drove our sales in Asia to represent approximately 21% of our total sales in the fourth quarter of 2009. The growth in Asia is being
5
Table of Contents
enhanced by our strong roots in China and India where we have achieved leading positions in the marketplace through increasingly close connectivity to customers. We are further strengthened in Asia by an outstanding network of suppliers, manufacturing sites and engineering hubs.
| WABCO SALES | ||||||||||||||
| BY GEOGRAPHY | MAJOR END-MARKETS | |||||||||||||
| FY 2009 % of Sales |
Q4 2009 % of Sales |
FY 2009 % of Sales |
Q4 2009 % of Sales |
|||||||||||
| • Europe |
65 | % | 60 | % | • Truck & Bus Products (OEMs) |
55 | % | 56 | % | |||||
| • Asia Pacific |
18 | % | 21 | % | • Aftermarket |
32 | % | 31 | % | |||||
| • North America |
8 | % | 9 | % | • Trailer Products |
9 | % | 8 | % | |||||
| • South America |
6 | % | 7 | % | • Car Products |
4 | % | 5 | % | |||||
| • Other |
3 | % | 3 | % | ||||||||||
Backlog
Information on our backlog is set forth under Item 7 “Management’s Discussion and Analysis of Financial Condition and Results of Operations – Backlog” of this annual report.
Cyclical and Seasonal Nature of Business
Information on the cyclical and seasonal nature of our business is set forth under Item 7 “Management’s Discussion and Analysis of Financial Condition and Results of Operations – Cyclical and Seasonal Nature of Business” of this annual report.
Growth Strategy
Our growth strategy is focused on four key platforms: technology innovation, geographic expansion, aftermarket growth and opportunistic automotive application of our products and systems. Drivers of growth for both our aftermarket and advanced car systems are discussed in “Customers” above.
Technology
We continue to drive growth by utilizing our industry-leading expertise in developing electronically controlled systems, including braking, transmission automation, air suspension and air management systems. We have a strong track record of innovation and are responsible for some of the industry’s most important innovations including:
| • | First heavy-duty truck anti-lock braking system (ABS); |
| • | First electronically controlled air suspension (ECAS) system for commercial vehicles; |
| • | First commercial vehicle automated manual transmission (AMT) controls system; |
| • | First electronic stability control (ESC) system for commercial vehicles; |
| • | First collision safety system with active braking developed for the North American market, based on Adaptive Cruise Control technology (ACC); and |
| • | First autonomous emergency braking (AEB) system for commercial vehicles, for collision imminent situations with moving or stopped vehicles. |
We continue to expand our product and technology portfolio by introducing new products and functionalities, and by improving the penetration of recently launched technologies. Advanced products and functionalities are typically developed and adopted first in Europe and then migrate to North America and Asia. Important examples
6
Table of Contents
include the adoption of ABS and automated transmission systems that were first widely adopted in European markets before starting to penetrate North America and Asia. Over the last three years, we spent approximately $250 million for research activities, product development and product engineering.
We are also focused on longer-term opportunities, particularly in the area of Advanced Driver Assistance Systems (ADAS). ADAS is a technology concept that involves connecting advanced sensors with truck control devices, such as braking and steering systems as well as engine controls, to improve safety and avoid collisions. During 2008, we launched our OnGuard™ product family, which includes the world’s first autonomous emergency braking system for commercial vehicles that we will begin producing in 2012. This product will allow our customers to comply with upcoming European road safety regulations to be implemented thereafter.
Geographic Expansion
We continue to drive sales in the high growth markets of Eastern Europe, China, India and Brazil. In Eastern Europe, we have been manufacturing products since 2001. The market in Eastern Europe, although experiencing the effects of the global economic slowdown, has historically experienced rapid growth, and we have established relationships with local customers.
China
China is a key long-term growth market for us. The adoption of more advanced braking, safety and other related systems is increasing in China, and the number of trucks built in the country is expected to continue to increase in the longer term. We have been in China since 1996 and are the leading provider of advanced systems like ABS, with a strong brand and established customer relationships. In the short-to medium-term, growth will be driven by the enforcement of existing regulations making ABS mandatory on trucks, buses and trailers, and we are well positioned to take advantage of this growth. Additional near term growth will be driven by introducing other new products into the local market such as our advanced air compressors and our new generation air disc brakes, clutch servos and automated manual transmission (AMT) systems. We have begun to supply our highly advanced modular AMT systems to CNHTC in China, illustrating our ability to grow in this market. To serve the growing demand for products both in China and for export, we have two facilities to manufacture conventional products, advanced systems such as ABS, and new modular air compressors. In addition, we have built a new factory in China to more closely support the long-term supply agreement with CNHTC and are building another facility in China to support the joint venture formed in December 2008 with Guangdong FUWA Heavy Industry Co., Ltd. (FUWA), which will provide for the production of air disc brakes in China. In order to ensure opportunities in Asia receive enough focus and management attention, we have increased our management presence in the region.
India
India is another growth market for us due to its expected volume of truck production and increasing adoption of advanced technology for commercial vehicles. We participate in this market through WABCO-TVS (INDIA) Ltd. (“WABCO-TVS”), which we took a majority ownership position in during the second quarter of 2009, further strengthening the Company’s already well-anchored position in India. With three world class factories in different areas of India, we are the market leader in traditional braking products, while customer demand for advanced braking and control systems is progressing. India also provides a strong base for sourcing and engineering activities, which we are actively developing. WABCO-TVS is a sourcing hub for our global operations by purchasing raw materials locally at best cost and it provides machining capabilities in our factory in Mahindra City to process the metals, castings and electrical motors that are used in our other factories in Europe, North America, Brazil and China to manufacture our products. WABCO-TVS is also a center of mechanical and software engineering activity, as we continue to develop our long-standing relationships in the local engineering community to benefit our global research and development efforts.
Competition
Given the importance of technological leadership, vehicle life-cycle expertise, reputation for quality and reliability, and the growing joint collaboration between OEMs and suppliers to drive new product development, the space in which we mostly operate has not historically had a large number of competitors. Our principal competitors
7
Table of Contents
are Knorr-Bremse (Knorr’s U.S. subsidiary is Bendix Commercial Vehicle Systems) and, in certain categories, Haldex. In the advanced electronics categories, automotive players such as Bosch (automotive) and Continental (including Siemens-VDO) have recently been present in some commercial vehicle applications. In the mechanical product categories, several Asian competitors are emerging, primarily in China, who are focused on such products.
Manufacturing and Operations
Most of our manufacturing sites and distribution centers produce and/or house a broad range of products and serve all different types of customers. Currently, over 64% of our manufacturing workforce is located in best cost countries such as China, India and Poland up from approximately 10% in 1999. Facilities in best cost countries have helped reduce costs on the simpler and more labor-intensive products, while the facilities in Western Europe are focused on producing more technologically advanced products. All facilities globally are deploying Six Sigma Lean initiatives to improve productivity and reduce costs. By applying the Six Sigma philosophy and tools we seek to improve quality and predictability of our processes. Lean is geared towards eliminating waste in our supply chain, manufacturing and administrative processes. Both methodologies are customer driven and data based. In addition, our global supply chain team makes decisions on where to manufacture which products taking into account such factors as local and export demand, customer approvals, cost, key supplier locations and factory capabilities.
Our global sourcing organization purchases a wide variety of components including electrical, electro-mechanical, cast aluminum products and steel, as well as copper, rubber and plastic containing components that represent a substantial portion of manufacturing costs. We source products on a global basis from three key regions: Western Europe, Central and Eastern Europe and Asia. To support the continuing shift of manufacturing to best cost countries, we also continue to shift more of our sourcing to best cost regions. Under the leadership of the global sourcing organization, which is organized around commodity and product groups, we identify and develop key suppliers and seek to integrate them as partners into our extended enterprise. Many of our Western European suppliers are accompanying us on our move to best cost countries. Since 1999, the share of our sourcing from best cost regions has increased from 10% to approximately 41%.
We have developed a strong position in the design, development, engineering and testing of products, components and systems. We are generally regarded in the industry as a systems expert, having in-depth technical knowledge and capabilities to support the development of advanced technology applications. Key customers depend on us and will typically involve us very early in the development process as they begin designing next generation platforms. We have approximately 1,250 employees dedicated to developing new products, components and systems as well as supporting and enhancing current applications. Our sales organization hosts application engineers that are based near customers in all regions around the world and are partially resident at some customer locations. We also have significant resources in best cost countries performing functions such as drawings, testing and software component development. We operate test tracks in Germany, Finland (for extreme weather test conditions) and India.
Joint Ventures
We use joint ventures globally to expand and enhance our access to customers. Our important joint ventures are:
| • | A majority-owned joint venture (90%) in Japan with Sanwa-Seiki that distributes WABCO’s products in the local market. |
| • | A majority-owned (70%) partnership in the U.S. with Cummins Engine Co. (WABCO Compressor Manufacturing Co.), a manufacturing partnership formed to produce air compressors designed by WABCO. |
| • | A majority-owned joint venture (70%) in China with Mingshui Automotive Fitting Factory (MAFF) that provides conventional mechanical products to the local market. |
| • | A majority-owned joint venture (70%) with Guangdong FUWA Heavy Industry Co., Ltd., (“FUWA”) to produce air disc brakes for commercial trailers in China. FUWA is the largest manufacturer of commercial trailer axles in China and in the world. |
| • | A 50 percent owned joint venture in North America with Arvin Meritor Automotive Inc. (Meritor WABCO) that markets ABS and other vehicle control products. |
8
Table of Contents
| • | A minority equity investment in a joint venture in South Africa, where we have a 49% ownership joint venture with Sturrock & Robson Ltd (WABCO SA), a distributor of braking systems products. |
Employees
We have approximately 8,100 employees. The streamlining actions taken in Europe significantly reduced the numbers of employees in Europe; however this was more than offset by the 1,800 employees added through taking majority ownership of WABCO-TVS in India. Approximately 50% of our employees are salaried and 50% are hourly. Approximately 58% of our workforce is in Europe, 35% is in Asia, and the remaining 7% is in the Americas. Approximately 1,250 employees work in engineering/product development.
Employees located in our sites in Europe, Asia and South America are subject to collective bargaining, with internal company agreements or external agreements at the region or country level. Currently 50% of our workforce is covered by a collective bargaining agreement and nearly all of those agreements expire during 2010. These employees’ right to strike is typically protected by law and union membership is confidential information which does not have to be provided to the employer. The collective bargaining agreements are typically renegotiated on an annual basis. Our U.S. facilities are non-union. We have maintained good relationships with our employees around the world and historically have experienced very few work stoppages.
Intellectual Property
Patents and other proprietary rights are important to our business. We also rely upon trade secrets, manufacturing know-how, continuing technological innovations, and licensing opportunities to maintain and improve our competitive position. We review third-party proprietary rights, including patents and patent applications, as available, in an effort to develop an effective intellectual property strategy, avoid infringement of third-party proprietary rights, identify licensing opportunities, and monitor the intellectual property claims of others.
We own a large portfolio of patents that principally relate to our products and technologies, and we have, from time to time, licensed some of our patents. Patents for individual products and processes extend for varying periods according to the date of patent filing or grant and the legal term of patents in various countries where patent protection is obtained.
The WABCO brand is also protected by trademark registrations throughout the world in the key markets in which our products are sold.
While we consider our patents and trademarks to be valuable assets, we do not believe that our competitive position is materially dependent upon any single patent or group of related patents.
Environmental Regulation
Our operations are subject to local, state, federal and foreign environmental laws and regulations that govern activities or operations that may have adverse environmental effects and which impose liability for clean-up costs resulting from past spills, disposals or other releases of hazardous wastes and environmental compliance. Generally, the international requirements that impact the majority of our operations tend to be no more restrictive than those in effect in the U.S.
Throughout the world, we have been dedicated to being an environmentally responsible manufacturer, neighbor and employer. We have a number of proactive programs under way to minimize our impact on the environment and believe that we are in substantial compliance with environmental laws and regulations. Manufacturing facilities are audited on a regular basis. Twelve of our manufacturing facilities have Environmental Management Systems (EMS), which have been certified as ISO 14001 compliant. These facilities are those located in:
| Claye-Souilly, France |
Campinas, Brazil | Wroclaw, Poland | ||
| Gronau, Germany |
Hannover, Germany | Jinan, China | ||
| Ambattur, India |
Pyungtaek, Korea | Qingdao, China | ||
| Meppel, Netherlands |
Mannheim, Germany | Charleston, United States |
9
Table of Contents
A number of our facilities are undertaking responsive actions to address groundwater and soil issues. Expenditures in 2009 to evaluate and remediate these sites were not material.
Additional sites may be identified for environmental remediation in the future, including properties previously transferred and with respect to which the Company may have contractual indemnification obligations.
Available Information
Our web site is located at www.wabco-auto.com. Our periodic reports and all amendments to those reports required to be filed or furnished pursuant to Section 13(a) or 15(d) of the Securities Exchange Act of 1934 are available free of charge through the web site. During the period covered by this report, we posted our periodic reports on Form 10-Q and our current reports on Form 8-K and any amendments to those documents to our web site as soon as such reports were filed or furnished electronically with the Securities Exchange Commission (“SEC”). We will continue to post to our web site such reports and amendments as soon as reasonably practicable after such reports are filed with or furnished to the SEC.
Code of Conduct and Ethics
Our Code of Conduct and Ethics, which applies to all employees, including all executive officers and senior financial officers and directors, is posted on our web site www.wabco-auto.com. The Code of Conduct and Ethics is compliant with Item 406 of SEC Regulation S-K and the NYSE corporate governance listing standards. Any changes to the Code of Conduct and Ethics that affect the provisions required by Item 406 of Regulation S-K will also be disclosed on the web site.
Any waivers of the Code of Conduct and Ethics for our executive officers, directors or senior financial officers must be approved by our Audit Committee and those waivers, if any are ever granted, would be disclosed on our web site under the caption “Exemptions to the Code of Conduct and Ethics.” There have been no waivers to the Code of Conduct and Ethics.
| ITEM 1A. | RISK FACTORS |
Any of the following factors could have a material adverse affect on our future operating results as well as other factors included in “Management’s Discussion and Analysis of Financial Condition and Results of Operations – Information Concerning Forward Looking Statements.”
Risks Relating to Our Business
The credit crisis and global recession have negatively impacted our customers and could continue to result in reduced demand for our products, which could therefore continue to have a significant negative impact on our business.
The credit markets have experienced a period of unprecedented turmoil and upheaval characterized by significantly reduced availability of credit and increased borrowing costs. The disruptions in the credit markets and impact of a more prolonged global recession could continue to negatively impact consumer confidence and spending patterns and cause our customers to reduce truck and bus production. This in turn could have a negative impact on our business and results of operations, our operating cash flows and our financial condition.
We may be unable to pay any significant fine imposed by the European Commission, if we are unable to access our principal credit facility or arrange for alternative sources of capital.
As discussed in greater detail in Item 3. “Legal Proceedings,” Item 7. “Management’s Discussion and Analysis of Results of Operations and Financial Condition – Liquidity with Regard to European Commission Fine,” and Note 13. “Warranties, Guarantees, Commitments and Contingencies,” we are required to indemnify our former parent company, American Standard, now Trane, and Ideal Standard International and their respective owners against any fines that may be imposed by the European Commission (“the Commission”) in connection with a multi-company
10
Table of Contents
investigation commenced in 2004 relating to alleged infringement of EU competition rules in the Bath and Kitchen fixtures market. The fine imposed by the Commission could be material to our operating results and cash flows for the year in which the liability would be recognized or the fine paid.
Our principal credit facility contains a number of covenants that require us to maintain certain defined financial metrics associated with our earnings before we can access the funds available under the facility. If the current global industry conditions continue to significantly negatively impact both our customers and the demand for our products in such a way as to continue to depress our earnings, we may continue to be unable to fully access our credit facility due to an inability to meet these financial covenants. If we are unable to fully access our principal credit facility, obtain alternative sources of financing, or obtain some payment relief from the Commission or a suspension of the payment obligation from the General Court (formerly the European Court of First Instance), and the fine exceeds our funding capability, then our financial condition and liquidity would be materially adversely affected.
Our sales could decline due to macro-economic factors, cyclicality of the industry, regulatory changes and other factors outside of our control.
Changes in economic conditions, cyclical downturns in our industry, regulatory changes impacting the purchasing patterns of commercial vehicles, and changes in the local economies of the countries or regions in which we sell our products, such as changes in consumer confidence, increases in interest rates and increases in unemployment, many of which are now occurring as a result of the global recession, are likely to further affect demand for our products, which could negatively affect our business and results of operations.
Demand for new trucks and buses in the markets in which we operate has a significant impact on our sales. While in the last few years leading up to 2009, heavy truck and bus production had increased in our largest market (Western Europe), this market along with others has been significantly affected by the downturn. The Western European market, which accounted for approximately 58% of our total sales, experienced a 62% decline in 2009. Adverse economic conditions in our markets, particularly in Western Europe, has largely contributed to reduced truck and bus production, which has and will continue to have an adverse effect on our results of operations and cash flows.
Our exposure to exchange rate fluctuations on cross border transactions and the translation of local currency results into U.S. dollars could negatively impact our results of operations.
We conduct business through subsidiaries in many different countries, and fluctuations in currency exchange rates have a significant impact on the reported results of our operations, which are presented in U.S. dollars. In 2009, approximately 92% of our combined sales occurred outside of the United States. A significant and growing portion of our products are manufactured in lower-cost locations and sold in various countries. Cross border transactions, both with external parties and intercompany relationships, result in increased exposure to foreign currency exchange effects. Accordingly, significant changes in the exchange rates of the euro, U.S. dollar and other applicable currencies could cause fluctuations in the reported results of our operations that could negatively affect our results of operations. Additionally, our results of operations are translated into U.S. dollars for reporting purposes. The strengthening or weakening of the U.S. dollar results in favorable or unfavorable translation effects as the results of foreign locations are translated into U.S. dollars.
We are subject to general risks associated with our foreign operations.
In addition to the currency exchange risks inherent in operating in many different foreign countries, there are other risks inherent in our international operations.
The risks related to our foreign operations that we more often face in the normal course of business include:
| • | changes in non-U.S. tax law, increases in non-U.S. tax rates and the amount of non-U.S. earnings relative to total combined earnings could change and impact our combined tax rate; |
| • | foreign earnings may be subject to withholding requirements or the imposition of tariffs, price or exchange controls, or other restrictions; |
11
Table of Contents
| • | general economic and political conditions in countries where we operate may have an adverse effect on our operations in those countries; and |
| • | we may have difficulty complying with a variety of foreign laws and regulations, some of which may conflict with United States law, and the uncertainty created by this legal environment could limit our ability to effectively enforce our rights in certain markets. |
The ability to manage these risks could be difficult and may limit our operations and make the manufacture and distribution of our products internationally more difficult, which could negatively affect our business and results of operations.
If we are unable to obtain component parts or obtain them at reasonable price levels, our ability to maintain existing sales margins may be affected.
We purchase a broad range of materials and components throughout the world in connection with our manufacturing activities. Major items include electronic components and parts containing aluminum, steel, copper, zinc, rubber and plastics. The cost of components and parts, and the raw materials used therein, represents a significant portion of our total costs. Price increases of the underlying commodities may adversely affect our results of operations. Although we maintain alternative sources for components and parts, our business is subject to the risk of price fluctuations and periodic delays in the delivery of certain raw materials. This risk has increased due to the current global recession, which is impacting our supplier base. The sudden inability of a supplier to deliver components or to do so at reasonable prices could have a temporary adverse effect on our production of certain products or the cost at which we can produce those products. Any change in the supply or price of raw materials could materially adversely affect our future business and results of operations.
If we are not able to maintain good relations with our employees, we could suffer work stoppages that could negatively affect our business and results of operations.
Employees located in our sites in Europe, Asia and South America are subject to collective bargaining, with internal company agreements or external agreements at the region or country level. These employees’ right to strike is typically protected by law and union membership is confidential information which does not have to be provided to the employer. Our U.S. facilities are non-union. Any disputes with our employee base could result in work stoppages or labor protests, which could disrupt our operations. Any such labor disputes could negatively affect our business and results of operations.
We are dependent on key customers.
We rely on several key customers. For the fiscal year ending December 31, 2009, sales to our top three customers accounted for approximately 12% (Daimler), 8% and 5%, respectively, of our sales, and sales to our top ten customers accounted for approximately 48% of our sales. This includes sales to our 50%-owned Meritor WABCO joint venture in North America. Many of our customers place orders for products on an as-needed basis and operate in cyclical industries and, as a result, their order levels have varied from period to period in the past and may vary significantly in the future. Such customer orders are dependent upon their markets and customers and may be subject to delays or cancellations. As a result of dependence on our key customers, we have experienced and could experience in the future a material adverse effect on our business and results of operations if any of the following were to occur:
| • | the loss of any key customer, in whole or in part; |
| • | a declining market in which customers reduce orders or demand reduced prices; or |
| • | a strike or work stoppage at a key customer facility, which could affect both their suppliers and customers. |
If there are changes in the environmental or other regulations that affect one or more of our current or future products, it could have a negative impact on our business and results of operations.
We are currently subject to various environmental and other regulations in the U.S. and internationally. A risk of environmental liability is inherent in our current and former manufacturing activities. Under certain environmental
12
Table of Contents
laws, we could be held jointly and severally responsible for the remediation of any hazardous substance contamination at our past and present facilities and at third party waste disposal sites and could also be held liable for damages to natural resources and any consequences arising out of human exposure to such substances or other environmental damage. While we have a number of proactive programs underway to minimize the impact of the production and use of our products on the environment and believe that we are in substantial compliance with environmental laws and regulations, we cannot predict whether there will be changes in the environmental regulations affecting our products.
Any changes in the environmental and other regulations which affect our current or future products could have a negative impact on our business if we are unable to adjust our product offering to comply with such regulatory changes. In addition, it is possible that we will incur increased costs as a result of complying with environmental regulations, which could have a material adverse effect on our business, results of operations and financial condition.
We may be subject to product liability and warranty and recall claims, which may increase the costs of doing business and adversely affect our business, financial condition and results of operations.
We are subject to a risk of product liability or warranty claims if our products actually or allegedly fail to perform as expected or the use of our products results, or is alleged to result, in bodily injury and/or property damage. While we maintain reasonable limits of insurance coverage to appropriately respond to such exposures, large product liability claims, if made, could exceed our insurance coverage limits and insurance may not continue to be available on commercially acceptable terms, if at all. We cannot assure you that we will not incur significant costs to defend these claims or that we will not experience any product liability losses in the future. In addition, if any of our designed products are or are alleged to be defective, we may be required to participate in recalls and exchanges of such products. In the past five years, our warranty expense has fluctuated between approximately 1.3% and 2.4% of sales on an annual basis. Individual quarters were above or below the annual averages. The future cost associated with providing product warranties and/or bearing the cost of repair or replacement of our products could exceed our historical experience and have a material adverse effect on our business, financial condition and results of operations.
We are required to plan our capacity well in advance of production and our success depends on having available capacity and effectively using it.
We principally compete for new business at the beginning of the development of our customers’ new products. Our customers’ new product development generally begins significantly prior to the marketing and production of their new products and our supply of our products generally lasts for the life of our customers’ products. Nevertheless, our customers may move business to other suppliers or request price reductions during the life cycle of a product. The long development and sales cycle of our new products, combined with the specialized nature of many of our facilities and the resulting difficulty in shifting work from one facility to another, could result in variances in capacity utilization. In order to meet our customers’ requirements, we may be required to supply our customers regardless of cost and consequently we may suffer an adverse impact on our operating profit margins and results of operations.
We must continue to make technological advances, or we may not be able to successfully compete in our industry.
We operate in an industry in which technological advancements are necessary to remain competitive. Accordingly, we devote substantial resources to improve already technologically complex products and to remain a leader in technological innovation. However, if we fail to continue to make technological improvements or our competitors develop technologically superior products, it could have an adverse effect on our operating results or financial condition.
13
Table of Contents
Risks Relating to the Separation
We have agreed to indemnify Trane for taxes and related losses resulting from certain actions that may cause the Distribution to fail to qualify as a tax-free transaction.
Trane has received a private letter ruling from the Internal Revenue Service (“IRS”) substantially to the effect that the Distribution qualifies as tax-free for U.S. federal income tax purposes under Section 355 of the Internal Revenue Code (“the Code”). In addition, Trane has received an opinion of Skadden, Arps, Slate, Meagher & Flom LLP, tax counsel to Trane, substantially to the effect that the Distribution will qualify as tax-free to Trane, us and our shareholders under Section 355 and related provisions of the Code. The ruling and opinion were based on, among other things, certain assumptions as well as on the accuracy of certain factual representations and statements made by Trane and the Company. In rendering its ruling, the IRS also relied on certain covenants that the Company and Trane entered into, including the adherence to certain restrictions on Trane’s and the Company’s future actions.
Notwithstanding receipt by Trane of the private letter ruling and the opinion of counsel, the IRS could assert that the Distribution should be treated as a taxable transaction. If the Distribution fails to qualify for tax-free treatment, then Trane would recognize a gain in an amount equal to the excess of (i) the fair market value of our common stock distributed to the Trane shareholders over (ii) Trane’s tax basis in such common stock. Under the terms of the Tax Sharing Agreement, in the event the Distribution were to fail to qualify as a tax-free reorganization and such failure was not the result of actions taken after the distribution by Trane or any of its subsidiaries or shareholders, we would be responsible for all taxes imposed on Trane as a result thereof. In addition, each Trane shareholder who received our common stock in the Distribution generally would be treated as having received a taxable Distribution in an amount equal to the fair market value of our common stock received (including any fractional share sold on behalf of the shareholder), which would be taxable as a dividend to the extent of the shareholder’s ratable share of Trane’s current and accumulated earnings and profits (as increased to reflect any current income including any gain recognized by Trane on the taxable distribution). The balance, if any, of the Distribution would be treated as a nontaxable return of capital to the extent of the Trane shareholder’s tax basis in its Trane stock, with any remaining amount being taxed as capital gain. Our obligation to indemnify Trane under the Tax Sharing Agreement if the Distribution fails to qualify for tax-free treatment could be substantial if triggered, and could have a material adverse effect on our business, financial condition and results of operations.
We are responsible for certain of Trane’s contingent and other corporate liabilities.
Under the Indemnification and Cooperation Agreement, the Separation and Distribution Agreement and the Tax Sharing Agreement, our wholly-owned subsidiary WABCO Europe BVBA has assumed and is responsible for certain contingent liabilities related to Trane’s business (including certain associated costs and expenses, whether arising prior to, at or after the Distribution) and will indemnify Trane for these liabilities. Among the contingent liabilities against which we will indemnify Trane and the other indemnitees, are liabilities associated with an investigation into alleged infringement of European Union competition regulations, certain non-U.S. tax liabilities and certain U.S. and non-U.S. environmental liabilities associated with certain Trane entities.
We will indemnify Trane, Ideal Standard International, including certain former European subsidiaries and affiliates of the former American Standard group, and their respective owners against any fines associated with an investigation into alleged infringement of European Union competition regulations.
As part of a multi-company investigation, American Standard and certain of its European subsidiaries engaged in the Bath and Kitchen business have been charged by the European Commission for alleged infringements of European Union competition rules relating to the distribution of bathroom fixtures and fittings in a number of European countries. Pursuant to the Indemnification and Cooperation Agreement, WABCO Europe BVBA (an indirect wholly-owned subsidiary of WABCO) will be responsible for, and will indemnify American Standard (now Trane) and Ideal Standard International (including certain subsidiaries engaged, or formerly engaged in the Bath and Kitchen business) and their respective affiliates against any fines related to this investigation. See Item 3. “Legal Proceedings” for additional discussion of the procedural history, response, hearing and appeals process related to the European Commission investigation.
14
Table of Contents
Risks Relating to Our Common Stock
Your percentage ownership in WABCO may be diluted in the future.
Your percentage ownership in WABCO may be diluted in the future because of equity awards that have already been granted and that we expect will be granted to our directors and officers in the future. Prior to the Separation and record date for the Distribution, Trane approved an Omnibus Incentive Plan, which provides for the grant of equity-based awards, including restricted stock, restricted stock units, stock options, stock appreciation rights, phantom equity awards and other equity-based awards to our directors, officers and other employees. After the Separation and record date for the Distribution, WABCO has approved its own Omnibus Incentive Plan. In the future, we may issue additional equity securities, subject to limitations imposed by the Tax Sharing Agreement, in order to fund working capital needs, capital expenditures and product development, or to make acquisitions and other investments, which may dilute your ownership interest.
We cannot assure you that we will pay any dividends or repurchase shares.
While we have historically returned value to shareholders in the form of share repurchases and dividends, our ability to repurchase shares and pay dividends is limited by available cash, contingent liabilities, (such as any fine resulting from the alleged infringement discussed above) and surplus. Moreover, all decisions regarding the declaration and payment of dividends and share repurchases will be at the sole discretion of our Board and will be evaluated from time to time in light of our financial condition, earnings, capital requirements of our business, covenants associated with certain debt obligations, legal requirements, regulatory constraints, industry practice and other factors that our Board deems relevant.
Our shareholder rights plan and provisions in our amended and restated certificate of incorporation and amended and restated by-laws, and of Delaware law may prevent or delay an acquisition of our company, which could decrease the trading price of our common stock.
Our amended and restated certificate of incorporation, amended and restated by-laws and Delaware law contain provisions that are intended to deter coercive takeover practices and inadequate takeover bids by making such practices or bids unacceptably expensive to the raider and to encourage prospective acquirers to negotiate with our Board of Directors rather than to attempt a hostile takeover. These provisions include, among others:
| • | a Board of Directors that is divided into three classes with staggered terms; |
| • | elimination of the right of our shareholders to act by written consent; |
| • | rules regarding how shareholders may present proposals or nominate directors for election at shareholder meetings; |
| • | the right of our Board to issue preferred stock without shareholder approval; and |
| • | limitations on the right of shareholders to remove directors. |
Delaware law also imposes some restrictions on mergers and other business combinations between us and any holder of 15% or more of our outstanding common stock.
On July 13, 2007, our Board adopted a shareholder rights plan, which provides, among other things, that when specified events occur, our shareholders will be entitled to purchase from us a newly created series of junior preferred stock. The preferred stock purchase rights are triggered by the earlier to occur of (i) ten business days (or a later date determined by our Board of Directors before the rights are separated from our common stock) after the public announcement that a person or group has become an “acquiring person” by acquiring beneficial ownership of 15% or more of our outstanding common stock or (ii) ten business days (or a later date determined by our Board before the rights are separated from our common stock) after a person or group begins a tender or exchange offer that, if completed, would result in that person or group becoming an acquiring person. The issuance of preferred stock pursuant to the shareholder rights plan would cause substantial dilution to a person or group that attempts to acquire us on terms not approved by our Board of Directors.
We believe these provisions protect our shareholders from coercive or otherwise unfair takeover tactics by requiring potential acquirers to negotiate with our Board and by providing our Board with more time to assess any
15
Table of Contents
acquisition proposal. These provisions are not intended to make our company immune from takeovers. However, these provisions apply even if the offer may be considered beneficial by some shareholders and could delay or prevent an acquisition that our Board determines is not in the best interests of our company and our shareholders.
| ITEM 1B. | UNRESOLVED STAFF COMMENTS |
None.
| ITEM 2. | PROPERTIES |
As of February 18, 2010, we conducted our manufacturing activities at 16 plants in 10 countries. Construction of one additional plant in Taishan, China has been completed but no manufacturing has taken place to date. In addition, we have a contract in place for the sale of our facility in Leeds, England, which will take place in 2010. This facility continues to fulfill a backlog of customer orders and will continue to manufacture certain products until the sale occurs.
| Location |
Major Products Manufactured at Location | |
| Campinas, Brazil |
Vehicle control systems | |
| Leeds, England |
Vacuum pumps | |
| Claye-Souilly, France |
Vehicle control systems | |
| Hanover, Germany |
Vehicle control systems | |
| Mannheim, Germany |
Foundation brakes | |
| Gronau, Germany |
Compressors and hydraulics | |
| Meppel, Netherlands |
Actuators | |
| Wroclaw, Poland |
Vehicle control systems | |
| Qingdao, China |
Braking systems | |
| Jinan, China (2 plants) |
Braking systems and Compressors | |
| Pyungtaek, Korea |
Braking systems | |
| Ambattur, India |
Vehicle control systems | |
| Jamshedpur, India |
Vehicle control systems | |
| Mahindra World City, India |
Vehicle control systems | |
| Charleston, United States |
Compressors |
We own all of the plants described above, except for Claye-Souilly, France; Jinan, China; Taishan, China; Jamshedpur, India; Mahindra World City, India and Charleston, U.S.; which are leased. Our properties are generally in good condition, are well maintained, and are generally suitable and adequate to carry out our business. In 2009, the manufacturing plants, taken as a whole, met our capacity needs.
We also own or lease warehouse and office space for administrative and sales staff. Our headquarters, located in Brussels, Belgium, and our executive offices, located in Piscataway, New Jersey, are leased.
| ITEM 3. | LEGAL PROCEEDINGS |
In addition to the matters described below, we are party to a variety of legal proceedings with respect to environmental related, employee related, product related, and general liability and automotive litigation related matters that arise in the normal course of our business. While the results of these legal proceedings cannot be predicted with certainty, management believes that the final outcome of these proceedings will not have a material adverse effect on our combined results of operations or financial position.
The European Commission Investigation
In November 2004, certain of American Standard’s European subsidiaries were contacted by the European Commission as part of a multi-company investigation into possible infringement of European Union competition regulations relating to the distribution of bathroom fixtures and fittings in certain European countries. In November 2005, the European Commission sent certain of American Standard’s European subsidiaries a written request for information. On March 28, 2007, American Standard and certain of its European subsidiaries engaged in the Bath and Kitchen business received an administrative complaint entitled a Statement of Objections from the European
16
Table of Contents
Commission alleging infringements of European Union competition rules by numerous bathroom fixture and fittings companies. As a result of a legal reorganization that occurred in 2007, WABCO Europe BVBA (an indirect wholly-owned subsidiary of WABCO), formerly American Standard Europe BVBA, is responsible for, and is liable to indemnify Trane and Ideal Standard International (representing the successor to the Bath and Kitchen business, and owner of certain of the former American Standard subsidiaries) and their owners against any fines related to this investigation.
American Standard and its charged European subsidiaries responded to the Statement of Objections on July 31, 2007. WABCO Europe BVBA attended a hearing with the European Commission to present evidence regarding the response to the Statement of Objections in November 2007. Since that time, the Commission has made several requests for additional information from WABCO relating to, among other things, historic sales for all of the charged entities for periods prior to and subsequent to the spin-off and the sale of the Bath & Kitchen Division of Trane. A fine would be required to be paid within three months of any decision, unless imposition of any such fine were appealed within two months of the decision. If we elected to appeal, we would be required to pay the fine or to provide a bank guarantee for the full amount of the fine plus interest. The appeals process could take as long as five to seven years during which time WABCO would not have access to such funds or would be required to provide a bank guarantee. The Commission or the General Court (previously known as the Court of First Instance) could agree to waive or suspend this requirement for reasons of financial hardship; however this outcome cannot be assured and will depend on the relevant facts at the time. See Note 13-Warranties, Guarantees, Commitments and Contingencies in the notes to the consolidated financial statements for further detail.
| ITEM 4. | SUBMISSION OF MATTERS TO A VOTE OF SECURITY HOLDERS |
No matter was submitted to a vote of the Company’s shareholders during the fourth quarter of 2009.
| ITEM 4A. | EXECUTIVE OFFICERS OF THE REGISTRANT |
The following table sets forth certain information as of February 18, 2010 with respect to each person who is an executive officer of the Company:
| Name |
Age | Position(s) | ||
| Jacques Esculier |
50 | Chairman of the Board of Directors and Chief Executive Officer | ||
| Ulrich Michel |
47 | Chief Financial Officer | ||
| Kevin Tarrant |
52 | Chief Human Resources Officer | ||
| Nikhil M. Varty |
45 | Vice President, Compression & Braking | ||
| Todd Weinblatt |
40 | Vice President and Controller | ||
| Jean-Christophe Figueroa |
46 | Vice President, Vehicle Dynamics and Controls | ||
| Alfred Farha |
47 | Chief Legal Officer and Secretary |
Each officer of the Company is appointed by the Board of Directors to a term of office expiring on the date of the first Board meeting after the Annual Meeting of Shareholders next succeeding his or her appointment or such officer’s earlier resignation or removal.
Set forth below is the principal occupation of each of the executive officers named above during the past five years.
Jacques Esculier has served as our Chief Executive Officer and director since July 2007. In May 2009, he was appointed Chairman of our Board of Directors. Prior to July 2007, Mr. Esculier served as Vice President of Trane and President of its Vehicle Control Systems business, a position he had held since January 2004. Prior to holding that position, Mr. Esculier served in the capacity of Business Leader for the Trane Commercial Systems’ Europe, Middle East, Africa, India & Asia Region from 2002 through January 2004. Prior to joining Trane in 2002, Mr. Esculier spent more than six years in leadership positions at AlliedSignal/Honeywell. He was Vice President and General Manager of Environmental Control and Power Systems Enterprise based in Los Angeles, and Vice President of Aftermarket Services—Asia Pacific based in Singapore.
Ulrich Michel has served as our Chief Financial Officer since July 2007. Prior to July 2007, Mr. Michel served as Chief Financial Officer of Trane’s Vehicle Control Systems business, a position he had held since April 2005.
17
Table of Contents
Prior to holding that position, Mr. Michel served in the capacity of Chief Financial Officer for the Trane Commercial Systems’ EMAIR (Europe, Middle East, Africa & India Region) from 2003 through April 2005. Prior to joining Trane in 2003, Mr. Michel spent more than six years in financial leadership positions at AlliedSignal/Honeywell with areas of focus including mergers and acquisitions, the Specialty Chemicals business, and the Control Products business in Europe. Before joining AlliedSignal/Honeywell, Mr. Michel spent eight years at Price Waterhouse.
Kevin Tarrant has served as our Chief Human Resources Officer since July 2007. Prior to July 2007, Mr. Tarrant served for two years as Vice President, Global Organization Effectiveness for Arrow Electronics in Melville, New York. Prior to that, Mr. Tarrant was Senior Vice President of Human Resources for First Data Resources in Denver, Colorado from 2003 to 2005 after having served as Vice President of Human Resources for First Data’s Western Union International business headquartered in Paris, France from 2002 to 2003. Before joining First Data, Mr. Tarrant spent 10 years at the headquarters and business-unit level working for various Dun & Bradstreet Corporation businesses and six years at the Monsanto Company’s chemical controls businesses.
Nikhil M. Varty has served as our Vice President, Compression and Braking since July 2007. Prior to July 2007, Mr. Varty served as Vice President, Compression and Braking of Trane’s Vehicle Control Systems business, a position he has held since January 2005. Prior to holding that position, Mr. Varty served in the capacity of Chief Financial Officer of Trane’s Vehicle Control Systems business. Prior to joining Trane in June 2001, Mr. Varty had more than 10 years of national and international senior level finance roles with Great Lakes Chemical Corp., AlliedSignal/Honeywell and Coopers & Lybrand.
Todd Weinblatt has served as our Vice President and Controller since July 2007. Prior to July 2007, Mr. Weinblatt served as Assistant Controller of Trane, a position he had held since 2004. Before joining Trane, Mr. Weinblatt served as Director—Accounting Policy and External Reporting at The Dun & Bradstreet Corporation. His prior experience includes six years at Lucent Technologies Inc., where he was a Senior Manager of Accounting Policy and Mergers and Acquisitions. He began his career with Coopers & Lybrand, where he spent five years as an auditor.
Jean-Christophe Figueroa has served as our Vice President, Vehicle Dynamics and Controls since July 2007. Prior to July 2007, Mr. Figueroa served in a similar capacity within Trane’s Vehicle Control Systems business. Mr. Figueroa joined Trane in 2005 from tier-1 automotive supplier Valeo where he had been Group Vice President, Purchasing, based in Paris, France. Mr. Figueroa spent 13 years in senior management business and purchasing positions for Valeo, including leadership of the Automotive Climate Control business in both Mexico and subsequently Western Europe. Prior to joining Valeo, Mr. Figueroa spent seven years with Pierburg, Mexico, in various leadership positions in logistics, purchasing and program management.
Alfred Farha has served as our Chief Legal Officer and Secretary since July 2008. Prior to July 2008, Mr. Farha served as the General Counsel, Europe of Flextronics for four years, with additional global responsibility for Flextronics’s automotive business segment. Previously, Mr. Farha was Senior Corporate Counsel at Cisco Systems from 2000-2004, and at Unisys Corporation, from 1996-2000. Prior to his in-house career, he gained diverse experience with leading corporate international law firms in Europe, the US, Japan and Venezuela. He is a member of the Bar of the State of New York.
18
Table of Contents
PART II
| ITEM 5. | MARKET FOR THE REGISTRANT’S COMMON EQUITY, RELATED STOCKHOLDER MATTERS AND ISSUER PURCHASES OF EQUITY SECURITIES |
Our common stock is listed on NYSE under the symbol “WBC.” The common stock was first traded “regular way” on the NYSE on August 1, 2007, concurrent with our spin-off from Trane.
Our Certificate of Incorporation, as amended, authorizes the Company to issue up to 400,000,000 shares of common stock, par value $.01 per share, and 4,000,000 shares of preferred stock, par value $.01 per share, all of which have been designated by our Board of Directors as a series of Junior Participating Cumulative Preferred Stock. We also have a rights agreement. Pursuant to the rights agreement, when triggered in certain takeover situations, one preferred stock purchase right will be issued for each outstanding share of our common stock.
As of February 12, 2010, there were 619 holders of record of the Company’s common stock. A significant number of the outstanding shares of common stock which are beneficially owned by individuals or entities are registered in the name of a nominee of The Depository Trust Company, a securities depository for banks and brokerage firms. We believe that there are approximately 23,598 beneficial owners of our common stock as of February 12, 2010.
We declared dividends of $18.3 million in 2008 and $4.5 million in 2009 on our common stock. Given the current state of the commercial vehicle industry and the pending decision by the European Commission on the civil fine discussed in Note 13—Warranties, Guarantees, Commitments and Contingencies, the Company has decided to suspend payment of further dividends.
Set forth below are the high and low sales prices for shares of our common stock for each quarterly period of 2008 and 2009.
| 2008 |
High | Low | Dividends Declared | ||||||
| First quarter |
$ | 50.21 | $ | 38.01 | $ | 0.07 | |||
| Second quarter |
$ | 54.93 | $ | 42.77 | $ | 0.07 | |||
| Third quarter |
$ | 48.00 | $ | 33.66 | $ | 0.07 | |||
| Fourth quarter |
$ | 35.60 | $ | 11.56 | $ | 0.07 | |||
| 2009 |
|||||||||
| First quarter |
$ | 18.86 | $ | 8.10 | $ | 0.07 | |||
| Second quarter |
$ | 18.40 | $ | 11.99 | $ | — | |||
| Third quarter |
$ | 21.91 | $ | 16.00 | $ | — | |||
| Fourth quarter |
$ | 26.14 | $ | 20.35 | $ | — | |||
19
Table of Contents
PERFORMANCE GRAPH
The following graph and table compare the cumulative total shareholder’s return on our common stock from August 1, 2007 through December 31, 2009, with the Standard & Poor’s 500 Index and the Standard & Poor’s Auto Parts & Equipment Index. The table and graph use data supplied by the Compustat Services unit of Standard & Poor’s Corporation. The comparisons reflected in the graph and table are not intended to forecast the future performance of the common stock and may not be indicative of such future performance.
Total Shareholder Returns
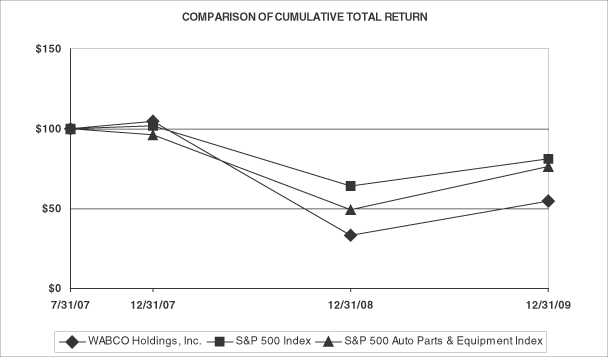
| 7/31/07 | 12/31/07 | 12/31/08 | 12/31/09 | |||||
| WABCO Holdings, Inc. |
100 | 104.67 | 33.30 | 54.71 | ||||
| S&P 500 Index |
100 | 101.79 | 64.13 | 81.10 | ||||
| S&P 500 Auto Parts & Equipment Index |
100 | 96.19 | 49.38 | 76.38 |
20
Table of Contents
| ITEM 6. | SELECTED FINANCIAL DATA |
| (Amounts in millions, except share and per |
Year Ended December 31, | |||||||||||||||||||
| 2009 | 2008 | 2007 | 2006 | 2005 | ||||||||||||||||
| Income Statement Data: |
||||||||||||||||||||
| Sales |
$ | 1,491.5 | $ | 2,588.0 | $ | 2,415.9 | $ | 2,015.2 | $ | 1,831.0 | ||||||||||
| Cost of sales |
1,126.7 | 1,883.5 | 1,760.5 | 1,462.2 | 1,303.4 | |||||||||||||||
| Streamlining expenses (a) |
37.0 | 10.5 | 3.7 | 1.3 | 9.1 | |||||||||||||||
| Gross profit |
327.8 | 694.0 | 651.7 | 551.7 | 518.5 | |||||||||||||||
| Costs and expenses: |
||||||||||||||||||||
| Selling and administrative expenses |
251.9 | 316.8 | 290.7 | 248.1 | 228.9 | |||||||||||||||
| Product Engineering expenses |
75.2 | 92.9 | 84.2 | 72.2 | 73.5 | |||||||||||||||
| Streamlining expenses (a) |
19.8 | 26.4 | 9.1 | 6.9 | 4.6 | |||||||||||||||
| Other operating (income) / expense, net |
(4.2 | ) | 11.4 | 26.0 | 1.5 | 0.4 | ||||||||||||||
| Operating (Loss) / Income |
(14.9 | ) | 246.5 | 241.7 | 223.0 | 211.1 | ||||||||||||||
| Equity income of unconsolidated joint ventures |
3.1 | 8.1 | 9.1 | 23.3 | 24.5 | |||||||||||||||
| Other non-operating (expense), net |
(5.3 | ) | (4.3 | ) | (6.6 | ) | (6.8 | ) | (3.2 | ) | ||||||||||
| Income from Indemnification and other settlements |
41.3 | — | — | — | — | |||||||||||||||
| Fair value adjustment (charge) of the noncontrolling interest prior to taking control |
(11.5 | ) | — | — | — | — | ||||||||||||||
| Interest income/(expense), net |
0.5 | 3.7 | (4.5 | ) | (11.3 | ) | 2.1 | |||||||||||||
| Income before income taxes |
13.2 | 254.0 | 239.7 | 228.2 | 234.5 | |||||||||||||||
| Income tax (benefit) / expense (b) |
(10.7 | ) | 38.2 | 111.3 | 87.9 | 87.4 | ||||||||||||||
| Net income including noncontrolling interests |
23.9 | 215.8 | 128.4 | 140.3 | 147.1 | |||||||||||||||
| Less: net income attributable to noncontrolling interests |
5.1 | 2.5 | 3.0 | 2.5 | 1.8 | |||||||||||||||
| Net income |
$ | 18.8 | $ | 213.3 | $ | 125.4 | $ | 137.8 | $ | 145.3 | ||||||||||
| Per share: |
||||||||||||||||||||
| Basic |
$ | 0.29 | $ | 3.28 | $ | 1.85 | — | — | ||||||||||||
| Diluted |
$ | 0.29 | $ | 3.24 | $ | 1.81 | — | — | ||||||||||||
| Average number of outstanding common shares: |
||||||||||||||||||||
| Basic |
64,024,237 | 65,113,404 | 67,887,919 | — | — | |||||||||||||||
| Diluted |
65,030,557 | 65,871,941 | 69,270,661 | — | — | |||||||||||||||
| Pro forma net income per common share: |
||||||||||||||||||||
| Basic |
— | — | — | $ | 2.03 | $ | 2.14 | |||||||||||||
| Diluted |
— | — | — | $ | 1.98 | $ | 2.08 | |||||||||||||
| Pro forma number of outstanding common shares (c): |
||||||||||||||||||||
| Basic |
— | — | — | 67,867,159 | 67,867,159 | |||||||||||||||
| Diluted |
— | — | — | 69,696,428 | 69,696,428 | |||||||||||||||
| Balance Sheet Data (at end of period): |
||||||||||||||||||||
| Total assets |
$ | 1,715.6 | $ | 1,776.0 | $ | 1,794.2 | $ | 1,276.9 | $ | 1,095.4 | ||||||||||
| Total debt |
$ | 156.1 | $ | 250.0 | $ | 126.2 | $ | 75.2 | $ | 44.4 | ||||||||||
| Total Shareholders’ equity / Owner’s Net Investment |
$ | 640.1 | $ | 601.5 | $ | 607.6 | $ | 315.2 | $ | 310.8 | ||||||||||
| Cash dividends per common share |
$ | 0.07 | $ | 0.28 | $ | 0.14 | $ | — | $ | — | ||||||||||
Prior to July 31, 2007, the historical selected financial data has been derived from the consolidated financial statements and accounting records of Trane, principally representing the Vehicle Control Systems segment, using the historical results of operations, and historical basis of assets and liabilities of the Vehicle Control Systems segment and reflecting Trane’s net investment in the Vehicle Control Systems segment through July 31, 2007.
21
Table of Contents
(a) Due to the materiality of the streamlining expenses related to cost of sales during 2009, the amounts have been shown separately and comparable periods have been adjusted.
(b) The income tax benefit for 2009 includes a net benefit of $13.0 million, principally related to the release of tax accruals as a consequence of the settlement of a foreign tax audit.
The income tax provision for 2008 includes a net benefit of $8.3 million, principally related to a reduction of an unrecognized tax benefit recorded in the third quarter of 2007 related to the separation of the WABCO business from Trane. This change in estimate resulted from the filing of the Company’s and Trane’s 2007 U.S. Federal income tax returns in September 2008. The 2008 effective income tax rate was 15.2%.
The income tax provision for 2007 includes a $50.7 million charge related to the separation of the WABCO business from Trane and a charge of $10.2 million related to the net reduction in deferred tax assets pursuant to rate changes in Germany, UK and China, partially offset by a $7.5 million benefit related to the settlement of a foreign tax audit during the second quarter, and benefits associated with foreign tax planning for 2007 following WABCO’s separation from Trane. The combined effects of the tax benefits and charge, with other ongoing tax planning activities resulted in an effective income tax rate of 47.0%.
The income tax provision for 2006 included a $9.6 million charge related to adjustments of accruals for tax contingencies. This charge was partially offset by a $2.8 million benefit related to the reductions of tax contingencies and a $4.9 million benefit representing a true up of the foreign tax earnings under Section 965 of the America Jobs Creation Act of 2004. The combined effects of the tax benefits and charge, with ongoing tax planning activities resulted in an effective income tax rate 38.9%.
The income tax provision for 2005 included benefits of $18.3 million from the resolution of tax audits and $4.5 million related to the impact of certain tax planning initiatives on prior tax years. Partially offsetting these benefits was a charge of $16 million associated with remitting foreign tax earnings under Section 965 of the American Jobs Creation Act of 2004. The combined effect of the net tax benefits that occurred in 2005, together with other ongoing tax planning activities, resulted in an effective income tax rate of 37.6% for the year.
(c) The pro forma number of common shares outstanding for basic and diluted earnings per share was determined by applying the distribution ratio of one share of WABCO common stock for every three shares of Trane common shares outstanding and including the effect of dilutive Trane common stock equivalents as of June 30, 2007. This method was applied to all periods prior to July 31, 2007.
For a comparative analysis of certain line items in the Income Statement Data section of this table, see Item 7 “Management’s Discussion and Analysis of Financial Condition and Results of Operations” which follows.
| ITEM 7. | MANAGEMENT’S DISCUSSION AND ANALYSIS OF FINANCIAL CONDITION AND RESULTS OF OPERATIONS |
This discussion summarizes the significant factors affecting the results of operations and financial condition of WABCO during the years ended December 31, 2009, 2008, and 2007 and should be read in conjunction with our consolidated financial statements and related notes thereto included elsewhere herein. Certain information in this discussion and analysis regarding industry outlook, our expectations regarding the future performance of our business and other non-historical statements are forward-looking statements. These forward-looking statements are subject to numerous risks and uncertainties, including, but not limited to, the risks and uncertainties described in “Risk Factors” above. Our actual results may differ materially from those contained in any forward-looking statements. You should read the following discussion together with the sections entitled “Risk Factors,” “Information Concerning Forward-Looking Statements,” “Selected Financial Information,” “Liquidity and Capital Resources” and consolidated financial statements and related notes thereto included elsewhere herein.
Executive Overview
Our 2009 results reflect the continued severity of the global economic recession. Market conditions quickly deteriorated across most industries and regions. Turmoil in the financial markets in 2008 and 2009 intensified the recession and was a contributing factor in most industrial companies’ decisions to slow production, reduce spending
22
Table of Contents
and conserve cash. This was evident in the commercial vehicle industry, especially in our most important market, Western Europe, where truck and bus production declined 62% in 2009. We acted decisively in response to the global commercial vehicle industry slowdown to align our capacity and cost structure for a significantly reduced level of market demand. We also continued to focus our efforts on expanding our business in emerging markets of China and India. While commercial vehicle production in Europe and North America declined in 2009, China’s commercial vehicle production grew 18% in 2009. We currently maintain two joint ventures in China and a market leading majority owned subsidiary in India to supply the growing local markets and to manufacture products for export. In addition to serving the local Asian market, our Indian subsidiary, WABCO-TVS, also acts as a sourcing hub for our global operations by purchasing raw materials from the lower cost Asian region and leveraging the machining capabilities in our factory in Mahindra City to process the metals, castings and electrical motors that are used in our other factories in Europe, North America and China to manufacture our products. India is also a center of mechanical engineering activity, and we continue to develop our relationships in the local engineering community to benefit our own research and development efforts. Although many of our major markets experienced significant declines in 2009, the first half of the year was impacted more severely as the third and fourth quarters began to show signs of incremental improvement.
During 2009, we continued to drive improvements through our WABCO Operating System, one of our industry’s most advanced management environments. Despite market turmoil that continued to strongly impact our suppliers and our own significant internal streamlining activities, our WABCO Operating System delivered $56.6 million of materials and conversion productivity, with materials productivity representing a record 6.1% of total materials cost. Among other strong positive results, we also achieved cost savings of $75 million in operating expenses, representing a reduction of approximately 19% year on year.
Our Markets and Our Customers
Our sales are affected by changes in truck and bus (T&B) production, especially in Europe. Europe is our largest geographic market and sales to T&B OEMs represent our largest customer group. The table below shows the relationship between our European sales to T&B OEMs, which, account for approximately 59% of our global sales to T&B OEMs and Western European T&B production, for the last five years. Sales data is shown at a constant euro to U.S. dollar exchange rate for year to year comparability and to make comparisons to unit production meaningful. Over the past five years, our sales have outperformed the growth in Western European T&B production by an average of three percent per year.
| Year to Year Change |
2005 | 2006 | 2007 | 2008 | 2009 | ||||||||||
| Sales to European T&B OEMs (at Constant FX rate) |
+6 | % | +10 | % | +12 | % | +4 | % | -58 | % | |||||
| Western European T&B Production |
+5 | % | +5 | % | +10 | % | +4 | % | -62 | % |
In general, our sales track directionally with truck and bus builds. However, individual year to year sales changes are also influenced by other factors such as timing of orders and deliveries to T&B OEM customers, application content, new product introduction, price and introduction of new customer platforms. The level of truck build activity is influenced by general economic conditions, including interest rate levels and inflation.
In regions outside Europe, there is less correlation between our sales and regional truck and bus builds. This is because of our smaller presence (which magnifies changes in content on individual truck platforms) as well as less stringent safety regulations. In addition, commercial vehicles built in the emerging countries are for both domestic and export markets, which will require varying types of components depending on the requirements of each respective market. As other regions adopt additional safety regulations in the future, similar to or approaching Europe’s, we expect the resulting increase in content will bring higher correlation between our regional sales and changes in regional truck and bus production.
Our aftermarket sales account for approximately 32% of total sales and are affected by a variety of factors: content on specific vehicles and breadth of our product range, number of commercial trucks in active operation, truck age, miles driven, demand for transported goods and overall economic activity. On average, our aftermarket sales (on a constant exchange to the U.S. dollar rate) have grown by 5% annually for the last five years as shown in the table below.
| Year to Year Change |
2005 | 2006 | 2007 | 2008 | 2009 | Average Change |
||||||||||||
| Aftermarket Sales (at Constant FX rate) |
+13 | % | +10 | % | +7 | % | +1 | % | -6 | % | +5 | % |
23
Table of Contents
Distribution of WABCO’s Sales by Major End-Markets, Product Types and Geography
| 2009 | 2008 | 2007 | |||||||
| Major End-Markets |
|||||||||
| OE Manufacturers: |
|||||||||
| Truck & Bus products |
55 | % | 62 | % | 60 | % | |||
| Trailer products |
9 | % | 13 | % | 14 | % | |||
| Car products |
4 | % | 4 | % | 5 | % | |||
| Aftermarket |
32 | % | 21 | % | 21 | % | |||
| 100 | % | 100 | % | 100 | % | ||||
| Geography: |
|||||||||
| Europe |
65 | % | 76 | % | 76 | % | |||
| Americas |
15 | % | 12 | % | 12 | % | |||
| Asia and rest of world |
20 | % | 12 | % | 12 | % | |||
| 100 | % | 100 | % | 100 | % | ||||
Our largest customer is Daimler, which accounts for approximately 12% of our sales. Other key customers include Arvin Meritor, Ashok Leyland, China National Heavy Truck Corporation (CNHTC), Cummins, Fiat (Iveco), Hino, Hyundai, MAN Nutzfahrzeuge AG (MAN), Meritor WABCO (a joint venture), Nissan Diesel, Paccar (DAF Trucks N.V. (DAF), Kenworth, Leyland and Peterbilt), Otto Sauer Achsenfabrik (SAF), Scania, TATA Motors, Volvo (Mack and Renault) and ZF Friedrichshafen AG (ZF). For the fiscal year ended December 31, 2009, our top 10 customers accounted for approximately 48% of our sales.
Results of Operations
Approximately 92% of our sales are outside the U.S. and therefore, changes in exchange rates can have a significant impact on the reported results of our operations, which are presented in U.S. dollars. Year-over-year changes in sales, expenses and net income for 2009 compared with 2008 and 2008 compared with 2007, are presented both with and without the effects of foreign currency translation. Changes in sales, expenses and net income excluding foreign exchange effects are calculated using current year sales, expenses and net income translated at prior year exchange rates. Presenting changes in sales, expenses and net income excluding the effects of foreign currency translation is not in conformity with U.S. Generally Accepted Accounting Principles (“U.S. GAAP”), but we analyze this data because it is useful to us in understanding the operating performance of our business. We believe this data is also useful to shareholders for the same reason. The changes in sales, expenses and net income excluding the effects of foreign exchange translation are not meant to be a substitute for measurements prepared in conformity with U.S. GAAP, nor to be considered in isolation. Management believes that presenting these non-U.S. GAAP financial measures is useful to shareholders because it enhances their understanding of how management assesses the operating performance of the Company’s business.
24
Table of Contents
Results of Operations for 2009 Compared with 2008
(amounts in millions)
| Year ended December 31, |
Excluding Foreign Exchange Translation |
|||||||||||||||||
| 2009 | 2008 | % change reported |
2009 adjusted amount |
% change adjusted |
||||||||||||||
| Sales |
$ | 1,491.5 | $ | 2,588.0 | (42.4 | )% | $ | 1,568.7 | (39.4 | )% | ||||||||
| Cost of sales |
1,163.7 | 1,894.0 | (38.6 | )% | 1,227.6 | (35.2 | )% | |||||||||||
| Gross profit |
327.8 | 694.0 | (52.8 | )% | 341.1 | (50.9 | )% | |||||||||||
| Operating expenses |
342.7 | 447.5 | (23.4 | )% | 363.9 | (18.7 | )% | |||||||||||
| Operating (loss) / income |
(14.9 | ) | 246.5 | * | (22.8 | ) | * | |||||||||||
| Equity in net income of unconsolidated joint ventures |
3.1 | 8.1 | (61.7 | )% | 3.0 | (63.0 | )% | |||||||||||
| Other non-operating income/(expense), net |
24.5 | (4.3 | ) | * | 21.4 | * | ||||||||||||
| Interest income, net |
0.5 | 3.7 | (86.5 | )% | 0.9 | (75.7 | )% | |||||||||||
| Income before income taxes |
13.2 | 254.0 | (94.8 | )% | 2.5 | (99.0 | )% | |||||||||||
| Income tax (benefit) / expense |
(10.7 | ) | 38.2 | * | (9.7 | ) | * | |||||||||||
| Net income including noncontrolling interests |
23.9 | 215.8 | (88.9 | )% | 12.2 | (94.3 | )% | |||||||||||
| Less: net income attributable to noncontrolling interests |
5.1 | 2.5 | * | 5.2 | * | |||||||||||||
| Net income |
$ | 18.8 | $ | 213.3 | (91.2 | )% | $ | 7.0 | (96.7 | )% | ||||||||
| * | Percentage change not meaningful |
Sales
Our sales for 2009 were $1.5 billion, a decrease of 42.4% (39.4% excluding foreign currency translation effects) from $2.6 billion in 2008. The decrease was attributable to the significant decline in commercial vehicle production that was evident across the world, with the exception of China. In addition to the deterioration in the end market demand, inventory reductions across most commercial vehicle manufacturers contributed to the production decline. The first half of 2009 experienced the most significant decline versus 2008, which was a decrease of 56.0% (49.2% excluding foreign currency translation effects). However, the trend in our sales as we finished 2009 included an improvement of 10% in the third quarter versus the second quarter, excluding the impact of consolidating WABCO-TVS into total WABCO and the impact from foreign currency translation effects, and an improvement in the fourth quarter versus the third quarter of 17%, excluding foreign currency translation effects.
Sales in Europe, our largest market, decreased approximately 50.6% (46.4% excluding foreign currency translation effects) for the full year 2009, which based on our estimate, was better than the decline in European truck production. Sales decreased 25.2% in North America, which based on our estimate, was less than the decrease in North American truck production. Sales in Asia increased 7.1% (6.0% excluding foreign currency translation effects), which included a favorable impact of 26.7.% resulting from the acquisition of WABCO-TVS in India. The sales growth in Asia included an increase in China sales of 3.1% (1.1% excluding foreign currency translation effects), which benefitted from a higher production of trucks for the domestic markets. However, sales growth in China was less than the increase in production of new commercial vehicles due to the significant decline in trucks produced for export which carry a higher content per vehicle than trucks for the domestic market. Sales in South America decreased 37.7% (32.0% excluding foreign currency translation effects). Total aftermarket sales decline, included in the geographic numbers provided above, was 13.0% (6.4% excluding foreign currency translation effects), which was impacted by both the Original Equipment Supply channel and the Independent Aftermarket channel due to declines in transportation.
The uncertainty of the development of the global economy makes it difficult to predict how demand for commercial vehicles will further develop in 2010. However, the reduction of new truck inventory by the OEM’s experienced in 2009 is expected to benefit the Company as production levels will need to increase to meet the level of end market demand of new trucks.
25
Table of Contents
Gross Profit
Gross profit decreased by $366.2 million ($352.9 million excluding foreign currency translation effects). The decrease in gross profit was primarily driven by volume and mix decreases of approximately $230.4 million. Overhead underabsorption, labor and other cost escalations had a negative impact of approximately $121.1 million, while higher spending on streamlining programs decreased gross profit by $31.0 million. Additionally, sales price decreases had a negative impact of $26.5 million. Even in this environment we generated $56.6 million of materials and conversion productivity, which we consider a significant achievement given the very difficult market conditions experienced in 2009. Also, included in gross profit was approximately $0.5 million of foreign currency transaction gains related mainly to the sale of products in countries (with different currencies) outside of the country where they are manufactured were reported.
Operating Expenses
Operating expenses, which include selling and administrative expenses, product engineering expenses and other operating expenses, decreased by $104.8 million ($83.6 million excluding foreign currency translation effects). The Company’s timely actions in anticipation of a continued market slowdown experienced in 2009 as well as the efficient execution of related cost cutting efforts resulted in savings of $74.5 million in operational spending. Also, the Company reduced separation costs by $13.7 million, primarily driven by the reversal of tax indemnification liabilities related to the expiration of statute of limitations and closing of tax audits. In addition, the Company reduced costs associated with streamlining programs by $4.7 million. The above was partially offset by the effect of the first time consolidation of India, labor and other cost inflation and escalations totaling approximately $9.3 million.
Cost Reduction Programs and Streamlining Expenses
Based on market declines occurring in the fourth quarter of 2008, WABCO commenced a streamlining program on October 28, 2008, which began with a consultative process with works councils and employee representatives globally. The initial intent, as previously disclosed, was to reduce the Company’s global workforce by approximately 1,000 positions. As the Company continued to assess the impacts of the declining market conditions, the Company planned further reductions bringing the estimated total to 1,800 employees. As of December 31, 2009, approximately 1,730 of the 1,800 positions were terminated. This level of reduction in workforce has brought our capacity in line with current market demand, while still allowing us to continue our focus on core strategies, including technology, new products, globalization, and quality and productivity initiatives. We believe the completion of these actions has created sufficient flexibility in production and will help to cope with anticipated demand volatility.
The Company also continued its cost reduction program which was put in place during 2008. The Company achieved cost savings of $75 million in operating expenses during 2010. This success reflects major progress in containing the costs of our streamlining program, as well as cost reductions across our organization, including flexible work schedules, shortened work weeks in some locations, reductions in discretionary expenses, and our decision to decrease executive and senior management compensation, among other measures.
The Company incurred $56.8 million of streamlining expenses during 2009 of which $19.8 million has been charged to selling and administrative expenses and $37.0 million was charged to cost of sales. The Company incurred $36.9 million of streamlining expenses during 2008 of which all is associated with severance relating to 2008 plans with $26.4 million charged to selling and administrative expenses and $10.5 million charged to cost of sales. The Company expended $40 million of cash on streamlining activities in 2009.
Equity in Net Income of Unconsolidated Joint Ventures
Equity in net income of unconsolidated joint ventures decreased $5.0 million to $3.1 million in 2009 as compared to $8.1 million in 2008. The decrease was primarily driven by the step acquisition of WABCO-TVS resulting in lower earnings in the current year of $3.5 million from the SCL joint venture. This is due to the fact that upon WABCO obtaining majority control of WABCO-TVS, 100% of WABCO-TVS’ results of operations, beginning June 2009, are included in the consolidated financial statements of the Company. At the same time, the Company reduced its ownership percentage in SCL to zero. Income from the Meritor WABCO joint venture increased $0.3 million and income from the South Africa joint venture decreased $1.8 million, when compared to 2008 results.
26
Table of Contents
Other Non-Operating Expense, net
Other non-operating expense, net decreased by $28.8 million ($25.7 million excluding foreign currency translation effects) for 2009 as compared to 2008. This decrease was primarily due to a reversal of approximately $41.3 million of indemnification and other settlements in the statement of income due to the closing of a tax audit and other settlements as well as a recorded gain on the sale of its investment in SCL of $0.7 million. These were partially offset by a fair value remeasurement resulting in a loss of $11.5 million of the investment in WABCO-TVS recorded prior to the step acquisition. This transaction is further explained in Note 19—Business Combinations.
Interest Income, net
Interest income, net decreased by $3.2 million ($2.8 million excluding foreign currency translation effects) to $0.5 million in 2009 compared to $3.7 million in 2008. The overall decrease in interest income is related to the significant drop in interest rates.
Income Taxes
The income tax benefit for 2009 was $(10.7) million on pre-tax income of $13.2 million before adjusting for noncontrolling interest, compared with a provision of $38.2 million on $254.0 million of pre-tax income before adjusting for minority interest in 2008. The tax benefit for 2009 is the net result of the release of tax accruals as a consequence of the settlement of a foreign tax audit, partially offset by the limited tax benefits associated with restructuring costs, and the negative effect of our European supply chain structure in a year of low profitability. Additionally, the 2009 benefit includes a provision for a valuation allowance for losses in certain foreign jurisdictions in which it is more likely than not that the losses will not be realizable in the foreseeable future.
Net Income Attributable to Noncontrolling Interests
Net income attributable to noncontrolling interests increased by $2.6 million ($2.7 million excluding foreign currency translation effects) to $5.1 million in 2009. The increase is primarily due to WABCO obtaining majority control of WABCO-TVS, which is 75% owned by the Company. Upon obtaining control, 100% of WABCO-TVS’ results of operations, beginning June 2009, are included in the condensed consolidated financial statements of the Company while the 25% that is not owned by WABCO is now included in the net income attributable to noncontrolling interests. In prior years, the results of WABCO-TVS were accounted for under the equity method.
Backlog
Backlog, which represents valid sales orders that have not yet been filled as of the end of the reporting period, was $636.8 million at the end of the fourth quarter, down 6.3% (down 23.8% excluding foreign currency translation effects) from the fourth quarter of 2008 attributable to a significant decline in production in the commercial vehicle industry. Backlog is not necessarily predictive of future business as it relates only to some of our products, and customers may still change future delivery dates.
27
Table of Contents
Results of Operations for 2008 Compared with 2007
(amounts in millions)
| Year ended December 31, |
% change reported |
Excluding Foreign Exchange Translation |
||||||||||||||||
| 2008 | 2007 | 2008 adjusted amount |
% change adjusted |
|||||||||||||||
| Sales |
$ | 2,588.0 | $ | 2,415.9 | 7.1 | % | $ | 2,414.9 | 0.0 | % | ||||||||
| Cost of sales |
1,894.0 | 1,764.2 | 7.4 | % | 1,775.6 | 0.6 | % | |||||||||||
| Gross profit |
694.0 | 651.7 | 6.5 | % | 639.3 | (1.9 | )% | |||||||||||
| Operating expenses |
447.5 | 410.0 | 9.1 | % | 418.4 | 2.0 | % | |||||||||||
| Operating income |
246.5 | 241.7 | 2.0 | % | 220.9 | (9.4 | )% | |||||||||||
| Equity in net income of unconsolidated joint ventures |
8.1 | 9.1 | (11.0 | )% | 7.7 | (15.4 | )% | |||||||||||
| Other non-operating (expense), net |
(6.8 | ) | (9.6 | ) | (29.2 | )% | (4.3 | ) | (55.2 | )% | ||||||||
| Interest income/(expense), net |
3.7 | (4.5 | ) | * | 3.2 | * | ||||||||||||
| Income before income taxes |
251.5 | 236.7 | 6.3 | % | 227.5 | (3.9 | )% | |||||||||||
| Income taxes |
38.2 | 111.3 | (65.7 | )% | 33.9 | (69.5 | )% | |||||||||||
| Net income |
$ | 213.3 | $ | 125.4 | 70.1 | % | $ | 193.6 | 54.4 | % | ||||||||
| * | Percentage change not meaningful |
Sales
Our sales for 2008 were $2.6 billion, an increase of 7.1% (flat excluding foreign currency translation effects) from $2.4 billion in 2007. Increases in truck and bus production in Europe, expanded content per vehicle including new applications, and slight growth in our aftermarket business were offset by the significant decline in North American truck and bus production as well as the global decline in the production of trailers. Sales in Europe, our largest market, increased approximately 6.7% (decreased 0.1% excluding favorable foreign currency translation effects), which was impacted by the severe production cuts experienced at all truck & bus manufacturers in the latter part of the year. Sales decreased in North America, which experienced declines in the production of trucks and buses for the second consecutive year, in addition to a significant decline in trailer production. These declines were attributable to the global recession environment in the latter part of the year as well as the economic problems associated with the credit markets, which put constraints on the end customers’ ability to obtain financing for new purchases. Notwithstanding the above, sales in Asia and South America increased 11.3% and 24.1%, respectively (5.8% and 14.1% excluding favorable foreign currency translation effects, respectively). The sales growth in Asia was driven by an increase in China sales of 28.9% (19.2% without foreign currency translation impact), which was primarily driven by a successful introduction of the Company’s compressor product line in the market as well as the increasing penetration of ABS. The growth in South America resulted from the strong market demand in Brazil, as well as expanded content per vehicle.
In the fourth quarter of 2008 the global commercial vehicle markets experienced the beginning of a significant decline. The Company had sales growth of 10% in local currencies through the first three quarters of 2008, which was completely offset by a 25% decline in sales in the fourth quarter of 2008. The impact of this fourth quarter decline resulted in full year 2008 sales that were flat with prior year in local currencies.
Gross Profit
Gross profit increased by $42.3 million (decreased $12.4 million excluding foreign currency translation effects). Also, included in gross profit was approximately $(6.7) million of foreign currency transaction losses related mainly to the sale of products in countries (with different currencies) outside of the country where they are manufactured. Although we were operating in a market that deteriorated significantly in the latter part of the year, the results generated from the WABCO Operating System provided for an increased benefit in gross profit from productivity improvements of approximately $64.4 million. These improvements were offset by sales price decreases of approximately $46.9 million, labor and other cost escalation of approximately $13.0 million, higher spending on streamlining programs of approximately $8.7 million, and other net costs of $1.5 million.
28
Table of Contents
Operating Expenses
Operating expenses, which include selling and administrative expenses, product engineering expenses and other operating expenses, increased by $37.5 million ($8.4 million excluding foreign currency translation effects). The increase in operating expense was primarily driven by increased spending on streamlining programs of approximately $16.8 million and labor cost inflation and escalation of approximately $13.4 million. The Company’s timely actions in anticipation of a market slowdown experienced in the latter part of the year as well as the efficient execution of related cost cutting efforts in the fourth quarter was the primary driver of a $10.8 million decrease in operational spending. In addition, separation costs decreased by approximately $11.0 million.
Streamlining Expenses
Due to the degree of market declines occurring in the fourth quarter of 2008, WABCO commenced a streamlining program on October 28, 2008, which began with a consultative process with works councils and employee representatives globally. In total, WABCO incurred $36.9 million of streamlining expenses during 2008 of which $26.4 million, consisting primarily of employee severance costs, was charged to selling and administrative expenses and $10.5 million was charged to cost of sales. WABCO incurred $12.8 million of streamlining expenses in 2007 of which $9.1 million was charged to selling and administrative expenses and $3.7 million was charged to cost of sales.
Equity in Net Income of Unconsolidated Joint Ventures
Equity in net income of unconsolidated joint ventures decreased $1.0 million to $8.1 million in 2008 as compared to $9.1 million in 2007. The decrease was partially due to WABCO’s joint venture in North America, driven by the production decline in the North American market. As described above, North American commercial vehicle and trailer production decreased significantly in 2008 from 2007 levels. As a result, Meritor WABCO was impacted by lower sales volumes in 2008. Additionally, the decrease was driven by WABCO’s Indian joint ventures, caused primarily by difficult market conditions in the non-brakes divisions of the joint venture’s, start-up costs associated with new business development, a write-off of one of the joint venture’s investments, as well as a decline in the brakes division experienced in the fourth quarter of 2008.
Other Non-Operating Expense, net
Other non-operating expense, net decreased by $2.8 million to $6.8 million for the full year 2008 as compared to $9.6 million for the full year 2007. The decrease was primarily driven by WABCO’s terminated participation in Trane’s securitization program as of May 31, 2007. This was partially offset by a write-off of capitalized transaction related costs of approximately $1.6 million in the fourth quarter of 2008.
Interest (Income)/Expense, net
Interest (income)/expense, net improved by $8.2 million ($7.7 million excluding foreign currency translation effects) to $(3.7) million in 2008 compared to $4.5 million in 2007. The improvement was largely driven by a more favorable average net cash position during 2008 compared to 2007, as well as more favorable interest rates.
Income Taxes
The income tax provision for 2008 was $38.2 million. The effective income tax rate was 15.2% of pre-tax income in 2008. The income tax provision for 2007 was $111.3 million, an effective tax rate of 47.0%. The income tax provision for 2008 includes a net benefit of $8.3 million, principally related to a reduction of an unrecognized tax benefit recorded in the third quarter of 2007 related to the separation of the WABCO business from Trane. This change in estimate resulted from the filing of the Company’s and Trane’s 2007 U.S. Federal income tax returns in September 2008.
Backlog
Backlog, which represents valid sales orders that have not yet been filled as of the end of the reporting period, was $679.7 million at the end of the fourth quarter of 2008, down 44.1% (or 40.4% excluding foreign currency translation effects) from the fourth quarter of 2007 attributable to a significant decline in production in the commercial vehicle industry.
29
Table of Contents
Liquidity and Capital Resources
Cash Flows for 2009 Compared with 2008
Net cash provided by operating activities was $146.4 million for 2009. This compared with net cash provided by operating activities of $324.8 million for 2008.
Although the Company only realized net income including noncontrolling interests of $23.9 million for 2009 compared with net income including noncontrolling interests of $215.8 million for 2008, the Company was still able to achieve strong cash flow. The net income for 2009 included noncash elements such as the fair value loss adjustment of the noncontrolling interest prior to taking control of WABCO-TVS of $11.5 million, the Company’s reversal of $41.3 million of indemnification liabilities and other settlements, and depreciation and amortization of $89.6 million. In addition, the Company reduced its working capital during 2009. Accounts receivable was reduced by $68.3 million, driven by a reduction in our past due receivables, resulting in a significant improvement in days sales outstanding. The Company was also able to successfully reduce inventory levels by $23.0 million in 2009, despite increases in safety stock. Both impacts were partially offset by a reduction in accounts payable of $13.1 million which was primarily driven by the reduction in inventory.
Within investing activities, the Company made capital expenditures of $73.8 million in 2009 as compared to capital expenditures of $83.6 million in 2008. The capital expenditures for 2009 include $32.4 million of investments in tooling, $26.9 million on plant and equipment, $7.4 million of net cash outlay for the WABCO-TVS acquisition and sale of SCL and $7.1 million in computer software. This compared with $41.6 million of investments in tooling, $36.4 million on plant and equipment, and $5.6 million in computer software during 2008. As a result of the downturn in the economy, the Company implemented controlled spending measures which resulted in capital expenditure reductions versus prior year.
The net cash used by financing activities during 2009 amounted to $121.9 million compared to $18.6 million of net cash used during 2008.
On March 7, 2008, we entered into an unsecured, 364 day credit agreement with Rabobank for €100.0 million. As a result of the draw down on July 31, 2008, the 364 day €100.0 million credit facility had an expiration date and was repaid on July 30, 2009 in the amount of $156.5 million primarily by a drawdown of the five year revolving credit facility for the same amount.
In November 2007, WABCO entered into a €50 million, 364 day credit agreement with the Bank of Tokyo-Mitsubishi. In April 2008, the Company obtained an amendment, extending the maturity date by six months. In November 2008, €50 million was drawn under the agreement. The Company redeemed the outstanding debt of €50 million ($63.5 million) and terminated the credit agreement on February 26, 2009.
As of December 31, 2009, our total third party indebtedness was $156.1 million consisting primarily of $154.0 million of long term debt borrowed under our $800 million 5-year credit facility which is discussed in Note 12 – Debt. Also, subsidiaries in other countries had borrowings from banks totaling $2.1 million. These loans support local working capital requirements.
The Company paid a quarterly dividend of $4.5 million on March 20, 2009. Given the current state of the commercial vehicle industry and the pending decision by the European Commission on the civil fine discussed in Note 13—Warranties, Guarantees, Commitments and Contingencies, WABCO has suspended payment of further dividends.
The Company’s Board of Directors had approved $500 million of expenditures under a program to purchase shares of the Company’s common stock in the open market. During 2009, the Company has not repurchased any shares. At December 31, 2009, the Company has no further authorization by the Board of Directors to repurchase shares as the previous approval of $500 million expired on September 1, 2009. Prior to expiration of the authorization, the Company had purchased $276.3 million of shares in past periods.
We employ several means to manage our liquidity and we are not dependent upon any one source of funding. Our sources of financing include cash flows from operations, cash and cash equivalents, bank credit agreements, accounts receivable financing facilities and the use of operating leases.
30
Table of Contents
Cash Flows for 2008 Compared with 2007
Net cash provided by operating activities was $324.8 million for 2008. This compared with net cash used by operating activities of $0.3 million for 2007.
During 2007, in accordance with the terms of Trane’s receivable financing facility, the spin-off of WABCO required its withdrawal from Trane’s asset securitization program. Additionally, as a result of the spin-off, WABCO is also no longer selling its receivables from Meritor WABCO to a subsidiary of Trane. The impact on the net cash of terminating these two arrangements amounted to $(216.1) million; composed of a $(169.5) million impact from accounts receivable, $19.1 million from other current assets, and $(65.7) million from other accrued liabilities during 2007.
In addition to the separation related items mentioned above, the change is due to a reduction of our working capital during 2008. Due to a weakening economy in the second half of 2008, WABCO ended the year with a lower accounts receivable balance. Additionally, the Company was able to successfully reduce inventory levels in the fourth quarter of 2008.
Within investing activities, we made capital expenditures of $83.6 million for 2008, including $36.4 million on plant and equipment, $41.6 million of investments in tooling, and $5.6 million in computer software. This compared with capital expenditures of $77.7 million in 2007, including $40.9 million on plant and equipment, $28.9 million of investments in tooling and $7.9 million in computer software. As a result of the downturn in the economy during 2008, the Company implemented controlled spending measures which resulted in capital expenditure reductions in the fourth quarter versus prior year.
The net cash used by financing activities during 2008 amounted to $18.6 million while the financing activities for 2007 resulted in net cash provided of $214.5 million.
In July 2007, we repaid $52.1 million of the outstanding credit facility which had been put into place by Trane in 2005 with JP Morgan. This repayment was primarily financed through additional cash obtained from Trane. In order to finance the share buy back program and to fund the operations of the China facilities, during 2008, we drew $116.0 million from our $800.0 million five year credit facility which was entered into in May 2007, and $4.0 million from our $20 million credit facility in China.
Prior to July 31, 2007, we had additional changes in the balance due from and to Trane or its affiliates. This balance was mainly made up of the net receipts from changes in loans due to/from Trane and its affiliates of $288.6 million and dividends paid to Trane and its affiliates of $48.0 million. The 2007 net cash provided was mainly used to finance the termination of the securitization programs, the redemption of the $40.0 million principal amount of its 7.59% Guaranteed Senior Bonds prior to their maturity date of January 31, 2013 and the redemption of the credit facility with JP Morgan of $52.1 million.
As of December 31, 2008, our total third party indebtedness was $250.0 million consisting primarily of $140.6 million of long term debt borrowed under our Rabobank facility, $33.0 million of long term debt borrowed under our $800 million 5-year credit facility and $70.3 million of short term debt borrowed under our Bank of Tokyo-Mitsubishi facility that was repaid in February 2009. Also, subsidiaries in other countries had borrowings from banks totaling $6.1 million. These loans support local working capital requirements.
We paid quarterly dividends amounting to $18.3 million for 2008 and $9.6 million for 2007, respectively. Although we had sufficient cash on our balance sheet in 2008, since the majority of this cash is generated outside of the U.S. and the Company has chosen to permanently reinvest these earnings in those locations. These dividends were funded by drawdowns on our $800 million credit facility. See “Credit Agreements” below for a description of the credit agreement.
WABCO makes contributions to funded pension plans that at a minimum, meet all statutory funding requirements. Contributions in 2008, including payment of benefits incurred by unfunded plans, totaled $31.0 million.
During 2008 we repurchased $153.5 million of shares and also received stock option proceeds for the year of $21.5 million.
31
Table of Contents
Credit Agreements
On May 31, 2007, WABCO entered into an unsecured, five-year $800 million, multi-currency revolving credit facility that will expire on July 31, 2012. This is our principal bank credit facility, and it became available to us on August 1, 2007. The proceeds of the borrowings under the credit facility have been used to fund historical repurchases of our shares, pay historical quarterly dividends to our shareholders and to meet short-term cash requirements. Additionally, the facility may be used to pay a fine or provide a bank guarantee that may be required pursuant to a decision relating to the European Commission investigation matter as further described under the heading “Item 3—Legal Proceedings—The European Commission Investigation” above. Up to $100 million under this facility may be used for issuing letters of credit of which $97.6 million was unused as of December 31, 2009, and up to $75 million for same-day borrowings. The balance outstanding on this facility on December 31, 2009 was $154.0 million. The Company has the ability to borrow (subject to the covenant restrictions discussed below) an additional $643.6 million under this facility. The Company intends to refinance all or some portion of the existing five-year $800 million credit facility at the time of its expiration.
On March 7, 2008, we entered into unsecured, 364 day credit agreements with two banks, Rabobank and ABN AMRO, totaling €200.0 million. As a result of the draw down on July 31, 2008, the 364 day €100.0 million credit facility with Rabobank had an expiration date and was repaid on July 30, 2009 by a drawdown of the five year revolving credit facility. The facility with ABN AMRO expired during the first quarter of 2009.
Our principal credit facility contains various covenants that limit, among other things, liens, transactions, subsidiary indebtedness, and certain mergers and sales of assets. The covenants also require us to meet certain financial tests: a rolling four quarters 3 to 1 ratio of consolidated net indebtedness to consolidated trailing four quarters adjusted EBITDA (earnings before interest, taxes, depreciation and amortization adjusted for certain items), a 3 to 1 ratio of consolidated trailing four quarters adjusted EBITDA to consolidated net interest expense, and a liquidity test. These terms are all defined within the agreement to the five-year $800 million credit facility. The liquidity covenant for the $800 million credit facility requires us to have at least $100 million of liquidity (which includes unused commitments under the agreement and certain other committed facilities that may be entered into, as well as unrestricted cash and cash equivalents) after giving effect to any payment of a fine or any provision of a bank guarantee that may be required pursuant to a decision relating to the European Commission investigation matter. As of December 31, 2009, our trailing four quarters adjusted EBITDA is $104.8 million, which consists of $46.4 million for the fourth quarter, $30.4 million for the third quarter, $9.1 million for the second quarter, and $18.9 million for the first quarter. Given a net indebtedness of $67.2 million at December 31, 2009, the EBITDA covenant ratio was 0.6 to 1. Given our total indebtedness (including guarantees) at December 31, 2009 we had the ability to borrow an incremental $148 million within the covenants of our principal credit facility. Prior quarter amounts were adjusted on a pro-forma basis to retroactively reflect the sale of Sundaram Clayton Ltd. and the additional investment in WABCO-TVS Ltd. For additional information relating to the terms of the credit agreement we refer to the Form 8-K filed by Trane on June 5, 2007. As of December 31, 2009, the Company was in compliance with all of its borrowing covenants.
Liquidity with Regard to European Commission Fine
In addition to cash on hand, we have a credit agreement in place designed, in part, to assist us in covering a fine expected to be imposed by the European Commission. Due to the uncertainties surrounding the timing and potential amount of the fine, and the limitations of the amounts we can draw under such credit agreements based on our covenants, as further described below, we cannot make any prediction as to whether or not the funds available under the credit agreements will be sufficient to finance the fine at such time as it becomes due.
The borrowings under our principal credit facility are limited by covenants (See “Credit Agreements” above for an overview of the covenants). The covenant which is most restrictive, based on current economic conditions, requires that our total net indebtedness does not exceed three times a trailing four quarters adjusted EBITDA (“EBITDA covenant”), as defined in the agreement to the five year $800 million credit facility. As of December 31, 2009 our trailing four quarters adjusted EBITDA is $104.8 million, which consists of $46.4 million for the fourth quarter, $30.4 million for the third quarter, $9.1 million for the second quarter, and $18.9 million for the first quarter. Given a net indebtedness of $67.2 million at December 31, 2009, this resulted in an EBITDA covenant ratio of 0.6 to 1. Given our total indebtedness (including guarantees) at December 31, 2009, we had the ability to borrow an incremental $148 million within the covenants of our principal credit facility. Prior quarter amounts were adjusted
32
Table of Contents
on a pro-forma basis to retroactively reflect the sale of Sundaram Clayton Ltd. and the additional investment in WABCO-TVS Ltd. We expect that this covenant will continue to limit our ability to borrow under our principal credit facility.
We chose not to renew both the one-year facility with ABN AMRO that expired in March 2009 and the one-year facility with Rabobank that expired in July 2009. We also chose to redeem our one-year facility with Bank of Tokyo-Mitsubishi in February 2009. We decided to focus our efforts on obtaining additional sources of liquidity which would not be subject to an EBITDA covenant and complement our principal credit facility.
As described in more detail in Note 9, Accounts Receivable Financing Facility, the Company’s accounts receivable financing facility that was put in place in 2008 was terminated on January 12, 2009 as a result of an event outside of the Company’s control. On September 23, 2009, the Company established a new accounts receivable financing facility (the “Receivables Facility”) with Société Générale Bank Nederland N.V. The maximum funding from receivables that may be sold into the Receivables Facility will be €100 million ($143 million at December 31, 2009 exchange rates); however, there can be no assurance that the participating sellers will generate sufficient receivables to access the maximum availability. The term of the Receivables Facility is for one year, with the possibility of four additional annual extensions, assuming the Company and the participating sellers are in compliance with the applicable covenants. As of December 31, 2009, the funding that would have been available under this program, if utilized, was approximately €35 million ($50 million at December 31, 2009 exchange rates).
On April 15, 2009, the Company entered into a €35 million factoring program in respect to accounts receivable from one of our customers. As of December 31, 2009, the funding that would have been available under this factoring program, if utilized, was approximately €19 million ($27 million at December 31, 2009 exchange rates).
Other potential sources of financing that the Company is considering include, but are not limited to: (i) other accounts receivable factoring programs, (ii) sale-leaseback of certain property, plant and equipment, (iii) supply chain financing and (iv) accessing capital markets. If necessary, we may also seek to obtain a waiver or renegotiate the debt covenants on our primary credit facility.
If the Commission were to issue a fine in excess of our funding capability, we intend to seek approval from the Commission for alternative payment measures, such as installment payments or an extension of the payment obligation, which we are advised is available in cases of extreme hardship and substantiated financial difficulties. It is our understanding that it is not in the Commission’s interest, nor is it their intention, to force companies out of business due to fine payments, and we believe that the Commission will be sensitive to the current economic conditions. However, this outcome cannot be assured due to the degree of discretion inherent in the Commission’s fining and enforcement powers. The current economic conditions require us to observe that if the fine were to be issued in an amount in excess of our funding capability, and various mitigating actions which the Company has implemented and is planning were to fail, the fine could have a material adverse effect on the financial condition and liquidity of WABCO.
Streamlining Program
On October 28, 2008, the Company commenced a consultative process with works councils and employee representatives regarding intended reductions in the Company’s global workforce by approximately 1,000 positions. Based on the continued deterioration in the industry, the Company planned further reductions bringing the estimated total to 1,800 employees. As of December 31, 2009, approximately 1,730 of the 1,800 positions were terminated. In many cases, reductions in workforce can only be effected subject to completion of a formal consultation process with works councils in accordance with applicable local laws. The Company estimates that the streamlining charges and related cash payments associated with this activity will be approximately $78 million of which approximately $40 million was paid in 2009. The Company recorded $26 million in the fourth quarter of 2008, of which approximately $21 million related to this program. Additionally $31 million was recorded in the first quarter of 2009, $6 million in the second quarter of 2009, $19 million in the third quarter of 2009 and $1 million in the fourth quarter of 2009. The Company anticipates annualized savings of approximately $82 million. Costs associated with our streamlining program consist of termination and severance costs, the provision of job outplacement services, and other employee benefit related costs. In specific countries the streamlining program includes early retirement programs; therefore a large portion of payments will be made after December 31, 2009.
33
Table of Contents
Off-Balance Sheet Arrangements
As discussed above, the Company has the ability to use its accounts receivable financing facilities as one of several means to manage its liquidity. Under the terms of the receivables financing facility that we entered into with Societe Generale, discussed further below, we have the ability to sell our accounts receivable directly to Societe Generale. As of December 31 2009, we had not sold any accounts receivable to our receivables financing facility.
On January 12, 2009, the accounts receivable financing facility, which was entered into in the second quarter of 2008, was terminated by ABN/Royal Bank of Scotland (RBS) due to the downgrade of RBS by S&P. That agreement had provided for the financing of up to € 150 million of receivables, which qualified for off balance sheet accounting treatment, and was not subject to the trailing four quarters adjusted EBITDA covenant described above.
On September 23, 2009, the Company established a new accounts receivable financing facility (the “Receivables Facility”) with Société Générale Bank Nederland N.V. The maximum funding from receivables that may be sold into the Receivables Facility will be €100 million ($143.4 million at December 31, 2009 exchange rates); however, there can be no assurance that the participating sellers will generate sufficient receivables to access the maximum availability under the Receivables Facility. The term of the Receivables Facility is for one year, with the possibility of four additional annual extensions, assuming the Company and the participating sellers are in compliance with the applicable covenants. As of December 31, 2009, the funding that would have been available under this program, if utilized, was approximately €35 million ($50 million at December 31, 2009 exchange rates).
On April 15, 2009, the Company entered into a €35 million factoring program in respect to accounts receivable from one of our customers. As of December 31, 2009, the funding that would have been available under this program, if utilized, was approximately €19 million ($27 million at December 31, 2009 exchange rates).
Cross Currency Swap
The unsecured 364 day €100.0 million credit facility entered into in March 2008 with Rabobank (discussed above under credit agreements), included a requirement to draw down on the facility within a certain time period to avoid termination of the facility. Therefore, the full €100.0 million, or $156.5 million U.S. dollars, was drawn down on July 31, 2008 and used to pay down the five-year $800 million, multi-currency revolving credit facility expiring on July 2012. As a result of the draw down on July 31, 2008, the 364 day €100.0 million credit facility with Rabobank had an expiration date and was repaid on July 30, 2009. In order to avoid foreign currency risk associated with the euro denominated borrowing, the Company entered into a cross currency swap with Rabobank on July 29, 2008, and designated the swap as a fair value hedge of the changes in the fair value of the underlying debt resulting from exchange rate movements between the euro and U.S. dollar. The fair value hedge was highly effective and therefore any volatility resulting from translating the hedged debt into U.S. dollars and the remeasurement of the swap did not have a material impact to our consolidated financial statements. The Company did not renew this cross currency swap, given its decision not to renew the 364 day €100 million credit facility previously entered into with Rabobank.
Contractual Obligations
Following is a summary of contractual obligations as of December 31, 2009.
Aggregate Contractual Obligations
As of December 31, 2009
(in millions)
| Payments due by period(1) | |||||||||||||||
| Contractual Obligation |
Total | 2010 | 2011 and 2012 | 2013 and 2014 | Beyond 2014 | ||||||||||
| Debt obligations (principal plus interest)(2) |
$ | 158.4 | $ | 3.0 | $ | 155.4 | $ | — | $ | — | |||||
| Operating lease obligations(3) |
39.6 | 14.4 | 14.8 | 7.9 | 2.5 | ||||||||||
| Tax indemnifications(4) |
39.5 | 11.6 | — | — | — | ||||||||||
| Purchase obligations(5) |
125.8 | 125.8 | — | — | — | ||||||||||
| Unfunded pension and post-retirement benefits(6) |
325.9 | 31.5 | 63.0 | 64.1 | 167.3 | ||||||||||
| Tax liabilities(7) |
80.2 | 10.4 | — | — | — | ||||||||||
| Total |
$ | 769.4 | $ | 196.7 | $ | 233.2 | $ | 72.0 | $ | 169.8 | |||||
| (1) | The amounts and timing of such obligations, as shown in the table may vary substantially from amounts that will actually be paid in future years. For example, the actual amount to be paid under debt obligations under our primary credit agreement will depend on the amount of debt outstanding under the agreement in each year. |
34
Table of Contents
| (2) | Amounts shown for debt obligations include the associated interest amounting to $2.3 million, calculated at the December 31, 2009 rates applicable to each type of debt. |
| (3) | Amounts include future rental commitments under all non-cancelable operating leases in effect at December 31, 2009. The present value of the $39.6 million total is equivalent to approximately $34.7 million, discounted at an assumed rate of 5.5%. |
| (4) | Amounts are estimated costs that the Company is responsible for under a Tax Sharing Agreement between Trane and WABCO. The remaining $27.9 million is classified as long term and the Company is currently unable to estimate the timing of the potential amounts to be paid beyond 2010. |
| (5) | In the normal course of business we expect to purchase approximately $1.1 billion in 2010 of materials and services, and estimate that on average no more than approximately $130 million is outstanding at any one time in the form of legally binding commitments. We spent approximately $0.9 billion, $1.6 billion and $1.5 billion on materials and services in 2009, 2008 and 2007, respectively. |
| (6) | Amounts represent undiscounted projected benefit payments to WABCO’s unfunded plans over the next ten years, as well as expected contributions to funded pension plans for 2010. The expected benefit payments are estimated based on the same assumptions used to measure our accumulated benefit obligation at the end of 2009 and include benefits attributable to estimated future employee service of current employees. |
| (7) | Amounts represent the Company’s unrecognized tax benefits (including interest of $5.7 million) potentially owed to tax authorities as described in Note 14 – Income Taxes. The remaining $69.8 million liability is classified as long term and the Company is currently unable to estimate the timing of potential amounts to be paid beyond 2010. |
Capital Expenditures
We believe our capital spending in recent years has been sufficient to maintain efficient production capacity, to implement important product and process redesigns and to expand capacity to meet increased demand. Productivity projects have freed up capacity in our manufacturing facilities and are expected to continue to do so. We expect to continue investing to expand and modernize our existing facilities and invest in our facilities to create capacity for new product development.
Recently Issued Accounting Standards
In June 2009, the Financial Accounting Standards Board (“FASB”) issued Accounting Standards Update (“ASU”) No. 2009-1, “Topic 105, Generally Accepted Accounting Principles,” which amended Accounting Standards Codification (“ASC” 105 Generally Accepted Accounting Principles, confirming that the FASB Accounting Standards Codification (the “Codification”) will become the single official source of authoritative US GAAP (other than guidance issued by the SEC), superseding existing FASB, American Institute of Certified Public Accountants, Emerging Issues Task Force (EITF), and related literature. Only one level of authoritative US GAAP will exist. All other literature will be considered non-authoritative. The Codification does not change US GAAP; instead, it introduces a new structure that is organized in an easily accessible, user-friendly online research system. The Codification became effective for interim and annual periods ending on or after September 15, 2009. The Company has adopted amendments to the Codification resulting from ASU No. 2009-1 during the third quarter of 2009.
In December 2007, the FASB issued guidance primarily contained in ASC topic 805, Business Combinations. ASC 805 requires that identifiable assets acquired, liabilities assumed, and any noncontrolling interest in the acquiree be recognized and measured as of the acquisition date at fair value regardless of the percentage of ownership. The standard also requires any shares issued for acquisition to be measured at fair value on the date of acquisition as well as any contingent consideration recognized or pre-acquisition gain or loss contingencies. In-process research and development will not be capitalized and any acquisition related transaction costs should be expensed as incurred. ASC 805 is effective for fiscal years beginning after December 15, 2008. The Company adopted certain provisions of ASC 805 as of January 1, 2009 and appropriately accounted for the WABCO-TVS step acquisition on June 3, 2009 in accordance with this standard. See Note 19—Business Combinations for further details.
In December 2007, the FASB issued guidance primarily contained in ASC topic 810-10-65-1, Consolidation. The updated guidance contained in this section requires that a noncontrolling interest in a consolidated subsidiary be displayed in the consolidated statement of financial position as a separate component of equity. Consistent with
35
Table of Contents
the FASB’s view that noncontrolling interests are part of the equity of the consolidated group, this section of the Codification requires that earnings attributed to the noncontrolling interests are to be reported as part of consolidated earnings and not as a separate component of income or expense. Once a subsidiary is consolidated, any change in ownership that does not result in loss of control is accounted for as an equity transaction. However, deconsolidation of a subsidiary would result in a gain or loss reflected in the Company’s Income Statement. ASC 810-10-65-1 is effective for fiscal years beginning after December 15, 2008. The Company has adopted ASC 810-10-65-1 as of January 1, 2009. There was no material impact on the consolidated financial statements, although a change in the financial statement presentation is required. As of December 31, 2009 and December 31, 2008, the Company has classified $38.6 million and $13.4 million, respectively, of noncontrolling interests within equity which was previously classified as a liability. For the years-ended December 31, 2009 and December 31, 2008, the Company has classified $5.1 million and $2.5 million, respectively, of net income attributable to noncontrolling interests separately on the consolidated statements of income.
In December 2008, the FASB issued guidance primarily contained in ASC topic 715-20-65-2, Compensation – Retirement Benefits: Defined Benefit Plans. The updated guidance in this section enhances disclosures for plan assets of a defined benefit pension or other postretirement plan. The objectives of the disclosures about plan assets in an employer’s defined benefit pension or other postretirement plan are to provide users of financial statements with an understanding of: (i) how investment allocation decisions are made, including the factors that are pertinent to an understanding of investment policies and strategies, (ii) the major categories of plan assets, (iii) the inputs and valuation techniques used to measure the fair value of plan assets, (iv) the effect of fair value measurements using significant unobservable inputs on changes in plan assets for the period, and (v) significant concentrations of risk within plan assets. ASC 715-20-65-2 is effective for fiscal years ending after December 15, 2009. The Company adopted ASC 715-20-65-2 as of December 31, 2009. As this section of the Codification relates specifically to disclosures, the adoption of this standard has no impact on our consolidated financial condition, results of operations or cash flows.
In April 2009, the FASB issued guidance primarily contained in ASC topic 825-10-65-1, Financial Instruments. The updated guidance in this section requires disclosures about fair value of financial instruments for interim reporting periods of publicly traded companies as well as in annual financial statements. The Company has adopted ASC 825-10-65-1 as of June 30, 2009. As this section relates specifically to disclosures, the adoption of this standard had no impact on our consolidated financial condition, results of operations or cash flows. Financial instruments consist mainly of cash, accounts receivable, accounts payable, loans payable to banks and long-term debt. At December 31, 2009, the carrying amounts of these instruments approximated their fair values.
In May 2009, the FASB issued guidance primarily contained in ASC topic 855, Subsequent Events. The updated guidance in this topic establishes principles and requirements for subsequent events. In particular, this Statement sets forth the period after the balance sheet date during which management of a reporting entity shall evaluate events or transactions that may occur for potential recognition or disclosure in the financial statements, the circumstances under which an entity shall recognize events or transactions occurring after the balance sheet date in its financial statements, and the disclosures that an entity shall make about events or transactions that occurred after the balance sheet date. The Company has adopted certain provisions of ASC 855 as of June 30, 2009. As ASC 855 relates specifically to disclosures, the adoption of this standard had no impact on our consolidated financial condition, results of operations or cash flows.
In June 2009, the FASB issued guidance primarily contained in ASC topic 860, Transfers and Servicing. The updated guidance improves the relevance, representational faithfulness, and comparability of the information that a reporting entity provides in its financial reports about a transfer of financial assets; the effects of a transfer on its financial position, financial performance, and cash flows; and a transferor’s continuing involvement in transferred financial assets. ASC 860 is effective for fiscal and interim periods beginning after November 15, 2009. Earlier application is prohibited. Futhermore, the Company considered its pending adoption of ASC 860 upon entering into the new accounts receivable financing facility which is further discussed in Note 9—Accounts Receivable Financing Facility.
In June 2009, the FASB issued guidance primarily contained in ASC topic 810, Consolidation. The updated guidance requires an enterprise to perform an analysis to determine whether the enterprise’s variable interests give it a controlling financial interest in a variable interest entity. ASC 810 is effective for fiscal and interim periods
36
Table of Contents
beginning after November 15, 2009. Earlier application is prohibited. The Company believes that the adoption of certain provisions of ASC 810 will not have a material impact on its future consolidated financial statements.
In August 2009, the FASB issued ASU 2009-05, Measuring Liabilities at Fair Value. ASU 2009-05 amends ASC 820, Fair Value Measurements, by clarifying that when a quoted price in an active market for an identical liability is not available, an entity must measure fair value using one or more of the following techniques: i) the use of a quoted price of an identical liability when traded as an asset; ii) the use of quoted prices for a similar liability or similar liabilities when traded as an asset; and iii) an income approach such as a present value technique, or a market approach but which should, in all instances, maximize the use of relevant observable inputs and minimize the use of unobservable inputs. The Company adopted amendments to the Codification resulting from ASU 2009-05 on September 30, 2009. The adoption of certain provisions of ASC 820 did not have a material impact on our consolidated financial condition, results of operations or cash flows.
Critical Accounting Policies and Estimates
Our discussion and analysis of our financial condition and results of operations are based upon our consolidated financial statements, which have been prepared in accordance with U.S. generally accepted accounting principles. The preparation of financial statements in conformity with those accounting principles requires us to make judgments and estimates that affect the amounts reported in the consolidated financial statements and accompanying notes. Those judgments and estimates have a significant effect on the consolidated financial statements because they result primarily from the need to make estimates about the effects of matters that are inherently uncertain. Actual results could differ from those estimates. We frequently re-evaluate our judgments and estimates that are based upon historical experience and on various other assumptions that we believe to be reasonable under the circumstances.
We believe that of our significant accounting policies (see Note 2 of Notes to Consolidated Financial Statements), the ones that may involve a higher degree of uncertainty, judgment and complexity are stock-based compensation, post-retirement benefits, warranties, streamlining expenses, income taxes, allowance for doubtful accounts and commitments and contingencies.
Allowance for Doubtful Accounts—In determining the allowance for doubtful accounts WABCO analyzes the aging of accounts receivable, historical bad debts, customer creditworthiness and current economic trends.
Inventories—Inventory costs are determined by the use of the last-in, first-out (LIFO) method, and are stated at the lower of such cost or realizable value. The LIFO method is used as it provides a better matching of the costs to the sales. On a quarterly basis, the company tests its inventory for slow moving and obsolete stock by considering both the historical and expected sales and the Company will record a provision, if needed.
Facilities—Property, plant and equipment balances are stated at cost less accumulated depreciation. WABCO capitalizes costs, including interest during construction of fixed asset additions, improvements, and betterments that add to productive capacity or extend the asset life. WABCO assesses facilities for impairment when events or circumstances indicate that the carrying amount of these assets may not be recoverable. Maintenance and repair expenditures are expensed as incurred.
Goodwill—The Company has a significant amount of goodwill on its balance sheet that is not amortized, but subject to impairment tests each fiscal year on October 1st or more often when events or circumstances indicate that the carrying amount of goodwill may not be recoverable. The Company’s impairment tests utilize the two-step approach. The first step of the goodwill impairment test compares fair value of a reporting unit with its carrying amount, including goodwill. If the fair value of a reporting unit exceeds its carrying amount, goodwill of the reporting unit is considered not impaired, thus the second step of the impairment test is unnecessary. If the carrying amount of a reporting unit exceeds its fair value, the second step of the goodwill impairment test shall be performed to measure the amount of impairment loss, if any. The second step of the goodwill impairment test compares the implied fair value of reporting unit goodwill with the carrying amount of that goodwill. If the carrying amount of reporting unit goodwill exceeds the implied fair value of that goodwill, an impairment loss shall be recognize in an amount equal to that excess.
37
Table of Contents
The recoverability of goodwill is measured based on one reporting unit for the total Company. WABCO’s plants, engineering, technical support, distribution centers and other support functions are shared among various product families and serve all distribution channels with many customers. Based on the organizational structure, as well as the nature of financial information available and reviewed by the Company’s chief operating decision maker to assess performance and make decisions about resource allocations, the Company has concluded that its total WABCO operations represent one reportable segment and that WABCO’s performance and future net cash flow perspectives are best understood and assessed as such. In order to approximate the fair value of the reporting unit for purposes of testing recoverability, we use the total market capitalization of the Company, a market approach, which is then compared to the total book value of the Company. In the event the Company’s fair value has fallen below book value, the Company will compare the estimated fair value of goodwill to its book value. If the book value of goodwill exceeds the estimated fair value of goodwill, the Company will recognize the difference as an impairment loss in operating income. There has been no impairment of goodwill during 2009 and the Company’s goodwill was not at risk for failing the first step of its impairment test.
Stock-Based Compensation—The Company measures and recognizes in its combined statement of income the expense associated with all share-based payment awards made to employees and directors including stock options, restricted stock units and restricted stock grants based on estimated fair values. The Company utilizes the Black-Scholes option valuation model to measure the amount of compensation expense to be recognized for each option award. There are several assumptions that must be made when using the Black-Scholes model such as the expected term of each option, the expected volatility of the stock price during the expected term of the option, the expected dividends to be paid and the risk free interest rate expected during the option term. The Company has reviewed each of these assumptions carefully and based on the analysis discussed in Note 5 of Notes to the Consolidated Financial Statements determined its best estimate for these variables. Of these assumptions, the expected term of the option and expected volatility of WABCO’s common stock are the most difficult to estimate since they are based on the exercise behavior of employees and expected performance of WABCO’s stock. An increase in the volatility of WABCO’s stock will increase the amount of compensation expense on new awards. An increase in the holding period of options will also cause an increase in compensation expense. Dividend yields and risk-free interest rates are less difficult to estimate, but an increase in the dividend yield will cause a decrease in expense and an increase in the risk-free interest rate will increase compensation expense.
Post-Retirement Benefits—The Company has significant pension and post-retirement benefit costs and liabilities that are developed from actuarial valuations. Inherent in these valuations are key assumptions including discount rates, expected return on plan assets, mortality rates, merit and promotion increases and the health care cost trend rate. The Company is required to consider current market conditions, including changes in interest rates and health care costs, in making its assumptions. Changes in the related pension and post-retirement benefit costs or liabilities may occur in the future due to changes in the assumptions. The assumptions as to the expected long- term rates of return on plan assets are based upon the composition of plan assets, historical long-term rates of return on similar assets and current and expected market conditions. The discount rate used for U.S. plans reflects the market rate for high-quality fixed-income investments on the Company’s annual measurement date (December 31) and is subject to change each year. The discount rate was determined by matching, on an approximate basis, the coupons and maturities for a portfolio of corporate bonds (rated Aa or better by Moody’s Investor Services) to the expected plan benefit payments defined by the projected benefit obligation. The discount rates used for plans outside the U.S. are based on a combination of relevant indices regarding corporate and government securities, the duration of the liability and appropriate judgment. A decrease of one percentage point in the assumed rate of return on plan assets and a decrease of one percentage point in the discount rate applied to projected benefit obligations would increase annual pension expense by approximately $1.1 million. An increase of one percentage point in the assumed health care cost trend rate in each future year would increase annual health insurance costs by approximately $1.5 million. See the disclosures about pension and post-retirement obligations, the composition of plan assets, assumptions and other matters in Note 11 of Notes to the Consolidated Financial Statements.
Warranties—Estimated product warranty expenses are accrued in cost of good sold at the time the related sales are recognized. Estimates of warranty expenses are based primarily on warranty claims experience and specific customer contracts. Warranty expenses include accruals for basic warranties for product sold, as well as accruals for product recalls, service campaigns and other related events when they are known and estimable.
To the extent we experience changes in warranty claim activity or costs associated with servicing those claims, our warranty accrual is adjusted accordingly. Warranty accrual estimates are updated based upon the most current
38
Table of Contents
warranty claims information available. Such changes in estimates, including foreign currency exchange effects (decreased) / increased our warranty accrual by a net of $(12.0) million in 2009, $3.8 million in 2008 and $13.5 million in 2007. The warranty accrual includes foreign currency exchange effects of $0.7 million, $(3.0) million and $5.4 million for the years ended December 31, 2009, 2008 and 2007, respectively. See Note 13 of Notes to the Consolidated Financial Statements for a three-year summary of warranty costs.
Income taxes—We record a valuation allowance to reduce our deferred tax assets to the amount that we believe is more likely than not to be realized. While we have considered future taxable income and ongoing prudent and feasible tax planning strategies in assessing the need for the valuation allowance, in the event we were to determine that we would not be able to realize all or part of our net deferred tax assets in the future, an adjustment to decrease the net deferred tax assets would be charged to income in the period such determination was made. Likewise, should we determine that we would be able to realize our deferred tax assets in the future in excess of our net recorded amount, an adjustment to increase the net deferred tax assets would increase income in the period such determination was made. Deferred tax assets have been reduced by a valuation allowance of $169.5 million related to foreign net operating losses.
We also estimate our effective income tax rate periodically, considering all known factors and the estimated effects of future events or tax planning strategies that can cause that rate to vary from the statutory rate. Estimating the outcome of future events is inherently uncertain and final resolution of those events can cause the effective rate to vary significantly. In addition, changes in U.S. or foreign tax laws or rulings may have a significant impact on our effective tax rate.
A tax position is a position in a previously filed tax return or a position expected to be taken in a future tax filing that is reflected in measuring current or deferred income tax assets and liabilities. Tax positions shall be recognized only when it is more likely than not (likelihood of greater than 50%), based on technical merits, that the position will be sustained. Tax positions that meet the more likely than not threshold should be measured using a probability weighted approach as the largest amount of tax benefit that is greater than 50% likely of being realized upon settlement. Whether the more-likely-than-not recognition threshold is met for a tax position, is a matter of judgment based on the individual facts and circumstances of that position evaluated in light of all available evidence. The Company accrues interest and penalties related to unrecognized tax benefits in income tax expense.
Contingencies—We are subject to proceedings, lawsuits and other claims related to products and other matters. We are required to assess the likelihood of any adverse judgments or outcomes to these matters as well as potential ranges of probable losses. A determination of the amount of liability to be recorded, if any, for these contingencies is made after careful analysis of each individual issue. The liabilities recorded may change in the future, possibly by significant amounts, due to new developments in any of the matters.
As part of a multi-company investigation commenced in 2004, the former American Standard Companies Inc. (now Trane Inc.), and certain of its European subsidiaries engaged in the Bath and Kitchen business were charged by the European Commission for alleged infringements of European Union competition rules relating to the distribution of bathroom fixtures and fittings in a number of European countries. Pursuant to the Indemnification and Cooperation Agreement that was concluded in the context of the spin-off of WABCO from Trane Inc., WABCO Europe BVBA (an indirect wholly-owned subsidiary of WABCO) is responsible for, and is liable to indemnify Trane Inc. and Ideal Standard International (representing the successor to the Bath and Kitchen business, and owner of certain of the former American Standard subsidiaries) and their owners against, any fines related to this investigation.
We anticipate that this investigation may result in the imposition of a fine in 2010; however, we are unable to reasonably estimate the likely amount or range of any fine that may result from this matter for the reasons that follow. Under its 2006 Fining Guidelines, the Commission will determine a “basic amount” of the fine by considering the value of the sales of goods to which the infringement related, the gravity of the infringement and its duration. In applying the 2006 Guidelines, the Commission retains considerable discretion in calculating the fine, including the determination of the “basic amount,” the evaluation of the aggravating and mitigating circumstances, the availability of leniency and the assessment of the overall deterrent effect of the fine. Due to the specific circumstances, and the factual differences of and with published precedents so far, there is insufficient guidance to allow us to ascertain how the Commission would exercise its discretion in applying the 2006 Guidelines in the present case. If the
39
Table of Contents
Commission were to apply the 2006 Guidelines to the allegations as set forth in the Statement of Objections, the fine could be significant depending on whether the breadth of the allegations and the alleged duration of the infringement are maintained. American Standard and its charged European businesses presented defenses to the allegations in the Statement of Objections, as did WABCO Europe BVBA at an oral hearing with the European Commission in November 2007. It is not possible to judge the impact of these defenses on the final outcome. We would be required to pay a fine within three months of the decision, unless we filed an appeal within two months of the decision, in which case we would be required to pay the fine or to provide a bank guarantee for the full amount of the fine plus interest. The appeals process could take as long as five to seven years during which time WABCO would not have access to such funds or would be required to provide a bank guarantee. The Commission or the General Court (previously known as the Court of First Instance) could agree to waive or suspend this requirement for reasons of financial hardship; however, this outcome cannot be assured and will depend on the relevant facts at the time.
Article 23 of Council Regulation No. 1/2003 provides for a maximum fine equal to 10% of the parent company’s worldwide revenue attributable to all of its products for the fiscal year prior to the year in which the fine is imposed. It is unknown on what basis the Commission will calculate the maximum. As we have previously reported, if the Commission had issued a fine in 2007 and based it on American Standard’s reported worldwide revenue in 2006, the total potential maximum liability would have been approximately $1.1 billion subject to a probable reduction for leniency of at least 20%. American Standard no longer exists. The effect, if any, of the spin-off of WABCO from American Standard, the sale of its Bath and Kitchen business to Ideal Standard International, and the merger of Trane Inc. with Ingersoll-Rand Company Limited, all of which occurred in 2007 and 2008, on the determination of the applicable 10% cap is unclear. Furthermore, we have argued that the cap should be calculated on the basis of the revenue of the charged European businesses, rather than the parent company’s worldwide revenues.
The fine imposed by the Commission could be material to WABCO’s operating results and cash flows for the year in which the liability would be recognized or the fine paid. We are continuing to fully cooperate with the Commission and believe the defenses we have presented to the Commission will be considered and taken into account in the determination of the fine.
As of December 31, 2009, the Company has a cash balance of $350.2 million. The Company’s $800 million five-year revolving credit facility is a non-amortizing facility. There is a balance of $154.0 million outstanding under our principal credit facility. Our principal credit facility contains covenants which limit our ability to access the funds available under the facility. Due to current economic conditions, the covenant which is most restrictive requires that our total net indebtedness does not exceed three times a trailing four quarters adjusted EBITDA (“EBITDA covenant”), as defined in the agreement to the five year $800 million credit facility. As of December 31, 2009, our trailing four quarters adjusted EBITDA was $104.8 million, which consists of $46.4 million for the fourth quarter, $30.4 million for the third quarter, $9.1 million for the second quarter and $18.9 million for the first quarter. Our net indebtedness was $67.2 million at December 31, 2009, resulting in an EBITDA covenant ratio of 0.6 to 1. Given our total indebtedness (including guarantees) at December 31, 2009 we had the ability to borrow an incremental $148 million within the covenants of our principal credit facility.
As described in more detail in Note 9, Accounts Receivable Financing Facility, on September 23, 2009, the Company established a new accounts receivable financing facility with Société Générale Bank Nederland N.V (the “Receivables Facility”). The maximum funding from receivables that may be sold into the Receivables Facility will be €100 million; however, there can be no assurance that the participating sellers will generate sufficient receivables to access the maximum availability. The term of the Receivables Facility is for one year, with the possibility of four additional annual extensions, assuming the Company and the participating sellers are in compliance with certain covenants. As of December 31, 2009, the funding that would have been available under this program, if utilized, was approximately €35 million ($50 million at December 31, 2009 exchange rates).
On April 15, 2009, the Company entered into a €35 million factoring program in respect to accounts receivable from one of our customers. As of December 31, 2009, the funding that would have been available under this program, if utilized, was approximately €19 million ($27 million at December 31, 2009 exchange rates).
Other potential sources of financing that the Company is considering include, but are not limited to: (i) other accounts receivable factoring programs, (ii) sale-leaseback of certain property, plant and equipment, (iii) supply
40
Table of Contents
chain financing and (iv) accessing capital markets. If necessary, we may also seek to obtain a waiver or renegotiate the debt covenants on our primary credit facility.
If the Commission were to issue a fine in excess of our funding capability, we intend to seek approval from the Commission for alternative payment measures, such as installment payments or a suspension of the payment obligation, which we are advised is available in cases of extreme hardship and substantiated financial difficulties. It is our understanding that it is not in the Commission’s interest, nor is it their intention, to force companies out of business due to fine payments, and we believe that the Commission will be sensitive to the current economic conditions. However, this outcome cannot be assured due to the degree of discretion inherent in the Commission’s fining and enforcement powers. The current economic conditions require us to observe that if the fine were to be issued in an amount in excess of our funding capability, and various mitigating actions which the Company has implemented and is planning were to fail, the fine could have a material adverse effect on the financial condition and liquidity of WABCO. See also Item 1A. Risk Factors.
In conjunction with the Tax Sharing Agreement, as further discussed in Note 15, Tax and Indemnification Liabilities Transferred from Trane to WABCO, in Notes to the Consolidated Financial Statements, WABCO is responsible for certain tax and indemnification liabilities. These liabilities include indemnifications to Trane of $39.5 million related to the non-U.S. entities of Trane’s Bath & Kitchen business. The unrecognized tax benefits of $80.2 million discussed further within Note 14-Income Taxes, includes $19.8 million of unrecognized tax benefits related to Trane’s Bath & Kitchen business for which WABCO has obligations directly to tax authorities.
Cyclical and Seasonal Nature of Business
The industry in which we operate is cyclical. Approximately 65% of our sales are for newly manufactured trucks, buses and trailers, the production of which follows long investment cycles and are impacted by macro economic factors and legislation. Global commercial vehicle production has consistently been growing since 2001. In the fourth quarter of 2008, however, the global commercial vehicle markets started to experience a significant decline that was unprecedented in its breadth, depth and speed which continued through 2009. The uncertainty of the development of the global economy makes it difficult to predict how demand for commercial vehicles will develop further in 2010. However, we are anticipating an increase in production from European OEM’s, at steady levels of demand from 2009, as the inventory reductions at the OEM’s in 2009 have subsided. The continued adoption of new technologies by truck and bus manufacturers helps our business outperform the rate of truck and bus production over the longer term. The commercial vehicle industry is not subject to seasonal impacts.
| ITEM 7A. | QUANTITATIVE AND QUALITATIVE DISCLOSURES ABOUT MARKET RISK |
We conduct operations through subsidiaries in most of the major countries of Western Europe, Brazil, Poland, China, South Korea, India and Japan as well as the US. In addition, we conduct business in some countries through affiliated companies and partnerships in which we own 50% or less of the stock or partnership interest. Fluctuations in currency exchange rates have a significant impact on the reported results of our operations, which are presented in U.S. dollars. The largest of these exposures to currency exchange rates is between the euro and U.S. dollar. We believe our primary exposures to changes in currency exchange rates are associated with the following:
| • | Translation—We face foreign currency exposure that arises from translating the results of our operations to the U.S. dollar at exchange rates that have fluctuated throughout the year. A hypothetical 10% weakening of all other currencies in relation to the U.S. dollar would result in an approximate $1.9 million decrease in the 2009 reported net income. |
| • | Sourcing and manufacturing strategy—A significant and growing portion of our products are sourced and manufactured in currencies different than the currency in which they are sold resulting in increased exposure to foreign exchange risks. Based on our expected 2010 transaction flow, a 10% weakening of all other currencies in relation to the U.S. dollar would result in an approximate $3.6 million decrease in the 2009 reported net income. |
| • | Transaction gains and losses—Certain of our monetary assets and liabilities are denominated in currencies other than the functional currency of the respective entity. Based on 2009 balances, a 10% weakening of all other currencies in relation to the U.S. dollar would result in an approximate $0.6 million decrease in the expected 2010 reported net income. |
41
Table of Contents
The aggregate impact of a hypothetical 10% weakening of all other currencies in relation to the U.S. dollar relating to the abovementioned exposures would have resulted in an approximate $6.1 million decrease in the 2009 reported net income. The economic conditions that we faced in 2009 resulted in geographic shifts and a significant reduction of income when compared to previous years. As a consequence, for full year 2009, all foreign currency exposures as noted above are moving in the same direction and as a result eliminated our natural hedge. However, looking at the trends in our currency risk patterns throughout the year, we believe that going forward we will again be in a position to benefit from a natural hedge.
42
Table of Contents
| ITEM 8. | FINANCIAL STATEMENTS AND SUPPLEMENTARY DATA |
Report of Independent Registered Public Accounting Firm
The Board of Directors and Shareholders of WABCO Holdings Inc.
We have audited the accompanying consolidated balance sheets of WABCO Holdings Inc. and subsidiaries as of December 31, 2009 and 2008, and the related consolidated statements of income, shareholders’ equity/owner’s net investment and comprehensive income, and cash flows for each of the three years in the period ended December 31, 2009. Our audit also included the financial statement schedule listed in the Index at Item 15(a). These financial statements and schedule are the responsibility of the Company’s management. Our responsibility is to express an opinion on these financial statements and schedule based on our audits.
We conducted our audits in accordance with the standards of the Public Company Accounting Oversight Board (United States). Those standards require that we plan and perform the audit to obtain reasonable assurance about whether the financial statements are free of material misstatement. An audit includes examining, on a test basis, evidence supporting the amounts and disclosures in the financial statements. An audit also includes assessing the accounting principles used and significant estimates made by management, as well as evaluating the overall financial statement presentation. We believe that our audits provide a reasonable basis for our opinion.
In our opinion, the financial statements referred to above present fairly, in all material respects, the consolidated financial position of WABCO Holdings Inc. and subsidiaries at December 31, 2009 and 2008, and the consolidated results of their operations and their cash flows for each the three years in the period ended December 31, 2009, in conformity with U.S. generally accepted accounting principles. Also, in our opinion, the related financial statement schedule, when considered in relation to the basic financial statements taken as a whole, presents fairly in all material respects the information set forth therein.
As discussed in Note 3 to the consolidated financial statements, the Company changed its method of accounting for business combinations with the adoption of the guidance originally issued in FASB Statement No. 141(R), Business Combinations (codified in FASB ASC Topic 805, Business Combinations) effective January 1, 2009
As discussed in Note 3 to the consolidated financial statements, the Company changed its method of presenting noncontrolling interest in subsidiaries in the consolidated financial statements with the adoption of the guidance originally issued in FASB Statement No. 160, Noncontrolling Interests in Consoldated Financial Statements, an amendment of ARB No. 51 (codified in FASB ASC Topic 810, Consolidation) effective January 1, 2009.
We also have audited, in accordance with the standards of the Public Company Accounting Oversight Board (United States), WABCO Holdings Inc. and subsidiaries’ internal control over financial reporting as of December 31, 2009, based on criteria established in Internal Control-Integrated Framework issued by the Committee of Sponsoring Organizations of the Treadway Commission and our report dated February 18, 2010 expressed an unqualified opinion thereon.
Ernst & Young Bedrijfsrevisoren BCVBA/Reviseurs d’Entreprises SCCRL
Represented by:
/s/ Harry Everaerts, Partner
Brussels, Belgium
February 18, 2010
43
Table of Contents
WABCO HOLDINGS INC. AND SUBSIDIARIES
CONSOLIDATED STATEMENTS OF INCOME
| (Amounts in millions, except share and per share data) |
Year Ended December 31, | |||||||||||
| 2009 | 2008 | 2007 | ||||||||||
| Sales |
$ | 1,491.5 | $ | 2,588.0 | $ | 2,415.9 | ||||||
| Cost of sales |
1,126.7 | 1,883.5 | 1,760.5 | |||||||||
| Streamlining expenses |
37.0 | 10.5 | 3.7 | |||||||||
| Gross profit |
327.8 | 694.0 | 651.7 | |||||||||
| Costs and expenses: |
||||||||||||
| Selling and administrative expenses |
251.9 | 316.8 | 290.7 | |||||||||
| Product engineering expenses |
75.2 | 92.9 | 84.2 | |||||||||
| Streamlining expenses |
19.8 | 26.4 | 9.1 | |||||||||
| Other operating (income)/expense, net |
(4.2 | ) | 11.4 | 26.0 | ||||||||
| Operating (Loss)/Income |
(14.9 | ) | 246.5 | 241.7 | ||||||||
| Equity income of unconsolidated joint ventures, net |
3.1 | 8.1 | 9.1 | |||||||||
| Other non-operating (expense), net |
(5.3 | ) | (4.3 | ) | (6.6 | ) | ||||||
| Income from Indemnification and other settlements |
41.3 | — | — | |||||||||
| Fair value adjustment (charge) of the noncontrolling interest prior to taking control |
(11.5 | ) | — | — | ||||||||
| Interest income/(expense), net |
0.5 | 3.7 | (4.5 | ) | ||||||||
| Income before income taxes |
13.2 | 254.0 | 239.7 | |||||||||
| Income tax (benefit)/expense |
(10.7 | ) | 38.2 | 111.3 | ||||||||
| Net income including noncontrolling interests |
23.9 | 215.8 | 128.4 | |||||||||
| Less: net income attributable to noncontrolling interests |
5.1 | 2.5 | 3.0 | |||||||||
| Net income |
$ | 18.8 | $ | 213.3 | $ | 125.4 | ||||||
| Net income per common share: |
||||||||||||
| Basic |
$ | 0.29 | $ | 3.28 | $ | 1.85 | ||||||
| Diluted |
$ | 0.29 | $ | 3.24 | $ | 1.81 | ||||||
| Cash dividends per share of common stock |
$ | 0.07 | $ | 0.28 | $ | 0.14 | ||||||
| Common shares outstanding: |
||||||||||||
| Basic |
64,024,237 | 65,113,404 | 67,887,919 | |||||||||
| Diluted |
65,030,557 | 65,871,941 | 69,270,661 | |||||||||
See Notes to Consolidated Financial Statements.
44
Table of Contents
WABCO HOLDINGS INC. AND SUBSIDIARIES
CONSOLIDATED BALANCE SHEETS
| (Amounts in millions, except share data) |
December 31, 2009 |
December 31, 2008 |
||||||
| ASSETS |
||||||||
| Current assets: |
||||||||
| Cash and cash equivalents |
$ | 350.2 | $ | 392.8 | ||||
| Accounts receivable, less allowance for doubtful accounts—$9.3 in 2009; $6.9 in 2008 |
264.2 | 313.8 | ||||||
| Inventories: |
||||||||
| Finished products |
66.0 | 75.1 | ||||||
| Products in process |
6.0 | 7.6 | ||||||
| Raw materials |
83.3 | 80.0 | ||||||
| Taxes receivable on income |
— | 20.0 | ||||||
| Future income tax benefits |
4.6 | 4.3 | ||||||
| Other current assets |
41.4 | 54.4 | ||||||
| Total current assets |
815.7 | 948.0 | ||||||
| Facilities, less accumulated depreciation |
368.2 | 315.8 | ||||||
| Goodwill |
399.4 | 360.8 | ||||||
| Capitalized software costs, less accumulated amortization—$154.5 in 2009; $145.9 in 2008 |
22.0 | 22.7 | ||||||
| Long-term future income tax benefits |
56.2 | 29.1 | ||||||
| Investments in unconsolidated joint ventures |
11.1 | 74.0 | ||||||
| Patents and intangible assets |
21.7 | 6.7 | ||||||
| Other assets |
21.3 | 18.9 | ||||||
| TOTAL ASSETS |
$ | 1,715.6 | $ | 1,776.0 | ||||
| LIABILITIES AND EQUITY |
||||||||
| Current liabilities: |
||||||||
| Loans payable to banks |
$ | 1.7 | $ | 76.4 | ||||
| Accounts payable |
111.2 | 108.3 | ||||||
| Accrued payroll |
68.8 | 89.8 | ||||||
| Current portion of warranties |
43.1 | 54.2 | ||||||
| Taxes payable |
21.8 | — | ||||||
| Indemnification liabilities |
11.6 | 25.2 | ||||||
| Streamlining liabilities |
31.7 | 15.3 | ||||||
| Other accrued liabilities |
65.3 | 59.2 | ||||||
| Total current liabilities |
355.2 | 428.4 | ||||||
| Long-term debt |
154.4 | 173.6 | ||||||
| Post-retirement benefits |
355.6 | 319.9 | ||||||
| Deferred tax liabilities |
25.8 | 26.6 | ||||||
| Long-term indemnification liabilities |
27.9 | 35.2 | ||||||
| Long-term income tax liabilities |
69.8 | 94.1 | ||||||
| Other liabilities |
48.0 | 83.3 | ||||||
| Total liabilities |
1,036.7 | 1,161.1 | ||||||
| Commitments and contingencies |
||||||||
| Shareholders’ equity: |
||||||||
| Preferred stock, 4,000,000 shares authorized; none issued and outstanding |
— | — | ||||||
| Common stock, $.01 par value, 400,000,000 shares authorized; shares issued: 70,033,252 in 2009; 69,921,105 in 2008; and shares outstanding: 64,077,446 in 2009; 63,964,299 in 2008 |
0.7 | 0.7 | ||||||
| Capital surplus |
591.5 | 578.4 | ||||||
| Treasury stock, at cost: 5,956,806 shares in 2009; 5,956,806 shares in 2008 |
(276.3 | ) | (276.3 | ) | ||||
| Retained earnings |
285.7 | 271.4 | ||||||
| Accumulated other comprehensive income: |
||||||||
| Foreign currency translation adjustments |
88.4 | 51.4 | ||||||
| Unrealized losses on benefit plans, net of tax |
(49.9 | ) | (24.1 | ) | ||||
| Total shareholders’ equity |
640.1 | 601.5 | ||||||
| Noncontrolling interests |
38.8 | 13.4 | ||||||
| Total equity |
678.9 | 614.9 | ||||||
| TOTAL LIABILITIES AND EQUITY |
$ | 1,715.6 | $ | 1,776.0 | ||||
See Notes to Consolidated Financial Statements.
45
Table of Contents
WABCO HOLDINGS INC. AND SUBSIDIARIES
CONSOLIDATED STATEMENTS OF CASH FLOWS
| (Amounts in millions) |
Year Ended December 31, | |||||||||||
| 2009 | 2008 | 2007 | ||||||||||
| Operating activities: |
||||||||||||
| Net income including noncontrolling interests |
$ | 23.9 | $ | 215.8 | $ | 128.4 | ||||||
| Adjustments to reconcile net income to net cash provided / (used) by operating activities: |
||||||||||||
| Depreciation |
69.0 | 71.8 | 63.6 | |||||||||
| Amortization of capitalized software and other intangibles |
20.6 | 24.7 | 28.7 | |||||||||
| Fair value adjustment of the noncontrolling interest prior to taking control |
11.5 | — | — | |||||||||
| Equity in earnings of unconsolidated joint ventures, net of dividends received |
3.1 | (0.6 | ) | (0.1 | ) | |||||||
| Non-cash stock compensation |
12.7 | 8.8 | 4.4 | |||||||||
| Deferred income taxes |
(21.0 | ) | 4.9 | 18.9 | ||||||||
| Loss on sale or disposal of facilities |
2.5 | 0.1 | 2.9 | |||||||||
| Gain on divestitures |
0.8 | — | — | |||||||||
| Indemnification settlements |
(41.3 | ) | — | — | ||||||||
| Changes in assets and liabilities: |
||||||||||||
| Accounts receivable, net |
68.3 | 115.9 | (233.9 | ) | ||||||||
| Inventories |
23.0 | 4.8 | (21.3 | ) | ||||||||
| Accounts payable |
(13.1 | ) | (76.2 | ) | 27.0 | |||||||
| Other accrued liabilities and taxes |
(33.3 | ) | (46.8 | ) | (29.7 | ) | ||||||
| Post-retirement benefits |
(5.4 | ) | (3.6 | ) | (3.3 | ) | ||||||
| Other current and long-term assets |
10.1 | (5.4 | ) | 1.5 | ||||||||
| Other long-term liabilities |
15.0 | 10.6 | 12.6 | |||||||||
| Net cash provided/ (used) by operating activities |
146.4 | 324.8 | (0.3 | ) | ||||||||
| Investing activities: |
||||||||||||
| Purchases of property, plant and equipment |
(59.3 | ) | (78.0 | ) | (69.8 | ) | ||||||
| Investments in capitalized software |
(7.1 | ) | (5.6 | ) | (7.9 | ) | ||||||
| Proceeds from disposal of property, plant and equipment |
— | — | 1.9 | |||||||||
| (Acquisitions) / divestitures, net |
(7.4 | ) | — | — | ||||||||
| Net cash used in investing activities |
(73.8 | ) | (83.6 | ) | (75.8 | ) | ||||||
| Financing activities: |
||||||||||||
| Borrowings of long-term debt |
0.8 | 156.5 | 142.4 | |||||||||
| Repayments of long-term debt |
(161.9 | ) | — | (202.0 | ) | |||||||
| Net (repayments) / borrowings of revolving credit facilities |
121.0 | (83.0 | ) | 116.0 | ||||||||
| Net (repayments) / borrowings of short-term debt |
(74.2 | ) | 58.2 | (8.6 | ) | |||||||
| Purchases of treasury stock |
— | (153.5 | ) | (122.8 | ) | |||||||
| Dividend payments |
(4.5 | ) | (18.3 | ) | (9.6 | ) | ||||||
| Dividends to noncontrolling interest holders |
(3.4 | ) | — | — | ||||||||
| Proceeds from exercise of stock options |
0.3 | 21.5 | 18.1 | |||||||||
| Net transfers from Trane or Trane affiliated entities |
— | — | 281.0 | |||||||||
| Net cash provided/(used) by financing activities |
(121.9 | ) | (18.6 | ) | 214.5 | |||||||
| Effect of exchange rate changes on cash and cash equivalents |
6.6 | (13.0 | ) | 10.0 | ||||||||
| Net increase/(decrease) in cash and cash equivalents |
(42.6 | ) | 209.6 | 148.4 | ||||||||
| Cash and cash equivalents at beginning of period |
392.8 | 183.2 | 34.8 | |||||||||
| Cash and cash equivalents at end of period |
$ | 350.2 | $ | 392.8 | $ | 183.2 | ||||||
| Cash paid during the year for: |
||||||||||||
| Interest |
$ | 2.9 | $ | 6.2 | $ | 4.7 | ||||||
| Income taxes |
$ | 3.4 | $ | 82.6 | $ | 65.7 | ||||||
| Non cash Items for the year: |
||||||||||||
| Pension reserves transferred from Trane. |
$ | — | $ | — | $ | 8.1 | ||||||
| VAT receivables transferred from Trane. |
$ | — | $ | — | $ | 6.8 | ||||||
| Tax reserves and separation taxes transferred from Trane. |
$ | — | $ | — | $ | 97.1 | ||||||
See Notes to Consolidated Financial Statements.
46
Table of Contents
WABCO HOLDINGS INC. AND SUBSIDIARIES
CONSOLIDATED STATEMENT OF SHAREHOLDERS’ EQUITY/OWNER’S NET INVESTMENT AND COMPREHENSIVE INCOME
| (Amounts in millions) |
Accumulated Other Comprehensive Income |
||||||||||||||||||||||||||||||
| Owner’s Investment |
Common Stock |
Capital Surplus |
Treasury Stock |
Retained Earnings |
Foreign Currency Translation Effects |
Unrealized Losses on Benefit Plans, net of tax |
Comprehensive Income |
||||||||||||||||||||||||
| Balance at December 31, 2006 |
$ | 306.0 | $ | — | $ | — | $ | — | $ | — | $ | 82.4 | $ | (73.2 | ) | ||||||||||||||||
| Net income prior to separation |
39.4 | — | — | — | — | — | — | $ | 39.4 | ||||||||||||||||||||||
| Net income post separation |
— | — | — | — | 86.0 | — | — | 86.0 | |||||||||||||||||||||||
| Foreign currency translation |
— | — | — | — | — | 46.2 | (4.0 | ) | 42.2 | ||||||||||||||||||||||
| Unrealized gains on pension, net of tax |
— | — | — | — | — | — | 53.6 | 53.6 | |||||||||||||||||||||||
| Total comprehensive income |
$ | 221.2 | |||||||||||||||||||||||||||||
| Net transfers from Trane and affiliates |
180.4 | — | — | — | — | — | — | ||||||||||||||||||||||||
| Common stock issued upon separation |
— | 0.7 | — | — | — | — | — | ||||||||||||||||||||||||
| Transfer upon separation |
(525.8 | ) | — | 525.8 | — | — | — | — | |||||||||||||||||||||||
| Treasury stock purchased |
— | — | — | (122.8 | ) | — | — | — | |||||||||||||||||||||||
| Stock options exercised |
— | — | 18.1 | — | — | — | — | ||||||||||||||||||||||||
| Stock-based compensation |
— | — | 4.4 | — | — | — | — | ||||||||||||||||||||||||
| Dividends paid |
— | — | — | — | (9.6 | ) | — | — | |||||||||||||||||||||||
| Balance at December 31, 2007 |
$ | — | $ | 0.7 | $ | 548.3 | $ | (122.8 | ) | $ | 76.4 | $ | 128.6 | $ | (23.6 | ) | |||||||||||||||
| Net income |
— | — | — | 213.3 | — | — | $ | 213.3 | |||||||||||||||||||||||
| Foreign currency translation |
— | — | — | — | — | (77.2 | ) | (2.7 | ) | (79.9 | ) | ||||||||||||||||||||
| Unrealized gains on pension, net of tax |
— | — | — | — | — | — | 2.2 | 2.2 | |||||||||||||||||||||||
| Total comprehensive income |
$ | 135.6 | |||||||||||||||||||||||||||||
| Treasury stock purchased |
— | — | — | (153.5 | ) | — | — | — | |||||||||||||||||||||||
| Stock options exercised |
— | — | 21.5 | — | — | — | — | ||||||||||||||||||||||||
| Stock-based compensation |
— | — | 8.4 | — | — | — | — | ||||||||||||||||||||||||
| Other stock issued |
— | — | 0.2 | — | — | — | — | ||||||||||||||||||||||||
| Dividends paid |
— | — | — | — | (18.3 | ) | — | — | |||||||||||||||||||||||
| Balance at December 31, 2008 |
$ | — | $ | 0.7 | $ | 578.4 | $ | (276.3 | ) | $ | 271.4 | $ | 51.4 | $ | (24.1 | ) | |||||||||||||||
| Net income |
— | — | — | 18.8 | — | — | $ | 18.8 | |||||||||||||||||||||||
| Foreign currency translation |
— | — | — | — | — | 37.0 | 2.0 | 39.0 | |||||||||||||||||||||||
| Unrealized losses on pension, net of tax |
— | — | — | — | — | — | (27.8 | ) | (27.8 | ) | |||||||||||||||||||||
| Total comprehensive income |
$ | 30.0 | |||||||||||||||||||||||||||||
| Treasury stock purchased |
— | — | — | — | — | — | — | ||||||||||||||||||||||||
| Stock options exercised |
— | — | 0.5 | — | — | — | — | ||||||||||||||||||||||||
| Stock-based compensation |
— | — | 12.8 | — | — | — | — | ||||||||||||||||||||||||
| Other stock issued |
— | — | (0.2 | ) | — | — | — | — | |||||||||||||||||||||||
| Dividends paid |
— | — | — | — | (4.5 | ) | — | — | |||||||||||||||||||||||
| Balance at December 31, 2009 |
$ | — | $ | 0.7 | $ | 591.5 | $ | (276.3 | ) | $ | 285.7 | $ | 88.4 | $ | (49.9 | ) | |||||||||||||||
See Notes to Consolidated Financial Statements.
47
Table of Contents
WABCO HOLDINGS INC. AND SUBSIDIARIES
NOTES TO CONSOLIDATED FINANCIAL STATEMENTS
DECEMBER 31, 2009
NOTE 1. Description of Company and Basis of Presentation
WABCO Holdings Inc. and subsidiaries (collectively “WABCO” or the “Company”) develops, manufactures and sells advanced braking, stability, suspension and transmission control systems primarily for commercial vehicles. WABCO’s largest selling products are braking systems (“ABS” and “EBS”), automated manual transmission controls and air suspension controls for heavy and medium-sized trucks, buses and trailers. WABCO sells its products to four groups of customers around the world: truck and bus original equipment manufacturers (“OEMs”), trailer OEMs, aftermarket distributors of replacement parts and services, and automotive OEMs.
On February 1, 2007, Trane Inc., formerly known as American Standard Companies Inc., (“Trane”) announced that its Board of Directors completed a strategic review of Trane and unanimously approved a plan to separate its Vehicle Control Systems business as an independent, publicly traded company, named WABCO Holdings Inc. (the “Separation”). Trane implemented the Separation on July 31, 2007, through a tax-free stock dividend of all of WABCO’s common stock to Trane shareowners, who received one share of WABCO common stock for every three shares of Trane common stock owned on the record date of July 19, 2007 (the “Distribution”). The Separation has provided WABCO with certain opportunities and benefits, including increased strategic focus, increased market recognition, improved capital flexibility and increased ability to attract, retain and motivate employees.
Prior to July 31, 2007, the historical consolidated financial statements have been derived from the consolidated financial statements and accounting records of Trane, principally representing the Vehicle Control Systems segment, using the historical results of operations, and historical basis of assets and liabilities of the Vehicle Control Systems segment and reflecting Trane’s net investment in the Vehicle Control Systems segment through July 31, 2007. Historically, stand-alone consolidated financial statements were not prepared for the Vehicle Control Systems segment. The accompanying consolidated financial statements include allocations of costs that were incurred by Trane for functions such as corporate human resources, finance and legal through July 31, 2007. These costs include the costs of salaries, benefits and other related costs. The total costs allocated to the accompanying consolidated financial statements for these functions amounted to $12.9 million for the year ended December 31, 2007. These costs are included in selling and administrative expenses in the accompanying consolidated financial statements. The primary driver underlying this allocation is total WABCO revenue as a percentage of the total consolidated revenue of Trane. Management believes the assumptions underlying the allocations included in the consolidated financial statements are reasonable.
Historically, WABCO’s operations have been substantially funded through Trane’s primary bank credit agreement through either intercompany loans or intercompany advances. The historical accompanying consolidated financial statements through July 31, 2007, reflect the interest expense or income, if any, charged or received on these intercompany arrangements.
Although the historical consolidated financial statements, for periods prior to the Separation, may not necessarily reflect WABCO’s results of operations, financial position and cash flows subsequent to the Separation, management believes the differences between the amounts presented and what its results of operations, financial position and cash flows would have been had WABCO been a standalone company during the periods presented would not be material. For purposes of cash flow presentation, the Company has presented both cash flow activities for the revolving credit facilities and short-term debt on a net presentation basis as these items represent cash flow activities where turnover is quick, the amounts are large, and the maturities are short. The Company evaluated subsequent events through February 18, 2010 which is the date of issuance of the financial statements.
NOTE 2. Summary of Significant Accounting Policies
Use of Estimates—The preparation of consolidated financial statements in conformity with U.S. generally accepted accounting principles requires management to make estimates and assumptions that affect the amounts reported in the consolidated financial statements and accompanying notes. Actual results could differ from those
48
Table of Contents
estimates. Some of the most significant estimates included in the preparation of the consolidated financial statements are related to stock-based compensation, post-retirement benefits, warranties, income taxes, allowance for doubtful accounts, inventories and commitments and contingencies. Allocation methods are described in the notes to these consolidated financial statements where appropriate. In the context of the current global economic environment, the degree of volatility and subsequent lack of visibility remains particularly high as of December 31, 2009.
Principles of Consolidation—The historical consolidated financial statements through July 31, 2007, include the accounts of certain majority-owned subsidiaries of Trane and intercompany transactions are eliminated. Subsequent to the Separation, all majority owned subsidiaries of WABCO are included in the consolidated financial statements and intercompany transactions are eliminated upon consolidation. WABCO investments in unconsolidated joint ventures are included at cost plus its equity in undistributed earnings in accordance with the equity method of accounting and reflected as investments in unconsolidated joint ventures in the consolidated balance sheet. Certain amounts in the prior years’ consolidated financial statements have been reclassified to conform to the current year presentation.
Foreign Currency Translation—Adjustments resulting from translating foreign functional currency assets and liabilities into U.S. dollars are recorded in a separate component of shareholders’ equity/owner’s net investment. Gains or losses resulting from transactions in other than the functional currency are reflected in the consolidated statement of income, except for intercompany transactions of a long-term investment nature.
Revenue Recognition—Sales of products are recorded (i) upon shipment if title passes to the customer upon shipment, or upon delivery if title passes to the customer upon delivery, (ii) when persuasive evidence of an arrangement exists with the customer, (iii) when the sales price is fixed and determinable, and (iv) when the collectability of the sales price is reasonably assured. Amounts billed to customers for shipping and handling costs are included in sales.
WABCO typically records cooperative advertising allowances, rebates and other forms of sales incentives as a reduction of sales at the later of the date of the sale or the date the incentive is offered. WABCO recorded $26.9 million, $38.3 million and $33.0 million in 2009, 2008 and 2007, respectively, for these costs of sales in the accompanying consolidated statements of income.
In most countries where WABCO operates, sales are subject to VAT taxes. Sales are presented net of VAT in the consolidated statements of income.
Shipping and Handling Costs—Shipping, handling, receiving, inspecting, warehousing, internal transfer, procurement and other costs of distribution are included in cost of sales in the consolidated statements of income.
Cash Equivalents—Cash equivalents include all highly liquid investments with maturity of three months or less when purchased.
Allowance for Doubtful Accounts—In determining the allowance for doubtful accounts WABCO analyzes the aging of accounts receivable, historical bad debts, customer creditworthiness, availability of credit insurance and current economic trends.
Inventories—Inventory costs are determined by the use of the last-in, first-out (LIFO) method, and are stated at the lower of such cost or realizable value. The LIFO method is used as it provides a better matching of the costs to the sales. On a quarterly basis, the company tests its inventory for slow moving and obsolete stock by considering both the historical and expected sales and the Company will record a provision, if needed.
Facilities—Property, plant and equipment balances are stated at cost less accumulated depreciation. WABCO capitalizes costs, including interest during construction of fixed asset additions, improvements, and betterments that add to productive capacity or extend the asset life. WABCO assesses facilities for impairment when events or circumstances indicate that the carrying amount of these assets may not be recoverable. Maintenance and repair expenditures are expensed as incurred.
49
Table of Contents
Depreciation—Depreciation and amortization are computed on the straight-line method based on the estimated useful life of the asset or asset group, which are 40 years for buildings, 3 years for tooling and 5 to 15 years for machinery and equipment.
Computer Software Costs—WABCO capitalizes the costs of obtaining or developing internal-use computer software, including directly related payroll costs. WABCO amortizes those costs over periods up to seven years, beginning when the software is ready for its intended use. WABCO recorded $8.6 million, $16.8 million and $14.0 million in 2009, 2008 and 2007, respectively, in the accompanying consolidated statements of income.
Goodwill—The Company has a significant amount of goodwill on its balance sheet that is not amortized, but subject to impairment tests each fiscal year on October 1st or more often when events or circumstances indicate that the carrying amount of goodwill may not be recoverable. The Company’s impairment tests utilize the two-step approach. The first step of the goodwill impairment test compares fair value of a reporting unit with its carrying amount, including goodwill. If the fair value of a reporting unit exceeds its carrying amount, goodwill of the reporting unit is considered not impaired, thus the second step of the impairment test is unnecessary. If the carrying amount of a reporting unit exceeds its fair value, the second step of the goodwill impairment test shall be performed to measure the amount of impairment loss, if any. The second step of the goodwill impairment test compares the implied fair value of reporting unit goodwill with the carrying amount of that goodwill. If the carrying amount of reporting unit goodwill exceeds the implied fair value of that goodwill, an impairment loss shall be recognize in an amount equal to that excess.
The recoverability of goodwill is measured based on one reporting unit for the total Company. WABCO’s plants, engineering, technical support, distribution centers and other support functions are shared among various product families and serve all distribution channels with many customers. Based on the organizational structure, as well as the nature of financial information available and reviewed by the Company’s chief operating decision maker to assess performance and make decisions about resource allocations, the Company has concluded that its total WABCO operations represent one reportable segment and that WABCO’s performance and future net cash flow perspectives are best understood and assessed as such. In order to approximate the fair value of the reporting unit for purposes of testing recoverability, we use the total market capitalization of the Company, a market approach, which is then compared to the total book value of the Company. In the event the Company’s fair value has fallen below book value, the Company will compare the estimated fair value of goodwill to its book value. If the book value of goodwill exceeds the estimated fair value of goodwill, the Company will recognize the difference as an impairment loss in operating income. There has been no impairment of goodwill during 2009.
Other Intangible Assets with Determinable Lives—Other intangible assets with determinable lives consist of customer and distribution relationships, patented and unpatented technology, in-process research and development, software and other intangibles and are amortized over their estimated useful lives, ranging from 1 to 15 years. See Note 19 for more details on acquired intangibles.
Debt Issuance Costs—The costs related to the issuance of debt are capitalized and amortized over the life of the related debt.
Warranties—Products sold by WABCO are covered by a basic limited warranty with terms and conditions that vary depending upon the product and country in which it was sold. The limited warranty covers the equipment, parts and labor (in certain cases) necessary to satisfy the warranty obligation for a period of two years, generally. Estimated product warranty expenses are accrued in cost of good sold at the time the related sale is recognized. Estimates of warranty expenses are based primarily on warranty claims experience and specific customer contracts. Warranty expenses include accruals for basic warranties for product sold, as well as accruals for product recalls, service campaigns and other related events when they are known and estimable. To the extent WABCO experiences changes in warranty claim activity or costs associated with servicing those claims, its warranty accrual is adjusted accordingly. Warranty accrual estimates are updated based upon the most current warranty claims information available. See Note 13 for a summary of warranties.
Post-retirement Benefits—All post-retirement benefits are accounted for on an accrual basis using actuarial assumptions. Post-retirement pension benefits are provided for substantially all employees of WABCO, both in the U.S. and abroad through plans specific to each of WABCO’s legal entities. In addition, in the U.S. and Brazil, certain
50
Table of Contents
employees receive post-retirement health care and life insurance benefits. The costs of the benefits provided through plans of WABCO are also included in the accompanying consolidated financial statements and summarized in detail along with other information pertaining to these plans in Note 11. Plans are primarily concentrated in the United Kingdom, Austria, Germany, and Switzerland.
WABCO is also required to measure a defined benefit post-retirement plan’s assets and obligations that determine its funded status as of the end of the employer’s fiscal year, and recognize changes in the funded status of a defined benefit post-retirement plan in comprehensive income in the year in which the changes occur. This provision was adopted by the Company for the year ended December 31, 2008. Since the Company currently has a measurement date of December 31st for substantially all plans, this provision did not have a material impact to the consolidated financial statements.
Fair Value of Financial Instruments—Financial instruments consist mainly of cash, accounts receivable, accounts payable, loans payable to banks and long-term debt. At December 31, 2009 and 2008, the carrying amounts of these instruments approximated their fair values.
Derivative Instruments and Hedging Activities—Historically, the Company has entered into cross currency swaps to minimize the risks and costs associated with fluctuations in foreign currency exchange rates between the euro and the U.S. dollar. The Company recognizes all derivative financial instruments in the consolidated financial statements at fair value. Changes in the fair value of derivative financial instrument which qualify for hedge accounting are recorded as an offset to the changes in fair value of the underlying hedged item and are included in the account other non-operating expense, net. As of December 31, 2009, the Company is not entered into any swap agreements.
Research, Development and Engineering Expenses—Research and development costs are expensed as incurred. WABCO expended approximately $75.2 million in 2009, $92.9 million in 2008 and $84.2 million in 2007 for research activities, product development and for product engineering.
Income Taxes—Deferred income taxes are determined on the asset and liability method, and are recognized for all temporary differences between the tax bases of assets and liabilities and their reported amounts in the consolidated financial statements. No provision is made for U.S. income taxes applicable to undistributed earnings of foreign subsidiaries that are indefinitely reinvested. Prior to July 31, 2007, WABCO had been included in Trane’s consolidated federal and state income tax returns. The provision for income taxes for those periods has been computed as if WABCO filed its own consolidated income tax returns separate and apart from Trane.
A tax position is a position in a previously filed tax return or a position expected to be taken in a future tax filing that is reflected in measuring current or deferred income tax assets and liabilities. Tax positions are recognized only when it is more likely than not (likelihood of greater than 50%) based on technical merits, that the position will be sustained upon examination. Tax positions that meet the more likely than not threshold are measured using a probability weighted approach as the largest amount of tax benefit that is greater than 50% likely of being realized upon settlement.
Earnings Per Share—Basic net income per share has been computed using the weighted average number of common shares outstanding. The average number of outstanding shares of common stock used in computing diluted net income per share included 1,006,320, 758,537 and 1,382,742 weighted average incremental shares for the years ended December 31, 2009, 2008 and 2007, respectively. The weighted average incremental shares represent the net amount of shares the Company would issue upon the assumed exercise of in-the-money stock options and vesting of Restricted Stock Units (“RSUs”) after assuming that the Company would use the proceeds from the exercise of options to repurchase treasury stock. The years ended December 31, 2009, 2008 and 2007, excluded 2,964,029, 1,553,054 and 111,887 shares due to their anti-dilutive effect, respectively. Anti-dilutive options represent those options whose exercise price was greater than the average price of the Company’s common stock during the years ended December 31, 2009, 2008 and 2007.
Comprehensive Income—Comprehensive income consists of net income, foreign currency translation adjustments and pension liability adjustments and unrecognized gains or losses on post-retirement benefit plans and is presented in the accompanying consolidated statement of shareholders’ equity/owner’s net investment and comprehensive income.
51
Table of Contents
Stock-Based Compensation—WABCO measures and recognizes in its combined statement of income the expense associated with all share-based payment awards made to employees and directors including stock options, restricted stock units and restricted stock grants based on estimated fair values.
Prior to Separation, certain WABCO employees participated in the stock-based compensation plans of Trane. Under these plans, certain WABCO employees had received grants of stock options. Stock options granted to WABCO employees under Trane’s plans had generally vested ratably over three years on the anniversary date of the awards and were exercisable generally over a period of ten years.
All options granted prior to 2007 were adjusted upon the Distribution into two separate options, one relating to the Company’s common stock and one relating to Trane common stock. This adjustment was made such that immediately following the Distribution (i) the number of shares relating to the Company options were equal to the number of shares of Company common stock that the option holder would have received in the Distribution had Trane options represented outstanding shares of Trane common stock, and (ii) the per share option exercise price of the original Trane stock option was proportionally allocated between the two types of stock options based upon the relative per share trading prices of the Company and Trane immediately following the Distribution. Thus, upon the Distribution, WABCO options are being held by both WABCO and Trane employees and Trane options continued to be held by WABCO employees. Options granted to WABCO employees in 2007 were equitably adjusted upon Distribution so as to relate solely to shares of the Company’s common stock. These adjustments preserved the economic value of the awards immediately prior to the Distribution. All Company options issued as part of this adjustment and the Trane options will continue to be subject to their current vesting schedules. Further, for purposes of vesting and the post-termination exercise periods applicable to such stock options, the Trane Inc. Management Development and Compensation Committee determined that continued employment with the Company will be viewed as continued employment with the issuer of the options.
WABCO uses the Black-Scholes option valuation model to measure the amount of compensation expense to be recognized for each option award. Total stock-based compensation cost recognized during the years ending December 31, 2009, 2008 and 2007 of $12.5 million, $8.4 million and $4.4 million, respectively, has been included in the accompanying consolidated statements of income. Outstanding WABCO options held by non-WABCO employees or directors arise as a result of the Distribution and are not reflected in compensation expense recognized by the Company. Consequently, these stock options do not result in any tax benefits to the Company at any time. The WABCO options held by non-employees or directors are considered in the Company’s diluted EPS calculation.
NOTE 3. Recently Issued Accounting Standards
In June 2009, the Financial Accounting Standards Board (“FASB”) issued Accounting Standards Update (“ASU”) No. 2009-1, “Topic 105, Generally Accepted Accounting Principles,” which amended Accounting Standards Codification (“ASC” 105 Generally Accepted Accounting Principles, confirming that the FASB Accounting Standards Codification (the “Codification”) will become the single official source of authoritative US GAAP (other than guidance issued by the SEC), superseding existing FASB, American Institute of Certified Public Accountants, Emerging Issues Task Force (EITF), and related literature. Only one level of authoritative US GAAP will exist. All other literature will be considered non-authoritative. The Codification does not change US GAAP; instead, it introduces a new structure that is organized in an easily accessible, user-friendly online research system. The Codification became effective for interim and annual periods ending on or after September 15, 2009. The Company has adopted amendments to the Codification resulting from ASU No. 2009-1 during the third quarter of 2009.
In December 2007, the FASB issued guidance primarily contained in ASC topic 805, Business Combinations. ASC 805 requires that identifiable assets acquired, liabilities assumed, and any noncontrolling interest in the acquiree be recognized and measured as of the acquisition date at fair value regardless of the percentage of ownership. The standard also requires any shares issued for acquisition to be measured at fair value on the date of acquisition as well as any contingent consideration recognized or pre-acquisition gain or loss contingencies. In-process research and development will not be capitalized and any acquisition related transaction costs should be expensed as incurred. ASC 805 is effective for fiscal years beginning after December 15, 2008. The Company adopted certain provisions of ASC 805 as of January 1, 2009 and appropriately accounted for the WABCO-TVS step acquisition on June 3, 2009 in accordance with this standard. See Note 19—Business Combinations for further details.
52
Table of Contents
In December 2007, the FASB issued guidance primarily contained in ASC topic 810-10-65-1, Consolidation. The updated guidance contained in this section requires that a noncontrolling interest in a consolidated subsidiary be displayed in the consolidated statement of financial position as a separate component of equity. Consistent with the FASB’s view that noncontrolling interests are part of the equity of the consolidated group, this section of the Codification requires that earnings attributed to the noncontrolling interests are to be reported as part of consolidated earnings and not as a separate component of income or expense. Once a subsidiary is consolidated, any change in ownership that does not result in loss of control is accounted for as an equity transaction. However, deconsolidation of a subsidiary would result in a gain or loss reflected in the Company’s Income Statement. ASC 810-10-65-1 is effective for fiscal years beginning after December 15, 2008. The Company has adopted ASC 810-10-65-1 as of January 1, 2009. There was no material impact on the consolidated financial statements, although a change in the financial statement presentation is required. As of December 31, 2009 and December 31, 2008, the Company has classified $38.8 million and $13.4 million, respectively, of noncontrolling interests within equity which was previously classified as a liability. For the years-ended December 31, 2009 and December 31, 2008, the Company has classified $5.1 million and $2.5 million, respectively, of net income attributable to noncontrolling interests separately on the consolidated statements of income.
In December 2008, the FASB issued guidance primarily contained in ASC topic 715-20-65-2, Compensation—Retirement Benefits: Defined Benefit Plans. The updated guidance in this section enhances disclosures for plan assets of a defined benefit pension or other postretirement plan. The objectives of the disclosures about plan assets in an employer’s defined benefit pension or other postretirement plan are to provide users of financial statements with an understanding of: (i) how investment allocation decisions are made, including the factors that are pertinent to an understanding of investment policies and strategies, (ii) the major categories of plan assets, (iii) the inputs and valuation techniques used to measure the fair value of plan assets, (iv) the effect of fair value measurements using significant unobservable inputs on changes in plan assets for the period, and (v) significant concentrations of risk within plan assets. ASC 715-20-65-2 is effective for fiscal years ending after December 15, 2009. The Company adopted ASC 715-20-65-2 as of December 31, 2009. As this section of the Codification relates specifically to disclosures, the adoption of this standard has no impact on our consolidated financial condition, results of operations or cash flows.
In April 2009, the FASB issued guidance primarily contained in ASC topic 825-10-65-1, Financial Instruments. The updated guidance in this section requires disclosures about fair value of financial instruments for interim reporting periods of publicly traded companies as well as in annual financial statements. The Company has adopted ASC 825-10-65-1 as of June 30, 2009. As this section relates specifically to disclosures, the adoption of this standard had no impact on our consolidated financial condition, results of operations or cash flows. Financial instruments consist mainly of cash, accounts receivable, accounts payable, loans payable to banks and long-term debt. At December 31, 2009, the carrying amounts of these instruments approximated their fair values.
In May 2009, the FASB issued guidance primarily contained in ASC topic 855, Subsequent Events. The updated guidance in this topic establishes principles and requirements for subsequent events. In particular, this Statement sets forth the period after the balance sheet date during which management of a reporting entity shall evaluate events or transactions that may occur for potential recognition or disclosure in the financial statements, the circumstances under which an entity shall recognize events or transactions occurring after the balance sheet date in its financial statements, and the disclosures that an entity shall make about events or transactions that occurred after the balance sheet date. The Company has adopted certain provisions of ASC 855 as of June 30, 2009. As ASC 855 relates specifically to disclosures, the adoption of this standard had no impact on our consolidated financial condition, results of operations or cash flows.
In June 2009, the FASB issued guidance primarily contained in ASC topic 860, Transfers and Servicing. The updated guidance improves the relevance, representational faithfulness, and comparability of the information that a reporting entity provides in its financial reports about a transfer of financial assets; the effects of a transfer on its financial position, financial performance, and cash flows; and a transferor’s continuing involvement in transferred financial assets. ASC 860 is effective for fiscal and interim periods beginning after November 15, 2009. Earlier application is prohibited. Futhermore, the Company considered its pending adoption of ASC 860 upon entering into the new accounts receivable financing facility which is further discussed in Note 9—Accounts Receivable Financing Facility.
53
Table of Contents
In June 2009, the FASB issued guidance primarily contained in ASC topic 810, Consolidation. The updated guidance requires an enterprise to perform an analysis to determine whether the enterprise’s variable interests give it a controlling financial interest in a variable interest entity. ASC 810 is effective for fiscal and interim periods beginning after November 15, 2009. Earlier application is prohibited. The Company believes that the adoption of certain provisions of ASC 810 will not have a material impact on the consolidated financial statements.
In August 2009, the FASB issued ASU 2009-05, Measuring Liabilities at Fair Value. ASU 2009-05 amends ASC 820, Fair Value Measurements, by clarifying that when a quoted price in an active market for an identical liability is not available, an entity must measure fair value using one or more of the following techniques: i) the use of a quoted price of an identical liability when traded as an asset; ii) the use of quoted prices for a similar liability or similar liabilities when traded as an asset; and iii) an income approach such as a present value technique, or a market approach but which should, in all instances, maximize the use of relevant observable inputs and minimize the use of unobservable inputs. The Company adopted amendments to the Codification resulting from ASU 2009-05 on September 30, 2009. The adoption of certain provisions of ASC 820 did not have a material impact on our consolidated financial condition, results of operations or cash flows.
NOTE 4. Streamlining Expenses
Following is a summary of the streamlining programs (consisting of termination payments and other employee costs) outstanding as of December 31, 2009 (amounts in millions):
| 2009 Streamlining Programs |
||||
| Charges during the year of 2009 |
$ | 56.8 | ||
| Payments during the year of 2009 |
(24.5 | ) | ||
| Balance as of December 31, 2009 |
$ | 32.3 | ||
| 2008 Streamlining Programs |
||||
| Balance as of December 31, 2008 |
$ | 26.5 | ||
| Payments during the year of 2009 |
(11.5 | ) | ||
| Balance as of December 31, 2009 |
$ | 15.0 | ||
| 2007 and earlier Streamlining Programs |
||||
| Balance as of December 31, 2008 |
$ | 8.8 | ||
| Payments during the year of 2009 |
(4.1 | ) | ||
| Balance as of December 31, 2009 |
$ | 4.7 | ||
| Total Balance as of December 31, 2009 |
$ | 52.0 | ||
During 2009, WABCO incurred charges totaling $56.8 million related to streamlining activities, of which $37.0 million is included in cost of sales and $19.8 million is included in selling and administrative expenses. WABCO expects that approximately $14.0 million will be paid in 2010 on the remaining balance of $32.3 million related to 2009 programs.
During 2009, WABCO paid $11.5 million of cash on 2008 programs. WABCO expects that approximately $4.9 million will be paid in 2010 on the remaining balance of $15.0 million related to 2008 programs.
During 2009, WABCO paid $2.8 million of cash on 2007 programs and $1.3 million on earlier year programs. WABCO expects that approximately $4.0 million will be paid in 2010 on the remaining balance of $4.7 million related to 2007 and earlier programs.
Of the balance of $52.0 million, $20.3 million is included in other liabilities and $31.7 million is included in streamlining liabilities in the accompanying consolidated balance sheet.
During 2008, WABCO incurred charges totaling $36.9 million related to streamlining activities, of which $10.5 million is included in cost of sales and $26.4 million is included in selling and administrative expenses. The Company also eliminated temporary positions during 2008 which had no impact on future streamlining costs.
54
Table of Contents
During 2007, WABCO incurred charges totaling $12.8 million related to streamlining activities, of which $3.7 million is included in cost of sales and $9.1 million is included in selling and administrative expenses. These charges included $0.9 million related to 2006 plans, primarily related to severance and early retirement plans.
NOTE 5. Capital Stock
The Company’s Certificate of Incorporation authorizes the Company to issue up to 400,000,000 shares of common stock, par value $.01 per share and 4,000,000 shares of preferred stock, par value $.01 per share. As a result of the Distribution, there were 68,131,836 shares of WABCO common stock outstanding on August 1, 2007.
The Company paid dividends of $4.5 million in 2009, $18.3 million in 2008 and $9.6 million in 2007 on our common stock. Given the current state of the commercial vehicle industry and the pending decision by the European Commission on the civil fine discussed in Note 13—Warranties, Guarantees, Commitments and Contingencies, the Company has decided to suspend payment of further dividends.
The Company’s Board of Directors had approved $500 million of expenditures under a program to purchase shares of the Company’s common stock in the open market. During 2009, the Company did not repurchase any shares. As of December 31, 2009, the Company has no further authorization by the Board of Directors to repurchase shares as the previous approval of $500 million expired on September 1, 2009. Prior to expiration of the authorization, the Company had purchased $276.3 million of shares in prior periods.
The WABCO Holdings Inc. 2007 Omnibus Incentive Plan (the “2007 Omnibus Plan”), was formally adopted by our Board of Directors prior to the Distribution. The 2007 Omnibus Plan was replaced in May 2009 by the WABCO Holdings Inc. 2009 Omnibus Incentive Plan (the “2009 Omnibus Plan”) which was approved by the shareholders at the Annual Meeting of Shareholders. The 2009 Omnibus plan is intended to promote our long-term financial success and increase shareholder value by providing us with the flexibility to implement annual and long-term cash, equity and equity-based incentives. The 2009 Omnibus Plan is also intended to align the interests of our employees with the interests of our shareholders by affording them certain opportunities to acquire an interest in our stock. We believe that these incentives and opportunities will encourage our executives and other key employees to continue in our employment, by providing them with a competitive level of compensation that varies based on our performance. Under the 2009 Omnibus Plan, the Company may issue the following types of awards: stock options, stock appreciation rights (sometimes referred to as SARs), restricted stock, restricted shares, annual incentive awards and long-term incentive awards. The maximum number of shares or units that may be issued under the 2009 Omnibus Plan is 5,100,000. No participant shall be granted stock options, stock appreciation rights, or both with respect to more than 750,000 shares during any calendar year. No individual shall be granted restricted stock or restricted stock units, with respect to 200,000 shares or units as the case may be during any calendar year. If an award under either the 2007 Omnibus Plan or the 2009 Omnibus Plan expires or becomes unexercisable without having been exercised in full, or, with respect to full-value incentive awards, is forfeited to or repurchased by the Company, the unpurchased shares will become available for future grant or sale under the 2009 Omnibus Plan. At December 31, 2009, options to purchase a total of 1,726 shares, RSUs and restricted shares were outstanding and there were 5,147,528 shares remaining available for grant under the 2009 Omnibus Plan.
Trane historically issued its annual stock-based compensation grants to its employees during the first quarter of each year. During 2007 the annual grant was made by Trane and all options granted to WABCO employees were converted to WABCO options upon the Separation. These options, as well as any outstanding WABCO options held by Trane employees, as of July 31, 2007, have been reflected in the options outstanding balance on August 1, 2007.
At the date of Separation, equity awards totaling approximately $8.3 million, which includes $5.5 million founders’ grant consisting of stock options and RSUs for certain WABCO employees, $2.3 million in a combination of a founder’s grant and an initial equity award grant consisting of stock options and restricted stock units for the CEO, $0.1 million consisting of stock option and RSUs for the Board of Directors and an equity award of restricted shares of $0.4 million to the Board of Directors, has been granted. The value of the stock options and RSU awards are being expensed ratably over a 3 year period, commencing with the Separation. The value of the restricted shares of $0.4 million was fully expensed during the third quarter of 2007 as there is no vesting period associated with these shares.
55
Table of Contents
Information regarding the Company’s stock options since Separation is summarized below (amounts not in thousands):
| Shares underlying options | |||||||||||||||
| WABCO employees |
Trane employees |
Total | Weighted- Average Exercise Price |
Weighted Average Grant Date Fair Value | |||||||||||
| Options Outstanding December 31, 2007 |
874,292 | 3,804,074 | 4,678,366 | $ | 30.65 | ||||||||||
| Options Granted |
712,112 | — | 712,112 | $ | 42.43 | $ | 11.09 | ||||||||
| Options Exercised |
(15,739 | ) | (774,860 | ) | (790,599 | ) | $ | 27.24 | |||||||
| Options Forfeited |
(57,805 | ) | (186,137 | ) | (243,942 | ) | $ | 42.48 | |||||||
| Options Outstanding December 31, 2008 |
1,512,860 | 2,843,077 | 4,355,937 | $ | 32.53 | ||||||||||
| Options Granted |
3,123,932 | — | 3,123,932 | $ | 11.77 | $ | 2.77 | ||||||||
| Options Exercised |
(5,711 | ) | (32,910 | ) | (38,621 | ) | $ | 14.35 | |||||||
| Options Forfeited |
(135,549 | ) | (39,166 | ) | (174,715 | ) | $ | 28.29 | |||||||
| Options Outstanding December 31, 2009 |
4,495,532 | 2,771,001 | 7,266,533 | $ | 23.78 | ||||||||||
| Options Outstanding December 31, 2009, net of expected forfeitures |
4,484,657 | 2,770,389 | 7,255,046 | $ | 23.85 | ||||||||||
| Exercisable at end of period: |
|||||||||||||||
| Year ended December 31, 2009 |
698,141 | 2,694,530 | 3,392,671 | $ | 29.79 | ||||||||||
| RSUs Outstanding December 31, 2007 |
84,452 | ||||||||||||||
| RSUs Granted |
113,463 | — | $ | 42.47 | |||||||||||
| RSUs Vested |
(25,387 | ) | |||||||||||||
| RSUs Forfeited |
(10,729 | ) | — | ||||||||||||
| RSUs Outstanding December 31, 2008 |
161,799 | ||||||||||||||
| RSUs Granted |
412,240 | — | $ | 11.79 | |||||||||||
| RSUs Vested |
(60,319 | ) | — | ||||||||||||
| RSUs Forfeited |
(9,991 | ) | — | ||||||||||||
| RSUs Outstanding December 31, 2009 |
503,729 | ||||||||||||||
In 2008, a total of 712,112 options were granted of which 438,140 are exercisable in equal installments over a period of three years. Of the remaining 273,972 options granted in 2008, 136,986 of the options become exercisable after three years and 136,986 of the options become exercisable after four years. In 2009, a total of 3,123,932 options were granted of which 3,068,035 are exercisable in equal annual installments over a period of three years. Of the remaining 55,897 options granted in 2009, 36,887 of the options become exercisable after two years and 19,010 become exercisable after three years. In 2008, a total of 113,463 RSUs were granted of which 109,519 vest ratably over a period of three years. The remaining 3,944 RSUs will vest 66% after two years with the remaining 34% vesting after three years. All of the RSUs granted in 2009 vest ratably over a period of three years. The weighted average grant date fair value was calculated under the Black-Scholes option-pricing model.
The total aggregate intrinsic value of awards outstanding as of December 31, 2009 is $54.6 million. The total aggregate intrinsic value of options exercisable as of December 31, 2009 is $11.7 million. The total aggregate intrinsic value of options outstanding, less expected forfeitures, as of December 31, 2009 is $54.2 million. Aggregate intrinsic value is calculated by subtracting the exercise price of the option from the closing price of the Company’s common stock on December 31, 2009, multiplied by the number of shares per each option. In addition, the weighted average remaining contractual life of options outstanding as of December 31, 2009 is 7.6 years and the weighted average remaining contractual life of options outstanding, less expected forfeitures, as of December 31, 2009 is 7.5 years. The total intrinsic value of options exercised during the year ended December 31, 2009 was $0.2 million and the total fair value of shares vested during the same period was $5.2 million. The 4,377,591 of nonvested options and RSUs as of December 31, 2009 will result in the recognition of $16.3 million of compensation cost. This cost will be recognized over the weighted average period of 2.3 years. The weighted average remaining contractual life of the vested options as of December 31, 2009 is 3.7 years. The contractual life of all options is 10 years.
56
Table of Contents
The following table summarizes the significant assumptions used for the grants during the years ended December 31, 2009, 2008 and 2007.
| Assumption |
Year Ended December 31, 2009 |
Year Ended December 31, 2008 |
Year Ended December 31, 2007 |
||||||
| Risk-free interest rate |
1.86 | % | 2.77 | % | 4.50 | % | |||
| Expected volatility |
31.6 | % | 26.0 | % | 26.0 | % | |||
| Expected holding period |
5 Years | 5 Years | 5 Years | ||||||
| Expected forfeiture rate |
0.8 | % | 4.0 | % | 4.0 | % | |||
| Dividend yield |
2.45 | % | 0.66 | % | 0.57 | % |
On an annual basis, the Company updates the assumptions used in determination of the Black-Scholes values. The risk free interest rate is based on the yield of U.S. Treasury securities that correspond to the expected holding period of the options. WABCO reviewed the historic volatility of its common stock over a 24 month period, the common stock of its peer group over a five year period, and the implied volatility for at the money options to purchase shares of its common stock. The five year historical volatility period was selected since that period corresponds with the expected holding period. Based on this data, the Company chose to use a weighted average of the implied volatility of WABCO, the most recent two year historical volatility of WABCO and the median most recent three year historical volatility of WABCO’s peer group prior to the spin-off date. The expected holding period was calculated by reviewing the historical exercise pattern of all holders that were granted options and the exercise behavior of officers versus non-officers. The results of the analysis support one expected holding period for all groups of employees. The expected forfeiture rate was determined based on the historical stock option forfeiture data of the Company. The dividend yield was based on WABCO’s expected dividend rate for the period at the time of grant. Assumptions used for volatility, expected holding period and forfeiture rate were updated by the Company as of September 1, 2009 and will be used for grants in the following 12 months. The new assumptions for volatility to be used for future grants is 40.96%, for expected holding period is 5 years and for forfeiture rate is 2.0%. As of December 31, 2009, no new grants were issued using the new assumptions.
On December 17, 2007, Trane announced that it had entered into an agreement and plan of merger with Ingersoll-Rand and Indian Merger Sub, Inc., a wholly-owned subsidiary of Ingersoll-Rand (“Merger Sub”), providing for the acquisition of Trane by Ingersoll-Rand, a publicly traded company on the New York Stock Exchange. Subject to the terms and conditions of the Merger Agreement, Merger Sub merged with and into Trane, with Trane continuing as the surviving corporation and a wholly-owned subsidiary of Ingersoll-Rand. The merger was completed on June 5, 2008. Certain WABCO employees held Trane options at the time of merger. At the date of merger, those options immediately vested and the Company recognized the remaining unamortized compensation expense on those options of $0.5 million. Certain Trane employees continue to hold WABCO options that are not fully vested. There have been no changes to the original vesting schedules or terms of the WABCO options that continue to be held by Trane employees. The WABCO options will continue to be held by such employees with the original vesting schedules and will cause no additional accounting for the Company.
Following is a summary of net shares outstanding and shares issued or reacquired during the years ending December 31, 2009, 2008 and 2007.
| Number of Shares of Common Stock | ||||||||
| Total Shares |
Treasury Shares |
Net Shares Outstanding |
||||||
| Issued, July 31, 2007 |
68,131,836 | — | 68,131,836 | |||||
| Shares issued upon exercise of stock options |
960,752 | — | 960,752 | |||||
| Shares purchased for treasury |
— | (2,572,700 | ) | (2,572,700 | ) | |||
| Other shares issued or (reacquired), net |
8,321 | — | 8,321 | |||||
| Balance, December 31, 2007 |
69,100,909 | (2,572,700 | ) | 66,528,209 | ||||
| Shares issued upon exercise of stock options |
790,599 | — | 790,599 | |||||
| Shares purchased for treasury |
— | (3,384,106 | ) | (3,384,106 | ) | |||
| Other shares issued or (reacquired), net |
29,597 | — | 29,597 | |||||
| Balance, December 31, 2008 |
69,921,105 | (5,956,806 | ) | 63,964,299 | ||||
| Shares issued upon exercise of stock options |
38,621 | — | 38,621 | |||||
| Shares purchased for treasury |
— | — | — | |||||
| Other shares issued or (reacquired), net |
74,526 | — | 74,526 | |||||
| Balance, December 31, 2009 |
70,034,252 | (5,956,806 | ) | 64,077,446 | ||||
57
Table of Contents
The Company accounts for purchases of treasury stock under the cost method with the costs of such share purchases reflected in treasury stock in the accompanying condensed consolidated balance sheets. When treasury shares are reissued they are recorded at the average cost of the treasury shares acquired since the inception of the share buy back programs, net of shares previously reissued and the Company reflects the difference between the average cost paid and the amount received for the reissued shares in capital surplus. As of December 31, 2009, no shares have been reissued. As of December 31, 2009, the Company has no further authorization by the Board of Directors to repurchase shares as the previous approval of $500 million expired on September 1, 2009.
NOTE 6. Other Operating and Non-Operating (Income) / Expense, Net
Other expense was as follows:
| Year Ended December 31, | ||||||||||
| (Amounts in millions) |
2009 | 2008 | 2007 | |||||||
| Operating: |
||||||||||
| Separation related taxes |
$ | (4.3 | ) | $ | 8.4 | $ | 13.6 | |||
| Early redemption on bonds premium |
— | — | 6.0 | |||||||
| Other, net |
0.1 | 3.0 | 6.4 | |||||||
| $ | (4.2 | ) | $ | 11.4 | 26.0 | |||||
| Non-operating: |
||||||||||
| Minority interest expense |
— | 2.5 | 3.0 | |||||||
| Tax indemnification liabilities |
3.0 | — | — | |||||||
| Receivable discount fees |
0.5 | 1.2 | 1.8 | |||||||
| Losses on accounts receivable securitization program |
0.8 | — | 3.2 | |||||||
| Foreign exchange loss |
1.2 | 1.8 | 0.7 | |||||||
| Other, net |
(0.2 | ) | 1.3 | 0.9 | ||||||
| $ | 5.3 | $ | 6.8 | $ | 9.6 | |||||
NOTE 7. Inventories
The components of inventories, which are carried on a last-in, first-out (LIFO) basis, are as follows:
| Year Ended December 31, | ||||||
| (Amounts in millions) |
2009 | 2008 | ||||
| Finished products |
$ | 66.0 | $ | 75.1 | ||
| Products in process |
6.0 | 7.6 | ||||
| Raw materials |
83.3 | 80.0 | ||||
| Inventories at cost |
$ | 155.3 | $ | 162.7 | ||
The current replacement cost approximated the LIFO carrying cost for 2009 and 2008.
NOTE 8. Facilities
The components of facilities, at cost, are as follows:
| Year Ended December 31, | ||||||
| (Amounts in millions) |
2009 | 2008 | ||||
| Land |
$ | 16.9 | $ | 16.0 | ||
| Buildings |
170.9 | 145.6 | ||||
| Machinery and equipment |
505.6 | 500.7 | ||||
| Improvements in progress |
59.3 | 26.2 | ||||
| Gross facilities |
752.7 | 688.5 | ||||
| Less: accumulated depreciation |
384.5 | 372.7 | ||||
| Net facilities |
$ | 368.2 | $ | 315.8 | ||
58
Table of Contents
Depreciation expense for owned assets and assets under capital leases for the years ended December 31, 2009, 2008 and 2007 was $69.0 million, $69.5 million and $63.6 million, respectively.
NOTE 9. Accounts Receivable Financing Facility
On January 12, 2009, the accounts receivable financing facility, which was entered into in the second quarter of 2008, was terminated by ABN/Royal Bank of Scotland (RBS) due to the downgrade of RBS by S&P. That agreement had provided for the financing of up to €150 million of receivables, which was not subject to the trailing four quarters adjusted EBITDA covenant described below.
On September 23, 2009, the Company established a new accounts receivable financing facility (the “Receivables Facility”) with Société Générale Bank Nederland N.V. The maximum funding from receivables that may be sold into the Facility will be €100 million ($143.4 million at December 31, 2009 exchange rates); however, there can be no assurance that the participating sellers will generate sufficient receivables to access the maximum availability. The term of the Receivables Facility is for one year, with the possibility of four additional annual extensions, assuming the Company and the participating sellers are in compliance with the applicable covenants. As of December 31, 2009, the funding that would have been available under this program, if utilized, was approximately €35 million ($50 million at December 31, 2009 exchange rates).
On April 15, 2009, the Company entered into a €35 million factoring program in respect to accounts receivable from one of our customers. As of December 31, 2009, the funding that would have been available under this program, if utilized, was approximately €19 million ($27 million at December 31, 2009 exchange rates).
NOTE 10. Goodwill
The following table summarizes the changes in the carrying amount of goodwill for the years ended December 31, 2009 and 2008.
| Year Ended December 31, |
|||||||
| (Amounts in millions) |
2009 | 2008 | |||||
| Balance of goodwill, beginning of year |
$ | 360.8 | $ | 376.8 | |||
| Acquisitions (See Note 19) |
26.2 | — | |||||
| Foreign exchange translation |
12.4 | (16.0 | ) | ||||
| Balance of goodwill, end of year |
$ | 399.4 | $ | 360.8 | |||
NOTE 11. Retirement Benefits
WABCO employees participate in a number of benefit plans. The plans include a 401(k) savings plan (the “Savings Plan”) for the Company’s U.S. salaried and hourly employees, and a pension plan for certain U.S. salaried and hourly employees. The Savings Plan is an individual-account defined contribution plan. WABCO employees in certain countries, primarily Germany, the United Kingdom, France and Switzerland participate in defined benefit plans sponsored by local WABCO legal entities. In addition, certain WABCO employees in Brazil receive post-retirement health-care benefits.
Further, WABCO has assumed responsibility for certain retiree medical plans in the U.S. and a pension plan in Germany relating to former employees of Trane’s Bath & Kitchen division.
Benefits under defined benefit pension plans on a worldwide basis are generally based on years of service and either employee’s compensation during the last years of employment or negotiated benefit levels.
WABCO recognizes in its statement of financial position an asset for a defined benefit post-retirement plan’s overfunded status or a liability for a plan’s underfunded status.
59
Table of Contents
The following table provides a reconciliation of the changes in pension and retirement health and life insurance benefit obligations and fair value of assets for the years ending December 31, 2009 and 2008, and a statement of the funded status as of December 31, 2009 and 2008:
| 2009 | 2009 | 2008 | 2008 | |||||||||||||
| (Amounts in millions) |
Health & Life Ins. Benefits |
Pension Benefits |
Health & Life Ins. Benefits |
Pension Benefits |
||||||||||||
| Reconciliation of benefit obligation: |
||||||||||||||||
| Obligation at beginning of year |
$ | 22.7 | $ | 428.6 | $ | 24.9 | $ | 489.1 | ||||||||
| Service cost |
— | 7.7 | 0.4 | 7.7 | ||||||||||||
| Interest cost |
1.0 | 24.6 | 1.6 | 26.1 | ||||||||||||
| Participant contributions |
1.3 | 0.3 | 1.3 | 0.3 | ||||||||||||
| Plan amendments |
(5.2 | ) | 1.4 | — | — | |||||||||||
| Actuarial loss / (gain) |
1.2 | 40.4 | (0.2 | ) | (18.8 | ) | ||||||||||
| Incremental separation liability |
— | — | — | 0.8 | ||||||||||||
| Benefit payments |
(3.8 | ) | (29.3 | ) | (3.8 | ) | (30.3 | ) | ||||||||
| Foreign exchange effects |
1.0 | 17.2 | (1.5 | ) | (46.3 | ) | ||||||||||
| Other |
— | (0.8 | ) | — | — | |||||||||||
| Obligation at end of year |
$ | 18.2 | $ | 490.1 | $ | 22.7 | $ | 428.6 | ||||||||
| Reconciliation of fair value of plan assets: |
||||||||||||||||
| Fair value of plan assets at beginning of year |
$ | — | $ | 110.6 | $ | — | $ | 158.2 | ||||||||
| Actual return on assets |
— | 16.4 | — | (13.3 | ) | |||||||||||
| Employer contributions |
2.5 | 27.0 | 2.5 | 28.5 | ||||||||||||
| Participant contributions |
1.3 | 0.3 | 1.3 | 0.3 | ||||||||||||
| Benefit payments |
(3.8 | ) | (29.3 | ) | (3.8 | ) | (30.3 | ) | ||||||||
| Foreign exchange effects |
— | 10.7 | — | (31.9 | ) | |||||||||||
| Other expenses |
— | (2.6 | ) | — | (0.9 | ) | ||||||||||
| Fair value of plan assets at end of year |
$ | — | $ | 133.1 | $ | — | $ | 110.6 | ||||||||
| Funded Status at December 31 |
$ | (18.2 | ) | $ | (357.0 | ) | $ | (22.7 | ) | $ | (318.0 | ) | ||||
| Amounts Recognized in the Balance Sheet: |
||||||||||||||||
| Current liabilities |
(2.3 | ) | (17.3 | ) | (2.4 | ) | (18.4 | ) | ||||||||
| Noncurrent liabilities |
(15.9 | ) | (339.7 | ) | (20.3 | ) | (299.6 | ) | ||||||||
| Net amounts recognized in Balance Sheet: |
$ | (18.2 | ) | $ | (357.0 | ) | $ | (22.7 | ) | $ | (318.0 | ) | ||||
| Cumulative Amounts Recognized in Other Comprehensive Income consists of: |
||||||||||||||||
| Prior Service Cost |
$ | 0.2 | $ | 0.3 | $ | 0.3 | $ | 0.3 | ||||||||
| Net actuarial loss |
7.5 | 63.6 | 8.5 | 25.7 | ||||||||||||
| Total (before tax effects) |
$ | 7.7 | $ | 63.9 | $ | 8.8 | $ | 26.0 | ||||||||
| Adjustments to post-retirement benefits accrual recognized in OCI: |
||||||||||||||||
| Change in Other Comprehensive Income due to experience |
0.8 | 35.5 | (1.2 | ) | 2.5 | |||||||||||
| Gross adjustments to post-retirement benefits accrual recognized in OCI (net of deferred tax of $10.4 in 2009 and $0.5 in 2008) |
$ | 0.8 | $ | 35.5 | $ | (1.2 | ) | $ | 2.5 | |||||||
60
Table of Contents
The following table provides a summary of pension plans with accumulated benefit obligations in excess of assets as of December 31:
| 2009 | 2008 | |||||
| (Amounts in millions) |
Foreign Pension Plans |
Foreign Pension Plans | ||||
| For all plans: |
||||||
| Accumulated benefit obligation |
$ | 453.5 | $ | 397.6 | ||
| For pension plans with Accumulated Benefit Obligations in excess of plan assets: |
||||||
| Projected benefit obligation |
$ | 327.5 | $ | 325.8 | ||
Total post-retirement costs are shown below:
| Year ended December 31, | |||||||||
| (Amounts in millions) |
2009 | 2008 | 2007 | ||||||
| Foreign pensions |
$ | 27.6 | $ | 25.9 | $ | 26.7 | |||
| Health & Life insurance benefits (Americas) |
1.3 | 2.4 | 2.2 | ||||||
| Defined contribution plan cost, principally Savings Plan |
— | — | 0.2 | ||||||
| Total post-retirement costs, including accretion expense |
$ | 28.9 | $ | 28.3 | $ | 29.1 | |||
Components of post-retirement costs are broken out in the tables below:
Pension Benefit Costs
| Year ended December 31, | ||||||||||||
| (Amounts in millions) |
2009 Pensions |
2008 Pensions |
2007 Pensions |
|||||||||
| Service cost-benefits earned during period |
$ | 7.7 | $ | 7.7 | $ | 9.7 | ||||||
| Interest cost on projected benefit obligation |
24.6 | 26.1 | 21.7 | |||||||||
| Less assumed return on plan assets |
(5.4 | ) | (9.2 | ) | (8.9 | ) | ||||||
| Amortization of prior service cost |
0.1 | 0.1 | 0.3 | |||||||||
| Amortization of net loss |
0.6 | 1.2 | 3.9 | |||||||||
| Net defined benefit plan cost after curtailments |
$ | 27.6 | $ | 25.9 | $ | 26.7 | ||||||
Other Post-Retirement Benefit Costs
| (Amounts in millions) |
2009 Health & Life Ins. Benefits |
2008 Health & Life Ins. Benefits |
2007 Health & Life Ins. Benefits | ||||||
| Interest and service cost on projected benefit obligation |
$ | 1.0 | $ | 2.0 | $ | 1.6 | |||
| Amortization of net loss |
0.3 | 0.4 | 0.6 | ||||||
| Defined benefit plan cost |
$ | 1.3 | $ | 2.4 | $ | 2.2 | |||
Amortization of prior service cost is computed on the straight-line method over the average remaining service period of active participants.
Major assumptions used in determining the benefit obligation and net cost for post-retirement plans are presented below as weighted averages:
| Benefit Obligation at December 31, |
2009 Health & Life Ins. benefits |
2009 Foreign Pension Plans |
2008 Health & Life Ins. Benefits |
2008 Foreign Pension Plans |
||||||||
| Discount rate |
5.33 | % | 5.26 | % | 6.59 | % | 5.75 | % | ||||
| Salary growth |
N/A | 3.22 | % | N/A | 3.18 | % | ||||||
| Net Periodic Pension Cost for the year |
||||||||||||
| Discount rate |
5.25 | % | 5.76 | % | 6.59 | % | 5.71 | % | ||||
| Salary growth |
N/A | 3.18 | % | N/A | 3.29 | % | ||||||
| Expected return on plan assets |
N/A | 6.17 | % | N/A | 7.02 | % |
61
Table of Contents
The discount rate assumption in this chart changed from 2008 to 2009, resulting in a significant change in the pension benefit obligation. In the chart above that reconciles the change in benefit obligations for the year, the impact of the discount rate change is included in the actuarial gain line item.
The assumed rate of return is a long-term investment return that takes into account the major categories of assets held by the plan and expected returns for each major category of assets. Return expectations reflect forward-looking analysis as well as historical experience.
WABCO’s asset management strategy focuses on maintaining a diversified portfolio using various major categories of assets to generate attractive returns while managing risk. The Company periodically reviews its target asset allocations for a given plan to ensure it aligns with the asset management strategy. In determining the target asset allocation for a given plan, consideration is given to the nature of its liabilities, and portfolios are periodically rebalanced with reference to the target level.
| Asset Allocation |
2009 | 2008 | 2009 Target |
2008 Target |
||||||||
| Equity securities |
23 | % | 21 | % | 24 | % | 24 | % | ||||
| Corporate debt securities |
70 | % | 73 | % | 71 | % | 71 | % | ||||
| Other, including real estate |
7 | % | 6 | % | 5 | % | 5 | % |
The 2009 target asset allocation was in line with the 2008 target allocation. The Company adjusted the allocations in the first quarter of 2008. The Company will continue to move towards these revised asset allocations in 2010.
All assets are measured at the current fair value. The Company determines fair value for each major category of assets in its entirety using quoted prices in active markets for identical assets (Level 1). The Company has not changed the valuation techniques and inputs used during the periods presented. The fair values for each major category of assets are presented below:
| (Amounts in millions) |
2009 | 2008 | ||||
| Equity securities |
$ | 30.6 | $ | 23.2 | ||
| Corporate debt securities |
$ | 93.2 | $ | 80.7 | ||
| Other, including real estate |
$ | 9.3 | $ | 6.7 | ||
| Total fair value of plan assets |
$ | 133.1 | $ | 110.6 | ||
WABCO makes contributions to funded pension plans that at a minimum, meet all statutory funding requirements. Contributions in 2009, including payment of benefits incurred by unfunded plans, totaled $29.1 million. Contributions in 2010 are expected to be in line with the contributions made during 2009.
Expected future benefit payments are shown in the table below:
| (Amounts in millions) |
2010 | 2011 | 2012 | 2013 | 2014 | 2015-2019 | ||||||||||||
| Domestic plans without subsidy |
$ | 2.4 | $ | 2.4 | $ | 2.3 | $ | 2.2 | $ | 2.0 | $ | 7.6 | ||||||
| Medicare D subsidy reimbursements |
$ | 0.1 | $ | 0.1 | $ | 0.1 | $ | 0.1 | $ | 0.1 | $ | 0.2 | ||||||
| Foreign pension plans |
$ | 29.0 | $ | 28.7 | $ | 29.4 | $ | 29.6 | $ | 30.3 | $ | 159.5 | ||||||
The weighted average annual assumed rate of increase in the health care cost trend rate was 8.4% in 2008, 8.5% for 2009 and is assumed to decrease to 7.5% in 2010 and gradually decline to 4.75% by 2018. The health care cost trend rate assumption has the following effect:
| (Amounts in millions) |
1% Increase | 1% Decrease | |||||
| Effect on the health care component of accumulated post-retirement obligation |
$ | 1.5 | $ | (1.4 | ) | ||
| Effect on total of service and interest cost components of net periodic post-retirement health care benefit costs |
$ | 0.1 | $ | (0.1 | ) | ||
62
Table of Contents
NOTE 12. Debt
Credit Agreements
On May 31, 2007, WABCO entered into an unsecured, five-year $800 million, multi-currency revolving credit facility that will expire on July 31, 2012. This is our principal bank credit facility, and it became available to us on August 1, 2007. The proceeds of the borrowings under the principal credit facility have been used to fund historical repurchases of our shares, pay historical quarterly dividends to our shareholders and to meet short-term cash requirements. Additionally, the facility may be used to pay a fine or provide a bank guarantee that may be required pursuant to a decision relating to the European Commission investigation matter as further described in Note 13 under the heading “Contingencies.” Up to $100 million under this facility may be used for issuing letters of credit, of which $97.6 million was unused as of December 31, 2009, and up to $75 million for same-day borrowings. The balance outstanding on this facility as of December 31, 2009, was $154.0 million. The Company has the possibility to borrow (subject to the covenant restrictions discussed below) an additional $643.6 million under this facility. The Company pays a facility fee of 0.10% per annum. Borrowings thereunder bear interest generally at the London Interbank Offered Rate (“LIBOR”) plus either 0.35% if borrowings are less than or equal to 50% of the total available balance, or 0.40% if borrowings are greater than 50% of the total available balance. The Company also pays 0.35% per annum plus issuance fees for letters of credit. The interest rate spreads above the U.S. dollar LIBOR (0.23531% at December 31, 2009) are subject to adjustments should the Company’s leverage ratio change. The Company intends to replace all or some portion of the existing five-year $800 million credit facility at the time of its expiration.
In November 2007, WABCO entered into a €50 million, 364 day credit agreement with the Bank of Tokyo-Mitsubishi. In April 2008, the Company obtained an amendment, extending the maturity date by six months. In November 2008, €50 million was drawn under the agreement. The Company redeemed the outstanding debt of €50 million ($63.5 million), and terminated the credit agreement on February 26, 2009.
In March 2008, WABCO entered into an unsecured, 364 day €100 million credit facility with Rabobank. As a result of the draw down on July 31, 2008, the 364 day €100.0 million credit facility with Rabobank had an expiration date of July 30, 2009. In July 2008, the Company entered into a cross currency swap to hedge the changes in the fair value of its €100.0 million loan from Rabobank relating to changes in foreign currency exchange rates between the euro and U.S. dollar. The Company did not renew this cross currency swap on July 30, 2009, given its decision not to renew the 364 day €100 million credit facility previously entered into with Rabobank which expired and was repaid on July 30, 2009 by a drawdown under the five year revolving credit facility.
Our principal credit facility contains various covenants that limit, among other things, liens, transactions, subsidiary indebtedness, and certain mergers and sales of assets. The covenants also require the Company to meet certain financial tests: a rolling four quarters 3 to 1 ratio of consolidated net debt to consolidated trailing four quarters adjusted EBITDA (earnings before interest, taxes, depreciation and amortization adjusted for certain items), a 3 to 1 ratio of consolidated trailing four quarters adjusted EBITDA to consolidated net interest expense, and a liquidity test. The liquidity covenant requires us to have at least $100 million of liquidity (which includes unused commitments under the agreement and certain other committed facilities that may be entered into, as well as unrestricted cash and cash equivalents) after giving effect to any payment of a fine or any provision of a bank guarantee that may be required pursuant to a decision relating to the European Commission investigation matter. As of December 31, 2009, our trailing four quarters adjusted EBITDA is $104.8 million, which consists of $46.4 million for the fourth quarter, $30.4 million for the third quarter, $9.1 million for the second quarter and $18.9 million for the first quarter. Our net indebtedness was $67.2 million at December 31, 2009, resulting in an EBITDA covenant ratio of 0.6 to 1. Given our total indebtedness (including guarantees) at December 31, 2009 we had the ability to borrow an incremental $148 million within the covenants of our principal credit facility. Prior quarter amounts were adjusted on a pro-forma basis to retroactively reflect the sale of Sundaram Clayton Ltd. and the additional investment in WABCO-TVS Ltd. As of December 31, 2009, the Company was in compliance with all the covenants contained in its credit agreements.
Also, subsidiaries in India, Spain and Brazil had borrowings from banks totaling $2.1 million of which $1.7 million is classified as short term and $0.4 as long term. These loans support local working capital requirements.
63
Table of Contents
NOTE 13. Warranties, Guarantees, Commitments and Contingencies
Warranties
Following is a summary of changes in the WABCO’s product warranty liability for the three years ended December 31, 2009, 2008 and 2007:
| Year Ended December 31, | ||||||||||||
| (Amounts in millions) |
2009 | 2008 | 2007 | |||||||||
| Balance of warranty costs accrued, beginning of year |
$ | 57.8 | $ | 54.0 | $ | 40.5 | ||||||
| Warranty costs accrued |
23.2 | 32.5 | 38.6 | |||||||||
| Warranty claims settled |
(35.9 | ) | (25.7 | ) | (30.5 | ) | ||||||
| Foreign exchange translation effects |
0.7 | (3.0 | ) | 5.4 | ||||||||
| Balance of warranty costs accrued, end of year |
45.8 | 57.8 | 54.0 | |||||||||
| Current portion included in current liabilities |
(43.1 | ) | (54.2 | ) | (49.7 | ) | ||||||
| Long-term warranty liability |
$ | 2.7 | $ | 3.6 | $ | 4.3 | ||||||
Guarantees and Commitments
Future minimum rental commitments under all non-cancelable operating leases with original terms in excess of one year in effect at December 31, 2009, are: $14.4 million in 2010; $8.1 million in 2011; $6.7 million in 2012; $4.3 million in 2013; $3.6 million in 2014 and $2.5 million thereafter, a total of $39.6 million. Net rental expense for all operating leases was $15.3 million, $15.9 million and $13.8 million for the years ended December 31, 2009, 2008 and 2007, respectively. As of December 31, 2009, the Company has bank guarantees for $11.1 million of which $5.8 million is related to tax litigation, $2.4 million is related to letters of credit and $2.9 million of other items.
Contingencies
General
We are subject to proceedings, lawsuits and other claims related to products and other matters. We are required to assess the likelihood of any adverse judgments or outcomes to these matters as well as potential ranges of probable losses. A determination of the amount of liability to be recorded, if any, for these contingencies is made after careful analysis of each individual issue. The liabilities recorded may change in the future, possibly by significant amounts, due to new developments in any of the matters.
Litigation
As part of a multi-company investigation commenced in 2004, the former American Standard Companies Inc. (now Trane Inc.), and certain of its European subsidiaries engaged in the Bath and Kitchen business were charged by the European Commission for alleged infringements of European Union competition rules relating to the distribution of bathroom fixtures and fittings in a number of European countries. Pursuant to the Indemnification and Cooperation Agreement that was concluded in the context of the spin-off of WABCO from Trane Inc., WABCO Europe BVBA (an indirect wholly-owned subsidiary of WABCO) is responsible for, and is liable to indemnify Trane Inc. and Ideal Standard International (representing the successor to the Bath and Kitchen business, and owner of certain of the former American Standard subsidiaries) and their owners against, any fines related to this investigation.
We anticipate that this investigation may result in the imposition of a fine in 2010; however, we are unable to reasonably estimate the likely amount or range of any fine that may result from this matter for the reasons that follow. Under its 2006 Fining Guidelines, the Commission will determine a “basic amount” of the fine by considering the value of the sales of goods to which the infringement related, the gravity of the infringement and its duration. In applying the 2006 Guidelines, the Commission retains considerable discretion in calculating the fine, including the determination of the “basic amount,” the evaluation of the aggravating and mitigating circumstances, the availability of leniency and the assessment of the overall deterrent effect of the fine. Due to the specific circumstances, and the factual differences of and with published precedents so far, there is insufficient guidance to allow us to ascertain how the Commission would exercise its discretion in applying the 2006 Guidelines in the present case. If the Commission were to apply the 2006 Guidelines to the allegations as set forth in the Statement of Objections, the fine could be significant depending on
64
Table of Contents
whether the breadth of the allegations and the alleged duration of the infringement are maintained. American Standard and its charged European businesses presented defenses to the allegations in the Statement of Objections, as did WABCO Europe BVBA at an oral hearing with the European Commission in November 2007. It is not possible to judge the impact of these defenses on the final outcome. We would be required to pay a fine within three months of the decision, unless we filed an appeal within two months of the decision, in which case we would be required to pay the fine or to provide a bank guarantee for the full amount of the fine plus interest. The appeals process could take as long as five to seven years during which time WABCO would not have access to such funds or would be required to provide a bank guarantee. The Commission or the General Court (previously known as the Court of First Instance) could agree to waive or suspend this requirement for reasons of financial hardship; however, this outcome cannot be assured and will depend on the relevant facts at the time.
Article 23 of Council Regulation No. 1/2003 provides for a maximum fine equal to 10% of the parent company’s worldwide revenue attributable to all of its products for the fiscal year prior to the year in which the fine is imposed. It is unknown on what basis the Commission will calculate the maximum. As we have previously reported, if the Commission had issued a fine in 2007 and based it on American Standard’s reported worldwide revenue in 2006, the total potential maximum liability would have been approximately $1.1 billion subject to a probable reduction for leniency of at least 20%. American Standard no longer exists. The effect, if any, of the spin-off of WABCO from American Standard, the sale of its Bath and Kitchen business to Ideal Standard International, and the merger of Trane Inc. with Ingersoll-Rand Company Limited, all of which occurred in 2007 and 2008, on the determination of the applicable 10% cap is unclear. Furthermore, we have argued that the cap should be calculated on the basis of the revenue of the charged European businesses, rather than the parent company’s worldwide revenues.
The fine imposed by the Commission could be material to WABCO’s operating results and cash flows for the year in which the liability would be recognized or the fine paid. We are continuing to fully cooperate with the Commission and believe the defenses we have presented to the Commission will be considered and taken into account in the determination of the fine.
As of December 31, 2009, the Company has a cash balance of $350.2 million. The Company’s $800 million five-year revolving credit facility is a non-amortizing facility. There is a balance of $154.0 million outstanding under our principal credit facility. Our principal credit facility contains covenants which limit our ability to access the funds available under the facility. Due to current economic conditions, the covenant which is most restrictive requires that our total net indebtedness does not exceed three times a trailing four quarters adjusted EBITDA (“EBITDA covenant”), as defined in the agreement to the five year $800 million credit facility. As of December 31, 2009, our trailing four quarters adjusted EBITDA was $104.8 million, which consists of $46.4 million for the fourth quarter, $30.4 million for the third quarter, $9.1 million for the second quarter and $18.9 million for the first quarter. Our net indebtedness was $67.2 million at December 31, 2009, resulting in an EBITDA covenant ratio of 0.6 to 1. Given our total indebtedness (including guarantees) at December 31, 2009 we had the ability to borrow an incremental $148 million within the covenants of our principal credit facility.
As described in more detail in Note 9, Accounts Receivable Financing Facility, on September 23, 2009, the Company established a new accounts receivable financing facility with Société Générale Bank Nederland N.V (the “Receivables Facility”). The maximum funding from receivables that may be sold into the Receivables Facility will be €100 million; however, there can be no assurance that the participating sellers will generate sufficient receivables to access the maximum availability. The term of the Receivables Facility is for one year, with the possibility of four additional annual extensions, assuming the Company and the participating sellers are in compliance with certain covenants. As of December 31, 2009, the funding that would have been available under this program, if utilized, was approximately €35 million ($50 million at December 31, 2009 exchange rates).
On April 15, 2009, the Company entered into a €35 million factoring program in respect to accounts receivable from one of our customers. As of December 31, 2009, the funding that would have been available under this program, if utilized, was approximately €19 million ($27 million at December 31, 2009 exchange rates).
Other potential sources of financing that the Company is considering include, but are not limited to: (i) other accounts receivable factoring programs, (ii) sale-leaseback of certain property, plant and equipment, (iii) supply chain financing and (iv) accessing capital markets. If necessary, we may also seek to obtain a waiver or renegotiate the debt covenants on our primary credit facility.
65
Table of Contents
If the Commission were to issue a fine in excess of our funding capability, we intend to seek approval from the Commission for alternative payment measures, such as installment payments or a suspension of the payment obligation, which we are advised is available in cases of extreme hardship and substantiated financial difficulties. It is our understanding that it is not in the Commission’s interest, nor is it their intention, to force companies out of business due to fine payments, and we believe that the Commission will be sensitive to the current economic conditions. However, this outcome cannot be assured due to the degree of discretion inherent in the Commission’s fining and enforcement powers. The current economic conditions require us to observe that if the fine were to be issued in an amount in excess of our funding capability, and various mitigating actions which the Company has implemented and is planning were to fail, the fine could have a material adverse effect on the financial condition and liquidity of WABCO. See also Item 1A. Risk Factors.
In conjunction with the Tax Sharing Agreement, as further discussed in Note 15, Tax and Indemnification Liabilities Transferred from Trane to WABCO, in Notes to the Consolidated Financial Statements, WABCO is responsible for certain tax and indemnification liabilities. These liabilities include indemnifications to Trane of $39.5 million related to the non-U.S. entities of Trane’s Bath & Kitchen business. The unrecognized tax benefits of $80.2 million discussed further within Note 14-Income Taxes, includes $19.8 million of unrecognized tax benefits related to Trane’s Bath & Kitchen business for which WABCO has obligations directly to tax authorities.
NOTE 14. Income Taxes
Income before income taxes and the applicable provision for income taxes were:
| Year Ended December 31, | ||||||||||
| (Amounts in millions) |
2009 | 2008 | 2007 | |||||||
| Income before income taxes: |
||||||||||
| Domestic |
$ | 52.5 | $ | 9.1 | $ | 16.1 | ||||
| Foreign |
(44.5 | ) | 242.4 | 220.6 | ||||||
| $ | 8.0 | $ | 251.5 | $ | 236.7 | |||||
| Provision / (benefit) for income taxes: |
||||||||||
| Current: |
||||||||||
| Domestic |
$ | 5.0 | $ | 0.3 | $ | 46.9 | ||||
| Foreign |
5.3 | 33.0 | 45.5 | |||||||
| 10.3 | 33.3 | 92.4 | ||||||||
| Deferred: |
||||||||||
| Domestic |
— | — | 0.1 | |||||||
| Foreign |
(21.0 | ) | 4.9 | 18.8 | ||||||
| (21.0 | ) | 4.9 | 18.9 | |||||||
| Total (benefit) / provision |
$ | (10.7 | ) | $ | 38.2 | $ | 111.3 | |||
A reconciliation between the actual income tax expense provided and the income taxes computed by applying the statutory federal income tax rate of 35% in 2009, 2008 and 2007 to the income before income taxes is as follows:
| Year Ended December 31, | ||||||||||||
| (Amounts in millions) |
2009 | 2008 | 2007 | |||||||||
| Tax provision at statutory rate |
$ | 2.8 | $ | 88.0 | $ | 82.9 | ||||||
| Separation related taxes and contingencies |
5.2 | (8.9 | ) | 50.7 | ||||||||
| Foreign earnings taxed at other than 35%, net of valuation allowance |
(10.7 | ) | (54.9 | ) | (31.4 | ) | ||||||
| Change in tax rates |
— | (0.1 | ) | 10.2 | ||||||||
| Tax contingencies |
3.3 | 11.4 | 9.4 | |||||||||
| Benefit of tax audit settlements |
(14.8 | ) | — | (7.5 | ) | |||||||
| Equity Compensation |
4.0 | 2.8 | 1.3 | |||||||||
| Other, net |
(0.5 | ) | (0.1 | ) | (4.3 | ) | ||||||
| Total provision |
$ | (10.7 | ) | $ | 38.2 | $ | 111.3 | |||||
66
Table of Contents
The effective income tax rates for 2009 and 2008 were (133.9%) and 15.2%, respectively. The income tax benefit for 2009 includes a net benefit of $13.0 million, principally related to the release of tax accruals as a consequence of the settlement of a foreign tax audit. The income tax provision for 2008 includes a net benefit of $8.3 million, principally related to a reduction of an unrecognized tax benefit recorded in the third quarter of 2007 related to the separation of the WABCO business from Trane. This change in estimate resulted from the filing of the Company’s and Trane’s 2007 U.S. Federal income tax returns in September 2008. Changes in U.S. or foreign tax laws or rulings may have a significant impact on our effective tax rate.
The approximate dollar and diluted earnings per share amounts of tax reductions related to tax holidays and incentive tax credits in various countries in which the Company does business were $1.2 million and $0.02 in 2009, $4.3 million and $0.07 in 2008 and $5.1 million and $0.07 in 2007, respectively. The tax holidays and incentive tax credits expire at various dates through 2017.
The following table details the gross deferred tax liabilities and assets and the related valuation allowances:
| Year Ended December 31, |
||||||||
| (Amounts in millions) |
2009 | 2008 | ||||||
| Deferred tax liabilities: |
||||||||
| Basis difference in minority interest |
$ | 12.4 | $ | 22.0 | ||||
| Employee benefits |
— | 18.9 | ||||||
| Facilities (accelerated depreciation, capitalized interest and purchase accounting differences) |
19.4 | 13.8 | ||||||
| Inventory (LIFO) |
1.2 | 2.9 | ||||||
| Intangibles |
5.6 | — | ||||||
| Other |
2.9 | 6.2 | ||||||
| $ | 41.5 | $ | 63.8 | |||||
| Deferred tax assets: |
||||||||
| Foreign net operating losses and tax credits |
204.9 | 127.8 | ||||||
| Valuation allowances |
(169.5 | ) | (113.1 | ) | ||||
| Post-retirement and other employee benefits |
22.7 | 31.6 | ||||||
| Intangibles |
10.4 | 15.3 | ||||||
| Inventory |
— | 0.3 | ||||||
| Warranties |
1.9 | 0.7 | ||||||
| Other |
6.2 | 8.0 | ||||||
| 76.6 | 70.6 | |||||||
| Net deferred tax assets |
$ | 35.1 | $ | 6.8 | ||||
At December 31, 2009, the Company has $601.5 million of net operating loss carry forwards (NOLs) available for utilization in future years. Approximately $498.7 million of such NOLs have an unlimited life and the remainder is available for periods of five to fifteen years. As of December 31, 2009, the Company has provided a full valuation allowance of $169.5 million representing the value of the associated deferred tax asset with regard to the $498.7 million of unlimited life NOLs. These NOLs consist of NOLs inherited by WABCO upon separation from Trane as well as losses incurred in post-spin years (2008 and 2009). The tax authorities had challenged a significant portion of these NOLs on the basis that they should be reduced by dividends received. However, in response to a favorable judgment by the European Court of Justice in 2009 for another taxpayer, the tax authorities have issued a general administrative ruling conceding that a taxpayer’s NOLs should not be reduced by dividends received. Therefore, the amount of the NOLs is no longer uncertain and these previously contested NOLs remain on the balance sheet with a full valuation allowance.
At December 31, 2009, we had unrecognized tax benefits of $80.2 million, all of which, if recognized, would impact the effective tax rate, comprised of $60.5 million related to the WABCO business and $19.7 million related to WABCO obligations to tax authorities for Trane’s Bath & Kitchen business (see Note 15). The Company believes that it is reasonably possible that a portion of such unrecognized tax benefits would be recognized in the next 12
67
Table of Contents
months. As a result, $69.8 million of the unrecognized tax benefits at December 31, 2009 are classified as long-term tax liabilities and $10.4 million are classified as short-term tax liabilities. Interest related to unrecognized tax benefits recorded in the 2009 and 2008 consolidated statement of income were $3.8 million and $3.6 million, respectively. Total accrued interest at December 31, 2009 and December 31, 2008 was approximately $5.7 million, and $6.9 million, respectively. The Company recognizes interest and penalties accrued related to unrecognized tax benefits in income tax expense, however no penalties have been accrued related to these unrecognized tax positions as it is more likely than not that such penalties should not be imposed.
A reconciliation of the beginning and ending balances of unrecognized tax benefits is as follows (exclusive of interest):
| Year Ended December 31, |
||||||||
| (Amounts in millions) |
2009 | 2008 | ||||||
| Beginning balance, January 1 |
$ | 87.2 | $ | 91.7 | ||||
| Additions for tax positions related to current year |
13.5 | 7.9 | ||||||
| Reductions for tax positions related to current year |
— | (9.9 | ) | |||||
| Settlements |
(28.3 | ) | — | |||||
| Foreign exchange |
2.1 | (2.5 | ) | |||||
| Ending balance, December 31 |
$ | 74.5 | $ | 87.2 | ||||
We conduct business globally and, as a result, WABCO or one or more of our subsidiaries file income tax returns in the U.S. federal, state and local, and foreign jurisdictions. In the normal course of business, we are subject to examination by taxing authorities throughout the world, including such major jurisdictions as Belgium, Brazil, China, France, Germany, the Netherlands, Poland, the United Kingdom and the United States. With no material exceptions, the Company is no longer subject to examinations by tax authorities for years before 2005. The Company may realize a reduction of up to $10.4 million of unrecognized tax benefits to occur within 12 months as a result of projected resolutions of worldwide tax disputes or applicable statute closings. The settlements of $28.3 million during 2009 relate to the closure of a foreign tax audit and the expiration of a statute of limitation.
As a result of the allocation of purchase accounting (principally goodwill) to foreign subsidiaries, the book basis in the net assets of the foreign subsidiaries exceeds the related U.S. tax basis in the subsidiaries’ stock. Such investments are considered permanent in duration and accordingly, no deferred taxes have been provided on such differences, which are significant. The Company considers the earnings of substantially all of its foreign subsidiaries to be permanently reinvested outside the U.S. and as such no additional U.S. tax cost has been provided. The Company has provided for tax at the U.S. tax rate for its Brazilian affiliate’s current year earnings in 2009. The Company estimates the amount of its unremitted foreign earnings permanently reinvested outside the U.S. to be approximately $500 million as December 31, 2009, however, it is not practicable to estimate the tax liability that would arise if the earnings that are considered permanently reinvested were remitted to the U.S.
NOTE 15. Tax and Indemnification Liabilities Transferred from Trane to WABCO
Pursuant to a Tax Sharing Agreement between Trane and WABCO, entered into on July 16, 2007, WABCO is responsible for certain tax contingencies and indemnification liabilities. As noted in Note 14—Income Taxes, the liabilities as of December 31, 2009 include $19.8 million related to non-US entities of Trane’s Bath & Kitchen business but for which WABCO entities have obligations directly to non-US tax authorities. In addition, as of December 31, 2009, the Company had indemnification liabilities of $39.5 million, of which $27.9 million is classified within long-term liabilities on the balance sheet and $11.6 million is classified within short-term liabilities. During the third quarter of 2009, $41.3 million comprised of approximately $18.3 million of indemnification liabilities and approximately $23.0 million of other tax related liabilities were reversed in the statement of income (in the line indemnifications and other settlements) and therefore due to the closing of a tax audit and other settlements, the exposures relating to these liabilities are no longer deemed probable as of December 31, 2009.
Under an indemnification agreement, WABCO Brazil is responsible for certain claims related to its business for periods prior to the spin-off of WABCO from American Standard. In particular, there are tax claims pending in various stages of the Brazilian legal process related to income, social contribution and/or value added taxes for
68
Table of Contents
which a contingency exists and which may or may not ultimately be incurred by the Company. The estimated total amount of the contingency as of December 31, 2009 is $23.4 million including interest. However, based on advice of Brazilian counsel, the Company believes that it has valid arguments in all of these cases and thus no accrual is required at year end.
NOTE 16. Related Party Transactions
Presented within the Company’s accompanying consolidated statement of cash flow for the year ended December 31, 2007 is Net Transfers to Trane and Affiliates which include the following types of transactions:
| (Amounts in Millions) |
2007 | |||
| Net receipts from changes in loans due to/from Trane and affiliates |
$ | 288.6 | ||
| Other net receipts, including Trane and affiliate locations |
40.4 | |||
| Dividends paid to Trane and affiliates |
(48.0 | ) | ||
| Net Cash Transfers from/(to) Trane and Affiliates |
$ | 281.0 | ||
Net receipts from changes in loans to/from Trane and affiliates – The amount of cash that was provided to the Company in order to fund working capital requirements as well as capital expenditures net of cash surplus provided from the Company to other Trane entities. The net receipts from changes in loans due to/from Trane and affiliates was $288.6 million. As there was no settlement of outstanding net payable balances as of the date of Separation, the net resulting liability was recognized as additional contributed capital surplus. Net interest expense totaling $1.5 million for the year ended December 31, 2007, is included in the accompanying combined consolidated Statement of Income. All interest rates are deemed to be at or near market rates except for the interest rates carrying zero percent interest rates. There were no loans outstanding as of December 31, 2009, 2008 and 2007.
Other net receipts, including Trane and affiliate locations – These amounts were included in owner’s net investment at December 31, 2007. As these balances were not settled as part of the Separation, the resulting net liability was recognized as contributed capital surplus.
Dividends paid to Trane and Affiliates – Dividends paid from WABCO to other Trane entities.
Investments in Unconsolidated Joint Ventures
WABCO has two investments in affiliates that are accounted for by the equity method. The first of these investments is in Meritor WABCO. Meritor WABCO, in which WABCO has a 50% equity ownership, markets braking systems products and sells the majority of WABCO products in the United States. The second of these investments is in WABCO Automotive South Africa (“WABCO SA”). WABCO SA, in which WABCO has a 49% equity ownership, is a distributor of breaking systems products and sells WABCO products primarily in South Africa. As of December 31, 2009, WABCO has investments in Meritor WABCO of $8.4 million and WABCO SA of $2.7 million. WABCO received dividends from the joint ventures of $6.0 million, $7.3 million and $11.2 million for the years ended December 31, 2009, 2008 and 2007, respectively. WABCO obtained a majority control of WABCO-TVS in 2009 and upon obtaining control, 100% of WABCO-TVS’ results of operations, beginning June 2009, are included in the consolidated financial statements of the Company. See Note 19—Business Combinations for further details.
| (Amounts in Millions) |
WABCO Sales to | WABCO Purchases from | ||||||||||||||||
| Joint Venture |
2009 | 2008 | 2007 | 2009 | 2008 | 2007 | ||||||||||||
| Meritor WABCO |
$ | 75.8 | $ | 111.2 | $ | 121.8 | $ | — | $ | 0.1 | $ | — | ||||||
| WABCO SA |
$ | 3.9 | $ | 7.5 | $ | 8.3 | $ | — | $ | — | $ | — | ||||||
| WABCO-TVS |
$ | 0.6 | $ | 5.2 | $ | 4.8 | $ | 1.0 | $ | 2.8 | $ | 1.8 | ||||||
69
Table of Contents
The following table summarizes the assets, liabilities, shareholders’ equity, and results of operations of WABCO’s investments in affiliates. Meritor WABCO and WABCO SA amounts have been derived from the individual financial statements (as of and for the period ending December 31, 2009) of each of these entities. 2007 and 2008 balances and results include the balances and results of WABCO-TVS.
| Year Ended December 31, | ||||||
| (Amounts in Millions) |
2009 | 2008 | ||||
| Assets: |
||||||
| Current |
$ | 44.4 | $ | 430.5 | ||
| Noncurrent |
1.7 | 424.9 | ||||
| Total assets |
$ | 46.1 | $ | 855.4 | ||
| Liabilities and Shareholders’ Equity: |
||||||
| Current liabilities |
$ | 24.5 | $ | 219.8 | ||
| Non current liabilities and shareholders’ equity |
21.6 | 635.6 | ||||
| Total liabilities and shareholders’ equity |
$ | 46.1 | $ | 855.4 | ||
| Year Ended December 31, | |||||||||
| (Amounts in Millions) |
2009 | 2008 | 2007 | ||||||
| Results of operations: |
|||||||||
| Net sales |
$ | 145 | $ | 1,197 | $ | 1,387 | |||
| Cost of sales |
$ | 117 | $ | 887 | $ | 1,023 | |||
| Income from continuing operations |
$ | 6 | $ | 18 | $ | 55 | |||
| Net income |
$ | 6 | $ | 10 | $ | 38 | |||
NOTE 17. Geographic Information
WABCO is a fully integrated global business with management structures established in a variety of ways, including around products, distribution channels and key customers. Our largest customer is Daimler, which accounted for 12%, 15% and 14% of our sales in 2009, 2008 and 2007, respectively. Volvo accounted for 8%, 10% and 11% of our sales in 2009, 2008 and 2007, respectively. WABCO’s plants, engineering, technical support, distribution centers and other support functions are shared among various product families and serve all distribution channels with many customers. Based on the organizational structure, as well as the nature of financial information available and reviewed by the Company’s chief operating decision maker to assess performance and make decisions about resource allocations, the Company has concluded that its total WABCO operations represent one reportable segment and that WABCO’s performance and future net cash flow perspectives are best understood and assessed as such.
European sales for the years ended December 31, 2009 and 2008 accounted for 65% and 76% of total sales, respectively. Asian sales for the years ended December 31, 2009 and 2008 accounted for 18% and 10% of total sales, respectively. We are strongly rooted in China and India and have achieved a leading position in the marketplace through increasingly close connectivity to customers. We are further strengthened in Asia by an outstanding network of suppliers, manufacturing sites and engineering hubs.
70
Table of Contents
Geographic Data
| Year Ended December 31 | |||||||||
| (Amounts in millions) |
2009 | 2008 | 2007 | ||||||
| Product Sales: |
|||||||||
| OEM |
$ | 1,024.2 | $ | 2,047.6 | $ | 1,908.7 | |||
| Aftermarket |
467.3 | 540.4 | 507.2 | ||||||
| Sales—Geographic distribution (a): |
|||||||||
| United States |
$ | 124.7 | $ | 166.9 | $ | 171.7 | |||
| Europe (countries below are included in this total) |
970.1 | 1,962.3 | 1,840.0 | ||||||
| Germany |
417.1 | 836.6 | 768.0 | ||||||
| France |
72.9 | 151.6 | 144.8 | ||||||
| Sweden |
98.9 | 221.4 | 206.8 | ||||||
| Other (countries below are included in this total) |
396.7 | 458.9 | 404.2 | ||||||
| Japan |
50.5 | 85.8 | 73.2 | ||||||
| China |
94.4 | 91.6 | 70.6 | ||||||
| Brazil |
87.6 | 143.1 | 116.3 | ||||||
| India |
65.9 | 0.1 | 0.1 | ||||||
| Total sales |
$ | 1,491.5 | $ | 2,588.0 | $ | 2,415.9 | |||
| (a) | Sales to external customers are classified by country of destination. |
| As of December 31 | |||||||||
| (Amounts in millions) |
2009 | 2008 | 2007 | ||||||
| Long-lived Assets (b) |
|||||||||
| Geographic distribution: |
|||||||||
| United States |
$ | 6.2 | $ | 5.8 | $ | 13.2 | |||
| Europe (countries below are included in this total) |
639.5 | 646.1 | 692.9 | ||||||
| Germany |
361.0 | 369.6 | 391.2 | ||||||
| Poland |
84.3 | 84.7 | 98.0 | ||||||
| Other (countries below are included in this total) |
187.0 | 73.0 | 77.0 | ||||||
| India |
98.3 | 0.0 | 0.0 | ||||||
| Total long-lived assets |
$ | 832.7 | $ | 724.9 | $ | 783.1 | |||
| (b) | Amounts are presented on a gross basis |
NOTE 18. Agreements Entered into During the Periods Presented
On July 16, 2007, WABCO entered into definitive agreements with Trane that, among other things, set forth the terms and conditions of the Separation of WABCO from Trane and provide a framework for the relationship between WABCO and Trane following the Separation. These agreements govern the relationship between WABCO and Trane subsequent to the completion of the Separation and provide for the allocation between WABCO and Trane of assets, liabilities and obligations attributable to periods prior to the Separation. In addition to the Separation and Distribution Agreement, which contains many of the key provisions related to the Separation of WABCO and the Distribution of WABCO’s common shares to Trane’s shareholders, the parties also entered into a Tax Sharing Agreement, a Transition Services Agreement, an Employee Matters Agreement and an Indemnification and Cooperation Agreement. A summary of each of the agreements is as follows:
Separation and Distribution Agreement – sets forth WABCO’s agreements with Trane regarding principal transactions necessary to separate WABCO from Trane. This agreement also sets forth the other agreements that govern certain aspects of WABCO’s relationship with Trane after the completion of the Separation from Trane and provides for the allocation of certain assets to be transferred, liabilities to be assumed and contracts to be assigned to WABCO and Trane as part of the Separation.
71
Table of Contents
Tax Sharing Agreement – governs the parties’ respective rights, responsibilities and obligations after the Distribution with respect to taxes, including ordinary course of business taxes and taxes, if any, incurred as a result of any failure of the Distribution of all of the common shares of WABCO to qualify as a tax-free distribution for U.S. federal income tax purposes within the meaning of Section 355 of the Internal Revenue Code of 1986, as amended.
Transition Services Agreement – governed the orderly transition of WABCO becoming an independent company. Under the Transition Services Agreement, WABCO and Trane had agreed to provide each other with various services, including services relating to human resources, payroll, treasury and risk management, environmental technology, tax compliance, telecommunications services and information technology services. The cost of each transition service was generally on the same payment terms and calculated using the same cost allocation methodologies for the particular service as those associated with the costs on WABCO’s historical financial statements. The majority of the services provided under the transition services agreement expired on February 1, 2008.
Employee Matters Agreement – allocates liabilities and responsibilities relating to employee compensation and benefit plans and programs and other related matters in connection with the Separation, including the treatment of outstanding incentive awards and certain retirement and welfare benefit obligations, both in and outside of the United States. For further detail, please refer to Note 5—Capital Stock.
Indemnification and Cooperation Agreement – Pursuant to this agreement, WABCO Europe BVBA (an indirect wholly-owned subsidiary of WABCO), has agreed to be responsible for and to indemnify Trane and its subsidiaries (including certain subsidiaries formerly engaged in the Bath and Kitchen business) and their respective affiliates against any fines related to the European Commission’s investigation, as outlined in a Statement of Objections received by Trane on March 28, 2007, into possible infringement of European Union competition regulations. For further detail, please refer to Note 13—Warranties, Guarantees, Commitments and Contingencies.
NOTE 19. Business Combinations
WABCO and its Indian joint venture partners, members of the TVS group (“TVS”), separated the WABCO related business from the non-WABCO related business of their Indian joint venture Sundaram-Clayton Ltd. (“SCL”). This was done through a plan of demerger, which was approved by the Madras High Court and became effective on March 28, 2008 under Indian law. As a result, the WABCO-related business of SCL was transferred to a new company, WABCO-TVS (INDIA) Ltd. (“WABCO-TVS”), the shares of which were allocated proportionately in May 2008 to existing SCL shareholders and were listed in India as of October 1, 2008. The Company believes that the demerger should be tax-free in both India and the United States and has received a positive private letter ruling from the U.S. Internal Revenue Service.
On June 3, 2009, WABCO sold 39.2% of its interest in SCL’s non-WABCO-related business, decreasing WABCO’s percentage ownership in SCL to zero. Based upon the trading share price of SCL at the time of the transaction, the consideration received by the Company to divest itself of its ownership in SCL was $24.0 million. The sale of these shares resulted in a pre-tax gain of $0.7 million that has been recognized in the quarter ended June 30, 2009. The Company has established a provision for the U.S. tax at 35% for this transfer of its entire shares in SCL.
Concurrent with the sale of the shares in SCL, on June 3, 2009 WABCO purchased additional shares of WABCO-TVS increasing its ownership in WABCO-TVS from 39.2% to 75%. Based upon the trading share price of WABCO-TVS at the time of the transaction, the consideration paid by the Company to acquire the additional 35.8% of WABCO-TVS was $31.6 million. With its outstanding engineering and manufacturing capabilities and local sourcing network, WABCO-TVS designs, manufactures and markets conventional braking products and other related air compression products and systems, directly serving customers locally and internationally through WABCO. Upon WABCO obtaining majority control of WABCO-TVS, 100% of WABCO-TVS’ results of operations, beginning June 2009, are included in the condensed consolidated financial statements of the Company. In addition, 25% of the results of operations for the same period are accounted for as non-controlling interest in the consolidating statement of income and shareholders’ equity section of the condensed consolidated balance sheet accordingly.
72
Table of Contents
Prior to accounting for the step acquisition, the Company remeasured its investment in WABCO-TVS to fair value, which resulted in a pre-tax loss of $11.5 million. The allocation of the purchase price has been performed based on the fair values of 100% of the assets acquired and liabilities assumed.
The fair value of the WABCO-TVS business identified intangible assets and goodwill as detailed below:
| Fair market value (in millions) |
Useful life (in years) |
Estimated annual amortization | ||||
| Customer and distribution relationships |
12.7 | 15 | 0.8 | |||
| TVS brand |
0.5 | 3 | 0.2 | |||
| Technology (patented and unpatented) |
3.3 | 5-10 | 0.4 | |||
| In-process research and development |
0.8 | 10 | 0.1 | |||
| Software |
0.1 | 1 | N/A | |||
| Goodwill |
26.7 | N/A | N/A |
The fair values were determined using the market approach, cost approach and income approach. The useful lives were determined by considering the following factors: expected use of the asset, legal provisions, historical experience, effects of obsolescence and expected maintenance.
NOTE 20. Quarterly Data (Unaudited)
Year 2009
| (Amounts in millions) |
First | Second | Third | Fourth | |||||||||||
| Sales |
$ | 333.9 | $ | 316.0 | $ | 382.0 | $ | 459.6 | |||||||
| Cost of sales (including streamlining expense) |
275.7 | 248.5 | 295.2 | 344.3 | |||||||||||
| Gross profit |
58.2 | 67.5 | 86.8 | 115.3 | |||||||||||
| Income before income taxes |
(35.4 | ) | (14.6 | ) | 36.2 | 26.8 | |||||||||
| Income taxes |
0.5 | 2.4 | 0.7 | (14.4 | ) | ||||||||||
| Net income |
$ | (36.4 | ) | $ | (17.4 | ) | $ | 33.8 | $ | 38.7 | |||||
| Net income per common share |
|||||||||||||||
| Basic |
$ | (0.57 | ) | $ | (0.27 | ) | $ | 0.53 | $ | 0.60 | |||||
| Diluted |
$ | (0.57 | ) | $ | (0.27 | ) | $ | 0.52 | $ | 0.59 | |||||
| Year 2008 | |||||||||||||||
| (Amounts in millions) |
First | Second | Third | Fourth | |||||||||||
| Sales |
$ | 705.4 | $ | 772.9 | $ | 655.0 | $ | 454.7 | |||||||
| Cost of sales (including streamlining expense) |
509.4 | 560.6 | 480.2 | 343.7 | |||||||||||
| Gross profit |
196.0 | 212.3 | 174.8 | 111.0 | |||||||||||
| Income before income taxes |
83.4 | 86.0 | 68.7 | 16.1 | |||||||||||
| Income taxes |
21.0 | 18.4 | 4.0 | (5.1 | ) | ||||||||||
| Net income |
$ | 61.3 | $ | 67.0 | $ | 63.7 | $ | 21.2 | |||||||
| Net income per common share |
|||||||||||||||
| Basic |
$ | 0.92 | $ | 1.02 | $ | 0.99 | $ | 0.33 | |||||||
| Diluted |
$ | 0.91 | $ | 1.00 | $ | 0.97 | $ | 0.33 | |||||||
The sum of each value line for the four quarters does not necessarily equal the amount reported for the full year because of rounding.
73
Table of Contents
| ITEM 9. | CHANGES IN AND DISAGREEMENTS WITH ACCOUNTANTS ON ACCOUNTING AND FINANCIAL DISCLOSURE |
None.
| ITEM 9A. | CONTROLS AND PROCEDURES |
The Company has established a Disclosure Controls Committee that assists the Chief Executive Officer and Chief Financial Officer in their evaluation of the Company’s disclosure controls and procedures. Our Chief Executive Officer and Chief Financial Officer have concluded, based on their evaluation as of the end of the period covered by this report, that our disclosure controls and procedures, as defined in the Securities Exchange Act of 1934, Rule 13a-15(e), are (i) effective to ensure that the information required to be disclosed in the reports that the Company files or submits under the Securities Act of 1934 is recorded, processed, summarized and reported, within the time periods specified in the Securities and Exchange Commission’s rules and forms, and (ii) is accumulated and communicated to the Company’s management, including our Chief Executive Officer and Chief Financial Officer, as appropriate to allow timely decisions regarding required disclosure. There have been no changes in our internal control over financial reporting during the most recent fiscal quarter that have materially affected, or are reasonably likely to materially affect, our internal control over financial reporting.
Management’s Report On Internal Control Over Financial Reporting
Our management is responsible for establishing and maintaining adequate internal control over financial reporting for the Company. The Company’s internal control over financial reporting is designed to provide reasonable assurance regarding the reliability of financial reporting and the preparation of consolidated financial statements for external purposes in accordance with generally accepted accounting principles. The Company’s internal control over financial reporting includes those policies and procedures that:
| (i) | pertain to the maintenance of records that, in reasonable detail, accurately and fairly reflect the transactions and dispositions of the assets of the Company, |
| (ii) | provide reasonable assurance that transactions are recorded as necessary to permit preparation of consolidated financial statements in accordance with generally accepted accounting principles, and that receipts and expenditures of the Company are being made only in accordance with authorizations of management and directors of the Company, and |
| (iii) | provide reasonable assurance regarding prevention or timely detection of unauthorized acquisition, use or disposition of the Company’s assets that could have a material effect on the consolidated financial statements. |
Because of its inherent limitations, internal control over financial reporting may not prevent or detect misstatements. Also, projections of any evaluation of the effectiveness to future periods are subject to the risk that controls may become inadequate because of changes in conditions, or that the degree of compliance with the policies and procedures included in such controls may deteriorate.
The Company conducted an evaluation of the effectiveness of our internal control over financial reporting based upon the framework in Internal Control – Integrated Framework issued by the Committee of Sponsoring Organizations of the Treadway Commission (COSO). Based upon such evaluation, our management concluded that our internal control over financial reporting was effective as of December 31, 2009.
The Company’s effectiveness of our internal control over financial reporting, as of December 31, 2009, has been audited by Ernst & Young Bedrijfsrevisoren BCVBA/Reviseurs d’Entreprises SCCRL, an independent registered public accounting firm, as stated in their attestation report which is included immediately below.
WABCO Holdings Inc.
February 18, 2010
74
Table of Contents
Report of Independent Registered Public Accounting Firm
The Board of Directors and Shareholders of WABCO Holdings Inc.
We have audited WABCO Holdings Inc. and subsidiaries’ internal control over financial reporting as of December 31, 2009, based on criteria established in Internal Control—Integrated Framework issued by the Committee of Sponsoring Organizations of the Treadway Commission (the COSO criteria). WABCO Holdings Inc.’s management is responsible for maintaining effective internal control over financial reporting, and for its assessment of the effectiveness of internal control over financial reporting included in the accompanying Management’s Report on Internal Control over Financial Reporting. Our responsibility is to express an opinion on the company’s internal control over financial reporting based on our audit.
We conducted our audit in accordance with the standards of the Public Company Accounting Oversight Board (United States). Those standards require that we plan and perform the audit to obtain reasonable assurance about whether effective internal control over financial reporting was maintained in all material respects. Our audit included obtaining an understanding of internal control over financial reporting, assessing the risk that a material weakness exists, testing and evaluating the design and operating effectiveness of internal control based on the assessed risk, and performing such other procedures as we considered necessary in the circumstances. We believe that our audit provides a reasonable basis for our opinion.
A company’s internal control over financial reporting is a process designed to provide reasonable assurance regarding the reliability of financial reporting and the preparation of financial statements for external purposes in accordance with generally accepted accounting principles. A company’s internal control over financial reporting includes those policies and procedures that (1) pertain to the maintenance of records that, in reasonable detail, accurately and fairly reflect the transactions and dispositions of the assets of the company; (2) provide reasonable assurance that transactions are recorded as necessary to permit preparation of financial statements in accordance with generally accepted accounting principles, and that receipts and expenditures of the company are being made only in accordance with authorizations of management and directors of the company; and (3) provide reasonable assurance regarding prevention or timely detection of unauthorized acquisition, use, or disposition of the company’s assets that could have a material effect on the financial statements.
Because of its inherent limitations, internal control over financial reporting may not prevent or detect misstatements. Also, projections of any evaluation of effectiveness to future periods are subject to the risk that controls may become inadequate because of changes in conditions, or that the degree of compliance with the policies or procedures may deteriorate.
In our opinion, WABCO Holdings Inc. and subsidiaries maintained, in all material respects, effective internal control over financial reporting as of December 31, 2009, based on the COSO criteria.
We also have audited, in accordance with the standards of the Public Company Accounting Oversight Board (United States), the consolidated balance sheets of WABCO Holdings Inc. and subsidiaries as of December 31, 2009 and 2008, and the related consolidated statements of income, shareholders’ equity/ owner’s net investment and comprehensive income, and cash flows for each of the three years in the period ended December 31, 2009, of WABCO Holdings, Inc. and subsidiaries and our report dated February 18, 2010 expressed an unqualified opinion thereon.
Ernst & Young Bedrijfsrevisoren BCVBA/Reviseurs d’Entreprises SCCRL
Represented by:
/s/ Harry Everaerts,
Partner
Brussels, Belgium
February 18, 2010
| ITEM 9B. | OTHER INFORMATION |
None.
75
Table of Contents
PART III
| ITEM 10. | DIRECTORS, EXECUTIVE OFFICERS AND CORPORATE GOVERNANCE |
Pursuant to instruction G(3) to Form 10-K, the information required by Item 10 with respect to the Directors of the Company set forth under the heading “Proposal 1—Election of Directors” and “Directors” in the Company’s definitive proxy statement to be filed within 120 days following the end of the fiscal year covered by this report is incorporated herein by reference.
The information required by Item 10 with respect to the executive officers of the Company has been included in Part I of this Form 10-K (as Item 4A) under the heading “Executive Officers of the Registrant” in reliance on Instruction G(3) of Form 10-K and Instruction 3 to Item 401(b) of Regulation S-K.
Pursuant to instruction G(3) to Form 10-K, information concerning the Audit Committee and audit committee financial expert disclosure set forth under the headings “Governance—Board Matters and Committee Membership” and “—Committees of the Board—Audit Committee” in the Company’s definitive proxy statement to be filed within 120 days following the end of the fiscal year covered by this report is incorporated herein by reference.
Pursuant to instruction G(3) to Form 10-K, information concerning compliance with Section 16(a) of the Securities Act of 1933 by officers and directors of the Company set forth under the heading “Certain Relationships or Related Person Transactions and Section 16 Reporting Compliance—Section 16(a) Beneficial Ownership Reporting Compliance” in the Company’s definitive proxy statement to be filed within 120 days following the end of the fiscal year covered by this report is incorporated herein by reference.
Information regarding our Code of Conduct and Ethics set forth under the caption “Code of Conduct and Ethics” in Item 1 of Part I of this Form 10-K is incorporated herein by reference.
| ITEM 11. | EXECUTIVE COMPENSATION |
Pursuant to Instruction G(3) to Form 10-K, information concerning director and officer executive compensation and related matters set forth under the headings “Report of the Compensation, Nominating and Governance Committee,” “Compensation Discussion and Analysis,” “Executive Compensation” and “Director Compensation” in the Company’s definitive proxy statement to be filed within 120 days following the end of the fiscal year covered by this report is incorporated herein by reference.
Pursuant to instruction G(3) to Form 10-K, information concerning compensation committee interlocks and insider participation set forth under the headings “Governance—Compensation Committee Interlocks and Insider Participation” in the Company’s definitive proxy statement to be filed within 120 days following the end of the fiscal year covered by this report is incorporated herein by reference.
| ITEM 12. | SECURITY OWNERSHIP OF CERTAIN BENEFICIAL OWNERS AND MANAGEMENT AND RELATED STOCKHOLDER MATTERS |
Pursuant to Instruction G(3) to Form 10-K, information concerning shares of common stock of the Company beneficially owned by management set forth under the heading “Common Stock Ownership of Officers, Directors and Significant Shareholders” in the Company’s definitive proxy statement to be filed within 120 days following the end of the fiscal year covered by this report is incorporated herein by reference.
Pursuant to Instruction G(3) to Form 10-K, information concerning securities authorized for issuance under equity compensation plans set forth under the heading “Equity Compensation Plans” in the Company’s definitive proxy statement to be filed within 120 days following the end of the fiscal year covered by this report is incorporated herein by reference.
76
Table of Contents
| ITEM 13. | CERTAIN RELATIONSHIPS AND RELATED TRANSACTIONS AND, DIRECTOR INDEPENDENCE |
Pursuant to Instruction G(3) to Form 10-K, information concerning certain relationships and related party transactions and director independence set forth under the headings “Certain Relationships or Related Person Transactions and Section 16 Reporting Compliance—Certain Relationships and Related Person Transactions,” and “Governance—Independence Standards for Board Service” and “—Availability of Corporate Governance Materials” in the Company’s definitive proxy statement to be filed within 120 days following the end of the fiscal year covered by this report is incorporated herein by reference.
| ITEM 14. | PRINCIPAL ACCOUNTING FEES AND SERVICES |
Pursuant to Instruction G(3) to Form 10-K, information concerning principal accounting fees and services set forth under the heading “Audit Committee Matters—Audit Committee’s Pre-Approval Policies and Procedures” and “—Audit and Non-Audit Fees” in the Company’s definitive proxy statement to be filed within 120 days following the end of the fiscal year covered by this report is incorporated herein by reference.
77
Table of Contents
PART IV
| ITEM 15. | EXHIBITS AND FINANCIAL STATEMENT SCHEDULES |
(a) 1. and 2. Financial statements and financial statement schedules
The financial statements and financial statement schedule listed in the Index to Financial Statements and Financial Statement Schedule on the following page are incorporated herein by reference.
(b) The exhibits to this Report are listed on the accompanying Index to Exhibits and are incorporated herein by reference or are filed as part of this Annual Report on Form 10-K.
78
Table of Contents
INDEX TO FINANCIAL STATEMENTS AND FINANCIAL STATEMENT SCHEDULE
All other schedules have been omitted because the information is not applicable or is not material or because the information required is included in the financial statements or the notes thereto.
79
Table of Contents
SCHEDULE II—VALUATION AND QUALIFYING ACCOUNTS
Years ended December 31, 2009, 2008, and 2007
(Amounts in thousands)
| Description |
Balance Beginning of Period |
Provision Addition, Net of Reductions to Amounts Provided in Prior Years |
Deductions | Foreign Currency Translation Effects |
Balance End of Period | |||||||||||||
| 2009: |
||||||||||||||||||
| Reserve deducted from assets: |
||||||||||||||||||
| Allowance for doubtful accounts receivable |
$ | 6,855 | $ | 2,675 | $ | (565 | )(A) | $ | 340 | $ | 9,305 | |||||||
| 2008: |
||||||||||||||||||
| Reserve deducted from assets: |
||||||||||||||||||
| Allowance for doubtful accounts receivable |
$ | 6,441 | $ | 875 | $ | (151 | )(A) | $ | (310 | ) | $ | 6,855 | ||||||
| 2007: |
||||||||||||||||||
| Reserve deducted from assets: |
||||||||||||||||||
| Allowance for doubtful accounts receivable |
$ | 6,533 | $ | (189 | ) | $ | (602 | )(A) | $ | 699 | $ | 6,441 | ||||||
| (A) | Accounts charged off. |
80
Table of Contents
Pursuant to the requirements of Section 13 or 15(d) of the Securities Exchange Act of 1934, the Registrant has duly caused this report to be signed on its behalf by the undersigned, thereunto duly authorized.
| WABCO HOLDINGS INC. | ||
| By: |
/S/ JACQUES ESCULIER | |
| Jacques Esculier | ||
| Chief Executive Officer and Director | ||
Pursuant to the requirements of the Securities Exchange Act of 1934, this report has been signed below by the following persons on behalf of the registrant and in the capacities and on the dates indicated.
| Signatures | Title | Date | ||
| /s/ JACQUES ESCULIER Jacques Esculier |
Chief Executive Officer and Chairman of the Board of Directors (Principal Executive Officer) |
February 18, 2010 | ||
| /s/ ULRICH MICHEL Ulrich Michel |
Chief Financial Officer (Principal Financial Officer) |
February 18, 2010 | ||
| /s/ TODD WEINBLATT Todd Weinblatt |
Vice President and Controller (Principal Accounting Officer) |
February 18, 2010 | ||
| * James F. Hardymon |
Director | February 18, 2010 | ||
| * G. Peter D’Aloia |
Director | February 18, 2010 | ||
| * John F. Fiedler |
Director | February 18, 2010 | ||
| * Dr. Juergen Gromer |
Director | February 18, 2010 | ||
| * Kenneth J. Martin |
Director | February 18, 2010 | ||
| * Michael T. Smith |
Director | February 18, 2010 | ||
| * Donald J. Stebbins |
Director | February 18, 2010 | ||
| * | Signed by Attorney-in-fact |
| /s/ ALFRED FARHA |
||||
| Alfred Farha Attorney-in-fact |
||||
81
Table of Contents
WABCO HOLDINGS INC.
INDEX TO EXHIBITS
(The File Number of the Registrant, WABCO Holdings Inc. is 1-33332)
| Exhibit No. |
Description | |
| 2.1 | Separation and Distribution Agreement, dated as of July 16, 2007, by and between Trane Inc. and WABCO Holdings Inc. (previously filed as Exhibit 2.1 to the Company’s Form 8-K (File No. 001-33332), filed on July 20, 2007 and herein incorporated by reference). | |
| 3.1 | Amended and Restated Certificate of Incorporation (previously filed as Exhibit 3.1 to the Company’s Form 8-K (File No. 001-33332), filed on July 18, 2007 and herein incorporated by reference). | |
| 3.2 | Amended and Restated By-Laws of WABCO Holdings Inc. (previously filed as Exhibit 3.2 to the Company’s Form 8-K (File No. 001-33332), filed on July 18, 2007 and herein incorporated by reference). | |
| 4.1 | Rights Agreement, dated July 16, 2007, by and between WABCO Holdings Inc. and The Bank of New York (previously filed as Exhibit 4.1 to the Company’s Form 8-K (File No. 001-33332), filed on July 18, 2007 and herein incorporated by reference). | |
| 4.2 | Certificate of Designation of Junior Participating Cumulative Preferred Stock (previously filed as Exhibit 4.2 to the Company’s Form 8-K (File No. 001-33332), filed on July 18, 2007 and herein incorporated by reference). | |
| 4.3 | Rights Certificate (attached as an exhibit to the Rights Agreement, dated July 16, 2007 filed as Exhibit 4.1 hereto). | |
| 4.4 | Form of Specimen Common Stock Certificate (previously filed as Exhibit 4.4 to the Company’s Form 10-Q (File No. 001-33332), filed on November 8, 2007 and herein incorporated by reference). | |
| 10.1 | Tax Sharing Agreement, dated as of July 16, 2007, by and among Trane Inc. and certain of its subsidiaries and WABCO Holdings Inc. and certain of its subsidiaries (previously filed as Exhibit 10.1 to the Company’s Form 8-K (File No. 001-33332), filed on July 20, 2007 and herein incorporated by reference). | |
| 10.2 | Employee Matters Agreement, dated July 16, 2007, by and between Trane Inc. and WABCO Holdings Inc. (previously filed as Exhibit 10.3 to the Company’s Form 8-K (File No. 001-33332), filed on July 20, 2007 and herein incorporated by reference). | |
| 10.3 | Indemnification and Cooperation Agreement, dated as of July 16, 2007, by and among Trane Inc. and certain of its subsidiaries and WABCO Holdings Inc. and certain of its subsidiaries (previously filed as Exhibit 10.4 to the Company’s Form 8-K (File No. 001-33332), filed on July 20, 2007 and herein incorporated by reference). | |
| 10.4 | WABCO Holdings Inc. Omnibus Incentive Plan (previously filed as Exhibit 10.1 to the Company’s Form S-8 (File No. 333-144906), filed on July 27, 2007 and herein incorporated by reference). | |
| 10.5 | WABCO Holdings Inc. 2009 Omnibus Incentive Plan (previously filed as Exhibit B to the Company’s Definitive Proxy Statement on Schedule 14A (File No. 001-33332), filed on April 17, 2009 and herein incorporated by reference). | |
| 10.6 | Form of Indemnification Agreement (previously filed as Exhibit 10.6 to the Company’s Form 10, as amended (File No. 001-33332), filed on May 23, 2007 and herein incorporated by reference) (Entered into with all executive officers and all members of the Board of Directors, as reported in Form 8-Ks filed by the Company on August 2, 2007 and September 5, 2007). | |
| 10.7 | Form of WABCO Holdings Inc. Stock Option Grant Agreement for U.S. Employees (previously filed as Exhibit 10.7 to the Company’s Form 10-Q (File No. 001-33332), filed on November 8, 2007 and herein incorporated by reference). | |
| 10.8 | Form of WABCO Holdings Inc. Stock Option Grant Agreement for Non-U.S. Employees (previously filed as Exhibit 10.8 to the Company’s Form 10-Q (File No. 001-33332), filed on November 8, 2007 and herein incorporated by reference). | |
| 10.9 | Form of WABCO Holdings Inc. Restricted Unit Grant Agreement for U.S. Employees (previously filed as Exhibit 10.9 to the Company’s Form 10-Q (File No. 001-33332), filed on November 8, 2007 and herein incorporated by reference). | |
Table of Contents
| Exhibit No. |
Description | |
| 10.10 | Form of WABCO Holdings Inc. Restricted Unit Grant Agreement for Non-U.S. Employees (previously filed as Exhibit 10.10 to the Company’s Form 10-Q (File No. 001-33332), filed on November 8, 2007 and herein incorporated by reference). | |
| 10.11 | WABCO Holdings Inc. Change of Control Severance Plan (previously filed as Exhibit 10.11 to the Company’s Form 10-Q (File No. 001-33332), filed on November 8, 2007 and herein incorporated by reference). | |
| 10.12 | Amendment No. 1 to WABCO Holdings Inc. Change of Control Severance Plan, (previously filed as Exhibit 10.1 to the Company’s 8-K (File no. 001-33332), filed on July 14, 2008 and herein incorporated by reference). | |
| 10.13 | Amendment No. 2 to WABCO Holdings Inc. Change of Control Severance Plan, effective as of December 31, 2008 (previously filed as Exhibit 10.14 to the Company’s Form 10-K (File No. 001-33332), filed on February 24, 2009 and herein incorporated by reference). | |
| 10.14 | WABCO Holdings Inc. Deferred Compensation Plan (previously filed as Exhibit 10.1 to the Company’s Form S-8 (File No. 333-148972), filed on January 31, 2008 and herein incorporated by reference). | |
| 10.15 | Amendment to WABCO Holdings Inc. Deferred Compensation Plan, effective as of December 31, 2008 (previously filed as Exhibit 10.16 to the Company’s Form 10-K (File No. 001-33332), filed on February 24, 2009 and herein incorporated by reference). | |
| 10.16 | WABCO Holdings Inc. Supplemental Savings Plan (previously filed as Exhibit 10.20 to the Company’s Form 10-Q (File No. 001-33332), filed on November 8, 2007 and herein incorporated by reference). | |
| 10.17 | Amendment to WABCO Holdings Inc. Supplemental Savings Plan, effective as of December 31, 2008 (previously filed as Exhibit 10.18 to the Company’s Form 10-K (File No. 001-33332), filed on February 24, 2009 and herein incorporated by reference). | |
| 10.18 | Employment Agreement by and between WABCO Expats Inc. and Jacques Esculier, dated as of July 27, 2007 (previously filed as Exhibit 10.12 to the Company’s Form 10-Q (File No. 001-33332), filed on November 8, 2007 and herein incorporated by reference). | |
| 10.19 | Non-Qualified Deferred Compensation Program for Belgian Executives (Summary of French Language Program Document) (previously filed as Exhibit 10.1 to the Company’s Form 10-Q (File No. 001-33332), filed on May 7, 2009 and herein incorporated by reference). | |
| 10.20 | Amendment to Employment Agreement, by and between WABCO Expats Inc. and Jacques Esculier, dated December 31, 2008 (previously filed as Exhibit 10.20 to the Company’s Form 10-K (File No. 001-33332), filed on February 24, 2009 and herein incorporated by reference). | |
| 10.21 | Amendment to Employment Contract of March 1, 2003 by and between Trane Europe BVBA and Ulrich Michel, dated July 27, 2007 (previously filed as Exhibit 10.13 to the Company’s Form 10-Q (File No. 001-33332), filed on November 8, 2007 and herein incorporated by reference). | |
| 10.22 | Amended Employment Agreement of Ulrich Michel, dated May 27, 2008 (previously filed as Exhibit 10.1 to the Company’s Form 8-K (File no. 001-33332), filed on June 6, 2008 and herein incorporated by reference). | |
| 10.23 | Employment Agreement by and between WABCO Expats Inc. and Alfred Farha, dated April 25, 2008 (previously filed as Exhibit 10.7 to the Company’s Form 10-Q (File No. 001-33332), filed on August 8, 2008 and herein incorporated by reference). | |
| 10.24 | Amendment to Employment Agreement, by and between WABCO Expats Inc. and Alfred Farha, dated December 31, 2008 (previously filed as Exhibit 10.24 to the Company’s Form 10-K (File No. 001-33332), filed on February 24, 2009 and herein incorporated by reference). | |
| 10.25 | Employment Agreement by and between WABCO Expats Inc. and Kevin Tarrant, dated as of July 1, 2007 (previously filed as Exhibit 10.14 to the Company’s Form 10-Q (File No. 001-33332), filed on November 8, 2007 and herein incorporated by reference). | |
Table of Contents
| Exhibit No. |
Description | |
| 10.26 | Amendment to Employment Agreement, by and between WABCO Expats Inc. and Kevin Tarrant, dated December 31, 2008 (previously filed as Exhibit 10.26 to the Company’s Form 10-K (File No. 001-33332), filed on February 24, 2009 and herein incorporated by reference). | |
| 10.27 | Employment Agreement by and between World Standard Ltd. And Nikhil M. Varty, dated April 15, 2001 (previously filed as Exhibit 10.15 to the Company’s Form 10-Q (File No. 001-33332), filed on November 8, 2007 and herein incorporated by reference). | |
| 10.28 | Addendum to Employment Agreement by and between World Standard Ltd. and Nikhil M. Varty, dated February 1, 2006 (previously filed as Exhibit 10.16 to the Company’s Form 10-Q (File No. 001-33332), filed on November 8, 2007 and herein incorporated by reference). | |
| 10.29 | Employment Agreement by and between Trane Europe BVBA and Jean-Christophe Figueroa, dated January 21, 2005 (previously filed as Exhibit 10.17 to the Company’s Form 10-Q (File No. 001-33332), filed on November 8, 2007 and herein incorporated by reference). | |
| 10.30 | Partnership Agreement, dated as of January 9, 1990, as amended by Amendment No. 1 thereto, dated as of May 29, 1990, and Amendment No. 2 thereto, dated as of May 10, 2006, of Meritor WABCO Vehicle Control Systems (formerly known as Rockwell WABCO Vehicle Control Systems), by and between WABCO Automotive Control Systems, Inc. and ArvinMeritor Brake Holdings, Inc. (successor in interest to Rockwell Brake Systems, Inc.) (previously filed as Exhibit 10.5 to the Company’s Form 10 (File No. 001-33332), filed on May 23, 2007 and herein incorporated by reference). | |
| 10.31 | Five-Year Credit Agreement, dated as of May 31, 2007, among WABCO Holdings Inc. and certain subsidiaries of WABCO Holdings Inc. and the financial institutions listed herein, JPMorgan Chase Bank, N.A., as Administrative Agent, Issuing Bank and Swingline Lender, J.P. Morgan Europe Limited, as London Agent, ABN AMRO Bank N.V., as Syndication Agent, and Bank of America, N.A., BNP Paribas and Citibank, N.A., as Document Agents (previously filed as Exhibit 10.7 to the Company’s Form 10 (File No. 001-33332), filed on June 11, 2007 and herein incorporated by reference). | |
| 10.32 | German Receivables Purchase and Servicing Agreement dated September 23, 2009, among WABCO Fahrzeugsysteme GmbH, as German Seller and German Servicer, WABCO Financial Services SPRL, as Seller’s Agent, and Société Générale Bank Nederland N.V., as Purchaser (previously filed as Exhibit 10.1 to the Company’s Form 8-K (File No. 001-33332), filed on September 28, 2009 and herein incorporated by reference). | |
| 10.33 | Italian Receivables Purchase and Servicing Agreement dated September 23, 2009, among WABCO Automotive Italia SRL, as Italian Seller and Italian Servicer, WABCO Financial Services SPRL, as Seller’s Agent, and Société Générale Bank Nederland N.V., as Purchaser (previously filed as Exhibit 10.2 to the Company’s Form 8-K (File No. 001-33332), filed on September 28, 2009). | |
| 10.34 | French Receivables Purchase and Servicing Agreement dated September 23, 2009, among WABCO Financial Services SPRL, as Seller’s Agent, WABCO France S.A.S., as French Seller, Paris Titrisation, as Management Company, and Société Générale, as Custodian (previously filed as Exhibit 10.3 to the Company’s Form 8-K (File No. 001-33332), filed on September 28, 2009). | |
| 10.35 | Master Definitions Agreement dated September 23, 2009, among Société Générale Bank Nederland N.V., as Senior Units Subscriber, the Bank or the Purchaser, as applicable, Paris Titrisation, as Management Company acting for the account of FCT Val Duchesse—Titrisation, Société Générale, as the Administrative Agent or Custodian, as applicable, Antalis S.A., WABCO France S.A.S., as French Seller, WABCO Fahrzeugsysteme GmbH, as German Seller, WABCO Automotive Italia SRL, as Italian Seller, WABCO Financial Services SPRL, as Depositor and the Seller’s Agent, and WABCO Europe SPRL, as Insurance Servicer (previously filed as Exhibit 10.4 to the Company’s Form 8-K (File No. 001-33332), filed on September 28, 2009). | |
| 10.36 | Guarantee and Subordination Agreement dated September 23, 2009, among WABCO Holdings Inc., as Guarantor, Paris Titrisation, as Management Company, Société Générale, as Custodian and Société Générale Bank Nederland N.V., as Purchaser (previously filed as Exhibit 10.5 to the Company’s Form 8-K (File No. 001-33332), filed on September 28, 2009). | |
Table of Contents
| Exhibit No. |
Description | |
| 16.1 | Letter from Ernst & Young LLP dated August 2, 2007 (previously filed as Exhibit 16.1 to the Company’s 8-K (File No. 001-33332), filed on August 2, 2007 and herein incorporated by reference). | |
| 21.1 | Subsidiaries of the Company. | |
| 23.1 | Consent of Ernst & Young Bedrijfsrevisoren BCVBA/Réviseurs d’Entreprises SCCRL. | |
| 24.1 | Form of Power of Attorney (James F. Hardymon, G. Peter D’Aloia, John F. Fiedler, Dr. Juergen Gromer, Kenneth J. Martin, Michael T. Smith and Donald J. Stebbins). | |
| 31.1 | Certification of the Chief Executive Officer pursuant to Section 302 of the Sarbanes-Oxley Act of 2002. | |
| 31.2 | Certification of the Chief Financial Officer pursuant to Section 302 of the Sarbanes-Oxley Act of 2002. | |
| 32.1 | Certification of the Chief Executive Officer pursuant to Section 906 of the Sarbanes-Oxley Act of 2002. | |
| 32.2 | Certification of the Chief Financial Officer pursuant to Section 906 of the Sarbanes-Oxley Act of 2002. | |