Attached files
| file | filename |
|---|---|
| EX-99.1 - EXHIBIT 99.1 - BENCHMARK ELECTRONICS INC | ex99_1.htm |
| 8-K - FORM 8-K - BENCHMARK ELECTRONICS INC | form8k.htm |
design develop deliver advanced technology Q4 and FY 2016 Earnings Presentation February 8, 2017

design develop deliver advanced technology 2 Forward - Looking Statements This document contains forward - looking statements within the scope of the Securities Act of 1933 and the Securities Exchange Act of 1934. The words “expect,” “estimate,” “anticipate,” “predict” and similar expressions, and the negatives thereof, often identify forward - looking statements, which are not limited to historical facts. F orward - looking statements include, among other things: guidance for the first quarter of 2017 relating to sales; statements , express or implied, concerning future operating results or margins, the ability to generate sales and income or cash flow; and Benchmark’s business and growth strategies and expected growth and performance. Although Benchmark believes these statements are based upon reasonable assumptions, they involve risks and uncertainties relating to operations , markets and the business environment generally. If one or more of these risks or uncertainties materializes, or underlying assumptions prove incorrect, actual outcomes may vary materially from those indicated. All forward - looking statements included in this document are based upon information available to the Company as of the date of this document, and it assumes no obligation to update them. Readers are advised to consult further disclosures on related subjects, particularly in Item 1A, “Risk Factors”, of the Company’s annual report on Form 10 - K for the year ended December 31, 2015, in its other filings with the Securities and Exchange Commission and in its press releases. Non - GAAP Financial Information This document includes certain financial measures, such as operating margin, that exclude items and therefore are not in accordance with generally accepted accounting principles (“GAAP”). A detailed reconciliation between GAAP results and results excluding special items (“non - GAAP”) is included in the Appendix of this document. Management discloses non - GAAP information to provide investors with additional information to analyze the Company’s performance and underlying trends. Management uses non - GAAP measures of net income and earnings per share that exclude certain items in order to better assess operating performance and help investors compare results with our previous guidance. This document also references “free cash flow”, which the Company defines as cash flow from operations less additions to property, plant and equipment and purchased software.
design develop deliver advanced technology 3 CEO Update

design develop deliver advanced technology 4 Fourth Quarter 2016 Summary Revenue and operating margins at the top end of guidance ▪ Stronger than expected Test & Instrumentation and Computing demand ▪ Historical high g ross margin of 9.5%, a 30 bps Q2Q improvement Exceeded working capital target ▪ Achieved cash conversion cycle of 74 days One day below target of 75 Year - over - year improvement of 20 days ▪ Implementing strategies for further improvement in 2017 Strong cash flows and 38 th consecutive quarter of buybacks ▪ Full year operating cash flows of $ 273 million ▪ Returned $42 million of domestic cash through buybacks in 2016
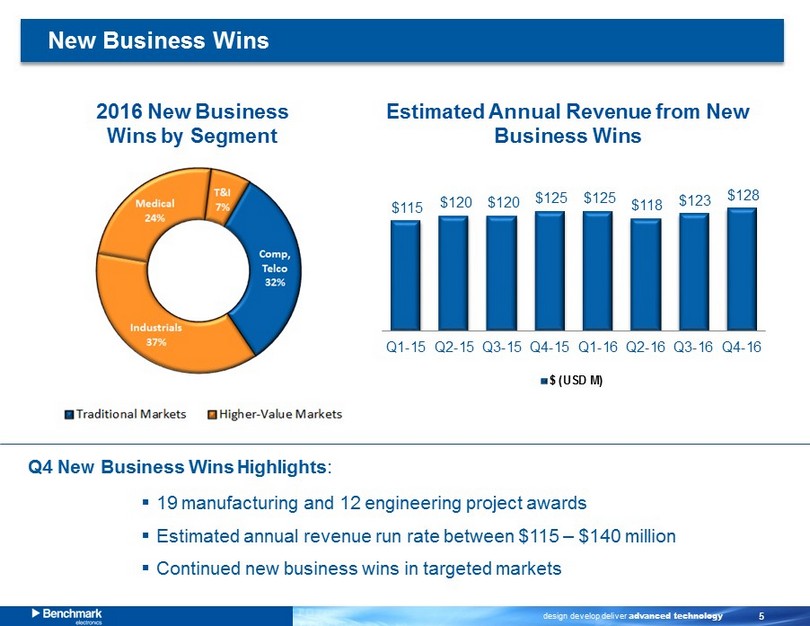
design develop deliver advanced technology 5 2016 New Business Wins by Segment ▪ 1 9 manufacturing and 12 engineering project awards ▪ Estimated annual revenue run rate between $115 – $140 million ▪ Continued new business wins in targeted markets Estimated Annual Revenue from New Business Wins New Business Wins $115 $120 $120 $125 $125 $118 $123 $128 $- $10 $20 $30 $40 $50 $60 $70 $80 $90 $100 $110 $120 $130 $140 $150 $160 Q1-15 Q2-15 Q3-15 Q4-15 Q1-16 Q2-16 Q3-16 Q4-16 $ (USD M) Q4 New Business Wins Highlights :

design develop deliver advanced technology 6 (In millions, except EPS) Dec 31 , 2016 Dec 31 , 2015 ‘15 to ’16 Y/Y Net Sales $2,310 $2,541 ($231) (9%) Gross Margin $213 $219 ($6) (3%) Gross Margin % 9.2% 8.6% 60 bps SG&A $113 $107 $6 6% SG&A % 4.9% 4.2% 70 bps Non - GAAP Operating Income $100 $112 ($12) (11%) Non - GAAP Operating Margin 4.3% 4.4% (10 bps) Non - GAAP Diluted EPS $1.45 $1.68 ($0.23) (14%) ROIC 8.4% 10.2% (180 bps) For the Twelve Months Ended 2016 Financial Summary
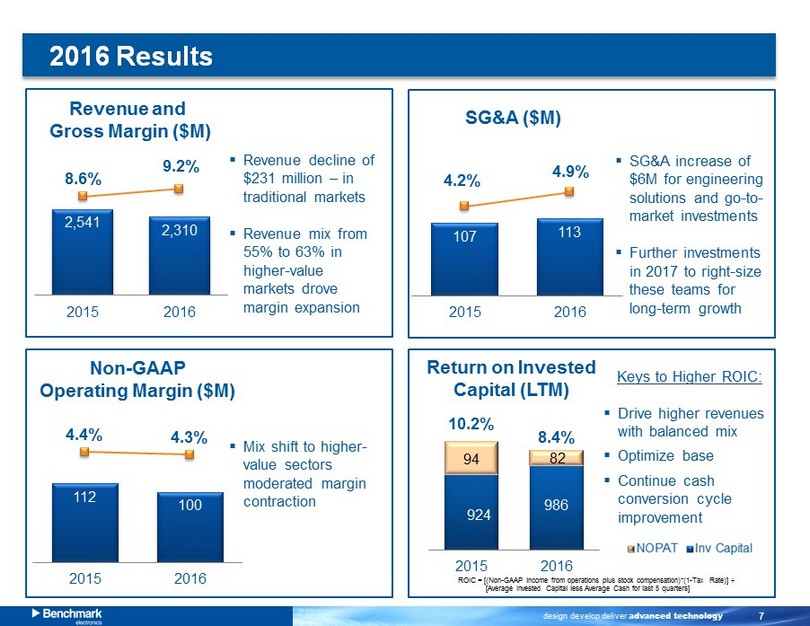
design develop deliver advanced technology 7 Keys to Higher ROIC: ▪ Drive higher revenues with balanced mix ▪ Optimize base ▪ Continue cash conversion cycle improvement 112 100 4.4% 4.3% 0.0% 1.0% 2.0% 3.0% 4.0% 5.0% 6.0% 7.0% 0 50 100 150 200 250 2015 2016 2,541 2,310 8.6% 9.2% 1.0% 3.0% 5.0% 7.0% 9.0% 11.0% 13.0% 0 500 1,000 1,500 2,000 2,500 3,000 3,500 4,000 4,500 5,000 2015 2016 924 986 0.0% 2.0% 4.0% 6.0% 8.0% 10.0% 12.0% 14.0% 2015 2016 Revenue and Gross Margin ($ M ) 2016 Results Return on Invested Capital (LTM) ROIC = [(Non - GAAP income from operations plus stock compensation )*( 1 - Tax Rate )] ÷ [ Average Invested Capital less Average Cash for last 5 quarters] Non - GAAP Operating Margin ($M) 107 113 4.2% 4.9% 0.0% 1.0% 2.0% 3.0% 4.0% 5.0% 6.0% 7.0% 8.0% 0 50 100 150 200 250 2015 2016 SG&A ($M) ▪ Mix shift to higher - value sectors moderated margin contraction ▪ SG&A increase of $6M for engineering solutions and go - to - market investments ▪ Further investments in 2017 to right - size these teams for long - term growth ▪ Revenue decline of $231 million – in traditional markets ▪ Revenue mix from 55% to 63% in higher - value markets drove margin expansion 10.2% 8.4% 94 8 2
design develop deliver advanced technology 8 CEO Observations • Unique set of highly leverageable assets • Strong customer engagements and a dedicated/ motivated workforce • Federation of sites, built by acquisition of distressed assets and managed independently • Regional company with international sites
design develop deliver advanced technology 9 2017: Our Priorities in a Transition Year Long - Term Revenue Growth ▪ Leverage engineering solutions for higher margin engagements ▪ Balance mix of higher - value and traditional market opportunities ▪ Reorient to a market sector - focused sales organization ▪ Increase bookings to achieve growth beyond 2017 Optimizing our Customer Base ▪ Acquire appropriate new customers aligned to target markets ▪ Focus on margins and asset velocity Elevating Execution ▪ Accelerate operational excellence programs ▪ Balanced network loading to maximize profit per square foot ▪ Continue progress on cash conversion cycle improvements
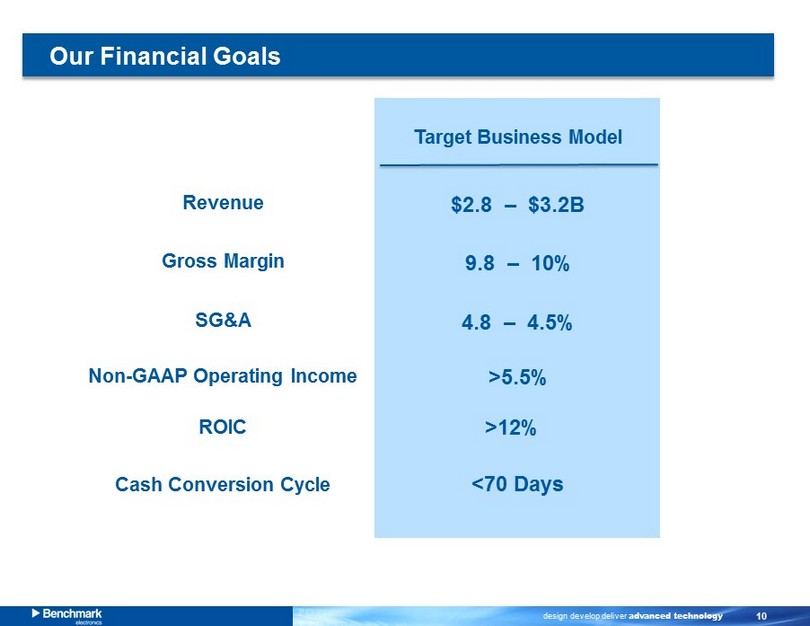
design develop deliver advanced technology 10 Our Financial Goals Revenue Gross Margin SG&A Non - GAAP Operating Income ROIC Cash Conversion Cycle $2.8 – $3.2B 9.8 – 10% 4.8 – 4.5% >5.5% >12% <70 Days Target Business Model
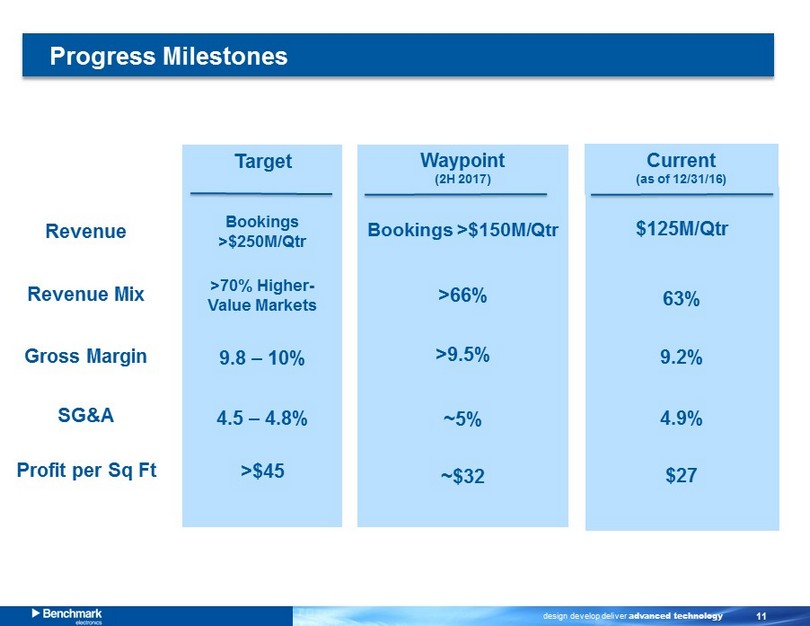
design develop deliver advanced technology 11 Progress Milestones Revenue Revenue Mix Gross Margin SG&A Profit per Sq Ft Bookings >$250M/Qtr >70% Higher - Value Markets 9.8 – 10% 4.5 – 4.8% >$45 Target Bookings >$150M/Qtr >66% >9.5% ~5% ~$32 Waypoint (2H 2017) $125M/ Q tr 63% 9.2% 4.9% $27 Current (as of 12/31/16)

design develop deliver advanced technology 12 Balanced Capital Deployment Focus on Generating Cash from Operations ▪ Continued emphasis on cash conversion cycle improvements Target range of 73 to 68 days ▪ Anticipate 2017 cash from operations in the range of $125 - 150 million Strong Balance Sheet Provides Flexibility ▪ Net cash position of $458 million ▪ Leverage ratio of 1.6x debt to EBITDA multiple is reasonable and aligned with peers ROIC: Key Determinant of Capital Allocation Strategy ▪ Organic growth through targeted investments ▪ Close - to - core, bolt - on M&A with capabilities to enable growth ▪ Share repurchases optimized for returns based on applicable law
design develop deliver advanced technology 13 Q4 & 2016 Financial Highlights
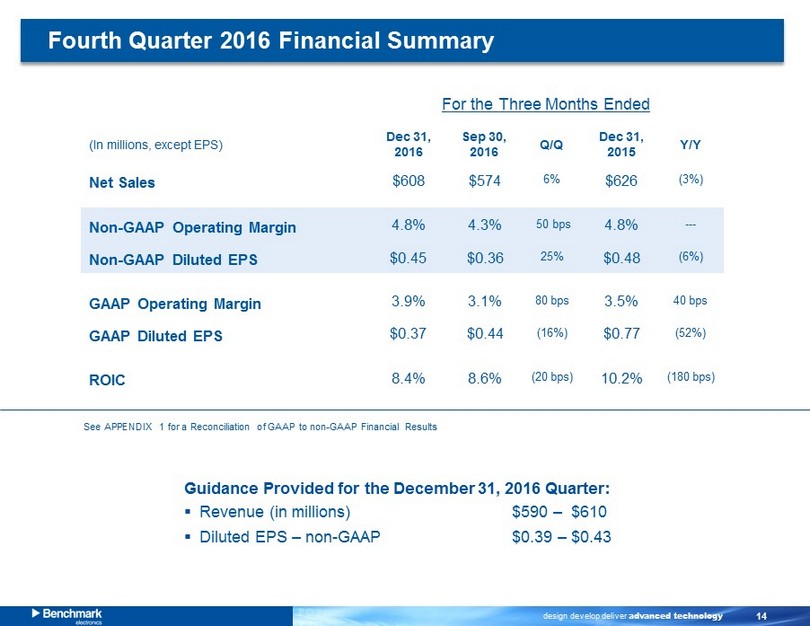
design develop deliver advanced technology 14 (In millions, except EPS) Dec 31 , 2016 Sep 30 , 2016 Q/Q Dec 31 , 2015 Y/Y Net Sales $608 $574 6% $626 (3%) Non - GAAP Operating Margin 4.8% 4.3% 50 bps 4.8% --- Non - GAAP Diluted EPS $0.45 $0.36 25% $0.48 (6%) GAAP Operating Margin 3.9% 3.1% 80 bps 3.5% 40 bps GAAP Diluted EPS $0.37 $0.44 (16%) $0.77 (52%) ROIC 8.4% 8.6% (20 bps) 10.2% (180 bps) For the Three Months Ended Guidance Provided for the December 31, 2016 Quarter: ▪ Revenue (in millions) $590 – $610 ▪ Diluted EPS – non - GAAP $0.39 – $0.43 Fourth Quarter 2016 Financial Summary See APPENDIX 1 for a Reconciliation of GAAP to non - GAAP Financial Results

design develop deliver advanced technology 15 Higher - Value Markets Dec 31 , 2016 Sep 30 , 2016 Q/Q Industrials 37% $230 38% $217 6% Medical 14% $86 15% $86 --- Test & Instrument. 11% $65 11% $66 (1%) Total Revenue $381 $369 3% Traditional Markets Dec 31 , 2016 Sep 30 , 2016 Q/Q Computing 20% $120 19% $107 12% Telecommunication s 18% $107 17% $98 8% Total Revenue $227 $205 10% Benchmark Revenue Results by Market Sector For the Three Months Ended Industrials, Computing and Telecommunications Up for Q4 - 16 (1) (1) (1) In millions (1) (1) Dec 31 , 2015 Y/Y 35% $223 3% 15% $92 (6%) 8% $51 26% $366 4% Dec 31 , 2015 Y/Y 25% $155 (23%) 17% $105 2% $260 (13%) (1) (1)
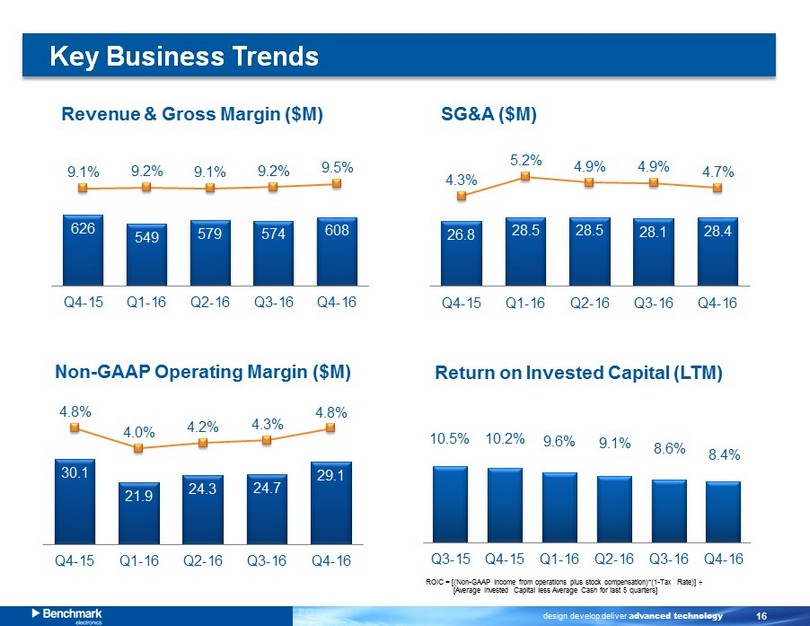
design develop deliver advanced technology 16 30.1 21.9 24.3 24.7 29.1 4.8% 4.0% 4.2% 4.3% 4.8% 0.0% 1.0% 2.0% 3.0% 4.0% 5.0% 6.0% 7.0% 0.0 10.0 20.0 30.0 40.0 50.0 60.0 Q4-15 Q1-16 Q2-16 Q3-16 Q4-16 626 549 579 574 608 9.1% 9.2% 9.1% 9.2% 9.5% 1.0% 3.0% 5.0% 7.0% 9.0% 11.0% 13.0% 15.0% 0 200 400 600 800 1,000 1,200 1,400 Q4-15 Q1-16 Q2-16 Q3-16 Q4-16 10.5% 10.2% 9.6% 9.1% 8.6% 8.4% 0.0% 2.0% 4.0% 6.0% 8.0% 10.0% 12.0% 14.0% 16.0% 18.0% 20.0% Q3-15 Q4-15 Q1-16 Q2-16 Q3-16 Q4-16 Revenue & Gross Margin ($ M ) Key Business Trends Return on Invested Capital (LTM) ROIC = [(Non - GAAP income from operations plus stock compensation )*( 1 - Tax Rate )] ÷ [ Average Invested Capital less Average Cash for last 5 quarters] Non - GAAP Operating Margin ($M) 26.8 28.5 28.5 28.1 28.4 4.3% 5.2% 4.9% 4.9% 4.7% 0.0% 1.0% 2.0% 3.0% 4.0% 5.0% 6.0% 7.0% 8.0% 0.0 10.0 20.0 30.0 40.0 50.0 60.0 70.0 Q4-15 Q1-16 Q2-16 Q3-16 Q4-16 SG&A ($M)
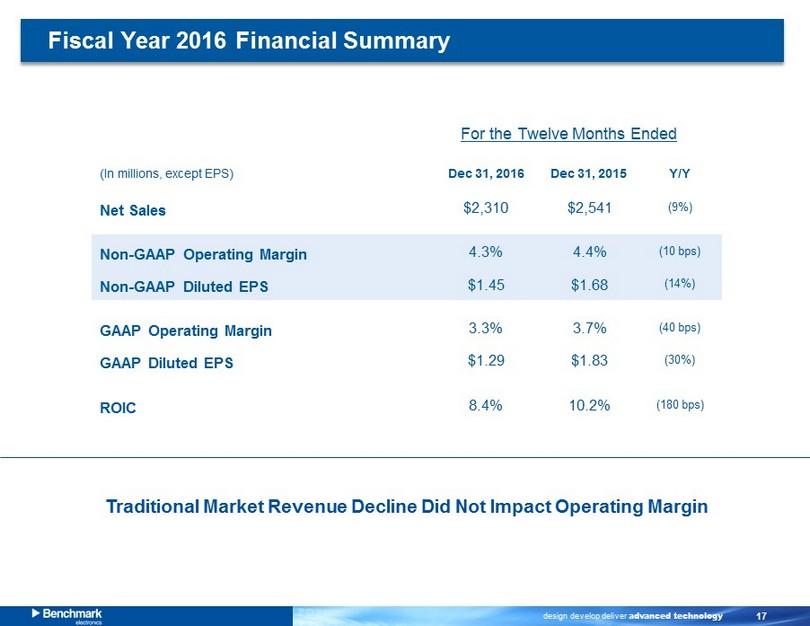
design develop deliver advanced technology 17 (In millions, except EPS) Dec 31 , 2016 Dec 31 , 2015 Y/Y Net Sales $2,310 $2,541 (9%) Non - GAAP Operating Margin 4.3% 4.4% (10 bps) Non - GAAP Diluted EPS $1.45 $1.68 (14%) GAAP Operating Margin 3.3% 3.7% (40 bps) GAAP Diluted EPS $1.29 $1.83 (30%) ROIC 8.4% 10.2% (180 bps) For the Twelve Months Ended Fiscal Year 2016 Financial Summary Traditional Market Revenue Decline Did Not Impact Operating Margin
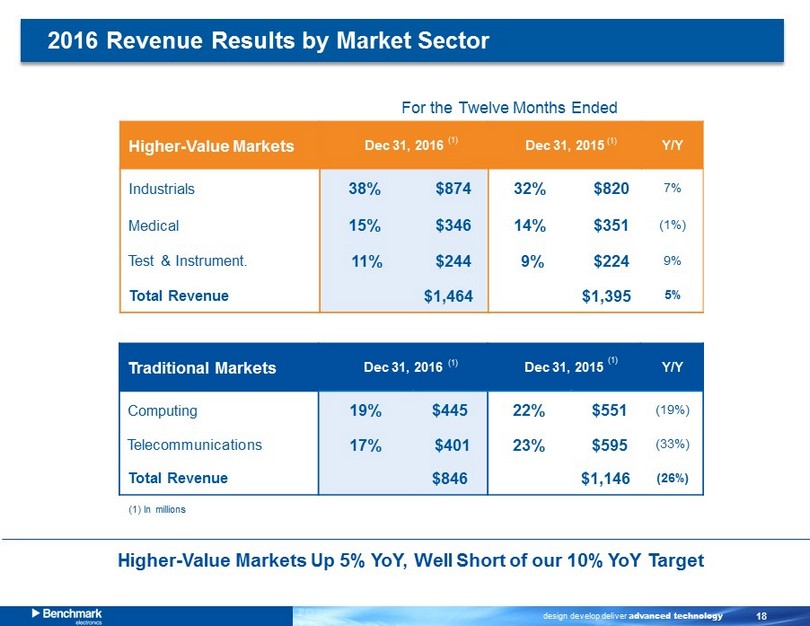
design develop deliver advanced technology 18 Higher - Value Markets Dec 31 , 2016 Dec 31 , 2015 Y/Y Industrials 38% $874 32% $820 7% Medical 15% $346 14% $351 (1%) Test & Instrument. 11% $244 9% $224 9% Total Revenue $1,464 $1,395 5% Traditional Markets Dec 31 , 2016 Dec 31 , 2015 Y/Y Computing 19% $445 22% $551 (19%) Telecommunication s 17% $401 23% $595 (33%) Total Revenue $846 $1,146 (26%) 2016 Revenue Results by Market Sector For the Twelve Months Ended Higher - Value Markets Up 5% YoY, Well Short of our 10% YoY Target (1) (1) (1) In millions (1) (1)

design develop deliver advanced technology 19 (In millions) Dec 31, 2016 Dec 31, 2015 Dec 31 , 2016 Sep 30 , 2016 Dec 31, 2015 Cash Flows from (used in) Operations $273 $147 $44 $70 $28 FCF $240 $109 $38 $61 $23 Cash $681 $466 $681 $636 $466 International $626 $424 $626 $592 $424 US $55 $42 $55 $44 $42 Inventory $381 $412 $381 $396 $412 Accounts Receivable $441 $479 $441 $417 $479 Accounts Payable $326 $251 $326 $309 $251 Cash Flow / Working Capital Highlights For the Three Months Ended (1) Free cash flow (FCF) defined as net cash provided by operations (GAAP) less capex 1 For the Twelve Months Ended Generated $273 million of Cash from Operations in 2016

design develop deliver advanced technology 20 Working Capital Update Exceeded 75 - day target exiting the year 99 91 90 94 99 83 80 75 74 25 45 65 85 105 Q1-15 Q2-15 Q3-15 Q4-15 Q1-16 Q2-16 Q3-16 Target Q4-16 Accounts Receivable Days Accounts Payable Days Inventory Days Q1-15 Q2-15 Q3-15 Q4-15 Q1-16 Q2-16 Q3-16 Q4-16 Accounts Receivable Days 71 68 67 69 68 66 65 65 Accounts Payable Days 39 43 43 40 39 47 53 53 Inventory Days 67 66 66 65 70 64 68 62 Cash Conversion Cycle 99 91 90 94 99 83 80 74
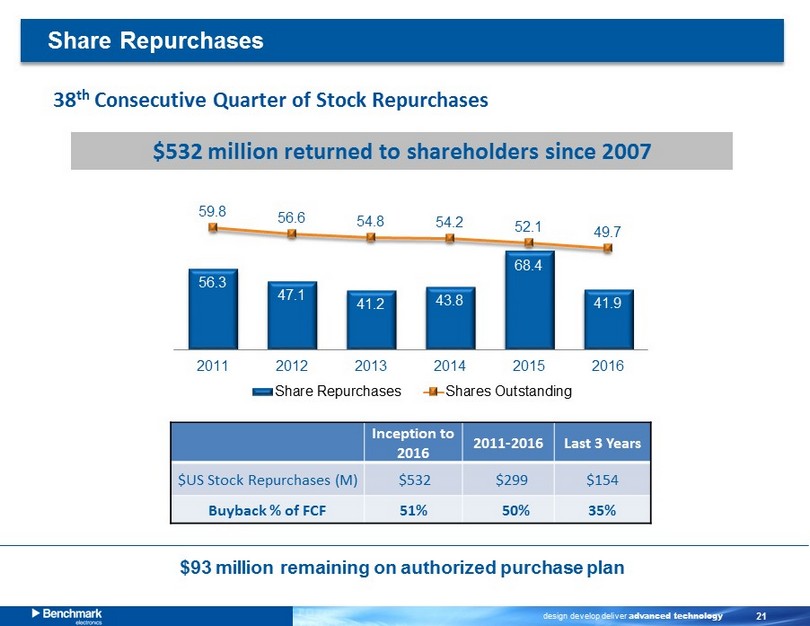
design develop deliver advanced technology 21 Share Repurchases 38 th Consecutive Quarter of Stock Repurchases $ 532 million returned to shareholders since 2007 $93 m illion remaining on authorized purchase plan Inception to 2016 2011 - 2016 Last 3 Years $US Stock Repurchases (M ) $532 $299 $154 Buyback % of FCF 51% 50% 35% 56.3 47.1 41.2 43.8 68.4 41.9 59.8 56.6 54.8 54.2 52.1 49.7 0.0 10.0 20.0 30.0 40.0 50.0 60.0 70.0 0 10 20 30 40 50 60 70 80 90 100 2011 2012 2013 2014 2015 2016 Share Repurchases Shares Outstanding

design develop deliver advanced technology 22 Guidance Net Sales (in millions) $530 – $550 Operating Margin – non - GAAP* 3.0% – 3.4% Diluted EPS – non - GAAP* $0.24 – $0.28 * The above guidance excludes the impact of amortization of intangible assets and estimated restructuring charges – See Appendix 1 First Quarter 2017 Guidance
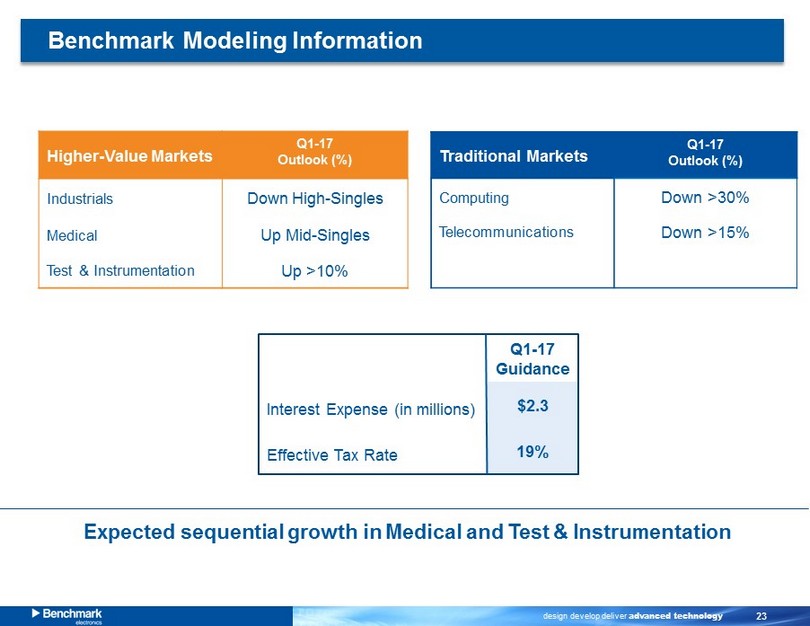
design develop deliver advanced technology 23 Higher - Value Markets Q1 - 17 Outlook (%) Industrials Down High - Singles Medical Up Mid - Singles Test & Instrumentation Up >10% Traditional Markets Q1 - 17 Outlook (%) Computing Down >30% Telecommunication s Down >15% Benchmark Modeling Information Expected sequential growth in Medical and Test & Instrumentation (1) Q1 - 17 Guidance Interest Expense (in millions) $2.3 Effective Tax Rate 19%

design develop deliver advanced technology 24 Appendix

design develop deliver advanced technology 25 APPENDIX 1 - Reconciliation of GAAP to non - GAAP Financial Results (Amounts in Thousands, Except Per Share Data) – (UNAUDITED) Dec 31, Sep 30, Dec 31, 2016 2016 2015 2016 2015 $ 23,548 $ 18,082 $ 21,905 $ 75,638 $ 92,969 2,663 3,485 6,308 12,539 13,861 2,893 3,170 1,923 11,838 4,962 $ 29,104 $ 24,737 $ 30,136 $ 100,015 $ 111,792 $ 18,568 $ 21,742 $ 39,421 $ 64,047 $ 95,401 2,663 3,485 6,308 12,539 13,861 2,893 3,170 1,923 11,838 4,962 (1,781) (2,207) (2,234) (7,695) (5,495) - (8,270) (21,174) (8,270) (21,174) $ 22,343 $ 17,920 $ 24,244 $ 72,459 $ 87,555 Basic $ 0.38 $ 0.44 $ 0.78 $ 1.30 $ 1.85 Diluted $ 0.37 $ 0.44 $ 0.77 $ 1.29 $ 1.83 Basic $ 0.46 $ 0.37 $ 0.48 $ 1.47 $ 1.70 Diluted $ 0.45 $ 0.36 $ 0.48 $ 1.45 $ 1.68 Basic 49,063 48,965 50,482 49,298 51,573 Diluted 49,544 49,414 50,914 49,825 52,088 *CS *CE Income from operations (GAAP) Net income (GAAP) Year EndedThree Months Ended December 31, Restructuring charges and other costs Amortization of intangible assets (1) (1) Beginning with the third quarter of 2016, our non-GAAP income and earnings per share exclude the impact of the amortization of intangible assets. The non-GAAP earnings per share for prior periods presented above exclude the impact of the amortization of intangible assets. (2) This amount represents the tax impact of the non-GAAP adjustments using the applicable effective tax rates. calculating earnings per share: Non-GAAP income from operations Non-GAAP net income Earnings per share: (GAAP) Earnings per share: (Non-GAAP) Restructuring charges and other costs Discrete tax benefits Weighted-average number of shares used in Income tax adjustments (2) Amortization of intangible assets (1)