Attached files
| file | filename |
|---|---|
| 8-K - 8-K - ISTAR INC. | a17-3037_18k.htm |
Exhibit 99.1
Lender Presentation January 2017
Forward-Looking Statements 1 Statements in this presentation which are not historical fact may be deemed forward-looking statements within the meaning of Section 27A of the Securities Act of 1933 and Section 21E of the Securities Exchange Act of 1934. Although iStar believes the expectations reflected in any forward-looking statements are based on reasonable assumptions, the Company can give no assurance that its expectations will be attained. Factors that could cause actual results to differ materially from iStar's expectations, including iStar’s assessments of risk reflected in its internal risk ratings and the status of land development projects contained herein, include general economic conditions and conditions in the commercial real estate and credit markets, the Company's ability to generate liquidity and to repay indebtedness as it comes due, additional loan loss provisions, the amount and timing of asset sales, changes in NPLs, repayment levels, the Company's ability to make new investments, the Company's ability to maintain compliance with its debt covenants, the Company's ability to generate income and gains from operating properties and land, legal processes and entitlement processes related to its land projects and other risks detailed from time to time in iStar’s SEC reports. The Company undertakes no duty to update any forward looking statements. All information is as of September 30, 2016, unless otherwise noted.
Executive Summary 2 iStar Inc. (the “Company”) (NYSE: STAR) is pursuing a repricing of its existing senior secured term loan facility due July 2020 iStar is one of the most experienced commercial real estate finance and investment companies in the US $4.8B1 asset base is well diversified by asset type, geography, collateral type and obligor Balance sheet includes $1.5B1 equity base Seasoned management team has led business through three business cycles Disciplined underwriting processes developed over 20 years Deeply knowledgeable asset management with sophisticated in-house capabilities Strong corporate liquidity profile and strengthened balance sheet provide additional creditor protection ~$800M2 of liquidity Leverage remains low at 2.1x3 Pro forma for this transaction, will remain primarily an unsecured borrower with UA of $4.2B Ability to retain earnings by sheltering ~$900M of income at REIT level through existing NOLs Note: All figures in the presentation are as of September 30, 2016, unless otherwise noted. 1 Gross of $433M of accumulated depreciation and general loan loss reserves 2 Represents cash and revolving credit facility capacity. 3 Calculated as book debt net of cash divided by book equity gross of accumulated depreciation, amortization and general loan loss reserves.
Transaction Overview 3 iStar is pursuing a repricing of its existing secured credit facility First lien term loan facility: L + 375 – 400 bps / 1.00% LIBOR floor / OID of 100.00 Asset Type Gross Book Value % of Pool Net Lease $373 61% Operating Property 191 31% Real Estate Finance 29 5% Land 20 3% Total GBV $613 100% Breakdown of Collateral Pool iStar will reset the 101 soft call protection in association with the repricing transaction All other terms of the facility will match the existing facility Collateral pool will match that of the existing facility (less two shorter duration loans and two land-related assets) Initial collateral coverage of 1.28x Facility will mature on July 2020 (same as existing) Minimum collateral coverage of 1.25x tested quarterly in absence of asset sales (same as existing)
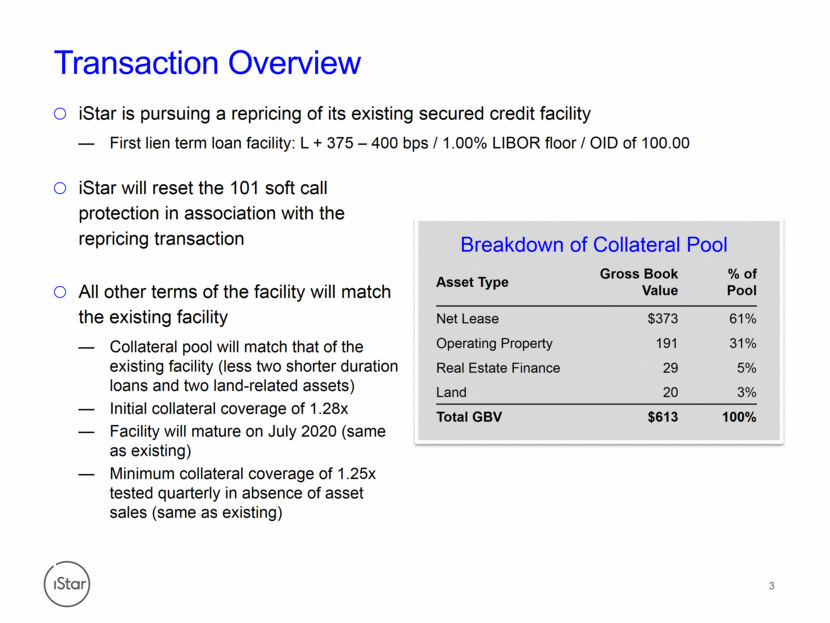
Transaction Term Sheet 4 Borrower Same as existing iStar Inc. Size $47M reduction $450M Use of Proceeds -- Repricing of iStar’s existing TL facility Security Same as existing Collateralized by either a 1st lien on or pledge of 100% of the capital stock of subsidiaries (“Collateral SPVs”) holding real estate finance assets, net lease assets, operating properties and land Negative pledge on Collateral SPV assets 80% advance rate for all assets based on undepreciated book value less any asset-specific mortgages currently outstanding Encumbered net leases only allowed as per 2012 Secured Credit Facility collateral pool Initial Collateral Coverage Same as existing 1.25x Pricing / LIBOR Floor / OID -- L + 375 – 400 bps / 1.00% LIBOR floor / OID of 100.00 Tenor Same as existing July 2020 Amortization Same as existing 1% per annum, bullet at maturity Optional Prepayments Same as existing 101 soft call for 6 months Corporate Ratings Same as existing B2/B+
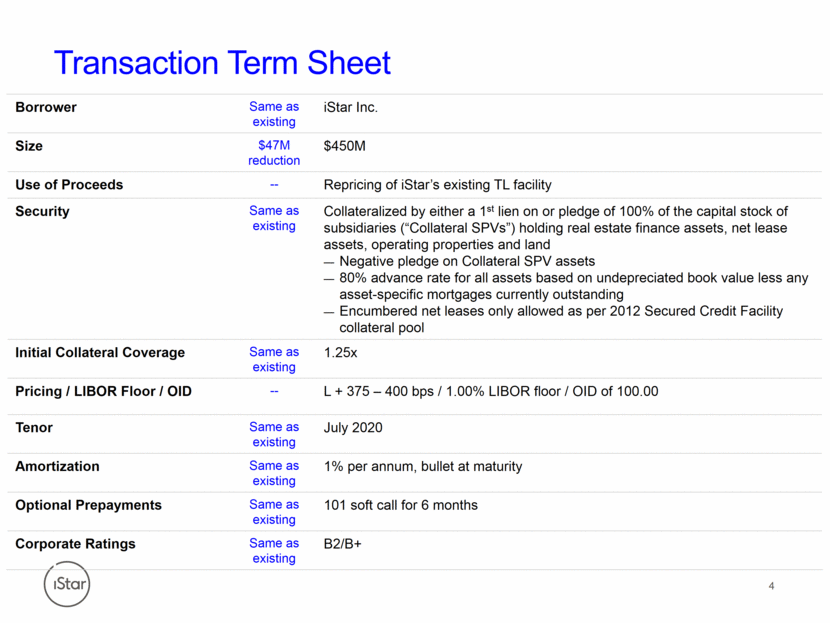
Transaction Term Sheet 5 Mandatory Prepayments Same as existing If an asset is to be monetized or removed from the collateral pool, then the Facility shall receive a prepayment at par equal to 110% of the Designated Valuation Amount After giving effect to any removal of an asset from the collateral pool and the prepayments described, the collateral coverage ratio shall be at least 1.25x Designated Valuation Amount defined as 80% of gross book value less any debt outstanding against the asset Borrowing Base Marks Same as existing GAAP gross book value Quarterly adjustments based on reserves / write-downs taken No asset valuation increases except to adjust for fundings on assets Affirmative and Negative Covenants Same as existing Minimum collateral coverage of 1.25x (tested quarterly in absence of asset sales) Conditions Precedent Same as existing Usual and customary for transactions of this type
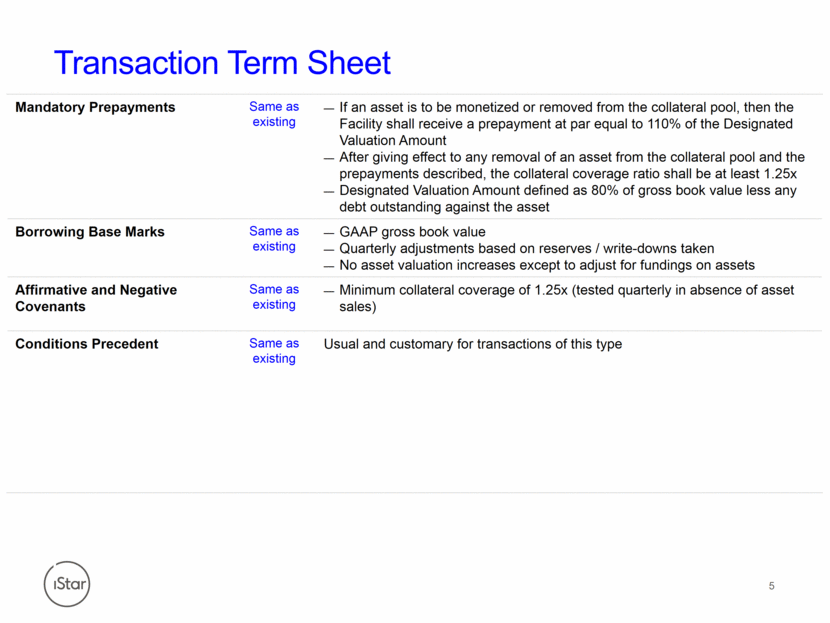
Transaction Timeline 6 January 2017 S M T W T F S 1 2 3 4 5 6 7 8 9 10 11 12 13 14 15 16 17 18 19 20 21 22 23 24 25 26 27 28 29 30 31 Important Transaction Dates Lender Call – January 24th Comments and Commitments Due from Lenders – January 26th Closing and Funding – January 31st
7 Collateral Overview
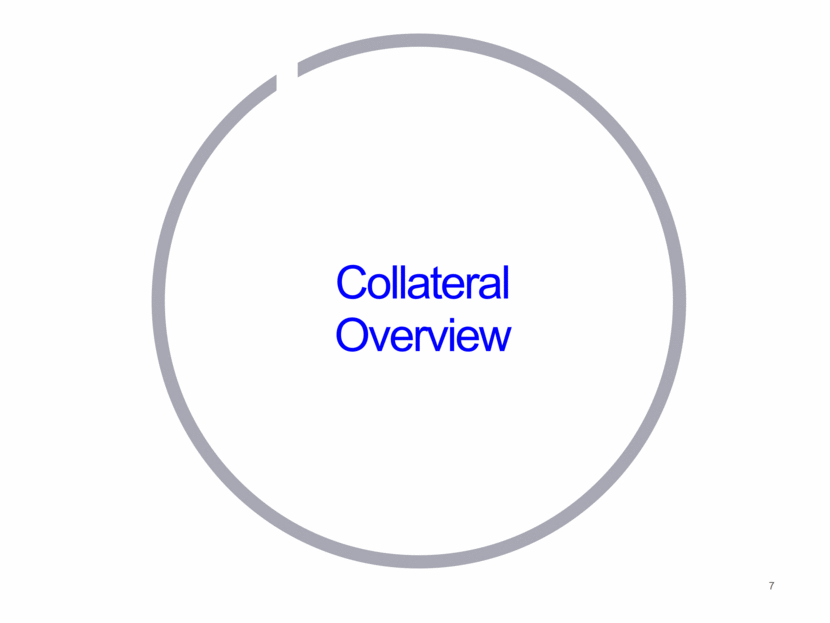
Collateral Credit Statistics 8 Original Transaction ($500M TL) Proposed Transaction ($450M TL) Gross Book Value % of Pool Gross Book Value % of Pool Sale-Leaseback / NLAs1 $371M 55% $373M 61% – Weighted Average Cap Rate 7.6% 7.6% – Weighted Average Lease Term 12.9 years 12.6 years Loans $84M 13% $29M2 5% – Weighted Average Loan to Original Cost 67% 13% – Weighted Average Coupon 8.3% 7.8% Commercial Property Assets $189M 28% $191M 31% – Weighted Average Cap Rate 5.8% 5.8% Land $28M 4% $20M2 3% – Current Basis as a % of Total Original Project Capitalization 22% 24% Total $672M 100% $613M 100% 1 Represents book value gross of accumulated depreciation and net of mortgage debt. 2 As a result of the smaller deal size, the Company removed two shorter duration loans, one land-related loan and one land project.
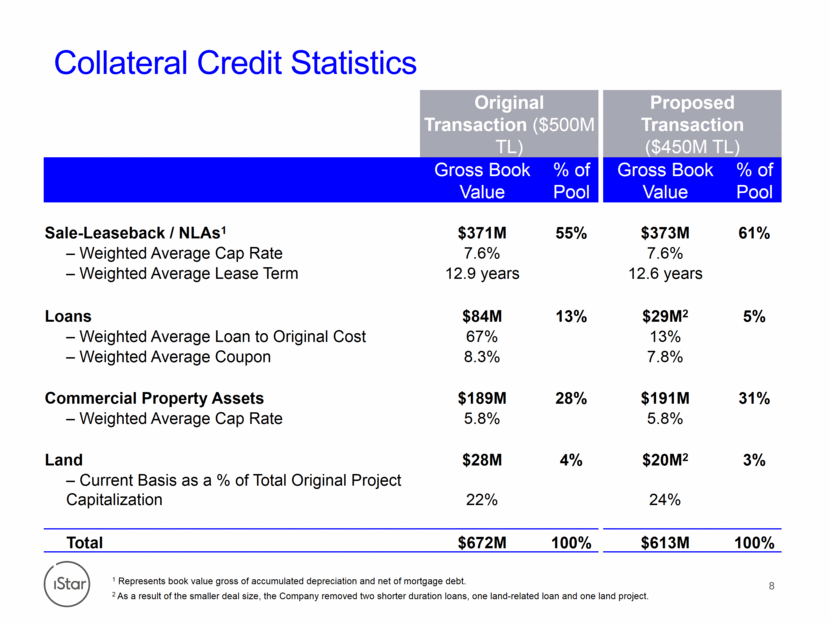
Collateral Stratification Summary 9 Value Stratification by Collateral Type1 Value Stratification by Asset Type1 Value Stratification by Capitalization1 Office $74 12% Entertainment $109 18% Retail $115 19% Hotel $40 6% Mixed Use $88 14% Industrial $157 26% Land $20 3% Performing Loans $29 5% Net Lease Assets $373 61% Non-First Dollar $180 29% Full First Dollar $433 71% Operating Assets $191 31% Value Stratification by Region1 Arizona $109 18% Georgia $55 9% Maryland $11 / 2% Texas $16 / 3% Virginia $41 / 7% New Jersey $33 / 5% Various $57 9% Massachusetts $36 / 6% (1) Designated Valuation Amounts (DVA) Florida $89 14% California $68 11% Illinois $57 9% 1 Represents book value gross of accumulated depreciation and net of mortgage debt. Land $30 5% Colorado $41 / 7%
10 Corporate Overview
Finance. Invest. Create. 11 iStar (NYSE: STAR) brings uncommon capabilities and new ways of thinking to commercial real estate, adapting its investment strategy to changing market conditions Flexibility and expertise to invest across various real estate sectors, including originating first mortgages, mezzanine loans and net lease investments, as well as developing, operating and repositioning owned real estate Fully-integrated platform brings all disciplines together in-house to underwrite and asset manage each investment Today, we are one of the most experienced public commercial real estate finance and investment companies in the U.S. Over two decades of experience and more than $35B of transactions Internal and strongly aligned management team has led business through three cycles Access to numerous capital sources, diversified $4.8B portfolio and $1.5B equity base1 1 Gross of $433M of accumulated depreciation and general loan loss reserves
Business Plan 12 Our goal is to find opportunities that offer better-than-market returns – either because they are not obvious, are off the radar or require a special set of skills to execute. One-stop, custom-tailored capital solutions Any part of the capital structure Any property type Any major US market Scale Speed Flexibility Leveraging platform and capabilities to maximize value of our operating and land development portfolios Create value: Develop, reposition, stabilize Monetization of these assets will allow us to grow earnings materially without the need to materially grow capital base New Investments Existing Portfolio
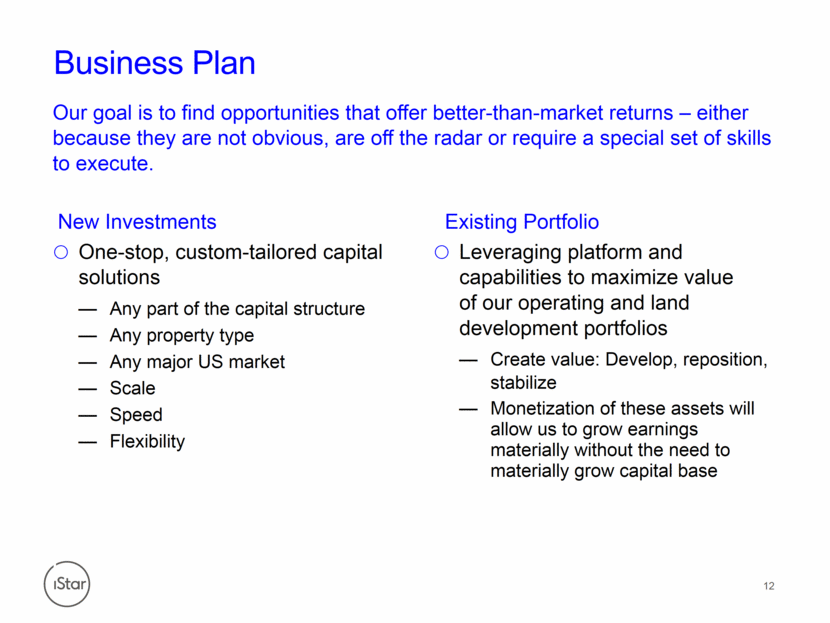
Fully-Integrated Platform 13 Real Estate Finance Net Lease Operating Properties Land & Development Underwriting Structure / Legal / Tax Credit Construction Design Servicing Capital Markets Risk Management Leasing Asset Management Relationships / JV Development iStar’s real estate platform brings a comprehensive set of skills and resources to every transaction
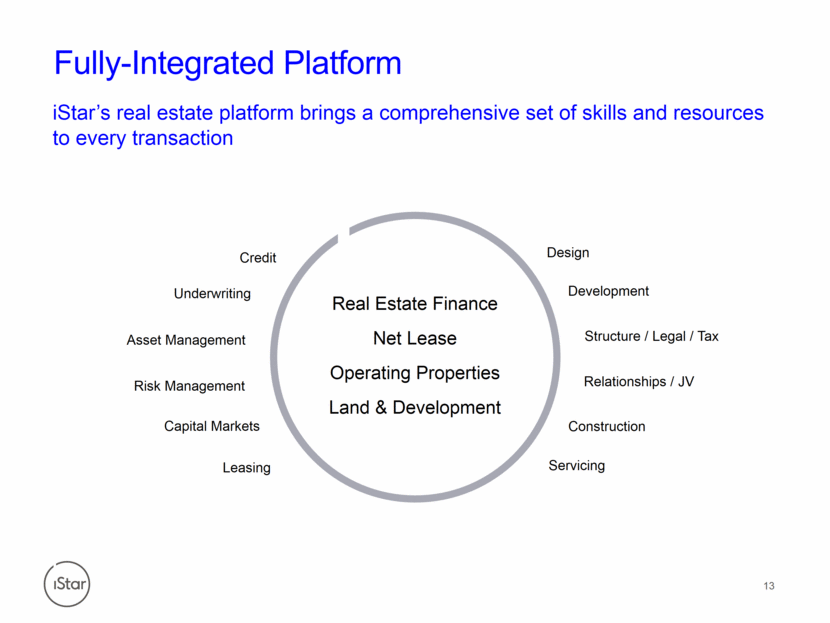
$4.8B Portfolio Overview 14 iStar is organized across four primary business segments that allow it to take advantage of its broad skill-set and fully-integrated platform across all geographic regions and property types Business Segments Geography Property Type Northeast 34% West 17% Southeast 14% Mid - Atlantic 13% Southwest 10% Various 6% Central 6% Real Estate Finance 34% Net Lease 31% Operating Properties 11% Land & Development 23% Corporate / Other 1% Land 24% Office / Industrial 20% Mixed Use 14% Hotel 12% Entertainment / Leisure 10% Residential 9% Other 6% Retail 5%
Jay Sugarman Chairman & Chief Executive Officer 32 years experience Nina Matis Chief Investment Officer / Chief Legal Officer 42 years experience Geoffrey Jervis Chief Operating Officer / Chief Financial Officer 23 years experience Officers Michelle MacKay EVP – Investments 27 years experience Barclay Jones EVP – Investments 34 years experience Vernon Schwartz EVP – Investments 39 years experience Chase Curtis EVP – Chief Credit Officer 29 years experience Timothy Doherty EVP – Investments 19 years experience David Sotolov EVP – Investments 18 years experience Julia Butler EVP – Investments 15 years experience Investments / Credit Experienced Senior Management Team Asset Management Elisha Blechner EVP - Head of Asset Management 14 years experience Greg Camia SVP – Asset Management 25 years experience John Kubicko SVP – Asset Management 26 years experience Cynthia Tucker SVP – Asset Management 35 years experience Alec Nedelman General Counsel – Real Estate 35 years experience 15
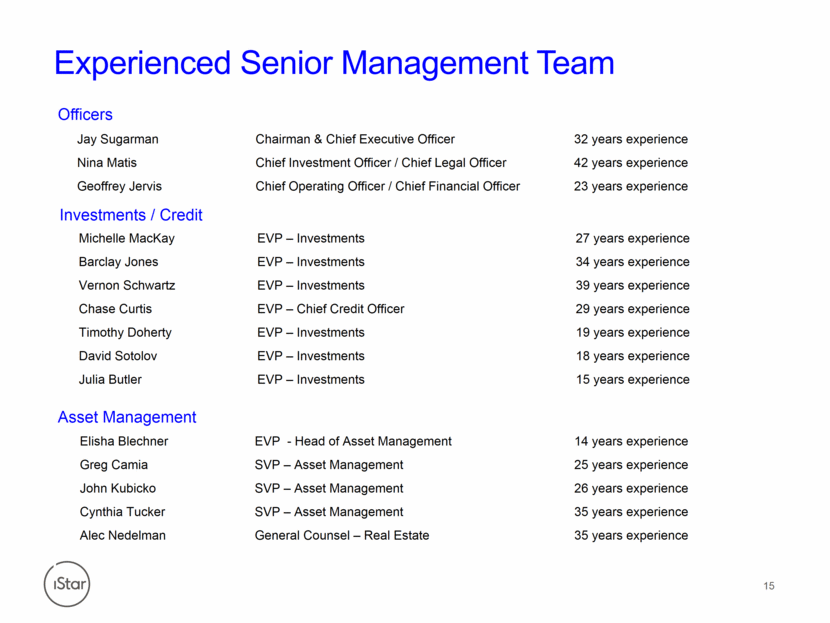
Investing in Attractive Risk-Adjusted Opportunities 16 77% of investment fundings since 2013 are within the core RE Finance and Net Lease portfolios Note: $ in millions. $149 $335 $397 $509 $351 $311 $266 $141 1H 2013 2H 2013 1H 2014 2H 2014 1H 2015 2H 2015 1H 2016 3Q 2016 RE Finance Net Lease Operating Land
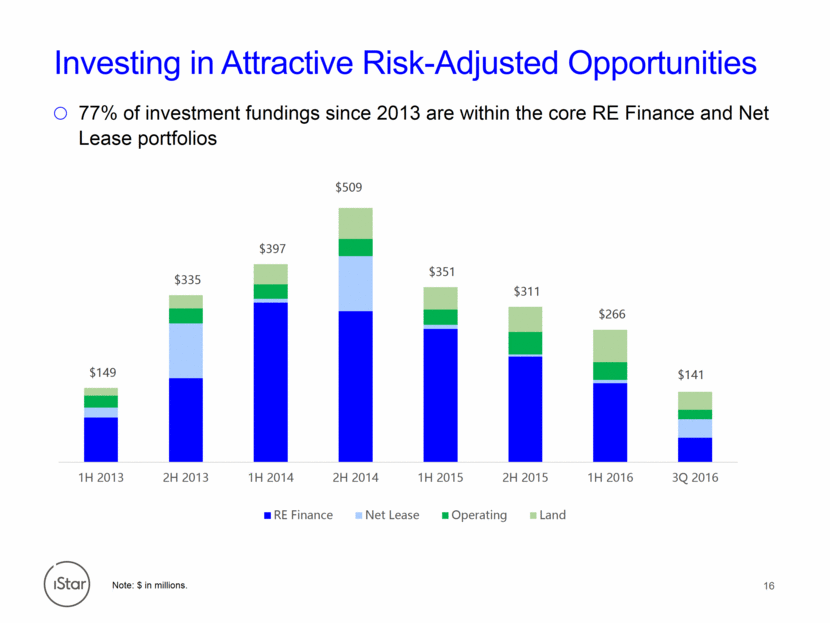
Real Estate Finance 17 Strong performance of $1.4B iStar 3.0 loan portfolio 100% performance on all loans to date Minimal legacy loans remaining 40% reduction in legacy portfolio during past year Note: $ in millions, iStar 3.0 (Post 12/31/07) 3Q’16 3Q’15 Book Value $1,366 $1,142 First Mtg / Sub 72% / 28% 64% / 36% W.A. LTV 61.5% 59.5% W.A. Yield 9.0% 9.4% W.A. RR 2.61 2.93 Legacy (Pre 12/31/07) 3Q’16 3Q’15 Book Value $287 $477 First Mtg / Sub 44% / 56% 32% / 68% W.A. LTV 89.9% 90.8%
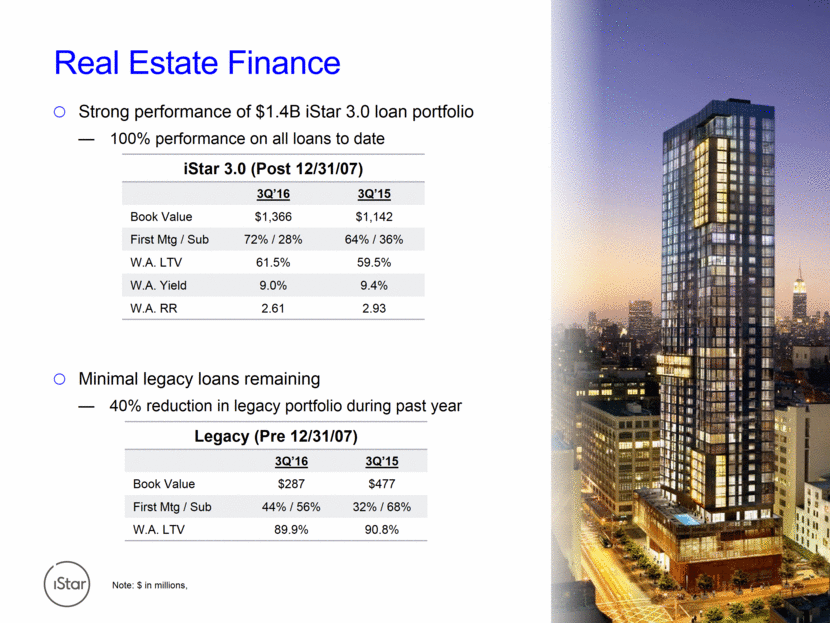
Net Lease 18 Attractive recent opportunities in core net lease business Recent Transactions: $260M of transactions closed in 2016 Example: $170M investment to construct, acquire and leaseback 343K SF Class-A office building in Maryland ~50% of total commitments remaining in $1.5B iStar managed net lease venture with sovereign wealth fund Current portfolio of $1.5B 17 million sq. ft. diversified across 33 states, property type & tenants 3Q’16 3Q’15 YOY Occupancy 99% 96% +3.1% Lease Term 15 years 15 years - Yield 8.2% 7.8% +0.4% Same Store NOI $31.1M $29.7M +4.7% Risk Rating1 1.96 2.13 -0.17 1 Risk ratings are internal metrics based on a five-point scale with 1 as the lowest risk and 5 as the highest risk. There can be no assurance that the Company’s internal assessment of risk will reflect actual results.
Operating Properties 19 $530M total operating portfolio (includes residential and commercial properties) Sold or stabilized over $3B of operating properties, recognizing $430 million of profits from sold assets Note: $ in millions. $1,642 $102 Cumulative GBV at 9/30/16 Residential Operating $1,726 $428 Cumulative GBV at 9/30/16 Commercial Operating
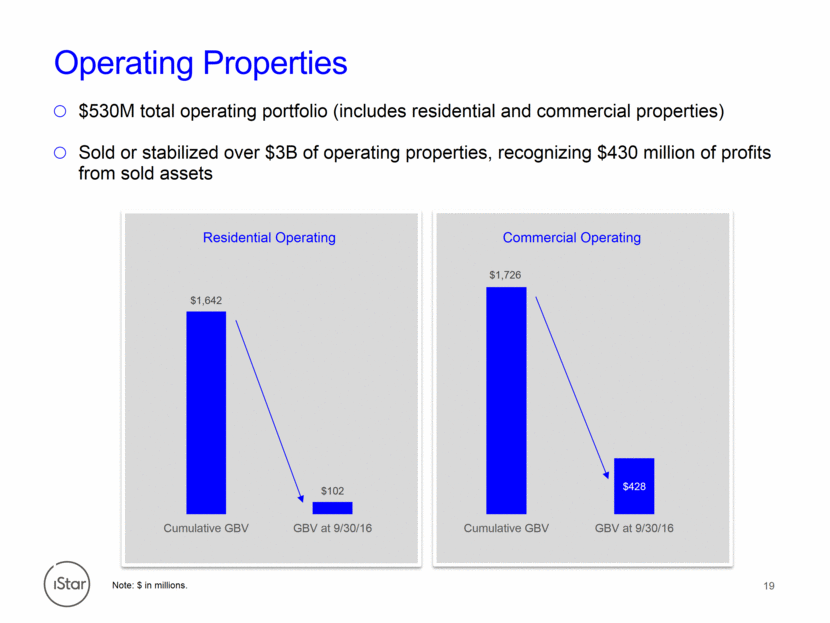
Land & Development 20 The Company has invested significantly in its land portfolio, bringing assets closer to monetization To date, iStar has sold or completed $214M of land basis and realized $122M of profits $176 $311M of capital expenditures & $59M of assets transferred in $176M of assets sold or completed and $38M of additional capex since the end of 2013 Land Status as of Today1 Land Status at Foreclosure1 Land Rollforward 1 Categories are based on internal Company assessment. There can be no assurance that the Company’s internal assessment of status will reflect actual results. $965 $751 $59 $311 $965 $1,122 2013 Q3'16 YE 2013 Book Value Assets Transfered-In Add'l Capex $38 $214 Not Entitled for Best Use / Legal Issues 79% Entitled for Best Use / Legal Resolution 21% Not Entitled for Best Use / Legal Issues 7% Entitled for Best Use / Legal Resolution 17% Development or Stabilization Underway 43% Sales Underway / Proceeds Exceed CapEx 33%
21 Credit Profile and Liquidity Update
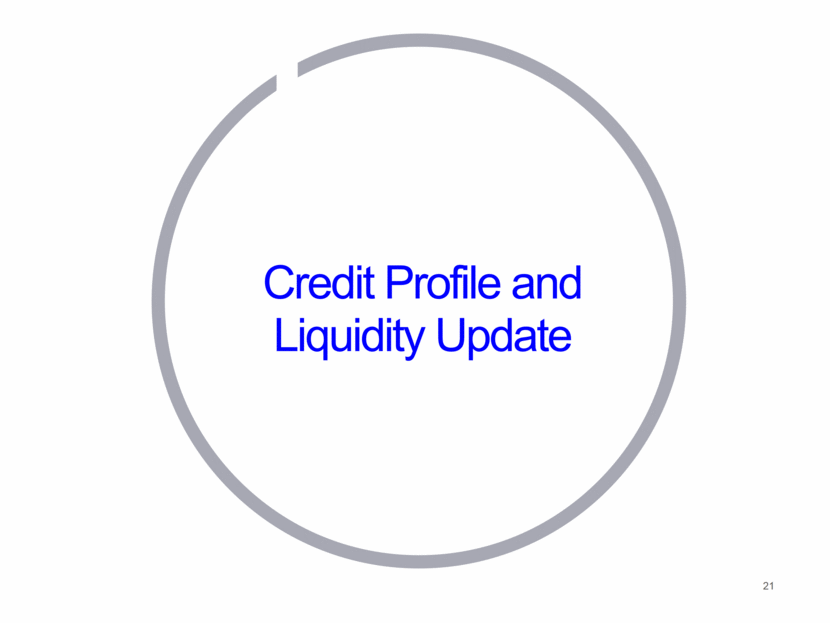
Liquidity and Capital Structure 22 1 Pro forma for repayment of convertible notes on November 15, 2016. Common Equity1 $330M Preferred Equity $750M Senior Unsecured Debt $2.7B Total Equity $1.5B Total Debt $3.4B1 Over the past year, iStar has reduced debt and accessed the capital markets on an unsecured and secured basis $261M unsecured notes repaid in March with cash $400M convertible notes matured in November, which were predominantly repaid with cash $275M 5-year unsecured notes raised in March $450M 4-year term loan raised with subsequent $50M upsize Secured Debt $733M Depreciation / Gen. Res. $433M
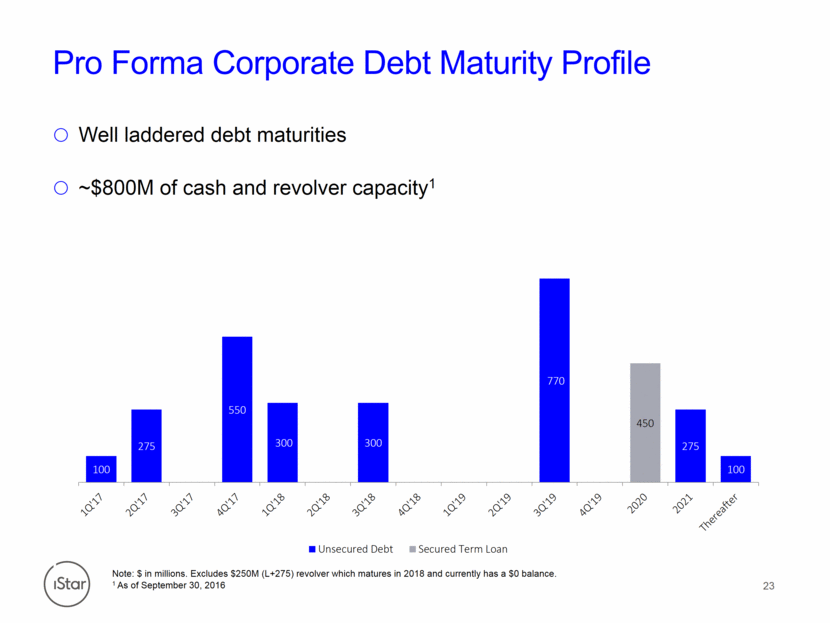
Pro Forma Corporate Debt Maturity Profile 23 Note: $ in millions. Excludes $250M (L+275) revolver which matures in 2018 and currently has a $0 balance. 1 As of September 30, 2016 Well laddered debt maturities ~$800M of cash and revolver capacity1 100 275 550 300 300 770 275 100 450 Unsecured Debt Secured Term Loan 300
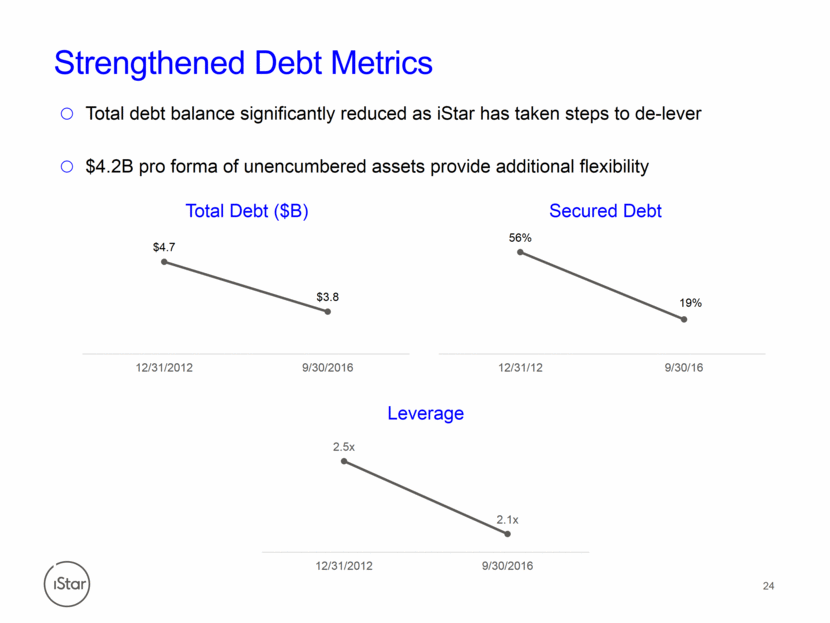
Strengthened Debt Metrics 24 Total debt balance significantly reduced as iStar has taken steps to de-lever $4.2B pro forma of unencumbered assets provide additional flexibility Secured Debt Total Debt ($B) Leverage 56% 19% 12/31/12 9/30/16 $4.7 $3.8 12/31/2012 9/30/2016 2.5x 2.1x 12/31/2012 9/30/2016
Conclusion 25 Facility offers investors a highly secure position with proven collateral performance Loan has corporate recourse and is over collateralized $4.2B of unencumbered assets pro forma the transaction and significant liquidity provide financial flexibility iStar’s platform combines a diversified balance sheet, low leverage and strong credit metrics with a seasoned internal management team
