Attached files
| file | filename |
|---|---|
| EX-12.1 - EX-12.1 - ISTAR INC. | a2201748zex-12_1.htm |
| EX-12.2 - EX-12.2 - ISTAR INC. | a2201748zex-12_2.htm |
| EX-31.0 - EX-31.0 - ISTAR INC. | a2201748zex-31_0.htm |
| EX-23.1 - EX-23.1 - ISTAR INC. | a2201748zex-23_1.htm |
| EX-32.0 - EX-32.0 - ISTAR INC. | a2201748zex-32_0.htm |
| EX-21.1 - EX-21.1 - ISTAR INC. | a2201748zex-21_1.htm |
Use these links to rapidly review the document
TABLE OF CONTENTS
Item 8. Financial Statements and Supplemental Data
UNITED STATES
SECURITIES AND EXCHANGE COMMISSION
Washington, D.C. 20549
FORM 10-K
| (Mark One) | ||
| ý | ANNUAL REPORT PURSUANT TO SECTION 13 OR 15(d) OF THE SECURITIES EXCHANGE ACT OF 1934 | |
For the fiscal year ended December 31, 2010 |
||
OR |
||
o |
TRANSITION REPORT PURSUANT TO SECTION 13 OR 15(d) OF THE SECURITIES EXCHANGE ACT OF 1934 |
|
For the transition period from to |
||
Commission File No. 1-15371 |
||
iSTAR FINANCIAL INC.
(Exact name of registrant as specified in its charter)
| Maryland | 95-6881527 | |
| (State or other jurisdiction of incorporation or organization) |
(I.R.S. Employer Identification Number) |
|
1114 Avenue of the Americas, 39th Floor New York, NY |
10036 |
|
| (Address of principal executive offices) | (Zip code) |
Registrant's telephone number, including area code: (212) 930-9400
Securities registered pursuant to Section 12(b) of the Act:
Title of each class:
|
Name of Exchange on which registered:
|
|
|---|---|---|
| Common Stock, $0.001 par value | New York Stock Exchange | |
| 8.000% Series D Cumulative Redeemable Preferred Stock, $0.001 par value |
New York Stock Exchange | |
| 7.875% Series E Cumulative Redeemable Preferred Stock, $0.001 par value |
New York Stock Exchange | |
| 7.8% Series F Cumulative Redeemable Preferred Stock, $0.001 par value |
New York Stock Exchange | |
| 7.65% Series G Cumulative Redeemable Preferred Stock, $0.001 par value |
New York Stock Exchange | |
| 7.50% Series I Cumulative Redeemable Preferred Stock, $0.001 par value |
New York Stock Exchange |
Securities registered pursuant to Section 12(g) of the Act: None
Indicate by check mark if the registrant is a well-known seasoned issuer, as defined in Rule 405 of the Securities Act. Yes ý No o
Indicate by check mark if the registrant is not required to file reports pursuant to Section 13 or Section 15(d) of the Act. Yes o No ý
Indicate by check mark whether the registrant: (i) has filed all reports required to be filed by Section 13 or 15(d) of the Securities Exchange Act of 1934 during the preceding twelve months (or for such shorter period that the registrant was required to file such reports); and (ii) has been subject to such filing requirements for the past 90 days. Yes ý No o
Indicate by check mark whether the registrant has submitted electronically and posted on its corporate Web site, if any, every Interactive Data File required to be submitted and posted pursuant to Rule 405 of Regulation S-T during the preceding 12 months (or for such shorter period that the registrant was required to submit and post such files). Yes o No o
Indicate by check mark if disclosure of delinquent filers pursuant to Item 405 of Regulation S-K is not contained herein, and will not be contained, to the best of registrant's knowledge, in definitive proxy or information statements incorporated by reference in Part III of this Form 10-K or any amendment to this Form 10-K. ý
Indicate by check mark whether the registrant is a large accelerated filer, an accelerated filer, a non-accelerated filer, or a smaller reporting company. See the definitions of "large accelerated filer," "accelerated filer," and "smaller reporting company" in Rule 12b-2 of the Exchange Act (check one):
| Large accelerated filer o | Accelerated filer ý | |
| Non-accelerated filer o (Do not check if a smaller reporting company) |
Smaller reporting company o |
Indicate by check mark whether the registrant is a shell company (as defined in Rule 12b-2 of the Act). Yes o No ý
As of June 30, 2010 the aggregate market value of the common stock, $0.001 par value per share of iStar Financial Inc. ("Common Stock"), held by non-affiliates (1) of the registrant was approximately $395.5 million, based upon the closing price of $4.46 on the New York Stock Exchange composite tape on such date.
As of March 11, 2011, there were 92,461,668 shares of Common Stock outstanding.
- (1)
- For purposes of this Annual Report only, includes all outstanding Common Stock other than Common Stock held directly by the registrant's directors and executive officers.
DOCUMENTS INCORPORATED BY REFERENCE
- 1.
- Portions of the registrant's definitive proxy statement for the registrant's 2011 Annual Meeting, to be filed within 120 days after the close of the registrant's fiscal year, are incorporated by reference into Part III of this Annual Report on Form 10-K.
Explanatory Note for Purposes of the "Safe Harbor Provisions" of Section 21E of the Securities Exchange Act of 1934, as amended
Certain statements in this report, other than purely historical information, including estimates, projections, statements relating to our business plans, objectives and expected operating results, and the assumptions upon which those statements are based, are "forward-looking statements" within the meaning of the Private Securities Litigation Reform Act of 1995, Section 27A of the Securities Act of 1933, as amended, and Section 21E of the Securities Exchange Act of 1934, as amended. Forward-looking statements are included with respect to, among other things, iStar Financial Inc.'s current business plan, business strategy, portfolio management, prospects and liquidity. These forward-looking statements generally are identified by the words "believe," "project," "expect," "anticipate," "estimate," "intend," "strategy," "plan," "may," "should," "will," "would," "will be," "will continue," "will likely result," and similar expressions. Forward-looking statements are based on current expectations and assumptions that are subject to risks and uncertainties which may cause actual results or outcomes to differ materially from those contained in the forward-looking statements. Important factors that iStar Financial Inc. believes might cause such differences are discussed in the section entitled, "Risk Factors" in Part I, Item 1a of this Form 10-K or otherwise accompany the forward-looking statements contained in this Form 10-K. We undertake no obligation to update or revise publicly any forward-looking statements, whether as a result of new information, future events or otherwise. In assessing all forward-looking statements, readers are urged to read carefully all cautionary statements contained in this Form 10-K.
Overview
iStar Financial Inc., or the "Company," is a fully-integrated finance and investment company focused on the commercial real estate industry. The Company provides custom-tailored investment capital to high-end private and corporate owners of real estate and invests directly across a range of real estate sectors. The Company, which is taxed as a real estate investment trust, or "REIT," has invested more than $35 billion over the past two decades. The Company's three primary business segments are lending, net leasing and real estate investment.
The lending portfolio is primarily comprised of senior and mezzanine real estate loans that typically range in size from $20 million to $150 million and have original terms generally ranging from three to ten years. These loans may be either fixed-rate (based on the U.S. Treasury rate plus a spread) or variable-rate (based on LIBOR plus a spread) and are structured to meet the specific financing needs of borrowers. The Company's portfolio also includes senior and subordinated loans to corporations, particularly those engaged in real estate or real estate related businesses. These financings may be either secured or unsecured, typically range in size from $20 million to $150 million and have initial maturities generally ranging from three to ten years. The Company's loan portfolio includes whole loans, loan participations and debt securities.
The Company's net lease portfolio is primarily comprised of properties owned by the Company and leased to single creditworthy tenants, where the properties are generally mission critical headquarters or distribution facilities that are subject to long-term leases. Most of the leases provide for expenses at the facility to be paid by the tenant on a triple net lease basis. Net lease transactions have initial terms generally ranging from 15 to 20 years and typically range in size from $20 million to $150 million.
The Company's real estate investment portfolio includes real estate held for investment ("REHI") and other real estate owned ("OREO") properties acquired through foreclosure or through deed-in-lieu of foreclosure in full or partial satisfaction of non-performing loans. Through the infusion of capital and/or intensive asset management, the Company generally seeks to reposition these distressed assets with the
1
objective of maximizing its recovery with respect to the investments. The Company has developed significant expertise in the ownership and repositioning of multifamily, condominium, master planned and development properties.
The Company's primary sources of revenues are interest income, which is the interest that borrowers pay on loans, and operating lease income, which is the rent that corporate customers pay to lease its properties. The Company primarily generates income through the "spread" or "margin," which is the difference between the revenues generated from loans and leases and interest expense and the cost of its net lease operations. Going forward, the Company also expects to earn income from its other real estate investments. Income from real estate investments may include operating revenues as well as income from sales of properties either in bulk or through unit sales. This income will be reduced by holding costs while the real estate investments are redeveloped, repositioned and eventually sold.
The Company began its business in 1993 through private investment funds and became publicly traded in 1998. Since that time, the Company has grown through the origination of new lending and leasing transactions, as well as through corporate acquisitions, including the acquisitions of TriNet Corporate Realty Trust, Inc. in 1999, Falcon Financial Investment Trust in 2005, a significant non-controlling interest in Oak Hill Advisors, L.P. and affiliates in 2005, and the commercial real estate lending business and loan portfolio, or "Fremont CRE," of Fremont Investment and Loan, or "Fremont," a division of Fremont General Corporation, in 2007.
Current Market Conditions
The economic recession and tightening of capital markets adversely affected the Company's business. The Company experienced significant provisions for loan losses and impairments resulting from high levels of non-performing loans and increasing amounts of real estate owned as the Company took title to assets of defaulting borrowers. The economic conditions and their effect on the Company's operations also resulted in increases in its financing costs and an inability to access the unsecured debt markets. Since the beginning of the crisis, the Company has significantly curtailed asset originations and has focused primarily on resolving problem assets, generating liquidity, retiring debt, decreasing leverage and preserving shareholder value.
The Company saw early signs of an economic recovery during 2010, including some improvements in the commercial real estate market and greater stability in the capital markets. These conditions resulted in reduced additions to non-performing loans, reductions in provisions for loan losses and increased levels of liquidity to fund operations. Despite improvement, these factors continue to have an effect on the Company's operations and operating costs. A more detailed discussion of how current market conditions have impacted the Company is provided in Item 7—"Management's Discussion and Analysis of Financial Condition and Results of Operations."
Risk Management
The Company's risk management team is a vertically integrated organization comprised of in-house professionals with expertise in asset management, legal, corporate credit, loan servicing, project and construction management and engineering. The risk management team includes a rated loan servicer, iStar Asset Services, or "iSAS," that is focused on preserving and maximizing returns from the Company's investments while providing the Company's customers with comprehensive post-closing support. The Company employs a proactive risk management strategy centered on information sharing and customer contact.
The Company has a quarterly risk rating process that enables it to evaluate, monitor and manage asset-specific credit issues and identify credit trends on a portfolio-wide basis. The quarterly risk rating process allows the Company to create a common language and framework to evaluate risk and the adequacy of the loan loss provision and reserves. A credit review of each asset is performed quarterly with
2
ratings of "1" to "5" assigned ("1" represents the lowest level of risk, "5" represents the highest level of risk).
The Company also has collateral and customer monitoring risk management systems that enable it to review the performance of its asset base. Risk management information is generated from collateral-level controls, customer reporting requirements and on-site asset and market monitoring programs.
iSAS, the Company's rated loan servicing subsidiary, and the Company's asset management personnel are responsible for managing the Company's asset base, including monitoring customers' compliance with their respective loan and leasing agreements, collecting customer payments and analyzing and distributing customer performance information. In addition, these individuals manage the construction oversight and disbursement process. iSAS performs servicing responsibilities primarily for Company owned assets.
The Company's risk management team employs an asset specific approach to managing and resolving loans that may become non-performing as well as REHI and OREO assets. Asset performance or collectability can deteriorate due to a variety of factors, including adverse market conditions, construction delays and overruns, or a borrower's financial condition or managerial capabilities. Once an asset's performance or collectability begins deteriorating and we believe the asset will become a non-performing loan ("NPL"), the team will formulate an asset resolution strategy.
For resolutions where title to collateral is obtained, the risk management team puts in place an asset-specific plan designed to maximize the value of the collateral. The plan may include completing the construction or renovation of the property, continuing the sale of condominium units, leasing or increasing the occupancy of the property, engaging a third party property manager or selling the entire asset or a partial interest to a third party. The Company may also seek to collect under guarantees of the loan.
The risk management team responsible for a non-performing loan or REHI/OREO resolution presents its proposed plan to the Company's senior management team for discussion and approval. The resolution plan is monitored on a quarterly basis and may be monitored more frequently, as necessary. Asset resolution strategies may be modified as conditions change.
Financing Strategy
The Company has utilized a wide range of debt and equity capital resources to finance its investment and growth strategies. Prior to the onset of the credit crisis, the Company's primary sources of liquidity were its unsecured bank credit facilities, issuances of unsecured debt and equity securities in capital markets transactions and repayments of loans. During 2008 and 2009, liquidity in the capital markets was severely constrained. Conditions improved somewhat in 2010, but have continued to impact the Company's cost of funds. As a result, the Company has sought alternative sources of liquidity primarily through secured debt financings and asset sales. The Company has sought, and may continue to seek, to raise capital through all means including secured financing, unsecured financing, asset sales, issuance of equity, joint ventures and other third party capital arrangements. A more detailed discussion of the Company's current liquidity and capital resources is provided in Item 7—"Management's Discussion and Analysis of Financial Condition and Results of Operations."
Investment Strategy
The Company has historically focused its investment strategy on the following:
- •
- Targeting the origination of large, custom-tailored mortgage, corporate and lease financings where customers require
flexible financial solutions and "one-call" responsiveness post-closing;
- •
- Avoiding commodity businesses where there is significant direct competition from other providers of capital;
3
- •
- Developing direct relationships with borrowers and corporate customers as opposed to sourcing transactions solely through
intermediaries;
- •
- Adding value beyond simply providing capital by offering borrowers and corporate customers specific lending expertise,
flexibility, certainty of closing and continuing relationships beyond the closing of a particular financing transaction;
- •
- Taking advantage of market anomalies in the real estate financing markets when, in the Company's view, credit was
mispriced by other providers of capital; and
- •
- Evaluating relative risk adjusted returns across multiple investment markets.
The Company's portfolio is generally characterized by:
- •
- Diversity by asset type, property type, obligor, loan/lease maturity and geography; and
- •
- Larger assets located in major metropolitan markets.
The Company significantly curtailed its new investment activity since the onset of the recent financial crisis. During this time, the Company has continued to fund pre-existing commitments to assets in its portfolio. In addition, the Company made a limited number of new investments in 2010 in assets already in its portfolio. The Company believes that it has a competitive advantage in such opportunities because of existing relationships with the customer and in-depth knowledge of the asset. The Company believes that investment opportunities within its existing $9.2 billion portfolio present attractive risk-adjusted return opportunities for the Company and expects to make additional investments of this type in the future.
4
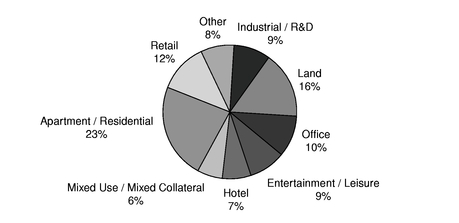
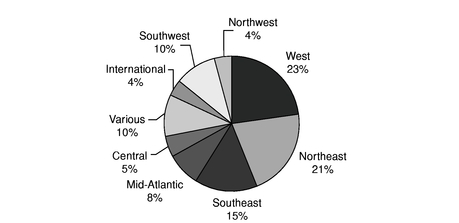
As of December 31, 2010, based on current gross carrying values, the Company's total investment portfolio has the following characteristics:
Asset Type
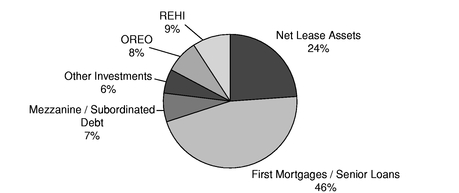
Property Type
Geography
5
Underwriting Process
The Company discusses and analyzes investment opportunities in meetings which are attended by its investment professionals, as well as representatives from its legal, credit, risk management and capital markets areas. The Company has developed a process for screening potential investments called the Six Point Methodologysm. Through this process, the Company evaluates an investment opportunity prior to beginning its formal due diligence process by: (1) evaluating the source of the opportunity; (2) evaluating the quality of the collateral or corporate credit, as well as its market or industry dynamics; (3) evaluating the equity or corporate sponsor; (4) determining whether it can implement an appropriate legal and financial structure for the transaction given its risk profile; (5) performing an alternative investment test; and (6) evaluating the liquidity of the investment and its ability to match fund the asset.
The Company's underwriting process provides for feedback and review by key disciplines within the Company, including investments, legal, credit, risk management and capital markets. Participation is encouraged from professionals in these disciplines throughout the entire origination process, from the initial consideration of the opportunity, through the Six Point Methodologysm and into the preparation and distribution of a memorandum for the Company's internal and/or Board of Directors investment committees.
Any commitment to make an investment of $25 million or less ($50 million or less in the case of a corporate debt instrument or aggregate debt instruments issued by a single corporate issuer) in any transaction or series of related transactions requires the approval of the Chief Executive Officer and Chief Investment Officer. Any commitment in an amount in excess of $25 million (or $50 million, in the case of a corporate debt instrument) but less than or equal to $75 million requires the further approval of the Company's internal investment committee, consisting of senior management representatives from all of the Company's key disciplines. Any commitment in an amount in excess of $75 million but less than or equal to $150 million requires the further approval of the Investment Committee of the Board of Directors. Any commitment in an amount in excess of $150 million, and any strategic investment such as a corporate merger, acquisition or material transaction involving the Company's entry into a new line of business, requires the approval of the full Board of Directors.
Hedging Strategy
The Company has variable-rate lending assets and variable-rate debt obligations. These assets and liabilities create a natural hedge against changes in variable interest rates. This means that, as interest rates increase, the Company earns more on its variable-rate lending assets and pays more on its variable-rate debt obligations and, conversely, as interest rates decrease, the Company earns less on its variable-rate lending assets and pays less on its variable-rate debt obligations. When the Company's variable-rate debt obligations differ significantly from its variable-rate lending assets, the Company may utilize derivative instruments to limit the impact of changing interest rates on its net income. The Company does not use derivative instruments for speculative purposes. The derivative instruments the Company uses are typically in the form of interest rate swaps and foreign currency hedges.
Industry Segments
The Company has three reportable operating segments: Real Estate Lending, Net Leasing and Real Estate Investment. The Real Estate Lending segment includes all of the Company's activities related to senior and mezzanine real estate debt and corporate capital investments. The Net Leasing segment includes all of the Company's activities related to the ownership and leasing of corporate facilities. The Real Estate Investment segment includes all of the Company's activities related to the repositioning and ultimate disposition of distressed or non-performing REHI and OREO assets. Segment revenue and profit information is presented in Item 8—"Financial Statements and Supplementary Data—Note 17."
6
Real Estate Lending
The Company's Real Estate Lending segment includes loans and other lending investments, which primarily consist of senior mortgage loans that are secured by commercial and residential real estate assets. A smaller portion of the portfolio consists of subordinated mortgage loans that are secured by subordinated interests in commercial and residential real estate assets and corporate/partnership loans, which may be senior or subordinate and corporate debt securities.
As of December 31, 2010, a portion of the Company's loan portfolio was designated as non-performing. Non-performing loans are placed on non-accrual status and reserves for loan losses are recorded to the extent these loans are determined to be impaired. See Item 8—"Financial Statements and Supplemental Data—Note 3" for a discussion of the Company's policies regarding non-performing loans and reserves for loan losses.
As of December 31, 2010, the Company's Real Estate Lending segment included the following ($ in thousands):
| |
|
% of Total |
||||||
|---|---|---|---|---|---|---|---|---|
Performing loans: |
||||||||
Senior mortgages |
$ | 2,382,875 | 44.2 | % | ||||
Subordinate mortgages |
305,245 | 5.7 | % | |||||
Corporate/Partnership loans |
678,241 | 12.6 | % | |||||
Subtotal |
3,366,361 | 62.5 | % | |||||
Non-performing loans: |
||||||||
Senior mortgages |
2,007,895 | 37.3 | % | |||||
Corporate/Partnership loans |
11,294 | 0.2 | % | |||||
Subtotal |
2,019,189 | 37.5 | % | |||||
Total gross carrying value of loans |
5,385,550 | 100.0 | % | |||||
Reserve for loan losses |
(814,625 | ) | ||||||
Total carrying value of loans |
4,570,925 | |||||||
Other lending investments—securities |
16,427 | |||||||
Total loans and other lending investments, net |
$ | 4,587,352 | ||||||
During the year ended December 31, 2010, the Company funded $356.3 million under existing loan commitments, received gross principal repayments of $2.06 billion and sold loans with a total carrying value of $808.8 million.
7
Summary of Collateral Types—As of December 31, 2010, the Company's real estate lending segment was comprised of the following collateral types ($ in thousands):
Collateral Type
|
Performing Loans and Securities(1) |
Non- performing Loans(1) |
Total | % of Total |
|||||||||
|---|---|---|---|---|---|---|---|---|---|---|---|---|---|
Apartment/Residential |
$ | 1,009,817 | $ | 588,918 | $ | 1,598,735 | 34.0 | % | |||||
Retail |
596,344 | 214,873 | 811,217 | 17.2 | % | ||||||||
Land |
379,105 | 268,536 | 647,641 | 13.7 | % | ||||||||
Hotel |
399,262 | 20,847 | 420,109 | 8.9 | % | ||||||||
Mixed Use/Mixed Collateral |
267,623 | 93,658 | 361,281 | 7.7 | % | ||||||||
Entertainment/Leisure |
193,353 | 77,801 | 271,154 | 5.8 | % | ||||||||
Office |
212,771 | 53,007 | 265,778 | 5.6 | % | ||||||||
Industrial/R&D |
98,721 | 21,330 | 120,051 | 2.6 | % | ||||||||
Other |
199,146 | 12,440 | 211,586 | 4.5 | % | ||||||||
Carrying value |
$ | 3,356,142 | $ | 1,351,410 | 4,707,552 | 100.0 | % | ||||||
General reserve for loan losses |
(120,200 | ) | |||||||||||
Total loans and other lending investments, net |
$ | 4,587,352 | |||||||||||
Explanatory Note:
- (1)
- Performing loans and securities and non-performing loans are presented net of asset-specific loan loss reserves of $26.6 million and $667.8 million, respectively.
Summary of Loan Interest Rate Characteristics—As of December 31, 2010, the Company's loans and other lending investments had the following interest rate characteristics ($ in thousands):
| |
Carrying Value |
% of Total |
Weighted Average Accrual Rate |
|||||||
|---|---|---|---|---|---|---|---|---|---|---|
Fixed-rate loans |
$ | 1,362,332 | 25.2 | % | 8.42 | % | ||||
Variable-rate loans(1) |
2,020,456 | 37.4 | % | 5.64 | % | |||||
Non-performing loans |
2,019,189 | 37.4 | % | N/A | ||||||
Gross carrying value of loans |
5,401,977 | 100.0 | % | |||||||
Reserve for loan losses |
(814,625 | ) | ||||||||
Total loans and other lending investments, net |
$ | 4,587,352 | ||||||||
Explanatory Note:
- (1)
- As of December 31, 2010, amount includes $823.5 million of loans with a weighted average interest rate floor of 3.55%.
8
Summary of Loan Maturities—As of December 31, 2010, the Company's loans and other lending investments had the following maturities ($ in thousands):
Year of Maturity
|
Number of Loans Maturing |
Carrying Value |
% of Total |
|||||||
|---|---|---|---|---|---|---|---|---|---|---|
2011 |
35 | $ | 971,844 | 18.0 | % | |||||
2012 |
20 | 818,162 | 15.1 | % | ||||||
2013 |
13 | 508,495 | 9.4 | % | ||||||
2014 |
9 | 292,352 | 5.4 | % | ||||||
2015 |
6 | 258,510 | 4.8 | % | ||||||
2016 and thereafter |
26 | 533,425 | 9.9 | % | ||||||
Total performing loans |
109 | 3,382,788 | 62.6 | % | ||||||
Non-performing loans |
47 | 2,019,189 | 37.4 | % | ||||||
Gross carrying value |
156 | 5,401,977 | 100.0 | % | ||||||
Reserve for loan losses |
(814,625 | ) | ||||||||
Total loans and other lending investments, net |
$ | 4,587,352 | ||||||||
Net Leasing
The Company has pursued the origination of net lease transactions by structuring purchase/leasebacks and by acquiring facilities subject to existing long-term net leases. In a typical purchase/leaseback transaction, the Company purchases a corporation's facility and leases it back to that corporation subject to a long-term net lease. This structure allows the corporate customer to reinvest the proceeds from the sale of its facilities into its core business, while the Company benefits from a long-term income stream. The Company generally intends to hold its net lease assets for long-term investment. However, subject to certain tax restrictions, the Company may dispose of assets if it deems the disposition to be in the Company's best interests.
Under a typical net lease agreement, the corporate customer agrees to pay a base monthly operating lease payment and all facility operating expenses (including taxes, maintenance and insurance). The Company generally seeks corporate customers that are established companies with stable core businesses or market leaders in growing or stable industries with commitments to the facilities that are mission-critical to their ongoing businesses.
During the year ended December 31, 2010, the Company sold net lease assets with a carrying value of $1.17 billion including a $1.05 billion portfolio of 32 net lease assets that represented approximately 30% of the net book value of the Company's net lease portfolio at the time of disposition. These sales resulted in gains of $270.4 million for the year ended December 31, 2010.
9
Summary of Portfolio Characteristics—As of December 31, 2010, the Company owned 311 facilities, comprising 25.2 million square feet in 35 states with a carrying value of $1.78 billion. In addition, net lease assets were 88.9% leased with a weighted average remaining lease term of approximately 13 years.
As of December 31, 2010, the Company's Net Leasing segment was comprised of the following property types:
Property Type
|
# of Leases |
% of In-Place Operating Lease Income(1) |
% of Total Revenue(2) |
|||||||
|---|---|---|---|---|---|---|---|---|---|---|
Industrial/R&D |
24 | 29.6 | % | 9.4 | % | |||||
Entertainment/Leisure |
6 | 26.4 | % | 8.4 | % | |||||
Office |
40 | 25.9 | % | 8.2 | % | |||||
Retail |
10 | 9.1 | % | 2.9 | % | |||||
Hotel |
4 | 9.0 | % | 2.9 | % | |||||
Total |
84 | 100.0 | % | |||||||
Explanatory Notes:
- (1)
- Reflects
a percentage of annualized GAAP operating lease income for leases in-place at December 31, 2010.
- (2)
- Reflects annualized GAAP operating lease income for leases in-place at December 31, 2010 as a percentage of annualized total revenue for the quarter ended December 31, 2010.
Summary of Lease Expirations—As of December 31, 2010, lease expirations on the Company's net lease assets are as follows ($ in thousands):
Year of Lease Expiration
|
Number of Leases Expiring |
Annualized In-Place Operating Lease Income(1) |
% of In-Place Operating Lease Income |
% of Total Revenue(2) |
|||||||||
|---|---|---|---|---|---|---|---|---|---|---|---|---|---|
2011 |
4 | $ | 2,919 | 1.7 | % | 0.5 | % | ||||||
2012 |
10 | 9,933 | 5.7 | % | 1.8 | % | |||||||
2013 |
4 | 1,897 | 1.1 | % | 0.3 | % | |||||||
2014 |
4 | 823 | 0.5 | % | 0.2 | % | |||||||
2015 |
5 | 3,607 | 2.0 | % | 0.7 | % | |||||||
2016 |
5 | 6,660 | 3.8 | % | 1.2 | % | |||||||
2017 |
6 | 2,627 | 1.5 | % | 0.5 | % | |||||||
2018 |
7 | 5,884 | 3.4 | % | 1.1 | % | |||||||
2019 |
3 | 2,073 | 1.2 | % | 0.4 | % | |||||||
2020 |
6 | 19,934 | 11.4 | % | 3.6 | % | |||||||
2021 and thereafter |
30 | 118,222 | 67.7 | % | 21.5 | % | |||||||
Total |
84 | $ | 174,579 | 100.0 | % | ||||||||
Weighted average remaining lease term |
12.9 years |
Explanatory Notes:
- (1)
- Reflects
annualized GAAP operating lease income for leases in-place at December 31, 2010.
- (2)
- Reflects the percentage of annualized GAAP operating lease income for leases in-place at December 31, 2010 as a percentage of annualized total revenue for the quarter ended December 31, 2010.
10
Real Estate Investment
The Real Estate Investment segment includes all of the Company's activities related to the repositioning and ultimate disposition of distressed assets. Real estate investment includes REHI and OREO properties that are acquired through foreclosure or through deed-in-lieu of foreclosure in full or partial satisfaction of non-performing loans. Properties are designated as REHI or OREO depending on the Company's business plan to realize the maximum value from the collateral received. When the Company intends to hold, operate or develop a property for a period of at least 12 months, assets are classified as REHI, and when it intends to market these properties for sale in the near term, assets are classified as OREO.
As of December 31, 2010, the Company's Real Estate Investment segment included the following ($ in thousands):
| |
Property Count |
Carrying Value |
% of Total |
||||||||
|---|---|---|---|---|---|---|---|---|---|---|---|
Real estate held for investment, net |
25 | $ | 833,060 | 52.8 | % | ||||||
Other real estate owned |
30 | 746,081 | 47.2 | % | |||||||
Total REHI and OREO |
55 | $ | 1,579,141 | 100.0 | % | ||||||
The Company generally seeks to reposition the distressed assets within this portfolio through the infusion of capital and/or intensive asset management, with the objective of maximizing its recovery with respect to the investments.
Summary of Property Types—As of December 31, 2010, the Company's Real Estate Investment segment was comprised of the following property types ($ in thousands):
Property Type
|
REHI | OREO | Total | % of Total |
|||||||||
|---|---|---|---|---|---|---|---|---|---|---|---|---|---|
Land |
$ | 637,701 | $ | 114,162 | $ | 751,863 | 47.6 | % | |||||
Apartment/Residential |
11,224 | 476,658 | 487,882 | 30.9 | % | ||||||||
Mixed Use/Mixed Collateral |
24,956 | 72,135 | 97,091 | 6.1 | % | ||||||||
Retail |
49,344 | 44,204 | 93,548 | 5.9 | % | ||||||||
Hotel |
43,058 | 15,000 | 58,058 | 3.7 | % | ||||||||
Industrial/R&D |
49,625 | 6,300 | 55,925 | 3.6 | % | ||||||||
Office |
17,152 | 16,422 | 33,574 | 2.1 | % | ||||||||
Entertainment/Leisure |
— | 1,200 | 1,200 | 0.1 | % | ||||||||
Carrying value |
$ | 833,060 | $ | 746,081 | $ | 1,579,141 | 100.0 | % | |||||
Policies with Respect to Other Activities
The Company's investment, financing and conflicts of interests policies are managed under the ultimate supervision of the Company's Board of Directors. The Company can amend, revise or eliminate these policies at anytime without a vote of shareholders. The Company currently intends to make investments in a manner consistent with the requirements of the Internal Revenue Code of 1986, as amended (the "Code") for the Company to qualify as a REIT.
Investment Restrictions or Limitations
The Company does not have any prescribed allocation among investments or product lines. Instead, the Company focuses on corporate and real estate credit underwriting to develop an analysis of the risk/reward ratios in determining the pricing and advisability of each particular transaction.
11
The Company believes that it is not, and intends to conduct its operations so as not to become, regulated as an investment company under the Investment Company Act. The Investment Company Act generally exempts entities that are "primarily engaged in purchasing or otherwise acquiring mortgages and other liens on and interests in real estate" (collectively, "Qualifying Interests"). The Company intends to rely on current interpretations of the Securities and Exchange Commission in an effort to qualify for this exemption. Based on these interpretations, the Company, among other things, must maintain at least 55% of its assets in Qualifying Interests and at least 25% of its assets in real estate- related assets (subject to reduction to the extent the Company invests more than 55% of its assets in Qualifying Interests). The Company's senior mortgages, net lease assets and certain of its subordinated mortgages generally constitute Qualifying Interests. Subject to the limitations on ownership of certain types of assets and the gross income tests imposed by the Code, the Company also may invest in the securities of other REITs, other entities engaged in real estate activities or other issuers, including for the purpose of exercising control over such entities.
Competition
The Company operates in a competitive market. See Item 1a—"Risk factors—We compete with a variety of financing and leasing sources for our customers," for a discussion of how we may be affected by competition.
Regulation
The operations of the Company are subject, in certain instances, to supervision and regulation by state and federal governmental authorities and may be subject to various laws and judicial and administrative decisions imposing various requirements and restrictions, which, among other things: (1) regulate credit granting activities; (2) establish maximum interest rates, finance charges and other charges; (3) require disclosures to customers; (4) govern secured transactions; and (5) set collection, foreclosure, repossession and claims-handling procedures and other trade practices. Although most states do not regulate commercial finance, certain states impose limitations on interest rates and other charges and on certain collection practices and creditor remedies, and require licensing of lenders and financiers and adequate disclosure of certain contract terms. The Company is also required to comply with certain provisions of the Equal Credit Opportunity Act that are applicable to commercial loans.
In the judgment of management, existing statutes and regulations have not had a material adverse effect on the business conducted by the Company. It is not possible at this time to forecast the exact nature of any future legislation, regulations, judicial decisions, orders or interpretations, nor their impact upon the future business, financial condition or results of operations or prospects of the Company.
The Company has elected and expects to continue to qualify to be taxed as a REIT under Section 856 through 860 of the Code. As a REIT, the Company must generally distribute at least 90% of its net taxable income, excluding capital gains, to its shareholders each year. In addition, the Company must distribute 100% of its net taxable income each year to avoid paying federal income taxes. REITs are also subject to a number of organizational and operational requirements in order to elect and maintain REIT qualification. These requirements include specific share ownership tests and asset and gross income tests. If the Company fails to qualify as a REIT in any taxable year, the Company will be subject to federal income tax (including any applicable alternative minimum tax) on its net taxable income at regular corporate tax rates. Even if the Company qualifies for taxation as a REIT, the Company may be subject to state and local taxes and to federal income tax and excise tax on its undistributed income.
Code of Conduct
The Company has adopted a code of business conduct for all of its employees and directors, including the Company's chief executive officer, chief financial officer, other executive officers and personnel. A
12
copy of the Company's code of conduct has been previously filed with the SEC and is incorporated by reference in this Annual Report on Form 10-K as Exhibit 14.0. The code of conduct is also available on the Company's website at www.istarfinancial.com. The Company intends to post on its website material changes to, or waivers from, its code of conduct, if any, within two days of any such event. As of December 31, 2010, there were no waivers or changes since adoption of the current code of conduct in October 2002.
Employees
As of January 31, 2011, the Company had approximately 200 employees and believes its relationships with its employees to be good. The Company's employees are not represented by any collective bargaining agreements.
Other
In addition to this Annual Report, the Company files quarterly and special reports, proxy statements and other information with the SEC. All documents are filed with the SEC and are available free of charge on the Company's corporate website, which is www.istarfinancial.com. Through the Company's website, the Company makes available free of charge its annual proxy statement, Annual Reports on Form 10-K, Quarterly Reports on Form 10-Q, Current Reports on Form 8-K, and amendments to those Reports filed or furnished pursuant to Section 13(a) or 15(d) of the Exchange Act as soon as reasonably practicable after the Company electronically files such material with, or furnishes it to, the SEC. You may also read and copy any document filed at the public reference facilities at 100 F Street, N.E., Washington, D.C. 25049. Please call the SEC at (800) SEC-0330 for further information about the public reference facilities. These documents also may be accessed through the SEC's electronic data gathering, analysis and retrieval system ("EDGAR") via electronic means, including on the SEC's homepage, which can be found at www.sec.gov.
13
In addition to the other information in this document, you should consider carefully the following risk factors in evaluating an investment in our securities. Any of these risks or the occurrence of any one or more of the uncertainties described below could have a material adverse effect on our business, financial condition, results of operations, cash flows, and trading price of our common stock. For purposes of these risk factors, the terms "we," "our" and "us" refer to iStar Financial Inc. and its consolidated subsidiaries, unless the context indicates otherwise.
Changes in general economic conditions have and may continue to adversely affect our business.
Our success is generally dependent upon economic conditions in the U.S. and, in particular, the geographic areas in which a substantial number of our investments are located. Substantially all businesses, including ours, were negatively affected by the 2008/2009 economic recession and illiquidity and volatility in the commercial real estate and credit markets. Although there were early signs of an economic recovery and greater stability in the commercial real estate and credit markets beginning in 2010, it is not possible for us to predict whether these trends will continue in the future or quantify the impact of these or other trends on our financial results. A deterioration in economic trends could have a material adverse effect on our financial performance and our ability to meet our debt obligations.
We have significant indebtedness and limitations on our liquidity and ability to raise capital may adversely affect us.
Sufficient liquidity is critical to the management of our balance sheet and our ability to meet our scheduled debt payments. However, liquidity in the capital markets has been constrained since the beginning of the credit crisis, and our cost of funds has increased. During this time, we have primarily relied on secured borrowings, repayments on our loan assets and proceeds from asset sales to fund our operations and meet our debt maturities, and we expect to continue to rely on these sources of liquidity for the foreseeable future. After giving effect to the new secured credit Facility and subsequent repayments of debt (see Item 8—"Financial Statements and Supplemental Data—Note 19"), we will have approximately $882 million of debt maturing and minimum required amortization payments due on or before December 31, 2011. Failure to repay or refinance our borrowings as they come due would have a material adverse effect on our business and stock price.
We have suffered adverse consequences as a result of our credit ratings being downgraded.
Our borrowing costs and our access to the debt capital markets depend significantly on our credit ratings. Our unsecured corporate credit ratings from major national credit rating agencies are currently below investment grade. Having below investment grade credit ratings has increased our borrowing costs and caused restrictive covenants in our public debt instruments to become operative. These factors have adversely impacted our financial performance and will continue to do so unless our credit ratings improve.
Covenants in our indebtedness could limit our flexibility and adversely affect our financial condition.
Our outstanding unsecured debt securities contain covenants that include fixed charge coverage and unencumbered assets to unsecured indebtedness ratios. The fixed charge coverage ratio in our debt securities is an incurrence test. While we expect that our ability to incur new indebtedness under the coverage ratio will be limited for the foreseeable future, we will continue to be permitted to incur indebtedness for the purpose of refinancing existing indebtedness and for other permitted purposes under the indentures. The unencumbered assets to unsecured indebtedness covenant is a maintenance covenant. If any of our covenants is breached and not cured within applicable cure periods, the breach could result in
14
acceleration of our debt securities unless a waiver or modification is agreed upon with the requisite percentage of the bondholders.
Our new secured credit Facility (see Item 8—"Financial Statements and Supplemental Data—Note 19") contains certain covenants, including covenants relating to the delivery of information to the lenders, collateral coverage, dividend payments, restrictions on fundamental changes, transactions with affiliates and matters relating to the liens granted to the lenders. In particular, we are required to maintain collateral coverage of 1.25x outstanding borrowings. In addition, for so long as we maintain our qualification as a REIT, the new secured credit Facility permits us to distribute 100% of our REIT taxable income on an annual basis. We may not pay common dividends if we cease to qualify as a REIT.
Our new secured credit Facility contains cross default provisions that would allow the lenders to declare an event of default and accelerate our indebtedness to them if we fail to pay amounts due in respect of our other recourse indebtedness in excess of specified thresholds or if the lenders under such other indebtedness are otherwise permitted to accelerate such indebtedness for any reason. The indentures governing our unsecured public debt securities permit the lenders and bondholders to declare an event of default and accelerate our indebtedness to them if we fail to pay amounts due at maturity in respect of other recourse indebtedness in excess of specified thresholds or if such indebtedness is accelerated. Our unsecured credit facilities permit the lenders to accelerate our indebtedness to them if our other recourse indebtedness in excess of specified thresholds is accelerated.
The covenants described above could limit our flexibility. In addition, a default by us on our indebtedness would have a material adverse effect on our business and the market price of our Common Stock.
Our reserves for loan losses may prove inadequate, which could have a material adverse effect on our financial results.
We maintain loan loss reserves to protect against potential losses and conduct a review of the adequacy of these reserves on a quarterly basis. Our general loan loss reserve reflects management's then-current estimation of the probability and severity of losses within our portfolio, based on this quarterly review. In addition, our determination of asset-specific loan loss reserves relies on material estimates regarding the fair value of loan collateral. Estimation of ultimate loan losses, provision expenses and loss reserves is a complex and subjective process. As such, there can be no assurance that management's judgment will prove to be correct and that reserves will be adequate over time to protect against potential future losses. Such losses could be caused by factors including, but not limited to, unanticipated adverse changes in the economy or events adversely affecting specific assets, borrowers, industries in which our borrowers operate or markets in which our borrowers or their properties are located. In particular, our non-performing loans increased materially during the financial crisis, driven by the weak economy and the disruption of the credit markets which adversely impacted the ability and willingness of many of our borrowers to service their debt and refinance our loans to them at maturity. If our reserves for credit losses prove inadequate we may suffer additional losses which would have a material adverse effect on our financial performance and results of operations.
We are required to make a number of judgments in applying accounting policies, and different estimates and assumptions could result in changes to our financial condition and results of operations.
Material estimates that are particularly susceptible to significant change relate to our determination of the reserve for loan losses, which is based primarily on the estimated fair value of loan collateral, as well as the valuation of net lease, OREO and REHI assets and intangible assets. While we have identified those accounting policies that are considered critical and have procedures in place to facilitate the associated judgments, different assumptions in the application of these policies could have a material adverse effect
15
on our financial performance and results of operations and actual results may differ materially from our estimates.
We have suffered losses when a borrower defaults on a loan and the underlying collateral is not sufficient, and we may suffer additional losses in the future.
We have suffered significant losses arising from borrower defaults on our loan assets and we may suffer additional losses in the future. In the event of a default by a borrower on a non-recourse loan, we will only have recourse to the real estate-related assets collateralizing the loan. If the underlying collateral value is less than the loan amount, we will suffer a loss. Conversely, we sometimes make loans that are unsecured or are secured only by equity interests in the borrowing entities. These loans are subject to the risk that other lenders may be directly secured by the real estate assets of the borrower. In the event of a default, those collateralized lenders would have priority over us with respect to the proceeds of a sale of the underlying real estate. In cases described above, we may lack control over the underlying asset collateralizing our loan or the underlying assets of the borrower prior to a default, and as a result the value of the collateral may be reduced by acts or omissions by owners or managers of the assets.
We sometimes obtain individual or corporate guarantees from borrowers or their affiliates, which are not secured. In cases where guarantees are not fully or partially secured, we typically rely on financial covenants from borrowers and guarantors which are designed to require the borrower or guarantor to maintain certain levels of creditworthiness. Where we do not have recourse to specific collateral pledged to satisfy such guarantees or recourse loans, we will only have recourse as an unsecured creditor to the general assets of the borrower or guarantor, some or all of which may be pledged to satisfy other lenders. There can be no assurance that a borrower or guarantor will comply with its financial covenants, or that sufficient assets will be available to pay amounts owed to us under our loans and guarantees. As a result of these factors, we may suffer additional losses which could have a material adverse effect on our financial performance.
In the event of a borrower bankruptcy, we may not have full recourse to the assets of the borrower in order to satisfy our loan. In addition, certain of our loans are subordinate to other debts of the borrower. If a borrower defaults on our loan or on debt senior to our loan, or in the event of a borrower bankruptcy, our loan will be satisfied only after the senior debt receives payment. Where debt senior to our loan exists, the presence of intercreditor arrangements may limit our ability to amend our loan documents, assign our loans, accept prepayments, exercise our remedies (through "standstill" periods) and control decisions made in bankruptcy proceedings relating to borrowers. Bankruptcy and borrower litigation can significantly increase collection costs and losses and the time necessary to acquire title to the underlying collateral, during which time the collateral may decline in value, causing us to suffer additional losses.
If the value of collateral underlying our loan declines or interest rates increase during the term of our loan, a borrower may not be able to obtain the necessary funds to repay our loan at maturity through refinancing. Decreasing collateral value and/or increasing interest rates may hinder a borrower's ability to refinance our loan because the underlying property cannot satisfy the debt service coverage requirements necessary to obtain new financing. If a borrower is unable to repay our loan at maturity, we could suffer additional loss which may adversely impact our financial performance.
We are subject to additional risks associated with loan participations.
Some of our loans are participation interests or co-lender arrangements in which we share the rights, obligations and benefits of the loan with other lenders. We may need the consent of these parties to exercise our rights under such loans, including rights with respect to amendment of loan documentation, enforcement proceedings in the event of default and the institution of, and control over, foreclosure proceedings. Similarly, a majority of the participants may be able to take actions to which we object but to
16
which we will be bound if our participation interest represents a minority interest. We may be adversely affected by this lack of full control.
We are subject to additional risk associated with foreclosed assets
We have obtained title to several assets that have served as collateral on defaulted loans. These assets are classified as REHI or OREO, based on our intention to either hold the properties over a longer period or to market them for sale in the near term. The assets are predominantly land and substantially completed condominium/multi-family projects. We must incur costs to carry these assets and in some cases make improvements to or complete the assets. These activities require additional liquidity and also result in additional expenses that impact our operating results. In addition, to the extent we need to raise liquidity through asset sales, we may be limited in our ability to sell these assets in a short time frame. We currently have several loans that are in default and to the extent the borrowers cannot cure the default, we could take title to these assets, which would require additional liquidity and further increase our expenses.
We may experience losses if the creditworthiness of our net lease asset tenants deteriorates and they are unable to meet their lease obligations.
We own the properties leased to the tenants of our net lease assets and receive rents from the tenants during the contracted term of such leases. A tenant's ability to pay rent is determined by its creditworthiness, among other factors. If a tenant's credit deteriorates, the tenant may default on its obligations under our lease and may also become bankrupt. The bankruptcy or insolvency of our tenants or other failure to pay is likely to adversely affect the income produced by our net lease assets. If a tenant defaults, we may experience delays and incur substantial costs in enforcing our rights as landlord. If a tenant files for bankruptcy, we may not be able to evict the tenant solely because of such bankruptcy or failure to pay. A court, however, may authorize a tenant to reject and terminate its lease with us. In such a case, our claim against the tenant for unpaid, future rent would be subject to a statutory cap that might be substantially less than the remaining rent owed under the lease. In addition, certain amounts paid to us within 90 days prior to the tenant's bankruptcy filing could be required to be returned to the tenant's bankruptcy estate. In any event, it is highly unlikely that a bankrupt or insolvent tenant would pay in full amounts it owes us under a lease. In other circumstances, where a tenant's financial condition has become impaired, we may agree to partially or wholly terminate the lease in advance of the termination date in consideration for a lease termination fee that is likely less than the total contractual rental amount. Without regard to the manner in which the lease termination occurs, we are likely to incur additional costs in the form of tenant improvements and leasing commissions in our efforts to lease the space to a new tenant. In any of the foregoing circumstances, our financial performance could be materially adversely affected.
Lease expirations, lease defaults and lease terminations may adversely affect our revenue.
Lease expirations and lease terminations may result in reduced revenues if the lease payments received from replacement tenants are less than the lease payments received from the expiring or terminating corporate tenants. In addition, lease defaults or lease terminations by one or more significant tenants or the failure of tenants under expiring leases to elect to renew their leases could cause us to experience long periods of vacancy with no revenue from a facility and to incur substantial capital expenditures and/or lease concessions in order to obtain replacement tenants.
We are subject to risks relating to our asset concentration.
Our portfolio consists primarily of large balance commercial real estate loans and net lease, OREO and REHI assets. Our asset base is generally diversified by asset type, obligor, property type and geographic location. However, as of December 31, 2010, approximately 23.2% of the carrying value of our assets related to apartment/residential assets, 16.3% related to land, 12.1% related to retail properties and
17
10.0% related to office properties. All of these types of collateral have been adversely affected by the financial crisis. In addition, as of December 31, 2010, approximately 22.7% of the carrying value of our assets related to properties located in the western U.S., 20.7% related to properties located in the northeastern U.S., 10.2% related to properties located in the southwest U.S and 15.1% related to properties located in the southeastern U.S. These regions include areas such as Florida, California and Nevada that were particularly hard hit by the downturn in the residential real estate markets. We may suffer additional losses on our assets based on these concentrations.
We underwrite the credit of prospective borrowers and customers and often require them to provide some form of credit support such as corporate guarantees, letters of credit and/or cash security deposits. Although our loans and other lending investments and net lease assets are geographically diverse and the borrowers and customers operate in a variety of industries, to the extent we have a significant concentration of interest or operating lease revenues from any single borrower or customer, the inability of that borrower or customer to make its payment could have an adverse effect on us. As of December 31, 2010, our five largest borrowers or tenants of net lease assets collectively accounted for approximately 23.7% of our aggregate annualized interest and operating lease revenue, of which no single customer accounts for more than 6.0%.
We compete with a variety of financing and leasing sources for our customers.
The financial services industry and commercial real estate markets are highly competitive. Our competitors include finance companies, other REITs, commercial banks and thrift institutions, investment banks and hedge funds. Our competitors seek to compete aggressively on the basis of a number of factors including transaction pricing, terms and structure. We may have difficulty competing to the extent we are unwilling to match our competitors' deal terms in order to maintain our interest margins and/or credit standards. To the extent that we match competitors' pricing, terms or structure, we may experience decreased interest margins and/or increased risk of credit losses, which could have an adverse effect on our financial performance.
We face significant competition within our net leasing business from other owners, operators and developers of properties, many of which own properties similar to ours in markets where we operate. Such competition may affect our ability to attract and retain tenants and reduce the rents we are able to charge. These competing properties may have vacancy rates higher than our properties, which may result in their owners being willing to rent space at lower rental rates than we would or providing greater tenant improvement allowances or other leasing concessions. This combination of circumstances could adversely affect our revenues and financial performance.
We are subject to certain risks associated with investing in real estate, including potential liabilities under environmental laws and risks of loss from earthquakes and terrorism.
Under various U.S. federal, state and local environmental laws, ordinances and regulations, a current or previous owner of real estate (including, in certain circumstances, a secured lender that succeeds to ownership or control of a property) may become liable for the costs of removal or remediation of certain hazardous or toxic substances at, on, under or in its property. Those laws typically impose cleanup responsibility and liability without regard to whether the owner or control party knew of or was responsible for the release or presence of such hazardous or toxic substances. The costs of investigation, remediation or removal of those substances may be substantial. The owner or control party of a site may be subject to common law claims by third parties based on damages and costs resulting from environmental contamination emanating from a site. Certain environmental laws also impose liability in connection with the handling of or exposure to asbestos-containing materials, pursuant to which third parties may seek recovery from owners of real properties for personal injuries associated with asbestos-containing materials. While a secured lender is not likely to be subject to these forms of environmental liability, when we foreclose on real property, we become an owner and are subject to the risks of environmental liability.
18
Additionally, under our net lease assets we require our tenants to undertake the obligation for environmental compliance and indemnify us from liability with respect thereto. There can be no assurance that our tenants will have sufficient resources to satisfy their obligations to us.
As of December 31, 2010, approximately 26.8% of the carrying value of our assets was located in the Western and Northwestern United States, geographic areas at higher risk for earthquakes. In addition, a significant number of our properties are located in New York City and other major urban areas which, in recent years, have been high risk geographical areas for terrorism and threats of terrorism. Future earthquakes or acts of terrorism could adversely impact the demand for, and value of, our assets and could also directly impact the value of our assets through damage, destruction or loss, and could thereafter materially impact the availability or cost of insurance to protect against these events. Although we believe our owned real estate and the properties collateralizing our loan assets are adequately covered by insurance, we cannot predict at this time if we or our borrowers will be able to obtain appropriate coverage at a reasonable cost in the future, or if we will be able to continue to pass along all of the costs of insurance to our tenants. Any earthquake or terrorist attack, whether or not insured, could have a material adverse effect on our financial performance, the market price of our Common Stock and our ability to pay dividends. In addition, there is a risk that one or more of our property insurers may not be able to fulfill its obligations with respect to claims payments due to a deterioration in its financial condition.
From time to time we make investments in companies over which we do not have sole control. Some of these companies operate in industries that differ from our current operations, with different risks than investing in real estate.
From time to time we make debt or equity investments in other companies that we may not control or over which we may not have sole control. These investments include but are not limited to: LNR Property Corporation ("LNR"), Oak Hill Advisors and other equity and mezzanine investments. Although these businesses generally have a significant real estate component, some of them operate in businesses that are different from our primary business segments including, without limitation, advising corporate credit funds and special servicing of securitized debt. Consequently, investments in these businesses, among other risks, subject us to the operating and financial risks of industries other than real estate and to the risk that we do not have sole control over the operations of these businesses. From time to time we may make additional investments in or acquire other entities that may subject us to similar risks. Investments in entities over which we do not have sole control, including joint ventures, present additional risks such as having differing objectives than our partners or the entities in which we invest, or becoming involved in disputes, or competing with those persons. In addition, we rely on the internal controls and financial reporting controls of these entities and their failure to maintain effectiveness or comply with applicable standards may adversely affect us.
Declines in the market values of our equity investments may adversely affect periodic reported results.
Most of our equity investments are in funds or companies that are not publicly traded and their fair value may not be readily determinable. We may periodically estimate the fair value of these investments, based upon available information and management's judgment. Because such valuations are inherently uncertain, they may fluctuate over short periods of time. In addition, our determinations regarding the fair value of these investments may be materially higher than the values that we ultimately realize upon their disposal, which could result in losses that have a material adverse effect on our financial performance, the market price of our common stock and our ability to pay dividends.
We may utilize derivative instruments to hedge risk, which may adversely affect our borrowing cost and expose us to other risks.
The derivative instruments we use are typically in the form of interest rate swaps and foreign currency swaps. Interest rate swaps effectively change variable-rate debt obligations to fixed-rate debt obligations or
19
fixed-rate debt obligations to variable-rate debt obligations. Foreign currency swaps limit our exposure to changes in currency rates in respect of certain investments denominated in foreign currencies.
Our use of derivative instruments also involves the risk that a counterparty to a hedging arrangement could default on its obligation and the risk that we may have to pay certain costs, such as transaction fees or breakage costs, if a hedging arrangement is terminated by us. As a matter of policy, we enter into hedging arrangements with counterparties that are large, creditworthy financial institutions typically rated at least "A/A2" by S&P and Moody's, respectively.
Developing an effective strategy for dealing with movements in interest rates and foreign currencies is complex and no strategy can completely insulate us from risks associated with such fluctuations. There can be no assurance that any hedging activities will have the desired beneficial impact on our results of operations or financial condition.
Quarterly results may fluctuate and may not be indicative of future quarterly performance.
Our quarterly operating results could fluctuate; therefore, reliance should not be placed on past quarterly results as indicative of our performance in future quarters. Factors that could cause quarterly operating results to fluctuate include, among others, variations in loan and net lease portfolio performance, levels of non-performing assets and related provisions, market values of investments, costs associated with debt, general economic conditions, the state of the real estate and financial markets and the degree to which we encounter competition in our markets.
Our ability to retain and attract key personnel is critical to our success.
Our success depends on our ability to retain our senior management and the other key members of our management team and recruit additional qualified personnel. We rely in part on equity compensation to retain and incentivize our personnel. In addition, if members of our management join competitors or form competing companies, the competition could have a material adverse effect on our business. Efforts to retain or attract professionals may result in additional compensation expense, which could affect our financial performance.
We are highly dependent on information systems, and systems failures could significantly disrupt our business.
Our business is highly dependent on communications, information, financial and operational systems. Any failure or interruption of our systems could cause delays or other problems in our business activities, which could have a material adverse effect on our operations and financial performance.
We may change certain of our policies without stockholder approval.
Our charter does not set forth specific percentages of the types of investments we may make. We can amend, revise or eliminate our investment financing and conflict of interest policies at any time at our discretion without a vote of our shareholders. A change in these policies could adversely affect our financial condition or results of operations or the market price of our common stock.
Certain provisions in our charter may inhibit a change in control.
Generally, to maintain our qualification as a REIT under the Code, not more than 50% in value of our outstanding shares of stock may be owned, directly or indirectly, by five or fewer individuals at any time during the last half of our taxable year. The Code defines "individuals" for purposes of the requirement described in the preceding sentence to include some types of entities. Under our charter, no person may own more than 9.8% of our outstanding shares of stock, with some exceptions. The restrictions
20
on transferability and ownership may delay, deter or prevent a change in control or other transaction that might involve a premium price or otherwise be in the best interest of the security holders.
We would be subject to adverse consequences if we fail to qualify as a REIT.
We believe that we have been organized and operated in a manner so as to qualify for taxation as a REIT for U.S. federal income tax purposes commencing with our taxable year ended December 31, 1998. However, our qualification as a REIT has depended and will continue to depend on our ability to meet various requirements concerning, among other things, the ownership of our outstanding stock, the nature of our assets, the sources of our income and the amount of our distributions to our shareholders. As a result of the current credit crisis, it may be difficult for us to meet one or more of the requirements for qualification as a REIT including, but not limited to, our distribution requirement.
If we were to fail to qualify as a REIT for any taxable year, we would not be allowed a deduction for distributions to our shareholders in computing our net taxable income and would be subject to U.S. federal income tax, including any applicable alternative minimum tax, or "AMT," on our net taxable income at regular corporate rates, as well as applicable state and local taxes. Unless entitled to relief under certain Code provisions, we would also be disqualified from treatment as a REIT for the four subsequent taxable years following the year during which our REIT qualification was lost. As a result, cash available for distribution would be reduced for each of the years involved. Furthermore, it is possible that future economic, market, legal, tax or other considerations may cause our REIT qualification to be revoked.
Our new secured credit Facility (see Item 8—"Financial Statements and Supplemental Data—Note 19") prohibits us from paying dividends on our common stock if we no longer qualify as a REIT.
To qualify as a REIT, we may be forced to borrow funds, sell assets or take other actions during unfavorable market conditions.
To qualify as a REIT, we generally must distribute to our shareholders at least 90% of our net taxable income, excluding net capital gains each year, and we will be subject to U.S. federal income tax, as well as applicable state and local taxes, to the extent that we distribute less than 100% of our net taxable income each year. In addition, we will be subject to a 4% nondeductible excise tax on the amount, if any, by which distributions paid by us in any calendar year are less than the sum of 85% of our ordinary income, 95% of our capital gain net income and 100% of our undistributed income from prior years. Our net taxable income could exceed our available cash flow as a result of, among other things, a difference in timing between the actual receipt of cash and inclusion of income for U.S. federal income tax purposes, the recognition of non-cash taxable income, the effect of non-deductible capital expenditures or required debt principal repayments.
In order to qualify as a REIT and avoid the payment of income and excise taxes, we may need to borrow funds on a short-term, or possibly long-term, basis, sell assets or pay distributions in the form of taxable dividends of our common stock to meet our REIT distribution requirement, even if prevailing market conditions are not favorable for these borrowings, asset dispositions or stock distributions.
Certain of our activities are subject to taxes and could result in taxes allocated to our shareholders.
Even if we qualify as a REIT for U.S. federal income tax purposes, we will be required to pay some U.S. federal, state, local and non-U.S. taxes on our income and property. We would be required to pay taxes on net taxable income that we fail to distribute to our shareholders. In addition, our "taxable REIT subsidiaries" are fully taxable corporations, and there are limitations on the ability of taxable REIT subsidiaries to make interest payments to affiliated REITs. Furthermore, we will be subject to a 100% penalty tax to the extent our economic arrangements with our tenants or our taxable REIT subsidiaries are not comparable to similar arrangements among unrelated parties. We will also be subject to a 100% tax to the extent we derive income from the sale of assets to customers in the ordinary course of business. To the
21
extent we or our taxable REIT subsidiaries are required to pay U.S. federal, state, local or non-U.S. taxes, we will have less cash available for distribution to our shareholders.
We do not intend to invest a material portion of our assets in real estate mortgage investment conduits, or "REMICs," or taxable mortgage pools. In the event we were to own REMIC or taxable mortgage pool residual interests, or treated as owning such residual interests, a portion of our income from these assets could be treated as "excess inclusion income."
IRS guidance indicates that our excess inclusion income will be allocated among our shareholders in proportion to our dividends paid. A shareholder's share of our excess inclusion income (i) would not be allowed to be offset by any net operating losses otherwise available to the shareholder, (ii) would be subject to tax as unrelated business taxable income in the hands of most tax-exempt shareholders, and (iii) would result in the application of U.S. federal income tax withholding at a rate of 30%, without reduction for any otherwise applicable income tax treaty, in the hands of a non-U.S. shareholder.
In addition, the IRS has taken the position that we are subject to tax at the highest U.S. federal corporate income tax rate on our excess inclusion income allocated to "disqualified organizations" (generally, tax-exempt investors that are not subject to U.S. federal income tax on unrelated business taxable income, including governmental organizations and charitable remainder trusts) that hold our stock in record name. Further, the IRS has taken the position that broker/dealers and nominees holding our stock in "street name" on behalf of disqualified organizations are subject to U.S. federal income tax at the highest U.S. federal corporate income tax rate on our excess inclusion income allocated to such disqualified organizations. Similarly, a regulated investment company or other pass-through entity may be subject to U.S. federal income tax at the highest U.S. federal corporate income tax rate on our excess inclusion income to the extent such entities are owned by disqualified organizations.
Our Investment Company Act exemption limits our investment discretion and loss of the exemption would adversely affect us.
We believe that we currently are not, and we intend to operate our company so that we will not be, regulated as an investment company under the Investment Company Act because we are "primarily engaged in the business of purchasing or otherwise acquiring mortgages and other liens on and interest in real estate." Specifically, we are required to invest at least 55% of our assets in "qualifying real estate assets" (that is, real estate, mortgage loans and other qualifying interests in real estate), and at least an additional 25% of our assets in other "real estate-related assets," such as mezzanine loans and unsecured investments in real estate entities, or additional qualifying real estate assets.
We will need to monitor our assets to ensure that we continue to satisfy the percentage tests. Maintaining our exemption from regulation as an investment company under the Investment Company Act limits our ability to invest in assets that otherwise would meet our investment strategies. If we fail to qualify for this exemption, we could not operate our business efficiently under the regulatory scheme imposed on investment companies under the Investment Company Act, and we could be required to restructure our activities. This would have a material adverse effect on our financial performance and the market price of our securities.
22
Item 1b. Unresolved Staff Comments
None.
The Company's principal executive and administrative offices are located at 1114 Avenue of the Americas, New York, NY 10036. Its telephone number, general facsimile number and web address are (212) 930-9400, (212) 930-9494 and www.istarfinancial.com, respectively. The lease for the Company's primary corporate office space expires in February 2021. The Company's regional offices are located in Atlanta, Georgia; Boston, Massachusetts; Chicago, Illinois; Dallas, Texas; Hartford, Connecticut; San Francisco, California and three offices in the Los Angeles, California metropolitan area (Brea, Irvine and Santa Monica).
See Item 1—"Net Leasing" and "Real Estate Investment," for a discussion of properties held by the Company for investment purposes and Item 8—"Financial Statements and Supplemental Data—Schedule III," for a detailed listing of such facilities.
The Company and/or one or more of its subsidiaries is party to various pending litigation matters that are considered ordinary routine litigation incidental to its business as a finance and investment company focused on the commercial real estate industry, including loan foreclosure and foreclosure-related proceedings. In addition to such matters, the Company or its subsidiaries is a party to, or any of their property is the subject of, the following pending legal proceedings.
Citiline Holdings, Inc., et al. v. iStar Financial, Inc., et al.
In April 2008, two putative class action complaints were filed in the United States District Court for the Southern District of New York naming the Company and certain of its current and former executive officers as defendants and alleging violations of federal securities laws. Both suits were purportedly filed on behalf of the same putative class of investors who purchased Common Stock in the Company's December 13, 2007 public offering (the "Company's Offering"). The two complaints were consolidated in a single proceeding (the "Citiline Action") on April 30, 2008.
On November 17, 2008, Plumbers Union Local No. 12 Pension Fund and Citiline Holdings, Inc. were appointed Lead Plaintiffs to pursue the Citiline Action. Plaintiffs filed a Consolidated Amended Complaint on February 2, 2009, purportedly on behalf of a putative class of investors who purchased the Company's Common Stock between December 6, 2007 and March 6, 2008 (the "Complaint"). The Complaint named as defendants the Company, certain of its current and former executive officers, and certain investment banks who served as underwriters in the Company's Offering. The Complaint reasserted claims for alleged violations of Sections 11, 12(a)(2) and 15 of the Securities Act, and added claims for alleged violations of Sections 10(b) and 20(a) of the Exchange Act. Plaintiffs allege the defendants made certain material misstatements and omissions relating to the Company's continuing operations, including the value of the Company's loan portfolio and certain debt securities held by the Company. The Complaint seeks certification as a class action, unspecified compensatory damages plus interest and attorneys fees, and rescission of the public offering. No class has been certified. The Company and its current and former officers filed a motion to dismiss the Complaint on April 27, 2009 and, on March 26, 2010, the Court issued its order granting, in part, the dismissal of certain Securities Act claims against certain of the Company's current and former officers, but denying the motion as to all claims asserted against the Company. Accordingly, the discovery process has commenced. The Company believes the Citiline Action has no merit and intends to continue defending itself vigorously against it.
23
Shareholder Derivative Actions
In April and May 2010, three separate shareholder derivative complaints were filed, purportedly on the Company's behalf against the Company's Board of Directors and certain current and former executive officers. These actions arise out of the same facts and circumstances alleged in the Citiline Action (described above) and all claim that the individual defendants breached their fiduciary duties to the Company and are liable to the Company for unjust enrichment, abuse of control, gross mismanagement and waste of corporate assets. Two of these complaints were filed in the United States District Court for the Southern District of New York and the third was filed in Supreme Court of New York, County of New York. In June 2010, the New York state court action was voluntarily dismissed by the plaintiff. Plaintiffs in the remaining two derivative actions seek monetary damages, reimbursement for professional fees, improvements in governance and controls and disgorgement of profits. The Company, as a nominal defendant on whose behalf the plaintiffs claim they are acting, has filed motions to dismiss these claims on the basis that neither shareholder has established the right to usurp the Board of Directors' power to decide whether and when a suit should be filed. Briefing on the motions to dismiss was completed in November 2010. Both motions are pending decision and no date has been set for oral argument. The individual defendants, who are separately represented by counsel, believe these claims have no merit and intend to defend themselves vigorously against these actions.
Shareholder Letters
On two occasions in 2009, the Company received letters from persons claiming to own Company shares and demanding that the Company address certain compensation, disclosure and other issues. In response to these demands, the Company appointed a special committee of independent directors. The committee, with the assistance of independent counsel, investigated the claims and concluded that the claimants either had not demonstrated they had standing to raise claims or had not sustained damages. One of these individuals, who repeatedly refused to provide any satisfactory evidence that she owned stock in the Company, has since filed suit against the Company (one of the pending derivative actions described in the preceding paragraph), alleging that certain current and former officers and directors breached their fiduciary duties to the Company, and that the special committee improperly refused her demand to initiate suit against these officers and directors on behalf of the Company. The Company has received letters from two other individuals claiming to own Company shares and demanding that the Company take action against current and former officers and directors named in the letter to recover damages arising from alleged breaches of fiduciary duties. The allegations in these two letters are materially the same as those made in the pending shareholder derivative actions described in the preceding paragraph. The shareholders on whose behalf these letters were written have complied with the special committee's request to furnish evidence of their continuous ownership of iStar shares. The special committee of independent directors is currently reviewing the claims made in these letters.
Item 4. (Removed and Reserved)
24
Item 5. Market for Registrant's Equity and Related Share Matters
The Company's Common Stock trades on the New York Stock Exchange ("NYSE") under the symbol "SFI."
The high and low closing prices per share of Common Stock are set forth below for the periods indicated.
Quarter Ended
|
High | Low | |||||
|---|---|---|---|---|---|---|---|
2010 |
|||||||
December 31, 2010 |
$ | 7.82 | $ | 3.06 | |||
September 30, 2010 |
$ | 5.22 | $ | 2.95 | |||
June 30, 2010 |
$ | 7.43 | $ | 4.46 | |||
March 31, 2010 |
$ | 5.06 | $ | 2.53 | |||
2009 |
|||||||
December 31, 2009 |
$ | 3.08 | $ | 2.09 | |||
September 30, 2009 |
$ | 3.37 | $ | 2.04 | |||
June 30, 2009 |
$ | 3.98 | $ | 2.51 | |||
March 31, 2009 |
$ | 2.99 | $ | 0.76 | |||
On March 11, 2011, the closing sale price of the Common Stock as reported by the NYSE was $9.83. The Company had 2,772 holders of record of Common Stock as of March 11, 2011.
At December 31, 2010, the Company had five series of preferred stock outstanding: 8.000% Series D Preferred Stock, 7.875% Series E Preferred Stock, 7.8% Series F Preferred Stock, 7.65% Series G Preferred Stock and 7.50% Series I Preferred Stock. Each of the Series D, E, F, G and I preferred stock is publicly traded.
Dividends
The Board of Directors has not established any minimum distribution level. In order to maintain its qualification as a REIT, the Company intends to pay dividends to its shareholders that, on an annual basis, will represent at least 90% of its taxable income (which may not necessarily equal net income as calculated in accordance with GAAP), determined without regard to the deduction for dividends paid and excluding any net capital gains. The Company has recorded net operating losses and may record net operating losses in the future, which may reduce its taxable income in future periods and lower or eliminate entirely the Company's obligation to pay dividends for such periods in order to maintain its REIT qualification.
Holders of Common Stock, vested High Performance Units and certain unvested restricted stock units and common share equivalents will be entitled to receive distributions if, as and when the Board of Directors authorizes and declares distributions. However, rights to distributions may be subordinated to the rights of holders of preferred stock, when preferred stock is issued and outstanding. In addition, the Company's new secured credit Facility (see Item 8—"Financial Statements and Supplemental Data—Note 19") permits the Company to distribute 100% of its REIT taxable income on an annual basis, for so long as the Company maintains its qualification as a REIT. The new secured credit Facility restricts the Company from paying any common dividends if it ceases to qualify as a REIT. In any liquidation, dissolution or winding up of the Company, each outstanding share of Common Stock and HPU share equivalent will entitle its holder to a proportionate share of the assets that remain after the Company pays its liabilities and any preferential distributions owed to preferred shareholders.
The Company did not declare or pay dividends on its Common Stock for the years ended December 31, 2010 and 2009. The Company declared and paid dividends aggregating $8.0 million,
25
$11.0 million, $7.8 million, $6.1 million and $9.4 million on its Series D, E, F, G, and I preferred stock, respectively, for each of the years ended December 31, 2010 and 2009. There are no dividend arrearages on any of the preferred shares currently outstanding.
Distributions to shareholders will generally be taxable as ordinary income, although all or a portion of such distributions may be designated by the Company as capital gain or may constitute a tax-free return of capital. The Company annually furnishes to each of its shareholders a statement setting forth the distributions paid during the preceding year and their characterization as ordinary income, capital gain or return of capital.
No assurance can be given as to the amounts or timing of future distributions, as such distributions are subject to the Company's taxable income after giving effect to its net operating loss carryforwards, financial condition, capital requirements, debt covenants, any change in the Company's intention to maintain its REIT qualification and such other factors as the Company's Board of Directors deems relevant. In addition, based upon recent guidance announced by the Internal Revenue Service, the Company may elect to satisfy some of its 2011 REIT distribution requirements, if any, through stock dividends.
Issuer Purchases of Equity Securities
None.
Disclosure of Equity Compensation Plan Information
| |
|
|
(c) |
|||||||
|---|---|---|---|---|---|---|---|---|---|---|
| |
|
|
Number of securities remaining available for future issuance under equity compensation plans (excluding securities reflected in column (a)) |
|||||||
| |
(a) |
(b) |
||||||||
Plans Category
|
Number of securities to be issued upon exercise of outstanding options, warrants and rights |
Weighted-average exercise price of outstanding options, warrants and rights |
||||||||
Equity compensation plans approved by security holders-stock |
142,788 | $ | 24.87 | N/A | ||||||
Equity compensation plans approved by security holders-restricted stock awards(2) |
14,614,977 | N/A | 3,595,184 | |||||||
Total |
14,757,765 | 3,595,184 | ||||||||
Explanatory Notes:
- (1)
- Stock
Options—As more fully discussed in Item 8—"Financial Statements and Supplementary Data—Note 13,"
there were 142,788 stock options outstanding as of December 31, 2010. These options, together with their weighted average exercise price, have been included in columns (a) and (b),
above.
- (2)
- Restricted Stock—The amount shown in column (a) includes 3,186,501 unvested restricted stock units which may vest in the future based on the employees' continued service to the Company and 11,146,518 unvested restricted stock units which may vest in the future if vesting conditions based on both the employees' continued service to the Company and the achievement of specified targets for shareholder return or Company performance are met. None of these unvested units are included in the Company's outstanding share balance (see Item 8—"Financial Statements and Supplementary Data—Note 13" for a more detailed description of the Company's restricted stock grants). Of the securities included in column (a), 14,006,542 restricted stock units are required to be settled on a net, after-tax basis (after deducting shares for minimum required statutory withholdings); therefore, the actual number of shares issued will be less than the gross amount of the awards. The amounts shown in column (a) also include 281,958 common stock equivalents awarded to our non-employee directors in consideration of their service to us as directors. Common stock equivalents represent rights to receive shares of Common Stock at the date the Common Stock Equivalents are settled. Common stock equivalents have dividend equivalent rights beginning on the date of grant. The amount in column (c) represents the aggregate amount of stock options, shares of restricted stock awards or other performance awards that could be granted under compensation plans approved by the Company's security holders after giving effect to previously issued awards of stock options, shares of restricted stock and other performance awards (see Item 8—"Financial Statements and Supplementary Data—Note 13" for a more detailed description of the Company's Long-Term Incentive Plans).
26
Item 6. Selected Financial Data
The following table sets forth selected financial data on a consolidated historical basis for the Company. This information should be read in conjunction with the discussions set forth in Item 7—"Management's Discussion and Analysis of Financial Condition and Results of Operations." Certain prior year amounts have been reclassified to conform to the 2010 presentation.
| |
For the Years Ended December 31, | |||||||||||||||||
|---|---|---|---|---|---|---|---|---|---|---|---|---|---|---|---|---|---|---|
| |
2010 | 2009 | 2008 | 2007 | 2006 | |||||||||||||
| |
(In thousands, except per share data and ratios) |
|||||||||||||||||
OPERATING DATA: |
||||||||||||||||||
Interest income |
$ | 364,094 | $ | 557,809 | $ | 947,661 | $ | 998,008 | $ | 575,598 | ||||||||
Operating lease income |
170,213 | 177,960 | 183,641 | 180,476 | 159,787 | |||||||||||||
Other income |
40,944 | 30,429 | 97,742 | 99,680 | 70,508 | |||||||||||||
Total revenue |
575,251 | 766,198 | 1,229,044 | 1,278,164 | 805,893 | |||||||||||||
Interest expense |
315,985 | 414,240 | 618,711 | 610,718 | 410,480 | |||||||||||||
Operating costs—net lease assets |
15,072 | 15,942 | 15,320 | 18,176 | 13,126 | |||||||||||||
Operating costs—REHI and OREO |
64,694 | 40,866 | 9,288 | 445 | — | |||||||||||||
Depreciation and amortization |
63,244 | 63,259 | 60,632 | 50,807 | 35,534 | |||||||||||||
General and administrative |
109,526 | 124,152 | 138,164 | 146,678 | 94,679 | |||||||||||||
Provision for loan losses |
331,487 | 1,255,357 | 1,029,322 | 185,000 | 14,000 | |||||||||||||
Impairment of assets |
20,521 | 126,588 | 334,534 | 143,887 | 5,386 | |||||||||||||
Other expense |
23,078 | 66,470 | 24,758 | 18,324 | 1,523 | |||||||||||||
Total costs and expenses |
943,607 | 2,106,874 | 2,230,729 | 1,174,035 | 574,728 | |||||||||||||
Income (loss) before earnings from equity method investments and other items |
(368,356 | ) | (1,340,676 | ) | (1,001,685 | ) | 104,129 | 231,165 | ||||||||||
Gain on early extinguishment of debt, net |
108,923 | 547,349 | 393,131 | 225 | — | |||||||||||||
Gain on sale of joint venture interest |
— | — | 280,219 | — | — | |||||||||||||
Earnings from equity method investments |
51,908 | 5,298 | 6,535 | 29,626 | 12,391 | |||||||||||||
Income (loss) from continuing operations |
(207,525 | ) | (788,029 | ) | (321,800 | ) | 133,980 | 243,556 | ||||||||||
Income from discontinued operations |
17,349 | 5,756 | 48,575 | 94,790 | 108,251 | |||||||||||||
Gain from discontinued operations |
270,382 | 12,426 | 91,458 | 7,832 | 24,227 | |||||||||||||
Net income (loss) |
80,206 | (769,847 | ) | (181,767 | ) | 236,602 | 376,034 | |||||||||||
Net (income) loss attributable to noncontrolling interests |
(523 |
) |
1,071 |
991 |
816 |
(1,207 |
) |
|||||||||||
Gain attributable to noncontrolling interests |
— | — | (22,249 | ) | — | — | ||||||||||||
Net income (loss) attributable to iStar Financial Inc. |
79,683 | (768,776 | ) | (203,025 | ) | 237,418 | 374,827 | |||||||||||
Preferred dividends |
(42,320 | ) | (42,320 | ) | (42,320 | ) | (42,320 | ) | (42,320 | ) | ||||||||
Net income (loss) attributable to iStar Financial Inc. and allocable to common shareholders, HPU holders and Participating Security holders(1) |
$ | 37,363 | $ | (811,096 | ) | $ | (245,345 | ) | $ | 195,098 | $ | 332,507 | ||||||
27
| |
For the Years Ended December 31, | |||||||||||||||||
|---|---|---|---|---|---|---|---|---|---|---|---|---|---|---|---|---|---|---|
| |
2010 | 2009 | 2008 | 2007 | 2006 | |||||||||||||
| |
(In thousands, except per share data and ratios) |
|||||||||||||||||
Per common share data(2): |
||||||||||||||||||
Income (loss) attributable to iStar Financial Inc. from continuing operations: |
||||||||||||||||||
Basic |
$ | (2.60 | ) | $ | (8.06 | ) | $ | (2.87 | ) | $ | 0.69 | $ | 1.68 | |||||
Diluted(3) |
$ | (2.60 | ) | $ | (8.06 | ) | $ | (2.87 | ) | $ | 0.68 | $ | 1.67 | |||||
Net income (loss) attributable to iStar Financial Inc.: |
||||||||||||||||||
Basic |
$ | 0.39 | $ | (7.88 | ) | $ | (1.85 | ) | $ | 1.48 | $ | 2.81 | ||||||
Diluted(3) |
$ | 0.39 | $ | (7.88 | ) | $ | (1.85 | ) | $ | 1.47 | $ | 2.78 | ||||||
Per HPU share data(2): |
||||||||||||||||||
Income (loss) attributable to iStar Financial Inc. from continuing operations: |
||||||||||||||||||
Basic |
$ | (494.33 | ) | $ | (1,535.20 | ) | $ | (542.40 | ) | $ | 129.80 | $ | 318.26 | |||||
Diluted(3) |
$ | (494.33 | ) | $ | (1,535.20 | ) | $ | (542.40 | ) | $ | 129.20 | $ | 315.67 | |||||
Net income (loss) attributable to iStar Financial Inc.: |
||||||||||||||||||
Basic |
$ | 72.27 | $ | (1,501.73 | ) | $ | (349.87 | ) | $ | 279.53 | $ | 530.94 | ||||||
Diluted(3) |
$ | 72.27 | $ | (1,501.73 | ) | $ | (349.87 | ) | $ | 278.07 | $ | 526.47 | ||||||
Dividends declared per common share(4) |
$ | — | $ | — | $ | 1.74 | $ | 3.60 | $ | 3.08 | ||||||||
SUPPLEMENTAL DATA: |
||||||||||||||||||
Adjusted earnings (loss) attributable to iStar Financial, Inc. and allocable to common shareholders and HPU holders(5)(6) |
$ | (223,471 | ) | $ | (708,595 | ) | $ | (359,295 | ) | $ | 355,707 | $ | 429,922 | |||||
Adjusted EBITDA(6)(7) |
$ | 777,803 | $ | 704,257 | $ | 1,606,888 | $ | 1,359,659 | $ | 935,849 | ||||||||
Ratio of Adjusted EBITDA to interest expense and preferred dividends(6)(7) |
2.0 | x | 1.4 | x | 2.3 | x | 2.0 | x | 2.0 | x | ||||||||
Ratio of earnings to fixed charges(8)(9) |
— | — | — | 1.2 | x | 1.6 | x | |||||||||||
Ratio of earnings to fixed charges and preferred dividends(9) |
— | — | — | 1.2 | x | 1.4 | x | |||||||||||
Weighted average common shares outstanding—basic |
93,244 | 100,071 | 131,153 | 126,801 | 115,023 | |||||||||||||
Weighted average common shares outstanding—diluted |
93,244 | 100,071 | 131,153 | 127,542 | 116,057 | |||||||||||||
Weighted average HPU shares outstanding—basic and diluted |
15 | 15 | 15 | 15 | 15 | |||||||||||||
Cash flows from: |
||||||||||||||||||
Operating activities |
$ | (47,396 | ) | $ | 77,795 | $ | 418,529 | $ | 561,337 | $ | 431,224 | |||||||
Investing activities |
$ | 3,738,823 | $ | 724,702 | $ | (27,943 | ) | $ | (4,745,080 | ) | $ | (2,529,260 | ) | |||||
Financing activities |
$ | (3,411,194 | ) | $ | (1,074,402 | ) | $ | 1,444 | $ | 4,182,299 | $ | 2,088,617 | ||||||
| |
As of December 31, | |||||||||||||||
|---|---|---|---|---|---|---|---|---|---|---|---|---|---|---|---|---|
| |
2010 | 2009 | 2008 | 2007 | 2006 | |||||||||||
| |
(In thousands) |
|||||||||||||||
BALANCE SHEET DATA: |
||||||||||||||||
Loans and other lending investments, net |
$ | 4,587,352 | $ | 7,661,562 | $ | 10,586,644 | $ | 10,949,354 | $ | 6,799,850 | ||||||
Net lease assets, net |
$ | 1,784,509 | $ | 2,885,896 | $ | 3,044,811 | $ | 3,309,866 | $ | 3,084,794 | ||||||
Real estate held for investment, net |
$ | 833,060 | $ | 422,664 | $ | — | $ | — | $ | — | ||||||
Other real estate owned |
$ | 746,081 | $ | 839,141 | $ | 242,505 | $ | — | $ | — | ||||||
Total assets |
$ | 9,174,514 | $ | 12,810,575 | $ | 15,296,748 | $ | 15,848,298 | $ | 11,059,995 | ||||||
Debt obligations, net |
$ | 7,345,433 | $ | 10,894,903 | $ | 12,486,404 | $ | 12,363,044 | $ | 7,833,437 | ||||||
Total equity |
$ | 1,694,659 | $ | 1,656,118 | $ | 2,446,662 | $ | 2,972,170 | $ | 3,016,372 | ||||||
Explanatory Notes:
- (1)
- HPU holders are current and former Company employees who purchased high performance common stock units under the Company's High Performance Unit Program. Participating Security holders are Company employees and directors who hold unvested restricted stock units and common stock equivalents granted under the Company's Long Term Incentive Plans.
28
- (2)
- See
Item 8—"Financial Statements and Supplementary Data—Note 14."
- (3)
- For
the years ended December 31, 2007 and 2006, net income used to calculate earnings per diluted common share and HPU share includes joint venture
income of $85 and $115, respectively.
- (4)
- The
Company generally declares common dividends in the month subsequent to the end of the quarter. During 2010 and 2009, no common dividends were declared.
During 2008, no common dividends were declared for the three month periods ended September 30, 2008 and December 31, 2008. In December of 2007, the Company declared a special $0.25
dividend due to higher taxable income generated as a result of the Company's acquisition of Fremont CRE.
- (5)
- Adjusted
earnings represents net income attributable to the Company and allocable to common shareholders, HPU holders and Participating Security holders
computed in accordance with GAAP, before depreciation, depletion, amortization, gain from discontinued operations, impairments of goodwill and intangible assets and extraordinary items. (See
Item 7—"Management's Discussion and Analysis of Financial Condition and Results of Operations," for a reconciliation of adjusted earnings to net income).
- (6)
- Both
Adjusted earnings and Adjusted EBITDA should be examined in conjunction with net income (loss) as shown in the Company's Consolidated Statements of
Operations. Neither Adjusted earnings nor Adjusted EBITDA should be considered as an alternative to net income (loss) (determined in accordance with GAAP) as an indicator of the Company's performance,
or to cash flows from operating activities (determined in accordance with GAAP) as a measure of the Company's liquidity, nor is either measure indicative of funds available to fund the Company's cash
needs or available for distribution to shareholders. Rather, Adjusted earnings and Adjusted EBITDA are additional measures the Company uses to analyze how its business is performing. As a commercial
finance company that focuses on real estate lending, net leasing and real estate investment, the Company records significant depreciation on its real estate assets and amortization of deferred
financing costs associated with its borrowings. In addition, in calculating its ratio of Adjusted EBITDA to interest expense and preferred stock dividends, the Company makes adjustments for
impairments of assets and provisions for loan losses because they are significant non-cash items and the Company believes that investors may find it useful to consider the Company's
coverage of its interest and preferred dividend payments without the effect of these non-cash items, as an additional measure to earnings to fixed charges. It should be noted that the
Company's manner of calculating Adjusted earnings and Adjusted EBITDA may differ from the calculations of similarly-titled measures by other companies.
- (7)
- Adjusted EBITDA is calculated as net income (loss) plus the sum of interest expense, depreciation, depletion and amortization, income taxes, provision for loan losses, impairment of assets, stock-based compensation expense and less the gain on early extinguishment of debt, net.
| |
For the Years Ended December 31, | ||||||||||||||||
|---|---|---|---|---|---|---|---|---|---|---|---|---|---|---|---|---|---|
| |
2010 | 2009 | 2008 | 2007 | 2006 | ||||||||||||
| |
(in thousands) |
||||||||||||||||
Net Income (loss) |
$ | 80,206 | $ | (769,847 | ) | $ | (181,767 | ) | $ | 236,602 | $ | 376,034 | |||||
Add: Interest expense(1) |
346,500 | 481,116 | 666,706 | 629,272 | 429,807 | ||||||||||||
Add: Depreciation, depletion and amortization(2) |
69,916 | 98,238 | 102,745 | 99,427 | 83,058 | ||||||||||||
Add: Joint venture depreciation and amortization |
9,858 | 17,990 | 14,466 | 40,826 | 14,941 | ||||||||||||
Add: Income taxes |
7,023 | 4,141 | 10,175 | 6,972 | 891 | ||||||||||||
Add: Provision for loan losses |
331,487 | 1,255,357 | 1,029,322 | 185,000 | 14,000 | ||||||||||||
Add: Impairment of assets(3) |
22,381 | 141,018 | 334,830 | 144,184 | 5,683 | ||||||||||||
Add: Stock-based compensation expense |
19,355 | 23,593 | 23,542 | 17,601 | 11,435 | ||||||||||||
Less: Gain on early extinguishment of debt, net |
(108,923 | ) | (547,349 | ) | (393,131 | ) | (225 | ) | — | ||||||||
Adjusted EBITDA |
$ | 777,803 | $ | 704,257 | $ | 1,606,888 | $ | 1,359,659 | $ | 935,849 | |||||||
- (1)
- For
the years ended December 31, 2010, 2009, 2008, 2007 and 2006, interest expense includes $30,515, $66,876, $47,995, $18,554 and $19,327,
respectively, of interest expense reclassified to discontinued operations.
- (2)
- For
the years ended December 31, 2010, 2009, 2008, 2007 and 2006, depreciation, depletion and amortization includes $7,541, $36,029, $40,811, $43,560
and $43,291, respectively, of depreciation, depletion and amortization reclassified to discontinued operations.
- (3)
- For
the years ended December 31, 2010, 2009, 2008, 2007 and 2006, impairment of assets includes $1,860, $14,430, $296, $297 and $297, respectively,
of impairment of assets reclassified to discontinued operations.
Explanatory Notes:
- (8)
- This
ratio of earnings to fixed charges is calculated in accordance with GAAP. The Company's unsecured debt securities have a fixed charge coverage covenant
which is calculated differently in accordance with the terms of the agreements.
- (9)
- For the years ended December 31, 2010, 2009 and 2008, earnings were not sufficient to cover fixed charges by $227,249, $756,824 and $282,640, respectively, and earnings were not sufficient to cover fixed charges and preferred dividends by $269,569, $799,144 and $324,960, respectively.
29
Item 7. Management's Discussion and Analysis of Financial Condition and Results of Operations
Certain statements in this report, other than purely historical information, including estimates, projections, statements relating to our business plans, objectives and expected operating results, and the assumptions upon which those statements are based, are "forward-looking statements" within the meaning of the Private Securities Litigation Reform Act of 1995, Section 27A of the Securities Act and Section 21E of the Exchange Act. Forward-looking statements are included with respect to, among other things, the Company's current business plan, business strategy, portfolio management, prospects and liquidity. These forward-looking statements generally are identified by the words "believe," "project," "expect," "anticipate," "estimate," "intend," "strategy," "plan," "may," "should," "will," "would," "will be," "will continue," "will likely result," and similar expressions. Forward-looking statements are based on current expectations and assumptions that are subject to risks and uncertainties which may cause actual results or outcomes to differ materially from those contained in the forward-looking statements. Important factors that the Company believes might cause such differences are discussed in the section entitled, "Risk Factors" in Part I, Item 1a of this Form 10-K or otherwise accompany the forward-looking statements contained in this Form 10-K. We undertake no obligation to update or revise publicly any forward-looking statements, whether as a result of new information, future events or otherwise. In assessing all forward-looking statements, readers are urged to read carefully all cautionary statements contained in this Form 10-K. For purposes of Management's Discussion and Analysis of Financial Condition and Results of Operations, the terms "we," "our" and "us" refer to iStar Financial Inc. and its consolidated subsidiaries, unless the context indicates otherwise.
This discussion summarizes the significant factors affecting our consolidated operating results, financial condition and liquidity during the three-year period ended December 31, 2010. This discussion should be read in conjunction with our consolidated financial statements and related notes for the three-year period ended December 31, 2010 included elsewhere in this Annual Report on Form 10-K. These historical financial statements may not be indicative of our future performance. We reclassified certain items in our consolidated financial statements of prior years to conform to our current year's presentation.
Overview
iStar Financial Inc. is a fully-integrated finance and investment company focused on the commercial real estate industry. We provide custom-tailored investment capital to high-end private and corporate owners of real estate and invest directly across a range of real estate sectors. We are taxed as a real estate investment trust, or "REIT," and have invested more than $35 billion over the past two decades. Our three primary business segments are lending, net leasing and real estate investment.
Our primary sources of revenues are interest income, which is the interest that borrowers pay on loans, and operating lease income, which is the rent that corporate customers pay to lease our properties. We primarily generate income through the "spread" or "margin," which is the difference between the revenues generated from loans and leases and interest expense and the cost of net lease operations. Going forward, we also expect to earn income from our other real estate investments. Income from real estate investments may include operating revenues as well as income from sales of properties either in bulk or through unit sales. This income will be reduced by holding costs while the real estate investments are redeveloped, repositioned and eventually sold.
The economic recession and tightening of capital markets adversely affected our business. We experienced significant provisions for loan losses and impairments resulting from high levels of non-performing loans and increasing amounts of real estate owned as we took title to assets of defaulting borrowers. The economic conditions and their effect on our operations resulted in increases in our financing costs and an inability to access the unsecured debt markets. Since the beginning of the crisis, we
30
have focused primarily on resolving problem assets, generating liquidity, retiring debt, decreasing leverage and preserving shareholder value.
We saw early signs of an economic recovery during 2010, including some improvements in the commercial real estate market and greater stability in the capital markets. This was evidenced in our own portfolio by increased liquidity from loan repayments and asset sales, better pricing for commercial real estate assets, improved risk ratings and reductions in non-performing and watch list assets as compared to 2008 and 2009. In addition, the trends of increases in loan loss provisions and performing loans becoming non-performing reversed course in 2010. Many of the improving trends in our financial condition and operating results are dependent on a sustained recovery; however, there can be no assurance that the recent improvement in conditions will continue in the future.
For the year ended December 31, 2010, we recorded net income of $79.7 million. This was an improvement from net losses of $768.8 million and $203.0 million in 2009 and 2008, respectively, and was primarily due to reduced provisions for loan losses and impairments of $352.0 million in 2010, compared to approximately $1.40 billion in each of the prior two years. Results for the year also benefited from $270.4 million in gains, primarily resulting from the disposition of a $1.05 billion portfolio of 32 net lease assets, as well as $108.9 million of gains from early extinguishment of debt. In addition to gains recorded in the current year, we recorded gains on early extinguishment of debt of $547.3 million and $393.1 million during 2009 and 2008, respectively, resulting from retirements that contributed to a $5.02 billion reduction of debt during the past three years. The market values of our debt have recovered significantly from their depressed values in previous years. Aside from the redemption of our senior secured notes discussed below, we do not expect to record significant gains from early extinguishments of debt for the foreseeable future while prices for our debt remain at or above their current levels.
During 2010, we reduced our net exposure to non-performing loans to $1.35 billion as of December 31, 2010, compared to $2.99 billion at December 31, 2009. In some cases these loans were sold or modified and in many cases we took possession of properties serving as collateral for these loans through foreclosure or deed-in-lieu of foreclosure. These foreclosed assets were classified as real estate held for investment ("REHI") or other real estate owned ("OREO") based on our strategy to either hold the properties over a longer period or to market them for sale in the near term. Together, these properties constitute our real estate investment portfolio, which has increased to $1.58 billion as of December 31, 2010, from $1.26 billion at the end of 2009. The overall increase in this portfolio was driven by new REHI assets that we took title to during the year, offset by net reductions in OREO as we made progress in monetizing assets through disposition. We generally seek to reposition the distressed assets within this portfolio through the infusion of capital and/or intensive asset management, with the objective of maximizing our recovery with respect to the investments. Further, we believe that impairments recognized on many of these assets prior to being transferred into this portfolio create an attractive below-cost investment basis, which, combined with our repositioning and development efforts, should enable us to create value from this portfolio. While we work on repositioning these assets, we expect to continue to incur elevated carrying costs. These costs totaled $64.6 million in 2010 and $40.9 million in 2009.
During the year ended December 31, 2010, we generated a total of $4.91 billion in proceeds from our portfolio, comprised of $2.27 billion in gross loan principal repayments, $700.1 million in loan sales, $460.2 million from sales of OREO assets and $1.47 billion from sales of net lease assets. These proceeds were used in part to reduce the Company's debt obligations by $3.55 billion and fully retire the remaining $473.3 million A-Participation associated with the acquisition of the Fremont portfolio. Additionally, we funded a total of $630.5 million in new and pre-existing investments. The new investments we made in 2010 were primarily sourced from our existing portfolio. We believe that making additional investments in assets within our portfolio may present more attractive risk-adjusted return opportunities than are otherwise available in the market, because of our existing relationships with the customers and knowledge of the assets.
31
In March 2011, we entered into a $2.95 billion senior secured credit facility and used the proceeds to repay approximately $2.62 billion of outstanding borrowings under our existing secured credit facilities, which were due to mature in June 2011 and June 2012. Proceeds were also used to repay $175.0 million of our unsecured credit facilities due in June 2011. We expect to use the remaining proceeds to repay unsecured debt maturing in the first half of 2011 as well as other corporate purposes. In addition, during the first quarter of 2011, we repaid the remaining $107.8 million principal amount of unsecured senior notes due March 2011 and completed the redemption of our remaining $312.3 million principal amount of 10% senior secured notes due June 2014. In connection with the redemption, we expect to record a gain of approximately $109 million on early extinguishment of debt during the first quarter of 2011 (see Subsequent Events below).
After giving effect to the new secured credit Facility and repayments noted above, we will have approximately $882 million of debt maturing and minimum required amortization payments due on or before December 31, 2011. We expect that liquidity in the coming year will primarily be provided by loan repayments as well as strategic asset sales and proceeds from planned OREO sales. We believe that proceeds from these activities will be sufficient to meet our obligations during the remainder of the year; however, the timing and amounts of proceeds from expected asset repayments and sales are subject to factors outside of our control and cannot be predicted with certainty.
Results of Operations for the Year Ended December 31, 2010 compared to the Year Ended December 31, 2009
| |
2010 | 2009 | $ Change | % Change | ||||||||||
|---|---|---|---|---|---|---|---|---|---|---|---|---|---|---|
| |
(in thousands) |
|
|
|||||||||||
Interest income |
$ | 364,094 | $ | 557,809 | $ | (193,715 | ) | (35 | )% | |||||
Operating lease income |
170,213 | 177,960 | (7,747 | ) | (4 | )% | ||||||||
Other income |
40,944 | 30,429 | 10,515 | 35 | % | |||||||||
Total revenue |
575,251 | 766,198 | (190,947 | ) | (25 | )% | ||||||||
Interest expense |
315,985 | 414,240 | (98,255 | ) | (24 | )% | ||||||||
Operating costs—net lease assets |
15,072 | 15,942 | (870 | ) | (5 | )% | ||||||||
Operating costs—REHI and OREO |
64,694 | 40,866 | 23,828 | 58 | % | |||||||||
Depreciation and amortization |
63,244 | 63,259 | (15 | ) | 0 | % | ||||||||
General and administrative |
109,526 | 124,152 | (14,626 | ) | (12 | )% | ||||||||
Provision for loan losses |
331,487 | 1,255,357 | (923,870 | ) | (74 | )% | ||||||||
Impairment of assets |
20,521 | 126,588 | (106,067 | ) | (84 | )% | ||||||||
Other expense |
23,078 | 66,470 | (43,392 | ) | (65 | )% | ||||||||
Total costs and expenses |
943,607 | 2,106,874 | (1,163,267 | ) | (55 | )% | ||||||||
Gain on early extinguishment of debt, net |
108,923 |
547,349 |
(438,426 |
) |
(80 |
)% |
||||||||
Earnings from equity method investments |
51,908 | 5,298 | 46,610 | >100 | % | |||||||||
Income from discontinued operations |
17,349 | 5,756 | 11,593 | >100 | % | |||||||||
Gain from discontinued operations |
270,382 | 12,426 | 257,956 | >100 | % | |||||||||
Net income (loss) |
$ | 80,206 | $ | (769,847 | ) | $ | 850,053 | >100 | % | |||||
Revenue—The decrease in interest income is primarily a result of a decline in the balance of performing loans to $3.37 billion at December 31, 2010 from $4.91 billion at December 31, 2009. The decline in performing loans was primarily driven by loan repayments and note sales as well as loans moving to non-performing status. (See Risk Management below).
Operating lease income from net lease assets decreased primarily due to a slight decrease in tenant occupancy rates and lower rent received as a result of lease restructurings.
32
Offsetting these declines in revenue was an increase in other income primarily driven by an increase in operating revenue from REHI assets and loan prepayment penalties received. Revenue from REHI assets increased to $23.1 million in 2010 from $5.8 million in 2009 due to the increase in real estate assets held for investment.
Costs and expenses—Total costs and expenses decreased primarily due to lower provisions for loan losses, fewer impairments of assets and reduced interest expense. The decline in our provision for loan losses was primarily due to fewer loans moving to non-performing status during the year ended December 31, 2010 as compared to the same period in 2009. The decrease in loans moving to non-performing status during the year can be attributed to a smaller overall loan portfolio and improving economic conditions and credit environment. Additionally, loan repayments and sales have led to a smaller performing loan asset base, which has resulted in a reduction in the required general loan loss reserve. (See Risk Management below.)
Impairment of assets for the year ended December 31, 2010 primarily consisted of $19.1 million of impairments on OREO assets. Asset impairments in 2009 were significantly higher due to declining real estate values and distressed economic conditions. These impairments included $78.6 million of impairments on REHI and OREO assets, $19.1 on net lease assets, $12.6 million on investment securities, $12.2 million on equity investments and $4.2 million on goodwill.
Interest expense decreased primarily due to the repayment and retirement of debt during the last 12 months as well as the exchange of senior unsecured notes for new second-lien senior secured notes completed in May 2009. The carrying value of our debt declined to $7.35 billion at December 31, 2010 from $10.89 billion at December 31, 2009. In addition, the weighted average interest rate on outstanding debt decreased to 3.87% for the year ended December 31, 2010 from 4.14% during the same period in 2009 primarily due to the repayment of higher rate debt obligations.
Other expense was lower primarily due to a $42.4 million charge incurred in 2009 pursuant to a settlement agreement under which we terminated a long-term lease for new headquarters space and settled all disputes with the landlord.
The decrease in general and administrative expense was primarily due to $5.9 million of rent expense incurred during the year ended December 31, 2009 relating to a lease for new headquarters space which was terminated in May 2009. Stock-based compensation expense also declined by $4.2 million primarily due to amortization of newer stock awards with lower values than those granted in prior years.
The increase in operating costs for REHI and OREO was primarily due to the increase in the number of assets held during 2010 as compared to in 2009.
Gain on early extinguishment of debt, net—During 2010, we retired $633.0 million par value of our senior secured and unsecured notes through open market repurchases and we redeemed $282.3 million of senior secured notes. Together, these transactions resulted in an aggregate gain on early extinguishment of debt of $131.0 million. Notes repurchased in 2010 yielded lower gains than in the prior year primarily because they were trading closer to par. These gains were offset by $22.1 million associated with expensing the unamortized deferred financing costs and other costs incurred in connection with the prepayments of our $1.0 billion First Priority Credit Agreement, which was due to mature in June 2012, and our $947.9 million non-recourse secured term loan and another secured term loan that were each collateralized by net lease assets we sold during the period.
During 2009, we retired $1.31 billion par value of our senior unsecured notes though open market repurchases at discounts to par and recognized $439.4 million in gain on early extinguishment of debt. Additionally, we completed our secured note exchange transactions and purchased $12.5 million of our outstanding senior floating rates notes in a cash tender offer, which resulted in an aggregate net gain on early extinguishment of debt of $107.9 million.
33
Earnings from equity method investments—The increase in earnings from equity method investments was primarily attributable to better overall market performance that affected our strategic investments in 2010 as compared to 2009. In addition, during 2009 we recorded a $9.4 million non-cash out of period charge to recognize losses from an equity method investment as a result of additional depreciation expense that should have been recorded at the equity method entity in prior periods.
Discontinued operations—During the year ended December 31, 2010, we sold a portfolio of 32 net lease assets and 9 other net lease assets and recognized aggregate gains of $270.4 million. Income from discontinued operations in 2010 included the net income from those net lease assets sold during the period. During the year ended December 31, 2009, we sold four net lease assets and recognized aggregate gains of $12.4 million. Income from discontinued operations in 2009 included the net income from net lease assets sold in the past 12 months offset by $14.4 million of impairments on those sold assets.
Results of Operations for the Year Ended December 31, 2009 compared to the Year Ended December 31, 2008
| |
2009 | 2008 | $ Change | % Change | ||||||||||
|---|---|---|---|---|---|---|---|---|---|---|---|---|---|---|
| |
(in thousands) |
|
|
|||||||||||
Interest income |
$ | 557,809 | $ | 947,661 | $ | (389,852 | ) | (41 | )% | |||||
Operating lease income |
177,960 | 183,641 | (5,681 | ) | (3 | )% | ||||||||
Other income |
30,429 | 97,742 | (67,313 | ) | (69 | )% | ||||||||
Total revenue |
766,198 | 1,229,044 | (462,846 | ) | (38 | )% | ||||||||
Interest expense |
414,240 |
618,711 |
(204,471 |
) |
(33 |
)% |
||||||||
Operating costs—net lease assets |
15,942 | 15,320 | 622 | 4 | % | |||||||||
Operating costs—REHI and OREO |
40,866 | 9,288 | 31,578 | >100 | % | |||||||||
Depreciation and amortization |
63,259 | 60,632 | 2,627 | 4 | % | |||||||||
General and administrative |
124,152 | 138,164 | (14,012 | ) | (10 | )% | ||||||||
Provision for loan losses |
1,255,357 | 1,029,322 | 226,035 | 22 | % | |||||||||
Impairment of assets |
126,588 | 334,534 | (207,946 | ) | (62 | )% | ||||||||
Other expense |
66,470 | 24,758 | 41,712 | >100 | % | |||||||||
Total costs and expenses |
2,106,874 | 2,230,729 | (123,855 | ) | (6 | )% | ||||||||
Gain on early extinguishment of debt |
547,349 |
393,131 |
154,218 |
39 |
% |
|||||||||
Gain on sale of joint venture interest |
— | 280,219 | (280,219 | ) | (100 | )% | ||||||||
Earnings from equity method investments |
5,298 | 6,535 | (1,237 | ) | (19 | )% | ||||||||
Income from discontinued operations |
5,756 | 48,575 | (42,819 | ) | (88 | )% | ||||||||
Gain from discontinued operations |
12,426 | 91,458 | (79,032 | ) | (86 | )% | ||||||||
Net income (loss) |
$ | (769,847 | ) | $ | (181,767 | ) | $ | (588,080 | ) | >(100 | )% | |||
Revenue—The decline in interest income year over year primarily resulted from a decrease in the carrying value of performing loans to $4.91 billion at the end of 2009 from $8.18 billion at the end of 2008. This decrease in performing loans was primarily due to assets moving from performing to non-performing status, as well as loan repayments and note sales that contributed to the decline in income generating loans. Lower interest rates also contributed to the decline in interest income with one-month LIBOR averaging 0.33% in 2009 versus 2.68% in 2008. However, the impact to overall rates from the decline in LIBOR rates was tempered by interest rate floors, resulting in a weighted average interest rate of 3.86% in effect on approximately $1.87 billion of loans at December 31, 2009.
The year over year change in other income was primarily driven by certain one-time transactions in 2008 including $44.2 million of income recognized from the redemption of a participation interest in a
34
lending investment and $12.0 million of income recognized when we exchanged a cost method equity investment for a loan receivable. Additionally, other loan related income, such as prepayment penalties, declined by $27.5 million from 2009 to 2008. Slightly offsetting this increase were $15.0 million of realized and unrealized gains on trading securities held in our other investment portfolio.
Operating lease income from net lease assets decreased primarily due to a slight decrease in tenant occupancy rates.
Costs and expenses—Total costs and expenses decreased primarily due to decreases in impairment of assets and interest expense partially offset by an increase in provision for loan losses. Impairment of assets in 2009 included $78.6 million of impairments on OREO and REHI assets, $24.8 million of impairments on securities and equity investments, $19.1 million of impairments on net lease assets and $4.2 million of impairments on goodwill. Impairments in 2008 were significantly higher and included $207.0 million of impairments on securities and equity investments, $60.6 million of impairments on goodwill and intangible assets, $55.6 million of impairments on OREO assets, and $11.3 million of impairments on net lease assets.
The decline in interest expense year over year is primarily a result of reducing outstanding debt balances from repurchases and repayments. In an effort to generate gains on certain of our debt securities which have traded at discounts to par, as discussed further below, we repurchased $1.31 billion par value of our senior unsecured notes during 2009 and we also repaid an additional $628.3 million at maturity. In addition, we completed an exchange of senior unsecured notes for new second-lien senior secured notes in May 2009. This exchange resulted in a $262.7 million deferred gain reflected as a premium to the new notes which is being amortized as a reduction to interest expense over the terms of the new notes. In 2009, we recognized $35.1 million in amortization of this premium as a reduction to interest expense. Lower LIBOR rates also contributed to our decrease in interest expense, with our average borrowing rates decreasing to 4.14% in 2009 from 5.02% in 2008.
General and administrative expenses decreased primarily due to lower payroll and employee related costs from reductions in headcount.
The increase in our provision for loan losses in 2009 was caused by the continued deterioration in the commercial real estate market and weakened economic conditions that negatively impacted our borrowers' ability to service their debt and refinance their loans at maturity. This resulted in additional asset-specific reserves due to the increasing level of non-performing loans within the portfolio along with declining values of real estate collateral that secure such loans.
Other expense was higher primarily due to a $42.4 million charge incurred during 2009 pursuant to a settlement agreement under which we terminated a long-term lease for new headquarters space and settled all disputes with a landlord.
The increase in operating costs for OREO and REHI was primarily due to the increase in the number of assets held during 2009 as compared to during 2008.
Gain on early extinguishment of debt—In 2009, we retired $1.31 billion par value of our senior unsecured notes through open market repurchases at discounts to par and recognized $439.4 million in gain on early extinguishment of debt. Additionally, we completed our secured note exchange transactions and purchased $12.5 million of our outstanding senior floating rate notes in a cash tender offer which resulted in an aggregate gain on early extinguishment of debt of $107.9 million.
During 2008, we retired $900.7 million par value of our senior unsecured notes through open market repurchases at discounts to par which resulted in an aggregate gain on early extinguishment of debt of $393.1 million.
35
Gain on sale of joint venture interest—In April 2008, we closed on the sale of our TimberStar Southwest joint venture for a gross sales price of $1.71 billion, including the assumption of debt. We received net proceeds of $417.0 million for our interest in the venture and recorded a gain of $280.2 million.
Discontinued operations—During 2009, we sold four net lease assets and recognized gains of $12.4 million while income from discontinued operations in 2009 included impairment charges of $14.4 million on net lease assets sold during the year or held for sale at the end of the year. During 2008, we sold several net lease assets and our Maine timber property for gains of $91.5 million, while income from discontinued operations included higher operating results for those properties sold or classified as held for sale in 2008 and 2009.
Adjusted Earnings
We measure our performance using adjusted earnings in addition to net income. Adjusted earnings represents net income attributable to us and allocable to our common shareholders, HPU holders and Participating Security holders computed in accordance with GAAP, before depreciation, depletion, amortization, gain from discontinued operations, impairments of goodwill and intangible assets and extraordinary items. Adjustments for joint ventures reflect our share of adjusted earnings calculated on the same basis.
We believe that adjusted earnings has historically been a helpful measure to consider, in addition to net income (loss), because this measure has helped us to evaluate how our commercial real estate finance business is performing compared to other commercial finance companies, without the effects of certain GAAP adjustments that are not necessarily indicative of current operating performance.
The most significant GAAP adjustments that we exclude in determining adjusted earnings are depreciation and amortization which are typically non-cash charges as well as gain from discontinued operations. As a commercial finance company that focuses on real estate lending and net leasing, we record significant depreciation on our real estate assets, and deferred financing amortization associated with our borrowings. Depreciation and amortization do not affect our daily operations, but they do impact financial results under GAAP. Adjusted earnings is not an alternative or substitute for net income (loss) in accordance with GAAP as a measure of our performance. Rather, we believe that adjusted earnings is an additional measure that helps us analyze how our business is performing. Adjusted earnings should not be viewed as an alternative measure of either our operating liquidity or funds available for our cash needs or
36
for distribution to our shareholders. In addition, we may not calculate adjusted earnings in the same manner as other companies that use a similarly titled measure.
| |
For the Years Ended December 31, | ||||||||||||||||
|---|---|---|---|---|---|---|---|---|---|---|---|---|---|---|---|---|---|
| |
2010 | 2009 | 2008 | 2007 | 2006 | ||||||||||||
| |
($ in thousands) |
||||||||||||||||
Adjusted earnings: |
|||||||||||||||||
Net income (loss) |
$ | 80,206 | $ | (769,847 | ) | $ | (181,767 | ) | $ | 236,602 | $ | 376,034 | |||||
Add: Depreciation, depletion and amortization |
69,916 | 98,238 | 102,745 | 99,427 | 83,058 | ||||||||||||
Add: Joint venture depreciation, depletion and amortization |
9,858 | 17,990 | 14,466 | 40,826 | 14,941 | ||||||||||||
Add: Net (income) loss attributable to noncontrolling interests |
(523 | ) | 1,071 | 991 | 816 | (1,207 | ) | ||||||||||
Add: Impairment of intangible assets and goodwill |
— | 4,186 | 60,618 | — | — | ||||||||||||
Add: Hedge ineffectiveness, net |
— | — | 7,427 | (239 | ) | — | |||||||||||
Add: Joint venture income |
— | — | — | 92 | 123 | ||||||||||||
Less: Gain from discontinued operations |
(270,382 | ) | (12,426 | ) | (91,458 | ) | (7,832 | ) | (24,227 | ) | |||||||
Less: Gain on sale of joint venture interest |
— | — | (280,219 | ) | (1,572 | ) | — | ||||||||||
Less: Deferred financing amortization |
(70,226 | ) | (5,487 | ) | 50,222 | 29,907 | 23,520 | ||||||||||
Less: Preferred dividends |
(42,320 | ) | (42,320 | ) | (42,320 | ) | (42,320 | ) | (42,320 | ) | |||||||
Adjusted earnings (loss) attributable to iStar Financial, Inc. and allocable to common shareholders, HPU holders and Participating Security holders |
$ | (223,471 | ) | $ | (708,595 | ) | $ | (359,295 | ) | $ | 355,707 | $ | 429,922 | ||||
37
Risk Management
Loan Credit Statistics—The table below summarizes our non-performing loans, watch list loans and the reserves for loan losses associated with our loans ($ in thousands):
| |
As of December 31, | |||||||
|---|---|---|---|---|---|---|---|---|
| |
2010 | 2009 | ||||||
Non-performing loans |
||||||||
Carrying value(1)(2) |
$ | 1,351,410 | $ | 2,993,158 | ||||
As a percentage of total carrying value of loans |
29.6 | % | 38.0 | % | ||||
Watch list loans |
||||||||
Carrying value(1) |
$ | 190,553 | $ | 703,173 | ||||
As a percentage of total carrying value of loans |
4.2 | % | 8.9 | % | ||||
Reserve for loan losses |
||||||||
Total reserve for loan losses |
$ | 814,625 | $ | 1,417,949 | ||||
As a percentage of total loans before loan loss reserves |
15.1 | % | 15.3 | % | ||||
Non-performing loan asset-specific reserves for loan losses |
$ |
667,779 |
$ |
1,216,097 |
||||
As a percentage of gross carrying value of non-performing loans |
33.1 | % | 28.9 | % | ||||
Explanatory Notes:
- (1)
- As
of December 31, 2009, carrying values of loans included the remaining outstanding participation interest on loans in the Fremont CRE portfolio,
which was $298.3 million for non-performing loans, $20.6 million for watch list loans and $473.3 million for total loans. The participation was fully repaid in October 2010 and
therefore is not reflected in the values as of December 31, 2010.
- (2)
- As of December 31, 2010 and 2009, carrying values of non-performing loans are net of asset-specific reserves for loan losses of $667.8 million and $1.22 billion, respectively.
Non-Performing Loans—We designate loans as non-performing at such time as: (1) the loan becomes 90 days delinquent; (2) the loan has a maturity default; or (3) management determines it is probable that it will be unable to collect all amounts due according to the contractual terms of the loan. All non-performing loans are placed on non-accrual status and income is only recognized in certain cases upon actual cash receipt. As of December 31, 2010, we had non-performing loans with an aggregate carrying value of $1.35 billion, or 29.6% of the total carrying value of loans. Our non-performing loans decreased during the year ended December 31, 2010, primarily due to transfers of non-performing loans to REHI and OREO as well as sales and repayments.
Watch List Loans—During our quarterly loan portfolio assessments, loans are put on the watch list if deteriorating performance indicates they warrant a higher degree of monitoring and senior management attention. As of December 31, 2010, we had loans on the watch list (excluding non-performing loans) with an aggregate carrying value of $190.6 million, or 4.2% of the total carrying value of loans.
Reserve for Loan Losses—The reserve for loan losses was $814.6 million as of December 31, 2010, or 15.1% of the gross carrying value of total loans, down from $1.42 billion or 15.3% at December 31, 2009. The change in the balance of the reserve was the result of $331.5 million of provisioning for loan losses, reduced by $934.8 million of charge-offs during the year ended December 31, 2010. The reserve is increased through the provision for loan losses, which reduces income in the period recorded and the reserve is reduced through charge-offs. Due to the continued volatility of the commercial real estate market, the process of estimating collateral values and reserves continues to require us to use significant judgment. We currently believe there is adequate collateral and reserves to support the carrying values of the loans.
38
The reserve for loan losses includes an asset-specific component and a formula-based component. An asset-specific reserve is established for an impaired loan when the estimated fair value of the loan's collateral less costs to sell is lower than the carrying value of the loan. As of December 31, 2010, we had asset-specific reserves of $694.4 million compared to $1.24 billion at December 31, 2009. The decrease in the amount of asset-specific reserves during the year ended December 31, 2010 was primarily due to the lower balance of non-performing loans as discussed above.
The formula-based general reserve is derived from estimated principal default probabilities and loss severities applied to groups of performing loans based upon risk ratings assigned to loans with similar risk characteristics during our quarterly loan portfolio assessment. During this assessment we perform a comprehensive analysis of our loan portfolio and assign risk ratings to loans that incorporate management's current judgments about their credit quality based on all known and relevant internal and external factors that may affect collectability. We consider, among other things, payment status, lien position, borrower financial resources and investment in collateral, collateral type, project economics and geographical location as well as national and regional economic factors. This methodology results in loans being segmented by risk classification into risk rating categories that are associated with estimated probabilities of default and principal loss. We estimate loss rates based on historical realized losses experienced within our portfolio and take into account current economic conditions affecting the commercial real estate market when establishing appropriate time frames to evaluate loss experience.
The general reserve was $120.2 million or 3.6% of the gross carrying value of performing loans as of December 31, 2010, compared to $174.9 million or 3.4% of the gross carrying value of performing loans at December 31, 2009. The decrease in the balance of the general reserve resulted from the decrease in performing loans outstanding from $5.08 billion as of December 31, 2009 to $3.37 billion as of December 31, 2010, as well as a slight improvement of the weighted average risk ratings of performing loans outstanding during that same period.
Real Estate Held for Investment, net and other Real Estate Owned—REHI and OREO consist of properties acquired through foreclosure or by deed-in-lieu of foreclosure in full or partial satisfaction of non-performing loans. Properties are designated as REHI or OREO depending on our strategic plan to realize the maximum value from the collateral received. When we intend to hold, operate or develop the property for a period of at least 12 months, assets are classified as REHI, and when we intend to market these properties for sale in the near term, assets are classified as OREO. As of December 31, 2010 we had $833.1 million of assets classified as REHI and $746.1 million as OREO. During the year ended December 31, 2010, we recorded impairment charges of $19.1 million on OREO assets due to changing market conditions. The continued volatility of the commercial real estate market requires us to use significant judgment in estimating fair values of REHI and OREO properties at the time of transfer and thereafter when events or circumstances indicate there may be a potential impairment. Additionally, we will continue to incur holding and operating costs related to REHI and OREO assets while they are being marketed for sale or redeveloped and repositioned. The aggregate net operating and holding costs for REHI and OREO assets was $64.7 million for the year ended December 31, 2010.
39
Risk concentrations—As of December 31, 2010, our total investment portfolio was comprised of the following property/collateral types ($ in thousands)(1):
Property/Collateral Types
|
Performing Loans and Other |
Non- performing Loans |
Net Lease Assets(3) |
REHI | OREO | Total | % of Total | |||||||||||||||
|---|---|---|---|---|---|---|---|---|---|---|---|---|---|---|---|---|---|---|---|---|---|---|
Apartment/Residential |
$ | 1,009,817 | $ | 588,918 | $ | — | $ | 11,500 | $ | 476,658 | $ | 2,086,893 | 23.2 | % | ||||||||
Land |
379,105 | 268,536 | 58,788 | 637,977 | 114,162 | 1,458,568 | 16.3 | % | ||||||||||||||
Retail |
596,344 | 214,873 | 183,820 | 50,641 | 44,204 | 1,089,882 | 12.1 | % | ||||||||||||||
Office |
212,771 | 53,007 | 600,618 | 17,337 | 16,422 | 900,155 | 10.0 | % | ||||||||||||||
Industrial/R&D |
98,721 | 21,330 | 603,537 | 50,520 | 6,300 | 780,408 | 8.7 | % | ||||||||||||||
Entertainment/Leisure |
193,353 | 77,801 | 483,173 | — | 1,200 | 755,527 | 8.4 | % | ||||||||||||||
Hotel |
399,262 | 20,847 | 183,805 | 44,556 | 15,000 | 663,470 | 7.4 | % | ||||||||||||||
Mixed Use/Mixed Collateral |
267,623 | 93,658 | 40,589 | 28,383 | 72,135 | 502,388 | 5.6 | % | ||||||||||||||
Other(2) |
715,376 | 12,440 | 20,641 | — | — | 748,457 | 8.3 | % | ||||||||||||||
Total |
$ | 3,872,372 | $ | 1,351,410 | $ | 2,174,971 | $ | 840,914 | $ | 746,081 | $ | 8,985,748 | 100.0 | % | ||||||||
Explanatory Notes:
- (1)
- Based
on the carrying value of our total investment portfolio, net of asset-specific loan loss reserves and gross of general loan loss reserves and
accumulated depreciation.
- (2)
- Includes
$516.2 million of other investments.
- (3)
- Includes $16.1 million of other investments.
As of December 31, 2010, our total investment portfolio had the following characteristics by geographical region ($ in thousands):
Geographic Region
|
Carrying Value(1) |
% of Total | |||||
|---|---|---|---|---|---|---|---|
West |
$ | 2,041,466 | 22.7 | % | |||
Northeast |
1,862,021 | 20.7 | % | ||||
Southeast |
1,356,366 | 15.1 | % | ||||
Southwest |
918,772 | 10.2 | % | ||||
Mid-Atlantic |
773,903 | 8.6 | % | ||||
Central |
427,817 | 4.8 | % | ||||
International |
376,829 | 4.2 | % | ||||
Northwest |
367,094 | 4.1 | % | ||||
Various |
861,480 | 9.6 | % | ||||
Total |
$ | 8,985,748 | 100.0 | % | |||
Explanatory Note:
- (1)
- Based on the carrying value of our total investment portfolio, net of asset-specific loan loss reserves but gross of general loan loss reserves and accumulated depreciation.
40
Concentrations of credit risks arise when a number of borrowers or customers related to our investments are engaged in similar business activities, or activities in the same geographic region, or have similar economic features that would cause their ability to meet contractual obligations, including those to us, to be similarly affected by changes in economic conditions. We monitor various segments of our portfolio to assess potential concentrations of credit risks. We believe the current portfolio is reasonably well diversified and does not contain any significant concentration of credit risks.
Substantially all of our net lease, REHI and OREO assets, as well as assets collateralizing our loans and other lending investments are located in the United States, with California 13.0%, New York 11.4%, and Florida 10.6% representing the only significant concentrations (greater than 10.0%) as of December 31, 2010. Our portfolio contains significant concentrations in the following asset types as of December 31, 2010: apartment/residential 23.2%, land 16.3%, retail 12.1% and office 10.0%.
We underwrite the credit of prospective borrowers and customers and often require them to provide some form of credit support such as corporate guarantees, letters of credit and/or cash security deposits. Although our loans and other lending investments, net lease, REHI and OREO assets are geographically diverse and the borrowers and customers operate in a variety of industries, to the extent we have a significant concentration of interest or operating lease revenues from any single borrower or customer, the inability of that borrower or customer to make its payment could have an adverse effect on us. As of December 31, 2010, our five largest borrowers or tenants of net lease assets collectively accounted for approximately 23.7% of our aggregate annualized interest and operating lease revenue, of which no single customer accounts for more than 6.0%.
Liquidity and Capital Resources
In March 2011, we entered into a $2.95 billion senior secured credit facility and used the proceeds to repay $2.62 billion of outstanding borrowings under our existing secured credit facilities, which were due to mature in June 2011 and June 2012. Proceeds were also used to repay $175.0 million of our unsecured credit facilities due in June 2011. We expect to use the remaining proceeds to repay unsecured debt maturing in the first half of 2011 as well as for other corporate purposes. In addition, during the first quarter of 2011, we repaid the remaining $107.8 million principal amount of unsecured senior notes due March 2011 and completed the redemption of our remaining $312.3 million principal amount of 10% senior secured notes due June 2014. After giving effect to these transactions, we will have approximately $882 million of debt maturing and minimum required amortization payments due on or before December 31, 2011 (see Subsequent Events below).
As of December 31, 2010, we had $504.9 million of unrestricted cash. Our capital sources in the coming year will primarily include loan repayments and proceeds from strategic asset sales and planned OREO sales. During 2011, we expect to use these proceeds to supplement operating revenues in order to repay our debt obligations and to fund loan commitments, investment activities and operating expenses, including costs to reposition our OREO and REHI assets.
We believe that our available cash and expected proceeds from asset repayments and sales will be sufficient to meet our obligations during the remainder of the year. However, the timing and amounts of proceeds from asset repayments and sales are subject to factors outside our control and cannot be predicted with certainty. Other capital sources which may be available to us in today's financing environment include secured and unsecured financings and possibly other capital raising transactions. We actively manage our liquidity and continually work on initiatives to address both our liquidity needs and compliance with the covenants in our debt instruments. Our plans are dynamic and we may adjust our plans in response to changes in our expectations and changes in market conditions. We would be materially adversely affected if we were unable to repay or refinance our debt as it comes due.
Since the beginning of 2008, we have simplified our capital structure through reductions in debt of $5.02 billion and through the retirement of the $4.20 billion A-Participation associated with the acquisition
41
of the Fremont portfolio. During the past three years we funded $4.86 billion in loan commitments related to our portfolio. We experienced reductions in available liquidity throughout 2008 and 2009 while economic conditions impacted our borrowers' ability to repay their loans to us and our access to the unsecured debt markets was limited. As a result, our sources of capital were derived primarily from asset sales and financings that were collateralized by the diverse assets in our portfolio. As real estate market conditions improved during 2010, loan repayments and asset monetizations increased, providing us with the additional liquidity to prepay outstanding indebtedness and reduce leverage.
During 2010, we generated a total of $4.91 billion in proceeds from our portfolio. This included $2.27 billion in gross loan principal repayments, $700.1 million in loan sales and $460.2 million from sales of OREO. We also generated proceeds from sales of net lease assets of $1.47 billion, including from the sale of a portfolio of 32 net lease assets during the second quarter of 2010, which resulted in a gain of $250.3 million. These proceeds were used in part to reduce our debt obligations by $3.55 billion and also to fully retire the remaining $473.3 million A-Participation associated with the acquisition of the Fremont portfolio. Additionally, we funded a total of $630.5 million in new and pre-existing investments, including $356.3 million in loan fundings and our $100.0 million investment in LNR. We also paid preferred dividends totaling $42.3 million during the year.
Contractual Obligations—The following table outlines the contractual obligations related to our long-term debt agreements and operating lease obligations as of December 31, 2010, before giving effect to the new secured credit Facility and repayments of debt disclosed in Subsequent Events below.
| |
Principal And Interest Payments Due By Period | |||||||||||||||||||
|---|---|---|---|---|---|---|---|---|---|---|---|---|---|---|---|---|---|---|---|---|
| |
Total | Less Than 1 Year |
2-3 Years |
4-5 Years |
6-10 Years |
After 10 Years |
||||||||||||||
| |
(in thousands) |
|||||||||||||||||||
Long-Term Debt Obligations: |
||||||||||||||||||||
Unsecured notes |
$ | 2,510,326 | $ | 401,275 | $ | 1,441,560 | $ | 306,366 | $ | 361,125 | $ | — | ||||||||
Secured notes |
312,329 | — | — | 312,329 | — | — | ||||||||||||||
Convertible notes |
787,750 | — | 787,750 | — | — | — | ||||||||||||||
Unsecured revolving credit facilities |
745,224 | 501,405 | 243,819 | — | — | — | ||||||||||||||
Secured term loans |
1,857,445 | 1,117,350 | 667,145 | — | 20,417 | 52,533 | ||||||||||||||
Secured revolving credit facilities |
953,063 | 618,883 | 334,180 | — | — | — | ||||||||||||||
Trust preferred |
100,000 | — | — | — | — | 100,000 | ||||||||||||||
Total principal maturities |
7,266,137 | 2,638,913 | 3,474,454 | 618,695 | 381,542 | 152,533 | ||||||||||||||
Interest Payable(1) |
696,974 | 237,651 | 308,126 | 84,763 | 36,883 | 29,551 | ||||||||||||||
Operating Lease Obligations |
40,994 | 5,945 | 9,710 | 8,046 | 16,841 | 452 | ||||||||||||||
Total(2) |
$ | 8,004,105 | $ | 2,882,509 | $ | 3,792,290 | $ | 711,504 | $ | 435,266 | $ | 182,536 | ||||||||
Explanatory Notes:
- (1)
- All
variable-rate debt assumes a 30-day LIBOR rate of 0.26% (the 30-day LIBOR rate at December 31, 2010).
- (2)
- We also have issued letters of credit totaling $14.4 million in connection with eight of our investments. See Unfunded Commitments below, for a discussion of certain unfunded commitments related to our lending and net lease businesses.
Pro Forma Contractual Obligations—The following table outlines the contractual obligations related to our long-term debt agreements and operating lease obligations as of December 31, 2010 after giving pro
42
forma effect to the new secured credit Facility and repayments of debt disclosed in Subsequent Events below:
| |
Principal And Interest Payments Due By Period | |||||||||||||||||||
|---|---|---|---|---|---|---|---|---|---|---|---|---|---|---|---|---|---|---|---|---|
| |
Total | Less Than 1 Year |
2 - 3 Years(1) |
4 - 5 Years |
6 - 10 Years |
After 10 Years |
||||||||||||||
| |
(In thousands) |
|||||||||||||||||||
Long-Term Debt Obligations: |
||||||||||||||||||||
Unsecured notes |
$ | 2,402,560 | $ | 293,509 | $ | 1,441,560 | $ | 306,366 | $ | 361,125 | $ | — | ||||||||
Convertible notes |
787,750 | — | 787,750 | — | — | — | ||||||||||||||
Unsecured revolving credit facilities |
570,224 | 326,405 | 243,819 | — | — | — | ||||||||||||||
Secured term loans |
190,223 | 62,350 | 54,923 | — | 20,417 | 52,533 | ||||||||||||||
Secured credit facilities |
2,950,000 | 200,000 | 1,450,000 | 1,300,000 | — | — | ||||||||||||||
Trust preferred |
100,000 | — | — | — | — | 100,000 | ||||||||||||||
Total principal maturities |
7,000,757 | 882,264 | 3,978,052 | 1,606,366 | 381,542 | 152,533 | ||||||||||||||
Interest Payable |
1,022,559 | 316,891 | 524,334 | 114,900 | 36,883 | 29,551 | ||||||||||||||
Operating Lease Obligations |
40,994 | 5,945 | 9,710 | 8,046 | 16,841 | 452 | ||||||||||||||
Total |
$ | 8,064,310 | $ | 1,205,100 | $ | 4,512,096 | $ | 1,729,312 | $ | 435,266 | $ | 182,536 | ||||||||
Explanatory Note:
- (1)
- Future long-term debt obligations due during the years ending December 31, 2012 and 2013 are $2.00 billion and $1.97 billion, respectively.
Credit Facilities—In March 2011, we entered into a new $2.95 billion senior secured credit agreement and used a portion of the proceeds to fully repay $2.62 billion outstanding under our existing secured credit facilities, described below, which were due to mature in June 2011 and June 2012. See Subsequent Events below.
Prior to the repayment of the secured credit facilities, as of December 31, 2010, we had outstanding borrowings of $618.9 million and $334.2 million of revolving loans maturing in June 2011 and June 2012, respectively, as well as $1.06 billion and $612.2 million of term loans maturing in June 2011 and June 2012, respectively. Borrowings under the secured credit facilities bore interest at the rate of LIBOR + 1.50% per year, subject to adjustment based upon our corporate credit ratings (see Ratings Triggers below). As of December 31, 2010, the total carrying value of assets pledged as collateral under the secured credit facilities was $3.95 billion. These assets also served as collateral for $312.3 million principal amount of 10% senior secured notes due 2014, which we redeemed in January 2011 (see Subsequent Events below).
As of December 31, 2010, we had two unsecured revolving credit facilities, with outstanding balances of $501.4 million maturing in June 2011 and $243.8 million maturing in June 2012. Borrowings under our unsecured revolving credit facilities bear interest at a rate of LIBOR + 0.85% per year, subject to adjustment based upon our corporate credit ratings (see Ratings Triggers below). We intend to use the remaining proceeds from the new secured credit Facility and other cash on hand to repay the unsecured facility maturing in June 2011.
In November 2010, we fully repaid a $1.00 billion First Priority Credit Agreement, which was due to mature in June 2012, and terminated all commitments thereunder.
Other Secured Term Loans—Also during 2010, we repaid other secured term loans, including a $947.9 million non-recourse loan that was collateralized by the portfolio of 32 net lease assets that was sold, as well as $153.3 million of other term loans with various maturities.
43
In connection with these repayments, we expensed unamortized deferred financing costs and incurred other expenses totaling $22.1 million, which reduced our net gain on early extinguishment of debt during the year ended December 31, 2010.
Secured Notes—Also during 2010, we redeemed or repurchased $155.3 million of our 8% second priority senior secured notes due 2011 and $167.2 million of our 10% second priority senior secured notes due 2014, generating $71.3 million of gains on early extinguishment of debt, primarily related to the recognition of the deferred gain premiums that resulted from our note exchanges completed in May 2009. Subsequent to year end, we fully redeemed our $312.3 million remaining principal amount of 10% senior secured notes due June 2014 (see Subsequent Events).
Unsecured Notes—During the year ended December 31, 2010, we repurchased $592.8 million par value of our senior unsecured notes with various maturities ranging from March 2010 to March 2014 through open market repurchases, generating $59.7 million in gains on early extinguishment of debt. We also repaid $375.7 million of unsecured notes at maturity during the year ended December 31, 2010.
Debt Covenants—Our outstanding unsecured debt securities contain covenants that include fixed charge coverage and unencumbered assets to unsecured indebtedness ratios. The fixed charge coverage ratio in our debt securities is an incurrence test. While we expect that our ability to incur new indebtedness under the coverage ratio will be limited for the foreseeable future, we will continue to be permitted to incur indebtedness for the purpose of refinancing existing indebtedness and for other permitted purposes under the indentures. The unencumbered assets to unsecured indebtedness covenant is a maintenance covenant. If any of our covenants is breached and not cured within applicable cure periods, the breach could result in acceleration of our debt securities unless a waiver or modification is agreed upon with the requisite percentage of the bondholders. Based on our unsecured credit ratings, the financial covenants in our debt securities, including the fixed charge coverage ratio and maintenance of unencumbered assets to unsecured indebtedness ratio, are currently operative.
Our new secured credit Facility (see Subsequent Events below) contains certain covenants, including covenants relating to the delivery of information to the lenders, collateral coverage, dividend payments, restrictions on fundamental changes, transactions with affiliates and matters relating to the liens granted to the lenders. In particular, we are required to maintain collateral coverage of 1.25x outstanding borrowings. In addition, for so long as we maintain our qualification as a REIT, the new Facility permits us to distribute 100% of our REIT taxable income on an annual basis. We may not pay common dividends if we cease to qualify as a REIT.
Our new secured credit Facility contains cross default provisions that would allow the lenders to declare an event of default and accelerate our indebtedness to them if we fail to pay amounts due in respect of our other recourse indebtedness in excess of specified thresholds or if the lenders under such other indebtedness are otherwise permitted to accelerate such indebtedness for any reason. The indentures governing our unsecured public debt securities permit the lenders and bondholders to declare an event of default and accelerate our indebtedness to them if we fail to pay amounts due at maturity in respect of other recourse indebtedness in excess of specified thresholds or if such indebtedness is accelerated. Our unsecured credit facilities permit the lenders to accelerate our indebtedness to them if our other recourse indebtedness in excess of specified thresholds is accelerated. We believe we are in full compliance with all the covenants in our debt instruments as of December 31, 2010.
Ratings Triggers—Borrowings under our secured and unsecured credit facilities bear interest at LIBOR based rates plus an applicable margin which varies between the facilities and is determined based on our corporate credit ratings. Our ability to borrow under our credit facilities is not dependent on the level of our credit ratings. Based on our current credit ratings, further downgrades in our credit ratings will have no effect on our borrowing rates under these facilities.
44
Off-Balance Sheet Transactions—We are not dependent on the use of any off-balance sheet financing arrangements for liquidity. We have issued letters of credit totaling $14.4 million in connection with eight of our investments.
Unfunded Commitments—We generally fund construction and development loans and build-outs of space in net lease assets over a period of time if and when the borrowers and tenants meet established milestones and other performance criteria. We refer to these arrangements as Performance-Based Commitments. In addition, we sometimes establish a maximum amount of additional funding which we will make available to a borrower or tenant for an expansion or addition to a project if we approve of the expansion or addition in our sole discretion. We refer to these arrangements as Discretionary Fundings. Finally, we have committed to invest capital in several real estate funds and other ventures. These arrangements are referred to as Strategic Investments. As of December 31, 2010, the maximum amounts of the fundings we may make under each category, assuming all performance hurdles and milestones are met under the Performance-Based Commitments, that we approve all Discretionary Fundings and that 100% of our capital committed to Strategic Investments is drawn down, are as follows (in thousands):
| |
Loans | Net Lease Assets |
Strategic Investments |
Total | ||||||||||
|---|---|---|---|---|---|---|---|---|---|---|---|---|---|---|
Performance-Based Commitments |
$ | 138,353 | $ | 8,143 | $ | — | $ | 146,496 | ||||||
Discretionary Fundings |
158,683 | — | — | 158,683 | ||||||||||
Other |
— | — | 52,370 | 52,370 | ||||||||||
Total |
$ | 297,036 | $ | 8,143 | $ | 52,370 | $ | 357,549 | ||||||
Transactions with Related Parties—We have substantial investments in non-controlling interests of Oak Hill Advisors, L.P. and 13 related entities. In relation to our investment in these entities, we appointed to our Board of Directors a member that holds a substantial investment in these same entities. As of December 31, 2010, the carrying value of our investments in these entities was $221.8 million. We recorded equity in earnings from these investments of $34.1 million for the year ended December 31, 2010.
We have an equity interest of approximately 24% in LNR Property Corporation ("LNR"). During the three months ended December 31, 2010, we executed the discounted payoff of a $25.0 million principal value loan with LNR for which we received proceeds of $24.5 million in full repayment.
Stock Repurchase Program—On March 13, 2009, our Board of Directors authorized the repurchase of up to $50 million of Common Stock from time to time in open market and privately negotiated purchases, including pursuant to one or more trading plans. During the year ended December 31, 2010, we repurchased 2.2 million shares of our outstanding Common Stock for approximately $7.5 million, at an average cost of $3.40 per share, and the repurchases were recorded at cost. As of December 31, 2010, we had $14.1 million of Common Stock available to repurchase under Board authorized stock repurchase programs.
Subsequent Events—In January 2011, we fully redeemed our $312.3 million remaining principal amount of 10% senior secured notes due June 2014. This redemption fully retired the remaining senior secured notes issued in our May 2009 exchange offer. In connection with this redemption, we expect to record a gain on early extinguishment of debt of approximately $109 million in our Consolidated Statement of Operations for the quarter ending March 31, 2011. In addition, we repaid the $107.8 million outstanding principal balance of our senior unsecured notes due in March 2011 upon maturity.
In March 2011, we entered into a new $2.95 billion senior secured credit agreement comprised of a $1.50 billion term loan facility bearing interest at a rate of LIBOR plus 3.75% and maturing in June 2013 (the "Tranche A-1 Facility") and a $1.45 billion term loan facility bearing interest at a rate of LIBOR plus 5.75% maturing in June 2014 (the "Tranche A-2 Facility"), together the "Facility." Both tranches include a LIBOR floor of 1.25%. Proceeds from the new secured credit Facility were used to fully repay the
45
$1.67 billion and $0.9 billion outstanding under our existing secured credit facilities, which were due to mature in June 2011 and June 2012, respectively. Proceeds were also used to repay $175.0 million of our unsecured credit facilities due in June 2011. We expect to use the remaining proceeds to repay unsecured debt maturing in the first half of 2011 as well as for other corporate purposes.
The new secured credit Facility is collateralized by a first lien on a fixed pool of assets consisting of loans, net lease assets and OREO assets with a designated aggregate value of approximately $3.69 billion at the time of closing. We are required to maintain collateral coverage of 1.25x outstanding borrowings until the final maturity of the new Facility. Proceeds from principal repayments and sales of collateral will be applied to amortize the new Facility. Proceeds in respect of additional investment amounts and interest, rent, lease payments and fee income will be retained by us.
The Tranche A-1 Facility requires that aggregate cumulative amortization payments of not less than $200.0 million shall be made on or before December 30, 2011, not less than $450.0 million on or before June 30, 2012, not less than $750.0 million on or before December 31, 2012 and not less than $1.50 billion on or before June 28, 2013. The Tranche A-2 Facility will begin amortizing six months after the repayment in full of the Tranche A-1 Facility, such that the not less than $150.0 million of cumulative amortization payments shall be made on or before the six month anniversary of repayment of the A-1 Facility, with additional cumulative amortization payments of $150 million due on or before each six month anniversary thereafter until the Tranche A-2 Facility is fully repaid.
Critical Accounting Estimates
The preparation of financial statements in accordance with GAAP requires management to make estimates and judgments in certain circumstances that affect amounts reported as assets, liabilities, revenues and expenses. We have established detailed policies and control procedures intended to ensure that valuation methods, including any judgments made as part of such methods, are well controlled, reviewed and applied consistently from period to period. We base our estimates on historical corporate and industry experience and various other assumptions that we believe to be appropriate under the circumstances. For all of these estimates, we caution that future events rarely develop exactly as forecasted, and, therefore, routinely require adjustment.
During 2010, management reviewed and evaluated these critical accounting estimates and believes they are appropriate. Our significant accounting policies are described in Item 8—"Financial Statements and Supplemental Data—Note 3." The following is a summary of accounting policies that require more significant management estimates and judgments:
Reserve for loan losses—The reserve for loan losses reflects management's estimate of loan losses inherent in the loan portfolio as of the balance sheet date. The reserve is increased through the "Provision for loan losses" on our Consolidated Statements of Operations and is decreased by charge-offs when losses are confirmed through the receipt of assets such as cash in a pre-foreclosure sale or via ownership control of the underlying collateral in full satisfaction of the loan upon foreclosure or when significant collection efforts have ceased. We have determined we have one portfolio segment, represented by commercial real estate lending, whereby we utilize a uniform process for determining our reserves for loan losses. The reserve for loan losses includes a general, formula-based component and an asset-specific component.
The general reserve component covers performing loans and reserves for loan losses are recorded when (i) available information as of each balance sheet date indicates that it is probable a loss has occurred in the portfolio and (ii) the amount of the loss can be reasonably estimated. The formula-based general reserve is derived from estimated principal default probabilities and loss severities applied to groups of loans based upon risk ratings assigned to loans with similar risk characteristics during our quarterly loan portfolio assessment. During this assessment, we perform a comprehensive analysis of our loan portfolio and assign risk ratings to loans that incorporate management's current judgments about their credit quality based on all known and relevant internal and external factors that may affect collectability. We consider,
46
among other things, payment status, lien position, borrower financial resources and investment in collateral, collateral type, project economics and geographical location as well as national and regional economic factors. This methodology results in loans being segmented by risk classification into risk rating categories that are associated with estimated probabilities of default and principal loss. Ratings range from "1" to "5" with "1" representing the lowest risk of loss and "5" representing the highest risk of loss. We estimate loss rates based on historical realized losses experienced within our portfolio and take into account current economic conditions affecting the commercial real estate market when establishing appropriate time frames to evaluate loss experience.
The asset-specific reserve component relates to reserves for losses on impaired loans. We consider a loan to be impaired when, based upon current information and events, we believe that it is probable that we will be unable to collect all amounts due under the contractual terms of the loan agreement. This assessment is made on a loan-by-loan basis each quarter based on such factors as payment status, lien position, borrower financial resources and investment in collateral, collateral type, project economics and geographical location as well as national and regional economic factors. A reserve is established for an impaired loan when the present value of payments expected to be received, observable market prices, or the estimated fair value of the collateral (for loans that are dependent on the collateral for repayment) is lower than the carrying value of that loan.
Substantially all of our impaired loans are collateral dependent and impairment is measured using the estimated fair value of collateral, less costs to sell. We generally use the income approach through internally developed valuation models to estimate the fair value of the collateral for such loans. In more limited cases, we obtain external "as is" appraisals for loan collateral, generally when third party participations exist. Valuations are performed or obtained at the time a loan is determined to be impaired and designated non-performing, and they are updated if circumstances indicate that a significant change in value has occurred. In limited cases, appraised values may be discounted when real estate markets rapidly deteriorate.
A loan is also considered impaired if its terms are modified in a troubled debt restructuring ("TDR"). A TDR occurs when the Company grants a concession to a borrower in financial difficulty by modifying the original terms of the loan. Impairments on TDR loans are generally measured based on the present value of expected future cash flows discounted at the effective interest rate of the original loan.
The provisions for loan losses for the years ended December 31, 2010, 2009 and 2008 were $331.5 million, $1.26 billion and $1.03 billion, respectively. The total reserve for loan losses at December 31, 2010 and 2009, included asset specific reserves of $694.4 million and $1.24 billion, respectively, and general reserves of $120.2 million and $174.9 million, respectively.
Impairment of available-for-sale and held-to-maturity debt securities—For held-to-maturity and available-for-sale debt securities held in "Loans and other lending investments," management evaluates whether the asset is other-than-temporarily impaired when the fair market value is below carrying value. We consider debt securities other-than-temporarily impaired if (1) we have the intent to sell the security, (2) it is more likely than not that we will be required to sell the security before recovery, or (3) we do not expect to recover the entire amortized cost basis of the security. If it is determined that an other-than-temporary impairment exists, the portion related to credit losses, where we do not expect to recover our entire amortized cost basis, will be recognized as an "Impairment of assets" on our Consolidated Statements of Operations. If we do not intend to sell the security and it is more likely than not that we will not be required to sell the security, but the security has suffered a credit loss, the impairment charge will be separated. The credit loss component of the impairment will be recorded as an "Impairment of assets" on our Consolidated Statements of Operations, and the remainder will be recorded in "Accumulated other comprehensive income" on our Consolidated Balance Sheets.
During the years ended December 31, 2009 and 2008, we determined that unrealized credit related losses on certain held-to-maturity and available-for-sale debt securities were other-than-temporary and
47
recorded impairment charges totaling $11.7 million and $120.0 million, respectively, in "Impairment of assets" on the Consolidated Statements of Operations.
Real estate held for investment, net and Other real estate owned—REHI and OREO consist of properties acquired through foreclosure or by deed-in-lieu of foreclosure in full or partial satisfaction of non-performing loans. Properties are designated as REHI or OREO depending on our strategic plan to realize the maximum value from the collateral received. When we intend to hold, operate or develop the property for a period of at least 12 months, assets are classified as REHI, and when we intend to market these properties for sale in the near term, assets are classified as OREO.
REHI assets are initially recorded at their estimated fair value. The excess of the carrying value of the loan over the fair value of the property is charged-off against the reserve for loan losses when title to the property is obtained. Upon acquisition, tangible and intangible assets and liabilities acquired are recorded at their estimated fair values. We consider REHI assets to be long-lived and periodically review them for impairment in value whenever events or changes in circumstances indicate that the carrying amount of such assets may not be recoverable. Impairment of REHI assets is measured in the same manner as long-lived assets as described below.
OREO assets are recorded at the estimated fair value less costs to sell. The excess of the carrying value of the loan over the fair value of the property less estimated costs to sell is charged-off against the reserve for loan losses when title to the property is obtained.
We review the recoverability of an OREO asset's carrying value when events or circumstances indicate a potential impairment of a property's value. If impairment exists a loss is recorded to the extent that the carrying value exceeds the estimated fair value of the property less cost to sell.
During the years ended December 31, 2010, 2009 and 2008, we received titles to properties in satisfaction of senior mortgage loans with cumulative gross carrying values of $1.41 billion, $1.88 billion and $419.1 million, respectively, for which those properties had served as collateral, and recorded charge-offs totaling $631.9 million, $573.6 million and $102.4 million, respectively, related to these loans. Subsequent to taking title to the properties, we determined certain OREO assets were impaired due to changing market conditions, and recorded impairment charges of $19.1 million, $78.6 million and $55.6 million during the years ended December 31, 2010, 2009 and 2008, respectively.
Long-lived assets impairment test—Net lease assets to be disposed of are reported at the lower of their carrying amount or estimated fair value less costs to sell and are included in "Assets held for sale" on our Consolidated Balance Sheets. The difference between the estimated fair value less costs to sell and the carrying value will be recorded as an impairment charge and included in "Income from discontinued operations" on the Consolidated Statements of Operations. Once the asset is classified as held for sale, depreciation expense is no longer recorded and historical operating results are reclassified to "Income from discontinued operations" on the Consolidated Statements of Operations.
We periodically review long-lived assets to be held and used for impairment in value whenever events or changes in circumstances indicate that the carrying amount of such assets may not be recoverable. A held for use long-lived asset's value is impaired only if management's estimate of the aggregate future cash flows (undiscounted and without interest charges) to be generated by the asset (taking into account the anticipated holding period of the asset) is less than the carrying value. Such estimate of cash flows considers factors such as expected future operating income, trends and prospects, as well as the effects of demand, competition and other economic factors. To the extent impairment has occurred, the loss will be measured as the excess of the carrying amount of the property over the fair value of the asset and reflected as an adjustment to the basis of the asset. Impairments of net lease and REHI assets are recorded in "Impairment of other assets," on our Consolidated Statements of Operations.
48
During the years ended December 31, 2010, 2009 and 2008, we recorded impairment charges on net lease assets of $4.2 million, $19.1 million and $11.3 million, respectively, due to changes in market conditions.
Identified intangible assets and goodwill—We record intangible assets acquired at their estimated fair values separate and apart from goodwill. We determine whether such intangible assets have finite or indefinite lives. As of December 31, 2010, all such acquired intangible assets have finite lives. We amortize finite lived intangible assets based on the period over which the assets are expected to contribute directly or indirectly to the future cash flows of the business acquired. We review finite lived intangible assets for impairment whenever events or changes in circumstances indicate that their carrying amount may not be recoverable. If we determine the carrying value of an intangible asset is not recoverable we will record an impairment charge to the extent its carrying value exceeds its estimated fair value. Impairments of intangibles are recorded in "Impairment of assets" on our Consolidated Statements of Operations.
The excess of the cost of an acquired entity over the net of the amounts assigned to assets acquired (including identified intangible assets) and liabilities assumed is recorded as goodwill. Goodwill is not amortized but is tested for impairment on an annual basis, or more frequently if events or changes in circumstances indicate that the asset might be impaired. The impairment test is done at a level of reporting referred to as a reporting unit. If the fair value of the reporting unit is less than its carrying value, an impairment charge is recorded to the extent that the fair value of the goodwill within the reporting unit is less than its carrying value.
Due to an overall deterioration in conditions within the commercial real estate market, we recorded impairment charges of $4.2 million during 2009 and $39.1 million during 2008 to write-off the goodwill allocated to the net leasing and Real Estate Lending reporting segments, respectively. These charges were recorded in "Impairment of assets" on our Consolidated Statements of Operations.
During the year ended December 31, 2008, we also recorded non-cash charges of $21.5 million to reduce the carrying value of certain intangible assets related to the Fremont CRE acquisition and other acquisitions, based on their revised estimated fair values. These charges were recorded in "Impairment of assets" on our Consolidated Statements of Operations.
Consolidation—Variable Interest Entities—We evaluate our investments and other contractual arrangements to determine if our interests constitute variable interests in a variable interest entity ("VIE") and if we are the primary beneficiary. There is a significant amount of judgment required to determine if an entity is considered a VIE and if we are the primary beneficiary. We first perform a qualitative analysis, which requires certain subjective decisions regarding our assessment, including, but not limited to, which interests create or absorb variability, contractual terms, the key decision making powers, either impact on the VIE's economic performance and related party relationships. An iterative quantitative analysis is required if our qualitative analysis proves inconclusive as to whether the entity is a VIE or we are the primary beneficiary and consolidation is required.
Fair value of assets and liabilities—The degree of management judgment involved in determining the fair value of assets and liabilities is dependent upon the availability of quoted market prices or observable market parameters. For financial and nonfinancial assets and liabilities that trade actively and have quoted market prices or observable market parameters, there is minimal subjectivity involved in measuring fair value. When observable market prices and parameters are not fully available, management judgment is necessary to estimate fair value. In addition, changes in market conditions may reduce the availability of quoted prices or observable data. For example, reduced liquidity in the capital markets or changes in secondary market activities could result in observable market inputs becoming unavailable. Therefore, when market data is not available, we would use valuation techniques requiring more management judgment to estimate the appropriate fair value measurement.
49
See Item 8—"Financial Statements and Supplementary Data—Note 16" for a complete discussion on how we determine fair value of financial and non-financial assets and financial liabilities and the related measurement techniques and estimates involved.
New Accounting Pronouncements
For a discussion of the impact of new accounting pronouncements on our financial condition or results of operations, see Item 8—"Financial Statements and Supplementary Data—Note 3."
50
Item 7a. Quantitative and Qualitative Disclosures about Market Risk
Market Risks
Market risk is the exposure to loss resulting from changes in interest rates, foreign currency exchange rates, commodity prices and equity prices. In pursuing our business plan, the primary market risk to which we are exposed is interest rate risk. Our operating results will depend in part on the difference between the interest and related income earned on our assets and the interest expense incurred in connection with our interest-bearing liabilities. Changes in the general level of interest rates prevailing in the financial markets will affect the spread between our interest-earning assets and interest-bearing liabilities. Any significant compression of the spreads between interest-earning assets and interest-bearing liabilities could have a material adverse effect on us.
In the event of a significant rising interest rate environment or further economic downturn, defaults could increase and cause us to incur additional credit losses which would adversely affect our liquidity and operating results. Such delinquencies or defaults would likely have an adverse effect on the spreads between interest-earning assets and interest-bearing liabilities. In addition, an increase in interest rates could, among other things, reduce the value of our fixed-rate interest-bearing assets and our ability to realize gains from the sale of such assets.
Interest rates are highly sensitive to many factors, including governmental monetary and tax policies, domestic and international economic and political conditions, and other factors beyond our control. We monitor the spreads between our interest-earning assets and interest-bearing liabilities and may implement hedging strategies to limit the effects of changes in interest rates on our operations, including engaging in interest rate swaps and other interest rate-related derivative contracts. Such strategies are designed to reduce our exposure, on specific transactions or on a portfolio basis, to changes in cash flows as a result of interest rate movements in the market. We do not enter into derivative contracts for speculative purposes or as a hedge against changes in our credit risk or the credit risk of our borrowers.
While a REIT may utilize derivative instruments to hedge interest rate risk on its liabilities incurred to acquire or carry real estate assets without generating non-qualifying income, use of derivatives for other purposes will generate non-qualified income for REIT income test purposes. This includes hedging asset related risks such as credit, foreign exchange and prepayment or interest rate exposure on our loan assets. As a result our ability to hedge these types of risks is limited. There can be no assurance that our profitability will not be adversely affected during any period as a result of changing interest rates.
The following table quantifies the potential changes in net investment income should interest rates increase by 50 or 100 basis points and decrease by 10 basis points, assuming no change in the shape of the yield curve (i.e., relative interest rates). Net investment income is calculated as revenue from loans and other lending investments and operating leases and earnings from equity method investments, less interest expense and operating costs on net lease assets for the year ended December 31, 2010. The base interest rate scenario assumes the one-month LIBOR rate of 0.26% as of December 31, 2010. Actual results could differ significantly from those estimated in the table.
Estimated Percentage Change In Net Investment Income
Change in Interest Rates
|
Net Investment Income(1) | |||
|---|---|---|---|---|
-10 Basis Points(1) |
1.05 | % | ||
Base Interest Rate |
— | |||
+50 Basis Points |
(5.27 | %) | ||
+100 Basis Points |
(10.39 | %) | ||
Explanatory Note:
- (1)
- We have a net variable-rate debt exposure resulting in an increase in net investment income when rates decrease and a decrease in net investment income when rates increase. In addition, interest rate floors on certain of our loan assets further increase net investment income as rates decrease and decrease net investment income when rates increase. As of December 31, 2010, $823.5 million of our floating rate loans have a weighted average interest rate floor of 3.55%.
51
Item 8. Financial Statements and Supplemental Data
Index to Financial Statements
All other schedules are omitted because they are not applicable or the required information is shown in the financial statements or notes thereto.
52
Report of Independent Registered Public Accounting Firm
To the Board of Directors and Shareholders of iStar Financial Inc.:
In our opinion, the consolidated financial statements listed in the accompanying index present fairly, in all material respects, the financial position of iStar Financial Inc. and its subsidiaries (collectively, the "Company") at December 31, 2010 and 2009, and the results of their operations and their cash flows for each of the three years in the period ended December 31, 2010 in conformity with accounting principles generally accepted in the United States of America. In addition, in our opinion, the financial statement schedules listed in the accompanying index present fairly, in all material respects, the information set forth therein when read in conjunction with the related consolidated financial statements. Also in our opinion, the Company maintained, in all material respects, effective internal control over financial reporting as of December 31, 2010, based on criteria established in Internal Control—Integrated Framework issued by the Committee of Sponsoring Organizations of the Treadway Commission (COSO). The Company's management is responsible for these financial statements and financial statement schedules, for maintaining effective internal control over financial reporting and for its assessment of the effectiveness of internal control over financial reporting, included in the accompanying Management's Report on Internal Control over Financial Reporting. Our responsibility is to express opinions on these financial statements, on the financial statement schedules, and on the Company's internal control over financial reporting based on our integrated audits. We conducted our audits in accordance with the standards of the Public Company Accounting Oversight Board (United States). Those standards require that we plan and perform the audits to obtain reasonable assurance about whether the financial statements are free of material misstatement and whether effective internal control over financial reporting was maintained in all material respects. Our audits of the financial statements included examining, on a test basis, evidence supporting the amounts and disclosures in the financial statements, assessing the accounting principles used and significant estimates made by management, and evaluating the overall financial statement presentation. Our audit of internal control over financial reporting included obtaining an understanding of internal control over financial reporting, assessing the risk that a material weakness exists, and testing and evaluating the design and operating effectiveness of internal control based on the assessed risk. Our audits also included performing such other procedures as we considered necessary in the circumstances. We believe that our audits provide a reasonable basis for our opinions.
A company's internal control over financial reporting is a process designed to provide reasonable assurance regarding the reliability of financial reporting and the preparation of financial statements for external purposes in accordance with generally accepted accounting principles. A company's internal control over financial reporting includes those policies and procedures that (i) pertain to the maintenance of records that, in reasonable detail, accurately and fairly reflect the transactions and dispositions of the assets of the company; (ii) provide reasonable assurance that transactions are recorded as necessary to permit preparation of financial statements in accordance with generally accepted accounting principles, and that receipts and expenditures of the company are being made only in accordance with authorizations of management and directors of the company; and (iii) provide reasonable assurance regarding prevention or timely detection of unauthorized acquisition, use, or disposition of the company's assets that could have a material effect on the financial statements.
Because of its inherent limitations, internal control over financial reporting may not prevent or detect misstatements. Also, projections of any evaluation of effectiveness to future periods are subject to the risk that controls may become inadequate because of changes in conditions, or that the degree of compliance with the policies or procedures may deteriorate.
/s/
PricewaterhouseCoopers LLP
New York, New York
March 23, 2011
53
iStar Financial Inc.
Consolidated Balance Sheets
(In thousands, except per share data)
| |
As of December 31, | |||||||
|---|---|---|---|---|---|---|---|---|
| |
2010 | 2009 | ||||||
ASSETS |
||||||||
Loans and other lending investments, net |
$ | 4,587,352 | $ | 7,661,562 | ||||
Net lease assets, net |
1,784,509 | 2,885,896 | ||||||
Real estate held for investment, net |
833,060 | 422,664 | ||||||
Other real estate owned |
746,081 | 839,141 | ||||||
Other investments |
532,358 | 384,379 | ||||||
Assets held for sale |
— | 17,282 | ||||||
Cash and cash equivalents |
504,865 | 224,632 | ||||||
Restricted cash |
13,784 | 39,654 | ||||||
Accrued interest and operating lease income receivable, net |
24,408 | 54,780 | ||||||
Deferred operating lease income receivable |
62,569 | 122,628 | ||||||
Deferred expenses and other assets, net |
85,528 | 157,957 | ||||||
Total assets |
$ | 9,174,514 | $ | 12,810,575 | ||||
LIABILITIES AND EQUITY |
||||||||
Liabilities: |
||||||||
Accounts payable, accrued expenses and other liabilities |
$ | 133,060 | $ | 252,110 | ||||
Debt obligations, net |
7,345,433 | 10,894,903 | ||||||
Total liabilities |
7,478,493 | 11,147,013 | ||||||
Commitments and contingencies |
— | — | ||||||
Redeemable noncontrolling interests |
1,362 | 7,444 | ||||||
Equity: |
||||||||
iStar Financial Inc. shareholders' equity: |
||||||||
Preferred Stock Series D, E, F, G and I, liquidation preference $25.00 per share (see Note 11) |
22 | 22 | ||||||
High Performance Units |
9,800 | 9,800 | ||||||
Common Stock, $0.001 par value, 200,000 shares authorized, 138,189 issued and 92,336 outstanding at December 31, 2010 and 137,868 issued and 94,216 outstanding at December 31, 2009 |
138 | 138 | ||||||
Additional paid-in capital |
3,809,071 | 3,791,972 | ||||||
Retained earnings (deficit) |
(2,014,013 | ) | (2,051,376 | ) | ||||
Accumulated other comprehensive income (see Note 15) |
1,609 | 6,145 | ||||||
Treasury stock, at cost, $0.001 par value, 45,853 shares at December 31, 2010 and 43,652 shares at December 31, 2009 |
(158,492 | ) | (151,016 | ) | ||||
Total iStar Financial Inc. shareholders' equity |
1,648,135 | 1,605,685 | ||||||
Noncontrolling interests |
46,524 | 50,433 | ||||||
Total equity |
1,694,659 | 1,656,118 | ||||||
Total liabilities and equity |
$ | 9,174,514 | $ | 12,810,575 | ||||
The accompanying notes are an integral part of the consolidated financial statements.
54
iStar Financial Inc.
Consolidated Statements of Operations
(In thousands, except per share data)
| |
For the Years Ended December 31, | |||||||||||
|---|---|---|---|---|---|---|---|---|---|---|---|---|
| |
2010 | 2009 | 2008 | |||||||||
Revenue: |
||||||||||||
Interest income |
$ | 364,094 | $ | 557,809 | $ | 947,661 | ||||||
Operating lease income |
170,213 | 177,960 | 183,641 | |||||||||
Other income |
40,944 | 30,429 | 97,742 | |||||||||
Total revenue |
575,251 | 766,198 | 1,229,044 | |||||||||
Costs and expenses: |
||||||||||||
Interest expense |
315,985 | 414,240 | 618,711 | |||||||||
Operating costs—net lease assets |
15,072 | 15,942 | 15,320 | |||||||||
Operating costs—REHI and OREO |
64,694 | 40,866 | 9,288 | |||||||||
Depreciation and amortization |
63,244 | 63,259 | 60,632 | |||||||||
General and administrative |
109,526 | 124,152 | 138,164 | |||||||||
Provision for loan losses |
331,487 | 1,255,357 | 1,029,322 | |||||||||
Impairment of assets |
20,521 | 126,588 | 334,534 | |||||||||
Other expense |
23,078 | 66,470 | 24,758 | |||||||||
Total costs and expenses |
943,607 | 2,106,874 | 2,230,729 | |||||||||
Income (loss) before earnings from equity method investments and other items |
(368,356 | ) | (1,340,676 | ) | (1,001,685 | ) | ||||||
Gain on early extinguishment of debt, net |
108,923 | 547,349 | 393,131 | |||||||||
Gain on sale of joint venture interest |
— | — | 280,219 | |||||||||
Earnings from equity method investments |
51,908 | 5,298 | 6,535 | |||||||||
Income (loss) from continuing operations |
(207,525 | ) | (788,029 | ) | (321,800 | ) | ||||||
Income from discontinued operations |
17,349 | 5,756 | 48,575 | |||||||||
Gain from discontinued operations |
270,382 | 12,426 | 91,458 | |||||||||
Net income (loss) |
80,206 | (769,847 | ) | (181,767 | ) | |||||||
Net (income) loss attributable to noncontrolling interests |
(523 |
) |
1,071 |
991 |
||||||||
Gain attributable to noncontrolling interests |
— | — | (22,249 | ) | ||||||||
Net income (loss) attributable to iStar Financial Inc. |
79,683 | (768,776 | ) | (203,025 | ) | |||||||
Preferred dividends |
(42,320 | ) | (42,320 | ) | (42,320 | ) | ||||||
Net income (loss) attributable to iStar Financial Inc. and allocable to common shareholders, HPU holders and Participating Security holders(1)(2)(3) |
$ | 37,363 | $ | (811,096 | ) | $ | (245,345 | ) | ||||
Per common share data(3): |
||||||||||||
Income (loss) attributable to iStar Financial Inc. from continuing operations: |
||||||||||||
Basic and diluted |
$ | (2.60 | ) | $ | (8.06 | ) | $ | (2.87 | ) | |||
Net income (loss) attributable to iStar Financial Inc.: |
||||||||||||
Basic and diluted |
$ | 0.39 | $ | (7.88 | ) | $ | (1.85 | ) | ||||
Weighted average number of common shares—basic and diluted |
93,244 | 100,071 | 131,153 | |||||||||
Per HPU share data(1)(3): |
||||||||||||
Income (loss) attributable to iStar Financial Inc. from continuing operations: |
||||||||||||
Basic and diluted |
$ | (494.33 | ) | $ | (1,535.20 | ) | $ | (542.40 | ) | |||
Net income (loss) attributable to iStar Financial Inc.: |
||||||||||||
Basic and diluted |
$ | 72.27 | $ | (1,501.73 | ) | $ | (349.87 | ) | ||||
Weighted average number of HPU shares—basic and diluted |
15 | 15 | 15 | |||||||||
Explanatory Notes:
- (1)
- HPU
holders are current and former Company employees who purchased high performance common stock units under the Company's High Performance Unit Program
(see Note 11).
- (2)
- Participating
Security holders are Company employees and directors who hold unvested restricted stock units and common stock equivalents granted under the
Company's Long Term Incentive Plans (see Notes 13 and 14).
- (3)
- See
Note 14 for amounts attributable to iStar Financial Inc. for income (loss) from continuing operations and further details on the
calculation of earnings per share.
The accompanying notes are an integral part of the consolidated financial statements.
55
Consolidated Statements of Changes in Equity
For the Years Ended December 31, 2010, 2009 and 2008
(In thousands)
| |
iStar Financial Inc. Shareholders' Equity | |
|
|||||||||||||||||||||||||
|---|---|---|---|---|---|---|---|---|---|---|---|---|---|---|---|---|---|---|---|---|---|---|---|---|---|---|---|---|
| |
Preferred Stock(1) |
HPU's | Common Stock at Par |
Additional Paid-In Capital |
Retained Earnings (Deficit) |
Accumulated Other Comprehensive Income (Loss) |
Treasury Stock at cost |
Noncontrolling Interests |
Total Equity |
|||||||||||||||||||
Balance at December 31, 2007 |
$ | 22 | $ | 9,800 | $ | 135 | $ | 3,739,532 | $ | (753,980 | ) | $ | (2,295 | ) | $ | (57,219 | ) | $ | 36,175 | $ | 2,972,170 | |||||||
Exercise of options |
— | — | — | 5,868 | — | — | — | 5,868 | ||||||||||||||||||||
Dividends declared—preferred |
— | — | — | — | (42,320 | ) | — | — | — | (42,320 | ) | |||||||||||||||||
Dividends declared—common |
— | — | — | — | (236,052 | ) | — | — | — | (236,052 | ) | |||||||||||||||||
Dividends declared—HPU |
— | — | — | — | (4,903 | ) | — | — | — | (4,903 | ) | |||||||||||||||||
Repurchase of stock |
— | — | — | — | — | — | (63,940 | ) | — | (63,940 | ) | |||||||||||||||||
Restricted stock unit amortization, net |
— | — | 1 | 20,746 | — | — | — | — | 20,747 | |||||||||||||||||||
Issuance of stock—DRIP/stock purchase plan |
— | — | 1 | 1,887 | — | — | — | — | 1,888 | |||||||||||||||||||
Redemption of HPU's |
— | — | — | 1,400 | — | — | — | — | 1,400 | |||||||||||||||||||
Net loss for the period(2) |
— | — | — | — | (203,025 | ) | — | — | (1,707 | ) | (204,732 | ) | ||||||||||||||||
Convertible Note repurchase |
— | — | — | (661 | ) | — | — | — | (661 | ) | ||||||||||||||||||
Gain attributable to noncontrolling interests |
— | — | — | — | — | — | — | 22,249 | 22,249 | |||||||||||||||||||
Contributions from noncontrolling interests |
— | — | — | — | — | — | — | 171 | 171 | |||||||||||||||||||
Distributions to noncontrolling interests |
— | — | — | — | — | — | — | (25,048 | ) | (25,048 | ) | |||||||||||||||||
Sale/purchase of certain noncontrolling interests |
— | — | — | — | — | — | — | (4,177 | ) | (4,177 | ) | |||||||||||||||||
Change in accumulated other comprehensive income (loss) |
— | — | — | — | — | 4,002 | — | — | 4,002 | |||||||||||||||||||
Balance at December 31, 2008 |
$ | 22 | $ | 9,800 | $ | 137 | $ | 3,768,772 | $ | (1,240,280 | ) | $ | 1,707 | $ | (121,159 | ) | $ | 27,663 | $ | 2,446,662 | ||||||||
Dividends declared—preferred |
— | — | — | — | (42,320 | ) | — | — | — | (42,320 | ) | |||||||||||||||||
Repurchase of stock |
— | — | — | — | — | — | (29,857 | ) | — | (29,857 | ) | |||||||||||||||||
Restricted stock unit amortization, net |
— | — | 1 | 23,200 | — | — | — | — | 23,201 | |||||||||||||||||||
Net loss for the period(2) |
— | — | — | — | (768,776 | ) | — | — | (1,065 | ) | (769,841 | ) | ||||||||||||||||
Contributions from noncontrolling interests |
— | — | — | — | — | — | — | 26,487 | 26,487 | |||||||||||||||||||
Distributions to noncontrolling interests |
— | — | — | — | — | — | — | (2,652 | ) | (2,652 | ) | |||||||||||||||||
Change in accumulated other comprehensive income (loss) |
— | — | — | — | — | 4,438 | — | — | 4,438 | |||||||||||||||||||
Balance at December 31, 2009 |
$ | 22 | $ | 9,800 | $ | 138 | $ | 3,791,972 | $ | (2,051,376 | ) | $ | 6,145 | $ | (151,016 | ) | $ | 50,433 | $ | 1,656,118 | ||||||||
The accompanying notes are an integral part of the consolidated financial statements.
56
iStar Financial Inc.
Consolidated Statements of Changes in Equity (Continued)
For the Years Ended December 31, 2010, 2009 and 2008
(In thousands)
| |
iStar Financial Inc. Shareholders' Equity | |
|
|||||||||||||||||||||||||
|---|---|---|---|---|---|---|---|---|---|---|---|---|---|---|---|---|---|---|---|---|---|---|---|---|---|---|---|---|
| |
Preferred Stock(1) |
HPU's | Common Stock at Par |
Additional Paid-In Capital |
Retained Earnings (Deficit) |
Accumulated Other Comprehensive Income (Loss) |
Treasury Stock at cost |
Noncontrolling Interests |
Total Equity |
|||||||||||||||||||
Balance at December 31, 2009 |
$ | 22 | $ | 9,800 | $ | 138 | $ | 3,791,972 | $ | (2,051,376 | ) | $ | 6,145 | $ | (151,016 | ) | $ | 50,433 | $ | 1,656,118 | ||||||||
Dividends declared—preferred |
— | — | — | — | (42,320 | ) | — | — | — | (42,320 | ) | |||||||||||||||||
Repurchase of stock |
— | — | — | — | — | — | (7,476 | ) | — | (7,476 | ) | |||||||||||||||||
Restricted stock unit amortization, net |
— | — | — | 17,099 | — | — | — | — | 17,099 | |||||||||||||||||||
Net income for the period(2) |
— | — | — | — | 79,683 | — | — | 534 | 80,217 | |||||||||||||||||||
Contributions from noncontrolling interests |
— | — | — | — | — | — | — | 159 | 159 | |||||||||||||||||||
Distributions to noncontrolling interests |
— | — | — | — | — | — | — | (4,602 | ) | (4,602 | ) | |||||||||||||||||
Change in accumulated other comprehensive income (loss) |
— | — | — | — | — | (4,536 | ) | — | — | (4,536 | ) | |||||||||||||||||
Balance at December 31, 2010 |
$ | 22 | $ | 9,800 | $ | 138 | $ | 3,809,071 | $ | (2,014,013 | ) | $ | 1,609 | $ | (158,492 | ) | $ | 46,524 | $ | 1,694,659 | ||||||||
Explanatory Notes:
- (1)
- See
Note 11 for details on the Company's Cumulative Redeemable Preferred Stock.
- (2)
- For the years ended December 31, 2010, 2009 and 2008, net income (loss) included $(11), $(6) and $716, respectively, of net income (loss) attributable to redeemable noncontrolling interests.
The accompanying notes are an integral part of the consolidated financial statements.
57
iStar Financial Inc.
Consolidated Statements of Cash Flows
(In thousands)
| |
For the Years Ended December 31, | |||||||||||
|---|---|---|---|---|---|---|---|---|---|---|---|---|
| |
2010 | 2009 | 2008 | |||||||||
Cash flows from operating activities: |
||||||||||||
Net income (loss) |
$ | 80,206 | $ | (769,847 | ) | $ | (181,767 | ) | ||||
Adjustments to reconcile net income (loss) to cash flows from operating activities: |
||||||||||||
Provision for loan losses |
331,487 | 1,255,357 | 1,029,322 | |||||||||
Non-cash expense for stock-based compensation |
19,355 | 23,592 | 23,079 | |||||||||
Impairment of assets |
22,382 | 141,018 | 334,830 | |||||||||
Depreciation and amortization |
70,770 | 99,287 | 104,453 | |||||||||
Amortization of discounts/premiums and deferred financing costs on debt |
(18,926 | ) | (12,025 | ) | 44,326 | |||||||
Amortization of discounts/premiums, deferred interest and costs on lending investments |
(102,261 | ) | (117,527 | ) | (196,519 | ) | ||||||
Discounts, loan fees and deferred interest received |
9,587 | 11,921 | 29,403 | |||||||||
Earnings from equity method investments |
(51,908 | ) | (5,298 | ) | (6,535 | ) | ||||||
Distributions from operations of equity method investments |
32,651 | 27,973 | 48,197 | |||||||||
Deferred operating lease income |
(9,976 | ) | (13,926 | ) | (20,043 | ) | ||||||
Gain from discontinued operations |
(270,382 | ) | (12,426 | ) | (91,458 | ) | ||||||
Gain on early extinguishment of debt, net |
(110,075 | ) | (547,349 | ) | (393,131 | ) | ||||||
Gain on sale of joint venture interest |
— | — | (280,219 | ) | ||||||||
Other non-cash adjustments |
1,043 | (1,156 | ) | (1,345 | ) | |||||||
Changes in assets and liabilities: |
||||||||||||
Changes in accrued interest and operating lease income receivable, net |
14,259 | 31,767 | 36,528 | |||||||||
Changes in deferred expenses and other assets, net |
(1,781 | ) | 7,659 | (18,599 | ) | |||||||
Changes in accounts payable, accrued expenses and other liabilities |
(63,827 | ) | (41,225 | ) | (41,993 | ) | ||||||
Cash flows from operating activities |
(47,396 | ) | 77,795 | 418,529 | ||||||||
Cash flows from investing activities: |
||||||||||||
New investment originations |
(100,000 | ) | — | (32,044 | ) | |||||||
Add-on fundings under existing loan commitments |
(356,329 | ) | (1,224,593 | ) | (3,276,502 | ) | ||||||
Repayments of and principal collections on loans |
1,519,653 | 951,202 | 1,822,587 | |||||||||
Purchase of securities |
(349 | ) | (31,535 | ) | (29 | ) | ||||||
Net proceeds from sales of loans |
700,098 | 720,770 | 394,293 | |||||||||
Net proceeds from sales of net lease assets |
1,362,983 | 64,566 | 576,857 | |||||||||
Net proceeds from sales of other real estate owned |
460,198 | 270,621 | 169,600 | |||||||||
Net proceeds from sale of joint venture interest |
— | — | 416,970 | |||||||||
Net proceeds from repayments and sales of securities |
213,344 | 27,060 | 51,407 | |||||||||
Contributions to unconsolidated entities |
(23,520 | ) | (34,272 | ) | (50,636 | ) | ||||||
Distributions from unconsolidated entities |
11,441 | 9,459 | 27,292 | |||||||||
Capital expenditures for build-to-suit facilities |
— | (7,152 | ) | (79,090 | ) | |||||||
Capital expenditures on net lease assets |
(14,031 | ) | (7,739 | ) | (23,802 | ) | ||||||
Capital expenditures on REHI and OREO |
(28,832 | ) | (11,056 | ) | (20,646 | ) | ||||||
Other investing activities, net |
(5,833 | ) | (2,629 | ) | (4,200 | ) | ||||||
Cash flows from investing activities |
3,738,823 | 724,702 | (27,943 | ) | ||||||||
Cash flows from financing activities: |
||||||||||||
Borrowings under revolving credit facilities |
36,793 | 134,741 | 11,451,167 | |||||||||
Repayments under revolving credit facilities |
(36,812 | ) | (371,798 | ) | (10,464,322 | ) | ||||||
Repayments under interim financing |
— | — | (1,289,811 | ) | ||||||||
Borrowings under secured term loans |
— | 1,000,000 | 1,307,776 | |||||||||
Repayments under secured term loans |
(2,132,899 | ) | (318,431 | ) | (109,262 | ) | ||||||
Borrowings under unsecured notes |
— | — | 740,506 | |||||||||
Repayments under unsecured notes |
(374,249 | ) | (628,366 | ) | (620,331 | ) | ||||||
Repurchases and redemptions of secured and unsecured notes |
(855,833 | ) | (885,055 | ) | (501,518 | ) | ||||||
Net distributions to noncontrolling interests |
(10,462 | ) | (2,630 | ) | (31,029 | ) | ||||||
Changes in restricted cash held in connection with debt obligations |
12,064 | 121,116 | (118,762 | ) | ||||||||
Payments for deferred financing costs |
— | (51,801 | ) | 11,221 | ||||||||
Common dividends paid |
— | — | (269,827 | ) | ||||||||
Preferred dividends paid |
(42,320 | ) | (42,320 | ) | (42,320 | ) | ||||||
Purchase of treasury stock |
(7,476 | ) | (29,858 | ) | (63,940 | ) | ||||||
Other financing activity |
— | — | 1,896 | |||||||||
Cash flows from financing activities |
(3,411,194 | ) | (1,074,402 | ) | 1,444 | |||||||
Changes in cash and cash equivalents |
280,233 | (271,905 | ) | 392,030 | ||||||||
Cash and cash equivalents at beginning of period |
224,632 | 496,537 | 104,507 | |||||||||
Cash and cash equivalents at end of period |
$ | 504,865 | $ | 224,632 | $ | 496,537 | ||||||
Supplemental disclosure of cash flow information: |
||||||||||||
Cash paid during the period for interest, net of amount capitalized |
$ | 376,473 | $ | 531,858 | $ | 645,413 | ||||||
The accompanying notes are an integral part of the consolidated financial statements.
58
iStar Financial Inc.
Notes to Consolidated Financial Statements
Note 1—Business and Organization
Business—iStar Financial Inc., or the "Company," is a fully-integrated finance and investment company focused on the commercial real estate industry. The Company provides custom-tailored investment capital to high-end private and corporate owners of real estate and invests directly across a range of real estate sectors. The Company, which is taxed as a real estate investment trust, or "REIT," has invested more than $35 billion over the the past two decades. The Company's three primary business segments are lending, net leasing and real estate investment. See Note 10 for discussion of the impact of recent economic conditions on the Company and business risks and uncertainties.
Organization—The Company began its business in 1993 through private investment funds and became publicly traded in 1998. Since that time, the Company has grown through the origination of new lending and leasing transactions, as well as through corporate acquisitions, including the acquisition of TriNet Corporate Realty Trust, Inc. in 1999, the acquisitions of Falcon Financial Investment Trust and of a significant non-controlling interest in Oak Hill Advisors, L.P. and affiliates in 2005, and the acquisition of the commercial real estate lending business and loan portfolio which the Company refers to as "Fremont CRE," of Fremont Investment and Loan, or "Fremont," a division of Fremont General Corporation, in 2007.
Note 2—Basis of Presentation and Principles of Consolidation
Basis of Presentation—The accompanying audited Consolidated Financial Statements have been prepared in conformity with generally accepted accounting principles in the United States of America ("GAAP") for complete financial statements. The preparation of financial statements in conformity with GAAP requires management to make estimates and assumptions that affect the reported amounts of assets, liabilities, disclosure of contingent assets and liabilities at the dates of the financial statements and the reported amounts of revenues and expenses during the reporting periods. Actual results could differ from those estimates.
Certain prior year amounts have been reclassified in the Consolidated Financial Statements and the related notes to conform to the current period presentation.
Principles of Consolidation—The Consolidated Financial Statements include the financial statements of the Company, its wholly owned subsidiaries, controlled partnerships and variable interest entities ("VIEs") for which the Company is the primary beneficiary. Consolidated VIEs included OHA Strategic Credit Fund Parallel I, LP ("OHA SCF") and Madison Deutsche Andau Holdings, LP ("Madison DA") (see Note 3). All significant intercompany balances and transactions have been eliminated in consolidation.
59
iStar Financial Inc.
Notes to Consolidated Financial Statements (Continued)
Note 3—Summary of Significant Accounting Policies
Loans and other lending investments, net—Loans and other lending investments, net includes the following investments: senior mortgages, subordinate mortgages, corporate/partnership loans and other lending investments-securities. Management considers nearly all of its loans and debt securities to be held-for-investment or held-to-maturity, although certain investments may be classified as held-for-sale or available-for-sale.
Loans and other lending investments designated for sale are classified as held for sale and are carried at lower of amortized historical cost or fair value. The amount by which carrying value exceeds fair value is recorded as a valuation allowance. Subsequent changes in the valuation allowance are included in the determination of net income (loss) in the period in which the change occurs.
Loans classified as held-for-investment or held-to-maturity are reported at their outstanding unpaid principal balance, and include unamortized acquisition premiums or discounts and unamortized deferred loan costs or fees. These loans also include accrued and paid-in-kind interest and accrued exit fees that the Company determines are probable of being collected. Debt securities classified as available-for-sale are reported at fair value with unrealized gains and losses included in "Accumulated other comprehensive income" on the Company's Consolidated Balance Sheets.
For held-to-maturity and available-for-sale debt securities held in "Loans and other lending investments, net," management evaluates whether the asset is other-than-temporarily impaired when the fair market value is below carrying value. The Company considers debt securities other-than-temporarily impaired if (1) the Company has the intent to sell the security, (2) it is more likely than not that it will be required to sell the security before recovery, or (3) it does not expect to recover the entire amortized cost basis of the security. If it is determined that an other-than-temporary impairment exists, the portion related to credit losses, where the Company does not expect to recover its entire amortized cost basis, will be recognized as an "Impairment of assets" on the Company's Consolidated Statements of Operations. If the Company does not intend to sell the security and it is more likely than not that the entity will not be required to sell the security, but the security has suffered a credit loss, the impairment charge will be separated. The credit loss component of the impairment will be recorded as an "Impairment of assets" on the Company's Consolidated Statements of Operations, and the remainder will be recorded in "Accumulated other comprehensive income" on the Company's Consolidated Balance Sheets.
Net lease assets and depreciation—Net lease assets are recorded at cost less accumulated depreciation. Certain improvements and replacements are capitalized when they extend the useful life, increase capacity or improve the efficiency of the asset. Repairs and maintenance items are expensed as incurred. Depreciation is computed using the straight-line method of cost recovery over the shorter of estimated useful lives or 40 years for facilities, five years for furniture and equipment, the shorter of the remaining lease term or expected life for tenant improvements and the remaining useful life of the facility for facility improvements.
Net lease assets to be disposed of are reported at the lower of their carrying amount or estimated fair value less costs to sell and are included in "Assets held for sale" on the Company's Consolidated Balance Sheets. If the estimated fair value less costs to sell is less than the carrying value, the difference will be recorded as an impairment charge and included in "Income from discontinued operations" on the Company's Consolidated Statements of Operations. Once an asset is classified as held for sale, depreciation expense is no longer recorded and historical operating results are reclassified to "Income from discontinued operations" on the Company's Consolidated Statements of Operations. As of
60
iStar Financial Inc.
Notes to Consolidated Financial Statements (Continued)
Note 3—Summary of Significant Accounting Policies (Continued)
December 31, 2009, there were two net lease assets with an aggregate book value of $17.3 million classified as "Assets held for sale" on the Company's Consolidated Balance Sheets.
The Company periodically reviews long-lived assets to be held and used for impairment in value whenever events or changes in circumstances indicate that the carrying amount of such assets may not be recoverable. The value of a long-lived asset held for use is impaired only if management's estimate of the aggregate future cash flows (undiscounted and without interest charges) to be generated by the asset (taking into account the anticipated holding period of the asset) is less than the carrying value. Such estimate of cash flows considers factors such as expected future operating income, trends and prospects, as well as the effects of demand, competition and other economic factors. To the extent impairment has occurred, the loss will be measured as the excess of the carrying amount of the property over the fair value of the asset and reflected as an adjustment to the basis of the asset. Impairments of net lease assets that are not held for sale are recorded in "Impairment of assets," on the Company's Consolidated Statements of Operations.
The Company accounts for its acquisition of facilities by allocating the purchase price to the tangible and intangible assets and liabilities acquired based on their estimated fair values. The value of the tangible assets, consisting of land, buildings, building improvements and tenant improvements is determined as if these assets are vacant. Intangible assets may include the value of above-market or below-market, in-place leases and the value of customer relationships, which are each recorded at their relative estimated fair values.
The capitalized above-market (or below-market) lease value is amortized as a reduction of (or, increase to) operating lease income over the remaining non-cancelable term of each lease plus any renewal periods with fixed rental terms that are considered to be below-market. The Company also generally engages in sale/leaseback transactions and typically executes leases with the occupant simultaneously with the purchase of the net lease asset at market-rate rents. As such, no above-market or below-market lease value is ascribed to these transactions.
Real estate held for investment, net—Real estate held for investment, net ("REHI") consists of properties acquired through foreclosure or through deed-in-lieu of foreclosure in full or partial satisfaction of non-performing loans that the Company intends to hold, operate or develop for a period of at least 12 months. REHI assets are initially recorded at their estimated fair value. The excess of the carrying value of the loan over the estimated fair value of the property acquired is charged-off against the reserve for loan losses when title to the property is obtained. Additionally, upon acquisition of a property, tangible and intangible assets and liabilities acquired are recorded at their estimated fair values and depreciation is computed, all in the same manners as described in "Net lease assets and depreciation" above. Subsequent to acquisition, qualified development and construction costs are capitalized. Revenues and expenses related to REHI assets are recorded as "Other income" and "Operating costs—REHI and OREO," respectively, on the Company's Consolidated Statements of Operations.
The Company considers REHI assets to be long-lived and periodically reviews them for impairment in value whenever events or changes in circumstances indicate that the carrying amount of such assets may not be recoverable. The Company measures impairments for REHI assets in the same manner as net lease assets, as described in "Net lease assets and depreciation" above. Impairments of REHI assets are recorded in "Impairment of assets," on the Company's Consolidated Statements of Operations.
61
iStar Financial Inc.
Notes to Consolidated Financial Statements (Continued)
Note 3—Summary of Significant Accounting Policies (Continued)
Other real estate owned—OREO consists of properties acquired through foreclosure or by deed-in-lieu of foreclosure in full or partial satisfaction of non-performing loans that the Company intends to market for sale in the near term. OREO is recorded at the estimated fair value less costs to sell. The excess of the carrying value of the loan over the estimated fair value of the property less costs to sell is charged-off against the reserve for loan losses when title to the property is obtained. Net revenues and costs of holding the property are recorded as "Operating costs—REHI and OREO" in the Company's Consolidated Statements of Operations. Significant property improvements may be capitalized to the extent that the carrying value of the property does not exceed its estimated fair value less costs to sell.
The Company reviews the recoverability of an OREO asset's carrying value when events or circumstances indicate a potential impairment of a property's value. If impairment exists, a loss is recorded to the extent that the carrying value exceeds the estimated fair value of the property less costs to sell. These impairments are recorded in "Impairment of assets" on the Company's Consolidated Statements of Operations.
Equity and cost method investments—Purchased equity interests that are not publicly traded and/or do not have a readily determinable fair value are accounted for pursuant to the equity method of accounting if the Company can significantly influence the operating and financial policies of an investee. This is generally presumed to exist when ownership interest is between 20% and 50% of a corporation, or greater than 5% of a limited partnership or limited liability company. The Company's periodic share of earnings and losses in equity method investees is included in "Earnings from equity method investments" on the Consolidated Statements of Operations. When the Company's ownership position is too small to provide such influence, the cost method is used to account for the equity interest. Equity and cost method investments are included in "Other investments" on the Company's Consolidated Balance Sheets.
The Company periodically reviews equity method investments for impairment in value whenever events or changes in circumstances indicate that the carrying amount of such investments may not be recoverable. The Company will record an impairment charge to the extent that the estimated fair value of an investment is less than its carrying value and the Company determines the impairment is other-than-temporary. Impairment charges are recorded in "Impairment of assets" on the Company's Consolidated Statements of Operations.
Timber and timberlands—In January 2005, TimberStar Operating Partnership, L.P. ("TimberStar") was created to acquire and manage a diversified portfolio of timberlands. During 2008, the Company sold all of its timberland investments. The Company consolidated this partnership for financial statement purposes. TimberStar's operating results for 2008 have been reclassified and are presented in "Income (loss) from discontinued operations" on its Consolidated Statements of Operations.
TimberStar previously owned a 46.7% interest in TimberStar Southwest Holdco LLC ("TimberStar Southwest"), which the Company accounted for under the equity method. In April 2008, the Company sold its joint venture interest and recorded a gain in "Gain on sale of joint venture interest" and "Gain attributable to noncontrolling interests" on its Consolidated Statements of Operations (see Note 7).
Cash and cash equivalents—Cash and cash equivalents include cash held in banks or invested in money market funds with original maturity terms of less than 90 days.
Restricted cash—Restricted cash represents amounts required to be maintained under certain of the Company's debt obligations and OREO, leasing and derivative transactions.
62
iStar Financial Inc.
Notes to Consolidated Financial Statements (Continued)
Note 3—Summary of Significant Accounting Policies (Continued)
Consolidation—Variable interest entities—The Company adopted Accounting Standards Update ("ASU") 2009-17 on January 1, 2010. In accordance with the standard, the Company evaluated its investments and other contractual arrangements to determine if they constitute variable interests in a VIE. A VIE is an entity where a controlling financial interest is achieved through means other than voting rights. A VIE is consolidated by the primary beneficiary, which is the party that has the power to direct matters that most significantly impact the activities of the VIE and has the obligation to absorb losses or the right to receive benefits of the VIE that could potentially be significant to the VIE. This overall consolidation assessment includes a review of, among other factors, which interests create or absorb variability, contractual terms, the key decision making powers, their impact on the VIE's economic performance, and related party relationships. Where qualitative assessment is not conclusive, the Company performs a quantitative analysis. The Company reassesses its evaluation of the primary beneficiary of a VIE on an ongoing basis and assesses its evaluation of an entity as a VIE upon certain reconsideration events.
The Company has investments in certain funds that meet the deferral criteria in ASU 2010-10 and will continue to assess consolidation of these entities under the overall guidance on the consolidation of VIEs in Accounting Standards Codification ("ASC") 810-10. The consolidation evaluation is similar to the process noted above, except that the primary beneficiary is the party that will receive a majority of the VIE's anticipated losses, a majority of the VIE's expected residual returns, or both. In addition, for entities that meet the deferral criteria, the Company reassesses its initial evaluation of the primary beneficiary and whether an entity is a VIE upon the occurrence of certain reconsideration events.
Consolidated VIEs—The Company did not consolidate any new entities as the result of the adoption of ASU 2009-17. The Company continues to consolidate OHA Strategic Credit Fund Parallel I, L.P. ("OHA SCF"), which was created to invest in distressed and undervalued loans, bonds, equities and other investments. As of December 31, 2010 and 2009, OHA SCF had $45.7 million and $40.3 million, respectively, of total assets, no debt, and $0.1 million of noncontrolling interests. The investments held by this entity are presented in "Other investments" on the Company's Consolidated Balance Sheets. As of December 31, 2010, the Company had a total unfunded commitment of $26.8 million to this entity.
The Company also continues to consolidate Madison Deutsche Andau Holdings, LP ("Madison DA"), which was created to invest in mortgage loans secured by real estate in Europe. As of December 31, 2010 and 2009, Madison DA had $58.0 million and $63.2 million, respectively, of total assets, no debt, and $8.6 million and $9.5 million of noncontrolling interests, respectively. The investments held by this entity are presented in "Loans and other lending investments, net" on the Company's Consolidated Balance Sheets.
Unconsolidated VIEs—On January 1, 2010, the Company deconsolidated Moor Park Real Estate Partners II, L.P. Incorporated ("Moor Park") as a result of the adoption of ASU 2009-17. Moor Park is a third-party managed fund that was created to make investments in European real estate as a 33% investor along-side a sister fund. The Company determined it did not have the power to direct matters that most significantly impact the activities of the VIE due to its interest as a limited partner. There was no cumulative effect adjustment resulting from the deconsolidation and the investment continues to be classified in "Other investments" on the Company's Consolidated Balance Sheets. As of December 31, 2010, the Company's carrying value in Moor Park was $12.7 million. The Company's maximum exposure to loss from this investment would not exceed the carrying value of its investment.
63
iStar Financial Inc.
Notes to Consolidated Financial Statements (Continued)
Note 3—Summary of Significant Accounting Policies (Continued)
In addition, the Company determined 26 of its other investments were VIEs where it is not the primary beneficiary and accordingly the VIEs have not been consolidated in the Company's Consolidated Financial Statements. As of December 31, 2010, the Company's maximum exposure to loss from these investments would not exceed the sum of the $203.9 million carrying value of the investments and $24.9 million of related unfunded commitments.
Deferred expenses—Deferred expenses include leasing costs and financing fees. Leasing costs include brokerage, legal and other costs which are amortized over the life of the respective leases. External fees and costs incurred to obtain long-term financing have been deferred and are amortized over the term of the respective borrowing using the effective interest method or the straight line method, as appropriate. Amortization of leasing costs and deferred financing fees are included in the Company's "Depreciation and amortization" and "Interest expense," respectively, on the Company's Consolidated Statements of Operations.
Identified intangible assets and goodwill—Upon the acquisition of a business, the Company records intangible assets acquired at their estimated fair values separate and apart from goodwill. The Company determines whether such intangible assets have finite or indefinite lives. As of December 31, 2010, all such intangible assets acquired by the Company have finite lives. The Company amortizes finite lived intangible assets based on the period over which the assets are expected to contribute directly or indirectly to the future cash flows of the business acquired. The Company reviews finite lived intangible assets for impairment whenever events or changes in circumstances indicate that their carrying amount may not be recoverable. If the Company determines the carrying value of an intangible asset is not recoverable it will record an impairment charge to the extent its carrying value exceeds its estimated fair value. Impairments of intangible assets are recorded in "Impairment of assets" on the Company's Consolidated Statements of Operations.
During the year ended December 31, 2008, the Company recorded non-cash charges of $21.5 million to reduce the carrying value of certain intangible assets related to the Fremont CRE acquisition and other acquisitions, based on their updated estimated fair values.
As of December 31, 2010 and 2009, the Company had $42.8 million and $55.9 million, respectively, of unamortized finite lived intangible assets primarily related to the prior acquisition of net lease assets and REHI. The total amortization expense for these intangible assets was $9.0 million, $12.2 million and $13.7 million for the years ended December 31, 2010, 2009 and 2008, respectively. The estimated aggregate amortization costs for each of the five succeeding fiscal years are as follows ($ in thousands):
2011 |
$ | 7,824 | ||
2012 |
4,140 | |||
2013 |
2,730 | |||
2014 |
2,339 | |||
2015 |
2,193 | |||
Total |
$ | 19,226 | ||
The excess of the cost of an acquired entity over the net of the amounts assigned to assets acquired (including identified intangible assets) and liabilities assumed is recorded as goodwill. Goodwill is not amortized but is tested for impairment on an annual basis, or more frequently if events or changes in circumstances indicate that the asset might be impaired. The impairment test is done at a level of reporting
64
iStar Financial Inc.
Notes to Consolidated Financial Statements (Continued)
Note 3—Summary of Significant Accounting Policies (Continued)
referred to as a reporting unit. If the fair value of the reporting unit is less than its carrying value, an impairment loss is recorded to the extent that the fair value of the goodwill within the reporting unit is less than its carrying value. Fair values for goodwill and other finite lived intangible assets are determined using the market approach, income approach or cost approach, as appropriate.
Due to an overall deterioration in conditions within the commercial real estate market, the Company recorded impairment charges of $4.2 million during 2009 and $39.1 million during 2008 to write-off the goodwill allocated to the Net Leasing and Real Estate Lending reporting segments, respectively. These charges were recorded in "Impairment of assets" on the Company's Consolidated Statements of Operations.
Revenue recognition—The Company's revenue recognition policies are as follows:
Loans and other lending investments: Interest income on loans and other lending investments is recognized on an accrual basis using the interest method.
On occasion, the Company may acquire loans at premiums or discounts. These discounts and premiums in addition to any deferred costs or fees, are typically amortized over the contractual term of the loan using the interest method. Exit fees are also recognized over the lives of the related loans as a yield adjustment, if management believes it is probable that such amounts will be received. If loans with premiums, discounts, loan origination or exit fees are prepaid, the Company immediately recognizes the unamortized portion, which is included in "Other income" on the Company's Consolidated Statements of Operations.
The Company considers a loan to be non-performing and places loans on non-accrual status at such time as: (1) the loan becomes 90 days delinquent; (2) the loan has a maturity default; or (3) management determines it is probable that it will be unable to collect all amounts due according to the contractual terms of the loan. While on non-accrual status, based on the Company's judgment as to collectability of principal, loans are either accounted for on a cash basis, where interest income is recognized only upon actual receipt of cash, or on a cost-recovery basis, where all cash receipts reduce a loan's carrying value. Non-accrual loans are returned to accrual status when a loan has become contractually current.
Certain of the Company's loans provide for accrual of interest at specified rates that differ from current payment terms. Interest is recognized on such loans at the accrual rate subject to management's determination that accrued interest and outstanding principal are ultimately collectible, based on the underlying collateral and operations of the borrower.
Prepayment penalties or yield maintenance payments from borrowers are recognized as additional income when received. Certain of the Company's loan investments provide for additional interest based on the borrower's operating cash flow or appreciation of the underlying collateral. Such amounts are considered contingent interest and are reflected as interest income only upon receipt of cash.
Leasing investments: Operating lease revenue is recognized on the straight-line method of accounting, generally from the later of the date the lessee takes posession of the space and it is ready for its intended use or the date of acquisition of the facility subject to existing leases. Accordingly, contractual lease payment increases are recognized evenly over the term of the lease. The periodic difference between lease revenue recognized under this method and contractual lease payment terms is recorded as "Deferred operating lease income receivable," on the Company's Consolidated Balance Sheets.
65
iStar Financial Inc.
Notes to Consolidated Financial Statements (Continued)
Note 3—Summary of Significant Accounting Policies (Continued)
Reserve for loan losses—The reserve for loan losses reflects management's estimate of loan losses inherent in the loan portfolio as of the balance sheet date. The reserve is increased through the "Provision for loan losses" on the Company's Consolidated Statements of Operations and is decreased by charge-offs when losses are confirmed through the receipt of assets such as cash in a pre-foreclosure sale or via ownership control of the underlying collateral in full satisfaction of the loan upon foreclosure or when significant collection efforts have ceased. The Company has determined it has one portfolio segment, represented by commercial real estate lending, whereby it utilizes a uniform process for determining its reserve for loan losses. The reserve for loan losses includes a general, formula-based component and an asset-specific component.
The general reserve component covers performing loans and reserves for loan losses are recorded when (i) available information as of each balance sheet date indicates that it is probable a loss has occurred in the portfolio and (ii) the amount of the loss can be reasonably estimated. The formula-based general reserve is derived from estimated principal default probabilities and loss severities applied to groups of loans based upon risk ratings assigned to loans with similar risk characteristics during the Company's quarterly loan portfolio assessment. During this assessment, the Company performs a comprehensive analysis of its loan portfolio and assigns risk ratings to loans that incorporate management's current judgments about their credit quality based on all known and relevant internal and external factors that may affect collectability. The Company considers, among other things, payment status, lien position, borrower financial resources and investment in collateral, collateral type, project economics and geographical location as well as national and regional economic factors. This methodology results in loans being segmented by risk classification into risk rating categories that are associated with estimated probabilities of default and principal loss. Ratings range from "1" to "5" with "1" representing the lowest risk of loss and "5" representing the highest risk of loss. The Company estimates loss rates based on historical realized losses experienced within its portfolio and takes into account current economic conditions affecting the commercial real estate market when establishing appropriate time frames to evaluate loss experience.
The asset-specific reserve component relates to reserves for losses on impaired loans. The Company considers a loan to be impaired when, based upon current information and events, it believes that it is probable that the Company will be unable to collect all amounts due under the contractual terms of the loan agreement. This assessment is made on a loan-by-loan basis each quarter based on such factors as payment status, lien position, borrower financial resources and investment in collateral, collateral type, project economics and geographical location as well as national and regional economic factors. A reserve is established for an impaired loan when the present value of payments expected to be received, observable market prices, or the estimated fair value of the collateral (for loans that are dependent on the collateral for repayment) is lower than the carrying value of that loan.
Substantially all of the Company's impaired loans are collateral dependent and impairment is measured using the estimated fair value of collateral, less costs to sell. The Company generally uses the income approach through internally developed valuation models to estimate the fair value of the collateral for such loans. In more limited cases, the Company obtains external "as is" appraisals for loan collateral, generally when third party participations exist. Valuations are performed or obtained at the time a loan is determined to be impaired and designated non-performing, and they are updated if circumstances indicate that a significant change in value has occurred. In limited cases, appraised values may be discounted when real estate markets rapidly deteriorate.
A loan is also considered impaired if its terms are modified in a troubled debt restructuring ("TDR"). A TDR occurs when the Company grants a concession to a borrower in financial difficulty by modifying
66
iStar Financial Inc.
Notes to Consolidated Financial Statements (Continued)
Note 3—Summary of Significant Accounting Policies (Continued)
the original terms of the loan. Impairments on TDR loans are generally measured based on the present value of expected future cash flows discounted at the effective interest rate of the original loan.
Allowance for doubtful accounts—The allowance for doubtful accounts reflects management's estimate of losses inherent in the accrued operating lease income receivable and deferred operating lease income receivable balances as of the balance sheet date and incorporates an asset-specific component, as well as a general, formula-based reserve based on management's evaluation of the credit risks associated with these receivables. At December 31, 2010 and 2009, the total allowance for doubtful accounts was $1.4 million and $2.8 million, respectively.
Derivative instruments and hedging activity—The Company recognizes derivatives as either assets or liabilities on the Company's Consolidated Balance Sheets at fair value. If certain conditions are met, a derivative may be specifically designated as a hedge of the exposure to changes in the fair value of a recognized asset or liability, a hedge of a forecasted transaction or the variability of cash flows to be received or paid related to a recognized asset or liability.
Derivatives, such as foreign currency hedges and interest rate caps, that are not designated hedges are considered economic hedges, with changes in fair value reported in current earnings in "Other expense" on the Company's Consolidated Statements of Operations. The Company does not enter into derivatives for trading purposes.
Stock-based compensation—Compensation cost for stock-based awards is measured on the grant date and adjusted over the period of the employees' services to reflect (i) actual forfeitures and (ii) the outcome of awards with performance or service conditions through the requisite service period. The Company recognizes compensation cost for performance-based awards if and when the Company concludes that it is probable that the performance condition will be achieved. Compensation cost for market condition-based awards is determined using a Monte Carlo model to simulate a range of possible future stock prices for the Company's Common Stock, which is reflected in the grant date fair value. All compensation cost for market-condition based awards in which the service conditions are met is recognized regardless of whether the market condition is satisfied. Compensation costs are recognized ratably over the applicable vesting/service period and recorded in "General and administrative" on the Company's Consolidated Statements of Operations.
Disposal of long-lived assets—The results of operations from net lease and timber assets that were sold or held for sale in the current and prior periods are classified as "Income from discontinued operations" on the Company's Consolidated Statements of Operations even though such income was actually recognized by the Company prior to the asset sale. Gains from the sale of net lease and timber assets are classified as "Gain from discontinued operations" and "Gain from discontinued operations attributable to noncontrolling interests" on the Company's Consolidated Statements of Operations.
Income taxes—The Company has elected to be qualified and taxed as a REIT under section 856 through 860 of the Internal Revenue Code of 1986, as amended (the "Code"). The Company is subject to federal income taxation at corporate rates on its REIT taxable income, however, the Company is allowed a deduction for the amount of dividends paid to its shareholders, thereby subjecting the distributed net income of the Company to taxation at the shareholder level only. In addition, the Company is allowed several other deductions in computing its REIT taxable income, including non-cash items such as depreciation expense and certain specific reserve amounts that the Company deems to be uncollectable. These deductions allow the Company to shelter a portion of its operating cash flow from its dividend payout requirement under federal tax laws. The Company intends to operate in a manner consistent with and to elect to be treated as a REIT for tax purposes.
67
iStar Financial Inc.
Notes to Consolidated Financial Statements (Continued)
Note 3—Summary of Significant Accounting Policies (Continued)
The Company can participate in certain activities from which it was previously precluded in order to maintain its qualification as a REIT, as long as these activities are conducted in entities which elect to be treated as taxable subsidiaries under the Code, subject to certain limitations. As such, the Company, through its taxable REIT subsidiaries ("TRSs"), is engaged in various real estate related opportunities, including but not limited to: (1) managing corporate credit-oriented investment strategies; (2) certain activities related to the purchase and sale of timber and timberlands; (3) servicing certain loan portfolios; and (4) managing activities related to certain foreclosed assets. The Company will consider other investments through TRS entities if suitable opportunities arise. The Company's TRS entities are not consolidated for federal income tax purposes and are taxed as corporations. For financial reporting purposes, current and deferred taxes are provided for in the portion of earnings recognized by the Company with respect to its interest in TRS entities. For the years ended December 31, 2010, 2009 and 2008, the Company recorded total income tax expense of $7.0 million, $4.1 million and $10.2 million, respectively, which was included in "Other expense" on the Company's Consolidated Statements of Operations. Total cash paid for taxes for the years ended December 31, 2010, 2009 and 2008, was $7.3 million, $2.9 million and $9.0 million, respectively. The Company also recognizes interest expense and penalties related to uncertain tax positions, if any, as income tax expense, included in "Other expense" on the Company's Consolidated Statements Operations.
Deferred income taxes reflect the net tax effects of temporary differences between the carrying amount of assets and liabilities for financial reporting purposes and the amounts used for income tax purposes, as well as operating loss and tax credit carryforwards. At December 31, 2010 and 2009, the Company had net deferred tax liabilities of $13.7 million and $9.3 million, respectively, included in "Accounts payable, accrued expenses and other liabilities" on the Company's Consolidated Balance Sheets. These deferred tax liabilities are primarily due to timing differences relating to equity method investments. At December 31, 2010 and 2009, the Company had deferred tax assets of $29.9 million and $19.0 million, respectively, that were each fully offset by valuation allowances. These amounts consist primarily of net operating loss carryforwards and expenses not currently deductible related to TRS entities which will expire through 2030. These valuation allowances were established based on the Company's conclusion that it is more likely than not that the deductions and carryforwards will not be utilized during the carryforward periods.
As of December 31, 2010, the Company had approximately $148.1 million of net operating loss carryforwards at the corporate REIT level, which can generally be used to offset ordinary taxable income in future years and will expire through 2030 if unused. The amount of net operating loss carryforwards will be subject to finalization of the 2010 tax returns and could be materially different from such amounts as of December 31, 2010.
Earnings per share—The Company uses the two-class method in calculating EPS when it issues securities other than common stock that contractually entitle the holder to participate in dividends and earnings of the company when, and if, the company declares dividends on its common stock. Vested HPU shares are entitled to dividends of the Company when dividends are declared. Basic earnings per share ("Basic EPS") for the Company's Common Stock and HPU shares are computed by dividing net income allocable to common shareholders and HPU holders by the weighted average number of shares of Common Stock and HPU shares outstanding for the period, respectively. Diluted earnings per share ("Diluted EPS") is calculated similarly, however, it reflects the potential dilution that could occur if
68
iStar Financial Inc.
Notes to Consolidated Financial Statements (Continued)
Note 3—Summary of Significant Accounting Policies (Continued)
securities or other contracts to issue common stock were exercised or converted into common stock, where such exercise or conversion would result in a lower earnings per share amount.
Unvested share-based payment awards that contain non-forfeitable rights to dividends or dividend equivalents (whether paid or unpaid) are deemed a ("Participating Security") and are included in the computation of earnings per share pursuant to the two-class method. The Company's unvested restricted stock units with rights to dividends and common stock equivalents issued under its Long-Term Incentive Plans are considered participating securities and have been included in the two-class method when calculating EPS.
New Accounting Pronouncements
In July 2010, Financial Accounting Standards Board ("FASB") issued ASU 2010-20, "Disclosures about the Credit Quality of Financing Receivables and the Allowance for Credit Losses," ("ASU 2010-20"), which outlined specific disclosures that are required for the allowance for credit losses and all finance receivables. Finance receivables includes loans and other arrangements with a contractual right to receive money on demand or on fixed or determinable dates that is recognized as an asset on an entity's statement of financial position. ASU 2010-20 requires companies to provide disaggregated levels of disclosure by portfolio segment and class to enable users of the financial statement to understand the nature of credit risk, how the risk is analyzed in determining the related allowance for credit losses and changes to the allowance during the reporting period. Required disclosures under ASU 2010-20 as of the end of a reporting period were effective for the Company's December 31, 2010 reporting period and disclosures regarding activities during a reporting period are effective for the Company's March 31, 2011 interim reporting period. The Company adopted this standard for its year ended December 31, 2010 reporting period, as required, and determined it has one portfolio segment: commercial real estate lending, with three classes: senior mortgages that are collateralized by real estate assets, subordinate mortgages that are collateralized by subordinated interests in real estate assets, and corporate/partnership loans which are typically unsecured and may be senior or subordinate and corporate debt securities. See Note 4 for additional disclosures required by the adoption of this standard.
In June 2009, the FASB issued SFAS No. 167, "Amendments to FASB Interpretation No. 46(R)" ("ASU 2009-17"), which eliminated the exemption for qualifying special purpose entities, created a new approach for determining who should consolidate a VIE, and required an ongoing reassessment to determine if a company should consolidate a VIE. This standard was effective for interim and annual periods beginning after November 15, 2009. The Company adopted ASU 2009-17 on January 1, 2010, as required. In addition, in February 2010, the FASB issued ASU 2010-10, "Consolidation (Topic 810): Amendments for Certain Investments Funds" ("ASU 2010-10"), which amended certain provisions of ASC 810-10. ASU 2010-10 deferred the effective date of ASU 2009-17 for reporting enterprises' interest in certain entities and for certain money market mutual funds. An entity that qualifies for the deferral will continue to be assessed under the overall guidance on the consolidation of variable interest entities in ASC 810-10 (previously Statement of Financial Accounting Standards ("SFAS") No. 167) or other applicable consolidation guidance. In addition, ASU 2010-10 amended certain provisions to change how a decision maker or service provider determined whether its contract represented a variable interest. The Company adopted ASU 2010-10 on January 1, 2010, as required, and as a result, deferred the effective date of ASC 810-10 for certain entities that met the criteria. See Consolidation—Variable interest entities above for further details on the adoption of both ASU 2009-17 and ASU 2010-10.
69
iStar Financial Inc.
Notes to Consolidated Financial Statements (Continued)
Note 3—Summary of Significant Accounting Policies (Continued)
In June 2009, the FASB issued SFAS No. 166, "Accounting for Transfers of Financial Assets—an amendment of FASB Statement No. 140" ("ASU 2009-16"), which eliminated the qualifying special-purpose entity concept, created a new unit of account definition that must be met for transfers of portions of financial assets to be eligible for sale accounting, clarified and changed the de-recognition criteria for a transfer to be accounted for as a sale, changed the amount of recognized gain or loss on a transfer of financial assets accounted for as a sale when beneficial interests were received by the transferor and required new disclosures. The Company adopted ASU 2009-16 on January 1, 2010, as required, and it did not have a significant impact on the Company's Consolidated Financial Statements.
Note 4—Loans and Other Lending Investments, net
The following is a summary of the Company's loans and other lending investments by class ($ in thousands):
| |
As of December 31, | |||||||
|---|---|---|---|---|---|---|---|---|
Type of Investment(1)
|
2010 | 2009 | ||||||
Senior mortgages |
$ | 4,390,770 | $ | 7,840,933 | ||||
Subordinate mortgages |
305,245 | 491,413 | ||||||
Corporate/Partnership loans |
689,535 | 957,629 | ||||||
Managed Loan Value(2) |
5,385,550 | 9,289,975 | ||||||
Participated portion of loans(2) |
— | (473,269 | ) | |||||
Total gross carrying value of loans |
5,385,550 | 8,816,706 | ||||||
Reserves for loan losses |
(814,625 | ) | (1,417,949 | ) | ||||
Total carrying value of loans |
4,570,925 | 7,398,757 | ||||||
Other lending investments—securities |
16,427 | 262,805 | ||||||
Total loans and other lending investments, net |
$ | 4,587,352 | $ | 7,661,562 | ||||
Explanatory Notes:
- (1)
- Loans
and other lending investments are presented net of unearned income, unamortized discounts and premiums and net unamortized deferred fees and costs. In
total, these amounts represented a net discount of $62.7 million and $97.0 million as of December 31, 2010 and 2009, respectively.
- (2)
- Managed Loan Value represents the Company's carrying value of a loan, gross of reserves for loan losses and the outstanding participation interest on loans in the Fremont CRE portfolio.
During the year ended December 31, 2010, the Company funded $356.3 million under existing loan commitments and received gross principal repayments of $2.06 billion, of which a portion of these repayments were allocable to the Fremont Participation (as defined below). During the same period, the Company sold loans with a total carrying value of $808.8 million, for which it recognized charge-offs of $109.1 million.
In addition, during the year ended December 31, 2010, the Company received title to properties in full or partial satisfaction of non-performing mortgage loans with a gross carrying value (gross of asset-specific reserves) of $1.41 billion, for which the properties had served as collateral, and recorded charge-offs
70
iStar Financial Inc.
Notes to Consolidated Financial Statements (Continued)
Note 4—Loans and Other Lending Investments, net (Continued)
totaling $631.9 million related to these loans. These properties were recorded as REHI or OREO on the Company's Consolidated Balance Sheets (see Note 5).
Reserve for Loan Losses—Changes in the Company's reserve for loan losses were as follows: ($ in thousands):
| |
|
||||
|---|---|---|---|---|---|
Reserve for loan losses, December 31, 2008 |
$ | 976,788 | |||
Provision for loan losses |
1,255,357 | ||||
Charge-offs |
(814,196 | ) | |||
Reserve for loan losses, December 31, 2009 |
1,417,949 | ||||
Provision for loan losses |
331,487 | ||||
Charge-offs |
(934,811 | ) | |||
Reserve for loan losses, December 31, 2010 |
$ | 814,625 | |||
As of December 31, 2010, the Company's recorded investment in loans and the associated reserve for loan losses were as follows ($ in thousands):
| |
Individually Evaluated for Impairment |
Collectively Evaluated for Impairment |
Loans Acquired with Deteriorated Credit Quality |
Total | ||||||||||
|---|---|---|---|---|---|---|---|---|---|---|---|---|---|---|
Loans |
$ | 2,296,599 | $ | 3,034,310 | $ | 75,907 | $ | 5,406,816 | ||||||
Less: Reserve for loan losses |
(692,610 | ) | (120,200 | ) | (1,815 | ) | (814,625 | ) | ||||||
Total |
$ | 1,603,989 | $ | 2,914,110 | $ | 74,092 | $ | 4,592,191 | ||||||
Credit Characteristics—As part of the Company's process for monitoring the credit quality of its loans, it performs a quarterly loan portfolio assessment and assigns risk ratings to each of its loans. This process is discussed in more detail in "Reserve for loan losses" in Note 3. As of December 31, 2010, the Company's recorded investment in loans, presented by class and by credit quality, as indicated by risk rating, was as follows ($ in thousands):
| |
Performing Loans |
Weighted Average Risk Ratings |
Non- performing Loans(1) |
Weighted Average Risk Ratings(1) |
|||||||||
|---|---|---|---|---|---|---|---|---|---|---|---|---|---|
Senior mortgages |
$ | 2,394,270 | 3.48 | $ | 2,007,895 | 4.78 | |||||||
Subordinate mortgages |
307,509 | 3.20 | — | — | |||||||||
Corporate/Partnership loans |
685,848 | 3.76 | 11,294 | 4.50 | |||||||||
Total |
$ | 3,387,627 | $ | 2,019,189 | |||||||||
Explanatory Note:
- (1)
- Risk ratings are assigned to loans based on the risk of loss relative to principal outstanding. The Company also assigns risk ratings to non-performing loans based on risk of loss relative to carrying value, which is net of asset-specific reserves. As of December 31, 2010, non-performing loans net of asset-specific reserves were $1.35 billion, with weighted average net risk ratings of 3.55 and 4.50 for senior mortgages and corporate/partnership loans, respectively.
71
iStar Financial Inc.
Notes to Consolidated Financial Statements (Continued)
Note 4—Loans and Other Lending Investments, net (Continued)
As of December 31, 2010, the Company's recorded investment in loans, aged by payment status and presented by class, were as follows ($ in thousands):
| |
Current | Less Than and Equal to 90 Days |
Greater Than 90 Days(1) |
Total Past Due |
Total | ||||||||||||
|---|---|---|---|---|---|---|---|---|---|---|---|---|---|---|---|---|---|
Senior mortgages |
$ | 2,473,031 | $ | 209,714 | $ | 1,719,420 | $ | 1,929,134 | $ | 4,402,165 | |||||||
Subordinate mortgages |
282,744 | 24,765 | — | 24,765 | 307,509 | ||||||||||||
Corporate/Partnership loans |
685,848 | — | 11,294 | 11,294 | 697,142 | ||||||||||||
Total |
$ | 3,441,623 | $ | 234,479 | $ | 1,730,714 | $ | 1,965,193 | $ | 5,406,816 | |||||||
Explanatory Note:
- (1)
- All loans with payments more than 90 days past due are classified as non-performing and are on non-accrual status.
Impaired Loans—As of December 31, 2010, the Company's recorded investment in impaired loans, presented by class, were as follows ($ in thousands)(1):
| |
Recorded Investment(2) |
Unpaid Principal Balance |
Related Allowance |
Average Recorded Investment |
Interest Income Recognized(3) |
|||||||||||||
|---|---|---|---|---|---|---|---|---|---|---|---|---|---|---|---|---|---|---|
With no related allowance recorded: |
||||||||||||||||||
Senior mortgages |
$ | 404,861 | $ | 404,126 | $ | — | $ | 659,150 | $ | 20,472 | ||||||||
Subordinate mortgages |
— | — | — | 1,404 | 87 | |||||||||||||
Corporate/Partnership loans |
10,110 | 10,160 | — | 27,526 | 1,868 | |||||||||||||
Subtotal |
$ | 414,971 | $ | 414,286 | $ | — | $ | 688,080 | $ | 22,427 | ||||||||
With an allowance recorded: |
||||||||||||||||||
Senior mortgages |
$ | 1,834,008 | $ | 1,825,150 | $ | (683,948 | ) | $ | 2,411,735 | $ | 5,183 | |||||||
Subordinate mortgages |
— | — | — | 77,125 | 107 | |||||||||||||
Corporate/Partnership loans |
64,465 | 64,919 | (10,477 | ) | 65,118 | — | ||||||||||||
Subtotal |
$ | 1,898,473 | $ | 1,890,069 | $ | (694,425 | ) | $ | 2,553,978 | $ | 5,290 | |||||||
Total: |
||||||||||||||||||
Senior mortgages |
$ | 2,238,869 | $ | 2,229,276 | $ | (683,948 | ) | $ | 3,070,885 | $ | 25,655 | |||||||
Subordinate mortgages |
— | — | — | 78,529 | 194 | |||||||||||||
Corporate/Partnership loans |
74,575 | 75,079 | (10,477 | ) | 92,644 | 1,868 | ||||||||||||
Total |
$ | 2,313,444 | $ | 2,304,355 | $ | (694,425 | ) | $ | 3,242,058 | $ | 27,717 | |||||||
Explanatory Notes:
- (1)
- All
of the Company's non-accrual loans are impaired and included in the table above. In addition, certain loans modified through troubled debt
restructurings with a recorded investment of $294.3 million are also included as impaired loans although they are considered performing and on accrual status.
- (2)
- Includes
$16.8 million of impaired loans acquired with deteriorated credit quality.
- (3)
- Represents the Company's recorded interest income on cash payments from impaired loans. For the years ended December 31, 2009 and 2008, such amounts were $14.3 million and $5.3 million, respectively.
Fremont Participation—On July 2, 2007, the Company sold a $4.20 billion participation interest ("Fremont Participation") in the $6.27 billion Fremont CRE portfolio. During the year ended December 31, 2010, the Company repaid the participation interest in full. While the Fremont Participation
72
iStar Financial Inc.
Notes to Consolidated Financial Statements (Continued)
Note 4—Loans and Other Lending Investments, net (Continued)
interest was outstanding, the holder of the participation received floating interest at LIBOR + 1.50% and 70% of all principal collected from the Fremont CRE portfolio, including principal collected from amounts funded on the loans subsequent to the acquisition of the portfolio and proceeds received from asset sales. As a result of the repayment, the Company now retains 100% of proceeds from sales and repayments of assets associated with the Fremont CRE portfolio, and the assets included in the portfolio are eligible for selection by the Company's lenders to serve as collateral for the Company's borrowings under its secured credit facilities and secured notes.
Changes in the outstanding Fremont Participation balance were as follows ($ in thousands):
Loan participation, December 31, 2008 |
$ | 1,297,944 | ||
Principal repayments |
(824,675 | ) | ||
Loan participation, December 31, 2009 |
473,269 | |||
Principal repayments |
(473,269 | ) | ||
Loan participation, December 31, 2010 |
$ | — | ||
Securities—Other lending investments-securities included the following ($ in thousands):
| |
Face Value |
Amortized Cost Basis |
Gross Unrealized Gains |
Gross Unrealized Losses |
Estimated Fair Value |
Net Carrying Value |
||||||||||||||
|---|---|---|---|---|---|---|---|---|---|---|---|---|---|---|---|---|---|---|---|---|
As of December 31, 2010: |
||||||||||||||||||||
Held-to-Maturity Securities |
||||||||||||||||||||
Commercial mortgage-backed securities |
$ | 23,209 | $ | 16,427 | $ | 1,514 | $ | — | $ | 17,941 | $ | 16,427 | ||||||||
Total |
$ | 23,209 | $ | 16,427 | $ | 1,514 | $ | — | $ | 17,941 | $ | 16,427 | ||||||||
As of December 31, 2009: |
||||||||||||||||||||
Available-for-Sale Securities |
||||||||||||||||||||
Corporate debt securities |
$ | 10,000 | $ | 2,594 | $ | 4,206 | $ | — | $ | 6,800 | $ | 6,800 | ||||||||
Held-to-Maturity Securities |
||||||||||||||||||||
Corporate debt securities |
238,671 | 238,103 | — | (3,473 | ) | 234,630 | 238,103 | |||||||||||||
Commercial mortgage-backed securities |
24,098 | 17,902 | — | (575 | ) | 17,327 | 17,902 | |||||||||||||
Total |
$ | 272,769 | $ | 258,599 | $ | 4,206 | $ | (4,048 | ) | $ | 258,757 | $ | 262,805 | |||||||
During the year ended December 31, 2010, the Company recognized $9.0 million in net gains resulting from a $205.0 million prepayment of held-to-maturity debt securities and sales of its remaining available-for-sale debt securities.
During the years ended December 31, 2009 and 2008, the Company determined that unrealized credit related losses on certain held-to-maturity and available-for-sale debt securities were other-than-temporary and recorded impairment charges totaling $11.7 million and $120.0 million, respectively, in "Impairment of assets" on the Company's Consolidated Statements of Operations. There are no other-than-temporary
73
iStar Financial Inc.
Notes to Consolidated Financial Statements (Continued)
Note 4—Loans and Other Lending Investments, net (Continued)
impairments recorded in "Accumulated other comprehensive income" on the Company's Consolidated Balance Sheet as of December 31, 2010 and 2009.
As of December 31, 2010, the contractual maturities of the Company's securities were as follows ($ in thousands):
| |
Held-to-maturity securities | |||||||
|---|---|---|---|---|---|---|---|---|
Maturities
|
Amortized Cost |
Estimated Fair Value |
||||||
1 through 5 years |
$ | 15,591 | $ | 17,105 | ||||
5 through 10 years |
720 | 720 | ||||||
10 years and thereafter |
116 | 116 | ||||||
Total |
$ | 16,427 | $ | 17,941 | ||||
Encumbered Loans—As of December 31, 2010 and 2009, loans and other lending investments with a carrying value of $2.92 billion and $4.39 billion, respectively, were pledged as collateral under the Company's secured indebtedness.
Note 5—Real Estate Held for Investment, net and Other Real Estate Owned
During the years ended December 31, 2010 and 2009, the Company received title to properties with an aggregate estimated fair value at the time of foreclosure of $773.3 million and $1.30 billion, respectively, in full or partial satisfaction of non-performing mortgage loans for which those properties had served as collateral. Of the properties received in 2010 and 2009, properties with a value of $424.2 million and $399.6 million, respectively, were classified as REHI and $349.1 million and $904.2 million, respectively, were classified as OREO, based on management's current intention to either hold the properties over a longer period or to market them for sale.
Real Estate Held for Investment, net—REHI consisted of the following ($ in thousands):
| |
As of December 31, | |||||||
|---|---|---|---|---|---|---|---|---|
| |
2010 | 2009 | ||||||
Land held for investment and development |
$ | 606,083 | $ | 290,283 | ||||
Operating property |
||||||||
Land |
69,807 | 31,162 | ||||||
Building |
151,471 | 98,669 | ||||||
Improvements |
13,554 | 5,450 | ||||||
Less: accumulated depreciation and amortization |
(7,855 | ) | (2,900 | ) | ||||
Real estate held for investment, net |
$ | 833,060 | $ | 422,664 | ||||
The Company records REHI operating income in "Other income" and REHI operating expenses in "Operating costs—REHI and OREO," on the Company's Consolidated Statements of Operations, as follows ($ in thousands):
| |
For the Years Ended December 31, | |||||||||
|---|---|---|---|---|---|---|---|---|---|---|
| |
2010 | 2009 | 2008 | |||||||
REHI operating income |
$ | 23,103 | $ | 5,822 | $ | — | ||||
REHI operating expenses |
$ | 31,646 | $ | 12,455 | $ | — | ||||
74
iStar Financial Inc.
Notes to Consolidated Financial Statements (Continued)
Note 5—Real estate held for investment, net and Other real estate owned (Continued)
Other Real Estate Owned—The Company's OREO consisted of the following property types ($ in thousands):
| |
As of December 31, | ||||||
|---|---|---|---|---|---|---|---|
| |
2010 | 2009 | |||||
Apartment/Residential |
$ | 476,658 | $ | 670,585 | |||
Land |
114,162 | 111,969 | |||||
Mixed Use/Mixed Collateral |
72,135 | — | |||||
Retail |
44,204 | 41,587 | |||||
Office |
16,422 | — | |||||
Other |
22,500 | 15,000 | |||||
Carrying value |
$ | 746,081 | $ | 839,141 | |||
During the years ended December 31, 2010 and 2009, the Company sold OREO assets with a carrying value of $455.4 million and $280.2 million, respectively. For the years ended December 31, 2010, 2009 and 2008, the Company recorded net impairment charges to OREO properties totaling $19.1 million, $78.6 million and $55.6 million, respectively, and recorded net expenses related to holding costs for OREO properties of $33.0 million, $28.4 million and $9.3 million, respectively.
Encumbered REHI and OREO—As of December 31, 2010 and 2009, REHI assets with a carrying value of $28.4 million and $27.1 million, respectively, and OREO assets with a carrying value of $232.1 million and $232.7 million, respectively, were pledged as collateral for the Company's secured indebtedness.
Note 6—Net Lease Assets, net
The Company's investments in net lease assets, at cost, were as follows ($ in thousands):
| |
As of December 31, | ||||||
|---|---|---|---|---|---|---|---|
| |
2010 | 2009 | |||||
Facilities and improvements |
$ | 1,651,998 | $ | 2,761,083 | |||
Land and land improvements |
454,925 | 639,581 | |||||
Less: accumulated depreciation |
(322,414 | ) | (514,768 | ) | |||
Net lease assets, net |
$ | 1,784,509 | $ | 2,885,896 | |||
On June 25, 2010, the Company completed the sale of a portfolio of 32 net lease assets to a single purchaser for a gross purchase price of $1.35 billion that resulted in a net gain of $250.3 million. The aggregate carrying value of the portfolio of assets was $1.05 billion. In relation to this transaction, the Company reduced its gain on sale and recorded a liability of $30.0 million based upon certain contingent obligations potentially owing to the purchaser. Proceeds from this transaction were used to repay a $947.9 million term loan collateralized by the properties being sold that was scheduled to mature in April 2011, as well as for general corporate purposes. See Note 9 for additional details on the repayment of the debt collateralized by these assets. As part of the purchaser's financing for the transaction, the Company provided the purchaser with $105.6 million of mezzanine loans, which were subsequently paid down to $26.8 million as of December 31, 2010.
75
iStar Financial Inc.
Notes to Consolidated Financial Statements (Continued)
Note 6—Net Lease Assets, net (Continued)
Summarized financial information for discontinued operations related to the sale of the portfolio of 32 net lease assets is as follows ($ in thousands):
| |
For the Years Ended December 31, | |||||||||
|---|---|---|---|---|---|---|---|---|---|---|
| |
2010 | 2009 | 2008 | |||||||
Total revenues |
$ | 55,559 | $ | 114,575 | $ | 114,546 | ||||
Income from discontinued operations |
$ | 15,580 | $ | 9,966 | $ | 20,893 | ||||
In addition to the sale of the portfolio of assets noted above, during the year ended December 31, 2010, the Company sold net lease assets with a carrying value of $119.7 million, which resulted in gains of $20.1 million. For the year ended December 31, 2010, the Company recorded impairment charges on net lease assets of $6.1 million, of which $1.9 million was included in "Income from discontinued operations" on the Company's Consolidated Statements of Operations.
During the year ended December 31, 2009 the Company sold net lease assets with carrying values of $52.1 million, which resulted in gains of $12.4 million. During the same period, the Company recorded impairment charges on net lease assets of $33.5 million of which $14.4 million was included in "Income from discontinued operations" on the Company's Consolidated Statements of Operations. During the year ended December 31, 2008, the Company sold net lease assets with carrying values of $359.7 million, which resulted in gains of $64.5 million. During the same period, the Company recorded impairment charges on net lease assets of $11.3 million.
The Company receives reimbursements from customers for certain facility operating expenses including common area costs, insurance and real estate taxes. Customer expense reimbursements for the years ended December 31, 2010, 2009 and 2008 were $29.8 million, $36.4 million and $38.8 million, respectively. Of these amounts, $24.0 million, $24.7 million and $24.7 million, respectively, were included as a reduction of "Operating costs—net lease assets," and the remainder was included in "Income from discontinued operations" on the Company's Consolidated Statements of Operations.
Future Minimum Operating Lease Payments—Future minimum operating lease payments under non-cancelable leases, excluding customer reimbursements of expenses, in effect at December 31, 2010, are as follows ($ in thousands):
Year
|
|
|||
|---|---|---|---|---|
2011 |
$ | 154,130 | ||
2012 |
147,715 | |||
2013 |
144,472 | |||
2014 |
145,922 | |||
2015 |
146,150 | |||
Thereafter |
1,380,447 | |||
Encumbered Net Lease Assets—As of December 31, 2010 and 2009, net lease assets with a net book value of $1.02 billion and $2.59 billion, respectively, were encumbered with mortgages or pledged as collateral for the Company's secured indebtedness.
76
iStar Financial Inc.
Notes to Consolidated Financial Statements (Continued)
Note 7—Other Investments
Other investments consist of the following items ($ in thousands):
| |
As of December 31, | ||||||
|---|---|---|---|---|---|---|---|
| |
2010 | 2009 | |||||
Equity method investments |
$ | 522,223 | $ | 339,002 | |||
Cost method investments |
8,028 | 6,923 | |||||
Other |
2,107 | 38,454 | |||||
Other investments |
$ | 532,358 | $ | 384,379 | |||
Equity Method Investments
The Company's equity method investments and its proportionate share of their results were as follows ($ in thousands):
| |
Carrying value at December 31, |
Equity in earnings for the years ended December 31, |
|||||||||||||||
|---|---|---|---|---|---|---|---|---|---|---|---|---|---|---|---|---|---|
| |
2010 | 2009 | 2010 | 2009 | 2008 | ||||||||||||
Oak Hill |
$ | 176,364 | $ | 180,372 | $ | 23,048 | $ | 21,745 | $ | 20,644 | |||||||
LNR |
122,176 | — | 1,797 | — | — | ||||||||||||
Madison Funds |
92,265 | 75,096 | 9,717 | (5,620 | ) | (7,392 | ) | ||||||||||
TimberStar Southwest |
4 | 93 | (1 | ) | (255 | ) | (3,499 | ) | |||||||||
Other |
131,414 | 83,441 | 17,347 | (10,572 | ) | (3,218 | ) | ||||||||||
Total |
$ | 522,223 | $ | 339,002 | $ | 51,908 | $ | 5,298 | $ | 6,535 | |||||||
Oak Hill—As of December 31, 2010, the Company owned 46.22% interests in Oak Hill Advisors, L.P., Oak Hill Credit Alpha MGP, LLC, Oak Hill Credit Opportunities MGP, LLC, OHA Strategic Credit Fund, LLC, OHA Leveraged Loan Portfolio GenPar, LLC, Oak Hill Credit OPP Fund, LP, OHA Structured Products MGP, LLC, 47.5% interest in OHA Finance MGP, LLC, OHA Capital Solutions MGP, LLC, and 48.1% interests in OHSF GP Partners II, LLC and OHSF GP Partners (Investors), LLC, (collectively, "Oak Hill"). The Company appointed to its Board of Directors a member that holds a substantial investment in Oak Hill. As such Oak Hill is a related party of the Company. Oak Hill engages in investment and asset management services. Upon acquisition of the original interests in Oak Hill, there was a difference between the Company's carrying value of its equity investments and the underlying equity in the net assets of Oak Hill of $200.2 million. The Company allocated this value to identifiable intangible assets of $81.8 million and goodwill of $118.4 million. The unamortized balance related to intangible assets for these investments was $39.5 million and $45.3 million as of December 31, 2010 and 2009, respectively.
LNR—On July 29, 2010, the Company acquired an ownership interest of approximately 24% in LNR Property Corporation ("LNR"). LNR is a servicer and special servicer of commercial mortgage loans and CMBS and a diversified real estate investment, finance and management company. In the transaction, the Company and a group of investors, including other creditors of LNR, acquired 100% of the common stock of LNR in exchange for cash and the extinguishment of existing senior notes of LNR's parent holding company (the "Holdco Notes"). The Company contributed $100.0 million aggregate principal amount of Holdco Notes and $100.0 million in cash in exchange for an equity interest of $120.0 million. During the three months ended December 31, 2010, the Company executed the discounted payoff of a $25.0 million principal value loan with LNR for which it received proceeds of $24.5 million in full repayment.
77
iStar Financial Inc.
Notes to Consolidated Financial Statements (Continued)
Note 7—Other Investments (Continued)
The Company records its investment in LNR on a one-quarter lag. Therefore, the equity in earnings for the year ended December 31, 2010 represents the Company's share of LNR's results of operations from the date of acquisition through September 30, 2010. During the quarter ended December 31, 2010, LNR settled a deferred liability, of which it expects approximately $8.2 million will be allocable to the Company. This amount, along with the Company's share of LNR's other operating results for the fourth quarter ended December 31, 2010, will be recognized in the Company's Consolidated Statements of Operations during the three months ending March 31, 2011.
LNR consolidates certain commercial mortgage-backed securities and collateralized debt obligation trusts for which it is the primary beneficiary. The assets of these trusts (primarily commercial mortgage loans), which aggregate approximately $142.4 billion as of September 30, 2010, are the sole source of repayment of the related liabilities, which are non-recourse to LNR and its equity holders, including the Company. Changes in the fair value of these assets each period are offset by changes in the fair value of the related liabilities through LNR's consolidated income statement. As of December 31, 2010, the carrying amount of the Company's investment in LNR does not materially differ from its share of LNR's equity.
Below is a summary of LNR's latest available financial information ($ in thousands)(1):
| |
For the Period July 29, 2010 to September 30, 2010 |
|||
|---|---|---|---|---|
Income Statement |
||||
Total revenue |
$ | 1,613,036 | ||
Net income |
$ | 11,623 | ||
Net income attributable to LNR |
$ | 7,539 | ||
| |
As of September 30, 2010 |
|||
|---|---|---|---|---|
Balance Sheet |
||||
Total assets |
$ | 143,266,730 | ||
Debt |
$ | 142,508,930 | ||
Total liabilities |
$ | 142,717,746 | ||
Noncontrolling interests |
$ | 39,474 | ||
LNR Property Corporation equity |
$ | 509,510 | ||
Explanatory Note:
- (1)
- Results and balances include amounts from consolidated VIEs.
Madison Funds—As of December 31, 2010, the Company owned a 29.52% interest in Madison International Real Estate Fund II, LP, a 32.92% interest in Madison International Real Estate Fund III, LP and a 29.52% interest in Madison GP1 Investors, LP (collectively, the "Madison Funds"). The Madison Funds invest in illiquid ownership positions of entities that own real estate assets. The Company has determined that all of these entities are variable interest entities and that an external member is the primary beneficiary.
TimberStar Southwest—Prior to selling its interest, the Company owned a 46.7% interest in TimberStar Southwest Holdco LLC ("TimberStar Southwest"), through its majority owned subsidiary TimberStar. The Company accounted for this investment under the equity method due to the venture's external partners having certain participating rights giving them shared control. In April 2008, the Company closed on the sale of TimberStar Southwest for a gross sales price of $1.71 billion, including the
78
iStar Financial Inc.
Notes to Consolidated Financial Statements (Continued)
Note 7—Other Investments (Continued)
assumption of debt. The Company received net proceeds of $417.0 million for its interest in the venture and recorded a gain of $280.2 million, which includes $18.6 million attributable to noncontrolling interests. These amounts were recorded in "Gain on sale of joint venture interest" and "Gain attributable to noncontrolling interests" on the Company's Consolidated Statements of Operations.
Other Equity Method Investments—The Company also had smaller investments in several other entities that were accounted for under the equity method where the Company has ownership interests up to 50.0%. Several of these investments are in real estate related funds or other strategic investment opportunities within niche markets.
During the years ended December 31, 2010 and 2009, the Company recognized impairment charges on certain of its equity method investments of $1.2 million and $4.7 million, respectively.
During the year ended December 31, 2009, the Company recorded a non-cash out-of-period charge of $9.4 million to recognize additional losses from an equity method investment as a result of additional depreciation expense that should have been recorded at the equity method entity. This adjustment was recorded as a reduction to "Other investments" on the Company's Consolidated Balance Sheets and a decrease to "Earnings from equity method investments," on the Company's Consolidated Statements of Operations. The Company concluded that the amount of losses that should have been recorded in periods beginning in July 2007 were not material to any of its previously issued financial statements. The Company also concluded that the cumulative out-of-period charge was not material to the fiscal year in which it has been recorded. As such, the charge was recorded in the Company's Consolidated Statements of Operations for the year ended December 31, 2009, rather than restating prior periods.
Summarized Financial Information—The following table presents the investee level summarized financial information of the Company's equity method investments, excluding LNR ($ in thousands):
| |
For the years ended December 31, | |||||||||
|---|---|---|---|---|---|---|---|---|---|---|
| |
2010 | 2009 | 2008 | |||||||
Income Statements |
||||||||||
Revenues |
$ | 590,265 | $ | 129,814 | $ | 159,385 | ||||
Net income (loss) |
$ | 402,174 | $ | (7,823 | ) | $ | (56,450 | ) | ||
Net income attributable to parent entities |
$ | 342,661 | $ | (12,237 | ) | $ | (59,945 | ) | ||
| |
As of December 31, | ||||||
|---|---|---|---|---|---|---|---|
| |
2010 | 2009 | |||||
Balance Sheets |
|||||||
Total assets |
$ | 4,486,974 | $ | 3,269,313 | |||
Debt |
$ | 1,100,561 | $ | 322,997 | |||
Total liabilities |
$ | 1,236,116 | $ | 574,591 | |||
Noncontrolling interests |
$ | 107,422 | $ | 4,856 | |||
Total equity |
$ | 3,143,436 | $ | 2,689,866 | |||
Cost Method Investments
The Company has investments in several real estate related funds or other strategic investment opportunities that are accounted for under the cost method. During the years ended December 31, 2009 and 2008, the Company determined that unrealized losses on certain of its cost method investments were other-than-temporary and recorded impairment charges of $7.5 million and $87.0 million, respectively.
79
iStar Financial Inc.
Notes to Consolidated Financial Statements (Continued)
Note 7—Other Investments (Continued)
During the year ended December 31, 2008, the Company redeemed its interest in a profits participation that was originally received as part of a prior lending investment and carried as a cost method investment prior to redemption. As a result of the transaction, the Company received cash of $44.2 million and recorded an equal amount of income in "Other income" on the Company's Consolidated Statements of Operations. In addition, during 2008, the Company also exchanged an investment with a carrying value of $97.4 million, net of noncontrolling interest, for a $109.0 million loan receivable, which resulted in a net gain of $12.0 million. The gain was recorded in "Other income" on the Consolidated Statements of Operations.
Timber and timberlands
On June 30, 2008, the Company closed on the sale of its Maine timber property for net proceeds of $152.7 million, resulting in a total gain of $27.0 million, which includes $3.7 million attributable to noncontrolling interests. These gains are included in "Gain from discontinued operations" and "Gain from discontinued operations attributable to noncontrolling interests" on the Company's Consolidated Statements of Operations. The Company reflected net income from the operations of its Maine timber property of $2.3 million in "Income from discontinued operations" for the year ended December 31, 2008.
Note 8—Other Assets and Other Liabilities
Deferred expenses and other assets, net, consist of the following items ($ in thousands):
| |
As of December 31, | ||||||
|---|---|---|---|---|---|---|---|
| |
2010 | 2009 | |||||
Net lease in-place lease intangibles, net(1) |
$ | 24,469 | $ | 48,751 | |||
Other receivables |
13,521 | 15,235 | |||||
Corporate furniture, fixtures and equipment, net(2) |
11,016 | 14,550 | |||||
Leasing costs, net(3) |
8,267 | 14,830 | |||||
Deferred financing fees, net(4) |
5,527 | 41,959 | |||||
Prepaid expenses |
5,265 | 6,045 | |||||
Other assets |
17,463 | 16,587 | |||||
Deferred expenses and other assets, net |
$ | 85,528 | $ | 157,957 | |||
Explanatory Notes:
- (1)
- Represents
unamortized finite-lived intangible assets primarily related to the prior acquisition of net lease assets. Accumulated amortization on net lease
intangibles was $26.6 million and $33.1 million as of December 31, 2010 and 2009, respectively. Amortization expense related to these assets was $6.4 million,
$9.6 million and $8.9 million for the years ended December 31, 2010, 2009 and 2008, respectively.
- (2)
- Accumulated
depreciation on corporate furniture, fixture and equipment was $7.2 million and $9.4 million as of December 31, 2010 and
2009, respectively.
- (3)
- Accumulated
amortization on leasing costs was $5.3 million and $11.2 million as of December 31, 2010 and 2009, respectively.
- (4)
- During the year ended December 31, 2010, in connection with certain prepayments of debt obligations, the Company expensed unamortized deferred financing fees of $21.1 million which reduced net gain on early extinguishment of debt (see Note 9). Accumulated amortization on deferred financing fees was $21.1 million and $30.3 million as of December 31, 2010 and 2009, respectively.
80
iStar Financial Inc.
Notes to Consolidated Financial Statements (Continued)
Note 8—Other Assets and Other Liabilities (Continued)
Accounts payable, accrued expenses and other liabilities consist of the following items ($ in thousands):
| |
As of December 31, | ||||||
|---|---|---|---|---|---|---|---|
| |
2010 | 2009 | |||||
Accrued interest payable |
$ | 38,143 | $ | 49,697 | |||
Accrued expenses |
19,800 | 37,388 | |||||
Deferred tax liabilities |
13,729 | 9,336 | |||||
Unearned operating lease income |
10,423 | 17,153 | |||||
Property taxes payable |
5,880 | 5,211 | |||||
Security deposits from customers |
2,874 | 24,763 | |||||
Fremont Participation payable (see Note 4) |
— | 67,711 | |||||
Other liabilities |
42,211 | 40,851 | |||||
Accounts payable, accrued expenses and other liabilities |
$ | 133,060 | $ | 252,110 | |||
81
iStar Financial Inc.
Notes to Consolidated Financial Statements (Continued)
Note 9—Debt Obligations, net
As of December 31, 2010 and 2009, the Company's debt obligations were as follows ($ in thousands):
| |
Carrying Value as of | |
|
|||||||||
|---|---|---|---|---|---|---|---|---|---|---|---|---|
| |
Stated Interest Rates |
Scheduled Maturity Date |
||||||||||
| |
2010 | 2009 | ||||||||||
Secured revolving credit facilities: |
||||||||||||
Line of credit(1) |
$ | 618,883 | $ | 625,247 | LIBOR + 1.50% | June 2011 | ||||||
Line of credit(1) |
334,180 | 334,180 | LIBOR + 1.50% | June 2012 | ||||||||
Unsecured revolving credit facilities: |
||||||||||||
Line of credit(1) |
501,405 | 504,305 | LIBOR + 0.85% | June 2011 | ||||||||
Line of credit |
243,819 | 244,295 | LIBOR + 0.85% | June 2012 | ||||||||
Total revolving credit facilities |
1,698,287 | 1,708,027 | ||||||||||
Secured term loans: |
||||||||||||
Collateralized by net lease assets |
— | 947,862 | 6.25% | April 2011 | ||||||||
Collateralized by loans, net lease, REHI and OREO assets(1) |
1,055,000 | 1,055,000 | LIBOR + 1.50% | June 2011 | ||||||||
Collateralized by loans, net lease, REHI and OREO assets(1) |
612,222 | 621,221 | LIBOR + 1.50% | June 2012 | ||||||||
Collateralized by loans, net lease, REHI and OREO assets |
— | 1,000,000 | LIBOR + 2.50% | June 2012 | ||||||||
Collateralized by net lease assets |
— | 114,279 | 11.438% | December 2020 | ||||||||
Collateralized by net lease and OREO assets |
190,223 | 260,980 | LIBOR + 1.65% 6.4%–8.4% | Various through 2029 | ||||||||
Total secured term loans |
1,857,445 | 3,999,342 | ||||||||||
Secured notes: |
||||||||||||
8.0% senior notes(2) |
— | 155,253 | 8.0% | March 2011 | ||||||||
10.0% senior notes(1)(2)(3) |
312,329 | 479,548 | 10.0% | June 2014 | ||||||||
Total secured notes |
312,329 | 634,801 | ||||||||||
Unsecured notes: |
||||||||||||
LIBOR + 0.35% senior notes |
— | 158,699 | LIBOR + 0.35% | March 2010 | ||||||||
5.375% senior notes |
— | 143,509 | 5.375% | April 2010 | ||||||||
6.0% senior notes |
— | 251,086 | 6.0% | December 2010 | ||||||||
5.80% senior notes(1) |
107,766 | 192,890 | 5.80% | March 2011 | ||||||||
5.125% senior notes |
96,916 | 175,168 | 5.125% | April 2011 | ||||||||
5.65% senior notes |
196,593 | 286,787 | 5.65% | September 2011 | ||||||||
5.15% senior notes |
322,006 | 406,996 | 5.15% | March 2012 | ||||||||
5.50% senior notes |
102,345 | 146,470 | 5.50% | June 2012 | ||||||||
LIBOR + 0.50% senior convertible notes(4) |
787,750 | 787,750 | LIBOR + 0.50% | October 2012 | ||||||||
8.625% senior notes |
501,701 | 508,701 | 8.625% | June 2013 | ||||||||
5.95% senior notes |
448,453 | 459,453 | 5.95% | October 2013 | ||||||||
6.5% senior notes |
67,055 | 75,635 | 6.5% | December 2013 | ||||||||
5.70% senior notes |
200,601 | 206,601 | 5.70% | March 2014 | ||||||||
6.05% senior notes |
105,765 | 105,765 | 6.05% | April 2015 | ||||||||
5.875% senior notes |
261,403 | 261,403 | 5.875% | March 2016 | ||||||||
5.85% senior notes |
99,722 | 99,722 | 5.85% | March 2017 | ||||||||
Total unsecured notes |
3,298,076 | 4,266,635 | ||||||||||
Other debt obligations |
100,000 | 100,000 | LIBOR + 1.5% | October 2035 | ||||||||
Total debt obligations |
7,266,137 | 10,708,805 | ||||||||||
Debt premiums/(discounts), net(3)(4) |
79,296 | 186,098 | ||||||||||
Total debt obligations, net |
$ | 7,345,433 | $ | 10,894,903 | ||||||||
82
iStar Financial Inc.
Notes to Consolidated Financial Statements (Continued)
Note 9—Debt Obligations, net (Continued)
Explanatory Notes:
- (1)
- Principal
balances have been fully or partially repaid subsequent to year end (see Note 19).
- (2)
- Represents
the Company's Secured Exchange Notes.
- (3)
- As
of December 31, 2010, debt premiums/ (discounts), net includes unamortized debt premiums of $109.5 million associated with the Secured
Exchange Notes, which resulted from the unsecured/secured note exchange transactions completed in May 2009.
- (4)
- The Company's convertible senior floating rate notes due October 2012 ("Convertible Notes") are convertible at the option of the holders, into 22.2 shares per $1,000 principal amount of Convertible Notes, on or after August 15, 2012, or prior to that date if (1) the price of the Company's Common Stock trades above 130% of the conversion price for a specified duration, (2) the trading price of the Convertible Notes is below a certain threshold, subject to specified exceptions, (3) the Convertible Notes have been called for redemption, or (4) specified corporate transactions have occurred. None of the conversion triggers have been met as of December 31, 2010. As of December 31, 2010, the outstanding principal balance of the Company's senior convertible notes was $787.8 million, the unamortized discount was $21.9 million and the net carrying amount of the liability was $765.9 million. As of December 31, 2010, the carrying value of the additional paid-in-capital, or equity component of the convertible notes, was $37.4 million. For the years ended December 31, 2010, 2009 and 2008, the Company recognized interest expense on the convertible notes of $17.5 million, $21.0 million and $42.3 million, respectively, of which $10.8 million, $10.0 million and $9.5 million, respectively, related to the amortization of the debt discount.
Future Scheduled Maturities—As of December 31, 2010, future scheduled maturities of outstanding long-term debt obligations, net are as follows ($ in thousands)(1):
2011 |
$ | 2,638,914 | ||
2012 |
2,402,322 | |||
2013 |
1,072,132 | |||
2014 |
512,930 | |||
2015 |
105,765 | |||
Thereafter |
534,074 | |||
Total principal maturities |
7,266,137 | |||
Unamortized debt premiums, net |
79,296 | |||
Total long-term debt obligations, net |
$ | 7,345,433 | ||
Explanatory Note:
- (1)
- See Note 19 for pro forma disclosure of future scheduled maturities after giving effect to the new secured credit Facility and debt repayments that occurred subsequent to year end.
Credit Facilities—As of December 31, 2010, the Company had two secured bank credit facilities with outstanding borrowings of $618.9 million and $334.2 million of revolving loans maturing in June 2011 and June 2012, respectively, as well as $1.06 billion and $612.2 million of term loans maturing in June 2011 and June 2012, respectively. Borrowings under the secured credit facilities bear interest at the rate of LIBOR + 1.50% per year, subject to adjustment based upon the Company's corporate credit ratings (see Ratings Triggers below). As of December 31, 2010, there was $11.4 million immediately available to draw under the secured credit facilities. Outstanding borrowings are secured by a lien on a collateral pool which must be maintained at 1.3x outstanding borrowings. As of December 31, 2010, the total carrying value of assets pledged as collateral under the secured credit facilities and the secured exchange notes was $3.95 billion.
As of December 31, 2010, the Company's unsecured revolving credit facilities have outstanding balances of $501.4 million maturing in June 2011 and $243.8 million maturing in June 2012. Borrowings
83
iStar Financial Inc.
Notes to Consolidated Financial Statements (Continued)
Note 9—Debt Obligations, net (Continued)
made under the unsecured revolving credit facilities bear interest at a rate of LIBOR + 0.85% per year, subject to adjustment based upon our corporate credit ratings (see Ratings Triggers below), and may not be repaid prior to maturity while the secured credit facilities remain outstanding.
In November 2010, the Company fully repaid a $1.00 billion First Priority Credit Agreement, which was due to mature in June 2012, and terminated all commitments thereunder. The repayment increased the aggregate limitation contained in the Company's secured credit facilities on its repurchases of its senior unsecured notes maturing after June 26, 2012 and its Common Stock from $350.0 million to $750.0 million; provided, however, that no more than $50.0 million may be used for Common Stock repurchases prior to December 31, 2010 and no more than $100.0 million may be used for all Common Stock repurchases.
Subsequent to year end, the Company fully repaid borrowings outstanding under its secured bank credit facilities with proceeds from the new secured credit Facility (see Note 19).
Other Secured Term Loans—Also during 2010, the Company repaid other secured term loans, including a $947.9 million non-recourse loan that was collateralized by the portfolio of 32 net lease assets sold during the period, as well as $153.3 million of other term loans with various maturities.
In connection with these repayments, the Company expensed unamortized deferred financing costs and incurred other expenses totaling $22.1 million, which reduced net gain on early extinguishment of debt during the year ended December 31, 2010.
Secured Notes—During 2009, the Company completed a series of private offers in which the Company issued $155.3 million aggregate principal amount of its 8.0% second priority senior secured guaranteed notes due 2011 ("2011 Notes") and $479.5 million aggregate principal amounts of its 10.0% second priority senior secured guaranteed notes due 2014 ("2014 Notes" and together with the 2011 Notes, the "Secured Exchange Notes") in exchange for $1.01 billion aggregate principal amount of its senior unsecured notes of various series. The Secured Exchange Notes are collateralized by a lien on the same pool of collateral pledged under the Company's secured credit facilities. In conjunction with the exchange, the Company also purchased $12.5 million par value of its outstanding senior floating rate notes due September 2009 in a cash tender offer.
The Company accounted for the issuance of the 2014 Notes in exchange for various series of senior unsecured notes as a troubled debt restructuring. As such, the Company recognized a gain on the exchange to the extent that the prior carrying value of the senior unsecured notes exceeded the total future contractual cash payments of the 2014 Notes, consisting of both principal and interest. The issuance of the 2011 Notes in exchange for senior unsecured notes was considered a modification of the original debt resulting in adjustments to the carrying amounts for any new premiums or discounts. As a result of these transactions, the Company recognized a $107.9 million gain on early extinguishment of debt, net of closing costs of $11.8 million, and recorded a deferred gain of $262.7 million which was reflected as premiums to the par value of the new debt. In addition, in connection with the exchange for the 2011 Notes, the Company incurred $4.3 million of direct costs which were recorded in "Other expense" on its Consolidated Statements of Operations. These premiums are being amortized over the terms of the 2011 Notes and the 2014 Notes as a reduction to interest expense.
84
iStar Financial Inc.
Notes to Consolidated Financial Statements (Continued)
Note 9—Debt Obligations, net (Continued)
During 2010, the Company redeemed or repurchased $155.3 million par value of 2011 Notes and $167.2 million par value of 2014 Notes, generating $71.3 million of gains on early extinguishment of debt, primarily related to the recognition of the deferred gain premiums that resulted from the May 2009 exchange. As of December 31, 2010, the remaining unamortized premium for the 2014 Notes was $109.5 million. Subsequent to year end, the Company fully redeemed its $312.3 million remaining principal amount of 2014 Notes (see Note 19).
Unsecured Notes—During the year ended December 31, 2010, the Company repurchased $592.8 million par value of its senior unsecured notes with various maturities ranging from March 2010 to March 2014 through open market repurchases generating $59.7 million in gains on early extinguishment of debt. In addition, the Company also repaid $375.7 million of unsecured notes at maturity during the year ended December 31, 2010.
During the year ended December 31, 2009, the Company repurchased, through open market and private transactions, $1.31 billion par value of its senior unsecured notes with various maturities ranging from January 2009 to March 2017. In connection with these repurchases, the Company recorded an aggregate net gain on early extinguishment of debt of $439.4 million for the year ended December 31, 2009.
Debt Covenants
The Company's outstanding unsecured debt securities contain covenants that include fixed charge coverage and unencumbered assets to unsecured indebtedness ratios. The fixed charge coverage ratio in the Company's debt securities is an incurrence test. While the Company expects that its ability to incur new indebtedness under the coverage ratio will be limited for the foreseeable future, it will continue to be permitted to incur indebtedness for the purpose of refinancing existing indebtedness and for other permitted purposes under the indentures. The unencumbered assets to unsecured indebtedness covenant is a maintenance covenant. If any of the Company's covenants is breached and not cured within applicable cure periods, the breach could result in acceleration of its debt securities unless a waiver or modification is agreed upon with the requisite percentage of the bondholders. Based on the Company's unsecured credit ratings, the financial covenants in its debt securities, including the fixed charge coverage ratio and maintenance of unencumbered assets to unsecured indebtedness ratio, are currently operative.
The Company's new secured credit Facility (see Note 19) contains certain covenants, including covenants relating to the delivery of information to the lenders, collateral coverage, dividend payments, restrictions on fundamental changes, transactions with affiliates and matters relating to the liens granted to the lenders. In particular, the Company is required to maintain collateral coverage of 1.25x outstanding borrowings. In addition, for so long as the Company maintains its qualification as a REIT, the new Facility permits it to distribute 100% of its REIT taxable income on an annual basis. The Company may not pay common dividends if it ceases to qualify as a REIT.
The Company's new secured credit Facility contains cross default provisions that would allow the lenders to declare an event of default and accelerate its indebtedness to them if it fails to pay amounts due in respect of its other recourse indebtedness in excess of specified thresholds or if the lenders under such other indebtedness are otherwise permitted to accelerate such indebtedness for any reason. The indentures governing the Company's unsecured public debt securities permit the lenders and bondholders to declare an event of default and accelerate its indebtedness to them if the Company's other recourse indebtedness
85
iStar Financial Inc.
Notes to Consolidated Financial Statements (Continued)
Note 9—Debt Obligations, net (Continued)
in excess of specified thresholds or if such indebtedness is accelerated. The Company's unsecured credit facilities permit the lenders to accelerate its indebtedness to them if other recourse indebtedness of the Company in excess of specified thresholds is accelerated. The Company believes it is in full compliance with all the covenants in its debt instruments as of December 31, 2010.
Ratings Triggers
Borrowings under the Company's secured and unsecured credit facilities bear interest at LIBOR based rates plus an applicable margin which varies between the facilities and is determined based on the Company's corporate credit ratings. The Company's ability to borrow under its credit facilities is not dependent on the level of its credit ratings. Based on the Company's current credit ratings, further downgrades in the Company's credit ratings will have no effect on its borrowing rates under these facilities.
Note 10—Commitments and Contingencies
Business Risks and Uncertainties—The economic recession and tightening of capital markets adversely affected our business. The Company experienced significant provisions for loan losses and impairments resulting from high levels of non-performing loans and increasing amounts of real estate owned as the Company took title to assets of defaulting borrowers. The economic conditions and their effect on the Company's operations also resulted in increases in its financing costs and an inability to access the unsecured debt markets. Since the beginning of the crisis, the Company has significantly curtailed asset originations and has focused primarily on resolving problem assets, generating liquidity, retiring debt, decreasing leverage and preserving shareholder value.
The Company saw early signs of an economic recovery during 2010, including some improvements in the commercial real estate market and greater stability in the capital markets. These conditions resulted in reduced additions to non-performing loans, reductions in provisions for loan losses and increased levels of liquidity to fund operations. Despite the improvements, the impact of the economic recession continues to have an effect on the Company's operations, primarily evidenced by still elevated levels of non-performing assets. Additionally, many of the improving trends in the Company's financial condition and operating results are dependent on a sustained recovery and there can be no assurance that the recent improvement in conditions will continue in the future.
After giving effect to the new secured credit Facility and repayments of debt subsequent to year-end (see Note 19), the Company has approximately $882 million of debt maturing and minimum required amortization payments due on or before December 31, 2011. The Company believes that its available cash and expected proceeds from asset repayments and sales will be sufficient to meet its obligations and to remain in compliance with the covenants in its debt instruments during the remainder of the year. However, the timing and amounts of expected proceeds from expected asset repayments and sales are subject to factors outside of the Company's control and cannot be predicted with certainty. The Company's plans are dynamic and it may adjust its plans in response to changes in its expectations and changes in market conditions. The Company would be materially adversely affected if it is unable to repay or refinance its debt as it comes due.
Unfunded Commitments—The Company has certain off-balance sheet unfunded commitments. The Company generally funds construction and development loans and build-outs of space in net lease assets over a period of time if and when the borrowers and tenants meet established milestones and other
86
iStar Financial Inc.
Notes to Consolidated Financial Statements (Continued)
Note 10—Commitments and Contingencies (Continued)
performance criteria. The Company refers to these arrangements as Performance-Based Commitments. In addition, the Company will sometimes establish a maximum amount of additional fundings which it will make available to a borrower or tenant for an expansion or addition to a project if it approves of the expansion or addition at its sole discretion. The Company refers to these arrangements as Discretionary Fundings. Finally, the Company has committed to invest capital in several real estate funds and other ventures. These arrangements are referred to as Strategic Investments. As of December 31, 2010, the maximum amounts of the fundings the Company may make under each category, assuming all performance hurdles and milestones are met under the Performance-Based Commitments, that it will approve all Discretionary Fundings and that 100% of its capital committed to Strategic Investments is drawn down, are as follows ($ in thousands):
| |
Loans | Net Lease Assets |
Strategic Investments |
Total | ||||||||||
|---|---|---|---|---|---|---|---|---|---|---|---|---|---|---|
Performance-Based Commitments |
$ | 138,353 | $ | 8,143 | $ | — | $ | 146,496 | ||||||
Discretionary Fundings |
158,683 | — | — | 158,683 | ||||||||||
Other |
— | — | 52,370 | 52,370 | ||||||||||
Total |
$ | 297,036 | $ | 8,143 | $ | 52,370 | $ | 357,549 | ||||||
Other Commitments—Total operating lease expense for the years ended December 31, 2010, 2009 and 2008 were $7.3 million, $13.3 million and $7.9 million, respectively. Future minimum lease obligations under non-cancelable operating leases are as follows ($ in thousands):
2011 |
$ | 5,945 | ||
2012 |
5,152 | |||
2013 |
4,558 | |||
2014 |
4,186 | |||
2015 |
3,860 | |||
Thereafter |
17,293 |
As a result of the Company's decision to remain in its current space that is leased through 2021, the Company entered into a settlement agreement with a landlord regarding a separate long-term lease for new headquarters space dated May 22, 2007 (as amended and restated, the "Lease"). Under the settlement, the Company agreed to pay the landlord a $42.4 million settlement payment in order to settle all disputes between the Company and the landlord relating to the Lease and the landlord agreed among other things, to terminate the Lease. For the year ended December 31, 2009, the Company recognized a $42.4 million lease termination expense in "Other expense" on the Company's Consolidated Statements of Operations.
The Company also has issued letters of credit totaling $14.4 million in connection with eight of its investments.
Note 11—Equity
The Company's charter provides for the issuance of up to 200.0 million shares of Common Stock, par value $0.001 per share and 30.0 million shares of preferred stock. As of December 31, 2010, 138.2 million common shares were issued and 92.3 million common shares were outstanding.
87
iStar Financial Inc.
Notes to Consolidated Financial Statements (Continued)
Note 11—Equity (Continued)
The Company had the following series of Cumulative Redeemable Preferred Stock outstanding as of December 31, 2010 and 2009:
| |
|
|
Cumulative Preferential Cash Dividends(1)(2) |
||||||||||
|---|---|---|---|---|---|---|---|---|---|---|---|---|---|
Series
|
Shares Authorized, Issued and Outstanding (in thousands) |
Par Value | Rate per Annum of the $25.00 Liquidation Preference |
Equivalent to Fixed Annual Rate (per share) |
|||||||||
D |
4,000 | $ | 0.001 | 8.000 | % | $ | 2.00 | ||||||
E |
5,600 | $ | 0.001 | 7.875 | % | $ | 1.97 | ||||||
F |
4,000 | $ | 0.001 | 7.8 | % | $ | 1.95 | ||||||
G |
3,200 | $ | 0.001 | 7.65 | % | $ | 1.91 | ||||||
I |
5,000 | $ | 0.001 | 7.50 | % | $ | 1.88 | ||||||
|
21,800 | ||||||||||||
Explanatory Notes:
- (1)
- Holders
of shares of the Series D, E, F, G and I preferred stock are entitled to receive dividends, when and as declared by the Board of Directors,
out of funds legally available for the payment of dividends. Dividends are cumulative from the date of original issue and are payable quarterly in arrears on or before the 15th day of each
March, June, September and December or, if not a business day, the next succeeding business day. Any dividend payable on the preferred stock for any partial dividend period will be computed on the
basis of a 360-day year consisting of twelve 30-day months. Dividends will be payable to holders of record as of the close of business on the first day of the calendar month in
which the applicable dividend payment date falls or on another date designated by the Board of Directors of the Company for the payment of dividends that is not more than 30 nor less than ten days
prior to the dividend payment date.
- (2)
- The Company declared and paid dividends aggregating $8.0 million, $11.0 million, $7.8 million, $6.1 million and $9.4 million on its Series D, E, F, G, and I preferred stock, respectively, during each of the years ended December 31, 2010 and 2009. There are no dividend arrearages on any of the preferred shares currently outstanding.
The Series D, E, F, G, and I Cumulative Redeemable Preferred Stock are redeemable without premium at the option of the Company at their respective liquidation preferences beginning on October 8, 2002, July 18, 2008, September 29, 2008, December 19, 2008 and March 1, 2009, respectively.
High Performance Unit Program
In May 2002, the Company's shareholders approved the iStar Financial High Performance Unit ("HPU") Program. The program entitled employee participants ("HPU Holders") to receive distributions if the total rate of return on the Company's Common Stock (share price appreciation plus dividends) exceeded certain performance thresholds over a specified valuation period. The Company established seven HPU plans that had valuation periods ending between 2002 and 2008 and the Company has not established any new HPU plans since 2005. HPU Holders purchased their interests in High Performance Common Stock for aggregate initial purchase prices of approximately $2.8 million, $1.8 million, $1.4 million, $0.6 million, $0.7 million, $0.6 million and $0.8 million for the 2002, 2003, 2004, 2005, 2006, 2007 and 2008 plans, respectively.
The 2002, 2003 and 2004 plans all exceeded their performance thresholds and are entitled to receive distributions equivalent to the amount of dividends payable on 819,254 shares, 987,149 shares and 1,031,875 shares, respectively, of the Company's Common Stock as and when such dividends are paid on the Company's Common Stock. Each of these three plans has 5,000 shares of High Performance Common
88
iStar Financial Inc.
Notes to Consolidated Financial Statements (Continued)
Note 11—Equity (Continued)
Stock associated with it, which is recorded as a separate class of stock within shareholders' equity on the Company's Consolidated Balance Sheets. High Performance Common Stock carries 0.25 votes per share. Net income allocable to common shareholders is reduced by the HPU holders' share of earnings.
The remaining four plans that had valuation periods which ended in 2005, 2006, 2007 and 2008, did not meet their required performance thresholds and none of the plans were funded. As a result, the Company redeemed the participants' units for approximately $1,700 resulting in the unit holders losing $2.4 million of aggregate contributions.
In addition to these plans, a high performance unit program for executive officers was established with plans having three-year valuation periods which ended December 31, 2005, 2006, 2007 and 2008. The provisions of these plans were substantially the same as the high performance unit programs for employees. The Chief Executive Officer and former President collectively purchased 100% interests in the Company's 2005, 2006, 2007 and 2008 high performance unit program for senior executive officers for an aggregate purchase price of $1.5 million. These plans did not meet the required performance thresholds and were not funded, resulting in the Chief Executive Officer and former President losing $0.9 million and $0.6 million in total contributions, respectively.
Dividends—In order to maintain its election to qualify as a REIT, the Company must currently distribute, at a minimum, an amount equal to 90% of its taxable income, excluding net capital gains, and must distribute 100% of its taxable income (including net capital gains) to avoid paying corporate federal income taxes. The Company has recorded net operating losses and may record net operating losses in the future, which may reduce its taxable income in future periods and lower or eliminate entirely the Company's obligation to pay dividends for such periods in order to maintain its REIT qualification. Because taxable income differs from cash flow from operations due to non-cash revenues and expenses (such as depreciation and certain asset impairments), in certain circumstances, the Company may generate operating cash flow in excess of its dividends or, alternatively, may be required to borrow to make sufficient dividend payments. The Company's new secured credit Facility permits the Company to distribute 100% of its REIT taxable income on an annual basis, for so long as the Company maintains its qualification as a REIT. The new Facility restricts the Company from paying any common dividends if it ceases to qualify as a REIT. The Company did not declare or pay any Common Stock dividends for the years ended December 31, 2010 and 2009.
For tax reporting purposes:
| |
|
|
Ordinary Dividend | 15% Capital Gain | 25% Section 1250 Capital Gains | ||||||||||||||||||||
|---|---|---|---|---|---|---|---|---|---|---|---|---|---|---|---|---|---|---|---|---|---|---|---|---|---|
Year
|
Total dividends declared (in thousands)(1) |
Dividends per share |
Per share | Percentage of dividends per share |
Per share | Percentage of dividends per share |
Per share | Percentage of dividends per share |
|||||||||||||||||
2010 |
$ | — | $ | — | $ | — | — | $ | — | — | $ | — | — | ||||||||||||
2009 |
$ | — | $ | — | $ | — | — | $ | — | — | $ | — | — | ||||||||||||
2008 |
$ | 236,052 | $ | 1.74 | $ | 0.1886 | 10.8 | % | $ | 1.3244 | 76.1 | % | $ | 0.2270 | 13.1 | % | |||||||||
Explanatory Note:
- (1)
- For the year ended December 31, 2008, 25.6% ($0.0483) of the ordinary dividend qualifies as a qualifying dividend for those shareholders who held shares of the Company for the entire year.
89
iStar Financial Inc.
Notes to Consolidated Financial Statements (Continued)
Note 11—Equity (Continued)
Stock Repurchase Program—On March 13, 2009, the Company's Board of Directors authorized the repurchase of up to $50 million of Common Stock from time to time in open market and privately negotiated purchases, including pursuant to one or more trading plans.
During the year ended December 31, 2010, the Company repurchased 2.2 million shares of its outstanding Common Stock for approximately $7.5 million, at an average cost of $3.40 per share, and the repurchases were recorded at cost. As of December 31, 2010, the Company had $14.1 million of Common Stock available to repurchase under the Board authorized stock repurchase programs.
Noncontrolling Interest—The following table presents amounts attributable to iStar Financial Inc. and allocable to common shareholders, HPU holders and Participating Security holders and excludes amounts allocable to noncontrolling interests ($ in thousands):
| |
For the Years Ended December 31, | ||||||||||
|---|---|---|---|---|---|---|---|---|---|---|---|
| |
2010 | 2009 | 2008 | ||||||||
Amounts attributable to iStar Financial Inc. and allocable to common shareholders, HPU holders and Participating Security holders |
|||||||||||
Income (loss) from continuing operations |
$ | (208,048 | ) | $ | (786,958 | ) | $ | (320,809 | ) | ||
Income from discontinued operations |
17,349 | 5,756 | 30,015 | ||||||||
Gain from discontinued operations |
270,382 | 12,426 | 87,769 | ||||||||
Net income (loss) |
79,683 | (768,776 | ) | (203,025 | ) | ||||||
Preferred dividends |
(42,320 | ) | (42,320 | ) | (42,320 | ) | |||||
Net income (loss) allocable to common shareholders, HPU holders and Participating Security holders |
$ | 37,363 | $ | (811,096 | ) | $ | (245,345 | ) | |||
Note 12—Risk Management and Derivatives
Risk management
In the normal course of its on-going business operations, the Company encounters economic risk. There are three main components of economic risk: interest rate risk, credit risk and market risk. The Company is subject to interest rate risk to the degree that its interest-bearing liabilities mature or reprice at different points in time and potentially at different bases, than its interest-earning assets. Credit risk is the risk of default on the Company's lending investments or leases that result from a borrower's or tenant's inability or unwillingness to make contractually required payments. Market risk reflects changes in the value of loans and other lending investments due to changes in interest rates or other market factors, including the rate of prepayments of principal and the value of the collateral underlying loans, the valuation of net lease, REHI and OREO assets by the Company as well as changes in foreign currency exchange rates.
90
iStar Financial Inc.
Notes to Consolidated Financial Statements (Continued)
Note 12—Risk Management and Derivatives (Continued)
Risk concentrations—As of December 31, 2010, the Company's total investment portfolio was comprised of the following property/collateral types ($ in thousands)(1):
Property/Collateral Type
|
Performing Loans and Other |
Non- performing Loans |
Net Lease Assets(3) |
REHI | OREO | Total | % of Total | |||||||||||||||
|---|---|---|---|---|---|---|---|---|---|---|---|---|---|---|---|---|---|---|---|---|---|---|
Apartment/Residential |
$ | 1,009,817 | $ | 588,918 | $ | — | $ | 11,500 | $ | 476,658 | $ | 2,086,893 | 23.2 | % | ||||||||
Land |
379,105 | 268,536 | 58,788 | 637,977 | 114,162 | 1,458,568 | 16.3 | % | ||||||||||||||
Retail |
596,344 | 214,873 | 183,820 | 50,641 | 44,204 | 1,089,882 | 12.1 | % | ||||||||||||||
Office |
212,771 | 53,007 | 600,618 | 17,337 | 16,422 | 900,155 | 10.0 | % | ||||||||||||||
Industrial/R&D |
98,721 | 21,330 | 603,537 | 50,520 | 6,300 | 780,408 | 8.7 | % | ||||||||||||||
Entertainment/Leisure |
193,353 | 77,801 | 483,173 | — | 1,200 | 755,527 | 8.4 | % | ||||||||||||||
Hotel |
399,262 | 20,847 | 183,805 | 44,556 | 15,000 | 663,470 | 7.4 | % | ||||||||||||||
Mixed Use/Mixed Collateral |
267,623 | 93,658 | 40,589 | 28,383 | 72,135 | 502,388 | 5.6 | % | ||||||||||||||
Other(2) |
715,376 | 12,440 | 20,641 | — | — | 748,457 | 8.3 | % | ||||||||||||||
Total |
$ | 3,872,372 | $ | 1,351,410 | $ | 2,174,971 | $ | 840,914 | $ | 746,081 | $ | 8,985,748 | 100.0 | % | ||||||||
Explanatory Notes:
- (1)
- Based
on the carrying value of our total investment portfolio net of asset-specific loan loss reserves and gross of general loan loss reserves and
accumulated depreciation.
- (2)
- Includes
$516.2 million of other investments.
- (3)
- Includes $16.1 million of other investments.
As of December 31, 2010, the Company's total investment portfolio had the following characteristics by geographical region ($ in thousands):
Geographic Region
|
Carrying Value(1) |
% of Total | |||||
|---|---|---|---|---|---|---|---|
West |
$ | 2,041,466 | 22.7 | % | |||
Northeast |
1,862,021 | 20.7 | % | ||||
Southeast |
1,356,366 | 15.1 | % | ||||
Southwest |
918,772 | 10.2 | % | ||||
Mid-Atlantic |
773,903 | 8.6 | % | ||||
Central |
427,817 | 4.8 | % | ||||
International |
376,829 | 4.2 | % | ||||
Northwest |
367,094 | 4.1 | % | ||||
Various |
861,480 | 9.6 | % | ||||
Total |
$ | 8,985,748 | 100.0 | % | |||
Explanatory Note:
- (1)
- Based on the carrying value of our total investment portfolio net of asset-specific loan loss reserves but gross of general loan loss reserves and accumulated depreciation.
91
iStar Financial Inc.
Notes to Consolidated Financial Statements (Continued)
Note 12—Risk Management and Derivatives (Continued)
Concentrations of credit risks arise when a number of borrowers or customers related to the Company's investments are engaged in similar business activities, or activities in the same geographic region, or have similar economic features that would cause their ability to meet contractual obligations, including those to the Company, to be similarly affected by changes in economic conditions. The Company monitors various segments of its portfolio to assess potential concentrations of credit risks. Management believes the current portfolio is reasonably well diversified and does not contain any significant concentration of credit risks.
Substantially all of the Company's net lease, REHI and OREO assets as well as assets collateralizing its loans and other lending investments are located in the United States, with California 13.0%, New York 11.4%, and Florida 10.6% representing the only significant concentrations (greater than 10.0%) as of December 31, 2010. The Company's portfolio contains significant concentrations in the following asset types as of December 31, 2010: apartment/residential 23.2%, land 16.3%, retail 12.1% and office 10.0%.
The Company underwrites the credit of prospective borrowers and customers and often requires them to provide some form of credit support such as corporate guarantees, letters of credit and/or cash security deposits. Although the Company's loans and other lending investments and net lease assets are geographically diverse and the borrowers and customers operate in a variety of industries, to the extent the Company has a significant concentration of interest or operating lease revenues from any single borrower or customer, the inability of that borrower or customer to make its payment could have an adverse effect on the Company. As of December 31, 2010, the Company's five largest borrowers or tenants collectively accounted for approximately 23.7% of the Company's aggregate annualized interest and operating lease revenue, of which no single customer accounts for more than 6.0%.
Derivatives
The Company's use of derivative financial instruments is primarily limited to the utilization of interest rate hedges and foreign exchange hedges. The principal objective of such hedges are to minimize the risks and/or costs associated with the Company's operating and financial structure and to manage its exposure to foreign exchange rate movements. Derivatives not designated as hedges are not speculative and are used to manage the Company's exposure to interest rate movements, foreign exchange rate movements, and other identified risks, but may not meet the strict hedge accounting requirements.
As of December 31, 2010, derivative liabilities with a fair value of $0.2 million were included in "Accounts payable, accrued expenses and other liabilities" on the Company's Consolidated Balance Sheet. As of December 31, 2009, derivative assets with a fair value of $0.8 million were included in "Deferred expenses and other assets, net" and derivative liabilities with a fair value of $0.3 million were included in "Accounts payable, accrued expenses and other liabilities" on the Company's Consolidated Balance Sheet.
2010 and 2009 Hedging Activity—During the years ended December 31, 2010 and 2009, the Company did not have any significant hedging activity.
2008 Hedging Activity—During the year ended December 31, 2008, the Company had the following significant hedging activity:
- •
- The Company paid $11.1 million to terminate forward starting swap agreements with a notional amount of $250.0 million. The Company determined the forecasted transaction was not probable of
92
iStar Financial Inc.
Notes to Consolidated Financial Statements (Continued)
Note 12—Risk Management and Derivatives (Continued)
- •
- The Company terminated $1.76 billion of pay floating interest rate swaps that were designated as fair value hedges of certain unsecured notes. As a result of the terminations, the Company received $51.1 million of cash, recorded a receivable of $19.0 million and recorded premiums to the respective unsecured notes of $65.7 million. The premiums amortize over the lives of the respective debt as an offset to "Interest expense" on the Company's Consolidated Statements of Operations. During the year ended December 31, 2008, the Company recorded a net loss of $16.7 million, related to ineffectiveness on interest rate swaps. In addition, for the year ended December 31, 2008, the Company recognized a net loss of $1.4 million for interest rate swaps not designated as hedges. All of these amounts were recorded in "Other expense" on the Company's Consolidated Statements of Operations.
occurring and recorded $8.2 million of losses that are recorded in "Other expense" on the Company's Consolidated Statements of Operations for the year ended December 31, 2008.
Note 13—Stock-Based Compensation Plans and Employee Benefits
On May 27, 2009, the Company's shareholders approved the Company's 2009 Long-Term Incentive Plan (the "2009 LTIP") which is designed to provide incentive compensation for officers, key employees, directors and advisors of the Company. The 2009 LTIP provides for awards of stock options, shares of restricted stock, phantom shares, restricted stock units, dividend equivalent rights and other share-based performance awards. A maximum of 8,000,000 shares of Common Stock may be awarded under the 2009 LTIP, plus up to an additional 500,000 shares to the extent that a corresponding number of equity awards previously granted under the Company's 1996 Long-Term Incentive Plan expire or are cancelled or forfeited. All awards under the 2009 LTIP are made at the discretion of the Board of Directors or a committee of the Board of Directors.
The Company's 2006 Long-Term Incentive Plan (the "2006 LTIP") is designed to provide equity-based incentive compensation for officers, key employees, directors, consultants and advisers of the Company. The 2006 LTIP provides for awards of stock options, shares of restricted stock, phantom shares, dividend equivalent rights and other share-based performance awards. A maximum of 4,550,000 shares of Common Stock may be subject to awards under the 2006 LTIP provided that the number of shares of Common Stock reserved for grants of options designated as incentive stock options is 1.0 million, subject to certain anti-dilution provisions in the 2006 LTIP. All awards under this Plan are at the discretion of the Board of Directors or a committee of the Board of Directors.
The Company's 2007 Incentive Compensation Plan ("Incentive Plan") was approved and adopted by the Board of Directors in 2007 in order to establish performance goals for selected officers and other key employees and to determine bonuses that will be awarded to those officers and other key employees based on the extent to which they achieve those performance goals. Equity-based awards may be made under the Incentive Plan, subject to the terms of the Company's equity incentive plans.
As of December 31, 2010, an aggregate of 3.6 million shares remain available for awards under the Company's 2006 and 2009 LTIP.
Stock-based Compensation—The Company recorded stock-based compensation expense of $19.4 million, $23.6 million and $23.4 million for the years ended December 31, 2010, 2009 and 2008, respectively in "General and administrative" on the Company's Consolidated Statements of Operations. As of December 31, 2010,
93
iStar Financial Inc.
Notes to Consolidated Financial Statements (Continued)
Note 13—Stock-Based Compensation Plans and Employee Benefits (Continued)
there was $14.6 million of total unrecognized compensation cost related to all unvested restricted stock units. That cost is expected to be recognized over a weighted average remaining vesting/service period of 0.96 years.
Stock Options—Changes in options outstanding during the year ended December 31, 2010, are as follows (amounts in thousands, except for weighted average strike price):
| |
Number of Shares | |
|
||||||||||||||
|---|---|---|---|---|---|---|---|---|---|---|---|---|---|---|---|---|---|
| |
Employees | Non-Employee Directors |
Other | Weighted Average Strike Price |
Aggregate Intrinsic Value |
||||||||||||
Options Outstanding, December 31, 2009 |
392 | 84 | 44 | $ | 19.08 | ||||||||||||
Forfeited in 2010 |
(333 | ) | (20 | ) | (24 | ) | $ | 16.89 | |||||||||
Options Outstanding, December 31, 2010 |
59 | 64 | 20 | $ | 24.87 | $ | — | ||||||||||
The following table summarizes information concerning outstanding and exercisable options as of December 31, 2010 (options in thousands):
Exercise Price
|
Options Outstanding and Exercisable |
Remaining Contractual Life (Years) |
|||||
|---|---|---|---|---|---|---|---|
$19.69 |
48 | 0.01 | |||||
$24.94 |
40 | 0.38 | |||||
$27.00 |
11 | 0.48 | |||||
$29.82 |
44 | 1.41 | |||||
|
143 | 0.58 | |||||
The Company has not issued any options since 2003. During the years ended December 31, 2010 and December 31, 2009, no options were exercised. Cash received from option exercises during the year ended December 31, 2008 was $5.2 million. The intrinsic value of options exercised during the year ended December 31, 2008 was $2.0 million.
Restricted Stock Units—Changes in non-vested restricted stock units during the year ended December 31, 2010 were as follows ($ in thousands, except per share amounts):
Non-Vested Shares
|
Number of Shares |
Weighted Average Grant Date Fair Value Per Share |
Aggregate Intrinsic Value |
||||||||
|---|---|---|---|---|---|---|---|---|---|---|---|
Non-vested at December 31, 2009 |
14,071 | $ | 3.62 | ||||||||
Granted |
2,324 | $ | 3.37 | ||||||||
Vested |
(521 | ) | $ | 24.31 | |||||||
Forfeited |
(1,541 | ) | $ | 3.05 | |||||||
Non-vested at December 31, 2010 |
14,333 | $ | 2.89 | $ | 112,084 | ||||||
2010 Activity—On February 17, 2010, the Company granted 1,516,074 service-based restricted stock units to employees that represent the right to receive an equivalent number of shares of the Company's Common Stock (after deducting shares for minimum required statutory withholdings) if and when the units vest. These units will cliff vest on February 17, 2012 if the employee is employed by the Company on that date and carry dividend equivalent rights that entitle the holder to receive dividend payments prior to vesting, if and when dividends are paid on shares of the Company's Common Stock. The grant date fair value of these awards was $4.7 million. As of December 31, 2010, 1,359,024 of these awards remained outstanding.
94
iStar Financial Inc.
Notes to Consolidated Financial Statements (Continued)
Note 13—Stock-Based Compensation Plans and Employee Benefits (Continued)
On March 2, 2010, the Company granted 806,518 performance-based restricted stock units to its Chairman and Chief Executive Officer. These units represent the right to receive an equivalent number of shares of the Company's Common Stock (after deducting shares for minimum required statutory withholdings) if and when the units vest. The performance-based units will cliff vest on March 2, 2012 if certain performance and service conditions have been achieved, relating to reductions in the Company's general and administrative expenses, retirement of debt and continued employment. The performance conditions were satisfied during the year ended December 31, 2010, therefore, vesting is now based solely on continued employment through March 2, 2012. Since the performance conditions have been achieved, these units now carry dividend equivalent rights that entitle the holder to receive dividend payments, if and when dividends are paid on shares of the Company's Common Stock. The grant date fair value of these performance based units was $3.2 million which is being recognized ratably over the service period. As of December 31, 2010, all of these awards remained outstanding.
On December 31, 2010, 341,199 market-condition based restricted stock units that were granted to employees on January 18, 2008 were forfeited as the market vesting condition was not met. These awards were to cliff vest on December 31, 2010 only if the total shareholder return on the Company's Common Stock was at least 20% (compounded annually, including dividends) from the date of the award through the end of the vesting period. Total shareholder return was based on the average NYSE closing prices for the Company's Common Stock for the 20 days prior to (a) the date of the award on January 18, 2008 (which was $25.04) and (b) December 31, 2010. Since shareholder return during that period was less than the established target, these awards were canceled.
Other Outstanding Awards—In addition to the awards granted in 2010, noted above, the following awards remained outstanding as of December 31, 2010:
- •
- 8,340,000 market-condition based restricted stock units granted to executives and other officers of the Company on
December 19, 2008. These units will vest in one installment on January 1, 2012 only if the Common Stock achieves a price of $10.00 or more (average NYSE closing price over 20 consecutive
trading days) prior to December 19, 2011 and the employee is thereafter employed on the vesting date. These awards established $4.00 and $7.00 price targets for the first and second measurement
periods ended December 19, 2009 and December 19, 2010, respectively, which were not achieved, therefore only the $10.00 price target remains applicable. If this price target is achieved,
the units will thereafter be entitled to dividend equivalent payments as dividends are paid on the Company's Common Stock. Upon vesting of these units, holders will receive shares of the Company's
Common Stock in the amount of the vested units, net of statutory minimum tax withholdings. On May 27, 2009, the Company's shareholders approved the 2009 LTIP, which authorized additional shares
of the Company's Common Stock to be available for awards under the Company's equity compensation plans including for settlement of these units. The approval converted the Company's accounting for the
units from liability-based to equity-based.
- •
- 2,000,000 market-condition based restricted stock units contingently awarded to the Company's Chairman and Chief Executive Officer on October 9, 2008 and approved by shareholders on May 27, 2009. These units will cliff vest in one installment on October 9, 2011 only if the total shareholder return on the Company's Common Stock is at least 25% per year (compounded at the end of the three year vesting period, including dividends). Total shareholder return will be based on the average NYSE closing prices for the Company's Common Stock for the 20 days prior to: (a) the date of the award on October 9, 2008 (which was $3.38); and (b) the vesting date (which must be at
95
iStar Financial Inc.
Notes to Consolidated Financial Statements (Continued)
Note 13—Stock-Based Compensation Plans and Employee Benefits (Continued)
- •
- 1,575,000 restricted stock units awarded to certain officers on October 9, 2008, as special retention incentive,
which will cliff vest in one installment on October 9, 2011, if the holders are employed on the vesting date. The unvested units are entitled to receive dividend equivalent payments as
dividends are paid on shares of the Company's Common Stock.
- •
- 252,477 service-based restricted stock units with original vesting terms ranging from three to five years that are entitled to be paid dividends as dividends are paid on shares of the Company's Common Stock.
least $6.58 if no dividends are paid). No dividends will be paid on these units prior to vesting. These units are required to be settled on a net, after-tax basis (after deducting shares for minimum required statutory withholdings); therefore the actual number of shares issued will be less than the gross amount of the award.
The fair values of the market-condition based restricted stock units, were determined by utilizing a Monte Carlo model to simulate a range of possible future stock prices for the Company's Common Stock. The following assumptions were used to estimate the fair value of market-condition based awards:
| |
Valued as of | |||||||||
|---|---|---|---|---|---|---|---|---|---|---|
| |
January 18, 2008 |
May 27, 2009(1) |
May 27, 2009(2) |
|||||||
Risk-free interest rate |
2.39 | % | 1.16 | % | 1.28 | % | ||||
Expected stock price volatility |
27.46 | % | 152.03 | % | 145.45 | % | ||||
Expected annual dividend |
— | — | — | |||||||
Explanatory Notes:
- (1)
- Contingent
equity-based restricted stock units awarded on October 9, 2008 were measured on May 27, 2009, the date the Company's shareholders
approved the grant of the award.
- (2)
- The units granted on December 19, 2008 were re-measured on May 27, 2009 when they became equity-based awards in accordance with ASC 718-20-55-135 to 138.
The total fair value of restricted stock units vested during the years ended December 31, 2010, 2009 and 2008 was $1.7 million, $1.4 million and $10.1 million, respectively.
Common Stock Equivalents—Non-employee directors are awarded common stock equivalents ("CSEs") at the time of the annual shareholders' meeting in consideration for their services on the Company's Board of Directors. The CSEs generally vest at the time of the next annual shareholders meeting and pay dividends in an amount equal to the dividends paid on an equivalent number of shares of the Company's Common Stock from the date of grant, as and when dividends are paid on the Common Stock. During the year ended December 31, 2010, the Company awarded to Directors 84,573 CSEs at a fair value per share of $5.91 at the time of grant. The CSE awards are classified as liability-based awards due to the fact that they can be settled in shares of stock or cash at the Directors' option. As of December 31, 2010, 281,958 CSEs, with an aggregate intrinsic value of $2.2 million were outstanding.
401(k) Plan
The Company has a savings and retirement plan (the "401(k) Plan"), which is a voluntary, defined contribution plan. All employees are eligible to participate in the 401(k) Plan following completion of three months of continuous service with the Company. Each participant may contribute on a pretax basis
96
iStar Financial Inc.
Notes to Consolidated Financial Statements (Continued)
Note 13—Stock-Based Compensation Plans and Employee Benefits (Continued)
up to the maximum percentage of compensation and dollar amount permissible under Section 402(g) of the Internal Revenue Code not to exceed the limits of Code Sections 401(k), 404 and 415. At the discretion of the Board of Directors, the Company may make matching contributions on the participant's behalf of up to 50% of the first 10% of the participant's annual compensation. The Company made gross contributions of approximately $1.1 million, $1.3 million and $1.5 million for the years ended December 31, 2010, 2009 and 2008, respectively.
Note 14—Earnings Per Share
EPS is calculated using the two-class method, which allocates earnings among common stock and participating securities to calculate EPS when an entity's capital structure includes either two or more classes of common stock or common stock and participating securities. HPU holders are current and former Company employees who purchased high performance common stock units under the Company's High Performance Unit (HPU) Program (see Note 11). These HPU units have been treated as a separate class of common stock.
The following table presents a reconciliation of income (loss) from continuing operations used in the basic and diluted EPS calculations ($ in thousands, except for per share data):
| |
For the Years Ended December 31, |
|||||||||
|---|---|---|---|---|---|---|---|---|---|---|
| |
2010 | 2009 | 2008 | |||||||
Income (loss) from continuing operations |
$ | (207,525 | ) | $ | (788,029 | ) | $ | (321,800 | ) | |
Net (income) loss attributable to noncontrolling interests |
(523 | ) | 1,071 | 991 | ||||||
Gain on sale of joint venture interest attributable to noncontrolling interests |
— | — | (18,560 | ) | ||||||
Preferred dividends |
(42,320 | ) | (42,320 | ) | (42,320 | ) | ||||
Dividends paid to Participating Security holders(1) |
— | — | (2,393 | ) | ||||||
Income (loss) from continuing operations attributable to iStar Financial Inc. and allocable to common shareholders and HPU holders |
$ | (250,368 | ) | $ | (829,278 | ) | $ | (384,082 | ) | |
Explanatory Note:
- (1)
- In accordance with ASC 260-10-65-1, "Application of the Two-Class Method under FASB Statement No. 128 to Master Limited Partnerships," ("ASC 260-10-65-1") the total dividends paid to Participating Security holders during the period have been deducted from income (loss) from continuing operations.
97
iStar Financial Inc.
Notes to Consolidated Financial Statements (Continued)
Note 14—Earnings Per Share (Continued)
| |
For the Years Ended December 31, |
|||||||||
|---|---|---|---|---|---|---|---|---|---|---|
| |
2010 | 2009 | 2008 | |||||||
Earnings allocable to common shares: |
||||||||||
Numerator for basic and diluted earnings per share: |
||||||||||
Income (loss) from continuing operations attributable to iStar Financial Inc. and allocable to common shareholders(1) |
$ | (242,953 | ) | $ | (806,250 | ) | $ | (375,946 | ) | |
Income from discontinued operations |
16,837 | 5,597 | 47,546 | |||||||
Gain from discontinued operations, net of noncontrolling interests |
262,395 | 12,083 | 85,910 | |||||||
Net income (loss) attributable to iStar Financial Inc. and allocable to common shareholders |
$ | 36,279 | $ | (788,570 | ) | $ | (242,490 | ) | ||
Denominator for basic and diluted earnings per share: |
||||||||||
Weighted average common shares outstanding for basic and diluted earnings per common share |
93,244 | 100,071 | 131,153 | |||||||
Basic and Diluted earnings per common share: |
||||||||||
Income (loss) from continuing operations attributable to iStar Financial Inc. and allocable to common shareholders(1) |
$ | (2.60 | ) | $ | (8.06 | ) | $ | (2.87 | ) | |
Income from discontinued operations |
0.18 | 0.06 | 0.36 | |||||||
Gain from discontinued operations, net of noncontrolling interests |
2.81 | 0.12 | 0.66 | |||||||
Net income (loss) attributable to iStar Financial Inc. and allocable to common shareholders |
$ | 0.39 | $ | (7.88 | ) | $ | (1.85 | ) | ||
Earnings allocable to High Performance Units: |
||||||||||
Numerator for basic and diluted earnings per HPU share: |
||||||||||
Income (loss) from continuing operations attributable to iStar Financial Inc. and allocable to HPU holders(1) |
$ | (7,415 | ) | $ | (23,028 | ) | $ | (8,136 | ) | |
Income from discontinued operations |
512 | 159 | 1,029 | |||||||
Gain from discontinued operations, net of noncontrolling interests |
7,987 | 343 | 1,859 | |||||||
Net income (loss) attributable to iStar Financial Inc. and allocable to HPU holders |
$ | 1,084 | $ | (22,526 | ) | $ | (5,248 | ) | ||
Denominator for basic and diluted earnings per HPU share:: |
||||||||||
Weighted average High Performance Units outstanding for basic and diluted earnings per share |
15 | 15 | 15 | |||||||
Basic and Diluted earnings per HPU share: |
||||||||||
Income (loss) from continuing operations attributable to iStar Financial Inc. and allocable to HPU holders(1) |
$ | (494.33 | ) | $ | (1,535.20 | ) | $ | (542.40 | ) | |
Income from discontinued operations |
34.13 | 10.60 | 68.60 | |||||||
Gain from discontinued operations, net of noncontrolling interests |
532.47 | 22.87 | 123.93 | |||||||
Net income (loss) attributable to iStar Financial Inc. and allocable to HPU holders |
$ | 72.27 | $ | (1,501.73 | ) | $ | (349.87 | ) | ||
Explanatory Note:
- (1)
- Income (loss) from continuing operations attributable to iStar Financial Inc. and allocable to common shareholders has been adjusted for net (income) loss attributable to noncontrolling interests and preferred dividends. In addition, for the year ended December 31, 2008, income (loss) from continuing operations attributable to iStar Financial Inc. and allocable to common shareholders has been adjusted to exclude dividends paid to Participating Security holders (see preceding table).
98
iStar Financial Inc.
Notes to Consolidated Financial Statements (Continued)
Note 14—Earnings Per Share (Continued)
For the years ended December 31, 2010, 2009 and 2008, the following shares were anti-dilutive ($ in thousands):
| |
For the Years Ended December 31, | |||||||||
|---|---|---|---|---|---|---|---|---|---|---|
| |
2010 | 2009 | 2008 | |||||||
Joint venture shares |
298 | 298 | 298 | |||||||
Stock options |
143 | 520 | 529 | |||||||
Restricted stock units(1) |
11,147 | 11,548 | 10,633 | |||||||
Explanatory Note:
- (1)
- For the periods ended December 31, 2010, 2009 and 2008, anti-dilutive restricted stock units exclude 3.2 million, 2.5 million and 4.4 million, respectively, of unvested restricted stock units that have dividend equivalent rights as they are considered Participating Securities.
Note 15—Comprehensive Income (Loss)
The statement of comprehensive income (loss) attributable to iStar Financial, Inc. is as follows ($ in thousands):
| |
For the Years Ended December 31, | ||||||||||
|---|---|---|---|---|---|---|---|---|---|---|---|
| |
2010 | 2009 | 2008 | ||||||||
Net income (loss) |
$ | 80,206 | $ | (769,847 | ) | $ | (181,767 | ) | |||
Other comprehensive income: |
|||||||||||
Reclassification of (gains)/losses on available-for-sale securities into earnings upon realization |
(4,206 | ) | 2,727 | 4,967 | |||||||
Reclassification of (gains)/losses on cash flow hedges into earnings upon realization |
(799 | ) | (4,357 | ) | 3,401 | ||||||
Unrealized gains/(losses) on available-for-sale securities |
445 | 6,515 | (5,797 | ) | |||||||
Unrealized gains/(losses) on cash flow hedges |
— | (30 | ) | 2,986 | |||||||
Unrealized gains/(losses) on cumulative translation adjustment |
24 | (416 | ) | (1,554 | ) | ||||||
Comprehensive income (loss) |
$ | 75,670 | $ | (765,408 | ) | $ | (177,764 | ) | |||
Net (income) loss attributable to noncontrolling interests |
(523 | ) | 1,071 | 991 | |||||||
Gain attributable to noncontrolling interests |
— | — | (22,249 | ) | |||||||
Comprehensive income (loss) attributable to iStar Financial Inc. |
$ | 75,147 | $ | (764,337 | ) | $ | (199,022 | ) | |||
Unrealized gains/(losses) on available-for-sale securities, cash flow hedges and foreign currency translation adjustments are recorded as adjustments to shareholders' equity through "Accumulated other comprehensive income" on the Company's Consolidated Balance Sheets and are not included in net
99
iStar Financial Inc.
Notes to Consolidated Financial Statements (Continued)
Note 15—Comprehensive Income (Loss) (Continued)
income unless realized. As of December 31, 2010 and 2009, accumulated other comprehensive income reflected in the Company's shareholders' equity is comprised of the following ($ in thousands):
| |
As of December 31, | ||||||
|---|---|---|---|---|---|---|---|
| |
2010 | 2009 | |||||
Unrealized gains on available-for-sale securities |
$ | 198 | $ | 3,959 | |||
Unrealized gains on cash flow hedges |
3,357 | 4,156 | |||||
Unrealized losses on cumulative translation adjustment |
(1,946 | ) | (1,970 | ) | |||
Accumulated other comprehensive income |
$ | 1,609 | $ | 6,145 | |||
Note 16—Fair Values
Fair value represents the price that would be received to sell an asset or paid to transfer a liability in an orderly transaction between market participants at the measurement date. The following fair value hierarchy prioritizes the inputs to be used in valuation techniques to measure fair value:
Level 1: Unadjusted quoted prices in active markets that are accessible at the measurement date for identical, unrestricted assets or liabilities;
Level 2: Quoted prices in markets that are not active, or inputs which are observable, either directly or indirectly, for substantially the full term of the asset or liability;
Level 3: Prices or valuation techniques that require inputs that are both significant to the fair value measurement and unobservable (i.e., supported by little or no market activity).
Certain of the Company's assets and liabilities are recorded at fair value either on a recurring or non-recurring basis. Assets required to be marked-to-market and reported at fair value every reporting period are classified as being valued on a recurring basis. Other assets not required to be recorded at fair value every period may be recorded at fair value if a specific provision or other impairment is recorded within the period to mark the carrying value of the asset to market as of the reporting date. Such assets are classified as being valued on a non-recurring basis.
100
iStar Financial Inc.
Notes to Consolidated Financial Statements (Continued)
Note 16—Fair Values (Continued)
The following table summarizes the Company's assets and liabilities recorded at fair value on a recurring and non-recurring basis by the above categories ($ in thousands):
| |
|
Fair Value Using | |||||||||||||
|---|---|---|---|---|---|---|---|---|---|---|---|---|---|---|---|
| |
Total | Quoted market prices in active markets (Level 1) |
Significant other observable inputs (Level 2) |
Significant unobservable inputs (Level 3) |
|||||||||||
As of December 31, 2010: |
|||||||||||||||
Recurring basis: |
|||||||||||||||
Financial Assets: |
|||||||||||||||
Marketable securities—equity securities |
$ | 699 | $ | 699 | $ | — | $ | — | |||||||
Financial Liabilities: |
|||||||||||||||
Derivative liabilities |
$ | 223 | $ | — | $ | 223 | $ | — | |||||||
Non-recurring basis: |
|||||||||||||||
Financial Assets: |
|||||||||||||||
Impaired loans |
$ | 616,070 | $ | — | $ | — | $ | 616,070 | |||||||
Impaired equity method investment |
$ | 1,535 | $ | — | $ | — | $ | 1,535 | |||||||
Non-financial Assets: |
|||||||||||||||
Impaired OREO |
$ | 54,141 | $ | — | $ | — | $ | 54,141 | |||||||
As of December 31, 2009: |
|||||||||||||||
Recurring basis: |
|||||||||||||||
Financial Assets: |
|||||||||||||||
Derivative assets |
$ | 800 | $ | — | $ | 800 | $ | — | |||||||
Other lending investments—available-for-sale debt securities |
$ | 6,800 | $ | 6,800 | $ | — | $ | — | |||||||
Marketable securities—trading debt and equity securities |
$ | 38,454 | $ | 254 | $ | 38,200 | $ | — | |||||||
Financial Liabilities: |
|||||||||||||||
Derivative liabilities |
$ | 254 | $ | — | $ | 254 | $ | — | |||||||
Non-recurring basis: |
|||||||||||||||
Financial Assets: |
|||||||||||||||
Impaired loans |
$ | 1,167,498 | $ | — | $ | — | $ | 1,167,498 | |||||||
Non-financial Assets: |
|||||||||||||||
Impaired OREO |
$ | 181,540 | $ | — | $ | — | $ | 181,540 | |||||||
Impaired net lease assets held for sale |
$ | 17,282 | $ | — | $ | — | $ | 17,282 | |||||||
Impaired net lease assets |
$ | 48,000 | $ | — | $ | — | $ | 48,000 | |||||||
In addition to the Company's disclosures regarding assets and liabilities recorded at fair value in the financial statements, it is also required to disclose the estimated fair values of all financial instruments, regardless of whether they are recorded at fair value in the financial statements.
101
iStar Financial Inc.
Notes to Consolidated Financial Statements (Continued)
Note 16—Fair Values (Continued)
The book and estimated fair values of financial instruments were as follows ($ in thousands)(1):
| |
As of December 31, 2010 | As of December 31, 2009 | ||||||||||||
|---|---|---|---|---|---|---|---|---|---|---|---|---|---|---|
| |
Book Value |
Fair Value |
Book Value |
Fair Value |
||||||||||
Financial assets: |
||||||||||||||
Loans and other lending investments, net |
$ | 4,587,352 | $ | 4,256,663 | $ | 7,661,562 | $ | 6,638,840 | ||||||
Financial liabilities: |
||||||||||||||
Debt obligations, net |
$ | 7,345,433 | $ | 6,767,968 | $ | 10,894,903 | $ | 8,115,023 | ||||||
Explanatory Note:
- (1)
- The carrying values of other financial instruments including cash and cash equivalents, restricted cash, accrued interest receivable and accounts payable, approximate the fair values of the instruments. The fair value of other financial instruments, including derivative assets and liabilities and marketable securities are included in the previous table.
Given the nature of certain assets and liabilities, clearly determinable market based valuation inputs are often not available, therefore, these assets and liabilities are valued using internal valuation techniques. Subjectivity exists with respect to these internal valuation techniques, therefore, the fair values disclosed may not ultimately be realized by the Company if the assets were sold or the liabilities were settled with third parties. The methods the Company used to estimate the fair values presented in the two tables are described more fully below for each type of asset and liability.
Derivatives—The Company uses interest rate swaps, interest rate caps and foreign currency derivatives to manage its interest rate and foreign currency risk. The valuation of these instruments is determined using discounted cash flow analysis on the expected cash flows of each derivative. This analysis reflects the contractual terms of the derivatives, including the period to maturity, and uses observable market-based inputs, including interest rate curves, foreign exchange rates, and implied volatilities. The Company incorporates credit valuation adjustments to appropriately reflect both its own non-performance risk and the respective counterparty's non-performance risk in the fair value measurements. In adjusting the fair value of its derivative contracts for the effect of non-performance risk, the Company has considered the impact of netting and any applicable credit enhancements, such as collateral postings, thresholds, mutual puts, and guarantees. The Company has determined that the significant inputs used to value its derivatives fall within Level 2 of the fair value hierarchy.
Securities—All of the Company's available-for-sale and impaired held-to-maturity debt and equity securities are actively traded and have been valued using quoted market prices. The Company's traded marketable securities are valued using market quotes, to the extent they are available, or broker quotes that fall within Level 2 of the fair value hierarchy.
Impaired loans—The Company's loans identified as being impaired are nearly all collateral dependent loans and are evaluated for impairment by comparing the estimated fair value of the underlying collateral, less costs to sell, to the carrying value of each loan. Due to the nature of the individual properties collateralizing the Company's loans, the Company generally uses a discounted cash flow methodology through internally developed valuation models to estimate the fair value of the collateral. This approach requires the Company to make significant judgments in respect to discount rates, capitalization rates and the timing and amounts of estimated future cash flows that are all considered Level 3 inputs. These cash flows generally include property revenues, lot and unit sale prices and velocity, operating costs, and costs of
102
iStar Financial Inc.
Notes to Consolidated Financial Statements (Continued)
Note 16—Fair Values (Continued)
completion. In more limited cases, the Company obtains external "as is" appraisals for loan collateral, generally when third party participations exist, and appraised values may be discounted when real estate markets rapidly deteriorate.
Impaired equity method investments—If the Company determines an equity method investment is other than temporarily impaired it records an impairment charge to adjust the investment to its estimated fair market value. To estimate the fair value of an investment in a fund that invests in real estate, the Company estimates the fair value of the individual properties held within the fund using a discounted cash flow methodology through internally developed valuation models. This approach requires the Company to make significant judgments with respect to discount rates, capitalization rates and the timing and amounts of estimated future cash flows that are all considered Level 3 inputs. These cash flows are primarily based on expected future leasing rates and operating costs.
Impaired OREO assets—If the Company determines an OREO asset is impaired it records an impairment charge to adjust the asset to its estimated fair market value. Due to the nature of the individual properties in the OREO portfolio, the Company uses a discounted cash flow methodology through internally developed valuation models to estimate the fair value of the assets. This approach requires the Company to make significant judgments with respect to discount rates, capitalization rates and the timing and amounts of estimated future cash flows that are all considered Level 3 inputs. These cash flows generally include property revenues, lot and unit sale prices and velocity, operating costs, and costs of completion.
Impaired net lease assets held for sale—The estimated fair value of impaired net lease assets held for sale is determined using observable market information, typically including contracted prices with prospective purchasers.
Impaired net lease assets—If the Company determines a net lease asset is impaired it records an impairment charge to adjust the asset to its estimated fair market value. Due to the nature of the individual properties in the net lease portfolio, the Company generally uses a discounted cash flow methodology through internally developed valuation models to estimate the fair value of the assets. This approach requires the Company to make significant judgments with respect to discount rates, capitalization rates and the timing and amounts of estimated future cash flows that are all considered Level 3 inputs. These cash flows are primarily based on expected future leasing rates and operating costs.
Loans and other lending investments—The Company estimates the fair value of its performing loans and other lending investments using a discounted cash flow methodology. This method discounts estimated future cash flows using rates management determines best reflect current market interest rates that would be offered for loans with similar characteristics and credit quality.
Debt obligations, net—For debt obligations traded in secondary markets, the Company uses market quotes, to the extent they are available to determine fair value. For debt obligations not traded in secondary markets, the Company determines fair value using a discounted cash flow methodology, whereby contractual cash flows are discounted at rates that management determines best reflect current market interest rates that would be charged for debt with similar characteristics and credit quality.
103
iStar Financial Inc.
Notes to Consolidated Financial Statements (Continued)
Note 17—Segment Reporting
The Company has determined that it has three reportable segments based on how management reviews and manages its business. These reportable segments include: Real Estate Lending, Net Leasing and Real Estate Investment. The Real Estate Lending segment includes all of the Company's activities related to senior and mezzanine real estate debt and corporate capital investments. The Net Leasing segment includes all of the Company's activities related to the ownership and leasing of corporate facilities. The Real Estate Investment segment includes all of the Company's activities related to the operations, repositioning and ultimate disposition of distressed REHI and OREO properties.
The Company evaluates performance based on the following financial measures for each segment ($ in thousands):
| |
Real Estate Lending |
Net Leasing |
Real Estate Investment |
Corporate/ Other(1) |
Company Total |
||||||||||||
|---|---|---|---|---|---|---|---|---|---|---|---|---|---|---|---|---|---|
2010 |
|||||||||||||||||
Total revenue(2) |
$ | 377,844 | $ | 171,363 | $ | 23,103 | $ | 2,941 | $ | 575,251 | |||||||
Earnings from equity method investments |
— | 2,522 | — | 49,386 | 51,908 | ||||||||||||
Operating costs |
(10,107 | ) | (15,072 | ) | (64,694 | ) | (12,971 | ) | (102,844 | ) | |||||||
Interest expense |
(192,010 | ) | (45,019 | ) | (45,574 | ) | (33,382 | ) | (315,985 | ) | |||||||
General and administrative(3) |
(28,340 | ) | (11,149 | ) | (6,727 | ) | (43,955 | ) | (90,171 | ) | |||||||
Segment profit (loss)(4) |
$ | 147,387 | $ | 102,645 | $ | (93,892 | ) | $ | (37,981 | ) | $ | 118,159 | |||||
Other significant non-cash items: |
|||||||||||||||||
Provision for loan losses |
$ | 331,487 | $ | — | $ | — | $ | — | $ | 331,487 | |||||||
Impairment of assets |
$ | — | $ | 4,202 | $ | 19,089 | $ | (2,770 | ) | $ | 20,521 | ||||||
Depreciation and amortization |
$ | — | $ | 54,216 | $ | 5,378 | $ | 3,650 | $ | 63,244 | |||||||
Capitalized expenditures |
$ | — | $ | 14,031 | $ | 28,832 | $ | 18 | $ | 42,881 | |||||||
Total assets(5) |
$ | 4,636,777 | $ | 1,915,164 | $ | 1,594,859 | $ | 1,027,714 | $ | 9,174,514 | |||||||
2009(6) |
|||||||||||||||||
Total revenue(2) |
$ | 563,849 | $ | 179,317 | $ | 5,822 | $ | 17,210 | $ | 766,198 | |||||||
Earnings from equity method investments |
— | 2,500 | — | 2,798 | 5,298 | ||||||||||||
Operating costs |
(9,734 | ) | (15,942 | ) | (40,866 | ) | (56,736 | ) | (123,278 | ) | |||||||
Interest expense |
(324,558 | ) | (44,033 | ) | (18,706 | ) | (26,943 | ) | (414,240 | ) | |||||||
General and administrative(3) |
(37,406 | ) | (12,782 | ) | (2,156 | ) | (48,216 | ) | (100,560 | ) | |||||||
Segment profit (loss)(4) |
$ | 192,151 | $ | 109,060 | $ | (55,906 | ) | $ | (111,887 | ) | $ | 133,418 | |||||
Other significant non-cash items: |
|||||||||||||||||
Provision for loan losses |
$ | 1,255,357 | $ | — | $ | — | $ | — | $ | 1,255,357 | |||||||
Impairment of assets |
$ | — | $ | 23,259 | $ | 78,564 | $ | 24,765 | $ | 126,588 | |||||||
Depreciation and amortization |
$ | — | $ | 55,912 | $ | 2,955 | $ | 4,392 | $ | 63,259 | |||||||
Capitalized expenditures |
$ | — | $ | 14,891 | $ | 11,056 | $ | 703 | $ | 26,650 | |||||||
Total assets(5) |
$ | 7,723,280 | $ | 3,149,783 | $ | 1,271,506 | $ | 666,006 | $ | 12,810,575 | |||||||
2008(6) |
|||||||||||||||||
Total revenue(2) |
$ | 1,024,907 | $ | 187,154 | $ | — | $ | 16,983 | $ | 1,229,044 | |||||||
Earnings from equity method investments |
— | 2,520 | — | 4,015 | 6,535 | ||||||||||||
Operating costs |
(5,219 | ) | (15,320 | ) | (9,288 | ) | (19,539 | ) | (49,366 | ) | |||||||
Interest expense |
(464,801 | ) | (99,874 | ) | (11,450 | ) | (42,586 | ) | (618,711 | ) | |||||||
General and administrative(3) |
(44,067 | ) | (14,019 | ) | (1,086 | ) | (55,450 | ) | (114,622 | ) | |||||||
Segment profit (loss)(4) |
$ | 510,820 | $ | 60,461 | $ | (21,824 | ) | $ | (96,577 | ) | $ | 452,880 | |||||
Other significant non-cash items: |
|||||||||||||||||
Provision for loan losses |
$ | 1,029,322 | $ | — | $ | — | $ | — | $ | 1,029,322 | |||||||
Impairment of assets |
$ | 175,257 | $ | 11,261 | $ | 55,633 | $ | 92,383 | $ | 334,534 | |||||||
Depreciation and amortization |
$ | — | $ | 52,702 | $ | — | $ | 7,930 | $ | 60,632 | |||||||
Capitalized expenditures |
$ | — | $ | 102,892 | $ | 20,646 | $ | 4,885 | $ | 128,423 | |||||||
Total assets(5)(7) |
$ | 10,792,559 | $ | 3,330,907 | $ | 245,067 | $ | 928,215 | $ | 15,296,748 | |||||||
Explanatory Notes:
- (1)
- Corporate/Other represents all corporate level and unallocated items including any intercompany eliminations necessary to reconcile to consolidated Company totals. This caption also includes the Company's joint venture investments and strategic investments that are
104
iStar Financial Inc.
Notes to Consolidated Financial Statements (Continued)
Note 17—Segment Reporting (Continued)
not related to any reporting segment, as well as the Company's timber operations, none of which are considered material separate segments.
- (2)
- Total
revenue represents all revenue earned during the period related to the assets in each segment. Revenue from the Real Estate Lending segment primarily
represents interest income, revenue from the Net Leasing segment primarily represents operating lease income and revenue from Real Estate Investment primarily represents operating revenues from REHI
properties.
- (3)
- General
and administrative excludes stock-based compensation expense of $19.4 million, $23.6 million and $23.5 million for the years
ended December 31, 2010, 2009 and 2008, respectively.
- (4)
- The following is a reconciliation of segment profit (loss) to income (loss) from continuing operations ($ in thousands):
| |
For the years ended December 31, | ||||||||||
|---|---|---|---|---|---|---|---|---|---|---|---|
| |
2010 | 2009 | 2008 | ||||||||
Segment profit (loss) |
$ | 118,159 | $ | 133,418 | $ | 452,880 | |||||
Less: Provision for loan losses |
(331,487 | ) | (1,255,357 | ) | (1,029,322 | ) | |||||
Less: Impairment of assets |
(20,521 | ) | (126,588 | ) | (334,534 | ) | |||||
Less: Stock-based compensation expense |
(19,355 | ) | (23,592 | ) | (23,542 | ) | |||||
Less: Depreciation and amortization |
(63,244 | ) | (63,259 | ) | (60,632 | ) | |||||
Add: Gain on early extinguishment of debt, net |
108,923 | 547,349 | 393,131 | ||||||||
Add: Gain on sale of joint venture interest |
— | — | 280,219 | ||||||||
Income (loss) from continuing operations |
$ | (207,525 | ) | $ | (788,029 | ) | $ | (321,800 | ) | ||
- (5)
- Intangible assets included in Net Leasing at December 31, 2010, 2009 and 2008 were $24.5 million, $48.8 million and
$58.5 million, respectively. Intangible assets included in Corporate/Other at December 31, 2009 and 2008 were $1.1 million and $2.7 million, respectively.
- (6)
- Prior
period presentation has been restated to conform with current period presentation.
- (7)
- Goodwill included in Net Leasing at December 31, 2008 was $4.2 million.
Note 18—Quarterly Financial Information (Unaudited)
The following table sets forth the selected quarterly financial data for the Company ($ in thousands, except per share amounts).
| |
For the Quarters Ended | ||||||||||||||
|---|---|---|---|---|---|---|---|---|---|---|---|---|---|---|---|
| |
December 31, | September 30, | June 30, | March 31, | |||||||||||
2010(1): |
|||||||||||||||
Revenue |
$ | 137,107 | $ | 134,371 | $ | 135,404 | $ | 168,369 | |||||||
Net income (loss) |
$ | (58,865 | ) | $ | (74,632 | ) | $ | 229,851 | $ | (16,142 | ) | ||||
Earnings per common share data: |
|||||||||||||||
Net income (loss) attributable to iStar Financial Inc. |
$ | (67,050 | ) | $ | (83,531 | ) | $ | 212,275 | $ | (25,408 | ) | ||||
Basic and diluted earnings per share |
$ | (0.73 | ) | $ | (0.89 | ) | $ | 2.27 | $ | (0.27 | ) | ||||
Weighted average number of common shares—basic and diluted |
92,319 | 93,370 | 93,382 | 93,923 | |||||||||||
Earnings per HPU share data: |
|||||||||||||||
Net income (loss) attributable to iStar Financial Inc. |
$ | (2,061 | ) | $ | (2,539 | ) | $ | 6,452 | $ | (768 | ) | ||||
Basic and diluted earnings per share |
$ | (137.40 | ) | $ | (169.27 | ) | $ | 430.13 | $ | (51.20 | ) | ||||
Weighted average number of HPU shares—basic and diluted |
15 | 15 | 15 | 15 | |||||||||||
2009(2): |
|||||||||||||||
Revenue |
$ | 168,058 | $ | 178,214 | $ | 192,564 | $ | 227,362 | |||||||
Net loss |
$ | (153,359 | ) | $ | (247,442 | ) | $ | (281,973 | ) | $ | (87,072 | ) | |||
105
iStar Financial Inc.
Notes to Consolidated Financial Statements (Continued)
Note 18—Quarterly Financial Information (Unaudited) (Continued)
| |
For the Quarters Ended | ||||||||||||||
|---|---|---|---|---|---|---|---|---|---|---|---|---|---|---|---|
| |
December 31, | September 30, | June 30, | March 31, | |||||||||||
Earnings per common share data: |
|||||||||||||||
Net loss attributable to iStar Financial Inc. |
$ | (159,177 | ) | $ | (251,308 | ) | $ | (284,197 | ) | $ | (93,886 | ) | |||
Basic and diluted earnings per share |
$ | (1.65 | ) | $ | (2.55 | ) | $ | (2.85 | ) | $ | (0.89 | ) | |||
Weighted average number of common shares—basic and diluted |
96,354 | 98,674 | 99,769 | 105,606 | |||||||||||
Earnings per HPU share data: |
|||||||||||||||
Net loss attributable to iStar Financial Inc. |
$ | (4,689 | ) | $ | (7,229 | ) | $ | (8,085 | ) | $ | (2,523 | ) | |||
Basic and diluted earnings per share |
$ | (312.60 | ) | $ | (481.93 | ) | $ | (539.00 | ) | $ | (168.20 | ) | |||
Weighted average number of HPU shares—basic and diluted |
15 | 15 | 15 | 15 | |||||||||||
Explanatory Notes:
- (1)
- During
the quarter ended June 30, 2010, the Company recorded gains from discontinued operations of $250.3 million for the sale of a portfolio
of 32 net lease assets (see Note 5). During the quarter ended December 31, 2010, the Company recorded provision for loan losses of $54.2 million.
- (2)
- During the quarter ended December 31, 2009, the Company recorded provision for loan losses of $216.4 million, impairment of assets of $61.8 million and a net gain on early extinguishment of debt of $100.4 million.
Note 19—Subsequent Events
In January 2011, the Company fully redeemed its $312.3 million remaining principal amount of 10% senior secured notes due June 2014. This redemption fully retired the remaining senior secured notes issued in the Company's May 2009 exchange offer. In connection with this redemption, the Company expects to record a gain on early extinguishment of debt of approximately $109 million in its Consolidated Statement of Operations for the quarter ending March 31, 2011. In addition, the Company repaid the $107.8 million outstanding principal balance of its senior unsecured notes due in March 2011 upon maturity.
In March 2011, the Company entered into a new $2.95 billion senior secured credit agreement comprised of a $1.50 billion term loan facility bearing interest at a rate of LIBOR plus 3.75% and maturing in June 2013 (the "Tranche A-1 Facility") and a $1.45 billion term loan facility bearing interest at a rate of LIBOR plus 5.75% maturing in June 2014 (the "Tranche A-2 Facility"), together the "Facility." Both tranches include a LIBOR floor of 1.25%. Proceeds from the new secured credit Facility were used to fully repay the $1.67 billion and $0.9 billion outstanding under the Company's existing secured credit facilities, which were due to mature in June 2011 and June 2012, respectively. Proceeds were also used to repay $175.0 million of the Company's unsecured credit facilities due in June 2011. The Company expects to use the remaining proceeds to repay unsecured debt maturing in the first half of 2011 as well as for other corporate purposes.
The new secured credit Facility is collateralized by a first lien on a fixed pool of assets consisting of loans, net lease assets and OREO assets with a designated aggregate value of approximately $3.69 billion at the time of closing. The Company is required to maintain collateral coverage of 1.25x outstanding borrowings until the final maturity of the new Facility. Proceeds from principal repayments and sales of collateral will be applied to amortize the new Facility. Proceeds in respect to additional investment amounts and interest, rent, lease payments and fee income will be retained by the Company.
106
iStar Financial Inc.
Notes to Consolidated Financial Statements (Continued)
Note 19—Subsequent Events (Continued)
The Tranche A-1 Facility requires that aggregate cumulative amortization payments of not less than $200.0 million shall be made on or before December 30, 2011, not less than $450.0 million on or before June 30, 2012, not less than $750.0 million on or before December 31, 2012 and not less than $1.50 billion on or before June 28, 2013. The Tranche A-2 Facility will begin amortizing six months after the repayment in full of the Tranche A-1 Facility, such that the not less than $150.0 million of cumulative amortization payments shall be made on or before the six month anniversary of repayment of the A-1 Facility, with additional cumulative amortization payments of $150 million due on or before each six month anniversary thereafter until the Tranche A-2 Facility is fully repaid.
After giving effect to the new Facility and other repayments/redemptions described above, the Company's future scheduled maturities of outstanding long-term debt obligations, net are as follows ($ in thousands):
2011 |
$ | 882,264 | ||
2012 |
2,005,920 | |||
2013 |
1,972,132 | |||
2014 |
1,500,601 | |||
2015 |
105,765 | |||
Thereafter |
534,075 | |||
Total principal maturities |
$ | 7,000,757 | ||
107
iStar Financial Inc.
Schedule II—Valuation and Qualifying Accounts and Reserves
($ in thousands)
Description
|
Balance at Beginning of Period |
Charged to Costs and Expenses |
Adjustments to Valuation Accounts |
Deductions | Balance at End of Period |
||||||||||||
|---|---|---|---|---|---|---|---|---|---|---|---|---|---|---|---|---|---|
For the Year Ended December 31, 2008 |
|||||||||||||||||
Reserve for loan losses(1)(2) |
$ | 217,910 | $ | 1,029,322 | $ | — | $ | (270,444 | ) | $ | 976,788 | ||||||
Allowance for doubtful accounts(2) |
2,407 | 2,928 | — | — | 5,335 | ||||||||||||
Allowance for deferred tax assets(2) |
89 | — | 10,759 | — | 10,848 | ||||||||||||
|
$ | 220,406 | $ | 1,032,250 | $ | 10,759 | $ | (270,444 | ) | $ | 992,971 | ||||||
For the Year Ended December 31, 2009 |
|||||||||||||||||
Reserve for loan losses(1)(2) |
$ | 976,788 | $ | 1,255,357 | $ | — | $ | (814,196 | ) | $ | 1,417,949 | ||||||
Allowance for doubtful accounts(2) |
5,335 | 1,237 | — | (3,784 | ) | 2,788 | |||||||||||
Allowance for deferred tax assets(2) |
10,848 | — | 8,109 | — | $ | 18,957 | |||||||||||
|
$ | 992,971 | $ | 1,256,594 | $ | 8,109 | $ | (817,980 | ) | $ | 1,439,694 | ||||||
For the Year Ended December 31, 2010 |
|||||||||||||||||
Reserve for loan losses(1)(2) |
$ | 1,417,949 | $ | 331,487 | $ | — | $ | (934,811 | ) | $ | 814,625 | ||||||
Allowance for doubtful accounts(2) |
2,788 | 687 | — | (2,099 | ) | 1,376 | |||||||||||
Allowance for deferred tax assets(2) |
18,957 | — | 10,964 | — | 29,921 | ||||||||||||
|
$ | 1,439,694 | $ | 332,174 | $ | 10,964 | $ | (936,910 | ) | $ | 845,922 | ||||||
Explanatory Notes:
- (1)
- See
Note 4 to the Company's Consolidated Financial Statements.
- (2)
- See Note 3 to the Company's Consolidated Financial Statements.
108
iStar Financial, Inc.
Schedule III—Real Estate and Accumulated Depreciation
As of December 31, 2010
($ in thousands)
| |
|
|
|
|
Gross Amount Carried at Close of Period |
|
|
|
|||||||||||||||||||||||
|---|---|---|---|---|---|---|---|---|---|---|---|---|---|---|---|---|---|---|---|---|---|---|---|---|---|---|---|---|---|---|---|
| |
|
Initial Cost to Company | |
|
|
|
|||||||||||||||||||||||||
| |
|
Cost Capitalized Subsequent to Acquisition |
|
|
|
||||||||||||||||||||||||||
State
|
Encumbrances | Land | Building and Improvements |
Land | Building and Improvements |
Total | Accumulated Depreciation |
Date Acquired |
Depreciable Life (Years) |
||||||||||||||||||||||
OFFICE FACILITIES: |
|||||||||||||||||||||||||||||||
Arizona |
$ | — | (1) | $ | 1,512 | $ | 9,732 | $ | 524 | $ | 1,512 | $ | 10,256 | $ | 11,768 | $ | 3,090 | 1999 | 40.0 | ||||||||||||
Arizona |
— | 1,033 | 6,652 | 378 | 1,033 | 7,030 | 8,063 | 2,234 | 1999 | 40.0 | |||||||||||||||||||||
Arizona |
— | 1,033 | 6,652 | 836 | 1,033 | 7,488 | 8,521 | 2,495 | 1999 | 40.0 | |||||||||||||||||||||
Arizona |
— | 1,033 | 6,652 | 2,273 | 1,033 | 8,925 | 9,958 | 3,598 | 1999 | 40.0 | |||||||||||||||||||||
Arizona |
— | 701 | 4,339 | 50 | 701 | 4,389 | 5,090 | 1,255 | 1999 | 40.0 | |||||||||||||||||||||
California |
— | (1) | 4,917 | 2,483 | — | 4,917 | 2,483 | 7,400 | 78 | 2009 | 40.0 | ||||||||||||||||||||
California |
— | 4,139 | 5,064 | 840 | 4,139 | 5,904 | 10,043 | 1,326 | 2002 | 40.0 | |||||||||||||||||||||
Colorado |
— | (1) | 1,757 | 16,930 | 5,072 | 1,757 | 22,002 | 23,759 | 4,939 | 1999 | 40.0 | ||||||||||||||||||||
Colorado |
8,229 | — | 16,752 | 48 | — | 16,800 | 16,800 | 3,675 | 2002 | 40.0 | |||||||||||||||||||||
Florida |
— | (1) | 2,517 | 14,484 | 336 | 2,517 | 14,820 | 17,337 | 185 | 2010 | 40.0 | ||||||||||||||||||||
Georgia |
— | 905 | 6,744 | 485 | 905 | 7,229 | 8,134 | 2,098 | 1999 | 40.0 | |||||||||||||||||||||
Georgia |
— | 5,709 | 49,091 | 13,870 | 5,709 | 62,961 | 68,670 | 18,912 | 1999 | 40.0 | |||||||||||||||||||||
Illinois |
— | 6,153 | 14,993 | (14,985 | ) | 6,153 | 8 | 6,161 | 3 | 1999 | 40.0 | ||||||||||||||||||||
Maryland |
15,155 | 1,800 | 18,706 | 433 | 1,800 | 19,139 | 20,939 | 4,035 | 2002 | 40.0 | |||||||||||||||||||||
Massachusetts |
15,607 | 1,600 | 21,947 | 243 | 1,600 | 22,190 | 23,790 | 4,822 | 2002 | 40.0 | |||||||||||||||||||||
Michigan |
— | 5,374 | 114,956 | 1,228 | 5,374 | 116,184 | 121,558 | 11,314 | 2007 | 40.0 | |||||||||||||||||||||
Minnesota |
4,550 | 4,550 | — | 4,550 | 4,550 | 9,100 | — | 2010 | — | ||||||||||||||||||||||
New Jersey |
54,923 | 7,726 | 74,429 | 10 | 7,724 | 74,441 | 82,165 | 15,003 | 2002 | 40.0 | |||||||||||||||||||||
New Jersey |
12,188 | 1,008 | 13,763 | (81 | ) | 1,008 | 13,682 | 14,690 | 2,357 | 2004 | 40.0 | ||||||||||||||||||||
New Jersey |
21,771 | 2,456 | 28,955 | 306 | 2,456 | 29,261 | 31,717 | 5,014 | 2004 | 40.0 | |||||||||||||||||||||
Pennsylvania |
— | 690 | 26,098 | (49 | ) | 690 | 26,049 | 26,739 | 6,052 | 2001 | 40.0 | ||||||||||||||||||||
Tennessee |
— | 2,702 | 25,129 | 49 | 2,702 | 25,178 | 27,880 | 7,022 | 1999 | 40.0 | |||||||||||||||||||||
Texas |
— | (1) | 1,364 | 10,628 | 8,152 | 2,373 | 17,771 | 20,144 | 6,371 | 1999 | 40.0 | ||||||||||||||||||||
Texas |
— | 1,233 | 15,160 | 607 | 1,233 | 15,767 | 17,000 | 4,527 | 1999 | 40.0 | |||||||||||||||||||||
Texas |
— | 2,932 | 31,235 | 5,059 | 2,932 | 36,294 | 39,226 | 10,415 | 1999 | 40.0 | |||||||||||||||||||||
Texas |
— | (1) | 1,230 | 5,660 | 469 | 1,230 | 6,129 | 7,359 | 1,673 | 1999 | 40.0 | ||||||||||||||||||||
Wisconsin |
— | 1,875 | 13,914 | (61 | ) | 1,875 | 13,853 | 15,728 | 3,813 | 1999 | 40.0 | ||||||||||||||||||||
Subtotal |
127,873 | 67,949 | 565,698 | 26,092 | 68,956 | 590,783 | 659,739 | 126,306 | |||||||||||||||||||||||
INDUSTRIAL FACILITIES: |
|||||||||||||||||||||||||||||||
Arizona |
— | 2,519 | 7,481 | — | 2,519 | 7,481 | 10,000 | 202 | 2009 | 40.0 | |||||||||||||||||||||
Arizona |
— | 3,279 | 5,221 | 707 | 3,279 | 5,928 | 9,207 | 151 | 2009 | 40.0 | |||||||||||||||||||||
California |
— | (1) | 11,635 | 19,515 | 5,943 | 11,635 | 25,458 | 37,093 | 1,952 | 2007 | 40.0 | ||||||||||||||||||||
California |
— | 1,820 | 3,380 | — | 1,820 | 3,380 | 5,200 | — | 2010 | — | |||||||||||||||||||||
California |
— | 741 | 494 | 3 | 741 | 497 | 1,238 | 67 | 2006 | 40.0 | |||||||||||||||||||||
California |
— | 1,343 | 1,669 | 2 | 1,343 | 1,671 | 3,014 | 163 | 2006 | 40.0 | |||||||||||||||||||||
California |
— | 654 | 4,591 | 436 | 654 | 5,027 | 5,681 | 1,316 | 1999 | 40.0 | |||||||||||||||||||||
California |
— | 1,086 | 7,964 | 2,876 | 1,086 | 10,840 | 11,926 | 2,572 | 1999 | 40.0 | |||||||||||||||||||||
California |
— | 4,880 | 12,367 | 3,036 | 4,880 | 15,403 | 20,283 | 3,759 | 1999 | 40.0 | |||||||||||||||||||||
California |
— | 6,857 | 8,378 | 343 | 6,856 | 8,722 | 15,578 | 2,152 | 2002 | 40.0 | |||||||||||||||||||||
California |
— | (1) | 4,095 | 8,323 | 1,586 | 4,095 | 9,909 | 14,004 | 2,553 | 1999 | 40.0 | ||||||||||||||||||||
California |
— | 5,051 | 6,170 | 359 | 5,051 | 6,529 | 11,580 | 1,627 | 2002 | 40.0 | |||||||||||||||||||||
California |
— | 4,119 | 5,034 | 17 | 4,119 | 5,051 | 9,170 | 1,261 | 2002 | 40.0 | |||||||||||||||||||||
California |
— | 3,044 | 3,716 | 1,196 | 3,044 | 4,912 | 7,956 | 1,100 | 2002 | 40.0 | |||||||||||||||||||||
California |
— | 2,633 | 3,219 | 290 | 2,633 | 3,509 | 6,142 | 879 | 2002 | 40.0 | |||||||||||||||||||||
California |
— | 4,600 | 5,627 | 1,840 | 4,600 | 7,467 | 12,067 | 1,602 | 2002 | 40.0 | |||||||||||||||||||||
California |
— | 5,617 | 6,877 | 5,501 | 5,619 | 12,376 | 17,995 | 3,614 | 2002 | 40.0 | |||||||||||||||||||||
California |
— | 15,708 | 27,987 | 5,667 | 15,708 | 33,654 | 49,362 | 11,673 | 2004 | 40.0 | |||||||||||||||||||||
California |
— | 808 | 8,306 | 1,140 | 808 | 9,446 | 10,254 | 2,842 | 1999 | 40.0 | |||||||||||||||||||||
Colorado |
— | 645 | 684 | (8 | ) | 645 | 676 | 1,321 | 72 | 2006 | 40.0 | ||||||||||||||||||||
Florida |
— | 322 | 323 | (5 | ) | 322 | 318 | 640 | 35 | 2006 | 40.0 | ||||||||||||||||||||
Florida |
— | (1) | 3,510 | 20,846 | 8,279 | 3,510 | 29,125 | 32,635 | 1,883 | 2007 | 40.0 | ||||||||||||||||||||
Florida |
— | 2,310 | 5,435 | — | 2,310 | 5,435 | 7,745 | 1,517 | 1999 | 40.0 | |||||||||||||||||||||
Florida |
— | (1) | 3,048 | 8,676 | — | 3,048 | 8,676 | 11,724 | 2,422 | 1999 | 40.0 | ||||||||||||||||||||
Florida |
— | (1) | 1,612 | 4,586 | (1,408 | ) | 1,241 | 3,549 | 4,790 | 355 | 1999 | 40.0 | |||||||||||||||||||
Florida |
— | (1) | 1,476 | 4,198 | (4,497 | ) | 450 | 727 | 1,177 | 178 | 1999 | 40.0 | |||||||||||||||||||
Georgia |
— | (1) | 2,791 | 24,637 | 349 | 2,791 | 24,986 | 27,777 | 1,990 | 2007 | 40.0 | ||||||||||||||||||||
Hawaii |
— | 7,477 | 23,623 | 214 | 7,477 | 23,837 | 31,314 | 543 | 2010 | 40.0 | |||||||||||||||||||||
Illinois |
— | 495 | 605 | — | 495 | 605 | 1,100 | — | 2010 | — | |||||||||||||||||||||
Indiana |
— | (1) | 462 | 9,224 | — | 462 | 9,224 | 9,686 | 1,134 | 2007 | 40.0 | ||||||||||||||||||||
Indiana |
14,122 | 550 | 22,240 | (2,934 | ) | 550 | 19,306 | 19,856 | 5,659 | 2000 | 40.0 | ||||||||||||||||||||
Indiana |
— | 140 | 4,640 | 717 | 140 | 5,357 | 5,497 | 1,630 | 1999 | 40.0 | |||||||||||||||||||||
Massachusetts |
— | (1) | 7,439 | 21,774 | 10,979 | 7,439 | 32,753 | 40,192 | 2,116 | 2007 | 40.0 | ||||||||||||||||||||
Michigan |
— | (1) | 598 | 9,814 | 1 | 598 | 9,815 | 10,413 | 1,219 | 2007 | 40.0 | ||||||||||||||||||||
Minnesota |
— | 403 | 1,147 | (344 | ) | 1,206 | — | 1,206 | — | 1999 | 40.0 | ||||||||||||||||||||
Minnesota |
— | (1) | 6,705 | 17,690 | — | 6,225 | 18,170 | 24,395 | 2,685 | 2005 | 40.0 | ||||||||||||||||||||
109
iStar Financial, Inc.
Schedule III—Real Estate and Accumulated Depreciation (Continued)
As of December 31, 2010
($ in thousands)
| |
|
|
|
|
Gross Amount Carried at Close of Period |
|
|
|
|||||||||||||||||||||||
|---|---|---|---|---|---|---|---|---|---|---|---|---|---|---|---|---|---|---|---|---|---|---|---|---|---|---|---|---|---|---|---|
| |
|
Initial Cost to Company | |
|
|
|
|||||||||||||||||||||||||
| |
|
Cost Capitalized Subsequent to Acquisition |
|
|
|
||||||||||||||||||||||||||
State
|
Encumbrances | Land | Building and Improvements |
Land | Building and Improvements |
Total | Accumulated Depreciation |
Date Acquired |
Depreciable Life (Years) |
||||||||||||||||||||||
North Carolina |
— | 680 | 5,947 | — | 680 | 5,947 | 6,627 | 932 | 2004 | 40.0 | |||||||||||||||||||||
New Jersey |
— | (1) | 8,368 | 15,376 | 21,141 | 8,368 | 36,517 | 44,885 | 2,433 | 2007 | 40.0 | ||||||||||||||||||||
Nevada |
— | 4,137 | 2,963 | — | 4,137 | 2,963 | 7,100 | 385 | 2006 | 40.0 | |||||||||||||||||||||
Nevada |
— | (1) | 248 | 707 | (116 | ) | 248 | 591 | 839 | 193 | 1999 | 40.0 | |||||||||||||||||||
New York |
— | (1) | 1,796 | 5,108 | 4 | 1,796 | 5,112 | 6,908 | 1,428 | 1999 | 40.0 | ||||||||||||||||||||
Texas |
— | 3,213 | 4,105 | 9 | 3,213 | 4,114 | 7,327 | 397 | 2006 | 40.0 | |||||||||||||||||||||
Texas |
— | (1) | 1,631 | 27,858 | (416 | ) | 1,631 | 27,442 | 29,073 | 2,129 | 2007 | 40.0 | |||||||||||||||||||
Texas |
— | (1) | 1,314 | 8,903 | 46 | 1,314 | 8,949 | 10,263 | 2,494 | 1999 | 40.0 | ||||||||||||||||||||
Virginia |
— | (1) | 2,619 | 28,481 | 142 | 2,619 | 28,623 | 31,242 | 2,278 | 2007 | 40.0 | ||||||||||||||||||||
Subtotal |
14,122 | 144,478 | 425,909 | 63,095 | 143,405 | 490,077 | 633,482 | 75,592 | |||||||||||||||||||||||
LAND: |
|||||||||||||||||||||||||||||||
Arizona |
— | 96,700 | — | — | 96,700 | — | 96,700 | — | 2010 | — | |||||||||||||||||||||
California |
— | 5,000 | — | (100 | ) | 4,900 | — | 4,900 | — | 2009 | — | ||||||||||||||||||||
California |
— | (1) | 28,464 | 2,836 | — | 28,464 | 2,836 | 31,300 | 137 | 2010 | — | ||||||||||||||||||||
California |
— | 87,300 | — | 4,386 | 91,686 | — | 91,686 | — | 2009 | — | |||||||||||||||||||||
California |
— | 68,155 | — | (19,155 | ) | 49,000 | — | 49,000 | 1,749 | 2000 | — | ||||||||||||||||||||
California |
— | 84,100 | — | — | 84,100 | — | 84,100 | — | 2010 | — | |||||||||||||||||||||
California |
— | 59,100 | — | 260 | 59,360 | — | 59,360 | — | 2010 | — | |||||||||||||||||||||
Florida |
— | 7,600 | — | — | 7,600 | — | 7,600 | — | 2009 | — | |||||||||||||||||||||
Florida |
— | 8,100 | — | — | 8,100 | — | 8,100 | — | 2009 | — | |||||||||||||||||||||
Florida |
— | 26,600 | — | — | 26,600 | — | 26,600 | — | 2010 | — | |||||||||||||||||||||
Florida |
— | 25,600 | — | — | 25,600 | — | 25,600 | — | 2009 | — | |||||||||||||||||||||
Florida |
— | 9,300 | — | — | 9,300 | — | 9,300 | — | 2010 | — | |||||||||||||||||||||
Hawaii |
— | 14,800 | — | — | 14,800 | — | 14,800 | — | 2010 | — | |||||||||||||||||||||
Maryland |
— | 102,938 | — | — | 102,938 | — | 102,938 | — | 2009 | — | |||||||||||||||||||||
Maryland |
— | (1) | 2,486 | — | — | 2,486 | — | 2,486 | 184 | 1999 | 70.0 | ||||||||||||||||||||
New Jersey |
— | 43,300 | — | 1,305 | 44,605 | — | 44,605 | — | 2009 | — | |||||||||||||||||||||
New Mexico |
— | 20,300 | — | — | 20,300 | — | 20,300 | — | 2010 | — | |||||||||||||||||||||
New York |
— | 52,461 | — | — | 52,461 | — | 52,461 | — | 2009 | — | |||||||||||||||||||||
Texas |
— | (1) | 3,375 | — | — | 3,375 | — | 3,375 | — | 2005 | — | ||||||||||||||||||||
Texas |
— | (1) | 3,621 | — | — | 3,621 | — | 3,621 | — | 2005 | — | ||||||||||||||||||||
Virginia |
— | 72,137 | — | (489 | ) | 71,648 | — | 71,648 | 139 | 2009 | — | ||||||||||||||||||||
Subtotal |
— | 821,437 | 2,836 | (13,793 | ) | 807,644 | 2,836 | 810,480 | 2,209 | ||||||||||||||||||||||
ENTERTAINMENT: |
|||||||||||||||||||||||||||||||
Alabama |
— | (1) | 277 | 359 | — | 277 | 359 | 636 | 61 | 2004 | 40.0 | ||||||||||||||||||||
Alabama |
— | (1) | 319 | 414 | — | 319 | 414 | 733 | 71 | 2004 | 40.0 | ||||||||||||||||||||
Arizona |
— | (1) | 793 | 1,027 | — | 793 | 1,027 | 1,820 | 176 | 2004 | 40.0 | ||||||||||||||||||||
Arizona |
— | (1) | 521 | 673 | — | 521 | 673 | 1,194 | 115 | 2004 | 40.0 | ||||||||||||||||||||
Arizona |
— | (1) | 305 | 394 | — | 305 | 394 | 699 | 67 | 2004 | 40.0 | ||||||||||||||||||||
Arizona |
— | (1) | 630 | 815 | — | 630 | 815 | 1,445 | 140 | 2004 | 40.0 | ||||||||||||||||||||
Arizona |
— | (1) | 590 | 764 | — | 590 | 764 | 1,354 | 131 | 2004 | 40.0 | ||||||||||||||||||||
Arizona |
— | (1) | 476 | 616 | — | 476 | 616 | 1,092 | 105 | 2004 | 40.0 | ||||||||||||||||||||
Arizona |
— | (1) | 654 | 845 | — | 654 | 845 | 1,499 | 145 | 2004 | 40.0 | ||||||||||||||||||||
Arizona |
— | (1) | 666 | 862 | — | 666 | 862 | 1,528 | 147 | 2004 | 40.0 | ||||||||||||||||||||
Arizona |
— | (1) | 460 | 596 | — | 460 | 596 | 1,056 | 102 | 2004 | 40.0 | ||||||||||||||||||||
California |
— | (1) | 1,097 | 1,421 | — | 1,097 | 1,421 | 2,518 | 243 | 2004 | 40.0 | ||||||||||||||||||||
California |
— | (1) | 434 | 560 | — | 434 | 560 | 994 | 96 | 2004 | 40.0 | ||||||||||||||||||||
California |
— | (1) | 332 | 429 | — | 332 | 429 | 761 | 73 | 2004 | 40.0 | ||||||||||||||||||||
California |
— | (1) | 1,642 | 2,124 | — | 1,642 | 2,124 | 3,766 | 363 | 2004 | 40.0 | ||||||||||||||||||||
California |
— | (1) | 676 | 876 | — | 676 | 876 | 1,552 | 150 | 2004 | 40.0 | ||||||||||||||||||||
California |
— | (1) | 720 | 932 | — | 720 | 932 | 1,652 | 160 | 2004 | 40.0 | ||||||||||||||||||||
California |
— | (1) | 574 | 743 | — | 574 | 743 | 1,317 | 127 | 2004 | 40.0 | ||||||||||||||||||||
California |
— | (1) | 392 | 508 | — | 392 | 508 | 900 | 87 | 2004 | 40.0 | ||||||||||||||||||||
California |
— | (1) | 358 | 464 | — | 358 | 464 | 822 | 79 | 2004 | 40.0 | ||||||||||||||||||||
California |
— | (1) | — | 18,000 | — | — | 18,000 | 18,000 | 3,064 | 2003 | 40.0 | ||||||||||||||||||||
California |
— | (1) | 852 | 1,101 | — | 852 | 1,101 | 1,953 | 189 | 2004 | 40.0 | ||||||||||||||||||||
California |
— | (1) | 1,572 | 2,034 | — | 1,572 | 2,034 | 3,606 | 348 | 2004 | 40.0 | ||||||||||||||||||||
California |
— | (1) | — | 1,953 | 25,772 | — | 27,725 | 27,725 | 1,269 | 2008 | 40.0 | ||||||||||||||||||||
California |
— | (1) | 659 | 852 | — | 659 | 852 | 1,511 | 146 | 2004 | 40.0 | ||||||||||||||||||||
California |
— | (1) | 562 | 729 | — | 562 | 729 | 1,291 | 125 | 2004 | 40.0 | ||||||||||||||||||||
California |
— | (1) | 896 | 1,159 | — | 896 | 1,159 | 2,055 | 198 | 2004 | 40.0 | ||||||||||||||||||||
Colorado |
— | (1) | 466 | 602 | — | 466 | 602 | 1,068 | 103 | 2004 | 40.0 | ||||||||||||||||||||
Colorado |
— | (1) | 640 | 827 | — | 640 | 827 | 1,467 | 142 | 2004 | 40.0 | ||||||||||||||||||||
Colorado |
— | (1) | 729 | 944 | — | 729 | 944 | 1,673 | 162 | 2004 | 40.0 | ||||||||||||||||||||
Colorado |
— | (1) | 536 | 694 | — | 536 | 694 | 1,230 | 119 | 2004 | 40.0 | ||||||||||||||||||||
Colorado |
— | (1) | 412 | 533 | — | 412 | 533 | 945 | 91 | 2004 | 40.0 | ||||||||||||||||||||
Colorado |
— | (1) | 901 | 1,165 | — | 901 | 1,165 | 2,066 | 199 | 2004 | 40.0 | ||||||||||||||||||||
Connecticut |
— | (1) | 1,097 | 1,420 | — | 1,097 | 1,420 | 2,517 | 243 | 2004 | 40.0 | ||||||||||||||||||||
Connecticut |
— | (1) | 330 | 426 | — | 330 | 426 | 756 | 73 | 2004 | 40.0 | ||||||||||||||||||||
110
iStar Financial, Inc.
Schedule III—Real Estate and Accumulated Depreciation (Continued)
As of December 31, 2010
($ in thousands)
| |
|
|
|
|
Gross Amount Carried at Close of Period |
|
|
|
|||||||||||||||||||||||
|---|---|---|---|---|---|---|---|---|---|---|---|---|---|---|---|---|---|---|---|---|---|---|---|---|---|---|---|---|---|---|---|
| |
|
Initial Cost to Company | |
|
|
|
|||||||||||||||||||||||||
| |
|
Cost Capitalized Subsequent to Acquisition |
|
|
|
||||||||||||||||||||||||||
State
|
Encumbrances | Land | Building and Improvements |
Land | Building and Improvements |
Total | Accumulated Depreciation |
Date Acquired |
Depreciable Life (Years) |
||||||||||||||||||||||
Delaware |
— | (1) | 1,076 | 1,390 | — | 1,076 | 1,390 | 2,466 | 238 | 2004 | 40.0 | ||||||||||||||||||||
Florida |
— | (1) | — | 41,809 | — | — | 41,809 | 41,809 | 9,023 | 2005 | 27.0 | ||||||||||||||||||||
Florida |
— | (1) | 412 | 531 | — | 412 | 531 | 943 | 91 | 2004 | 40.0 | ||||||||||||||||||||
Florida |
— | (1) | 6,550 | — | 17,118 | 6,533 | 17,135 | 23,668 | 1,567 | 2006 | 40.0 | ||||||||||||||||||||
Florida |
— | (1) | 1,067 | 1,382 | — | 1,067 | 1,382 | 2,449 | 236 | 2004 | 40.0 | ||||||||||||||||||||
Florida |
— | (1) | 340 | 439 | — | 340 | 439 | 779 | 75 | 2004 | 40.0 | ||||||||||||||||||||
Florida |
— | (1) | 401 | 520 | — | 401 | 520 | 921 | 89 | 2004 | 40.0 | ||||||||||||||||||||
Florida |
— | (1) | 507 | 655 | — | 507 | 655 | 1,162 | 112 | 2004 | 40.0 | ||||||||||||||||||||
Florida |
— | (1) | 282 | 364 | — | 282 | 364 | 646 | 62 | 2004 | 40.0 | ||||||||||||||||||||
Florida |
— | (1) | 352 | 455 | — | 352 | 455 | 807 | 78 | 2004 | 40.0 | ||||||||||||||||||||
Florida |
— | (1) | 404 | 524 | — | 404 | 524 | 928 | 90 | 2004 | 40.0 | ||||||||||||||||||||
Florida |
— | (1) | 437 | 567 | — | 437 | 567 | 1,004 | 97 | 2004 | 40.0 | ||||||||||||||||||||
Florida |
— | (1) | 532 | 689 | — | 532 | 689 | 1,221 | 118 | 2004 | 40.0 | ||||||||||||||||||||
Florida |
— | (1) | 379 | 490 | — | 379 | 490 | 869 | 84 | 2004 | 40.0 | ||||||||||||||||||||
Florida |
— | (1) | 486 | 629 | — | 486 | 629 | 1,115 | 108 | 2004 | 40.0 | ||||||||||||||||||||
Florida |
— | (1) | 433 | 561 | — | 433 | 561 | 994 | 96 | 2004 | 40.0 | ||||||||||||||||||||
Florida |
— | (1) | 497 | 643 | — | 497 | 643 | 1,140 | 110 | 2004 | 40.0 | ||||||||||||||||||||
Florida |
— | 360 | 840 | — | 360 | 840 | 1,200 | — | 2010 | — | |||||||||||||||||||||
Florida |
— | (1) | 643 | 833 | — | 643 | 833 | 1,476 | 142 | 2004 | 40.0 | ||||||||||||||||||||
Florida |
— | (1) | 4,200 | 18,272 | — | 4,200 | 18,272 | 22,472 | 2,670 | 2005 | 40.0 | ||||||||||||||||||||
Florida |
— | (1) | 551 | 714 | — | 551 | 714 | 1,265 | 122 | 2004 | 40.0 | ||||||||||||||||||||
Florida |
— | (1) | 364 | 470 | — | 364 | 470 | 834 | 81 | 2004 | 40.0 | ||||||||||||||||||||
Florida |
— | (1) | 507 | 656 | — | 507 | 656 | 1,163 | 112 | 2004 | 40.0 | ||||||||||||||||||||
Florida |
— | (1) | — | 19,337 | — | — | 19,337 | 19,337 | 2,826 | 2005 | 40.0 | ||||||||||||||||||||
Georgia |
— | (1) | 510 | 660 | — | 510 | 660 | 1,170 | 113 | 2004 | 40.0 | ||||||||||||||||||||
Georgia |
— | (1) | 286 | 371 | — | 286 | 371 | 657 | 63 | 2004 | 40.0 | ||||||||||||||||||||
Georgia |
— | (1) | 474 | 613 | — | 474 | 613 | 1,087 | 105 | 2004 | 40.0 | ||||||||||||||||||||
Georgia |
— | (1) | 581 | 752 | — | 581 | 752 | 1,333 | 129 | 2004 | 40.0 | ||||||||||||||||||||
Georgia |
— | (1) | 718 | 930 | — | 718 | 930 | 1,648 | 159 | 2004 | 40.0 | ||||||||||||||||||||
Georgia |
— | (1) | 546 | 706 | — | 546 | 706 | 1,252 | 121 | 2004 | 40.0 | ||||||||||||||||||||
Georgia |
— | (1) | 502 | 651 | — | 502 | 651 | 1,153 | 111 | 2004 | 40.0 | ||||||||||||||||||||
Iowa |
— | (1) | 425 | 551 | — | 425 | 551 | 976 | 94 | 2004 | 40.0 | ||||||||||||||||||||
Illinois |
— | (1) | 335 | 434 | — | 335 | 434 | 769 | 74 | 2004 | 40.0 | ||||||||||||||||||||
Illinois |
— | (1) | 481 | 622 | — | 481 | 622 | 1,103 | 106 | 2004 | 40.0 | ||||||||||||||||||||
Illinois |
— | (1) | 8,803 | 57 | 30,479 | 8,803 | 30,536 | 39,339 | 2,528 | 2006 | 40.0 | ||||||||||||||||||||
Illinois |
— | (1) | 433 | 560 | — | 433 | 560 | 993 | 96 | 2004 | 40.0 | ||||||||||||||||||||
Illinois |
— | (1) | 431 | 557 | — | 431 | 557 | 988 | 95 | 2004 | 40.0 | ||||||||||||||||||||
Indiana |
— | (1) | 542 | 701 | — | 542 | 701 | 1,243 | 120 | 2004 | 40.0 | ||||||||||||||||||||
Kentucky |
— | (1) | 417 | 539 | — | 417 | 539 | 956 | 92 | 2004 | 40.0 | ||||||||||||||||||||
Kentucky |
— | (1) | 365 | 473 | — | 365 | 473 | 838 | 81 | 2004 | 40.0 | ||||||||||||||||||||
Maryland |
— | (1) | 428 | 554 | — | 428 | 554 | 982 | 95 | 2004 | 40.0 | ||||||||||||||||||||
Maryland |
— | (1) | 575 | 745 | — | 575 | 745 | 1,320 | 127 | 2004 | 40.0 | ||||||||||||||||||||
Maryland |
— | (1) | 362 | 468 | — | 362 | 468 | 830 | 80 | 2004 | 40.0 | ||||||||||||||||||||
Maryland |
— | (1) | 884 | 1,145 | — | 884 | 1,145 | 2,029 | 196 | 2004 | 40.0 | ||||||||||||||||||||
Maryland |
— | (1) | 371 | 481 | — | 371 | 481 | 852 | 82 | 2004 | 40.0 | ||||||||||||||||||||
Maryland |
— | (1) | 399 | 518 | — | 399 | 518 | 917 | 88 | 2004 | 40.0 | ||||||||||||||||||||
Maryland |
— | (1) | 649 | 839 | — | 649 | 839 | 1,488 | 144 | 2004 | 40.0 | ||||||||||||||||||||
Maryland |
— | (1) | 366 | 473 | — | 366 | 473 | 839 | 81 | 2004 | 40.0 | ||||||||||||||||||||
Maryland |
— | (1) | 398 | 516 | — | 398 | 516 | 914 | 88 | 2004 | 40.0 | ||||||||||||||||||||
Maryland |
— | (1) | 388 | 505 | — | 388 | 505 | 893 | 86 | 2004 | 40.0 | ||||||||||||||||||||
Maryland |
— | (1) | 1,126 | 1,458 | — | 1,126 | 1,458 | 2,584 | 249 | 2004 | 40.0 | ||||||||||||||||||||
Massachusetts |
— | (1) | 523 | 678 | — | 523 | 678 | 1,201 | 116 | 2004 | 40.0 | ||||||||||||||||||||
Massachusetts |
— | (1) | 548 | 711 | — | 548 | 711 | 1,259 | 122 | 2004 | 40.0 | ||||||||||||||||||||
Massachusetts |
— | (1) | 519 | 672 | — | 519 | 672 | 1,191 | 115 | 2004 | 40.0 | ||||||||||||||||||||
Massachusetts |
— | (1) | 344 | 445 | — | 344 | 445 | 789 | 76 | 2004 | 40.0 | ||||||||||||||||||||
Michigan |
— | (1) | 309 | 400 | — | 309 | 400 | 709 | 68 | 2004 | 40.0 | ||||||||||||||||||||
Michigan |
— | (1) | 516 | 667 | — | 516 | 667 | 1,183 | 114 | 2004 | 40.0 | ||||||||||||||||||||
Michigan |
— | (1) | 554 | 718 | — | 554 | 718 | 1,272 | 123 | 2004 | 40.0 | ||||||||||||||||||||
Michigan |
— | (1) | 387 | 500 | — | 387 | 500 | 887 | 86 | 2004 | 40.0 | ||||||||||||||||||||
Michigan |
— | (1) | 533 | 691 | — | 533 | 691 | 1,224 | 118 | 2004 | 40.0 | ||||||||||||||||||||
Michigan |
— | (1) | 356 | 460 | — | 356 | 460 | 816 | 79 | 2004 | 40.0 | ||||||||||||||||||||
Minnesota |
— | (1) | 666 | 861 | — | 666 | 861 | 1,527 | 147 | 2004 | 40.0 | ||||||||||||||||||||
Minnesota |
— | 2,962 | — | 14,324 | 2,962 | 14,324 | 17,286 | 877 | 2006 | 40.0 | |||||||||||||||||||||
Minnesota |
— | (1) | 359 | 465 | — | 359 | 465 | 824 | 80 | 2004 | 40.0 | ||||||||||||||||||||
Minnesota |
— | 2,437 | 8,715 | — | 2,437 | 8,715 | 11,152 | 895 | 2006 | 40.0 | |||||||||||||||||||||
Missouri |
— | (1) | 334 | 432 | — | 334 | 432 | 766 | 74 | 2004 | 40.0 | ||||||||||||||||||||
Missouri |
— | (1) | 404 | 523 | — | 404 | 523 | 927 | 89 | 2004 | 40.0 | ||||||||||||||||||||
Missouri |
— | (1) | 462 | 597 | — | 462 | 597 | 1,059 | 102 | 2004 | 40.0 | ||||||||||||||||||||
Missouri |
— | (1) | 878 | 1,139 | — | 878 | 1,139 | 2,017 | 195 | 2004 | 40.0 | ||||||||||||||||||||
New Jersey |
— | (1) | 1,560 | 2,019 | — | 1,560 | 2,019 | 3,579 | 345 | 2004 | 40.0 | ||||||||||||||||||||
New Jersey |
— | (1) | 830 | 1,075 | — | 830 | 1,075 | 1,905 | 184 | 2004 | 40.0 | ||||||||||||||||||||
111
iStar Financial, Inc.
Schedule III—Real Estate and Accumulated Depreciation (Continued)
As of December 31, 2010
($ in thousands)
| |
|
|
|
|
Gross Amount Carried at Close of Period |
|
|
|
|||||||||||||||||||||||
|---|---|---|---|---|---|---|---|---|---|---|---|---|---|---|---|---|---|---|---|---|---|---|---|---|---|---|---|---|---|---|---|
| |
|
Initial Cost to Company | |
|
|
|
|||||||||||||||||||||||||
| |
|
Cost Capitalized Subsequent to Acquisition |
|
|
|
||||||||||||||||||||||||||
State
|
Encumbrances | Land | Building and Improvements |
Land | Building and Improvements |
Total | Accumulated Depreciation |
Date Acquired |
Depreciable Life (Years) |
||||||||||||||||||||||
Nevada |
— | (1) | 440 | 569 | — | 440 | 569 | 1,009 | 97 | 2004 | 40.0 | ||||||||||||||||||||
New York |
— | (1) | 603 | 779 | — | 603 | 779 | 1,382 | 133 | 2004 | 40.0 | ||||||||||||||||||||
New York |
— | (1) | 442 | 571 | — | 442 | 571 | 1,013 | 98 | 2004 | 40.0 | ||||||||||||||||||||
New York |
— | (1) | 562 | 728 | — | 562 | 728 | 1,290 | 125 | 2004 | 40.0 | ||||||||||||||||||||
New York |
— | (1) | 385 | 499 | — | 385 | 499 | 884 | 85 | 2004 | 40.0 | ||||||||||||||||||||
New York |
— | (1) | 350 | 453 | — | 350 | 453 | 803 | 78 | 2004 | 40.0 | ||||||||||||||||||||
New York |
— | (1) | 326 | 421 | — | 326 | 421 | 747 | 72 | 2004 | 40.0 | ||||||||||||||||||||
New York |
— | (1) | 494 | 640 | — | 494 | 640 | 1,134 | 110 | 2004 | 40.0 | ||||||||||||||||||||
New York |
— | (1) | 320 | 414 | — | 320 | 414 | 734 | 71 | 2004 | 40.0 | ||||||||||||||||||||
New York |
— | (1) | 399 | 516 | — | 399 | 516 | 915 | 88 | 2004 | 40.0 | ||||||||||||||||||||
New York |
— | (1) | 959 | 1,240 | — | 959 | 1,240 | 2,199 | 212 | 2004 | 40.0 | ||||||||||||||||||||
New York |
— | (1) | 587 | 761 | — | 587 | 761 | 1,348 | 130 | 2004 | 40.0 | ||||||||||||||||||||
New York |
— | (1) | 521 | 675 | — | 521 | 675 | 1,196 | 115 | 2004 | 40.0 | ||||||||||||||||||||
New York |
— | (1) | 711 | 920 | — | 711 | 920 | 1,631 | 157 | 2004 | 40.0 | ||||||||||||||||||||
New York |
— | (1) | 558 | 723 | — | 558 | 723 | 1,281 | 124 | 2004 | 40.0 | ||||||||||||||||||||
New York |
— | (1) | 747 | 967 | — | 747 | 967 | 1,714 | 166 | 2004 | 40.0 | ||||||||||||||||||||
New York |
— | (1) | 683 | 885 | — | 683 | 885 | 1,568 | 151 | 2004 | 40.0 | ||||||||||||||||||||
New York |
— | (1) | 1,492 | 1,933 | — | 1,492 | 1,933 | 3,425 | 331 | 2004 | 40.0 | ||||||||||||||||||||
New York |
— | (1) | 1,471 | 1,904 | — | 1,471 | 1,904 | 3,375 | 326 | 2004 | 40.0 | ||||||||||||||||||||
North Carolina |
— | (1) | 397 | 513 | — | 397 | 513 | 910 | 88 | 2004 | 40.0 | ||||||||||||||||||||
North Carolina |
— | (1) | 476 | 615 | — | 476 | 615 | 1,091 | 105 | 2004 | 40.0 | ||||||||||||||||||||
North Carolina |
— | (1) | 410 | 530 | — | 410 | 530 | 940 | 91 | 2004 | 40.0 | ||||||||||||||||||||
North Carolina |
— | (1) | 402 | 520 | — | 402 | 520 | 922 | 89 | 2004 | 40.0 | ||||||||||||||||||||
North Carolina |
— | (1) | 948 | 1,227 | — | 948 | 1,227 | 2,175 | 210 | 2004 | 40.0 | ||||||||||||||||||||
North Carolina |
— | (1) | 259 | 336 | — | 259 | 336 | 595 | 57 | 2004 | 40.0 | ||||||||||||||||||||
North Carolina |
— | (1) | 349 | 452 | — | 349 | 452 | 801 | 77 | 2004 | 40.0 | ||||||||||||||||||||
North Carolina |
— | (1) | 640 | 828 | — | 640 | 828 | 1,468 | 142 | 2004 | 40.0 | ||||||||||||||||||||
North Carolina |
— | (1) | 409 | 531 | — | 409 | 531 | 940 | 91 | 2004 | 40.0 | ||||||||||||||||||||
North Carolina |
— | (1) | 965 | 1,249 | — | 965 | 1,249 | 2,214 | 214 | 2004 | 40.0 | ||||||||||||||||||||
North Carolina |
— | (1) | 475 | 615 | — | 475 | 615 | 1,090 | 105 | 2004 | 40.0 | ||||||||||||||||||||
North Carolina |
— | (1) | 494 | 638 | — | 494 | 638 | 1,132 | 109 | 2004 | 40.0 | ||||||||||||||||||||
Ohio |
— | (1) | 434 | 562 | — | 434 | 562 | 996 | 96 | 2004 | 40.0 | ||||||||||||||||||||
Ohio |
— | (1) | 967 | 1,252 | — | 967 | 1,252 | 2,219 | 214 | 2004 | 40.0 | ||||||||||||||||||||
Ohio |
— | (1) | 281 | 365 | — | 281 | 365 | 646 | 62 | 2004 | 40.0 | ||||||||||||||||||||
Ohio |
— | (1) | 393 | 508 | — | 393 | 508 | 901 | 87 | 2004 | 40.0 | ||||||||||||||||||||
Oklahoma |
— | (1) | 431 | 557 | — | 431 | 557 | 988 | 95 | 2004 | 40.0 | ||||||||||||||||||||
Oklahoma |
— | (1) | 954 | 1,235 | — | 954 | 1,235 | 2,189 | 211 | 2004 | 40.0 | ||||||||||||||||||||
Oregon |
— | (1) | 373 | 484 | — | 373 | 484 | 857 | 83 | 2004 | 40.0 | ||||||||||||||||||||
Oregon |
— | (1) | 393 | 508 | — | 393 | 508 | 901 | 87 | 2004 | 40.0 | ||||||||||||||||||||
Pennsylvania |
— | (1) | 407 | 527 | — | 407 | 527 | 934 | 90 | 2004 | 40.0 | ||||||||||||||||||||
Pennsylvania |
— | (1) | 421 | 544 | — | 421 | 544 | 965 | 93 | 2004 | 40.0 | ||||||||||||||||||||
Pennsylvania |
— | (1) | 409 | 528 | — | 409 | 528 | 937 | 90 | 2004 | 40.0 | ||||||||||||||||||||
Pennsylvania |
— | (1) | 407 | 527 | — | 407 | 527 | 934 | 90 | 2004 | 40.0 | ||||||||||||||||||||
Puerto Rico |
— | (1) | 950 | 1,230 | — | 950 | 1,230 | 2,180 | 210 | 2004 | 40.0 | ||||||||||||||||||||
Rhode Island |
— | (1) | 850 | 1,100 | — | 850 | 1,100 | 1,950 | 188 | 2004 | 40.0 | ||||||||||||||||||||
South Carolina |
— | (1) | 943 | 1,220 | — | 943 | 1,220 | 2,163 | 209 | 2004 | 40.0 | ||||||||||||||||||||
South Carolina |
— | (1) | 332 | 429 | — | 332 | 429 | 761 | 73 | 2004 | 40.0 | ||||||||||||||||||||
South Carolina |
— | (1) | 924 | 1,196 | — | 924 | 1,196 | 2,120 | 205 | 2004 | 40.0 | ||||||||||||||||||||
Tennessee |
— | (1) | 260 | 338 | — | 260 | 338 | 598 | 58 | 2004 | 40.0 | ||||||||||||||||||||
Texas |
— | (1) | 1,045 | 1,353 | — | 1,045 | 1,353 | 2,398 | 232 | 2004 | 40.0 | ||||||||||||||||||||
Texas |
— | (1) | 593 | 767 | — | 593 | 767 | 1,360 | 131 | 2004 | 40.0 | ||||||||||||||||||||
Texas |
— | (1) | 985 | 1,276 | — | 985 | 1,276 | 2,261 | 218 | 2004 | 40.0 | ||||||||||||||||||||
Texas |
— | (1) | 838 | 1,083 | — | 838 | 1,083 | 1,921 | 185 | 2004 | 40.0 | ||||||||||||||||||||
Texas |
— | (1) | 528 | 682 | — | 528 | 682 | 1,210 | 117 | 2004 | 40.0 | ||||||||||||||||||||
Texas |
— | (1) | 480 | 622 | — | 480 | 622 | 1,102 | 106 | 2004 | 40.0 | ||||||||||||||||||||
Texas |
— | (1) | 975 | 1,261 | — | 975 | 1,261 | 2,236 | 216 | 2004 | 40.0 | ||||||||||||||||||||
Texas |
— | (1) | 1,108 | 1,433 | — | 1,108 | 1,433 | 2,541 | 245 | 2004 | 40.0 | ||||||||||||||||||||
Texas |
— | (1) | 425 | 549 | — | 425 | 549 | 974 | 94 | 2004 | 40.0 | ||||||||||||||||||||
Texas |
— | (1) | 518 | 671 | — | 518 | 671 | 1,189 | 115 | 2004 | 40.0 | ||||||||||||||||||||
Texas |
— | (1) | 758 | 981 | — | 758 | 981 | 1,739 | 168 | 2004 | 40.0 | ||||||||||||||||||||
Texas |
— | (1) | 399 | 517 | — | 399 | 517 | 916 | 88 | 2004 | 40.0 | ||||||||||||||||||||
Texas |
— | (1) | 375 | 485 | — | 375 | 485 | 860 | 83 | 2004 | 40.0 | ||||||||||||||||||||
Texas |
— | (1) | 438 | 567 | — | 438 | 567 | 1,005 | 97 | 2004 | 40.0 | ||||||||||||||||||||
Texas |
— | (1) | 285 | 369 | — | 285 | 369 | 654 | 63 | 2004 | 40.0 | ||||||||||||||||||||
Texas |
— | (1) | 554 | 718 | — | 554 | 718 | 1,272 | 123 | 2004 | 40.0 | ||||||||||||||||||||
Texas |
— | (1) | 561 | 726 | — | 561 | 726 | 1,287 | 124 | 2004 | 40.0 | ||||||||||||||||||||
Texas |
— | (1) | 753 | 976 | — | 753 | 976 | 1,729 | 167 | 2004 | 40.0 | ||||||||||||||||||||
Texas |
— | (1) | 521 | 675 | — | 521 | 675 | 1,196 | 115 | 2004 | 40.0 | ||||||||||||||||||||
Texas |
— | (1) | 634 | 821 | — | 634 | 821 | 1,455 | 140 | 2004 | 40.0 | ||||||||||||||||||||
Texas |
— | (1) | 379 | 491 | — | 379 | 491 | 870 | 84 | 2004 | 40.0 | ||||||||||||||||||||
Texas |
— | (1) | 592 | 766 | — | 592 | 766 | 1,358 | 131 | 2004 | 40.0 | ||||||||||||||||||||
Utah |
— | (1) | 624 | 808 | — | 624 | 808 | 1,432 | 138 | 2004 | 40.0 | ||||||||||||||||||||
112
iStar Financial, Inc.
Schedule III—Real Estate and Accumulated Depreciation (Continued)
As of December 31, 2010
($ in thousands)
| |
|
|
|
|
Gross Amount Carried at Close of Period |
|
|
|
|||||||||||||||||||||||
|---|---|---|---|---|---|---|---|---|---|---|---|---|---|---|---|---|---|---|---|---|---|---|---|---|---|---|---|---|---|---|---|
| |
|
Initial Cost to Company | |
|
|
|
|||||||||||||||||||||||||
| |
|
Cost Capitalized Subsequent to Acquisition |
|
|
|
||||||||||||||||||||||||||
State
|
Encumbrances | Land | Building and Improvements |
Land | Building and Improvements |
Total | Accumulated Depreciation |
Date Acquired |
Depreciable Life (Years) |
||||||||||||||||||||||
Virginia |
— | (1) | 1,134 | 1,467 | — | 1,134 | 1,467 | 2,601 | 251 | 2004 | 40.0 | ||||||||||||||||||||
Virginia |
— | (1) | 845 | 1,094 | — | 845 | 1,094 | 1,939 | 187 | 2004 | 40.0 | ||||||||||||||||||||
Virginia |
— | (1) | 884 | 1,145 | — | 884 | 1,145 | 2,029 | 196 | 2004 | 40.0 | ||||||||||||||||||||
Virginia |
— | (1) | 953 | 1,233 | — | 953 | 1,233 | 2,186 | 211 | 2004 | 40.0 | ||||||||||||||||||||
Virginia |
— | (1) | 487 | 632 | — | 487 | 632 | 1,119 | 108 | 2004 | 40.0 | ||||||||||||||||||||
Virginia |
— | (1) | 425 | 550 | — | 425 | 550 | 975 | 94 | 2004 | 40.0 | ||||||||||||||||||||
Virginia |
— | (1) | 1,151 | 1,490 | — | 1,151 | 1,490 | 2,641 | 255 | 2004 | 40.0 | ||||||||||||||||||||
Virginia |
— | (1) | 546 | 707 | — | 546 | 707 | 1,253 | 121 | 2004 | 40.0 | ||||||||||||||||||||
Virginia |
— | (1) | 851 | 1,103 | — | 851 | 1,103 | 1,954 | 189 | 2004 | 40.0 | ||||||||||||||||||||
Virginia |
— | (1) | 819 | 1,061 | — | 819 | 1,061 | 1,880 | 182 | 2004 | 40.0 | ||||||||||||||||||||
Virginia |
— | (1) | 958 | 1,240 | — | 958 | 1,240 | 2,198 | 212 | 2004 | 40.0 | ||||||||||||||||||||
Virginia |
— | (1) | 788 | 1,020 | — | 788 | 1,020 | 1,808 | 175 | 2004 | 40.0 | ||||||||||||||||||||
Virginia |
— | (1) | 554 | 716 | — | 554 | 716 | 1,270 | 123 | 2004 | 40.0 | ||||||||||||||||||||
Washington |
— | (1) | 1,500 | 6,500 | — | 1,500 | 6,500 | 8,000 | 1,362 | 2003 | 40.0 | ||||||||||||||||||||
Wisconsin |
— | (1) | 521 | 673 | — | 521 | 673 | 1,194 | 115 | 2004 | 40.0 | ||||||||||||||||||||
Wisconsin |
— | (1) | 413 | 535 | — | 413 | 535 | 948 | 92 | 2004 | 40.0 | ||||||||||||||||||||
Wisconsin |
— | (1) | 542 | 702 | — | 542 | 702 | 1,244 | 120 | 2004 | 40.0 | ||||||||||||||||||||
Wisconsin |
— | (1) | 793 | 1,025 | — | 793 | 1,025 | 1,818 | 175 | 2004 | 40.0 | ||||||||||||||||||||
Wisconsin |
— | (1) | 1,124 | 1,455 | — | 1,124 | 1,455 | 2,579 | 249 | 2004 | 40.0 | ||||||||||||||||||||
Subtotal |
— | 137,683 | 258,985 | 87,693 | 137,666 | 346,695 | 484,361 | 50,629 | |||||||||||||||||||||||
RETAIL: |
|||||||||||||||||||||||||||||||
Alabama |
— | 2,377 | 3,978 | 69 | 2,408 | 4,016 | 6,424 | 663 | 2004 | 39.0 | |||||||||||||||||||||
Arizona |
20,303 | 8,374 | 5,394 | 23,038 | 8,223 | 28,583 | 36,806 | 4,062 | 2004 | 36.5 | |||||||||||||||||||||
Arizona |
8,121 | 3,284 | 8,258 | (36 | ) | 3,274 | 8,232 | 11,506 | 1,317 | 2004 | 40.0 | ||||||||||||||||||||
Arizona |
— | 2,625 | 4,875 | (500 | ) | 2,625 | 4,375 | 7,000 | — | 2009 | — | ||||||||||||||||||||
Arizona |
— | 2,184 | 4,056 | (1,588 | ) | 2,184 | 2,468 | 4,652 | — | 2009 | — | ||||||||||||||||||||
Arizona |
— | 756 | 1,404 | (552 | ) | 756 | 852 | 1,608 | — | 2009 | — | ||||||||||||||||||||
Arizona |
9,887 | 6,232 | 9,271 | 3,470 | 6,219 | 12,754 | 18,973 | 1,957 | 2004 | 40.0 | |||||||||||||||||||||
California |
— | 2,569 | 3,031 | — | 2,569 | 3,031 | 5,600 | 85 | 2010 | 40.0 | |||||||||||||||||||||
California |
— | 3,100 | — | — | 3,100 | — | 3,100 | — | 2010 | — | |||||||||||||||||||||
Colorado |
— | 2,631 | 279 | 5,195 | 2,607 | 5,498 | 8,105 | 516 | 2006 | 40.0 | |||||||||||||||||||||
Florida |
— | 3,230 | 6,865 | (1,495 | ) | 2,752 | 5,848 | 8,600 | — | 2008 | — | ||||||||||||||||||||
Florida |
— | 2,182 | 4,638 | — | 2,182 | 4,638 | 6,820 | — | 2009 | — | |||||||||||||||||||||
Florida |
— | 3,950 | — | 10,285 | 3,908 | 10,327 | 14,235 | 1,145 | 2005 | 40.0 | |||||||||||||||||||||
Hawaii |
— | 3,393 | 21,306 | 1,602 | 3,393 | 22,908 | 26,301 | 886 | 2009 | 40.0 | |||||||||||||||||||||
Illinois |
— | — | 18,700 | 41 | — | 18,741 | 18,741 | 327 | 2010 | 40.0 | |||||||||||||||||||||
Louisiana |
— | 2,193 | 3,654 | 64 | 2,221 | 3,690 | 5,911 | 625 | 2004 | 38.0 | |||||||||||||||||||||
New Hampshire |
— | (1) | 3,848 | 3,909 | (89 | ) | 3,798 | 3,870 | 7,668 | 698 | 2006 | 27.5 | |||||||||||||||||||
New Jersey |
9,917 | — | 18,003 | (19 | ) | — | 17,984 | 17,984 | 1,648 | 2007 | 40.0 | ||||||||||||||||||||
New Mexico |
— | 1,733 | — | 8,370 | 1,705 | 8,398 | 10,103 | 896 | 2005 | 40.0 | |||||||||||||||||||||
New Mexico |
— | 756 | 905 | 422 | 762 | 1,321 | 2,083 | 216 | 2005 | 28.0 | |||||||||||||||||||||
New Mexico |
— | 4,178 | 8,528 | (22 | ) | 4,338 | 8,346 | 12,684 | 1,314 | 2005 | 38.0 | ||||||||||||||||||||
New York |
— | 731 | 6,073 | 699 | 711 | 6,792 | 7,503 | 978 | 2005 | 40.0 | |||||||||||||||||||||
New York |
— | 1,760 | 3,740 | (1,200 | ) | 1,376 | 2,924 | 4,300 | — | 2009 | — | ||||||||||||||||||||
New York |
— | 482 | 1,024 | (355 | ) | 482 | 669 | 1,151 | — | 2009 | — | ||||||||||||||||||||
New York |
— | 198 | 420 | — | 198 | 420 | 618 | — | 2009 | — | |||||||||||||||||||||
South Carolina |
— | 2,126 | 948 | (790 | ) | 1,337 | 947 | 2,284 | 87 | 2007 | 40.0 | ||||||||||||||||||||
Texas |
— | 3,538 | 4,215 | 171 | 3,514 | 4,410 | 7,924 | 702 | 2005 | 40.0 | |||||||||||||||||||||
Texas |
— | 1,225 | 2,275 | — | 1,225 | 2,275 | 3,500 | — | 2010 | — | |||||||||||||||||||||
Texas |
— | 630 | 1,170 | — | 630 | 1,170 | 1,800 | — | 2010 | — | |||||||||||||||||||||
Texas |
— | 420 | 780 | — | 420 | 780 | 1,200 | — | 2010 | — | |||||||||||||||||||||
Utah |
— | 3,502 | — | 5,975 | 3,502 | 5,975 | 9,477 | 649 | 2005 | 40.0 | |||||||||||||||||||||
Subtotal |
48,228 | 74,207 | 147,699 | 52,755 | 72,419 | 202,242 | 274,661 | 18,771 | |||||||||||||||||||||||
HOTEL: |
|||||||||||||||||||||||||||||||
California |
— | 1,281 | 9,809 | (469 | ) | 1,281 | 9,340 | 10,621 | 2,991 | 1998 | 40.0 | ||||||||||||||||||||
California |
— | 4,394 | 27,030 | (1,328 | ) | 4,394 | 25,702 | 30,096 | 8,472 | 1998 | 40.0 | ||||||||||||||||||||
California |
— | 3,308 | 20,623 | (1,012 | ) | 3,308 | 19,611 | 22,919 | 6,454 | 1998 | 40.0 | ||||||||||||||||||||
Colorado |
— | 1,242 | 7,865 | (385 | ) | 1,242 | 7,480 | 8,722 | 2,458 | 1998 | 40.0 | ||||||||||||||||||||
Hawaii |
— | 4,567 | 39,815 | 174 | 4,567 | 39,989 | 44,556 | 1,499 | 2009 | 40.0 | |||||||||||||||||||||
Hawaii |
— | 3,000 | 12,000 | — | 3,000 | 12,000 | 15,000 | — | 2009 | — | |||||||||||||||||||||
Idaho |
— | 968 | 6,405 | (312 | ) | 968 | 6,093 | 7,061 | 1,987 | 1998 | 40.0 | ||||||||||||||||||||
Montana |
— | 210 | 1,607 | (77 | ) | 210 | 1,530 | 1,740 | 492 | 1998 | 40.0 | ||||||||||||||||||||
Oregon |
— | 233 | 1,726 | (83 | ) | 233 | 1,643 | 1,876 | 528 | 1998 | 40.0 | ||||||||||||||||||||
Oregon |
— | 404 | 3,049 | (146 | ) | 404 | 2,903 | 3,307 | 932 | 1998 | 40.0 | ||||||||||||||||||||
Oregon |
— | 361 | 2,721 | (131 | ) | 361 | 2,590 | 2,951 | 833 | 1998 | 40.0 | ||||||||||||||||||||
Oregon |
— | 609 | 4,668 | (223 | ) | 609 | 4,445 | 5,054 | 1,423 | 1998 | 40.0 | ||||||||||||||||||||
Oregon |
— | 556 | 4,245 | (203 | ) | 556 | 4,042 | 4,598 | 1,294 | 1998 | 40.0 | ||||||||||||||||||||
Utah |
— | 5,620 | 32,695 | (1,619 | ) | 5,620 | 31,076 | 36,696 | 10,330 | 1998 | 40.0 | ||||||||||||||||||||
113
iStar Financial, Inc.
Schedule III—Real Estate and Accumulated Depreciation (Continued)
As of December 31, 2010
($ in thousands)
| |
|
|
|
|
Gross Amount Carried at Close of Period |
|
|
|
|||||||||||||||||||||||
|---|---|---|---|---|---|---|---|---|---|---|---|---|---|---|---|---|---|---|---|---|---|---|---|---|---|---|---|---|---|---|---|
| |
|
Initial Cost to Company | |
|
|
|
|||||||||||||||||||||||||
| |
|
Cost Capitalized Subsequent to Acquisition |
|
|
|
||||||||||||||||||||||||||
State
|
Encumbrances | Land | Building and Improvements |
Land | Building and Improvements |
Total | Accumulated Depreciation |
Date Acquired |
Depreciable Life (Years) |
||||||||||||||||||||||
Washington |
— | 502 | 3,779 | (181 | ) | 502 | 3,598 | 4,100 | 1,154 | 1998 | 40.0 | ||||||||||||||||||||
Washington |
— | 507 | 3,981 | (190 | ) | 507 | 3,791 | 4,298 | 1,211 | 1998 | 40.0 | ||||||||||||||||||||
Washington |
— | 513 | 3,825 | (183 | ) | 513 | 3,642 | 4,155 | 1,170 | 1998 | 40.0 | ||||||||||||||||||||
Washington |
— | 5,101 | 32,080 | (1,571 | ) | 5,101 | 30,509 | 35,610 | 10,024 | 1998 | 40.0 | ||||||||||||||||||||
Subtotal |
— | 33,376 | 217,923 | (7,939 | ) | 33,376 | 209,984 | 243,360 | 53,252 | ||||||||||||||||||||||
APARTMENT/RESIDENTIAL: |
|||||||||||||||||||||||||||||||
Arizona |
— | 4,480 | 17,920 | (5,978 | ) | 4,480 | 11,942 | 16,422 | — | 2010 | — | ||||||||||||||||||||
Arizona |
— | (1) | 1,626 | 11,174 | (1,300 | ) | 1,561 | 9,939 | 11,500 | 276 | 2009 | — | |||||||||||||||||||
California |
— | (1) | 7,333 | 29,333 | 1,909 | 7,333 | 31,242 | 38,575 | — | 2009 | — | ||||||||||||||||||||
California |
— | 10,078 | 40,312 | (22,392 | ) | 5,600 | 22,398 | 27,998 | — | 2007 | — | ||||||||||||||||||||
Florida |
— | 2,394 | 24,206 | (10,816 | ) | 2,394 | 13,390 | 15,784 | — | 2009 | — | ||||||||||||||||||||
Florida |
— | 6,540 | 15,260 | 165 | 6,540 | 15,425 | 21,965 | — | 2010 | — | |||||||||||||||||||||
Hawaii |
— | 8,080 | 12,120 | (5,445 | ) | 8,080 | 6,675 | 14,755 | — | 2010 | — | ||||||||||||||||||||
Hawaii |
— | 4,430 | 18,170 | (6,884 | ) | 2,364 | 13,352 | 15,716 | — | 2009 | — | ||||||||||||||||||||
Hawaii |
— | 3,483 | 9,417 | (1,200 | ) | 3,123 | 8,577 | 11,700 | — | 2009 | — | ||||||||||||||||||||
Idaho |
— | 2,275 | 15,925 | (3,108 | ) | 2,275 | 12,817 | 15,092 | — | 2009 | — | ||||||||||||||||||||
Nevada |
— | 18,117 | 106,829 | (43,437 | ) | 11,819 | 69,690 | 81,509 | — | 2009 | — | ||||||||||||||||||||
New Jersey |
— | (1) | 36,405 | 64,720 | (30,194 | ) | 25,536 | 45,395 | 70,931 | — | 2009 | — | |||||||||||||||||||
New York |
— | (1) | — | 114,400 | 922 | — | 115,322 | 115,322 | — | 2009 | — | ||||||||||||||||||||
Washington |
— | 2,342 | 44,478 | (15,931 | ) | 1,545 | 29,344 | 30,889 | — | 2009 | — | ||||||||||||||||||||
Subtotal |
— | 107,583 | 524,264 | (143,689 | ) | 82,650 | 405,508 | 488,158 | 276 | ||||||||||||||||||||||
MIXED USE: |
|||||||||||||||||||||||||||||||
California |
— | 5,870 | 629 | 1 | 5,870 | 630 | 6,500 | 12 | 2010 | 40.0 | |||||||||||||||||||||
Florida |
— | 8,450 | 13,251 | 182 | 8,450 | 13,433 | 21,883 | 3,415 | 2008 | 40.0 | |||||||||||||||||||||
Georgia |
— | 13,820 | 55,280 | 3,035 | 13,820 | 58,315 | 72,135 | — | 2010 | — | |||||||||||||||||||||
Subtotal |
— | 28,140 | 69,160 | 3,218 | 28,140 | 72,378 | 100,518 | 3,427 | |||||||||||||||||||||||
Total |
190,223 | 1,414,853 | 2,212,474 | 67,432 | 1,374,256 | 2,320,503 | 3,694,759 | 330,462 | |||||||||||||||||||||||
Explanatory Note:
- (1)
- Consists of properties pledged as collateral under the Company's secured indebtedness with a total book value of $1.04 billion.
114
iStar Financial, Inc.
Schedule III—Real Estate and Accumulated Depreciation (Continued)
($ in thousands)
1. Reconciliation of Real Estate:
The following table reconciles Real Estate from January 1, 2008 to December 31, 2010:
| |
2010 | 2009 | 2008 | |||||||
|---|---|---|---|---|---|---|---|---|---|---|
Balance at January 1 |
$ | 4,690,096 | $ | 3,498,067 | $ | 3,726,882 | ||||
Improvements and additions |
109,479 | 29,145 | 172,520 | |||||||
Acquisitions through foreclosure |
773,315 | 1,340,255 | — | |||||||
Dispositions |
(1,858,527 | ) | (71,843 | ) | (401,335 | ) | ||||
Impairments |
(19,604 | ) | (105,528 | ) | — | |||||
Balance at December 31 |
$ | 3,694,759 | $ | 4,690,096 | $ | 3,498,067 | ||||
2. Reconciliation of Accumulated Depreciation:
The following table reconciles Accumulated Depreciation from January 1, 2008 to December 31, 2010:
| |
2010 | 2009 | 2008 | |||||||
|---|---|---|---|---|---|---|---|---|---|---|
Balance at January 1 |
$ | (525,113 | ) | $ | (453,256 | ) | $ | (417,015 | ) | |
Additions |
(75,019 | ) | (82,082 | ) | (76,967 | ) | ||||
Dispositions |
269,670 | 10,225 | 40,726 | |||||||
Balance at December 31 |
$ | (330,462 | ) | $ | (525,113 | ) | $ | (453,256 | ) | |
115
iStar Financial Inc.
Schedule IV—Mortgage Loans on Real Estate
As of December 31, 2010
($ in thousands)
Type of Loan/Borrower
|
Underlying Property Type | Contractual Interest Accrual Rates |
Contractual Interest Payment Rates |
Effective Maturity Dates |
Periodic Payment Terms |
Prior Liens |
Face Amount of Mortgages |
Carrying Amount of Mortgages(1)(2) |
||||||||||||||
|---|---|---|---|---|---|---|---|---|---|---|---|---|---|---|---|---|---|---|---|---|---|---|
Senior Mortgages: |
||||||||||||||||||||||
Borrower A |
Apartment/Residential | LIBOR + 3.5% | LIBOR + 3.5% | November 2011 | IO | $ | — | $ | 179,589 | $ | 180,745 | |||||||||||
Borrower B |
Apartment/Residential | 9% | 0% | September 2010(3) | IO | — | 193,721 | 159,200 | ||||||||||||||
Borrower C |
Apartment/Residential | LIBOR + 4%(4) | LIBOR + 4%(4) | December 2012 | IO | — | 139,039 | 139,344 | ||||||||||||||
Senior mortgages individually <3% |
Apartment/Residential, Retail, Land, | Fixed: 4% to 23% | Fixed: 2.5% to 20% | 2011 to 2024 | ||||||||||||||||||
|
Industrial/R&D, Mixed Use/Mixed | Variable: | Variable: | |||||||||||||||||||
|
Collateral, Office, Hotel, | LIBOR + 2.5% to | LIBOR + 0.5% to | |||||||||||||||||||
|
Entertainment/Leisure, Other | LIBOR + 10% | LIBOR + 10% | 3,859,971 | 3,227,533 | |||||||||||||||||
|
4,372,320 | 3,706,822 | ||||||||||||||||||||
Subordinate Mortgages: |
||||||||||||||||||||||
Subordinate mortgages individually <3% |
Apartment/Residential, Retail, Mixed | Fixed: 5% to 14% | Fixed: 6.5% to 10.5% | 2011 to 2018 | ||||||||||||||||||
|
Use/Mixed Collateral, Office, Hotel, | Variable: | Variable: | |||||||||||||||||||
|
Entertainment/Leisure, Other | LIBOR + 2.5% to | LIBOR + 2.5% to | |||||||||||||||||||
|
LIBOR + 6% | LIBOR + 6% | 323,387 | 305,245 | ||||||||||||||||||
|
323,387 | 305,245 | ||||||||||||||||||||
Total mortgages |
$ | 4,695,707 | $ | 4,012,067 | ||||||||||||||||||
Explanatory Notes:
- (1)
- Amounts
are presented net of asset-specific reserves of $683.9 million on impaired loans. Impairment is measured using the estimated fair value of
collateral, less costs to sell.
- (2)
- The
carrying amount of mortgages approximated the federal income tax basis.
- (3)
- Loan
is in default with $193.7 million of principal that is more than 90 days delinquent. Loan is designated as non-performing and is on
non-accrual status.
- (4)
- As of December 31, 2010, includes a LIBOR interest rate floor of 4%.
116
iStar Financial Inc.
Schedule IV—Mortgage Loans on Real Estate (Continued)
($ in thousands)
1. Reconciliation of Mortgage Loans on Real Estate:
The following table reconciles Mortgage Loans on Real Estate from January 1, 2008 to December 31, 2010(1):
| |
2010 | 2009 | 2008 | ||||||||
|---|---|---|---|---|---|---|---|---|---|---|---|
Balance at January 1 |
$ | 6,662,379 | $ | 9,088,331 | $ | 8,926,910 | |||||
Additions: |
|||||||||||
New mortgage loans |
— | — | 11,206 | ||||||||
Additions under existing mortgage loans |
326,093 | 1,212,299 | 3,097,205 | ||||||||
Other(2) |
48,493 | 107,922 | 122,330 | ||||||||
Deductions(3): |
|||||||||||
Collections of principal |
(2,004,129 | ) | (1,329,083 | ) | (1,847,603 | ) | |||||
Provision for loan losses |
(291,905 | ) | (1,114,606 | ) | (906,445 | ) | |||||
Transfers to REHI, net and OREO |
(728,559 | ) | (1,300,058 | ) | (314,271 | ) | |||||
Amortization of premium |
(305 | ) | (2,426 | ) | (1,001 | ) | |||||
Balance at December 31 |
$ | 4,012,067 | $ | 6,662,379 | $ | 9,088,331 | |||||
Explanatory Notes:
- (1)
- Balances
represent the carrying value of loans, which are net of asset specific reserves.
- (2)
- Amount
includes amortization of discount, deferred interest capitalized and mark-to-market adjustments resulting from changes in
foreign exchange rates.
- (3)
- Amounts are presented net of charge-offs of $804.7 million, $680.4 million and $223.5 million for the years ended December 31, 2010, 2009 and 2008, respectively.
117
Item 9. Changes in and Disagreements with Registered Public Accounting Firm on Accounting and Financial Disclosure
None.
Item 9a. Controls and Procedures
Evaluation of Disclosure Controls and Procedures—The Company has established and maintains disclosure controls and procedures that are designed to ensure that information required to be disclosed in the Company's Exchange Act reports is recorded, processed, summarized and reported within the time periods specified in the SEC's rules and forms, and that such information is accumulated and communicated to the Company's management, including its Chief Executive Officer and Chief Financial Officer, as appropriate, to allow timely decisions regarding required disclosure. The Company has formed a disclosure committee that is responsible for considering the materiality of information and determining the disclosure obligations of the Company on a timely basis. The disclosure committee reports directly to the Company's Chief Executive Officer and Chief Financial Officer. The Chief Financial Officer is currently a member of the disclosure committee.
Based upon their evaluation as of December 31, 2010, the Chief Executive Officer and Chief Financial Officer concluded that the Company's disclosure controls and procedures (as such term is defined in Rules 13a-15(e) under the Securities and Exchange Act of 1934, as amended (the "Exchange Act")) are effective.
Management's Report on Internal Control Over Financial Reporting—Management is responsible for establishing and maintaining adequate internal control over financial reporting, as defined in Exchange Act Rule 13a-15(f). Under the supervision and with the participation of the disclosure committee and other members of management, including the Chief Executive Officer and Chief Financial Officer, management carried out its evaluation of the effectiveness of the Company's internal control over financial reporting based on the framework in Internal Control—Integrated Framework issued by the Committee of Sponsoring Organizations of the Treadway Commission.
Based on management's assessment under the framework in Internal Control—Integrated Framework, management has concluded that its internal control over financial reporting was effective as of December 31, 2010.
The Company's internal control over financial reporting as of December 31, 2010, has been audited by PricewaterhouseCoopers LLP, an independent registered public accounting firm, as stated in their report which appears on page 53.
Changes in Internal Controls Over Financial Reporting—There have been no changes during the last fiscal quarter in the Company's internal controls identified in connection with the evaluation required by paragraph (d) of Exchange Act Rules 13a-15 or 15d-15 that have materially affected, or are reasonably likely to materially affect, the Company's internal control over financial reporting.
None.
118
Item 10. Directors, Executive Officers and Corporate Governance of the Registrant
Portions of the Company's definitive proxy statement for the 2011 annual meeting of shareholders to be filed within 120 days after the close of the Company's fiscal year are incorporated herein by reference.
Item 11. Executive Compensation
Portions of the Company's definitive proxy statement for the 2011 annual meeting of shareholders to be filed within 120 days after the close of the Company's fiscal year are incorporated herein by reference.
Item 12. Security Ownership of Certain Beneficial Owners and Management and Related Stockholder Matters
Portions of the Company's definitive proxy statement for the 2011 annual meeting of shareholders to be filed within 120 days after the close of the Company's fiscal year are incorporated herein by reference.
Item 13. Certain Relationships, Related Transactions and Director Independence
Portions of the Company's definitive proxy statement for the 2011 annual meeting of shareholders to be filed within 120 days after the close of the Company's fiscal year are incorporated herein by reference.
Item 14. Principal Registered Public Accounting Firm Fees and Services
Portions of the Company's definitive proxy statement for the 2011 annual meeting of shareholders to be filed within 120 days after the close of the Company's fiscal year are incorporated herein by reference.
Item 15. Exhibits, Financial Statement Schedules and Reports on Form 8-K
- (a)
- and
(c) Financial statements and schedules—see Index to Financial Statements and Schedules included in Item 8.
- (b)
- Exhibits—see index on following page.
119
| Exhibit Number | Document Description | ||
|---|---|---|---|
| 3.1 | Amended and Restated Charter of the Company (including the Articles Supplementary for the Series A, B, C and D Preferred Stock, all of which has been redeemed other than the Series D Preferred Stock).(2) | ||
3.2 |
Bylaws of the Company.(3) |
||
3.3 |
Articles Supplementary for High Performance Common Stock—Series 1.(5) |
||
3.4 |
Articles Supplementary for High Performance Common Stock—Series 2.(5) |
||
3.5 |
Articles Supplementary for High Performance Common Stock—Series 3.(5) |
||
3.6 |
Articles Supplementary relating to Series E Preferred Stock.(6) |
||
3.7 |
Articles Supplementary relating to Series F Preferred Stock.(7) |
||
3.8 |
Articles Supplementary relating to Series G Preferred Stock.(8) |
||
3.9 |
Articles Supplementary relating to Series I Preferred Stock.(11) |
||
4.1 |
Form of 77/8% Series E Cumulative Redeemable Preferred Stock Certificate.(6) |
||
4.2 |
Form of 7.8% Series F Cumulative Redeemable Preferred Stock Certificate.(7) |
||
4.3 |
Form of 7.65% Series G Cumulative Redeemable Preferred Stock Certificate.(8) |
||
4.4 |
Form of 7.50% Series I Cumulative Redeemable Preferred Stock Certificate.(11) |
||
4.5 |
Form of Stock Certificate for the Company's Common Stock.(1) |
||
4.6 |
Form of Global Note evidencing 10.00% Second-Priority Senior Secured Guaranteed Notes due 2014 issued on May 8, 2009.(38) |
||
4.7 |
Form of Global Note evidencing 5.50% Senior Notes due 2012 issued on March 9, 2007.(31) |
||
4.8 |
Form of Global Note evidencing 5.85% Senior Notes due 2017 issued on March 9, 2007.(31) |
||
4.9 |
Form of Global Note evidencing 5.95% Senior Notes due 2013 issued on September 22, 2006.(25) |
||
4.10 |
Form of Global Note evidencing 5.65% Senior Notes due 2011 issued on February 21, 2006.(24) |
||
4.11 |
Form of Global Note evidencing 5.875% Senior Notes due 2016 issued on February 21, 2006.(24) |
||
4.12 |
Form of Global Note evidencing 5.80% Senior Notes due 2011 issued on December 14, 2005.(21) |
||
4.13 |
Form of Global Note evidencing 6.05% Senior Notes due 2015 issued on April 21, 2005.(20) |
||
4.14 |
Form of Global Note evidencing 5.15% Senior Notes due 2012 issued on March 1, 2005.(18) |
||
4.15 |
Form of Global Note evidencing 5.125% Notes due 2011 issued on March 30, 2004.(16) |
||
4.16 |
Form of Global Note evidencing 5.70% Notes due 2014 issued on March 9, 2004 and March 1, 2005 in connection with the Company's exchange offer for TriNet Corporate Realty Trust, Inc.'s 7.70% Notes due 2017.(16) |
||
120
| Exhibit Number | Document Description | ||
|---|---|---|---|
| 4.17 | Form of Global Note evidencing 6.50% Senior Notes due 2013 issued on December 12, 2003.(9) | ||
4.18 |
Form of Global Note evidencing 8.625% Senior Notes due 2013 issued on May 21, 2008.(35) |
||
4.19 |
Fourth Supplemental Indenture, dated as of December 12, 2003.(23) |
||
4.20 |
Fifth Supplemental Indenture, dated as of March 1, 2005.(23) |
||
4.21 |
Eighth Supplemental Indenture, dated as of April 21, 2005.(23) |
||
4.22 |
Ninth Supplemental Indenture, dated as of December 14, 2005.(23) |
||
4.23 |
Eleventh Supplemental Indenture, dated as of February 21, 2006.(24) |
||
4.24 |
Twelfth Supplemental Indenture, dated as of February 21, 2006.(24) |
||
4.25 |
Fifteenth Supplemental Indenture (containing amendments to the 6.50% Notes due 2013), dated as of January 9, 2007.(28) |
||
4.26 |
First Supplemental Indenture (containing amendments to the 5.125% Notes due 2011), dated as of January 9, 2007.(28) |
||
4.27 |
First Supplemental Indenture (containing amendments to the 5.70% Notes due 2014), dated as of January 9, 2007.(28) |
||
4.28 |
Sixteenth Supplemental Indenture, dated as of March 9, 2007, governing the 5.50% Senior Notes due 2012.(30) |
||
4.29 |
Seventeenth Supplemental Indenture, dated as of March 9, 2007, governing the 5.85% Senior Notes due 2017.(30) |
||
4.30 |
Nineteenth Supplemental Indenture, dated as of October 15, 2007, governing the Convertible Senior Floating Rate Notes due 2012.(33) |
||
4.31 |
Twentieth Supplemental Indenture, dated as of May 21, 2008, governing the 8.625% Senior Notes due 2013.(35) |
||
4.32 |
Base Indenture, dated as of February 5, 2001, between the Company and State Street Bank and Trust Company.(4) |
||
4.33 |
Indenture, dated March 9, 2004, governing the 5.70% Senior Notes due 2014.(13) |
||
4.34 |
Indenture, dated March 30, 2004, governing the 5.125% Senior Notes due 2011.(15) |
||
4.35 |
Indenture, dated September 22, 2006, governing the 5.95% Senior Notes due 2013.(25) |
||
4.36 |
Indenture, dated May 8, 2009, by and between the Company, each of the Guarantors (as defined therein) and U.S. Bank National Association, as trustee, governing the 10.0% Second-Priority Senior Secured Guaranteed Notes due 2014.(38) |
||
10.1 |
iStar Financial Inc. 2009 Long Term Incentive Compensation Plan.(26) |
||
10.2 |
Amended and Restated Master Agreement, dated January 9, 2006, between iStar DB Seller, LLC, Seller (as defined therein) and Deutsche Bank AG, Cayman Islands Branch, Buyer.(22) |
||
10.3 |
Performance Retention Grant Agreement, dated February 11, 2004.(10) |
||
10.4 |
Purchase Agreement, dated February 14, 2005, among the Company, Oak Hill Advisors, L.P. and the other parties named therein.(19) |
||
121
| Exhibit Number | Document Description | ||
|---|---|---|---|
| 10.5 | Amended and Restated Employment Agreement, dated January 19, 2005, by and between Falcon Financial Investment Trust and Vernon B. Schwartz.(17) | ||
10.6 |
Amended and Restated Revolving Credit Agreement, dated June 28, 2006, among the Company and JPMorgan Chase Bank, N.A., as administrative agent, and Bank of America, N.A., as syndication agent.(27) |
||
10.7 |
2006 Amendment and Commitment Transfer Agreement, dated as of March 13, 2009, among the Company and Bank of America N.A., as syndication agent, JPMorgan Chase Bank, N.A., as administrative agent, and the bank lenders named therein.(39) |
||
10.8 |
2007 Amendment and Commitment Transfer Agreement, dated as of March 13, 2009, among the Company and Bank of America, N.A., as syndication agent, JPMorgan Chase Bank, N.A., as administrative agent, and the bank lenders named therein.(39) |
||
10.9 |
Non-Employee Directors' Deferral Plan.(12) |
||
10.10 |
Form of Restricted Stock Unit Award Agreement.(29) |
||
10.11 |
Form of Restricted Stock Unit Award Agreement (Performance-Based Vesting).(34) |
||
10.12 |
$1,695,000,000 Second Priority Credit Agreement, dated as of March 13, 2009, among the Company and JPMorgan Chase Bank, N.A., as administrative agent, Bank of America, N.A. and Citicorp North America, Inc., as syndication agents, J.P. Morgan Securities Inc., Banc of America Securities LLC and Citigroup Global Markets Inc., as joint lead arrangers and joint bookrunners, and the bank lenders named therein.(39) |
||
10.13 |
$950,000,000 Second Priority Credit Agreement, dated as of March 13, 2009, among the Company and JPMorgan Chase Bank, N.A., as administrative agent, Bank of America, N.A. and Citicorp North America, Inc., as syndication agents, J.P. Morgan Securities Inc., Banc of America Securities LLC and Citigroup Global Markets Inc., as joint lead arrangers and joint bookrunners, and the bank lenders named therein.(39) |
||
10.14 |
$1,200,000,000 Revolving Credit Agreement, dated as of June 26, 2007, among the Company and JPMorgan Chase Bank, N.A., as administrative agent, and Bank of America, N.A., as syndication agent.(32) |
||
10.15 |
First Amendment, dated as of June 26, 2007, to the Credit Agreement, dated as of June 28, 2006, among the Company and JPMorgan Chase Bank, N.A., as administrative agent, and Bank of America, N.A., as syndication agent.(32) |
||
10.16 |
Collateral Trust and Intercreditor Agreement, dated March 13, 2009, by and among the Company, iStar Tara Holdings LLC, iStar Tara LLC, each of the other Grantors (as defined therein), JPMorgan Chase Bank, N.A. and The Bank of New York Mellon Trust Company, N.A.(36) |
||
10.17 |
Registration Rights Agreement, dated May 8, 2009, by and among the Company, each of the Guarantors (as defined therein), Banc of America Securities LLC, Citigroup Global Markets Inc. and J.P. Morgan Securities Inc.(37) |
||
10.18 |
Purchase and Sale Agreement, dated May 3, 2010, by and among the Company, the entities set forth therein and TRT Acquisitions LLC.(40) |
||
10.19 |
First Amendment to Purchase and Sale Agreement, dated May 11, 2010, by and among the Company, the entities set forth therein and TRT Acquisitions LLC.(40) |
||
122
| Exhibit Number | Document Description | ||
|---|---|---|---|
| 10.20 | Second Amendment to Purchase and Sale Agreement, dated May 21, 2010, by and among the Company, the entities set forth therein and TRT Acquisitions LLC.(40) | ||
10.21 |
Third Amendment to Purchase and Sale Agreement, dated June 24, 2010, by and among the Company, the entities set forth therein and TRT Acquisitions LLC.(40) |
||
10.22 |
Fourth Amendment to Purchase and Sale Agreement, dated June 25, 2010, by and among the Company, the entities set forth therein and TRT Acquisitions LLC.(40) |
||
10.23 |
Member Interest Purchase and Sale Agreement, dated May 3, 2010, by and among the Company, iStar Harborside LLC and TRT Acquisitions LLC.(40) |
||
10.24 |
Partnership Interests Purchase and Sale Agreement, dated June 25, 2010, by and among the Company, iStar NG Inc., iStar NG GenPar Inc. and TRT Acquisitions LLC.(40) |
||
10.25 |
Member Interest Purchase and Sale Agreement, dated June 25, 2010, by and among the Company, iStar CTL Holdco LLC and TRT Acquisitions LLC.(40) |
||
12.1 |
Computation of Ratio of Earnings to fixed charges and Earnings to fixed charges and preferred stock dividends. |
||
12.2 |
Computation of Ratio of Adjusted EBITDA to interest expense and preferred dividends. |
||
14.0 |
iStar Financial Inc. Code of Conduct.(16) |
||
21.1 |
Subsidiaries of the Company. |
||
23.1 |
Consent of PricewaterhouseCoopers LLP. |
||
31.0 |
Certifications pursuant to Section 302 of the Sarbanes-Oxley Act. |
||
32.0 |
Certifications pursuant to Section 906 of the Sarbanes-Oxley Act. |
||
Explanatory Notes:
- (1)
- Incorporated
by reference from the Company's Annual Report on Form 10-K for the year ended December 31, 1999 filed on
March 30, 2000.
- (2)
- Incorporated
by reference from the Company's Quarterly Report on Form 10-Q for the quarter ended March 31, 2000 filed on
May 15, 2000.
- (3)
- Incorporated
by reference from the Company's Quarterly Report on Form 10-Q for the quarter ended June 30, 2000 filed on
August 14, 2000.
- (4)
- Incorporated
by reference from the Company's Form S-3 filed on February 12, 2001.
- (5)
- Incorporated
by reference from the Company's Quarterly Report on Form 10-Q for the quarter ended September 30, 2002 filed on
November 14, 2002.
- (6)
- Incorporated
by reference from the Company's Current Report on Form 8-A filed on July 8, 2003.
- (7)
- Incorporated
by reference from the Company's Current Report on Form 8-A filed on September 25, 2003.
- (8)
- Incorporated
by reference from the Company's Current Report on Form 8-A filed on December 10, 2003.
- (9)
- Incorporated
by reference from the Company's Current Report on Form 8-K filed on December 12, 2003.
- (10)
- Incorporated
by reference from the Company's Annual Report on Form 10-K for the year ended December 31, 2003 filed on
March 15, 2004.
- (11)
- Incorporated
by reference from the Company's Current Report on Form 8-A filed on February 27, 2004.
- (12)
- Incorporated
by reference from the Company's DEF14A filed on April 28, 2004.
- (13)
- Incorporated by reference from the Company's Form S-4 filed on May 21, 2004.
123
- (14)
- Incorporated
by reference from the Company's Form S-4 filed on May 25, 2004.
- (15)
- Incorporated
by reference from the Company's Form S-4 filed on June 9, 2004.
- (16)
- Incorporated
by reference from the Company's Annual Report on Form 10-K for the year ended December 31, 2004 filed on
March 16, 2005.
- (17)
- Incorporated
by reference from Falcon Financial Investment Trust's Form 8-K filed on January 24, 2005.
- (18)
- Incorporated
by reference from the Company's Current Report on Form 8-K filed on March 1, 2005.
- (19)
- Incorporated
by reference from the Company's Quarterly Report on Form 10-Q for the period ended March 31, 2005 filed on
May 10, 2005.
- (20)
- Incorporated
by reference from the Company's Current Report on Form 8-K filed on April 20, 2005.
- (21)
- Incorporated
by reference from the Company's Current Report on Form 8-K filed on December 20, 2005.
- (22)
- Incorporated
by reference from the Company's Current Report on Form 8-K filed on January 10, 2006.
- (23)
- Incorporated
by reference from the Company's Annual Report on Form 10-K for the year ended December 31, 2005 filed on
March 16, 2006.
- (24)
- Incorporated
by reference from the Company's Current Report on Form 8-K filed on February 24, 2006.
- (25)
- Incorporated
by reference from the Company's Quarterly Report on Form 10-Q for the quarter ended September 30, 2006 filed on
November 8, 2006.
- (26)
- Incorporated
by reference from the Company's Definitive Proxy Statement filed on April 27, 2009.
- (27)
- Incorporated
by reference from the Company's Quarterly Report on Form 10-Q for the quarter ended June 30, 2006 filed on
August 8, 2006.
- (28)
- Incorporated
by reference from the Company's Current Report on Form 8-K filed on January 16, 2007.
- (29)
- Incorporated
by reference from the Company's Current Report on Form 8-K filed on January 25, 2007.
- (30)
- Incorporated
by reference from the Company's Current Report on Form 8-K filed on March 15, 2007.
- (31)
- Incorporated
by reference from the Company's Quarterly Report on Form 10-Q for the quarter ended March 31, 2007 filed on
May 9, 2007.
- (32)
- Incorporated
by reference from the Company's Current Report on Form 8-K filed on July 2, 2007.
- (33)
- Incorporated
by reference from the Company's Current Report on Form 8-K filed on October 19, 2007.
- (34)
- Incorporated
by reference from the Company's Quarterly Report on Form 10-Q for the quarter ended March 31, 2008 filed on
May 9, 2008.
- (35)
- Incorporated
by reference from the Company's Current Report on Form 8-K filed on May 27, 2008.
- (36)
- Incorporated
by reference from the Company's Quarterly Report on Form 10-Q for the quarter ended June 30, 2009 filed on
August 10, 2009.
- (37)
- Incorporated
by reference from the Company's Current Report on Form 8-K filed on May 8, 2009.
- (38)
- Incorporated
by reference from the Company's Quarterly Report on Form 10-Q for the quarter ended March 31, 2009 filed on
May 8, 2009.
- (39)
- Incorporated
by reference from the Company's Current Report on Form 8-K filed on March 19, 2009.
- (40)
- Incorporated by reference from the Company's Quarterly Report on Form 10-Q for the quarter ended June 30, 2010 filed on August 6, 2010.
124
Pursuant to the requirements of Section 13 or 15(d) of the Securities Exchange Act of 1934, as amended, the Registrant has duly caused this report to be signed on its behalf by the undersigned, thereunto duly authorized.
| iSTAR FINANCIAL INC. Registrant |
||
Date: March 23, 2011 |
/s/ JAY SUGARMAN Jay Sugarman Chairman of the Board of Directors and Chief Executive Officer (Principal executive officer) |
|
Date: March 23, 2011 |
/s/ DAVID DISTASO David DiStaso Chief Financial Officer (Principal financial and accounting officer) |
Pursuant to the requirements of the Securities Exchange Act of 1934, as amended, this report has been signed below by the following persons on behalf of the registrant and in the capacities and on the dates indicated.
Date: March 23, 2011 |
/s/ JAY SUGARMAN Jay Sugarman Chairman of the Board of Directors Chief Executive Officer |
|
Date: March 23, 2011 |
/s/ GLENN R. AUGUST Glenn R. August Director |
|
Date: March 23, 2011 |
/s/ ROBERT W. HOLMAN, JR. Robert W. Holman, Jr. Director |
|
Date: March 23, 2011 |
/s/ ROBIN JOSEPHS Robin Josephs Director |
|
Date: March 23, 2011 |
/s/ JOHN G. MCDONALD John G. McDonald Director |
|
Date: March 23, 2011 |
/s/ GEORGE R. PUSKAR George R. Puskar Director |
|
Date: March 23, 2011 |
/s/ DALE A. REISS Dale A. Reiss Director |
|
Date: March 23, 2011 |
/s/ JEFFREY A. WEBER Jeffrey A. Weber Director |
125