Attached files
| file | filename |
|---|---|
| EX-99.1 - EXHIBIT 99.1 - ASSOCIATED BANC-CORP | asb12312016ex-991.htm |
| 8-K - FORM 8-K - ASSOCIATED BANC-CORP | asb-12312016form8xkpr.htm |
FOURTH QUARTER 2016
EARNINGS PRESENTATION
JANUARY 19, 2017
Exhibit 99.2

FORWARD-LOOKING STATEMENTS
Important note regarding forward-looking statements:
Statements made in this presentation which are not purely historical are forward-looking statements, as
defined in the Private Securities Litigation Reform Act of 1995. This includes any statements regarding
management’s plans, objectives, or goals for future operations, products or services, and forecasts of its
revenues, earnings, or other measures of performance. Such forward-looking statements may be
identified by the use of words such as “believe,” “expect,” “anticipate,” “plan,” “estimate,” “should,” “will,”
“intend,” “outlook” or similar expressions. Forward-looking statements are based on current management
expectations and, by their nature, are subject to risks and uncertainties. Actual results may differ
materially from those contained in the forward-looking statements. Factors which may cause actual
results to differ materially from those contained in such forward-looking statements include those
identified in the Company’s most recent Form 10-K and subsequent SEC filings. Such factors are
incorporated herein by reference.
1

2016 HIGHLIGHTS
Balance
Sheet
Management
Loans reached $20 billion at year
end; full year margin of 2.80%
Average loans were up
$1.4 billion, or 8% from 2015
Average deposits were up
$1.1 billion, or 6% from 2015
Fee
Businesses
Capital markets increased
significantly year over year
Mortgage banking increased
18% year over year
Insurance commissions increased
7% year over year
Expense
Management
Efficiency ratio improved for the
fifth consecutive year
Expenses in-line with guidance,
excluding severance
Capital
Management
Return on average common equity
Tier 1 (CET1) of 9.9%
Dividend payout ratio of 35%
CET1 ratio of 9.5% at year end
2
Growing
Revenues
Stabilizing
Margin
Improving
Efficiency
Expanding
Bottom Line
2016: Net income available to common equity of $191 million, or $1.26 per common share
4Q 2016: Net income available to common equity of $52 million, or $0.34 per common share

($148)
($82)
($19)
$76
$218
$233
$502
$618
$1.8 $1.6 $1.5 $1.5 $1.4
$4.4 $4.6 $4.9 $5.5
$6.2
$3.4 $3.7
$4.0
$4.2
$4.7
$5.1
$5.8
$6.5
$7.0
$7.4
2012 2013 2014 2015 2016
Home equity & Other consumer Residential mortgage
Commercial real estate Commercial & business
CRE Investor
18%
Construction
6%
Commercial &
business
38%
Residential
mortgage
31%
Home equity
5%
Other
consumer
2%
LOAN PORTFOLIO – ANNUAL TRENDS
$19.7
$16.8
$18.3
$15.7
$14.7
Average Net Loan Change (from 2015)
Loan Mix – 2016 (Average)
Average Annual Loans
($ in billions)
($ in millions)
Total
Commercial
& Business
+5%
Home equity & Other consumer
Commercial real estate
Residential mortgage
Power & Utilities
Mortgage warehouse
REIT
General commercial
Oil and Gas
3

CRE Investor
18%
Construction
7%
Commercial &
business
37%
Residential
mortgage
31%
Home equity
5%
Other
consumer
2%
($ in millions)
$1.4 $1.4 $1.4 $1.4 $1.3
$5.8 $5.9 $6.1 $6.3 $6.3
$4.4 $4.5 $4.7
$4.9 $4.9
$6.9 $7.1
$7.5 $7.6 $7.4
4Q 2015 1Q 2016 2Q 2016 3Q 2016 4Q 2016
Home equity & Other consumer Residential mortgage
Commercial real estate Commercial & business
($202)
($57)
($26)
($18)
$44
$59
$61
$63
LOAN PORTFOLIO – QUARTERLY TRENDS
Average Net Loan Change (from 3Q 2016)
Loan Mix – 4Q 2016 (Average)
Average Quarterly Loans
$18.5
Total
Commercial
& Business
-2%
$18.9
$19.6 $20.1
Home equity & Other consumer
Commercial real estate
Residential mortgage
Power & Utilities
Mortgage warehouse
REIT
($ in billions)
General commercial
Oil and Gas
$20.0
4
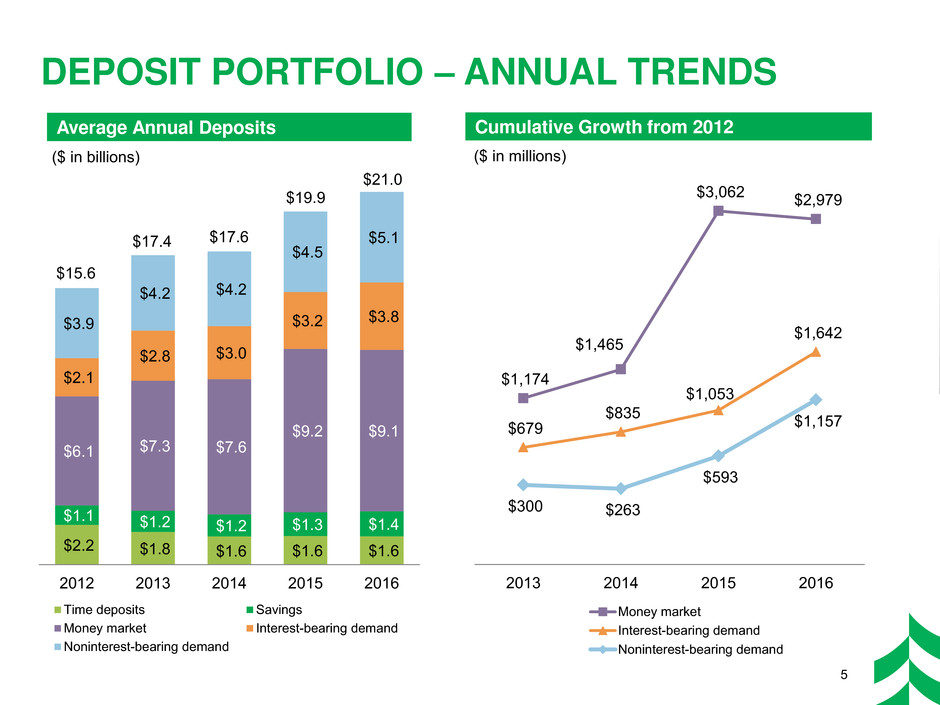
$2.2 $1.8 $1.6 $1.6 $1.6
$1.1 $1.2 $1.2 $1.3 $1.4
$6.1 $7.3 $7.6
$9.2 $9.1
$2.1
$2.8 $3.0
$3.2 $3.8 $3.9
$4.2 $4.2
$4.5
$5.1
2012 2013 2014 2015 2016
Time deposits Savings
Money market Interest-bearing demand
Noninterest-bearing demand
DEPOSIT PORTFOLIO – ANNUAL TRENDS
Cumulative Growth from 2012 Average Annual Deposits
($ in billions)
$21.0
5
$19.9
$1,174
$1,465
$3,062 $2,979
$679
$835
$1,053
$1,642
$300 $263
$593
$1,157
2013 2014 2015 2016
Money market
Interest-bearing demand
Noninterest-bearing demand
($ in millions)
$17.6 $17.4
$15.6
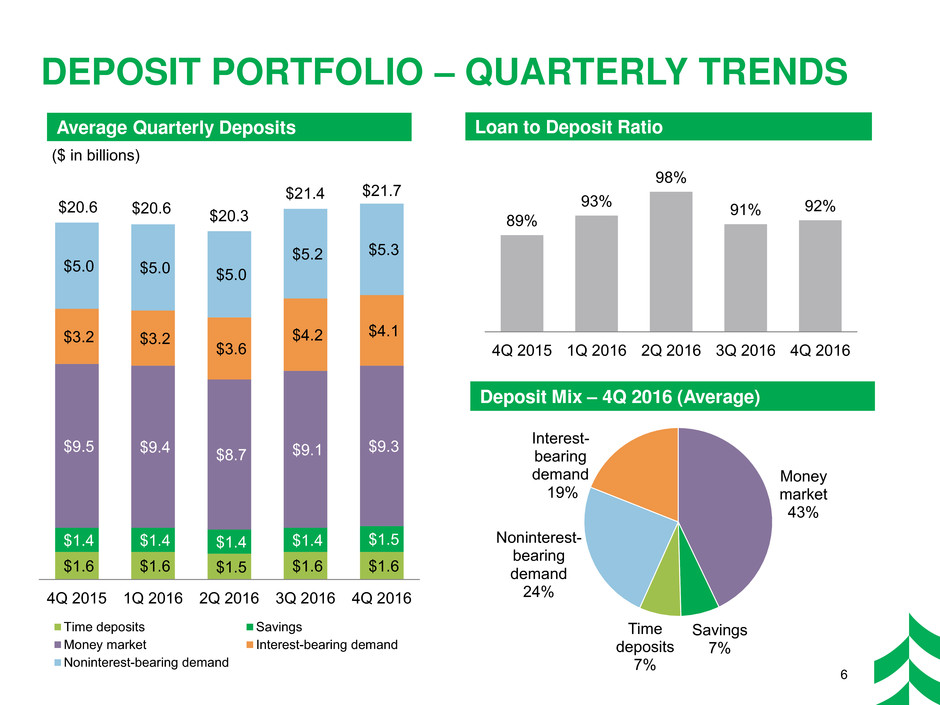
$1.6 $1.6 $1.5 $1.6 $1.6
$1.4 $1.4 $1.4 $1.4 $1.5
$9.5 $9.4 $8.7 $9.1 $9.3
$3.2 $3.2
$3.6
$4.2 $4.1
$5.0 $5.0 $5.0
$5.2 $5.3
4Q 2015 1Q 2016 2Q 2016 3Q 2016 4Q 2016
Time deposits Savings
Money market Interest-bearing demand
Noninterest-bearing demand
Money
market
43%
Savings
7%
Time
deposits
7%
Noninterest-
bearing
demand
24%
Interest-
bearing
demand
19%
DEPOSIT PORTFOLIO – QUARTERLY TRENDS
Loan to Deposit Ratio
Deposit Mix – 4Q 2016 (Average)
Average Quarterly Deposits
$20.6 $20.6 $20.3
$21.4
($ in billions)
$21.7
89%
93%
98%
91% 92%
4Q 2015 1Q 2016 2Q 2016 3Q 2016 4Q 2016
6

$253
$185 $177 $158 $128
$20
$147
2012 2013 2014 2015 2016
Oil and Gas
1.9% 1.7% 1.5% 1.5% 1.4%
5.6% 5.7%
2012 2013 2014 2015 2016
ALLL / Total Loans
Oil and Gas ALLL / Oil and Gas Loans
CREDIT QUALITY – ANNUAL TRENDS
($ IN MILLIONS)
$361
$235
$190 $178
$276
$124
$75
2012 2013 2014 2015 2016
Oil and Gas
$84
$39
$15
$30
$6
2012 2013 2014 2015 2016
Oil and Gas
Potential Problem Loans – Year End Nonaccrual Loans – Year End
Net Charge Offs Allowance to Total Loans / Oil and Gas Loans
$302
$351
$178
$275
7
$65
$59
Note: All amounts at or for the year ended

4Q 2015 1Q 2016 2Q 2016 3Q 2016 4Q 2016
Oil and Gas
$8
$4 $2
$(4)
$3
$13 $19 $22
$6
1.5% 1.4% 1.4% 1.4% 1.4%
5.6%
6.5%
5.6% 5.5% 5.7%
4Q 2015 1Q 2016 2Q 2016 3Q 2016 4Q 2016
ALLL / Total Loans
Oil and Gas ALLL / Oil and Gas Loans
CREDIT QUALITY – QUARTERLY TRENDS
($ IN MILLIONS)
$178
$251 $281 $270 $276
$124
$150
$176 $171
$75
4Q 2015 1Q 2016 2Q 2016 3Q 2016 4Q 2016
Oil and Gas
$158 $157 $154 $163 $128
$20
$129 $129 $127 $147
4Q 2015 1Q 2016 2Q 2016 3Q 2016 4Q 2016
Oil and Gas
Potential Problem Loans Nonaccrual Loans
Net Charge Offs (Recoveries) Allowance to Total Loans / Oil and Gas Loans
$302
$401
$457 $441
$351
$178
$286 $283 $290 $275
$21
$18
$9
$17
8

OIL AND GAS UPDATE
$608
$477 $451
$398
$446
$124
$150 $176
$171 $75
$20
$129 $129
$127
$147
4Q 2015 1Q 2016 2Q 2016 3Q 2016 4Q 2016
Pass Potential Problem Loans Nonaccrual
$752 $756 $756
$696
$668
Period End Loans by Credit Quality Oil and Gas Allowance
$42
$49
$42 $38 $38
5.6%
6.5%
5.6% 5.5% 5.7%
4Q 2015 1Q 2016 2Q 2016 3Q 2016 4Q 2016
Oil and Gas Allowance
Oil and Gas Allowance / Oil and Gas Loans
($ in millions) ($ in millions)
9
Total O&G Portfolio
Year end December 31, 2016
61 credits ~$1 billion commitments
$668 million
outstandings
3%
of total loans
New business in 2016 14 credits
$310 million
commitments
$187 million
outstandings
1%
of total loans

$626 $646
$681 $676
$707
2012 2013 2014 2015 2016
Net interest income
3.30%
3.17% 3.08%
2.84% 2.80%
0.00%
0.50%
1.00%
1.50%
2.00%
2.50%
3.00%
3.50%
4.00%
$- $4
$8 $12
$16 $20
$24 $28
$32 $36
$40 $44
$48 $52
$56 $60
$64 $68
$72 $76
$80 $84
$88 $92
$96 $100
$104 $108
$112 $116
$120 $124
$128 $132
$136 $140
$144 $148
$152 $156
$160 $164
$168 $172
$176 $180
NET INTEREST INCOME AND MARGIN
ANNUAL TRENDS
0.36%
0.24% 0.20% 0.22%
0.32%
2012 2013 2014 2015 2016
Interest-bearing deposit costs Other funding costs
0.40%
0.31%
0.62%
0.40% 0.42%
Net interest margin
Yield on Interest-earning Assets Net Interest Income & Net Interest Margin
Cost of Interest-bearing Liabilities
($ in millions)
3.77%
3.47% 3.32% 3.15% 3.12%
4.07%
3.77% 3.58% 3.40% 3.38%
2.86%
2.59% 2.59% 2.45% 2.34%
2012 2013 2014 2015 2016
Total interest-earning assets Total loans
Investments and other
10

2.82% 2.81% 2.81% 2.77% 2.80%
0.00%
0.50%
1.00%
1.50%
2.00%
2.50%
3.00%
3.50%
4.00%
$-
$4
$8
$12
$16
$20
$24
$28
$32
$36
$40
$44
$48
$52
$56
$60
$64
$68
$72
$76
$80
$84
$88
$92
$96
$100
$104
$108
$112
$116
$120
$124
$128
$132
$136
$140
$144
$148
$152
$156
$160
$164
$168
$172
$176
$180
$169 $171
$176 $178 $178
$2 $1
$1 $1 $2
4Q 2015 1Q 2016 2Q 2016 3Q 2016 4Q 2016
Interest recoveries, prepayment fees, & deferred fees
Net interest income net of interest recoveries, prepayment fees, &
deferred fees
3.14% 3.16% 3.12% 3.09% 3.12%
3.37% 3.41% 3.35% 3.35% 3.40%
2.47% 2.43% 2.38% 2.29% 2.25%
4Q 2015 1Q 2016 2Q 2016 3Q 2016 4Q 2016
Total interest-earning assets Total loans
Investments and other
0.22%
0.30% 0.31% 0.32% 0.33%
4Q 2015 1Q 2016 2Q 2016 3Q 2016 4Q 2016
Interest-bearing deposit costs Other funding costs
Net interest margin
Yield on Interest-earning Assets Net Interest Income & Net Interest Margin
NET INTEREST INCOME AND MARGIN
QUARTERLY TRENDS
($ in millions)
0.41%
0.45%
0.41%
$172
$179
0.39%
$177
$171
$180
Cost of Interest-bearing Liabilities
0.42%
11
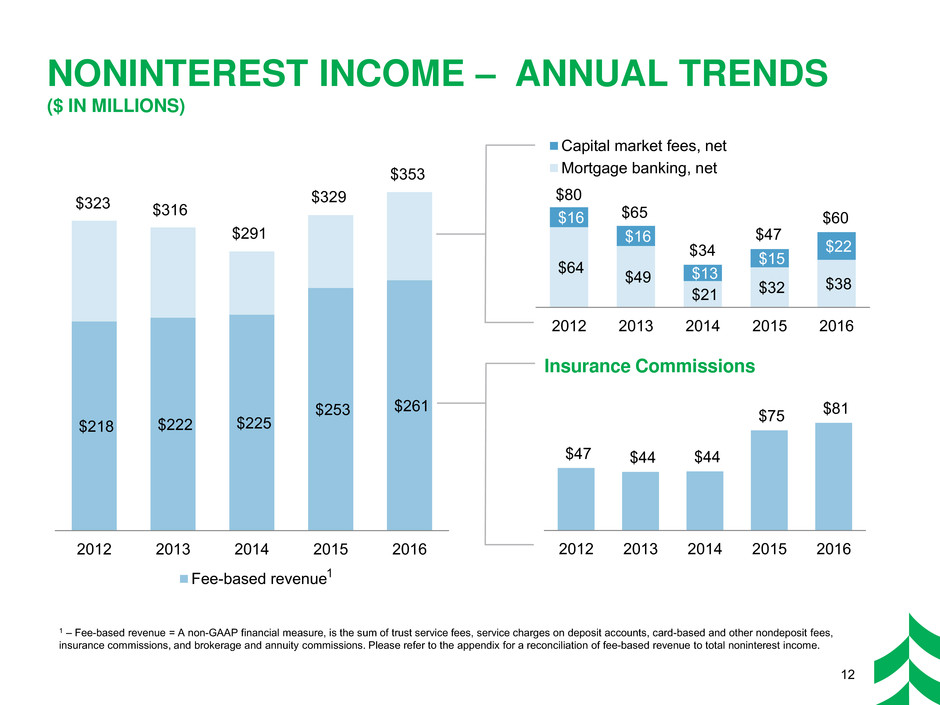
$218 $222 $225
$253 $261
2012 2013 2014 2015 2016
Fee-based revenue
NONINTEREST INCOME – ANNUAL TRENDS
($ IN MILLIONS)
$323
$64 $49
$21 $32
$38
$16
$16
$13
$15
$22
2012 2013 2014 2015 2016
Capital market fees, net
Mortgage banking, net
$47 $44 $44
$75 $81
2012 2013 2014 2015 2016
$316
$291
$329
$353
Insurance Commissions
12
1 – Fee-based revenue = A non-GAAP financial measure, is the sum of trust service fees, service charges on deposit accounts, card-based and other nondeposit fees,
insurance commissions, and brokerage and annuity commissions. Please refer to the appendix for a reconciliation of fee-based revenue to total noninterest income.
1
$80
$65
$34
$47
$60
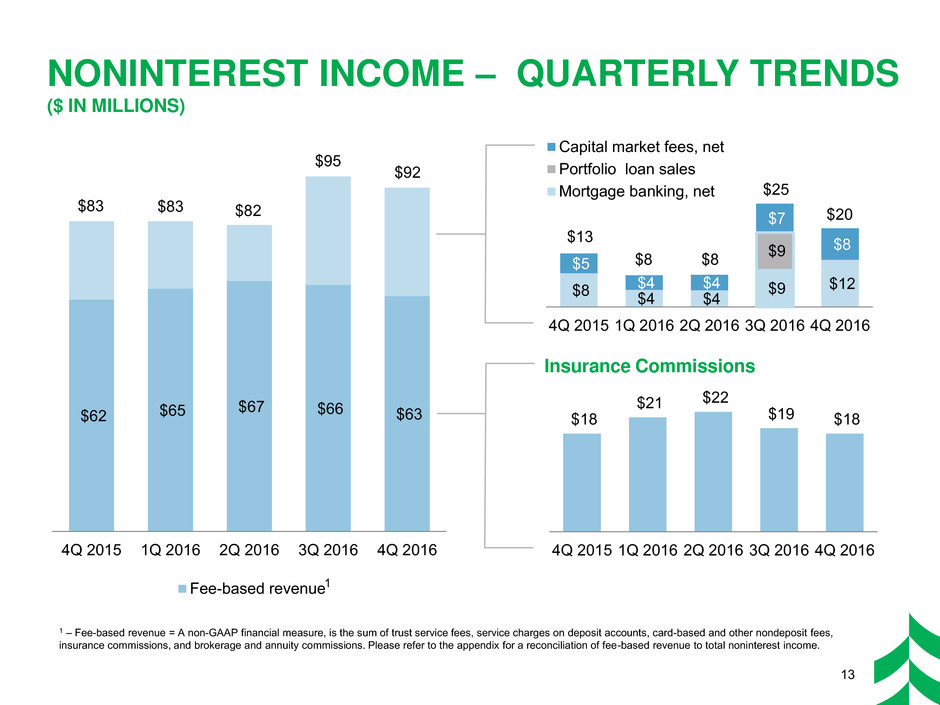
$8 $4 $4
$9 $12
$9
$5
$4 $4
$7
$8
4Q 2015 1Q 2016 2Q 2016 3Q 2016 4Q 2016
Capital market fees, net
Portfolio loan sales
Mortgage banking, net
NONINTEREST INCOME – QUARTERLY TRENDS
($ IN MILLIONS)
$62 $65 $67 $66 $63
4Q 2015 1Q 2016 2Q 2016 3Q 2016 4Q 2016
Fee-based revenue
$92
$83 $83 $82
Insurance Commissions
$18
$21 $22
$19 $18
4Q 2015 1Q 2016 2Q 2016 3Q 2016 4Q 2016
13
$95
$13
$8 $8
$25
$20
1 – Fee-based revenue = A non-GAAP financial measure, is the sum of trust service fees, service charges on deposit accounts, card-based and other nondeposit fees,
insurance commissions, and brokerage and annuity commissions. Please refer to the appendix for a reconciliation of fee-based revenue to total noninterest income.
1
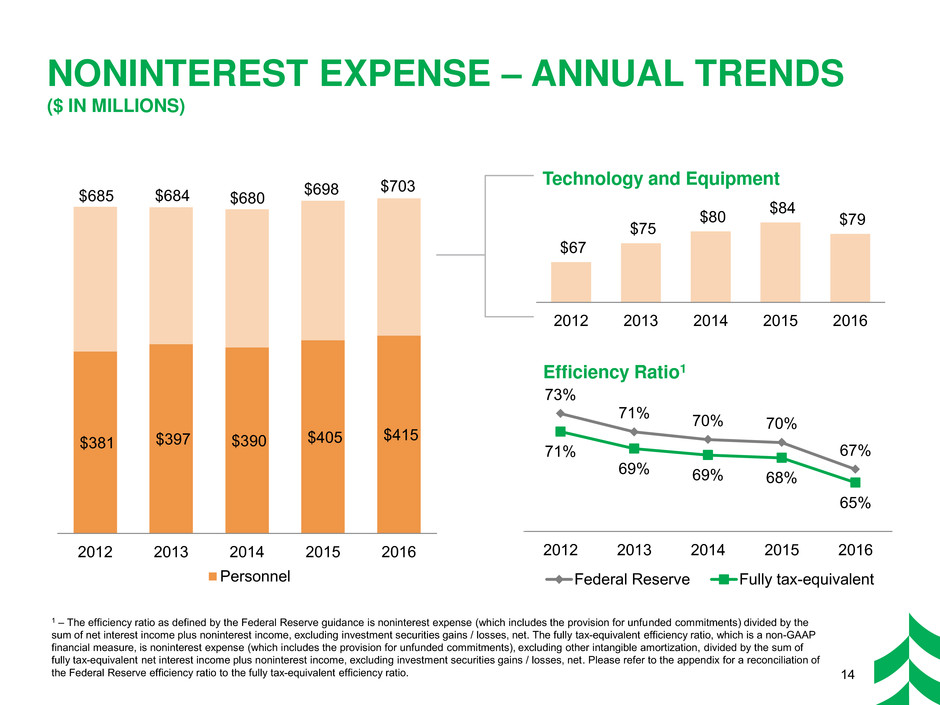
$381 $397 $390 $405 $415
2012 2013 2014 2015 2016
Personnel
NONINTEREST EXPENSE – ANNUAL TRENDS
($ IN MILLIONS)
$685
$67
$75
$80 $84 $79
2012 2013 2014 2015 2016
$684 $680 $698
$703 Technology and Equipment
Efficiency Ratio1
1 – The efficiency ratio as defined by the Federal Reserve guidance is noninterest expense (which includes the provision for unfunded commitments) divided by the
sum of net interest income plus noninterest income, excluding investment securities gains / losses, net. The fully tax-equivalent efficiency ratio, which is a non-GAAP
financial measure, is noninterest expense (which includes the provision for unfunded commitments), excluding other intangible amortization, divided by the sum of
fully tax-equivalent net interest income plus noninterest income, excluding investment securities gains / losses, net. Please refer to the appendix for a reconciliation of
the Federal Reserve efficiency ratio to the fully tax-equivalent efficiency ratio. 14
73%
71% 70% 70%
67% 71%
69% 69% 68%
65%
2012 2013 2014 2015 2016
Federal Reserve Fully tax-equivalent
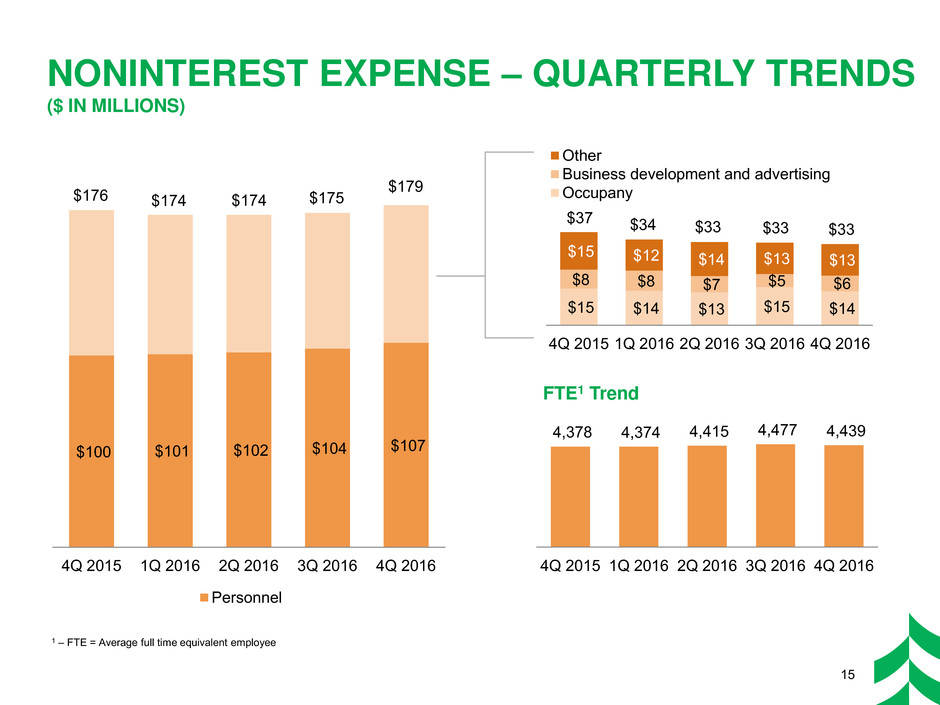
$15 $14 $13 $15 $14
$8 $8 $7 $5 $6
$15 $12 $14 $13 $13
4Q 2015 1Q 2016 2Q 2016 3Q 2016 4Q 2016
Other
Business development and advertising
Occupany
$100 $101 $102 $104 $107
4Q 2015 1Q 2016 2Q 2016 3Q 2016 4Q 2016
Personnel
NONINTEREST EXPENSE – QUARTERLY TRENDS
($ IN MILLIONS)
1 – FTE = Average full time equivalent employee
FTE1 Trend
$176 $174 $174 $175
4,378 4,374 4,415 4,477 4,439
4Q 2015 1Q 2016 2Q 2016 3Q 2016 4Q 2016
$179
15
$37 $34 $33 $33 $33

2017 OUTLOOK
Balance
Sheet
Management
Mid-to-high single digit annual
average loan growth
Maintain Loan to Deposit ratio
under 100%
Stable to improving NIM trend,
assuming additional Federal
Reserve action to raise rates
Fee
Businesses
Improving fee-based and
capital markets revenues
Declining mortgage banking
Increasing tax credit
investment activity
Expense
Management
Approximately 1% higher than
the prior year
Continued improvement to our
efficiency ratio
Capital
&
Credit
Management
Continue to follow stated
corporate priorities for capital
deployment
Expected to adjust with changes
to risk grade, other indications of
credit quality, and loan volume
16
This outlook reflects a similar economy to what we experienced in 2016 and includes our
expectation of two interest rate increases in 2017. It does not reflect any changes to the regulatory
environment or to corporate tax rates. We may adjust our outlook if, and when, we have more
clarity on any one, or more, of these factors.

RECONCILIATION AND DEFINITIONS OF
NON-GAAP ITEMS
17
Efficiency Ratio 2012 2013 2014 2015 2016
Federal Reserve efficiency ratio 73.21% 71.14% 70.29% 69.96% 66.95%
Fully tax-equivalent adjustment (1.59) (1.45) (1.35) (1.41) (1.29)
Other intangible amortization (0.44) (0.42) (0.39) (0.31) (0.20)
Fully tax-equivalent efficiency ratio 71.18% 69.27% 68.55% 68.24% 65.46%
The efficiency ratio as defined by the Federal Reserve guidance is noninterest expense (which includes the provision for unfunded commitments)
divided by the sum of net interest income plus noninterest income, excluding investment securities gains / losses, net. The fully tax-equivalent
efficiency ratio, which is a non-GAAP financial measure, is noninterest expense (which includes the provision for unfunded commitments),
excluding other intangible amortization, divided by the sum of fully tax-equivalent net interest income plus noninterest income, excluding
investment securities gains / losses, net. Management believes the fully tax-equivalent efficiency ratio, which adjusts net interest income for the
tax-favored status of certain loans and investment securities, to be the preferred industry measurement as it enhances the comparability of net
interest income arising from taxable and tax-exempt sources.
Fee-based Revenue ($ millions) 2012 2013 2014 2015 2016
4Q
2015
1Q
2016
2Q
2016
3Q
2016
4Q
2016
Trust service fees $41 $46 $49 $49 $47 $12 $12 $12 $12 $12
Service charges on deposit accounts 69 70 69 66 67 17 16 16 18 16
Card-based and other nondeposit fees 46 47 47 48 50 11 12 13 13 13
Insurance commissions 47 44 44 75 81 18 21 22 19 18
Brokerage and annuity commissions 15 15 16 15 16 4 4 4 4 4
Total Fee-based revenue $218 $222 $225 $253 $261 $62 $65 $67 $66 $63
Other 105 94 66 76 92 21 18 15 29 29
Total noninterest income $323 $316 $291 $329 $353 $83 $83 $82 $95 $92
