Attached files
| file | filename |
|---|---|
| EX-99.2 - EX-99.2 - Riverview Financial Corp | d313241dex992.htm |
| EX-10.2 - EX-10.2 - Riverview Financial Corp | d313241dex102.htm |
| 8-K - FORM 8-K - Riverview Financial Corp | d313241d8k.htm |
| Exhibit 99.1
|

Common Stock Offering
November 2016
Confidential
Page | 1
|
|
Disclaimer
This confidential presentation has been prepared by Riverview Financial Corporation (“Riverview” or the “Company”) solely for informational purposes based on its own information, as well as information from public sources. This presentation has been prepared to assist interested parties in making their own evaluation of Riverview and does not purport to contain all of the information that they may deem relevant. In all cases, interested parties should conduct their own investigation and analysis of Riverview and the data set forth in this presentation and other information provided by or on behalf of Riverview. This presentation is not an offer and offers can only be made by the PPM.
Except as otherwise indicated, this presentation speaks as of the date hereof. The delivery of this presentation shall not, under any circumstances, create any implication that there has been no change in the affairs of the Company after the date hereof. Certain of the information contained herein may be derived from information provided by industry sources. The Company believes that such information is accurate and that the sources from which it has been obtained are reliable. The Company cannot guarantee the accuracy of such information, however, and has not independently verified such information.
This presentation contains forward-looking statements, including projections, predictions, expectations or statements as to beliefs or future events or results or refer to other matters that are not historical facts. In some cases you can identify these forward-looking statements by words like “may”, “will”, “should”, “expect”, “plan”, “anticipate”, “intend”, “believe”, “estimate”, “predict”, “potential”, or “continue”. These forward-looking statements are not historical facts, and are based on current expectations, estimates and projections about the Company’s industry, management’s beliefs and certain assumptions made by management, many of which, by their nature, are inherently uncertain and beyond the Company’s control. Accordingly, you are cautioned that any such forward-looking statements are not guarantees of future performance and are subject to certain risks, uncertainties and assumptions that are difficult to predict. Although the Company believes that the expectations reflected in such forward-looking statements are reasonable as of the date made, actual results may prove to be materially different from the expected results expressed or implied by such forward-looking statements.
Important factors that could cause our actual results to differ materially from those in the forward-looking statements include, but are not limited to: our ability to achieve the intended benefits of acquisitions and integration of previously acquired businesses; restructuring initiatives; changes in interest rates; economic conditions, particularly in our market area; legislative and regulatory changes and the ability to comply with the significant laws and regulations governing the banking and financial services business; monetary and fiscal policies of the U.S. government, including policies of the U.S. Department of Treasury and the Federal Reserve System; credit risk associated with lending activities and changes in the quality and composition of our loan and investment portfolios; demand for loan and other products; deposit flows; competition; changes in the values of real estate and other collateral securing the loan portfolio, particularly in our market area; changes in relevant accounting principles and guidelines; and inability of third party service providers to perform.
The forward-looking statements contained in this presentation speak only as of the date of this presentation, and the Company undertakes no obligation to update any forward-looking statement to reflect events or circumstances after the date of this presentation or to reflect the occurrence of unanticipated events. This presentation is subject to the Confidentiality Agreement between Recipient and Ambassador Financial Group, Inc. as placement agent for Riverview.
Page | 2
|
|
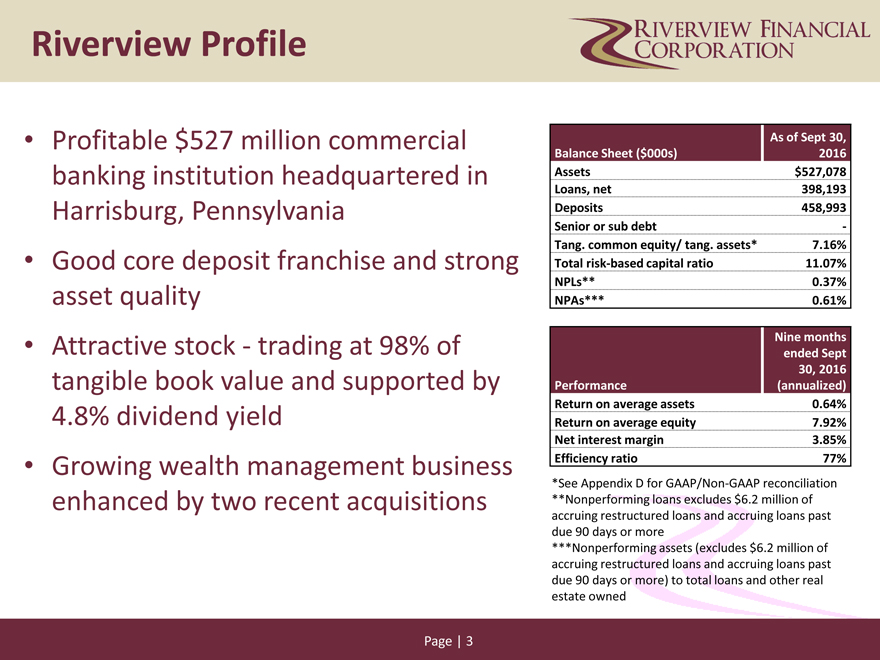
Riverview Profile
Profitable $527 million commercial banking institution headquartered in Harrisburg, Pennsylvania
Good core deposit franchise and strong asset quality
Attractive stock—trading at 98% of tangible book value and supported by 4.8% dividend yield
Growing wealth management business enhanced by two recent acquisitions
As of Sept 30,
Balance Sheet ($000s) 2016
Assets $527,078
Loans, net 398,193
Deposits 458,993
Senior or sub debt -
Tang. common equity/ tang. assets* 7.16%
Total risk-based capital ratio 11.07%
NPLs** 0.37%
NPAs*** 0.61%
Nine months
ended Sept
30, 2016
Performance (annualized)
Return on average assets 0.64%
Return on average equity 7.92%
Net interest margin 3.85%
Efficiency ratio 77%
*See Appendix D for GAAP/Non-GAAP reconciliation
**Nonperforming loans excludes $6.2 million of
accruing restructured loans and accruing loans past
due 90 days or more
***Nonperforming assets (excludes $6.2 million of
accruing restructured loans and accruing loans past
due 90 days or more) to total loans and other real
estate owned
Page | 3
|
|
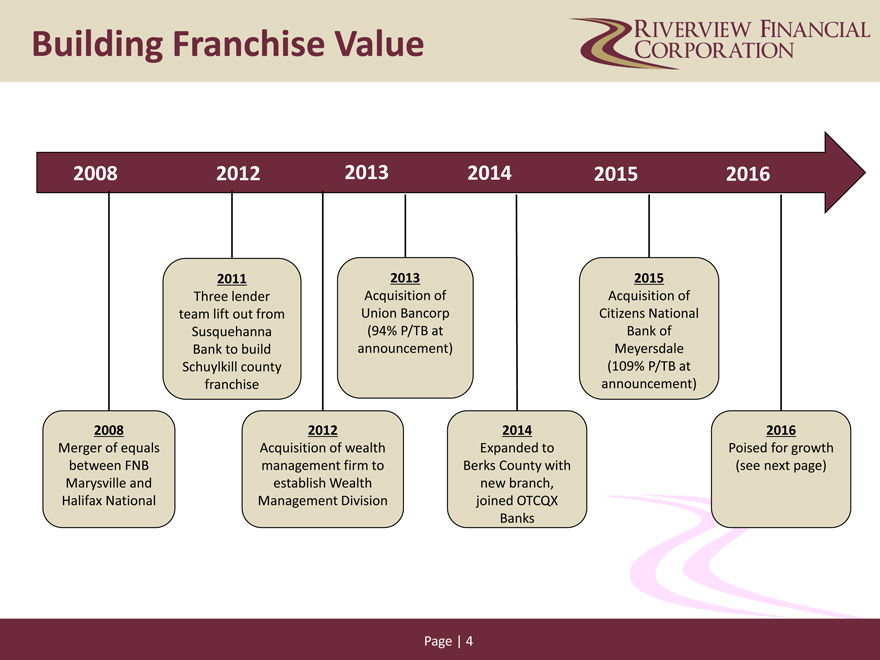
Building Franchise Value
2012 201320142015
2008 2012 2013201420152016
2011 20132015
Three lender Acquisition of Acquisition of
team lift out from Union Bancorp Citizens National
Susquehanna (94% P/TB at Bank of
Bank to build announcement) Meyersdale
Schuylkill county (109% P/TB at
franchise announcement)
2008 201220142016
Merger of equals Acquisition of wealth Expanded to Poised for growth
between FNB management firm to Berks County with(see next page)
Marysville and establish Wealth new branch,
Halifax National Management Division joined OTCQX
Banks
Page | 4
|
|
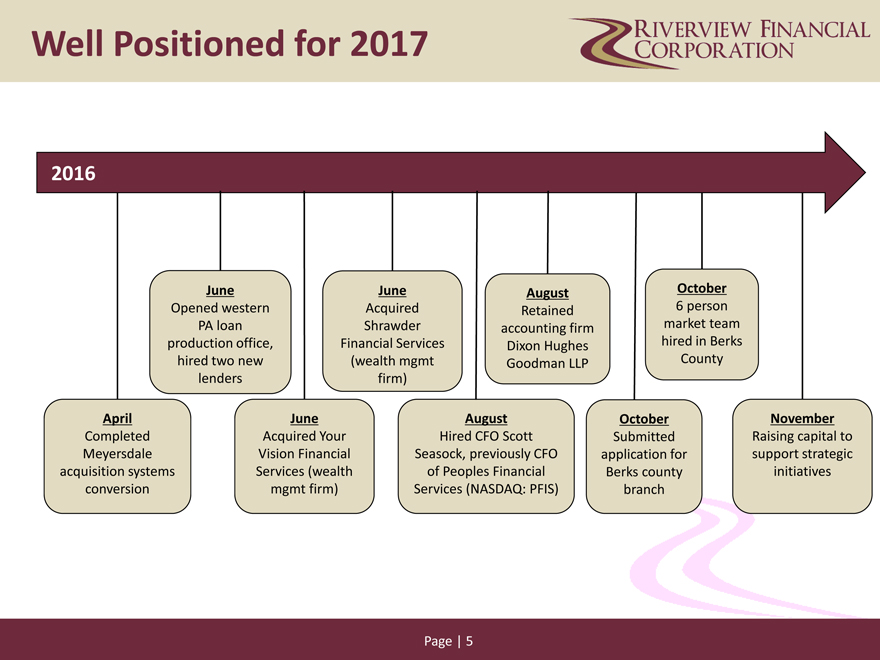
Well Positioned for 2017
2012 2013 20142015
2016
June June August October
Opened western Acquired Retained 6 person
PA loan Shrawder accounting firm market team
production office, Financial Services Dixon Hughes hired in Berks
hired two new (wealth mgmt Goodman LLP County
lenders firm)
April June August October November
Completed Acquired Your Hired CFO Scott Submitted Raising capital to
Meyersdale Vision Financial Seasock, previously CFO application for support strategic
acquisition systems Services (wealth of Peoples Financial Berks county initiatives
conversion mgmt firm) Services (NASDAQ: PFIS) branch
Page | 5
|
|
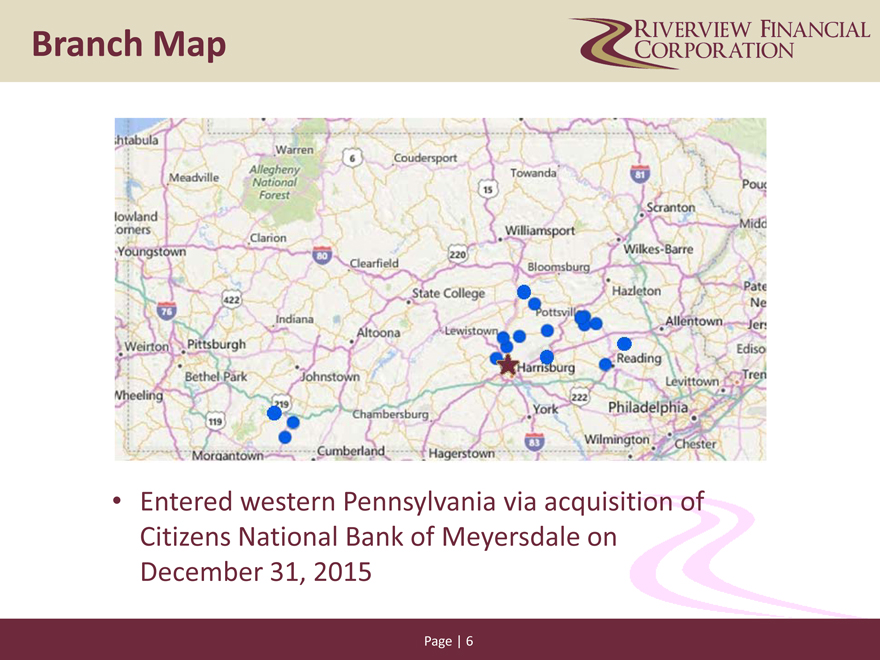
Branch Map
Entered western Pennsylvania via acquisition of Citizens National Bank of Meyersdale on December 31, 2015
Page | 6
|
|
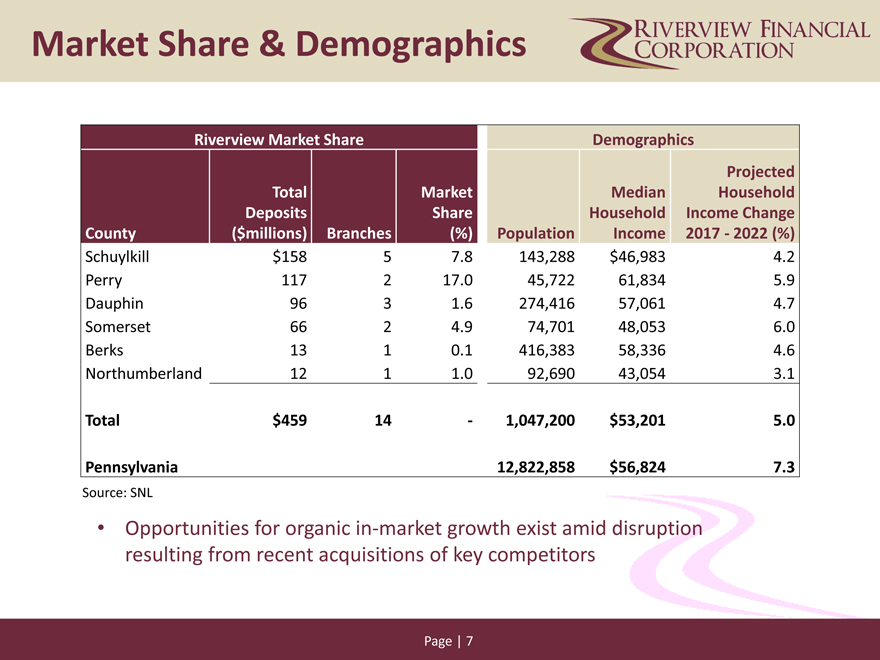
Market Share & Demographics
Riverview Market Share Demographics
Projected
Total Market Median Household
Deposits Share Household Income Change
County ($millions) Branches (%) Population Income 2017—2022 (%)
Schuylkill $158 57.8143,288$46,9834.2
Perry 117 217.045,72261,8345.9
Dauphin 96 31.6274,41657,0614.7
Somerset 66 24.974,70148,0536.0
Berks 13 10.1416,38358,3364.6
Northumberland 12 11.092,69043,0543.1
Total $459 14-1,047,200$53,2015.0
Pennsylvania 12,822,858$56,8247.3
Source: SNL
Opportunities for organic in-market growth exist amid disruption
resulting from recent acquisitions of key competitors
Page | 7
|
|
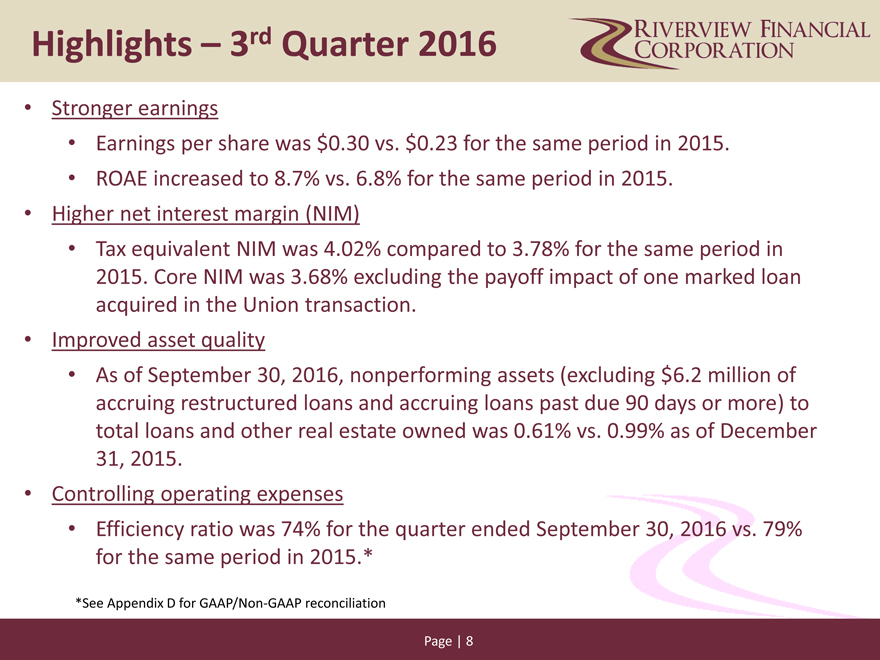
Highlights – 3rd Quarter 2016
Stronger earnings
Earnings per share was $0.30 vs. $0.23 for the same period in 2015.
ROAE increased to 8.7% vs. 6.8% for the same period in 2015.
Higher net interest margin (NIM)
Tax equivalent NIM was 4.02% compared to 3.78% for the same period in 2015. Core NIM was 3.68% excluding the payoff impact of one marked loan acquired in the Union transaction.
Improved asset quality
As of September 30, 2016, nonperforming assets (excluding $6.2 million of accruing restructured loans and accruing loans past due 90 days or more) to total loans and other real estate owned was 0.61% vs. 0.99% as of December 31, 2015.
Controlling operating expenses
Efficiency ratio was 74% for the quarter ended September 30, 2016 vs. 79% for the same period in 2015.*
*See Appendix D for GAAP/Non-GAAP reconciliation
Page | 8
|
|
Our Strategy
Successfully integrate past acquisitions and position for new opportunities
Strategically focus on revenue growth
Maintain strong credit quality in all business cycles
Grow diversified streams of non-interest income to decrease reliance on net interest margin (NIM)
Emphasize client relationships and continue to attract core deposits
Introduce mobile banking capabilities next quarter
Page | 9
|
|
Financial History
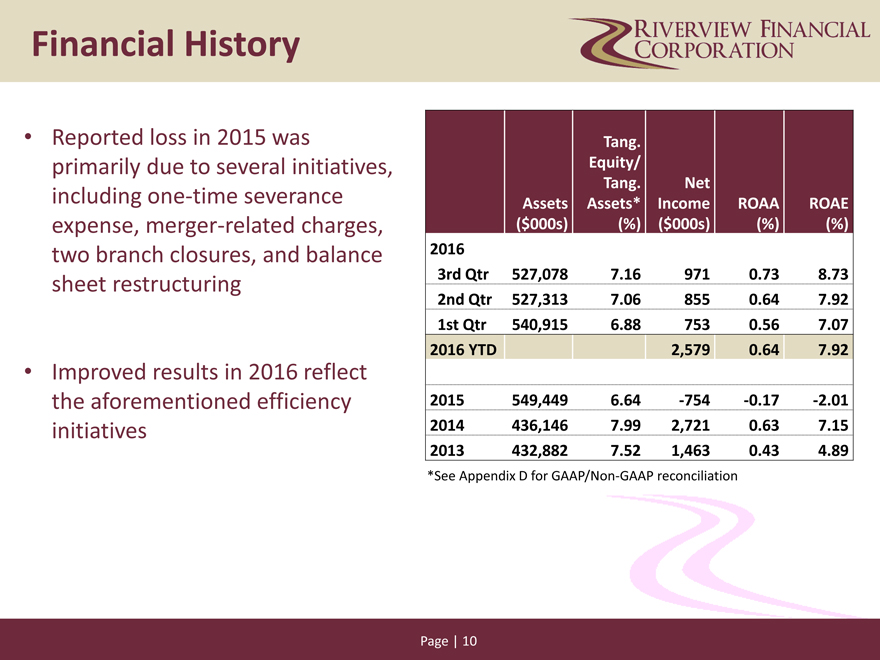
Reported loss in 2015 was primarily due to several initiatives, including one-time severance expense, merger-related charges, two branch closures, and balance sheet restructuring
Improved results in 2016 reflect the aforementioned efficiency initiatives
Tang.
Equity/
Tang.Net
Assets Assets* Income ROAA ROAE
($000s) (%)($000s)(%)(%)
2016
3rd Qtr 527,078 7.169710.738.73
2nd Qtr 527,313 7.068550.647.92
1st Qtr 540,915 6.887530.567.07
2016 YTD 2,5790.647.92
2015 549,449 6.64-754-0.17-2.01
2014 436,146 7.992,7210.637.15
2013 432,882 7.521,4630.434.89
*See Appendix D for GAAP/Non-GAAP reconciliation
Page | 10
|
|
Financial History
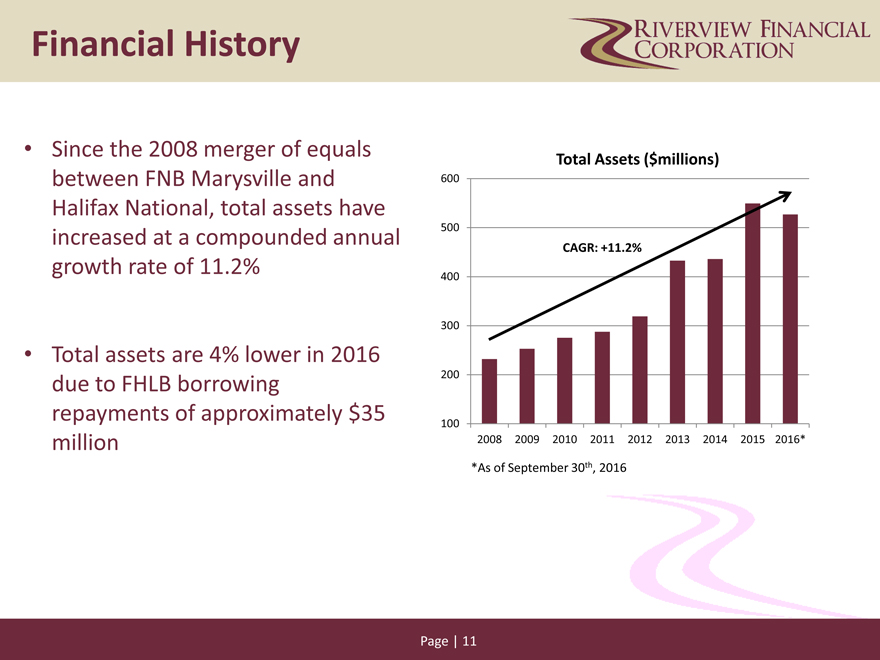
Since the 2008 merger of equals between FNB Marysville and Halifax National, total assets have increased at a compounded annual growth rate of 11.2%
Total assets are 4% lower in 2016 due to FHLB borrowing repayments of approximately $35 million
Total Assets ($millions)
600
500
CAGR: +11.2%
400
300
200
100
2008 2009 2010 2011 2012 2013 2014 20152016*
*As of September 30th, 2016
Page | 11
|
|
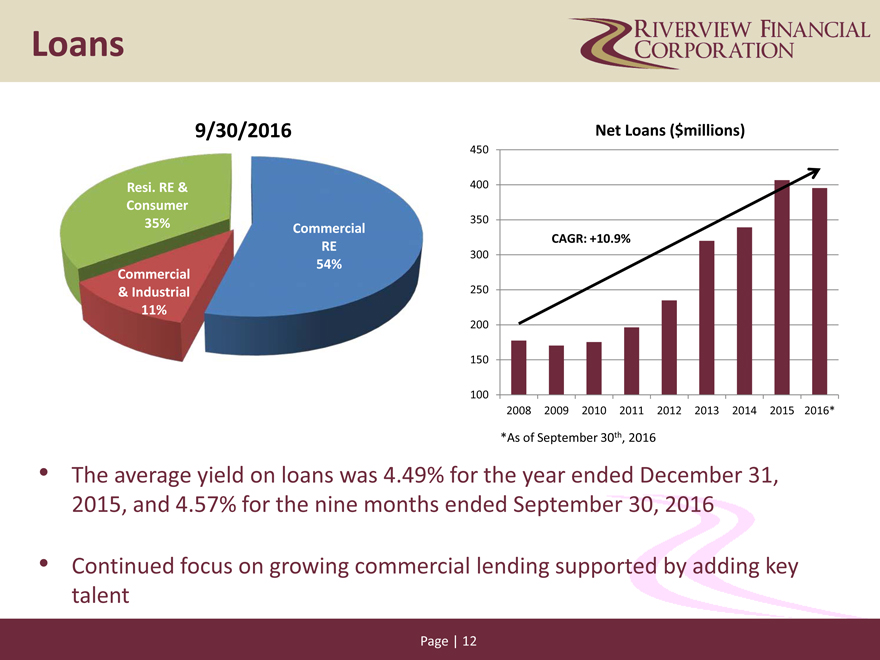
Loans
9/30/2016 Net Loans ($millions)
450
Resi. RE & 400
Consumer
35% Commercial350
RECAGR: +10.9%
300
Commercial 54%
& Industrial 250
11%
200
150
100
2008 2009 2010 2011 2012 2013 201420152016*
*As of September 30th, 2016
The average yield on loans was 4.49% for the year ended December 31, 2015, and 4.57% for the nine months ended September 30, 2016
Continued focus on growing commercial lending supported by adding key talent
Page | 12
|
|
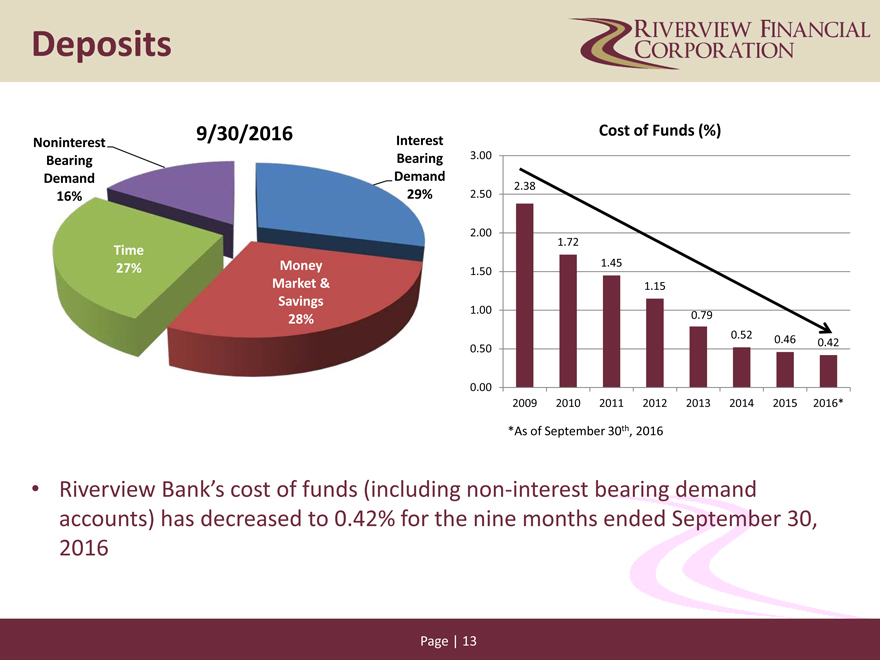
Deposits
Noninterest 9/30/2016 Interest Cost of Funds (%)
Bearing Bearing 3.00
Demand Demand
16% 29%2.502.38
2.00
Time 1.72
27% Money 1.501.45
Market &1.15
Savings1.00
28%0.79
0.520.460.42
0.50
0.00
2009 2010 2011 2012 2013 2014 2015 2016*
*As of September 30th, 2016
Riverview Bank’s cost of funds (including non-interest bearing demand
accounts) has decreased to 0.42% for the nine months ended September 30,
2016
Page | 13
|
|
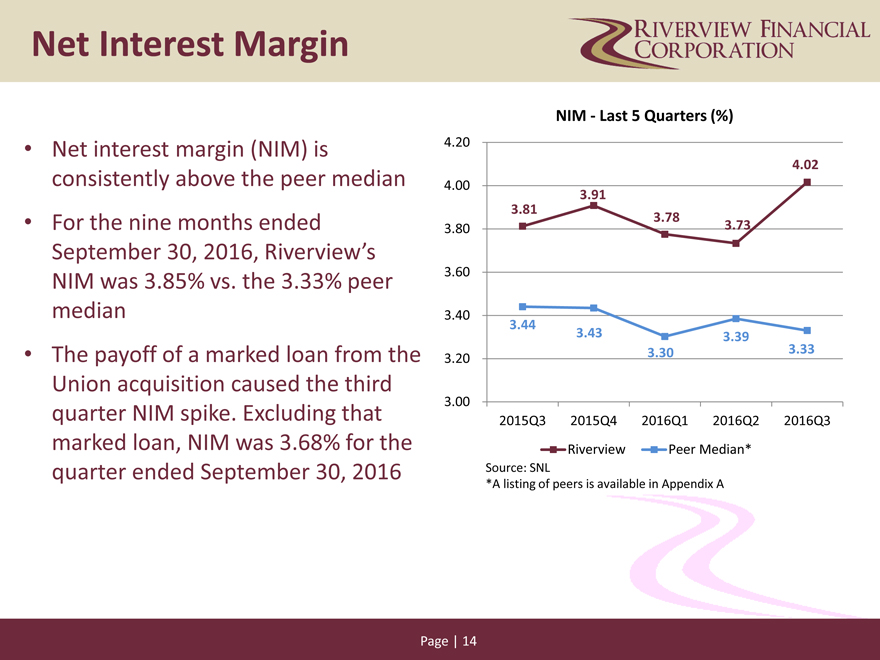
Net Interest Margin
NIM—Last 5 Quarters (%)
Net interest margin (NIM) is 4.20
4.02
consistently above the peer median 4.003.91
For the nine months ended 3.803.813.783.73
September 30, 2016, Riverview’s
NIM was 3.85% vs. the 3.33% peer 3.60
median 3.40
3.443.433.39
The payoff of a marked loan from the 3.203.303.33
Union acquisition caused the third
quarter NIM spike. Excluding that 3.002015Q32015Q42016Q12016Q22016Q3
marked loan, NIM was 3.68% for the RiverviewPeer Median*
quarter ended September 30, 2016 Source: SNL
*A listing of peers is available in Appendix A
Page | 14
|
|
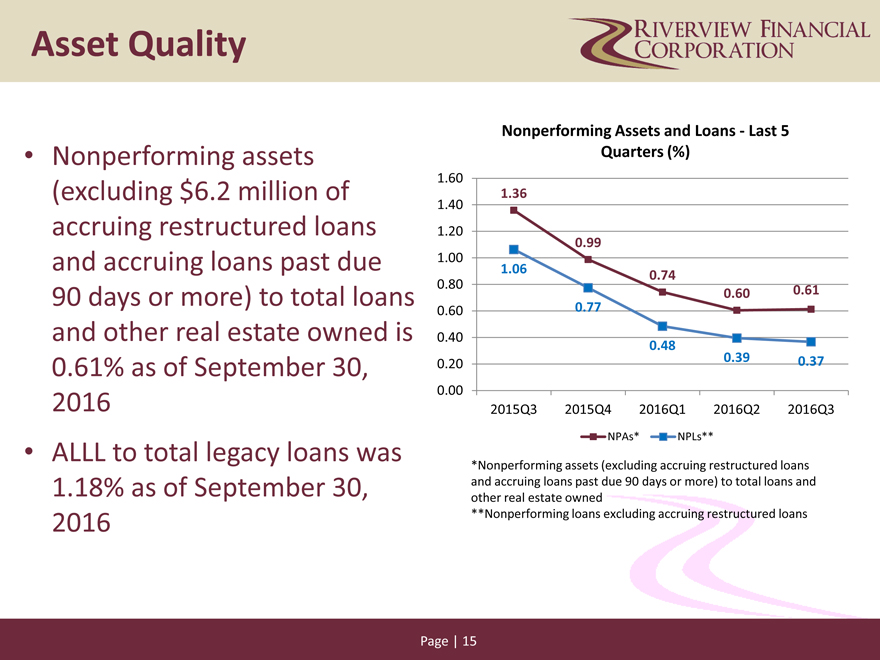
Asset Quality
Nonperforming Assets and Loans—Last 5
Nonperforming assets Quarters (%)
(excluding $6.2 million of 1.601.36
1.40
accruing restructured loans 1.20
0.99
and accruing loans past due 1.001.
060.74
90 days or more) to total loans 0.800.600.61
0.600.77
and other real estate owned is 0.400.48
0.61% as of September 30, 0.200.390.37
2016 0.00
2015Q32015Q42016Q12016Q22016Q3
ALLL to total legacy loans was NPAs*NPLs**
*Nonperforming assets (excluding accruing restructured loans
1.18% as of September 30, and accruing loans past due 90 days or more) to total loans and
other real estate owned
2016 **Nonperforming loans excluding accruing restructured loans
Page | 15
|
|
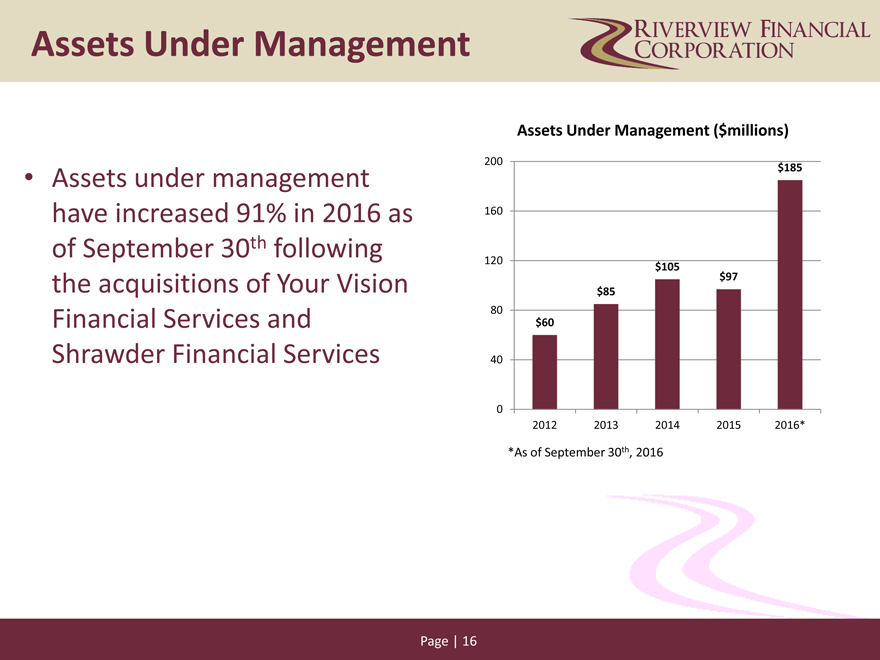
Assets Under Management
Assets Under Management ($millions)
Assets under management 200$185
have increased 91% in 2016 as 160
of September 30th following
120$105
the acquisitions of Your Vision $97
$85
80
Financial Services and $60
Shrawder Financial Services 40
0
20122013201420152016*
*As of September 30th, 2016
Page | 16
|
|
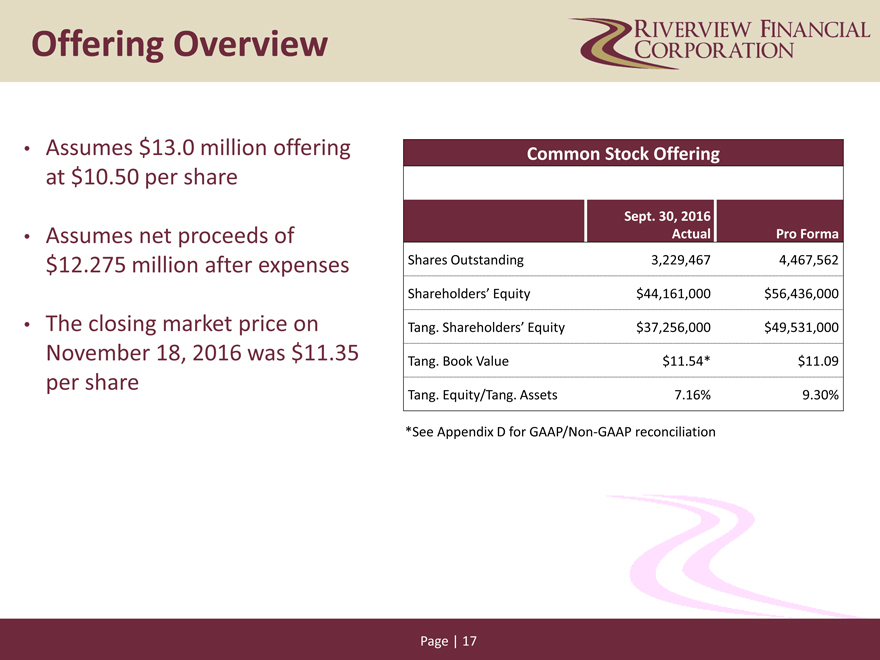
Offering Overview
Assumes $13.0 million offering Common Stock Offering
at $10.50 per share
Sept. 30, 2016
Assumes net proceeds of ActualPro Forma
$12.275 million after expenses Shares Outstanding 3,229,4674,467,562
Shareholders’ Equity $44,161,000$56,436,000
The closing market price on Tang. Shareholders’ Equity $37,256,000$49,531,000
November 18, 2016 was $11.35 Tang. Book Value $11.54*$11.09
per share Tang. Equity/Tang. Assets 7.16%9.30%
*See Appendix D for GAAP/Non-GAAP reconciliation
Page | 17
|
|

Reasons for the Offering
Support strategic organic growth opportunities
Help generate increased earnings power through growth which can achieve better economies of scale
Strengthen position to better compete for acquisition opportunities
Improve shareholder liquidity
Page | 18
|
|
Compelling Investment
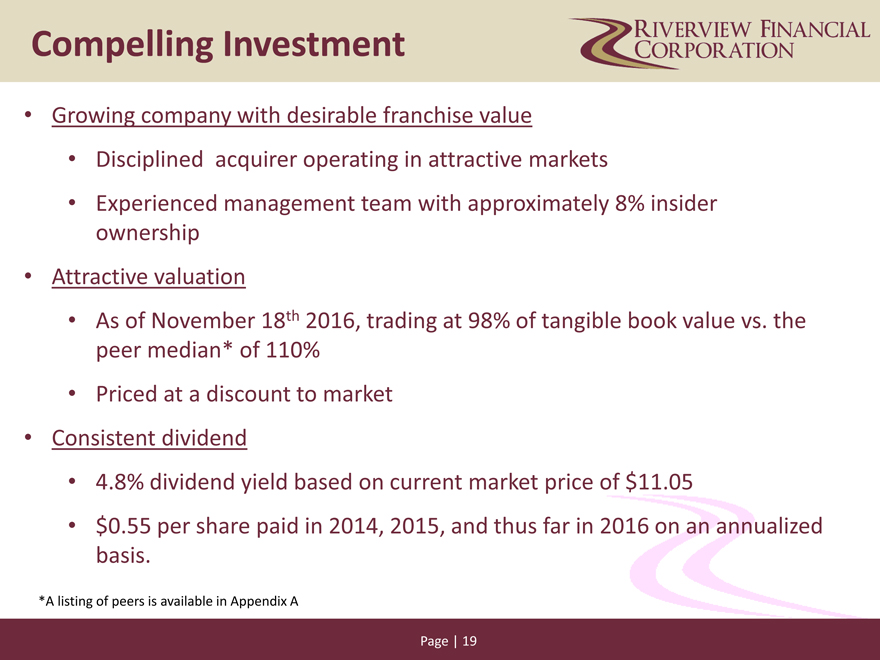
Growing company with desirable franchise value
Disciplined acquirer operating in attractive markets
Experienced management team with approximately 8% insider ownership
Attractive valuation
As of November 18th 2016, trading at 98% of tangible book value vs. the peer median* of 110%
Priced at a discount to market
Consistent dividend
4.8% dividend yield based on current market price of $11.05
$0.55 per share paid in 2014, 2015, and thus far in 2016 on an annualized basis.
*A listing of peers is available in Appendix A
Page | 19
|
|
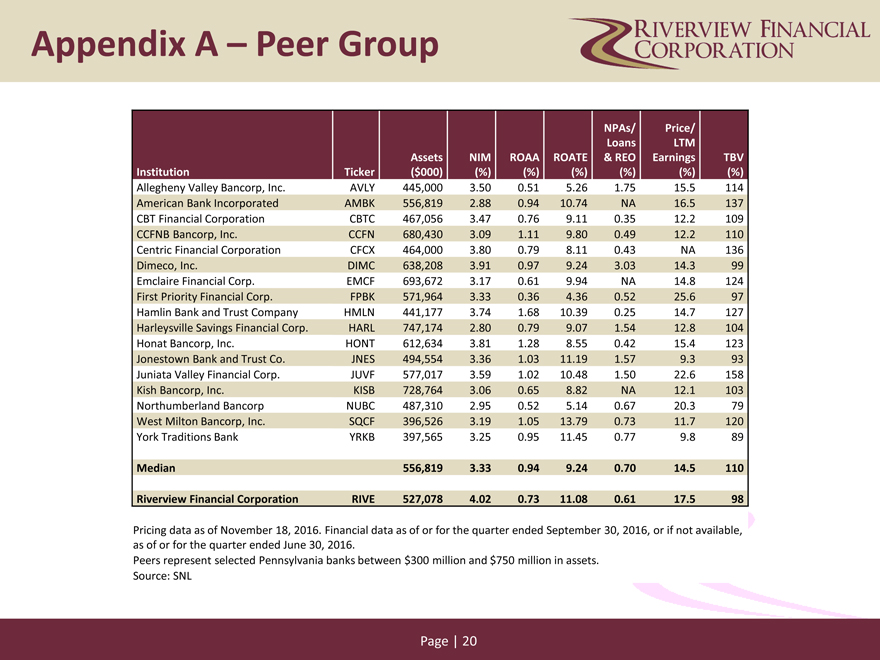
Appendix A – Peer Group
NPAs/Price/
LoansLTM
AssetsNIMROAAROATE& REOEarningsTBV
Institution Ticker ($000)(%)(%)(%)(%)(%)(%)
Allegheny Valley Bancorp, Inc. AVLY 445,0003.500.515.261.7515.5114
American Bank Incorporated AMBK 556,8192.880.9410.74NA16.5137
CBT Financial Corporation CBTC 467,0563.470.769.110.3512.2109
CCFNB Bancorp, Inc. CCFN 680,4303.091.119.800.4912.2110
Centric Financial Corporation CFCX 464,0003.800.798.110.43NA136
Dimeco, Inc. DIMC 638,2083.910.979.243.0314.399
Emclaire Financial Corp. EMCF 693,6723.170.619.94NA14.8124
First Priority Financial Corp. FPBK 571,9643.330.364.360.5225.697
Hamlin Bank and Trust Company HMLN 441,1773.741.6810.390.2514.7127
Harleysville Savings Financial Corp. HARL 747,1742.800.799.071.5412.8104
Honat Bancorp, Inc. HONT 612,6343.811.288.550.4215.4123
Jonestown Bank and Trust Co. JNES 494,5543.361.0311.191.579.393
Juniata Valley Financial Corp. JUVF 577,0173.591.0210.481.5022.6158
Kish Bancorp, Inc. KISB 728,7643.060.658.82NA12.1103
Northumberland Bancorp NUBC 487,3102.950.525.140.6720.379
West Milton Bancorp, Inc. SQCF 396,5263.191.0513.790.7311.7120
York Traditions Bank YRKB 397,5653.250.9511.450.779.889
Median 556,8193.330.949.240.7014.5110
Riverview Financial Corporation RIVE 527,0784.020.7311.080.6117.598
Pricing data as of November 18, 2016. Financial data as of or for the quarter ended September 30, 2016, or if not available,
as of or for the quarter ended June 30, 2016.
Peers represent selected Pennsylvania banks between $300 million and $750 million in assets.
Source: SNL
Page | 20
|
|
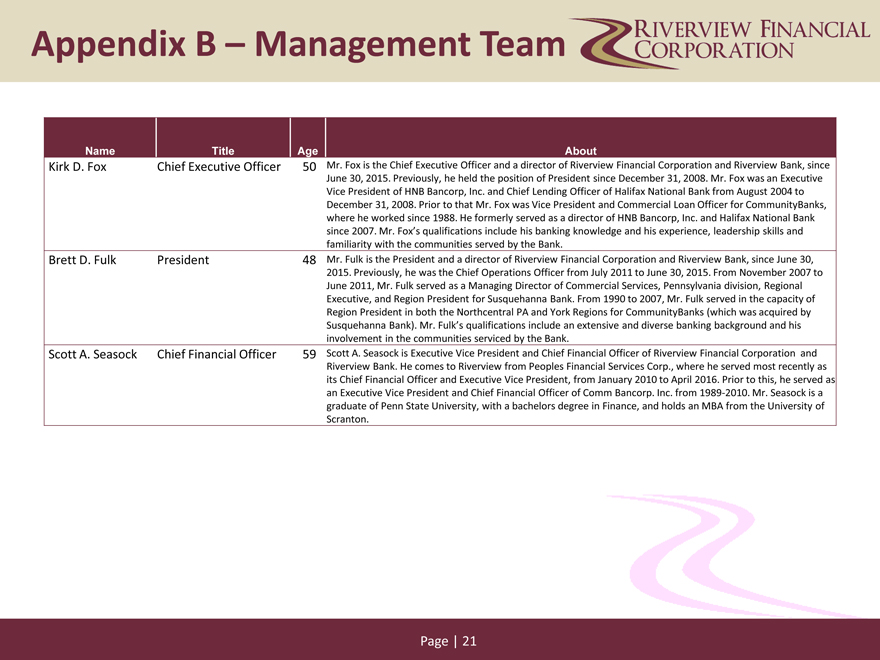
Appendix B – Management Team
Name Title AgeAbout
Kirk D. Fox Chief Executive Officer 50Mr. Fox is the Chief Executive Officer and a director of Riverview Financial Corporation and Riverview Bank, since
June 30, 2015. Previously, he held the position of President since December 31, 2008. Mr. Fox was an Executive
Vice President of HNB Bancorp, Inc. and Chief Lending Officer of Halifax National Bank from August 2004 to
December 31, 2008. Prior to that Mr. Fox was Vice President and Commercial Loan Officer for CommunityBanks,
where he worked since 1988. He formerly served as a director of HNB Bancorp, Inc. and Halifax National Bank
since 2007. Mr. Fox’s qualifications include his banking knowledge and his experience, leadership skills and
familiarity with the communities served by the Bank.
Brett D. Fulk President 48Mr. Fulk is the President and a director of Riverview Financial Corporation and Riverview Bank, since June 30,
2015. Previously, he was the Chief Operations Officer from July 2011 to June 30, 2015. From November 2007 to
June 2011, Mr. Fulk served as a Managing Director of Commercial Services, Pennsylvania division, Regional
Executive, and Region President for Susquehanna Bank. From 1990 to 2007, Mr. Fulk served in the capacity of
Region President in both the North central PA and York Regions for CommunityBanks (which was acquired by
Susquehanna Bank). Mr. Fulk’s qualifications include an extensive and diverse banking background and his
involvement in the communities serviced by the Bank.
Scott A. Seasock Chief Financial Officer 59Scott A. Seasock is Executive Vice President and Chief Financial Officer of Riverview Financial Corporation and
Riverview Bank. He comes to Riverview from Peoples Financial Services Corp., where he served most recently as
its Chief Financial Officer and Executive Vice President, from January 2010 to April 2016. Prior to this, he served as
an Executive Vice President and Chief Financial Officer of Comm Bancorp. Inc. from 1989-2010. Mr. Seasock is a
graduate of Penn State University, with a bachelors degree in Finance, and holds an MBA from the University of
Scranton.
Page | 21
|
|
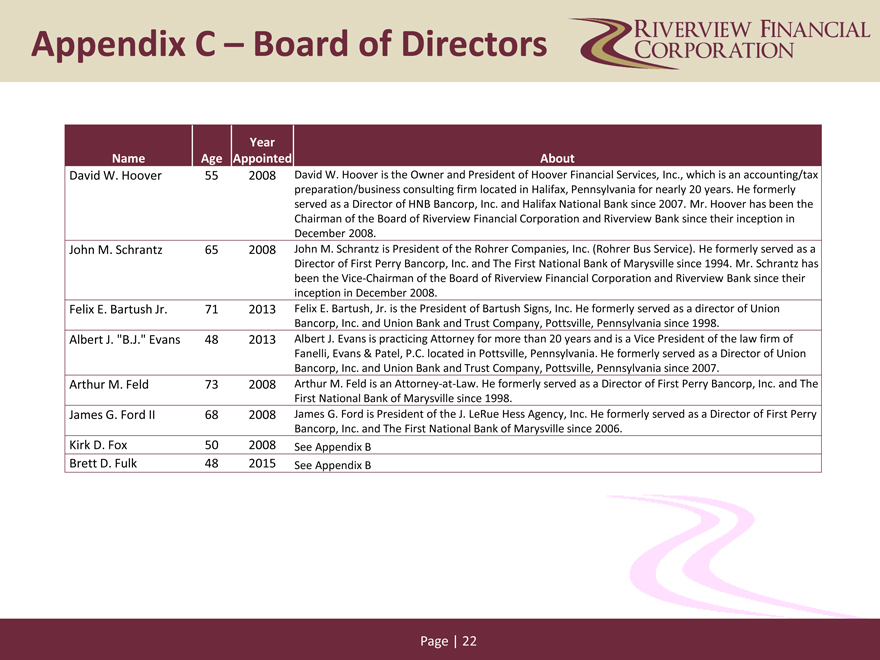
Appendix C – Board of Directors
Year
Name Age Appointed About
David W. Hoover 55 2008David W. Hoover is the Owner and President of Hoover Financial Services, Inc., which is an accounting/tax
preparation/business consulting firm located in Halifax, Pennsylvania for nearly 20 years. He formerly
served as a Director of HNB Bancorp, Inc. and Halifax National Bank since 2007. Mr. Hoover has been the
Chairman of the Board of Riverview Financial Corporation and Riverview Bank since their inception in
December 2008.
John M. Schrantz 65 2008John M. Schrantz is President of the Rohrer Companies, Inc. (Rohrer Bus Service). He formerly served as a
Director of First Perry Bancorp, Inc. and The First National Bank of Marysville since 1994. Mr. Schrantz has
been the Vice-Chairman of the Board of Riverview Financial Corporation and Riverview Bank since their
inception in December 2008.
Felix E. Bartush Jr. 71 2013Felix E. Bartush, Jr. is the President of Bartush Signs, Inc. He formerly served as a director of Union
Bancorp, Inc. and Union Bank and Trust Company, Pottsville, Pennsylvania since 1998.
Albert J. “B.J.” Evans 48 2013Albert J. Evans is practicing Attorney for more than 20 years and is a Vice President of the law firm of
Fanelli, Evans & Patel, P.C. located in Pottsville, Pennsylvania. He formerly served as a Director of Union
Bancorp, Inc. and Union Bank and Trust Company, Pottsville, Pennsylvania since 2007.
Arthur M. Feld 73 2008Arthur M. Feld is an Attorney-at-Law. He formerly served as a Director of First Perry Bancorp, Inc. and The
First National Bank of Marysville since 1998.
James G. Ford II 68 2008James G. Ford is President of the J. LeRue Hess Agency, Inc. He formerly served as a Director of First Perry
Bancorp, Inc. and The First National Bank of Marysville since 2006.
Kirk D. Fox 50 2008See Appendix B
Brett D. Fulk 48 2015See Appendix B
Page | 22
|
|
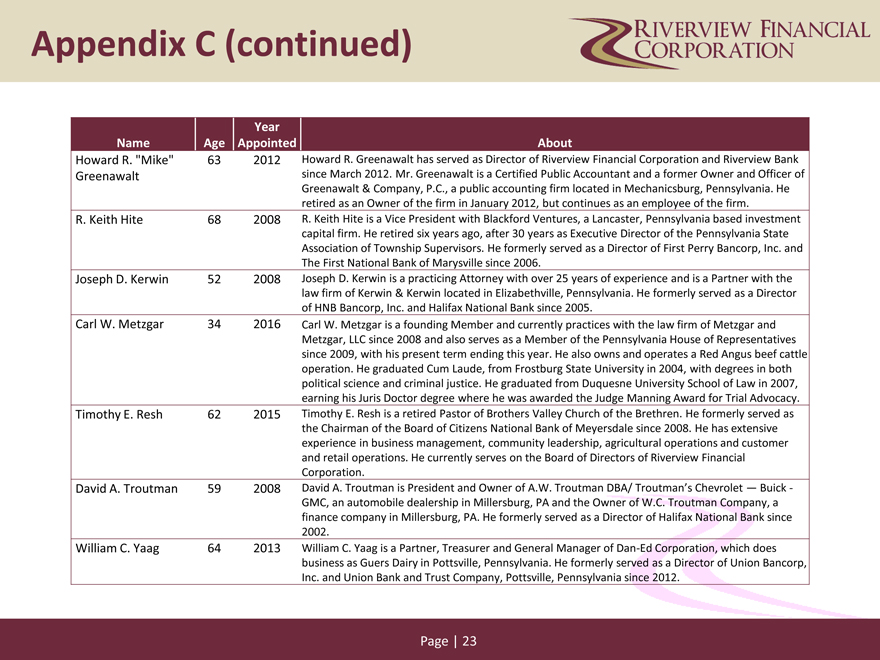
Appendix C (continued)
Year
Name Age AppointedAbout
Howard R. “Mike” 63 2012Howard R. Greenawalt has served as Director of Riverview Financial Corporation and Riverview Bank
Greenawalt since March 2012. Mr. Greenawalt is a Certified Public Accountant and a former Owner and Officer of
Greenawalt & Company, P.C., a public accounting firm located in Mechanicsburg, Pennsylvania. He
retired as an Owner of the firm in January 2012, but continues as an employee of the firm.
R. Keith Hite 68 2008R. Keith Hite is a Vice President with Blackford Ventures, a Lancaster, Pennsylvania based investment
capital firm. He retired six years ago, after 30 years as Executive Director of the Pennsylvania State
Association of Township Supervisors. He formerly served as a Director of First Perry Bancorp, Inc. and
The First National Bank of Marysville since 2006.
Joseph D. Kerwin 52 2008Joseph D. Kerwin is a practicing Attorney with over 25 years of experience and is a Partner with the
law firm of Kerwin & Kerwin located in Elizabethville, Pennsylvania. He formerly served as a Director
of HNB Bancorp, Inc. and Halifax National Bank since 2005.
Carl W. Metzgar 34 2016Carl W. Metzgar is a founding Member and currently practices with the law firm of Metzgar and
Metzgar, LLC since 2008 and also serves as a Member of the Pennsylvania House of Representatives
since 2009, with his present term ending this year. He also owns and operates a Red Angus beef cattle
operation. He graduated Cum Laude, from Frostburg State University in 2004, with degrees in both
political science and criminal justice. He graduated from Duquesne University School of Law in 2007,
earning his Juris Doctor degree where he was awarded the Judge Manning Award for Trial Advocacy.
Timothy E. Resh 62 2015Timothy E. Resh is a retired Pastor of Brothers Valley Church of the Brethren. He formerly served as
the Chairman of the Board of Citizens National Bank of Meyersdale since 2008. He has extensive
experience in business management, community leadership, agricultural operations and customer
and retail operations. He currently serves on the Board of Directors of Riverview Financial
Corporation.
David A. Troutman 59 2008David A. Troutman is President and Owner of A.W. Troutman DBA/ Troutman’s Chevrolet — Buick -
GMC, an automobile dealership in Millersburg, PA and the Owner of W.C. Troutman Company, a
finance company in Millersburg, PA. He formerly served as a Director of Halifax National Bank since
2002.
William C. Yaag 64 2013William C. Yaag is a Partner, Treasurer and General Manager of Dan-Ed Corporation, which does
business as Guers Dairy in Pottsville, Pennsylvania. He formerly served as a Director of Union Bancorp,
Inc. and Union Bank and Trust Company, Pottsville, Pennsylvania since 2012.
Page | 23
|
|
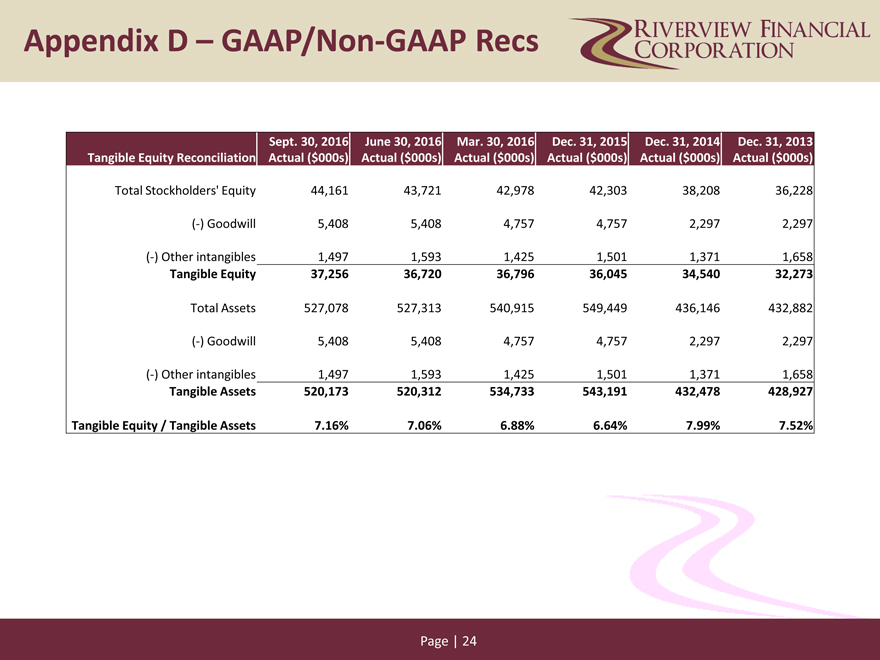
Appendix D – GAAP/Non-GAAP Recs
Sept. 30, 2016 June 30, 2016Mar. 30, 2016Dec. 31, 2015Dec. 31, 2014Dec. 31, 2013
Tangible Equity Reconciliation Actual ($000s) Actual ($000s)Actual ($000s)Actual ($000s)Actual ($000s)Actual ($000s)
Total Stockholders’ Equity 44,161 43,72142,97842,30338,20836,228
(-) Goodwill 5,408 5,4084,7574,7572,2972,297
(-) Other intangibles 1,497 1,5931,4251,5011,3711,658
Tangible Equity 37,256 36,72036,79636,04534,54032,273
Total Assets 527,078 527,313540,915549,449436,146432,882
(-) Goodwill 5,408 5,4084,7574,7572,2972,297
(-) Other intangibles 1,497 1,5931,4251,5011,3711,658
Tangible Assets 520,173 520,312534,733543,191432,478428,927
Tangible Equity / Tangible Assets 7.16% 7.06%6.88%6.64%7.99%7.52%
Page | 24
|
|
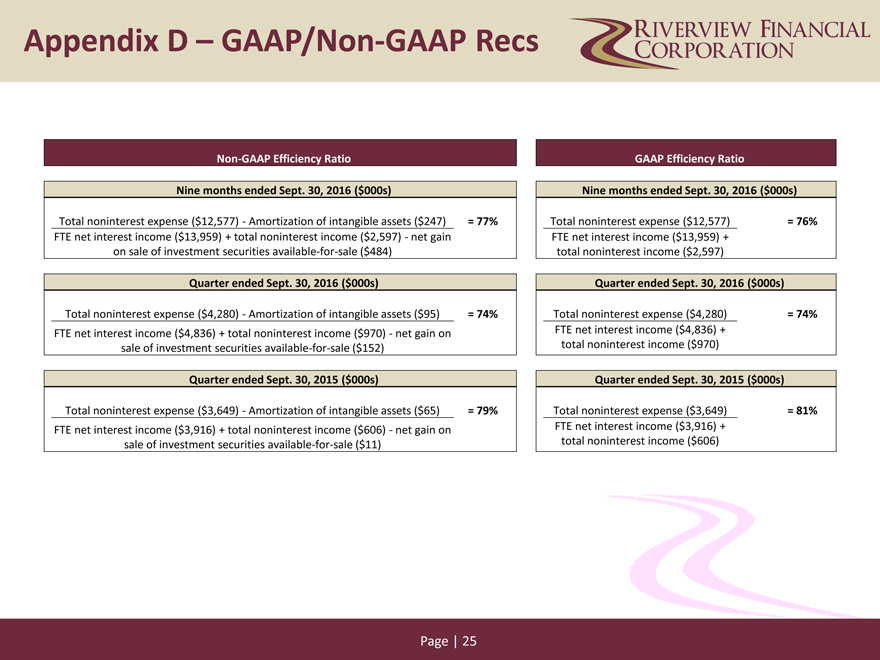
Appendix D – GAAP/Non-GAAP Recs
Non-GAAP Efficiency Ratio GAAP Efficiency Ratio
Nine months ended Sept. 30, 2016 ($000s) Nine months ended Sept. 30, 2016 ($000s)
Total noninterest expense ($12,577)—Amortization of intangible assets ($247) = 77% Total noninterest expense ($12,577)= 76%
FTE net interest income ($13,959) + total noninterest income ($2,597)—net gain FTE net interest income ($13,959) +
on sale of investment securities available-for-sale ($484) total noninterest income ($2,597)
Quarter ended Sept. 30, 2016 ($000s) Quarter ended Sept. 30, 2016 ($000s)
Total noninterest expense ($4,280)—Amortization of intangible assets ($95) = 74% Total noninterest expense ($4,280)= 74%
FTE net interest income ($4,836) + total noninterest income ($970)—net gain on FTE net interest income ($4,836) +
sale of investment securities available-for-sale ($152) total noninterest income ($970)
Quarter ended Sept. 30, 2015 ($000s) Quarter ended Sept. 30, 2015 ($000s)
Total noninterest expense ($3,649)—Amortization of intangible assets ($65) = 79% Total noninterest expense ($3,649)= 81%
FTE net interest income ($3,916) + total noninterest income ($606)—net gain on FTE net interest income ($3,916) +
sale of investment securities available-for-sale ($11) total noninterest income ($606)
Page | 25
|
|
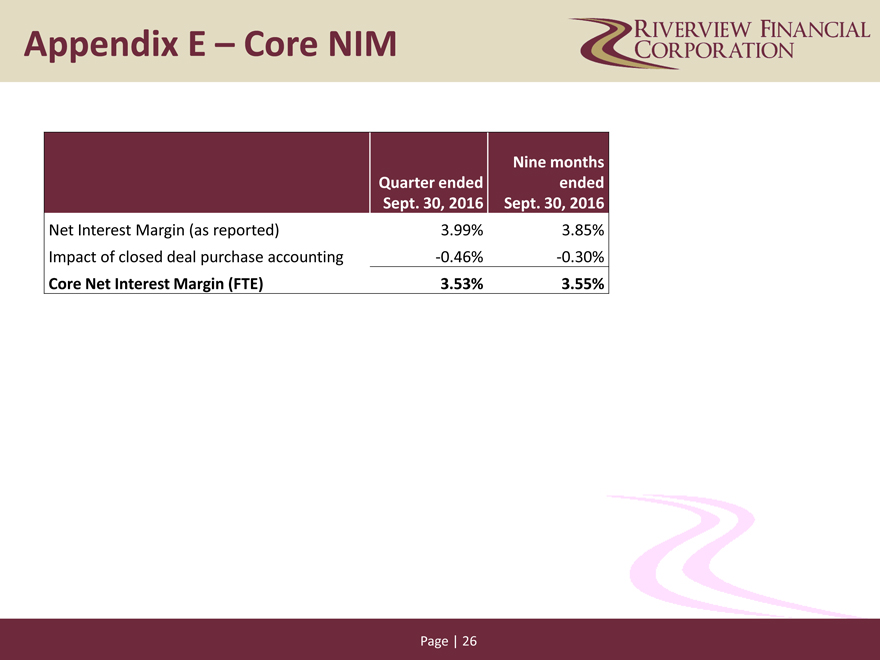
Appendix E – Core NIM
Nine months
Quarter ended ended
Sept. 30, 2016 Sept. 30, 2016
Net Interest Margin (as reported) 3.99% 3.85%
Impact of closed deal purchase accounting -0.46% -0.30%
Core Net Interest Margin (FTE) 3.53% 3.55%
Page | 26