Attached files
| file | filename |
|---|---|
| 8-K - 8-K - Genesis Healthcare, Inc. | gen-20170112x8k.htm |
Exhibit 99.1
|
|
A leading provider of post‐acute services JP Morgan 2017 Healthcare Conference San Francisco, CA © 2017 by Genesis Healthcare, Inc. All Rights Reserved. |
|
|
Safe Harbor Statement Certain statements in this presentation regarding the expected benefits of the Skilled Healthcare transaction, future opportunities for the Company and any other statements regarding the Company’s future expectations, beliefs, goals, strategies or prospects contained in this presentation constitute “forward-looking statements” under Section 27A of the Securities Act of 1933 and Section 21E of the Securities Exchange Act of 1934. Forward-looking statements may be preceded by, followed by or include the words “may,” “will,” “believe,” “expect,” “anticipate,” “intend,” “plan,” “estimate,” “could,” “might,” or “continue” or the negative or other variations thereof or comparable terminology. A number of important factors could cause actual events or results to differ materially from those indicated by such forward-looking statements, including changes in the Company’s reimbursement rates; healthcare reform legislation; the impact of government investigations and legal actions against the Company’s centers and other factors described in the most recent Annual Report on Form 10-K of the Company and elsewhere in the Company’s filings with the Securities and Exchange Commission. You should not place undue reliance on any of these forward-looking statements. Any forward-looking statement speaks only as of the date on which it is made, and the Company undertakes no obligation to update any such statement to reflect new information, or the occurrence of future events or changes in circumstances. References made in this presentation to "Genesis," "the Company," "we," "us" and "our" refer to Genesis Healthcare, Inc. and each of its wholly-owned companies. 2 |
|
|
Agenda Genesis Overview Long-Term Value Creation Opportunities Financial Summary |
|
|
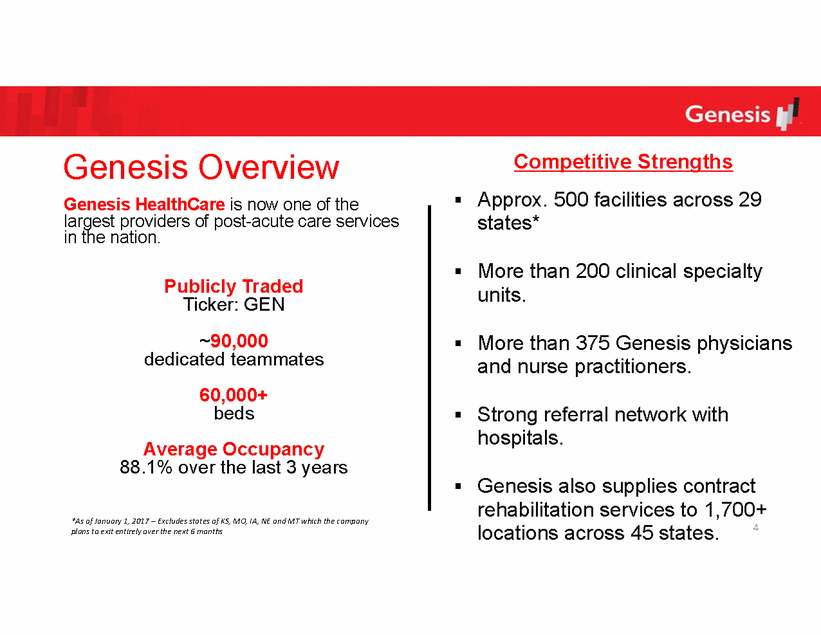
Genesis Overview Competitive Strengths Approx. 500 facilities across 29 states* Genesis HealthCare is now one of the largest providers of post-acute care services in the nation. More than 200 clinical specialty units. Publicly Traded Ticker: GEN ~90,000 dedicated teammates 60,000+ beds More than 375 Genesis physicians and nurse practitioners. Strong referral network with hospitals. Average Occupancy 88.1% over the last 3 years Genesis also supplies contract rehabilitation services to 1,700+ *As of January 1, 2017 – Excludes states of KS, MO, IA, NE and MT which the company plans to exit entirely over the next 6 months locations across 45 states. 4 |
|
|
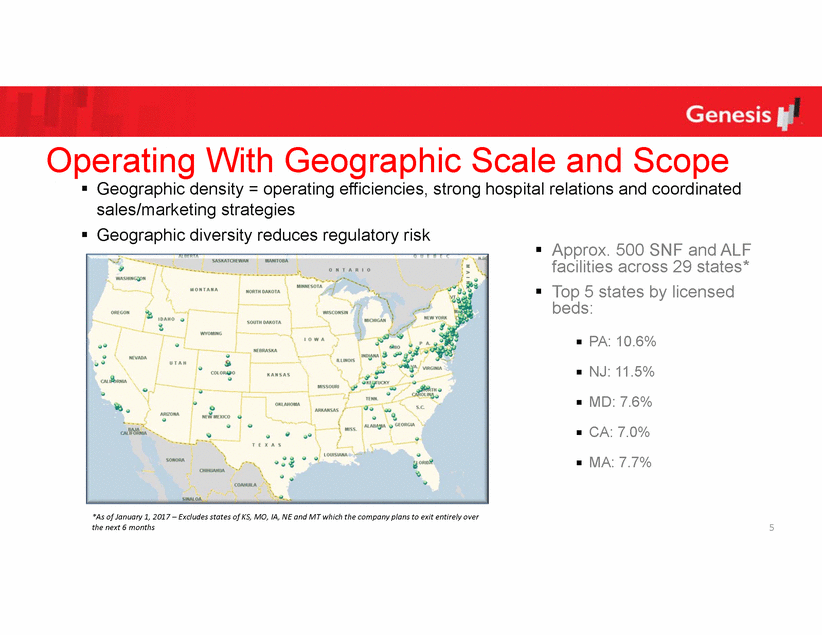
Operating With Geographic Scale and Scope sales/marketing strategies Geographic density = operating efficiencies, strong hospital relations and coordinated Geographic diversity reduces regulatory risk Approx. 500 SNF and ALF facilities across 29 states* Top 5 states by licensed beds: PA: 10.6% NJ: 11.5% MD: 7.6% CA: 7.0% MA: 7.7% *As of January 1, 2017 – Excludes states of KS, MO, IA, NE and MT which the company plans to exit entirely over the next 6 months 5 |
|
|
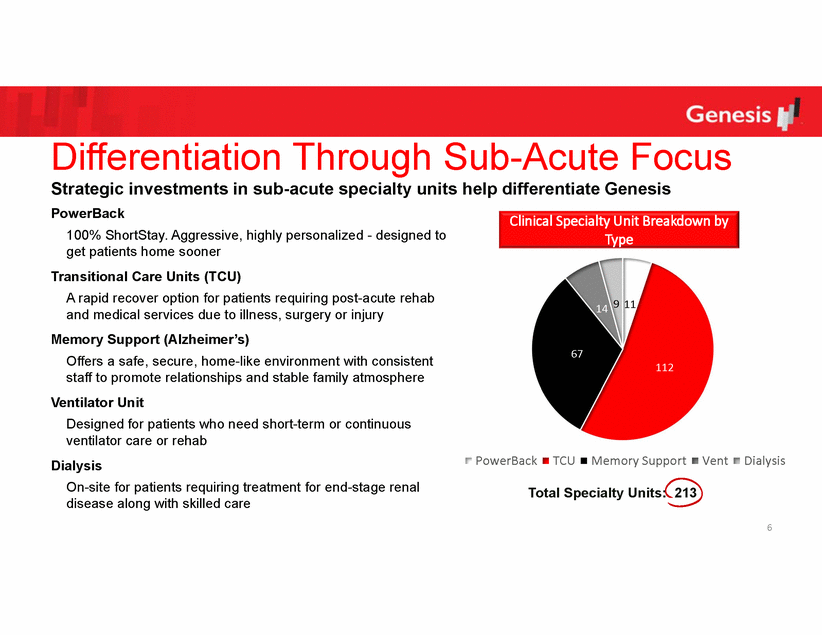
Differentiation Through Sub-Acute Focus Strategic investments in sub-acute specialty units help differentiate Genesis PowerBack 100% ShortStay. Aggressive, highly personalized - designed to get patients home sooner Transitional Care Units (TCU) A rapid recover option for patients requiring post-acute rehab and medical services due to illness, surgery or injury Memory Support (Alzheimer’s) Offers a safe, secure, home-like environment with consistent staff to promote relationships and stable family atmosphere Ventilator Unit Designed for patients who need short-term or continuous ventilator care or rehab Dialysis On-site for patients requiring treatment for end-stage renal disease along with skilled care Clinical Specialty Unit Breakdown by Type 9 11 14 67 112 PowerBack TCU Memory Support Vent Dialysis Total Specialty Units: 213 6 |
|
|
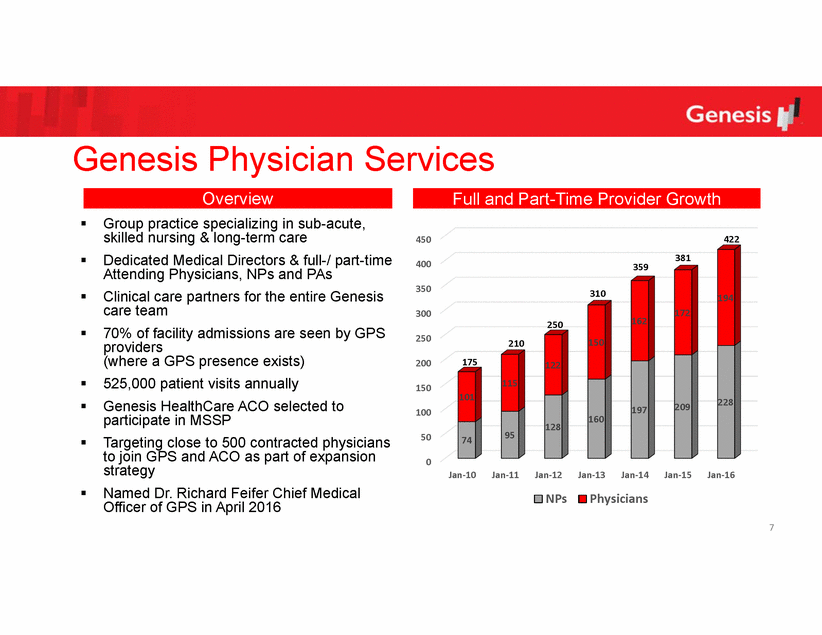
Genesis Physician Services Overview Full and Part-Time Provider Growth Group practice specializing in sub-acute, skilled nursing & long-term care Dedicated Medical Directors & full-/ part-time Attending Physicians, NPs and PAs Clinical care partners for the entire Genesis care team 70% of facility admissions are seen by GPS providers (where a GPS presence exists) 525,000 patient visits annually Genesis HealthCare ACO selected to participate in MSSP Targeting close to 500 contracted physicians to join GPS and ACO as part of expansion strategy Named Dr. Richard Feifer Chief Medical Officer of GPS in April 2016 450 422 381 400 359 350 310 194 172 300 162 250 250 150 210 175 200 122 115 150 101 228 209 197 100 160 128 95 50 74 0 Jan‐10 Jan‐11 Jan‐12 Jan‐13 Jan‐14 Jan‐15 Jan‐16 NPs Physicians 7 |
|
|
Agenda Genesis Overview Long-Term Value Creation Opportunities Financial Summary |
|
|
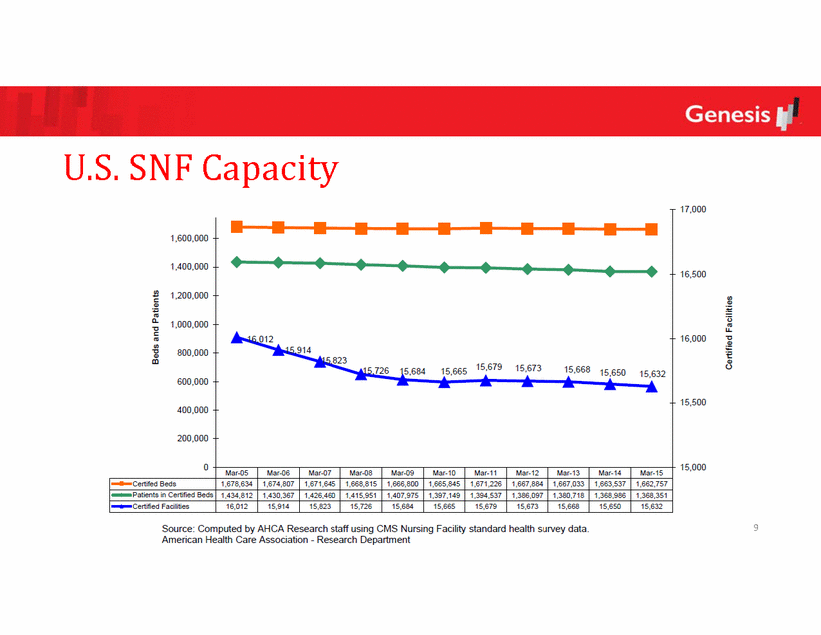
U.S. SNF Capacity 9 |
|
|
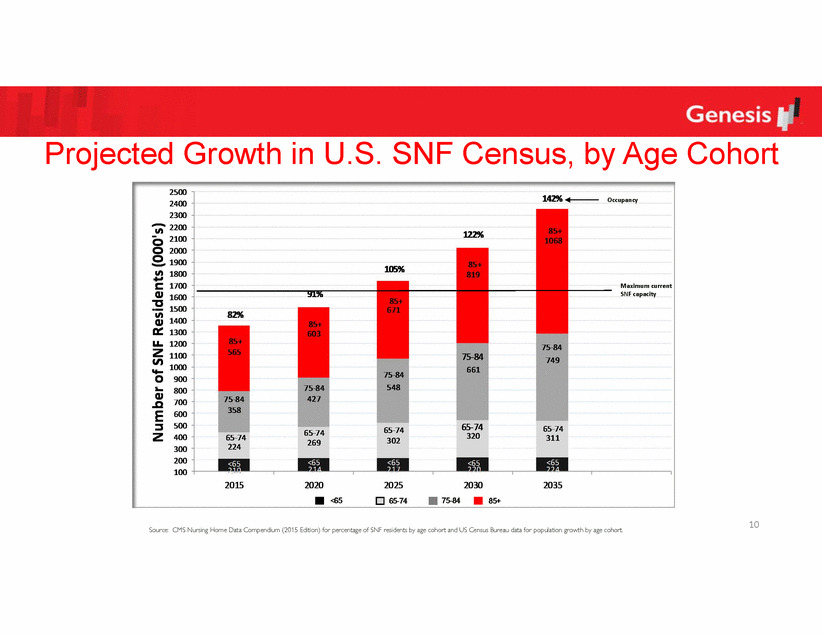
Projected Growth in U.S. SNF Census, by Age Occupancy Cohort Maximum current SNF capacity 10 Source: CMS Nursing Home Data Compendium (2015 Edition) for percentage of SNF residents by age cohort and US Census Bureau data for population growth by age cohort. |
|
|
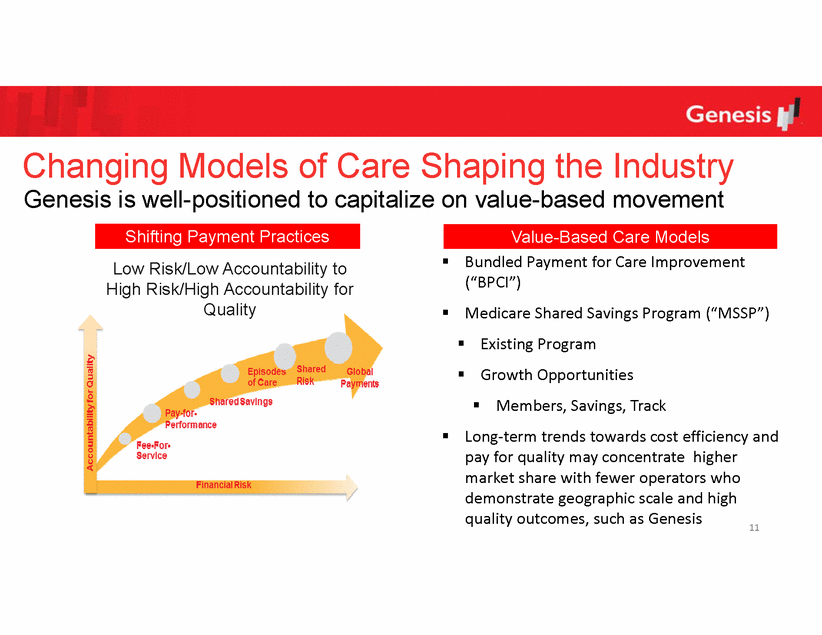
Changing Models of Care Shaping the Industry Genesis is well-positioned to capitalize on value-based movement Bundled Payment for Care Improvement (“BPCI”) Medicare Shared Savings Program (“MSSP”) Existing Program Growth Opportunities Low Risk/Low Accountability to High Risk/High Accountability for Quality Members, Savings, Track Long‐term trends towards cost efficiency and pay for quality may concentrate higher market share with fewer operators who demonstrate geographic scale and high quality outcomes, such as Genesis 11 Value-Based Care Models Shifting Payment Practices |
|
|
Unlocking the Value of Genesis’ Ancillary Businesses In addition to favorable U.S. demographic supply / demand dynamics and Genesis’ leading edge in the value-based transformation, Genesis is positioned for value three undervalued ancillary businesses: creation in its Genesis Physician Services/ Genesis ACO Genesis Rehab Services GRS China 12 |
|
|
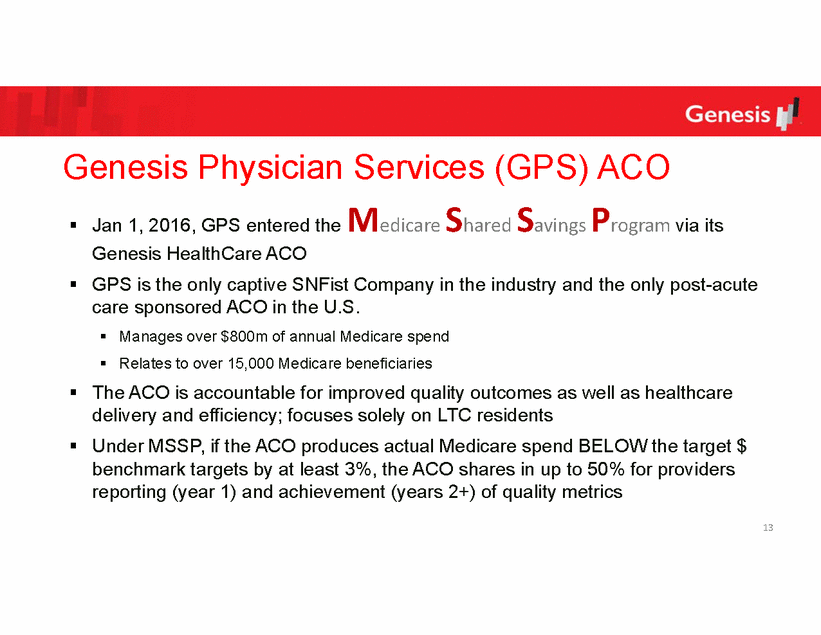
Genesis Physician Services (GPS) ACO Jan 1, 2016, GPS entered the Medicare Shared Savings Program via its Genesis HealthCare ACO GPS is the only captive SNFist Company in the industry and the only post-acute care sponsored ACO in the U.S. Manages over $800m of annual Medicare spend Relates to over 15,000 Medicare beneficiaries The ACO is accountable for improved quality outcomes as well as healthcare delivery and efficiency; focuses solely on LTC residents Under MSSP, if the ACO produces actual Medicare spend BELOW the target $ benchmark targets by at least 3%, the ACO shares in up to 50% for providers reporting (year 1) and achievement (years 2+) of quality metrics 13 |
|
|
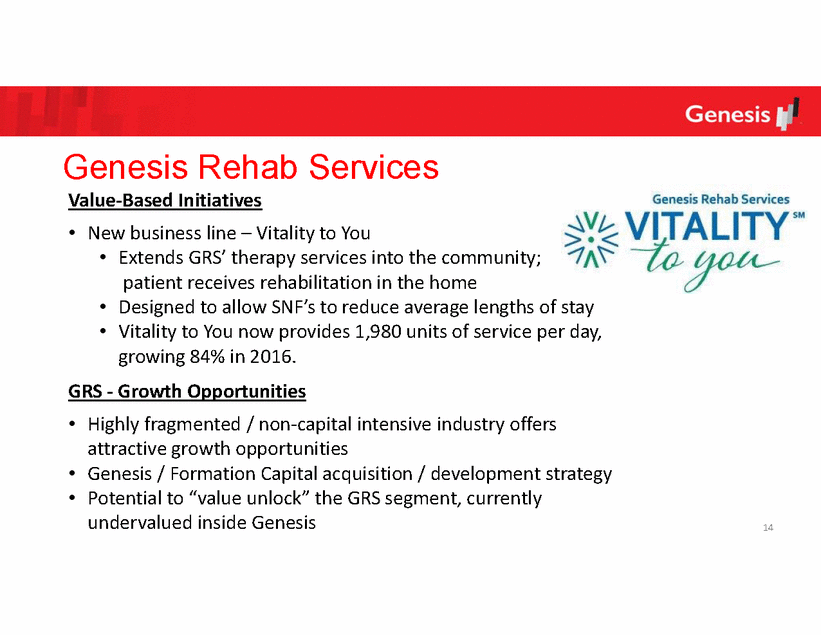
Genesis Rehab Services Va lue‐Based Initiatives • New business line – Vitality to You • Extends GRS’ therapy services into the community; patient receives rehabilitation in the home Designed to allow SNF’s to reduce average lengths of stay Vitality to You now provides 1,980 units of service per day, growing 84% in 2016. • • GRS ‐ Growth Opportunities • Highly fragmented / non‐capital intensive industry offers attractive growth opportunities Genesis / Formation Capital acquisition / development strategy Potential to “value unlock” the GRS segment, currently undervalued inside Genesis • • 14 |
|
|
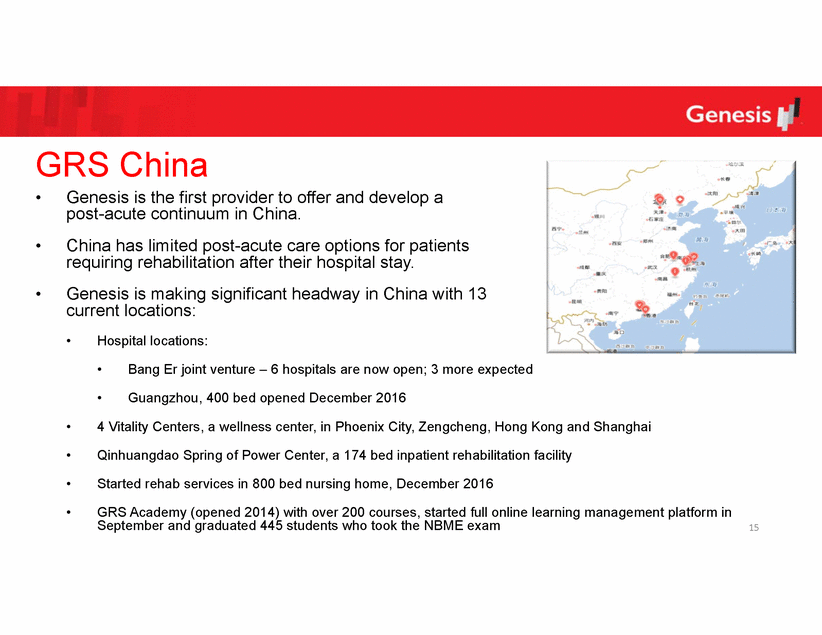
GRS China • Genesis is the first provider to offer and develop a post-acute continuum in China. China has limited post-acute care options for patients requiring rehabilitation after their hospital stay. Genesis is making significant headway in China with 13 current locations: • • • Hospital locations: • Bang Er joint venture – 6 hospitals are now open; 3 more expected • Guangzhou, 400 bed opened December 2016 • 4 Vitality Centers, a wellness center, in Phoenix City, Zengcheng, Hong Kong and Shanghai • Qinhuangdao Spring of Power Center, a 174 bed inpatient rehabilitation facility • Started rehab services in 800 bed nursing home, December 2016 • GRS Academy (opened 2014) with over 200 courses, started full online learning management platform in September and graduated 445 students who took the NBME exam 15 |
|
|
Agenda Genesis Overview Long-Term Value Creation Opportunities Financial Summary |
|
|
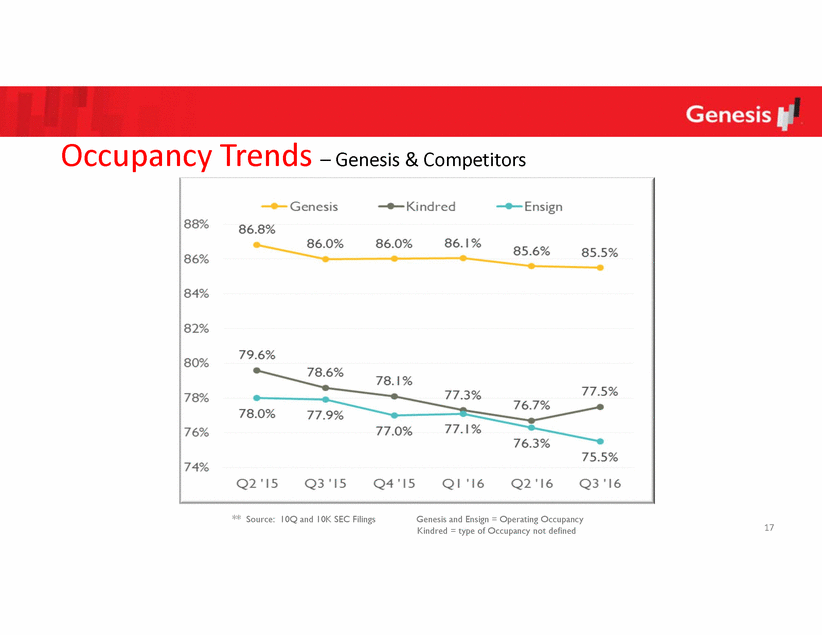
Occupancy Trends – Genesis & Competitors ** Source: 10Q and 10K SEC Filings Genesis and Ensign = Operating Occupancy Kindred = type of Occupancy not defined 17 |
|
|
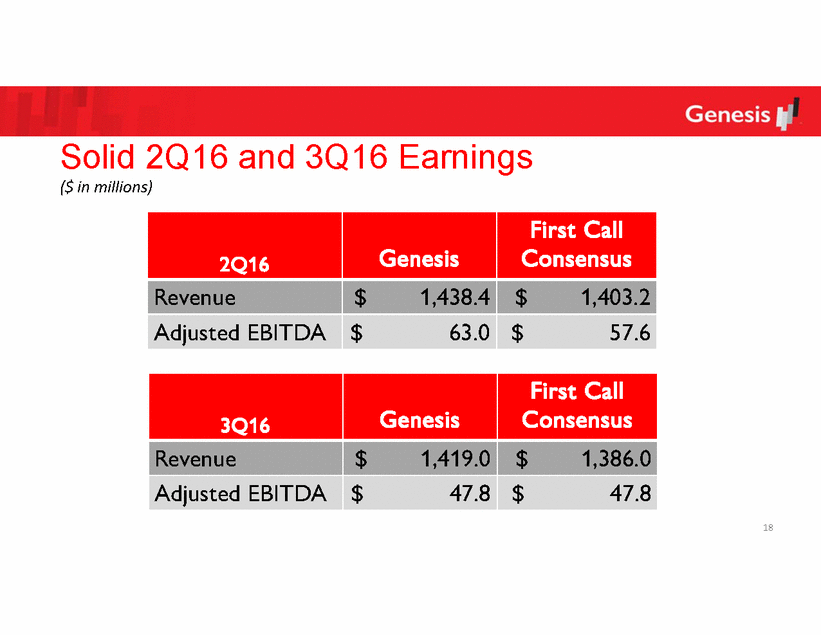
Solid 2Q16 ($ in millions) and 3Q16 Earnings 18 3Q16 Genesis First Call Consensus Revenue $1,419.0 $1,386.0 Adjusted EBITDA $47.8 $47.8 2Q16 Genesis First Call Consensus Revenue $1,438.4 $1,403.2 Adjusted EBITDA $63.0 $57.6 |
|
|
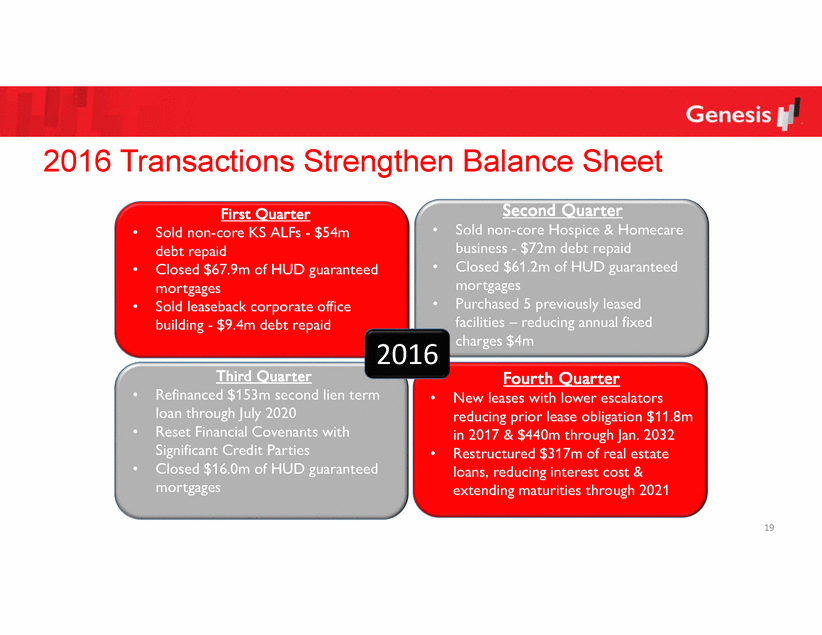
2016 Transactions Strengthen Balance Sheet Second Quarter First Quarter • Sold non-core Hospice & Homecare business - $72m debt repaid Closed $61.2m of HUD guaranteed mortgages Purchased 5 previously leased facilities – reducing annual fixed charges $4m • Sold non-core KS ALFs - $54m debt repaid Closed $67.9m of HUD guaranteed mortgages Sold leaseback corporate office building - $9.4m debt repaid • • • • 2016 Third Quarter Fourth Quarter • Refinanced $153m second lien term loan through July 2020 Reset Financial Covenants with Significant Credit Parties Closed $16.0m of HUD guaranteed mortgages • New leases with lower escalators reducing prior lease obligation $11.8m in 2017 & $440m through Jan. 2032 Restructured $317m of real estate loans, reducing interest cost & extending maturities through 2021 • • • 19 |
|
|
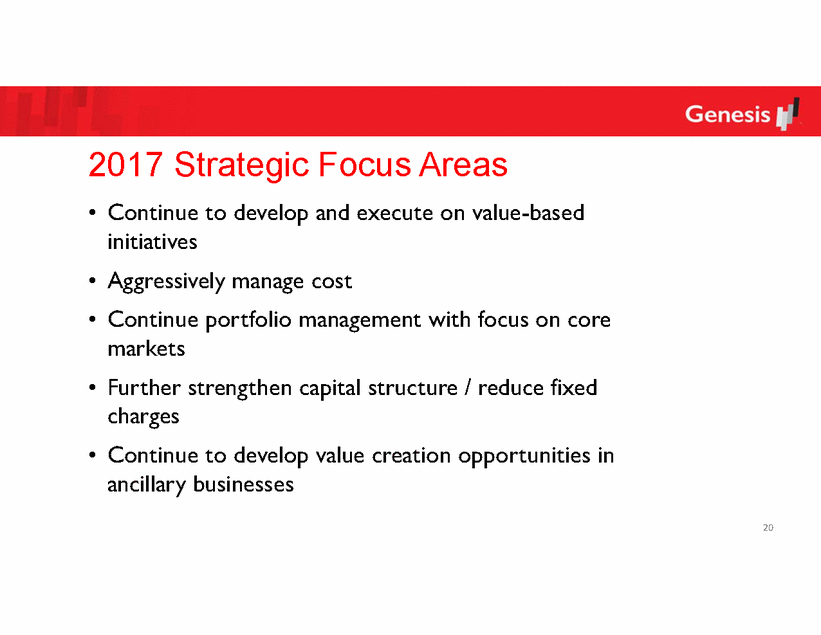
2017 Strategic Focus Areas • Continue to develop and execute on value-based initiatives Aggressively manage cost Continue portfolio management with focus on core markets Further strengthen capital structure / reduce fixed charges Continue to develop value creation opportunities in ancillary businesses • • • • 20 |
|
|
Appendix |
|
|
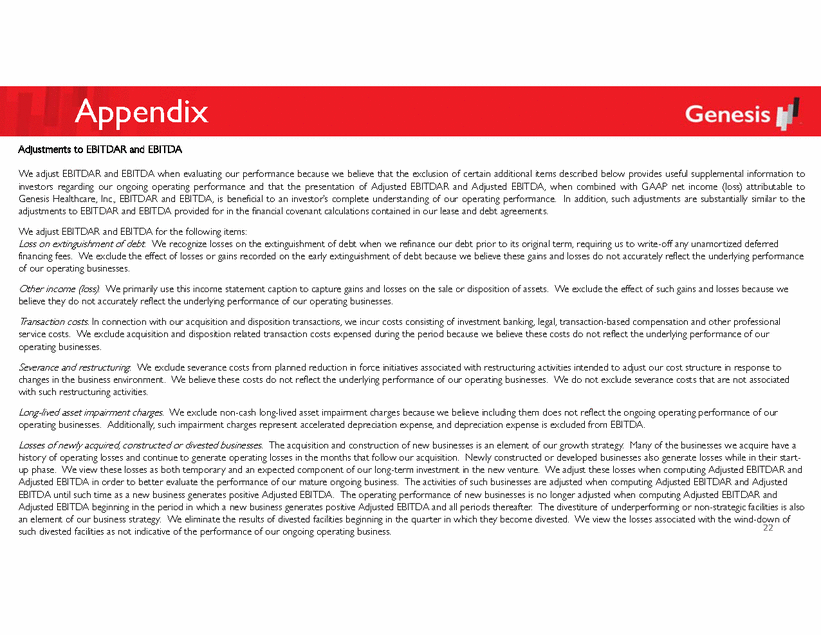
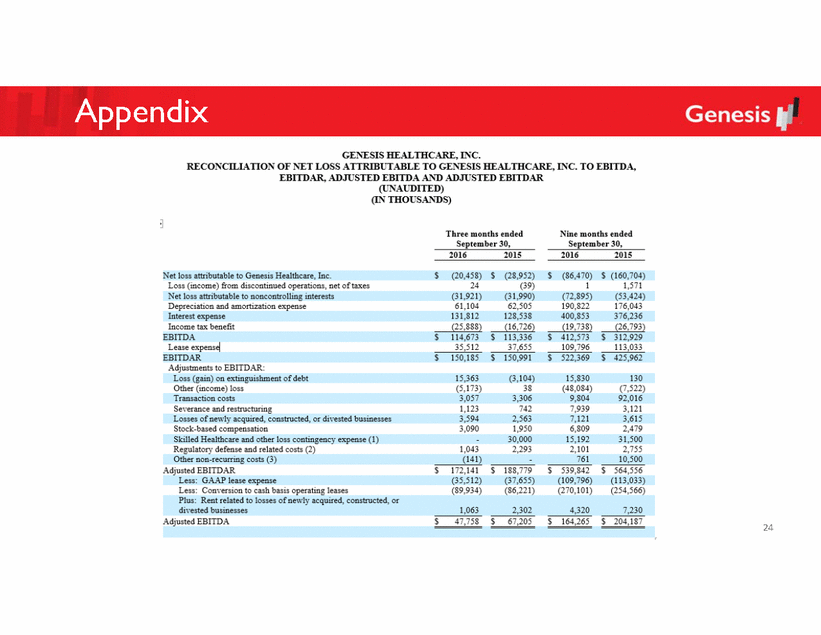
Appendix Adjustments to EBITDAR and EBITDA We adjust EBITDAR and EBITDA when evaluating our performance because we believe that the exclusion of certain additional items described below provides useful supplemental information to investors regarding our ongoing operating performance and that the presentation of Adjusted EBITDAR and Adjusted EBITDA, when combined with GAAP net income (loss) attributable to Genesis Healthcare, Inc., EBITDAR and EBITDA, is beneficial to an investor’s complete understanding of our operating performance. In addition, such adjustments are substantially similar to the adjustments to EBITDAR and EBITDA provided for in the financial covenant calculations contained in our lease and debt agreements. We adjust EBITDAR and EBITDA for the following items: Loss on extinguishment of debt. We recognize losses on the extinguishment of debt when we refinance our debt prior to its original term, requiring us to write-off any unamortized deferred financing fees. We exclude the effect of losses or gains recorded on the early extinguishment of debt because we believe these gains and losses do not accurately reflect the underlying performance of our operating businesses. Other income (loss). We primarily use this income statement caption to capture gains and losses on the sale or disposition of assets. We exclude the effect of such gains and losses because we believe they do not accurately reflect the underlying performance of our operating businesses. Transaction costs. In connection with our acquisition and disposition transactions, we incur costs consisting of investment banking, legal, transaction-based compensation and other professional service costs. We exclude acquisition and disposition related transaction costs expensed during the period because we believe these costs do not reflect the underlying performance of our operating businesses. Severance and restructuring. We exclude severance costs from planned reduction in force initiatives associated with restructuring activities intended to adjust our cost structure in response to changes in the business environment. We believe these costs do not reflect the underlying performance of our operating businesses. We do not exclude severance costs that are not associated with such restructuring activities. Long-lived asset impairment charges. We exclude non-cash long-lived asset impairment charges because we believe including them does not reflect the ongoing operating performance of our operating businesses. Additionally, such impairment charges represent accelerated depreciation expense, and depreciation expense is excluded from EBITDA. Losses of newly acquired, constructed or divested businesses. The acquisition and construction of new businesses is an element of our growth strategy. Many of the businesses we acquire have a history of operating losses and continue to generate operating losses in the months that follow our acquisition. Newly constructed or developed businesses also generate losses while in their start-up phase. We view these losses as both temporary and an expected component of our long-term investment in the new venture. We adjust these losses when computing Adjusted EBITDAR and Adjusted EBITDA in order to better evaluate the performance of our mature ongoing business. The activities of such businesses are adjusted when computing Adjusted EBITDAR and Adjusted EBITDA until such time as a new business generates positive Adjusted EBITDA. The operating performance of new businesses is no longer adjusted when computing Adjusted EBITDAR and Adjusted EBITDA beginning in the period in which a new business generates positive Adjusted EBITDA and all periods thereafter. The divestiture of underperforming or non-strategic facilities is also an element of our business strategy. We eliminate the results of divested facilities beginning in the quarter in which they become divested. We view the losses associated with the wind-down of 22 such divested facilities as not indicative of the performance of our ongoing operating business. |
|
|
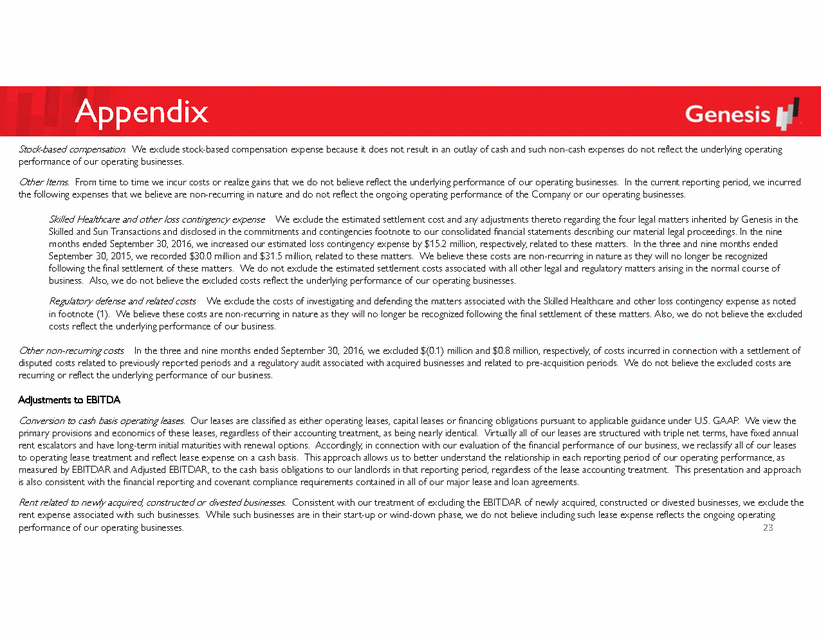
Appendix Stock-based compensation. We exclude stock-based compensation expense because it does not result in an outlay of cash and such non-cash expenses do not reflect the underlying operating performance of our operating businesses. Other Items. From time to time we incur costs or realize gains that we do not believe reflect the underlying performance of our operating businesses. In the current reporting period, we incurred the following expenses that we believe are non-recurring in nature and do not reflect the ongoing operating performance of the Company or our operating businesses. Skilled Healthcare and other loss contingency expense – We exclude the estimated settlement cost and any adjustments thereto regarding the four legal matters inherited by Genesis in the Skilled and Sun Transactions and disclosed in the commitments and contingencies footnote to our consolidated financial statements describing our material legal proceedings. In the nine months ended September 30, 2016, we increased our estimated loss contingency expense by $15.2 million, respectively, related to these matters. In the three and nine months ended September 30, 2015, we recorded $30.0 million and $31.5 million, related to these matters. We believe these costs are non-recurring in nature as they will no longer be recognized following the final settlement of these matters. We do not exclude the estimated settlement costs associated with all other legal and regulatory matters arising in the normal course of business. Also, we do not believe the excluded costs reflect the underlying performance of our operating businesses. Regulatory defense and related costs – We exclude the costs of investigating and defending the matters associated with the Skilled Healthcare and other loss contingency expense as noted in footnote (1). We believe these costs are non-recurring in nature as they will no longer be recognized following the final settlement of these matters. Also, we do not believe the excluded costs reflect the underlying performance of our business. Other non-recurring costs – In the three and nine months ended September 30, 2016, we excluded $(0.1) million and $0.8 million, respectively, of costs incurred in connection with a settlement of disputed costs related to previously reported periods and a regulatory audit associated with acquired businesses and related to pre-acquisition periods. We do not believe the excluded costs are recurring or reflect the underlying performance of our business. Adjustments to EBITDA Conversion to cash basis operating leases. Our leases are classified as either operating leases, capital leases or financing obligations pursuant to applicable guidance under U.S. GAAP. We view the primary provisions and economics of these leases, regardless of their accounting treatment, as being nearly identical. Virtually all of our leases are structured with triple net terms, have fixed annual rent escalators and have long-term initial maturities with renewal options. Accordingly, in connection with our evaluation of the financial performance of our business, we reclassify all of our leases to operating lease treatment and reflect lease expense on a cash basis. This approach allows us to better understand the relationship in each reporting period of our operating performance, as measured by EBITDAR and Adjusted EBITDAR, to the cash basis obligations to our landlords in that reporting period, regardless of the lease accounting treatment. This presentation and approach is also consistent with the financial reporting and covenant compliance requirements contained in all of our major lease and loan agreements. Rent related to newly acquired, constructed or divested businesses. Consistent with our treatment of excluding the EBITDAR of newly acquired, constructed or divested businesses, we exclude the rent expense associated with such businesses. While such businesses are in their start-up or wind-down phase, we do not believe including such lease expense reflects the ongoing operating performance of our operating businesses. 23 |
|
|
Appendix 24 |

