Attached files
| file | filename |
|---|---|
| EX-21 - EXHIBIT 21 - Genesis Healthcare, Inc. | a2014-ex21.htm |
| EX-23.1 - EXHIBIT 23.1 - Genesis Healthcare, Inc. | a2014-ex231.htm |
| EX-32 - EXHIBIT 32 - Genesis Healthcare, Inc. | a20141231-ex32.htm |
| EX-31.1 - EXHIBIT 31.1 - Genesis Healthcare, Inc. | a20141231-ex311.htm |
| EX-31.2 - EXHIBIT 31.2 - Genesis Healthcare, Inc. | a20141231-ex312.htm |
| EXCEL - IDEA: XBRL DOCUMENT - Genesis Healthcare, Inc. | Financial_Report.xls |
UNITED STATES
SECURITIES AND EXCHANGE COMMISSION
Washington, D.C. 20549
FORM 10-K
(Mark One)
þ | ANNUAL REPORT PURSUANT TO SECTION 13 OR 15(d) OF THE SECURITIES EXCHANGE ACT OF 1934 |
For the Fiscal Year Ended December 31, 2014
OR
£ | TRANSITION REPORT PURSUANT TO SECTION 13 OR 15(d) OF THE SECURITIES EXCHANGE ACT OF 1934 |
Commission File Number 001-33459
Genesis Healthcare, Inc.
(Exact Name of Registrant as Specified in its Charter)
Delaware | 20-3934755 | |
(State of Incorporation) | (I.R.S. Employer Identification Number) | |
101 East State Street Kennett Square, Pennsylvania | 19348 | |
(Address of Principal Executive Offices) | (Zip Code) | |
Registrant’s telephone number: (610) 444-6350
Securities registered pursuant to Section 12(b) of the Act:
Class A Common Stock, $0.001 par value per share | New York Stock Exchange | |
(Title of each class) | (Name of each exchange on which registered) | |
Securities registered pursuant to Section 12(g) of the Act: None
Indicate by check mark if the registrant is a well-known seasoned issuer, as defined in Rule 405 of the Securities Act. Yes ¨ No þ
Indicate by check mark if the registrant is not required to file reports pursuant to Section 13 or Section 15(d) of the Act. Yes ¨ No þ
Indicate by check mark whether the registrant (1) has filed all reports required to be filed by Section 13 or 15(d) of the Securities Exchange Act of 1934 during the preceding 12 months (or for such shorter period that the registrant was required to file such reports), and (2) has been subject to such filing requirements for the past 90 days. Yes þ No ¨
Indicate by check mark whether the registrant has submitted electronically and posted on its corporate Web site, if any, every Interactive Data File required to be submitted and posted pursuant to Rule 405 of Regulation S-T during the preceding 12 months (or for such shorter period that the registrant was required to submit and post such files). Yes þ No ¨
Indicate by check mark if disclosure of delinquent filers pursuant to Item 405 of Regulation S-K is not contained herein, and will not be contained, to the best of registrant’s knowledge, in definitive proxy or information statements incorporated by reference in Part III of this Form 10-K or any amendment to this Form 10-K. ¨
Indicate by check mark whether the registrant is a large accelerated filer, an accelerated filer, a non-accelerated filer or a smaller reporting company. See definitions of "large accelerated filer," "accelerated filer" and "smaller reporting company" in Rule 12b-2 of the Exchange Act:
Large accelerated filer | ¨ | Accelerated filer | þ | |
Non-accelerated filer | ¨ | Smaller Reporting Company | ¨ | |
Indicate by check mark whether the registrant is a shell company (as defined in Rule 12b-2 of the Act). Yes ¨ No þ
As of June 30, 2014, the last business day of the registrant's most recently completed second fiscal quarter, the aggregate market value of the shares of Class A common stock, par value $0.001 per share, and Class B common stock, par value $0.001 per share, held by non-affiliates of the registrant, computed based on the closing sale price of $6.29 per share on June 30, 2014, as reported by The New York Stock Exchange, was approximately $155.7 million. The aggregate number of shares held by non-affiliates is calculated by excluding all shares held by executive officers, directors and holders known to hold 5% or more of the voting power of the registrant’s common stock. As of February 18, 2015, there were 73,592,083 shares of the registrant’s Class A common stock issued and outstanding, 15,511,603 shares of the registrant’s Class B common stock issued and outstanding, and 64,449,380 shares of the registrants Class C common stock, par value $0.001 per share, issued and outstanding. The Class C common stock did not exist as of June 30, 2014.
Documents Incorporated by Reference:
The information called for by Part III is incorporated by reference to the Definitive Proxy Statement for the 2015 Annual Meeting of Stockholders of the Registrant which will be filed with the U.S. Securities and Exchange Commission not later than April 30, 2015.
Genesis Healthcare, Inc.
Annual Report
Index
Page | ||
Item 1. | ||
Item 1A. | ||
Item 1B. | ||
Item 2. | ||
Item 3. | ||
Item 4. | ||
Item 5. | ||
Item 6. | ||
Item 7. | ||
Item 7A. | ||
Item 8. | ||
Item 9. | ||
Item 9A. | ||
Item 9B. | ||
Item 10. | ||
Item 11. | ||
Item 12. | ||
Item 13. | ||
Item 14. | ||
Item 15. | ||
PART I
Item 1. | Business |
Overview
Genesis Healthcare, Inc. ("Genesis") is a holding company with subsidiaries that, on a combined basis, as of the date of this report, comprise one of the nation's largest post-acute care providers with more than 500 skilled nursing centers and assisted/senior living communities in 34 states nationwide. Genesis subsidiaries also supply rehabilitation and respiratory therapy to more than 1,800 healthcare providers in 47 states and the District of Columbia. In addition, Genesis subsidiaries provide a full complement of administrative and consultative services to our affiliated operators and third-party operators with whom we contract to better focus on delivery of healthcare services. There were 25 such service agreements with unaffiliated or jointly owned skilled nursing facility operators. All of our healthcare operating subsidiaries focus on providing high-quality care to the people we serve, and our skilled nursing facility subsidiaries, which comprise the largest portion of our consolidated business, have a strong commitment to treating patients who require a high level of skilled nursing care and extensive rehabilitation therapy, whom we refer to as high-acuity patients.
On February 2, 2015, Genesis completed the previously announced combination transaction (the "Combination") with FC-GEN Operations Investment, LLC ("FC-GEN"). FC-GEN, now a subsidiary of Genesis, offers inpatient services through its network of 416 skilled nursing and assisted living facilities across 28 states, consisting of 382 skilled nursing facilities and 34 assisted living facilities. Of the 416 facilities, 389 are leased, 18 are managed, six are joint ventures and three are owned. Collectively, these skilled nursing and assisted living facilities have 49,123 licensed beds, approximately 49% of which are concentrated in the states of Massachusetts, Maryland, New Jersey, Pennsylvania and West Virginia. See "Note 18 - Combination with FC-GEN and Item 7 - Management’s Discussion and Analysis of Financial Conditions and Results of Operations - Liquidity and Capital Resources," for further details.
The disclosures in this report generally relate to a period prior to the February 2, 2015 closing of the Combination. As a result, the terms "Skilled," "we," "us," "our" and the "Company," and similar terms used in this report, refer collectively to Genesis prior to the Combination (then named "Skilled Healthcare Group, Inc.") and its then consolidated wholly-owned subsidiaries and do not give effect to the Combination, unless the context requires otherwise.
Genesis is a holding company and substantially all of its assets are its controlling equity interests in FC-GEN. The following diagram depicts the current organizational structure of Genesis subsequent to the Combination:

1
Operations
As of December 31, 2014, we owned or leased 73 skilled nursing facilities and 22 assisted living facilities, together comprising 10,275 licensed beds. We also lease five skilled nursing facilities in California to an unaffiliated third party operator. Our skilled nursing and assisted living facilities are located in California, Texas, Iowa, Kansas, Missouri, Nebraska, Nevada and New Mexico, and are generally clustered in large urban or suburban markets. We owned 77.0% of these facilities as of December 31, 2014. As of December 31, 2014, we provided hospice and home health services in Arizona, Idaho, Montana, Nevada, and New Mexico. We also provided private duty care services in Arizona, Idaho, Montana, and Nevada. For the year ended December 31, 2014, we generated approximately 75.2% of our revenue from our skilled nursing facilities, including our integrated rehabilitation therapy services at these facilities. The remainder of our revenue is generated from our assisted living services, rehabilitation therapy services provided to third-party facilities, hospice care and home health services.
Our services focus primarily on the medical and physical issues facing elderly patients and are provided by our skilled nursing companies, assisted living companies, integrated and third-party rehabilitation therapy business, hospice business and home health business. We have a strong commitment to treating patients who require a high level of skilled nursing care and extensive rehabilitation therapy, whom we refer to as high-acuity patients.
As of December 31, 2014, we had three reportable operating segments: (1) long-term care ("LTC"), which includes the operation of skilled nursing facilities and assisted living facilities and is the largest portion of our business; (2) therapy services, which includes our integrated and third-party rehabilitation therapy services; and (3) hospice and home health services, which includes our hospice and home health businesses. Our administrative and consultative services that are attributable to the reportable operating segments are allocated among the segments accordingly. For the twelve months ended December 31, 2014, the LTC operating segment generated approximately 79.3% of our revenue, with the therapy services segment and hospice and home health services segment accounting for 10.8% and 9.9% of our revenue, respectively. For additional information regarding the financial performance of our reportable operating segments, see Item 7, Management's Discussion and Analysis of Financial Condition and Results of Operations—Revenue and Note 6, "Business Segments," in the notes to our consolidated financial statements included elsewhere in this report.
Long-Term Care Services Segment
Skilled Nursing Facilities
As of December 31, 2014, our skilled nursing companies provided skilled nursing care at 73 regionally clustered facilities, having 9,063 licensed beds, in California, Texas, Iowa, Kansas, Missouri, Nebraska, Nevada and New Mexico. We have developed programs for, and actively market our services to, high-acuity patients who are typically admitted to our facilities as they recover from strokes, other neurological conditions, cardiovascular and respiratory ailments, joint replacements and other muscular or skeletal disorders. As of December 31, 2014, we employed approximately 8,816 active employees in our skilled nursing business.
We use interdisciplinary teams of experienced medical professionals, including therapists, to provide services prescribed by physicians. These teams include registered nurses, licensed practical nurses, certified nursing assistants and other professionals who provide individualized comprehensive nursing care 24 hours a day. Many of our skilled nursing facilities are equipped to provide specialty care, such as chemotherapy, enteral/parenteral nutrition, tracheotomy care and ventilator care. We also provide standard services to each of our skilled nursing patients, including room and board, special nutritional programs, social services, recreational activities and related healthcare and other services.
Our Express Recovery™ program uses a dedicated unit within a skilled nursing facility to deliver a comprehensive rehabilitation regimen in accommodations specifically designed to serve high-acuity patients. Each Express Recovery™ unit can typically be entered without using the main facility entrance, permitting residents to bypass portions of the facility dedicated to the traditional nursing home patient. Each Express Recovery™ unit typically has 12 to 36 beds and provides skilled nursing care and rehabilitation therapy for patients recovering from conditions such as joint replacement surgery, and cardiac and respiratory ailments. We believe that having an Express Recovery™ unit at a facility enables the facility to more effectively attract higher acuity patients and achieve a higher skilled mix than it would be able to without the unit, which in turn results in higher reimbursement rates. Skilled mix is the average daily number of Medicare and managed care patients we serve at our skilled nursing facilities divided by the average daily number of total patients we serve at our skilled nursing facilities. As of December 31, 2014, we operated 64 Express Recovery™ units with 2,307 beds. We have substantially completed the build out of our Express Recovery™ units at our skilled nursing facilities. We will continue to add and modify Express Recovery™ units in the future as warranted.
Our administrative service company provides a full complement of administrative and consultative services that allows our affiliated operators and unaffiliated third-party operators with whom we contract to better focus on delivery of healthcare services. We currently have one such service agreement with an unaffiliated facility operator. The income associated with the services our administrative service company provides to the third-party facility operator is included in LTC in our segment reporting as services are performed primarily by personnel supporting the LTC segment. Each of our facilities operates as a
2
distinct company to better focus on service delivery and is supported by the administrative service company for efficient delivery of non-healthcare support services.
Assisted Living Facilities
We complement our skilled nursing care business by providing assisted living services at 22 facilities with 1,212 beds as of December 31, 2014. Our assisted living companies, which are mostly in Kansas, provide residential accommodations, activities, meals, security, housekeeping and assistance in the activities of daily living to seniors who are independent or who require some support, but not the level of nursing care provided in a skilled nursing facility. Our independent living units are non-licensed independent living apartments in which residents are independent and require no support with the activities of daily living. As of December 31, 2014, we employed approximately 640 active employees in our assisted and independent living businesses.
Equity Investment in Pharmacy Joint Venture
We have a 50% equity interest in APS - Summit Care Pharmacy, LLC, or APS - Summit Care, which is a joint venture that serves the pharmaceutical needs of a limited number of our Texas operations, as well as a number of other unaffiliated customers. The remaining 50% equity interest in APS - Summit Care is owned by an unaffiliated third party. APS - Summit Care operates a pharmacy in Austin, Texas, through which we pay market value for prescription drugs and receive a 50% share of the net income related to the joint venture. For additional information regarding the joint venture, see Note 15, "Investment in Unconsolidated Joint Venture."
Therapy Services Segment
Rehabilitation Therapy Services
As of December 31, 2014, we provided rehabilitation therapy services to a total of 175 healthcare facilities, including 63 facilities owned by us. In addition, we have contracts to manage the rehabilitation therapy services for our 10 healthcare facilities in New Mexico. We provide rehabilitation therapy services at our skilled nursing facilities as part of an integrated service offering in connection with our skilled nursing care. We believe that an integrated approach to treating high-acuity patients enhances our ability to achieve successful patient outcomes and enables us to identify and treat patients who can benefit from our rehabilitation therapy services. We believe hospitals and physician groups often refer high-acuity patients to our skilled nursing facilities because they recognize the value of an integrated approach to providing skilled nursing care and rehabilitation therapy services.
We believe that we have also established a strong reputation as a premium provider of rehabilitation therapy services to third-party skilled nursing operators in our local markets, with a recognized ability to provide these services to high-acuity patients. Our approach to providing rehabilitation therapy services for third-party operators emphasizes high-quality treatment and successful clinical outcomes. As of December 31, 2014, we employed approximately 2,448 active employees (primarily therapists) in our rehabilitation therapy business.
Hospice and Home Health Services Segment
Hospice Care
As of December 31, 2014, we provided hospice care services in Arizona, California, Nevada, Idaho, Montana, and New Mexico. Hospice services focus on the physical, spiritual and psychosocial needs of terminally ill individuals and their families, and consist primarily of palliative and clinical care, education and counseling. As of December 31, 2014, we employed approximately 679 active employees in our hospice services business.
Home Health
As of December 31, 2014, we provided home health care services in Arizona, Nevada, Idaho, Montana and New Mexico. Our home health care services generally consist of providing some combination of the services of registered nurses, speech, occupational and physical therapists, medical social workers and certified home health aides. Home health care is often a cost-effective solution for patients, and can also increase their quality of life and allow them to receive quality medical care in the comfort and convenience of a familiar setting. As of December 31, 2014, we employed approximately 442 active employees in our home health business.
Revenue Sources
Within our skilled nursing facilities, we generate our revenue from Medicare, Medicaid, managed care providers, insurers, private pay and other sources. Within our assisted living facilities, we generate revenue primarily from private pay sources, with a small portion earned from Medicaid or other state-specific programs. With respect to our rehabilitation therapy services business, it receives payment from the third-party facilities that it serves based on negotiated patient per diem rates or a
3
negotiated fee schedule based on the type of services rendered. Our rehabilitation therapy business also similarly negotiates rates and fees with our affiliated facilities that it services, but the revenue it generates from those facilities is included in our revenue from our skilled nursing facilities. We derive substantially all of the revenue from our hospice business from Medicare and managed care reimbursement. We derive the majority of our revenue from our home health business from Medicare and managed care. For additional information regarding the revenue we generate by service offering, our revenue sources, and regulatory and other governmental actions affecting revenue, see Item 7, "Management's Discussion and Analysis of Financial Condition and Results of Operation - Revenue Sources."
Industry Trends
Medicare and Medicaid Reimbursement
Rising healthcare costs due to a variety of factors, including an aging population and increasing life expectancies, has in recent years increased demand for post-acute healthcare services, such as skilled nursing, assisted living, home health care, hospice care and rehabilitation therapy. In an effort to mitigate the cost of providing healthcare benefits, third party payors including Medicare, Medicaid, managed care providers, insurance companies and others have increasingly encouraged the treatment of patients in lower-cost care settings. As a result, in recent years skilled nursing facilities, which typically have significantly lower cost structures than acute care hospitals and certain other post-acute care settings, have generally been serving larger populations of higher-acuity patients than in the past. Despite this growth in demand, uncertainty over Medicare and Medicaid reimbursement rates persists as rates have often been reduced or been increased in lesser amounts than expected. Medicare and Medicaid reimbursement rates are subject to change from time to time and, because revenue derived directly or indirectly from Medicare and Medicaid reimbursement has historically comprised the most significant portion of our consolidated revenue, a reduction or slow growth in rates could materially and adversely impact our revenue, particularly in times of increased regulation and related expenses.
Medicare reimburses our skilled nursing facilities under a prospective payment system ("PPS") for certain inpatient covered services. Under the PPS, facilities are paid a predetermined amount per patient, per day, for certain services based on the anticipated costs of treating patients. The amount to be paid is determined by classifying each patient into a resource utilization group ("RUG") category that is based upon each patient's acuity level. In October 2010, the number of RUG categories was expanded from 53 to 66 as part of the implementation of the RUGs IV system and the introduction of a revised and substantially expanded patient assessment tool called the minimum data set (MDS) version 3.0.
On July 29, 2011, the Centers for Medicare & Medicaid Services ("CMS") issued a final rule providing for, among other things, a net 11.1% reduction in PPS payments to skilled nursing facilities for CMS's fiscal year 2012 (which began October 1, 2011) as compared to PPS payments in CMS's fiscal year 2011 (which ended September 30, 2011). The 11.1% reduction was on a net basis, after the application of a 2.7% market basket increase, and reduced by a 1.0% multi-factor productivity adjustment required by the Patient Protection and Affordable Care Act of 2010 ("PPACA"). The final CMS rule also adjusted the method by which group therapy is counted for reimbursement purposes, and changed the timing in which patients who are receiving therapy must be reassessed for purposes of determining their RUG category.
The Budget Control Act of 2011, enacted on August 2, 2011, increased the United States debt ceiling in connection with deficit reductions over the next ten years. Under the Budget Control Act of 2011, $1.2 trillion in domestic and defense spending reductions were automatically set to begin February 1, 2013, split evenly between domestic and defense spending. Payments to Medicare providers are subject to these automatic spending reductions, subject to a 2% cap. As discussed below, the American Taxpayer Relief Act of 2012 (the “ATRA”), enacted on January 2, 2013, subsequently delayed by two months the automatic budget sequestration cuts established by the Budget Control Act of 2011. The automatic 2% reduction on each claim submitted to Medicare began on April 1, 2013. Reductions to Medicare and Medicaid reimbursement resulting from the Budget Control Act of 2011 could have a material adverse effect on the Company's business, financial position, results of operations and liquidity.
The Middle Class Tax Relief and Job Creation Act of 2012 was signed into law on February 22, 2012, extending the Medicare Part B outpatient therapy cap exceptions process through December 31, 2012. As noted below, the exceptions process was further extended for an additional year through the end of 2013. The statutory Medicare Part B outpatient therapy cap for occupational therapy (OT) was $1,900 for 2013, and the combined cap for physical therapy (PT) and speech-language pathology services (SLP) was also $1,900 for 2013. This is the annual per beneficiary therapy cap amount determined for each calendar year. Similar to the therapy cap, the law requires an exceptions process to the therapy cap that allows providers to receive payment from Medicare for medically necessary therapy services above the therapy cap amount. Congress established a threshold of $3,700 for PT and SLP services combined and another threshold of $3,700 for OT services. All therapy services rendered above the $3,700 are subject to manual medical review ("MMR") and may be denied unless approved by the provider's Medicare Administrative Contractor (or "MAC").
On July 27, 2012, CMS issued a final rule providing for, among other things, a net 1.8% increase in PPS payments to skilled nursing facilities for CMS's fiscal year 2013 (which began October 1, 2012 and runs through September 30, 2013) as compared to PPS payments in CMS's fiscal year 2012 (which ended September 30, 2012). The 1.8% increase was on a net basis, after the application of a 2.5% market basket increase, and reduced by a 0.7% multi-factor productivity adjustment required by Patient Protection and Affordable Care Act of 2010 ("PPACA"). After our wage index adjustment, our net increase was 1.7%.
In July 2012, CMS issued its final rule for hospice services for its 2013 fiscal year. The rule included a market basket increase of 2.6% less a 0.3% reduction in the market basket as a result of the PPACA and a 0.7% reduction due to productivity adjustment. After our wage index adjustment, our net increase was 0.9%.
On July 31, 2013, CMS issued its final rule providing for, among other things, a net increase of 1.3% in PPS payments to skilled nursing facilities for CMS's fiscal year 2014 (which began October 1, 2013) as compared to the PPS payments in CMS's fiscal year 2013 (which ended September 30, 2013). The 1.3% increase is on a net basis, after the application of a 2.3% market basket increase reduced by a 0.5% forecast error correction and further reduced by 0.5% multi-factor productivity adjustment required by the PPACA.
On July 31, 2014, CMS issued its final rule providing for, among other things, a net increase of 2.0% in PPS payments to skilled nursing facilities for CMS fiscal year 2015 (which began October 1, 2014) as compared to the PPS payments in CMS fiscal year 2014 (which ended September 30, 2014). The 2.0% increase is on a net basis, after the application of a 2.5% market basket increase reduced by a 0.5% multi-factor productivity adjustment required by the PPACA. There was no forecast error adjustment.
On August 4, 2014, CMS issued its final rule providing for a net increase of 1.4% for payments to hospices serving Medicare beneficiaries for CMS' fiscal year 2015. The hospice payment increase would be the net result of a proposed payment update to the hospice per diem rates of 2.1% market basket increase less a 0.7% decrease in payments to hospices due to updated wage data and the sixth year of CMS' seven-year-phase-out of its wage index budget neutrality adjustment factor.
The ATRA delayed by two months the automatic budget sequestration cuts established by the Budget Control Act of 2011. The ATRA also extended the therapy cap exception process for one year. The ATRA also made additional changes to the Multiple Procedure Payment Reduction ("MPPR") previously implemented in 2011. The existing discount to the practice component of multiple therapy procedures performed in an outpatient environment during a single day was 25%. Effective April 1, 2013, ATRA increased the discount by an additional 25% to 50%. The new rules related to MPPR have reduced our revenue for the fiscal year ended December 31, 2014.
Should future changes in PPS include further reduced rates or increased standards for reaching certain reimbursement levels (including as a result of automatic cuts tied to federal deficit cut efforts or otherwise), our Medicare revenues derived from our skilled nursing facilities (including rehabilitation therapy services provided at our skilled nursing facilities) could be reduced, with a corresponding adverse impact on our financial condition and results of operation. Our rehabilitation therapy, hospice and home health care businesses are also to a large degree directly or indirectly dependent on (and therefore affected by changes in) Medicare and Medicaid reimbursement rates. For example, our rehabilitation therapy business may have difficulty increasing or maintaining the rates it has negotiated with third party nursing facilities in light of the reduced PPS reimbursement rates that took effect on October 1, 2011 as discussed above or future reductions in reimbursement rates.
We also derive a substantial portion of our consolidated revenue from Medicaid reimbursement, primarily through our skilled nursing business. Medicaid programs are administered by the applicable states and financed by both state and federal funds. Medicaid spending nationally has increased substantially in recent years, becoming an increasingly significant component of state budgets. This, combined with slower state revenue growth and other state budget demands, has led both the federal government and many states, including California and other states in which we operate, to institute measures aimed at controlling the growth of Medicaid spending (and in some instances reducing it).
Historically, adjustments to reimbursement under Medicare and Medicaid have had a significant effect on our revenue and results of operations. Recently enacted, pending and proposed legislation and administrative rulemaking at the federal and state levels could have similar effects on our business. Efforts to impose reduced reimbursement rates, greater discounts and more stringent cost controls by government and other payors are expected to continue for the foreseeable future and could adversely affect our business, financial condition and results of operations. Additionally, any delay or default by the federal or state governments in making Medicare and/or Medicaid reimbursement payments could materially and adversely affect our business, financial condition and results of operations.
Federal Health Care Reform
In addition to the matters described above affecting Medicare and Medicaid participating providers, PPACA enacted several reforms with respect to skilled nursing facilities, home health agencies and hospices, including payment measures to realize significant savings of federal and state funds by deterring and prosecuting fraud and abuse in both the Medicare and
5
Medicaid programs. While many of the provisions of PPACA will not take effect for several years or are subject to further refinement through the promulgation of regulations, some key provisions of PPACA are presently effective.
• | Enhanced CMPs and Escrow Provisions. PPACA includes expanded civil monetary penalty ("CMP") and related provisions applicable to all Medicare and Medicaid providers. CMS rules adopted to implement applicable provisions of PPACA also provide that assessed CMPs may be collected and placed in whole or in part into an escrow pending final disposition of the applicable administrative and judicial appeals processes. To the extent our businesses are assessed large CMPs that are collected and placed into an escrow account pending lengthy appeals, such actions could adversely affect our liquidity and results of operations. |
• | Nursing Home Transparency Requirements. In addition to expanded CMP provisions, PPACA imposes new transparency requirements for Medicare-participating nursing facilities. In addition to previously required disclosures regarding a facility's owners, management and secured creditors, PPACA expanded the required disclosures to include information regarding the facility's organizational structure, additional information on officers, directors, trustees and "managing employees" of the facility (including their names, titles, and start dates of services), and information regarding certain parties affiliated with the facility. The transparency provisions could result in the potential for greater government scrutiny and oversight of the ownership and investment structure for skilled nursing facilities, as well as more extensive disclosure of entities and individuals that comprise part of skilled nursing facilities' ownership and management structure. |
• | Face-to-Face Encounter Requirements. PPACA imposes new patient face-to-face encounter requirements on home health agencies and hospices to establish a patient's ongoing eligibility for Medicare home health services or hospice services, as applicable. A certifying physician or other designated health care professional must conduct the face-to-face encounters within specified timeframes, and failure of the face-to-face encounter to occur and be properly documented during the applicable timeframes could render the patient's care ineligible for reimbursement under Medicare. |
• | Suspension of Payments During Pending Fraud Investigations. PPACA provides the federal government with expanded authority to suspend Medicare and Medicaid payments if a provider is investigated for allegations or issues of fraud. This suspension authority creates a new mechanism for the federal government to suspend both Medicare and Medicaid payments for allegations of fraud, independent of whether a state exercises its authority to suspend Medicaid payments pending a fraud investigation. To the extent the suspension of payments provision is applied to one of our businesses for allegations of fraud, such a suspension could adversely affect our liquidity and results of operations. |
• | Overpayment Reporting and Repayment; Expanded False Claims Act Liability. PPACA enacted several important changes that expand potential liability under the federal False Claims Act. Overpayments related to services provided to both Medicare and Medicaid beneficiaries must be reported and returned to the applicable payor within specified deadlines, or else they are considered obligations of the provider for purposes of the federal False Claims Act. This new provision substantially tightens the repayment and reporting requirements generally associated with operations of health care providers to avoid False Claims Act exposure. |
• | Home and Community Based Services. PPACA provides that states can provide home and community-based attendant services and supports through the Community First Choice State plan option. States choosing to provide home and community based services under this option must make them available to assist with activities of daily living, instrumental activities of daily living and health related tasks under a plan of care agreed upon by the individual and his/her representative. PPACA also includes additional measures related to the expansion of community and home based services and authorizes states to expand coverage of community and home-based services to individuals who would not otherwise be eligible for them. The expansion of home-and-community based services could reduce the demand for the facility based services that we provide. |
• | Health Care-Acquired Conditions. PPACA provides that the Secretary of Health and Human Services must prohibit payments to states for any amounts expended for providing medical assistance for certain medical conditions acquired during the patient's receipt of health care services. The CMS regulation implementing this provision of PPACA prohibits states from making payments to providers under the Medicaid program for conditions that are deemed to be reasonably preventable. It uses Medicare's list of preventable conditions in inpatient hospital settings as the base (adjusted for the differences in the Medicare and Medicaid populations) and provides states the flexibility to identify additional preventable conditions and settings for which Medicaid payment will be denied. |
6
• | Value-Based Purchasing. PPACA requires the Secretary of Health and Human Services to develop a plan to implement a value-based purchasing (“VBP”) program for payments under the Medicare program for skilled nursing facilities and to submit a report containing the plan to Congress. The intent of the provision is to potentially reconfigure how Medicare pays for health care services, moving the program towards rewarding better value, outcomes, and innovations, instead of volume. According to the plan submitted to Congress in June 2012, the funding for the VBP program could come from payment withholds from poor-performing skilled nursing facilities or by holding back a portion of the base payment rate or the annual update for all skilled nursing facilities. If a VBP program is ultimately implemented, it is uncertain what effect it would have upon skilled nursing facilities, but its funding or other provisions could negatively affect skilled nursing facilities. |
• | Anti-Kickback Statute Amendments. PPACA amended the Anti-Kickback Statute so that (i) a claim that includes items or services violating the Anti-Kickback Statute also would constitute a false or fraudulent claim under the federal False Claims Act and (ii) the intent required to violate the Anti-Kickback Statute is lowered such that a person need not have actual knowledge or specific intent to violate the Anti-Kickback Statute in order for a violation to be deemed to have occurred. These modifications of the Anti-Kickback Statute could expose us to greater risk of inadvertent violations of the statute and to related liability under the federal False Claims Act. |
The provisions of PPACA discussed above are examples of recently enacted federal health reform provisions that we believe may have a material impact on the long-term care profession generally and on our business. However, the foregoing discussion is not intended to constitute, nor does it constitute, an exhaustive review and discussion of PPACA. It is possible that other provisions of PPACA may be interpreted, clarified, or applied to our businesses in a way that could have a material adverse impact on our business, financial condition and results of operations. Similar federal and/or state legislation that may be adopted in the future could have similar effects.
Government Regulation
General
Healthcare is an area of extensive and frequent regulatory change. Our subsidiaries that provide healthcare services must comply with federal, state and local laws relating to, among other things, licensure, delivery and adequacy of medical care, distribution of pharmaceuticals, personnel and operating policies. Changes in the law or new interpretations of existing laws may have a significant impact on our methods and costs of doing business.
Governmental and other authorities periodically inspect our skilled nursing facilities, assisted living facilities, hospice agencies and home health agencies to verify that we continue to comply with their various standards. We must pass these inspections to continue our licensing under state law, to obtain certification under the Medicare and Medicaid programs, and, in some instances, to continue our participation in the Veterans Administration program. We can only participate in these third-party programs if inspections by regulatory authorities reveal that our facilities are in substantial compliance with applicable standards. In addition, regulatory authorities periodically inspect our recordkeeping and inventory control of controlled narcotics. From time to time, we, like others in the healthcare industry, may receive notices from federal and state regulatory authorities alleging that we failed to comply with applicable standards. These notices may require us to take corrective action, and may impose civil monetary penalties and other operating restrictions on us. If our facilities or agencies fail to comply with these directives or otherwise fail to comply substantially with licensure and certification laws, rules and regulations, they could lose their certification as a Medicare or Medicaid provider or lose their state operating licenses.
Civil and Criminal Fraud and Abuse Laws and Enforcement
Federal and state healthcare fraud and abuse laws regulate both the provision of services to government program beneficiaries and the methods and requirements for submitting claims for services rendered to such beneficiaries. Under these laws, individuals and organizations can be penalized for submitting claims for services that are not provided, that have been inadequately provided, billed in an incorrect manner or other than as actually provided, not medically necessary, provided by an improper person, accompanied by an illegal inducement to utilize or refrain from utilizing a service or product, or billed or coded in a manner that does not otherwise comply with applicable governmental requirements. Penalties also may be imposed for violation of anti-kickback and patient referral laws.
Federal and state governments have a range of criminal, civil and administrative sanctions available to penalize and remediate healthcare fraud and abuse, including exclusion of the provider from participation in the Medicare and Medicaid programs, fines, criminal and civil monetary penalties and suspension of payments and, in the case of individuals, imprisonment.
We have internal policies and procedures, including a compliance program designed to facilitate compliance with and to reduce exposure for violations of these and other laws and regulations. However, because enforcement efforts presently are
7
widespread within the industry and may vary from region to region, there can be no assurance that our internal policies and procedures will significantly reduce or eliminate exposure to civil or criminal sanctions or adverse administrative determinations.
Anti-Kickback Statute
Federal law commonly referred to as the Anti-Kickback Statute prohibits the knowing and willful offer, payment, solicitation or receipt of anything of value, directly or indirectly, in return for the referral of patients or arranging for the referral of patients, or in return for the recommendation, arrangement, purchase, lease or order of items or services that are covered by a federal healthcare program such as Medicare or Medicaid. Violation of the Anti-Kickback Statute is a felony, and sanctions for each violation include imprisonment of up to five years, significant criminal fines, significant civil monetary penalties plus three times the amount claimed or three times the remuneration offered, and exclusion from federal healthcare programs (including Medicare and Medicaid). Many states have adopted similar prohibitions against kickbacks and other practices that are intended to induce referrals applicable to all payors.
We are required under the Medicare conditions of participation and some state licensing laws to contract with numerous healthcare providers and practitioners, including physicians, hospitals and nursing homes, and to arrange for these individuals or entities to provide services to our patients. In addition, we have contracts with other suppliers, including pharmacies, ambulance services and medical equipment companies. Some of these individuals or entities may refer, or be in a position to refer, patients to us, and we may refer, or be in a position to refer, patients to these individuals or entities. Certain safe harbor provisions have been created, and compliance with a safe harbor ensures that the contractual relationship will not be found in violation of the Anti-Kickback Statute. We attempt to structure these arrangements in a manner that falls within one of the safe harbors. Some of these arrangements may not ultimately satisfy the applicable safe harbor requirements, but failure to meet the safe harbor does not necessarily mean an arrangement is illegal.
We believe that our arrangements with providers, practitioners and suppliers are in compliance with the Anti-Kickback Statute and similar state laws. However, if any of our arrangements with third parties were to be challenged and found to be in violation of the Anti-Kickback Statute, we could be subject to civil and criminal penalties, and we could be excluded from participating in federal and state healthcare programs such as Medicare and Medicaid. The occurrence of any of these events could significantly harm our business and financial condition.
Stark Law
Federal law commonly known as the Stark Law prohibits a physician from making referrals for particular healthcare services to entities with which the physician (or an immediate family member of the physician) has a financial relationship if the services are payable by Medicare or Medicaid. If an arrangement is covered by the Stark Law, the requirements of a Stark Law exception must be met for the physician to be able to make referrals to the entity for designated health services and for the entity to be able to bill for these services. Although the term “designated health services” does not include long-term care services, some of the services provided at our skilled nursing facilities and other related business units are classified as designated health services, including physical, speech and occupational therapy, as well as pharmacy and hospice services. The term “financial relationship” is defined very broadly to include most types of ownership or compensation relationships. The Stark Law also prohibits the entity receiving the referral from seeking payment from the patient or the Medicare and Medicaid programs for services rendered pursuant to a prohibited referral.
The Stark Law contains exceptions for certain physician ownership or investment interests in, and certain physician compensation arrangements with, certain entities. If a compensation arrangement or investment relationship between a physician, or immediate family member, and an entity satisfies the applicable requirements for a Stark Law exception, the Stark Law will not prohibit the physician from referring patients to the entity for designated health services. The exceptions for compensation arrangements cover employment relationships, personal services contracts and space and equipment leases, among others.
If an entity violates the Stark Law, it could be subject to significant civil penalties. The entity also may be excluded from participating in federal and state healthcare programs, including Medicare and Medicaid. If the Stark Law were found to apply to our relationships with referring physicians and no exception under the Stark Law were available, we would be required to restructure these relationships or refuse to accept referrals for designated health services from these physicians. If we were found to have submitted claims to Medicare or Medicaid for services provided pursuant to a referral prohibited by the Stark Law, we would be required to repay any amounts we received from Medicare or Medicaid for those services and could be subject to civil monetary penalties. Further, we could be excluded from participating in Medicare and Medicaid and other federal and state healthcare programs. If we were required to repay any amounts to Medicare or Medicaid, subjected to fines, or excluded from the Medicare and Medicaid Programs, our business and financial condition would be harmed significantly.
As directed by PPACA, in 2010 CMS released a self-referral disclosure protocol (“SRDP”) for potential or actual violations of the Stark Law. Under SRDP, CMS states that it may, but is not required to, reduce the amounts due and owing for a Stark Law violation, and will consider the following factors in deciding whether to grant a reduction: (1) the nature and extent
8
of the improper or illegal practice; (2) the timeliness of the self-disclosure; (3) the cooperation in providing additional information related to the disclosure; (4) the litigation risk associated with the matter disclosed; and (5) the financial position of the disclosing party.
Many states have physician relationship and referral statutes that are similar to the Stark Law. These laws generally apply regardless of the payor. We believe that our operations are structured to comply with the Stark Law and applicable state laws with respect to physician relationships and referrals. However, any finding that we are not in compliance with these laws could require us to change our operations or could subject us to penalties. This, in turn, could significantly harm our business and financial condition.
False Claims
Federal and state laws prohibit the submission of false claims and other acts that are considered fraudulent or abusive. The submission of claims to a federal or state healthcare program for items and services that are “not provided as claimed” may lead to the imposition of significant civil monetary penalties, significant criminal fines and imprisonment, and/or exclusion from participation in state and federally-funded healthcare programs, including the Medicare and Medicaid programs. Allegations of poor quality of care can also lead to false claims suits as prosecutors allege that the provider has represented to the government healthcare program that adequate care is provided and the lack of quality care causes the service to be “not provided as claimed.”
Under the federal False Claims Act ("FCA"), actions against a provider can be initiated by the federal government or by a private party on behalf of the federal government. These private parties, who are often referred to as “qui tam relators” or “relators,” are entitled to share in any amounts recovered by the government. Both direct enforcement activity by the government and qui tam relator actions have increased significantly in recent years. The use of private enforcement actions against healthcare providers has increased dramatically, in part because the relators are entitled to share in a portion of any settlement or judgment. This development has increased the risk that a healthcare company will have to defend a false claims action, pay fines or settlement amounts or be excluded from the Medicare and Medicaid programs, and other federal and state healthcare programs as a result of an investigation arising out of false claims laws. Many states have enacted similar laws providing for imposition of civil and criminal penalties for the filing of fraudulent claims.
Because we submit thousands of claims to Medicare each year, and there is a relatively long statute of limitations under the FCA, there is a risk that intentional, or even negligent or recklessly submitted claims that prove to be incorrect, or even billing errors, cost reporting errors or lapses in statutory or regulatory compliance with regard to the provision of health care services (including, without limitation the Anti-Kickback Statue and the federal self-referral law discussed above), could result in significant civil or criminal penalties against us. For example, see Note 13, "Commitment and Contingencies - Legal Matters," for information regarding matters in which the government is pursuing, or has expressed an intent to pursue, legal remedies against us under the FCA and similar state laws. In addition to FCA concerns, federal law makes it a felony to fail to disclose to the government an overpayment once the recipient has knowledge of the overpayment.
We believe that our operations comply with the FCA and similar state laws. However, if our claims practices were challenged and found to violate the applicable laws, any finding that we are not in compliance with these laws could require us to change our operations or could subject us to penalties or make us ineligible to participate in certain government funded healthcare programs, which could in turn significantly harm our business and financial condition.
Patient Privacy and Security Laws
There are numerous legislative and regulatory requirements at the federal and state levels addressing patient privacy and security of health information. The Health Insurance Portability and Accountability Act of 1996 (“HIPAA”) contains provisions that require us to adopt and maintain business procedures designed to protect the privacy, security and integrity of patients' individual health information. States also have laws that apply to the privacy of healthcare information. We must comply with these state privacy laws to the extent that they are more protective of healthcare information or provide additional protections not afforded by HIPAA.
HIPAA's security standards were designed to protect electronic information against reasonably anticipated threats or hazards to the security or integrity of the information and to protect the information against unauthorized use or disclosure. These standards have had and are expected to continue to have a significant impact on the health care industry because they impose extensive requirements and restrictions on the use and disclosure of identifiable patient information. In addition, HIPAA established uniform standards governing the conduct of certain electronic healthcare transactions and protecting the privacy and security of certain individually identifiable health information.
The Health Information Technology for Clinical Health Act of 2009 ("HITECH Act"), and predecessor laws in California, expanded the requirements and noncompliance penalties under HIPAA and California privacy law and require correspondingly intensive compliance efforts by companies such as ours, including self-disclosures of breaches of unsecured health information to affected patients, federal officials, and, in some cases, the media. These laws make unauthorized access (i.e., “snooping”) by
9
our employees illegal and subject to self-disclosure and penalties. Other states may adopt similar or more extensive breach notice and privacy requirements. Compliance with these regulations could require us to make significant investments of money and other resources. We believe that we are in substantial compliance with applicable state and federal regulations relating to privacy and security of patient information. However, if we fail to comply with the applicable regulations, we could be subject to significant penalties and other adverse consequences.
Federal Health Care Reform
In addition to the provisions described above affecting Medicare and Medicaid participating providers, the PPACA enacted several reforms with respect to skilled nursing facilities and hospices, including payment measures to realize significant savings of federal and state funds by deterring and prosecuting fraud and abuse in both the Medicare and Medicaid programs. See “Industry Trends-Federal Health Care Reform” above for additional information regarding PPACA.
Certificates of Need and Other Regulatory Matters
Certain states administer a certificate of need program, which applies to the incurrence of capital expenditures, the offering of certain new institutional health services, the cessation of certain services and the acquisition of major medical equipment. Such legislation also stipulates requirements for such programs, including that each program be consistent with the respective state health plan in effect pursuant to such legislation and provide for penalties to enforce program requirements. To the extent that certificates of need or other similar approvals are required for expansion of our operations, either through acquisitions, expansion or provision of new services or other changes, such expansion could be affected adversely by the failure or inability to obtain the necessary approvals, changes in the standards applicable to such approvals or possible delays and expenses associated with obtaining such approvals.
State Operating License Requirements
Nursing homes, assisted living facilities, pharmacies, hospice agencies and home health agencies are required to be individually licensed or certified under applicable state law and as a condition of participation under the Medicare program. In addition, healthcare professionals and practitioners are required to be licensed in most states. We believe that our operating companies and personnel that provide these services have all required regulatory approvals necessary for our current operations. The failure to obtain, retain or renew any required license could adversely affect our operations, including our financial results.
Rehabilitation License Requirements
Our rehabilitation therapy services operations are subject to various federal and state regulations, primarily regulations of individual practitioners. Therapists and other healthcare professionals employed by us are required to be individually licensed or certified under applicable state law. We take measures to ensure that our therapists and other healthcare professionals are properly licensed and participate in required continuing education programs. The failure to obtain, retain or renew any required license or certifications by therapists or other healthcare professionals could adversely affect our operations, including our financial results.
Regulation of our Joint Venture Institutional Pharmacy
Our joint venture institutional pharmacy operations, which include medical equipment and supplies, are subject to extensive federal, state and local regulation relating to, among other things, operational requirements, reimbursement, documentation, licensure, certification and regulation of pharmacies, pharmacists, drug compounding and manufacture and controlled substances.
Under federal law, dispensers of controlled substances must register with the Drug Enforcement Administration, file reports of inventories and transactions and provide adequate security measures. Failure to comply with such requirements or other laws applicable to pharmacies could result in significant civil or criminal penalties. The Medicare and Medicaid programs also establish certain requirements for participation of pharmacy suppliers.
Competition
Our skilled nursing facilities compete primarily on a local and regional basis with many long-term care providers, from national and regional chains to smaller providers owning as few as a single nursing center. We also compete under certain circumstances with inpatient rehabilitation facilities and long-term acute care hospitals. Our ability to compete successfully varies from location to location and depends on a number of factors, including the number of competing facilities in the local market, the types of services available, our local reputation for quality care of patients, the commitment and expertise of our caregivers, our local service offerings and treatment programs, the cost of care in each locality, and the physical appearance, location, age and condition of our facilities.
10
We seek to compete effectively in each market by establishing a reputation within the local community for quality of care, attractive and comfortable facilities, and providing specialized healthcare with an emphasized focus on high-acuity patients. Programs targeting high-acuity patients, including our Express Recovery™ units, generally have a higher staffing level per patient than our other inpatient facilities and compete more directly with inpatient rehabilitation facilities and long-term acute-care hospitals. We believe that the average cost to a third-party payor for the treatment of our typical high-acuity patient is lower if that patient is treated in one of our skilled nursing facilities than if that same patient were to be treated in an inpatient rehabilitation facility or long-term acute-care hospital.
Our other services, such as assisted living facilities, rehabilitation therapy provided to third-party facilities, hospice care and home health services, and institutional pharmacy services, also compete with local, regional, and national companies. The primary competitive factors in these businesses are similar to those for our skilled nursing facilities and include reputation, cost of services, quality of clinical services, responsiveness to patient/resident needs, location and the ability to provide support in other areas such as third-party reimbursement, information management and patient recordkeeping.
Increased competition could limit our ability to attract and retain patients, maintain or increase rates or to expand our business. Some of our competitors have greater financial and other resources than we have, may have greater brand recognition and may be more established in their respective communities than we are. Competing companies may also offer newer facilities or different programs or services than we do and may as a result be more attractive to our current patients, to potential patients and to referral sources. Some of our competitors may accept lower profit margins than we do, which could present significant price competition, particularly for managed care and private pay patients.
With respect to hospice services, while non-profit organizations have historically operated a significant majority of all hospice programs, for-profit companies have begun to occupy a larger share of the hospice market. Increasing public awareness of hospice services, the aging of the U.S. population and favorable reimbursement by Medicare, which is the primary payor for hospice services, have contributed to the recent growth in the hospice care market. As more companies enter the market to provide hospice services, we will face increasing competitive pressure.
Labor
Our most significant operating cost is labor. We seek to manage our labor costs by improving staffing retention, maintaining competitive labor rates, and reducing reliance on overtime compensation and temporary staffing services.
As of December 31, 2014, we had approximately 13,025 active employees and had eight collective bargaining agreements with unions covering approximately 531 active employees at seven of our skilled nursing facilities. Labor costs accounted for approximately 69.5%, 67.3% and 68.5% of our operating expenses (excluding impairment charges) from continuing operations for the years ended December 31, 2014, 2013 and 2012, respectively. Following the Combination with FC-GEN, the combined company had approximately 95,000 employees. We generally consider our relationship with our employees to be good.
Risk Management
We have developed a risk management program intended to stabilize our insurance and professional liability costs. As part of this program, we have implemented an arbitration agreement system at each of our nursing facilities under which, upon admission, patients are requested (but not required) to execute an agreement that requires disputes to be arbitrated instead of litigated in court. We believe that this program accelerates resolution of disputes and has significantly reduced our liability exposure and related costs. We have also established an incident reporting process that involves periodic follow-up with our facility administrators to monitor the progress of claims and losses. We believe that our emphasis on providing high-quality care and our attention to monitoring quality of care indicators has also helped to reduce our liability exposure and related costs.
Insurance
We maintain a variety of types of insurance, including general and professional liability, workers' compensation, employee benefits liability, property, casualty, directors' and officers' liability, crime, boiler and machinery, automobile, employment practices liability and earthquake and flood. We believe that our insurance programs are adequate and where there has been a direct transfer of risk to the insurance carrier, we do not recognize a liability in our consolidated financial statements. We self-insure a significant portion of our potential liabilities for several risks, including certain types of general and professional liability, workers' compensation, and employee benefit insurance. To the extent our insurance coverage is insufficient or unavailable to cover losses that we incur that would otherwise be insurable, or to the extent that our estimates of anticipated liabilities that we self-insure are significantly lower than the actual self-insured liabilities that we incur, our financial condition and results of operations could be materially and adversely affected. For additional information regarding our insurance programs, see Note 13, “Commitments and Contingencies - Insurance,” in the financial statements included elsewhere in this report.
Environmental Matters
11
We are subject to a wide variety of federal, state and local environmental and occupational health and safety laws and regulations. As a healthcare provider, we face regulatory requirements in areas of air and water quality control, medical and low-level radioactive waste management and disposal, asbestos management, response to mold and lead-based paint in our facilities and employee safety.
In our role as owner and/or operator of our facilities (including our leased facilities), we also may be required to investigate and remediate hazardous substances that are located on the property, including any such substances that may have migrated off, or discharged or transported from the property. Part of our operations involves the handling, use, storage, transportation, disposal and/or discharge of hazardous, infectious, toxic, flammable and other hazardous materials, wastes, pollutants or contaminants. These activities may result in damage to individuals, property or the environment; may interrupt operations and/or increase costs; may result in legal liability, damages, injunctions or fines; may result in investigations, administrative proceedings, penalties or other governmental agency actions; and may not be covered by insurance. We believe that we are in material compliance with applicable environmental and occupational health and safety requirements. However, there can be no assurance that we will not incur environmental liabilities in the future, and such liabilities may result in material adverse consequences to our operations and financial condition.
Customers
No individual customer or client accounts for a significant portion of our revenue. We do not expect that the loss of a single customer or client would have a material adverse effect on our business, results of operations or financial condition.
Available Information
Our Annual Reports on Form 10-K, Quarterly Reports on Form 10-Q, Current Reports on Form 8-K, and amendments to reports filed pursuant to Sections 13(a) and 15(d) of the Securities Exchange Act of 1934, as amended, are filed with the U.S. Securities and Exchange Commission ("SEC"). Such reports and other information filed by us with the SEC are available free of charge at the investor relations section of our website at www.genesishcc.com as soon as reasonably practicable after such reports are electronically filed with, or furnished to, the SEC. Copies are also available, without charge, by writing to Genesis Healthcare, Inc. Investor Communications, 101 East State Street, Kennett Square, PA 19348. Reports filed with the SEC may be viewed at www.sec.gov or obtained at the SEC Public Reference Room located at 100 F Street, NE, Washington, D.C. 20549. Information regarding the operation of the Public Reference Room may be obtained by calling the SEC at 1-800-SEC-0330. The inclusion of our website address in this annual report does not include or incorporate by reference the information on our website into this annual report.
Company History
Genesis Healthcare, Inc. was incorporated as SHG Holding Solutions, Inc. in Delaware in October 2005. Our predecessor company acquired Summit Care Corporation, a publicly traded long-term care company with nursing facilities in California, Texas and Arizona, in 1998. In October 2001, our predecessor and 19 of its subsidiaries filed voluntary petitions for protection under Chapter 11 of the U.S. Bankruptcy Code and in November 2001, our remaining three companies also filed voluntary petitions for protection under Chapter 11. In August 2003, we emerged from bankruptcy, paying or restructuring all debt holders in full, paying all accrued interest expenses and issuing 5.0% of our common stock to former bondholders.
In February 2007, we effected the merger of our predecessor company, which was our wholly-owned subsidiary, with and into us. We were the surviving company in the merger and changed our name from SHG Holding Solutions, Inc. to Skilled Healthcare Group, Inc. As a result of the merger, we assumed all of the rights and obligations of our predecessor company.
In June 2009, the United States Bankruptcy Court for the Central District of California granted entry of a final decree closing the aforementioned Chapter 11 cases.
On February 2, 2015, we completed the previously announced Combination with FC-GEN and changed the company name from "Skilled Healthcare Group, Inc." to "Genesis Healthcare, Inc." See "Note 18 - Combination with FC-GEN and Item 7 - Management’s Discussion and Analysis of Financial Conditions and Results of Operations - Liquidity and Capital Resources," for further details.
Item 1A. Risk Factors
Statements made by us in this report and in other reports and statements released by us that are not historical facts constitute "forward-looking statements" within the meaning of Section 21 of the Exchange Act. Statements that use words such as "believe," "anticipate," "estimate," "intend," "could," "plan," "expect," "project" or the negative of these, as well as similar expressions, are intended to identify forward-looking statements. These forward-looking statements are necessarily estimates and expectations reflecting the best judgment of our senior management based on our current estimates, expectations, forecasts and projections, and include comments that express our current opinions about trends and factors that may impact future
operating results. Such statements rely on a number of assumptions concerning future events, many of which are outside of our control, and involve known and unknown risks and uncertainties that could cause our actual results, performance or achievements, or industry results, to differ materially from any future results, performance or achievements, expressed or implied by such forward-looking statements. Any such forward-looking statements, whether made in this report or elsewhere, should be considered in the context of the various disclosures made by us about our business and other matters including, without limitation, the risk factors discussed below. We expressly disclaim any duty to update the forward-looking statements and other information contained in this report, except as required by law.
We operate in a rapidly changing and highly regulated environment that involves a number of risks and uncertainties, some of which are highlighted below and others are discussed elsewhere in this report. In addition, we may be exposed to risks relating to our Combination with FC-GEN. These risks and uncertainties could materially and adversely affect our business, financial condition, prospects, operating results or cash flows. The following risk factors are not the only ones facing us. Our business is also subject to the risks that affect many other companies, such as employment relations, natural disasters, general economic conditions and geopolitical events. Further, additional risks not currently known to us or that we currently believe are immaterial may in the future materially and adversely affect our business, operations, liquidity and stock price.
Risks Related to Our Business
Reductions in Medicare reimbursement rates, or changes in the rules governing the Medicare program could have a material adverse effect on our revenue, financial condition and results of operations.
We receive a significant portion of our revenue from Medicare, which accounted for 28.4% of our consolidated revenue during 2014 and 30.9% in 2013. In addition, many private payors base their reimbursement rates on the published Medicare rates or, in the case of our rehabilitation therapy services customers, are themselves reimbursed by Medicare for the services we provide. Accordingly, if Medicare reimbursement rates are reduced or fail to increase as quickly as our costs, or if there are changes in the rules governing the Medicare program that are disadvantageous to our business or industry, our business and results of operations will be adversely affected.
The Medicare program and its reimbursement rates and rules are subject to frequent change. These include statutory and regulatory changes, rate adjustments (including retroactive adjustments), administrative or executive orders and government funding restrictions, all of which may materially adversely affect the rates at which Medicare reimburses us for our services. For example, CMS implemented a net 11.1% reduction in its reimbursement rates to skilled nursing facilities effective October 1, 2011. Furthermore, due to the federal sequestration, an automatic 2% reduction in Medicare spending took effect beginning in April 2013 and will remain in effect unless Congress takes action to terminate the automatic reduction or authorize spending increases. Budget pressures often lead the federal government to reduce or place limits on reimbursement rates under Medicare. Implementation of these and other types of measures has in the past and could in the future result in substantial reductions in our revenue and operating margins. Prior reductions in governmental reimbursement rates partially contributed to our predecessor's bankruptcy filing under Chapter 11 of the United States Bankruptcy Code in October 2001.
In addition, the federal government often changes the rules governing the Medicare program, including those governing reimbursement. Changes that could adversely affect our business include:
• | administrative or legislative changes to base rates or the bases of payment; |
• | limits on the services or types of providers for which Medicare will provide reimbursement; |
• | changes in methodology for patient assessment and/or determination of payment levels; |
• | the reduction or elimination of annual rate increases; or |
• | an increase in co-payments or deductibles payable by beneficiaries. |
Given the history of frequent revisions to the Medicare program and its reimbursement rates and rules, we may not continue to receive reimbursement rates from Medicare that sufficiently compensate us for our services or, in some instances, cover our operating costs. Limits on reimbursement rates or the scope of services being reimbursed could have a material adverse effect on our revenue, financial condition and results of operations. Additionally, any delay or default by the federal or state governments in making Medicare and/or Medicaid reimbursement payments could materially and adversely affect our business, financial condition and results of operations.
We expect the federal and state governments to continue their efforts to contain growth in Medicaid expenditures, which could adversely affect our revenue and profitability.
Medicaid is our largest source of revenue, accounting for 34.1% of our consolidated revenue for the twelve months ended December 31, 2014 and 31.6% for the twelve months ended December 31, 2013. Medicaid is a state-administered program financed by both state funds and matching federal funds. Medicaid spending has increased rapidly in recent years, becoming a significant component of state budgets. This, combined with slower state revenue growth, has led both the federal government and many states (including California and Texas, where significant portions of our Medicaid-related business is located) to
13
institute measures aimed at controlling the growth of Medicaid spending, and in some instances reducing aggregate Medicaid spending. We expect these state and federal efforts to continue for the foreseeable future. Furthermore, not all of the states in which we operate, most notably Texas, have elected to expand Medicaid as part of federal healthcare reform legislation. Additionally, certain of our subsidiaries in Texas participate in a state inter-governmental payment program that provides supplemental Medicaid payments with federal matching funds for skilled nursing facilities that are affiliated with county owned hospital districts. There can be no assurance that the program, or the Company's participation in it, on the current terms or otherwise, will continue for any particular period of time beyond the foreseeable future. If Medicaid reimbursement rates are reduced or fail to increase as quickly as our costs, or if there are changes in the rules governing the Medicaid program that are disadvantageous to our businesses, our business and results of operations could be materially and adversely affected.
Recent federal government proposals could limit the states' use of provider tax programs to generate revenue for their Medicaid expenditures, which could result in a reduction in our reimbursement rates under Medicaid.
To generate funds to pay for the increasing costs of the Medicaid program, many states utilize financial arrangements commonly referred to as "provider taxes." Under provider tax arrangements, states collect taxes from healthcare providers and then use the revenue to pay the providers as a Medicaid expenditure, which allows the states to then claim additional federal matching funds on the additional reimbursements. Current federal law provides for a cap on the maximum allowable provider tax as a percentage of the provider's total revenue. There can be no assurance that federal law will continue to provide matching federal funds on state Medicaid expenditures funded through provider taxes, or that the current caps on provider taxes will not be reduced. Any discontinuance or reduction in federal matching of provider tax-related Medicaid expenditures could have a significant and adverse effect on states' Medicaid expenditures, and as a result could have a material and adverse effect on our financial condition and results of operations.
Revenue we receive from Medicare and Medicaid is subject to potential retroactive reduction.
Payments we receive from Medicare and Medicaid can be retroactively adjusted after examination during the claims settlement process or as a result of post-payment audits. Payors may disallow our requests for reimbursement, or recoup amounts previously reimbursed, based on determinations by the payors or their third-party audit contractors that certain costs are not reimbursable because either adequate or additional documentation was not provided or because certain services were not covered or deemed to not be medically necessary. Significant adjustments, recoupments or repayments of our Medicare or Medicaid revenue, and the costs associated with complying with investigative audits by regulatory and governmental authorities, could adversely affect our financial condition and results of operations.
Additionally, from time to time we become aware, either based on information provided by third parties and/or the results of internal audits, of payments from payor sources that were either wholly or partially in excess of the amount that we should have been paid for the service provided. Overpayments may result from a variety of factors, including insufficient documentation supporting the services rendered or medical necessity of the services, other failures to document the satisfaction of the necessary conditions of payment, or in some cases for providing services that are deemed to be worthless. We are required by law in most instances to refund the full amount of the overpayment after becoming aware of it, and failure to do so within requisite time limits imposed by the law could lead to significant fines and penalties being imposed on us. Furthermore, our initial billing of and payments for services that are unsupported by the requisite documentation and satisfaction of any other conditions of payment, regardless of our awareness of the failure at the time of the billing or payment, could expose us to significant fines and penalties, including pursuant to the Federal False Claims Act ("FFCA") and the Federal Civil Monetary Penalties Law ("FCMPL"). Violations of the FFCA could lead to any combination of a variety of criminal, civil and administrative fines and penalties. The FFCA provides for civil fines ranging from $5,500 to $11,000 per claim plus treble damages. The Civil Monetary Penalties Law similarly provides for civil monetary penalties of up to $10,000 per claim plus up to treble damages. We and/or certain of our operating companies could also be subject to exclusion from participation in the Medicare or Medicaid programs in some circumstances as well, in addition to any monetary or other fines, penalties or sanctions that we may incur under applicable federal and/or state law. Our repayment of any such amounts, as well as any fines, penalties or other sanctions that we may incur, could be significant and could have a material and adverse effect on our results of operations and financial condition.
From time to time we are also involved in various external governmental investigations, audits and reviews. Reviews, audits and investigations of this sort can lead to government actions, which can result in the assessment of damages, civil or criminal fines or penalties, or other sanctions, including restrictions or changes in the way we conduct business, loss of licensure or exclusion from participation in government programs. For example, the Office of the Inspector General (“OIG”) conducts a variety of routine, regular and special investigations, audits and reviews across our industry. Failure to comply with applicable laws, regulations and rules could have a material and adverse effect on our results of operations and financial condition. Furthermore, becoming subject to these governmental investigations, audits and reviews can also require us to incur significant legal and document production expenses as we cooperate with the government authorities, regardless of whether the particular investigation, audit or review leads to the identification of underlying issues. For example, as discussed under
14
“Creekside Hospice Litigation,” "Therapy Matters Litigation," and "Staffing Matters Litigation" in Note 13, "Commitments and Contingencies - Legal Matters", included elsewhere in this report, the government has investigated and has elected to intervene in two pending qui tam actions that allege violations of the FFCA and the Nevada False Claims Act in connection with the operations of our affiliated Las Vegas, Nevada hospice, and the government is investigating and has expressed its intent to pursue litigation against us in connection with two other pending investigations. We have accrued $6.0 million as a contingent liability in connection with the Creekside Hospice Litigation based on a prior offer of settlement that we made in the matter, but it could ultimately cost more than that amount to settle or otherwise resolve it, including to satisfy any judgment that might be rendered against us if our litigation defense were ultimately unsuccessful. We do not currently have any contingent liabilities accrued in connection with the other two aforementioned investigations because the standards for accrual have not been satisfied in those matters. However, expenses incurred in resolution of either of those matters, as well as the costs of defense should litigation be instituted, could have a material adverse effect on us and our financial condition.
Our success is dependent upon retaining key executive and personnel.
Our senior management team has extensive experience in the healthcare industry. We believe that they have been instrumental in guiding our businesses, instituting valuable performance and quality monitoring, and driving innovation. Our future performance is substantially dependent upon the continued services of our senior management team or their successors. The loss of the services of any of these persons could have a material adverse effect upon us.
Health reform legislation could adversely affect our revenue and financial condition.
In recent years, there have been numerous initiatives on the federal and state levels for comprehensive reforms affecting the payment for, the availability of and reimbursement for, healthcare services in the United States. These initiatives have ranged from proposals to fundamentally change federal and state healthcare reimbursement programs, including the provision of comprehensive healthcare coverage to the public under governmental funded programs, to minor modifications to existing programs. PPACA was enacted in 2010 and is among the most comprehensive and notable of these legislative efforts. The impact of PPACA remains uncertain to a large degree due to various implementation, timing, cost and regulatory requirements imposed by the legislation. The content or timing of any future health reform legislation, and its impact on us is impossible to predict. However, it is likely that certain provisions in PPACA will impose significant costs on us or that will otherwise negatively affect our operations. For instance, the requirement to offer full time employees “affordable” healthcare insurance that meets specified coverage minimums (or alternatively pay a per-employee penalty to the federal government) could significantly increase our annual healthcare costs or could damage employee morale and/or cause other employee-related issues that are harmful to our operations. If significant reforms are made to the U.S. healthcare system, those reforms may have an adverse effect on our financial condition and results of operations.
In addition, we incur considerable administrative costs in monitoring the changes made within the various reimbursement programs in which we participate, determining the appropriate actions to be taken in response to those changes, and implementing the required actions to meet the new requirements and minimize the repercussions of the changes to our organization, reimbursement rates and costs.
Annual caps that limit the amounts that can be paid for outpatient therapy services rendered to any Medicare beneficiary may negatively affect our results of operations.
Some of our rehabilitation therapy revenue is paid by the Medicare Part B program under a fee schedule. There are annual caps that limit, subject to certain exceptions, the amounts that can be paid (including deductible and coinsurance amounts) for rehabilitation therapy services rendered to any Medicare beneficiary under Medicare Part B. There is a combined cap for physical therapy and speech-language pathology and a separate cap for occupational therapy that apply subject to certain exceptions. The discontinuation or change in the current cap exception process or future modifications of the Medicare Part B cap structure could have an adverse effect on the revenue that we generate through our rehabilitation therapy business. This could in turn have a negative effect on our financial condition and results of operations. For example, the Medicare Part B therapy pre-approval provisions (MMR) and multiple procedure payment reduction ("MPPR") rate reductions that took effect October 1, 2012, have continued to negatively impact our therapy business.
The MMR requirement generally provides that, on a per beneficiary basis and subject to limited exceptions, services above $3,700 for physical therapy and speech-language pathology services combined and/or $3,700 for occupational therapy services are subject to manual medical review (typically on a pre-payment basis) by the applicable Medicare contractors. Challenges in obtaining a timely response from the applicable contractors and other difficulties with the MMR system have added significant uncertainty as to whether beneficiaries will have access to the applicable therapy services that are over the cap amount, and whether the provider will be reimbursed for those services. Under the MPPR policy, when physical therapy, occupational therapy and speech-language pathology services are performed on the same day for the same patient and paid under Medicare Part B, then Medicare effectively makes a full reimbursement payment for only one of the procedures and the
15
reimbursements for the other procedures are at a reduced rate. The application of the MPPR policy has negatively affected our therapy business and will continue to do so as long as the policy is in effect.
We are subject to a Medicare cap amount for our hospice business. Our net patient service revenue and profitability could be adversely affected by limitations on Medicare payments.
Overall payments made by Medicare to us on a per hospice basis are subject to an annual cap amount. Total Medicare payments received for services rendered during the applicable Medicare hospice cap year by each of our Medicare-certified hospice programs during this period are compared to the cap amount for the relevant period. Payments in excess of the cap are subject to recoupment by Medicare.
We monitor the Medicare cap amount and seek to implement corrective measures as necessary. We maintain what we believe are adequate allowances in the event that our individual hospice agencies exceed the Medicare hospice cap in any given fiscal year. However, many of the variables involved in estimating the Medicare hospice cap contractual adjustment are beyond our control, and we cannot assure you that we will not increase or decrease our estimated contractual allowance in the future, or that we will not be required to surrender amounts we received from Medicare that were in excess of the Medicare hospice cap for any particular period(s).
We recorded net hospice cap reserves of $2.7 million in 2014 and $5.6 million in 2013. This adjustment related primarily to patients staying on service longer than estimated which results in the patients' lifetime cap allowances being stretched over multiple cap years. Our ability to comply with the cap limitation depends on a number of factors relating to a given hospice program, including number of admissions, average length of stay, mix in level of care and Medicare patients that transfer into and out of our hospice programs. Our revenue and profitability may be materially reduced if we are unable to comply with this and other Medicare payment limitations. We cannot assure you that our hospice programs will not exceed the cap amount in the future or that our estimate of the Medicare cap contractual adjustment will not differ materially from the actual Medicare cap amount.
We are subject to extensive and complex laws and government regulations. If we are not operating in compliance with these laws and regulations or if these laws and regulations change, we could be required to make significant expenditures or change our operations in order to bring our facilities and operations into compliance.
We, along with other companies in the healthcare industry, are required to comply with extensive and complex laws and regulations at the federal, state and local government levels relating to, among other things:
• | licensure and certification; |
• | adequacy and quality of healthcare services; |
• | qualifications of healthcare and support personnel; |
• | quality of medical equipment; |
• | confidentiality, maintenance and security issues associated with medical records and claims processing; |
• | relationships with physicians and other referral sources and recipients; |
• | constraints on protective contractual provisions with patients and third-party payors; |
• | operating policies and procedures; |
• | addition of facilities and services; and |
• | billing for services. |
Many of these laws and regulations are expansive, and we do not always have the benefit of significant regulatory or judicial interpretation of these laws and regulations. In addition, many of these laws and regulations evolve to include additional obligations and restrictions, and sometimes with retroactive effect. Certain other regulatory developments, such as revisions in the building code requirements for assisted living and skilled nursing facilities, mandatory increases in scope and quality of care to be offered to residents, revisions in licensing and certification standards, mandatory staffing levels, regulations regarding conditions for payment and regulations restricting those we can hire, could also have a material adverse effect on us. In the future, different interpretations or enforcement of these laws and regulations could subject our current or past practices to allegations of impropriety or illegality or could require us to make changes in our facilities, equipment, personnel, services, capital expenditure programs and operating expenses.
One development potentially restricting those we may hire was a decision on November 3, 2010 by the Physical Therapy Board of California ("PT Board") to rescind a 1990 PT Board resolution which determined that the offering of physical therapy services by a corporation, not organized as a professional corporation, was permitted by the Physical Therapy Practice Act, which is the California statute governing the provision of physical therapy within the state. This rescission purports to prohibit employment of a physical therapist to provide physical therapy services by any professional corporation except those owned by physical therapists and Naturopaths. Lay corporations that hold themselves out as physical therapy corporations would be similarly prohibited. We have a subsidiary that employs physical therapists in California, but is not owned by physical therapists. Our subsidiary contracts with nursing facilities to provide the facilities with personnel who are licensed to provide
16
rehabilitation therapy services, including physical therapy, occupational therapy and/or speech language pathology services. Our therapists then provide rehabilitation therapy services to the nursing facilities' patients under the skilled nursing facilities' licenses that authorize the provision of physical therapy (and other rehabilitation therapy services, if applicable). In this relationship, the nursing facilities retain the patient relationship, remain professionally responsible for the healthcare services including therapy, and bill the patient and/or third party payors for the services rendered to their patients. We are unaware of any enforcement actions by the PT Board to date and it is not clear whether the applicable law would ultimately be interpreted to mean that our rehabilitation therapy subsidiary cannot employ and provide physical therapists to nursing facilities in California as it currently does. Nevertheless, the PT Board could seek an enforcement action against our rehabilitation therapy subsidiary and its physical therapist employees and we may have to significantly restructure our California rehabilitation therapy operations to conform to the PT Board's revised interpretation of the law.
In addition, federal and state government agencies have increased and coordinated civil and criminal enforcement efforts as part of numerous ongoing investigations of healthcare companies, including skilled nursing facilities, home health agencies and hospice agencies. This includes investigations of:
• | fraud and abuse; |
• | quality of care; |
• | financial relationships with referral sources; and |
• | the medical necessity of services provided. |
We are unable to predict the future course of federal, state and local regulation or legislation, including Medicare and Medicaid statutes and regulations, the intensity of federal and state enforcement actions or the extent and size of any potential sanctions, fines or penalties. Changes in the regulatory framework, our failure to obtain or renew required regulatory approvals or licenses or to comply with applicable regulatory requirements, the suspension or revocation of our licenses or our disqualification from participation in federal and state reimbursement programs, or the imposition of other enforcement sanctions, fines or penalties could have a material adverse effect upon our results of operations, financial condition and liquidity. Furthermore, should we lose licenses or certifications for a number of our facilities or other businesses as a result of regulatory action, legal proceedings such as those described in Note 13, "Commitments and Contingencies-Legal Matters," or otherwise, we could be deemed to be in default under some of our agreements, including agreements governing outstanding indebtedness and the report of such issues at one of our facilities could harm our reputation for quality care and lead to a reduction in our patient referrals and ultimately our revenue and operating income.
We face inspections, reviews, audits and investigations under federal and state government programs and contracts. These audits could have adverse findings that may negatively affect our business.
As a result of our participation in the Medicare and Medicaid programs, we are subject to various governmental inspections, reviews, audits and investigations to verify our compliance with these programs and applicable laws and regulations. Managed care payors may also reserve the right to conduct audits. We also periodically conduct internal audits and reviews of our regulatory compliance. An adverse inspection, review, audit or investigation could result in:
• | refunding amounts we have been paid pursuant to the Medicare or Medicaid programs or from managed care payors; |
• | state or federal agencies imposing fines, penalties and other sanctions on us; |
• | temporary suspension of payment for new patients to the facility or agency; |
• | decertification or exclusion from participation in the Medicare or Medicaid programs or one or more managed care payor networks; |
• | self-disclosure of violations to applicable regulatory authorities; |
• | damage to our reputation; |
• | the revocation of a facility's or agency's license; and |
• | loss of certain rights under, or termination of, our contracts with managed care payors. |
We have in the past and will likely in the future be required to refund amounts we have been paid and/or pay fines and penalties, as a result of these inspections, reviews, audits and investigations. If adverse inspections, reviews, audits or investigations occur and any of the results noted above occur, it could have a material adverse effect on our business and operating results. Furthermore, the legal, document production and other costs associated with complying with these inspections, reviews, audits or investigations could be significant.
Significant legal actions, which are commonplace in our professions, could subject us to increased operating costs and substantial uninsured liabilities, which would materially and adversely affect our results of operations, liquidity and financial condition.
The long-term care profession has experienced an increasing trend in the number and severity of litigation claims involving punitive damages and settlements. We believe that this trend is endemic to the industry and is a result of a variety of
17
factors, including the number of large judgments, including large punitive damage awards, against long-term care providers in recent years resulting in an increased awareness by plaintiffs' lawyers of potentially large recoveries. While some states have enacted tort reform legislation that limits plaintiffs' recoveries in some respects, should our professional liability and general liability increase significantly in the future, we may not be able to increase our revenue sufficiently to cover the cost increases, our operating income could suffer, and we may not be able to meet our obligations to repay our liabilities. For a discussion of recent litigation claims against us, including the Humboldt County Action, see Note 13, "Commitments and Contingencies-Legal Matters", in the notes to the consolidated financial statements included elsewhere in this report.
We also may be subject to lawsuits under the FFCA and comparable state laws for submitting allegedly fraudulent or otherwise inappropriate bills for services to the Medicare and Medicaid programs. These lawsuits, which may be initiated by regulatory authorities as well as private party relators, can involve significant monetary damages, fines, attorney fees and the award of bounties to private plaintiffs who successfully bring these suits, as well as to the government programs. In recent years, government oversight and law enforcement have become increasingly active and aggressive in investigating and taking legal action against potential fraud and abuse.
We may incur significant liabilities in conjunction with legal actions against us, including as a result of damages, fines and penalties that may be assessed against us, as well as a result of the sometimes significant commitments of financial and management resources that are often required to defend against such legal actions. The incurrence of such liabilities and related commitments of resources could materially and adversely affect our business, financial condition and results of operations.
We could face significant financial difficulties as a result of one or more of the risks discussed in this report, which could cause us to significantly alter our business and/or seek protection under bankruptcy laws or could cause our creditors or government authorities to have a receiver appointed on our behalf.
We could face significant financial difficulties if Medicare or Medicaid reimbursement rates are reduced, patient demand for our services is reduced or we incur unexpected liabilities or expenses, including in connection with legal actions, sanctions, penalties or fines or the other risks discussed in this report. This financial difficulty could cause us to significantly alter our business and/or seek protection under bankruptcy laws or could cause our creditors or government authorities to have a receiver appointed on our behalf.
Failure to maintain effective internal control over our financial reporting could have an adverse effect on our ability to report our financial results on a timely and accurate basis.
We produce our consolidated financial statements in accordance with the requirements of accounting principles generally accepted in the United States of America ("U.S. GAAP"). Effective internal control over financial reporting is necessary for us to provide reliable financial reports, to help mitigate the risk of fraud and to operate successfully. We are required by federal securities laws to document and test our internal control procedures in order to satisfy the requirements of the Sarbanes-Oxley Act of 2002, which requires annual management assessments of the effectiveness of our internal control over financial reporting.
Testing and maintaining our internal control over financial reporting can be expensive and divert our management's attention from other matters that are important to our business. We may not be able to conclude on an ongoing basis that we have effective internal control over financial reporting in accordance with applicable law, or our independent registered public accounting firm may not be able or willing to issue an unqualified attestation report if we conclude that our internal control over financial reporting is not effective. If we fail to maintain effective internal control over financial reporting, or our independent registered public accounting firm is unable to provide us with an unqualified attestation report on our internal control, we could be required to take costly and time-consuming corrective measures, be required to restate the affected historical financial statements, be subjected to investigations and/or sanctions by federal and state securities regulators, and be subjected to civil lawsuits by security holders. Any of the foregoing could also cause investors to lose confidence in our reported financial information and in our company and would likely result in a decline in the market price of our stock and in our ability to raise additional financing if needed in the future. Also, as a result of the Combination with FC-GEN that closed on February 2, 2015, we are evaluating our internal control policies and procedures and may make modifications to the design of our internal control policies and procedures.
Changes in the acuity mix of patients as well as payor mix and payment methodologies may significantly reduce our profitability or cause us to incur losses.
18
Our revenue is affected by our ability to attract a favorable patient acuity mix, and by our mix of payment sources. Changes in the type of patients we attract, as well as our payor mix among private payors, managed care companies, Medicare (both traditional Medicare and "managed" Medicare/Medicare Advantage) and Medicaid, significantly affect our profitability because not all payors reimburse us at the same rates. Particularly, if we fail to maintain our proportion of high-acuity patients or if there is any significant increase in the percentage of our population for which we receive Medicaid reimbursement, our financial position, results of operations and cash flow may be adversely affected. Furthermore, in recent periods we have continued to see a shift from to “traditional” fee-for-service Medicare patients to “managed” Medicare (Medicare Advantage) patients. Reimbursement rates are generally lower for services provided to Medicare Advantage patients than they are for the same services provided to traditional fee-for-service Medicare patients. This trend may continue in future periods. Our financial results have been negatively affected by this shift to date. Our financial results will continue to be negatively affected if the trend towards Medicare Advantage continues, and particularly if it accelerates.
It can be difficult to attract and retain qualified nurses, therapists, healthcare professionals and other key personnel, which can increase our costs related to these employees
Our employees are our most important asset. We rely on our ability to attract and retain qualified nurses, therapists and other healthcare professionals. The market for these key personnel is highly competitive, and we could experience significant increases in our operating costs due to shortages in their availability. Like other healthcare providers, we have at times experienced difficulties in attracting and retaining qualified personnel, especially facility administrators, nurses, therapists, certified nurses' aides and other important healthcare personnel. We may continue to experience increases in our labor costs, primarily due to higher wages and greater benefits required to attract and retain qualified healthcare personnel, and such increases may adversely affect our profitability. Furthermore, while we attempt to manage overall labor costs in the most efficient way, our efforts to manage them through wage freezes and similar means may have limited effectiveness and may lead to increased turnover and other challenges.
Tight labor markets and high demand for such employees can contribute to high turnover among clinical professional staff. A shortage of qualified personnel at a facility could result in significant increases in labor costs and increased reliance on overtime and expensive temporary staffing agencies, and could otherwise adversely affect operations at the affected facilities. If we are unable to attract and retain qualified professionals, our ability to adequately provide services to our residents and patients may decline and our ability to grow may be constrained.
If we are unable to comply with state minimum staffing requirements at one or more of our facilities, we could be subject to fines or other sanctions.
Increased attention to the quality of care provided in skilled nursing facilities has caused several states to mandate, and other states to consider mandating, staffing laws that require minimum nursing hours of direct care per resident per day. These minimum staffing requirements further increase the gap between demand for and supply of qualified professionals, and lead to higher labor costs.
We operate a number of facilities in California, which enacted legislation aimed at establishing minimum staffing requirements for facilities operating in that state. This legislation required that the California Department of Public Health ("DPH"), promulgate regulations requiring each skilled nursing facility to provide a minimum of 3.2 nursing hours per patient day. The DPH finalized regulations in 2009 that required three 8-hour shifts for nurse-to-patient staffing, described documentation and notice requirements, and specified procedures for obtaining a waiver from per-shift staffing requirements at skilled nursing facilities. Although DPH finalized the regulations, initial implementation of the statute authorizing the regulations is contingent on an appropriation in the state's annual budged legislation or another statute. Because no appropriation was made and no additional statutes were enacted, the regulations did not become operational. Therefore, DPH will continue its practice of determining a facility's compliance with the 3.2 hour of nursing services per patient day measure in accordance with its internal policy and through on-site reviews conducted during periodic licensing and certification surveys and in response to complaints. If the DPH determines that a facility is out of compliance with this staffing measure, the DPH may issue a notice of deficiency, or a citation, depending on the impact on patient care. A citation carries with it the imposition of significant monetary fines. DPH has issued guidelines, implementing the provisions of newly enacted California laws, for state audits that verify compliance with the 3.2 nursing hours per patient day staffing requirements. If DPH determines under an audit that a facility has failed to meet the minimum staffing requirement for between 5% and 49% of the audited days, a significant administrative monetary penalty will be assessed. If DPH determines that a facility has failed to meet the minimum staffing requirement for more than 49% of the audited days, then a larger administrative monetary penalty will be assessed. The issuance of either a notice of deficiency or a citation requires the facility to prepare and implement an acceptable plan of correction. The Humboldt County Action included allegations that certain of our California skilled nursing facilities failed to meet state-mandated minimum staffing requirements. The Humboldt County Action, which occurred prior to DPH's adoption of the aforementioned guidelines, resulted in a jury verdict against us and certain of our affiliated skilled nursing companies that awarded $677 million in damages. The case was ultimately settled in September 2010, pursuant to which we were required to deposit into escrow a total of $50 million to cover certain settlement costs. For more information regarding the Humboldt
19
County Action and the settlement, as well as a description of our February 2013 settlement with the BMFEA which included a new staffing agreement and of an investigation by the DOJ regarding related staffing considerations, see Note 13, "Commitments and Contingencies-Legal Matters," in the notes to the consolidated financial statements included elsewhere in this report.
Our ability to satisfy any minimum staffing requirements depends upon our ability to attract and retain qualified healthcare professionals, including nurses, certified nurse's assistants and other personnel. Attracting and retaining this personnel is difficult, given a tight labor market for these professionals in many of the markets in which we operate. Furthermore, if states do not appropriate additional funds (through Medicaid program appropriations or otherwise) sufficient to pay for any additional operating costs resulting from minimum staffing requirements, our profitability may be materially adversely affected.
If we fail to attract patients and residents and to compete effectively with other healthcare providers, our revenue and profitability may decline and we may incur losses.
The healthcare services industry is highly competitive. Our skilled nursing facilities compete primarily on a local and regional basis with many long-term care providers, from national and regional chains to smaller providers owning as few as a single nursing center. We also compete under certain circumstances with inpatient rehabilitation facilities and long-term acute care hospitals. Our hospices and home health agencies also compete with local, regional and national companies. We anticipate additional competition in the future from accountable care organizations, as well as HMO's and similar healthcare systems that seek to provide a wider variety of healthcare services to their patients/members. Increased competition could limit our ability to attract and retain patients, maintain or increase rates and occupancy, or to expand our business. Our ability to compete successfully varies from location to location and depends on a number of factors, including the number of competitors in the local market, the types of services available, our local reputation for quality care of patients, achieve or maintain desired census levels, the commitment and expertise of our staff and physicians, our local service offerings and treatment programs, the cost of care in each locality, and the physical appearance, location, age and condition of our facilities. If we are unable to attract patients to our facilities and agencies, particularly high-acuity patients, then our revenue and profitability will be adversely affected. Some of our competitors may have greater recognition and be more established in their respective communities than we are, and may have greater financial and other resources than we have. Competing long-term care companies may also offer newer facilities or different programs or services than we do, which, combined with the foregoing factors, may result in our competitors being more attractive to our current patients, to potential patients and to referral sources. Furthermore, while we budget for routine capital expenditures at our facilities to keep them competitive in their respective markets, to the extent that competitive forces cause those expenditures to increase in the future our financial condition may be negatively affected.
Some of our competitors may accept lower profit margins than we do, which could present significant price competition, particularly for managed care and private pay patients. We believe we utilize a conservative approach in complying with laws prohibiting kickbacks and referral payments to referral sources. However, some of our competitors may use more aggressive methods than we do with this respect to obtaining patient referrals, and as a result competitors may from time to time obtain patient referrals that are not otherwise available to us.
The primary competitive factors for our assisted living, rehabilitation therapy, hospice and home health care services are similar to those for our skilled nursing businesses and include reputation, the cost of services, the quality of services, responsiveness to patient/resident needs and the ability to provide support in other areas such as third-party reimbursement, information management and patient recordkeeping. Furthermore, given the relatively low barriers to entry and continuing healthcare cost containment pressures, we expect that the markets we service will become increasingly competitive in the future. Increased competition in the future could limit our ability to attract and retain patients and residents, maintain or increase our fees, or expand our business.
Insurance coverage may become increasingly expensive and difficult to obtain for health care companies, and our self-insurance may expose us to significant losses.
It may become more difficult and costly for us to obtain coverage for patient care liabilities and certain other risks, including property and casualty insurance. Insurance carriers may require health care companies to significantly increase their self-insured retention levels and/or pay substantially higher premiums for reduced coverage for most insurance coverages, including workers' compensation, employee healthcare and patient care liability.
20
We self-insure a significant portion of our potential liabilities for several risks, including certain types of professional and general liability, workers' compensation and employee healthcare benefits. Due to our self-insured retentions under many of our professional and general liability, workers' compensation and employee healthcare benefits programs, including our election to self-insure against workers' compensation claims in Texas, there is no limit on the maximum number of claims or amount for which we can be liable in any policy period. We base our loss estimates and related accruals on actuarial analyses, which determine expected liabilities on an undiscounted basis, including incurred but not reported losses, based upon the available information on a given date. It is possible, however, for the ultimate amount of losses to exceed our estimates and related accruals, as well as our insurance limits as applicable. In the event our actual liability exceeds our estimates for any given period, our results of operations and financial condition could be materially adversely impacted. Additionally, we may from time to time need to increase our accruals as a result of future actuarial reviews and claims that may develop. Such increases could have an adverse impact on our business and results of operations. An adverse determination in legal proceedings, whether currently asserted or arising in the future, could have a material adverse effect on our business and results of operations.
If our referral sources fail to view us as an attractive health care provider, our patient base would likely decrease.
We rely significantly on appropriate referrals from physicians, hospitals and other healthcare providers in the communities in which we deliver our services to attract the kinds of patients we target. Our referral sources are not obligated to refer business to us and generally also refer business to other healthcare providers. We believe many of our referral sources refer business to us as a result of the quality of our patient service and our efforts to establish and build a relationship with them. If we lose, or fail to maintain, existing relationships with our referral resources, fail to develop new relationships or if we are perceived by our referral sources for any reason as not providing high quality patient care, our volume of referrals would likely decrease, the quality of our patient mix could suffer and our revenue and results of operations could be adversely affected.
If we do not achieve or maintain a reputation for providing high quality of care, our business may be negatively affected.
Our ability to achieve and maintain a reputation for providing high quality of care to our patients at each of our skilled nursing and assisted living facilities, or through our rehabilitation therapy, hospice and home health businesses, is important to our ability to attract and retain patients, particularly high-acuity patients. In some instances, our referral sources are affiliated with health care systems that may have affiliated businesses that offer services that compete with ours, and the frequency of this occurring may increase in the future as accountable care organizations are formed in the markets we serve. We believe that the perception of our quality of care by a potential patient or potential patient's family seeking to contract for our services is influenced by a variety of factors, including doctor and other healthcare professional referrals, community information and referral services, newspapers and other print and electronic media, results of patient surveys, recommendations from family and friends, and quality care statistics or rating systems compiled and published by CMS or other industry data. Through our focus on retaining high quality staffing, reviewing feedback and surveys from our patients and referral sources to highlight areas of improvement and integrating our service offerings at each of our facilities, we seek to maintain and improve on the outcomes from each of the factors listed above in order to build and maintain a strong reputation at our facilities. If any of our companies fail to achieve or maintain a reputation for providing high-quality care, or is perceived to provide a lower quality of care than competitors within the same geographic area, our ability to attract and retain patients would be adversely affected. If our businesses fail to maintain a strong reputation in the areas in which we operate, our business, revenue and profitability could be adversely affected.
We may be unable to reduce costs to offset decreases in our patient census levels or other expenses completely.
We depend on implementing adequate cost management initiatives in response to fluctuations in levels of patient census in our businesses in order to maintain our current cash flow and earnings levels. Fluctuation in our patient census levels may become more common as we continue our emphasis in our skilled nursing facilities on patients with shorter stays but higher acuities. A decline in patient census levels would likely result in decreased revenue. If we are unable to put in place corresponding reductions in costs in response to decreases in our patient census or other revenue shortfalls, our financial condition and operating results could be adversely affected. There are limits in our ability to reduce the costs of our centers because we must maintain staffing levels.
We may not be fully reimbursed for all services that our skilled nursing facilities are able to bill through Medicare's consolidated billing requirements.
Skilled nursing facilities are required to bill Medicare on a consolidated basis for certain items and services that they furnish to patients and residents, regardless of the amount or costs of services that the patients and residents actually receive. The consolidated billing requirement essentially confers on the skilled nursing facility itself the Medicare billing responsibility for the entire package of care that its residents receive in these situations. Federal law also requires that post-hospitalization skilled nursing services be “bundled” into the hospital's Diagnostic Related Group ("DRG") payment in certain circumstances. Where this rule applies, the hospital and the skilled nursing facility must, in effect, divide the payment which otherwise would
21
have been paid to the hospital alone for the patient's treatment, and no additional funds are paid by Medicare for skilled nursing care of the patient. This requirement may, in instances where it is applicable, have a negative effect on skilled nursing facility utilization/census and payments, either because hospitals may find it difficult to place patients in skilled nursing facilities which will not be paid as they previously were, or because hospitals are reluctant to discharge patients to skilled nursing facilities and lose a portion of the payment that the hospital would otherwise receive. This bundling requirement could be extended to more DRGs in the future, which could exacerbate the potentially negative impact on skilled nursing facility utilization/census and payments. As a result of the bundling requirements we may not be fully reimbursed for all services that a facility bills through consolidated billing, which could adversely affect our results of operations and financial condition.
Consolidation of managed care organizations and other third-party payors or reductions in reimbursement from these payors may adversely affect our revenue and income or cause us to incur losses.
Managed care organizations and other third-party payors have in many instances consolidated in order to enhance their ability to influence the delivery of healthcare services. Consequently, the healthcare needs of a large percentage of the United States population are increasingly served by a small number of managed care organizations. These organizations generally enter into service agreements with a limited number of providers for needed services. These organizations have become an increasingly important source of revenue and referrals for us. To the extent that such organizations terminate us as a preferred provider or engage our competitors as a preferred or exclusive provider, our business could be materially adversely affected.
In addition, private third-party payors, including managed care payors, are continuing their efforts to control healthcare costs through direct contracts with healthcare providers, increased utilization reviews, or reviews of the propriety of, and charges for, services provided, and greater enrollment in managed care programs and preferred provider organizations. As these private payors increase their purchasing power, they are demanding discounted fee structures and the assumption by healthcare providers of all or a portion of the financial risk associated with the provision of care. Significant reductions in reimbursement from these sources could materially adversely affect our business and financial condition.
Delays in reimbursement may cause liquidity problems.
If we have information systems problems or payment or other issues arise with Medicare, Medicaid or other payors that affect the amount or timeliness of reimbursements, we may encounter delays in our payment cycle. Any significant payment timing delay could cause us to experience working capital shortages. As a result, working capital management, including prompt and diligent billing and collection, is an important factor in our consolidated results of operations and liquidity. Our working capital management procedures may not successfully mitigate the effects of any delays in our receipt of payments or reimbursements. Accordingly, such delays could have an adverse effect on our liquidity and financial condition.
Our rehabilitation and other related healthcare services are also subject to delays in reimbursement, as we act as vendors to other providers who in turn must wait for reimbursement from other third-party payors. Each of these customers is therefore subject to the same potential delays to which our nursing homes are subject, meaning any such delays would further delay the date we would receive payment for the provision of our related healthcare services. To the extent we grow and expand the rehabilitation and other complementary services that we offer to third parties, we may incur increasing delays in payment for these services, and these payment delays could have an adverse effect on our liquidity and financial condition. We may also experience delays in reimbursement related to change of ownership applications for our acquired facilities, as well as changes in fiscal intermediaries.
Future acquisitions may use significant resources, may be unsuccessful and could expose us to unforeseen liabilities.
We intend to selectively pursue acquisitions and development of skilled nursing facilities, assisted living facilities, contract rehabilitation therapy businesses, and other related healthcare operations. Acquisitions may involve significant cash expenditures, debt incurrence, operating losses and additional expenses that could have a material adverse effect on our financial position, results of operations and liquidity. Acquisitions involve numerous risks, including:
• | difficulties integrating acquired operations, personnel and accounting and information systems, or in realizing projected efficiencies and cost savings; |
• | diversion of management's attention from other business concerns; |
• | potential loss of key employees or customers of acquired companies; |
• | entry into markets in which we may have limited or no experience; |
• | increasing our indebtedness and limiting our ability to access additional capital when needed; |
• | assumption of unknown liabilities or regulatory issues of acquired companies, including failure to comply with healthcare regulations or to establish internal financial controls; and |
• | straining of our resources, including internal controls relating to information and accounting systems, regulatory compliance, logistics and others. |
Furthermore, certain of the foregoing risks could be exacerbated when combined with other growth measures that we may pursue.
22
We lease a significant number of our facilities and may experience risks relating to lease termination, lease extensions and special charges.
Following the Combination with FC-GEN, Genesis Healthcare, Inc. faces risks because of the number of facilities we lease. As of February 2, 2015, we leased approximately 80% of our centers and 40% of those centers were leased from Health Care REIT, Inc. (“HCN”) and an additional 36% were leased pursuant to master lease agreements with other landlords. The loss or deterioration of our relationship with HCN may adversely affect our business.
Each of our lease agreements provide that the lessor may terminate the lease, subject to applicable cure provisions, for a number of reasons, including, the defaults in any payment of rent, taxes or other payment obligations or the breach of any other covenant or agreement in the lease. Termination of certain of our lease agreements could result in a cross-default under our debt agreements or other lease agreements.
Our leases generally provide for renewal or extension options. We expect to renew or extend our leases in the normal course of business; however, there can be no assurance that these rights will be exercised in the future or that we will be able to satisfy the conditions precedent to exercising any such renewal or extension. In addition, if we are unable to renew or extend any of our master leases, we may lose all of the facilities subject to that master lease agreement. If we are not able to renew or extend our leases at or prior to the end of the existing lease terms, or if the terms of such options are unfavorable or unacceptable to us, our business, financial condition and results of operation could be adversely affected.
Our high percentage of facilities leased pursuant to master lease agreements limits our ability to exit markets. As a result, if some facilities should prove to be unprofitable, we may remain obligated for lease payments even if we decide to withdraw from those locations. We could incur special charges relating to the closing of such facilities, including lease termination costs, impairment charges and other special charges that would reduce our profits and could have a material adverse effect on our business, financial condition or results of operations.
Global economic conditions may impact our ability to obtain additional financing on commercially reasonable terms or at all and our ability to expand our business may be harmed.
Global market and economic conditions in recent years have been very challenging with tight credit conditions and slow or negative economic growth in most major economies generally expected to continue in 2015 and possibly beyond. Ongoing concerns about the systemic impact of potential long-term and widespread economic recession or stagnation, energy costs, geopolitical issues, sovereign debt issues, the availability and cost of credit, and the global real estate and mortgage markets have contributed to increased market volatility, uncertainty and liquidity issues for both borrowers and investors. These conditions, combined with volatile prices for energy, food and other commodities, unstable business and consumer confidence, and significant unemployment, have contributed to pronounced economic volatility.
As a result of these market conditions, the cost and availability of credit has been and may continue to be adversely affected by illiquid credit markets, interest rate fluctuations and wider credit spreads. Concern about the stability of the markets generally and the strength of counterparties specifically has led many lenders and institutional investors to reduce, and in some cases, cease to provide credit to businesses and consumers. These factors have led to a decrease in spending by businesses and consumers alike, and a corresponding decrease in global infrastructure spending. Turbulence in the U.S. and international markets and economies and declines or stagnation in business and consumer spending may adversely affect our liquidity and financial condition, and the liquidity and financial condition of our customers, including our ability to refinance maturing liabilities and access the capital markets to meet liquidity needs.
If our ability to borrow under our credit facilities is insufficient for our capital requirements, we will be required to seek additional sources of financing, including issuing equity, which may be dilutive to our current stockholders or incurring additional debt. Our ability to incur additional debt is subject to the restrictions in our credit facilities. There can be no assurance that the restrictions contained in our credit facilities will permit us to borrow the funds that we need to finance our operations, or that additional debt will be available to us on commercially reasonable terms or at all. Furthermore, market conditions may impede our ability to secure additional sources of financing, whether through the extension of our existing credit facilities or by accessing the debt and/or equity markets. If we are unable to obtain funds sufficient to finance our capital requirements, we may have to forego opportunities to expand our business, including the acquisition or development of additional or expanded facilities.
Our substantial indebtedness could adversely affect our financial health and prevent us from fulfilling our financial obligations.
We have now and will for the foreseeable future continue to have a significant amount of indebtedness, both before and after the Combination with FC-GEN. At December 31, 2014, our total indebtedness was approximately $410.8 million.
23
Following the Combination with FC-GEN, our total funded indebtedness is approximately $970.0 million. Our substantial indebtedness could have important consequences. For example, it could:
• | increase our vulnerability to adverse economic and industry conditions; |
• | require us to dedicate a substantial portion of our cash flow from operations to payments on our indebtedness, thereby reducing the availability of our cash flow to fund working capital, capital expenditures and other general corporate purposes; |
• | limit our flexibility in planning for, or reacting to, changes in our business and the industry in which we operate; |
• | place us at a competitive disadvantage compared to our competitors that have less debt; |
• | increase the cost or limit the availability of additional financing, if needed or desired, to fund future working capital, capital expenditures and other general corporate requirements, or to carry out other aspects of our business plan; |
• | require us to maintain debt coverage and financial ratios at specified levels, reducing our financial flexibility; and |
• | limit our ability to make strategic acquisitions and develop new or expanded facilities. |
In addition, if we are unable to generate sufficient cash flow or otherwise obtain funds necessary to make required debt payments, or if we fail to comply with the various covenants and requirements of our credit facilities or other existing or future indebtedness, we would be in default, which could permit the holders of our indebtedness, including our credit facilities, to accelerate the maturity of indebtedness, as the case may be. Any default under our credit facilities, or our other existing or future indebtedness, as well as any of the above-listed factors, could have a material adverse effect on our business, operating results, liquidity and financial condition.
Despite our substantial indebtedness, we may still be able to incur more debt. This could intensify the risks associated with this indebtedness.
The terms of our credit facilities contain restrictions on our ability to incur additional indebtedness. These restrictions are subject to a number of important qualifications and exceptions, and the indebtedness incurred in compliance with these exceptions could be substantial. Accordingly, we could incur significant additional indebtedness in the future. The more we become leveraged, the more we become exposed to the risks described above under “Our substantial indebtedness could adversely affect our financial health and prevent us from fulfilling our financial obligations.”
Floating rate indebtedness subjects us to interest rate risk, which could cause our debt service obligations to increase.
Following the Combination with FC-GEN, we will have significant indebtedness in multiple instruments that bear interest at variable rates. Interest rate changes could affect the amount of our interest payments, and accordingly, our future earnings and cash flows, assuming other factors are held constant. As a result, an increase in interest rates, whether because of an increase in market interest rates or an increase in our own cost of borrowing, would increase the cost of servicing our debt and could materially reduce our profitability. See Item 7 - Management’s Discussion and Analysis of Financial Conditions and Results of Operations - Liquidity and Capital Resources and Item 7A. Quantitative and Qualitative Disclosures About Market Risk for a description of the types and level of indebtedness following the Combination.
Our operations are subject to environmental and occupational health and safety regulations, which could subject us to fines, penalties and increased operational costs.
We are subject to a wide variety of federal, state and local environmental and occupational health and safety laws and regulations. Regulatory requirements faced by healthcare providers such as us include those relating to air emissions, wastewater discharges, air and water quality control, occupational health and safety (such as standards regarding blood-borne pathogens and ergonomics), management and disposal of low-level radioactive medical waste, biohazards and other wastes, management of explosive or combustible gases, such as oxygen, specific regulatory requirements applicable to asbestos, lead-based paints, polychlorinated biphenyls and mold, other occupational hazards associated with our workplaces, and providing notice to employees and members of the public about our use and storage of regulated or hazardous materials and wastes. Failure to comply with these requirements could subject us to fines, penalties and increased operational costs. Moreover, changes in existing requirements or more stringent enforcement of them, as well as discovery of currently unknown conditions at our owned or leased facilities, could result in additional cost and potential liabilities, including liability for conducting cleanup, and there can be no guarantee that such increased expenditures would not be significant.
A portion of our workforce is unionized and our operations may be adversely affected by work stoppages, strikes or other collective actions.
As of December 31, 2014, approximately 531 of our 13,025 active employees were represented by unions and covered by collective bargaining agreements. Following the Combination, approximately 8,900 of the combined workforce of approximately 95,000 will be represented by unions and covered by collective bargaining agreements. In addition, certain labor unions have publicly stated that they are concentrating their organizing efforts within the long-term healthcare industry.
24
We cannot predict the effect that continued union representation or future organizational activities will have on our business or future operations. There can be no assurance that we will not experience a material work stoppage in the future.
Disasters and similar events may seriously harm our business.
Natural and man-made disasters and similar events, including terrorist attacks and acts of nature such as hurricanes, tornados, earthquakes, floods and wildfires, may cause damage or disruption to us, our employees and our facilities, which could have an adverse impact on our patients and our business. In order to provide care for our patients, we are dependent on consistent and reliable delivery of food, pharmaceuticals, utilities and other goods to our facilities, and the availability of employees to provide services at our facilities and other locations. If the delivery of goods or the ability of employees to reach our facilities and patients were interrupted in any material respect due to a natural disaster or other reasons, it would have a significant impact on our business. For example, in connection with Hurricane Katrina in New Orleans, several nursing home operators unaffiliated with us were accused of not properly caring for their residents, which resulted in, among other things, criminal charges being filed against the proprietors of those facilities. Furthermore, the impact, or impending threat, of a natural disaster has in the past and may in the future require that we evacuate one or more facilities, which would be costly and would involve risks, including potentially fatal risks, for the patients and employees. The impact of disasters and similar events is inherently uncertain. Such events could harm our patients and employees, severely damage or destroy one or more of our facilities, harm our business, reputation and financial performance, or otherwise cause our business to suffer in ways that we currently cannot predict.
The operation of our business is dependent on effective and secure information systems.
We depend on several information technology systems for the efficient functioning of our business. The software programs supporting these systems are licensed to us by independent software developers. Our inability or the inability of these developers, to continue to maintain and upgrade these information systems and software programs could disrupt or reduce the efficiency of our operations. In addition, costs and potential problems and interruptions associated with the implementation of new or upgraded systems and technology or with maintenance or adequate support of existing systems could also disrupt or reduce the efficiency of our operations. Furthermore, while we budget for changes and upgrades to our information technology systems that we anticipate needing over time, it is possible that we may underestimate the actual costs of those changes and upgrades. Failure to make necessary changes and upgrades due to financial or other concerns could negatively impact the effectiveness of our information technology systems, as well as our operations and financial performance.
Additionally, we maintain information necessary to conduct our business, including confidential and proprietary information as well as personal information regarding our patients, employees and others with whom we do business, in digital form. Data maintained in digital form is subject to the risk of tampering, theft and unauthorized access. We develop and maintain systems to prevent this from occurring, but the development and maintenance of these systems is costly and requires ongoing monitoring and updating as technologies change and efforts to overcome security measures become more sophisticated. Moreover, despite our efforts, the possibility of tampering, theft and other unauthorized access cannot be eliminated entirely, and risks associated with each of these remain. If our information technology systems are compromised and personal or other protected information regarding patients, employees or others with whom we do business is stolen, tampered with or otherwise improperly accessed, our ability to conduct our business and our reputation may be impaired. If personal or other protected information of our patients, employees or others with whom we do business is tampered with, stolen or otherwise improperly accessed, and we may incur significant costs to remediate possible injury to the affected persons, compensate the affected persons, pay any applicable fines, or take other action with respect to judicial or regulatory actions arising out of the incident, including under HIPAA or the HITECH Act, as applicable.
Following the Combination, we may not be able to successfully integrate our operations with FC-GEN's, which could adversely affect us and the market price of our common stock.
We cannot be certain whether, and to what extent, any strategic, operational, financial or other anticipated benefits of the Combination with FC-GEN will be achieved. Even if achieved, such benefits may be delayed or reduced in their realization. The success of the Combination will depend, in part, on achieving efficiencies and cost savings, and no assurances can be given that such efficiencies and savings will result following the Combination. Integration may be complex and may cause disruptions in the business of the combined company. Failure to integrate quickly and effectively may negatively impact our earnings.
The market price of our common stock may decline as a result of the Combination if the integration is unsuccessful, delayed or inconsistent with the expectations of financial analysts or investors.
We have incurred substantial costs and expect to incur additional transaction and integration costs in connection with the Combination.
We have incurred significant transaction costs in connection with the Combination with FC-GEN and expect to incur additional costs in connection with the integration of the combined company. Although we expect to achieve strategic, operational and
25
financial benefits as a result of the Combination, such benefits may be offset by the costs of integration or otherwise not be realized in the near term, or at all.
We may not be able to retain key employees following the acquisition, and such inability to retain employees could adversely affect our business.
The success of the combined company following the Combination with FC-GEN will depend in part on the ability to retain key employees who are expected to continue employment. If key employees decide not to remain with the combined company, it is possible we may be unable to secure employment of suitable replacements on reasonable terms. In addition, if key employees terminate their employment, the attention of management of the combined company might be diverted from the efforts to successfully integrate our and FC-GEN's operations to hiring suitable replacements.
Risks Related to Ownership of Our Class A Common Stock
The holders of a majority of the voting power of Genesis’ common stock have entered into a voting agreement, and the voting group’s interests may conflict with yours.
The holders of a majority of the voting power of Genesis’ common stock have entered into a voting agreement governing the election of our directors following the Combination. These holders constitute a “group” (as such term is defined in Section 13(d) of the Exchange Act) controlling a majority of the voting power of Genesis’s common stock (the “Voting Group”), and we therefore remain a “controlled company” following the Combination. Our Class A common stock, Class B common stock and Class C common stock each have one vote per share. As of February 2, 2015, the Voting Group owned shares of common stock representing over 63% of the combined voting power of our outstanding common stock. Accordingly, the Voting Group will generally have the power to control the outcome of matters on which stockholders are entitled to vote. Such matters include the election and removal of directors, the adoption or amendment of our certificate of incorporation and bylaws, possible mergers, corporate control contests and significant transactions. Through its control of elections to our board of directors, the Voting Group may also have the ability to appoint or replace our senior management and cause us to issue additional shares of our common stock or repurchase common stock, declare dividends or take other actions. The Voting Group may make decisions regarding our company and business that are opposed to our other stockholders’ interests or with which they disagree. The Voting Group may also delay or prevent a change of control of us, even if the change of control would benefit our other stockholders, which could deprive our other stockholders of the opportunity to receive a premium for their Class A common stock. The significant concentration of stock ownership and voting power may also adversely affect the trading price of our Class A common stock due to investors’ perception that conflicts of interest may exist or arise. To the extent that the interests of our public stockholders are harmed by the actions of the Voting Group, the price of our Class A common stock may be harmed.
Some of our directors are significant stockholders or representatives of significant stockholders, which may result in the diversion of corporate opportunities and other potential conflicts.
Our board of directors includes certain of our significant stockholders and representatives of certain of our significant stockholders. Those stockholders and their affiliates may invest in entities that directly or indirectly compete with us, companies with which we transact business, or companies in which they are currently invested or in which they serve as an officer or director may already compete with us. As a result of these relationships, when conflicts between the interests of those stockholders or their affiliates and the interests of our other stockholders arise, these directors may not be disinterested.
Also, in accordance with Delaware law, our board of directors adopted resolutions to specify the obligation of certain of our directors to present certain corporate opportunities to the Company. While such directors are required to present to us any corporate opportunities in our core businesses (as they may be expanded by our board of directors) and any other opportunity that is expressly offered as an opportunity for the Company, the resolutions also renounce our rights to certain other business opportunities. The resolutions further provide that such directors will not be liable to us or our stockholders for breach of any fiduciary duty that would otherwise exist by reason of the fact that any such individual directs a corporate opportunity (other than certain types of opportunities set forth in the resolutions) to any person instead of the Company or is engaged in certain current business activities, or does not refer or communicate information regarding such corporate opportunities to the Company. Accordingly, we may not be presented with certain corporate opportunities that we may find attractive and may wish to pursue.
If our stock price is volatile, purchasers of our Class A common stock could incur substantial losses.
Our stock price has been and is likely to continue to be volatile. The stock market in general often experiences substantial volatility that is seemingly unrelated to the operating performance of particular companies. These broad market fluctuations may adversely affect the trading price of our Class A common stock. The price for our Class A common stock may be influenced by many factors, including:
• | the depth and liquidity of the market for our Class A common stock; |
26
• | developments generally affecting the healthcare industry; |
• | investor perceptions of us and our business; |
• | actions by institutional or other large stockholders; |
• | strategic actions, such as acquisitions or restructurings, or the introduction of new services by us or our competitors; |
• | new laws or regulations or new interpretations of existing laws or regulations applicable to our business; |
• | litigation and governmental investigations; |
• | changes in accounting standards, policies, guidance, interpretations or principles; |
• | adverse conditions in the financial markets, state and federal government or general economic conditions, including those resulting from statewide, national or global financial and deficit considerations, overall market conditions, war, incidents of terrorism and responses to such events; |
• | sales of Class B common stock by Onex, |
• | sales of OP units by the Voting Group or members of our management team; |
• | additions or departures of key personnel; and |
• | our results of operations, financial performance and future prospects. |
These and other factors may cause the market price and demand for our Class A common stock to fluctuate substantially, which may limit or prevent investors from readily selling their shares of Class A common stock and may otherwise negatively affect the liquidity of our Class A common stock. In addition, in the past, when the market price of a stock has been volatile, holders of that stock have sometimes instituted securities class action litigation against the company that issued the stock. If any of our stockholders brought a lawsuit against us, we could incur substantial costs defending or settling the lawsuit. Such a lawsuit could also divert the time and attention of our management from our business.
If securities or industry analysts do not publish research or reports about our business, if they change their recommendations regarding our stock adversely or if our operating results do not meet their expectations, our stock price and trading volume could decline.
The trading market for our Class A common stock is significantly influenced by the research and reports that industry or securities analysts publish about us or our business. If one or more of these analysts cease coverage of our company or fail to publish reports on us regularly, we could lose visibility in the financial markets, which in turn could cause our stock price or trading volume to decline. Moreover, if one or more of the analysts who cover us downgrade our stock or if our operating results do not meet their expectations, our stock price could decline.
We do not intend to pay dividends on our common stock.
We do not anticipate paying any cash dividends on our common stock in the foreseeable future. We currently anticipate that we will retain all of our available cash, if any, for use as working capital and for other general purposes, including to service or repay our debt and to fund the operation and expansion of our business. Any payment of future dividends will be at the discretion of our board of directors and will depend on, among other things, our earnings, financial condition, capital requirements, level of indebtedness, statutory and contractual restrictions applying to the payment of dividends and other considerations that our board of directors deems relevant.
We are a “controlled company” within the meaning of NYSE rules and, as a result, qualify for and rely on exemptions from certain corporate governance requirements.
Certain of our stockholders who are parties to a voting agreement control a majority of the voting power of our outstanding common stock. Under the NYSE rules, a company of which more than 50% of the voting power is held by another person or group of persons acting together is a “controlled company” and may elect not to comply with certain NYSE corporate governance requirements, including the requirements that:
• | a majority of the board of directors consist of independent directors; |
• | the nominating and corporate governance committee be entirely composed of independent directors with a written charter addressing the committee’s purpose and responsibilities; |
• | the compensation committee be entirely composed of independent directors with a written charter addressing the committee’s purpose and responsibilities; and |
• | there be an annual performance evaluation of the nominating and corporate governance and compensation committees. |
We elect to be treated as a controlled company and thus utilize some of these exemptions. In addition, although we currently have a board composed of a majority of independent directors and have adopted charters for our audit, corporate governance, quality and compliance and compensation committees, and intend to conduct annual performance evaluations for these committees, none of these committees are composed of independent directors, except for our audit committee. Accordingly, you may not have the same protections afforded to stockholders of companies that are subject to all of NYSE corporate governance requirements.
27
Our amended and restated certificate of incorporation, bylaws and Delaware law contain provisions that could discourage transactions resulting in a change in control, which may negatively affect the market price of our Class A common stock.
In addition to the effect that the concentration of ownership and voting power in our significant stockholders may have, our amended and restated certificate of incorporation and our amended and restated bylaws contain provisions that may enable our management to resist a change in control. These provisions may discourage, delay or prevent a change in the ownership of our company or a change in our management, even if doing so might be beneficial to our stockholders. In addition, these provisions could limit the price that investors would be willing to pay in the future for shares of our Class A common stock. The provisions in our amended and restated certificate of incorporation or amended and restated bylaws include:
• | our board of directors is authorized, without prior stockholder approval, to create and issue preferred stock, commonly referred to as “blank check” preferred stock, with rights senior to those of our Class A common stock, Class B common stock and Class C common stock; |
• | advance notice requirements for stockholders to nominate individuals to serve on our board of directors or to submit proposals that can be acted upon at stockholder meetings; |
• | our board of directors is classified so not all of the members of our board of directors are elected at one time, which may make it more difficult for a person who acquires control of a majority of our outstanding voting stock to replace our directors; |
• | special meetings of the stockholders are permitted to be called only by the chairman of our board of directors, our chief executive officer,by a majority of our board of directors or by a majority of the voting power of the shares entitled to vote in connection with the election of directors of Genesis; |
• | stockholders are not permitted to cumulate their votes for the election of directors; |
• | newly created directorships resulting from an increase in the authorized number of directors or vacancies on our board of directors will be filled only by majority vote of the remaining directors; |
• | a majority of our board of directors is expressly authorized to make, alter or repeal our bylaws; and |
• | the affirmative vote of the holders of at least 66 2/3% of the combined voting power of the shares entitled to vote in connection with the election of directors of Skilled Healthcare is required to amend, alter, change, or repeal, or to adopt any provision inconsistent with the purpose and intent of certain articles of the Restated Charter relating to the management of Genesis’ business and conduct of the affairs; the rights to call special meetings of the stockholders; the ability to take action by written consent in lieu of a meeting of stockholders; the obligations of Genesis to indemnify its directors and officers; amendments to the bylaws; and amendments to the certificate of incorporation. |
We are also subject to the provisions of Section 203 of the Delaware General Corporation Law, which may prohibit certain business combinations with stockholders owning 15% or more of our outstanding voting stock. These and other provisions in our amended and rested certificate of incorporation, amended and restated bylaws and Delaware law could discourage acquisition proposals and make it more difficult or expensive for stockholders or potential acquirers to obtain control of our board of directors or initiate actions that are opposed by our then-current board of directors, including delaying or impeding a merger, tender offer or proxy contest involving us. Any delay or prevention of a change of control transaction or changes in our board of directors could cause the market price of our Class A common stock to decline.
Risks Related to Our Organizational Structure
We will be required to pay the other members of FC-GEN for certain tax benefits we may claim as a result of the tax basis step-up we receive in connection with exchanges of the members of FC-GEN for Genesis shares. In certain circumstances, payments under the tax receivable agreement may be accelerated and/or significantly exceed the actual tax benefits we realize.
FC-GEN Class A Common Units may be exchanged for shares of Class A common stock. Such exchanges of Class A Common Units in FC-GEN may result in increases in the tax basis of the assets of FC-GEN that otherwise would not have been available. Such increases in tax basis are likely to increase (for tax purposes) depreciation and amortization deductions and therefore reduce the amount of income tax we would otherwise be required to pay in the future. These increases in tax basis may also decrease gain (or increase loss) on future dispositions of certain capital assets to the extent the increased tax basis is allocated to those capital assets.
On February 2, 2015 we entered into a tax receivable agreement ("the TRA") with the members of FC-GEN that provides for the payment by us to such members of FC-GEN of 90% of the amount of cash savings, if any, in U.S. federal, state and local income tax or franchise tax that we actually realize as a result of (a) the increases in tax basis attributable to the members of FC-GEN and (b) tax benefits related to imputed interest deemed to be paid by us as a result of this TRA. While the actual increase in tax basis, as well as the amount and timing of any payments under the TRA, will vary depending upon a number of factors, the payments that we may make to the members of FC-GEN could be substantial.
Although we are not aware of any issue that would cause the Internal Revenue Service (the “IRS”) to challenge a tax basis increase, the IRS may challenge all or part of these tax basis increases, and a court could sustain such a challenge. In
28
such event, the FC-GEN members generally will not reimburse us for any payments that may previously have been made to them under the TRA. As a result, in certain circumstances we could make payments to the FC-GEN members under the TRA in excess of our cash tax savings.
In addition, the TRA provides that, upon a merger, asset sale or other form of business combination or certain other changes of control or if, at any time, we elect an early termination of the TRA, our (or our successor's) obligations with respect to exchanged or acquired Class A Common Units (whether exchanged or acquired before or after such change of control or early termination) would be based on certain assumptions, including that (i) in a case of an early termination, we would have sufficient taxable income to fully utilize the deductions arising from the increased tax deductions and tax basis and other benefits related to entering into the TRA; (ii) in the case of a change of control, we would have taxable income at least equal to our taxable income for the 12-month period ending on the last day of the month immediately preceding the change of control; and (iii) any Class A Common Units that have not been exchanged will be deemed exchanged for the market value of the Class A common stock at the time of early termination or change of control. Consequently, it is possible, in these circumstances also, that the actual cash tax savings realized by us may be significantly less than the corresponding TRA payments.
If Genesis were deemed an "investment company" under the Investment Company Act of 1940 as a result of its ownership of FC-GEN, applicable restrictions could make it impractical for us to continue our business as contemplated and could materially and adversely affect our operating results.
If Genesis were to cease participation in the management of FC-GEN, its interests in FC-GEN could be deemed an "investment security" for purposes of the Investment Company Act of 1940 (the "1940 Act"). Generally, a person is deemed to be an "investment company" if it owns investment securities having a value exceeding 40% of the value of its total assets (exclusive of U.S. government securities and cash items), absent an applicable exemption. Genesis has substantially no assets other than its equity interests in the managing member of FC-GEN and FC-GEN’s interests in its subsidiaries. A determination that this interest in FC-GEN was an investment security could result in Genesis being an investment company under the 1940 Act and becoming subject to the registration and other requirements of the 1940 Act. We intend to conduct our operations so that we will not be deemed an investment company. However, if we were to be deemed an investment company, restrictions imposed by the 1940 Act, including limitations on our capital structure and our ability to transact with affiliates, could make it impractical for us to continue our business as contemplated and have a material adverse effect on our business and operating results and the price of our Class A common stock.
Item 1B. | Unresolved Staff Comments |
Not applicable.
Item 2. | Properties |
As of December 31, 2014, our 95 long-term care facilities consisted of 72 of which were owned, 23 of which were leased. In addition, we own five facilities that have been leased to an unaffiliated third party operator. As of December 31, 2014, our operated facilities had a total of 10,275 licensed beds.
29
The following table provides information by state as of December 31, 2014 regarding the skilled nursing and assisted living facilities that we owned and leased.
Owned Facilities | Leased Facilities | Total Facilities | |||||||||||||||
Number | Licensed Beds | Number | Licensed Beds | Number | Licensed Beds | ||||||||||||
California | 12 | 1,384 | 12 | 1,545 | 24 | 2,929 | |||||||||||
Kansas | 26 | 1,439 | 1 | 96 | 27 | 1,535 | |||||||||||
Texas | 21 | 3,055 | — | — | 21 | 3,055 | |||||||||||
Nevada | 2 | 134 | 1 | 190 | 3 | 324 | |||||||||||
Missouri | 7 | 1,011 | — | — | 7 | 1,011 | |||||||||||
New Mexico | 2 | 208 | 8 | 968 | 10 | 1,176 | |||||||||||
Iowa | 2 | 164 | — | — | 2 | 164 | |||||||||||
Nebraska | — | — | 1 | 81 | 1 | 81 | |||||||||||
Total | 72 | 7,395 | 23 | 2,880 | 95 | 10,275 | |||||||||||
Skilled nursing | 51 | 6,349 | 22 | 2,714 | 73 | 9,063 | |||||||||||
Assisted living | 21 | 1,046 | 1 | 166 | 22 | 1,212 | |||||||||||
Skilled nursing facilities leased to unaffiliated third party operator | 5 | — | — | — | 5 | — | |||||||||||
Following the Combination with FC-GEN, as of February 18, 2015, the combined company operates in 416 additional facilities, 389 of which are leased, 18 of which have been managed by Genesis for unaffiliated operators, six of which are joint ventures and three of which are owned by the combined company. The combined company's operated facilities have an additional 49,123 licensed beds.
Following the Combination with FC-GEN, our executive offices are located in Kennett Square, Pennsylvania and we have several other corporate offices, including Towson, Maryland, Albuquerque, New Mexico, and Foothill Ranch, California. We own our chief executive offices in Kennett Square, Pennsylvania. Prior to the Combination with FC-GEN, our executive offices were located in Foothill Ranch, California.
Item 3. | Legal Proceedings |
For information regarding certain pending legal proceedings to which we are a party or our property is subject, see Note 13, "Commitments and Contingencies—Legal Matters," to our consolidated financial statements included elsewhere in this report, which is incorporated herein by reference.
Item 4. | Mine Safety Disclosures |
Not applicable.
PART II
Item 5. | Market for Registrant’s Common Equity, Related Stockholder Matters and Issuer Purchases of Equity Securities |
Our Class A common stock is listed on the New York Stock Exchange under the symbol "GEN." Information with respect to sales prices and record holders of our Class A common stock is set forth below. There is no established trading market for our Class B common stock or Class C common stock. Prior to the Combination, Genesis Class A common stock traded under the symbol "SKH" on the New York Stock Exchange.
30
Market Information
The following table sets forth, for the indicated quarterly periods, the high and low sale prices of our Class A common stock as reported by the New York Stock Exchange:
Year Ended December 31, 2014 | High ($) | Low ($) | |||||
First quarter | $ | 5.50 | $ | 4.08 | |||
Second quarter | 7.15 | 4.77 | |||||
Third quarter | 7.90 | 5.75 | |||||
Fourth quarter | 9.00 | 6.06 | |||||
Year Ended December 31, 2013 | High ($) | Low ($) | |||||
First quarter | $ | 6.90 | $ | 4.99 | |||
Second quarter | 7.51 | 5.96 | |||||
Third quarter | 6.81 | 4.10 | |||||
Fourth quarter | 5.25 | 4.19 | |||||
On February 18, 2015, the closing sales price of our Class A common stock on the New York Stock Exchange was $8.82 per share. On that date, there were 87 holders of record of our Class A common stock, 14 holders of record of our Class B common stock, and 72 holders of record of our Class C common stock.
Dividend Payment
We did not declare or pay cash dividends in either 2014 or 2013 on our Class A common stock or Class B common stock. We do not anticipate paying any cash dividends on our common stock in the foreseeable future. We currently anticipate that we will retain all of our available cash, if any, for use as working capital and for other general purposes, including to service or repay our debt and to fund the operation and expansion of our business.
Purchases of Equity Securities by the Issuer and Affiliated Purchasers
The table below sets forth information with respect to purchases of our Class A common stock made by us or on our behalf during the quarter ended December 31, 2014:
Period | Total Number of Shares Purchased(1) | Average Price Paid per Share | Total Number of Shares Purchased as Part of Publicly Announced Plans or Programs | Maximum Dollar Value of Shares that May Yet Be Purchased Under the Plans or Programs | ||||||
October 1 - 31, 2014 | — | $ | — | n/a | n/a | |||||
November 1 - 30, 2014 | 2,024 | $ | 7.03 | n/a | n/a | |||||
December 1 - 31, 2014 | 177,858 | $ | 8.57 | n/a | n/a | |||||
Total: | 179,882 | $ | 8.55 | n/a | n/a | |||||
(1) | Reflects shares forfeited to us upon the vesting of restricted stock granted to participants in our 2007 Incentive Award Plan, to satisfy applicable tax withholding obligations with respect to such vesting. We did not have any publicly announced plans or programs to purchase our Class A common stock in the quarter ended December 31, 2014. |
Securities Authorized for Issuance Under Equity Compensation Plans
We primarily issue stock options, restricted stock, and restricted stock units under our share-based compensation plans, which are part of a broad-based, long-term retention program that is intended to attract and retain talented employees and directors, and align stockholder and employee interests.
31
Pursuant to our Amended and Restated Skilled Healthcare Group, Inc. 2007 Incentive Award Plan, or 2007 Plan, we grant stock-based awards, including stock options, restricted stock awards, and restricted stock units, to employees and directors. Options are granted to purchase shares of our Class A common stock at a price not less than the fair market value of our Class A common stock on the date of grant. The 2007 Plan provides for the grant of incentive and non-qualified stock options as well as stock appreciation rights, restricted stock, restricted stock units, performance units and shares, and other stock-based awards. Generally, option grants and restricted stock awards to employees vest over four years and are exercisable for up to 10 years from the grant date. Our awards to certain executives have performance based criteria that must be met in order for the awards to vest. The Board of Directors may terminate the 2007 Plan at any time. Only shares of our Class A common stock can be issued or transferred pursuant to awards under the 2007 Plan. Upon closing of the Combination, options to purchase shares of common stock and shares of restricted stock automatically vested.
Additional information regarding our stock option plans and plan activity for fiscal year 2014, 2013 and 2012 is provided in the notes to our consolidated financial statements in this annual report, see Note 12, "Stock-Based Compensation."
The equity compensation plan information set forth in Part III, Item 12 "Security Ownership of Certain Beneficial Owners and Management and Related Stockholder Matters" of this report contains information concerning securities authorized for issuance under our equity compensation plans.
Stock Performance Graph
The following graph illustrates a comparison of the total cumulative stockholder return on our Class A common stock since December 31, 2009, to two indices: the S&P 500 and the Morningstar Long-Term Care Index. The graph assumes an initial investment of $100 on December 31, 2009, assuming reinvestment of dividends, if any. The comparisons in the graph are required by the U.S. Securities and Exchange Commission and are not intended to forecast or be indicative of possible future performance of our Class A common stock. The following graph and related information shall not be deemed "soliciting material" or deemed to be "filed" with the U.S. Securities and Exchange Commission, nor shall such information be incorporated by reference into any SEC filing unless we specifically incorporate it by reference into the particular filing.
COMPARISON OF CUMULATIVE TOTAL RETURN ON INVESTMENT
Assuming $100 Investment on December 31, 2009
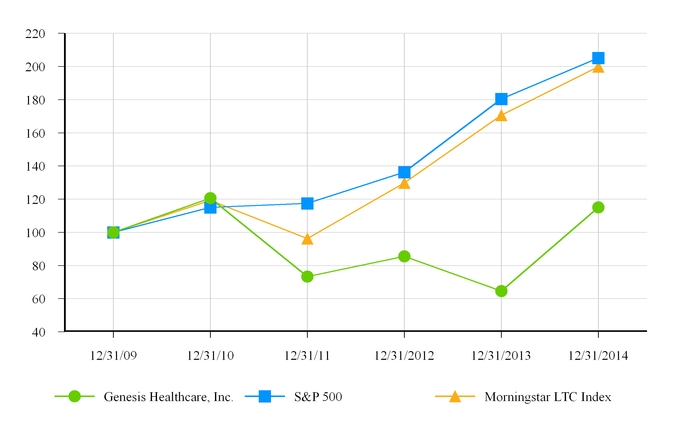
32
12/31/2009 | 12/31/2010 | 12/31/2011 | 12/31/2012 | 12/31/2013 | 12/31/2014 | ||||||||||||||||||
Genesis Healthcare, Inc. | $ | 100.00 | $ | 120.54 | $ | 73.29 | $ | 85.50 | $ | 64.56 | $ | 115.03 | |||||||||||
S&P 500 | 100.00 | 115.06 | 117.49 | 136.30 | 180.44 | 205.14 | |||||||||||||||||
Morningstar LTC Index | 100.00 | 119.18 | 96.24 | 129.83 | 170.62 | 199.81 | |||||||||||||||||
Item 6. | Selected Financial Data |
We derived the selected historical consolidated financial data below for each of the years ended December 31, 2014, 2013, and 2012, and as of December 31, 2014 and 2013, from our audited consolidated financial statements included elsewhere in this report. We derived the selected historical consolidated financial data for the years ended December 31, 2011 and 2010 and as of December 31, 2012, 2011 and 2010 from our consolidated financial statements not included in this report. Historical results are not necessarily indicative of future performance.
Our selected historical consolidated statements of operations have been recast to reflect our disposal of two skilled nursing facilities on December 1, 2013, as discontinued operations for the years ended December 31, 2014, 2013, and 2012, and the disposal of a Ventura, California hospice business, which we closed in September 2009, as discontinued operations for the year ended December 31, 2009. Please refer to the information set forth below in conjunction with other sections of this report, including “Management’s Discussion and Analysis of Financial Condition and Results of Operations,” and our consolidated historical financial statements and related notes included elsewhere in this report.
33
SELECTED CONSOLIDATED FINANCIAL DATA
Year ended December 31, | |||||||||||||||||||
2014 | 2013 | 2012 | 2011 | 2010 | |||||||||||||||
(in thousands, except per share data) | |||||||||||||||||||
Consolidated Statement of Operations Data | |||||||||||||||||||
Revenue | $ | 833,256 | $ | 842,272 | $ | 857,899 | $ | 851,875 | $ | 818,962 | |||||||||
Expenses | 804,756 | 816,747 | 783,154 | 1,016,383 | 780,621 | ||||||||||||||
Total other (expenses) income, net | (30,655 | ) | (34,614 | ) | (39,458 | ) | (36,854 | ) | (38,186 | ) | |||||||||
(Loss) income from continuing operations before (benefit) provision for income taxes | (2,155 | ) | (9,089 | ) | 35,287 | (201,362 | ) | 155 | |||||||||||
(Benefit) provision for income taxes | (1,248 | ) | (2,905 | ) | 12,896 | 2,892 | 1,995 | ||||||||||||
(Loss) income from continuing operations | (907 | ) | (6,184 | ) | 22,391 | $ | (204,254 | ) | (1,840 | ) | |||||||||
(Loss) income from discontinued operations, net of tax | — | (4,300 | ) | (794 | ) | 211 | — | ||||||||||||
Net (loss) income | $ | (907 | ) | $ | (10,484 | ) | $ | 21,597 | $ | (204,043 | ) | $ | (1,840 | ) | |||||
(Loss) earnings Per Share Data: | |||||||||||||||||||
(Loss) earnings per common share from continuing operations, basic | $ | (0.02 | ) | $ | (0.17 | ) | $ | 0.60 | $ | (5.50 | ) | $ | (0.05 | ) | |||||
(Loss) earnings per common share from discontinued operations, basic | — | (0.11 | ) | (0.02 | ) | 0.01 | — | ||||||||||||
(Loss) earnings per common share, basic | $ | (0.02 | ) | $ | (0.28 | ) | $ | 0.58 | $ | (5.49 | ) | $ | (0.05 | ) | |||||
(Loss) earnings per common share from continuing operations, diluted | $ | (0.02 | ) | $ | (0.17 | ) | $ | 0.60 | $ | (5.50 | ) | $ | (0.05 | ) | |||||
(Loss) earnings per common share from discontinued operations, diluted | — | (0.11 | ) | (0.02 | ) | 0.01 | — | ||||||||||||
(Loss) earnings per common share, diluted | $ | (0.02 | ) | $ | (0.28 | ) | $ | 0.58 | $ | (5.49 | ) | $ | (0.05 | ) | |||||
Weighted-average common shares outstanding, basic | 38,125 | 37,533 | 37,389 | 37,145 | 36,988 | ||||||||||||||
Weighted-average common shares outstanding, diluted | 38,125 | 37,533 | 37,589 | 37,145 | 36,988 | ||||||||||||||
Other Financial Data | |||||||||||||||||||
Capital expenditures (excluding acquisitions) | $ | (12,981 | ) | $ | (13,436 | ) | $ | (19,522 | ) | $ | (16,298 | ) | $ | (41,155 | ) | ||||
Net cash provided by operating activities | 26,321 | 47,921 | 42,676 | 99,380 | 75,021 | ||||||||||||||
Net cash used in investing activities | (11,825 | ) | (493 | ) | (19,525 | ) | (39,917 | ) | (46,168 | ) | |||||||||
Net cash used in financing activities | (15,044 | ) | (45,254 | ) | (37,165 | ) | (47,638 | ) | (27,762 | ) | |||||||||
EBITDA(1) | 53,407 | 44,305 | 95,382 | (139,268 | ) | 61,276 | |||||||||||||
EBITDA margin(1) | 6.4 | % | 5.3 | % | 11.1 | % | (16.3 | )% | 7.5 | % | |||||||||
Adjusted EBITDA(1) | 78,820 | 72,330 | 101,119 | 128,822 | 120,248 | ||||||||||||||
Adjusted EBITDA margin(1) | 9.5 | % | 8.6 | % | 11.8 | % | 15.1 | % | 14.7 | % | |||||||||
EBITDAR(2) | 73,407 | 63,133 | 113,323 | (121,425 | ) | 80,314 | |||||||||||||
EBITDAR margin(2) | 8.8 | % | 7.5 | % | 13.2 | % | (14.3 | )% | 9.8 | % | |||||||||
Adjusted EBITDAR(2) | 98,820 | 91,158 | 119,060 | 146,665 | 139,286 | ||||||||||||||
Adjusted EBITDAR margin(2) | 11.9 | % | 10.8 | % | 13.9 | % | 17.2 | % | 17.0 | % | |||||||||
34
As of December 31, | |||||||||||||||||||
2014 | 2013 | 2012 | 2011 | 2010 | |||||||||||||||
(in thousands) | |||||||||||||||||||
Balance Sheet Data | |||||||||||||||||||
Cash and cash equivalents | $ | 3,629 | $ | 4,177 | $ | 2,003 | $ | 16,017 | $ | 4,192 | |||||||||
Working capital | 46,091 | 44,629 | 34,522 | 41,336 | 49,946 | ||||||||||||||
Property and equipment and leased facility assets, net | 340,074 | 351,238 | 380,658 | 386,294 | 387,322 | ||||||||||||||
Total assets | 650,956 | 643,416 | 682,636 | 697,199 | 945,998 | ||||||||||||||
Long-term debt (including current portion and the revolving credit facility) | 410,845 | 419,125 | 448,967 | 475,483 | 519,963 | ||||||||||||||
Total stockholders’ equity | $ | 95,259 | $ | 92,232 | $ | 99,831 | $ | 73,596 | $ | 274,740 | |||||||||
________________
Notes
(1) | We define EBITDA as net (loss) income before depreciation, amortization and interest expense (net of interest income) and the provision for income taxes. EBTDA margin is EBITDA as a percentage of revenue. Adjusted EBITDA is EBITDA adjusted for non-core business items, which for the periods presented in this report includes gains or losses on debt retirement costs, impairment charges, litigation settlement costs, combination related expenses, the loss on disposal of property and equipment, expenses related to the exploration of strategic alternatives, and exit costs related to the disposition of certain of our operations in Northern California (each to the extent applicable in the appropriate period.) |
(2) | We define EBITDAR as net (loss) income before depreciation, amortization, interest expense (net of interest income), the provision for income taxes and rent cost of revenue. EBITDAR margin is EBITDAR as a percentage of revenue. Adjusted EBITDAR is EBITDAR adjusted for the non-core business items listed above for the definition of Adjusted EBITDA (each to the extent applicable in the appropriate period.) |
We believe that the presentation of EBITDA, EBITDAR, Adjusted EBITDA and Adjusted EBITDAR provides useful information regarding our operational performance because they enhance the overall understanding of the financial performance and prospects for the future of our core business activities.
Specifically, we believe that a report of EBITDA, EBITDAR, Adjusted EBITDA and Adjusted EBITDAR provides consistency in our financial reporting and provides a basis for the comparison of results of core business operations between our current, past and future periods. EBITDA, EBITDAR, Adjusted EBITDA and Adjusted EBITDAR are primary indicators management uses for planning and forecasting in future periods, including trending and analyzing the core operating performance of our business from period-to-period without the effect of accounting principles generally accepted in the United States of America ("U.S. GAAP") expenses, revenues and gains (losses) that we believe are unrelated to the day-to-day performance of our consolidated and segmented business. We also use EBITDA, EBITDAR, Adjusted EBITDA and Adjusted EBITDAR to benchmark the performance of our consolidated and segmented business against expected results, analyzing year-over-year trends as described below and to compare our operating performance to that of our competitors.
Management, including operating company based management, uses EBITDA, EBITDAR, Adjusted EBITDA and Adjusted EBITDAR to assess the performance of our core business operations, to prepare operating budgets and to measure our performance against those budgets on a consolidated and segment level. Segment management uses these metrics to measure performance on a business unit by business unit basis. We typically use Adjusted EBITDA and Adjusted EBITDAR for these purposes on a consolidated basis as the adjustments to EBITDA and EBITDAR are not generally allocable to any individual business unit and we typically use EBITDA and EBITDAR to compare the operating performance of each skilled nursing facility, assisted living facility, or other business unit as well as to assess the performance of our operating segments. EBITDA, EBITDAR, Adjusted EBITDA and Adjusted EBITDAR are useful in this regard because they do not include such costs as interest expense (net of interest income), income taxes, depreciation and amortization expense, rent cost of revenue (in the case of EBITDAR and Adjusted EBITDAR) and special charges, which may vary from business unit to business unit and period-to-period depending upon various factors, including the method used to finance the business, the amount of debt that we have determined to incur, whether a facility is owned or leased, the date of acquisition of a facility or business, the original purchase price of a facility or business unit or the tax law of the state in which a business unit operates. We believe these types of charges are dependent on factors unrelated to the underlying business unit performance. As a result, we believe that the use of EBITDA, EBITDAR, Adjusted EBITDA and Adjusted EBITDAR provides a meaningful and consistent comparison of our underlying business units between periods by eliminating certain items required by U.S. GAAP which have little or no significance to their day-to-day operations.
35
Finally, we use Adjusted EBITDA to determine compliance with our debt covenants and assess our ability to borrow additional funds and to finance or expand operations. Prior to the Combination, our senior secured credit facility used a measure substantially similar to Adjusted EBITDA as the basis for determining compliance with our financial covenants, specifically our minimum interest coverage ratio and our maximum total leverage ratio, and for determining the interest rate of our first lien term loan. For example, the senior secured credit facility included adjustments to EBITDA for (i) gain or losses on sale of assets, (ii) the write-off of deferred financing costs of extinguished debt, (iii) pro forma adjustments for acquisitions to show a full year of EBITDA and interest expense, (iv) sponsorship fees paid to Onex which totals $0.5 million annually, (v) non-cash stock compensation and (vi) impairment of long-lived assets. Our noncompliance with these financial covenants could lead to acceleration of amounts due under our senior secured credit facility.
Despite the importance of these measures in analyzing our underlying business, maintaining our financial requirements, designing incentive compensation and for our goal setting both on an aggregate and individual business level basis, EBITDA, EBITDAR, Adjusted EBITDA and Adjusted EBITDAR are non-GAAP financial measures that have no standardized meaning defined by U.S. GAAP. Therefore, our EBITDA, EBITDAR, Adjusted EBITDA and Adjusted EBITDAR measures have limitations as analytical tools, and they should not be considered in isolation, or as a substitute for analysis of our results as reported under U.S. GAAP. Some of these limitations are:
• | they do not reflect our cash expenditures, or future requirements, for capital expenditures or contractual commitments; |
• | they do not reflect changes in, or cash requirements for, our working capital needs; |
• | they do not reflect the interest expense, or the cash requirements necessary to service interest or principal payments, on our debt; |
• | they do not reflect any income tax payments we may be required to make; |
• | although depreciation and amortization are non-cash charges, the assets being depreciated and amortized will often have to be replaced in the future, and EBITDA and Adjusted EBITDA do not reflect any cash requirements for such replacements; |
• | they are not adjusted for all non-cash income or expense items that are reflected in our consolidated statements of cash flows; |
• | they do not reflect the impact on earnings of charges resulting from certain matters we consider not to be indicative of our ongoing operations; and |
• | other companies in our industry may calculate these measures differently than we do, which may limit their usefulness as comparative measures. |
We compensate for these limitations by using EBITDA, EBITDAR, Adjusted EBITDA and Adjusted EBITDAR only to supplement net income on a basis prepared in conformance with U.S. GAAP in order to provide a more complete understanding of the factors and trends affecting our business. Furthermore, the non-GAAP financial measures that we present may be different from the presentation of similar measures by other companies, so the comparability of the measures among companies may be limited. We strongly encourage investors to consider net income determined under U.S. GAAP as compared to EBITDA, EBITDAR, Adjusted EBITDA and Adjusted EBITDAR, and to perform their own analysis, as appropriate.
36
The following table provides a reconciliation of our net (loss) income, which is the most directly comparable financial measure presented in accordance with U.S. GAAP for the periods indicated, to EBITDA, EBITDAR, Adjusted EBITDAR and Adjusted EBITDA:
Year ended December 31, | |||||||||||||||||||
2014 | 2013 | 2012 | 2011 | 2010 | |||||||||||||||
(in thousands) | |||||||||||||||||||
Net (loss) income | $ | (907 | ) | $ | (10,484 | ) | $ | 21,597 | $ | (204,043 | ) | $ | (1,840 | ) | |||||
(Benefit) provision for income taxes | (1,248 | ) | (2,905 | ) | 12,896 | 2,892 | 1,995 | ||||||||||||
Depreciation and amortization | 24,322 | 23,771 | 23,641 | 23,602 | 25,047 | ||||||||||||||
Interest expense, net of interest income | 31,240 | 33,923 | 37,248 | 38,281 | 36,074 | ||||||||||||||
EBITDA | 53,407 | 44,305 | 95,382 | (139,268 | ) | 61,276 | |||||||||||||
Rent cost of revenue | 20,000 | 18,828 | 17,941 | 17,843 | 19,038 | ||||||||||||||
EBITDAR | 73,407 | 63,133 | 113,323 | (121,425 | ) | 80,314 | |||||||||||||
EBITDA | 53,407 | 44,305 | 95,382 | (139,268 | ) | 61,276 | |||||||||||||
Discontinued operations, net of tax (a) | — | 4,300 | 794 | (211 | ) | — | |||||||||||||
Loss (gain) on sale of assets (b) | 68 | — | — | 290 | (2,243 | ) | |||||||||||||
Impairment of long-lived assets (c) | 82 | 19,000 | — | 270,478 | — | ||||||||||||||
Governmental investigation expense (d) | 6,000 | — | — | — | — | ||||||||||||||
Litigation settlement costs,(net of recoveries) (e) | — | — | — | (4,488 | ) | 53,505 | |||||||||||||
Debt modification/retirement cost (f) | 843 | 2,828 | 4,126 | — | 7,010 | ||||||||||||||
Merger related expense (g) | 13,697 | 306 | — | — | 700 | ||||||||||||||
Legal expense for non-routine matters (h) | 2,285 | 2,531 | — | — | — | ||||||||||||||
Expenses related to the exploration of strategic alternatives (i) | — | — | — | 716 | — | ||||||||||||||
Exit costs related to Northern California divestiture (j) | — | — | — | 820 | — | ||||||||||||||
Recovery of expenses related to the divestiture of Westside Campus of Care facility (k) | — | — | — | (265 | ) | — | |||||||||||||
Change in fair value of contingent consideration (l) | (576 | ) | (3,702 | ) | 817 | 750 | — | ||||||||||||
Organization restructure costs (m) | 1,592 | 2,343 | — | — | — | ||||||||||||||
Exit costs related to divested facilities (n) | 397 | — | — | — | — | ||||||||||||||
Losses at skilled nursing facility not at full operation (o) | 1,025 | — | — | — | — | ||||||||||||||
Closure of California home health agency (p) | — | 419 | — | — | — | ||||||||||||||
Adjusted EBITDA | 78,820 | 72,330 | 101,119 | 128,822 | 120,248 | ||||||||||||||
Rent cost of revenue | 20,000 | 18,828 | 17,941 | 17,843 | 19,038 | ||||||||||||||
Adjusted EBITDAR | $ | 98,820 | $ | 91,158 | $ | 119,060 | $ | 146,665 | $ | 139,286 | |||||||||
________________
Notes
(a) | In 2013, we disposed of two skilled nursing facilities, one owned facility in Texas and one leased facility in California. The results of these transactions have been classified as discontinued operations. |
(b) | While unusual and non-recurring gains or losses on sales of assets are required under U.S. GAAP, these amounts are not reflective of income and losses of the Company's underlying business. |
(c) | During the third quarter of 2013, we recorded a goodwill impairment charge of $19.0 million related to our home health reporting unit. The proposed reimbursement reductions by the Centers for Medicare & Medicaid Services ("CMS") going into effect on January 1, 2014 combined with the recent operational under-performance of the home health care business unit were identified as factors for the impairment. During the third quarter of 2011, we recorded goodwill impairment charges of $243.2 million related to our long-term care reporting unit, $24.3 million for the therapy services reporting unit and a $3.0 million impairment charge within the therapy services reporting unit related to the Hallmark Rehabilitation business's trade name. The impairment charges of long-lived assets are the result of the July 29, 2011 announcement by CMS regarding the Medicare rate reductions and program changes that went into effect October 1, 2011. The impairment charges of long-lived assets are a non-cash accounting adjustment to our financial statements that does not affect our cash flows or our liquidity position. |
37
(d) | On or about August 6, 2014, in relation to its investigation of Creekside Hospice, the DOJ filed a notice of intervention in two pending qui tam proceedings filed by private party relators under the FCA and the NFCA and advised that it intended to take over the actions and file an amended complaint within 90 days, asserting that certain claims for hospice services provided by Creekside Hospice in the time period 2010 to 2013 did not meet Medicare requirements for reimbursement and are in violation of the civil False Claims Act. The DOJ filed its complaint in intervention on November 25, 2014, against Creekside, Skilled Healthcare Group, Inc., and Skilled Healthcare, LLC, asserting, among other things, that certain claims for hospice services provided by Creekside in the time period 2010 to 2013 did not meet Medicare requirements for reimbursement and are in violation of the civil False Claims Act. The DOJ is pursuing False Claims Act, NFCA, and federal common law claims remedies in an unspecified amount, with a request to treble provable damages and impose penalties per proved false claim in the amount ranging from $5,500 to $11,000 per claim, as applicable. While the Company denies the allegations and will defend this action, the Company has accrued $6.0 million as a contingent liability in connection with the matter, but it could ultimately cost more than that amount to settle or otherwise resolve it, including to satisfy any judgment that might be rendered against the Company or Creekside Hospice if the litigation defense were ultimately unsuccessful. |
(e) | In 2011, we recorded $4.5 million of insurance recoveries related to the litigation settlement expense of $53.5 million recorded during the third quarter of 2010. The $53.5 million was comprised of a $50.0 million cash settlement related to the Humboldt County Action described in "Note 13, Commitments and Contingencies-Legal Matters," and $3.0 million of related legal expenses, and $0.5 million in costs related to a securities class action related to our initial public offering (which was settled in September 2010). |
(f) | For the year ended December 31, 2014, we recorded debt modification/retirement costs of $0.8 million. The entire amount was related to the June 2014 credit facility agreement. During 2013, we recorded debt modification/retirement costs of $2.8 million. Of the $2.8 million expensed for debt modification, $1.1 million related to the June 2013 credit facility amendment. The remaining $1.7 million was related to deferred financing fees expensed on the extinguishment of term debt that was refinanced with HUD insured loans as well as the term debt that was refinanced with MidCap Financial. In the second quarter of 2012, we refinanced our senior subordinated notes (the "2014 Notes") and recorded debt retirement cost of $4.1 million. During the second quarter of 2010, we recorded debt retirement cost of $7.0 million in conjunction with the refinancing of our senior secured credit facility due to the expensing of deferred financing fees of $6.6 million and $0.4 million of interest rate swap termination costs as the swaps were incompatible with the refinanced credit facility. |
(g) | On February 2, 2015, the business and operations of Skilled and FC-GEN were combined. During 2014, we incurred $13.7 million in due diligence and merger related costs, including $2.0 million of employee severance costs. We expect to incur an additional $4.8 million of severance costs in 2015. In 2013, we incurred $0.3 million in the proposals to discuss the Combination. In 2010, hospice and home health costs of services included $0.7 million of non-recurring acquisition and due diligence related costs. |
(h) | In 2014 and 2013 we incurred $2.3 million and $2.5 million, respectively, in legal expenses related to government investigations and similar non-routine legal matters. |
(i) | On April 11, 2011, we announced that our Board of Directors had engaged J.P. Morgan Securities LLC to assist exploring strategic alternatives to maximize stockholder value, including a potential sale of our real estate assets or the whole company. On August 2, 2011, we announced that our Board of Directors determined to conclude the previously-announced exploration of strategic alternatives. We recorded $0.7 million in expenses related to the exploration of strategic alternatives. |
(j) | In April 2011, five of our subsidiaries that operate skilled nursing facilities in northern California transferred their operations to an unaffiliated third party skilled nursing facility operator. Another subsidiary of ours retained ownership of the real estate where the operations are located and has signed a 10-year lease with two 10-year extension options with the new operator. We recorded $0.8 million in exit costs in connection with the foregoing transaction. |
(k) | During the third quarter of 2011, we recorded a recovery of approximately $0.3 million in expenses related to the divestiture of Westside Campus of Care skilled nursing facility operations in Texas in December 2010. |
(l) | A benefit of $0.6 million and $3.7 million was recorded in 2014 and 2013, respectively, for the change in fair value of contingent consideration related to the 2010 hospice and home health acquisition due to reductions in forecasted EBITDA, which reduced the likelihood of the businesses achieving their EBITDA target necessary for the earn-out to be paid in future period. |
(m) | We recorded $1.6 million and $2.3 million in organization restructure costs during 2014 and 2013, respectively. |
(n) | During 2014 we recorded $0.4 million in costs related to Sycamore and Dallas facilities divested during the end of 2013. |
(o) | In 2014 we recorded $1.0 million related to our Kansas City Traditional Care Center which was commencing operations. |
38
(p) | In the third quarter of 2013 we recorded a $0.4 million intangible asset impairment charge related to the closure of our California home health agency. |
39
Item 7. | Management’s Discussion and Analysis of Financial Condition and Results of Operations |
This Management’s Discussion and Analysis of Financial Condition and Results of Operations is intended to assist in understanding and assessing the trends and significant changes in our results of operations and financial condition. Historical results may not indicate future performance. Our forward-looking statements, which reflect our current views about future events, are based on assumptions and are subject to known and unknown risks and uncertainties that could cause actual results to differ materially from those contemplated by these statements. Factors that may cause differences between actual results and those contemplated by forward-looking statements include, but are not limited to, those discussed in Item 1A, “Risk Factors,” of this report on Form 10-K. This Management’s Discussion and Analysis of Financial Condition and Results of Operations should be read in conjunction with “Selected Financial Data” in Item 6 of this report on Form 10-K and our consolidated financial statements and related notes included in this report.
Business Overview
The disclosures in this Management's Discussion and Analysis of Financial Condition and Results of Operations generally relate to a period prior to the February 2, 2015 closing of the Combination. As a result, the terms "Skilled," "we," "us," "our" and the "Company," and similar terms used in this Management's Discussion and Analysis of Financial Condition and Results of Operations, refer collectively to Genesis prior to the Combination (then named "Skilled Healthcare Group, Inc.") and its then consolidated wholly-owned subsidiaries and do not give effect to the Combination, unless the context requires otherwise.
Genesis is a holding company with subsidiaries that, on a combined basis as of the date of this report, comprise one of the nation's largest post-acute care providers with more than 500 skilled nursing centers and assisted/senior living communities in 34 states nationwide. Genesis subsidiaries also supply rehabilitation and respiratory therapy to more than 1,800 healthcare providers in 47 states and the District of Columbia. In addition, Genesis subsidiaries provide a full complement of administrative and consultative services to our affiliated operators and third-party operators with whom we contract to allow them to better focus on delivery of healthcare services. There were 25 such service agreements with unaffiliated or jointly owned skilled nursing facility operators. All of our healthcare operating subsidiaries focus on providing high-quality care to the people we serve, and our skilled nursing facility subsidiaries, which comprise the largest portion of our consolidated business, have a strong commitment to treating patients who require a high level of skilled nursing care and extensive rehabilitation therapy, whom we refer to as high-acuity patients.
On February 2, 2015, Genesis completed the previously announced Combination with FC-GEN. FC-GEN, now a subsidiary of Genesis, offers inpatient services through its network of 413 skilled nursing and assisted living facilities across 28 states, consisting of 379 skilled nursing facilities and 34 assisted living facilities. Of the 413 facilities, 386 are leased, 18 are managed, six are joint ventures and three are owned. Collectively, these skilled nursing and assisted living facilities have 48,922 licensed beds, approximately 49% of which are concentrated in the states of Massachusetts, Maryland, New Jersey, Pennsylvania and West Virginia. See "Note 18 - Combination with FC-GEN and Item 7 - Management’s Discussion and Analysis of Financial Conditions and Results of Operations - Liquidity and Capital Resources," for further details.
As of December 31, 2014, we operated 73 skilled nursing and 22 assisted living owned or leased facilities, together comprising 10,275 licensed beds. We also lease five skilled nursing facilities in California to an unaffiliated third party operator. Our skilled nursing and assisted living facilities, approximately 77% of which we own, are located in California, Texas, Iowa, Kansas, Missouri, Nebraska, Nevada and New Mexico, and are generally clustered in large urban or suburban markets. For the twelve months ended December 31, 2014, we generated approximately 75.2% of our revenue from our skilled nursing facilities, including our integrated rehabilitation therapy services at these facilities. The remainder of our revenue is generated from our assisted living services, rehabilitation therapy services provided to third-party facilities, hospice care and home health services, and lease of five skilled nursing facilities to an unaffiliated third party operator.
Our revenue was $833.3 million and $842.3 million for the years ended December 31, 2014 and 2013, respectively. We focus on acquiring existing facilities and businesses, developing new facilities and businesses, and improving our occupancy (census) rate and our skilled mix, which is the number of Medicare and managed care patient days at our skilled nursing facilities divided by the total number of patient days at our skilled nursing facilities for any given period. Medicare and managed care payors typically provide higher reimbursement than other payors because patients in these programs typically require a greater level of care and service.
As of December 31, 2014, we operated our business in three reportable operating segments: (1) long-term care services, which includes the operation of skilled nursing and assisted living facilities and is the most significant portion of our business; (2) therapy services, which includes our rehabilitation therapy services business; and (3) hospice and home health services, which includes our hospice and home health businesses. The “other” category includes general and administrative items. Our reporting segments are business units that offer different services, and that are managed separately due to the nature of services provided.
40
Acquisitions, Developments, and Divestiture
In September 2013, we ceased operations at our home health agency in California.
On December 1, 2013, our facility operated by a wholly owned subsidiary of our business, the Dallas Center of Rehabilitation, LLC ("DCR"), was sold to an unaffiliated third party. In addition, we transferred the operations of a leased facility, Sycamore Rehabilitation, to the same third party.
Key Financial Performance Indicators
We manage the fiscal aspects of our business by monitoring certain key performance indicators that affect our revenue and profitability. The most important key performance indicators for our business are:
• | Average daily number of patients—the total number of patients at our skilled nursing facilities in a period divided by the number of days in that period. |
• | Average daily rates—revenue per patient per day for Medicare or managed care, Medicaid and private pay and other, calculated as total revenue for Medicare or managed care, Medicaid and private pay and other at our skilled nursing facilities divided by actual patient days for that revenue source for any given period. |
• | EBITDA—net income (loss) before depreciation, amortization and interest expense (net of interest income) and the provision for income taxes. Additionally, Adjusted EBITDA means EBITDA as adjusted for non-core business items. See footnote 1 under Item 6 of this report, "Selected Financial Data," for an explanation of the adjustments and a description of our uses of, and the limitations associated with, EBITDA and Adjusted EBITDA. |
• | EBITDAR—net income (loss) before depreciation, amortization and interest expenses (net of interest income), the provision for income taxes and rent cost of revenue. Additionally, Adjusted EBITDAR means EBITDAR as adjusted for the non-core business items reflected in Adjusted EBITDA. See footnote 2 under Item 6 of this report, "Selected Financial Data," for an explanation of the adjustments and a description of our uses of, and the limitations associated with, EBITDAR and Adjusted EBITDAR. |
• | Number of facilities and licensed beds—the total number of skilled nursing facilities and assisted living facilities that we own or operate and the total number of licensed beds associated with our skilled nursing facilities and the total number of units associated with our assisted living facilities. |
• | Occupancy percentage—the average daily ratio during a measurement period of the total number of patients occupying beds in a skilled nursing facility to the number of available beds in the skilled nursing facility. During any measurement period, the number of licensed beds in a skilled nursing facility that are actually available to us may be less than the actual licensed bed capacity due to, among other things, bed de-certifications. |
• | Percentage of facilities owned—the number of skilled nursing facilities and assisted living facilities that we own as a percentage of the total number of facilities we operate. We believe that our success is positively influenced by the significant level of ownership of the facilities we operate. |
• | Quality mix—the amount of non-Medicaid revenue from each of our business units as a percentage of total revenue. In most states, Medicaid rates are generally the lowest of all payor types. |
• | Skilled mix—the number of Medicare and managed care patient days at our skilled nursing facilities divided by the total number of patient days at our skilled nursing facilities for any given period. |
The following tables summarize, for each of the periods indicated, our payor sources, quality mix, occupancy percentage, skilled mix, EBITDA, EBITDAR, Adjusted EBITDA and Adjusted EBITDAR and average daily rates and, at the end of the periods indicated, the number of facilities operated by us, the number of facilities that we own and lease, the total number of licensed beds and our total number of available beds:
Year Ended December 31, | |||||||||||
2014 | 2013 | 2012 | |||||||||
Occupancy statistics (skilled nursing facilities): | |||||||||||
Available beds in service at end of period | 8,673 | 8,587 | 8,595 | ||||||||
Available patient days | 3,147,130 | 3,136,805 | 3,145,738 | ||||||||
Actual patient days | 2,566,750 | 2,578,563 | 2,611,025 | ||||||||
Occupancy percentage | 81.6 | % | 82.2 | % | 83.0 | % | |||||
Skilled mix | 21.8 | % | 21.8 | % | 22.0 | % | |||||
Average daily number of patients | 7,032 | 7,065 | 7,134 | ||||||||
41
Hospice average daily census | 999 | 1,262 | 1,397 | ||||||||
Home health episodic-based admissions | 7,900 | 8,432 | 8,341 | ||||||||
Home health episodic-based recertifications | 1,863 | 1,942 | 1,624 | ||||||||
EBITDA(1) (in thousands) | $ | 53,407 | $ | 44,305 | $ | 95,382 | |||||
Adjusted EBITDA(1) (in thousands) | $ | 78,820 | $ | 72,330 | $ | 101,119 | |||||
EBITDAR(2) (in thousands) | $ | 73,407 | $ | 63,133 | $ | 113,323 | |||||
Adjusted EBITDAR(2) (in thousands) | $ | 98,820 | $ | 91,158 | $ | 119,060 | |||||
Revenue per patient day (skilled nursing facilities prior to intercompany eliminations) | |||||||||||
LTC only Medicare (Part A) | $ | 523 | $ | 520 | $ | 513 | |||||
Medicare blended rate (Part A & B) | 579 | 570 | 574 | ||||||||
Managed care (Part A) | 408 | 393 | 383 | ||||||||
Managed care blended rate (Part A & B) | 417 | 402 | 392 | ||||||||
Medicaid | 173 | 164 | 160 | ||||||||
Private and other | 176 | 172 | 172 | ||||||||
Weighted-average | $ | 244 | $ | 237 | $ | 236 | |||||
Patient days by payor (skilled nursing facilities) | |||||||||||
Medicare | 293,140 | 308,516 | 339,557 | ||||||||
Managed Care | 266,369 | 252,092 | 233,981 | ||||||||
Total skilled mix days | 559,509 | 560,608 | 573,538 | ||||||||
Private and other | 385,405 | 414,020 | 421,146 | ||||||||
Medicaid | 1,621,836 | 1,603,935 | 1,616,341 | ||||||||
Total days | 2,566,750 | 2,578,563 | 2,611,025 | ||||||||
Patient days as a percentage of total patient days (skilled nursing facilities) | |||||||||||
Medicare | 11.4 | % | 12.0 | % | 13.0 | % | |||||
Managed Care | 10.4 | 9.8 | 9.0 | ||||||||
Skilled mix | 21.8 | 21.8 | 22.0 | ||||||||
Private and other | 15.0 | 16.1 | 16.1 | ||||||||
Medicaid | 63.2 | 62.1 | 61.9 | ||||||||
Total | 100.0 | % | 100.0 | % | 100.0 | % | |||||
Revenue from (total company): | |||||||||||
Medicare | 28.4 | % | 30.9 | % | 33.6 | % | |||||
Managed care, private pay, and other | 37.5 | 37.5 | 36.0 | ||||||||
Quality mix | 65.9 | 68.4 | 69.6 | ||||||||
Medicaid | 34.1 | 31.6 | 30.4 | ||||||||
Total | 100.0 | % | 100.0 | % | 100.0 | % | |||||
42
As of December 31, | ||||||||
2014 | 2013 | 2012 | ||||||
Facilities: | ||||||||
Skilled nursing facilities: | ||||||||
Owned | 51 | 51 | 52 | |||||
Leased | 22 | 21 | 22 | |||||
Total skilled nursing facilities | 73 | 72 | 74 | |||||
Total licensed beds | 9,063 | 8,967 | 9,181 | |||||
Skilled nursing facilities leased to unaffiliated third party operator | 5 | 5 | 5 | |||||
Assisted living facilities: | ||||||||
Owned | 21 | 21 | 21 | |||||
Leased | 1 | 1 | 1 | |||||
Total assisted living facilities | 22 | 22 | 22 | |||||
Total licensed beds | 1,212 | 1,212 | 1,212 | |||||
Total facilities | 100 | 99 | 101 | |||||
Available beds in service (SNF only) | 8,673 | 8,587 | 8,809 | |||||
Percentage of owned facilities | 77.0 | % | 77.8 | % | 77.2 | % | ||
________________
(1) | EBITDA and Adjusted EBITDA, as defined above, are supplemental measures of our performance that are not required by, or presented in accordance with, U.S. GAAP. See the reconciliation of net (loss) income to EBITDA and Adjusted EBITDA, and a discussion of their uses and limitations, in Item 6 of this report, "Selected Financial Data." |
(2) | EBITDAR and Adjusted EBITDAR, as defined above, are supplemental measures of our performance that are not required by, or presented in accordance with, U.S. GAAP. See the reconciliation of net (loss) income to EBITDAR and Adjusted EBITDAR, and a discussion of their uses and limitations, in Item 6 of this report, "Selected Financial Data." |
Revenue
Revenue by Service Offering
We operate our businesses in three reportable operating segments: (i) long-term care services, which includes the operation of skilled nursing and assisted living facilities and is the most significant portion of our business; (ii) our rehabilitation therapy services business; and (iii) our hospice and home health businesses. Our reporting segments are business units that offer different services, and that are managed separately from one another due to the nature of services provided.
In our long-term care services segment, we derive the majority of our revenue by providing skilled nursing care and integrated rehabilitation therapy services to residents in our affiliated skilled nursing facilities. The remainder of our long-term care segment revenue is generated by our assisted living facilities, by our administration of an unaffiliated third party skilled nursing facility, and from our leasing of five skilled nursing facilities to an unaffiliated third party operator. In our therapy services segment, we derive revenue by providing rehabilitation therapy services to third-party facilities. In our hospice and home health services segment, we provide hospice and home health services.
43
The following table shows the revenue and percentage of our total revenue generated by each of these segments for the periods presented (dollars in thousands):
Year Ended December 31, | ||||||||||||||||||||||||||
2014 | 2013 | 2012 | ||||||||||||||||||||||||
Revenue Dollars | Revenue Percentage | Revenue Dollars | Revenue Percentage | Revenue Dollars | Revenue Percentage | Percentage Change | ||||||||||||||||||||
2014 vs. 2013 | 2013 vs. 2012 | |||||||||||||||||||||||||
Long-term care services: | ||||||||||||||||||||||||||
Skilled nursing facilities | $ | 626,238 | 75.2 | % | $ | 609,189 | 72.3 | % | $ | 614,906 | 71.7 | % | 2.8 | % | (0.9 | )% | ||||||||||
Assisted living facilities | 30,616 | 3.7 | 28,355 | 3.4 | 28,042 | 3.3 | 8.0 | 1.1 | ||||||||||||||||||
Administration of third party facilities | 662 | 0.1 | 595 | 0.1 | 791 | 0.1 | 11.3 | (24.8 | ) | |||||||||||||||||
Leased facility revenue | 3,201 | 0.3 | 3,122 | 0.3 | 3,060 | 0.3 | 2.5 | 2.0 | ||||||||||||||||||
Total long-term care services | 660,717 | 79.3 | 641,261 | 76.1 | 646,799 | 75.4 | 3.0 | (0.9 | ) | |||||||||||||||||
Therapy services: | ||||||||||||||||||||||||||
Third-party rehabilitation therapy services | 89,921 | 10.8 | 102,169 | 12.1 | 104,403 | 12.2 | (12.0 | ) | (2.1 | ) | ||||||||||||||||
Total therapy services | 89,921 | 10.8 | 102,169 | 12.1 | 104,403 | 12.2 | (12.0 | ) | (2.1 | ) | ||||||||||||||||
Hospice & home health services: | ||||||||||||||||||||||||||
Hospice | 57,897 | 6.9 | 71,268 | 8.5 | 80,306 | 9.3 | (18.8 | ) | (11.3 | ) | ||||||||||||||||
Home health | 24,721 | 3.0 | 27,574 | 3.3 | 26,391 | 3.1 | (10.3 | ) | 4.5 | |||||||||||||||||
Total hospice & home health services | 82,618 | 9.9 | 98,842 | 11.8 | 106,697 | 12.4 | (16.4 | ) | (7.4 | ) | ||||||||||||||||
Total | $ | 833,256 | 100.0 | % | $ | 842,272 | 100.0 | % | $ | 857,899 | 100.0 | % | (1.1 | )% | (1.8 | )% | ||||||||||
Sources of Revenue
The following table sets forth revenue consolidated by state in dollars and as a percentage of total revenue for the periods presented (dollars in thousands):
Year Ended December 31, | ||||||||||||||||||||
2014 | 2013 | 2012 | ||||||||||||||||||
Revenue Dollars | Percentage of Revenue | Revenue Dollars | Percentage of Revenue | Revenue Dollars | Percentage of Revenue | |||||||||||||||
California | $ | 335,325 | 40.2 | % | $ | 343,948 | 40.8 | % | $ | 342,398 | 39.9 | % | ||||||||
Texas | 168,623 | 20.2 | 164,369 | 19.5 | 172,215 | 20.1 | ||||||||||||||
New Mexico | 100,189 | 12.0 | 98,901 | 11.7 | 99,439 | 11.6 | ||||||||||||||
Kansas | 63,690 | 7.7 | 60,848 | 7.2 | 61,662 | 7.2 | ||||||||||||||
Missouri | 61,615 | 7.4 | 58,644 | 7.0 | 59,743 | 7.0 | ||||||||||||||
Nevada | 54,467 | 6.6 | 59,410 | 7.1 | 62,916 | 7.3 | ||||||||||||||
Montana | 13,470 | 1.6 | 14,220 | 1.7 | 15,665 | 1.8 | ||||||||||||||
Iowa | 10,075 | 1.2 | 9,556 | 1.1 | 10,598 | 1.2 | ||||||||||||||
Idaho | 9,571 | 1.1 | 10,603 | 1.3 | 10,300 | 1.2 | ||||||||||||||
Arizona | 9,156 | 1.1 | 14,053 | 1.7 | 14,618 | 1.7 | ||||||||||||||
Nebraska | 7,075 | 0.9 | 6,246 | 0.7 | 4,721 | 0.6 | ||||||||||||||
Indiana | — | — | 1,474 | 0.2 | 3,624 | 0.4 | ||||||||||||||
Total | $ | 833,256 | 100.0 | % | $ | 842,272 | 100.0 | % | $ | 857,899 | 100.0 | % | ||||||||
44
Long-Term Care Services Segment
Skilled Nursing Facilities. Within our skilled nursing facilities, we generate our revenue from Medicare, Medicaid, managed care providers, insurers, private pay and other sources. We believe that our skilled mix, which we define as the number of Medicare and non-Medicaid managed care patient days at our skilled nursing facilities divided by the total number of patient days at our skilled nursing facilities for any given period, is an important indicator of our success in attracting high-acuity patients because it represents the percentage of our patients who are reimbursed by Medicare and managed care payors, for whom we receive higher reimbursement rates. Most of our skilled nursing facilities include our Express RecoveryTM program. This program uses a dedicated unit within a skilled nursing facility to deliver a comprehensive rehabilitation and recovery regimen in accommodations specifically designed to serve high-acuity patients.
Skilled mix remained constant in 2014 and 2013 at 21.8%. We continued to experience a decrease in Medicare patient days partially offset by an increase in our Medicaid and Managed care patient days in 2014 as more seniors elected managed Medicare. Our managed care patient per day (PPD) rates are lower than our Medicare PPD rates and our managed care patients historically have had a shorter length of stay than our Medicare patients.
Assisted Living Facilities. Within our assisted living facilities, which are mostly in Kansas, we generate our revenue primarily from private pay sources, with a small portion earned from Medicaid or other state-specific programs.
Leased Facility Revenue. We lease five skilled nursing facilities in California to an unaffiliated third party operator. For additional information on the lease arrangement, see Note 9, "Property and Equipment."
Therapy Services Segment
As of December 31, 2014, we provided rehabilitation therapy services to a total of 175 healthcare facilities, including 63 of our facilities, as compared to 174 facilities, including 62 of our facilities, as of December 31, 2013. In addition, we have contracts to manage the rehabilitation therapy services for our 10 healthcare facilities in New Mexico. The net increase of 1 facility serviced was comprised of 8 new facilities serviced, net of 7 cancellations. Rehabilitation therapy revenue derived from servicing our own facilities is included in our revenue from skilled nursing facilities. Our rehabilitation therapy business receives payment for services from the third-party skilled nursing facilities that it serves based on negotiated patient per diem rates or a negotiated fee schedule based on the type of service rendered. As of December 31, 2014, we provided rehabilitation therapy services to facilities in California, Kansas, Nevada, Texas, Missouri, Nebraska, and Iowa.
Hospice and Home Health Services Segment
Hospice. As of December 31, 2014, we provided hospice care in Arizona, California, Idaho, Montana, Nevada and New Mexico. We derive substantially all of the revenue from our hospice business from Medicare and managed care reimbursement.
For a Medicare beneficiary to qualify for the Medicare hospice benefit, two physicians must certify that, in their best judgment, the beneficiary has less than six months to live, assuming the beneficiary’s disease runs its normal course. In addition, the Medicare beneficiary must affirmatively elect hospice care and waive any rights to other Medicare benefits related to his or her terminal illness. Each benefit period, a physician must re-certify that the Medicare beneficiary’s life expectancy is six months or less in order for the beneficiary to continue to qualify for and to receive the Medicare hospice benefit. The first two benefit periods are measured at 90-day intervals and subsequent benefit periods are measured at 60-day intervals. There is no limit on the number of periods that a Medicare beneficiary may be re-certified. A Medicare beneficiary may revoke his or her election at any time and begin receiving traditional Medicare benefits.
Medicare reimburses for hospice care. We receive one of four predetermined daily or hourly rates based on the level of care we furnish to the beneficiary. These rates are subject to annual adjustments based on inflation and geographic wage considerations.
We are subject to two limitations on Medicare payments for hospice services. First, if inpatient days of care provided to patients at a hospice exceed 20% of the total days of hospice care provided for an annual period beginning on November 1st, then payment for days in excess of this limit are paid for at the routine home care rate. None of our hospice programs exceeded the payment limits on inpatient services for 2009 through 2014.
45
Second, overall payments made by Medicare to us on a per hospice program basis are also subject to a cap amount calculated by the Medicare fiscal intermediary at the end of the hospice cap period. The Medicare revenue paid to a hospice program from November 1 to October 31 may not exceed the annual aggregate cap amount. Up to the 2011 fiscal cap year, which began on November 1, 2010, this annual aggregate cap amount is calculated by multiplying the number of first time Medicare hospice beneficiaries during the year by the Medicare per beneficiary cap amount, resulting in that hospice’s aggregate cap, which is the allowable amount of total Medicare payments that hospice can receive for that cap year. This method is known as the streamlined method. Beginning with the 2011 fiscal cap year, unless an agency elected to stay with the streamlined method, the hospice cap amount is calculated under the proportional method, which spreads the hospice patient's lifetime cap allowance over the period for which the patient is under hospice care. For a hospice agency to estimate its cap exposure under the proportional method, the agency must estimate how long patients will stay on service. If a hospice exceeds its aggregate cap, then the hospice must repay the excess back to Medicare. The Medicare cap amount is reduced proportionately for patients who transferred in and out of our hospice services. The Medicare cap amount is adjusted annually for inflation, but is not adjusted for geographic differences in wage levels, although hospice per diem payment rates are wage indexed. In 2014, 2013, and 2012 we estimated and recorded a cap reserve of $2.7 million, $5.6 million, and $4.1 million respectively. See Item 1A of this report, “Risk Factors—We are subject to a Medicare cap amount for our hospice business. Our net patient service revenue and profitability could be adversely affected by limitations on Medicare payments.”
Home Health. We provided home health care in Arizona, Idaho, Montana, Nevada, and New Mexico as of December 31, 2014. We derive the majority of the revenue from our home health business from Medicare. The payment is adjusted for the health condition and care needs of the beneficiary. The payment is also adjusted for the geographic differences in wages for home health agencies across the country. The adjustment for the health condition, or clinical characteristics, and service needs of the beneficiary is referred to as the case-mix adjustment. The home health PPS will provide home health agencies with payments for each 60-day episode of care for each beneficiary. If a beneficiary is still eligible for care after the end of the first episode, a second episode can begin. There are no limits to the number of episodes a beneficiary who remains eligible for the home health benefit can receive. While payment for each episode is adjusted to reflect the beneficiary’s health condition and needs, a special outlier provision exists to ensure appropriate payment for those beneficiaries that have the most expensive care needs.
Regulatory and other Governmental Actions Affecting Revenue
We derive a substantial portion of our revenue from government Medicare and Medicaid programs. In addition, our rehabilitation therapy services, for which we receive payment from private payors, is significantly dependent on Medicare and Medicaid funding, as those private payors are primarily funded or reimbursed by these programs. The following table summarizes the amount of revenue that we received from each of our payor classes by segment in the periods presented (dollars in thousands):
Year Ended December 31, | ||||||||||||||||||||||||||||||||||||||||||||||||||||||||
2014 | 2013 | 2012 | ||||||||||||||||||||||||||||||||||||||||||||||||||||||
Long-term Care Services | Therapy Services | Hospice & Home Health Services | Total Revenue | Revenue % | Long-term Care Services | Therapy Services | Hospice & Home Health Services | Total Revenue | Revenue % | Long-term Care Services | Therapy Services | Hospice & Home Health Services | Total Revenue | Revenue % | ||||||||||||||||||||||||||||||||||||||||||
Medicare | $ | 169,469 | $ | — | $ | 67,364 | $ | 236,833 | 28.4 | % | $ | 175,705 | $ | — | $ | 84,426 | $ | 260,131 | 30.9 | % | $ | 194,911 | $ | — | $ | 93,007 | $ | 287,918 | 33.6 | % | ||||||||||||||||||||||||||
Medicaid | 279,938 | — | 3,736 | 283,674 | 34.1 | 263,251 | — | 3,199 | 266,450 | 31.6 | 258,424 | — | 2,448 | 260,872 | 30.4 | |||||||||||||||||||||||||||||||||||||||||
Subtotal Medicare and Medicaid | 449,407 | — | 71,100 | 520,507 | 62.5 | 438,956 | — | 87,625 | 526,581 | 62.5 | 453,335 | — | 95,455 | 548,790 | 64.0 | |||||||||||||||||||||||||||||||||||||||||
Managed Care | 111,000 | — | 6,644 | 117,644 | 14.1 | 101,331 | — | 5,784 | 107,115 | 12.7 | 91,718 | — | 4,874 | 96,592 | 11.3 | |||||||||||||||||||||||||||||||||||||||||
Private pay and other | 100,310 | 89,921 | 4,874 | 195,105 | 23.4 | 100,974 | 102,169 | 5,433 | 208,576 | 24.8 | 101,747 | 104,403 | 6,367 | 212,517 | 24.7 | |||||||||||||||||||||||||||||||||||||||||
Total | $ | 660,717 | $ | 89,921 | $ | 82,618 | $ | 833,256 | 100.0 | % | $ | 641,261 | $ | 102,169 | $ | 98,842 | $ | 842,272 | 100.0 | % | $ | 646,800 | $ | 104,403 | $ | 106,696 | $ | 857,899 | 100.0 | % | ||||||||||||||||||||||||||
46
Medicare. Medicare is a federal program that provides certain healthcare benefits to beneficiaries who are 65 years of age or older, blind, disabled or qualify for Medicare’s End Stage Renal Disease program. Medicare provides health insurance benefits in two primary parts for services that we provide:
• | Part A. Medicare Part A is hospital insurance, which provides reimbursement for inpatient services for hospitals, skilled nursing facilities, hospices, home health and certain other healthcare providers and patients requiring daily professional skilled nursing and other rehabilitative care. Coverage in a skilled nursing facility is limited for a period of up to 100 days, if medically necessary, after the individual has qualified for Medicare coverage as a result of a three-day or longer hospital stay. Medicare pays for the first 20 days of stay in a skilled nursing facility in full and the next 80 days, to the extent above a daily coinsurance amount. Covered services include supervised nursing care, room and board, social services, pharmaceuticals and supplies as well as physical, speech and occupational therapies and other necessary services provided by nursing facilities. Medicare Part A also covers hospice care and some home health care. Skilled nursing facilities are paid under Medicare Part A on the basis of a prospective payment system, or PPS. The PPS payment rates are adjusted for case mix and geographic variation in wages and cover all costs of furnishing covered skilled nursing facilities services (routine, ancillary, and capital-related costs). The amount to be paid is determined by classifying each patient into a resource utilization group ("RUG"), category, which is based upon the patient's acuity level. CMS generally evaluates and adjusts payment rates on an annual basis. |
• | Part B. Medicare Part B is supplemental medical insurance, which requires the beneficiary to pay monthly premiums, covers physician services, limited drug coverage and other outpatient services, such as physical, occupational and speech therapy services, enteral nutrition, certain medical items and X-ray services received outside of a Part A covered inpatient stay. |
Medicaid. Medicaid is a state-administered medical assistance program for the indigent, operated by the individual states with the financial participation of the federal government. Each state has relatively broad discretion in establishing its Medicaid reimbursement formulas and coverage of service, which must be approved by the federal government in accordance with federal guidelines. All states in which we operate cover long-term care services for individuals who are Medicaid eligible and qualify for institutional care. Providers must accept the Medicaid reimbursement level as payment in full for services rendered. Medicaid programs generally make payments directly to providers, except in cases where the state has implemented a Medicaid managed care program, under which providers receive Medicaid payments from managed care organizations ("MCOs") that have subcontracted with the Medicaid program. PPACA provides for increased financial participation by the federal government in a state's Medicaid program if the state chooses to expand its Medicaid program as contemplated by PPACA. However, states are not required to expand their Medicaid programs and it is uncertain as to which states, including states in which we operate, will ultimately expand their programs.
The Company is participating in the recently established Upper Payment Limit (UPL) supplemental payment program in the state of Texas that provides supplemental Medicaid payments for skilled nursing facilities that are licensed to non-state government entities such as county hospital districts. Company subsidiaries previously operating twenty Company-owned Texas skilled nursing facilities entered into transactions with such hospital districts providing for the transfer of the licenses for the twenty Company-owned Texas skilled nursing facilities to the hospital districts, and providing further for the Company’s operating subsidiaries to retain the management of those facilities on behalf of the hospital districts, which are all participating in the UPL program. Each affected Operating subsidiary therefore retains operations of its skilled nursing facility and each agreement between the hospital district and the Company subsidiary is terminable by either party to fully restore the prior license status.
Managed Care. Our managed care patients consist of individuals who are insured by a third-party entity, typically called a senior Health Maintenance Organization, ("HMO") plan, or are Medicare beneficiaries who assign their Medicare benefits to a senior HMO plan.
Private Pay and Other. Private pay and other sources consist primarily of individuals or parties who directly pay for their services or are beneficiaries of the Department of Veterans Affairs.
Primary Expense Components
Cost of Services
Cost of services in our long-term care services segment primarily includes salaries and benefits, supplies, purchased services, ancillary expenses such as the cost of pharmacy and therapy services provided to patients and residents, and operating expenses of our skilled nursing and assisted living facilities, including professional and general liability insurance.
Cost of services in our therapy services and hospice and home health services segments primarily includes salaries and benefits, supplies, purchased services, expenses for general and professional liability insurances and other operating expenses.
47
General and Administrative
General and administrative expenses are primarily salaries, bonuses and benefits and purchased services to operate our administrative service company. Also included in general and administrative expenses are expenses related to non-cash stock-based compensation and professional fees, including accounting, financial audit and legal fees.
Performance Based Incentive Compensation
Our performance based incentive compensation plan for each of our operating segments provides for cash bonus payments that are intended to reflect the achievement of key operating measures, including quality outcomes, customer satisfaction, cash collections, efficient resource utilization and operating budget goals. We accrue bonus expense based on the ratable achievement of these operating measures.
Depreciation and Amortization
Depreciation and amortization relates to the ratable write-off of assets such as our owned buildings and equipment over their estimated useful lives. Depreciation and amortization is computed using the straight-line method over the estimated useful lives of the assets as follows:
Buildings and improvements | 15-40 years | |
Leasehold improvements | Shorter of the lease term or estimated useful life, generally 5-10 years | |
Furniture and equipment | 3-10 years | |
Rent Cost of Revenue
Rent consists of the straight-line recognition of lease amounts payable to third-party owners of skilled nursing facilities and assisted living facilities that we operate but do not own.
Critical Accounting Policies and Estimates
The preparation of our financial statements and related disclosures requires us to make judgments, estimates and assumptions that affect the reported amounts of assets and liabilities and disclosure of contingent assets and liabilities at the date of the financial statements and the reported amounts of revenue and expenses during the reporting period. On an ongoing basis, we reevaluate our judgments and estimates, including those related to revenue, doubtful accounts, self-insurance liabilities, income taxes and loss contingencies. We base our estimates and judgments on our historical experience, knowledge of current conditions and our belief of what could occur in the future considering available information, including assumptions that are believed to be reasonable under the circumstances. Actual results may differ materially from these estimates under different assumptions or conditions. By their nature, these estimates and judgments are subject to an inherent degree of uncertainty and actual results could differ materially from the amounts reported based on these policies.
The following represents a summary of our critical accounting policies, defined as those policies and estimates that we believe: (a) are the most important to the portrayal of our financial condition and results of operations and (b) require management’s most subjective or complex judgments, often as a result of the need to make estimates about the effects of matters that are inherently uncertain.
Revenue recognition
Our net patient service revenue is derived primarily from our skilled nursing facilities, which includes our integrated rehabilitation therapy services at these facilities, with the remainder generated by our post-acute related healthcare services. These other healthcare services consist of our rehabilitation therapy services provided to third-party facilities, as well as services provided by our assisted living facilities and by our hospice care and home health businesses. We record our net patient service revenue on an accrual basis as services are performed at their estimated net realizable value under these programs. Our revenue from governmental and managed care programs is subject to ongoing audit and retroactive adjustment by governmental and third-party agencies. Retroactive adjustments that are likely to result from ongoing and future audits by third-party payors are accrued on an estimated basis in the period the related services are performed. Consistent with accounting practices in the healthcare industry, we record any changes to these governmental revenue estimates in the period in which the change or adjustment becomes known based on final settlements. Because of the complexity of the laws and regulations governing Medicare and state Medicaid assistance programs, our revenue estimates may potentially change by a material amount.
Overall payments made by Medicare for hospice services are subject to an annual cap amount on a per hospice agency basis. Total Medicare payments received for services rendered during the applicable Medicare hospice cap year by each Medicare-certified agency during this period are compared to the cap amount for the relevant period. Payments in excess of the cap are subject to recoupment by Medicare.
48
Allowance for doubtful accounts
We maintain allowances for doubtful accounts related to estimated losses resulting from nonpayment of patient accounts receivable and third-party billings and notes receivable from customers. In evaluating the collectability of accounts receivable, we consider a number of factors, including the age of the accounts, changes in collection trends, the composition of patient accounts by payor, the status of ongoing disputes with third-party payors, underlying guarantees, and general industry conditions. If the financial condition of our customers were to deteriorate, resulting in an impairment of their ability to make payments, additional allowances may be required. Our receivables from Medicare and Medicaid payor programs represent our only significant concentration of credit risk. We do not believe there to be significant credit risks associated with these governmental programs. If, at December 31, 2014, we were to recognize an increase of 10% in our allowance for doubtful accounts, our total current assets would decrease by $1.7 million, or 1.2%. There would also be a corresponding increase in operating expense.
Patient liability risks
Our professional liability and general liability reserve includes amounts for patient care related claims and incurred but not reported claims. Professional liability and general liability costs for healthcare services in many states continue to be expensive and difficult to estimate, although many states have implemented tort reform that has stabilized the costs. The amount of our reserves is determined based on an estimation process that uses information obtained from both company-specific and industry data. The estimation process requires us to continuously monitor and evaluate the life cycle of the claims. Using data obtained from this monitoring and our assumptions about emerging trends, we, along with an independent actuary, develop information about the size of ultimate claims based on our historical experience and other available industry information. The most significant assumptions used in the estimation process include determining the trend in costs, the expected number and cost of claims incurred but not reported and the expected costs to settle unpaid claims. Although we believe that our reserves are adequate, it is possible that this liability will require a material adjustment in the future. For example, an adverse professional liability judgment partially contributed to our predecessor's bankruptcy filing under Chapter 11 of the United States Bankruptcy Code in October 2001. If, at December 31, 2014, we were to recognize an increase of 10% in the reserve for professional liability and general liability, our total liabilities would be increased by $2.2 million, or 0.4%. There would also be a corresponding increase in operating expense. We record our professional and general liability reserves on an undiscounted basis.
Impairment of long-lived assets
We periodically evaluate the carrying value of our long-lived assets other than goodwill, primarily consisting of our investments in real estate, for impairment indicators. If indicators of impairment are present, we evaluate the carrying value of the related real estate investments in relation to the future undiscounted cash flows of the underlying operations to assess recoverability of the assets. Measurement of the amount of the impairment, if any, may be based on independent appraisals, established market values of comparable assets or estimates of future cash flows expected. The estimates of these future cash flows are based on assumptions and projections believed by management to be reasonable and supportable. They require management's subjective judgments and take into account assumptions about revenue and expense growth rates. These assumptions may vary by type of long-lived asset.
Goodwill and Other Long-Lived Assets
Goodwill is accounted for under the Financial Accounting Standards Board (“FASB”) Accounting Standards Codification (“ASC”) Topic 805, Business Combinations, and represents the excess of the purchase price over the fair value of identifiable net assets acquired in business combinations accounted for as purchases. In accordance with FASB ASC Topic 350, Intangibles - Goodwill and Other, goodwill is subject to periodic testing for impairment. Goodwill of a reporting unit is tested for impairment on an annual basis, or, if an event occurs or circumstances change that would reduce the fair value of a reporting unit below its carrying amount, between annual testing. We have selected October 1 as the date to test goodwill for impairment on an annual basis.
Goodwill Impairment Testing
We compare the fair value of each reporting unit to its carrying amount on an annual basis to determine whether there is potential goodwill impairment. If the fair value of the reporting unit is less than its carrying value, an impairment loss is recorded to the extent the fair value of goodwill is less than its carrying value.
As of December 31, 2014, there was no goodwill related to the long-term care reporting unit, $9.7 million related to the rehabilitation therapy reporting unit, $53.6 million related to the hospice reporting unit, and $5.5 million related to the home health reporting unit.
49
As of October 1, 2014, we compared the fair value of each reporting unit to its carrying value. We concluded that the fair values of the therapy, hospice, and the home health reporting units exceeded their carrying values. We have no goodwill at our long-term care reporting unit.
We assessed the fair value of the therapy, hospice, and home health services reporting units for goodwill impairment based upon a combination of a discounted cash flow (income approach) and a public company method (market approach). The income and market approaches were given equal weighting.
The discounted cash flow and market approach methodologies utilized in estimating the fair value of our reporting units for purposes of goodwill impairment testing requires various judgmental assumptions about revenues, EBITDA and operating margins, growth rates, and working capital requirements. In determining those judgmental assumptions, we make a number of judgments regarding a variety of data, including-for each reporting unit, the annual budget for the upcoming year when available, the longer-term business plan, economic projections, anticipated future cash flows, market data, and historical cash flow growth rates.
Therapy Unit Testing
Below are the key assumptions used to estimate the fair value for our therapy reporting unit at the time of our October 1, 2014 goodwill impairment test using the income approach:
• 2.0% long-term growth rate; and
• 11.5% discount rate
Our therapy services reporting unit experienced an average annual compounded growth rate in external revenue from 2007 to 2013 of 4.4%. We selected a long term growth rate of 2.0% for the discounted cash flow analysis conducted as part of the impairment analysis as the 2.0% long-term growth rate is our expected long−term growth rate from a combination of growth in external contracts, rate increases as well as occupancy and skilled mix increases at our third party customers, as well as the reimbursement changes discussed in Part I - Item 1 - Business - Industry Trends earlier in the document. This growth rate was also assumed to be 2.0% in the prior year analysis.
The operating expenses projected under the discounted cash flow method were based upon our historical expenses as a percentage of therapy revenue adjusted for known efficiencies or additional costs to be incurred. Capital expenditures in the therapy services reporting unit have historically been negligible.
The discount rate used to present value cash flows under the discounted cash flow method is a significant assumption in the analysis. The discount rate was developed using the capital asset pricing model through which a weighted average cost of capital was derived. The cost of equity was assumed to be 14.3% and the pre-tax cost of debt was assumed to be 4.7%, or about 2.8% after tax. Assuming a capital structure of 25% debt and 75% equity, the average cost of capital was determined to be 11.5%, which was used as the discount rate. A 0.5% decrease in the discount rate would increase the equity value of the therapy reporting unit by approximately $4.2 million, or 7%, using the income approach. A 0.5% increase in the discount rate would decrease the equity value of the therapy reporting unit by approximately $3.8 million, or 6%, using the income approach. Increasing the long-term revenue growth rate by 0.5% would increase the equity value by approximately $3.0 million, or 5%, using the income approach. Decreasing the long-term revenue growth rate by 0.5% would decrease the equity value by approximately $2.8 million, or 5%, using the income approach.
For the market approach, we compared ourselves to a peer group of other public companies. The metric used was business enterprise value, or BEV, divided by EBITDA. The average BEV divided by projected 2014 EBITDA for the peer group, including us, assuming a control premium of 30% was 10.8 with a minimum of 10.0. For our market valuation a multiple of 11.0 was selected due to the relative size of our operations, based upon historical transactions.
As the result of this evaluation indicated that the reporting unit's fair value of equity exceeded the carrying value of equity by $13.2 million, it was determined that there was no impairment to the therapy services reporting unit.
Hospice Unit Testing
Below are the key assumptions used to estimate the fair value for our hospice reporting unit at the time of our October 1, 2014 goodwill impairment test using the income approach:
• 2.0% long-term growth rate; and
• a 11.5% discount rate
Although there was an 18.8% decline in external revenue in the most recent year, our average annual compounded growth rate in external revenue from 2010 to 2013 was 20.1%, we concluded a 2.0% long term growth rate was appropriate for the discounted cash flow analysis conducted as part of the impairment analysis as the 2.0% long-term growth rate is our expected long-term growth rate from a combination of growth in rate increases as well as census increases. This growth rate was also assumed to be 2.0% in the prior year analysis.
50
The operating expenses projected under the discounted cash flow method were based upon our historical expenses as a percentage of hospice revenue adjusted for known efficiencies or additional costs to be incurred. Capital expenditures in the hospice services reporting unit have historically been negligible.
The discount rate used to calculate the present value of cash flows under the discounted cash flow method is a significant assumption in the analysis. The discount rate was developed using the capital asset pricing model through which a weighted average cost of capital was derived. The cost of equity was assumed to be 14.7% and the pre-tax cost of debt was assumed to be 4.7%, or about 2.8% after tax. Assuming a capital structure of 25% debt and 75% equity, the average cost of capital was determined to be 11.5%, which was used as the discount rate. A 0.5% decrease in the discount rate would increase the equity value of the hospice reporting unit by approximately $3.1 million, or 29%, using the income approach. A 0.5% increase in the discount rate would decrease the equity value of the hospice reporting unit by approximately $2.7 million, or 25%, using the income approach. Increasing the long-term revenue growth rate by 0.5% would increase the equity value by approximately $2.3 million, or 21%, using the income approach. Decreasing the long-term revenue growth rate by 0.5% would decrease the equity value by approximately $2.0 million, or 19%, using the income approach.
For the market approach, we compared ourselves to a peer group of other public companies. The metric used was business enterprise value, or BEV, divided by EBITDA. The average BEV divided by projected 2014 EBITDA for the peer group, including us, assuming a control premium of 30% was 12.4 with a minimum of 10.0. For our market valuation a multiple of 14.5 was selected due to the relative size of our operations, based upon historical transactions.
As the result of this evaluation indicated that the reporting unit's fair value of equity exceeded the carrying value of equity by $1.3 million, it was determined that there was no impairment to the hospice reporting unit.
Home Health Unit Testing
Below are the key assumptions used to estimate the fair value for our home health care reporting unit at the time of our October 1, 2014 goodwill impairment test using the income approach:
• | 2.0% long-term revenue growth rate beginning in 2017; and |
• | 11.0% discount rate |
Our home health care reporting unit experienced an average annual compounded growth rate in external revenue from 2010 to 2013 of 38.0%. However, we selected a long-term growth rate of 2.0% for the discounted cash flow analysis conducted as part of the impairment analysis because the historical growth rate includes acquisitions. The 2.0% long-term growth rate is our expected long-term growth rate from a combination of reimbursement rate changes and increases in episodic treatments.
The operating expenses projected under the discounted cash flow method were based upon our historical expenses as a percentage of home health care revenue adjusted for known efficiencies or additional costs to be incurred.
The discount rate used to calculate the present value of cash flows under the discounted cash flow method is a significant assumption in the analysis. The discount rate was developed using the capital asset pricing model through which a weighted average cost of capital was derived. The cost of equity was assumed to be 13.6% and the pre-tax cost of debt was assumed to be 4.7% or about 2.8% after tax. Assuming a capital structure of 25% debt and 75% equity, the average cost of capital was determined to be 11.0%, which was used as the discount rate. A 0.5% increase in the discount rate would decrease the equity value of the home health reporting unit by approximately $0.5 million, or 6%, using the income approach.
Increasing the long-term revenue growth rate by 0.5% increases the equity value by approximately $0.3 million, or 3%, using the income approach.
For the market approach, we compared ourselves to a peer group of other public companies. The metric used was business enterprise value, or BEV, divided by EBITDA. The average BEV divided by projected 2014 EBITDA for the peer group, including us, assuming a control premium of 30% was 13.3 with a minimum of 10.0. For our market valuation a multiple of 10.0 was selected due to the relative size of our operations, based upon historical transactions.
As the result of this evaluation indicated that the reporting unit's fair value of equity exceeded the carrying value of equity by $6.9 million it was determined that there was no impairment to the home health reporting unit.
Our goodwill impairment analysis is subject to uncertainties due to uncontrollable events, including any strategic decisions made in response to economic or competitive conditions, the general economic environment, and material changes in Medicare and Medicaid reimbursement that could positively or negatively impact anticipated future operating conditions and cash flows. In addition, our goodwill impairment analysis is subject to current economic uncertainties.
As of December 31, 2014, there was no goodwill related to the long-term care reporting unit, $9.7 million related to the rehabilitation therapy reporting unit, $53.6 million related to the hospice reporting unit, and $5.5 million related to the home health reporting unit.
Income Taxes
51
Income taxes are accounted for under FASB ASC Topic 740, "Income Taxes." FASB ASC Topic 740 prescribes a recognition threshold and measurement criteria for the financial statement recognition and measurement of a tax position taken or expected to be taken in a tax return. FASB ASC Topic 740 also provides guidance on de-recognition, classification, interest and penalties, accounting in interim periods, disclosure and transition rules. As of December 31, 2014 and 2013, our accrual for unrecognized tax benefits including applicable interest and penalties was negligible. As prescribed by FASB ASC Topic 740, only the amounts reasonably expected to be paid within 12 months are recorded in taxes payable, while remaining amounts after 12 months are recorded in other non-current taxes payable.
Significant judgment is required in determining our provision for income taxes. In the ordinary course of business, there are many transactions for which the ultimate tax outcome is uncertain. While we believe that our tax return positions are supportable, there are certain positions that may not be sustained upon review by tax authorities. Although we believe that adequate accruals have been made for such positions, the final resolution of those matters may differ materially from the amounts provided for in our historical income tax provisions and accruals.
We are subject to taxation in the United States and in various state jurisdictions. Our tax years 2011 and forward are subject to examination by the United States Internal Revenue Service. Our tax years 2010 and forward are subject to examination by our material state jurisdictions. The Internal Revenue Service is examining our 2012 tax year and we do not anticipate any material changes to our tax return as filed
We use the liability method of accounting for income taxes as set forth in FASB ASC Topic 740. We determine deferred tax assets and liabilities at the balance sheet date based upon the difference between the financial statement and tax bases of assets and liabilities using enacted tax rates in effect for the year in which the differences are expected to affect taxable income.
Our temporary differences are primarily attributable to purchase adjustments related to intangible assets, depreciation, allowances for doubtful accounts, and accruals for professional and general liability expenses and workers' compensation, which are not deductible for tax purposes until paid.
We assess the likelihood that our deferred tax assets will be recovered from future taxable income and available carryback potential and unless we believe that recovery is more likely than not, we establish a valuation allowance to reduce the deferred tax assets to the amounts expected to be realized. We make our judgments regarding deferred tax assets and the associated valuation allowance, based on among other things, expected future reversals of taxable temporary differences, available carryback potential, tax planning strategies and forecasts of future income, but not based on the anticipated impact of the Combination. We periodically review for the requirement of a valuation allowance as necessary. Further, as the deferred tax assets are expected to reverse in subsequent years, any deferred tax asset could be partially utilized to carry back against prior year income or to offset future taxable income caused by expected reversals of deferred tax liabilities. This significant positive evidence overcomes the presumption of a need for a valuation allowance. At December 31, 2014, we retained a valuation allowance for our state loss and credit carryforwards of $3.2 million as a result of certain restrictions regarding their utilization.
Accounting for Conditional Asset Retirement Obligations
In accordance with FASB ASC Topic 410, "Asset Retirement and Environmental Obligations," we recorded a liability of $5.0 million effective December 31, 2005, substantially all of which related to estimated costs to remove asbestos that is contained within our facilities. Of this $5.0 million liability, $1.6 million was recorded as a cumulative effect of a change in accounting principle, net of tax benefit for the year ended December 31, 2005.
We have determined that a conditional asset retirement obligation exists for asbestos remediation. Though not a current health hazard in our facilities, upon renovation, we may be required to take the appropriate remediation procedures in compliance with state law to remove the asbestos. The removal of asbestos-containing materials includes primarily floor and ceiling tiles from our pre-1980 constructed facilities. We determined the fair value of the conditional asset retirement obligation as the present value of the estimated future cost of remediation based on an estimated expected date of remediation. This computation is based on a number of assumptions which may change in the future based on the availability of new information, technology changes, changes in costs of remediation, and other factors.
The determination of the asset retirement obligation is based upon a number of assumptions that incorporate our knowledge of the facilities, the asset life of the floor and ceiling tiles, the estimated time frames for periodic renovations which would involve floor and ceiling tiles, the current cost for remediation of asbestos and the current technology at hand to accomplish the remediation work. These assumptions to determine the asset retirement obligation may be imprecise or be subject to changes in the future. Any change in the assumptions can impact the value of the determined liability and impact our future earnings. If we were to experience a 10% increase in our estimated future cost of remediation, our recorded liability of $4.4 million would increase by $0.4 million and operating expenses would also increase.
Operating Leases
52
The information required by this item is incorporated herein by reference to Note 3, "Summary of Significant Accounting Policies," to the consolidated financial statements included elsewhere in this report.
Recent Accounting Standards
The information required by this item is incorporated herein by reference to Note 3, "Summary of Significant Accounting Policies," to the consolidated financial statements included elsewhere in this report.
Results of Operations
The following table sets forth details of our revenue, expenses and (loss) earnings as a percentage of total revenue for the periods indicated:
Year Ended December 31, | ||||||||
2014 | 2013 | 2012 | ||||||
Revenue | 100.0 | % | 100.0 | % | 100.0 | % | ||
Expenses: | ||||||||
Cost of services (exclusive of rent cost of revenue and depreciation and amortization shown below) | 85.8 | 86.9 | 83.5 | |||||
Rent cost of revenue | 2.4 | 2.2 | 2.1 | |||||
General and administrative | 4.8 | 3.2 | 2.8 | |||||
Litigation settlement costs, (net of recoveries) | — | — | — | |||||
Depreciation and amortization | 2.9 | 2.8 | 2.8 | |||||
Governmental investigation expense | 0.7 | — | — | |||||
Change in fair value of contingent consideration | (0.1 | ) | (0.4 | ) | 0.1 | |||
Goodwill impairment charge | — | 2.3 | — | |||||
Loss on disposal of assets | — | — | — | |||||
96.6 | 97.0 | 91.3 | ||||||
Other (expenses) income: | ||||||||
Interest expense | (3.8 | ) | (4.1 | ) | (4.4 | ) | ||
Interest income | 0.1 | — | 0.1 | |||||
Equity in earnings of joint venture | 0.2 | 0.3 | 0.2 | |||||
Other (expense) income | — | — | — | |||||
Debt modification/retirement costs | (0.1 | ) | (0.3 | ) | (0.5 | ) | ||
Total other (expenses) income, net | (3.6 | ) | (4.1 | ) | (4.6 | ) | ||
(Loss) income from continuing operations, before (benefit) provision for income taxes | (0.3 | ) | (1.1 | ) | 4.1 | |||
(Benefit) provision for income taxes | (0.1 | ) | (0.4 | ) | 1.5 | |||
(Loss) income from continuing operations | (0.1 | ) | (0.7 | ) | 2.6 | |||
(Loss) from discontinued operations, net of tax | — | (0.5 | ) | (0.1 | ) | |||
Net (loss) income | (0.1 | )% | (1.2 | )% | 2.5 | % | ||
EBITDA(1) | 6.4 | % | 5.3 | % | 11.1 | % | ||
Adjusted EBITDA(1) | 9.5 | % | 8.6 | % | 11.8 | % | ||
EBITDAR(2) | 8.8 | % | 7.5 | % | 13.2 | % | ||
Adjusted EBITDAR(2) | 11.9 | % | 10.8 | % | 13.9 | % | ||
________________
(1) | See footnote 1 to Item 6 of this report, "Selected Financial Data" for a calculation of EBITDA and Adjusted EBITDA and for a description of our uses of, and the limitations associated with, EBITDA and Adjusted EBITDA, as well as an accompanying reconciliation of EBITDA and Adjusted EBITDA to net (loss) income. |
(2) | See footnote 2 to Item 6 of this report, "Selected Financial Data" for a calculation of EBITDAR and Adjusted EBITDAR and for a description of our uses of, and the limitations associated with, EBITDAR and Adjusted EBITDAR, as well as an accompanying reconciliation of EBITDA and Adjusted EBITDA to net (loss) income. |
53
Year Ended December 31, 2014 Compared to Year Ended December 31, 2013
Revenue. Revenue decreased $9.0 million, or 1.1%, to $833.3 million in 2014 from $842.3 million in 2013.
Long Term Care Service
Year Ended December 31, | ||||||||||||||||||||
2014 | 2013 | Increase/(Decrease) | ||||||||||||||||||
Revenue Dollars | Revenue Percentage | Revenue Dollars | Revenue Percentage | Dollars | Percentage | |||||||||||||||
(dollars in millions) | ||||||||||||||||||||
Skilled nursing facilities | $ | 626.2 | 75.2 | % | $ | 609.2 | 72.3 | % | $ | 17.0 | 2.8 | % | ||||||||
Assisted living facilities | 30.6 | 3.7 | 28.4 | 3.4 | 2.2 | 7.7 | ||||||||||||||
Administration of third party facilities | 0.7 | 0.1 | 0.6 | 0.1 | 0.1 | 16.7 | ||||||||||||||
Leased facility revenue | 3.2 | 0.3 | 3.1 | 0.3 | 0.1 | 3.2 | ||||||||||||||
Total long-term care services | $ | 660.7 | 79.3 | % | $ | 641.3 | 76.1 | % | $ | 19.4 | 3.0 | % | ||||||||
The $17.0 million increase in Skilled nursing facilities revenue in 2014 as compared to 2013 was primarily driven by increases in revenue per patient day "PPD" across all payors as well as improvements in Medicaid and Managed Care average daily census "ADC". The overall increase in PPD rates resulted in an improvement in revenue of $2.9 million and $1.3 million, from Medicare and Private & Other payors, respectively, in 2014 as compared to 2013. Also contributing to the increase in revenue for 2014 as compared to 2013 was an increase in both PPD and ADC for both Medicaid and Managed Care representing $16.9 million and $9.4 million, respectively. $2.0 million in additional revenue for the year was provided by the Company's newly developed leased facility in Kansas City, added during the second quarter 2014. A major contributing factor to the increase in revenue for 2014 as compared to 2013 was the result of our participation in the recently enacted UPL supplemental payment program in the state of Texas that provides supplemental Medicaid payments with federal matching funds for skilled nursing facilities that are affiliated with county owned hospital districts. Presently twenty of our twenty-one Texas facilities are participating in the program. For 2014, the UPL program provided $7.3 million of the $16.9 million total increase in Medicaid revenue as compared to 2013. The improvement in revenue was offset by a decrease in Medicare and Private & Other ADC of $10.7 million and $4.8 million, respectively. The majority of the decreased volume was in Medicare days, which was partially offset by an increase in Managed Medicare (Medicare Advantage) as more seniors elect Medicare Advantage. Our average revenue per patient day improved from $240.6 to $244.4 during 2014.
The increase of $2.2 million at our assisted living facilities in the year ended December 31, 2014 as compared to the year ended December 31, 2013 was due to an increase in the private PPD rate of 3.4% from $95.94 to $98.98 as well as a 4.4% increase in days.
The increase of $0.1 million in the administration of third party facilities revenue is due to improvement in the performance of the third party facilities.
Therapy Services
Year Ended December 31, | ||||||||||||||||||||
2014 | 2013 | Increase/(Decrease) | ||||||||||||||||||
Revenue Dollars | Revenue Percentage | Revenue Dollars | Revenue Percentage | Dollars | Percentage | |||||||||||||||
(dollars in millions) | ||||||||||||||||||||
Rehabilitation therapy services | $ | 146.2 | 17.5 | % | $ | 159.1 | 18.9 | % | $ | (12.9 | ) | (8.1 | )% | |||||||
Intersegment eliminations of services related to affiliated entities | (56.3 | ) | (6.8 | ) | (57.0 | ) | (6.8 | ) | 0.7 | (1.2 | ) | |||||||||
Total therapy services | $ | 89.9 | 10.8 | % | $ | 102.2 | 12.1 | % | $ | (12.3 | ) | (12.0 | )% | |||||||
Third party rehabilitation therapy services revenue decreased $12.9 million in 2014 as compared to 2013. Revenue decreased $15.1 million for same store facilities serviced for all of 2014 as compared to 2013. This decrease in revenue from same stores was partially offset by an increase of $2.2 million in revenue from new stores added during 2014.
54
Hospice and Home Health Services
Year Ended December 31, | ||||||||||||||||||||
2014 | 2013 | Increase/(Decrease) | ||||||||||||||||||
Revenue Dollars | Revenue Percentage | Revenue Dollars | Revenue Percentage | Dollars | Percentage | |||||||||||||||
(dollars in millions) | ||||||||||||||||||||
Hospice | $ | 57.9 | 6.9 | % | $ | 71.3 | 8.5 | % | $ | (13.4 | ) | (18.9 | )% | |||||||
Home Health | 24.7 | 3.0 | 27.6 | 3.3 | (2.9 | ) | (10.5 | ) | ||||||||||||
Total hospice & home health services | $ | 82.6 | 9.9 | % | $ | 98.8 | 11.8 | % | $ | (16.2 | ) | (16.4 | )% | |||||||
The $13.4 million decrease in hospice revenue for 2014 as compared to 2013 was due to a reduction in ADC leading to a decrease in revenue of $15.3 million. The decrease in revenue was partially offset by a 2.7% increase in our average PPD rate resulting in an increase in revenue of $1.9 million for 2014 as compared to 2013. Revenue for 2014 and 2013 was net of $2.7 million and $5.6 million of hospice cap reserves, respectively. Of the $2.7 million hospice cap reserves recorded in 2014, $2.4 million was related to the 2014 cap year and $0.3 million was related to the 2013 cap year. Of the $5.6 million in cap adjustment recorded in 2013, $2.5 million was related to the 2013 cap year, $2.9 million was related to the 2012 cap year and $0.2 million was related to the 2011 cap year. The hospice cap reserves recorded for 2014 were the result of a combination of continued long stay patients and a decline in admissions.
The $2.9 million decrease in our home health revenue in 2014 as compared to 2013 was the result of a volume decrease of $1.1 million coupled with a rate per episode decrease of $1.0 million. The remaining $0.8 million decrease in home health revenue was related to non profitable facilities disposed of in Q4 2013. For the year ended 2014, we experienced a decrease in episodic admissions of 5.9%.
Cost of Services Expenses
Our cost of services expenses decreased by $17.0 million, or 2.3%, to $714.9 million, or 85.8% of revenue, in 2014, from $731.9 million, or 86.9% of revenue, in 2013. The decrease in cost of services as a percentage of revenue is primarily due to the impact of the decrease in hospice average daily census in 2014 as compared to 2013.
Long Term Care Services
Year Ended December 31, | ||||||||||||||||||||
2014 | 2013 | Increase/(Decrease) | ||||||||||||||||||
Cost of Service Dollars (prior to intersegment eliminations) | Revenue Percentage | Cost of Service Dollars (prior to intersegment eliminations) | Revenue Percentage | Dollars | Percentage | |||||||||||||||
(dollars in millions) | ||||||||||||||||||||
Skilled nursing facilities | $ | 525.0 | 83.8 | % | $ | 513.2 | 84.2 | % | $ | 11.8 | 2.3 | % | ||||||||
Assisted living facilities | 21.5 | 70.3 | 20.6 | 72.5 | 0.9 | 4.4 | ||||||||||||||
Operations support | 19.6 | n/a | 19.9 | n/a | (0.3 | ) | (1.5 | ) | ||||||||||||
Total long-term care services | $ | 566.1 | 85.7 | % | $ | 553.7 | 86.3 | % | $ | 12.4 | 2.2 | % | ||||||||
Cost of services at our skilled nursing facilities increased by $11.8 million in 2014 as compared to 2013. The $11.8 million increase was primarily the result of an increase of $6.0 million in salaries and wages, incremental bad debt expense of $1.6 million, increase in purchased services costs of $2.4 million, $1.5 million increase in rehab/ancillaries expense, and $2.6 million increase comprised of supplies, food, utilities, and other operating expense. We incurred an additional $2.0 million in costs of services associated with our Kansas City facility, which became operational during 2014. These increased expenses were partially offset by a decrease of $2.2 million in employee benefit costs, primarily due to lower than expected self-insured medical utilization, $1.8 million reduction to professional and general liability insurance expense, and $0.3 million reduction due to a decrease in taxes and license expense. Bad debt expense increased $1.6 million in 2014 as compared to the prior year period due to poor collection. Self insured general and professional liability expense decreased $1.8 million in 2014 as compared to 2013 due to a change in projected ultimate losses primarily as a result of a decrease in claim count from prior years and a increase in claims recoveries.
Cost of services expenses at our assisted living facilities increased $0.9 million in 2014 as compared to 2013. The increase was attributable to a $0.6 million increase in labor costs. In addition, there was a $0.2 million increase in purchased services expense, $0.2 million increase in utilities expense, and $0.2 million increase food and supplies in 2014 as compared to
55
2013. These increases were offset by a $0.2 million decrease in insurance, and $0.1 million decrease in taxes, licenses, and other expense.
Cost of services at our regional operations support decreased by $0.3 million in 2014 as compared to 2013. The primary reason for the decrease was that there was a reduction of overhead positions.
Therapy Services
Year Ended December 31, | ||||||||||||||||||||||||||||
2014 | 2013 | Increase/(Decrease) | ||||||||||||||||||||||||||
Revenue Dollars (prior to intersegment eliminations) | Cost of Service Dollars (prior to intersegment eliminations) | Revenue Percentage | Revenue Dollars (prior to intersegment eliminations) | Cost of Service Dollars (prior to intersegment eliminations) | Revenue Percentage | Dollars | Percentage | |||||||||||||||||||||
(dollars in millions) | ||||||||||||||||||||||||||||
Rehabilitation therapy services | $ | 146.2 | $ | 132.2 | 90.4 | % | $ | 159.1 | $ | 148.2 | 93.1 | % | $ | (16.0 | ) | (10.8 | )% | |||||||||||
Total therapy services | $ | 146.2 | $ | 132.2 | 90.4 | % | $ | 159.1 | $ | 148.2 | 93.1 | % | $ | (16.0 | ) | (10.8 | )% | |||||||||||
Rehabilitation therapy costs as a percentage of revenue decreased by 10.8% or $16.0 million commensurate with the revenue reduction and improved efficiencies in labor management, decreased utilization of contract labor, and a decrease in employee benefit costs, primarily due to lower than expected self-insured medical utilization.
Hospice and Home Health Services
Year Ended December 31, | ||||||||||||||||||||
2014 | 2013 | Increase/(Decrease) | ||||||||||||||||||
Cost of Service Dollars | Revenue Percentage | Cost of Service Dollars | Revenue Percentage | Dollars | Percentage | |||||||||||||||
(dollars in millions) | ||||||||||||||||||||
Hospice | $ | 52.5 | 90.7 | % | $ | 63.2 | 88.6 | % | $ | (10.7 | ) | (16.9 | )% | |||||||
Home Health | 22.5 | 91.1 | 26.3 | 95.3 | (3.8 | ) | (14.4 | ) | ||||||||||||
Total hospice & home health services | $ | 75.0 | 90.8 | % | $ | 89.5 | 90.6 | % | $ | (14.5 | ) | (16.2 | )% | |||||||
Cost of services expenses related to our hospice business decreased $10.7 million in 2014 as compared to 2013, commensurate with the revenue reduction. PPD costs increased 4.8%, from $137.27 to $143.90, reflecting the time necessary for the Company to align labor costs to the decline in census.
Cost of services related to our home health business decreased $3.8 million in 2014 as compared to 2013. The decrease was primarily due to a decrease of $3.3 million in salaries, wages, and benefits commensurate with the revenue reduction. Other operating expenses decreased $0.3 million, supplies decreased $0.1 million, and remaining cost of services expenses decreased by $0.1 million during 2014 as compared to 2013.
Rent Cost of Revenue. Rent cost of revenue increased by $1.2 million, or 6.2%, to $20.0 million, or 2.4% of revenue, in 2014 from $18.8 million, or 2.2% of revenue, in 2013. The increase was primarily due to a new lease that went into effect in the second quarter of 2014 at the Kansas City Transitional Care Center.
General and Administrative Services Expenses. Our general and administrative services expenses increased by $13.4 million, or 50.2%, to $40.0 million, or 4.8% of revenue, in 2014 from $26.6 million, or 3.2% of revenue, in 2013. After adjusting for the effect of one-time restructuring charge of $2.3 million for 2013, $0.3 million in combination related expense in 2013, $1.6 million in one-time restructuring charges and $13.7 million in combination related expense in 2014, general and administrative expense increased $0.7 million. The increase was primarily due to an increase in stock compensation of $1.5 million offset by $0.7 million reduction due to headcount reductions during 2014.
Depreciation and Amortization. Depreciation and amortization increased by $0.6 million, or 2.3% to 24.3 million from $23.8 million in 2014 as compared to 2013.
Change in fair value of contingent consideration. The change in fair value of contingent consideration decreased by $3.1 million to a benefit of $0.6 million in 2014, from a benefit of $3.7 million, or 0.4% of revenue, in 2013. The decrease is related to a $0.1 million change in fair value of the contingent consideration related to the Cornerstone acquisition due to reductions in
56
forecasted EBITDA, which reduces the likelihood of the businesses achieving their EBITDA target necessary for the earn-out to be paid in future periods along with an $0.5 million value adjustment related to Cornerstone not achieving their 2014 earn out.
Interest Expense. Interest expense decreased by $2.3 million, or 6.7%, to $32.0 million in 2014 from $34.3 million in 2013. The decrease is related to the decrease in average debt outstanding from $419.1 million in 2013 to $410.8 million in 2014. Also our average interest rate decreased from 6.62% in 2013 to 6.29% in 2014.
Interest Income. Interest income increased by $0.4 million to $0.7 million in 2014 from $0.3 million in 2013 due to an increase in average outstanding notes receivable.
Equity in Earnings of Joint Venture. Equity earnings of our joint venture decreased by $0.5 million to $1.4 million in 2014 from $1.9 million, or 0.3% of revenue, in 2013. The decrease was related to a decrease in the joint ventures' performance in 2014.
Debt Modification/Retirement Cost. The debt modification/retirement costs decreased by $2.0 million to $0.8 million or 0.1% of revenue, in 2014 from $2.8 million or 0.3% of revenue in 2013. The $0.8 million in expenses recorded in 2014 as debt modification was related to the June 2014 credit facility amendment. Of the $2.8 million of debt modification costs in 2013, $1.1 million related to the June 2013 credit facility amendment. The remaining $1.7 million was related to deferred financing fees expensed on the extinguishment of term debt that was refinanced with HUD insured loans as well as the term debt that was refinanced with MidCap Financial.
(Loss) / Income from Continuing Operations Before Benefit for Income Taxes. (Loss) income from continuing operations before benefit from incomes taxes decreased by $6.9 million to a loss of $2.2 million in 2014 from a loss of $9.1 million in 2013 primarily as a result of the 2013 goodwill impairment, divestment of not profitable facilities during 2013, our enrollment in the Texas UPL program in 2014, overall increases in census days and revenue PPD discussed above, and expense savings from cost-cutting initiatives.
Benefit for Income Taxes. We recorded a tax benefit of $1.2 million, or 65.0% of pre-tax loss, for 2014, as compared to a benefit of $2.9 million, or 32.0% of pre-tax earnings, for 2013. The lower tax benefit for 2014 was due primarily to higher pre-tax income and the increase in Work Opportunity Tax Credits.
Year Ended December 31, 2013 Compared to Year Ended December 31, 2012
Revenue. Revenue increased $15.6 million, or 1.8%, to $842.3 million in 2013 from $857.9 million in 2012.
Long Term Care Service
Year Ended December 31, | ||||||||||||||||||||
2013 | 2012 | Increase/(Decrease) | ||||||||||||||||||
Revenue Dollars | Revenue Percentage | Revenue Dollars | Revenue Percentage | Dollars | Percentage | |||||||||||||||
(dollars in millions) | ||||||||||||||||||||
Skilled nursing facilities | $ | 609.2 | 72.3 | % | $ | 614.9 | 71.7 | % | $ | (5.7 | ) | (0.9 | )% | |||||||
Assisted living facilities | 28.4 | 3.4 | 28.0 | 3.3 | 0.4 | 1.4 | ||||||||||||||
Administration of third party facilities | 0.6 | 0.1 | 0.8 | 0.1 | (0.2 | ) | (25.0 | ) | ||||||||||||
Leased facility revenue | 3.1 | 0.3 | % | 3.1 | 0.3 | — | n/a | |||||||||||||
Total long-term care services | $ | 641.3 | 76.1 | % | $ | 646.8 | 75.4 | % | $ | (5.5 | ) | (0.9 | )% | |||||||
Skilled nursing facilities revenue decreased by $5.7 million in 2013 as compared to 2012. Revenue decreased by $5.9 million for skilled nursing facilities operated for all of 2012 and 2013. The decrease of $7.7 million was partially due to one less day in 2013 as compared to 2012 and a decrease in patient days, offset in part by increased revenue of $1.8 million due to an overall increase in rates. The majority of the decreased volume was in Medicare days, which was partially offset by an increase in Managed Medicare (Medicare Advantage) as more seniors elect Medicare Advantage. We also experienced a decrease in Medicaid days. In addition to the foregoing, a significant contributing factor to the decrease in overall census and the revenue decline stemmed from one facility in New Mexico that experienced a significant Medicare and Medicaid census decline in 2013 as compared to the prior year period. Finally, we disposed of two skilled nursing facilities in 2013. The combined revenue for these two facilities was $13.7 million in 2013 as compared to $14.7 million in 2012.
The increase of $0.4 million at our assisted living facilities in the year ended December 31, 2013 as compared to the year ended December 31, 2012 was due to an increase in the private PPD rate of 1.3% from $94.74 to $95.94.
The decrease of $0.2 million in the administration of third party facilities revenue is due to a reduction in the performance of the third party facilities.
57
Therapy Services
Year Ended December 31, | ||||||||||||||||||||
2013 | 2012 | Increase/(Decrease) | ||||||||||||||||||
Revenue Dollars | Revenue Percentage | Revenue Dollars | Revenue Percentage | Dollars | Percentage | |||||||||||||||
(dollars in millions) | ||||||||||||||||||||
Rehabilitation therapy services | $ | 159.1 | 18.9 | % | $ | 166.3 | 19.4 | % | $ | (7.2 | ) | (4.3 | )% | |||||||
Intersegment eliminations of services related to affiliated entities | (57.0 | ) | (6.8 | ) | (61.9 | ) | (7.2 | ) | 4.9 | (7.9 | ) | |||||||||
Total therapy services | $ | 102.2 | 12.1 | % | $ | 104.4 | 12.2 | % | $ | (2.2 | ) | (2.1 | )% | |||||||
Third party rehabilitation therapy services revenue decreased $2.2 million in 2013 compared to 2012. Revenue decreased $0.1 million for facilities serviced for all of 2013 and 2012. In addition, we had a decrease in revenue of $1.2 million in as a result of a net reduction of 21 third party service locations. This large reduction in our third party contracts was focused on the non-profitable contracts. The Medicare Part B Manual Medical Review process went into effect on October 1, 2012 and requires pre-payment review for all patients exceeding a $3,700 annual threshold. This has negatively impacted the therapy business and will continue to have a negative impact in 2014. The MPPR for outpatient therapy included in the American Taxpayer Relief Act of 2012 went into effect April 1, 2013 and has also had a negative impact of $0.9 million on our therapy business in 2013. For 2014, we expect this will be partially offset by Medicare Part B rate increases effective January 1, 2014.
Hospice and Home Health Services
Year Ended December 31, | ||||||||||||||||||||
2013 | 2012 | Increase/(Decrease) | ||||||||||||||||||
Revenue Dollars | Revenue Percentage | Revenue Dollars | Revenue Percentage | Dollars | Percentage | |||||||||||||||
(dollars in millions) | ||||||||||||||||||||
Hospice | $ | 71.3 | 8.5 | % | $ | 80.3 | 9.3 | % | $ | (9.0 | ) | (11.2 | )% | |||||||
Home Health | 27.6 | 3.3 | 26.4 | 3.1 | 1.2 | 4.5 | ||||||||||||||
Total hospice & home health services | $ | 98.8 | 11.8 | % | $ | 106.7 | 12.4 | % | $ | (7.9 | ) | (7.4 | )% | |||||||
The $9.0 million decrease in hospice revenue for 2013 as compared to 2012 was due to a decrease in average daily census ("ADC") of 212 patients, leading to a decrease in revenue of $7.9 million, and a $1.1 million average rate decrease, which was mostly the result of larger hospice cap reserves recorded in 2013 as compared to 2012. For 2013 and 2012, we recorded hospice Medicare cap adjustments of $5.6 million and $4.1 million, respectively, as adjustments to revenue, which negatively affected the weighted average PPD rates for both periods and accounted for the remaining decrease in revenue. Of the $5.6 million hospice cap reserves recorded in 2013, $2.5 million was related to the 2013 cap year, $2.9 million was related to the 2012 cap year and $0.2 million was related to the 2011 cap year. Of the $4.1 million in cap adjustment recorded in 2012, $2.3 million was related to the 2012 cap year and $1.8 million was related to the 2011 cap year.
Of the $1.2 million increase in our home health revenue in 2013 as compared to 2012, $0.5 million was from home health agencies operated for all of both periods, and $0.7 million resulted from an increase in episodes offset by a $0.2 million decrease in rate per episode. The remaining $0.7 million increase in home health revenue was due to acquisitions.
58
Cost of Services Expenses.
Our cost of services expenses increased by $34.0 million , or 5.0% , to $716.5 million , or 83.5% of revenue, in 2013 , from $682.5 million , or 80.1% of revenue, in 2012 . The increase in cost of services as a percentage of revenue is primarily due to the impact of the Medicare rate cut and decrease in our skilled mix at our long-term care reporting unit as previously discussed.
Long Term Care Services
Year Ended December 31, | ||||||||||||||||||||
2013 | 2012 | Increase/(Decrease) | ||||||||||||||||||
Cost of Service Dollars (prior to intersegment eliminations) | Revenue Percentage | Cost of Service Dollars (prior to intersegment eliminations) | Revenue Percentage | Dollars | Percentage | |||||||||||||||
(dollars in millions) | ||||||||||||||||||||
Skilled nursing facilities | $ | 513.2 | 84.2 | % | $ | 497.8 | 81.0 | % | $ | 15.4 | 3.1 | % | ||||||||
Assisted living facilities | 20.6 | 72.5 | 19.7 | 70.4 | 0.9 | 4.6 | ||||||||||||||
Operations support | 19.9 | n/a | 21.5 | n/a | (1.6 | ) | (7.4 | ) | ||||||||||||
Total long-term care services | $ | 553.7 | 86.3 | % | $ | 539.0 | 83.3 | % | $ | 14.7 | 2.7 | % | ||||||||
Cost of services at our skilled nursing facilities increased by $15.4 million in 2013 compared to 2012. Of the $15.4 million, $7.5 million was related to an increase in self insured general and professional liability expense in 2013 as compared to 2012 due to a change in ultimate loss reserve primarily as a result of an increase in claim count from prior years and reduction in claims recoveries. There was a $5.3 million increase in labor and benefit costs for 2013 as compared to 2012. This was primarily due to increases in self insured medical of $1.5 million, increase in workers compensation expense of $3.6 million, increase in paid time off ("PTO") of $1.3 million, offset by $0.9 million decrease in salaries. Bad debt expense increased $5.6 million in 2013 as compared to the prior year period due to the payor mix shift and an increase in the aging of private co-pay receivables, as well as from the aging of Medicare Part B receivables related to the MMR’s. Taxes and licenses expense increased by $2.1 million in 2013 as compared to 2012 due to an increase in the California quality assurance ("QA") fees. These increases were offset by a decrease in rehab and ancillaries expense of $5.2 million due to the reduction in the number of Medicare Part B and Medicare Part A patients treated.
Therapy Services
Year Ended December 31, | ||||||||||||||||||||||||||||
2013 | 2012 | Increase/(Decrease) | ||||||||||||||||||||||||||
Revenue Dollars (prior to intersegment eliminations) | Cost of Service Dollars (prior to intersegment eliminations) | Revenue Percentage | Revenue Dollars (prior to intersegment eliminations) | Cost of Service Dollars (prior to intersegment eliminations) | Revenue Percentage | Dollars | Percentage | |||||||||||||||||||||
(dollars in millions) | ||||||||||||||||||||||||||||
Rehabilitation therapy services | $ | 159.1 | $ | 148.2 | 93.1 | % | $ | 166.3 | $ | 153.5 | 92.3 | % | $ | (5.3 | ) | (3.5 | )% | |||||||||||
Total therapy services | $ | 159.1 | $ | 148.2 | 93.1 | % | $ | 166.3 | $ | 153.5 | 92.3 | % | $ | (5.3 | ) | (3.5 | )% | |||||||||||
Cost of services expenses at our assisted living facilities increased $0.9 million of 2013 as compared to 2012 due to an increase of $1.1 million in our facilities that operated for the full twelve months in both periods attributable to an $0.7 million increase in labor costs resulting from increases in self insured medical and self insured workers compensation expense. In addition, there was a $0.1 million increase in professional liability reserves on existing claims in 2013 as compared to 2012, a $0.1 million increase in bad debt expense for 2013 as compared to the same period a year ago, and a $0.2 million increase in other expenses in 2013 as compared to 2012. These increases were offset by a $0.2 million decrease in expenses due to the closure of an assisted living facility in California in April, 2012.
Cost of services at our regional operations support decreased by $1.6 million in 2013 as compared to 2012. The primary reason for the decrease was a decrease in labor costs of $1.6 million due to the reduction of overhead positions in August 2013.
59
Hospice and Home Health Services
Year Ended December 31, | ||||||||||||||||||||
2013 | 2012 | Increase/(Decrease) | ||||||||||||||||||
Cost of Service Dollars | Revenue Percentage | Cost of Service Dollars | Revenue Percentage | Dollars | Percentage | |||||||||||||||
(dollars in millions) | ||||||||||||||||||||
Hospice | $ | 63.2 | 88.6 | % | $ | 64.5 | 80.3 | % | $ | (1.3 | ) | (2.0 | )% | |||||||
Home Health | 26.3 | 95.3 | 23.9 | 90.6 | % | 2.4 | 10.0 | |||||||||||||
Total hospice & home health services | $ | 89.5 | 90.6 | % | $ | 88.4 | 82.8 | % | $ | 1.1 | 1.2 | % | ||||||||
Cost of services expenses related to our hospice business decreased $1.3 million in 2013 as compared to 2012. This decrease resulted from a $2.9 million decrease in the operating costs at the facilities that operated for the full twelve month period in 2013 and 2012, partially offset by an increase in operating expenses of $1.6 million at the General Inpatient Care ("GIP") unit at our Las Vegas, Nevada hospice. GIP units require a higher level of patient care and result in increased PPD costs. In addition, salaries and wages increased on a PPD basis as the agencies did not reduce staffing levels commensurate with their decreased census.
Cost of services related to our home health business increased $2.4 million in 2013 as compared to 2012. The increase was primarily due to an increase of $1.4 million of additional expenses at our existing home health agencies, commensurate with the increase in episodes. Of the $1.4 million, salaries, contract, and benefits related expense increased by $1.1 million for these facilities. The remaining balance of $1.0 million in home health cost of services expense was due to acquisitions.
Rent Cost of Revenue. Rent cost of revenue increased by $0.9 million , or 4.9% , to $18.8 million , or 2.2% of revenue, in 2013 from $17.9 million , or 2.1% of revenue, in 2012 . The increase was primarily related to a new lease that went into effect in the fourth quarter of 2012 at a California skilled nursing facility.
General and Administrative Services Expenses. Our general and administrative services expenses increased by $2.4 million , or 9.8% , to $26.6 million , or 3.2% of revenue, in 2013 from $24.2 million , or 2.8% of revenue, in 2012 . The increase is primarily due to $2.0 million in severance costs related to the elimination of positions not related to patient care. There was also an increase of $0.3 million in consulting fees related to our CEO search, a $1.0 million increase in legal professional services used in 2013 as compared to 2012, and a $0.8 million increase in purchased services in 2013 as compared to 2012. These increases were partially offset by a $1.1 million reduction in stock compensation expense and $0.3 million less of incentive accruals in 2013, as compared to 2012.
Depreciation and Amortization. Depreciation and amortization remained consistent at $23.6 million in 2013 as compared to 2012 .
Change in fair value of contingent consideration. The change in fair value of contingent consideration decreased by $4.5 million, to a benefit of $3.7 million, or 0.4% of revenue, in 2013 from an expense of $0.8 million, or 0.1% of revenue, in 2012. The decrease is related to the change in fair value of the contingent consideration related to the 2010 hospice and home health acquisition due to reductions in forecasted EBITDA, which reduces the likelihood of the businesses achieving their EBITDA target necessary for the earn-out to be paid in future periods.
Impairment of Long-Lived Assets. We recorded a goodwill impairment charge of $16.5 million and a $2.5 million impairment charge related to home health licenses in 2013. There was no comparable charge recorded in 2012. See “ Management's Discussion and Analysis of Financial Condition and Results of Operations-Goodwill and Other Long-Lived Assets,” for a more detailed discussion of the impairment charges.
Interest Expense. Interest expense decreased by $3.5 million , or 9.3% , to $34.3 million in 2013 from $37.8 million in 2012 . The decrease is related to the replacement of higher cost subordinated debt with term debt in the second quarter of 2012 as well as the 2013 refinancing 10 skilled nursing facilities with mortgage loans insured by the U.S. Department of Housing and Urban Development Program ("HUD"). The weighted average interest rate decreased from 6.87% for 2012 to 6.62% for 2013. Also, the average debt outstanding dropped from $476.8 million for the period ended December 31, 2012 to $447.7 million for the period ended December 31, 2013.
Interest Income. Interest income decreased by $0.2 million to $0.3 million in 2013 from $0.5 million in 2012 due to a decrease in average outstanding notes receivable.
Equity in Earnings of Joint Venture. Equity earnings of our joint venture remained consistent at $1.9 million , or 0.2% of revenue, in 2013 as compared to 2012 .
60
Debt Modification/Retirement Cost. The debt modification/retirement costs decreased by $1.3 million to $2.8 million or 0.3% of revenue, in 2013 from $4.1 million or 0.5% of revenue in 2012. Of the $2.8 million expensed for debt modification, $1.1 million related to the June 2013 credit facility amendment. The remaining $1.7 million was related to deferred financing fees expensed on the extinguishment of term debt that was refinanced with HUD insured loans as well as the term debt that was refinanced with MidCap Financial. Of the $4.1 million expensed in 2012, $1.9 million in costs related unamortized subordinated debt deferred financing fees expensed when the bonds were defeased and $2.1 million related to the June 2012 credit facility amendment.
(Loss) Income from Continuing Operations Before Provision for Income Taxes. (Loss) income from continuing operations before provision for incomes taxes decreased by $44.4 million to a loss of $9.1 million in 2013 from an income of $35.3 million in 2012 primarily as a result of the decrease in revenue, impairment of goodwill and long lived assets of $19.0 million and the loss due to closure of the Home Health Care of the West agency of $0.4 million.
Benefit for Income Taxes. We recorded a tax benefit of $2.9 million, or 32.0% of pre-tax loss, for 2013, as compared to an expense of $12.9 million, or 36.5% of pre-tax earnings, for 2012. The lower tax expense for 2013 was due primarily to lower pre-tax income. On July 11, 2013, legislation was enacted in California that will limit the carryover period for unused EZ tax credits to 10 years beginning in 2014. Prior to this legislation, unused EZ tax credits could be carried over indefinitely. This change in carryforward period resulted in the recording of a $2.3 million increase to the state valuation allowance, which was partially offset by the federal benefit resulting from the increase in state valuation allowance of $0.8 million .
61
Quarterly Data
The following is a summary of our unaudited quarterly results from operations for each of the years ended December 31, 2014 and 2013.
Three Months Ended, | |||||||||||||||||||||||||||||||
December 31, 2014 | September 30, 2014 | June 30, 2014 | March 31, 2014 | December 31, 2013 | September 30, 2013 | June 30, 2013 | March 31, 2013 | ||||||||||||||||||||||||
(In thousands, except per share data) | |||||||||||||||||||||||||||||||
Consolidated Statement of Operations Data | |||||||||||||||||||||||||||||||
Revenue | $ | 210,359 | $ | 208,618 | $ | 206,979 | $ | 207,300 | $ | 208,278 | $ | 208,744 | $ | 210,192 | $ | 215,058 | |||||||||||||||
Expenses: | |||||||||||||||||||||||||||||||
Cost of services (exclusive of rent cost of revenue and depreciation and amortization shown below) | 179,337 | 176,689 | 178,529 | 180,309 | 181,707 | 181,078 | 182,815 | 186,270 | |||||||||||||||||||||||
Rent cost of revenue | 5,158 | 5,146 | 4,922 | 4,774 | 4,668 | 4,806 | 4,685 | 4,669 | |||||||||||||||||||||||
General and administrative | 13,838 | 12,780 | 7,287 | 6,084 | 6,837 | 6,490 | 6,837 | 6,455 | |||||||||||||||||||||||
Litigation settlement costs (net of recoveries) | — | — | — | — | — | — | — | — | |||||||||||||||||||||||
Depreciation and amortization | 6,082 | 6,120 | 6,034 | 6,085 | 6,071 | 5,900 | 5,902 | 5,898 | |||||||||||||||||||||||
Change in fair value of contingent consideration | (476 | ) | 7 | (121 | ) | 14 | (1,620 | ) | 79 | (2,244 | ) | 83 | |||||||||||||||||||
Impairment of long-lived assets | — | — | 82 | — | — | 19,000 | — | — | |||||||||||||||||||||||
Loss on disposal of assets | 2 | 68 | — | — | — | — | — | — | |||||||||||||||||||||||
203,941 | 200,810 | 196,733 | 197,266 | 197,663 | 217,353 | 197,995 | 203,375 | ||||||||||||||||||||||||
Other (expenses) income: | |||||||||||||||||||||||||||||||
Interest expense | (7,984 | ) | (8,009 | ) | (7,945 | ) | (8,039 | ) | (8,105 | ) | (8,744 | ) | (8,734 | ) | (8,675 | ) | |||||||||||||||
Interest income | 219 | 173 | 302 | 43 | 48 | 63 | 112 | 112 | |||||||||||||||||||||||
Other (expense) income | (33 | ) | (26 | ) | 7 | 52 | 2 | 248 | (32 | ) | (30 | ) | |||||||||||||||||||
Equity in earnings of joint venture | 221 | 568 | 92 | 546 | 480 | 508 | 472 | 489 | |||||||||||||||||||||||
Debt retirement costs | — | (21 | ) | (822 | ) | — | (1,308 | ) | (432 | ) | (1,088 | ) | — | ||||||||||||||||||
Total other (expenses) income, net | (7,577 | ) | (7,315 | ) | (8,366 | ) | (7,398 | ) | (8,883 | ) | (8,357 | ) | (9,270 | ) | (8,104 | ) | |||||||||||||||
(Loss) income from continuing operations before (benefit) provision for income taxes | (1,159 | ) | 493 | (4,125 | ) | 2,636 | 1,668 | (17,263 | ) | 2,927 | 3,579 | ||||||||||||||||||||
(Benefit) provision for income taxes | (1,094 | ) | (150 | ) | (1,345 | ) | 1,341 | 1,035 | (5,324 | ) | 1,139 | 245 | |||||||||||||||||||
(Loss) income from continuing operations | (65 | ) | 643 | (2,780 | ) | 1,295 | 633 | (11,939 | ) | 1,788 | 3,334 | ||||||||||||||||||||
Loss from discontinued operations, net of tax | — | — | — | — | (3,635 | ) | (136 | ) | (265 | ) | (264 | ) | |||||||||||||||||||
Net (loss) income | $ | (65 | ) | $ | 643 | $ | (2,780 | ) | $ | 1,295 | $ | (3,002 | ) | $ | (12,075 | ) | $ | 1,523 | $ | 3,070 | |||||||||||
Earnings (loss) per share, basic: | |||||||||||||||||||||||||||||||
Earnings (loss) per common share from continuing operations | $ | — | $ | 0.02 | $ | (0.07 | ) | $ | 0.03 | $ | 0.02 | $ | (0.32 | ) | $ | 0.05 | $ | 0.08 | |||||||||||||
Loss per common share from discontinued operations | — | — | — | — | (0.10 | ) | — | (0.01 | ) | — | |||||||||||||||||||||
Earnings (loss) per share | $ | — | $ | 0.02 | $ | (0.07 | ) | $ | 0.03 | $ | (0.08 | ) | $ | (0.32 | ) | $ | 0.04 | $ | 0.08 | ||||||||||||
Earnings (loss) per share, diluted: | |||||||||||||||||||||||||||||||
Earnings (loss) per common share from continuing operations | $ | — | $ | 0.02 | $ | (0.07 | ) | $ | 0.03 | $ | 0.02 | $ | (0.32 | ) | $ | 0.05 | $ | 0.08 | |||||||||||||
Loss per common share from discontinued operations | — | — | — | — | (0.10 | ) | — | (0.01 | ) | — | |||||||||||||||||||||
Earnings (loss) per share | $ | — | $ | 0.02 | $ | (0.07 | ) | $ | 0.03 | $ | (0.08 | ) | $ | (0.32 | ) | $ | 0.04 | $ | 0.08 | ||||||||||||
Weighted-average common shares outstanding, basic | 38,218 | 38,207 | 38,098 | 37,972 | 37,431 | 37,499 | 37,646 | 37,557 | |||||||||||||||||||||||
Weighted-average common shares outstanding, diluted | 38,218 | 38,463 | 38,098 | 38,202 | 37,431 | 37,499 | 38,186 | 38,034 | |||||||||||||||||||||||
62
Liquidity and Capital Resources
The following table presents selected data from our consolidated statements of cash flows (in thousands):
Year Ended December 31, | |||||||||||
2014 | 2013 | 2012 | |||||||||
Cash Flows from Continuing Operations | |||||||||||
Net cash provided by operating activities | $ | 26,321 | $ | 47,921 | $ | 42,676 | |||||
Net cash used in investing activities | (11,825 | ) | (493 | ) | (19,525 | ) | |||||
Net cash used by financing activities | (15,044 | ) | (45,254 | ) | (37,165 | ) | |||||
Net (decrease) increase in cash and equivalents | (548 | ) | 2,174 | (14,014 | ) | ||||||
Cash and cash equivalents at beginning of period | 4,177 | 2,003 | 16,017 | ||||||||
Cash and cash equivalents at end of period | $ | 3,629 | $ | 4,177 | $ | 2,003 | |||||
Based upon our current level of operations, we believe that cash generated from operations, cash on hand and borrowings available to us will be adequate to meet our anticipated debt service requirements, capital expenditures and working capital needs for at least the next 12 months. One element of our business strategy is to selectively pursue acquisitions and strategic alliances. Any acquisitions or strategic alliances may result in the incurrence of, or assumption by us, of additional indebtedness. We continually assess our capital needs and may seek additional financing through a variety of methods including through an extension of our revolving credit facility or by accessing available debt and equity markets, as considered necessary to fund capital expenditures and potential acquisitions or for other purposes. Our future operating performance will be subject to future economic conditions and to financial, business, regulatory and other factors, many of which are beyond our control. For additional discussion, see "Other Factors Affecting Liquidity and Capital Resources" below.
Years Ended December 31, 2014 and 2013
Net cash provided by operating activities primarily consists of net (loss) income adjusted for certain non-cash items including depreciation and amortization, provision for doubtful accounts, stock-based compensation, and goodwill impairment charge, as well as the effect of changes in working capital and other activities. Cash provided by operating activities for the year ended December 31, 2014 was $26.3 million and consisted of a net loss of $0.9 million, positive non-cash items of $46.2 million, and a decrease in working capital and other activities of $19.0 million. The non-cash items consisted primarily of depreciation and amortization of $24.2 million, bad debt expense of $14.1 million, non-cash stock-based compensation of $4.3 million, and amortization of deferred financing costs of $3.3 million. Working capital and other activities primarily consisted of an increase in accounts receivable of $33.8 million, an increase in accounts payable and accrued liabilities of $7.8 million, insurance liability risks of $1.9 million, a increase in employee compensation and benefits of $2.3 million, and an increase in payments on notes receivable $1.6 million. The increase in accounts receivable after considering the provision for doubtful accounts was $19.7 million. The increase in accounts receivable is primarily attributed to the increase in Medicaid revenue associated with the Texas UPL program and the general increase in Medicaid and Managed care revenue during 2014. Days sales outstanding ("DSO") increased from 45.9 as of December 31, 2013 to 53.9 as of December 31, 2014. The increase in DSO was primarily due to the UPL program in Texas. The management fees associated with the program typically take six months to collect. As of December 31, 2014 there was $6.6 million of management fees on the balance sheet. Additionally, due to the number of facilities in Texas filing change of ownership (CHOW) paperwork with the state in order to participate in the program, the state has been unable to process the CHOW paperwork within the time frame that they typically take to complete it. As a result, there was an additional $4.2 million of receivables on the balance sheet at December 31, 2014 that would otherwise have been collected.
Investing activities used $11.8 million in 2014, as compared to $0.5 million in 2013. The primary use of funds in 2014 consisted of $13.0 million of capital expenditures offset by the cash proceeds of $1.0 million received from the maturity of investments.
Net cash used in financing activities was $15.0 million in 2014, as compared to net cash used in financing activities of $45.3 million in 2013. In 2014, net cash used in financing activities reflects our net repayments under our line of credit of $2.9 million as well as a net reduction in term and other long term debt of $9.6 million from scheduled principal payments. There was $2.2 million of deferred financing fees paid for the June 2014 credit facility amendment. Stock activity, including the exercise of options and payment of taxes related to the vesting of stock awards used a net $0.3 million in 2014.
63
Years Ended December 31, 2013 and 2012
Net cash provided by operating activities primarily consists of net income adjusted for certain non-cash items including depreciation and amortization, provision for doubtful accounts, stock-based compensation, and goodwill impairment change, as well as the effect of changes in working capital and other activities. Cash provided by operating activities for the year ended December 31, 2013 was $47.9 million and consisted of net income of $10.5 million, positive non-cash items of $69.4 million, and negative working capital and other activities of $11.0 million. The non-cash items consisted primarily of depreciation and amortization of $24.6 million bad debt expense of $14.4 million, and a goodwill impairment charge of $19.0 million. Working capital and other activities primarily consisted of an increase in accounts receivable of $14.5 million, an increase in insurance liability risks of $7.8 million, a decrease in employee compensation and benefits of $7.8 million, and an increase in accounts payable and accrued liabilities of $6.2 million. The increase in accounts receivable after considering the provision for doubtful accounts was less than $0.1 million. Days sales outstanding ("DSO") increased from 44.5 for the three months ended December 31, 2012 to 45.9 for the three months ended December 31, 2013. The increase in DSO was due to the relative increase in revenue sources other than Medicare, which pay slower than Medicare.
Investing activities used $0.5 million in 2013, as compared to $19.5 million in 2012. The primary use of funds in 2013 consisted $13.4 million of capital expenditures offset by the cash proceeds of $12.9 million received from the disposition of two skilled nursing facilities.
Net cash used in financing activities was $45.3 million in 2013, as compared to net cash used in financing activities of $37.2 million in 2012. In 2013, net cash used in financing activities primarily reflects our borrowings under our line of credit net of repayment of $11.9 million as well as a net reduction in term and other long term debt of $25.4 million from both scheduled principal payments and from the use from the proceeds of skilled nursing facility dispositions to repay term debt. There were $7.7 million of additions to deferred financing fees from the credit facility amendment to increase the permitted leverage ratio and from the refinancing of term debt with HUD and other mortgage debt.
Principal Debt Obligations
Our primary sources of liquidity are our cash on hand, our cash flows from operations and our revolving credit facility, which is subject to the satisfaction of certain financial covenants therein. Our primary liquidity requirements are for lease obligations, debt service on our indebtedness, capital expenditures and working capital.
We are significantly leveraged both before and after the Combination with FC-GEN. As of December 31, 2014, prior to the Combination with FC-GEN, we had $410.8 million in aggregate indebtedness outstanding, consisting of a $241.6 million first lien senior secured term loan (net of the unamortized portion of the original issue discount of $0.7 million), $16.0 million principal amount outstanding under our $83.1 million revolving credit facility, $4.2 million outstanding under our asset based revolving credit facility, $86.1 million HUD insured loans, $60.6 million term debt mortgage loan, and other debt of approximately $2.4 million. Furthermore, we had $4.9 million in outstanding letters of credit against our $83.1 million revolving credit facility, leaving approximately $62.2 million of additional borrowing capacity under our "senior secured credit facility" as of December 31, 2014. Substantially all of our subsidiaries except for the HUD insured loan subsidiaries guarantee the first lien senior secured term loan and our then existing revolving credit facility. For 2014, 2013, and 2012, our interest expense, net of interest income, was $31.2 million, $33.9 million, and $37.2 million, respectively.
In connection with our Combination with FC-GEN, on February 2, 2015 we and certain of our subsidiaries entered into a $360.0 million loan (the “Real Estate Bridge Loan”), which is secured by a mortgage lien on the real property of 67 facilities and a second lien on certain receivables of the operators of such facilities. The Real Estate Bridge Loan is subject to a 24-month term with two extension options of 90-days each and accrues interest at a rate equal to LIBOR, plus 6.75%, plus an additional margin that ranges up to 7.00% based on the aggregate number of days the Real Estate Bridge Loan is outstanding. The interest rate is also subject to a LIBOR interest rate floor of 0.5%. The Real Estate Bridge Loan is subject to payments of interest only during the term with a balloon payment due at maturity; provided, that to the extent the subsidiaries receive any net proceeds from the sale and / or refinance of the underlying facilities such net proceeds are required to be used to repay the outstanding principal balance of the Real Estate Bridge Loan. The proceeds of the Real Estate Bridge Loan were used to repay our first lien senior secured term loan, repay our mortgage loans and asset based revolving credit facility with MidCap Financial with excess proceeds used to fund direct costs of the Combination with FC-GEN. The Real Estate Bridge Loan currently has an outstanding principal balance of $360.0 million.
Also in connection with our Combination with FC-GEN, on February 2, 2015 we and certain of our subsidiaries entered into a credit agreement, the (“Revolving Credit Facilities”). The Revolving Credit Facilities consist of a senior secured, asset-based revolving credit facility of up to $550 million under three separate tranches: Tranche A-1, Tranche A-2 and FILO Tranche. Interest accrues at a per annum equal to either (x) a base rate (calculated as the highest of the (i) prime rate, (ii) the federal funds rate plus 3.00%, or (iii) LIBOR plus the excess of the applicable margin between LIBOR loans and base rate loans) plus an applicable margin or (y) LIBOR plus an applicable margin. The applicable margin is based on the level of commitments for all three tranches, and in regards to LIBOR loans (i) for Tranche A-1 ranges from 3.25% to 2.75%; (ii) for
64
Tranche A-2 ranges from 3.00% to 2.50%; and (iii) for FILO Tranche is 5.00%. The Revolving Credit Facilities mature on February 2, 2020; provided that if the Term Loan Facility (defined below) or the Real Estate Bridge Loan is not refinanced with longer term debt or their terms not extended prior to their current maturities of December 4, 2017 and August 27, 2017, respectively, the Revolving Credit Facilities will mature 90 days prior to such maturity date, as applicable. Borrowings levels under the Revolving Credit Facilities are limited to a borrowing base that is computed based upon the level of our eligible accounts receivable, as defined. In addition to paying interest on the outstanding principal borrowed under the Revolving Credit Facilities, we are required to pay a commitment fee to the lenders for any unutilized commitments. The commitment fee rate ranges from 0.375% per annum to 0.50% depending upon the level of unused commitment. At the time of the Combination with FC-GEN, on February 2, 2015, we had outstanding borrowings under the Revolving Credit Facilities of $324.5 million and have $109.5 million of drawn letters of credit securing insurance and lease obligations, leaving us approximately $116.0 million of available borrowing capacity under the Revolving Credit Facilities.
Prior to the Combination, FC-GEN and certain of its subsidiaries became a party to a five year term loan, (the “Term Loan Facility”). The Term Loan Facility is secured by a first priority lien on the membership interests in FC-GEN, substantially all of FC-GEN and its subsidiaries’ assets other than collateral held on a first priority basis by the Revolving Credit Facilities lender. Borrowings under the Term Loan Facility bear interest at a rate per annum equal to the applicable margin plus, at our option, either (x) LIBOR or (y) a base rate determined by reference to the highest of (i) the lender defined prime rate, (ii) the federal funds rate effective plus one half of one percent and (iii) LIBOR described in subclause (x) plus 1.0%. LIBOR based loans are subject to an interest rate floor of 1.5% and base rate loans are subject to a floor of 2.5%. The Term Loan Facility matures on December 4, 2017. On September 24, 2014, FC-GEN entered into an amendment to the Term Loan Facility providing for changes to the financial covenants and other provisions allowing for and accommodating the Combination. On February 2, 2015, the amendment to the Term Loan Facility became effective. The Term Loan Facility currently has an outstanding principal balance of $230.7 million.
If our remaining ability to borrow under our revolving credit facility is insufficient for our capital and operating requirements, we will be required to seek additional sources of financing, including issuing equity, which may be dilutive to our current stockholders, or incurring additional debt. Our ability to incur additional debt is subject to the restrictions in our loan and lease agreements. We cannot assure you that the restrictions contained in our lease and loan agreements will permit us to borrow the funds that we need to finance our operations, or that additional debt will be available to us on commercially reasonable terms or at all. If we are unable to obtain funds sufficient to finance our capital requirements, we may have to forego opportunities to expand our business, including the acquisition of additional facilities or complementary businesses.
HUD Insured Mortgage Loans and Other Indebtedness
In 2013, we received funding of 10 loans insured by HUD. The loans have a combined aggregate original principal balance of $87.6 million and are secured by 10 skilled nursing facilities. The HUD insured loans have an average all in interest rate of approximately 5.3% and amortization terms of 30 to 35 years. As of December 31, 2014 the HUD insured loans have a combined aggregate principal balance of $86.1 million.
Accordingly, as of December 31, 2014, the Company has 10 mortgages insured by HUD, which are each secured by a skilled nursing facility. These mortgages have an average remaining term of 33 years with fixed interest rates ranging from 3.3% to 4.5% and a weighted average interest rate of 4.23%. Depending on the mortgage agreement, prepayments are generally allowed only after 12 months or from the inception of the mortgage. Prepayments are subject to a penalty of 10% of the remaining principal balances in the first year and the prepayment penalty decreases each subsequent year by 1% until no penalty is required. As all $87.6 million of the HUD insured mortgage loans were originated in 2013, none of the loans could be prepaid at December 31, 2014. Any further HUD insured mortgages will require additional HUD approval.
All HUD-insured mortgages are non-recourse loans to the Company. All mortgages are subject to HUD regulatory agreements that require escrow reserve funds to be deposited with the loan servicer for mortgage insurance premiums, property taxes, insurance and for capital replacement expenditures. As of December 31, 2014, the Company has escrow reserve funds of $1.6 million with the loan servicer that are reported within other current assets, and replacement reserve funds of $3.6 million in other assets.
In connection with the Combination with FC-GEN, we will consolidate additional mortgages and other secured debt. Subsidiaries of FC-GEN carry two mortgage loans on two of its corporate office buildings. The loans are secured by the underlying real property and have fixed or variable rates of interest ranging from 1.9% to 4.3% with maturity dates ranging from 2018 to 2019. Additionally, certain of FC-GEN’s consolidated joint ventures carry mortgages, which are non-recourse to us. The loans consist principally of revenue bonds and secured bank loans. Loans are secured by the underlying real and personal property of individual facilities and have fixed or variable rates of interest ranging from 2.5% to 21.9%, with maturity dates ranging from 2018 to 2036. Loans are labeled “non-recourse” because neither the Company nor a wholly owned subsidiary is obligated to perform under the respective loan agreements.
65
Capital Expenditures
We intend to invest in the maintenance and general upkeep of our facilities and our information systems on an ongoing basis. Combined, we expect that these activities will amount to approximately $1,300 per bed.
We anticipate that we will have capital expenditures in 2015 of approximately $85.0 million to $90.0 million, including approximately $15.0 million of capital expenditures in connection with the Combination. We will continue to assess our capital spending plans on an ongoing basis.
Other Factors Affecting Liquidity and Capital Resources
Medical and Professional Malpractice and Workers' Compensation Insurance. Our skilled nursing facilities and other businesses, like physicians, hospitals and other healthcare providers, are subject to a significant number of legal actions alleging malpractice, negligence or related legal theories. Many of these actions involve large claims and significant defense costs. To protect ourselves from the cost of these claims, we maintain professional liability and general liability as well as workers' compensation insurance in amounts and with deductibles that we believe to be sufficient for our operations. Historically, unfavorable pricing and availability trends emerged in the professional liability and workers' compensation insurance market and the insurance market in general that caused the cost of these liability coverages to generally increase dramatically. Many insurance underwriters became more selective in the insurance limits and types of coverage they would provide as a result of rising settlement costs and the significant failures of some nationally known insurance underwriters. As a result, we experienced substantial changes in our professional liability insurance program beginning in 2001. Specifically, we are required to assume substantial self-insured retentions for our professional liability claims. A self-insured retention is a minimum amount of damages and expenses (including legal fees) that we must pay for each claim. We use actuarial methods to estimate the value of the losses that may occur within this self-insured retention level and we are required under our workers' compensation insurance agreements to post a letter of credit or set aside cash in trust funds to securitize the estimated losses that we may incur. Because of the high retention levels, we cannot predict with certainty the actual amount of the losses we will assume and pay.
We estimate our self-insured general and professional liability reserves and our self-insured workers' compensation reserve at least semiannually, based upon actuarial analyses using the most recent trends of claims, settlements and other relevant data from our own and our industry's loss history. Based upon these analyses, at December 31, 2014, we had reserved $21.6 million for known or unknown or potential self-insured general and professional liability claims and $21.9 million for self-insured workers' compensation claims. Of these reserves, we estimate that a total of $14.2 million, consisting of approximately $7.9 million for self-insured general and professional liability claims based on historical experience and current claims activity and $6.3 million for self-insured workers' compensation claims, will be payable within 12 months. At the time of the Combination with FC-GEN, we estimate we will add $288.3 million and $198.0 million of incremental self-insured general and professional liability and workers compensation reserves, respectively. Of these additional reserves, we estimate a total of $130.9 million, consisting of $93.9 million and $37.0 million of self-insured general and professional and workers compensation claims, respectively, will be payable in the next 12 months. While there are some settlements with prescribed future payment dates, for the majority of our self-insured losses there are no set payment schedules and there can be no assurance that the payment amount in the next 12 months will not be significantly larger or smaller. To the extent that subsequent claims information varies from loss estimates, the liabilities will be adjusted to reflect current loss data. There can be no assurance that in the future general and professional liability or workers' compensation insurance will be available at a reasonable price and that we will not have to further increase our levels of self-insurance.
Inflation. We derive a substantial portion of our revenue from the Medicare program. We also derive revenue from state Medicaid and similar reimbursement programs. Payments under these programs generally provide for reimbursement levels that are adjusted for inflation annually based upon the state's fiscal year for the Medicaid programs and in each October for the Medicare program. However, there can be no assurance that these adjustments will continue in the future and, if received, will reflect the actual increase in our costs for providing healthcare services.
Labor and supply expenses make up a substantial portion of our operating expenses. Those expenses can be subject to increase in periods of rising inflation and when labor shortages occur in the marketplace. To date, we have generally been able to implement cost control measures or obtain increases in reimbursement sufficient to offset increases in these expenses. We cannot assure you that we will be successful in offsetting future cost increases.
Off Balance Sheet Arrangements
We had outstanding letters of credit of $4.9 million under our $83.1 million revolving credit facility as of December 31, 2014. Following the Combination with FC-GEN, we will add an additional $109.5 million of outstanding letters of credit on the expanded Revolving Credit Facilities. The Revolving Credit Facilities provide for a total letter of credit facility of $150.0 million, however, utilization under that sub-facility restricts the net available borrowings and liquidity afforded by the
66
Revolving Credit Facilities. In addition, at the time of the Combination, FC-GEN has another $95.4 million of outstanding letters of credit which are 100% collateralized by restricted marketable securities, also added in the Combination.
Contractual Obligations
The following table sets forth our contractual obligations as of December 31, 2014 and does not give effect to the Combination, including any of the contractual obligations entered into by FC-GEN described above (in thousands):
Total | Less Than 1 Yr. | 1-3 Yrs. | More than 3 Yrs. | ||||||||||||
Long-term debt obligations | |||||||||||||||
Senior secured credit facility(1)(3) | $ | 323,071 | $ | 9,343 | $ | 313,728 | $ | — | |||||||
Other long-term debt obligations(3) | 88,478 | 3,113 | 5,051 | 78,707 | |||||||||||
Operating lease obligations(2)(3) | 133,609 | 18,927 | 32,711 | 60,577 | |||||||||||
$ | 545,158 | $ | 31,383 | $ | 351,490 | $ | 139,284 | ||||||||
________________
(1) | Based on implied forward one-month LIBOR rates in the yield curve as of December 31, 2014. |
(2) | We lease some of our facilities under non-cancelable operating leases. The leases generally provide for our payment of property taxes, insurance and repairs, and have rent escalation clauses, principally based upon the Consumer Price Index or other fixed annual adjustments. The amounts shown reflect the future minimum rental payments under these leases. |
(3) | These contractual obligations have not been adjusted to reflect the Combination with FC-GEN. |
Item 7A. | Quantitative and Qualitative Disclosures About Market Risk |
In the normal course of business, our operations are exposed to risks associated with fluctuations in interest rates. To the extent these interest rates increase, our interest expense will increase, which will make our interest payments and funding our other fixed costs more expensive, and our available cash flow may be adversely affected. We routinely monitor our risks associated with fluctuations in interest rates and consider the use of derivative financial instruments to hedge these exposures. We do not enter into derivative financial instruments for trading or speculative purposes nor do we enter into energy or commodity contracts.
Interest Rate Exposure—Interest Rate Risk Management
In connection with, and following the Combination with FC-GEN, we have a $360.0 million Real Estate Bridge Loan, the $550.0 million Revolving Credit Facilities and other indebtedness which expose us to variability in interest payments due to changes in interest rates. Our HUD insured mortgage loans and certain other realestate loans are fixed rate fully amortizing loans.
The table below presents the principal amounts, weighted-average interest rates and fair values by year of expected maturity to evaluate our expected cash flows and sensitivity to interest rate changes (dollars in thousands):
Twelve Months Ending December 31, | |||||||||||||||||||||||||||||||
2015 | 2016 | 2017 | 2018 | 2019 | Thereafter | Total | Fair Value | ||||||||||||||||||||||||
Fixed-rate debt | $ | 4,144 | $ | 2,684 | $ | 2,801 | $ | 2,923 | $ | 3,598 | $ | 104,167 | $ | 120,317 | $ | 120,963 | |||||||||||||||
Average interest rate(1) | 3.7 | % | 4.3 | % | 4.3 | % | 4.3 | % | 4.2 | % | 4.5 | % | |||||||||||||||||||
Variable-rate debt(2) | $ | 13,360 | $ | 13,388 | $ | 891,090 | $ | 21,814 | $ | — | $ | — | $ | 939,652 | $ | 939,652 | |||||||||||||||
Average interest rate(1) | 9.5 | % | 9.5 | % | 7.5 | % | 3.0 | % | — | % | — | % | |||||||||||||||||||
(1) | Based on one month LIBOR rate of 0.17% as of February 2, 2015. |
(2) | Excludes unamortized original issue discounts and debt premiums which amortize through interest expense on a non-cash basis over the life of the instrument. |
See Liquidity and Capital Resources - Principal Debt Obligations in Item 7 - Management’s Discussion and Analysis of Financial Condition and Results of Operations for a description of the debt transactions completed in connection with the Combination with FC-GEN.
A 1% increase in the applicable interest rate on the combined variable-rate debt following the Combination with FC-GEN would result in an increase of approximately $9.4 million in annual interest expense.
Item 8. | Financial Statements and Supplementary Data |
The information required by this item is incorporated herein by reference to the financial statements set forth in Item 15 of this report, "Exhibits and Financial Statement Schedules—Consolidated Financial Statements and Supplementary Data."
Item 9. | Changes in and Disagreements with Accountants on Accounting and Financial Disclosure |
The Combination was treated as a “reverse acquisition” for accounting purposes and, as such, the historical financial statements of the accounting acquirer, FC-GEN, which were audited by KPMG LLP (“KPMG”), will become the historical financial statements of Genesis.
On February 16, 2015, the Audit Committee of Genesis chose to (i) dismiss Ernst & Young LLP (“Ernst & Young”) as Genesis’ independent registered public accounting firm, and (ii) formally engage KPMG LLP to be the independent registered public accounting firm for Genesis for the fiscal year ending December 31, 2015. The dismissal of Ernst & Young will become effective upon the issuance by Ernst & Young of its reports on the Company’s consolidated financial statements as of and for the fiscal year ending December 31, 2014 and the effectiveness of internal control over financial reporting as of December 31, 2014 for inclusion in the Company’s Annual Report on Form 10-K for the fiscal year ending December 31, 2014.
Ernst & Young’s reports on the Company’s financial statements for the fiscal years ended December 31, 2014 and 2013 did not contain an adverse opinion or disclaimer of opinion, or qualification or modification as to uncertainty, audit scope, or accounting principles. In addition, during the Company’s two most recent fiscal years and through the date of this report, there were no disagreements with Ernst & Young on any matter of accounting principles or practices, financial statement disclosure or auditing scope or procedure, which disagreement(s), if not resolved to the satisfaction of Ernst & Young, would have caused it to make reference to the subject matter of the disagreement(s) in connection with its report.
Genesis has provided Ernst & Young with a copy of the foregoing disclosures and requested that Ernst & Young furnish a letter addressed to the U.S. Securities and Exchange Commission stating whether it agreed with the above statements made by the Company. [A copy of such letter, dated February 19, 2015, is filed as Exhibit 16.1 to our Current Report on Form 8-K filed on February 19, 2015.]
During the fiscal years ended December 31, 2014 and 2013, and subsequent period through the date of this report, neither the Company nor anyone on its behalf consulted with KPMG regarding (i) the application of accounting principles to a specified transaction, either completed or proposed; or the type of audit opinion that might be rendered on the Company’s financial statements, and neither a written report nor oral advice was provided to the Company that KPMG concluded was an important factor considered by the Company in reaching a decision as to the accounting, auditing or financial reporting issue; or (ii) any matter that was either the subject of a “disagreement” (as that term is defined in Item 304(a)(1)(iv) of Regulation S-K and the related instructions to Item 304 of Regulation S-K) or a “reportable event” (as that term is defined in Item 304(a)(1)(v) of Regulation S-K).
Item 9A. | Controls and Procedures |
Evaluation of Disclosure Controls and Procedures
As required by Rules 13a-15(e) and 15d-15(e) under the Securities Exchange Act of 1934, as amended (the "Exchange Act"), management has evaluated, with the participation of our Chief Executive Officer and Chief Financial Officer, the effectiveness of our disclosure controls and procedures as of the end of the period covered by this report.
Disclosure controls and procedures refer to controls and other procedures designed to ensure that information required to be disclosed in the reports we file or submit under the Exchange Act is recorded, processed, summarized and reported, within the time periods specified in the rules and forms of the U.S. Securities and Exchange Commission. Disclosure controls and procedures include, without limitation, controls and procedures designed to ensure that information required to be disclosed by us in our reports that we file or submit under the Exchange Act is accumulated and communicated to management, including our Chief Executive Officer and Chief Financial Officer, as appropriate to allow timely decisions regarding our required disclosure. In designing and evaluating our disclosure controls and procedures, management recognizes that any controls and procedures, no matter how well designed and operated, can provide only reasonable assurance of achieving the desired control objectives, and management was required to apply its judgment in evaluating and implementing possible controls and procedures.
We conducted an evaluation, under the supervision and with the participation of our Chief Executive Officer and Chief Financial Officer, of the effectiveness of the design and operation of our disclosure controls and procedures as of the end of the period covered by this report. Based on their evaluation and subject to the foregoing, our Chief Executive Officer and Chief Financial Officer have concluded that, as of the end of the period covered by this report, the disclosure controls and procedures
were effective to provide reasonable assurance that information required to be disclosed in the reports we file and submit under the Exchange Act is recorded, processed, summarized and reported as and when required.
Management’s Report on Internal Control over Financial Reporting
Management is responsible for establishing and maintaining adequate internal control over financial reporting as defined in Rule 13a-15(f) under the Exchange Act.
Internal control over financial reporting refers to a process designed by, or under the supervision of, our Chief Executive Officer and Chief Financial Officer and effected by our board of directors, management and other personnel, to provide reasonable assurance regarding the reliability of financial reporting and the preparation of financial statements for external purposes in accordance with generally accepted accounting principles and includes those policies and procedures that:
• | pertain to the maintenance of records that in reasonable detail accurately and fairly reflect the transactions and dispositions of our assets; |
• | provide reasonable assurance that transactions are recorded as necessary to permit preparation of financial statements in accordance with generally accepted accounting principles, and that our receipts and expenditures are being made only in accordance with authorizations of our management and members of our board of directors; and |
• | provide reasonable assurance regarding prevention or timely detection of unauthorized acquisition, use, or disposition of our assets that could have a material effect on our financial statements. |
Internal control over financial reporting cannot provide absolute assurance of achieving financial reporting objectives because of its inherent limitations. Internal control over financial reporting is a process that involves human diligence and compliance and is subject to lapses in judgment and breakdowns resulting from human failures. Internal control over financial reporting also can be circumvented by collusion or improper override. Because of such limitations, there is a risk that material misstatements may not be prevented or detected on a timely basis by internal control over financial reporting. However, these inherent limitations are known features of the financial reporting process, and it is possible to design into the process safeguards to reduce, though not eliminate, this risk.
Management conducted the above-referenced assessment of the effectiveness of our internal control over financial reporting as of December 31, 2014 using the framework set forth in the report entitled, "Internal Control — Integrated Framework (2013 framework)", issued by the Committee of Sponsoring Organizations of the Treadway Commission, or the COSO Report. Based on management’s evaluation and the criteria set forth in the COSO Report, management concluded that our internal control over financial reporting was effective as of December 31, 2014.
The effectiveness of our internal control over financial reporting as of December 31, 2014 has been audited by Ernst & Young LLP, our independent registered public accounting firm. Ernst & Young's attestation report of our internal control over financial reporting is included in this item under "Report of Independent Registered Public Accounting Firm" and expresses an unqualified opinion on the effectiveness of our internal control over financial reporting as of December 31, 2014.
Changes in Internal Control Over Financial Reporting
Management determined that, as of December 31, 2014, there were no changes in our internal control over financial reporting that occurred during the last fiscal quarter then ended that has materially affected, or is reasonably likely to materially affect, our internal control over financial reporting. However, as a result of the Combination with FC-GEN that closed on February 2, 2015, we are evaluating our internal control policies and procedures and may make modifications in the design of our internal control policies and procedures.
70
Report of Independent Registered Public Accounting Firm
The Board of Directors and Shareholders
Genesis Healthcare, Inc. (formerly Skilled Healthcare Group, Inc.)
We have audited Skilled Healthcare Group, Inc.’s internal control over financial reporting as of December 31, 2014, based on criteria established in Internal Control-Integrated Framework issued by the Committee of Sponsoring Organizations of the Treadway Commission (2013 framework) (the COSO criteria). Skilled Healthcare Group, Inc.’s management is responsible for maintaining effective internal control over financial reporting, and for its assessment of the effectiveness of internal control over financial reporting included in the accompanying Management’s Report on Internal Control over Financial Reporting. Our responsibility is to express an opinion on the company’s internal control over financial reporting based on our audit.
We conducted our audit in accordance with the standards of the Public Company Accounting Oversight Board (United States). Those standards require that we plan and perform the audit to obtain reasonable assurance about whether effective internal control over financial reporting was maintained in all material respects. Our audit included obtaining an understanding of internal control over financial reporting, assessing the risk that a material weakness exists, testing and evaluating the design and operating effectiveness of internal control based on the assessed risk, and performing such other procedures as we considered necessary in the circumstances. We believe that our audit provides a reasonable basis for our opinion.
A company’s internal control over financial reporting is a process designed to provide reasonable assurance regarding the reliability of financial reporting and the preparation of financial statements for external purposes in accordance with generally accepted accounting principles. A company’s internal control over financial reporting includes those policies and procedures that (1) pertain to the maintenance of records that, in reasonable detail, accurately and fairly reflect the transactions and dispositions of the assets of the company; (2) provide reasonable assurance that transactions are recorded as necessary to permit preparation of financial statements in accordance with generally accepted accounting principles, and that receipts and expenditures of the company are being made only in accordance with authorizations of management and directors of the company; and (3) provide reasonable assurance regarding prevention or timely detection of unauthorized acquisition, use, or disposition of the company’s assets that could have a material effect on the financial statements.
Because of its inherent limitations, internal control over financial reporting may not prevent or detect misstatements. Also, projections of any evaluation of effectiveness to future periods are subject to the risk that controls may become inadequate because of changes in conditions, or that the degree of compliance with the policies or procedures may deteriorate.
In our opinion, Skilled Healthcare Group, Inc. maintained, in all material respects, effective internal control over financial reporting as of December 31, 2014, based on the COSO criteria.
We also have audited, in accordance with the standards of the Public Company Accounting Oversight Board (United States), the consolidated balance sheets of Skilled Healthcare Group, Inc. as of December 31, 2014 and 2013 and the related consolidated statements of operations, comprehensive (loss) income, stockholders’ equity and cash flows for each of the three years in the period ended December 31, 2014 of Skilled Healthcare Group, Inc. and our report dated February 20, 2015 expressed an unqualified opinion thereon.
/s/ Ernst & Young LLP
Irvine, California
February 20, 2015
71
Item 9B. | Other Information |
Not applicable.
PART III
Item 10. | Directors, Executive Officers and Corporate Governance |
The information to be included in the sections entitled, "Election of Directors” and “Our Executive Officers," respectively, in the Definitive Proxy Statement for the Annual Meeting of Stockholders to be filed by us with the U.S. Securities and Exchange Commission no later than 120 days after December 31, 2014 (the "2015 Proxy Statement") is incorporated herein by reference.
The information to be included in the section entitled "Section 16(a) Beneficial Ownership Reporting Compliance" in the 2015 Proxy Statement is incorporated herein by reference.
The information to be included in the section entitled "Code of Business Conduct and Ethics" in the 2015 Proxy Statement is incorporated herein by reference.
We have filed, as exhibits to this annual report, the certifications of our Principal Executive Officer and Principal Financial Officer required pursuant to Section 302 of the Sarbanes-Oxley Act of 2002.
Item 11. | Executive Compensation |
The information to be included in the sections entitled “Executive Compensation” and “Directors’ Compensation” in the 2015 Proxy Statement is incorporated herein by reference.
Item 12. | Security Ownership of Certain Beneficial Owners and Management and Related Stockholder Matters |
The information to be included in the section entitled “Security Ownership of Directors and Executive Officers and Certain Beneficial Owners” in the 2015 Proxy Statement is incorporated herein by reference.
Item 13. | Certain Relationships and Related Transactions, and Director Independence |
The information to be included in the sections entitled “Certain Relationships and Related Transactions,” “Board Independence,” and “Compensation Committee Interlocks and Insider Participation” in the 2015 Proxy Statement is incorporated herein by reference.
Item 14. | Principal Accountant Fees and Services |
The information to be included in the section entitled “Independent Registered Public Accounting Firm” in the 2015 Proxy Statement is incorporated herein by reference.
PART IV
Item 15. | Exhibits and Financial Statement Schedules |
(a) | 1. Consolidated Financial Statements and Supplementary Data: |
The following consolidated financial statements, and notes thereto, and the related Report of our Independent Registered Public Accounting Firm, are filed as part of this Form 10-K:
Page Number | ||
2. | Financial Statement Schedule: |
The following financial statement schedule is filed as part of this Form 10-K:
Page Number | ||
All other schedules have been omitted for the reason that the required information is presented in financial statements or notes thereto, the amounts involved are not significant or the schedules are not applicable.
(b) | Exhibits: A list of the exhibits filed or furnished with this Form 10-K is set forth on the Index of Exhibit immediately following the signature page to this Form 10-K and is incorporated herein by reference. |
(c) | Item 601 Exhibits |
Reference is hereby made to Item 15(a) of this report, “Exhibits and Financial Statement Schedules—Exhibits.”
SIGNATURES
Pursuant to the requirements of Section 13 or 15(d) of the Securities Exchange Act of 1934, as amended, the registrant has duly caused this report to be signed on its behalf by the undersigned, thereunto duly authorized.
SKILLED HEALTHCARE GROUP, INC. | |||
By | /S/ GEORGE V. HAGER JR. | ||
George V. Hager Jr. | |||
Date: | February 20, 2015 | Chief Executive Officer | |
Pursuant to the requirements of the Securities Exchange Act of 1934, as amended, this report has been signed below by the following persons on behalf of the registrant and in the capacities and on the date indicated.
Date: | February 20, 2015 | By | /S/ GEORGE V. HAGER JR. |
George V. Hager Jr. | |||
Chief Executive Officer | |||
Date: | February 20, 2015 | By | /S/ THOMAS DIVITTORIO |
Thomas DiVittorio | |||
Chief Financial Officer | |||
(Principal Financial Officer and Authorized Signatory) | |||
Date: | February 20, 2015 | By | /S/ STEPHEN S. YOUNG |
Stephen S. Young | |||
Vice President and Controller | |||
(Principal Accounting Officer and Authorized Signatory) | |||
Date: | February 20, 2015 | By | /S/ JAMES H. BLOEM |
James H. Bloem Director | |||
Date: | February 20, 2015 | By | /S/ JOHN F. DEPODESTA |
John F. DePodesta Director | |||
Date: | February 20, 2015 | By | /S/ ROBERT FISH |
Robert Fish Director | |||
Date: | February 20, 2015 | By | /S/ STEVEN FISHMAN |
Steven Fishman Chairman of the Board | |||
Date: | February 20, 2015 | By | /S/ ROBERT HARTMAN |
Robert Hartman Director | |||
Date: | February 20, 2015 | By | /S/ JOSHUA HAUSMAN |
Joshua Hausman Director | |||
Date: | February 20, 2015 | By | /S/ JAMES V. MCKEON |
James V. McKeon Director | |||
74
Date: | February 20, 2015 | By | /S/ DAVID REIS |
David Reis Director | |||
Date: | February 20, 2015 | By | /S/ GLENN SCHAFER |
Glenn Schafer Lead Independent Director | |||
Date: | February 20, 2015 | By | /S/ ARNOLD WHITMAN |
Arnold Whitman Director | |||
75
INDEX OF EXHIBITS
Number | Description |
2.1 | Asset Purchase Agreement, dated as of May 1, 2010 by and between Home and Hospice Care Investments, LLC and each of the other parties thereto (filed as Exhibit 2.1 to our Form 10-Q for the quarter ended March 31, 2010, and incorporated herein by reference). |
2.2 | Joinder Agreement and Amendment No. 1, dated as of May 21, 2010, to Asset Purchase Agreement by and between Home and Hospice Care Investments, LLC and each of the other parties thereto (filed as Exhibit 2.1 to our Current Report on Form 8-K dated May 26, 2010, and incorporated herein by reference). |
2.3 | Purchase and Contribution Agreement, dated as of August 18, 2014, by and between FC-GEN Operations Investment, LLC and Skilled Healthcare Group, Inc. (filed as Exhibit 2.1 to our Current Report on Form 8-K filed on August 18, 2014, and incorporated herein by reference). |
2.4 | Amendment No. 1 to Purchase and Contribution Agreement, dated as of January 5, 2015, by and between FC-GEN Operations Investment, LLC and Skilled Healthcare Group, Inc. (filed as Exhibit 2.1 to our Current Report on Form 8-K filed on January 9, 2015, and incorporated herein by reference). |
3.1 | Third Amended and Restated Certificate of Incorporation of Genesis Healthcare, Inc. (filed as Exhibit 3.1 to our Current Report on Form 8-K on February 6, 2015, and incorporated herein by reference). |
3.2 | Amended and Restated By-Laws of Genesis Healthcare, Inc. (filed as Exhibit 3.2 to our Current Report on Form 8-K filed on February 6, 2015, and incorporated herein by reference). |
4.1 | Amended and Restated Registration Rights Agreement, dated as of August 18, 2014, among Onex Holders (as defined therein), Greystone Holders (as defined therein) and Skilled Healthcare Group, Inc. (filed as Exhibit 10.1 to our Form 10-Q filed on November 3, 2014, and incorporated herein by reference). |
4.2 | Form of specimen certificate for Skilled Healthcare Group, Inc.'s Class A common stock (filed as Exhibit 4.1 to our Registration Statement on Form S-1/A, No. 333-137897, filed on April 27, 2007, and incorporated herein by reference). |
10.1 | Sixth Amended and Restated Limited Liability Company Operating Agreement of FC-GEN Operations Investment, LLC, dated as of February 2, 2015 (filed as Exhibit 10.1 to our Current Report on Form 8-K filed on February 6, 2015, and incorporated herein by reference). |
10.2 | Tax Receivable Agreement, dated as of February 2, 2015, by and among Genesis Healthcare, Inc. (f/k/a Skilled Healthcare Group, Inc.), FC-GEN Operations Investment, LLC and each of the Members (as defined therein) (filed as Exhibit 10.2 to our Current Report on Form 8-K filed on February 6, 2015, and incorporated herein by reference). |
10.3* | Skilled Healthcare Group, Inc. Restricted Stock Plan (filed as Exhibit 10.1 to our Registration Statement on Form S-1, No. 333-137897, filed on October 10, 2006, and incorporated herein by reference). |
10.4 | Lease, dated as of August 26, 2002, by and between CT Foothill 10/241, LLC, and Fountain View, Inc., and amendments thereto (filed as Exhibit 10.13 to our Registration Statement on Form S-1, No. 333-137897, filed on October 10, 2006, and incorporated herein by reference). |
10.5* | Form of Indemnification Agreement with Skilled Healthcare Group's directors, executive officers, and certain employees (filed as Exhibit 10.10 to our Registration Statement on Form S-1/A, No. 333-137897, filed on April 27, 2007, and incorporated herein by reference). |
10.6* | Amended and Restated Skilled Healthcare Group, Inc. 2007 Incentive Award Plan (filed as Appendix A to our Definitive Proxy Statement filed on March 25, 2013, and incorporated herein by reference). |
10.7* | Form of Restricted Stock Award Agreement (revised April 2010) (filed as Exhibit 10.2 to our Form 10-Q filed on May 4, 2010, and incorporated herein by reference). |
10.8* | Form of Restricted Stock Award Agreement (revised March 2014) (filed as Exhibit 10.1 to our Current Report on Form 8-K filed on March 28, 2014, and incorporated herein by reference). |
10.9 | Class Settlement Agreement and Release, dated as of September 7, 2010 (filed as Exhibit 10.1 to our Current Report on Form 8-K filed on September 8, 2010, and incorporated herein by reference). |
10.10 | Settlement Agreement and Release with The People of the State of California, by and through Intervenor, the Humboldt County District Attorney's Office, dated as of September 7, 2010 (filed as Exhibit 10.2 to our Current Report on Form 8-K filed on September 8, 2010, and incorporated herein by reference). |
76
10.11* | Employment Agreement, dated as of May 1, 2010, by and between Skilled Healthcare Group, Inc. and Douglas Shane Peck (filed as Exhibit 10.2 to our Quarterly Report on Form 10-Q, filed on August 5, 2010, and incorporated herein by reference). |
10.12 | Stipulation and Order (Case No. DR060264), Superior Court of California, Humboldt County, dated July 15, 2010 (filed as Exhibit 10.1 to our Current Report on Form 8-K filed on July 15, 2010 and incorporated herein by reference). |
10.13 | Lease Amendment, dated October 31, 2011, by and between FPOC, LLC and Skilled Healthcare Group, Inc. (filed as Exhibit 10.18 to our Annual Report on Form 10-K filed on February 13, 2012, and incorporated herein by reference). |
10.14 | Amendment and Restatement and Additional Term Loan Assumption Agreement, dated as of April 12, 2012, among us, the subsidiary guarantors listed on the signature pages thereto, the lenders listed on the signature pages thereto, Credit Suisse AG, as administrative agent for the lenders and as collateral agent for the lenders, and J.P. Morgan Securities LLC and Credit Suisse Securities (USA) LLC, as amendment arrangers, as set forth in the Fourth Amended and Restated Credit Agreement in Exhibit A to such Amendment and Restatement and Additional Term Loan Assumption Agreement (filed as Exhibit 10.1 to our Current Report on Form 8-K filed on April 12, 2012, and incorporated herein by reference). |
10.15 | Amendment No.1, dated as of June 6, 2013, to the Fourth Amended and Restated Credit Agreement, dated as of April 12, 2012, by and among Skilled Healthcare Group, Inc., certain subsidiary guarantors, Credit Suisse AG, as administrative agent and collateral agent, Credit Suisse Securities (USA) LLC, as amendment arranger, and certain lenders and other parties thereto. (Filed as Exhibit 10.1 to our Current Report on Form 8-K filed on June 6, 2013, and incorporated herein by reference). |
10.16 | Amendment No. 2 and Loan Modification Agreement, dated as of June 23, 2014, to the Fourth Amended and Restated Credit Agreement, dated as of April 12, 2012, by and among Skilled Healthcare Group, Inc., certain subsidiary guarantor, Credit Suisse AG, Cayman Islands Branch, as administrative agent, Credit Suisse Securities (USA) LLC, as amendment arranger, and certain lenders and other parties thereto (filed as Exhibit 10.01 to our Current Report on Form 8-K filed on June 27, 2014, and incorporated herein by reference). |
10.17 | Credit and Security Agreement, dated as of December 26, 2013, by and among certain affiliates of the Company, as borrowers, Midcap Financial, LLC, as agent and a lender, and the additional lenders from time to time party thereto (Revolving Loan) (filed as Exhibit 10.19 to our Annual Report on form 10-K filed on February 10, 2014, and incorporated herein by reference). |
10.18 | Credit and Security Agreement, dated as of December 26, 2013, by and among certain affiliates of the Company, as borrowers, Midcap Financial, LLC, as agent and a lender, and the additional lenders from time to time party thereto (Term Loan) (filed as Exhibit 10.20 to our Annual Report on Form 10-K filed on February 10, 2014, and incorporated herein by reference). |
10.19 | Form of Healthcare Facility Note with respect to HUD-insured loans (filed as Exhibit 10.1 to our Current Report on Form 8-K filed on September 24, 2013, and incorporated herein by reference). |
10.20* | Employment Agreement, by and between the Company, Skilled Healthcare, LLC and Robert H. Fish, dated November 20, 2013 (filed as Exhibit 10.3 to our Current Report on Form 8-K filed on November 25, 2013, and incorporated herein by reference). |
10.21* | Robert H. Fish Restricted Stock Award Agreement, dated November 20, 2013 (filed as Exhibit 10.4 to our Current Report on Form 8-K filed on November 25, 2013, and incorporated herein by reference). |
10.22* | Employment Agreement, dated as of April 10, 2014, with Paxton L. Wiffler (filed as Exhibit 10.1 to our Quarterly Report on Form 10-Q filed on August 11, 2014, and incorporated herein by reference). |
10.23* | Restricted Stock Agreement, dated as of May 8, 2014, with Paxton L. Wiffler (filed as Exhibit 10.2 to our Quarterly Report on Form 10-Q filed on August 11, 2014, and incorporated herein by reference). |
10.24* | Employment Agreement, dated as of December 9, 2010, with Laurie Thomas (filed as Exhibit 10.29 to our Annual Report on Form 10-K filed on February 10, 2014, and incorporated herein by reference). |
10.25* | Employment Transition Offer Letter, dated as of September 23, 2013, with Laurie Thomas (filed as Exhibit 10.30 to our Annual Report on Form 10-K filed on February 10, 2014, and incorporated herein by reference). |
10.26* | Form of Stock Option Agreement (filed as Exhibit 10.18 to our Annual Report on Form 10-K filed on February 11, 2013, and incorporated herein by reference). |
10.27* | Form of Restricted Stock Unit Agreement (filed as Exhibit 10.19 to our Annual Report on Form 10-K filed on February 11, 2013, and incorporated herein by reference). |
10.28* | Form of Restricted Stock Award Agreement (adopted February 2013) (filed as Exhibit 10.1 to our Quarterly Report on Form 10-Q filed on May 6, 2013, and incorporated herein by reference). |
10.29* | Employment Agreement, dated as of August 11, 2009, with Chris Felfe (filed as Exhibit 10.26 to our Annual Report on Form 10-K filed on February 10, 2014, and incorporated herein by reference). |
16.1 | Letter of Ernst & Young LLP dated February 19, 2015 (filed as Exhibit 16.1 to our Current Report on Form 8-K filed on February 19, 2015, and incorporated herein by reference). |
21 | Subsidiaries of the Registrant. |
77
23.1 | Consent of Independent Registered Public Accounting Firm. |
31.1 | Certification of Principal Executive Officer pursuant to Section 302 of the Sarbanes-Oxley Act of 2002. |
31.2 | Certification of Principal Financial Officer pursuant to Section 302 of the Sarbanes-Oxley Act of 2002. |
32** | Certification pursuant to 18 U.S.C. Section 1350, as adopted pursuant to Section 906 of the Sarbanes-Oxley Act of 2002. |
101** | Interactive data files (furnished electronically herewith pursuant to Rule 406T of Regulations S-T). |
________________
* | Management contract or compensatory plan or arrangement. |
** | Furnished herewith and not “filed” for purposes of Section 18 of the Securities Exchange Act of 1934, as amended. |
78
Report of Independent Registered Public Accounting Firm
The Board of Directors and Stockholders
Genesis Healthcare, Inc. (formerly Skilled Healthcare Group, Inc.)
We have audited the accompanying consolidated balance sheets of Skilled Healthcare Group, Inc. as of December 31, 2014 and 2013, and the related consolidated statements of income, comprehensive (loss) income, shareholders' equity and cash flows for each of the three years in the period ended December 31, 2014. Our audits also included the financial statement schedule listed in the Index at Item 15(a)(2). These financial statements and schedule are the responsibility of the Company's management. Our responsibility is to express an opinion on these financial statements and schedule based on our audits.
We conducted our audits in accordance with the standards of the Public Company Accounting Oversight Board (United States). Those standards require that we plan and perform the audit to obtain reasonable assurance about whether the financial statements are free of material misstatement. An audit includes examining, on a test basis, evidence supporting the amounts and disclosures in the financial statements. An audit also includes assessing the accounting principles used and significant estimates made by management, as well as evaluating the overall financial statement presentation. We believe that our audits provide a reasonable basis for our opinion.
In our opinion, the financial statements referred to above present fairly, in all material respects, the consolidated financial position of Skilled Healthcare Group, Inc. at December 31, 2014 and 2013, and the consolidated results of its operations and its cash flows for each of the three years in the period ended December 31, 2014, in conformity with U.S. generally accepted accounting principles. Also, in our opinion, the related financial statement schedule, when considered in relation to the basic financial statements taken as a whole, presents fairly in all material respects the information set forth therein.
We also have audited, in accordance with the standards of the Public Company Accounting Oversight Board (United States), Skilled Healthcare Group, Inc.’s internal control over financial reporting as of December 31, 2014, based on criteria established in Internal Control-Integrated Framework issued by the Committee of Sponsoring Organizations of the Treadway Commission (2013 framework) and our report dated February 20, 2015 expressed an unqualified opinion thereon.
/s/ Ernst & Young LLP
Irvine, California
February 20, 2015
F-1
Skilled Healthcare Group, Inc.
Consolidated Balance Sheets
(In thousands)
December 31, | |||||||
2014 | 2013 | ||||||
ASSETS | |||||||
Current assets: | |||||||
Cash and cash equivalents | $ | 3,629 | $ | 4,177 | |||
Accounts receivable, less allowance for doubtful accounts of $17,930 and $16,665 at December 31, 2014 and December 31, 2013, respectively | 124,103 | 107,215 | |||||
Deferred income taxes | 17,659 | 9,876 | |||||
Prepaid expenses | 5,689 | 8,961 | |||||
Other current assets | 10,303 | 12,188 | |||||
Total current assets | 161,383 | 142,417 | |||||
Property and equipment, less accumulated depreciation of $160,984 and $137,484 at December 31, 2014 and December 31, 2013, respectively | 331,130 | 341,822 | |||||
Leased facility assets, less accumulated depreciation of $4,904 and $4,432 at December 31, 2014 and December 31, 2013, respectively | 8,944 | 9,416 | |||||
Other assets: | |||||||
Notes receivable | 1,800 | 520 | |||||
Deferred financing costs, net | 7,318 | 9,189 | |||||
Goodwill | 68,833 | 69,065 | |||||
Intangible assets, less accumulated amortization of $4,957 and $4,640 at December 31, 2014 and December 31, 2013, respectively | 18,491 | 18,807 | |||||
Deferred income taxes | 3,232 | 9,472 | |||||
Other assets | 49,825 | 42,708 | |||||
Total other assets | 149,499 | 149,761 | |||||
Total assets | $ | 650,956 | $ | 643,416 | |||
LIABILITIES AND STOCKHOLDERS’ EQUITY | |||||||
Current liabilities: | |||||||
Accounts payable and accrued liabilities | $ | 65,349 | $ | 57,179 | |||
Employee compensation and benefits | 37,487 | 32,979 | |||||
Current portion of long-term debt | 12,456 | 7,630 | |||||
Total current liabilities | 115,292 | 97,788 | |||||
Long-term liabilities: | |||||||
Insurance liability risks | 29,356 | 29,534 | |||||
Other long-term liabilities | 12,660 | 12,367 | |||||
Long-term debt, less current portion | 398,389 | 411,495 | |||||
Total liabilities | 555,697 | 551,184 | |||||
Commitments and contingencies — Note 13 | |||||||
Stockholders’ equity: | |||||||
Class A common stock, 175,000 shares authorized, $0.001 par value per share; Issued and outstanding - 24,482 and 24,278 at December 31, 2014 and December 31, 2013, respectively | 24 | 24 | |||||
Class B common stock, 30,000 shares authorized, $0.001 par value per share; Issued and outstanding - 15,512 and 15,515 at December 31, 2014 and December 31, 2013, respectively | 16 | 16 | |||||
Additional paid-in-capital | 382,718 | 378,756 | |||||
Accumulated deficit | (287,499 | ) | (286,592 | ) | |||
Accumulated other comprehensive income | — | 28 | |||||
Total stockholders’ equity | 95,259 | 92,232 | |||||
Total liabilities and stockholders’ equity | $ | 650,956 | $ | 643,416 | |||
The accompanying notes are an integral part of these consolidated financial statements.
F-2
Skilled Healthcare Group, Inc.
Consolidated Statements of Operations
(In thousands, except per share data)
Year Ended December 31, | |||||||||||
2014 | 2013 | 2012 | |||||||||
Revenue: | |||||||||||
Net patient service revenue | $ | 830,055 | $ | 839,150 | $ | 854,839 | |||||
Leased facility revenue | 3,201 | 3,122 | 3,060 | ||||||||
833,256 | 842,272 | 857,899 | |||||||||
Expenses: | |||||||||||
Cost of services (exclusive of rent cost of revenue and depreciation and amortization shown below) | 714,864 | 731,870 | 716,506 | ||||||||
Rent cost of revenue | 20,000 | 18,828 | 17,941 | ||||||||
General and administrative | 39,989 | 26,619 | 24,249 | ||||||||
Governmental investigation expense | 6,000 | — | — | ||||||||
Depreciation and amortization | 24,322 | 23,771 | 23,641 | ||||||||
Change in fair value of contingent consideration | (576 | ) | (3,702 | ) | 817 | ||||||
Impairment of long-lived assets | 82 | 19,000 | — | ||||||||
Loss on disposal of assets | 75 | 361 | — | ||||||||
804,756 | 816,747 | 783,154 | |||||||||
Other (expenses) income: | |||||||||||
Interest expense | (31,977 | ) | (34,258 | ) | (37,760 | ) | |||||
Interest income | 737 | 335 | 512 | ||||||||
Other income (expense), net | 1 | 188 | (32 | ) | |||||||
Equity in earnings of joint venture | 1,427 | 1,949 | 1,948 | ||||||||
Debt modification/retirement costs | (843 | ) | (2,828 | ) | (4,126 | ) | |||||
Total other (expenses), net | (30,655 | ) | (34,614 | ) | (39,458 | ) | |||||
(Loss) income from continuing operations before (benefit) provision for income taxes | (2,155 | ) | (9,089 | ) | 35,287 | ||||||
(Benefit) provision for income taxes | (1,248 | ) | (2,905 | ) | 12,896 | ||||||
(Loss) income from continuing operations | (907 | ) | (6,184 | ) | 22,391 | ||||||
(Loss) from discontinued operations, net of tax | — | (4,300 | ) | (794 | ) | ||||||
Net (loss) income | $ | (907 | ) | $ | (10,484 | ) | $ | 21,597 | |||
(Loss) earnings per share, basic: | |||||||||||
(Loss) earnings per common share from continuing operations | $ | (0.02 | ) | $ | (0.17 | ) | $ | 0.60 | |||
(Loss) per common share from discontinued operations | — | (0.11 | ) | (0.02 | ) | ||||||
(Loss) income per share | $ | (0.02 | ) | $ | (0.28 | ) | $ | 0.58 | |||
(Loss) earnings per share, diluted: | |||||||||||
(Loss) earnings per common share from continuing operations | $ | (0.02 | ) | $ | (0.17 | ) | $ | 0.60 | |||
(Loss) per common share from discontinued operations | — | (0.11 | ) | (0.02 | ) | ||||||
(Loss) income per share | $ | (0.02 | ) | $ | (0.28 | ) | $ | 0.58 | |||
Weighted-average common shares outstanding, basic | 38,125 | 37,533 | 37,389 | ||||||||
Weighted-average common shares outstanding, diluted | 38,125 | 37,533 | 37,589 | ||||||||
The accompanying notes are an integral part of these consolidated financial statements.
F-3
Skilled Healthcare Group, Inc.
Consolidated Statements of Comprehensive (Loss) Income
(In thousands)
Year Ended December 31, | |||||||||||
2014 | 2013 | 2012 | |||||||||
Net (loss) income | $ | (907 | ) | $ | (10,484 | ) | $ | 21,597 | |||
Other comprehensive income (loss): | |||||||||||
Unrealized loss on interest rate swap net of income tax (benefit) of ($16) for the year ended December 31, 2012. | — | — | (26 | ) | |||||||
Unrealized (loss) gain on investment available for sale - net of income tax (benefit) expense of ($9) and $27 for the years ended December 31, 2013 and 2012 respectively. | — | (14 | ) | 42 | |||||||
Reclassification adjustments: | |||||||||||
Gain realized in net loss on investment available for sale - net of income tax expense of $17 for the year ended December 31, 2014. | (28 | ) | — | — | |||||||
Interest expense on interest rate swap - net of income tax expense of $107 and $219 for the years ended December 31, 2013 and 2012 respectively. | — | 169 | 347 | ||||||||
Other comprehensive (loss) income, net of tax | (28 | ) | 155 | 363 | |||||||
Comprehensive (loss) income | $ | (935 | ) | $ | (10,329 | ) | $ | 21,960 | |||
The accompanying notes are an integral part of these consolidated financial statements.
F-4
Skilled Healthcare Group, Inc.
Consolidated Statements of Stockholders’ Equity
(In thousands)
Class A Common Stock | Class B Common Stock | Additional Paid-In Capital | (Accumulated Deficit) | Accumulated Other Comprehensive (Loss) income | Total | ||||||||||||||||||||||||||
Shares | Amount | Shares | Amount | ||||||||||||||||||||||||||||
Balance at December 31, 2011 | 21,064 | 21 | 16,937 | 17 | 371,753 | (297,705 | ) | (490 | ) | 73,596 | |||||||||||||||||||||
Net income | — | — | — | — | — | 21,597 | — | 21,597 | |||||||||||||||||||||||
Conversion of class B common stock into class A common stock | 1,361 | 1 | (1,361 | ) | (1 | ) | — | — | — | — | |||||||||||||||||||||
Issuance of restricted stock | 600 | 1 | — | — | — | — | — | 1 | |||||||||||||||||||||||
Forfeiture of restricted stock | (23 | ) | — | — | — | — | — | — | — | ||||||||||||||||||||||
Stock-based compensation | — | — | — | — | 4,750 | — | — | 4,750 | |||||||||||||||||||||||
Restricted stock traded to pay tax | (35 | ) | — | — | — | (234 | ) | — | — | (234 | ) | ||||||||||||||||||||
Excess tax benefits from stock-based payment arrangements | — | — | — | — | (242 | ) | — | — | (242 | ) | |||||||||||||||||||||
Other comprehensive income, net of tax | — | — | — | — | — | — | 363 | 363 | |||||||||||||||||||||||
Balance at December 31, 2012 | 22,967 | 23 | 15,576 | 16 | 376,027 | (276,108 | ) | (127 | ) | 99,831 | |||||||||||||||||||||
Net loss | — | — | — | — | — | (10,484 | ) | — | (10,484 | ) | |||||||||||||||||||||
Conversion of class B common stock into class A common stock | 61 | — | (61 | ) | — | — | — | — | — | ||||||||||||||||||||||
Issuance of restricted stock | 1,688 | 1 | — | — | — | — | — | 1 | |||||||||||||||||||||||
Forfeiture of restricted stock | (376 | ) | — | — | — | — | — | — | — | ||||||||||||||||||||||
Restricted stock traded to pay tax | (62 | ) | — | — | — | (269 | ) | — | — | (269 | ) | ||||||||||||||||||||
Stock-based compensation | — | — | — | — | 2,998 | — | — | 2,998 | |||||||||||||||||||||||
Other comprehensive income, net of tax | — | — | — | — | — | — | 155 | 155 | |||||||||||||||||||||||
Balance at December 31, 2013 | 24,278 | $ | 24 | 15,515 | $ | 16 | $ | 378,756 | $ | (286,592 | ) | $ | 28 | $ | 92,232 | ||||||||||||||||
Net loss | — | — | — | — | — | (907 | ) | — | (907 | ) | |||||||||||||||||||||
Conversion of class B common stock into class A common stock | 3 | $ | — | (3 | ) | — | — | — | — | — | |||||||||||||||||||||
Issuance of restricted stock | 889 | 1 | — | — | — | — | — | 1 | |||||||||||||||||||||||
Forfeiture of restricted stock | (610 | ) | (1 | ) | — | — | — | — | — | (1 | ) | ||||||||||||||||||||
Other comprehensive income, net of tax | — | — | — | — | — | — | (28 | ) | (28 | ) | |||||||||||||||||||||
Restricted stock traded to pay tax | (292 | ) | — | — | — | (1,920 | ) | — | — | (1,920 | ) | ||||||||||||||||||||
Stock-based compensation | — | — | — | — | 4,269 | — | — | 4,269 | |||||||||||||||||||||||
Options exercised | 214 | — | — | — | 1,264 | — | — | 1,264 | |||||||||||||||||||||||
Excess tax benefits from stock-based payment arrangements | — | — | — | — | 349 | — | — | 349 | |||||||||||||||||||||||
Balance at December 31, 2014 | $ | 24,482 | 24 | $ | 15,512 | 16 | $ | 382,718 | $ | (287,499 | ) | $ | — | $ | 95,259 | ||||||||||||||||
The accompanying notes are an integral part of these consolidated financial statements.
F-5
Skilled Healthcare Group, Inc.
Consolidated Statements of Cash Flows
(In thousands)
Year Ended December 31, | |||||||||||
2014 | 2013 | 2012 | |||||||||
Cash Flows from Operating Activities | |||||||||||
Net (loss) income | $ | (907 | ) | $ | (10,484 | ) | $ | 21,597 | |||
Adjustments to reconcile net (loss) income to net cash provided by operating activities: | |||||||||||
Depreciation and amortization | 24,234 | 24,622 | 24,584 | ||||||||
Change in fair value of contingent consideration | (576 | ) | (3,702 | ) | 816 | ||||||
Provision for doubtful accounts | 14,125 | 14,396 | 7,409 | ||||||||
Non-cash stock-based compensation | 4,269 | 2,998 | 4,750 | ||||||||
Excess tax benefits from stock-based payment arrangements | (349 | ) | — | 242 | |||||||
Loss (gain) on disposal of property and equipment | 163 | 6,051 | (98 | ) | |||||||
Amortization of deferred financing costs | 3,268 | 2,870 | 2,813 | ||||||||
Deferred income taxes | (432 | ) | (529 | ) | 3,490 | ||||||
Amortization of discount on debt | 550 | 896 | 906 | ||||||||
Debt retirement costs | 843 | 2,828 | 4,126 | ||||||||
Impairment of long-lived assets | 82 | 19,000 | — | ||||||||
Changes in operating assets and liabilities: | |||||||||||
Accounts receivable | (33,803 | ) | (14,496 | ) | (15,293 | ) | |||||
Payments on notes receivable | 1,622 | 3,313 | 3,116 | ||||||||
Other current and non-current assets | 376 | (6,594 | ) | (1,952 | ) | ||||||
Accounts payable and accrued liabilities | 7,766 | 6,214 | (10,128 | ) | |||||||
Employee compensation and benefits | 2,330 | (7,812 | ) | 1,083 | |||||||
Insurance liability risks | 1,892 | 7,758 | (1,637 | ) | |||||||
Other long-term liabilities | 868 | 592 | (3,148 | ) | |||||||
Net cash provided by operating activities | 26,321 | 47,921 | 42,676 | ||||||||
Cash Flows from Investing Activities | |||||||||||
Additions to property and equipment | (12,981 | ) | (13,436 | ) | (19,522 | ) | |||||
Acquisitions | — | — | (1,053 | ) | |||||||
Proceeds from sale of property and equipment | — | 12,943 | 1,050 | ||||||||
Proceeds from sale of investments | 1,060 | — | — | ||||||||
Proceeds from the sale of home health agency | 30 | — | — | ||||||||
Proceeds from the sale of land | 66 | — | — | ||||||||
Net cash used in investing activities | (11,825 | ) | (493 | ) | (19,525 | ) | |||||
Cash Flows from Financing Activities | |||||||||||
Borrowings under line of credit | 298,500 | 363,582 | 307,000 | ||||||||
Repayments under line of credit | (301,392 | ) | (375,525 | ) | (272,000 | ) | |||||
Repayments of long-term debt | (9,606 | ) | (174,989 | ) | (165,423 | ) | |||||
Proceeds from issuance of long-term debt | — | 149,611 | 98,000 | ||||||||
Cash paid for financing costs | (2,239 | ) | (7,664 | ) | (4,266 | ) | |||||
Proceeds from exercise of stock options | 1,264 | — | — | ||||||||
Excess tax benefits from stock-based payment arrangements | 349 | — | (242 | ) | |||||||
Taxes paid related to net share settlement of equity awards | (1,920 | ) | (269 | ) | (234 | ) | |||||
Net cash used in financing activities | (15,044 | ) | (45,254 | ) | (37,165 | ) | |||||
(Decrease) increase in cash and cash equivalents | (548 | ) | 2,174 | (14,014 | ) | ||||||
Cash and cash equivalents at beginning of period | 4,177 | 2,003 | 16,017 | ||||||||
Cash and cash equivalents at end of period | $ | 3,629 | $ | 4,177 | $ | 2,003 | |||||
The accompanying notes are an integral part of these consolidated financial statements.
F-6
Year Ended December 31, | |||||||||||
2014 | 2013 | 2012 | |||||||||
Supplemental cash flow information | |||||||||||
Cash paid for: | |||||||||||
Interest expense | $ | 26,883 | $ | 29,082 | $ | 39,872 | |||||
Income taxes, net | $ | (1,866 | ) | $ | 184 | $ | 8,733 | ||||
Non-cash activities: | |||||||||||
Conversion of accounts receivable into notes receivable | $ | 2,782 | $ | — | $ | 359 | |||||
Insurance premium financed | $ | 3,668 | $ | 5,715 | $ | 4,628 | |||||
Liabilities issued as consideration for purchase of business | $ | — | $ | — | $ | 261 | |||||
The accompanying notes are an integral part of these consolidated financial statements.
F-7
SKILLED HEALTHCARE GROUP, INC.
NOTES TO CONSOLIDATED FINANCIAL STATEMENTS
1. Description of Business
Business
Skilled Healthcare Group, Inc. ("Skilled") is a holding company that owns subsidiaries that operate long-term care facilities and provide a wide range of post-acute care services, with a strategic emphasis on sub-acute specialty medical care. Skilled and its consolidated wholly-owned companies are collectively referred to as the "Company." As of December 31, 2014, the Company operated facilities in California, Iowa, Kansas, Missouri, Nevada, Nebraska, New Mexico and Texas, including 73 skilled nursing facilities ("SNFs"), which offer sub-acute care and rehabilitative and specialty healthcare skilled nursing care, and 22 assisted living facilities ("ALFs"), which provide room and board and assistance with activities of daily living. The Company leases five skilled nursing facilities in California to an unaffiliated third party operator. In addition, through its Hallmark Rehabilitation subsidiary ("Hallmark"), the Company provides a variety of rehabilitative services such as physical, occupational and speech therapy in Company-operated facilities and unaffiliated facilities. Furthermore, as of December 31, 2014, the Company provided hospice care and home health services in Arizona, California, Idaho, Montana, Nevada and New Mexico. The Company also provides private duty care services in Arizona, Idaho, Montana, and Nevada. The Company has an administrative services company that provides a full complement of administrative and consultative services that allows affiliated operators and third-party facility operators with whom the Company contracts to better focus on delivery of healthcare services. The Company currently has one such service agreement with an unrelated skilled nursing facility operator. The Company is also a member in a joint venture located in Texas that provides institutional pharmacy services, which currently serves eight of the Company's SNFs and other facilities unaffiliated with the Company.
Combination with FC-GEN
On February 2, 2015, Skilled completed the previously announced combination transaction (the "Combination") with FC-GEN Operations Investment, LLC ("FC-GEN"). The closing of the Combination transaction occurred on February 2, 2015. After completion of the transaction, the combined company operates under the name Genesis Healthcare, Inc. and the Class A common stock of Skilled continues to trade on the NYSE.
Company History
Skilled Healthcare Group, Inc. was incorporated as SHG Holding Solutions, Inc. in Delaware in October 2005. Our predecessor company acquired Summit Care Corporation, a publicly-traded long-term care company with nursing facilities in California, Texas and Arizona, in 1998. In October 2001, our predecessor and 19 of its subsidiaries filed voluntary petitions for protection under Chapter 11 of the U.S. Bankruptcy Code and in November 2001, our remaining three companies also filed voluntary petitions for protection under Chapter 11. In August 2003, we emerged from bankruptcy, paying or restructuring all debt holders in full, paying all accrued interest expenses and issuing 5.0% of our common stock to former bondholders.
In February 2007, we effected the merger of our predecessor company, which was our wholly-owned subsidiary, with and into us. We were the surviving company in the merger and changed our name from SHG Holding Solutions, Inc. to Skilled Healthcare Group, Inc. As a result of the merger, we assumed all of the rights and obligations of our predecessor company.
In June 2009, the United States Bankruptcy Court for the Central District of California granted entry of a final decree closing the aforementioned Chapter 11 cases.
The Onex Transaction
In October 2005, Skilled (known as SHG Holding Solutions, Inc. at that time) entered into an agreement and plan of merger (the "Agreement") with its predecessor company known then as Skilled Healthcare Group, Inc. ("SHG"), which was the entity that owned the subsidiaries that then operated Skilled's business, SHG Acquisition Corp. ("Acquisition") and SHG's former sponsor, Heritage Fund II LP and related investors ("Heritage"). Skilled and Acquisition were formed by Onex Partners LP, Onex American Holdings II LLC and Onex U.S. Principals LP ("Onex") and certain of their associates (collectively the "Sponsors") for purposes of acquiring SHG. The merger was completed effective December 27, 2005 (the "Onex Transaction"). Under the Agreement, Acquisition acquired substantially all of the outstanding shares of SHG through a merger with SHG, with SHG being the surviving corporation. The Company refers to the transactions contemplated by the merger agreement, the equity contributions, the financings and use of proceeds of the financings, collectively, as the Transactions.
2. Discontinued Operations
F-8
On December 1, 2013, the Company disposed of two skilled nursing facilities, one owned facility in Texas and one leased facility in California. In accordance with Financial Accounting Standards Board (“FASB”) Accounting Standards Update (“ASU”) Topic 205, “Presentation of Financial Statements,” and FASB ASC Topic 360, “Property, Plant and Equipment,” the results of operations of these facilities for all periods presented and the losses associated with the transaction have been classified as discontinued operations, net of tax, in the accompanying consolidated income statements as the operations have been eliminated from the Company’s ongoing operations.
A summary of the discontinued operations for the periods presented is as follows (in thousands):
Year Ended December 31, | |||||||||||
2014 | 2013 | 2012 | |||||||||
Net operating revenues | $ | — | $ | 13,699 | $ | 14,724 | |||||
Operating expenses | — | 15,026 | 15,976 | ||||||||
(Loss) from disposal of assets | — | (5,690 | ) | — | |||||||
(Loss) from discontinued operations | — | (7,017 | ) | (1,252 | ) | ||||||
Income tax (benefit) | — | (2,717 | ) | (458 | ) | ||||||
(Loss) from discontinued operations | $ | — | $ | (4,300 | ) | $ | (794 | ) | |||
3. Summary of Significant Accounting Policies
Basis of Presentation
The consolidated financial statements of the Company include the accounts of the Company and the Company's wholly-owned companies. All significant intercompany transactions have been eliminated in consolidation.
Estimates and Assumptions
The consolidated financial statements have been prepared in conformity with accounting principles generally accepted in the United States of America ("U.S. GAAP"), which requires the Company to consolidate company financial information and make informed estimates and assumptions that affect the reported amounts of assets and liabilities, disclosure of contingent assets and liabilities at the date of the financial statements and the reported amounts of revenue and expenses during the reporting period. The most significant estimates in the Company’s consolidated financial statements relate to revenue, allowance for doubtful accounts, self-insured liability risks, income taxes, valuation of contingent consideration and impairment of long-lived assets and goodwill. Actual results could differ from those estimates.
Revenue and Accounts Receivables
Revenue and accounts receivable are recorded on an accrual basis as services are performed at their estimated net realizable value. The Company derives a majority of its revenue from funds under federal Medicare and state Medicaid assistance programs, the continuation of which are dependent upon governmental policies and are subject to audit risk and potential recoupment.
The Company is participating in the recently established UPL supplemental payment program in the state of Texas that provides supplemental Medicaid payments for skilled nursing facilities that are licensed to non-state government entities such as county hospital districts. Company subsidiaries previously operating twenty Company-owned Texas skilled nursing facilities entered into transactions with such hospital districts providing for the transfer of the licenses for the twenty of the Company-owned Texas skilled nursing facilities to the hospital districts, and providing further for the Company’s operating subsidiaries to retain the management of those facilities on behalf of the hospital districts, which are all participating in the UPL program. Each affected Operating subsidiary therefore retains operations of its skilled nursing facility and each agreement between the hospital district and the Company subsidiary is terminable by either party to fully restore the prior license status.
Overall payments made by Medicare for hospice services are subject to an annual cap amount on a per hospice agency basis. Total Medicare payments received for services rendered during the applicable Medicare hospice cap year by each Medicare-certified agency during this period are compared to the cap amount for the relevant period. Payments in excess of the cap are subject to recoupment by Medicare. For the years ended December 31, 2014, 2013, and 2012, the Company recorded net hospice Medicare cap reserves of $2.7 million, $5.6 million, and $4.1 million, respectively, as adjustments to revenue. Of the $2.7 million of hospice cap reserves recorded in the year ended December 31, 2014, $0.3 million was related to 2013 cap
F-9
year and $2.4 million was related to the 2014 cap year. Of the $5.6 million of hospice cap reserves recorded in the year ended December 31, 2013, $0.2 million related to the 2011 cap year, $2.9 million was related to the 2012 cap year, and $2.5 million was related to the 2013 cap year. Of the $4.1 million of hospice cap reserves recorded in the year ended December 31, 2012, $1.9 million was related to the 2011 cap year, and $2.2 million was related to the 2012 cap year. These adjustments related to patients who transferred to or from the Company's hospice agencies and who received care from unaffiliated hospice agencies, as a result of which the hospice cap allowance is shared among those agencies.
The following table summarizes how the Company's revenue is derived from services provided to patients by payor classes (including leased facility revenue which is included within private pay and other) (dollars in thousands):
Year Ended December 31, | ||||||||||||||||||||
2014 | 2013 | 2012 | ||||||||||||||||||
Revenue Dollars | Revenue Percentage | Revenue Dollars | Revenue Percentage | Revenue Dollars | Revenue Percentage | |||||||||||||||
Medicare | $ | 236,833 | 28.4 | % | $ | 260,131 | 30.9 | % | $ | 287,918 | 33.6 | % | ||||||||
Medicaid | 283,674 | 34.1 | 266,450 | 31.6 | 260,872 | 30.4 | ||||||||||||||
Subtotal Medicare and Medicaid | 520,507 | 62.5 | 526,581 | 62.5 | 548,790 | 64.0 | ||||||||||||||
Managed Care | 117,644 | 14.1 | 107,115 | 12.7 | 96,592 | 11.3 | ||||||||||||||
Private pay and other | 195,105 | 23.4 | 208,576 | 24.8 | 212,517 | 24.7 | ||||||||||||||
Total | $ | 833,256 | 100.0 | % | $ | 842,272 | 100.0 | % | $ | 857,899 | 100.0 | % | ||||||||
The following table sets forth revenue by state and revenue by state as a percentage of total revenue for the periods (dollars in thousands):
Year Ended December 31, | ||||||||||||||||||||
2014 | 2013 | 2012 | ||||||||||||||||||
Revenue Dollars | Percentage of Revenue | Revenue Dollars | Percentage of Revenue | Revenue Dollars | Percentage of Revenue | |||||||||||||||
California | $ | 335,325 | 40.2 | % | $ | 343,948 | 40.8 | % | $ | 342,398 | 39.9 | % | ||||||||
Texas | 168,623 | 20.2 | 164,369 | 19.5 | 172,215 | 20.1 | ||||||||||||||
New Mexico | 100,189 | 12.0 | 98,901 | 11.7 | 99,439 | 11.6 | ||||||||||||||
Kansas | 63,690 | 7.7 | 60,848 | 7.2 | 61,662 | 7.2 | ||||||||||||||
Nevada | 54,467 | 6.6 | 59,410 | 7.1 | 62,916 | 7.3 | ||||||||||||||
Missouri | 61,615 | 7.4 | 58,644 | 7.0 | 59,743 | 7.0 | ||||||||||||||
Montana | 13,470 | 1.6 | 14,220 | 1.7 | 15,665 | 1.8 | ||||||||||||||
Arizona | 9,156 | 1.1 | 14,053 | 1.7 | 14,618 | 1.7 | ||||||||||||||
Idaho | 9,571 | 1.1 | 10,603 | 1.3 | 10,300 | 1.2 | ||||||||||||||
Iowa | 10,075 | 1.2 | 9,556 | 1.1 | 10,598 | 1.2 | ||||||||||||||
Nebraska | 7,075 | 0.9 | 6,246 | 0.7 | 4,721 | 0.6 | ||||||||||||||
Indiana | — | — | 1,474 | 0.2 | 3,624 | 0.4 | ||||||||||||||
Total | $ | 833,256 | 100.0 | % | $ | 842,272 | 100.0 | % | $ | 857,899 | 100.0 | % | ||||||||
The Company's accounts receivable is derived from services provided to patients in the following payor classes for the years ended December 31 (in thousands):
Year Ended December 31, | |||||||
2014 | 2013 | ||||||
Medicare | $ | 25,014 | $ | 30,063 | |||
Medicaid | 43,334 | 28,153 | |||||
Subtotal Medicare and Medicaid | 68,348 | 58,216 | |||||
Managed care | 33,027 | 24,874 | |||||
Private pay and other | 40,658 | 40,790 | |||||
Total accounts receivable | 142,033 | 123,880 | |||||
Allowance for doubtful accounts | (17,930 | ) | (16,665 | ) | |||
Accounts receivable, net | $ | 124,103 | $ | 107,215 | |||
F-10
The Company estimates bad debt expense and the allowance for doubtful accounts based on historical experience.
As of December 31, 2014, notes receivable were approximately $3.2 million compared to $2.0 million as of December 31, 2013, of which $1.5 million and $1.5 million as of December 31, 2014 and 2013, respectively, were reflected as current assets with the remaining balances reflected as long-term assets. Interest rates on these notes approximate market rates as of the dates of the notes.
As of December 31, 2014 and December 31, 2013, two Hallmark Rehabilitation business customers owed $3.2 million, or 100.0% and $2.0 million or 100.0% of the total notes receivable balance respectively. These notes receivable, as well as the trade receivables from these two customers are guaranteed both by the assets of the customers as well as personally by the principal owners of the customers. Additionally, these two customers represented 35.5% and 50.7% of the net accounts receivable for the Company’s rehabilitation therapy services company as of December 31, 2014 and December 31, 2013 respectively. Additionally, these two customers accounted for approximately 42.1%, 41.0% and 41.6% of the rehabilitation therapy services company external revenue for the years ended 2014, 2013, and 2012 respectively. There are no past due accounts receivable that were converted to notes receivable. The notes receivable balance is stated net of an allowance for uncollectibility of approximately zero at December 31, 2014 and zero at December 31, 2013.
Risks and Uncertainties
Laws and regulations governing the Medicare and Medicaid programs are complex and subject to interpretation. The Company believes that it is in substantial compliance with applicable laws and regulations. Compliance with such laws and regulations is subject to ongoing and future government review and interpretation, including processing claims at lower amounts upon audit as well as significant regulatory action including revenue adjustments, fines, penalties, and exclusion from the Medicare and Medicaid programs.
Concentration of Credit Risk
The Company has significant accounts receivable balances whose collectability is dependent on the availability of funds from certain governmental programs, primarily Medicare and Medicaid. These receivables represent the only significant concentration of credit risk for the Company. The Company does not believe there is significant credit risk associated with these governmental programs. The Company believes that an adequate allowance has been recorded for the possibility of these receivables proving uncollectible, and continually monitors and adjusts these allowances as necessary.
Cash and Cash Equivalents
Cash and cash equivalents consist of cash and short-term investments with original maturities of three months or less. At December 31, 2014, the Company had aggregate cash of $3.6 million. This available cash is held in accounts at commercial banking institutions. The Company has periodically invested in AAA money market funds. To date, the Company has not experienced any loss or restricted access to its invested cash or cash equivalents; however, the Company can provide no assurances that access to its invested cash or cash equivalents will not be impacted by adverse conditions in the financial markets.
Property and Equipment
Upon the consummation of the Onex Transaction all property and equipment were stated at fair value. Property and equipment acquired subsequent to the Onex Transaction were recorded at cost or at fair value if acquired as part of a business combination. Major renovations or improvements are capitalized, whereas ordinary maintenance and repairs are expensed as incurred. Depreciation and amortization is computed using the straight-line method over the estimated useful lives of the assets as follows:
Buildings and improvements | 15-40 years | |
Leasehold improvements | Shorter of the lease term or estimated useful life, generally 5-10 years | |
Furniture and equipment | 3-10 years | |
Depreciation and amortization of property and equipment under capital leases is included in depreciation and amortization expense. For leasehold improvements, where the Company has acquired the right of first refusal to purchase or to renew the lease, amortization is based on the lesser of the estimated useful lives or the period covered by the right. Depreciation expense was $24.3 million in 2014, $23.8 million in 2013, and $23.6 million in 2012.
F-11
Goodwill and Long-Lived Assets
Goodwill represents the excess of the purchase price over the fair value of identifiable net assets acquired in business combinations accounted for as purchases. Goodwill is subject to periodic testing for impairment. Goodwill of a reporting unit is tested for impairment on an annual basis, or, if an event occurs or circumstances change that would reduce the fair value of a reporting unit below its carrying amount, between annual testing. The Company has selected October 1 as the date to test goodwill for impairment on an annual basis. The Company periodically evaluates the carrying value of long-lived assets other than goodwill, primarily consisting of our investments in real estate, for impairment indicators. If indicators of impairment are present, the carrying value of the related real estate investments in relation to the future discounted cash flows of the underlying operations is evaluated to assess recoverability of the assets. Measurement of the amount of the impairment, if any, may be based on independent appraisals, established market values of comparable assets or estimates of future cash flows expected. The estimates of these future cash flows are based on assumptions and projections believed by management to be reasonable and supportable. They require management's subjective judgments and take into account assumptions about revenue and expense growth rates. These assumptions may vary by type of long-lived asset.
Goodwill and Long-Lived Asset Impairment Testing
As of December 31, 2014, goodwill in the amount of $68.8 million was recorded on the Company's consolidated balance sheet, of which $9.7 million related to the rehabilitation therapy unit, $53.6 million related to the hospice reporting unit and $5.5 million related to the home health reporting unit.
The Company did not record a goodwill impairment or an impairment of long-lived assets charge in 2014.
As of December 31, 2013, goodwill in the amount of $69.1 million was recorded on the Company's consolidated balance sheet, of which $9.7 million related to the rehabilitation therapy unit, $53.7 million related to the hospice reporting unit and $5.7 million related to the home health reporting unit.
As of September 30, 2013, the Company determined the fair value of the long-term care, therapy services and hospice and home health services reporting units for goodwill and intangible assets based upon a combination of the discounted cash flow (income approach) and guideline public company method (market approach). After the fair value was determined and compared to the carrying value of each reporting entity, the Company concluded that the carrying value of the home health care services reporting unit exceeded its fair value and step two of the analysis was performed. The fair value of the long-term care, therapy services, and hospice reporting units exceeded their carrying value.
Upon completion of step two, the Company recorded a goodwill impairment charge as of and for the twelve months ended December 31, 2013 of $16.5 million with respect to the home health services reporting unit as the carrying value of goodwill exceeded its implied fair value. This amount is included within the caption "Impairment of long-lived assets" in the accompanying statement of operations. Additionally, after evaluating its long-lived assets, an impairment charge of $2.5 million was recognized within the home health services reporting unit related to the home health licenses and is included within the caption "Impairment of long-lived assets" in the accompanying statement of operations for the year ended December 31, 2013.
Deferred Financing Costs
Deferred financing costs substantially relate to the senior secured credit facility agreement, the HUD insured loans, and the mortgage loans see Note 7 - "Debt," and are being amortized over the maturity periods using an effective-interest method for the term debt component of the senior secured credit facility. At December 31, 2014, deferred financing costs, net of amortization, was $7.3 million, and was $9.2 million at December 31, 2013.
Income Taxes
The Company uses the liability method of accounting for income taxes as set forth in FASB ASC Topic 740, "Income Taxes." Under the liability method, deferred taxes are determined based on the differences between the financial statement and tax bases of assets and liabilities using currently enacted tax rates. A valuation allowance is established for deferred tax assets unless their realization is considered more likely than not. When the company establishes or reduces the valuation allowance against its deferred tax assets, its provision for income taxes will increase or decrease, respectively, in the period such determination is made.
In accordance with the relevant accounting standards, the Company applies a recognition threshold and measurement attribute of more likely than not for the financial statement recognition and measurement of a tax position taken or expected to be taken in a tax return and also provides guidance on de-recognition, classification, interest and penalties, accounting in interim periods, disclosure and transition.
Interest Rate Hedges
F-12
The Company's senior secured credit facility agreement exposes the Company to variability in interest payments due to changes in interest rates. The Company entered into an interest rate swap agreement on June 30, 2010 in order to manage fluctuations in cash flows resulting from interest rate risk. The interest rate swap agreement was for a notional amount of $70.0 million with an interest rate of 2.3% from January 2012 to June 2013.
Interests in joint ventures
Joint ventures are entities over which the Company has significant influence but not control, generally achieved by a shareholding of at least 20% of the voting rights. The equity method is used to account for investments in joint ventures and investments are initially recognized at cost.
Stock Options and Equity Related Charges
The Company measures and recognizes expense for all share-based payment awards made to employees and directors. The fair value of share-based payment awards is estimated at grant date using an option pricing model and the portion that is ultimately expected to vest is recognized as compensation cost over the requisite service period. Share-based compensation expense included in the accompanying statements of operations has not been retroactively adjusted to reflect the vesting of shares upon closing of the Combination.
Asset Retirement Obligations
A liability is recognized for the fair value of a legal obligation to perform asset-retirement activities that are conditioned on the occurrence of a future event if the amount can be reasonably estimated, or where it cannot, disclosure that such a liability exists, but has not been recognized, and the reasons why a reasonable estimate cannot be made.
The Company determined that a conditional asset retirement obligation exists for asbestos remediation. Though not a current health hazard in its facilities, upon renovation the Company may be required to take the appropriate remediation procedures in compliance with state law to remove the asbestos. The removal of asbestos-containing materials includes primarily floor and ceiling tiles from the Company’s pre-1980 constructed facilities. The fair value of the conditional asset retirement obligation was determined as the present value of the estimated future cost of remediation based on an estimated expected date of remediation. This computation is based on a number of assumptions which may change in the future based on the availability of new information, technology changes, changes in costs of remediation, and other factors. Any change in the assumptions can impact the value of the determined liability and will be recognized as a change in estimate in the period identified.
As of December 31, 2014 and 2013, the asset retirement obligations were $4.4 million and $4.3 million, respectively, which are classified as other long-term liabilities.
Operating Leases
As of December 31, 2014, 23 of the Company's 95 long-term care facilities that it operates were leased. The leases require payment of real estate taxes, insurance and common area maintenance in addition to rent. Most of the leases contain renewal options and rent escalation clauses.
For leases that contain predetermined fixed escalations of the minimum rent, the Company recognizes the related rent expense on a straight-line basis from the date the Company takes possession of the property to the expected end of the lease term. The Company records any difference between the straight-line rent amounts and amounts payable under the leases as part of deferred rent, in accrued liabilities or other long-term liabilities, as appropriate.
(Loss) Income per Share
The Company computes (loss) income per share of Class A common stock and Class B common stock using the two-class method. The Company’s Class A common stock and Class B common stock are identical in all respects, except with respect to voting rights and except that each share of Class B common stock is convertible into one share of Class A common stock under certain circumstances. Net (loss) income is allocated on a proportionate basis to each class of common stock in the determination of loss per share.
Basic (loss) income per share was computed by dividing net loss by the weighted-average number of outstanding shares for the period.
The following table sets forth the computation of basic and diluted (loss) income per share of Class A common stock and Class B common stock (dollars in thousands, except per share data):
F-13
December 31, 2014 | December 31, 2013 | December 31, 2012 | |||||||||||||||||||||||||||||||||
Class A | Class B | Total | Class A | Class B | Total | Class A | Class B | Total | |||||||||||||||||||||||||||
(Loss) income per share, basic | |||||||||||||||||||||||||||||||||||
Numerator: | |||||||||||||||||||||||||||||||||||
Allocation of net (loss) income from continuing operations | $ | (538 | ) | $ | (369 | ) | $ | (907 | ) | $ | (3,621 | ) | $ | (2,563 | ) | $ | (6,184 | ) | $ | 12,663 | $ | 9,728 | $ | 22,391 | |||||||||||
Allocation of net (loss) from discontinued operations | — | — | — | (2,519 | ) | (1,781 | ) | (4,300 | ) | (449 | ) | (345 | ) | (794 | ) | ||||||||||||||||||||
Allocation of net (loss) income | $ | (538 | ) | $ | (369 | ) | $ | (907 | ) | $ | (6,140 | ) | $ | (4,344 | ) | $ | (10,484 | ) | $ | 12,214 | $ | 9,383 | $ | 21,597 | |||||||||||
(Loss) income per share, diluted | |||||||||||||||||||||||||||||||||||
Numerator: | |||||||||||||||||||||||||||||||||||
Allocation of net (loss) income from continuing operations | $ | (538 | ) | $ | (369 | ) | $ | (907 | ) | $ | (3,621 | ) | $ | (2,563 | ) | $ | (6,184 | ) | $ | 12,714 | $ | 9,677 | $ | 22,391 | |||||||||||
Allocation of net (loss) from discontinued operations | — | — | — | (2,519 | ) | (1,781 | ) | (4,300 | ) | (450 | ) | (344 | ) | (794 | ) | ||||||||||||||||||||
Allocation of net (loss) income | $ | (538 | ) | $ | (369 | ) | $ | (907 | ) | $ | (6,140 | ) | $ | (4,344 | ) | $ | (10,484 | ) | $ | 12,264 | $ | 9,333 | $ | 21,597 | |||||||||||
Denominator for basic and diluted (loss) income per share: | |||||||||||||||||||||||||||||||||||
Weighted-average common shares outstanding, basic | 22,612 | 15,513 | 38,125 | 21,981 | 15,552 | 37,533 | 21,145 | 16,244 | 37,389 | ||||||||||||||||||||||||||
Plus: incremental shares related to dilutive effect of stock options and restricted stock, if applicable | — | — | — | — | — | — | 200 | — | 200 | ||||||||||||||||||||||||||
Adjusted weighted-average common shares outstanding, diluted | 22,612 | 15,513 | 38,125 | 21,981 | 15,552 | 37,533 | 21,345 | 16,244 | 37,589 | ||||||||||||||||||||||||||
(Loss) income per share, basic: | |||||||||||||||||||||||||||||||||||
(Loss) earnings per share from continuing operations | $ | (0.02 | ) | $ | (0.02 | ) | $ | (0.02 | ) | $ | (0.17 | ) | $ | (0.17 | ) | $ | (0.17 | ) | $ | 0.60 | $ | 0.60 | $ | 0.60 | |||||||||||
(Loss) per share from discontinued operations | — | — | — | (0.11 | ) | (0.11 | ) | (0.11 | ) | (0.02 | ) | (0.02 | ) | (0.02 | ) | ||||||||||||||||||||
(Loss) income per common share | $ | (0.02 | ) | $ | (0.02 | ) | $ | (0.02 | ) | $ | (0.28 | ) | $ | (0.28 | ) | $ | (0.28 | ) | $ | 0.58 | $ | 0.58 | $ | 0.58 | |||||||||||
(Loss) income per share, diluted: | |||||||||||||||||||||||||||||||||||
(Loss) earnings per share from continuing operations | $ | (0.02 | ) | $ | (0.02 | ) | $ | (0.02 | ) | $ | (0.17 | ) | $ | (0.17 | ) | $ | (0.17 | ) | $ | 0.60 | $ | 0.60 | $ | 0.60 | |||||||||||
(Loss) per share from discontinued operations | — | — | — | (0.11 | ) | (0.11 | ) | (0.11 | ) | (0.02 | ) | (0.02 | ) | (0.02 | ) | ||||||||||||||||||||
(Loss) income per common share | $ | (0.02 | ) | $ | (0.02 | ) | $ | (0.02 | ) | $ | (0.28 | ) | $ | (0.28 | ) | $ | (0.28 | ) | $ | 0.58 | $ | 0.58 | $ | 0.58 | |||||||||||
The following were excluded from the weighted-average diluted shares computation for 2014, 2013, and 2012 (shares in thousands) because the effect would be anti-dilutive:
Year Ended December 31, | ||||||||
2014 | 2013 | 2012 | ||||||
Options to purchase common shares | 288 | 717 | 472 | |||||
Non-vested restricted stock and restricted stock units | 741 | 527 | 325 | |||||
Total excluded | 1,029 | 1,244 | 797 | |||||
Accumulated Other Comprehensive (Loss) Income
Accumulated other comprehensive (loss) income consists of other comprehensive (loss) income. Other comprehensive (loss) income refers to gains and losses that, under U.S. GAAP, are recorded as an element of stockholders’ equity but are excluded from net loss. For the year ended December 31, 2014, the Company’s other comprehensive (loss) income consisted of a reclassification adjustment upon realization in the statement of operations of gains on available for sale securities that were previously included in accumulated other comprehensive income.
Recent Accounting Pronouncements
In April 2014, the FASB issued ASU No. 2014-08, Reporting Discontinued Operations and Disclosures of Disposals of Components of an Entity, ("ASU 2014-08"). This ASU requires an entity to report disposed components or components held-
F-14
for-sale in discontinued operations if such components represent a strategic shift that has or will have a significant effect on operations and financial results. Additionally, expanded disclosure about discontinued operations and disposals of significant components that do not qualify for discontinued operations presentation will be required. The adoption of ASU 2014-08 is effective prospectively for disposals that occur within annual periods beginning on or after December 15, 2014, with early adoption permitted. The Company is currently evaluating the impact of the ASU on its consolidated financial statements.
In May 2014, the FASB issued ASU No. 2014-09, Revenue from Contracts with Customers, ("ASU 2014-08"). This ASU requires an entity to recognize revenue to depict the transfer of promised goods or services to customers in an amount that reflects the consideration to which the entity expects to be entitled in exchange for those goods or services. To achieve this core principle, the guidance provides that an entity should apply the following steps: (1) identify the contract(s) with a customer; (2) identify the performance obligations in the contract; (3) determine the transaction price; (4) allocate the transaction price to the performance obligations in the contract; and (5) recognize revenue when, or as, the entity satisfies a performance obligation. The ASU is effective beginning in the first quarter of our fiscal year 2017. Early adoption is not permitted. The Company is currently evaluating the impact to the consolidated financial statements.
4. Fair Value Measurements
The following methods and assumptions were used by the Company in estimating fair value of each class of financial instruments for which it is practicable to estimate this value:
Cash and Cash Equivalents
The carrying amounts approximate fair value because of the short maturity of these instruments.
Available for Sale Securities, Trading Securities, and Contingent Consideration
Fair value measurements are based on a three-tier hierarchy that prioritizes the inputs used to measure fair value. These tiers include: Level 1, defined as observable inputs such as quoted prices in active markets; Level 2, defined as inputs other than quoted prices in active markets that are either directly or indirectly observable; and Level 3, defined as unobservable inputs for which little or no market data exists, therefore requiring an entity to develop its own assumptions. The following table summarizes the valuation of the Company’s available for sale securities, trading securities, and contingent consideration as of December 31, 2014 and 2013 fair value hierarchy (dollars in thousands):
December 31, | |||||||||||||||||||||||
2014 | 2013 | ||||||||||||||||||||||
Level 1 | Level 2 | Level 3 | Level 1 | Level 2 | Level 3 | ||||||||||||||||||
Available for sale securities | $ | — | $ | — | $ | — | $ | — | $ | 1,046 | $ | — | |||||||||||
Trading securities | $ | — | $ | 9,350 | $ | — | $ | — | $ | — | $ | — | |||||||||||
Contingent consideration – acquisitions | $ | — | $ | — | $ | 360 | $ | — | $ | — | $ | 1,736 | |||||||||||
Trading Securities
The Company's wholly owned offshore captive insurance company is required by regulatory agencies to set aside assets to comply with the laws of the jurisdiction in which it operates. These assets consist of restricted cash and trading securities, which are included in restricted assets in the Company's consolidated December 31, 2014 balance sheet.
Available for Sale Securities
As of December 31, 2013 the Company's available for sale securities are U.S. government securities with an amortized cost basis and aggregate fair value of $1.0 million and $1.0 million, respectively. Net unrealized gains included in other comprehensive (loss) income on the Company's available for sale securities totaled $0.1 million as of December 31, 2013.
Contingent Consideration
On October 24, 2011, wholly-owned subsidiaries of the Company acquired substantially all of the assets of Cornerstone Hospice, Inc. ("Cornerstone"). The acquisition includes contingent earn-out consideration that can be earned based on the acquired business's achievement of an EBITDA threshold. The contingent consideration is up to $1.5 million over a period of 5 years following the closing. The fair value of the contingent consideration was estimated using a probability-weighted discounted cash flow model. As this fair value measurement is based upon the financial forecast of the combined acquired entities, which input is not observable in the market, it represents a Level 3 measurement. The fair value of the earn-out at December 31, 2013 was $1.1 million and at December 31, 2014 was $0.4 million which reflects a $0.8 million payment to the
F-15
seller, a value adjustment due to Cornerstone not achieving their 2014 earn out of $0.5 million, and an adjustment of $0.1 million due to reductions in forecasted EBITDA, which reduced the likelihood of the business achieving their EBITDA target necessary for the earn-out to be paid in future period..
As discussed above, EBITDA is the basis for calculating the contingent consideration. The unobservable inputs to the determination of the fair value of the contingent consideration include assumptions as to the ability of the acquired businesses to meet their EBITDA targets and discount rates used in the calculation. Should the actual EBITDA generated by the acquired businesses increase or decrease as compared to our assumptions, the fair value of the contingent consideration obligations would increase or decrease, up to the contracted limit, as applicable. As the timing of contingent payments goes further into the future, discount rate assumptions increase due to the increased uncertainty of the EBITDA that may be generated in those periods.
The Company's assumptions range from the acquired businesses achieving none, a portion, or all of the consideration, and discount rates range from 4%- 7%.
Below is a table listing the Level 3 rollforward as of December 31, 2014 (in thousands):
Level 3 Rollforward | |||
Value at January 1, 2014 | $ | 1,736 | |
Change in fair value | (576 | ) | |
Payout | (800 | ) | |
Value at December 31, 2014 | $ | 360 | |
Below is a table listing the amount of gain (loss) reclassified from accumulated OCI into income (effective portion) for the year ending December 31, 2014, 2013, and 2012 (in thousands):
Location of Gain (Loss) Reclassified from Accumulated OCI into Income (Effective Portion) | Amount of Gain (Loss) Reclassified from Accumulated OCI into Income (Effective Portion) | ||||||||||
Year Ended December 31, | |||||||||||
2014 | 2013 | 2012 | |||||||||
Gain realized in net loss on investment available for sale, net of income tax | $ | (28 | ) | $ | — | $ | — | ||||
Interest expense | $ | — | $ | 169 | $ | 347 | |||||
Long-Term Debt
At December 31, 2014, the aggregate fair value of the Company's term loan due 2016, the revolving credit facility due 2015, the HUD insured loans due in 2043 and 2048, the mortgage term loan due 2016, and the asset based revolving credit facility due 2016, using the Level 2 inputs, approximated the carrying value. The carrying value of the debt at December 31, 2014 was $410.8 million. Fair value was estimated based on current yield rates plus the Company's estimated credit spread available for loan products with similar terms and maturities.
5. Intangible Assets
Identified intangible assets are amortized over their useful lives except for trade names and certain other long-lived intangibles, which have an indefinite life. As described in Note 3, "Summary of Significant Accounting Policies," the Company recorded an impairment charge of $2.5 million for the year ended December 31, 2013 within the home health services reporting unit related to the home health licenses which is included within the caption "Impairment of long-lived assets" in the accompanying statement of operations.
Amortization expense was approximately $0.3 million in 2014, $0.3 million in 2013 and $0.4 million in 2012. Amortization of the Company’s intangible assets at December 31, 2014 is expected to be approximately $0.3 million in 2015, $0.3 million in 2016, and zero in 2017 and thereafter. Identified intangible asset balances by major class at December 31, 2014 and 2013, are as follows (dollars in thousands):
F-16
Cost | Life (in years) | Accumulated Amortization | Net Balance | ||||||||||
Intangible assets subject to amortization: | |||||||||||||
Covenants not-to-compete | $ | 520 | 5 | $ | (451 | ) | $ | 69 | |||||
Leasehold interests | 5,050 | 7-29 | (4,506 | ) | 544 | ||||||||
Total | $ | 5,570 | $ | (4,957 | ) | $ | 613 | ||||||
Intangible assets not subject to amortization: | |||||||||||||
Trade names | $ | 14,130 | |||||||||||
Other long-lived intangibles substantially related to operating licenses | 3,748 | ||||||||||||
Balance at December 31, 2014 | $ | 18,491 | |||||||||||
Cost | Life (in years) | Accumulated Amortization | Net Balance | ||||||||||
Intangible assets subject to amortization: | |||||||||||||
Covenants not-to-compete | $ | 520 | 5 | $ | (399 | ) | $ | 121 | |||||
Leasehold interests | 5,050 | 7-29 | (4,241 | ) | 809 | ||||||||
Total | $ | 5,570 | $ | (4,640 | ) | $ | 930 | ||||||
Intangible assets not subject to amortization: | |||||||||||||
Trade names | $ | 14,130 | |||||||||||
Other long-lived intangibles substantially related to operating licenses | 3,748 | ||||||||||||
Balance at December 31, 2013 | $ | 18,807 | |||||||||||
6. Business Segments
The Company has three reportable operating segments: (i) long-term care services ("LTC"), which includes the operation of SNFs and ALFs which is the most significant portion of the Company's business, the Company's administrative services provided to an unrelated SNF operator, and the facility lease revenue from a third-party operator; (ii) the Company's rehabilitation therapy services business; and (iii) the Company's hospice and home health businesses. The "other" column in the table below includes general and administrative items. The Company's reportable segments are business units that offer different services, and that are managed differently due to the nature of the services provided.
At December 31, 2014, LTC services included 73 wholly-owned SNF operating companies that offer post-acute, rehabilitative custodial and specialty skilled nursing care, as well as 22 wholly-owned ALF operating companies that provide room and board and social services. Therapy services included rehabilitative services such as physical, occupational and speech therapy provided in the Company's facilities and in unaffiliated facilities. Hospice and home health services were provided by the Company's wholly owned subsidiaries to patients.
The Company evaluates performance and allocates capital resources to each segment based on an operating model that is designed to maximize the quality of care provided and profitability. Accordingly, earnings from operations before net interest, tax, depreciation and amortization, non-core expenses ("Adjusted EBITDA") and rent cost of revenue ("Adjusted EBITDAR") is used as the primary measure of each segment’s operating results because it does not include such costs as interest expense, income taxes, depreciation, amortization and rent cost of revenue which may vary from segment to segment depending upon various factors, including the method used to finance the original purchase of assets within a segment or the tax law of the states in which a segment operates. By excluding these items, the Company is better able to evaluate operating performance of the segment by focusing on more controllable measures. Adjusted EBITDA and Adjusted EBITDAR are non‑GAAP financial measures. For a full discussion of the definitions of these terms and the reasons why the Company utilizes such measures, see Item 2, Management's Discussion and Analysis of Financial Condition and Results of Operations, of this filing. General and administrative expenses are not allocated to any segment for purposes of determining segment profit or loss, and are included in the "other" category in the selected segment financial data that follows. The accounting policies of the reporting segments are the same as those described in Note 3, "Summary of Significant Accounting Policies." Intersegment sales and transfers are recorded at cost plus standard mark-up; intersegment transactions have been eliminated in consolidation.
The following table sets forth selected financial data consolidated by business segment (dollars in thousands):
F-17
Long-Term Care Services | Therapy Services | Hospice & Home Health Services | Other | Elimination | Total | ||||||||||||||||||
Year Ended December 31, 2014 | |||||||||||||||||||||||
Net patient service revenue from external customers | $ | 657,532 | $ | 89,905 | $ | 82,618 | $ | — | $ | — | $ | 830,055 | |||||||||||
Leased facility revenue | 3,201 | — | — | — | — | 3,201 | |||||||||||||||||
Intersegment revenue | 2,086 | 56,340 | — | — | (58,426 | ) | — | ||||||||||||||||
Total revenue | $ | 662,819 | $ | 146,245 | $ | 82,618 | $ | — | $ | (58,426 | ) | $ | 833,256 | ||||||||||
Operating income (loss) | $ | 56,414 | $ | 13,307 | $ | (661 | ) | $ | (40,560 | ) | $ | — | $ | 28,500 | |||||||||
Interest expense, net of interest income | (31,240 | ) | |||||||||||||||||||||
Other income | 1 | ||||||||||||||||||||||
Equity in earnings of joint venture | 1,427 | ||||||||||||||||||||||
Debt modification/retirement costs | (843 | ) | |||||||||||||||||||||
Loss from continuing operations before provision for income taxes | $ | (2,155 | ) | ||||||||||||||||||||
Depreciation and amortization | $ | 22,206 | $ | 647 | $ | 899 | $ | 570 | $ | — | $ | 24,322 | |||||||||||
Segment capital expenditures | $ | 10,441 | $ | 85 | $ | 183 | $ | 2,272 | $ | — | $ | 12,981 | |||||||||||
Adjusted EBITDA | $ | 81,248 | $ | 14,025 | $ | 6,993 | $ | (23,446 | ) | $ | — | $ | 78,820 | ||||||||||
Adjusted EBITDAR | $ | 99,409 | $ | 14,025 | $ | 8,832 | $ | (23,446 | ) | $ | — | $ | 98,820 | ||||||||||
Year Ended December 31, 2013 | |||||||||||||||||||||||
Net patient service revenue from external customers | $ | 638,139 | $ | 102,169 | $ | 98,842 | $ | — | $ | — | $ | 839,150 | |||||||||||
Leased facility revenue | 3,122 | — | — | — | — | 3,122 | |||||||||||||||||
Intersegment revenue | 2,350 | 56,959 | — | — | (59,309 | ) | — | ||||||||||||||||
Total revenue | $ | 643,611 | $ | 159,128 | $ | 98,842 | $ | — | $ | (59,309 | ) | $ | 842,272 | ||||||||||
Operating income (loss) | $ | 51,281 | $ | 10,244 | $ | (8,717 | ) | $ | (27,283 | ) | $ | — | $ | 25,525 | |||||||||
Interest expense, net of interest income | (33,923 | ) | |||||||||||||||||||||
Other expense | 188 | ||||||||||||||||||||||
Equity in earnings of joint venture | 1,949 | ||||||||||||||||||||||
Debt modification/retirement costs | (2,828 | ) | |||||||||||||||||||||
Loss from continuing operations before provision for income taxes | $ | (9,089 | ) | ||||||||||||||||||||
Depreciation and amortization | $ | 21,796 | $ | 688 | $ | 623 | $ | 664 | $ | — | $ | 23,771 | |||||||||||
Segment capital expenditures | $ | 12,364 | $ | 132 | $ | 832 | $ | 108 | $ | — | $ | 13,436 | |||||||||||
Adjusted EBITDA | $ | 71,500 | $ | 11,328 | $ | 8,865 | $ | (19,363 | ) | $ | — | $ | 72,330 | ||||||||||
Adjusted EBITDAR | $ | 88,490 | $ | 11,328 | $ | 10,703 | $ | (19,363 | ) | $ | — | $ | 91,158 | ||||||||||
Year Ended December 31, 2012 | |||||||||||||||||||||||
Net patient service revenue from external customers | $ | 643,740 | $ | 104,403 | $ | 106,696 | $ | — | $ | — | $ | 854,839 | |||||||||||
Leased facility revenue | 3,060 | — | — | — | — | 3,060 | |||||||||||||||||
Intersegment revenue | 2,587 | 61,932 | — | — | (64,519 | ) | — | ||||||||||||||||
Total revenue | $ | 649,387 | $ | 166,335 | $ | 106,696 | $ | — | $ | (64,519 | ) | $ | 857,899 | ||||||||||
Operating income (loss) | $ | 72,259 | $ | 12,133 | $ | 15,349 | $ | (24,996 | ) | $ | — | $ | 74,745 | ||||||||||
Interest expense, net of interest income | (37,248 | ) | |||||||||||||||||||||
Other income | (32 | ) | |||||||||||||||||||||
Equity in earnings of joint venture | 1,948 | ||||||||||||||||||||||
Income from continuing operations before provision for income taxes | $ | 35,287 | |||||||||||||||||||||
Depreciation and amortization | $ | 21,649 | $ | 669 | $ | 607 | $ | 716 | $ | — | $ | 23,641 | |||||||||||
F-18
Long-Term Care Services | Therapy Services | Hospice & Home Health Services | Other | Elimination | Total | ||||||||||||||||||
Segment capital expenditures | $ | 15,551 | $ | 823 | $ | 1,053 | $ | 2,098 | $ | — | $ | 19,525 | |||||||||||
Adjusted EBITDA | $ | 93,306 | $ | 12,944 | $ | 17,102 | $ | (22,233 | ) | $ | — | $ | 101,119 | ||||||||||
Adjusted EBITDAR | $ | 109,728 | $ | 12,944 | $ | 18,591 | $ | (22,203 | ) | $ | — | $ | 119,060 | ||||||||||
A reconciliation of Adjusted EBITDA and Adjusted EBITDAR to net (loss) income is as follows (dollars in thousands):
Year Ended December 31, | |||||||||||
2014 | 2013 | 2012 | |||||||||
Adjusted EBITDAR | $ | 98,820 | $ | 91,158 | $ | 119,060 | |||||
Rent cost of revenue | 20,000 | 18,828 | 17,941 | ||||||||
Adjusted EBITDA | 78,820 | 72,330 | 101,119 | ||||||||
Depreciation and amortization | (24,322 | ) | (23,771 | ) | (23,641 | ) | |||||
Interest expense | (31,977 | ) | (34,258 | ) | (37,760 | ) | |||||
Interest income | 737 | 335 | 512 | ||||||||
Impairment of long-lived assets (a) | (82 | ) | (19,000 | ) | — | ||||||
Debt modification/retirement costs (b) | (843 | ) | (2,828 | ) | (4,126 | ) | |||||
Organization restructuring costs (c) | (1,592 | ) | (2,343 | ) | — | ||||||
Change in fair value of contingent consideration (d) | 576 | 3,702 | (817 | ) | |||||||
Closure of California home health agency (e) | — | (419 | ) | — | |||||||
Governmental investigation expense (f) | (6,000 | ) | — | — | |||||||
Legal expense for non-routine matters (g) | (2,285 | ) | (2,531 | ) | — | ||||||
Combination related expense (h) | (13,697 | ) | (306 | ) | — | ||||||
Exit costs related to divested facilities (i) | (397 | ) | — | — | |||||||
Losses at skilled nursing facility not at full operation (j) | (1,025 | ) | — | — | |||||||
Loss on the sale of assets (k) | (68 | ) | — | — | |||||||
Discontinued operations, net of taxes (l) | — | (4,300 | ) | (794 | ) | ||||||
(Benefit) provision for income taxes | (1,248 | ) | (2,905 | ) | 12,896 | ||||||
Net (loss) income | $ | (907 | ) | $ | (10,484 | ) | $ | 21,597 | |||
Notes
(a) | During the third quarter of 2013, the Company recorded a goodwill impairment charge of $19.0 million related to its home health reporting unit. See "Note 3 - Goodwill and Long-lived Impairment Testing", for a more detailed discussion of the goodwill impairment charges. |
(b) | For the year ended December 31, 2014, the Company recorded debt modification/retirement costs of $0.8 million. The entire amount was related to the June 2014 credit facility agreement. During 2013, we recorded debt modification/retirement costs of $2.8 million. Of the $2.8 million expensed for debt modification, $1.1 million related to the June 2013 credit facility amendment. The remaining $1.7 million was related to deferred financing fees expensed on the extinguishment of term debt that was refinanced with HUD insured loans as well as the term debt that was refinanced with MidCap Financial. In the second quarter of 2012, the Company refinanced its senior subordinated notes (the "2014 Notes") and recorded debt retirement cost of $4.1 million for the year ended December 31, 2012. |
(c) | For the year ended December 31, 2014, the Company recorded $1.6 million in organization restructure costs. In 2013, the Company recorded $2.0 million in organization restructure costs. |
(d) | In 2013, a benefit of $3.7 million was recorded for the change in fair value of contingent consideration related to the 2010 hospice and home health acquisition due to reductions in forecasted EBITDA, which reduced the likelihood of the businesses achieving their EBITDA target necessary for the earn-out to be paid in future period. |
(e) | In the third quarter of 2013 the Company recorded a $0.4 million intangible asset impairment charge related to the closure of its California home health agency. |
(f) | On or about August 6, 2014, in relation to its investigation of Creekside Hospice, the DOJ filed a notice of intervention in two pending qui tam proceedings filed by private party relators under the FCA and the NFCA and |
F-19
advised that it intended to take over the actions and file an amended complaint within 90 days, asserting that certain claims for hospice services provided by Creekside Hospice in the time period 2010 to 2013 did not meet Medicare requirements for reimbursement and are in violation of the civil False Claims Act. The DOJ filed its complaint in intervention on November 25, 2014, against Creekside, Skilled Healthcare Group, Inc., and Skilled Healthcare, LLC, asserting, among other things, that certain claims for hospice services provided by Creekside in the time period 2010 to 2013 did not meet Medicare requirements for reimbursement and are in violation of the civil False Claims Act. The DOJ is pursuing False Claims Act, NFCA, and federal common law claims remedies in an unspecified amount, with a request to treble provable damages and impose penalties per proved false claim in the amount ranging from $5,500 to $11,000 per claim, as applicable. While the Company denies the allegations and will defend this action, the Company has accrued $6.0 million as a contingent liability in connection with the matter, but it could ultimately cost more than that amount to settle or otherwise resolve it, including to satisfy any judgment that might be rendered against the Company or Creekside Hospice if the litigation defense were ultimately unsuccessful.
(g) | In 2014 and 2013 the Company incurred $2.3 million and $2.5 million, respectively, in legal expenses related to government investigations and similar non-routine legal matters. |
(h) | On February 2, 2015, the business and operations of Skilled and FC-GEN were combined. During 2014, we incurred $13.7 million in due diligence and merger related costs, including $2.0 million of employee severance costs. We expect to incur an additional $4.8 million of severance costs in 2015. In 2013, we incurred $0.3 million in the proposals to discuss the FC-GEN Combination. |
(i) | During 2014 the Company recorded $0.4 million in costs related to Sycamore and Dallas facilities divested during the end of 2013. |
(j) | In 2014 the Company recorded $1.0 million related to our Kansas City Traditional Care Center which was commencing operations. |
(k) | While unusual and non-recurring gains or losses on sales of assets are required under U.S. GAAP, these amounts are not reflective of income and losses of the Company's underlying business. |
(l) | The Company sold two skilled nursing facilities on December 1, 2013, one owned facility in Texas and one leased facility in California, therefore, the results of these transactions have been classified as discontinued operations. |
The following table presents the segment assets as of December 31, 2014 compared to December 31, 2013 (dollars in thousands):
Long-Term Care Services | Therapy Services | Hospice & Home Health Services | Other | Total | |||||||||||||||
December 31, 2014: | |||||||||||||||||||
Segment total assets | $ | 464,780 | $ | 50,113 | $ | 76,382 | $ | 59,681 | $ | 650,956 | |||||||||
Goodwill and intangibles included in total assets | $ | 1,036 | $ | 23,694 | $ | 62,594 | $ | — | $ | 87,324 | |||||||||
December 31, 2013: | |||||||||||||||||||
Segment total assets | $ | 445,987 | $ | 48,251 | $ | 80,290 | $ | 68,888 | $ | 643,416 | |||||||||
Goodwill and intangibles included in total assets | $ | 1,300 | $ | 23,693 | $ | 62,879 | $ | — | $ | 87,872 | |||||||||
7. Debt
The Company’s long-term debt is summarized as follows (dollars in thousands):
F-20
As of December 31, | |||||||
2014 | 2013 | ||||||
Term Loan, due April 2016, interest rate based on LIBOR (subject to a 1.50% floor) plus 5.50%, or 7.00%, at December 31, 2014 and LIBOR (subject to a 1.50% floor) plus 5.25%, or 6.75%, at December 31, 2013; collateralized by substantially all assets of the Company excluding the skilled nursing facilities that collateralize the HUD insured mortgage loans and the skilled nursing facilities that collateralize the MidCap Financial credit facility | $ | 242,314 | $ | 243,953 | |||
Term Loan original issue discount | (704 | ) | (1,254 | ) | |||
Revolving Credit Facility due April 2015, interest rate comprised of the Prime rate of 3.25% plus 3.50%, or 6.75%, at December 31, 2013 | — | 11,000 | |||||
Revolving Credit Facility due April 2016, interest rate comprised of LIBOR plus 5.50%, or 5.74%, at December 31, 2014 | 9,744 | — | |||||
Revolving Credit Facility due April 2015, interest rate comprised of LIBOR plus 4.50%, or 4.74%, at December 31, 2014 and December 31, 2013 | 6,256 | 7,057 | |||||
HUD insured loans due in 2043 and 2048, with a weighted average interest rate of 4.28% and 4.24% at December 31, 2014 and December 31, 2013 | 86,118 | 87,314 | |||||
Term Loan, due December 2016, interest rate based on LIBOR rate (subject to a floor of 0.75%) plus 5.95%, or 6.70%, at December 31, 2014 and December 31, 2013; collateralized by 10 skilled nursing facilities | 60,592 | 62,000 | |||||
Revolving Credit Facility due December 2016, interest rate comprised of LIBOR (subject to a floor of 0.75%) plus 5.95%, or 6.70%, at December 31, 2014 and December 31, 2013; collateralized by the accounts receivable of 10 skilled nursing facilities | 4,165 | 5,000 | |||||
Note payable due December 2018, interest rate fixed at 6.50%, payable in monthly installments, collateralized by a first priority deed of trust | 789 | 959 | |||||
Insurance premiums financed | 1,571 | 2,990 | |||||
Other | — | 106 | |||||
Total long-term debt | 410,845 | 419,125 | |||||
Less amounts due within one year | (12,456 | ) | (7,630 | ) | |||
Long-term debt, net of current portion | $ | 398,389 | $ | 411,495 | |||
Term Loan and Revolving Credit Facility
On April 9, 2010, the Company entered into an up to $360.0 million senior secured term loan and a $100.0 million revolving credit facility (the "Prior Credit Agreement") that amended and restated the senior secured term loan and revolving credit facility that were set to mature in June 2012. On April 12, 2012, the Company entered into an Amendment and Restatement and Additional Term Loan Assumption Agreement (“Restated Credit Agreement”) that amended and restated the Prior Credit Agreement and pursuant to which, among other things, the size of the Company's existing senior secured term loan was increased by $100.0 million (hereinafter referred to as the incremental senior secured term loan).
On June 6, 2013, the Company entered into an amendment to the Restated Credit Agreement that increased the maximum leverage ratio by 0.50 throughout the life of the Restated Credit Agreement. The amendment additionally permits the Company to make future offers to the lenders under the revolving credit facility to extend the maturity date of all or a portion of the revolving credit facility. The credit arrangements provided under the Restated Credit Agreement are collectively referred to herein as the Company's senior secured credit facility.
In connection with the June 2013 modification, the Company paid fees totaling $2.5 million, of which $1.1 million was recorded as debt modification costs in the consolidated statement of operations, and $1.4 million was recorded as other assets in the consolidated balance sheet. Substantially all of the Company's assets, except those skilled nursing facilities securing the HUD and MidCap mortgage loans, are pledged as collateral under the senior secured credit facility. Amounts borrowed under the senior secured term loan may be prepaid at any time without penalty, except for LIBOR breakage costs. The senior secured term loan matures on April 9, 2016.
On June 23, 2014, the Company entered into an Amendment No. 2 and Loan Modification Agreement ("Amendment No. 2") to our Fourth Amended and Restated Credit Agreement dated April 12, 2012, as previously amended on June 6, 2013. Amendment No. 2 increased the maximum leverage ratio to 5.25 and decreased the fixed charge coverage ratio to 1.85, both up to but not including June 30, 2015. Amendment No. 2 increased the interest rate by 0.25% to the London Interbank Offered Rate
F-21
("LIBOR") (subject to a floor of 1.50%) plus a margin of 5.50 or the prime rate (subject to a floor of 2.50%) plus a margin of 4.50%. Amendment No. 2 extended the maturity date of the revolving credit facility to April 9, 2016 and reduced the commitments of any extending revolving lenders by 25%. After giving effect to Amendment No. 2, the extended revolving credit facility commitments are $50.6 million and the non-extended revolving credit facility commitments are $32.5 million, for a total capacity of $83.1 million. The capacity of the revolving credit facility will decrease to $50.6 million on April 9, 2015 until its maturity. Lenders that take an assignment of non-extended commitments may subsequently agree to extend those commitments in accordance with Amendment No. 2. Amendment No. 2 also modified the interest rate for the extended revolving credit commitments to be, at the Company’s option, LIBOR plus a margin between 5.25% and 5.50% (based upon consolidated leverage) or the prime rate plus a margin between 4.25% and 4.50% (based upon consolidated leverage). The interest rates on the non-extended revolving credit facility commitments remain, at the Company’s option, at LIBOR plus a margin of between 4.25% and 4.50% (based upon consolidated leverage) or the prime rate plus a margin between 3.25% and 3.50% (based upon consolidated leverage). In connection with the June 2014 modification, the Company paid fees totaling $2.0 million of which $0.8 million were recorded as debt modification costs in the condensed consolidated statements of operations, and $1.2 million was recorded as other assets in the condensed consolidated balance sheet.
Pursuant to the Restated Credit Agreement, the quarterly term loan amortization payments increased to $2.6 million beginning June 30, 2012 compared to $0.9 million under the Prior Credit Agreement. Due to the principal reductions made in 2013 made in association with the HUD insured financings, no amortization payments were due until December 31, 2014, at which time the quarterly principal payments due will be $1.6 million. Additionally, the maximum portion of the annual Consolidated Excess Cash Flow (as defined in the Restated Credit Agreement) to be applied to term debt reductions increased to 75% from 50%, subject to step-downs to 50% and 25% based on consolidated leverage. The Company has also increased its ability to refinance a portion of its credit facility with U.S. Department of Housing and Urban Development ("HUD") insured debt up to $250 million, subject to certain credit facility covenants. Any HUD insured borrowings beyond $250 million would necessitate either refinancing the senior secured credit facility in full or otherwise seeking a waiver or amendment from the senior secured lenders.
Under the senior secured credit facility, the Company must maintain compliance with specified financial covenants measured on a quarterly basis. The senior secured credit facility also includes certain additional affirmative and negative covenants, including limitations on the incurrence of additional indebtedness, liens, investments in other businesses and capital expenditures. Also under the senior secured credit facility, subject to certain exceptions and minimum thresholds, the Company is required to apply all of the proceeds from any issuance of debt, as much as half of the proceeds from any issuance of equity, as much as 75% of the Company's annual Consolidated Excess Cash Flow (as defined in the Restated Credit Agreement), and amounts received in connection with any sale of the Company's assets to repay the outstanding amounts under the Restated Credit Agreement. The Company believes that it is in compliance with its debt covenants as of December 31, 2014. As of December 31, 2014, the fixed charge coverage ratio was 2.55, which compares to a minimum requirement of 1.85 and the leverage ratio was 4.20, as compared to an allowed maximum of 5.25.
The senior secured credit agreement was terminated upon the closing of the Combination on February 2, 2015.
HUD Insured and Other Mortgage Loans
In 2013, we received funding of 10 loans insured by HUD. The loans have a combined aggregate original principal balance of $87.6 million and are secured by 10 skilled nursing facilities. The HUD insured loans have an average all in interest rate of approximately 5.3% and amortization terms of 30 to 35 years. As of December 31, 2014 the HUD insured loans have a combined aggregate principal balance of $86.1 million.
Accordingly, as of December 31, 2014, the Company has 10 mortgages insured by HUD, which are each secured by a skilled nursing facility. These mortgages have an average remaining term of 33 years with fixed interest rates ranging from 3.3% to 4.5% and a weighted average interest rate of 4.23%. Depending on the mortgage agreement, prepayments are generally allowed only after 12 months or from the inception of the mortgage. Prepayments are subject to a penalty of 10% of the remaining principal balances in the first year and the prepayment penalty decreases each subsequent year by 1% until no penalty is required. As all $87.6 million of the HUD insured mortgage loans were originated in 2013, none of the loans could be prepaid at December 31, 2014. Any further HUD insured mortgages will require additional HUD approval.
All HUD-insured mortgages are non-recourse loans to the Company. All mortgages are subject to HUD regulatory agreements that require escrow reserve funds to be deposited with the loan servicer for mortgage insurance premiums, property taxes, insurance and for capital replacement expenditures. As of December 31, 2014, the Company has escrow reserve funds of $1.6 million with the loan servicer that are reported within other current assets, and replacement reserve funds of $3.6 million in other assets.
F-22
As of December 31, 2014 the Company has 10 additional skilled nursing facilities securing a $60.6 million mortgage loan and a $4.2 million asset based revolving credit facility with MidCap Financial. Both loans have an interest rate of LIBOR plus a margin of 5.95% with a LIBOR floor of 0.75%. The mortgage loan amortizes over 25 years with the remaining principal due December 1, 2016. There are additional quarterly principal payments of $0.3 million beginning after six months, $0.4 million in year two and $0.5 million in year three. The mortgage loan has a debt service coverage ratio and a minimum debt coverage ratio, both of which were met at December 31, 2014. The asset based revolving credit facility is secured by the accounts receivable of the 10 skilled nursing facilities.
Scheduled Maturities of Long-Term Debt
The scheduled maturities of long-term debt as of December 31, 2014 are as follows (in thousands):
Long-Term Debt | |||
2015 | $ | 12,456 | |
2016 | 315,339 | ||
2017 | 1,683 | ||
2018 | 1,757 | ||
2019 | 1,607 | ||
Thereafter | 78,707 | ||
411,549 | |||
Less original issue discount at December 31, 2014 | (704 | ) | |
$ | 410,845 | ||
8. Other Current Assets and Other Assets
Other current assets consisted of the following at December 31 (in thousands):
As of December 31, | |||||||
2014 | 2013 | ||||||
Current portion of notes receivable, net | $ | 1,389 | $ | 1,501 | |||
Supplies inventory | 2,776 | 2,766 | |||||
Income tax refund receivable | 5,917 | 7,654 | |||||
Current portion of insurance recoveries | 80 | 226 | |||||
Other current assets | 141 | 41 | |||||
$ | 10,303 | $ | 12,188 | ||||
Other assets consisted of the following at December 31 (in thousands):
As of December 31, | |||||||
2014 | 2013 | ||||||
Equity investment in joint ventures (see Note 15) | $ | 4,950 | $ | 6,420 | |||
Restricted cash | 33,687 | 26,965 | |||||
Deposits and other assets | 11,118 | 9,147 | |||||
Insurance recoveries | 70 | 176 | |||||
$ | 49,825 | $ | 42,708 | ||||
Restricted Cash
In August 2003, SHG formed Fountain View Reinsurance, Ltd. (the "Captive"), a wholly-owned offshore captive insurance company, for the purpose of insuring its workers’ compensation liability in California. In connection with the formation of the Captive, the Company funds its estimated losses and is required to maintain certain levels of cash reserves on hand for claims related to occurrences prior to September 1, 2005. As of September 2011, the Captive commenced insuring a portion of the Company's professional liability and general liability. The Company is required to fund its estimated losses and to maintain certain cash reserve levels related to professional liability and general liability claims subsequent to August 31,
F-23
2011. As the use of these funds is restricted, the funds are classified as restricted cash in the Company’s consolidated balance sheets. Additionally, restricted cash includes amounts on deposit at the Company’s workers' compensation third-party claims administrator.
Deposits
In the normal course of business the Company is required to post security deposits with respect to its leased properties and to certain of the vendors with which it conducts business.
9. Property and Equipment
Property and equipment consisted of the following as of December 31 (in thousands):
2014 | 2013 | ||||||
Land and land improvements | $ | 62,236 | $ | 62,370 | |||
Buildings and leasehold improvements | 326,892 | 320,923 | |||||
Furniture and equipment | 96,192 | 87,392 | |||||
Construction in progress | 6,794 | 8,621 | |||||
492,114 | 479,306 | ||||||
Less accumulated depreciation | (160,984 | ) | (137,484 | ) | |||
$ | 331,130 | $ | 341,822 | ||||
Leased facility assets consisted of the following as of December 31 (in thousands):
2014 | 2013 | ||||||
Leased facility assets | $ | 13,848 | $ | 13,848 | |||
Less accumulated depreciation | (4,904 | ) | (4,432 | ) | |||
$ | 8,944 | $ | 9,416 | ||||
The Company began leasing five skilled nursing facilities in California to an unaffiliated third party operator in April 2011 and signed a 10-year lease with two 10-year extension options exercisable by the lessee.
10. Income Taxes
The income tax (benefit) expense from operations consisted of the following for the years ended December 31 (in thousands):
2014 | 2013 | 2012 | |||||||||
Federal: | |||||||||||
Current | $ | (414 | ) | $ | (2,844 | ) | $ | 6,202 | |||
Deferred | (1,104 | ) | (2,007 | ) | 4,755 | ||||||
State: | |||||||||||
Current | 344 | 66 | 1,004 | ||||||||
Deferred | (74 | ) | 1,880 | 935 | |||||||
Income tax (benefit) expense from continuing operations | (1,248 | ) | (2,905 | ) | 12,896 | ||||||
Income tax (benefit) expense from discontinued operations | — | (2,717 | ) | (458 | ) | ||||||
Income tax (benefit) expense | $ | (1,248 | ) | $ | (5,622 | ) | $ | 12,438 | |||
F-24
A reconciliation of the income tax (benefit) expense on income from continuing operations computed at statutory rates to the Company's actual effective tax rate is summarized as follows for the years ended December 31 (in thousands):
2014 | 2013 | 2012 | |||||||||
Federal rate (35%) | $ | (753 | ) | $ | (3,182 | ) | $ | 12,350 | |||
State taxes, net of federal tax benefit | 94 | (252 | ) | 1,267 | |||||||
Uncertain tax positions and related interest | (32 | ) | 53 | 25 | |||||||
Lavender class action settlement | — | (1,050 | ) | — | |||||||
Change in state valuation allowance, net of federal tax benefit | 126 | 1,517 | — | ||||||||
Other permanent items | 225 | 223 | 253 | ||||||||
Return to provision adjustment | (400 | ) | (573 | ) | (740 | ) | |||||
Credits, net | (845 | ) | (520 | ) | (260 | ) | |||||
Stock-based compensation | 422 | 808 | 38 | ||||||||
Other, net | (85 | ) | 71 | (37 | ) | ||||||
$ | (1,248 | ) | $ | (2,905 | ) | $ | 12,896 | ||||
Deferred income taxes result from temporary differences between the tax basis of assets and liabilities for financial reporting purposes and the amounts used for income tax purposes. The Company's temporary differences are primarily attributable to purchase adjustments related to intangible assets, depreciation, allowances for doubtful accounts, settlement costs and accruals for professional and general liability expenses and compensation which are not deductible for tax purposes until paid.
In assessing the realizability of deferred tax assets, management considers whether it is more likely than not that some portion or all of the deferred tax assets will not be realized. The ultimate realization of deferred tax assets is primarily dependent upon the Company generating sufficient operating income during the periods in which temporary differences become deductible.
At December 31, 2014 and 2013, we retained a valuation allowance for our state loss and credit carryforwards of $3.2 million and $3.0 million, respectively, as a result of certain restrictions regarding their utilization. On July 11, 2013, legislation was enacted in California that limits the carryover period for unused enterprise zone ("EZ") tax credits to 10 years beginning in 2014. Prior to this legislation, unused EZ tax credits could be carried over indefinitely. This change in carryforward period resulted in the recording of a $2.3 million increase to the state valuation allowance in 2013, which was partially offset by the federal benefit resulting from the increase in state valuation allowance of $0.8 million.
F-25
Significant components of the Company's deferred income tax assets and liabilities at December 31 are as follows (in thousands):
2014 | 2013 | ||||||||||||||
Current | Non- Current | Current | Non- Current | ||||||||||||
Deferred income tax assets: | |||||||||||||||
Vacation and other accrued expenses | $ | 6,134 | $ | 5,890 | $ | 5,072 | $ | 9,372 | |||||||
Allowance for doubtful accounts | 3,989 | — | 3,774 | — | |||||||||||
Professional liability accrual | 1,061 | 1,765 | 3,260 | 951 | |||||||||||
Rent accrual | 63 | 3,148 | 112 | 2,859 | |||||||||||
Asset retirement obligation, net | — | 1,584 | — | 1,488 | |||||||||||
Governmental investigation | 2,445 | — | — | — | |||||||||||
CA EZ credit carryforward | — | 3,761 | — | 3,789 | |||||||||||
Merger accruals | 5,259 | — | — | — | |||||||||||
Intangible assets | — | 4,754 | — | 8,956 | |||||||||||
Other | 1,973 | 524 | 1,069 | 502 | |||||||||||
Total deferred income tax assets | 20,924 | 21,426 | 13,287 | 27,917 | |||||||||||
Deferred income tax liabilities: | |||||||||||||||
Fixed assets | — | (14,638 | ) | — | (14,495 | ) | |||||||||
Prepaid Expenses | (1,674 | ) | — | (2,435 | ) | — | |||||||||
Other | — | (1,926 | ) | — | (1,900 | ) | |||||||||
Total deferred income tax liabilities | (1,674 | ) | (16,564 | ) | (2,435 | ) | (16,395 | ) | |||||||
Net deferred income tax assets | 19,250 | 4,862 | 10,852 | 11,522 | |||||||||||
Valuation allowance | (1,591 | ) | (1,630 | ) | (976 | ) | (2,050 | ) | |||||||
Net deferred income tax assets | $ | 17,659 | $ | 3,232 | $ | 9,876 | $ | 9,472 | |||||||
Significant judgment is required in determining the Company’s provision for income taxes. In the ordinary course of business, there are many transactions for which the ultimate tax outcome is uncertain. While the Company believes that its tax return positions are supportable, there are certain positions that may not be sustained upon review by tax authorities. Although the Company believes that adequate accruals have been made for such positions, the final resolution of those matters may be materially different than the amounts provided for in the Company’s historical income tax provisions and accruals.
A reconciliation of the beginning and ending amount of unrecognized tax benefits is as follows for 2014, 2013 and 2012 (in thousands):
2014 | 2013 | 2012 | |||||||||
Balance at January 1, | $ | 321 | $ | 195 | $ | 135 | |||||
Additions for tax positions of prior years | 56 | 158 | 139 | ||||||||
Settlements | (53 | ) | — | (79 | ) | ||||||
Reductions for lapses of statutes | (78 | ) | (32 | ) | — | ||||||
Balance at December 31, | $ | 246 | $ | 321 | $ | 195 | |||||
At December 31, 2014, the total amount of unrecognized tax benefit was $0.2 million, which will result in a benefit to the provision for income taxes in subsequent years, if recognized.
The Company recognizes interest and penalties related to uncertain tax positions in the provision for income taxes line item of the consolidated statements of operations. As of December 31, 2014 and 2013, our accrued interest and penalties on unrecognized tax benefits was negligible.
The Company is subject to taxation in the United States and in various state jurisdictions. The Company's tax years 2011 and forward are subject to examination by the United States Internal Revenue Service. The Company’s tax years 2010 and forward are subject to examination by the Company's material state jurisdictions. The Internal Revenue Service is examining our 2012 tax year. We do not anticipate any material changes to our tax returns as filed.
F-26
11. Stockholders' Equity
The Company did not declare or pay cash dividends in either 2014 or 2013. The Company does not anticipate paying any cash dividends on our common stock in the foreseeable future. The Company currently expects that it will retain all available cash, if any, for use as working capital and for other general purposes, including to service or repay the debt and to fund the operation and expansion of its business. Any payment of future dividends will be at the discretion of the board of directors and will depend on, among other things, the Company's earnings, financial condition, capital requirements, level of indebtedness, statutory and contractual restrictions applying to the payment of dividends and other considerations that the board of directors deems relevant.
Prior to the Combination, holders of the Company's Class A common stock were entitled to a voting power of one vote per share and holders of the Company's Class B common stock are entitled to a voting power of ten votes per share. Following the Combination, each holder of Genesis's Class A common stock, Class B common stock, and Class C common stock is entitled to one vote per share. Mandatory and optional conversion of the Class B common stock into Class A common stock exists on a one-for-one basis under certain circumstances. Mandatory conversion of the Class C common stock into the Class A common stock exists on a fractional basis, as determined at the time of the conversion pursuant to the formula specified in our certificates of incorporation, under certain circumstances.
12. Stock-Based Compensation
2005 Restricted Stock Plan
In December 2005, the Company’s board of directors adopted a restricted stock plan with respect to Skilled’s Class B common stock (the "Restricted Stock Plan"). The Restricted Stock Plan provided for awards of restricted stock to the Company’s officers and other key employees. Such grants of restricted stock were required to be evidenced by restricted stock agreements and were subject to the vesting and other requirements as determined at the time of grant by a committee appointed by the board of directors. Restricted shares of each initial participant vested (i) 25% on the date of grant and (ii) 25% on each of the first three anniversaries of the date of grant, unless such initial participant ceases to be an employee of or consultant to Skilled or any of its companies on the relevant anniversary date. As of December 31, 2014, the aggregate number of shares of Class B stock issued under the Restricted Stock Plan was 1.3 million, net of forfeitures, all of which have fully vested. No additional shares of common stock are available for issuance under this plan.
2007 Incentive Award Plan
In April 2007, Skilled's board of directors adopted the Skilled Healthcare Group, Inc. 2007 Incentive Award Plan (the "2007 Plan") that provides for cash-based and equity-based awards to the Company's directors, officers, and other key employees. In May 2008, the stockholders of the Company approved the 2007 Plan increasing the number of shares of the Company’s Class A common stock that may be issued under the 2007 Plan by 1.5 million shares to a total of 2.6 million shares. The 2007 Plan became effective immediately upon stockholder approval. The Company's stockholders approved an amendment of the 2007 Plan in May 2011, which increased the number of shares of Class A common stock available for issuance under the plan by 1.9 million shares to a total of 4.5 million shares. In May 2013, the Company's stockholders approved an amendment of the 2007 Plan, which increased the number of shares of Class A common stock available for issuance under the plan by 1.0 million shares to a total of 5.5 million shares.
Restricted stock awards granted under the 2007 Plan are subject to vesting and other requirements as determined at the time of award by a committee appointed by the board of directors. The restricted awards granted to non-employee directors are generally subject to a one-year vesting requirement. The restricted common shares awarded to executive officers and other key employees generally vest 25% on the first four anniversary dates of the award. In addition to restricted common shares, the Company also awards restricted stock units to certain directors. The restricted stock units have rights similar to the rights of restricted vested common shares and the non-employee director will ultimately receive one common share for each restricted stock unit. The fair value of the restricted common shares and restricted stock units is based on the award date market value of the common shares and is amortized over the vesting period on a ratable basis.
Under the 2007 Plan, incentive and nonqualified stock options may be granted to eligible participants for the right to purchase common stock at a specified price which may not be less than the fair market value on the date of the grant. Based on the terms of individual option grants, options granted under the 2007 Plan generally expire 10 years after the grant date and generally become exercisable over a period of four years, with annual vesting, based on continued employment. In 2014 and 2013, the Company granted no new options to purchase shares of Class A common stock.
In November 2008, the Company began granting performance based restricted Class A common shares and stock options to executive officers. The stock options vest ratably over a four-year period. The fair value of the stock options is valued utilizing the Black-Scholes model and is amortized over the vesting period of the options. The fair value of the performance shares is is recognized as compensation expense based on the most probable outcome of the performance condition which is
F-27
evaluated quarterly using the Company's forecasted and actual results. As of December 31, 2014, there were 0.9 million non-vested performance based restricted stock awards outstanding as compared to 0.8 million for the same period in 2013.
As of December 31, 2014, the aggregate number of Class A common shares and restricted stock units issued under the 2007 plan was 4.6 million as compared to 3.7 million as of December 31, 2013.
During the year ended December 31, 2014, the following actively occurred with respect to restricted stock awards, restricted stock units and performance stock awards under the Company’s existing plans (number of shares in thousands):
Number of Shares | Weighted- Average Grant Date Fair Value | |||||
Non-vested balance at January 1, 2014 | 2,256 | $ | 6.42 | |||
Granted | 948 | 4.86 | ||||
Vested | (740 | ) | 4.63 | |||
Forfeited | (610 | ) | 5.49 | |||
Non-vested balance at December 31, 2014 | 1,854 | |||||
As of December 31, 2014, there was approximately $3.5 million of total unrecognized compensation costs related to restricted stock awards, restricted stock units and performance stock awards as compared to $4.6 million for the year ended December 31, 2013. These costs had a weighted-average remaining recognition period of 1.7 as of December 31, 2014 and 1.8 years as of December 31, 2013. The total fair value of shares vested during the years ended December 31, 2014, 2013, and 2012 was $5.1 million, $2.5 million, and $1.8 million, respectively.
There were no new stock options granted in the year ended December 31, 2014 and December 31, 2013.
There were 214,064 options exercised during the year ended December 31, 2014. As of December 31, 2014, there was less than $0.1 million of unrecognized compensation cost related to outstanding stock options, net of estimated forfeitures. This amount is expected to be recognized over a weighted-average period of 0.9 years. To the extent the forfeiture rate is different than the Company has anticipated, stock-based compensation related to these awards will be different from the Company's expectations.
The following table summarizes stock option activity during the year ended December 31, 2014 under the Skilled Healthcare Group, Inc. Amended and Restated 2007 Incentive Award Plan:
Number of Shares | Weighted- Average Exercise Price | Weighted- Average Remaining Contractual Term (in years) | Aggregate Intrinsic Value (in thousands) | |||||||||
Outstanding at January 1, 2014 | 795 | $ | 8.54 | |||||||||
Granted | — | — | ||||||||||
Forfeited or cancelled | (208 | ) | 9.80 | |||||||||
Outstanding at December 31, 2014 | 587 | $ | 9.35 | 4.54 | $ | 414,721 | ||||||
Fully vested and expected to vest at December 31, 2014 | 372 | $ | 9.35 | 4.54 | $ | 413,765 | ||||||
Exercisable at December 31, 2014 | 352 | $ | 9.44 | 4.40 | $ | 384,081 | ||||||
Aggregate intrinsic value represents the value of Skilled's closing stock price on the New York Stock Exchange on the last trading day of the fiscal period in excess of the exercise price, multiplied by the number of options outstanding or exercisable.
The amount of compensation included in general and administrative expenses was $3.2 million, $1.7 million, and $3.0 million for the year ended December 31, 2014, 2013 and 2012, respectively. The amount of compensation included in cost of services was $1.0 million, $1.3 million, and $1.8 million for the years ended December 31, 2014, 2013 and 2012, respectively.
13. Commitments and Contingencies
Leases
F-28
The Company leases certain of its facilities under non-cancelable operating leases. The leases generally provide for payment of property taxes, insurance and repairs, and have rent escalation clauses, principally based upon the Consumer Price Index or other fixed annual adjustments.
The future minimum rental payments under non-cancelable operating leases that have initial or remaining lease terms in excess of one year as of December 31, 2014 are as follows (in thousands):
2015 | $ | 18,927 | |
2016 | 17,618 | ||
2017 | 15,093 | ||
2018 | 10,618 | ||
2019 | 9,916 | ||
Thereafter | 40,043 | ||
$ | 112,215 | ||
The information above does not reflect the effects of the Combination, which occurred on February 2, 2015.
Legal Matters
The Company is a party to litigation and regulatory investigations arising in the ordinary course of business. With the exception of the specific matters noted below, management does not believe the results of such litigation and regulatory investigations, even if the outcome is unfavorable, would have a material adverse effect on the results of operations, financial position or cash flows of the Company.
Creekside Hospice Litigation
On August 2, 2013, the United States Attorney for the District of Nevada and the Civil Division of the U.S. Department of Justice (the “DOJ”) informed the Company that its Civil Division was investigating the Company, as well as its subsidiary, Creekside Hospice II, LLC, for possible violations of federal and state healthcare fraud and abuse laws and regulations. Those laws could have included the federal False Claims Act ("FCA") and the Nevada False Claims Act ("NFCA"). The FCA provides for civil and administrative fines and penalties, plus treble damages. The NFCA provides for similar fines and penalties, including treble damages. Violations of those federal or state laws could also subject the Company and/or its subsidiaries to exclusion from participation in the Medicare and Medicaid programs.
On or about August 6, 2014, in relation to the investigation the DOJ filed a notice of intervention in two pending qui tam proceedings filed by private party relators under the FCA and the NFCA and advised that it intends to take over the actions. The DOJ filed its complaint in intervention on November 25, 2014, against Creekside, Skilled Healthcare Group, Inc., and Skilled Healthcare, LLC, asserting, among other things, that certain claims for hospice services provided by Creekside in the time period 2010 to 2013 did not meet Medicare requirements for reimbursement and are in violation of the civil False Claims Act. The private party relators may attempt to continue to pursue any claims that the DOJ has not elected to pursue. The DOJ is pursuing False Claims Act, NFCA, and federal common law claims remedies in an unspecified amount, with a request to treble provable damages and impose penalties per proved false claim in the amount ranging from $5,500 to $11,000 per claim, as applicable.
While the Company denies the allegations and will defend this action, including any portion of the action that the private party relators may continue to pursue, the Company has accrued $6.0 million as a contingent liability in connection with the matter. However, it could ultimately cost more than that amount to settle or otherwise resolve the matter(s), including to satisfy any judgment that might be rendered against the Company or Creekside Hospice if the litigation defense were ultimately unsuccessful.
Therapy Matters Investigation
In February 2015, representatives of the U.S. Department of Justice Civil Division informed the Company that they are investigating and may pursue legal action against the Company and certain of its subsidiaries for alleged violations of the civil False Claims Act related to the provision of therapy services from 2005 through 2013. These laws could include the FCA and similar state laws. As noted above, the FCA provides for civil and administrative fines and penalties, including civil fines ranging from $5,500 to $11,000 per claim plus treble damages. Applicable state laws provide for similar penalties. Violations of these federal or state laws could also subject the Company and/or its subsidiaries to exclusion from participation in the Medicare and Medicaid programs. Any damages, fines, penalties, other sanctions and costs that we may incur as a result of any federal and/or state suit could be significant and could have a material and adverse effect on our results of operations and financial condition. At this time, we cannot predict what effect, if any, the investigation or any potential claims arising under applicable federal or state laws and regulations could have on the Company. While the Company will continue to cooperate
F-29
with the government’s investigation of the matter, the Company intends to vigorously defend against any legal action that may be brought in the matter.
Staffing Matters Investigation
In the course of communications in 2012-2013 with the California Attorney General's Bureau of Medi-Cal Fraud & Elder Abuse ("BMFEA") related to the “BMFEA Matter” discussed below, representatives of the California Attorney General and the DOJ indicated an interest in pursuing an action under the FCA and certain other legal theories based upon the jury findings of understaffing in the Humboldt County Action discussed below. (As discussed under “BMFEA Matter” below, the Company subsequently entered into a release with the BMFEA.) On February 10, 2015, the DOJ informed the Company that it intends to pursue legal action against the Company and certain of its subsidiaries related to staffing and certain quality of care allegations related to the issues adjudicated in the Humboldt County Action. These laws could include the FCA and similar state laws. As noted above, violations of the FCA or similar state laws and regulations could subject the Company and/or its subsidiaries to severe monetary and other penalties and remedies. Any damages, fines, penalties, other sanctions and costs that we may incur as a result of any federal or state suit could be significant and could have a material and adverse effect on our results of operations and financial condition. At this time, we cannot predict what effect, if any, the investigation or any potential claims arising under applicable federal or state laws and regulations could have on the Company. While the Company will continue to cooperate with the government's evaluation of the matter, the Company intends to vigorously defend against any legal action that may be brought in the matter.
Stockholder Litigation Regarding FC-GEN Combination
As discussed more fully in Note 18 - Combination with FC-GEN, on February 2, 2015, the business and operations of Skilled and FC-GEN were combined. Skilled, the Skilled board of directors, Onex Corporation ("Onex"), Genesis and Genesis HealthCare LLC ("Genesis HealthCare") are named as defendants in a purported class action lawsuit, In re Skilled Healthcare Group, Inc. Stockholder Litigation, C.A. No. 10097-DCN, a consolidation of two separate actions filed on September 5, 2014, and September 16, 2014, respectively, brought by individuals who claim to be stockholders of the Company. The consolidated complaint, filed on January 16, 2015, alleges, among other things, that the Board of Directors breached fiduciary duties owed to the Company’s stockholders by agreeing to enter into an agreement for a combination with FC-GEN in an all-stock transaction. The complaint seeks to recover damages resulting from defendants’ alleged wrongful conduct and rescission of the transaction. Skilled, the Skilled board of directors and Genesis believe that the claims in this action are without merit and intend to defend against it vigorously. However, Plaintiff decided to voluntarily dismiss their case without prejudice. The court order granting the stipulation to dismiss the case was filed on February 13, 2015.
Humboldt County Injunction
In connection with the September 2010 settlement of the class action litigation against Skilled and certain of its subsidiaries related to, among other matters, alleged understaffing at certain California skilled nursing facilities operated by Skilled's subsidiaries (the "Humboldt County Action"), Skilled and its defendant subsidiaries (collectively, the "Defendants”) entered into settlement agreements with the plaintiffs and intervenor and agreed to an injunction. The settlement was approved by the Superior Court of California, Humboldt County on November 30, 2010. Under the terms of the settlement agreements, the defendant entities deposited a total of $50.0 million into escrow accounts to cover settlement payments to class members, notice and claims administration costs, reasonable attorneys' fees and costs and certain other payments, including $5.0 million to settle certain government agency claims and potential government claims that may arise. Of the $5.0 million provided for such government claims, $1.0 million has been released by the court to the Humboldt County Treasurer-Tax Collector on behalf of the People of the State of California for their release of the Defendants. The remaining $4.0 million was available for the settlement and releases by the California Attorney General and certain other District Attorneys. However, in the event that any of these government authorities were to instead file certain actions against the Defendants by the second anniversary of the effective date of the settlement agreement, which occurred in February 2013, the entire $4.0 million would have reverted to the Defendants upon their request to the Settlement Administrator. No such actions were filed, however, resulting in an additional $1.0 million distribution to the Humboldt County District Attorney's Office and the remaining $3.0 million was distributed to the class settlement fund, as required by the settlement agreement.
In addition to the payments to the Humboldt County Treasurer-Tax Collector on behalf of the People of the State of California, the court also approved payments from the escrow of up to approximately $24.8 million for attorneys' fees and costs and $10,000 to each of the three named plaintiffs. Pursuant to the injunction, the twenty-two Defendants that operated California nursing facilities were required to provide specified nurse staffing levels, comply with specified state and federal laws governing staffing levels and posting requirements, and provide reports and information to a court-appointed auditor. The injunction was to remain in effect for a period of twenty-four months unless extended for additional three-month periods as to those Defendants that may be found in violation. Defendants demonstrating compliance for an eighteen-month period that ended September 30, 2012 were permitted to petition for early termination of the injunction. The Defendants were required to
F-30
demonstrate over the term of the injunction that the costs of the injunction met a minimum threshold level pursuant to the settlement agreement, which level, initially $9.6 million, was reduced by the portion attributable to any Defendant in the case that no longer operated a skilled nursing facility during the injunction period.
In April 2011, five of the subsidiary Defendants transferred their operations to an unaffiliated third party skilled nursing facility operator (the “Former Humboldt County Facilities”). On November 14, 2012, the Defendants filed a motion to terminate the injunction and vacate the final judgment in the Humboldt County Action. Based upon compliance with the injunction through the requisite eighteen-month period, on December 21, 2012, the Superior Court of California, Humboldt County granted the Defendants' motion for early termination of the injunction, and the injunction has now ended with respect to the 17 California nursing facilities that the subsidiary Defendants still operate. In its order, the court determined that the injunction termination did not apply to the Former Humboldt County Facilities. However, the 2010 court-approved stipulation and order establishing the injunction provides that the injunction applies to the named defendants and any successor licensees of the applicable nursing facilities, but only if those successor licensees are affiliates of the named defendants. As noted above, the Former Humboldt County Facilities have been operated by an unaffiliated third party since April 2011. Therefore, under the terms of the injunction it does not apply to the Former Humboldt County Facilities unless an affiliate of the Defendants operates them. Pursuant to the BMFEA matter discussed below the California theories in this context were released in February 2013.
BMFEA Matter
On April 15, 2009, two of Skilled's wholly-owned companies, Eureka Healthcare and Rehabilitation Center, LLC (“EHRC”), which at the time operated Eureka Healthcare and Rehabilitation Center (the "Facility"), and Skilled Healthcare, LLC (“SHC”), the administrative services provider for the Facility, were served with a search warrant that related to an investigation of the Facility by the BMFEA. The search warrant related to, among other things, records, property and information regarding certain enumerated patients of the Facility and covered the period from January 1, 2007 through the date of the search. On October 31, 2012, the BMFEA filed a criminal complaint (the “BMFEA Action”) in California Superior Court, Humboldt County against EHRC, SHC and Skilled alleging elder endangerment in nine misdemeanor counts under Penal Code Section 368(c) and two felony counts under Penal Code Section 368(b)(1) related to the care of certain patients at the Facility in 2008. No individuals were named as defendants in the complaint. The Company disputed the BMFEA's theories of alleged criminal liability and vigorously defended the action. The charges filed by the BMFEA, if proven, would have carried fines of up to $6,000 for each of the two felony counts and $2,000 for each of the nine misdemeanor counts. Convictions could also lead to exclusion from participation in federal healthcare programs under federal laws such as the Federal False Claims Act and the Civil Monetary Penalty Law, which could be materially adverse to Skilled's business. EHRC transferred its operations in April 2011 to an unaffiliated third party skilled nursing facility operator, and has not had any ongoing operations since that time.
On February 15, 2013, the parties reached a mutually satisfactory settlement of the BMFEA Action. Pursuant to the settlement: (i) Skilled and SHC were dismissed from the case with prejudice; (ii) EHRC pled no contest to a single misdemeanor count of elder endangerment under Penal Code Section 368(c) and agreed to pay a statutory fine of $680, pay $145,000 to the California Attorney General for its costs of investigation, and to serve two (2) years of summary probation; and (iii) the California Attorney General granted Skilled, SHC, and twenty-five (25) of their affiliates who currently or formerly operated skilled nursing facilities in California, a release of any potential liability to the California Attorney General under certain civil statutes based upon conduct occurring through the effective date of the settlement (including the FCA theories discussed under Humboldt County Litigation above). The court accepted EHRC's misdemeanor plea and the other relevant terms of the settlement on February 15, 2013. Notwithstanding EHRC's no contest plea to the single misdemeanor charge, the Company, SHC and EHRC continue to deny any liability for the allegations in the BMFEA Action. The release granted by the California Attorney General may not apply to the DOJ should it choose to pursue action against us.
Pursuant to the settlement, Skilled, SHC and their twenty (20) affiliated current California skilled nursing facility operators also agreed to a 2-year staffing agreement (the “2013 Staffing Agreement”) with the California Attorney General that essentially continues the requirements of the staffing-related injunction that was in effect until December 2012 as a result of the September 2010 settlement of the Humboldt County Action. Similar to the former staffing-related injunction, the 2013 Staffing Agreement requires the applicable nursing facility operators to provide a minimum of 3.2 nursing hours per patient day as required by applicable California regulation and to adhere to related regulatory requirements, as well as to submit to periodic compliance audits of the same. Unlike the former staffing-related injunction, however, the 2013 Staffing Agreement does not provide for early termination based on demonstrated compliance and does not contain a minimum spend requirement. To date the 2013 Staffing Agreement has not, and the Company does not believe it will, require the Company or its affected affiliates to incur any material staffing or other costs beyond what they would otherwise incur in the ordinary course of business.
F-31
Insurance
The Company maintains various insurance and self-insurance for property and casualty including workers' compensation and general and professional liability. The Company believes that its insurance programs are adequate and appropriate, and where there has not been a direct transfer of risk to the insurance carrier, the Company recognizes a liability in the consolidated financial statements.
Workers' Compensation. The Company has maintained workers' compensation insurance where statutorily required. The commercial workers' compensation insurance purchased is loss sensitive in nature. As a result, the Company is responsible for adverse loss development. The Company self-insures the first unaggregated $1.0 million per workers' compensation claim for all operations. The Company has elected not to carry workers' compensation insurance in Texas as a qualified non-subscriber and may be liable for negligence claims that are asserted against it by its Texas-based employees. The Company recognizes a liability in its financial statements for its estimated self-insured workers' compensation risks. Historically, estimated liabilities have been sufficient to cover actual claims. Effective January 1, 2014 the Company self-insures its workers compensation for all its business operations, other than those based in Texas, through its wholly-owned insurance company based on actuarially determined estimates.
General and Professional Liability. The Company's services subject it to certain liability risks. Malpractice and similar claims may be asserted against the Company if its services are alleged to have resulted in patient injury or other harm. The Company is subject to malpractice and similar claims and other litigation in the ordinary course of business.
The Company purchases excess liability policies for claims in excess of its unaggregated self insured retention for all businesses. The Company also self-insures professional liability claims through its wholly-owned insurance company.
The Company's Hospice and home health businesses are insured under a separate general and professional liability insurance policy. The excess liability coverage referenced above is also applicable to this policy.
Employee Medical Insurance. Medical preferred provider option programs are offered as a component of the Company's employee benefits. The Company retains a self-insured amount up to a contractual stop loss amount of $0.25 million deductible for its preferred provider organization plan. All other employee medical plans are guaranteed cost plans.
Actuarial Analysis. Changes in actuarial estimates are reviewed on a quarterly basis for both general and professional liability and Employee Medical Insurance claims and semi-annually for workers compensation claims. Variances in expected ultimate liabilities are recognized accordingly.
A summary of the liabilities related to insurance risks are as follows (dollars in thousands):
As of December 31, 2014 | As of December 31, 2013 | ||||||||||||||||||||||||||||||
General and Professional | Employee Medical | Workers’ Compensation | Total | General and Professional | Employee Medical | Workers’ Compensation | Total | ||||||||||||||||||||||||
Current | $ | 7,868 | (1) | $ | 1,551 | (2) | $ | 6,251 | (2) | $ | 15,670 | $ | 8,228 | (1) | $ | 2,446 | (2) | $ | 3,178 | (2) | $ | 13,852 | |||||||||
Non-current | 13,710 | — | 15,646 | 29,356 | 12,762 | — | 16,772 | 29,534 | |||||||||||||||||||||||
$ | 21,578 | $ | 1,551 | $ | 21,897 | $ | 45,026 | $ | 20,990 | $ | 2,446 | $ | 19,950 | $ | 43,386 | ||||||||||||||||
(1) | Included in accounts payable and accrued liabilities. |
(2) | Included in employee compensation and benefits. |
Hallmark Indemnification
Hallmark, the Company's wholly-owned rehabilitation services company, provides physical, occupational and speech therapy services to various unaffiliated skilled nursing facilities. These unaffiliated skilled nursing facilities are reimbursed for these services from the Medicare Program and other third-party payors. Hallmark has indemnified these unaffiliated skilled nursing facilities from a portion of certain disallowances of these services. Additionally, to the extent a Recovery Audit Contractor ("RAC") or other regulatory authority or contractor is successful in making a claim for recoupment of revenue from any of these skilled nursing facilities, Hallmark will typically be required to indemnify them against their charges associated with this loss. No material indemnification payments were required to be made in 2014.
Financial Guarantees
Substantially of all Skilled's wholly-owned subsidiaries guarantee the Company's first lien senior secured credit facility, excluding the subsidiaries that are pledged as collateral for the ten mortgage loans insured by the U.S. Department of Housing
F-32
and Urban Development Program ("HUD") and the ten facilities pledged to MidCap Financial as collateral for the MidCap Financial credit facility. These guarantees are full and unconditional and joint and several. Other subsidiaries of Skilled that are not guarantors are considered minor. On May 12, 2012, the Company redeemed the entire $130.0 million of its then outstanding 11.0% senior subordinated notes due 2014 (the "2014 Notes"). The 2014 Notes were guaranteed by substantially all of Skilled's wholly-owned subsidiaries on terms similar to their guarantees of the Company's first lien senior secured credit facility.
Purchase Commitment
As of December 31, 2014, the Company had no outstanding purchase commitments, except as noted under Leases above.
14. | Material Transactions with Related Parties |
Agreement with Onex Partners Manager LP
Upon completion of the Transactions, the Company entered into an agreement with Onex Partners Manager LP, or Onex Manager, a wholly-owned subsidiary of Onex Corporation. In exchange for providing the Company with corporate finance and strategic planning consulting services, the Company paid Onex Manager an annual fee of $0.5 million. The aforementioned agreement with Onex Manager was terminated upon the closing of the Combination on February 2, 2015.
15. | Investment in Unconsolidated Joint Venture |
Since 1996, the Company had a 50% equity interest in APS - Summit Care Pharmacy, LLC, or APS - Summit Care, which is a joint venture that serves the pharmaceutical needs of a limited number of the Company's affiliated Texas operations, as well as a number of other unaffiliated customers. The remaining 50% equity interest in APS - Summit Care is owned by an unaffiliated third party. APS - Summit Care operates a pharmacy in Austin, Texas, through which the Company's affiliated operations pay market value for prescription drugs and receives a 50% share of the net income related to the joint venture. The Company’s investment balance at December 31, 2014 and 2013 of $4.1 million and $5.6 million, respectively, is included in other assets in the consolidated balance sheets. The following tables provide summarized information from the balance sheet and statement of earnings for APS - Summit Care as of December 31:
Statement of Earnings
(In thousands)
Year ended December 31, | ||||||||||||
2014 | 2013 | 2012 | ||||||||||
Sales | $ | 16,021 | $ | 26,900 | $ | 27,802 | ||||||
Gross Profit | 2,789 | 4,559 | 2,969 | |||||||||
Net Income | $ | 2,255 | $ | 3,374 | $ | 3,040 | ||||||
Balance Sheet
(In thousands)
December 31, | ||||||||
2014 | 2013 | |||||||
Current Assets | $ | 3,114 | $ | 3,518 | ||||
Non-Current Assets | 1,177 | 1,078 | ||||||
Current Liabilities | 174 | 96 | ||||||
16. | Defined Contribution Plan |
The Company sponsors a defined contribution plan covering substantially all employees who meet certain eligibility requirements. The Company did not match employee contributions for the defined contribution plan in 2014 and 2013.
F-33
17. | Quarterly Financial Information (Unaudited) |
The following table summarizes unaudited quarterly financial data for the years ended December 31, 2014 and 2013 (dollars in thousands, except share and per share data):
Three Months Ended, | |||||||||||||||
December 31 | September 30 | June 30 | March 31 | ||||||||||||
2014 | |||||||||||||||
Revenue | $ | 210,359 | $ | 208,618 | $ | 206,979 | $ | 207,300 | |||||||
Total expense | 203,941 | 200,810 | 202,738 | 197,266 | |||||||||||
Other expenses, net of other income | (7,577 | ) | (7,315 | ) | (8,366 | ) | (7,398 | ) | |||||||
(Loss) income from continuing operations before provision (benefit) for income taxes | (1,159 | ) | 493 | (4,125 | ) | 2,636 | |||||||||
(Benefit) provision for income taxes | (1,094 | ) | (150 | ) | (1,345 | ) | 1,341 | ||||||||
(Loss) income from continuing operations | (65 | ) | 643 | (2,780 | ) | 1,295 | |||||||||
Loss from discontinued operations, net of tax | — | — | — | — | |||||||||||
Net (loss) income | $ | (65 | ) | $ | 643 | $ | (2,780 | ) | $ | 1,295 | |||||
Earnings (loss) per share, basic: | |||||||||||||||
Earnings (loss) per common share from continuing operations | $0.00 | $ | 0.02 | $ | (0.07 | ) | $ | 0.03 | |||||||
Loss per common share from discontinued operations | — | — | — | — | |||||||||||
Earnings (loss) per share | $0.00 | $ | 0.02 | $ | (0.07 | ) | $ | 0.03 | |||||||
Earnings (loss) per share, diluted: | |||||||||||||||
Earnings (loss) per common share from continuing operations | $0.00 | $ | 0.02 | $ | (0.07 | ) | $ | 0.03 | |||||||
Loss per common share from discontinued operations | — | — | — | — | |||||||||||
Earnings (loss) per share | $0.00 | $ | 0.02 | $ | (0.07 | ) | $ | 0.03 | |||||||
Weighted-average common shares outstanding, basic | 38,218 | 38,207 | 38,098 | 37,972 | |||||||||||
Weighted-average common shares outstanding, diluted | 38,218 | 38,463 | 38,098 | 38,202 | |||||||||||
Three Months Ended, | |||||||||||||||
December 31 | September 30 | June 30 | March 31 | ||||||||||||
2013 | |||||||||||||||
Revenue | $ | 208,278 | $ | 208,744 | $ | 210,192 | $ | 215,058 | |||||||
Total expense | 197,727 | 217,650 | 197,995 | 203,375 | |||||||||||
Other expenses, net of other income | (8,883 | ) | (8,357 | ) | (9,270 | ) | (8,104 | ) | |||||||
Income (loss) from continuing operations before provision for income taxes | 1,668 | (17,263 | ) | 2,927 | 3,579 | ||||||||||
Provision (benefit) for income taxes | 1,035 | (5,324 | ) | 1,139 | 245 | ||||||||||
Income (loss) from continuing operations | 633 | (11,939 | ) | 1,788 | 3,334 | ||||||||||
Loss from discontinued operations, net of tax | (3,635 | ) | (136 | ) | (265 | ) | (264 | ) | |||||||
Net (loss) income | $ | (3,002 | ) | $ | (12,075 | ) | $ | 1,523 | $ | 3,070 | |||||
Earnings (loss) per share, basic: | |||||||||||||||
Earnings (loss) per common share from continuing operations | $ | 0.02 | $ | (0.32 | ) | $ | 0.05 | $ | 0.08 | ||||||
Loss per common share from discontinued operations | (0.10 | ) | — | (0.01 | ) | — | |||||||||
(Loss) earnings per share | $ | (0.08 | ) | $ | (0.32 | ) | $ | 0.04 | $ | 0.08 | |||||
Earnings (loss) per share, diluted: | |||||||||||||||
Earnings (loss) per common share from continuing operations | $ | 0.02 | $ | (0.32 | ) | $ | 0.05 | $ | 0.08 | ||||||
Loss per common share from discontinued operations | (0.10 | ) | — | (0.01 | ) | — | |||||||||
(Loss) earnings per share | $ | (0.08 | ) | $ | (0.32 | ) | $ | 0.04 | $ | 0.08 | |||||
Weighted-average common shares outstanding, basic | 37,431 | 37,499 | 37,646 | 37,557 | |||||||||||
Weighted-average common shares outstanding, diluted | 37,431 | 37,499 | 38,186 | 38,034 | |||||||||||
F-34
Earnings per basic and diluted share are computed independently for each of the quarters presented based upon basic and diluted shares outstanding per quarter and therefore may not sum to the totals for the year.
18. Subsequent Event - Combination with FC-GEN
On August 18, 2014, Skilled entered into a Purchase and Contribution Agreement with FC-GEN for the Combination of the businesses and operations of FC-GEN and Skilled. The closing of the Combination transaction occurred on February 2, 2015. After completion of the transaction, the combined company operates under the name Genesis Healthcare, Inc. and the Class A common stock of Skilled continues to trade on the NYSE.
In connection with the Combination on February 2, 2015, Skilled's first lien senior secured term loan, Skilled's mortgage loans, and asset based revolving credit facility were repaid.
(a) | 2. Financial Statement Schedule: |
SKILLED HEALTHCARE GROUP, INC.
SCHEDULE II—VALUATION ACCOUNTS
(in thousands)
Balance at Beginning of Period | Charged to Costs and Expenses | Deductions(1) | Balance at End of Period | |||||||||||||
Accounts receivable allowances | ||||||||||||||||
Year Ended December 31, 2014 | $ | 16,665 | $ | 14,125 | $ | (12,860 | ) | $ | 17,930 | |||||||
Year Ended December 31, 2013 | $ | 15,646 | $ | 14,396 | $ | (13,377 | ) | $ | 16,665 | |||||||
Year Ended December 31, 2012 | $ | 15,238 | $ | 7,409 | $ | (7,001 | ) | $ | 15,646 | |||||||
Notes receivable allowances | ||||||||||||||||
Year Ended December 31, 2014 | $ | — | $ | — | $ | — | ||||||||||
Year Ended December 31, 2013 | $ | 130 | $ | — | $ | (130 | ) | $ | — | |||||||
Year Ended December 31, 2012 | $ | 175 | $ | — | $ | (45 | ) | $ | 130 | |||||||
________________
(1) | Uncollectible accounts written off, net of recoveries |
F-35