Attached files
| file | filename |
|---|---|
| 8-K - FORM 8-K - STONERIDGE INC | v456632_8k.htm |

1 The information in this document belongs to Stoneridge, Inc. or its subsidiaries and may be confidential. This document and inf ormation in it may not be copied, reproduced, revealed or appropriated, either in whole or in part, without the prior written consent of Stoneridge, Inc. | STONERIDGE Technologies In Motion Deutsche Bank Conference January 10, 2017 Exhibit 99.1

2 The information in this document belongs to Stoneridge, Inc. or its subsidiaries and may be confidential. This document and inf ormation in it may not be copied, reproduced, revealed or appropriated, either in whole or in part, without the prior written consent of Stoneridge, Inc. | STONERIDGE Forward Looking Statements Statements in this presentation that are not historical facts are forward - looking statements, which involve risks and uncertaint ies that could cause actual events or results to differ materially from those expressed or implied by the statements. Important factors that may cause actual results to differ materially from those in th e f orward - looking statements include, among other factors, the loss or bankruptcy of a major customer; the costs and timing of facility closures, business realignment or similar actions; a significant change in me dium - and heavy - duty truck, automotive or agricultural and off - highway vehicle production; our ability to achieve cost reductions that offset or exceed customer - mandated selling price reductions; a significa nt change in general economic conditions in any of the various countries in which Stoneridge operates; labor disruptions at Stoneridge’s facilities or at any of Stoneridge’s significant customers or supplier s; the ability of suppliers to supply Stoneridge with parts and components at competitive prices on a timely basis; the amount of Stoneridge’s indebtedness and the restrictive covenants contained in the agr eements governing its indebtedness, including its asset - based credit facility and senior secured notes; customer acceptance of new products; capital availability or costs, including changes in interest r ate s or market perceptions; the failure to achieve successful integration of any acquired company or business; the occurrence or non - occurrence of circumstances beyond Stoneridge’s control; and the items descr ibed in “Risk Factors” and other uncertainties or risks discussed in Stoneridge’s periodic and current reports filed with the Securities and Exchange Commission. Important factors that could cause the performance of the commercial vehicle and automotive industry to differ materially fro m t hose in the forward - looking statements include factors such as (1) continued economic instability or poor economic conditions in the United States and global markets, (2) changes in economic conditions, ho using prices, foreign currency exchange rates, commodity prices, including shortages of and increases or volatility in the price of oil, (3) changes in laws and regulations, (4) the state of the credi t m arkets, (5) political stability, (6) international conflicts and (7) the occurrence of force majeure events. These factors should not be construed as exhaustive and should be considered with the other cautionary statements in Stonerid ge’ s filings with the Securities and Exchange Commission. Forward - looking statements are not guarantees of future performance; Stoneridge’s actual results of operations, financial condit ion and liquidity, and the development of the industry in which Stoneridge operates may differ materially from those described in or suggested by the forward - looking statements contained in this presenta tion. In addition, even if Stoneridge’s results of operations, financial condition and liquidity, and the development of the industry in which Stoneridge operates are consistent with the forward - looking statemen ts contained in this presentation, those results or developments may not be indicative of results or developments in subsequent periods. This presentation contains time - sensitive information that reflects management’s best analysis only as of the date of this prese ntation. Any forward - looking statements in this presentation speak only as of the date of this presentation, and Stoneridge undertakes no obligation to update such statements. Comparisons of results for cu rrent and any prior periods are not intended to express any future trends or indications of future performance, unless expressed as such, and should only be viewed as historical data. Stoneridge does not undertake any obligation to publicly update or revise any forward - looking statement as a result of new infor mation, future events or otherwise, except as otherwise required by law. Rounding Disclosure: There may be slight immaterial differences between figures represented in our public filings compared t o w hat is shown in this presentation. The differences are the a result of rounding due to the representation of values in millions rather than thousands in public filings.

3 The information in this document belongs to Stoneridge, Inc. or its subsidiaries and may be confidential. This document and inf ormation in it may not be copied, reproduced, revealed or appropriated, either in whole or in part, without the prior written consent of Stoneridge, Inc. | STONERIDGE Overview Stoneridge designs and manufactures highly engineered sensing, communication, and control technologies to satisfy the global vehicle market needs for lower emissions, improved fuel economy, safety, security and information. We are Fast, Focused and Flexible. • Company founded in 1965 • Publicly traded on the NYSE (SRI) • Headquarters: Novi, Michigan, USA • 2015 Revenue: $645 Million • Employees: 4,200

4 The information in this document belongs to Stoneridge, Inc. or its subsidiaries and may be confidential. This document and inf ormation in it may not be copied, reproduced, revealed or appropriated, either in whole or in part, without the prior written consent of Stoneridge, Inc. | STONERIDGE Global Reach Manufacturing Site Design Center Sales & Technical Support 10 Manufacturing Sites, 9 Design Centers and 19 Sales and Technical Support Sites
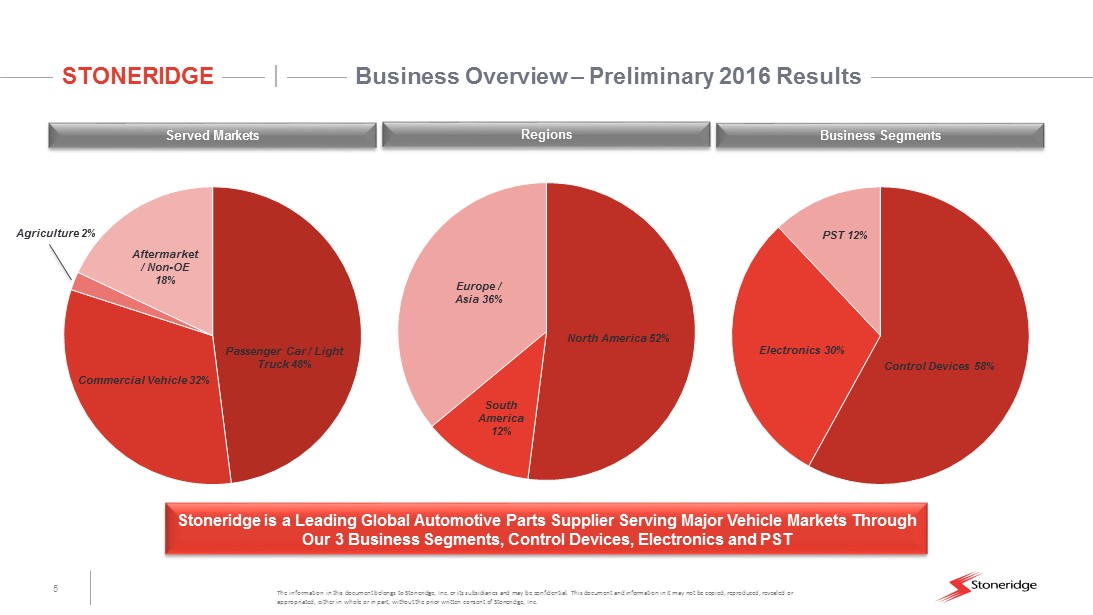
5 The information in this document belongs to Stoneridge, Inc. or its subsidiaries and may be confidential. This document and inf ormation in it may not be copied, reproduced, revealed or appropriated, either in whole or in part, without the prior written consent of Stoneridge, Inc. | STONERIDGE Business Overview – Preliminary 2016 Results Served Markets Business Segments Regions Stoneridge is a Leading Global Automotive Parts Supplier Serving Major Vehicle Markets Through Our 3 Business Segments, Control Devices, Electronics and PST South America 12% Passenger Car / Light Truck 48% Commercial Vehicle 32% Aftermarket / Non - OE 18% North America 52% South America 12% Europe / Asia 36% Control Devices 58% Electronics 30% PST 12% Agriculture 2%

6 The information in this document belongs to Stoneridge, Inc. or its subsidiaries and may be confidential. This document and inf ormation in it may not be copied, reproduced, revealed or appropriated, either in whole or in part, without the prior written consent of Stoneridge, Inc. | STONERIDGE Current Product Portfolio Instrumentation and Displays ECUs and Power Modules Sensors Emissions/Position/Temp/Level Telematics and Tachographs Actuators Stoneridge’s Products Comprise the Basic Elements of Every Vehicle’s Electrical System and Control Architecture

7 The information in this document belongs to Stoneridge, Inc. or its subsidiaries and may be confidential. This document and inf ormation in it may not be copied, reproduced, revealed or appropriated, either in whole or in part, without the prior written consent of Stoneridge, Inc. | STONERIDGE Changing our Customer Solution Set Build to Print Design to a Market Need Sub - System System Build to Print Increasingly own and develop IP Competitive intensity Development Capability and Capacity Higher Higher Lower Lower
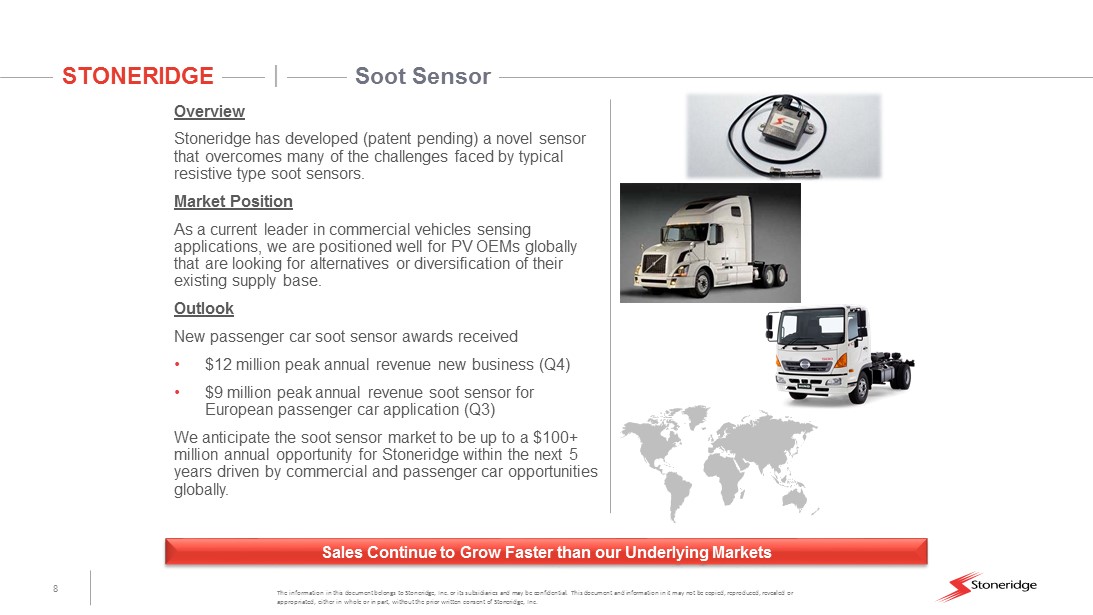
8 The information in this document belongs to Stoneridge, Inc. or its subsidiaries and may be confidential. This document and inf ormation in it may not be copied, reproduced, revealed or appropriated, either in whole or in part, without the prior written consent of Stoneridge, Inc. | STONERIDGE Soot Sensor Sales Continue to Grow Faster than our Underlying Markets Overview Stoneridge has developed (patent pending) a novel sensor that overcomes many of the challenges faced by typical resistive type soot sensors. Market Position As a current leader in commercial vehicles sensing applications, we are positioned well for PV OEMs globally that are looking for alternatives or diversification of their existing supply base. Outlook New passenger car soot sensor awards received • $12 million peak annual revenue new business (Q4) • $9 million peak annual revenue soot sensor for European passenger car application (Q3) We anticipate the soot sensor market to be up to a $100+ million annual opportunity for Stoneridge within the next 5 years driven by commercial and passenger car opportunities globally.

9 The information in this document belongs to Stoneridge, Inc. or its subsidiaries and may be confidential. This document and inf ormation in it may not be copied, reproduced, revealed or appropriated, either in whole or in part, without the prior written consent of Stoneridge, Inc. | STONERIDGE Electronic Logging Device (ELD) Recent Legislation will Drive ELD Growth. Stoneridge’s ELD Solution is Simple, Cost Effective and User Friendly, While Satisfying the ELD Mandate Overview Stoneridge’s Electronic Logging Device (ELD) provides fast compliance to a US mandate through a simple “plug & play” device that fits all trucks. It offers an easy - to - use driver interface via a mobile app and back office support. • ELDs are used to electronically record a US driver’s Record of Duty Status and help ensure compliance. • ELDs are a solution to a US legislative mandate in which fleets have until December 18, 2017 to implement certified solutions to record hours of service Outlook According to the US Federal Motor Carrier Safety Administration* “…3.51 million drivers would be subject to the rule, requiring the purchase of approximately 2.8 million ELDs” or similar upgrades. * Source : Regulatory Evaluation of Electronic Logging Devices and Hours of Service Supporting Documents Final Rule, Nov 2015

10 The information in this document belongs to Stoneridge, Inc. or its subsidiaries and may be confidential. This document and inf ormation in it may not be copied, reproduced, revealed or appropriated, either in whole or in part, without the prior written consent of Stoneridge, Inc. | STONERIDGE Mirror Eye TM Mirror Eye TM Benefits Safety • Reduction/Elimination of blind spot • Overtake warning • Vision enhancement • Expanded view • Improved aerodynamics & fuel economy Mirror Eye TM Features • High resolution cameras • Superior image quality • Power fold • Automatic panning Targeting 2019 – 2020 OEM Product Launch Received positive feedback at recent industry trade shows from OEMs and fleets Already completed follow - up technology showcase with large North American fleet from ATA Conference discussion MIrrorEye TM Wil l Evolve into a Significant Growth Opportunity
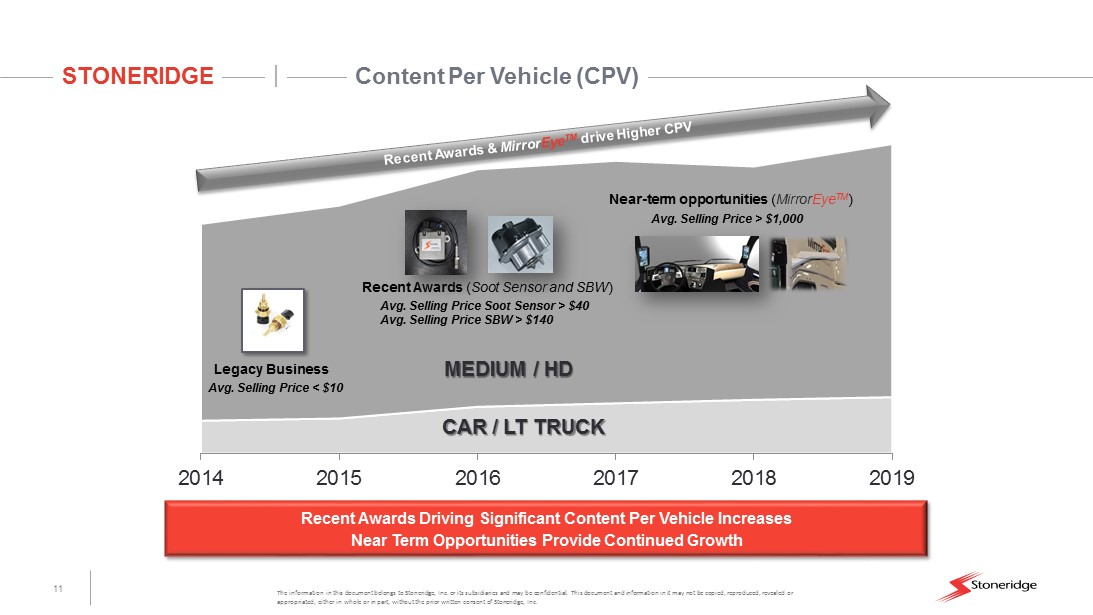
11 The information in this document belongs to Stoneridge, Inc. or its subsidiaries and may be confidential. This document and inf ormation in it may not be copied, reproduced, revealed or appropriated, either in whole or in part, without the prior written consent of Stoneridge, Inc. | STONERIDGE Content Per Vehicle (CPV) 2014 2015 2016 2017 2018 2019 MEDIUM / HD CAR / LT TRUCK Legacy Business Avg. Selling Price < $10 Recent Awards ( Soot Sensor and SBW ) Avg. Selling Price Soot Sensor > $40 Avg. Selling Price SBW > $140 Near - term opportunities ( Mirror Eye TM ) Avg. Selling Price > $1,000 Recent Awards Driving Significant Content Per Vehicle Increases Near Term Opportunities Provide Continued Growth

12 The information in this document belongs to Stoneridge, Inc. or its subsidiaries and may be confidential. This document and inf ormation in it may not be copied, reproduced, revealed or appropriated, either in whole or in part, without the prior written consent of Stoneridge, Inc. | STONERIDGE Market Segments Driving Growth INTELLIGENCE 8% CAGR SAFETY & SECURITY 7% CAGR EMISSIONS 16% CAGR FUEL ECONOMY 5% CAGR Electronics Actuation We are focused on growth markets Stoneridge Sales Growth 2015 2016 2017 2018 2019 2020 SOURCE: Dec 2015 IHS; 2015 LMCA, ACT Research, Company Data Sensing

13 The information in this document belongs to Stoneridge, Inc. or its subsidiaries and may be confidential. This document and inf ormation in it may not be copied, reproduced, revealed or appropriated, either in whole or in part, without the prior written consent of Stoneridge, Inc. | STONERIDGE Stoneridge Content at 2017 Detroit Auto Show Ford F - Series Trailer Tow Connector, CVV, Rotary 4x4 Control Switch, STPS Chevrolet Bolt Shift by Wire Ram Trucks FAD, Trailer Tow Connector Buick LaCrosse Shift by Wire, CVV Chevy / GMC Silverado / Sierra Front Axle Disconnect (FAD) , Trailer Tow Connector, CVV Ford Fusion Shift by Wire, Capacitive Keypad, STPS, Release Switches, CBV, VBV Cadillac XT5 Shift by Wire, CVV Chevrolet Corvette STPS, CVV Lincoln Continental Shift by Wire, Capacitive Keypad, Seat Track Position Sensor (STPS ), Vapor Bypass Valve (VBV), Canister Vent Valve (CVV)

14 The information in this document belongs to Stoneridge, Inc. or its subsidiaries and may be confidential. This document and inf ormation in it may not be copied, reproduced, revealed or appropriated, either in whole or in part, without the prior written consent of Stoneridge, Inc. | STONERIDGE Summary • Stoneridge is a global, publicly traded designer and manufacturer of highly engineered electrical and electronic components. • Product innovation will continue to drive increased content per vehicle (electronic shift by wire, soot sensor applications and Mirror Eye TM ) • Products positioned to drive above - market growth by focusing on advancing technologies related to vehicle intelligence, safety and security, emissions and fuel economy Continue to Drive Shareholder Value Through Strong Operating Results, New Business Wins, and Product Innovation

15 The information in this document belongs to Stoneridge, Inc. or its subsidiaries and may be confidential. This document and inf ormation in it may not be copied, reproduced, revealed or appropriated, either in whole or in part, without the prior written consent of Stoneridge, Inc. | STONERIDGE Technologies In Motion Financial Update
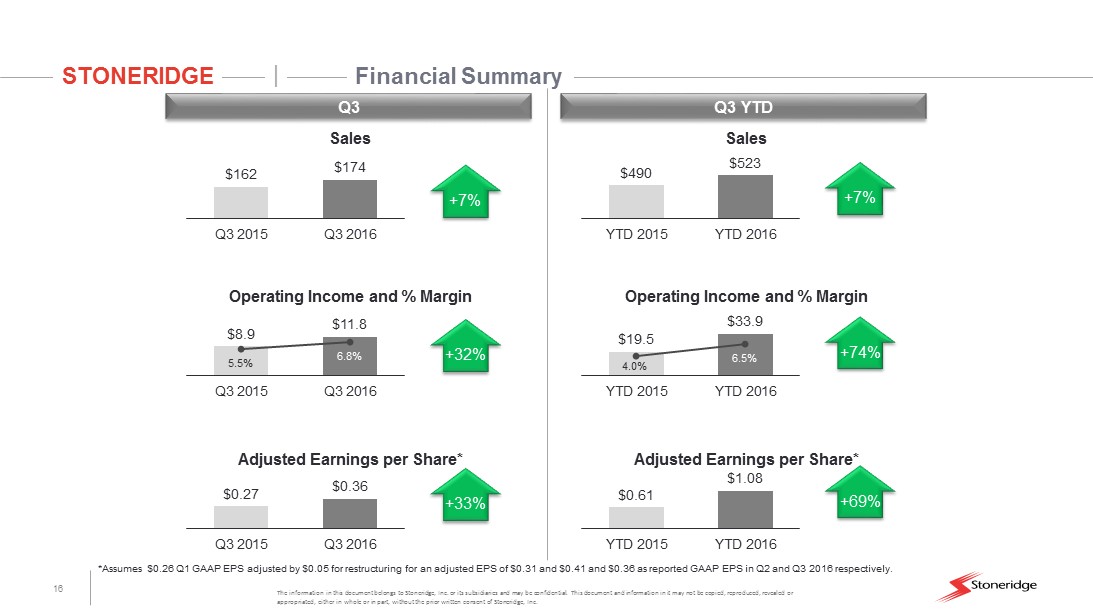
16 The information in this document belongs to Stoneridge, Inc. or its subsidiaries and may be confidential. This document and inf ormation in it may not be copied, reproduced, revealed or appropriated, either in whole or in part, without the prior written consent of Stoneridge, Inc. | STONERIDGE Financial Summary Q3 Q3 YTD Sales $0.27 $0.36 Q3 2015 Q3 2016 Operating Income and % Margin Adjusted Earnings per Share* $162 $174 Q3 2015 Q3 2016 $8.9 $11.8 5.5% 6.8% Q3 2015 Q3 2016 Sales $0.61 $1.08 YTD 2015 YTD 2016 Operating Income and % Margin Adjusted Earnings per Share* $490 $523 YTD 2015 YTD 2016 $19.5 $33.9 4.0% 6.5% YTD 2015 YTD 2016 +7% +32% +33% +7% +74% +69% *Assumes $0.26 Q1 GAAP EPS adjusted by $0.05 for restructuring for an adjusted EPS of $0.31 and $0.41 and $0.36 as reported GAAP EPS in Q2 and Q3 2016 respectively.

17 The information in this document belongs to Stoneridge, Inc. or its subsidiaries and may be confidential. This document and inf ormation in it may not be copied, reproduced, revealed or appropriated, either in whole or in part, without the prior written consent of Stoneridge, Inc. | STONERIDGE 2016 Full Year Guidance Current 2016 Guidance Commentary Sales $690 - $700 Million Expect to be at midpoint of range. Gross Margin 26.0% - 28.5% Expect to be at the high end of range. Operating Margin 6.0% - 7.3% Guidance implies improvement of 170 – 300 basis points vs. 2015. Adjusted EPS* $1.25 - $1.40 Expect to be at the high end of range. EBITDA 9.5% - 11.3% Guidance implies improvement of 190 – 370 basis points vs. 2015 . *Assumes $0.26 Q1 GAAP EPS adjusted by $0.05 for restructuring for an adjusted EPS of $0.31 and $0.41 and $0.36 as reported GAAP EPS in Q2 and Q3 2016 respectively. Expect to be within communicated ranges on all aspects of guidance

18 The information in this document belongs to Stoneridge, Inc. or its subsidiaries and may be confidential. This document and inf ormation in it may not be copied, reproduced, revealed or appropriated, either in whole or in part, without the prior written consent of Stoneridge, Inc. | STONERIDGE 2017 Full Year Volume Outlook Stoneridge’s Sales Mix Relative to Forecasted Vehicle Volumes Suggest Flat to (1%) Sales Growth Passenger Car Commercial Vehicle SOURCE: Dec 2016 IHS; Q4 2016 LMC, Company Data (Units in Millions) Stoneridge Global Vehicle Production 2017 2016E Sales 2016E 2017E B/(W) 2016 Europe 5.4% 21.4 21.8 1.8% Asia 15.4% 46.6 47.2 1.4% North America 78.8% 16.7 16.4 -1.5% South America 0.1% 2.7 2.7 0.6% Other 0.2% 2.3 2.3 0.7% Total 100.0% 89.7 90.5 0.9% (Units in Millions) Stoneridge Global Vehicle Production 2017 2016E Sales 2016E 2017E B/(W) 2016 Europe 68.3% 0.6 0.6 1.5% Asia 2.2% 1.6 1.6 0.4% North America 29.3% 0.5 0.4 -6.7% South America 0.1% 0.1 0.1 10.7% Other 0.1% 0.0 0.0 4.1% Total 100.0% 2.7 2.7 -0.4%
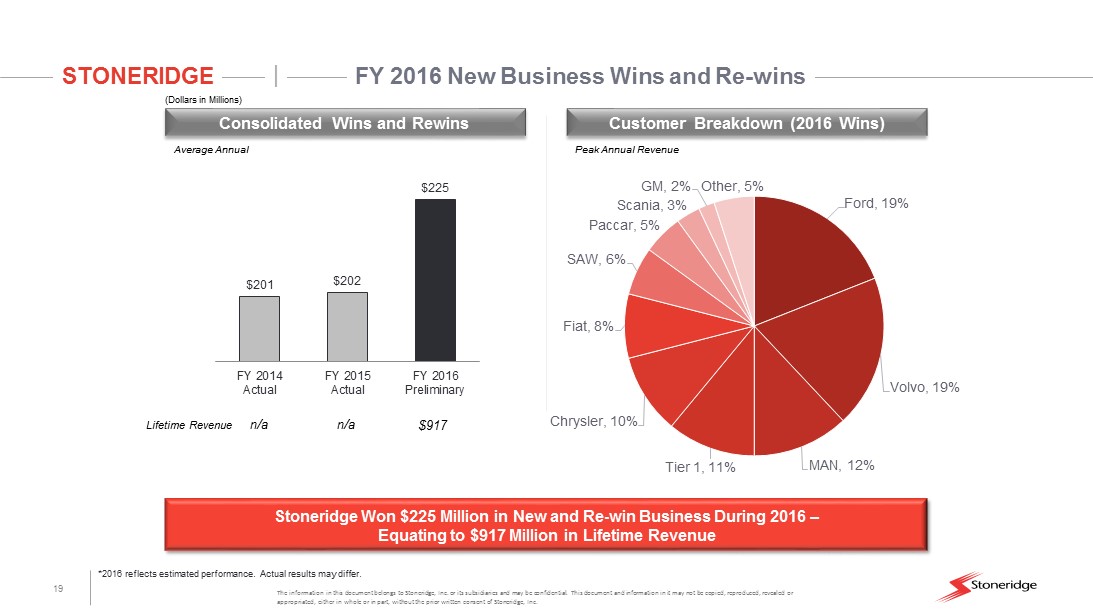
19 The information in this document belongs to Stoneridge, Inc. or its subsidiaries and may be confidential. This document and inf ormation in it may not be copied, reproduced, revealed or appropriated, either in whole or in part, without the prior written consent of Stoneridge, Inc. | STONERIDGE FY 2016 New Business Wins and Re - wins Lifetime Revenue $ 917 Average Annual Peak Annual Revenue (Dollars in Millions) Consolidated Wins and Rewins Customer Breakdown ( 2016 Wins) n/a n/a *2016 reflects estimated performance. Actual results may differ. Ford , 19% Volvo , 19% MAN , 12% Tier 1 , 11% Chrysler , 10% Fiat , 8% SAW , 6% Paccar , 5% Scania , 3% GM , 2% Other , 5% $201 $202 $225 FY 2014 Actual FY 2015 Actual FY 2016 Preliminary Stoneridge Won $225 Million in New and Re - win Business During 2016 – Equating to $917 Million in Lifetime Revenue

20 The information in this document belongs to Stoneridge, Inc. or its subsidiaries and may be confidential. This document and inf ormation in it may not be copied, reproduced, revealed or appropriated, either in whole or in part, without the prior written consent of Stoneridge, Inc. | STONERIDGE 2016 Revenues and New Business Wins by Region *2016 reflects estimated performance. Actual results may differ. Asia 8% North America 50% Europe 42% Asia 4% North America 71% Europe 25% 2016 OEM Sales by Region 2016 New Business Wins by Region Stoneridge 2016 New Business Wins Will Improve Regional Diversity vs. 2016 Represents approximately 1/3 of overall backlog

21 The information in this document belongs to Stoneridge, Inc. or its subsidiaries and may be confidential. This document and inf ormation in it may not be copied, reproduced, revealed or appropriated, either in whole or in part, without the prior written consent of Stoneridge, Inc. | STONERIDGE 2016 Preliminary Business Share by Customer FORD 18% TIER 1 11% SCANIA 7% GM 7% VOLVO 6% DAIMLER FREIGHTLINER 6% AAM 4% MAN 3% CHRYSLER 2% PACCAR 2% NAVISTAR 2% DEERE 1% CUMMINS 1% OTHER OE 12% PST AFTERMARKET AND OTHER AFTERMARKET 18% *Does not include revenue from Minda - Stoneridge JV, Based on preliminary 2016 estimates. Actual results may differ. Greater than 80% of sales are attributable to OEM customers which comprise forecasted backlog
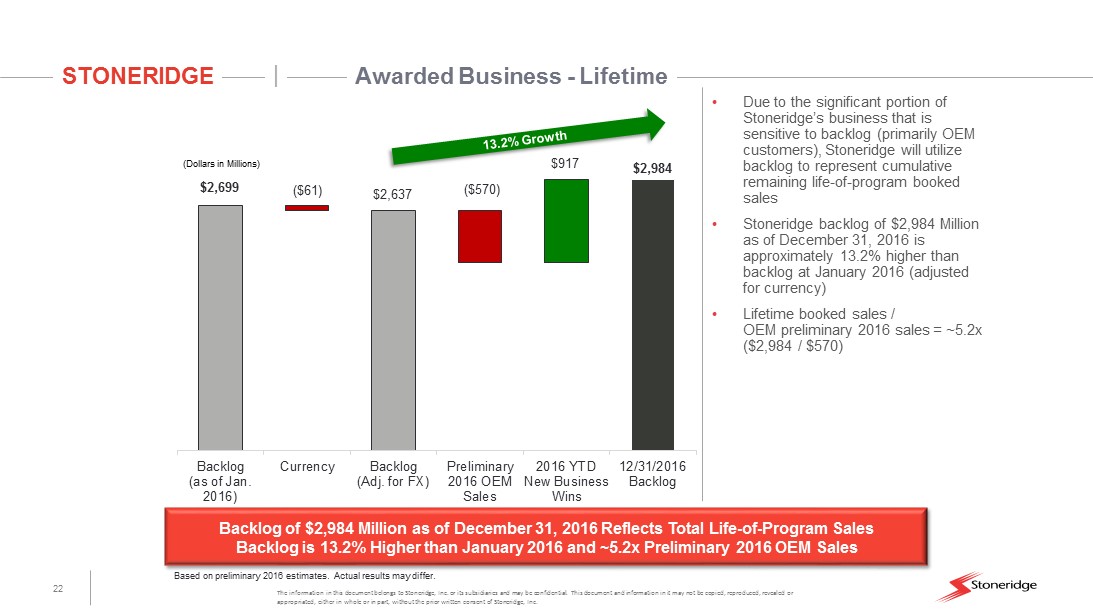
22 The information in this document belongs to Stoneridge, Inc. or its subsidiaries and may be confidential. This document and inf ormation in it may not be copied, reproduced, revealed or appropriated, either in whole or in part, without the prior written consent of Stoneridge, Inc. | STONERIDGE Awarded Business - Lifetime $2,699 $2,984 ($61) $2,637 ($570) $917 Backlog (as of Jan. 2016) Currency Backlog (Adj. for FX) Preliminary 2016 OEM Sales 2016 YTD New Business Wins 12/31/2016 Backlog (Dollars in Millions) • Due to the significant portion of Stoneridge’s business that is sensitive to backlog (primarily OEM customers), Stoneridge will utilize backlog to represent cumulative remaining life - of - program booked sales • Stoneridge backlog of $ 2,984 Million as of December 31, 2016 is approximately 13.2% higher than backlog at January 2016 (adjusted for currency) • Lifetime booked sales / OEM preliminary 2016 sales = ~5.2x ($2,984 / $570) Backlog of $ 2,984 Million as of December 31, 2016 Reflects Total Life - of - Program Sales Backlog is 13.2% Higher than January 2016 and ~5.2x Preliminary 2016 OEM Sales Based on preliminary 2016 estimates. Actual results may differ.

23 The information in this document belongs to Stoneridge, Inc. or its subsidiaries and may be confidential. This document and inf ormation in it may not be copied, reproduced, revealed or appropriated, either in whole or in part, without the prior written consent of Stoneridge, Inc. | STONERIDGE 2017 Preliminary Outlook $1.35 – $ 1.40 >$1.35 – $1.40 2016 Midpoint Product Sales Adjusted Earnings Per Share Net New Business Wins Pricing / Other 2016 High - End of Guidance 2017 Preliminary Outlook 2017 Preliminary Outlook Wage / Benefit Inflation Production Volumes Annual Impact Of PST Improvements Currency $695m Production Volumes >$695m Aftermarket Currency Pricing / Other Gross Margin Improvements

24 The information in this document belongs to Stoneridge, Inc. or its subsidiaries and may be confidential. This document and inf ormation in it may not be copied, reproduced, revealed or appropriated, either in whole or in part, without the prior written consent of Stoneridge, Inc. | STONERIDGE Potential Uses of Cash in 2017 Cash and favorable leverage position could allow Stoneridge to expand, diversify or complement existing and future product portfolio, geographic capabilities or strategic partnerships Potential M&A opportunities will be evaluated considering; • Alignment with Stoneridge’s long - term strategic vision • enhances our product portfolio • positively impacts product, customer or geographic diversification • helps us down the path toward higher value products / sub - systems / systems • Value of the standalone business • Existing and future synergy opportunities • Cultural fit of the potential target or partner • innovation • integrity Capital Structure As of September 30, 2016 U.S. Debt Revolver Capacity $300 Amount Drawn (87) Net Availability $213 Brazil Debt Gov’t Incentive Debt $(9) Other Debt (9) Total Brazil Debt $(18) U.S. Debt $(87) Brazil Debt (18) Total Debt (105) Total Cash $50 Net Debt $(55) (Dollars in Millions) Continue to Evaluate M&A Opportunities That Align with our Long - Term Strategic Plan

25 The information in this document belongs to Stoneridge, Inc. or its subsidiaries and may be confidential. This document and inf ormation in it may not be copied, reproduced, revealed or appropriated, either in whole or in part, without the prior written consent of Stoneridge, Inc. | STONERIDGE Financial Summary • Stoneridge has continued to drive financial performance through top - line growth and margin expansion, ultimately resulting in significant year - over - year operating income and EPS improvement • Stoneridge expects 2016 financial performance in - line with analyst expectations and previous guidance • Our strong new business wins have improved our geographic and customer diversity and expanded our sales backlog • Stoneridge expects continued strong financial performance in 2017 • As a result of a favorable leverage position and strong balance sheet, Stoneridge will continue to evaluate potential M&A options to maximize shareholder return and advance strategic priorities Stoneridge Expects Continued Financial Success Through Existing Channels and Will Continue to Evaluate Strategic Options to Maximize Shareholder Return