Attached files
| file | filename |
|---|---|
| EX-99.1 - EX-99.1 - SELECT MEDICAL HOLDINGS CORP | a17-1666_1ex99d1.htm |
| 8-K - 8-K - SELECT MEDICAL HOLDINGS CORP | a17-1666_18k.htm |
Exhibit 99.2
J.P. Morgan 35th Annual Healthcare Conference January 9-12, 2017
Forward-Looking Statements This presentation may contain forward-looking statements based on current management expectations. Numerous factors, including those related to market conditions and those detailed from time-to-time in the Company’s filings with the Securities and Exchange Commission, may cause results to differ materially from those anticipated in the forward-looking statements. Many of the factors that will determine the Company’s future results are beyond the ability of the Company to control or predict. These statements are subject to risks and uncertainties and, therefore, actual results may differ materially. Readers should not place undue reliance on forward-looking statements, which reflect management’s views only as of the date hereof. The Company undertakes no obligation to revise or update any forward-looking statements, or to make any other forward-looking statements, whether as a result of new information, future events or otherwise. All references to “Select” used throughout this presentation refer to Select Medical Holdings Corporation and its subsidiaries.
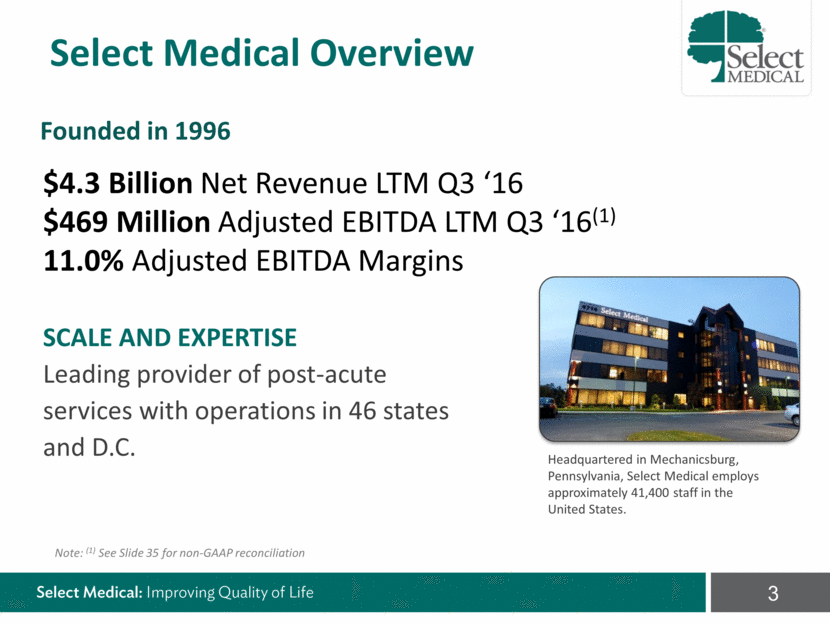
Headquartered in Mechanicsburg, Pennsylvania, Select Medical employs approximately 41,400 staff in the United States. SCALE AND EXPERTISE Leading provider of post-acute services with operations in 46 states and D.C. Note: (1) See Slide 35 for non-GAAP reconciliation Founded in 1996 $4.3 Billion Net Revenue LTM Q3 ‘16 $469 Million Adjusted EBITDA LTM Q3 ‘16(1) 11.0% Adjusted EBITDA Margins Select Medical Overview
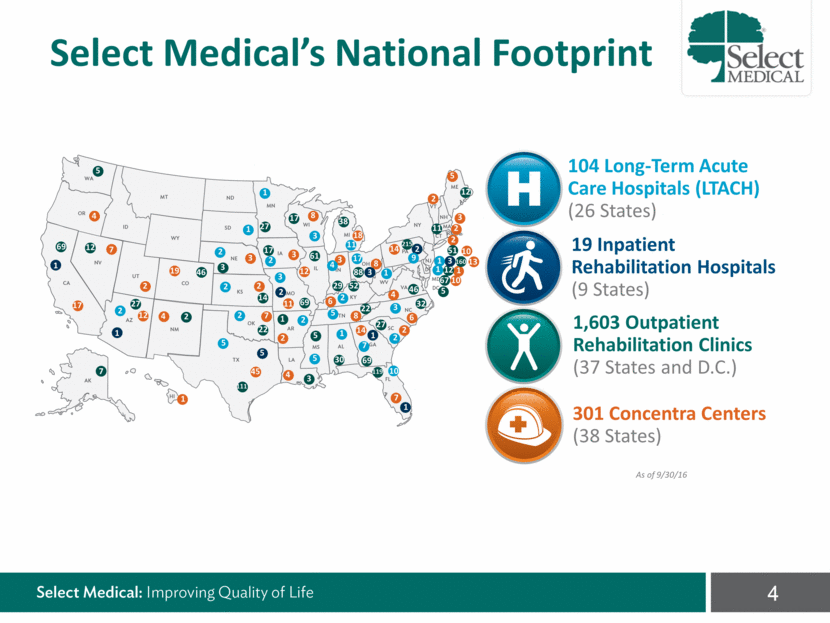
Select Medical’s National Footprint 104 Long-Term Acute Care Hospitals (LTACH) (26 States) 19 Inpatient Rehabilitation Hospitals (9 States) 1,603 Outpatient Rehabilitation Clinics (37 States and D.C.) 301 Concentra Centers (38 States) As of 9/30/16 4 17 4 7 19 2 4 12 1 45 4 2 7 2 11 3 3 8 12 3 18 14 8 8 14 2 6 4 7 5 2 3 2 2 10 13 1 10 6 12 27 2 46 3 69 17 27 38 61 88 29 27 69 119 32 46 215 5 67 12 160 51 11 111 7 1 22 14 22 52 12 69 30 5 3 5 17 1 2 5 1 3 2 3 1 2 2 2 1 1 2 2 5 2 5 1 5 10 7 2 3 1 2 4 3 11 17 9 1 1 3 1
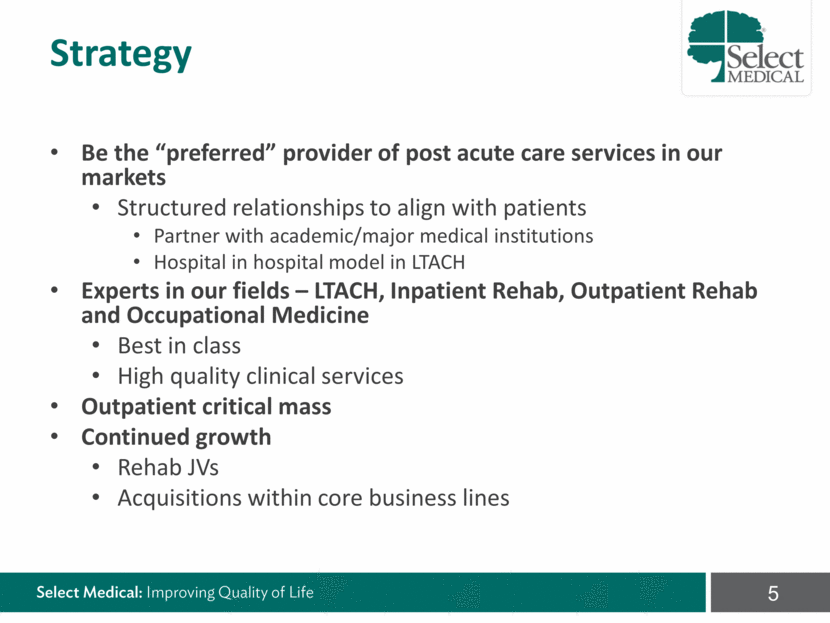
Strategy Be the “preferred” provider of post acute care services in our markets Structured relationships to align with patients Partner with academic/major medical institutions Hospital in hospital model in LTACH Experts in our fields – LTACH, Inpatient Rehab, Outpatient Rehab and Occupational Medicine Best in class High quality clinical services Outpatient critical mass Continued growth Rehab JVs Acquisitions within core business lines
Physiotherapy Acquisition (“Physio”) March 2016 acquired Physiotherapy Associates for $408.7 million 2015 Adjusted EBITDA of $32.7 million and expected synergies of $20.4 million Sale of Contract Therapy Business On March 31, 2016, completed the sale for $65.0 million Kindred Hospital Swaps In June, completed exchange transaction with Kindred to swap 5 LTACs to Kindred in exchange for 3 LTACs in Cleveland, OH and Atlanta, GA. Recent Developments
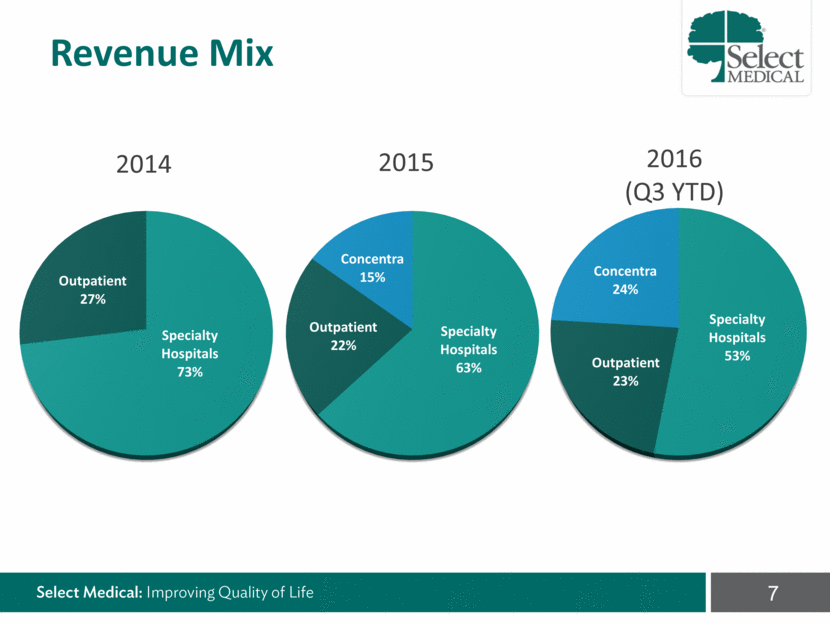
2014 2015 2016 (Q3 YTD) Revenue Mix Specialty Hospitals 73% Outpatient 27% Specialty Hospitals 63% Outpatient 22% Concentra 15% Specialty Hospitals 53% Outpatient 23% Concentra 24%
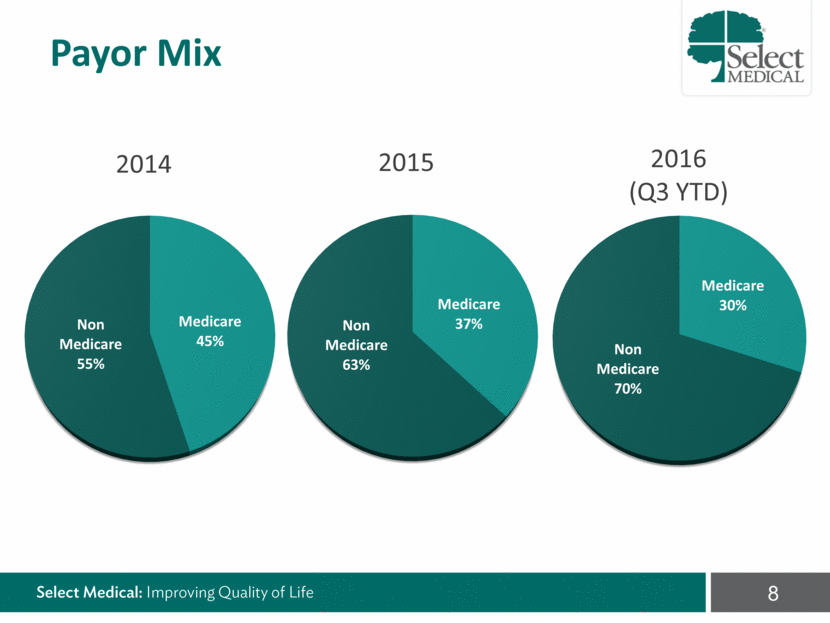
2014 2015 2016 (Q3 YTD) Payor Mix Medicare 45% Non Medicare 55% Medicare 30% Non Medicare 70% Medicare 37% Non Medicare 63%
[LOGO]
10 104 Long-Term Acute Care Hospitals (LTACH) (26 States) 2 2 2 1 1 2 2 5 2 5 1 5 10 7 2 3 1 2 4 3 11 17 9 1 1 3 As of 9/30/16 Select Medical LTAC Hospitals
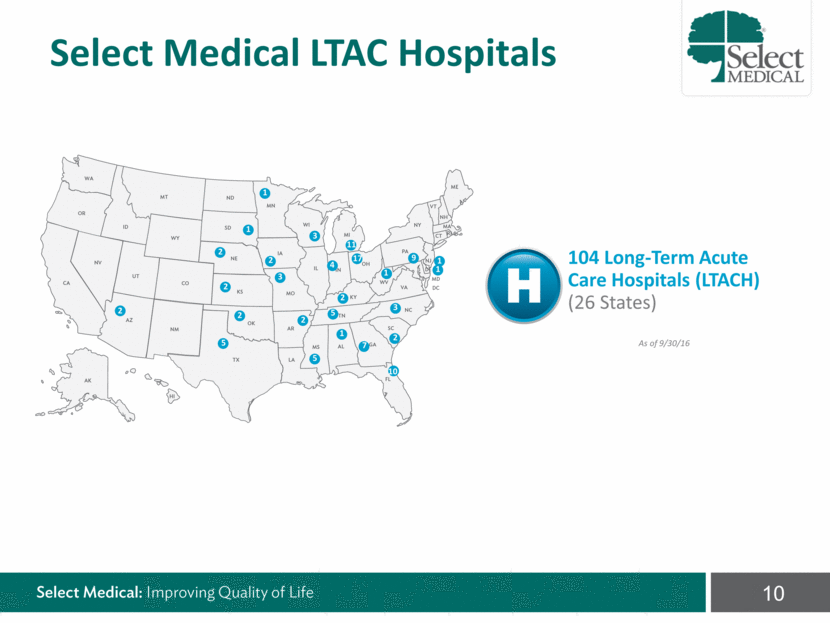
Major provider of LTACH services in U.S. 104 hospitals 77 hospital-in-hospital (2,814 beds); average size 37 beds 26 freestanding (1,472 beds); average size 57 beds 1 managed hospital Ownership of freestanding LTACHs 15 owned 11 leased LTACH Overview
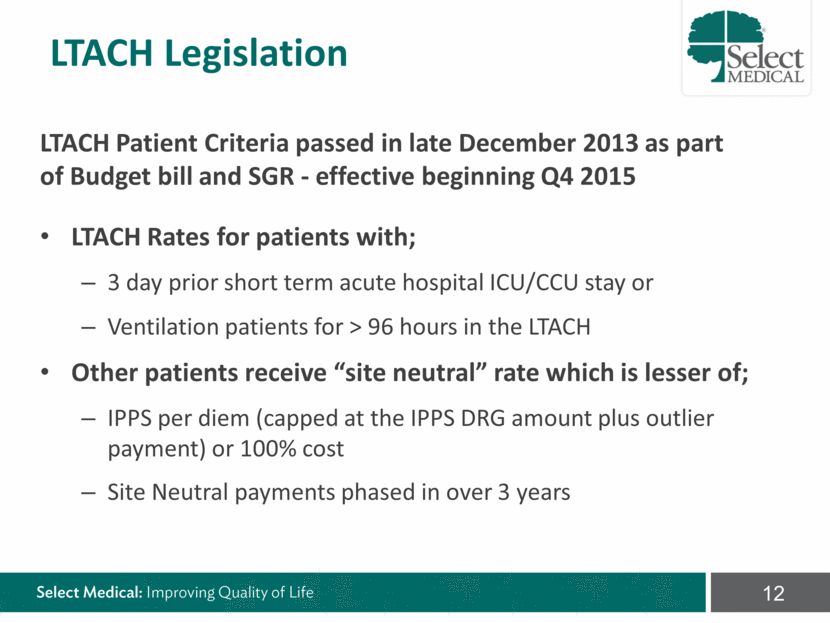
LTACH Patient Criteria passed in late December 2013 as part of Budget bill and SGR - effective beginning Q4 2015 LTACH Rates for patients with; 3 day prior short term acute hospital ICU/CCU stay or Ventilation patients for > 96 hours in the LTACH Other patients receive “site neutral” rate which is lesser of; IPPS per diem (capped at the IPPS DRG amount plus outlier payment) or 100% cost Site Neutral payments phased in over 3 years LTACH Legislation
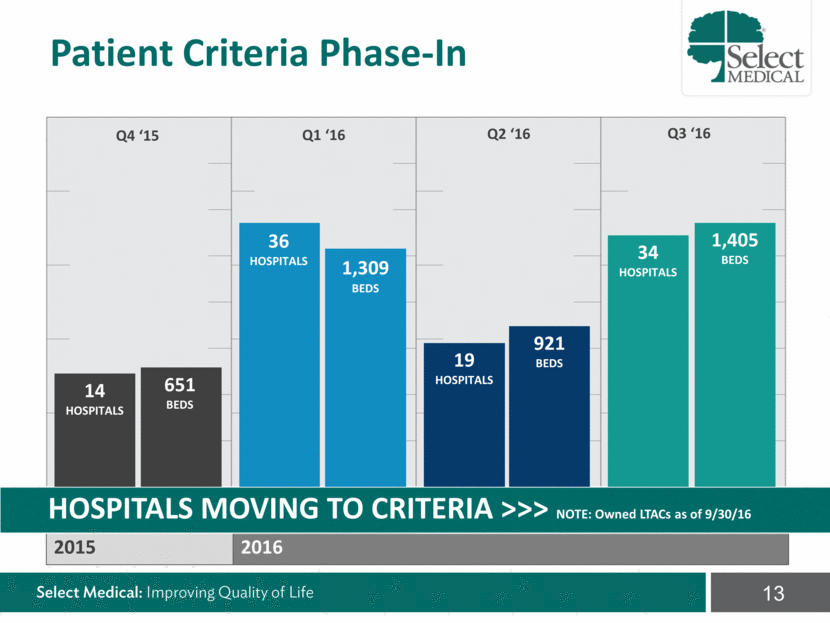
HOSPITALS MOVING TO CRITERIA >>> NOTE: Owned LTACs as of 9/30/16 2015 2016 14 HOSPITALS 651 BEDS 36 HOSPITALS 1,309 BEDS 19 HOSPITALS 921 BEDS 34 HOSPITALS 1,405 BEDS Q4 ‘15 Q1 ‘16 Q2 ‘16 Q3 ‘16 Patient Criteria Phase-In
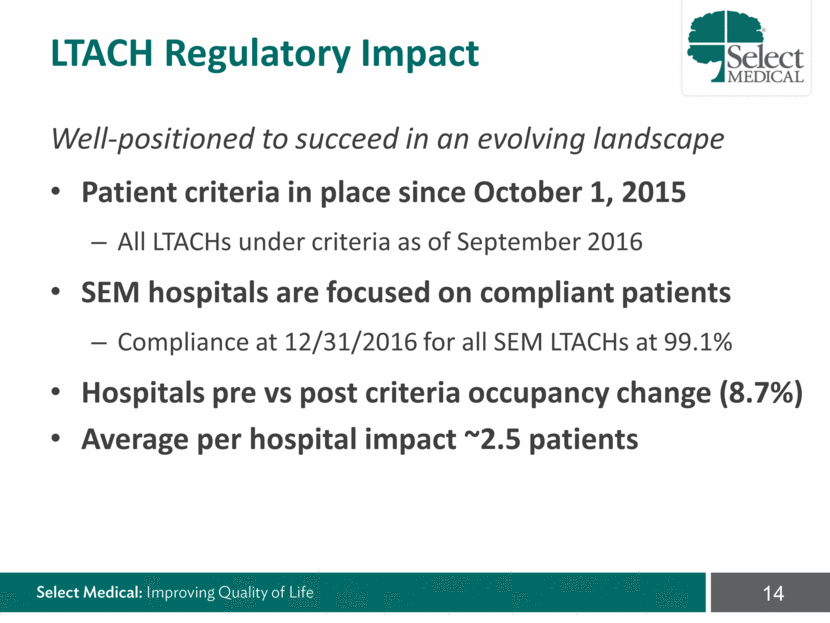
Well-positioned to succeed in an evolving landscape Patient criteria in place since October 1, 2015 All LTACHs under criteria as of September 2016 SEM hospitals are focused on compliant patients Compliance at 12/31/2016 for all SEM LTACHs at 99.1% Hospitals pre vs post criteria occupancy change (8.7%) Average per hospital impact ~2.5 patients LTACH Regulatory Impact
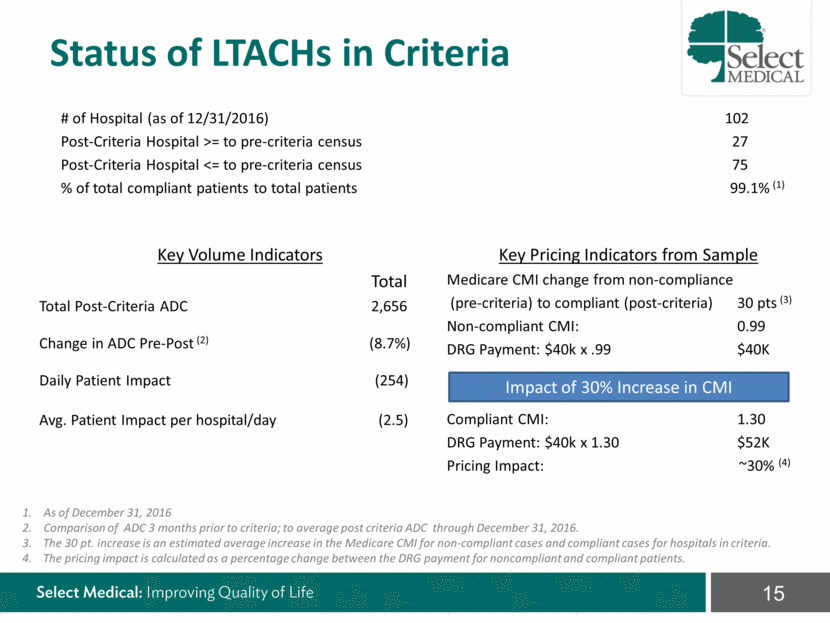
Status of LTACHs in Criteria Key Pricing Indicators from Sample Medicare CMI change from non-compliance (pre-criteria) to compliant (post-criteria) 30 pts (3) Non-compliant CMI: 0.99 DRG Payment: $40k x .99 $40K Impact of a 30% Increase in CMI Index Compliant CMI: 1.30 DRG Payment: $40k x 1.30 $52K Pricing Impact: ~30% (4) Key Volume Indicators Total Total Post-Criteria ADC 2,656 Change in ADC Pre-Post (2) (8.7%) Daily Patient Impact (254) Avg. Patient Impact per hospital/day (2.5) # of Hospital (as of 12/31/2016) 102 Post-Criteria Hospital >= to pre-criteria census 27 Post-Criteria Hospital <= to pre-criteria census 75 % of total compliant patients to total patients 99.1% (1) Impact of 30% Increase in CMI 1. As of December 31, 2016 2. Comparison of ADC 3 months prior to criteria; to average post criteria ADC through December 31, 2016. The 30 pt. increase is an estimated average increase in the Medicare CMI for non-compliant cases and compliant cases for hospitals in criteria. The pricing impact is calculated as a percentage change between the DRG payment for noncompliant and compliant patients.
[LOGO]
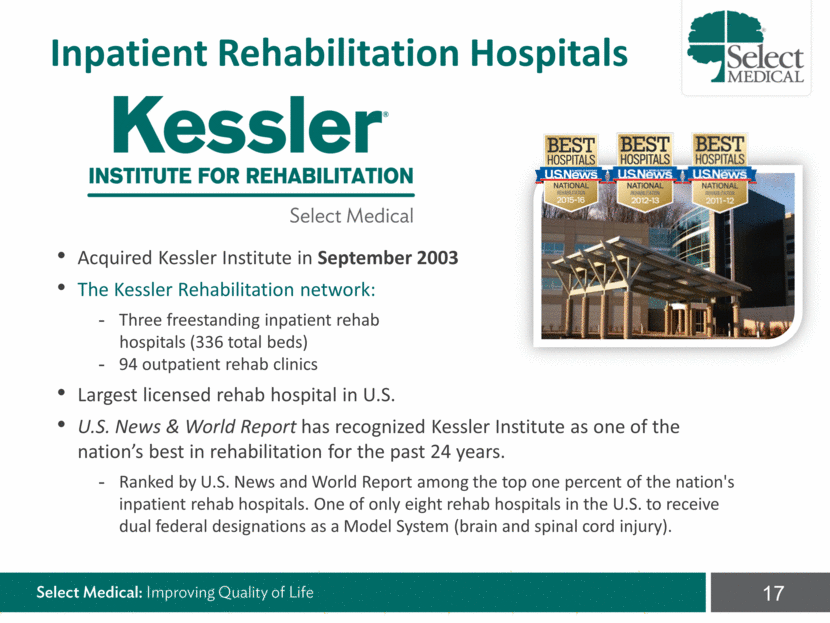
Acquired Kessler Institute in September 2003 The Kessler Rehabilitation network: Three freestanding inpatient rehab hospitals (336 total beds) 94 outpatient rehab clinics Largest licensed rehab hospital in U.S. U.S. News & World Report has recognized Kessler Institute as one of the nation’s best in rehabilitation for the past 24 years. Ranked by U.S. News and World Report among the top one percent of the nation's inpatient rehab hospitals. One of only eight rehab hospitals in the U.S. to receive dual federal designations as a Model System (brain and spinal cord injury). Inpatient Rehabilitation Hospitals
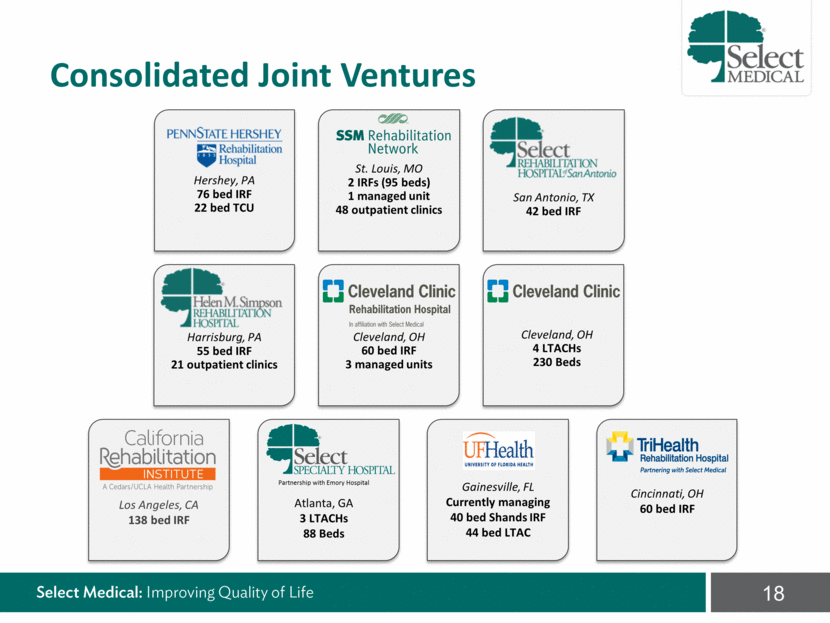
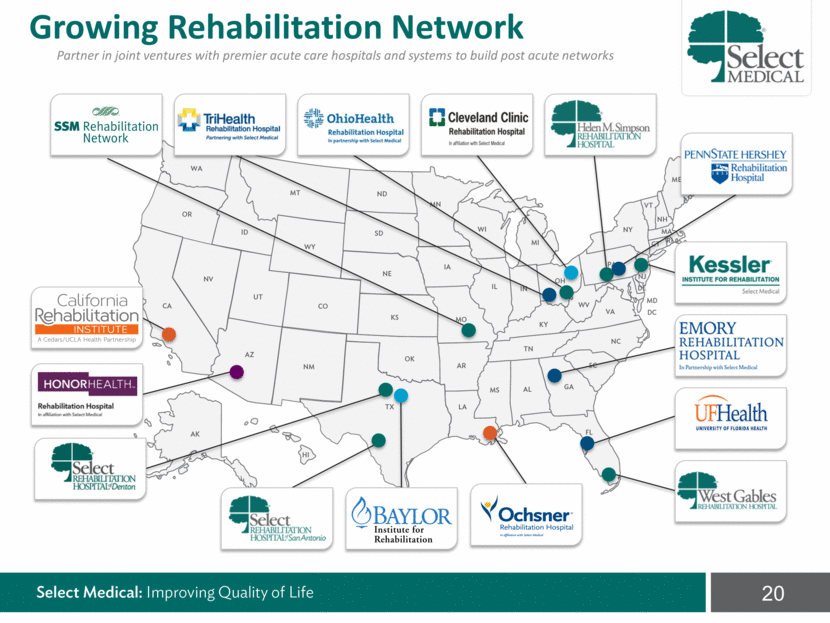
Consolidated Joint Ventures Harrisburg, PA 55 bed IRF 21 outpatient clinics Cincinnati, OH 60 bed IRF Los Angeles, CA 138 bed IRF Cleveland, OH 4 LTACHs 230 Beds Hershey, PA 76 bed IRF 22 bed TCU San Antonio, TX 42 bed IRF St. Louis, MO 2 IRFs (95 beds) 1 managed unit 48 outpatient clinics Gainesville, FL Currently managing 40 bed Shands IRF 44 bed LTAC Partnership with Emory Hospital Atlanta, GA 3 LTACHs 88 Beds Cleveland, OH 60 bed IRF 3 managed units
Non-Consolidating Joint Ventures Columbus, OH 74 bed IRF Dallas, TX 3 IRFs (178 beds) 2 managed units 63 outpatient clinics Scottsdale, AZ 50 bed IRF Atlanta, GA 56 bed IRF 22 outpatient clinics
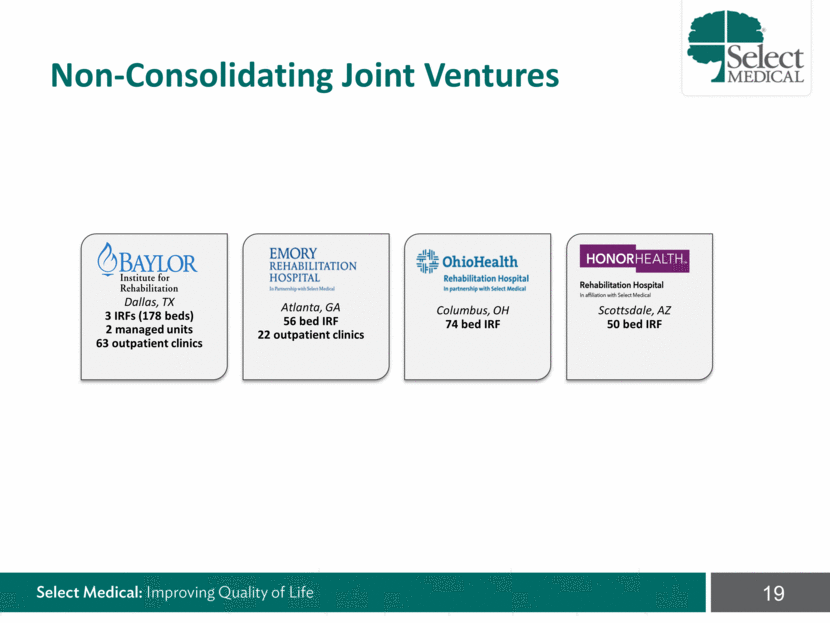
Growing Rehabilitation Network Partner in joint ventures with premier acute care hospitals and systems to build post acute networks
[LOGO]
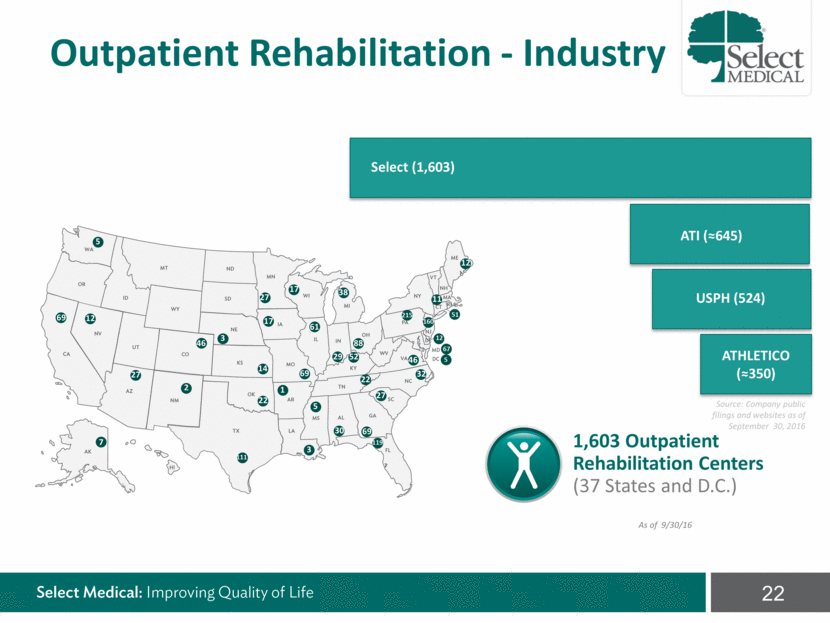
Source: Company public filings and websites as of September 30, 2016 Select (1,603) USPH (524) ATI (645) 11 7 6 14 2 17 24 15 20 93 1 66 13 45 17 57 152 1 21 2 21 33 42 12 15 24 3 98 12 131 1,603 Outpatient Rehabilitation Centers (37 States and D.C.) 12 27 2 46 3 69 17 27 38 61 88 29 27 69 119 32 46 215 5 67 12 160 51 11 111 7 1 22 14 22 52 12 69 As of 9/30/16 30 5 3 5 17 Outpatient Rehabilitation - Industry ATHLETICO (350)
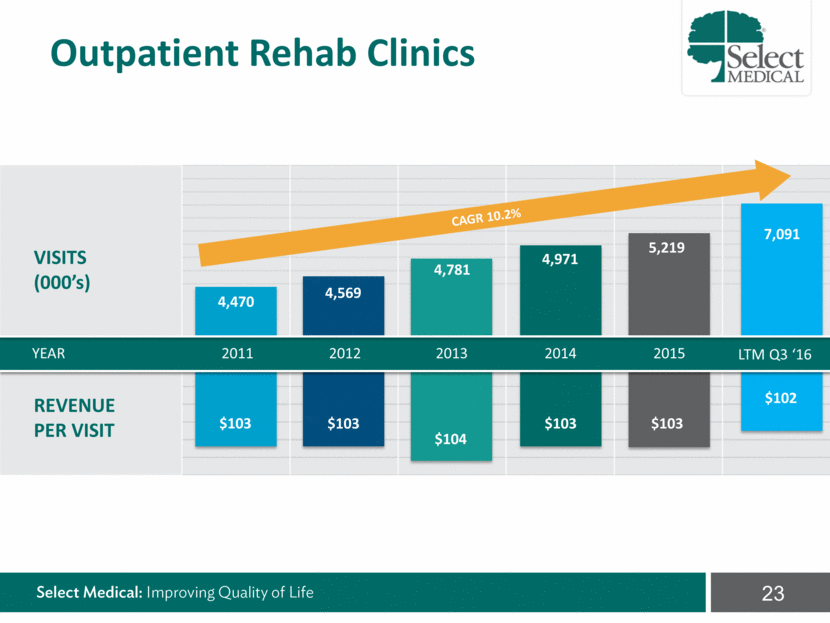
42% 13% 22% 23% YEAR 2011 2012 2013 2014 2015 VISITS (000’s) REVENUE PER VISIT $102 7,091 $103 4,470 $103 4,569 $104 4,781 $103 4,971 LTM Q3 ‘16 $103 5,219 CAGR 10.2% Outpatient Rehab Clinics
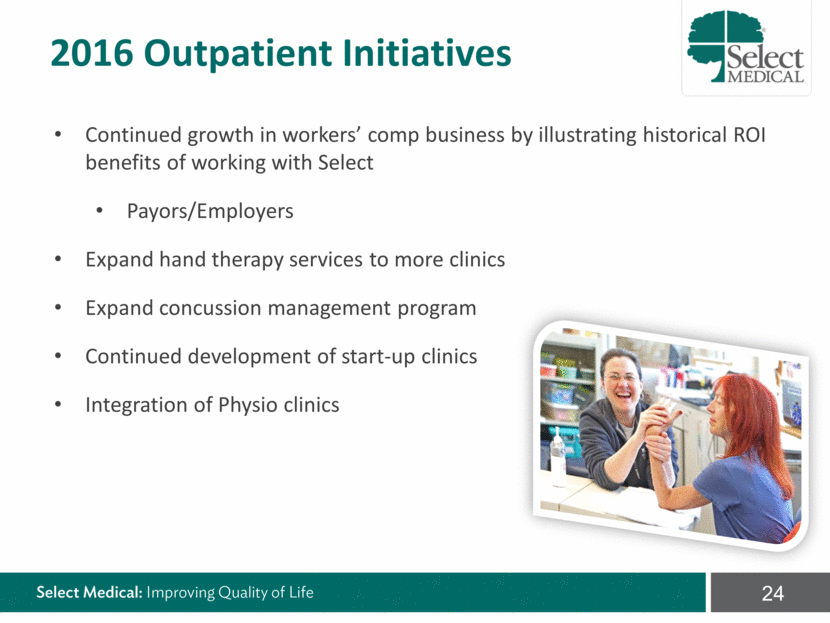
Continued growth in workers’ comp business by illustrating historical ROI benefits of working with Select Payors/Employers Expand hand therapy services to more clinics Expand concussion management program Continued development of start-up clinics Integration of Physio clinics 2016 Outpatient Initiatives
[LOGO]
Concentra is the leading provider of occupational health with 441 locations across 43 states Service Lines: Centers: 301 occupational health locations, with some consumer health Onsite Clinics: 108 locations at employer locations CBOCs: 32 Community Based Outpatient Clinics serving Veterans Health Administration patients Concentra
Management transition Earnings LTM - September 2016 Revenue = $1.0 billion Adjusted EBITDA = $129.6 million Adjusted EBITDA margin = 12.9% Identification of $46 million of cost saving synergies Post-Acquisition Update
28

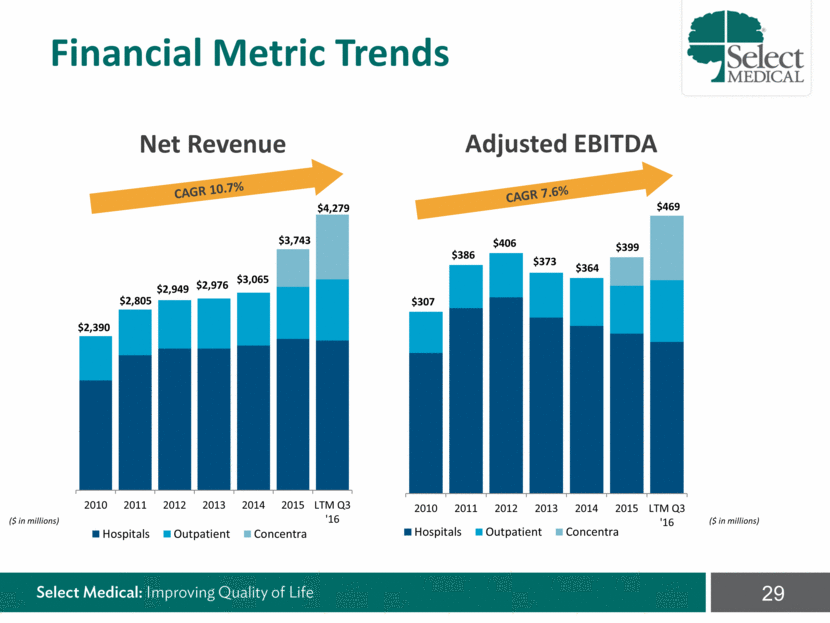
Net Revenue Adjusted EBITDA CAGR 10.7% CAGR 7.6% ($ in millions) ($ in millions) Financial Metric Trends $307 $386 $406 $373 $364 $399 $469 2010 2011 2012 2013 2014 2015 LTM Q3 '16 Hospitals Outpatient Concentra $2,390 $2,805 $2,949 $2,976 $3,065 $3,743 $4,279 2010 2011 2012 2013 2014 2015 LTM Q3 '16 Hospitals Outpatient Concentra
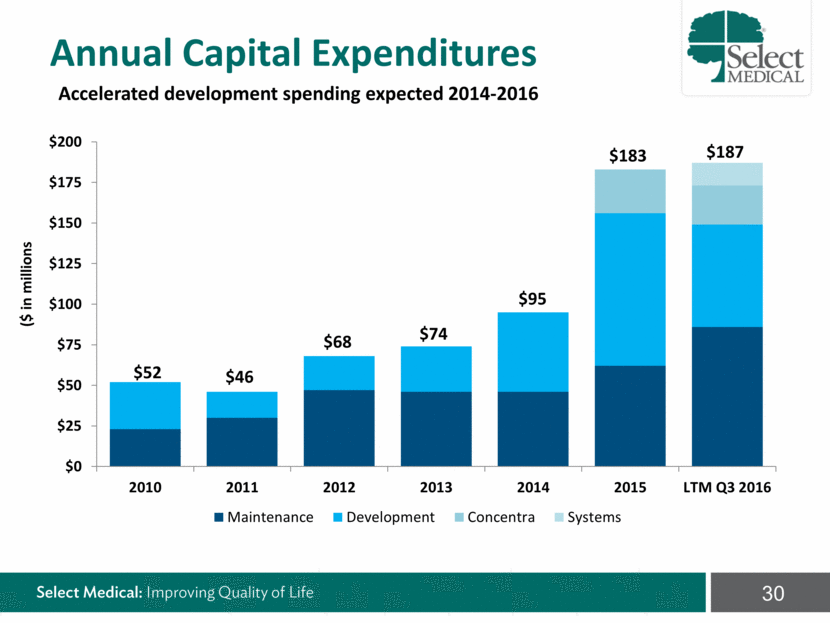
Annual Capital Expenditures Accelerated development spending expected 2014-2016 ($ in millions
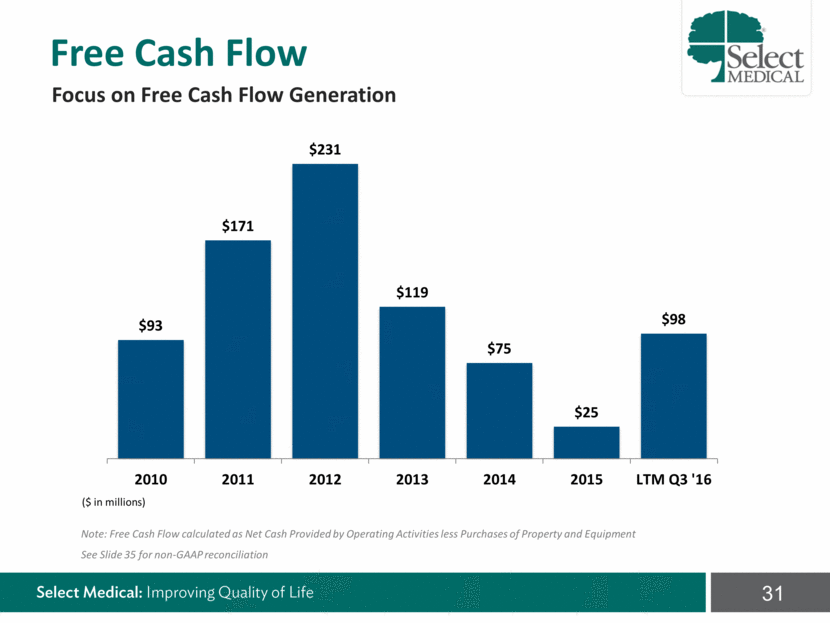
($ in millions) Note: Free Cash Flow calculated as Net Cash Provided by Operating Activities less Purchases of Property and Equipment See Slide 35 for non-GAAP reconciliation Focus on Free Cash Flow Generation Free Cash Flow $93 $171 $231 $119 $75 $25 $98 2010 2011 2012 2013 2014 2015 LTM Q3 '16
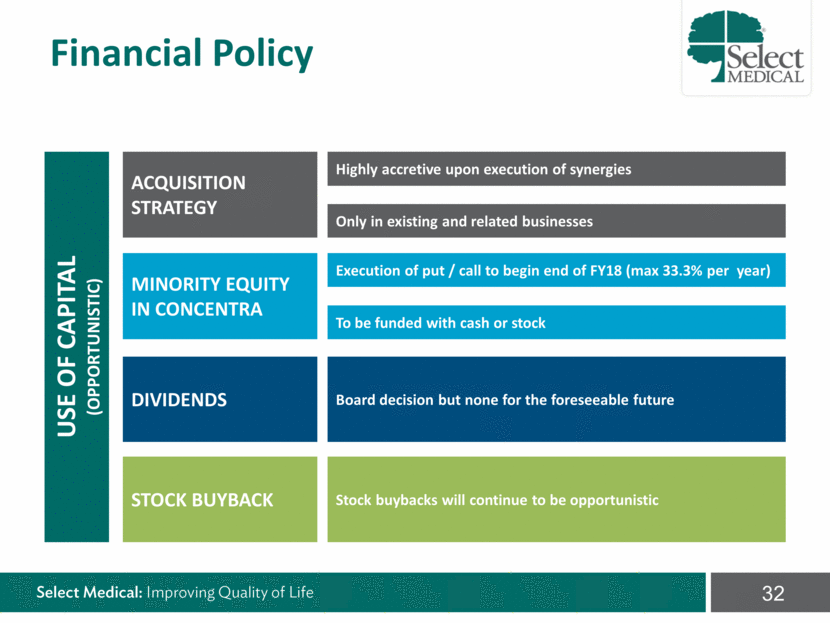
Highly accretive upon execution of synergies Only in existing and related businesses Execution of put / call to begin end of FY18 (max 33.3% per year) Board decision but none for the foreseeable future MINORITY EQUITY IN CONCENTRA DIVIDENDS USE OF CAPITAL (OPPORTUNISTIC) ACQUISITION STRATEGY STOCK BUYBACK Stock buybacks will continue to be opportunistic To be funded with cash or stock Financial Policy
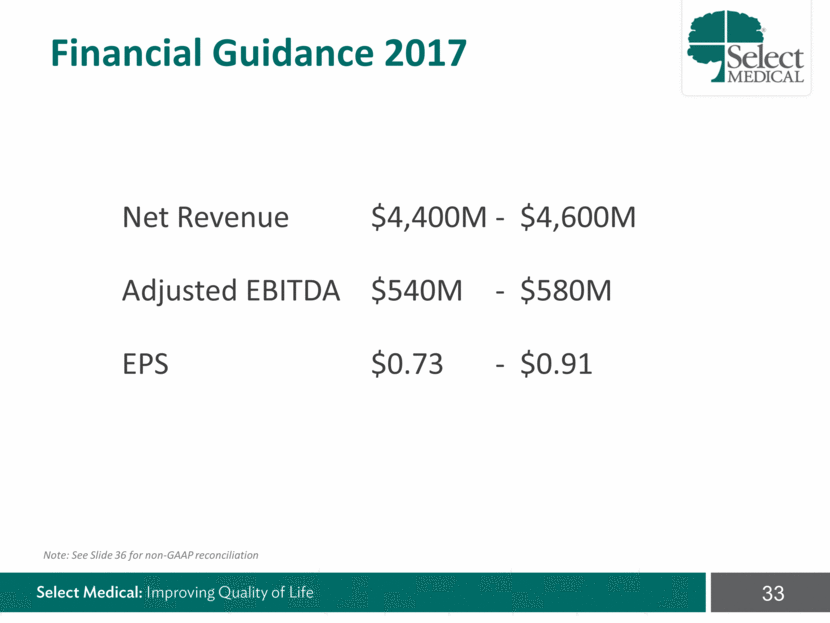
Net Revenue $4,400M - $4,600M Adjusted EBITDA $540M - $580M EPS $0.73 - $0.91 Financial Guidance 2017 Note: See Slide 36 for non-GAAP reconciliation
Appendix: Additional Materials

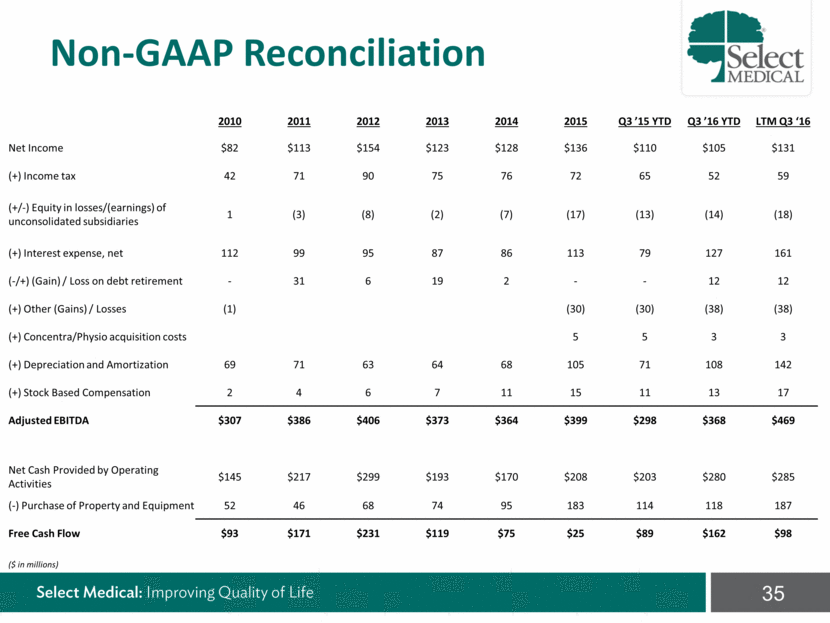
($ in millions) 2010 2011 2012 2013 2014 2015 Q3 ’15 YTD Q3 ’16 YTD LTM Q3 ‘16 Net Income $82 $113 $154 $123 $128 $136 $110 $105 $131 (+) Income tax 42 71 90 75 76 72 65 52 59 (+/-) Equity in losses/(earnings) of unconsolidated subsidiaries 1 (3) (8) (2) (7) (17) (13) (14) (18) (+) Interest expense, net 112 99 95 87 86 113 79 127 161 (-/+) (Gain) / Loss on debt retirement - 31 6 19 2 - - 12 12 (+) Other (Gains) / Losses (1) (30) (30) (38) (38) (+) Concentra/Physio acquisition costs 5 5 3 3 (+) Depreciation and Amortization 69 71 63 64 68 105 71 108 142 (+) Stock Based Compensation 2 4 6 7 11 15 11 13 17 Adjusted EBITDA $307 $386 $406 $373 $364 $399 $298 $368 $469 Net Cash Provided by Operating Activities $145 $217 $299 $193 $170 $208 $203 $280 $285 (-) Purchase of Property and Equipment 52 46 68 74 95 183 114 118 187 Free Cash Flow $93 $171 $231 $119 $75 $25 $89 $162 $98 Non-GAAP Reconciliation
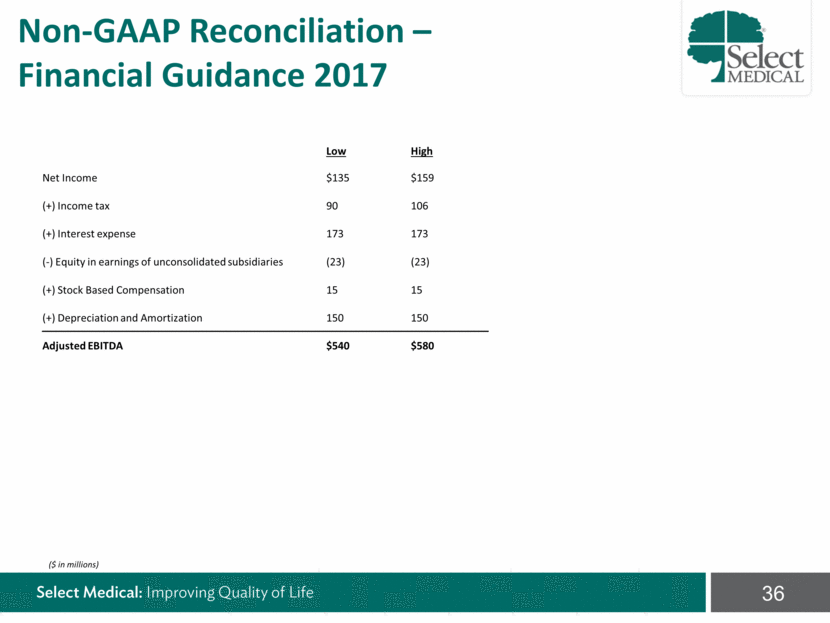
($ in millions) Low High Net Income $135 $159 (+) Income tax 90 106 (+) Interest expense 173 173 (-) Equity in earnings of unconsolidated subsidiaries (23) (23) (+) Stock Based Compensation 15 15 (+) Depreciation and Amortization 150 150 Adjusted EBITDA $540 $580 Non-GAAP Reconciliation – Financial Guidance 2017
selectmedical.com/investor-relations/for-investors