Attached files
| file | filename |
|---|---|
| 8-K - 8-K - Riverview Financial Corp | d282081d8k.htm |
Annual Shareholder Meeting Exhibit 99.1
FORWARD-LOOKING STATEMENTS: We make statements in this presentation, and we may from time to time make other statements, regarding our outlook or expectations for future financial or operating results and/or other matters regarding or affecting Riverview Financial Corporation or its subsidiaries (collectively, the “Company” or “we”) that are considered “forward-looking statements” as defined in the Private Securities Litigation Reform Act of 1995 (the “PSLRA”). Such forward-looking statements may be identified by the use of such words as “believe,” “expect,” “anticipate,” “should,” “planned,” “estimated,” “intend” and “potential”. For these statements, the Company claims the protection of the safe harbor for forward-looking statements contained in the PSLRA. The Company cautions you that a number of important risk factors could cause actual results to differ materially from those currently anticipated in any forward-looking statement. Such risk factors include, but are not limited to: prevailing economic and political conditions, particularly in our market area; credit risk associated with our lending activities; changes in interest rates, loan demand, real estate values and competition; changes in accounting principles, policies, and guidelines; changes in any applicable law, rule, regulation or practice with respect to tax or legal issues; and other economic, competitive, governmental, regulatory and technological factors affecting the Company’s operations, pricing, products and services and other factors that may be described in the Company’s Annual Reports on Form 10-K and Quarterly Reports on Form 10-Q as filed with the Securities and Exchange Commission (“SEC”) from time to time. In light of risks, uncertainties and assumptions, you should not place undue reliance on any forward-looking statements in this presentation. The forward-looking statements are made as of the date of this presentation, and, except as may be required by applicable law or regulation, the Company assumes no obligation to update the forward-looking statements or to update the reasons why actual results could differ from those projected in the forward-looking statements. USE OF NON-GAAP FINANCIAL MEASURES: In addition to evaluating our results of operations in accordance with accounting principles generally accepted in the United States of America (“GAAP”), we routinely supplement our evaluation with an analysis of certain non-GAAP financial measures, such as tangible stockholders’ equity and core net income ratios. The financial results in this presentation contain items which we consider non-core, namely net gains on sales of investment securities available-for-sale and one-time merger related expenses. We believe the reported non-GAAP financial measures provide information useful to investors in understanding our operating performance and trends. Where non-GAAP disclosures are used in this presentation, a reconciliation to the comparable GAAP measure is provided in the quarterly earnings press releases filed as current reports on Form 8-K with the SEC. The non-GAAP financial measures we use may differ from the non-GAAP financial measures of other financial institutions.
About Your Corporation Corporate Highlights Formed upon the consolidation of First Perry Bancorp, Inc., Marysville and HNB Bancorp, Inc., Halifax in 2008 Nearly tripled franchise size through inorganic partnerships with Union Bancorp in 2013 and Citizens Meyersdale in 2015 Headquartered in Harrisburg, PA. Loan operations in Marysville. Data processing and trust operations in Pottsville. Compliance and deposit operations support in Halifax. 14 Full service community banking offices, 2 dedicated wealth management offices, and 1 LPO serving six counties in PA Stock trades on OTCQX (top tier for over-the-counter market)
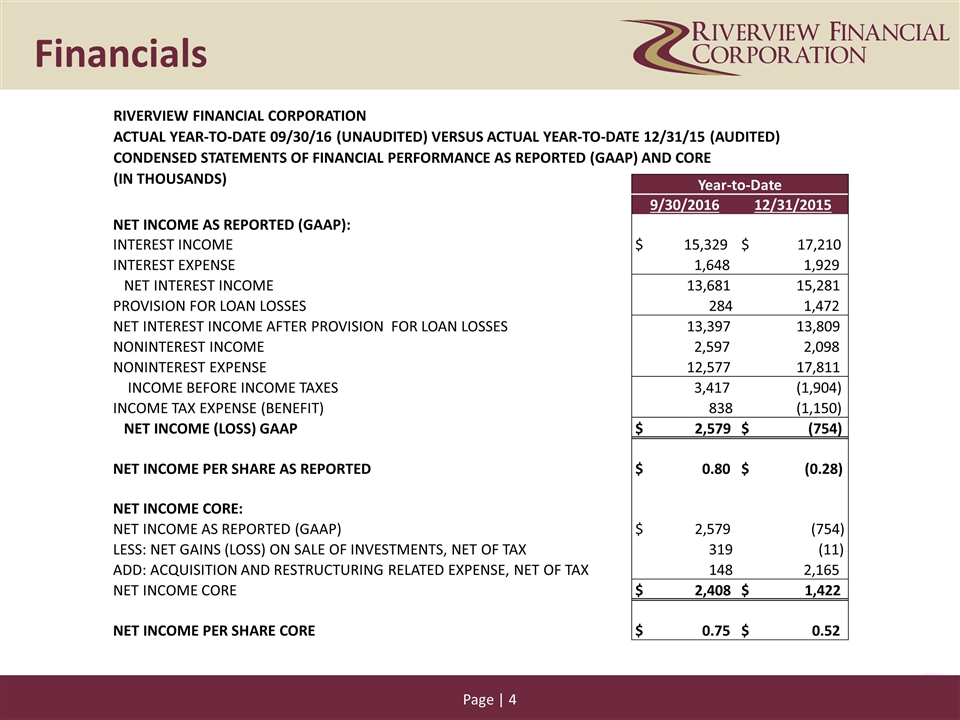
Financials Year-to-Date 9/30/2016 12/31/2015 NET INCOME AS REPORTED (GAAP): INTEREST INCOME $ 15,329 $ 17,210 INTEREST EXPENSE 1,648 1,929 NET INTEREST INCOME 13,681 15,281 PROVISION FOR LOAN LOSSES 284 1,472 NET INTEREST INCOME AFTER PROVISION FOR LOAN LOSSES 13,397 13,809 NONINTEREST INCOME 2,597 2,098 NONINTEREST EXPENSE 12,577 17,811 INCOME BEFORE INCOME TAXES 3,417 (1,904) INCOME TAX EXPENSE (BENEFIT) 838 (1,150) NET INCOME (LOSS) GAAP $ 2,579 $ (754) NET INCOME PER SHARE AS REPORTED $ 0.80 $ (0.28) NET INCOME CORE: NET INCOME AS REPORTED (GAAP) $ 2,579 (754) LESS: NET GAINS (LOSS) ON SALE OF INVESTMENTS, NET OF TAX 319 (11) ADD: ACQUISITION AND RESTRUCTURING RELATED EXPENSE, NET OF TAX 148 2,165 NET INCOME CORE $ 2,408 $ 1,422 NET INCOME PER SHARE CORE $ 0.75 $ 0.52 RIVERVIEW FINANCIAL CORPORATION ACTUAL YEAR-TO-DATE 09/30/16 (UNAUDITED) VERSUS ACTUAL YEAR-TO-DATE 12/31/15 (AUDITED) CONDENSED STATEMENTS OF FINANCIAL PERFORMANCE AS REPORTED (GAAP) AND CORE (IN THOUSANDS)
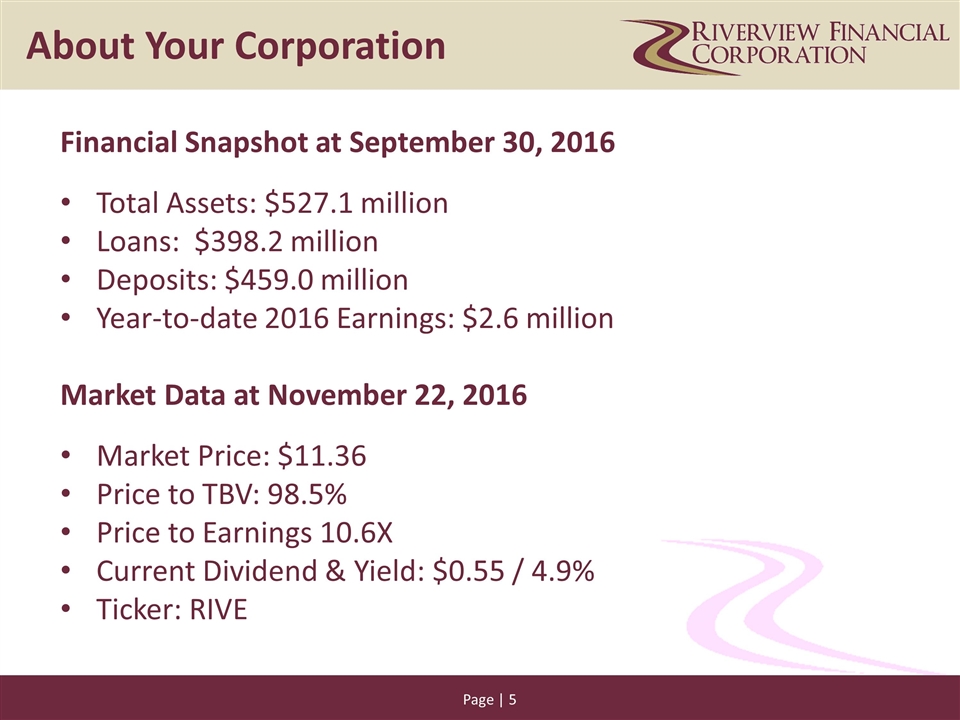
Financial Snapshot at September 30, 2016 Total Assets: $527.1 million Loans: $398.2 million Deposits: $459.0 million Year-to-date 2016 Earnings: $2.6 million Market Data at November 22, 2016 Market Price: $11.36 Price to TBV: 98.5% Price to Earnings 10.6X Current Dividend & Yield: $0.55 / 4.9% Ticker: RIVE About Your Corporation
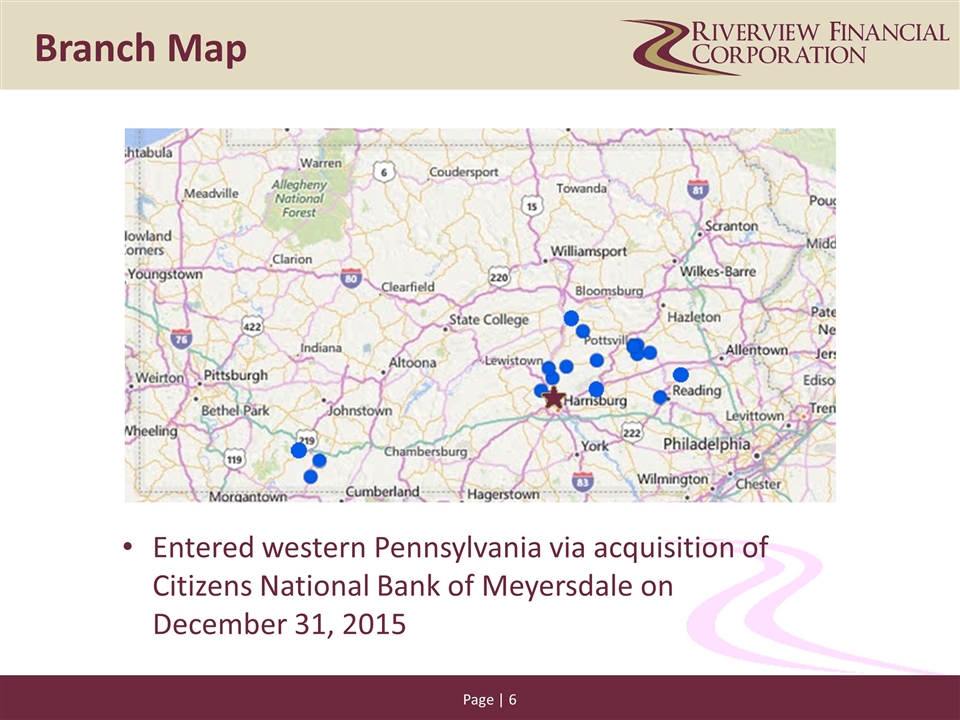
Branch Map Entered western Pennsylvania via acquisition of Citizens National Bank of Meyersdale on December 31, 2015
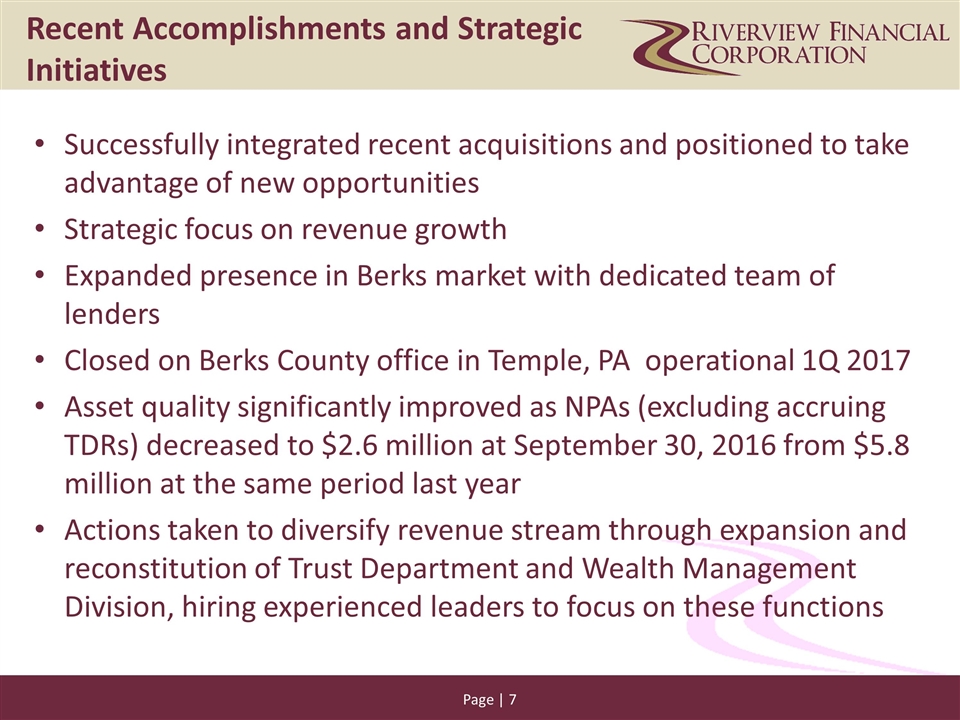
Recent Accomplishments and Strategic Initiatives Successfully integrated recent acquisitions and positioned to take advantage of new opportunities Strategic focus on revenue growth Expanded presence in Berks market with dedicated team of lenders Closed on Berks County office in Temple, PA operational 1Q 2017 Asset quality significantly improved as NPAs (excluding accruing TDRs) decreased to $2.6 million at September 30, 2016 from $5.8 million at the same period last year Actions taken to diversify revenue stream through expansion and reconstitution of Trust Department and Wealth Management Division, hiring experienced leaders to focus on these functions
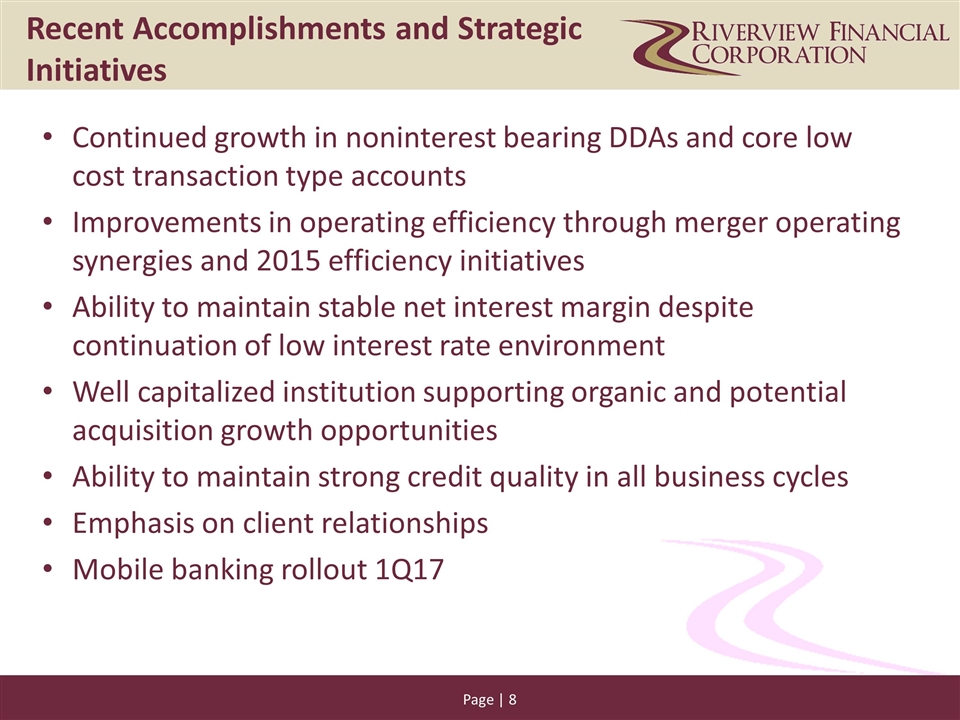
Continued growth in noninterest bearing DDAs and core low cost transaction type accounts Improvements in operating efficiency through merger operating synergies and 2015 efficiency initiatives Ability to maintain stable net interest margin despite continuation of low interest rate environment Well capitalized institution supporting organic and potential acquisition growth opportunities Ability to maintain strong credit quality in all business cycles Emphasis on client relationships Mobile banking rollout 1Q17 Recent Accomplishments and Strategic Initiatives
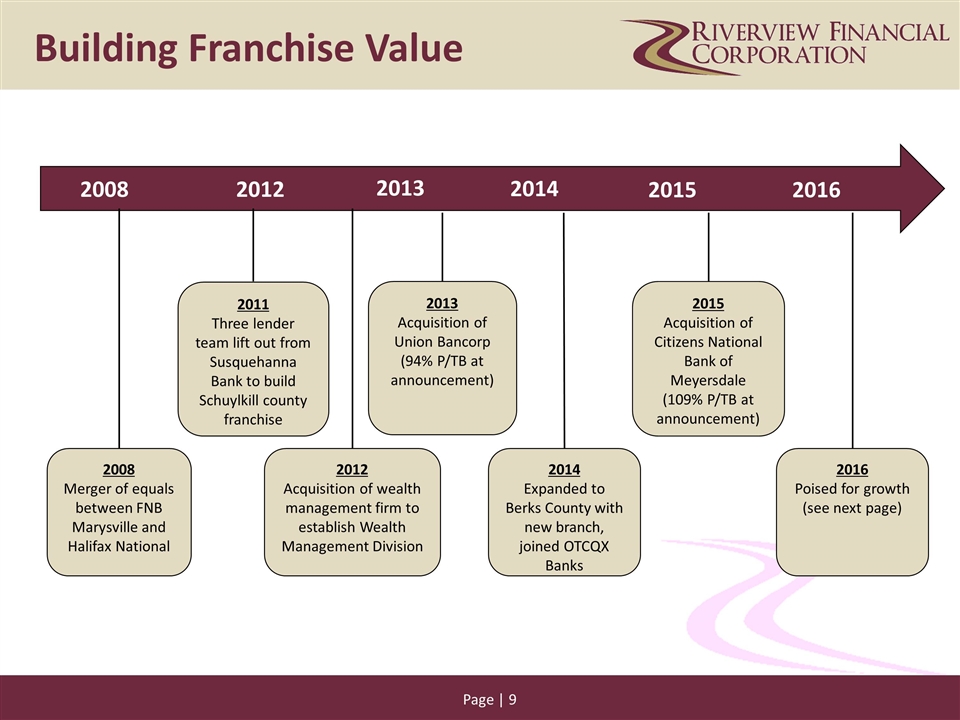
2012 2013 2014 2015 2008 2012 2014 2012 Acquisition of wealth management firm to establish Wealth Management Division 2008 Merger of equals between FNB Marysville and Halifax National 2013 Acquisition of Union Bancorp (94% P/TB at announcement) 2014 Expanded to Berks County with new branch, joined OTCQX Banks 2015 Acquisition of Citizens National Bank of Meyersdale (109% P/TB at announcement) 2016 Building Franchise Value 2013 2015 2016 Poised for growth (see next page) 2011 Three lender team lift out from Susquehanna Bank to build Schuylkill county franchise
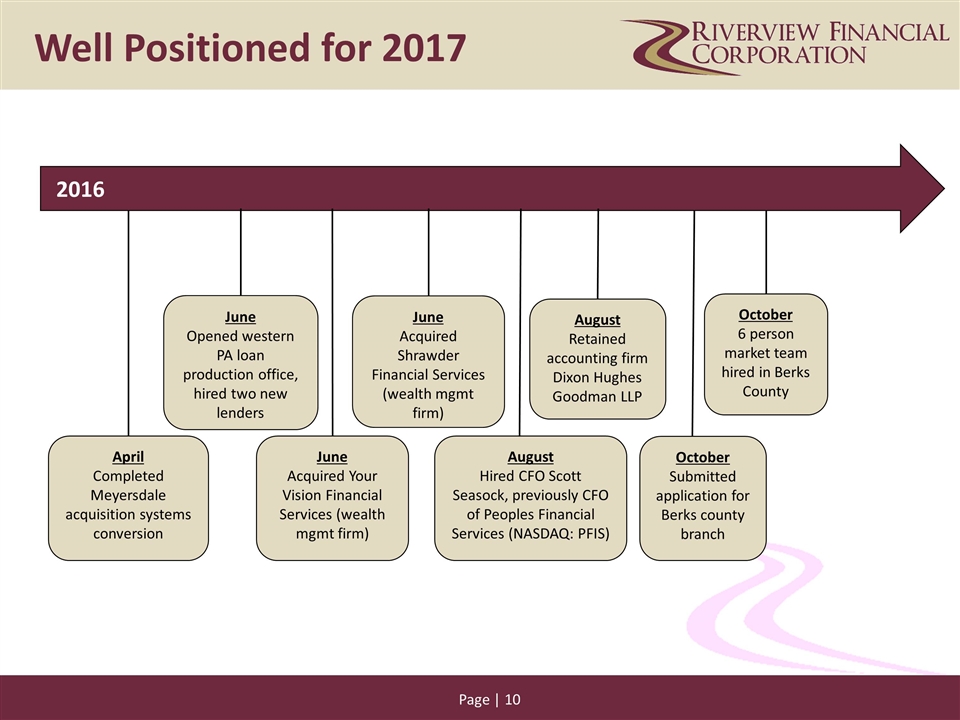
2012 2013 2014 2015 June Acquired Shrawder Financial Services (wealth mgmt firm) June Opened western PA loan production office, hired two new lenders August Retained accounting firm Dixon Hughes Goodman LLP August Hired CFO Scott Seasock, previously CFO of Peoples Financial Services (NASDAQ: PFIS) October 6 person market team hired in Berks County Well Positioned for 2017 June Acquired Your Vision Financial Services (wealth mgmt firm) October Submitted application for Berks county branch April Completed Meyersdale acquisition systems conversion 2016
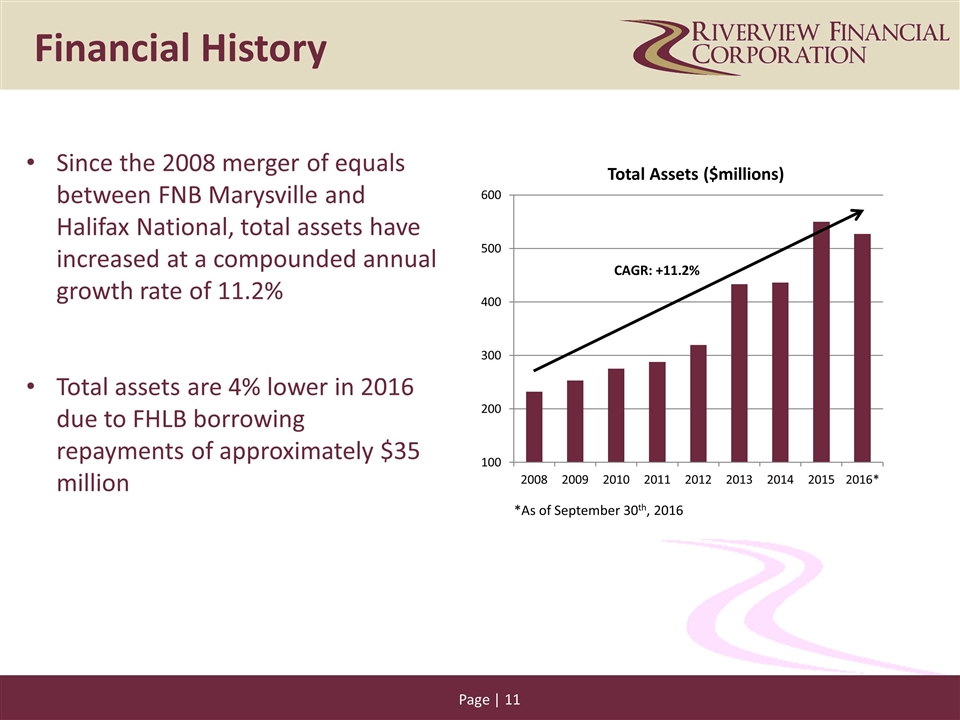
Since the 2008 merger of equals between FNB Marysville and Halifax National, total assets have increased at a compounded annual growth rate of 11.2% Total assets are 4% lower in 2016 due to FHLB borrowing repayments of approximately $35 million Financial History CAGR: +11.2% *As of September 30th, 2016
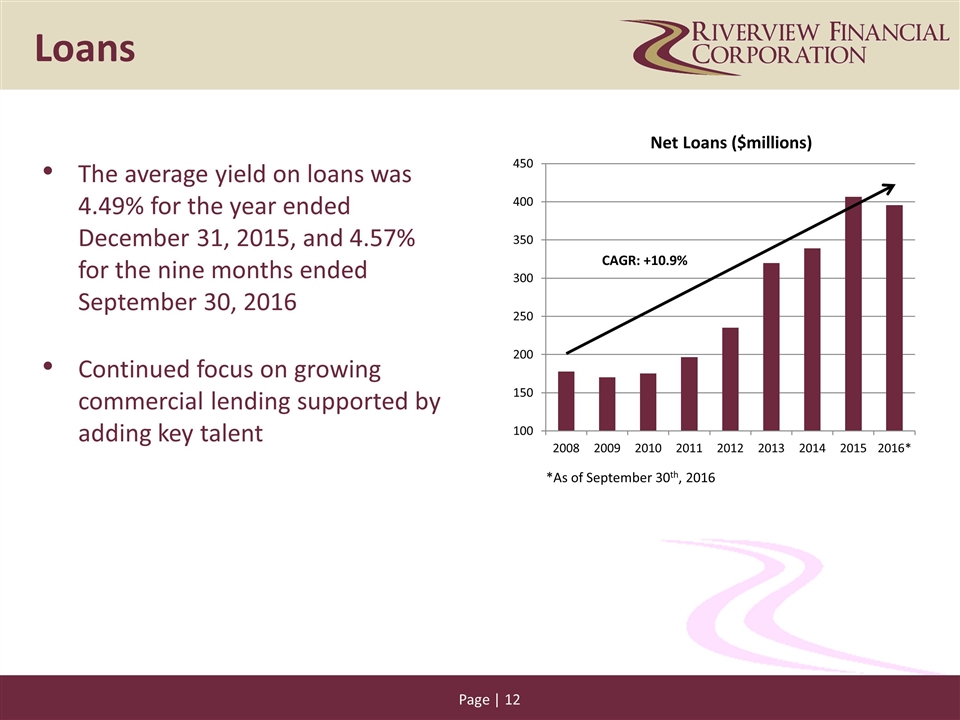
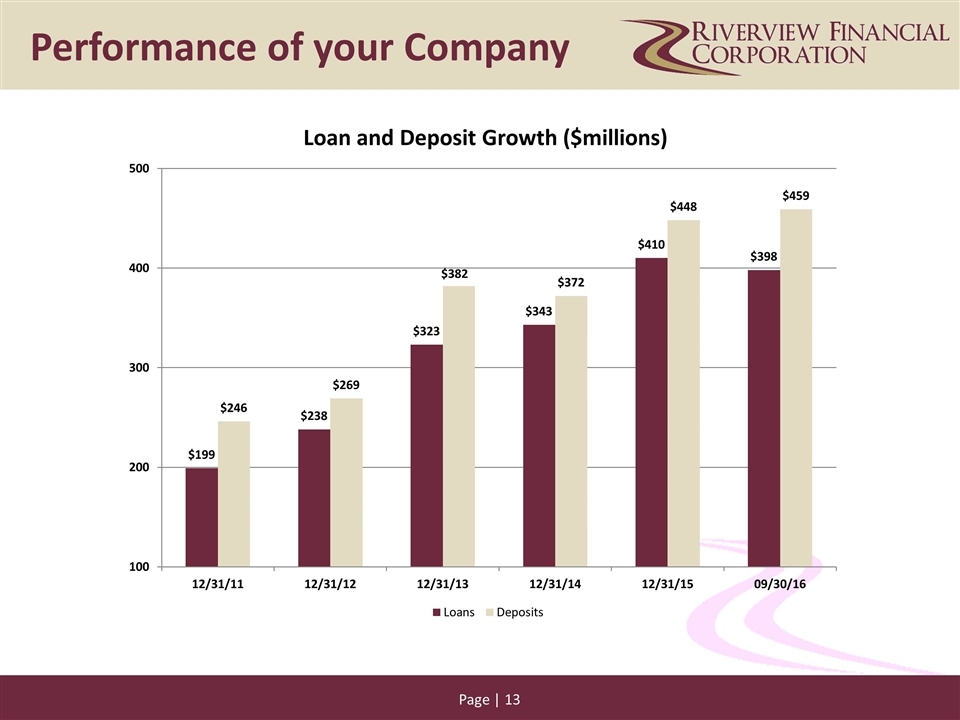
The average yield on loans was 4.49% for the year ended December 31, 2015, and 4.57% for the nine months ended September 30, 2016 Continued focus on growing commercial lending supported by adding key talent Loans CAGR: +10.9% *As of September 30th, 2016
Performance of your Company
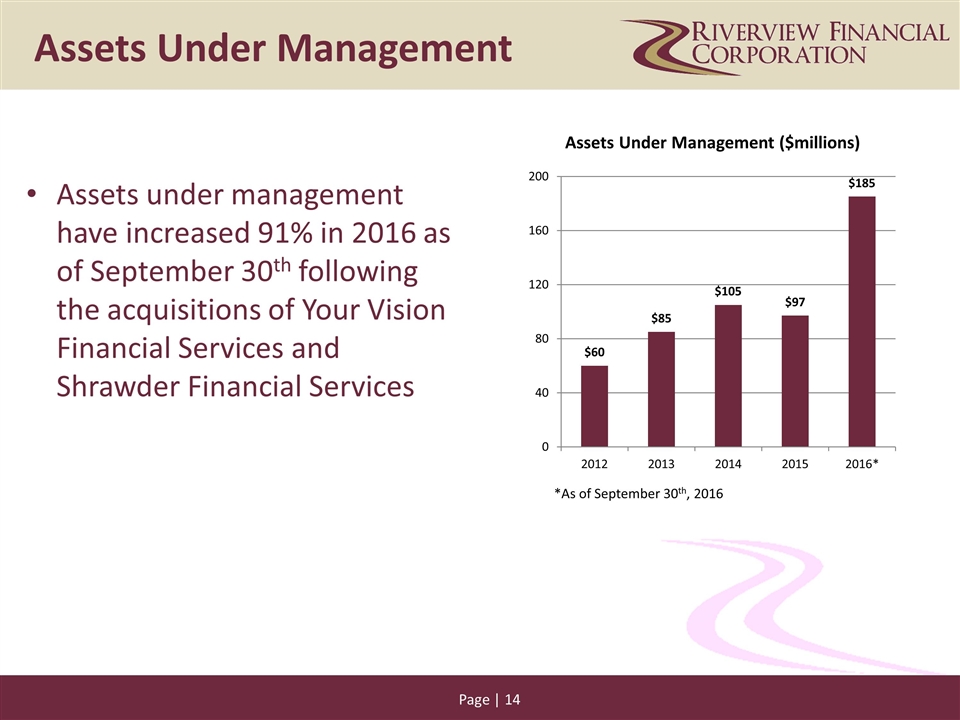
Assets Under Management Assets under management have increased 91% in 2016 as of September 30th following the acquisitions of Your Vision Financial Services and Shrawder Financial Services *As of September 30th, 2016
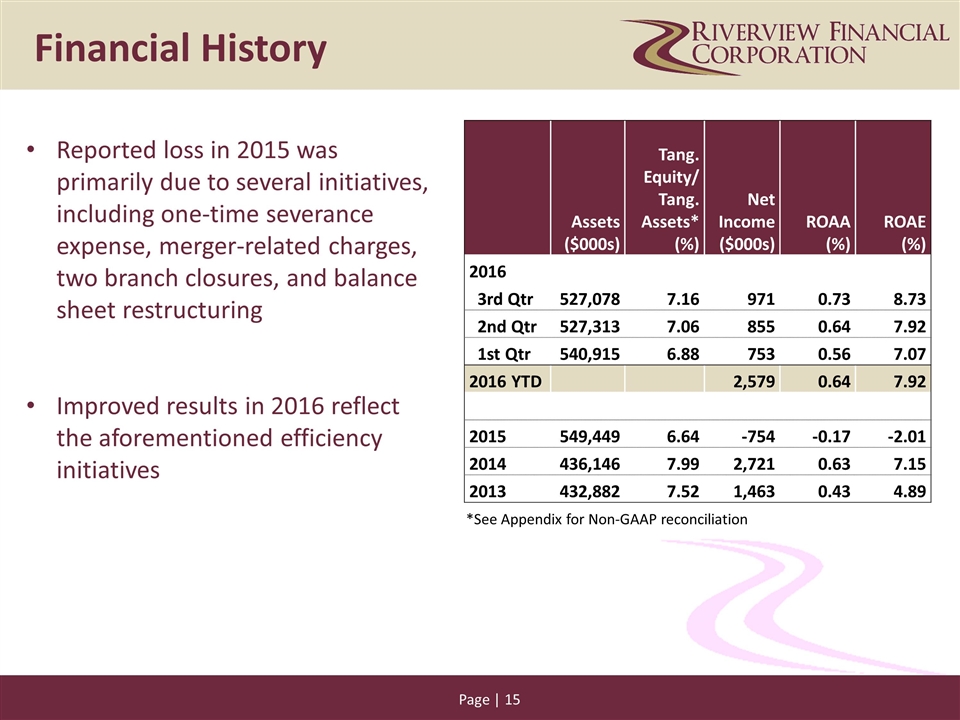
Reported loss in 2015 was primarily due to several initiatives, including one-time severance expense, merger-related charges, two branch closures, and balance sheet restructuring Improved results in 2016 reflect the aforementioned efficiency initiatives Financial History Assets ($000s) Tang. Equity/ Tang. Assets* (%) Net Income ($000s) ROAA (%) ROAE (%) 2016 3rd Qtr 527,078 7.16 971 0.73 8.73 2nd Qtr 527,313 7.06 855 0.64 7.92 1st Qtr 540,915 6.88 753 0.56 7.07 2016 YTD 2,579 0.64 7.92 2015 549,449 6.64 -754 -0.17 -2.01 2014 436,146 7.99 2,721 0.63 7.15 2013 432,882 7.52 1,463 0.43 4.89 *See Appendix for Non-GAAP reconciliation
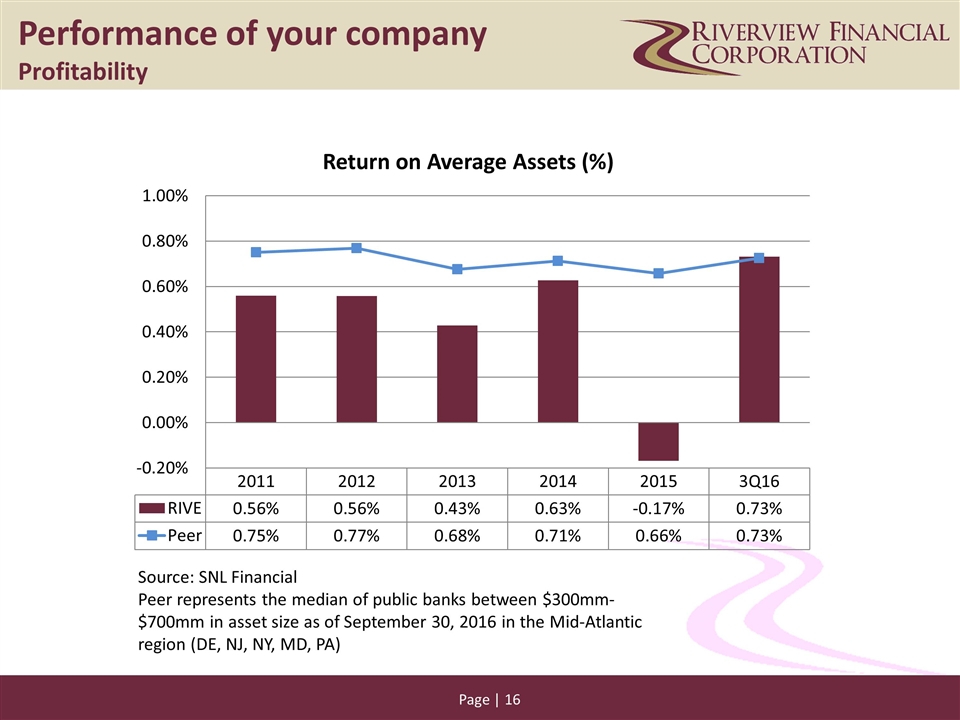
Performance of your company Profitability Source: SNL Financial Peer represents the median of public banks between $300mm-$700mm in asset size as of September 30, 2016 in the Mid-Atlantic region (DE, NJ, NY, MD, PA)
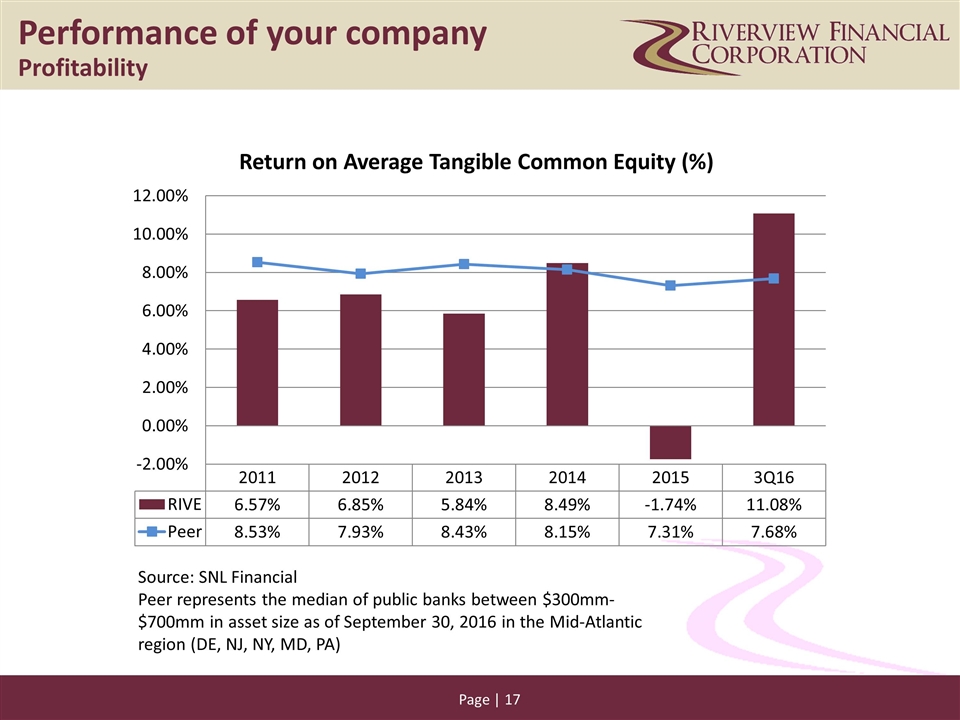
Performance of your company Profitability Source: SNL Financial Peer represents the median of public banks between $300mm-$700mm in asset size as of September 30, 2016 in the Mid-Atlantic region (DE, NJ, NY, MD, PA)
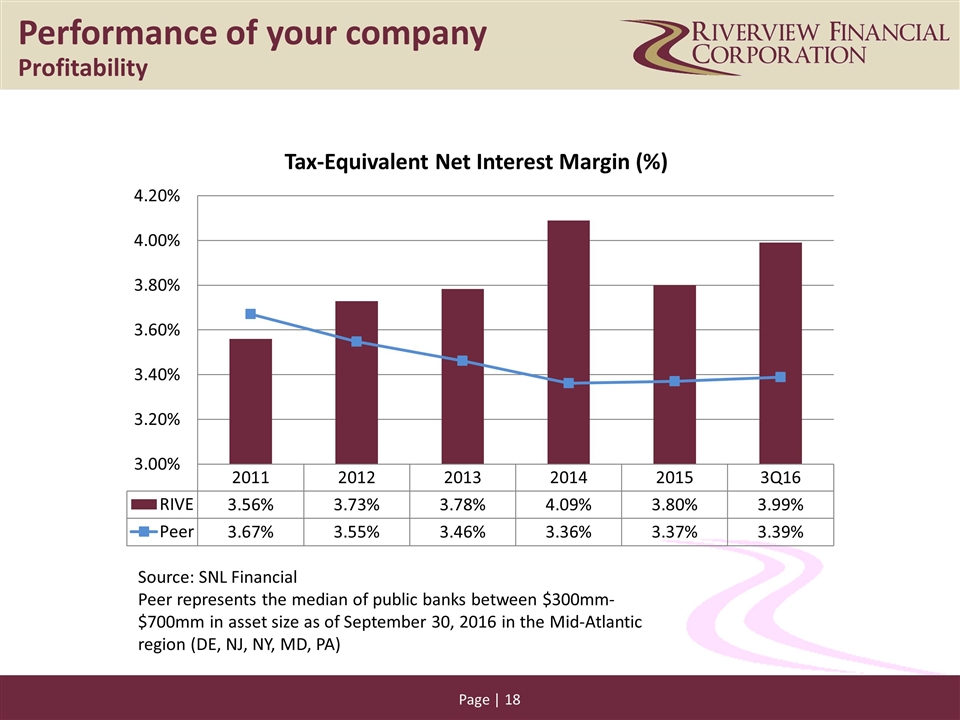
Performance of your company Profitability Source: SNL Financial Peer represents the median of public banks between $300mm-$700mm in asset size as of September 30, 2016 in the Mid-Atlantic region (DE, NJ, NY, MD, PA)
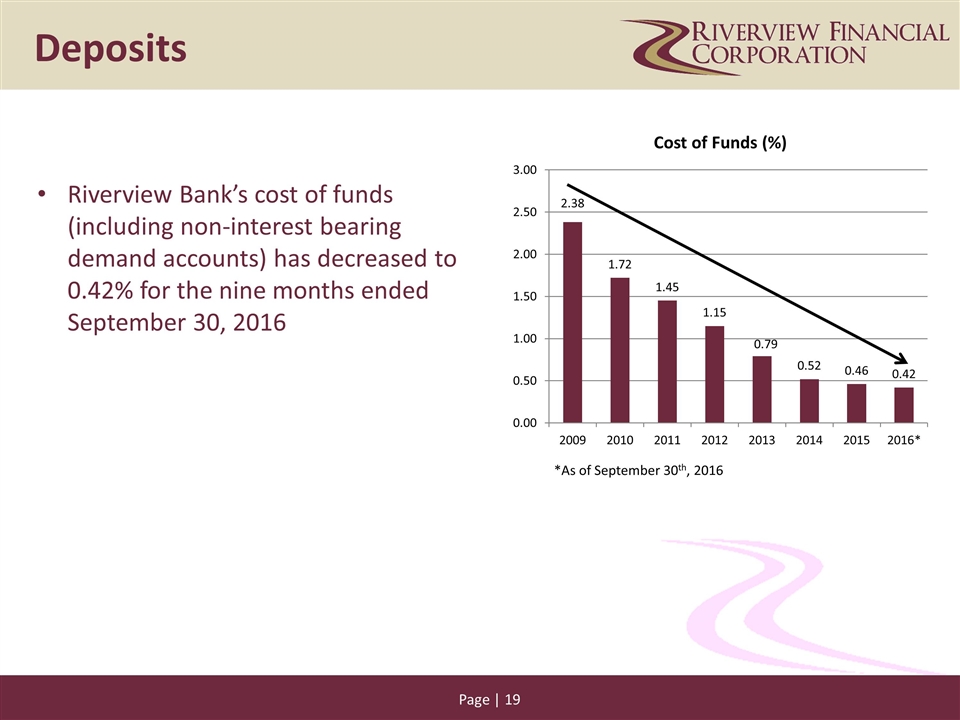
Riverview Bank’s cost of funds (including non-interest bearing demand accounts) has decreased to 0.42% for the nine months ended September 30, 2016 Deposits *As of September 30th, 2016
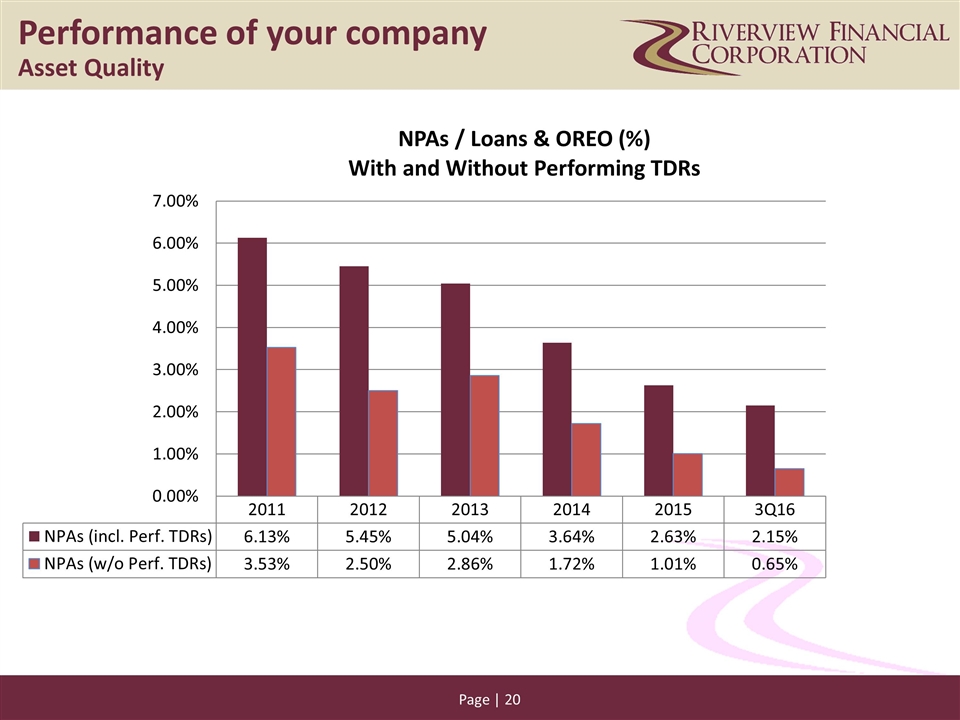
Performance of your company Asset Quality
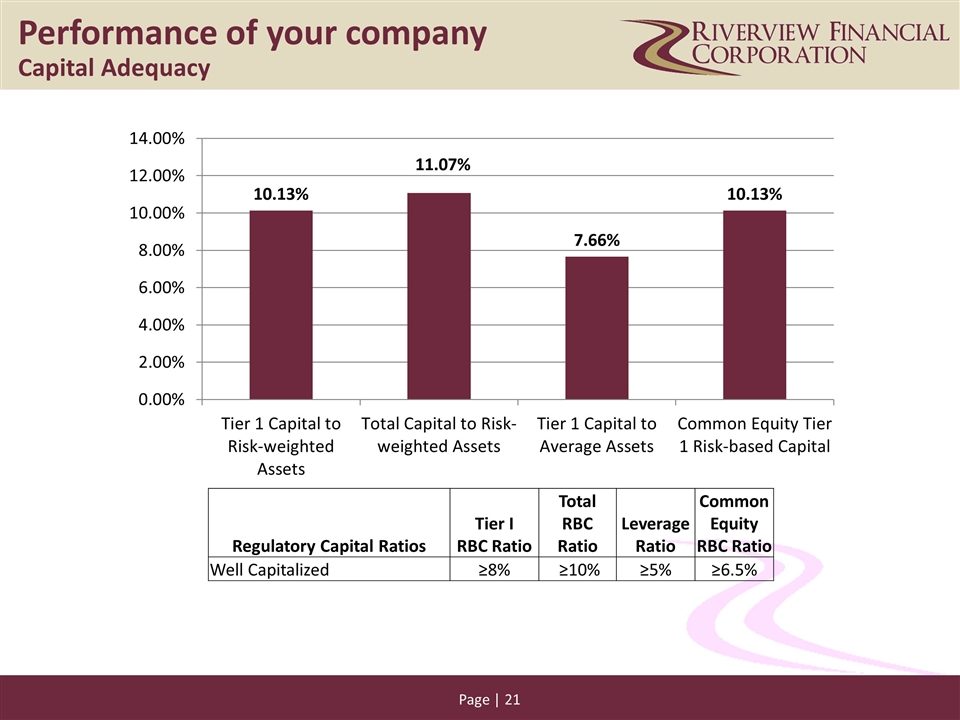
Regulatory Capital Ratios Tier I RBC Ratio Total RBC Ratio Leverage Ratio Common Equity RBC Ratio Well Capitalized ≥8% ≥10% ≥5% ≥6.5% Performance of your company Capital Adequacy
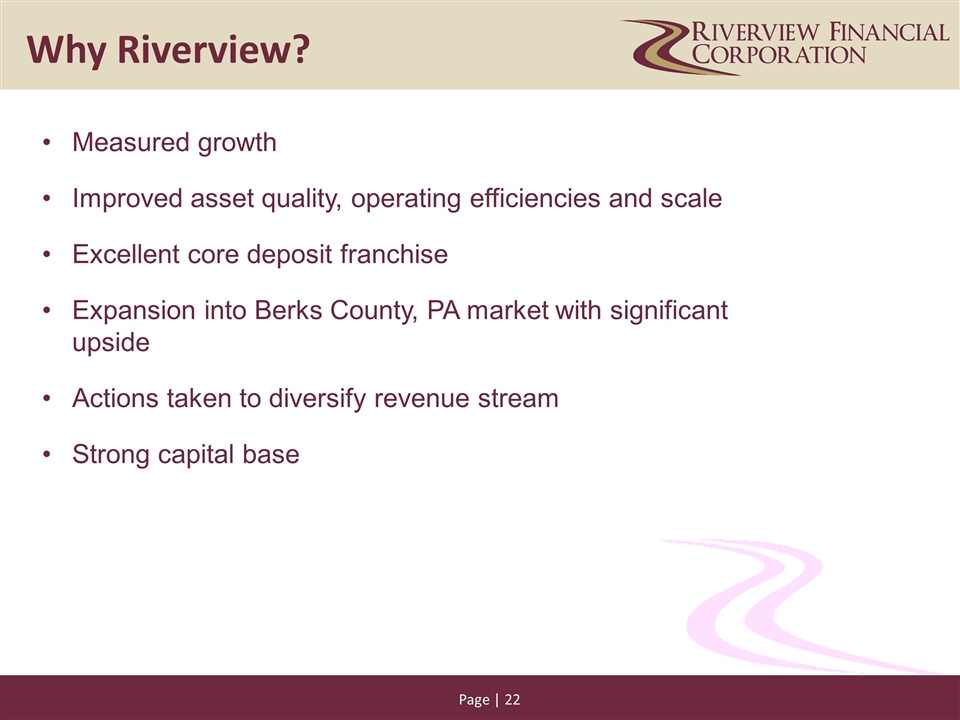
Why Riverview? Measured growth Improved asset quality, operating efficiencies and scale Excellent core deposit franchise Expansion into Berks County, PA market with significant upside Actions taken to diversify revenue stream Strong capital base
Investor Relations Contacts and Information Sources INFORMATION SOURCES: Riverview website www.riverviewbankpa.com under “Investor Relations” Sec.gov - Current filings with the Securities and Exchange Commission Fdic.gov - Call Reports, Uniform Bank Performance Reports, Summary of Branch Deposits Investor Services: Transfer Agent: American Stock Transfer and Trust, LLC (800) 937-5449 Dividend Reinvestment Direct Deposit Market Makers Boenning & Scattergood (610) 862-5368 Monroe Financial Partners (312) 327-2530 Scott A. Seasock Telephone: 717-827-4039 E-mail: sseasock@riverviewbankpa.com
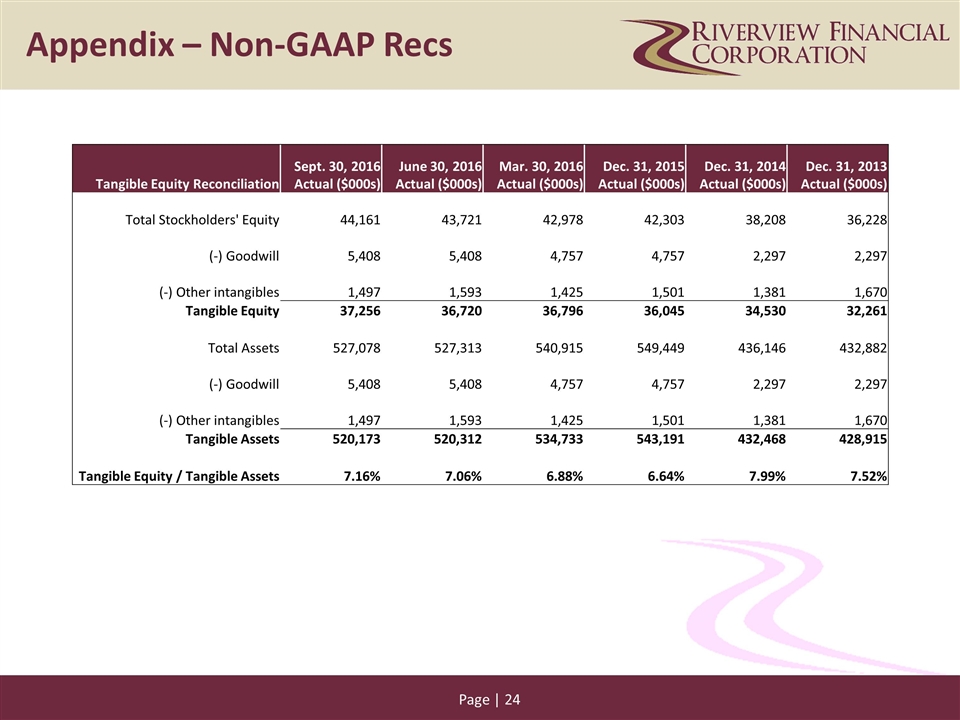
Appendix – Non-GAAP Recs Tangible Equity Reconciliation Sept. 30, 2016 Actual ($000s) June 30, 2016 Actual ($000s) Mar. 30, 2016 Actual ($000s) Dec. 31, 2015 Actual ($000s) Dec. 31, 2014 Actual ($000s) Dec. 31, 2013 Actual ($000s) Total Stockholders' Equity 44,161 43,721 42,978 42,303 38,208 36,228 (-) Goodwill 5,408 5,408 4,757 4,757 2,297 2,297 (-) Other intangibles 1,497 1,593 1,425 1,501 1,381 1,670 Tangible Equity 37,256 36,720 36,796 36,045 34,530 32,261 Total Assets 527,078 527,313 540,915 549,449 436,146 432,882 (-) Goodwill 5,408 5,408 4,757 4,757 2,297 2,297 (-) Other intangibles 1,497 1,593 1,425 1,501 1,381 1,670 Tangible Assets 520,173 520,312 534,733 543,191 432,468 428,915 Tangible Equity / Tangible Assets 7.16% 7.06% 6.88% 6.64% 7.99% 7.52%
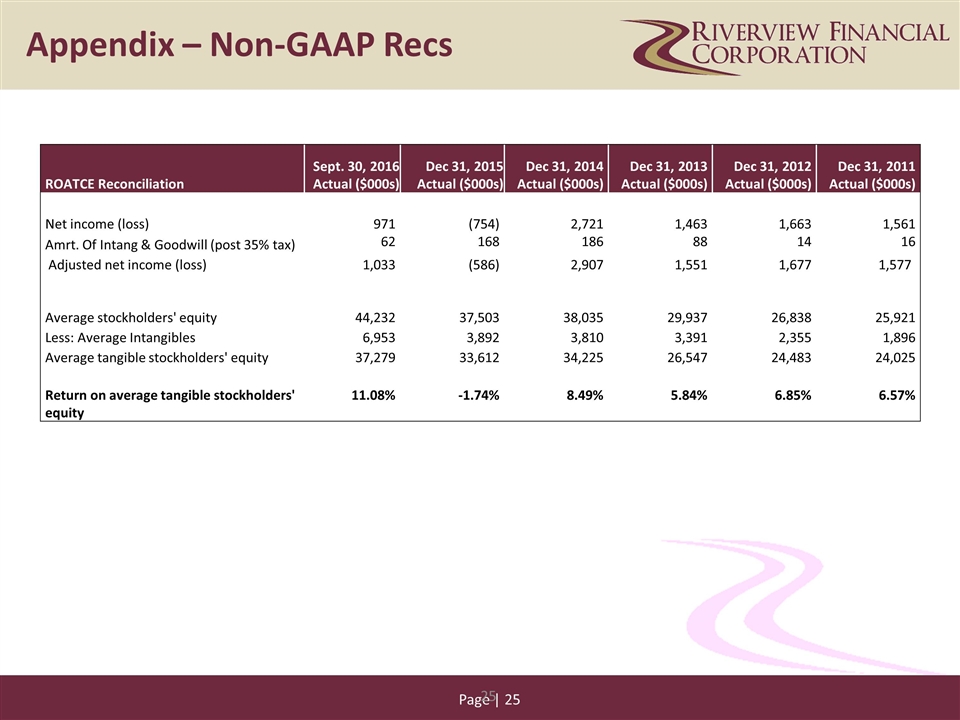
ROATCE Reconciliation Sept. 30, 2016 Actual ($000s) Dec 31, 2015 Actual ($000s) Dec 31, 2014 Actual ($000s) Dec 31, 2013 Actual ($000s) Dec 31, 2012 Actual ($000s) Dec 31, 2011 Actual ($000s) Net income (loss) 971 (754) 2,721 1,463 1,663 1,561 Amrt. Of Intang & Goodwill (post 35% tax) 62 168 186 88 14 16 Adjusted net income (loss) 1,033 (586) 2,907 1,551 1,677 1,577 Average stockholders' equity 44,232 37,503 38,035 29,937 26,838 25,921 Less: Average Intangibles 6,953 3,892 3,810 3,391 2,355 1,896 Average tangible stockholders' equity 37,279 33,612 34,225 26,547 24,483 24,025 Return on average tangible stockholders' equity 11.08% -1.74% 8.49% 5.84% 6.85% 6.57% Appendix – Non-GAAP Recs
