Attached files
| file | filename |
|---|---|
| EX-32.1 - CERTIFICATION - Corporate Capital Trust, Inc. | d291401dex321.htm |
| EX-31.2 - CERTIFICATION - Corporate Capital Trust, Inc. | d291401dex312.htm |
| EX-31.1 - CERTIFICATION - Corporate Capital Trust, Inc. | d291401dex311.htm |
Table of Contents
UNITED STATES
SECURITIES AND EXCHANGE COMMISSION
Washington, D.C. 20549
FORM 10-Q
| x | QUARTERLY REPORT PURSUANT TO SECTION 13 OR 15 (d) OF THE SECURITIES EXCHANGE ACT OF 1934 |
For the quarterly period ended September 30, 2016
OR
| ¨ | TRANSITION REPORT PURSUANT TO SECTION 13 OR 15 (d) OF THE SECURITIES EXCHANGE ACT OF 1934 |
Commission file number: 814-00827
CORPORATE CAPITAL TRUST, INC.
(Exact name of registrant as specified in its charter)
| Maryland | 27-2857503 | |
| (State or other jurisdiction of incorporation or organization) |
(I.R.S. Employer Identification No.) |
| CNL Center at City Commons 450 South Orange Avenue Orlando, Florida |
32801 | |
| (Address of principal executive offices) | (Zip Code) |
Registrant’s telephone number, including area code (866) 745-3797
Indicate by check mark whether the registrant (1) has filed all reports required to be filed by Section 13 or 15(d) of the Securities Exchange Act of 1934 during the preceding 12 months (or for such shorter period that the registrant was required to file such reports), and (2) has been subject to such filing requirements for the past 90 days. Yes x No ¨
Indicate by check mark whether the registrant has submitted electronically and posted on its corporate Web site, if any, every Interactive Data File required to be submitted and posted pursuant to Rule 405 of Regulation S-T (§232.405 of this chapter) during the preceding 12 months (or for such shorter period that the registrant was required to submit and post such files). Yes ¨ No ¨
Indicate by check mark whether the registrant is a large accelerated filer, an accelerated filer, a non-accelerated filer, or a smaller reporting company. See definition of “large accelerated filer,” “accelerated filer” and “smaller reporting company” in Rule 12b-2 of the Exchange Act.
| Large accelerated filer | ¨ | Accelerated filer | ¨ | |||
| Non-accelerated filer | x Do not check if smaller reporting company | Smaller reporting company | ¨ | |||
Indicate by check mark whether the registrant is a shell company (as defined in Rule 12b-2 of the Exchange Act). Yes ¨ No x
The number of shares of common stock of the registrant outstanding as of November 10, 2016 was 309,257,129.
Table of Contents
CORPORATE CAPITAL TRUST, INC.
| PAGE | ||||||
| PART I. FINANCIAL INFORMATION |
||||||
| Item 1. |
Financial Statements: |
|||||
| 2 | ||||||
| 3 | ||||||
| 4 | ||||||
| 5 | ||||||
| 6 | ||||||
| Notes to Condensed Consolidated Financial Statements (unaudited) |
42 | |||||
| Item 2. |
Management’s Discussion and Analysis of Financial Condition and Results of Operations |
81 | ||||
| Item 3. |
106 | |||||
| Item 4. |
109 | |||||
| Item 1. |
109 | |||||
| Item 1A. |
109 | |||||
| Item 2. |
109 | |||||
| Item 3. |
109 | |||||
| Item 4. |
109 | |||||
| Item 5. |
109 | |||||
| Item 6. |
109 | |||||
| 110 | ||||||
| 111 | ||||||
Table of Contents
Corporate Capital Trust, Inc. and Subsidiaries
Condensed Consolidated Statements of Assets and Liabilities
(in thousands, except share and per share amounts)
| September 30, 2016 |
December 31, 2015 |
|||||||
| (unaudited) | ||||||||
| Assets |
||||||||
| Investment at fair value: |
||||||||
| Non-controlled, non-affiliated investments (amortized cost of $3,795,013 and $3,643,035, respectively) - including $257,130 and $315,881, respectively, of investments pledged to creditors (Note 10) |
$ | 3,637,731 | $ | 3,422,335 | ||||
| Non-controlled, affiliated investments (amortized cost of $343,849 and $302,648, respectively) |
255,051 | 219,099 | ||||||
| Controlled, affiliated investments (amortized cost of $177,770 and $83,419, respectively) |
169,916 | 87,898 | ||||||
|
|
|
|
|
|||||
| Total investments, at fair value (amortized cost of $4,316,632 and $4,029,102, respectively) |
4,062,698 | 3,729,332 | ||||||
| Cash |
38,728 | 54,016 | ||||||
| Cash denominated in foreign currency (cost of $5,111 and $15,171, respectively) |
5,143 | 15,188 | ||||||
| Collateral on deposit with custodian |
95,000 | 142,640 | ||||||
| Dividends and interest receivable |
55,807 | 46,533 | ||||||
| Receivable for investments sold |
24,402 | 25,587 | ||||||
| Principal receivable |
5,567 | 2,234 | ||||||
| Unrealized appreciation on derivative instruments |
19,825 | 16,526 | ||||||
| Receivable from advisors |
168 | 181 | ||||||
| Deferred offering expense |
522 | 1,608 | ||||||
| Prepaid and other deferred expenses |
12,906 | 7,345 | ||||||
|
|
|
|
|
|||||
| Total assets |
4,320,766 | 4,041,190 | ||||||
|
|
|
|
|
|||||
| Liabilities |
||||||||
| Revolving credit facilities |
1,046,096 | 1,030,980 | ||||||
| Term loan payable, net |
385,815 | 387,677 | ||||||
| Repurchase agreement payable |
25,029 | — | ||||||
| Payable for investments purchased |
77,797 | — | ||||||
| Unrealized depreciation on derivative instruments |
11,629 | 14,407 | ||||||
| Accrued performance-based incentive fees |
5,816 | 749 | ||||||
| Accrued investment advisory fees |
6,899 | 6,748 | ||||||
| Accrued directors’ fees |
2 | 12 | ||||||
| Other accrued expenses and liabilities |
3,602 | 6,595 | ||||||
|
|
|
|
|
|||||
| Total liabilities |
1,562,685 | 1,447,168 | ||||||
| Commitments and contingencies (Note 11) |
||||||||
|
|
|
|
|
|||||
| Net Assets |
$ | 2,758,081 | $ | 2,594,022 | ||||
|
|
|
|
|
|||||
| Components of Net Assets |
||||||||
| Common stock, $0.001 par value per share, 1,000,000,000 shares authorized, 307,308,235 and 290,430,338 shares issued and outstanding at September 30, 2016 and December 31, 2015, respectively |
$ | 307 | $ | 290 | ||||
| Paid-in capital in excess of par value |
3,001,713 | 2,850,563 | ||||||
| Undistributed net investment income |
41,008 | 67,248 | ||||||
| Accumulated net realized losses |
(38,364 | ) | (28,141 | ) | ||||
| Accumulated net unrealized depreciation on investments, derivative instruments and foreign currency translation |
(246,583 | ) | (295,938 | ) | ||||
|
|
|
|
|
|||||
| Net assets |
$ | 2,758,081 | $ | 2,594,022 | ||||
|
|
|
|
|
|||||
| Net asset value per share |
$ | 8.97 | $ | 8.93 | ||||
|
|
|
|
|
|||||
See notes to condensed consolidated financial statements.
2
Table of Contents
Corporate Capital Trust, Inc. and Subsidiaries
Condensed Consolidated Statements of Operations (unaudited)
(in thousands, except share and per share amounts)
| Three Months Ended September 30, |
Nine Months Ended September 30, |
|||||||||||||||
| 2016 | 2015 | 2016 | 2015 | |||||||||||||
| Investment income |
| |||||||||||||||
| Interest income: |
||||||||||||||||
| Non-controlled, non-affiliated investments (net of tax withholding, $319, $116, $966 and $279, respectively) |
$ | 85,176 | $ | 60,885 | $ | 247,971 | $ | 177,355 | ||||||||
| Non-controlled, affiliated investments |
— | 756 | — | 2,245 | ||||||||||||
|
|
|
|
|
|
|
|
|
|||||||||
| Total interest income |
85,176 | 61,641 | 247,971 | 179,600 | ||||||||||||
|
|
|
|
|
|
|
|
|
|||||||||
| Payment-in-kind interest income: |
||||||||||||||||
| Non-controlled, non-affiliated investments |
(1,950 | ) | 5,710 | 4,602 | 14,221 | |||||||||||
| Non-controlled, affiliated investments |
4,162 | 2,627 | 11,804 | 10,087 | ||||||||||||
|
|
|
|
|
|
|
|
|
|||||||||
| Total payment-in-kind interest income |
2,212 | 8,337 | 16,406 | 24,308 | ||||||||||||
|
|
|
|
|
|
|
|
|
|||||||||
| Fee income: |
||||||||||||||||
| Non-controlled, non-affiliated investments |
4,956 | 2,539 | 8,199 | 14,023 | ||||||||||||
|
|
|
|
|
|
|
|
|
|||||||||
| Total fee income |
4,956 | 2,539 | 8,199 | 14,023 | ||||||||||||
|
|
|
|
|
|
|
|
|
|||||||||
| Dividend and other income: |
||||||||||||||||
| Non-controlled, non-affiliated investments |
2,165 | 19 | 4,483 | 207 | ||||||||||||
| Non-controlled, affiliated investments |
421 | 459 | 1,580 | 977 | ||||||||||||
| Controlled, affiliated investments |
2,488 | 4,936 | 6,077 | 4,936 | ||||||||||||
|
|
|
|
|
|
|
|
|
|||||||||
| Total dividend and other income |
5,074 | 5,414 | 12,140 | 6,120 | ||||||||||||
|
|
|
|
|
|
|
|
|
|||||||||
| Total investment income |
97,418 | 77,931 | 284,716 | 224,051 | ||||||||||||
|
|
|
|
|
|
|
|
|
|||||||||
| Operating expenses |
||||||||||||||||
| Investment advisory fees |
21,441 | 18,867 | 61,109 | 51,004 | ||||||||||||
| Interest expense |
13,465 | 9,487 | 36,890 | 25,561 | ||||||||||||
| Performance-based incentive fees |
5,816 | — | 19,218 | 7,983 | ||||||||||||
| Offering expenses |
361 | 957 | 1,846 | 3,598 | ||||||||||||
| Administrative services |
896 | 717 | 2,618 | 2,031 | ||||||||||||
| Professional services |
653 | 621 | 2,036 | 1,988 | ||||||||||||
| Custodian and accounting fees |
406 | 377 | 1,183 | 958 | ||||||||||||
| Director fees and expenses |
129 | 158 | 370 | 478 | ||||||||||||
| Other |
1,073 | 1,029 | 2,696 | 2,741 | ||||||||||||
|
|
|
|
|
|
|
|
|
|||||||||
| Total operating expenses |
44,240 | 32,213 | 127,966 | 96,342 | ||||||||||||
|
|
|
|
|
|
|
|
|
|||||||||
| Net investment income before taxes |
53,178 | 45,718 | 156,750 | 127,709 | ||||||||||||
| Income tax expense, including excise tax |
14 | 90 | 14 | 131 | ||||||||||||
|
|
|
|
|
|
|
|
|
|||||||||
| Net investment income |
53,164 | 45,628 | 156,736 | 127,578 | ||||||||||||
|
|
|
|
|
|
|
|
|
|||||||||
| Net realized and unrealized gains (losses) |
||||||||||||||||
| Net realized gains (losses) on: |
||||||||||||||||
| Non-controlled, non-affiliated investments |
(227 | ) | (1,094 | ) | (22,657 | ) | (28,783 | ) | ||||||||
| Derivative instruments |
(561 | ) | 51,360 | 10,826 | 80,933 | |||||||||||
| Foreign currency transactions |
(587 | ) | (2,200 | ) | 1,608 | (2,828 | ) | |||||||||
|
|
|
|
|
|
|
|
|
|||||||||
| Net realized gains (losses) |
(1,375 | ) | 48,066 | (10,223 | ) | 49,322 | ||||||||||
|
|
|
|
|
|
|
|
|
|||||||||
| Net change in unrealized appreciation (depreciation) on: |
||||||||||||||||
| Non-controlled, non-affiliated investments |
44,116 | (77,888 | ) | 63,418 | (90,047 | ) | ||||||||||
| Non-controlled, affiliated investments |
7,969 | (29,875 | ) | (5,249 | ) | (48,031 | ) | |||||||||
| Controlled, affiliated investments |
(7,330 | ) | (96 | ) | (12,333 | ) | 1,579 | |||||||||
| Derivative instruments |
15,484 | (45,350 | ) | 6,077 | (38,759 | ) | ||||||||||
| Foreign currency translation |
188 | (216 | ) | (2,558 | ) | (165 | ) | |||||||||
|
|
|
|
|
|
|
|
|
|||||||||
| Net change in unrealized appreciation (depreciation) |
60,427 | (153,425 | ) | 49,355 | (175,423 | ) | ||||||||||
|
|
|
|
|
|
|
|
|
|||||||||
| Net realized and unrealized gains (losses) |
59,052 | (105,359 | ) | 39,132 | (126,101 | ) | ||||||||||
|
|
|
|
|
|
|
|
|
|||||||||
| Net increase (decrease) in net assets resulting from operations |
$ | 112,216 | $ | (59,731 | ) | $ | 195,868 | $ | 1,477 | |||||||
|
|
|
|
|
|
|
|
|
|||||||||
| Net investment income per share |
$ | 0.17 | $ | 0.17 | $ | 0.52 | $ | 0.52 | ||||||||
|
|
|
|
|
|
|
|
|
|||||||||
| Diluted and basic earnings (losses) per share |
$ | 0.37 | $ | (0.23 | ) | $ | 0.65 | $ | 0.01 | |||||||
|
|
|
|
|
|
|
|
|
|||||||||
| Weighted average number of shares of common stock outstanding (basic and diluted) |
306,927,293 | 264,030,528 | 303,271,181 | 246,351,875 | ||||||||||||
|
|
|
|
|
|
|
|
|
|||||||||
| Distributions declared per share |
$ | 0.20 | $ | 0.20 | $ | 0.60 | $ | 0.60 | ||||||||
|
|
|
|
|
|
|
|
|
|||||||||
See notes to condensed consolidated financial statements.
3
Table of Contents
Corporate Capital Trust, Inc. and Subsidiaries
Condensed Consolidated Statements of Changes in Net Assets (unaudited)
(in thousands, except share amounts)
| Nine Months Ended September 30, | ||||||||
| 2016 | 2015 | |||||||
| Operations |
||||||||
| Net investment income |
$ | 156,736 | $ | 127,578 | ||||
| Net realized gains (losses) on investments, derivative instruments and foreign currency transactions |
(10,223 | ) | 49,322 | |||||
| Net change in unrealized appreciation (depreciation) on investments, derivative instruments and foreign currency translation |
49,355 | (175,423 | ) | |||||
|
|
|
|
|
|||||
| Net increase in net assets resulting from operations |
195,868 | 1,477 | ||||||
|
|
|
|
|
|||||
| Distributions to shareholders from |
||||||||
| Net investment income |
(156,736 | ) | (127,578 | ) | ||||
| Net realized gains |
— | (21,141 | ) | |||||
| Distributions in excess of net investment income (Note 8) |
(26,240 | ) | — | |||||
|
|
|
|
|
|||||
| Net decrease in net assets resulting from shareholders’ distributions |
(182,976 | ) | (148,719 | ) | ||||
|
|
|
|
|
|||||
| Capital share transactions |
||||||||
| Issuance of shares of common stock |
119,537 | 472,250 | ||||||
| Reinvestment of shareholders’ distributions |
93,033 | 76,446 | ||||||
| Repurchase of shares of common stock |
(61,403 | ) | (20,914 | ) | ||||
|
|
|
|
|
|||||
| Net increase in net assets resulting from capital share transactions |
151,167 | 527,782 | ||||||
|
|
|
|
|
|||||
| Total increase in net assets |
164,059 | 380,540 | ||||||
| Net assets at beginning of period |
2,594,022 | 2,145,821 | ||||||
|
|
|
|
|
|||||
| Net assets at end of period |
$ | 2,758,081 | $ | 2,526,361 | ||||
|
|
|
|
|
|||||
| Capital share activity |
||||||||
| Shares issued from subscriptions |
13,434,421 | 47,926,637 | ||||||
| Shares issued from reinvestment of distributions |
10,428,645 | 7,798,343 | ||||||
| Shares repurchased |
(6,985,169 | ) | (2,150,538 | ) | ||||
|
|
|
|
|
|||||
| Net increase in shares outstanding |
16,877,897 | 53,574,442 | ||||||
|
|
|
|
|
|||||
| Undistributed net investment income at end of period |
$ | 41,008 | $ | 9,099 | ||||
|
|
|
|
|
|||||
See notes to condensed consolidated financial statements.
4
Table of Contents
Corporate Capital Trust, Inc. and Subsidiaries
Condensed Consolidated Statements of Cash Flows (unaudited)
(in thousands)
| Nine Months Ended September 30, | ||||||||
| 2016 | 2015 | |||||||
| Operating Activities: |
| |||||||
| Net increase in net assets resulting from operations |
$ | 195,868 | $ | 1,477 | ||||
| Adjustments to reconcile net increase in net assets resulting from operations to net cash used in operating activities: |
||||||||
| Purchases of investments |
(1,156,797 | ) | (1,467,289 | ) | ||||
| Increase (decrease) in payable for investments purchased |
77,753 | (31,400 | ) | |||||
| Payment-in-kind interest |
(14,252 | ) | (19,441 | ) | ||||
| Proceeds from sales of investments |
370,220 | 251,954 | ||||||
| Proceeds from principal payments |
521,431 | 385,296 | ||||||
| Net realized loss on investments |
22,657 | 28,783 | ||||||
| Net change in unrealized (appreciation) depreciation on investments |
(45,836 | ) | 136,499 | |||||
| Net change in unrealized (appreciation) depreciation on derivative instruments |
(6,077 | ) | 38,759 | |||||
| Net change in unrealized depreciation on foreign currency translation |
2,558 | 165 | ||||||
| Amortization of premium/discount, net |
(11,370 | ) | (6,102 | ) | ||||
| Amortization of deferred financing costs |
2,962 | 2,359 | ||||||
| Accretion of discount on term loan payable |
297 | 286 | ||||||
| Increase in short-term investments, net |
(19,419 | ) | (68,253 | ) | ||||
| Decrease (increase) in collateral on deposit with custodian |
47,640 | (26,940 | ) | |||||
| Increase in dividends and interest receivable |
(9,278 | ) | (20,259 | ) | ||||
| Decrease (increase) in receivable for investments sold |
1,358 | (6,339 | ) | |||||
| Increase in principal receivable |
(3,333 | ) | (819 | ) | ||||
| Decrease (increase) in receivable from advisors |
13 | (500 | ) | |||||
| Decrease (increase) in other assets |
800 | (130 | ) | |||||
| Increase in accrued investment advisory fees |
151 | 1,237 | ||||||
| Increase (decrease) in accrued performance-based incentive fees |
5,067 | (5,108 | ) | |||||
| Decrease in other accrued expenses and liabilities |
(3,003 | ) | (985 | ) | ||||
|
|
|
|
|
|||||
| Net cash used in operating activities |
(20,590 | ) | (806,750 | ) | ||||
|
|
|
|
|
|||||
| Financing Activities: |
||||||||
| Proceeds from issuance of shares of common stock |
119,537 | 472,250 | ||||||
| Payments on repurchases of shares of common stock |
(61,403 | ) | (20,914 | ) | ||||
| Distributions paid |
(89,943 | ) | (72,273 | ) | ||||
| Repayments under term loan payable |
(3,000 | ) | (3,000 | ) | ||||
| Borrowings under revolving credit facilities |
579,750 | 702,000 | ||||||
| Repayments of revolving credit facilities |
(567,046 | ) | (264,450 | ) | ||||
| Borrowings under repurchase agreement |
24,726 | — | ||||||
| Deferred financing costs paid |
(7,380 | ) | (827 | ) | ||||
|
|
|
|
|
|||||
| Net cash used in (provided by) financing activities |
(4,759 | ) | 812,786 | |||||
|
|
|
|
|
|||||
| Effect of exchange rate changes on cash |
16 | (131 | ) | |||||
|
|
|
|
|
|||||
| Net (decrease) increase in cash |
(25,333 | ) | 5,905 | |||||
| Cash and cash denominated in foreign currency, beginning of period |
69,204 | 46,977 | ||||||
|
|
|
|
|
|||||
| Cash and cash denominated in foreign currency, end of period |
$ | 43,871 | $ | 52,882 | ||||
|
|
|
|
|
|||||
| Supplemental disclosure of cash flow information and non-cash financing activities: |
||||||||
| Cash paid for interest |
$ | 33,853 | $ | 22,628 | ||||
|
|
|
|
|
|||||
| Excise taxes paid |
$ | 2,791 | $ | 1,953 | ||||
|
|
|
|
|
|||||
| Distributions reinvested |
$ | 93,033 | $ | 76,446 | ||||
|
|
|
|
|
|||||
See notes to condensed consolidated financial statements.
5
Table of Contents
Corporate Capital Trust, Inc. and Subsidiaries
Condensed Consolidated Schedule of Investments (unaudited)
As of September 30, 2016
(in thousands, except share amounts)
Company (a)(b) |
Footnotes | Industry |
Interest Rate |
Base Rate Floor |
Maturity Date (c) |
No. Shares/ Principal Amount (d) |
Cost (e) |
Fair Value |
||||||||||||||||||||
| Senior Secured Loans-First Lien—58.2% |
| |||||||||||||||||||||||||||
| A10 Capital, LLC |
(f)(g)(1) | Real Estate | L + 700 | 1.00% | 1/21/2022 | $ | 27,659 | $ | 27,324 | $ | 27,759 | |||||||||||||||||
| Abaco Systems, Inc. |
(g)(1) | Capital Goods | L + 600 | 1.00% | 12/7/2021 | 105,221 | 100,991 | 102,894 | ||||||||||||||||||||
| ABILITY Network, Inc. |
(h)(1) | Health Care Equipment & Services | L + 500 | 1.00% | 5/14/2021 | 7,635 | 7,569 | 7,594 | ||||||||||||||||||||
|
Agro Merchants NAI Holdings, LLC |
(g)(1) | Transportation | L + 700 | 1.00% | 10/1/2020 | 73,634 | 72,978 | 72,500 | ||||||||||||||||||||
| Algeco/Scotsman (LUX) |
(f)(g)(i)(j)(k) | Consumer Durables & Apparel |
|
15.75% PIK (15.75% Max PIK) |
|
5/1/2018 | 38,848 | 32,642 | 4,624 | |||||||||||||||||||
| AltEn, LLC |
(g)(k)(l)(j) | Energy |
|
10.00% PIK (10.00% Max PIK) |
|
9/12/2018 | 35,658 | 29,836 | 7,472 | |||||||||||||||||||
| American Freight, Inc. |
(g)(1) | Retailing | L + 625 | 1.00% | 10/31/2020 | 32,081 | 31,964 | 32,081 | ||||||||||||||||||||
| Amtek Global Technology Pte. Ltd. (SGP) |
(f)(g)(i)(2)(EUR) | Automobiles & Components | E + 900 | 1.00% | 11/10/2019 | € | 7,895 | 8,616 | 8,573 | |||||||||||||||||||
| (f)(g)(i)(2)(EUR) | E + 900 | 1.00% | 11/10/2019 | 59,707 | 61,052 | 64,830 | ||||||||||||||||||||||
| (f)(g)(i)(2)(EUR) | E + 900 | 1.00% | 11/10/2019 | 61,150 | 62,528 | 66,397 | ||||||||||||||||||||||
| (f)(g)(i)(2)(EUR) | E + 900 | 1.00% | 11/10/2019 | 8,515 | 8,707 | 9,245 | ||||||||||||||||||||||
| Applied Systems, Inc. |
(h)(1) | Software & Services | L + 300 | 1.00% | 1/25/2021 | $ | 643 | 639 | 645 | |||||||||||||||||||
| Bay Club Co. |
(h)(1) | Consumer Services | L + 650 | 1.00% | 8/31/2022 | 13,344 | 13,079 | 13,144 | ||||||||||||||||||||
| BeyondTrust Software, Inc. |
(g)(1) | Software & Services | L + 700 | 1.00% | 9/25/2019 | 11,947 | 11,856 | 11,601 | ||||||||||||||||||||
| Brock Holdings III, Inc. |
(1) | Capital Goods | L + 450 | 1.50% | 3/16/2017 | 499 | 487 | 494 | ||||||||||||||||||||
|
Caesars Entertainment Operating Co., Inc. |
(f)(h)(k)(1) | Consumer Services | L + 725 | 3/1/2017 | 10,800 | 10,163 | 11,853 | |||||||||||||||||||||
See notes to condensed consolidated financial statements.
6
Table of Contents
Corporate Capital Trust, Inc. and Subsidiaries
Condensed Consolidated Schedule of Investments (unaudited) (continued)
As of September 30, 2016
(in thousands, except share amounts)
Company (a)(b) |
Footnotes | Industry |
Interest Rate |
Base Rate Floor |
Maturity Date (c) |
No. Shares/ Principal Amount (d) |
Cost (e) |
Fair Value |
||||||||||||||||||||
|
Casual Dining BidCo, Ltd. (GBR) |
(f)(g)(i)(3)(GBP) | Consumer Services | L + 825 | 12/11/2020 | £ | 40,546 | $ | 60,314 | $ | 53,020 | ||||||||||||||||||
| Charlotte Russe, Inc. |
(1) | Retailing | L + 550 | 1.25% | 5/22/2019 | $ | 4,478 | 4,461 | 2,216 | |||||||||||||||||||
| (1) | L + 550 | 1.25% | 5/22/2019 | 18,291 | 18,181 | 9,054 | ||||||||||||||||||||||
| Commercial Barge Line, Co. |
(h)(1) | Transportation | L + 875 | 1.00% | 11/12/2020 | 7,513 | 6,753 | 7,335 | ||||||||||||||||||||
| David’s Bridal, Inc. |
(h)(1) | Retailing | L + 375 | 1.25% | 10/11/2019 | 313 | 305 | 295 | ||||||||||||||||||||
| Distribution International, Inc. |
(h)(1) | Retailing | L + 500 | 1.00% | 12/15/2021 | 9,021 | 8,414 | 7,713 | ||||||||||||||||||||
| EagleView Technology Corp. |
(1) | Software & Services | L + 425 | 1.00% | 7/15/2022 | 6,930 | 6,871 | 6,891 | ||||||||||||||||||||
| Emerald Performance Materials, LLC |
(h)(4) | Materials | L + 350 | 1.00% | 7/30/2021 | 630 | 628 | 635 | ||||||||||||||||||||
| Exemplis Corp. |
(g)(5) | Commercial & Professional Services | L + 650 | 1.00% | 3/23/2022 | 67,777 | 67,227 | 68,455 | ||||||||||||||||||||
| FleetPride Corp. |
(1) | Capital Goods | L + 400 | 1.25% | 11/19/2019 | 890 | 781 | 808 | ||||||||||||||||||||
| Greystone & Co., Inc. |
(g)(1) | Diversified Financials | L + 800 | 1.00% | 3/26/2021 | 33,162 | 32,749 | 32,435 | ||||||||||||||||||||
| Gymboree Corp. |
(1) | Retailing | L + 350 | 1.50% | 2/23/2018 | 10 | 9 | 8 | ||||||||||||||||||||
|
Hanson Building Products North America |
(f)(h)(1) | Capital Goods | L + 550 | 1.00% | 3/13/2022 | 15 | 15 | 15 | ||||||||||||||||||||
| Harbor Freight Tools USA, Inc. |
(h)(1) | Retailing | L + 325 | 0.75% | 8/18/2023 | 500 | 501 | 503 | ||||||||||||||||||||
| Heartland Dental Care, Inc. |
(h)(1) | Pharmaceuticals, Biotechnology & Life Sciences | L + 450 | 1.00% | 12/21/2018 | 1,031 | 1,016 | 1,033 | ||||||||||||||||||||
| Hillman Group, Inc. |
(h)(1) | Consumer Durables & Apparel | L + 350 | 1.00% | 6/30/2021 | 823 | 824 | 827 | ||||||||||||||||||||
See notes to condensed consolidated financial statements.
7
Table of Contents
Corporate Capital Trust, Inc. and Subsidiaries
Condensed Consolidated Schedule of Investments (unaudited) (continued)
As of September 30, 2016
(in thousands, except share amounts)
| Company (a)(b) | Footnotes | Industry |
Interest Rate |
Base Rate Floor |
Maturity Date (c) |
No. Shares/ Principal Amount (d) |
Cost (e) |
Fair Value |
||||||||||||||||||
| Imagine! Print Solutions, Inc. |
(g)(1) | Media | L + 625 | 1.00% | 3/31/2023 | $ | 14,925 | $ | 14,360 | $ | 14,898 | |||||||||||||||
| inVentiv Health, Inc. |
(h)(1) | Health Care Equipment & Services | L + 375 | 1.00% | 9/29/2023 | 14,239 | 14,168 | 14,298 | ||||||||||||||||||
| iPayment, Inc. |
(h)(1) | Software & Services | L + 525 | 1.50% | 5/8/2017 | 14,003 | 13,964 | 13,304 | ||||||||||||||||||
| Jacuzzi Brands, Inc. |
(g)(1) | Capital Goods | L + 650 | 1.25% | 7/3/2019 | 16,649 | 16,468 | 16,559 | ||||||||||||||||||
| Jacuzzi Brands, Inc. (LUX) |
(g)(i)(1) | Capital Goods | L + 650 | 1.25% | 7/3/2019 | 20,118 | 19,900 | 20,009 | ||||||||||||||||||
| JHT Holdings, Inc. |
(g)(1) | Capital Goods | L + 850 | 1.00% | 5/4/2022 | 36,727 | 36,030 | 36,280 | ||||||||||||||||||
| KeyPoint Government Solutions, Inc. |
(g)(1) | Capital Goods | L + 650 | 1.25% | 11/13/2017 | 28,981 | 28,817 | 28,981 | ||||||||||||||||||
| Keystone Australia Holdings, Pty. Ltd. (AUS) |
(f)(g)(i)(k)(n)(AUD) | Consumer Services | 15.00% | 8/7/2019 | A$ | 31,021 | 27,501 | 16,972 | ||||||||||||||||||
| Koosharem, LLC |
(h)(1) | Commercial & Professional Services | L + 650 | 1.00% | 5/15/2020 | $ | 21,054 | 20,907 | 18,142 | |||||||||||||||||
| Marshall Retail Group, LLC |
(g)(1) | Retailing | L + 600 | 1.00% | 8/25/2020 | 16,510 | 16,389 | 14,453 | ||||||||||||||||||
| MCS AMS Sub-Holdings, LLC |
(1) | Commercial & Professional Services | L + 650 | 1.00% | 10/15/2019 | 24,994 | 24,433 | 22,526 | ||||||||||||||||||
| Neiman Marcus Group, LLC |
(h)(1) | Retailing | L + 325 | 1.00% | 10/25/2020 | 968 | 956 | 893 | ||||||||||||||||||
| NEP Group, Inc. |
(1) | Media | L + 325 | 1.00% | 1/22/2020 | 499 | 491 | 498 | ||||||||||||||||||
| New Enterprise Stone & Lime Co., Inc. |
(g)(1) | Capital Goods | L + 850 | 1.00% | 3/19/2021 | 102,461 | 101,477 | 103,176 | ||||||||||||||||||
| (g)(1) | L + 850 | 1.00% | 3/19/2021 | 51,745 | 51,248 | 52,105 | ||||||||||||||||||||
| Nine West Holdings, Inc. |
(h)(1) | Consumer Durables & Apparel |
L + 375 | 1.00% | 10/8/2019 | 13,315 | 13,148 | 6,897 | ||||||||||||||||||
See notes to condensed consolidated financial statements.
8
Table of Contents
Corporate Capital Trust, Inc. and Subsidiaries
Condensed Consolidated Schedule of Investments (unaudited) (continued)
As of September 30, 2016
(in thousands, except share amounts)
| Company (a)(b) | Footnotes | Industry | Interest Rate |
Base Rate Floor |
Maturity Date (c) |
No. Shares/ Principal Amount (d) |
Cost (e) | Fair Value | ||||||||||||||||||
| NMI Holdings, Inc. |
(f)(g)(1) | Insurance | L + 750 | 1.00% | 11/15/2018 | $ | 37,525 | $ | 37,165 | $ | 37,289 | |||||||||||||||
| P & L Development, LLC |
(g)(j)(4) | Pharmaceuticals, Biotechnology & Life Sciences |
|
L + 750, 1.00% PIK (1.00% Max PIK) |
|
5/1/2020 | 56,311 | 55,884 | 56,347 | |||||||||||||||||
| Pacific Union Financial, LLC |
(g)(4) | Diversified Financials | L + 800 | 1.00% | 5/31/2019 | 58,062 | 57,285 | 58,912 | ||||||||||||||||||
| Paradigm Acquisition Corp. |
(1) | Health Care Equipment & Services |
L + 500 | 1.00% | 6/2/2022 | 10,953 | 10,814 | 10,912 | ||||||||||||||||||
| Payless, Inc. |
(g)(1) | Retailing | L + 625 | 1.00% | 3/2/2019 | 12,973 | 12,813 | 12,748 | ||||||||||||||||||
| Petroplex Acidizing, Inc. |
(g)(j)(k)(6) | Energy |
|
L + 625, 1.75% PIK (1.75% Max PIK) |
|
1.00% | 12/4/2019 | 37,180 | 36,185 | 23,958 | ||||||||||||||||
| Plaskolite, LLC |
(h)(1) | Materials | L + 475 | 1.00% | 11/3/2022 | 3,226 | 3,193 | 3,236 | ||||||||||||||||||
| PQ Corp. |
(h)(1) | Materials | L + 475 | 1.00% | 11/4/2022 | 687 | 681 | 694 | ||||||||||||||||||
| Proserv Acquisition, LLC |
(f)(g)(1) | Energy | L + 538 | 1.00% | 12/22/2021 | 27,102 | 21,411 | 16,701 | ||||||||||||||||||
| Proserv Acquisition, LLC (GBR) |
(f)(g)(i)(1) | Energy | L + 538 | 1.00% | 12/22/2021 | 15,908 | 12,567 | 9,803 | ||||||||||||||||||
| Raley’s |
(1) | Food & Staples Retailing | L + 625 | 1.00% | 5/18/2022 | 11,477 | 11,134 | 11,499 | ||||||||||||||||||
| RedPrairie Corp. |
(h)(4) | Software & Services | L + 500 | 1.00% | 12/21/2018 | 13,643 | 13,350 | 13,657 | ||||||||||||||||||
| Riverbed Technology, Inc. |
(h)(m)(1) | Technology Hardware & Equipment |
L + 400 | 1.00% | 4/25/2022 | 7,971 | 7,938 | 8,058 | ||||||||||||||||||
| Safety Technology Holdings, Inc. |
(g)(1) | Technology Hardware & Equipment |
L + 600 | 1.00% | 7/7/2022 | 7,500 | 7,287 | 7,314 | ||||||||||||||||||
See notes to condensed consolidated financial statements.
9
Table of Contents
Corporate Capital Trust, Inc. and Subsidiaries
Condensed Consolidated Schedule of Investments (unaudited) (continued)
As of September 30, 2016
(in thousands, except share amounts)
| Company (a)(b) | Footnotes | Industry | Interest Rate |
Base Rate Floor |
Maturity Date (c) |
No. Shares/ Principal Amount (d) |
Cost (e) | Fair Value | ||||||||||||||||||
| SARquavitae Servicios a la Dependencia, S.L. (LUX) |
(f)(g)(i)(j)(2)(EUR) | Health Care Equipment & Services | |
E + 800 (2.00% Max PIK) |
|
1.00% | 9/30/2022 | € | 28,297 | $ | 29,219 | $ | 31,758 | |||||||||||||
| (f)(g)(i)(j)(2)(EUR) |
|
E + 800 (2.00% Max PIK) |
|
1.00% | 9/30/2022 | 14,306 | 14,772 | 16,055 | ||||||||||||||||||
|
(f)(g)(i)(j)(2)(EUR) |
|
E + 800 (2.00% Max PIK) |
|
1.00% | 9/30/2022 | 3,131 | 3,233 | 3,514 | ||||||||||||||||||
| Savers, Inc. |
(h)(1) | Retailing | L + 375 | 1.25% | 7/9/2019 | $ | 1,128 | 927 | 1,037 | |||||||||||||||||
| Sequa Corp. |
(h)(m)(1) | Capital Goods | L + 400 | 1.25% | 6/19/2017 | 7,372 | 6,512 | 6,493 | ||||||||||||||||||
| Smile Brands Group, Inc. |
(g)(m)(1) | Health Care Equipment & Services | L + 625 | 1.00% | 8/15/2018 | 12,500 | 12,344 | 12,457 | ||||||||||||||||||
| SouthernCarlson |
(g)(1) | Capital Goods | L + 700 | 1.00% | 6/30/2022 | 38,349 | 37,742 | 37,392 | ||||||||||||||||||
| Standard Aero, Ltd |
(h)(1) | Capital Goods | L + 425 | 1.00% | 7/7/2022 | 997 | 1,001 | 1,005 | ||||||||||||||||||
| TIBCO Software, Inc. |
(h)(4) | Software & Services | L + 550 | 1.00% | 12/4/2020 | 22,982 | 22,378 | 22,705 | ||||||||||||||||||
| Traverse Midstream Partners, LLC |
(g)(1) | Energy | L + 1000 | 1.00% | 11/10/2020 | 7,044 | 6,922 | 6,939 | ||||||||||||||||||
| (g)(1) | L + 1000 | 1.00% | 11/10/2020 | 11,741 | 11,535 | 11,566 | ||||||||||||||||||||
| (g)(1) | L + 1000 | 1.00% | 11/10/2020 | 2,348 | 2,308 | 2,313 | ||||||||||||||||||||
| (g)(1) | L + 1000 | 1.00% | 11/10/2020 | 15,263 | 15,000 | 15,035 | ||||||||||||||||||||
| TruGreen, LP |
(h)(7) | Consumer Services | L + 550 | 1.00% | 4/13/2023 | 9,975 | 9,825 | 10,081 | ||||||||||||||||||
| TTM Technologies, Inc. |
(f)(4) | Technology Hardware & Equipment | L + 500 | 1.00% | 5/31/2021 | 9,773 | 9,492 | 9,492 | ||||||||||||||||||
| Tweddle Group, Inc. |
(g)(1) | Automobiles & Components | L + 675 | 1.00% | 4/7/2020 | 40,647 | 39,968 | 40,635 | ||||||||||||||||||
See notes to condensed consolidated financial statements.
10
Table of Contents
Corporate Capital Trust, Inc. and Subsidiaries
Condensed Consolidated Schedule of Investments (unaudited) (continued)
As of September 30, 2016
(in thousands, except share amounts)
| Company (a)(b) | Footnotes | Industry | Interest Rate |
Base Rate Floor |
Maturity Date (c) |
No. Shares/ Principal Amount (d) |
Cost (e) | Fair Value |
||||||||||||||||||||||
| Vertafore, Inc. |
(h)(7) | Software & Services | L + 375 | 1.00% | 6/30/2023 | $ | 1,032 | $ | 1,027 | $ | 1,037 | |||||||||||||||||||
| Waste Pro USA, Inc. |
(g)(1) | Transportation | L + 750 | 1.00% | 10/15/2020 | 36,039 | 36,039 | 36,025 | ||||||||||||||||||||||
| Willbros Group, Inc. |
(g)(1) | Energy | L + 975 | 1.25% | 12/15/2019 | 25,599 | 25,599 | 24,469 | ||||||||||||||||||||||
| Z Gallerie, Inc. |
(g)(1) | Retailing | L + 650 | 1.00% | 10/8/2020 | 32,030 | 31,760 | 31,742 | ||||||||||||||||||||||
| Total Senior Secured Loans - First Lien |
|
$ | 1,695,047 | $ | 1,605,818 | |||||||||||||||||||||||||
|
|
|
|
|
|||||||||||||||||||||||||||
| Senior Secured Loans - Second Lien—39.8% |
|
|||||||||||||||||||||||||||||
| Abaco Systems, Inc. |
(g)(1) | Capital Goods | L + 1050 | 1.00% | 6/7/2022 | $ | 63,371 | $ | 62,208 | $ | 63,192 | |||||||||||||||||||
| Angelica Corp. |
(g)(k)(1) | Health Care Equipment & Services | L + 875 | 1.25% | 8/20/2019 | 50,869 | 50,869 | 25,377 | ||||||||||||||||||||||
| Applied Systems, Inc. |
(h)(1) | Software & Services | L + 650 | 1.00% | 1/24/2022 | 24,242 | 24,352 | 24,508 | ||||||||||||||||||||||
| Belk, Inc. |
(g) | Retailing | 10.50% | 6/12/2023 | 99,615 | 97,755 | 93,743 | |||||||||||||||||||||||
| Bon-Ton Department Stores, Inc. |
(f)(g)(1) | Retailing | L + 950 | 1.00% | 3/18/2021 | 13,529 | 13,261 | 13,279 | ||||||||||||||||||||||
| CPI International, Inc. |
(g)(4) | Capital Goods | L + 700 | 1.00% | 9/16/2017 | 28,000 | 27,680 | 28,042 | ||||||||||||||||||||||
| CTI Foods Holding Co., LLC |
(1) | Food, Beverage & Tobacco | L + 725 | 1.00% | 6/28/2021 | 23,219 | 22,983 | 20,897 | ||||||||||||||||||||||
| Deltek, Inc. |
(h)(1) | Software & Services | L + 850 | 1.00% | 6/26/2023 | 35,369 | 35,056 | 35,856 | ||||||||||||||||||||||
| EagleView Technology Corp. |
(1) | Software & Services | L + 825 | 1.00% | 7/14/2023 | 33,000 | 32,554 | 32,890 | ||||||||||||||||||||||
| Emerald Performance Materials, LLC |
(h)(4) | Materials | L + 675 | 1.00% | 8/1/2022 | 2,040 | 2,032 | 2,040 | ||||||||||||||||||||||
| Excelitas Technologies Corp. |
(g)(j)(1) | Technology Hardware & Equipment | |
L + 975, 3.00% PIK (3.00% Max PIK) |
|
1.00% | 4/29/2021 | 113,413 | 113,413 | 105,747 | ||||||||||||||||||||
See notes to condensed consolidated financial statements.
11
Table of Contents
Corporate Capital Trust, Inc. and Subsidiaries
Condensed Consolidated Schedule of Investments (unaudited) (continued)
As of September 30, 2016
(in thousands, except share amounts)
| Company (a)(b) | Footnotes | Industry | Interest Rate |
Base Rate Floor |
Maturity Date (c) |
No. Shares/ Principal Amount (d) |
Cost (e) | Fair Value | ||||||||||||||||||||||||||
| Genoa, a QoL Healthcare Co., LLC |
(1) | Health Care Equipment & Services | L + 775 | 1.00% | 4/28/2023 | $ | 3,731 | $ | 3,698 | $ | 3,759 | |||||||||||||||||||||||
| Greenway Medical Technologies |
(1) | Health Care Equipment & Services | L + 825 | 1.00% | 11/4/2021 | 12,442 | 12,306 | 11,540 | ||||||||||||||||||||||||||
| Grocery Outlet, Inc. |
(h)(1) | Food & Staples Retailing | L + 825 | 1.00% | 10/21/2022 | 45,346 | 44,164 | 45,346 | ||||||||||||||||||||||||||
| iParadigms Holdings, LLC |
(1) | Software & Services | L + 725 | 1.00% | 7/29/2022 | 24,366 | 24,219 | 23,940 | ||||||||||||||||||||||||||
| Lightower Fiber, LLC |
(h)(1) | Telecommunication Services | L + 675 | 1.25% | 4/12/2021 | 15,799 | 15,562 | 15,868 | ||||||||||||||||||||||||||
| MedAssets, Inc. |
(g)(1) | Health Care Equipment & Services | L + 975 | 1.00% | 4/19/2023 | 63,000 | 61,191 | 63,221 | ||||||||||||||||||||||||||
| NEP Group, Inc. |
(h)(1) | Media | L + 875 | 1.25% | 7/22/2020 | 1,150 | 1,120 | 1,159 | ||||||||||||||||||||||||||
| NewWave Communications, Inc. |
(1) | Media | L + 800 | 1.00% | 10/30/2020 | 13,712 | 13,682 | 13,472 | ||||||||||||||||||||||||||
| P2 Energy Solutions, Inc. |
(f)(1) | Software & Services | L + 800 | 1.00% | 4/30/2021 | 74,312 | 72,692 | 64,837 | ||||||||||||||||||||||||||
| (f)(h)(7) | L + 800 | 1.00% | 4/30/2021 | 9,283 | 9,217 | 8,099 | ||||||||||||||||||||||||||||
| Petrochoice Holdings, Inc. |
(g)(4) | Capital Goods | L + 875 | 1.00% | 8/21/2023 | 65,000 | 63,223 | 62,858 | ||||||||||||||||||||||||||
| Plaskolite, LLC |
(g)(1) | Materials | L + 825 | 1.00% | 11/3/2023 | 33,543 | 32,582 | 33,740 | ||||||||||||||||||||||||||
| Polyconcept North America, Inc. |
(g)(4) | Consumer Durables & Apparel | L + 1000 | 1.00% | 12/31/2023 | 29,376 | 28,652 | 28,796 | ||||||||||||||||||||||||||
| Press Ganey Holdings, Inc. |
(5) | Health Care Equipment & Services | L + 800 | 1.00% | 9/30/2024 | 6,703 | 6,636 | 6,753 | ||||||||||||||||||||||||||
| RedPrairie Corp. |
(4) | Software & Services | L + 1000 | 1.25% | 12/21/2019 | 39,868 | 37,602 | 40,205 | ||||||||||||||||||||||||||
| SI Organization, Inc. |
(1) | Capital Goods | L + 875 | 1.00% | 5/23/2020 | 87,673 | 86,682 | 88,111 | ||||||||||||||||||||||||||
See notes to condensed consolidated financial statements.
12
Table of Contents
Corporate Capital Trust, Inc. and Subsidiaries
Condensed Consolidated Schedule of Investments (unaudited) (continued)
As of September 30, 2016
(in thousands, except share amounts)
| Company (a)(b) | Footnotes | Industry | Interest Rate |
Base Rate Floor |
Maturity Date (c) |
No. Shares/ Principal Amount (d) |
Cost (e) | Fair Value | ||||||||||||||||||||||||||
| Talbots, Inc. |
(h)(1) | Retailing | L + 850 | 1.00% | 3/19/2021 | $ | 3,293 | $ | 3,269 | $ | 3,079 | |||||||||||||||||||||||
| Valeo Foods Group Ltd. (IRL) |
(f)(g)(i)(8)(GBP) | Food, Beverage & Tobacco | L + 800 | 1.00% | 5/8/2023 | £ | 29,125 | 43,722 | 37,939 | |||||||||||||||||||||||||
| Vertafore, Inc. |
(g)(1) | Software & Services | L + 900 | 1.00% | 6/30/2024 | $ | 81,500 | 79,116 | 81,918 | |||||||||||||||||||||||||
| WireCo WorldGroup, Inc. |
(m)(1) | Capital Goods | L + 950 | 1.00% | 7/12/2024 | 7,108 | 7,002 | 7,126 | ||||||||||||||||||||||||||
| Other |
13,499 | 13,450 | 8,559 | |||||||||||||||||||||||||||||||
| Total Senior Secured Loans - Second Lien |
$ | 1,141,950 | $ | 1,095,896 | ||||||||||||||||||||||||||||||
|
|
|
|
|
|||||||||||||||||||||||||||||||
| Senior Secured Bonds—5.6% |
||||||||||||||||||||||||||||||||||
| Artesyn Technologies, Inc. |
(h)(o)(p) | Technology Hardware & Equipment | 9.75% | 10/15/2020 | $ | 16,059 | $ | 15,605 | $ | 14,574 | ||||||||||||||||||||||||
| Calumet Specialty Products Partners, LP |
(f)(h)(p) | Energy | 11.50% | 1/15/2021 | 13,398 | 13,186 | 15,341 | |||||||||||||||||||||||||||
| Cequel Communications Holdings, LLC |
(f)(o)(p) | Media | 7.75% | 7/15/2025 | 10,656 | 10,421 | 11,508 | |||||||||||||||||||||||||||
| Direct ChassisLink, Inc. |
(o)(p) | Transportation | 10.00% | 6/15/2023 | 2,498 | 2,498 | 2,623 | |||||||||||||||||||||||||||
| Guitar Center, Inc. |
(o)(p) | Retailing | 6.50% | 4/15/2019 | 19,307 | 19,030 | 16,990 | |||||||||||||||||||||||||||
| iPayment, Inc. |
(o)(p) | Software & Services | 9.50% | 12/15/2019 | 4,693 | 4,693 | 4,711 | |||||||||||||||||||||||||||
| Louisiana Public Facilities Authority |
(g)(k)(p)(1) | Energy | L + 1000 | 1.50% | 1/1/2020 | 10,650 | 10,650 | 7,007 | ||||||||||||||||||||||||||
| (g)(k)(1) | L + 1000 | 1.50% | 1/1/2020 | 34,330 | 33,586 | 22,586 | ||||||||||||||||||||||||||||
| Maxim Crane, LP |
(o)(p) | Capital Goods | 10.13% | 8/1/2024 | 3,821 | 3,821 | 3,964 | |||||||||||||||||||||||||||
See notes to condensed consolidated financial statements.
13
Table of Contents
Corporate Capital Trust, Inc. and Subsidiaries
Condensed Consolidated Schedule of Investments (unaudited) (continued)
As of September 30, 2016
(in thousands, except share amounts)
| Company (a)(b) | Footnotes | Industry | Interest Rate |
Base Rate Floor |
Maturity Date (c) |
No. Shares/ Principal Amount (d) |
Cost (e) | Fair Value | ||||||||||||||||||||||||||
| NESCO, LLC |
(o)(p) | Capital Goods | 6.88% | 2/15/2021 | $ | 12,944 | $ | 8,666 | $ | 9,546 | ||||||||||||||||||||||||
| OAG Holdings, LLC |
(g)(j) | Energy | |
8.00%, 2.00% PIK (2.00% Max PIK) |
|
12/20/2020 | 21,153 | 18,695 | 1,961 | |||||||||||||||||||||||||
| PQ Corp. |
(o)(p) | Materials | 6.75% | 11/15/2022 | 1,052 | 1,052 | 1,115 | |||||||||||||||||||||||||||
| RedPrairie Corp. |
(m)(p) | Software & Services | 7.375% | 10/15/2024 | 13,805 | 13,805 | 14,185 | |||||||||||||||||||||||||||
| Rockport Group, LLC |
(g) | Consumer Durables & Apparel | 9.50% | 7/31/2022 | 28,516 | 27,893 | 27,728 | |||||||||||||||||||||||||||
| Towergate (GBR) |
(f)(i)(o)(GBP) | Insurance | 8.75% | 4/2/2020 | £ | 936 | 1,422 | 1,056 | ||||||||||||||||||||||||||
| Total Senior Secured Bonds |
$ | 185,023 | $ | 154,895 | ||||||||||||||||||||||||||||||
|
|
|
|
|
|||||||||||||||||||||||||||||||
| Total Senior Debt |
$ | 3,022,020 | $ | 2,856,609 | ||||||||||||||||||||||||||||||
|
|
|
|
|
|||||||||||||||||||||||||||||||
| Subordinated Debt—20.8% |
||||||||||||||||||||||||||||||||||
| Alion Science & Technology Corp. |
(g)(p) | Capital Goods | 11.00% | 8/19/2022 | $ | 68,603 | $ | 67,676 | $ | 65,675 | ||||||||||||||||||||||||
| Block Communications, Inc. |
(o)(p) | Media | 7.25% | 2/1/2020 | 845 | 850 | 866 | |||||||||||||||||||||||||||
| Builders FirstSource, Inc. |
(f)(o)(p) | Capital Goods | 10.75% | 8/15/2023 | 1,431 | 1,431 | 1,642 | |||||||||||||||||||||||||||
| Cemex Materials, LLC |
(o)(p) | Materials | 7.70% | 7/21/2025 | 58,454 | 62,055 | 61,961 | |||||||||||||||||||||||||||
| Cequel Communications Holdings, LLC |
(f)(o)(p) | Media | 5.13% | 12/15/2021 | 13,325 | 13,136 | 13,292 | |||||||||||||||||||||||||||
| ClubCorp Club Operations, Inc. |
(o)(p) | Consumer Services | 8.25% | 12/15/2023 | 693 | 660 | 745 | |||||||||||||||||||||||||||
| Datatel, Inc. |
(o)(p) | Software & Services | 9.00% | 9/30/2023 | 3,320 | 3,210 | 3,486 | |||||||||||||||||||||||||||
See notes to condensed consolidated financial statements.
14
Table of Contents
Corporate Capital Trust, Inc. and Subsidiaries
Condensed Consolidated Schedule of Investments (unaudited) (continued)
As of September 30, 2016
(in thousands, except share amounts)
Company (a)(b) |
Footnotes | Industry |
Interest Rate |
Base Rate Floor |
Maturity Date (c) |
No. Shares/ Principal Amount (d) |
Cost (e) |
Fair Value |
||||||||||||||||||||
| Essar Steel Algoma, Inc. (CAN) |
(f)(i)(j)(k)(o) | Materials |
|
14.00% PIK (14.00% Max PIK) |
|
2/13/2020 | $ | 5,069 | $ | 4,383 | $ | 127 | ||||||||||||||||
| Exemplis Corp. |
(g)(j)(1) | Commercial & Professional Services | |
L + 700, 2.00% PIK (2.00% Max PIK) |
|
3/23/2020 | 19,722 | 19,722 | 20,018 | |||||||||||||||||||
| GCI, Inc. |
(o) | Telecommunication Services | 6.75% | 6/1/2021 | 890 | 884 | 914 | |||||||||||||||||||||
| (o) | 6.88% | 4/15/2025 | 13,693 | 13,621 | 14,035 | |||||||||||||||||||||||
| GCP Applied Technologies, Inc. |
(f)(o)(p) | Materials | 9.50% | 2/1/2023 | 911 | 911 | 1,036 | |||||||||||||||||||||
| Hilding Anders (SWE) |
(f)(g)(i)(j)(l)(EUR) | Consumer Durables & Apparel |
|
13.00% PIK (13.00% Max PIK) |
|
6/30/2021 | € | 112,086 | 134,277 | 105,072 | ||||||||||||||||||
| (f)(g)(i)(j)(k)(l)(EUR) |
|
12.00% PIK (12.00% Max PIK) |
|
12/31/2023 | 19,813 | 939 | 18 | |||||||||||||||||||||
| (f)(g)(i)(j)(k)(l)(EUR) |
|
18.00% PIK (18.00% Max PIK) |
|
12/31/2024 | 9,860 | 8,485 | 3,839 | |||||||||||||||||||||
| Hillman Group, Inc. |
(o)(p) | Consumer Durables & Apparel | 6.38% | 7/15/2022 | $ | 559 | 541 | 524 | ||||||||||||||||||||
| IMS Health, Inc. |
(f)(o)(p) | Health Care Equipment & Services | 6.00% | 11/1/2020 | 2,160 | 2,231 | 2,192 | |||||||||||||||||||||
| JC Penney Corp., Inc. |
(f)(o) | Retailing | 5.65% | 6/1/2020 | 8,354 | 6,003 | 8,374 | |||||||||||||||||||||
| Jo-Ann Stores, Inc. (o)(p) |
Retailing | 8.13% | 3/15/2019 | 2,514 | 2,383 | 2,508 | ||||||||||||||||||||||
| Kenan Advantage Group, Inc. |
(o)(p) | Transportation | 7.88% | 7/31/2023 | 24,440 | 24,350 | 23,157 | |||||||||||||||||||||
| Lightower Fiber, LLC |
(g) | Telecommunication Services | 10.00% | 2/12/2022 | 11,555 | 11,350 | 11,706 | |||||||||||||||||||||
| (g)(j) |
|
12.00% PIK (12.00% Max PIK) |
|
8/12/2025 | 9,708 | 9,546 | 9,877 | |||||||||||||||||||||
See notes to condensed consolidated financial statements.
15
Table of Contents
Corporate Capital Trust, Inc. and Subsidiaries
Condensed Consolidated Schedule of Investments (unaudited) (continued)
As of September 30, 2016
(in thousands, except share amounts)
Company (a)(b) |
Footnotes | Industry |
Interest Rate |
Base Rate Floor |
Maturity Date (c) |
No. Shares/ Principal Amount (d) |
Cost (e) |
Fair Value |
||||||||||||||||||||||
| Manitowoc Foodservice, Inc. |
(f)(h) | Capital Goods | 9.50% | 2/15/2024 | $ | 3,894 | $ | 3,894 | $ | 4,439 | ||||||||||||||||||||
| MultiPlan, Inc. |
(h)(p) | Health Care Equipment & Services | 7.13% | 6/1/2024 | 2,336 | 2,336 | 2,511 | |||||||||||||||||||||||
| Platform Specialty Products Corp. |
(f)(o)(p) | Materials | 10.38% | 5/1/2021 | 2,747 | 2,747 | 2,967 | |||||||||||||||||||||||
| PQ Corp. |
(g)(p)(1) | Materials | L + 1075 | 1.00% | 5/1/2022 | 133,488 | 130,900 | 137,019 | ||||||||||||||||||||||
| Riverbed Technology, Inc. |
(o)(p) | Technology Hardware & Equipment | 8.88% | 3/1/2023 | 10,662 | 10,767 | 11,395 | |||||||||||||||||||||||
| Solera Holdings, Inc. |
(h)(o)(p) | Software & Services | 10.50% | 3/1/2024 | 19,123 | 18,207 | 21,322 | |||||||||||||||||||||||
| Surgery Center Holdings, Inc. |
(f)(h)(o)(p) | Health Care Equipment & Services | 8.88% | 4/15/2021 | 5,972 | 6,024 | 6,375 | |||||||||||||||||||||||
| TIBCO Software, Inc. |
(o)(p) | Software & Services | 11.38% | 12/1/2021 | 21,219 | 20,770 | 18,885 | |||||||||||||||||||||||
| Vertiv Co. |
(f)(p) | Technology Hardware & Equipment | 9.25% | 10/15/2024 | 19,178 | 19,178 | 19,178 | |||||||||||||||||||||||
| Total Subordinated Debt |
$ | 603,467 | $ | 575,155 | ||||||||||||||||||||||||||
|
|
|
|
|
|||||||||||||||||||||||||||
| Structured Products—7.8% |
||||||||||||||||||||||||||||||
| Central Park Leasing SARL (LUX), Partnership Interest |
(f)(g)(i) | Capital Goods | N/A | $ | 63,419 | $ | 63,369 | |||||||||||||||||||||||
| Comet Aircraft SARL (LUX), Common Shares |
(f)(g)(i)(q) | Capital Goods | 549,451 | 49,618 | 49,603 | |||||||||||||||||||||||||
| Guardian Investors, LLC, Membership Interest |
(f)(g)(q) | Diversified Financials | N/A | 9,345 | 5,941 | |||||||||||||||||||||||||
| Innovating Partners, LLC, Membership Interest |
(f)(g)(q) | Diversified Financials | N/A | 12,027 | 7,258 | |||||||||||||||||||||||||
| KKR BPT Holdings Aggregator, LLC, Membership Interest |
(f)(g)(q)* | Diversified Financials | N/A | 10,500 | 7,836 | |||||||||||||||||||||||||
See notes to condensed consolidated financial statements.
16
Table of Contents
Corporate Capital Trust, Inc. and Subsidiaries
Condensed Consolidated Schedule of Investments (unaudited) (continued)
As of September 30, 2016
(in thousands, except share amounts)
Company (a)(b) |
Footnotes | Industry |
Interest Rate |
Base Rate Floor |
Maturity Date (c) |
No. Shares/ Principal Amount (d) |
Cost (e) |
Fair Value |
||||||||||||||||||||
| LSF IX Java Investments, Ltd (IRL), Facility B |
(f)(g)(i)(u)(2)(EUR) | Diversified Financials | E + 315 | 12/3/2019 | € | 56,406 | $ | 50,317 | $ | 51,744 | ||||||||||||||||||
| Trade Finance Funding I, Ltd. 2013-1A Class B (CYM) |
(f)(g)(i)(p) | Diversified Financials | 10.75% | 11/13/2018 | $ | 28,221 | 28,221 | 28,221 | ||||||||||||||||||||
| Total Structured Products |
|
$ | 223,447 | $ | 213,972 | |||||||||||||||||||||||
|
|
|
|
|
|||||||||||||||||||||||||
|
Equity/Other—14.1% |
|
|||||||||||||||||||||||||||
| Alion Science & Technology Corp., Class A Membership Interest |
(g)* | Capital Goods | N/A | $ | 7,350 | $ | 6,329 | |||||||||||||||||||||
| AltEn, LLC, Membership Units |
(g)(l)* | Energy | 2,384 | 2,955 | — | |||||||||||||||||||||||
| Amtek Global Technology Pte. Ltd. (SGP), Warrants |
(f)(g)(i)*(EUR) | Automobiles & Components | 12/31/2017 | 9,991 | 4,636 | 4,205 | ||||||||||||||||||||||
| (f)(g)(i)*(EUR) | 12/31/2018 | 9,991 | 4,785 | 4,359 | ||||||||||||||||||||||||
| Belk, Inc., Units |
(g)* | Retailing | 1,642 | 9,961 | 9,812 | |||||||||||||||||||||||
| Cengage Learning Holdings II, LP, Common Stock |
Media | 227,802 | 7,529 | 4,955 | ||||||||||||||||||||||||
| Education Management Corp., Common Stock |
(g)* | Consumer Services | 3,779,591 | 1,047 | — | |||||||||||||||||||||||
| Education Management Corp., Warrants |
(g)* | 1/5/2022 | 2,320,791 | 371 | — | |||||||||||||||||||||||
| Excelitas Technologies Corp., Class A Membership Interest |
(g)* | Technology Hardware & Equipment | N/A | 5,636 | 4,085 | |||||||||||||||||||||||
| GA Capital Specialty Lending Fund, Limited Partnership Interest |
(f)(g) | Diversified Financials | N/A | 46,075 | 46,075 | |||||||||||||||||||||||
| Genesys Telecommunications Laboratories, Inc., Common Shares |
(g)* | Software & Services | 2,501 | 120 | 450 | |||||||||||||||||||||||
| Genesys Telecommunications Laboratories, Inc., Preferred Shares |
(g) | 525 | 117 | 441 | ||||||||||||||||||||||||
See notes to condensed consolidated financial statements.
17
Table of Contents
Corporate Capital Trust, Inc. and Subsidiaries
Condensed Consolidated Schedule of Investments (unaudited) (continued)
As of September 30, 2016
(in thousands, except share amounts)
Company (a)(b) |
Footnotes | Industry |
Interest Rate |
Base Rate Floor |
Maturity Date (c) |
No. Shares/ Principal Amount (d) |
Cost (e) |
Fair Value |
||||||||||||||||||
| Hilding Anders (SWE), Class A Common Stock |
(f)(g)(i)(l)*(SEK) | Consumer Durables & Apparel | 1,394,288 | $ | 132 | $ | 1 | |||||||||||||||||||
| Hilding Anders (SWE), Class B Common Stock |
(f)(g)(i)(l)*(SEK) | 260,253 | 25 | — | ||||||||||||||||||||||
| Hilding Anders (SWE), Equity Options |
(f)(g)(i)(l)*(SEK) | 12/31/2020 | 236,160,807 | 14,988 | 5,005 | |||||||||||||||||||||
| Home Partners of America, Inc., Common Stock |
(g)(l)* | Real Estate | 98,053 | 99,726 | 109,750 | |||||||||||||||||||||
| Home Partners of America, Inc., Warrants |
(g)(l)* | 8/7/2024 | 2,675 | 292 | 529 | |||||||||||||||||||||
| iPayment, Inc., Common Stock |
(g)* | Software & Services | 538,144 | 1,988 | 1,183 | |||||||||||||||||||||
| Jones Apparel Group Holdings, Inc., Common Stock |
(g) | Consumer Durables & Apparel | 5,451 | 872 | 2,686 | |||||||||||||||||||||
| Keystone Australia Holdings, Pty. Ltd. (AUS), Warrants |
(f)(g)(i)(r)*(AUD) | Consumer Services | 1,588,469 | 1,019 | — | |||||||||||||||||||||
| Nine West Holdings, Inc., Common Stock |
(g)* | Consumer Durables & Apparel | 5,451 | 6,541 | — | |||||||||||||||||||||
| OAG Holdings, LLC, Overriding Royalty Interest |
(g) | Energy | N/A | 2,354 | — | |||||||||||||||||||||
| Orchard Marine, Ltd. (VGB), Class B Common Stock |
(f)(g)(i)(l)* | Transportation | 1,964 | 3,069 | — | |||||||||||||||||||||
| Orchard Marine, Ltd. (VGB), Series A Preferred Stock |
(f)(g)(i)(l)(s) | 9.00% | 50,082 | 49,125 | 23,365 | |||||||||||||||||||||
| Polyconcept North America Holdings, Inc., Class A-1 Units |
(g) | Consumer Durables & Apparel | 29,376 | 2,938 | 2,862 | |||||||||||||||||||||
| PQ Corp., Class B Common Stock |
(g)* | Materials | 18,059 | 3,337 | 3,315 | |||||||||||||||||||||
| Sentry Holdings, Ltd. (JEY), Common Shares A |
(f)(g)(i)*(GBP) | Insurance | 16,450 | — | — | |||||||||||||||||||||
| Sentry Holdings, Ltd. (JEY), Preferred B Shares |
(f)(g)(i)*(GBP) | 6,113,719 | 9,065 | 7,608 | ||||||||||||||||||||||
| SquareTwo Financial Corp., Series A Preferred Stock |
(g)(j)* | Diversified Financials |
|
12.50% PIK (12.50% Max PIK) |
|
5,615,400 | 5,457 | — | ||||||||||||||||||
See notes to condensed consolidated financial statements.
18
Table of Contents
Corporate Capital Trust, Inc. and Subsidiaries
Condensed Consolidated Schedule of Investments (unaudited) (continued)
As of September 30, 2016
(in thousands, except share amounts)
Company (a)(b) |
Footnotes | Industry |
Interest Rate |
Base Rate Floor |
Maturity Date (c) |
No. Shares/ Principal Amount (d) |
Cost (e) |
Fair Value |
||||||||||||||||||||
| Star Mountain SMB Multi-Manager Credit Platform, LP, Limited Partnership Interest |
(f)(g) | Diversified Financials | N/A | $ | 45,487 | $ | 47,515 | |||||||||||||||||||||
| Strategic Credit Opportunities Partners, LLC, Units |
(f)(g)(q) | Diversified Financials | 92,400 | 92,400 | 95,398 | |||||||||||||||||||||||
| Stuart Weitzman, Inc., Common Stock |
(g) | Consumer Durables & Apparel | 5,451 | — | 1,235 | |||||||||||||||||||||||
| Toorak Capital Partners, LLC, Membership Interest |
(f)(g)(q) | Diversified Financials | N/A | 3,880 | 3,880 | |||||||||||||||||||||||
| Towergate (GBR), Ordinary Shares |
(f)(g)(i)*(GBP) | Insurance | 116,814 | 173 | 145 | |||||||||||||||||||||||
| Willbros Group, Inc., Common Stock |
* | Energy | 2,810,814 | 7,760 | 5,284 | |||||||||||||||||||||||
| Total Equity/Other |
|
$ | 441,208 | $ | 390,472 | |||||||||||||||||||||||
|
|
|
|
|
|||||||||||||||||||||||||
| Total Investments, excluding Short Term Investments — 146.3% |
$ | 4,290,142 | $ | 4,036,208 | ||||||||||||||||||||||||
|
|
|
|
|
|||||||||||||||||||||||||
| Short Term Investments—1.0% |
| |||||||||||||||||||||||||||
| Goldman Sachs Financial Square Funds - Treasury Instruments Fund |
(h)(t) | 0.05% | 11,270,627 | $ | 11,271 | $ | 11,271 | |||||||||||||||||||||
| State Street Institutional Liquid Reserves Fund, Premier Class |
(t) | 0.40% | 15,218,782 | 15,219 | 15,219 | |||||||||||||||||||||||
| Total Short Term Investments |
$ | 26,490 | $ | 26,490 | ||||||||||||||||||||||||
|
|
|
|
|
|||||||||||||||||||||||||
See notes to condensed consolidated financial statements.
19
Table of Contents
Corporate Capital Trust, Inc. and Subsidiaries
Condensed Consolidated Schedule of Investments (unaudited) (continued)
As of September 30, 2016
(in thousands, except share amounts)
Company (a)(b) |
Footnotes | Industry |
Interest Rate |
Base Rate Floor |
Maturity Date (c) |
No. Shares/ Principal Amount (d) |
Cost (e) |
Fair Value |
||||||||||||||||||||||
| TOTAL INVESTMENTS — 147.3%(v) |
|
$ | 4,316,632 | $ | 4,062,698 | |||||||||||||||||||||||||
|
|
|
|
|
|||||||||||||||||||||||||||
| LIABILITIES IN EXCESS OF OTHER ASSETS—(47.3%) |
|
(1,304,617 | ) | |||||||||||||||||||||||||||
| NET ASSETS—100.0% |
|
$ | 2,758,081 | |||||||||||||||||||||||||||
| Collateral on Deposit with Custodian—3.4% |
||||||||||||||||||||||||||||||
| Bank of Nova Scotia—Certificate of Deposit |
12/30/2016 | $ | 95,000 | $ | 95,000 | $ | 95,000 | |||||||||||||||||||||||
| Total Collateral on Deposit with Custodian |
|
$ | 95,000 | $ | 95,000 | |||||||||||||||||||||||||
|
|
|
|
|
|||||||||||||||||||||||||||
| Derivative Instruments (Note 4)—0.3% |
||||||||||||||||||||||||||||||
| Cross Currency Swaps |
(f | ) | $ | — | $ | 9,997 | ||||||||||||||||||||||||
| Foreign currency forward contracts |
(f | ) | — | (18 | ) | |||||||||||||||||||||||||
| Interest rate swaps |
(f | ) | — | (6,611 | ) | |||||||||||||||||||||||||
| Total return swaps |
(f | )(g) | — | 4,828 | ||||||||||||||||||||||||||
| Total Derivative Instruments |
|
$ | — | $ | 8,196 | |||||||||||||||||||||||||
|
|
|
|
|
|||||||||||||||||||||||||||
| (a) | Security may be an obligation of one or more entities affiliated with the named company. |
| (b) | Non-controlled/non-affiliated investments as defined by the Investment Company Act of 1940, as amended (“1940 Act”), unless otherwise indicated. Non-controlled/non-affiliated investments are investments that are neither controlled investments nor affiliated investments. |
| (c) | Represents maturity of debt securities and expiration of applicable equity investments. |
| (d) | Denominated in U.S. dollars unless otherwise noted. |
| (e) | Represents amortized cost for debt securities and cost for equity investments translated to U.S. dollars. |
See notes to condensed consolidated financial statements.
20
Table of Contents
Corporate Capital Trust, Inc. and Subsidiaries
Condensed Consolidated Schedule of Investments (unaudited) (continued)
As of September 30, 2016
(in thousands, except share amounts)
| (f) | The investment is not a qualifying asset as defined in Section 55(a) under the 1940 Act. A business development company may not acquire any asset other than qualifying assets, unless, at the time the acquisition is made, qualifying assets represent at least 70% of the company’s total assets. The Company calculates its compliance with the qualifying assets test on a “look through” basis by disregarding the value of the Company’s total return swaps and treating each loan underlying the total return swaps as either a qualifying asset or non-qualifying asset based on whether the obligor is an eligible portfolio company. On this basis, 74.2% of the Company’s total assets represented qualifying assets as of September 30, 2016. | |
| (g) | Investments classified as Level 3 whereby fair value was determined by the Company’s Board of Directors (see Note 2). | |
| (h) | Security or portion thereof was held within CCT Funding, LLC and was pledged as collateral supporting the amounts outstanding under the revolving credit facility with Deutsche Bank as of September 30, 2016. | |
| (i) | A portfolio company domiciled in a foreign country. The jurisdiction of the security issuer may be a different country than the domicile of the portfolio company. | |
| (j) | The underlying credit agreement or indenture contains a PIK provision, whereby the issuer has either the option or the obligation to make interest payments with the issuance of additional securities. The interest rate in the schedule represents the current interest rate in effect for these investments. | |
| (k) | Investment was on non-accrual status as of September 30, 2016. |
See notes to condensed consolidated financial statements.
21
Table of Contents
Corporate Capital Trust, Inc. and Subsidiaries
Condensed Consolidated Schedule of Investments (unaudited) (continued)
As of September 30, 2016
(in thousands, except share amounts)
| (l) | Affiliated investment as defined by the 1940 Act, whereby the Company owns between 5% and 25% of the portfolio company’s outstanding voting securities and the investments are not classified as controlled investments. The aggregate fair value of non-controlled, affiliated investments at September 30, 2016 represented 9.2% of the Company’s net assets. Fair value as of December 31, 2015 and September 30, 2016 along with transactions during the nine months ended September 30, 2016 in these affiliated investments were as follows (amounts in thousands): |
| Nine Months Ended September 30, 2016 | Nine Months Ended September 30, 2016 | |||||||||||||||||||||||||||||||||||
| Non-Controlled, Affiliated |
Fair Value at December 31, 2015 |
Gross Additions (Cost)+ |
Gross Reductions (Cost)++ |
Net Unrealized Gain (Loss) |
Fair Value at September 30, 2016 |
Net Realized Gain (Loss) |
Interest Income+++ |
Fee Income |
Dividend Income |
|||||||||||||||||||||||||||
| AltEn, LLC |
||||||||||||||||||||||||||||||||||||
| Membership Units |
$ | – | $ | – | $ | – | $ | – | $ | – | $ | – | $ | – | $ | – | $ | – | ||||||||||||||||||
| Term Loan |
9,353 | – | – | (1,881 | ) | 7,472 | – | – | – | – | ||||||||||||||||||||||||||
| Hilding Anders |
||||||||||||||||||||||||||||||||||||
| Subordinated Debt |
94,473 | 8,545 | – | 5,911 | 108,929 | – | 11,804 | – | – | |||||||||||||||||||||||||||
| Class A Common Stock |
– | – | – | 1 | 1 | – | – | – | – | |||||||||||||||||||||||||||
| Class B Common Stock |
– | – | – | – | – | – | – | – | – | |||||||||||||||||||||||||||
| Equity Options |
213 | – | – | 4,792 | 5,005 | – | – | – | – | |||||||||||||||||||||||||||
| Home Partners of America, Inc. | ||||||||||||||||||||||||||||||||||||
| Common Stock |
76,608 | 26,518 | – | 6,624 | 109,750 | – | – | – | – | |||||||||||||||||||||||||||
| Warrants |
370 | – | – | 159 | 529 | – | – | – | – | |||||||||||||||||||||||||||
| Orchard Marine, Ltd. |
||||||||||||||||||||||||||||||||||||
| Class B Common Stock |
– | – | – | – | – | – | – | – | – | |||||||||||||||||||||||||||
| Series A Preferred Stock |
38,082 | 6,138 | – | (20,855 | ) | 23,365 | – | – | – | 1,580 | ||||||||||||||||||||||||||
|
|
|
|
|
|
|
|
|
|
|
|
|
|
|
|
|
|
|
|||||||||||||||||||
| Totals |
$ | 219,099 | $ | 41,201 | $ | – | $ | (5,249 | ) | $ | 255,051 | $ | – | $ | 11,804 | $ | – | $ | 1,580 | |||||||||||||||||
|
|
|
|
|
|
|
|
|
|
|
|
|
|
|
|
|
|
|
|||||||||||||||||||
+ Gross additions include increases in the cost basis of investments resulting from new portfolio investments, PIK interest, the amortization of unearned income, the exchange of one or more existing securities for one or more new securities and the movement of an existing portfolio company into this category from a different category.
++ Gross reductions include decreases in the cost basis of investments resulting from principal collections related to investment repayments or sales, the exchange of one or more existing securities for one or more new securities and the movement of an existing portfolio company out of this category into a different category.
+++ Includes payment-in-kind interest income.
| (m) | Position or portion thereof unsettled as of September 30, 2016. | |
| (n) | The interest rate on this investment is comprised of a 7.00% cash payment plus an 8.00% redemption premium, to be paid upon redemption of the notes. | |
| (o) | Security or portion thereof is held within Paris Funding, LLC and is pledged as collateral supporting the amounts outstanding under the committed facility agreement with BNP Paribas Prime Brokerage, Inc. and eligible to be hypothecated as allowed under Rule 15c2-1(a)(1) of the Securities Exchange Act of 1934 (“Exchange Act”) subject to the limits of the Rehypothecation Agreement. See Note 10, “Borrowings” for additional information. | |
| (p) | This security was acquired in a transaction that was exempt from the registration requirements of the Securities Act of 1933, as amended (the “Securities Act”), pursuant to Rule 144A thereunder. This security may be resold only in transactions that are exempt from the registration requirements of the Securities Act, normally to qualified institutional buyers. |
See notes to condensed consolidated financial statements.
22
Table of Contents
Corporate Capital Trust, Inc. and Subsidiaries
Condensed Consolidated Schedule of Investments (unaudited) (continued)
As of September 30, 2016
(in thousands, except share amounts)
| (q) | Controlled investment as defined by the 1940 Act, whereby the Company owns more than 25% of the portfolio company’s outstanding voting securities or maintains the ability to nominate greater than 50% of the board representation. The aggregate fair value of controlled investments at September 30, 2016 represented 6.2% of the Company’s net assets. Fair value as of December 31, 2015 and September 30, 2016 along with transactions during the nine months ended September 30, 2016 in these controlled investments were as follows (amounts in thousands): |
| Nine Months Ended September 30, 2016 | Nine Months Ended September 30, 2016 |
|||||||||||||||||||||||||||||||||||
| Controlled Investments |
Fair Value at December 31, 2015 |
Gross Additions (Cost)+ |
Gross Reductions (Cost)++ |
Net Unrealized Gain (Loss) |
Fair Value at September 30, 2016 |
Net Realized Gain (Loss) |
Interest Income |
Fee Income |
Dividend Income |
|||||||||||||||||||||||||||
| Comet Aircraft S.A.R.L |
$ | 52,126 | $ | – | $ | – | $ | (2,523 | ) | $ | 49,603 | $ | – | $ | – | $ | – | $ | 4,001 | |||||||||||||||||
| Guardian Investors, LLC |
11,821 | – | (1,083 | ) | (4,797 | ) | 5,941 | – | – | – | 894 | |||||||||||||||||||||||||
| Innovating Partners, LLC |
16,826 | – | (1,845 | ) | (7,723 | ) | 7,258 | – | – | – | 1,182 | |||||||||||||||||||||||||
| KKR BPT Holdings Aggregator, LLC |
7,125 | 1,000 | – | (289 | ) | 7,836 | – | – | – | – | ||||||||||||||||||||||||||
| Strategic Credit Opportunities Partners, LLC |
– | 92,400 | – | 2,998 | 95,398 | – | – | – | – | |||||||||||||||||||||||||||
| Toorak Capital Partners, LLC |
– | 3,880 | – | – | 3,880 | – | – | – | – | |||||||||||||||||||||||||||
|
|
|
|
|
|
|
|
|
|
|
|
|
|
|
|
|
|
|
|||||||||||||||||||
| Totals |
$ | 87,898 | $ | 97,280 | $ | (2,928 | ) | $ | (12,334 | ) | $ | 169,916 | $ | – | $ | – | $ | – | $ | 6,077 | ||||||||||||||||
|
|
|
|
|
|
|
|
|
|
|
|
|
|
|
|
|
|
|
|||||||||||||||||||
+ Gross additions include increases in the cost basis of investments resulting from new portfolio investments, PIK interest, the amortization of unearned income, the exchange of one or more existing securities for one or more new securities and the movement of an existing portfolio company into this category from a different category.
++ Gross reductions include decreases in the cost basis of investments resulting from principal collections related to investment repayments or sales, the exchange of one or more existing securities for one or more new securities and the movement of an existing portfolio company out of this category into a different category.
| (r) | Expiration date contingent on certain events pursuant to underlying agreements. | |
| (s) | The issuer of this investment has elected to pay the stated dividend rate in the form of 5.00% to be paid in cash and 4.00% to be paid upon liquidation of the investment. | |
| (t) | 7-day effective yield as of September 30, 2016. | |
| (u) | Security is pledged as collateral supporting the amounts outstanding under the repurchase agreement with Credit Suisse Securities (Europe) Limited. See Note 10. “Borrowings” for additional information. | |
| (v) | As of September 30, 2016, the aggregate gross unrealized appreciation for all securities in which there was an excess of value over tax cost was $83,411; the aggregate gross unrealized depreciation for all securities in which there was an excess of tax cost over value was $377,345; the net unrealized depreciation was $253,934; the aggregate cost of securities for Federal income tax purposes was $4,316,632. | |
| * | Non-income producing security. | |
| (1) | The interest rate on these investments is subject to a base rate of 3-Month LIBOR, which at September 30, 2016 was 0.85%. The current base rate for each investment may be different from the reference rate on September 30, 2016. | |
| (2) | The interest rate on these investments is subject to the base rate of 3-month EURIBOR, which at September 30, 2016 was (0.30%). The current base rate for each investment may be different from the reference rate on September 30, 2016. |
See notes to condensed consolidated financial statements.
23
Table of Contents
Corporate Capital Trust, Inc. and Subsidiaries
Condensed Consolidated Schedule of Investments (unaudited) (continued)
As of September 30, 2016
(in thousands, except share amounts)
| (3) | The Interest rate on these investments is subject to the base rate of 3-Month GBP Libor, which at September 30, 2016 was 0.38. The current base rate for each investment may be different from the reference rate on September 30, 2016. | |
| (4) | The interest rate on these investments is subject to a base rate of 1-Month LIBOR, which at September 30, 2016 was 0.53%. The current base rate for each investment may be different from the reference rate on September 30, 2016. | |
| (5) | The interest rate on these investments is subject to the base rate of 2-Month LIBOR, which at September 30, 2016 was 0.65%. The current base rate for each investment may be different from the reference rate on September 30, 2016. | |
| (6) | The interest rate on these investments is subject to a base rate of 12-Month LIBOR, which at September 30, 2016 was 1.55%. The current base rate for each investment may be different from the reference rate on September 30, 2016. | |
| (7) | The interest rate on these investments is subject to a base rate of 6-Month LIBOR, which at September 30, 2016 was 1.24%. The current base rate for each investment may be different from the reference rate on September 30, 2016. | |
| (8) | The interest rate on these investments is subject to the base rate of 1-Month GBP LIBOR, which at September 30, 2016 was 0.27%. The current base rate for each investment may be different from the reference rate on September 30, 2016. | |
|
Abbreviations:
AUD - Australian Dollar; local currency investment amount is denominated in Australian Dollar. A$1 / US $0.767 as of September 30, 2016.
EUR - Euro; local currency investment amount is denominated in Euros. €1 / US $1.121 as of September 30, 2016.
GBP - British Pound Sterling; local currency investment amount is denominated in Pound Sterling. £1 / US $1.301 as of September 30, 2016.
SEK - Swedish Krona; local currency investment amount is denominated in Swedish Kronor. SEK1 / US $0.117 as of September 30, 2016.
AUS - Australia
CAN - Canada
CYM - Cayman Islands
FRA - France
IRL - Ireland
LUX - Luxembourg
JEY - Jersey
NLD - The Netherlands
SGP - Singapore
SWE - Sweden
GBR - United Kingdom
VGB - British Virgin Islands
E = EURIBOR - Euro Interbank Offered Rate
L = LIBOR - London Interbank Offered Rate, typically 3-Month
PIK - Payment-in-kind; the issuance of additional securities by the borrower to settle interest payment obligations. | ||
See notes to condensed consolidated financial statements.
24
Table of Contents
Corporate Capital Trust, Inc. and Subsidiaries
Consolidated Schedule of Investments
As of December 31, 2015
(in thousands, except share amounts)
Company (a)(b) |
Footnotes | Industry |
Interest Rate |
Base Rate Floor |
Maturity Date |
No. Shares/ Principal Amount (c) |
Cost (d) |
Fair Value |
||||||||||||||||||||
| Senior Secured Loans—First Lien—61.5% |
|
|||||||||||||||||||||||||||
| Abaco Systems, Inc. |
(e)(f) | Capital Goods | L + 600 | 1.00 | % | 12/7/2021 | $ | 106,016 | $ | 101,282 | $ | 101,245 | ||||||||||||||||
| ABILITY Network, Inc. |
(e)(g) | Health Care Equipment & Services | L + 500 | 1.00 | % | 5/14/2021 | 19,962 | 19,785 | 19,762 | |||||||||||||||||||
| Agro Merchants NAI Holdings, LLC |
(e)(f) | Transportation | L + 700 | 1.00 | % | 10/1/2020 | 71,696 | 70,998 | 70,132 | |||||||||||||||||||
| Algeco/Scotsman (LUX) |
(h)(i)(j)(f)(k) | Consumer Durables & Apparel |
|
15.75% PIK (15.75% Max PIK) |
|
5/1/2018 | 35,983 | 32,642 | 6,273 | |||||||||||||||||||
| AltEn, LLC |
(f)(j)(k)(l)(m) | Energy |
|
L + 900 PIK (L + 900 Max PIK) |
|
1.00 | % | 9/12/2018 | 33,055 | 29,834 | 9,353 | |||||||||||||||||
| American Freight, Inc. |
(e)(f) | Retailing | L + 625 | 1.00 | % | 10/31/2020 | 32,363 | 32,227 | 31,978 | |||||||||||||||||||
| Amtek Global Technology Pte. Ltd. (SGP) |
(f)(h)(i)(n)(EUR) | Automobiles & Components | E + 900 | 1.00 | % | 11/10/2019 | € | 59,707 | 60,594 | 58,235 | ||||||||||||||||||
| (f)(h)(i)(n)(EUR) | E + 900 | 1.00 | % | 11/10/2019 | 61,150 | 62,059 | 59,642 | |||||||||||||||||||||
| (f)(h)(i)(n)(EUR) | E + 900 | 1.00 | % | 11/10/2019 | 8,515 | 8,641 | 8,305 | |||||||||||||||||||||
| Applied Systems, Inc. |
(e)(g) | Software & Services | L + 325 | 1.00 | % | 1/25/2021 | $ | 648 | 644 | 637 | ||||||||||||||||||
| Belk, Inc. |
(e) | Retailing | L + 475 | 1.00 | % | 11/18/2022 | 4,230 | 4,030 | 3,744 | |||||||||||||||||||
| BeyondTrust Software, Inc. |
(e)(f) | Software & Services | L + 700 | 1.00 | % | 9/25/2019 | 12,882 | 12,768 | 12,477 | |||||||||||||||||||
| BRG Sports, Inc. |
(l) | Consumer Durables & Apparel | L + 550 | 1.00 | % | 4/15/2021 | 3,869 | 3,807 | 3,826 | |||||||||||||||||||
| Caesars Entertainment Operating Co., Inc. |
(e)(g)(i)(k) | Consumer Services | L + 725 | 3/1/2017 | 10,800 | 10,164 | 9,639 | |||||||||||||||||||||
| California Pizza Kitchen, Inc. |
(e)(g) | Food & Staples Retailing | L + 425 | 1.00 | % | 3/29/2018 | 17,012 | 16,471 | 15,800 | |||||||||||||||||||
See notes to condensed consolidated financial statements.
25
Table of Contents
Corporate Capital Trust, Inc. and Subsidiaries
Consolidated Schedule of Investments (continued)
As of December 31, 2015
(in thousands, except share amounts)
Company (a)(b) |
Footnotes | Industry |
Interest Rate |
Base Rate Floor |
Maturity Date |
No. Shares/ Principal Amount (c) |
Cost (d) |
Fair Value |
||||||||||||||||||||
| Casual Dining Bidco Limited |
(f)(h)(i)(w)(GBP) | Consumer Services | L + 825 | 12/11/2020 | £ | 40,546 | $ | 60,143 | $ | 58,279 | ||||||||||||||||||
| Charlotte Russe, Inc. |
(e) | Retailing | L + 550 | 1.25% | 5/22/2019 | $ | 4,478 | 4,457 | 3,119 | |||||||||||||||||||
| (e) | L + 550 | 1.25% | 5/22/2019 | 18,291 | 18,155 | 12,895 | ||||||||||||||||||||||
| CityCenter Holdings, LLC |
(g)(l) | Real Estate | L + 325 | 1.00% | 10/16/2020 | 5,773 | 5,729 | 5,742 | ||||||||||||||||||||
| David’s Bridal, Inc. |
(e)(g) | Retailing | L + 400 | 1.25% | 10/11/2019 | 8,368 | 8,170 | 6,971 | ||||||||||||||||||||
| Distribution International, Inc. |
(g)(l) | Retailing | L + 500 | 1.00% | 12/10/2021 | 6,359 | 6,303 | 5,914 | ||||||||||||||||||||
| EagleView Technology Corp. |
(e) | Software & Services | L + 425 | 1.00% | 7/15/2022 | 6,930 | 6,864 | 6,794 | ||||||||||||||||||||
| Emerald Performance Materials, LLC |
(g)(l) | Materials | L + 350 | 1.00% | 7/30/2021 | 635 | 632 | 624 | ||||||||||||||||||||
| Exemplis Corp. |
(e)(f) | Commercial & Professional Services | L + 650 | 1.00% | 3/23/2022 | 67,777 | 67,163 | 67,974 | ||||||||||||||||||||
| Football Association of Ireland (IRL) |
(f)(h)(i)(EUR) | Consumer Durables & Apparel | 6.40% | 12/20/2020 | € | 41,615 | 55,884 | 46,258 | ||||||||||||||||||||
| Greystone & Co., Inc. |
(e)(f) | Diversified Financials | L + 800 | 1.00% | 3/26/2021 | $ | 33,581 | 33,107 | 32,228 | |||||||||||||||||||
| Grocery Outlet, Inc. |
(e)(g) | Food & Staples Retailing | L + 375 | 1.00% | 10/21/2021 | 2,953 | 2,962 | 2,849 | ||||||||||||||||||||
| Gymboree Corp. |
(e) | Retailing | L + 350 | 1.50% | 2/23/2018 | 11,892 | 10,958 | 6,142 | ||||||||||||||||||||
| Hanson Building Products North America |
(e)(g)(i) | Materials | L + 550 | 1.00% | 3/13/2022 | 22,995 | 22,802 | 22,363 | ||||||||||||||||||||
| Harbor Freight Tools USA, Inc. |
(e)(g) | Capital Goods | L + 375 | 1.00% | 7/26/2019 | 2,823 | 2,828 | 2,824 | ||||||||||||||||||||
| Hillman Group, Inc. |
(e)(g) | Consumer Durables & Apparel | L + 350 | 1.00% | 6/30/2021 | 829 | 831 | 804 | ||||||||||||||||||||
See notes to condensed consolidated financial statements.
26
Table of Contents
Corporate Capital Trust, Inc. and Subsidiaries
Consolidated Schedule of Investments (continued)
As of December 31, 2015
(in thousands, except share amounts)
Company (a)(b) |
Footnotes | Industry |
Interest Rate |
Base Rate Floor |
Maturity Date |
No. Shares/ Principal Amount (c) |
Cost (d) |
Fair Value |
||||||||||||||||||||
| iPayment, Inc. |
(e)(g) | Software & Services | L + 525 | 1.50 | % | 5/8/2017 | $ | 29,163 | $ | 29,016 | $ | 28,037 | ||||||||||||||||
| Jacuzzi Brands, Inc. |
(e)(f) | Capital Goods | L + 650 | 1.25 | % | 7/3/2019 | 18,200 | 17,960 | 18,054 | |||||||||||||||||||
| Jacuzzi Brands, Inc. (LUX) |
(e)(f)(h) | Capital Goods | L + 650 | 1.25 | % | 7/3/2019 | 20,118 | 19,853 | 19,956 | |||||||||||||||||||
| KeyPoint Government Solutions, Inc. |
(e)(f) | Capital Goods | L + 650 | 1.25 | % | 11/13/2017 | 32,217 | 31,949 | 32,242 | |||||||||||||||||||
| Keystone Australia Holdings, Pty. Ltd. (AUS) |
(f)(h)(i)(AUD) | Consumer Services | 15.00% | 8/7/2019 | A$ | 31,021 | 29,176 | 21,471 | ||||||||||||||||||||
| Koosharem, LLC |
(e)(g) | Commercial & Professional Services | L + 650 | 1.00 | % | 5/15/2020 | $ | 42,645 | 42,283 | 40,087 | ||||||||||||||||||
| Kurt Geiger Ltd. (GBR) |
(f)(h)(i)(j)(GBP) | Consumer Durables & Apparel |
|
10.00% 1.00% PIK (1.00% Max PIK) |
|
4/8/2019 | £ | 47,339 | 78,021 | 71,880 | ||||||||||||||||||
| Marshall Retail Group, LLC |
(e)(f) | Retailing | L + 600 | 1.00 | % | 8/25/2020 | $ | 16,636 | 16,483 | 15,088 | ||||||||||||||||||
| MCS AMS Sub-Holdings, LLC (e) |
Commercial & Professional Services | L + 650 | 1.00 | % | 10/15/2019 | 26,981 | 26,353 | 22,124 | ||||||||||||||||||||
| MSX International, Inc. |
(e) | Software & Services | L + 500 | 1.00 | % | 8/18/2020 | 2,368 | 2,270 | 2,362 | |||||||||||||||||||
| Neiman Marcus Group, LLC |
(e)(g) | Retailing | L + 325 | 1.00 | % | 10/25/2020 | 4,926 | 4,863 | 4,374 | |||||||||||||||||||
| New Enterprise Stone & Lime Co., Inc. |
(e)(f) | Capital Goods | L + 700 | 1.00 | % | 2/12/2019 | 56,298 | 56,298 | 55,234 | |||||||||||||||||||
| Nine West Holdings, Inc. |
(e)(g) | Consumer Durables & Apparel | L + 375 | 1.00 | % | 10/8/2019 | 13,417 | 13,214 | 9,486 | |||||||||||||||||||
| NMI Holdings, Inc. |
(f)(i)(o) | Insurance | L + 750 | 1.00 | % | 11/15/2018 | 37,810 | 37,447 | 37,610 | |||||||||||||||||||
| P & L Development, LLC |
(f)(j)(l) | Pharmaceuticals, Biotechnology & Life Sciences |
|
L + 750 1.00% PIK (1.00% Max PIK) |
|
5/1/2020 | 56,305 | 55,805 | 53,634 | |||||||||||||||||||
See notes to condensed consolidated financial statements.
27
Table of Contents
Corporate Capital Trust, Inc. and Subsidiaries
Consolidated Schedule of Investments (continued)
As of December 31, 2015
(in thousands, except share amounts)
Company (a)(b) |
Footnotes | Industry |
Interest Rate |
Base Rate Floor |
Maturity Date |
No. Shares/ Principal Amount (c) |
Cost (d) |
Fair Value |
||||||||||||||||||||
| Pacific Union Financial, LLC |
(f)(l) | Diversified Financials | L + 800 | 1.00 | % | 5/31/2019 | $ | 60,650 | $ | 59,793 | $ | 58,703 | ||||||||||||||||
| Paradigm Acquisition Corp. |
(e) | Health Care Equipment & Services | L + 500 | 1.00 | % | 6/2/2022 | 11,036 | 10,881 | 10,833 | |||||||||||||||||||
| Payless, Inc. |
(e)(f) | Retailing | L + 625 | 1.00 | % | 3/2/2019 | 12,973 | 12,771 | 12,766 | |||||||||||||||||||
| Petroplex Acidizing, Inc. |
(e)(f)(j) | Energy |
|
L + 625 1.75% PIK (1.75% Max PIK) |
|
1.00 | % | 12/4/2019 | 36,623 | 36,173 | 28,473 | |||||||||||||||||
| Plaskolite, LLC |
(e)(g) | Materials | L + 475 | 1.00 | % | 11/3/2022 | 3,250 | 3,218 | 3,234 | |||||||||||||||||||
| Proserv Acquisition, LLC |
(e)(i) | Energy | L + 538 | 1.00 | % | 12/22/2021 | 27,309 | 21,576 | 19,344 | |||||||||||||||||||
| Proserv Acquisition, LLC (GBR) |
(e)(h)(i) | Energy | L + 538 | 1.00 | % | 12/22/2021 | 16,029 | 12,663 | 11,354 | |||||||||||||||||||
| Raley’s |
(e) | Food & Staples Retailing | L + 625 | 1.00 | % | 4/10/2022 | 29,216 | 28,259 | 29,070 | |||||||||||||||||||
| RedPrairie Corp. |
(e)(g) | Software & Services | L + 500 | 1.00 | % | 12/21/2018 | 26,276 | 25,400 | 23,498 | |||||||||||||||||||
| Riverbed Technology, Inc. |
(e)(g) | Technology Hardware & Equipment | L + 500 | 1.00 | % | 4/24/2022 | 7,672 | 7,636 | 7,652 | |||||||||||||||||||
| SARquavitae Servicios a la Dependencia, S.L. (LUX) |
(f)(h)(i)(n)(EUR) | Health Care Equipment & Services | E + 800 | 1.00 | % | 9/30/2022 | € | 3,131 | 3,226 | 3,304 | ||||||||||||||||||
| (f)(h)(i)(n)(EUR) | E + 800 | 1.00 | % | 9/30/2022 | 14,306 | 14,741 | 15,096 | |||||||||||||||||||||
| (f)(h)(i)(n)(EUR) | E + 800 | 1.00 | % | 9/30/2022 | 28,297 | 29,158 | 29,861 | |||||||||||||||||||||
| TIBCO Software, Inc. |
(g)(l) | Software & Services | L + 550 | 1.00 | % | 12/4/2020 | $ | 57,661 | 56,102 | 52,543 | ||||||||||||||||||
| Traverse Midstream Partners, LLC |
(f)(l) | Energy | L + 1000 | 1.00 | % | 11/10/2020 | 17,611 | 17,267 | 16,301 | |||||||||||||||||||
| TTM Technologies, Inc. |
(e)(i) | Technology Hardware & Equipment | L + 500 | 1.00 | % | 5/31/2021 | 11,950 | 11,562 | 10,845 | |||||||||||||||||||
See notes to condensed consolidated financial statements.
28
Table of Contents
Corporate Capital Trust, Inc. and Subsidiaries
Consolidated Schedule of Investments (continued)
As of December 31, 2015
(in thousands, except share amounts)
Company (a)(b) |
Footnotes | Industry |
Interest Rate |
Base Rate Floor |
Maturity Date |
No. Shares/ Principal Amount (c) |
Cost (d) |
Fair Value |
||||||||||||||||||||||||||||||
| Tweddle Group, Inc. |
(e)(f) | Automobiles & Components | L + 675 | 1.00 | % | 4/7/2020 | $ | 42,905 | $ | 42,069 | $ | 42,590 | ||||||||||||||||||||||||||
| Waste Pro USA, Inc. |
(e)(f) | Transportation | L + 750 | 1.00 | % | 10/15/2020 | 36,314 | 36,314 | 35,891 | |||||||||||||||||||||||||||||
| Willbros Group, Inc. |
(e)(f) | Energy | L + 975 | 1.25 | % | 12/15/2019 | 26,467 | 26,467 | 25,686 | |||||||||||||||||||||||||||||
| Z Gallerie, Inc. |
(e)(f) | Retailing | L + 650 | 1.00 | % | 10/8/2020 | 32,273 | 31,962 | 32,157 | |||||||||||||||||||||||||||||
| Total Senior Secured Loans—First Lien |
$ | 1,721,163 | $ | 1,593,668 | ||||||||||||||||||||||||||||||||||
|
|
|
|
|
|||||||||||||||||||||||||||||||||||
| Senior Secured Loans - Second Lien—42.4% |
||||||||||||||||||||||||||||||||||||||
| Abaco Systems, Inc. |
(e)(f) | Capital Goods | L + 1050 | 1.00 | % | 6/7/2022 | $ | 63,371 | $ | 62,107 | $ | 62,104 | ||||||||||||||||||||||||||
| Angelica Corp. |
(e)(f) | Health Care Equipment & Services | L + 875 | 1.25 | % | 8/20/2019 | 50,869 | 50,869 | 44,179 | |||||||||||||||||||||||||||||
| Applied Systems, Inc. |
(e)(g) | Software & Services | L + 650 | 1.00 | % | 1/24/2022 | 36,703 | 36,953 | 34,134 | |||||||||||||||||||||||||||||
| Belk, Inc. |
(f) | Retailing | 10.50% | 6/12/2023 | 99,615 | 97,627 | 95,730 | |||||||||||||||||||||||||||||||
| Brake Bros Ltd. (GBR) |
(h)(i)(j)(w)(GBP) | Food & Staples Retailing |
|
L + 325 3.00% PIK (3.00% Max PIK) |
|
3/12/2017 | £ | 3,480 | 5,014 | 5,130 | ||||||||||||||||||||||||||||
| BRG Sports, Inc. |
(l) | Consumer Durables & Apparel | L + 925 | 1.00 | % | 4/15/2022 | $ | 23,855 | 23,678 | 21,947 | ||||||||||||||||||||||||||||
| CPI International, Inc. |
(e)(f) | Capital Goods | L + 700 | 1.00 | % | 9/16/2017 | 28,000 | 27,504 | 27,175 | |||||||||||||||||||||||||||||
| CTI Foods Holding Co., LLC |
(e) | Food, Beverage & Tobacco | L + 725 | 1.00 | % | 6/28/2021 | 23,219 | 22,954 | 21,129 | |||||||||||||||||||||||||||||
| Deltek, Inc. |
(e)(g) | Software & Services | L + 850 | 1.00 | % | 6/17/2023 | 62,369 | 61,775 | 61,823 | |||||||||||||||||||||||||||||
| EagleView Technology Corp. |
(e) | Software & Services | L + 825 | 1.00 | % | 7/14/2023 | 33,000 | 32,522 | 31,639 | |||||||||||||||||||||||||||||
See notes to condensed consolidated financial statements.
29
Table of Contents
Corporate Capital Trust, Inc. and Subsidiaries
Consolidated Schedule of Investments (continued)
As of December 31, 2015
(in thousands, except share amounts)
Company (a)(b) |
Footnotes | Industry |
Interest Rate |
Base Rate Floor |
Maturity Date |
No. Shares/ Principal Amount (c) |
Cost (d) |
Fair Value |
||||||||||||||||||||||||||||
| Emerald Performance Materials, LLC |
(g)(l) | Materials | L + 675 | 1.00 | % | 8/1/2022 | $ | 2,041 | $ | 2,032 | $ | 1,939 | ||||||||||||||||||||||||
| Excelitas Technologies Corp. |
(e)(f)(j) | Technology Hardware & Equipment |
|
L + 975 3.00% PIK (3.00% Max PIK) |
|
1.00 | % | 4/29/2021 | 110,862 | 110,862 | 102,760 | |||||||||||||||||||||||||
| Genoa, a QoL Healthcare Co., LLC |
(e) | Health Care Equipment & Services | L + 775 | 1.00 | % | 4/28/2023 | 6,403 | 6,342 | 6,019 | |||||||||||||||||||||||||||
| Greenway Medical Technologies |
(e) | Health Care Equipment & Services | L + 825 | 1.00 | % | 11/4/2021 | 23,057 | 22,779 | 22,135 | |||||||||||||||||||||||||||
| Grocery Outlet, Inc. |
(e)(g) | Food & Staples Retailing | L + 825 | 1.00 | % | 10/21/2022 | 49,688 | 48,285 | 49,005 | |||||||||||||||||||||||||||
| Gruppo Argenta S.p.A. (LUX) |
(f)(h)(i)(j)(EUR) | Retailing |
|
12.00% PIK (12.00% Max PIK) |
|
1/31/2019 | € | 25,598 | 29,189 | 24,415 | ||||||||||||||||||||||||||
| (f)(h)(i)(j)(EUR) |
|
12.00% PIK (12.00% Max PIK) |
|
1/31/2019 | 3,485 | 3,747 | 3,324 | |||||||||||||||||||||||||||||
| Gypsum Management & Supply, Inc. |
(e)(g) | Capital Goods | L + 675 | 1.00 | % | 4/1/2022 | $ | 14,802 | 14,411 | 13,886 | ||||||||||||||||||||||||||
| iParadigms Holdings, LLC |
(e) | Software & Services | L + 725 | 1.00 | % | 7/29/2022 | 24,366 | 24,205 | 23,879 | |||||||||||||||||||||||||||
| Learfield Communications, Inc. |
(e) | Media | L + 775 | 1.00 | % | 10/8/2021 | 26,434 | 26,620 | 26,170 | |||||||||||||||||||||||||||
| Lightower Fiber, LLC |
(e)(g) | Telecommunication Services | L + 675 | 1.25 | % | 4/12/2021 | 29,022 | 28,565 | 28,097 | |||||||||||||||||||||||||||
| Maxim Crane, LP |
(g)(l) | Capital Goods | L + 925 | 1.00 | % | 11/26/2018 | 970 | 988 | 960 | |||||||||||||||||||||||||||
| Misys Ltd. (GBR) |
(g)(h)(i) | Software & Services | 12.00% | 6/12/2019 | 3,000 | 3,259 | 3,215 | |||||||||||||||||||||||||||||
| NEP Group, Inc. |
(e)(g) | Media | L + 875 | 1.25 | % | 7/22/2020 | 1,150 | 1,116 | 1,087 | |||||||||||||||||||||||||||
| NewWave Communications |
(e) | Media | L + 800 | 1.00 | % | 10/30/2020 | 13,712 | 13,678 | 13,370 | |||||||||||||||||||||||||||
| P2 Energy Solutions, Inc. |
(e)(i) | Software & Services | L + 800 | 1.00 | % | 4/30/2021 | 74,312 | 72,439 | 62,236 | |||||||||||||||||||||||||||
| (e)(g)(i) | L + 800 | 1.00 | % | 4/30/2021 | 9,283 | 9,210 | 7,774 | |||||||||||||||||||||||||||||
See notes to condensed consolidated financial statements.
30
Table of Contents
Corporate Capital Trust, Inc. and Subsidiaries
Consolidated Schedule of Investments (continued)
As of December 31, 2015
(in thousands, except share amounts)
Company (a)(b) |
Footnotes | Industry |
Interest Rate |
Base Rate Floor |
Maturity Date |
No. Shares/ Principal Amount (c) |
Cost (d) |
Fair Value |
||||||||||||||||||||||||||||
| Petrochoice Holdings, Inc. |
(f)(l) | Capital Goods | L + 875 | 1.00 | % | 8/21/2023 | $ | 50,000 | $ | 49,024 | $ | 47,943 | ||||||||||||||||||||||||
| Plaskolite, LLC |
(e)(f) | Materials | L + 825 | 1.00 | % | 9/14/2023 | 29,350 | 28,410 | 27,990 | |||||||||||||||||||||||||||
| Polyconcept Finance B.V. (NLD) |
(f)(h)(i)(l) | Consumer Durables & Apparel | L + 875 | 1.25 | % | 6/28/2020 | 46,727 | 46,727 | 45,852 | |||||||||||||||||||||||||||
| Progressive Solutions |
(l) | Health Care Equipment & Services | L + 850 | 1.00 | % | 10/22/2021 | 17,145 | 17,007 | 16,974 | |||||||||||||||||||||||||||
| RedPrairie Corp. |
(e) | Software & Services | L + 1000 | 1.25 | % | 12/21/2019 | 39,868 | 37,602 | 32,925 | |||||||||||||||||||||||||||
| Safety Technology Holdings, Inc. |
(e)(f) | Technology Hardware & Equipment | L + 825 | 1.00 | % | 6/2/2020 | 30,402 | 29,834 | 30,244 | |||||||||||||||||||||||||||
| SI Organization, Inc. |
(e) | Capital Goods | L + 800 | 1.00 | % | 5/23/2020 | 56,000 | 55,558 | 55,020 | |||||||||||||||||||||||||||
| Talbots, Inc. |
(e)(g) | Retailing | L + 850 | 1.00 | % | 3/19/2021 | 8,022 | 7,993 | 7,567 | |||||||||||||||||||||||||||
| Valeo Foods Group Ltd. (IRL) |
(f)(h)(i)(x)(GBP) | Food, Beverage & Tobacco | L + 800 | 1.00 | % | 5/8/2023 | £ | 29,125 | 43,633 | 41,005 | ||||||||||||||||||||||||||
| Total Senior Secured Loans—Second Lien |
$ | 1,154,518 | $ | 1,100,781 | ||||||||||||||||||||||||||||||||
|
|
|
|
|
|||||||||||||||||||||||||||||||||
| Senior Secured Bonds—7.1% |
||||||||||||||||||||||||||||||||||||
| Altice International S.A.R.L. (LUX) |
(h)(i)(r)(s) | Media | 6.63% | 2/15/2023 | $ | 1,420 | $ | 1,420 | $ | 1,402 | ||||||||||||||||||||||||||
| Artesyn Technologies, Inc. |
(g)(r)(s) | Technology Hardware & Equipment | 9.75% | 10/15/2020 | 24,387 | 23,937 | 21,643 | |||||||||||||||||||||||||||||
| Guitar Center, Inc. |
(r)(s) | Retailing | 6.50% | 4/15/2019 | 27,739 | 27,336 | 23,578 | |||||||||||||||||||||||||||||
| Hot Topic, Inc. |
(r)(s) | Consumer Durables & Apparel | 9.25% | 6/15/2021 | 887 | 961 | 785 | |||||||||||||||||||||||||||||
See notes to condensed consolidated financial statements.
31
Table of Contents
Corporate Capital Trust, Inc. and Subsidiaries
Consolidated Schedule of Investments (continued)
As of December 31, 2015
(in thousands, except share amounts)
Company (a)(b) |
Footnotes | Industry |
Interest Rate |
Base Rate Floor |
Maturity Date |
No. Shares/ Principal Amount (c) |
Cost (d) |
Fair Value |
||||||||||||||||||||||||||||
| iPayment, Inc. |
(r)(s) | Software & Services | 9.50% | 12/15/2019 | $ | 8,597 | $ | 8,597 | $ | 8,919 | ||||||||||||||||||||||||||
| Louisiana Public Facilities Authority |
(f)(k) | Energy | 11.50% | 1/1/2020 | 34,330 | 33,586 | 32,946 | |||||||||||||||||||||||||||||
| (f)(k)(r) | L + 1000 | 1/1/2020 | 10,650 | 10,650 | 10,159 | |||||||||||||||||||||||||||||||
| NESCO, LLC |
(r)(s) | Capital Goods | 6.88% | 2/15/2021 | 12,190 | 8,153 | 7,314 | |||||||||||||||||||||||||||||
| New Enterprise Stone & Lime Co., Inc. |
(j)(s) | Capital Goods |
|
7.00% 6.00% PIK (12.00% Max PIK) |
|
3/15/2018 | 36,933 | 39,189 | 37,672 | |||||||||||||||||||||||||||
| OAG Holdings, LLC |
(f)(j) | Energy |
|
8.00% 2.00% PIK (2.00% Max PIK) |
|
12/20/2020 | 20,834 | 18,376 | 2,879 | |||||||||||||||||||||||||||
| Rockport Group, LLC |
(f) | Consumer Durables & Apparel | 9.50% | 7/31/2022 | 28,516 | 27,836 | 27,173 | |||||||||||||||||||||||||||||
| SquareTwo Financial Corp. |
(k)(s) | Banks | 11.63% | 4/1/2017 | 16,044 | 15,885 | 8,824 | |||||||||||||||||||||||||||||
| Towergate (GBR) |
(h)(i)(s)(GBP) | Insurance | 8.75% | 4/2/2020 | £ | 936 | 1,424 | 1,215 | ||||||||||||||||||||||||||||
| Total Senior Secured Bonds |
$ | 217,350 | $ | 184,509 | ||||||||||||||||||||||||||||||||
|
|
|
|
|
|||||||||||||||||||||||||||||||||
| Total Senior Debt |
$ | 3,093,031 | $ | 2,878,958 | ||||||||||||||||||||||||||||||||
|
|
|
|
|
|||||||||||||||||||||||||||||||||
| Subordinated Debt—17.6% |
||||||||||||||||||||||||||||||||||||
| Alion Science & Technology Corp. |
(f)(r) | Capital Goods | 11.00% | 8/19/2022 | $ | 68,603 | $ | 67,598 | $ | 64,606 | ||||||||||||||||||||||||||
| Block Communications, Inc. |
(r)(s) | Media | 7.25% | 2/1/2020 | 463 | 473 | 461 | |||||||||||||||||||||||||||||
| Builders FirstSource, Inc. |
(i)(r)(s) | Capital Goods | 10.75% | 8/15/2023 | 15,522 | 15,522 | 15,405 | |||||||||||||||||||||||||||||
| Cemex Materials, LLC |
(r)(s) | Materials | 7.70% | 7/21/2025 | 58,454 | 62,281 | 55,209 | |||||||||||||||||||||||||||||
See notes to condensed consolidated financial statements.
32
Table of Contents
Corporate Capital Trust, Inc. and Subsidiaries
Consolidated Schedule of Investments (continued)
As of December 31, 2015
(in thousands, except share amounts)
Company (a)(b) |
Footnotes | Industry |
Interest Rate |
Base Rate Floor |
Maturity Date |
No. Shares/ Principal Amount (c) |
Cost (d) |
Fair Value |
||||||||||||||||||||||||||||
| Cequel Communications Holdings, LLC |
(r)(s) | Media | 5.13% | 12/15/2021 | $ | 20,751 | $ | 20,536 | $ | 18,676 | ||||||||||||||||||||||||||
| (i)(r)(s) | 7.75% | 7/15/2025 | 20,456 | 20,135 | 18,717 | |||||||||||||||||||||||||||||||
| CHS/Community Health Systems, Inc. |
(i)(s) | Health Care Equipment & Services | 6.88% | 2/1/2022 | 114 | 114 | 108 | |||||||||||||||||||||||||||||
| Datatel, Inc. |
(r)(s) | Software & Services | 9.00% | 9/30/2023 | 3,120 | 3,014 | 3,015 | |||||||||||||||||||||||||||||
| Essar Steel Algoma, Inc. (CAN) |
(h)(i)(j)(k)(s) | Materials |
|
14.00% PIK (14.00% Max PIK) |
|
2/13/2020 | 5,069 | 4,383 | 1 | |||||||||||||||||||||||||||
| Exemplis Corp. |
(e)(f)(j) | Commercial & Professional Services |
|
L + 700 2.00% PIK (2.00% Max PIK) |
|
3/23/2020 | 25,167 | 25,167 | 24,854 | |||||||||||||||||||||||||||
| GCI, Inc. |
(s) | Telecommunication Services | 6.75% | 6/1/2021 | 2,430 | 2,424 | 2,466 | |||||||||||||||||||||||||||||
| (s) | 6.88% | 4/15/2025 | 30,141 | 29,979 | 30,819 | |||||||||||||||||||||||||||||||
| Global Closure Systems (FRA) |
(f)(h)(i)(j)(EUR) | Materials |
|
13.00% PIK (13.00% Max PIK) |
|
11/15/2019 | € | 22,936 | 29,782 | 25,175 | ||||||||||||||||||||||||||
| Gruppo Argenta S.p.A. (LUX) |
(f)(h)(i)(j)(EUR) | Retailing |
|
15.00% PIK (15.00% Max PIK) |
|
11/11/2018 | 773 | 1,035 | 658 | |||||||||||||||||||||||||||
| Hilding Anders (SWE) |
(f)(h)(i)(j)(m)(EUR) | Consumer Durables & Apparel |
|
13.00% PIK (13.00% Max PIK) |
|
6/30/2021 | 105,174 | 125,732 | 92,984 | |||||||||||||||||||||||||||
| (f)(h)(i)(j)(k)(m)(EUR) |
|
12.00% PIK (12.00% Max PIK) |
|
12/31/2023 | 19,813 | 939 | 0 | |||||||||||||||||||||||||||||
| (f)(h)(i)(j)(k)(m)(EUR) |
|
18.00% PIK (18.00% Max PIK) |
|
12/31/2024 | 9,860 | 8,485 | 1,489 | |||||||||||||||||||||||||||||
| Hillman Group, Inc. |
(r)(s) | Consumer Durables & Apparel | 6.38% | 7/15/2022 | $ | 3,953 | 3,812 | 3,281 | ||||||||||||||||||||||||||||
| Hot Topic, Inc. |
(j)(r)(s) | Consumer Durables & Apparel |
|
12.00% (12.75% Max PIK) |
|
5/15/2019 | 9,662 | 9,616 | 8,068 | |||||||||||||||||||||||||||
| IMS Health, Inc. |
(i)(r)(s) | Health Care Equipment & Services | 6.00% | 11/1/2020 | 9,513 | 9,880 | 9,798 | |||||||||||||||||||||||||||||
| JC Penney Corp., Inc. |
(i)(s) | Retailing | 5.65% | 6/1/2020 | 8,440 | 6,069 | 6,752 | |||||||||||||||||||||||||||||
See notes to condensed consolidated financial statements.
33
Table of Contents
Corporate Capital Trust, Inc. and Subsidiaries
Consolidated Schedule of Investments (continued)
As of December 31, 2015
(in thousands, except share amounts)
Company (a)(b) |
Footnotes | Industry |
Interest Rate |
Base Rate Floor |
Maturity Date |
No. Shares/ Principal Amount (c) |
Cost (d) |
Fair Value |
||||||||||||||||||||||||||||
| Kenan Advantage Group, Inc. |
(r)(s) | Transportation | 7.88% | 7/31/2023 | $ | 30,097 | $ | 30,097 | $ | 29,909 | ||||||||||||||||||||||||||
| Lightower Fiber, LLC |
(f) | Telecommunication Services | 10.00% | 2/12/2022 | 11,555 | 11,324 | 11,187 | |||||||||||||||||||||||||||||
| (f)(j) |
|
12.00% PIK (12.00% Max PIK) |
|
8/12/2025 | 8,531 | 8,362 | 8,112 | |||||||||||||||||||||||||||||
| Platform Specialty Products Corp. |
(i)(r) | Materials | 10.38% | 5/1/2021 | 7,813 | 7,813 | 7,793 | |||||||||||||||||||||||||||||
| TIBCO Software, Inc. |
(r)(s) | Software & Services | 11.38% | 12/1/2021 | 21,219 | 20,729 | 17,744 | |||||||||||||||||||||||||||||
| Total Subordinated Debt |
$ | 525,301 | $ | 457,287 | ||||||||||||||||||||||||||||||||
|
|
|
|
|
|||||||||||||||||||||||||||||||||
| Structured Products—4.5% |
||||||||||||||||||||||||||||||||||||
| Comet Aircraft S.A.R.L. (LUX), Common Shares |
(f)(h)(i)(t) | Capital Goods | $ | 49,618 | $ | 49,618 | $ | 52,126 | ||||||||||||||||||||||||||||
| Guardian Investors, LLC, Membership Interest |
(f)(i)(t) | Diversified Financials | N/A | 10,429 | 11,821 | |||||||||||||||||||||||||||||||
| Innovating Partners, LLC, Membership Interest |
(f)(i)(t) | Diversified Financials | N/A | 13,872 | 16,826 | |||||||||||||||||||||||||||||||
| KKR BPT Holdings Aggregator, LLC, Membership Interest |
(f)(i)(t)* | Diversified Financials | N/A | 9,500 | 7,125 | |||||||||||||||||||||||||||||||
| Trade Finance Funding I, Ltd. 2013-1A Class B (CYM) |
(f)(h)(i)(r) | Diversified Financials | 10.75% | 11/13/2018 | 28,221 | 28,221 | 28,310 | |||||||||||||||||||||||||||||
| Total Structured Products |
$ | 111,640 | $ | 116,208 | ||||||||||||||||||||||||||||||||
|
|
|
|
|
|||||||||||||||||||||||||||||||||
| Equity/Other—10.4% |
||||||||||||||||||||||||||||||||||||
| Alion Science & Technology Corp., Membership Interest |
(f)* | Capital Goods | N/A | $ | 7,350 | $ | 7,955 | |||||||||||||||||||||||||||||
| AltEn, LLC, Membership Units |
(f)(m)* | Energy | 2,384 | 2,955 | — | |||||||||||||||||||||||||||||||
| Amtek Global Technology Pte. Ltd. (SGP), Warrants |
(f)(h)(i)*(EUR) | Automobiles & Components | 12/31/2017 | 9,991 | 4,636 | 4,551 | ||||||||||||||||||||||||||||||
| (f)(h)(i)*(EUR) | 12/31/2018 | 9,991 | 4,785 | 4,754 | ||||||||||||||||||||||||||||||||
See notes to condensed consolidated financial statements.
34
Table of Contents
Corporate Capital Trust, Inc. and Subsidiaries
Consolidated Schedule of Investments (continued)
As of December 31, 2015
(in thousands, except share amounts)
Company (a)(b) |
Footnotes | Industry |
Interest Rate |
Base Rate Floor |
Maturity Date |
No. Shares/ Principal Amount (c) |
Cost (d) |
Fair Value |
||||||||||||||||||||||||||||
| Belk, Inc., Common Stock |
(f)* | Retailing | 1,642 | $ | 9,961 | $ | 9,510 | |||||||||||||||||||||||||||||
| Cengage Learning Holdings II, LP, Common Stock |
Media | 227,802 | 7,529 | 5,239 | ||||||||||||||||||||||||||||||||
| Education Management Corp., Common Stock |
(f)* | Consumer Services | 1/5/2022 | 3,779,591 | 1,047 | — | ||||||||||||||||||||||||||||||
| Education Management Corp., Warrants |
(f)* | 2,320,791 | 371 | — | ||||||||||||||||||||||||||||||||
| Excelitas Technologies Corp., Class A Membership Interest |
(f)* | Technology Hardware & Equipment | N/A | 5,636 | 3,199 | |||||||||||||||||||||||||||||||
| GA Capital Specialty Lending Fund, Limited Partnership Interest |
(f)(i) | Diversified Financials | N/A | 33,881 | 33,881 | |||||||||||||||||||||||||||||||
| Genesys Telecommunications Laboratories, Inc., Common Stock |
(f)* | Software & Services | 5,775 | 449 | 712 | |||||||||||||||||||||||||||||||
| Global Closure Systems (FRA), Limited Partnership Interest |
(f)(h)(i)*(EUR) | Materials | N/A | 823 | 1,911 | |||||||||||||||||||||||||||||||
| Gruppo Argenta S.p.A. (LUX), Warrants |
(f)(h)(i)*(EUR) | Retailing | (y | ) | 225,289 | 5,342 | 2,332 | |||||||||||||||||||||||||||||
| Hilding Anders (SWE), Class A Common Stock |
(f)(h)(i)(m)*(SEK) | Consumer Durables & Apparel | 12/31/2020 | 1,394,288 | 132 | — | ||||||||||||||||||||||||||||||
| Hilding Anders (SWE), Class B Common Stock |
(f)(h)(i)(m)*(SEK) | 260,253 | 25 | — | ||||||||||||||||||||||||||||||||
| Hilding Anders (SWE), Equity Options |
(f)(h)(i)(m)*(SEK) | 236,160,807 | 14,988 | 213 | ||||||||||||||||||||||||||||||||
| Home Partners of America, Inc., Common Stock |
(f)(m)* | Real Estate | 73,500 | 73,208 | 76,608 | |||||||||||||||||||||||||||||||
| Home Partners of America, Inc., Warrants |
(f)(m)* | 8/7/2024 | 2,675 | 292 | 370 | |||||||||||||||||||||||||||||||
| iPayment, Inc., Common Stock |
(f)* | Software & Services | 538,144 | 1,988 | 2,296 | |||||||||||||||||||||||||||||||
See notes to condensed consolidated financial statements.
35
Table of Contents
Corporate Capital Trust, Inc. and Subsidiaries
Consolidated Schedule of Investments (continued)
As of December 31, 2015
(in thousands, except share amounts)
Company (a)(b) |
Footnotes | Industry |
Interest Rate |
Base Rate Floor |
Maturity Date |
No. Shares/ |
Cost (d) |
Fair Value |
||||||||||||||||||||||||
| Jones Apparel Group Holdings, Inc., Common Stock |
(f)* | Consumer Durables & Apparel | 5,451 | $ | 872 | $ | 2,289 | |||||||||||||||||||||||||
| Keystone Australia Holdings, Pty. Ltd. (AUS), Warrants |
(f)(h)(i)*(AUD) | Consumer Services | (y | ) | 1,588,469 | 1,019 | — | |||||||||||||||||||||||||
| Kurt Geiger Ltd. (GBR), Common Stock |
(f)(h)(i) | Consumer Durables & Apparel | 5,451 | 65 | 14,272 | |||||||||||||||||||||||||||
| Nine West Holdings, Inc., Common Stock |
(f)* | Consumer Durables & Apparel | 5,451 | 6,541 | 82 | |||||||||||||||||||||||||||
| OAG Holdings, LLC, Overriding Royalty Interest |
(f) | Energy | N/A | 2,354 | — | |||||||||||||||||||||||||||
| Orchard Marine, Ltd. (VGB), Class B Common Stock |
(f)(h)(i)(m)* | Transportation | 1,964 | 3,069 | — | |||||||||||||||||||||||||||
| Orchard Marine, Ltd. (VGB), Series A Preferred Stock |
(f)(h)(i)(m) | 9.00% | 43,945 | 42,987 | 38,082 | |||||||||||||||||||||||||||
| Star Mountain SMB Multi-Manager Credit Platform, LP, Limited Partnership Interest(f)(i) |
Diversified Financials | N/A | 42,756 | 42,926 | ||||||||||||||||||||||||||||
| Stuart Weitzman, Inc., Other |
(f) | Consumer Durables & Apparel | N/A | — | 1,127 | |||||||||||||||||||||||||||
| SUN NewCo, Common Shares A |
(f)(i)*(GBP) | Insurance | 16,450 | — | — | |||||||||||||||||||||||||||
| SUN NewCo, Preference B Shares |
(f)(i)*(GBP) | 6,113,719 | 9,065 | 9,752 | ||||||||||||||||||||||||||||
| Towergate (GBR), Ordinary Shares |
(f)(h)(i)*(GBP) | Insurance | 116,814 | 173 | 186 | |||||||||||||||||||||||||||
| Willbros Group, Inc., Common Stock |
* | Energy | 2,810,814 | 7,760 | 7,561 | |||||||||||||||||||||||||||
| Total Equity/Other |
$ | 292,059 | $ | 269,808 | ||||||||||||||||||||||||||||
|
|
|
|
|
|||||||||||||||||||||||||||||
| Total Investments, excluding Short Term Investments — 143.5% |
$ | 4,022,031 | $ | 3,722,261 | ||||||||||||||||||||||||||||
|
|
|
|
|
|||||||||||||||||||||||||||||
| Short Term Investments—0.3% |
||||||||||||||||||||||||||||||||
| Goldman Sachs Financial Square Funds—Prime Obligations Fund FST Preferred Shares |
(g)(u) | 0.14% | 3,669,013 | $ | 3,669 | $ | 3,669 | |||||||||||||||||||||||||
See notes to condensed consolidated financial statements.
36
Table of Contents
Corporate Capital Trust, Inc. and Subsidiaries
Consolidated Schedule of Investments (continued)
As of December 31, 2015
(in thousands, except share amounts)
Company (a)(b) |
Footnotes | Industry |
Interest Rate |
Base Rate Floor |
Maturity Date |
No. Shares/ Principal Amount (c) |
Cost (d) |
Fair Value |
||||||||||||||||||||||||||||
| State Street Institutional Liquid Reserves Fund, Premier Class |
(u) | 0.23% | 3,401,999 | $ | 3,402 | $ | 3,402 | |||||||||||||||||||||||||||||
| Total Short Term Investments |
$ | 7,071 | $ | 7,071 | ||||||||||||||||||||||||||||||||
|
|
|
|
|
|||||||||||||||||||||||||||||||||
| TOTAL INVESTMENTS — 143.8%(v) |
$ | 4,029,102 | $ | 3,729,332 | ||||||||||||||||||||||||||||||||
|
|
|
|
|
|||||||||||||||||||||||||||||||||
| LIABILITIES IN EXCESS OF OTHER ASSETS—(43.8%) |
(1,135,310 | ) | ||||||||||||||||||||||||||||||||||
| NET ASSETS—100.0% |
$ | 2,594,022 | ||||||||||||||||||||||||||||||||||
|
|
|
|||||||||||||||||||||||||||||||||||
| Collateral on Deposit with Custodian—5.5% |
||||||||||||||||||||||||||||||||||||
| Bank of Nova Scotia— Certificate of Deposit |
0.51% | 3/31/2016 | 142,640 | $ | 142,640 | 142,640 | ||||||||||||||||||||||||||||||
| Total Collateral on Deposit with Custodian |
$ | 142,640 | $ | 142,640 | ||||||||||||||||||||||||||||||||
|
|
|
|
|
|||||||||||||||||||||||||||||||||
| Derivative Instruments (Note 4)—0.1% |
||||||||||||||||||||||||||||||||||||
| Cross Currency Swaps |
(i) | $ | — | $ | 7,943 | |||||||||||||||||||||||||||||||
| Foreign currency forward contracts |
(i) | $ | — | 1,717 | ||||||||||||||||||||||||||||||||
| Interest rate swaps |
(i) | $ | — | 6,021 | ||||||||||||||||||||||||||||||||
| Total return swaps |
(f)(i) | $ | — | $ | (13,562 | ) | ||||||||||||||||||||||||||||||
| Total Derivative Instruments |
$ | — | $ | 2,119 | ||||||||||||||||||||||||||||||||
|
|
|
|
|
|||||||||||||||||||||||||||||||||
| * | Non-income producing security. |
| (a) | Security may be an obligation of one or more entities affiliated with the named company. |
See notes to condensed consolidated financial statements.
37
Table of Contents
Corporate Capital Trust, Inc. and Subsidiaries
Consolidated Schedule of Investments (continued)
As of December 31, 2015
(in thousands, except share amounts)
| (b) | Non-controlled/non-affiliated investments as defined by the Investment Company Act of 1940, as amended (“1940 Act”), unless otherwise indicated. Non-controlled/non-affiliated investments are investments that are neither controlled investments nor affiliated investments. |
| (c) | Denominated in U.S. dollars unless otherwise noted. |
| (d) | Represents amortized cost for debt securities and cost for common stocks translated to U.S. dollars. |
| (e) | The interest rate on these investments is subject to a base rate of 3-Month LIBOR, which at December 31, 2015 was 0.61%. The current base rate for each investment may be different from the reference rate on December 31, 2015. |
| (f) | Investments classified as Level 3 whereby fair value was determined by the Company’s Board of Directors (see Note 2). |
| (g) | Security or portion thereof was held within CCT Funding, LLC and was pledged as collateral supporting the amounts outstanding under the revolving credit facility with Deutsche Bank as of December 31, 2015. |
| (h) | A portfolio company domiciled in a foreign country. The jurisdiction of the security issuer may be a different country than the domicile of the portfolio company. |
| (i) | The investment is not a qualifying asset as defined in Section 55(a) under the 1940 Act. A business development company may not acquire any asset other than qualifying assets, unless, at the time the acquisition is made, qualifying assets represent at least 70% of the company’s total assets. The Company calculates its compliance with the qualifying assets test on a “look through” basis by disregarding the value of the Company’s total return swaps and treating each loan underlying the total return swaps as either a qualifying asset or non-qualifying asset based on whether the obligor is an eligible portfolio company. On this basis, 72.7% of the Company’s total assets represented qualifying assets as of December 31, 2015. |
| (j) | The underlying credit agreement or indenture contains a PIK provision, whereby the issuer has either the option or the obligation to make interest payments with the issuance of additional securities. The interest rate in the schedule represents the current interest rate in effect for these investments. |
| (k) | Investment was on non-accrual status as of December 31, 2015. |
| (l) | The interest rate on these investments is subject to a base rate of 1-Month LIBOR, which at December 31, 2015 was 0.43%. The current base rate for each investment may be different from the reference rate on December 31, 2015. |
| (m) | Affiliated investment as defined by the 1940 Act, whereby the Company owns between 5% and 25% of the portfolio company’s outstanding voting securities and the investments are not classified as controlled investments. The aggregate fair value of non-controlled, affiliated investments at December 31, 2015 represented 8.5% of the Company’s net assets. Fair value as of December 31, 2015 and 2014 along with transactions during the year ended December 31, 2015 in these affiliated investments were as follows (amounts in thousands): |
See notes to condensed consolidated financial statements.
38
Table of Contents
Corporate Capital Trust, Inc. and Subsidiaries
Consolidated Schedule of Investments (continued)
As of December 31, 2015
(in thousands, except share amounts)
| Year Ended December 31, 2015 | Year Ended December 31, 2015 | |||||||||||||||||||||||||||||||||||
| Non-Controlled, Affiliated |
Fair Value at December 31, 2014 |
Gross Additions (Cost)+ |
Gross Reductions (Cost)++ |
Net Unrealized Gain (Loss) |
Fair Value at December 31, 2015 |
Net Realized Gain (Loss) |
Interest Income+++ |
Fee Income |
Dividend Income |
|||||||||||||||||||||||||||
| AltEn, LLC |
||||||||||||||||||||||||||||||||||||
| Common Stock |
$ | 2,787 | $ | - | $ | - | $ | (2,787 | ) | $ | - | $ | - | $ | - | $ | - | $ | - | |||||||||||||||||
| Term Loan |
25,792 | 3,011 | - | (19,450 | ) | 9,353 | - | 2,237 | - | - | ||||||||||||||||||||||||||
| Hilding Anders |
||||||||||||||||||||||||||||||||||||
| Subordinated Debt |
110,973 | 14,867 | - | (31,367 | ) | 94,473 | - | 13,549 | - | - | ||||||||||||||||||||||||||
| Class A Common Stock |
257 | - | - | (257 | ) | - | - | - | - | - | ||||||||||||||||||||||||||
| Class B Common Stock |
48 | - | - | (48 | ) | - | - | - | - | - | ||||||||||||||||||||||||||
| Equity Options |
11,724 | - | - | (11,511 | ) | 213 | - | - | - | - | ||||||||||||||||||||||||||
| Home Partners of America, Inc. |
||||||||||||||||||||||||||||||||||||
| Common Stock |
22,223 | 51,267 | - | 3,118 | 76,608 | - | - | - | - | |||||||||||||||||||||||||||
| Warrants |
78 | 215 | - | 77 | 370 | - | - | - | - | |||||||||||||||||||||||||||
| Warrants Delivery Rights |
32 | - | (32 | ) | - | - | - | - | - | - | ||||||||||||||||||||||||||
| Orchard Marine, Ltd. |
||||||||||||||||||||||||||||||||||||
| Class B Common Stock |
3,001 | - | - | (3,001 | ) | - | - | - | - | - | ||||||||||||||||||||||||||
| Series A Preferred Stock |
23,760 | 19,395 | - | (5,073 | ) | 38,082 | - | - | - | 1,505 | ||||||||||||||||||||||||||
| VSK Holdings, Ltd. |
||||||||||||||||||||||||||||||||||||
| Class B Preferred Shares |
2,597 | - | - | (2,597 | ) | - | - | - | - | - | ||||||||||||||||||||||||||
|
|
|
|
|
|
|
|
|
|
|
|
|
|
|
|
|
|
|
|||||||||||||||||||
| Totals |
$ | 203,272 | $ | 88,755 | $ | (32 | ) | $ | (72,896 | ) | $ | 219,099 | $ | - | $ | 15,786 | $ | - | $ | 1,505 | ||||||||||||||||
|
|
|
|
|
|
|
|
|
|
|
|
|
|
|
|
|
|
|
|||||||||||||||||||
| + | Gross additions include increases in the cost basis of investments resulting from new portfolio investments, PIK interest, the amortization of unearned income, the exchange of one or more existing securities for one or more new securities and the movement of an existing portfolio company into this category from a different category. |
| ++ | Gross reductions include decreases in the cost basis of investments resulting from principal collections related to investment repayments or sales, the exchange of one or more existing securities for one or more new securities and the movement of an existing portfolio company out of this category into a different category. |
| +++ | Includes payment-in-kind interest income. |
| (n) | The interest rate on these investments is subject to the base rate of 3-Month EURIBOR, which at December 31, 2015 was -0.13%. The current base rate for each investment may be different from the reference rate on December 31, 2015. |
| (o) | The interest rate on these investments is subject to a base rate of 6-Month LIBOR, which at December 31, 2015 was 0.85%. The current base rate for each investment may be different from the reference rate on December 31, 2015. |
| (p) | Position or portion thereof unsettled as of December 31, 2015. |
| (q) | The interest rate on these investments is subject to the base rate of 1-Month EURIBOR, which at December 31, 2015 was -0.21%. The current base rate for each investment may be different from the reference rate on December 31, 2015. |
| (r) | This security was acquired in a transaction that was exempt from the registration requirements of the Securities Act of 1933, as amended (the “Securities Act”), pursuant to Rule 144A thereunder. This security may be resold only in transactions that are exempt from the registration requirements of the Securities Act, normally to qualified institutional buyers. |
| (s) | Security or portion thereof is held within Paris Funding, LLC and is pledged as collateral supporting the amounts outstanding under the committed facility agreement with BNP Paribas Prime Brokerage, Inc. and eligible to be hypothecated as allowed under Rule 15c2-1(a)(1) of the Securities Exchange Act of 1934 (“Exchange Act”) subject to the limits of the Rehypothecation Agreement. See Note 10, “Borrowings “ for additional information. |
See notes to condensed consolidated financial statements.
39
Table of Contents
Corporate Capital Trust, Inc. and Subsidiaries
Consolidated Schedule of Investments (continued)
As of December 31, 2015
(in thousands, except share amounts)
| (t) | Controlled investment as defined by the 1940 Act, whereby the Company owns more than 25% of the portfolio company’s outstanding voting securities or maintains the ability to nominate greater than 50% of the board representation. The aggregate fair value of controlled investments at December 31, 2015 represented 3.4% of the Company’s net assets. Fair value as of December 31, 2014 and December 31, 2015 along with transactions during the year ended December 31, 2015 in these controlled investments were as follows (amounts in thousands): |
| Year Ended December 31, 2015 | Year Ended December 31, 2015 | |||||||||||||||||||||||||||||||||||
| Controlled Investments |
Fair Value at December 31, 2014 |
Gross Additions (Cost)+ |
Gross Reductions (Cost)++ |
Net Unrealized Gain (Loss) |
Fair Value at December 31, 2015 |
Net Realized Gain (Loss) |
Interest Income |
Fee Income |
Dividend Income |
|||||||||||||||||||||||||||
| Comet Aircraft S.A.R.L |
||||||||||||||||||||||||||||||||||||
| Structured Products |
$ | — | $ | 49,618 | $ | — | $ | 2,508 | $ | 52,126 | $ | — | $ | — | $ | — | $ | 4,921 | ||||||||||||||||||
| Guardian Investors, LLC, Membership Interest |
— | 10,429 | — | 1,392 | 11,821 | — | — | — | 1,759 | |||||||||||||||||||||||||||
| Innovating Partners, LLC, Membership Interest |
— | 13,872 | — | 2,954 | 16,826 | — | — | — | 3,266 | |||||||||||||||||||||||||||
| KKR BPT Holdings Aggregator, |
||||||||||||||||||||||||||||||||||||
| LLC, Structured Product |
5,500 | 4,000 | — | (2,375 | ) | 7,125 | — | — | — | — | ||||||||||||||||||||||||||
|
|
|
|
|
|
|
|
|
|
|
|
|
|
|
|
|
|
|
|||||||||||||||||||
| Totals |
$ | 5,500 | $ | 77,919 | $ | — | $ | 4,479 | $ | 87,898 | $ | — | $ | — | $ | — | $ | 9,946 | ||||||||||||||||||
|
|
|
|
|
|
|
|
|
|
|
|
|
|
|
|
|
|
|
|||||||||||||||||||
| + | Gross additions include increases in the cost basis of investments resulting from new portfolio investments, PIK interest, the amortization of unearned income, the exchange of one or more existing securities for one or more new securities and the movement of an existing portfolio company into this category from a different category. |
| ++ | Gross reductions include decreases in the cost basis of investments resulting from principal collections related to investment repayments or sales, the exchange of one or more existing securities for one or more new securities and the movement of an existing portfolio company out of this category into a different category. |
| (u) | 7-day effective yield as of December 31, 2015. |
| (v) | As of December 31, 2015, the aggregate gross unrealized appreciation for all securities in which there was an excess of value over tax cost was $52,143; the aggregate gross unrealized depreciation for all securities in which there was an excess of tax cost over value was $350,640; the net unrealized depreciation was $298,497; the aggregate cost of securities for Federal income tax purposes was $4,027,829. |
| (w) | The interest rate on these investments is subject to the base rate of 3-Month GBP LIBOR, which at December 31, 2015 was 0.59%. The current base rate for each investment may be different from the reference rate on December 31, 2015. |
| (x) | The interest rate on these investments is subject to the base rate of 1-Month GBP LIBOR, which at December 31, 2015 was 0.51%. The current base rate for each investment may be different from the reference rate on December 31, 2015. |
| (y) | Expiration date contingent on certain events pursuant to underlying agreements. |
See notes to condensed consolidated financial statements.
40
Table of Contents
Corporate Capital Trust, Inc. and Subsidiaries
Consolidated Schedule of Investments (continued)
As of December 31, 2015
(in thousands, except share amounts)
Abbreviations:
AUD - Australian Dollar; local currency investment amount is denominated in Australian Dollar. A$1 / US $0.730 as of December 31, 2015.
EUR - Euro; local currency investment amount is denominated in Euros. €1 / US $1.091 as of December 31, 2015.
GBP - British Pound Sterling; local currency investment amount is denominated in Pound Sterling. £1 / US $1.480 as of December 31, 2015.
SEK - Swedish Krona; local currency investment amount is denominated in Swedish Kronor. SEK1 / US $0.119 as of December 31, 2015.
AUS - Australia
CAN - Canada
CYM - Cayman Islands
FRA - France
GBR - United Kingdom
IRL - Ireland
LUX - Luxembourg
NLD - The Netherlands
SGP - Singapore
SWE - Sweden
VGB - British Virgin Islands
E = EURIBOR - Euro Interbank Offered Rate
L = LIBOR - London Interbank Offered Rate, typically 3-Month
PIK - Payment-in-kind; the issuance of additional securities by the borrower to settle interest payment obligations.
See notes to condensed consolidated financial statements.
41
Table of Contents
CORPORATE CAPITAL TRUST, INC. AND SUBSIDIARIES
Notes to Condensed Consolidated Financial Statements (unaudited)
| 1. | Principal Business and Organization |
Corporate Capital Trust, Inc. (the “Company”) was incorporated under the general corporation laws of the State of Maryland on June 9, 2010. The Company is a non-diversified closed-end management investment company and regulated as a business development company (“BDC”) under the Investment Company Act of 1940, as amended (the “1940 Act”). The Company’s investment objective is to provide its shareholders with current income and, to a lesser extent, long-term capital appreciation, by investing primarily in the debt of privately owned U.S. companies with a focus on originated transactions sourced through the networks of its advisors. The Company commenced business operations on June 17, 2011 and investment operations on July 1, 2011. The Company has elected to be treated as a regulated investment company (“RIC”) under the Internal Revenue Code of 1986, as amended (the “Code”) and operates in a manner so as to qualify for the tax treatment applicable to RICs.
The Company is externally managed by CNL Fund Advisors Company (“CNL”) and KKR Credit Advisors (US) LLC (“KKR”) (collectively, the “Advisors”), which are responsible for sourcing potential investments, analyzing and conducting due diligence on prospective investment opportunities, structuring investments and ongoing monitoring of the Company’s investment portfolio. Both Advisors are registered as investment advisers with the Securities and Exchange Commission (“SEC”). CNL also provides the administrative services necessary for the Company to operate.
The Company sold approximately 141 million shares of common stock through its initial continuous public offering (the “Initial Offering”). As of September 30, 2016, the Company was offering and selling shares of its common stock pursuant to a registration statement on Form N-2 (the “Follow-On Registration Statement”) covering its follow-on continuous public offering of up to 209 million shares of common stock (the “Follow-On Offering”). The Initial Offering and Follow-On Offering are collectively referred to as the “Offerings.” In February 2016, the Company closed the Follow-On Offering to investors who purchased shares through the independent broker-dealer channel. The Follow-On Offering remained open to investors who purchased through the registered investment advisor channel. In October 2016, the Company closed the Follow-On Offering to new investors.
In January 2015, the Company filed a shelf registration statement with the SEC on Form N-2 (the “Shelf Registration Statement”) to provide for the Company the ability to offer, from time to time, in one or more offerings or series up to $750 million of its securities, on terms to be determined at the time of each such offering. The Shelf Registration Statement was declared effective by the SEC in January 2015. As of September 30, 2016, the Company has not yet offered any securities pursuant to the Shelf Registration Statement.
As of September 30, 2016, the Company had various wholly owned subsidiaries including, among others, (i) CCT Funding LLC (“CCT Funding”), Paris Funding LLC (“Paris Funding”) and CCT Tokyo Funding LLC (“CCT Tokyo Funding”), special purpose financing subsidiaries organized for the purpose of arranging secured debt financing with banks and borrowing money to invest in portfolio companies, (ii) Halifax Funding LLC (“Halifax Funding”), a special purpose financing subsidiary organized to enter into total return swaps (“TRS”) and (iii) FCF LLC and CCT Holdings LLC, taxable subsidiaries (the “Taxable Subsidiaries”), which are taxed as corporations for federal income tax purposes and were organized to hold certain equity securities of portfolio companies organized as pass-through entities for U.S. tax purposes.
| 2. | Significant Accounting Policies |
Basis of Presentation – The accompanying condensed consolidated financial statements of the Company are prepared in accordance with the instructions to Form 10-Q. The Company is an investment company following accounting and reporting guidance in Financial Accounting Standards Board (“FASB”) Accounting Standards Codification (“ASC”) Topic 946, Financial Services—Investment Companies (“ASC Topic 946”). The unaudited condensed consolidated financial statements reflect all normal recurring adjustments, which are, in the opinion of management, necessary for the fair presentation of the Company’s results for the interim periods presented. The results of operations for interim periods are not indicative of results to be expected for the full year.
Certain financial information that is normally included in annual financial statements, including certain financial statement footnotes, prepared in accordance with accounting principles generally accepted in the United States of America (“GAAP”), is not required for interim reporting purposes and has been condensed or omitted herein. These financial statements should be read in conjunction with the Company’s financial statements and notes related thereto included in the Company’s Annual Report on Form 10-K for the year ended December 31, 2015, which was filed with the SEC on March 21, 2016. The condensed consolidated financial statements include the accounts of the Company and its wholly owned subsidiaries.
42
Table of Contents
| 2. | Significant Accounting Policies (continued) |
Principles of Consolidation – Under ASC Topic 946, the Company is precluded from consolidating any entity other than another investment company or an operating company which provides substantially all of its services to benefit the Company. In accordance therewith, the Company has consolidated the results of its wholly owned subsidiaries in its condensed consolidated financial statements. All intercompany account balances and transactions have been eliminated in consolidation.
In accordance with the guidance for the consolidation of variable interest entities (“VIE”s), the Company analyzes its variable interests, including its equity investments, to determine if the entity in which it has a variable interest is a variable interest entity. The Company’s analysis includes both quantitative and qualitative reviews. The Company bases its quantitative analysis on the forecasted cash flows of the entity, and its qualitative analysis on its review of the design of the entity, its organizational structure including decision-making ability and financial agreements. The Company also uses its quantitative and qualitative analyses to determine if it is the primary beneficiary of the VIE, and if such determination is made, it will include the accounts of the VIE in its consolidated financial statements.
The Company does not consolidate its equity interest in Strategic Credit Opportunities Partners, LLC (“SCJV”). For further description of the Company’s investment in SCJV, see Note 3. “Investments”.
Use of Estimates – The preparation of the condensed consolidated financial statements in conformity with GAAP requires management to make estimates and assumptions that affect (i) the reported amounts of assets and liabilities at the date of the condensed consolidated financial statements, (ii) the reported amounts of income and expenses during the reporting periods presented and (iii) disclosure of contingent assets and liabilities at the date of the condensed consolidated financial statements. Actual results could differ from those estimates.
Cash – Cash consists of demand deposits and foreign currency.
Valuation of Investments – The Company measures the value of its investments in accordance with ASC Topic 820, Fair Value Measurements and Disclosure (“ASC Topic 820”), issued by FASB. Fair value is the price that would be received to sell an asset or paid to transfer a liability in an orderly transaction between market participants at the measurement date. Market participants are defined as buyers and sellers in the principal or most advantageous market (which may be a hypothetical market) that are independent, knowledgeable, and willing and able to transact. In accordance with ASC Topic 820, the Company considers its principal market to be the market that has the greatest volume and level of activity.
ASC Topic 820 defines hierarchical levels directly related to the amount of subjectivity associated with the inputs used to determine fair values of assets and liabilities. The hierarchical levels and types of inputs used to measure fair value for each level are described as follows:
Level 1 – Quoted prices are available in active markets for identical investments as of the reporting date. Publicly listed equities and debt securities, publicly listed derivatives, money market/short-term investment funds and foreign currency are generally included in Level 1. The Company does not adjust the quoted price for these investments.
Level 2 – Valuation inputs are other than quoted prices in active markets, which are either directly or indirectly observable as of the reporting date, and fair value is determined through the use of models or other valuation methodologies. In certain cases, debt and equity securities are valued on the basis of prices from orderly transactions for similar investments in active markets between market participants and provided by reputable dealers or independent pricing services. In determining the value of a particular investment, independent pricing services may use certain information with respect to transactions in such investments, quotations from dealers, pricing matrices, market transactions in comparable investments, and various relationships between investments. Investments generally included in this category are corporate bonds and loans, convertible debt indexed to publicly listed securities, foreign currency forward contracts, cross currency and interest rate swaps and certain over-the-counter derivatives.
Level 3 – Valuation inputs are unobservable for the investment and include situations where there is little, if any, market activity for the investment. The inputs into the determination of fair value require significant judgment or estimation. Investments generally included in this category are TRS agreements, illiquid corporate bonds and loans, unlisted common and preferred stock investments, and equity options that lack observable market pricing.
43
Table of Contents
| 2. | Significant Accounting Policies (continued) |
In certain cases, the inputs used to measure fair value may fall within different levels of the fair value hierarchy. In such cases, an investment’s level within the fair value hierarchy is based on the lowest level of input that is significant to the fair value measurement. Depending on the relative liquidity in the markets for certain investments, the Company may transfer assets to Level 3 if it determines that observable quoted prices, obtained directly or indirectly, are not available or reliable. The Company’s assessment of the significance of a particular input to the fair value measurement requires judgment, and the consideration of factors specific to the investment.
Investments for which market quotations are readily available are valued using market quotations, which are generally obtained from independent pricing services, broker-dealers or market makers. With respect to the Company’s portfolio investments for which market quotations are not readily available, the Company’s board of directors is responsible for determining in good faith the fair value of the Company’s portfolio investments in accordance with the valuation policy and procedures approved by the board of directors, based on, among other things, the input of the Company’s Advisors and management, its audit committee, and independent third-party valuation firms.
The Company and the board of directors conduct its fair value determination process on a quarterly basis and any other time when a decision regarding the fair value of the portfolio investments is required. A determination of fair value involves subjective judgments and estimates. Due to the inherent uncertainty of determining the fair value of portfolio investments that do not have a readily available market value, the fair value of the investments may differ significantly from the values that would have been determined had a readily available market value existed for such investments, and the differences could be material. Further, such investments are generally less liquid than publicly traded securities. If the Company was required to liquidate a portfolio investment that does not have a readily available market value in a forced or liquidation sale, the Company could realize significantly less than the value recorded by the Company.
The Company and its Advisors undertake a multi-step valuation process each quarter for determining the fair value of the Company’s investments, the market prices of which are not readily available, as described below:
| • | Each portfolio company or investment is initially valued by KKR (internal valuation) and/or the Company’s independent third party valuation firm (external valuation), which provides a valuation range. |
| • | Valuation recommendations are formulated and documented by KKR and reviewed by KKR’s valuation committee. The KKR valuation committee then provides its valuation recommendation for each portfolio investment, along with supporting documentation, to CNL and the Company. |
| • | After the Company’s management has substantially completed its review, it forwards the valuation recommendations and supporting documentation for audit committee review. |
| • | The Company’s board of directors then discusses the investment valuation recommendations with the Advisors and management and, based on those discussions and the related review process conducted by the Company’s audit committee, determines the fair value of the investments in good faith. |
The valuation techniques used by the Company for the assets and liabilities that are classified as Level 3 in the fair value hierarchy are described below.
Senior Debt and Subordinated Debt: Senior debt and subordinated debt investments are initially valued at transaction price and are subsequently valued using (i) market data for similar instruments (e.g., recent transactions or indicative broker quotes), (ii) comparisons to benchmark derivative indices or (iii) valuation models. Valuation models are generally based on yield analysis and discounted cash flow techniques, where the key inputs are based on relative value analyses and the assignment of risk-adjusted discounted rates, based on the analysis of similar instruments from similar issuers. In addition, an illiquidity discount is applied where appropriate.
44
Table of Contents
| 2. | Significant Accounting Policies (continued) |
Equity/Other Investments: Equity/other investments are initially valued at transaction price and are subsequently valued using valuation models in the absence of readily observable market prices. Valuation models are generally based on (i) market and income (discounted cash flow) approaches, in which various internal and external factors are considered, and (ii) earnings before interest, taxes, depreciation and amortization (“EBITDA”) valuation multiples analysis. Factors include key financial inputs and recent public and private transactions for comparable investments. Key inputs used for the discounted cash flow approach include the weighted average cost of capital and assumed inputs used to calculate terminal values, such as EBITDA exit multiples. The fair value for a particular investment will generally be within the value range conclusions derived by the two approaches. Upon completion of the valuations conducted, an illiquidity discount is applied where appropriate.
The Company relies primarily on information provided by managers of private investment funds in valuing the Company’s investments in such funds. The Advisors monitor the valuation methodology used by the asset manager and/or issuer of the private investment fund. Following procedures adopted by the Company’s board of directors, in the absence of specific transaction activity in a particular private investment fund, the Company’s board of directors considers whether it is appropriate, in light of all relevant circumstances, to value the Company’s investment at the net asset value reported by the private investment fund at the time of valuation or to adjust the value to reflect a premium or discount.
Total Return Swaps: The Company values its TRS in accordance with the TRS agreements between its wholly owned subsidiary and the TRS counterparty, which collectively established the TRS. Pursuant to the TRS agreements, the value of the TRS is based on (i) the increase or decrease in the value of the TRS assets relative to the notional amounts, (ii) collected and accrued interest income and fee income related to the TRS assets, (iii) TRS financing costs on the TRS settled notional amounts, and (iv) certain other expenses incurred under the TRS. The TRS assets are valued pursuant to the valuation algorithm specified in the TRS agreements, including reliance on indicative bid prices provided by independent third-party pricing services. Bid prices reflect the highest price that market participants may be willing to pay. On a quarterly basis, the Company’s Advisors review, test and compare (i) the indicative bid prices assigned to each TRS asset by the TRS counterparty with (ii) pricing inputs that are independently sourced by the Company’s management and/or its Advisors from third-party pricing services. Additionally, the Company’s Advisors review the calculations of (i) collected and accrued interest, (ii) TRS financing costs, and (iii) realized gains and losses as included components of the TRS fair value. For additional disclosures on the Company’s TRS, including quantitative disclosures of the current period fair value components, see Note 4. “Derivative Instruments.”
The Company utilizes several valuation techniques that use unobservable pricing inputs and assumptions in determining the fair value of its Level 3 investments. The valuation techniques, as well as the key unobservable inputs that have a significant impact on the Company’s Level 3 valuations, are described in Note 5. “Fair Value of Financial Instruments.” The unobservable pricing inputs and assumptions may differ by asset and in the application of the Company’s valuation methodologies. The reported fair value estimates could vary materially if the Company had chosen to incorporate different unobservable pricing inputs and other assumptions.
Security Transactions, Realized/Unrealized Gains or Losses, and Income Recognition – Investments purchased on a secondary basis are recorded on the trade date. Loan originations are recorded on the funding date. The Company measures realized gains or losses from the sale of investments using the specific identification method. Realized gains or losses are measured by the difference between the net proceeds from the sale and the amortized cost basis of the investment without regard to unrealized gains or losses previously recognized, and include investments charged off during the period, net of recoveries. Unrealized gains or losses primarily reflect the change in investment values, including the reversal of previously recorded unrealized gains or losses when gains or losses are realized. The amortized cost basis of investments includes (i) the original cost and (ii) adjustments for the accretion/amortization of market discounts and premiums, original issue discount and loan origination fees. The Company reports changes in fair value of investments as a component of net change in unrealized appreciation (depreciation) on investments in the condensed consolidated statements of operations.
Interest Income – Interest income is recorded on an accrual basis and includes amortization of premiums to par value and accretion of discounts to par value. Discounts and premiums to par value on securities purchased are accreted/amortized into interest income over the life of the respective security using the effective interest method. Generally, loan origination, closing, commitment and other fees received by the Company directly or indirectly from borrowers in connection with the closing of investments are accreted over the contractual life of the debt investment as interest income based on the effective interest method. Upon prepayment of a debt investment, any prepayment penalties and unamortized loan fees and discounts are recorded as interest income.
45
Table of Contents
| 2. | Significant Accounting Policies (continued) |
Certain of the Company’s investments in debt securities contain a contractual payment-in-kind (“PIK”) interest provision. The PIK provisions generally feature the obligation or the option at each interest payment date of making interest payments in (i) cash, (ii) additional debt securities or (iii) a combination of cash and additional debt securities. PIK interest, computed at the contractual rate specified in the investment’s credit agreement, is accrued as interest income and recorded as interest receivable up to the interest payment date. On the interest payment dates, the Company will capitalize the accrued interest receivable attributable to PIK as additional principal due from the borrower. When additional PIK securities are received on the interest payment date, they typically have the same terms, including maturity dates and interest rates as the original securities issued. PIK interest generally becomes due at maturity of the investment or upon the investment being called by the issuer.
If the portfolio company valuation indicates the value of the PIK investment is not sufficient to cover the contractual PIK interest, the Company will not accrue additional PIK interest income and will record an allowance for any accrued PIK interest receivable as a reduction of interest income in the period the Company determines it is not collectible.
Debt securities are placed on nonaccrual status when principal or interest payments are at least 90 days past due or when there is reasonable doubt that principal or interest will be collected. Generally, accrued interest is reversed against interest income when a debt security is placed on nonaccrual status. Interest payments received on debt securities on nonaccrual status may be recognized as interest income or applied to principal based on management’s judgment. Debt securities on nonaccrual status are restored to accrual status when past due principal and interest are paid and, in management’s judgment, such investments are likely to remain current on interest payment obligations. The Company may make exceptions to this treatment if the debt security has sufficient collateral value and is in the process of collection.
Fee Income – In its role as the Company’s investment sub-advisor, KKR or its affiliates may provide financial advisory services to portfolio companies and in return may receive fees for capital structuring services. KKR is obligated to remit to the Company any earned capital structuring fees based on the pro-rata portion of the Company’s investment in co-investment transactions and originated investments. These fees are generally nonrecurring and are recognized as fee income by the Company upon the investment closing date.
The Company may also receive fees for commitments, amendments and other services rendered to portfolio companies. Such fees are recognized as fee income when earned or the services are rendered.
Dividend Income – Dividend income on preferred equity securities is recorded as dividend income on an accrual basis to the extent such amounts are payable by the portfolio company and are expected to be collected. Dividend income on common equity securities is recorded on the record date for private portfolio companies or on the ex-dividend date for publicly traded portfolio companies. Each distribution received from limited liability company (“LLC”) and limited partnership (“LP”) investments are evaluated to determine if the distribution should be recorded as dividend income or a return of capital. Generally, the Company will not record distributions from equity investments in LLCs and LPs as dividend income unless there are sufficient accumulated earnings in the LLC or LP prior to the distribution. Distributions that are classified as a return of capital are recorded as a reduction in the cost basis of the investment.
Derivative Instruments – The Company’s derivative instruments include foreign currency forward contracts, cross currency swaps, interest rate swaps and the TRS. The Company recognizes all derivative instruments as assets or liabilities at fair value in its condensed consolidated financial statements. Derivative contracts entered into by the Company are not designated as hedging instruments, and as a result, the Company presents changes in fair value through net change in unrealized appreciation (depreciation) on derivative instruments in the condensed consolidated statements of operations. TRS unrealized appreciation (depreciation) is composed of accrued interest income, net of accrued TRS financing charges owed, and the overall change in fair value of the TRS assets. Realized gains and losses that occur upon the cash settlement of the derivative instruments are included in net realized gains (losses) on derivative instruments in the condensed consolidated statements of operations. TRS realized gains and losses are composed of realized gains or losses on the TRS assets and the net interest and fees received or paid on the quarterly TRS settlement date.
Deferred Financing Costs – Financing costs, including upfront fees, commitment fees and legal fees related to the Company’s credit facilities, term loan and the TRS are deferred and amortized over the life of the related financing instrument using either the effective interest method or straight-line method. The amortization of deferred financing costs is included in interest expense in the condensed consolidated statements of operations.
Paid In Capital – The Company records the proceeds from the sale of its common stock on a net basis to (i) capital stock and (ii) paid-in capital in excess of par value, excluding selling commissions and marketing support fees.
46
Table of Contents
| 2. | Significant Accounting Policies (continued) |
Foreign Currency Translation, Transactions and Gains/Losses – Foreign currency amounts are translated into U.S. dollars on the following basis: (i) at the exchange rate on the last business day of the reporting period for the fair value of investment securities, other assets and liabilities; and (ii) at the prevailing exchange rate on the respective recording dates for the purchase and sale of investment securities, income, expenses, gains and losses.
Net assets and fair values are presented based on the applicable foreign exchange rates described above and the Company does not isolate that portion of the results of operations resulting from changes in foreign exchange rates on investments from the fluctuations arising from changes in fair values of investments held; therefore, fluctuations related to foreign exchange rate conversions are included with the net realized gains (losses) and unrealized appreciation (depreciation) on investments.
Net realized gains or losses on foreign currency transactions arise from sales of foreign currency, currency gains or losses realized between the trade and settlement dates on securities transactions, and the difference between the amounts of dividends, interest, and foreign withholding taxes recorded by the Company and the U.S. dollar equivalent of the amounts actually received or paid by the Company.
Unrealized appreciation (depreciation) from foreign currency translation for foreign currency forward contracts and cross currency swaps is included in net change in unrealized appreciation (depreciation) in derivative instruments in the condensed consolidated statements of operations and is included with unrealized appreciation (depreciation) on derivative instruments in the condensed consolidated statements of assets and liabilities. Unrealized appreciation (depreciation) from foreign currency translation for other receivables or payables is presented as net change in unrealized appreciation (depreciation) in foreign currency translation in the condensed consolidated statements of operations.
Management Fees – The Company incurs a base management fee (recorded as investment advisory fees) and performance-based incentive fees, including (i) a subordinated incentive fee on income and (ii) an incentive fee on capital gains, due to its Advisors pursuant to an investment advisory agreement described in Note 6. “Related Party Transactions.” The two components of performance-based incentive fees are combined and expensed in the condensed consolidated statements of operations and accrued in the condensed consolidated statements of assets and liabilities as accrued performance-based incentive fees. Pursuant to the terms of the investment advisory agreement, the incentive fee on capital gains is determined and payable in arrears as of the end of each calendar year (or upon termination of the investment advisory agreement) based on the Company’s realized capitalized gains on a cumulative basis from inception, net of all realized capital losses on a cumulative basis and unrealized depreciation at year end, less the aggregate amount of any previously paid capital gains incentive fees. Although the terms of the investment advisory agreement do not provide for the inclusion of unrealized gains in the calculation of the incentive fee on capital gains, pursuant to an interpretation of an American Institute of Certified Public Accountants Technical Practice Aid for investment companies, for GAAP purposes, the Company includes unrealized gains in the calculation of the incentive fee on capital gains expense and related accrued incentive fee on capital gains. This accrual reflects the incentive fees that would be payable to the Advisors if the Company’s entire portfolio was liquidated at its fair value as of the balance sheet date even though the Advisors are not entitled to an incentive fee with respect to unrealized gains unless and until such gains are actually realized.
Offering Expenses – Offering expenses incurred in connection with the Company’s Offerings, including reimbursement payments to the Advisors, but excluding selling commissions and marketing support fees, are accumulated monthly and capitalized as deferred offering expenses and then subsequently expensed over a 12-month period.
The Company recorded expenses related to its Shelf Registration Statement as prepaid assets. These expenses will be charged as a reduction of capital upon utilization, in accordance with ASC 946, Financial Services – Investment Companies. Such expenses relating to issuances of debt securities by the Company will be capitalized as deferred financing costs and amortized over the term of the related debt using the effective interest or straight line method, as applicable.
Earnings per Share – Earnings per share is calculated based upon the weighted average number of shares of common stock outstanding during the reporting period.
Distributions – Weekly distributions are generally declared monthly by the Company’s board of directors and recognized as a liability on the applicable record date. Distributions are paid monthly. The Company has adopted a distribution reinvestment plan that provides for reinvestment of distributions on behalf of shareholders. Shareholders who have elected to participate in the distribution reinvestment plan will have their cash distribution automatically reinvested in additional shares of common stock at a price per share equivalent to the then current public offering price, net of selling commissions and marketing support fees.
47
Table of Contents
| 2. | Significant Accounting Policies (continued) |
Federal Income Taxes – The Company has elected to be treated for federal income tax purposes, and intends to maintain its qualification, as a RIC under Subchapter M of the Code. Generally, a RIC is not subject to federal income taxes on distributed income and gains if it distributes at least 90% of its “Investment Company Taxable Income,” as defined in the Code. The Company intends to distribute sufficient dividends to maintain its RIC status each year.
The Company is generally subject to nondeductible federal excise taxes if it does not distribute to its shareholders an amount at least equal to the sum of (i) 98% of its net ordinary income for the calendar year, (ii) 98.2% of its capital gains in excess of capital losses for the one-year period generally ending on October 31 of the calendar year and (iii) any ordinary income and net capital gains for preceding years that were not distributed during such years and on which the Company paid no federal income tax.
The Taxable Subsidiaries hold certain of the Company’s portfolio investments. The Taxable Subsidiaries are consolidated for GAAP reporting purposes, and the portfolio investments held by such entities are included in the condensed consolidated financial statements. The Taxable Subsidiaries may generate income tax expense, or benefit, and related tax assets and liabilities. As a result, any such income tax expense, or benefit and the related tax assets and liabilities are recorded in the Company’s condensed consolidated financial statements. Deferred tax assets and liabilities are recorded for temporary differences between the tax basis of assets and liabilities and their reported amounts in the financial statements, using statutory tax rates in effect for the year in which the temporary differences are expected to reverse. Valuation allowances are established when necessary to reduce deferred tax assets to the amount expected to be realized. Similarly, certain foreign investments, which may be held outside of the Taxable Subsidiaries, might incur foreign income taxes and have deferred tax assets and liabilities.
The Company recognizes in its condensed consolidated financial statements the effect of a tax position when it is deemed more likely than not, based on the technical merits, that the position will be sustained upon examination. Tax benefits of positions not deemed to meet the more-likely-than-not threshold are recorded as a tax expense in the current year. The Company did not have any uncertain tax positions that met the recognition or measurement criteria of ASC 740-10-25, Income Taxes – Overall –Recognition, nor did it have any unrecognized tax benefits for the periods presented herein. Although the Company and the Taxable Subsidiaries file federal and state tax returns, their major tax jurisdiction is federal.
Permanent book and tax basis differences are reclassified among the Company’s capital accounts, as appropriate. Additionally, the tax character and amount of distributions is determined in accordance with the Code which differs from GAAP.
Recent Accounting Pronouncements – In February 2015, the FASB issued Accounting Standard Update (“ASU”) 2015-02, “Amendments to the Consolidation Analysis,” which requires amendments to both the variable interest entity (“VIE”) and voting models. The amendments (i) modify the identification of variable interests (fees paid to a decision maker or service provider), the VIE characteristics for a limited partnership or similar entity and primary beneficiary determination under the VIE model, and (ii) eliminate the presumption within the current voting model that a general partner controls a limited partnership or similar entity. The new guidance is effective for annual reporting periods, and interim periods within those annual periods, beginning after December 15, 2015 with early adoption permitted. The amendments may be applied using either a modified retrospective or full retrospective approach. The application of this guidance has not had material impact on the Company’s condensed consolidated financial position, results of operations and cash flows.
In April 2015, the FASB issued ASU 2015-03, “Simplifying the Presentation of Debt Issuance Costs,” which requires that loan costs related to a recognized debt liability be presented in the balance sheet as a direct deduction from the carrying amount of that debt liability, consistent with debt discounts or premiums. The new guidance is effective for annual reporting periods, and interim periods within those annual periods, beginning after December 15, 2015 with early adoption permitted. The ASU is to be applied retrospectively for each period presented. Upon adoption, an entity is required to comply with the applicable disclosures for a change in an accounting principle. The FASB subsequently issued ASU 2015-15, “Presentation and Subsequent Measurement of Debt Issuance Costs Associated with Line-of-Credit Arrangements,” which clarifies that, given the absence of authoritative guidance in ASU 2015-03 regarding presentation and subsequent measurement of loan costs related to line-of-credit arrangements, the SEC Staff would not object to an entity deferring and presenting loan costs as an asset and subsequently amortizing the loan costs ratably over the term of the line-of-credit arrangement, regardless of whether there are any outstanding borrowings on the line-of-credit arrangement. Prior to adoption of this ASU, the Company included all deferred financing costs in prepaid and other deferred expenses in the condensed consolidated statements of assets and liabilities. Upon adoption, the Company reclassified the deferred financing costs related to the Company’s term loan to be a direct deduction from the carrying amount of the term loan payable in the condensed consolidated statements of assets and liabilities. The Company also retrospectively reclassified $3.93 million of unamortized deferred financing costs that were previously presented as prepaid and other deferred expenses as of December 31, 2015.
In August 2016, the FASB issued ASU 2016-15, “Statement of Cash Flows (Topic 230): Classification of Certain Cash Receipts and Cash Payments,” which will make eight targeted changes to how cash receipts and cash payments are presented and classified in the statement of cash flows. The ASU further clarifies how the predominance principle should be applied to cash receipts and payments relating to more than one class of cash flows. The ASU is effective for annual reporting periods, and interim periods within those annual periods, beginning after December 15, 2017. The ASU is to be applied retrospectively for each period presented. The Company is currently evaluating the impact this ASU will have on the Company’s consolidated statement of cash flows.
48
Table of Contents
| 3. | Investments |
The Company is engaged in a strategy to invest primarily in the debt of privately owned and thinly traded U.S. companies. The primary investment concentrations include (i) senior debt securities and (ii) subordinated debt securities. The Company’s investments may, in some cases, be accompanied by warrants, options or other forms of equity participation. The Company may separately purchase common or preferred equity interests in transactions, including non-controlling equity investments. Additionally, the Company may invest in convertible securities, derivatives and private investment funds. The Company may also co-invest with third parties through partnerships, joint ventures or other entities, thereby acquiring jointly controlled or non-controlling interests in certain investments in conjunction with participation by one or more third parties in such investment. The fair value of the Company’s investments will generally fluctuate with, among other things, changes in prevailing interest rates, the general supply of, and demand for, debt capital among private and public companies, general domestic and global economic conditions, the condition of certain financial markets, developments or trends in any particular industry and changes in the financial condition and credit quality of each security’s issuer.
As of September 30, 2016 and December 31, 2015, the Company’s investment portfolio consisted of the following (in thousands):
| As of September 30, 2016 | ||||||||||||||||
| Asset Category | Amortized Cost |
Fair Value | Percentage of Investment Portfolio |
Percentage of Net Assets |
||||||||||||
| Senior debt |
||||||||||||||||
| Senior secured loans – first lien |
$ | 1,695,047 | $ | 1,605,818 | 39.8 | % | 58.2 | % | ||||||||
| Senior secured loans – second lien |
1,141,950 | 1,095,896 | 27.2 | 39.8 | ||||||||||||
| Senior secured bonds |
185,023 | 154,895 | 3.8 | 5.6 | ||||||||||||
|
|
|
|
|
|
|
|
|
|||||||||
| Total senior debt |
3,022,020 | 2,856,609 | 70.8 | 103.6 | ||||||||||||
| Subordinated debt |
603,467 | 575,155 | 14.2 | 20.8 | ||||||||||||
| Structured products |
223,447 | 213,972 | 5.3 | 7.8 | ||||||||||||
| Equity/Other |
441,208 | 390,472 | 9.7 | 14.1 | ||||||||||||
|
|
|
|
|
|
|
|
|
|||||||||
| Subtotal |
4,290,142 | 4,036,208 | 100.0 | % | 146.3 | % | ||||||||||
|
|
|
|||||||||||||||
| Short-term investments |
26,490 | 26,490 | 1.0 | |||||||||||||
|
|
|
|
|
|
|
|||||||||||
| Total investments |
$ | 4,316,632 | $ | 4,062,698 | 147.3 | % | ||||||||||
|
|
|
|
|
|
|
|||||||||||
| As of December 31, 2015 | ||||||||||||||||
| Asset Category | Amortized Cost |
Fair Value | Percentage of Investment Portfolio |
Percentage of Net Assets |
||||||||||||
| Senior debt |
||||||||||||||||
| Senior secured loans – first lien |
$ | 1,721,163 | $ | 1,593,668 | 42.8 | % | 61.5 | % | ||||||||
| Senior secured loans – second lien |
1,154,518 | 1,100,781 | 29.6 | 42.4 | ||||||||||||
| Senior secured bonds |
217,350 | 184,509 | 5.0 | 7.1 | ||||||||||||
|
|
|
|
|
|
|
|
|
|||||||||
| Total senior debt |
3,093,031 | 2,878,958 | 77.4 | 111.0 | ||||||||||||
| Subordinated debt |
525,301 | 457,287 | 12.3 | 17.6 | ||||||||||||
| Structured products |
111,640 | 116,208 | 3.1 | 4.5 | ||||||||||||
| Equity/Other |
292,059 | 269,808 | 7.2 | 10.4 | ||||||||||||
|
|
|
|
|
|
|
|
|
|||||||||
| Subtotal |
4,022,031 | 3,722,261 | 100.0 | % | 143.5 | % | ||||||||||
|
|
|
|||||||||||||||
| Short-term investments |
7,071 | 7,071 | 0.3 | |||||||||||||
|
|
|
|
|
|
|
|||||||||||
| Total investments |
$ | 4,029,102 | $ | 3,729,332 | 143.8 | % | ||||||||||
|
|
|
|
|
|
|
|||||||||||
As of September 30, 2016, debt investments on nonaccrual status represented 5.7% and 3.0% of total investments on an amortized cost basis and fair value basis, respectively. As of December 31, 2015, debt investments on nonaccrual status represented 3.6% and 2.1% of total investments on an amortized cost basis and fair value basis, respectively.
49
Table of Contents
| 3. | Investments (continued) |
The industry composition, geographic dispersion, and local currencies of the Company’s investment portfolio as a percentage of total fair value of the Company’s investments, excluding short term investments and derivative instruments, as of September 30, 2016 and December 31, 2015 were as follows:
| Industry Composition |
September 30, 2016 | December 31, 2015 | ||||||
| Capital Goods |
21.3 | % | 16.7 | % | ||||
| Software & Services |
11.1 | 11.2 | ||||||
| Diversified Financials |
9.8 | 6.2 | ||||||
| Retailing |
6.5 | 8.3 | ||||||
| Materials |
6.1 | 3.9 | ||||||
| Health Care Equipment & Services |
5.4 | 4.8 | ||||||
| Automobiles & Components |
4.9 | 4.8 | ||||||
| Consumer Durables & Apparel |
4.7 | 9.6 | ||||||
| Technology Hardware & Equipment |
4.5 | 4.7 | ||||||
| Energy |
4.2 | 4.4 | ||||||
| Transportation |
4.1 | 4.7 | ||||||
| Real Estate |
3.4 | 2.2 | ||||||
| Commercial & Professional Services |
3.2 | 4.2 | ||||||
| Consumer Services |
2.6 | 2.4 | ||||||
| Media |
1.5 | 2.3 | ||||||
| Food, Beverage & Tobacco |
1.5 | 1.7 | ||||||
| Pharmaceuticals, Biotechnology & Life Sciences |
1.4 | 1.4 | ||||||
| Food & Staples Retailing |
1.4 | 2.7 | ||||||
| Telecommunication Services |
1.3 | 2.2 | ||||||
| Insurance |
1.1 | 1.6 | ||||||
|
|
|
|
|
|||||
| Total |
100.0 | % | 100.0 | % | ||||
|
|
|
|
|
|||||
| Geographic Dispersion (1) |
||||||||
| United States |
82.9 | % | 78.4 | % | ||||
| Luxembourg |
4.7 | 4.3 | ||||||
| Singapore |
3.9 | 3.6 | ||||||
| Sweden |
2.8 | 2.5 | ||||||
| Ireland |
2.2 | 2.3 | ||||||
| United Kingdom |
1.6 | 4.4 | ||||||
| Caymen Islands |
0.7 | 0.8 | ||||||
| British Virgin Islands |
0.6 | 1.0 | ||||||
| Australia |
0.4 | 0.6 | ||||||
| Remaining Countries |
0.2 | 2.1 | ||||||
|
|
|
|
|
|||||
| Total |
100.0 | % | 100.0 | % | ||||
|
|
|
|
|
|||||
| Local Currency |
||||||||
| U.S. Dollar |
87.8 | % | 84.1 | % | ||||
| Euro |
9.2 | 10.3 | ||||||
| British Pound Sterling |
2.5 | 5.0 | ||||||
| Australian Dollar |
0.4 | 0.6 | ||||||
| Swedish Krona |
0.1 | — | ||||||
|
|
|
|
|
|||||
| Total |
100.0 | % | 100.0 | % | ||||
|
|
|
|
|
|||||
| (1) | The geographic dispersion is determined by the portfolio company’s country of domicile or the jurisdiction of the security’s issuer. |
Strategic Credit Opportunities Partners, LLC
In May 2016, SCJV, a joint venture between the Company and Conway Capital, LLC (“Conway”), an affiliate of Guggenheim Life and Annuity Company and Delaware Life Insurance Company, was formed pursuant to the terms of a limited liability company agreement between the Company and Conway. Pursuant to the terms of the agreement, the Company and Conway each have 50% voting control of SCJV and together will agree on all investment decisions as well as all other significant actions for SCJV. SCJV was formed to invest its capital in a range of investments, including senior secured loans (both first lien and second lien) to middle market companies, broadly syndicated loans, equity, warrants and other investments. The Company and Conway have agreed to provide capital to SCJV of up to $500 million in the aggregate. The Company and Conway will provide 87.5% and 12.5%, respectively, of the committed capital. As administrative agent of SCJV, the Company will perform certain day-to-day management responsibilities on behalf of SCJV.
50
Table of Contents
| 3. | Investments (continued) |
In August 2016, the Company and Conway completed the initial funding of SCJV. As part of the initial funding, the Company sold investments with a fair value of $247.24 million to SCJV, in exchange for cash and a $92.40 million equity interest in SCJV. The Company recognized a net realized loss of $0.95 million in connection with the transaction. Conway completed its initial funding of SCJV with a cash contribution of $13.20 million.
On August 15, 2016, CSCOP SE I LLC (“Borrower SPV”), a wholly-owned subsidiary of SCJV, entered into a credit agreement (the “Credit Agreement”), with Bank of America Merrill Lynch. The Credit Agreement provides for a revolving credit facility which provides for up to $165.00 million in total commitments to Borrower SPV (the “Credit Facility”), and is secured by substantially all of the assets of Borrower SPV. The stated borrowing rate under the Credit Facility may take the form of either base rate loans or Eurocurrency rate loans and may be converted to either or during the term of the loan by delivering a notice to the Credit Agreement administrative agent and State Street Bank and Trust Company, as collateral administrator, pursuant to the terms of the Credit Agreement. Base rate loans shall bear interest at a rate per annum equal to the sum of (a) the fluctuating rate per annum equal to the highest of (i) the federal funds rate plus 0.5% of 1%, (ii) the prime rate set by Bank of America for such day and (iii) the 1-month LIBOR plus (b) 1.85%. Eurocurrency rate loans shall bear interest at the rate per annum equal to the sum of (a) LIBOR (or a comparable or successor rate approved by the Credit Agreement administrative agent) plus (b) 1.85%. Borrower SPV shall also pay a commitment fee for undrawn commitment in the amount between 0.75% to 1.75%. The Credit Facility matures on August 15, 2018. As of September 30, 2016, total outstanding borrowings under this Credit Facility were $143.60 million.
As of September 30, 2016, SCJV had total investments with a fair value of $238.89 million. As of September 30, 2016, SCJV had no investments on non-accrual status.
Below is a summary of SCJV’s portfolio, followed by a listing of the individual loans in SCJV’s portfolio as of September 30, 2016:
| September 30, 2016 | ||||
| Total debt investments (1) |
$ | 241,356 | ||
| Weighted average current interest rate on debt investments (2) |
7.18 | % | ||
| Number of borrowers in SCJV |
33 | |||
| Largest loan to a single borrower (1) |
$ | 21,268 | ||
| (1) | At par amount. |
| (2) | Computed as the (a) annual stated interest rate on accruing debt, divided by (b) total debt at par amount. |
Strategic Credit Opportunities Partners, LLC Portfolio
As of September 30, 2016 (in thousands)
| Company (a) |
Footnotes | Industry |
Interest Rate |
Base Rate Floor |
Maturity Date |
Principal Amount(b) |
Cost |
Fair Value | ||||||||||||||||||||||
| Senior Secured Loans - First Lien—113.6% |
||||||||||||||||||||||||||||||
| ABILITY Network, Inc. |
(f)(1) | Health Care Equipment & Services | L + 500 | 1.00 | % | 5/14/2021 | $ | 8,834 | $ | 8,730 | $ | 8,787 | ||||||||||||||||||
| Belk, Inc. |
(1) | Retailing | L + 475 | 1.00 | % | 12/12/2022 | 4,209 | 3,712 | 3,824 | |||||||||||||||||||||
| CityCenter Holdings, LLC |
(1) | Real Estate | L + 325 | 1.00 | % | 10/16/2020 | 4,755 | 4,783 | 4,793 | |||||||||||||||||||||
| David’s Bridal, Inc. |
(f)(1) | Retailing | L + 375 | 1.25 | % | 10/11/2019 | 6,479 | 6,043 | 6,111 | |||||||||||||||||||||
| Grocery Outlet, Inc. |
(1) | Food & Staples Retailing | L + 400 | 1.00 | % | 10/21/2021 | 2,930 | 2,897 | 2,930 | |||||||||||||||||||||
| Gymboree Corp. |
(c)(f)(1) | Retailing | L + 350 | 1.50 | % | 2/23/2018 | 4,385 | 3,376 | 3,494 | |||||||||||||||||||||
| Hanson Building Products North America |
(f)(1) | Capital Goods | L + 550 | 1.00 | % | 3/13/2022 | 8,509 | 8,465 | 8,483 | |||||||||||||||||||||
| Harbor Freight Tools USA, Inc. |
(f)(1) | Retailing | L + 325 | 0.75 | % | 8/18/2023 | 2,183 | 2,187 | 2,198 | |||||||||||||||||||||
| Koosharem, LLC |
(f)(1) | Commercial & Professional Services | L + 650 | 1.00 | % | 5/15/2020 | 21,268 | 18,770 | 18,326 | |||||||||||||||||||||
| MedAssets, Inc. |
(2) | Health Care Equipment & Services | L + 550 | 1.00 | % | 10/19/2022 | 7,090 | 7,156 | 7,152 | |||||||||||||||||||||
| Neiman Marcus Group, LLC |
(f)(1) | Retailing | L + 325 | 1.00 | % | 10/25/2020 | 3,921 | 3,661 | 3,619 | |||||||||||||||||||||
| Netsmart Technologies, Inc. |
(2) | Health Care Equipment & Services | L + 475 | 1.00 | % | 4/19/2023 | 1,981 | 1,993 | 1,993 | |||||||||||||||||||||
51
Table of Contents
| 3. | Investments (continued) |
| Company (a) |
Footnotes | Industry |
Interest Rate |
Base Rate Floor |
Maturity Date |
Principal Amount(b) |
Cost |
Fair Value | ||||||||||||||||||||
| RedPrairie Corp. |
(f)(2) | Software & Services | L + 500 | 1.00 | % | 12/21/2018 | $ | 12,542 | $ | 12,472 | $ | 12,555 | ||||||||||||||||
| (c)(2) | L + 350 | 1.00 | % | 9/22/2023 | 11,288 | 11,232 | 11,317 | |||||||||||||||||||||
| Savers, Inc., Common Shares A |
(f)(1) | Retailing | L + 375 | 1.25 | % | 7/9/2019 | 9,974 | 8,771 | 9,171 | |||||||||||||||||||
| TIBCO Software, Inc. |
(f)(2) | Software & Services | L + 550 | 1.00 | % | 12/4/2020 | 19,281 | 18,717 | 19,049 | |||||||||||||||||||
|
|
|
|
|
|||||||||||||||||||||||||
| Total Senior Secured Loans—First Lien |
$ | 122,965 | $ | 123,802 | ||||||||||||||||||||||||
|
|
|
|
|
|||||||||||||||||||||||||
| Senior Secured Loans - Second Lien—18.1% |
||||||||||||||||||||||||||||
| Applied Systems, Inc. |
(f)(1) | Software & Services | L + 650 | 1.00 | % | 1/24/2022 | $ | 7,461 | $ | 7,500 | $ | 7,542 | ||||||||||||||||
| Deltek, Inc. |
(f)(1) | Software & Services | L + 850 | 1.00 | % | 6/26/2023 | 7,000 | 7,113 | 7,096 | |||||||||||||||||||
| Misys, Ltd. (GBR) |
(d) | Software & Services | 12.00 | % | 6/12/2019 | 4,866 | 5,081 | 5,134 | ||||||||||||||||||||
|
|
|
|
|
|||||||||||||||||||||||||
| Total Senior Secured Loans - Second Lien |
$ | 19,694 | $ | 19,772 | ||||||||||||||||||||||||
|
|
|
|
|
|||||||||||||||||||||||||
| Senior Secured Bonds—21.2% |
||||||||||||||||||||||||||||
| Artesyn Technologies, Inc. |
(e)(f) | Technology Hardware & Equipment | 9.75 | % | 10/15/2020 | $ | 8,900 | $ | 7,510 | $ | 8,077 | |||||||||||||||||
| Calumet Specialty Products Partners, LP |
(e)(f) | Energy | 11.50 | % | 1/15/2021 | 6,579 | 7,477 | 7,533 | ||||||||||||||||||||
| Guitar Center, Inc. |
(e)(f) | Retailing | 6.50 | % | 4/15/2019 | 8,523 | 7,543 | 7,500 | ||||||||||||||||||||
|
|
|
|
|
|||||||||||||||||||||||||
| Total Senior Secured Bonds |
|
$ | 22,530 | $ | 23,110 | |||||||||||||||||||||||
|
|
|
|
|
|||||||||||||||||||||||||
| Total Senior Debt |
|
$ | 165,189 | $ | 166,684 | |||||||||||||||||||||||
|
|
|
|
|
|||||||||||||||||||||||||
| Subordinated Debt—66.2% |
|
|||||||||||||||||||||||||||
| Builders FirstSource, Inc. |
(e)(f) | Capital Goods | 10.75 | % | 8/15/2023 | $ | 6,564 | $ | 7,487 | $ | 7,532 | |||||||||||||||||
| Cequel Communications Holdings, LLC |
(e)(f) | Media | 5.13 | % | 12/15/2021 | 7,426 | 7,499 | 7,408 | ||||||||||||||||||||
| ClubCorp Club Operations, Inc. |
(e)(f) | Consumer Services | 8.25 | % | 12/15/2023 | 2,773 | 2,903 | 2,981 | ||||||||||||||||||||
| GCI, Inc. |
(f) | Telecommunication Services | 6.88 | % | 4/15/2025 | 7,211 | 7,497 | 7,391 | ||||||||||||||||||||
| GCP Applied Technologies, Inc. |
(e)(f) | Materials | 9.50 | % | 2/1/2023 | 4,796 | 5,480 | 5,456 | ||||||||||||||||||||
| Hillman Group, Inc. |
(e)(f) | Consumer Durables & Apparel | 6.38 | % | 7/15/2022 | 2,238 | 2,051 | 2,098 | ||||||||||||||||||||
| IMS Health, Inc. |
(e)(f) | Health Care Equipment & Services | 6.00 | % | 11/1/2020 | 7,353 | 7,496 | 7,463 | ||||||||||||||||||||
| Jo-Ann Stores, Inc. |
(e)(f) | Retailing | 8.13 | % | 3/15/2019 | 2,090 | 2,050 | 2,085 | ||||||||||||||||||||
| Kenan Advantage Group, Inc. |
(e)(f) | Transportation | 7.88 | % | 7/31/2023 | 7,692 | 7,501 | 7,288 | ||||||||||||||||||||
| Manitowoc Foodservice, Inc. |
(f) | Capital Goods | 9.50 | % | 2/15/2024 | 6,622 | 7,488 | 7,549 | ||||||||||||||||||||
| Platform Specialty Products Corp. |
(e)(f) | Materials | 10.38 | % | 5/1/2021 | 6,813 | 7,138 | 7,358 | ||||||||||||||||||||
| Solera Holdings, Inc. |
(e)(f) | Software & Services | 10.50 | % | 3/1/2024 | 6,818 | 7,491 | 7,602 | ||||||||||||||||||||
|
|
|
|
|
|||||||||||||||||||||||||
| Total Subordinated Debt |
|
$ | 72,081 | $ | 72,211 | |||||||||||||||||||||||
|
|
|
|
|
|||||||||||||||||||||||||
| TOTAL INVESTMENTS — 219.1% |
|
$ | 237,270 | $ | 238,895 | |||||||||||||||||||||||
|
|
|
|
|
|||||||||||||||||||||||||
52
Table of Contents
| 3. | Investments (continued) |
| (a) | Security may be an obligation of one or more entities affiliated with the named company. |
| (b) | Denominated in U.S. dollars unless otherwise noted. |
| (c) | Position or portion thereof unsettled as of September 30, 2016. |
| (d) | A portfolio company domiciled in a foreign country. The jurisdiction of the security issuer may be a different country than the domicile of the portfolio company. |
| (e) | This security was acquired in a transaction that was exempt from the registration requirements of the Securities Act of 1933 pursuant to Rule 144A thereunder. This security may be resold only in transactions that are exempt from the registration requirements of the Securities Act, normally to qualified institutional buyers. |
| (f) | This investment is held by both the Company and SCJV as of September 30, 2016. |
| (1) | The interest rate on these investments is subject to a base rate of 3-Month LIBOR, which at September 30, 2016 was 0.85%. The current base rate for each investment may be different from the reference rate on September 30, 2016. |
| (2) | The interest rate on these investments is subject to a base rate of 1-Month LIBOR, which at September 30, 2016 was 0.53%. The current base rate for each investment may be different from the reference rate on September 30, 2016. |
Abbreviations:
GBR - United Kingdom
L = LIBOR - London Interbank Offered Rate, typically 3-Month
Below is selected balance sheet information for SCJV as of September 30, 2016 (in thousands):
| September 30, 2016 | ||||
| Selected Balance Sheet Information |
| |||
| Total investments, at fair value |
$ | 238,895 | ||
| Cash and other assets |
29,621 | |||
|
|
|
|||
| Total assets |
$ | 268,516 | ||
|
|
|
|||
| Debt |
$ | 143,600 | ||
| Payable for investments purchased |
15,694 | |||
| Other liabilities |
196 | |||
|
|
|
|||
| Total liabilities |
$ | 159,490 | ||
|
|
|
|||
| Member’s equity |
$ | 109,026 | ||
|
|
|
|||
Below is selected statement of operations information for SCJV for the period from August 15, 2016 (Inception) through September 30, 2016 (in thousands):
| Period from August 15, 2016 (Inception) through September 30, 2016 |
||||
| Selected Statement of Operations Information |
| |||
| Total investment income |
$ | 2,251 | ||
| Expenses |
||||
| Interest expense |
500 | |||
| Professional services |
23 | |||
| Administrative services |
8 | |||
| Custodian and accounting fees |
18 | |||
|
|
|
|||
| Total expenses |
549 | |||
|
|
|
|||
| Net investment income |
1,702 | |||
| Net realized and unrealized gains |
1,724 | |||
|
|
|
|||
| Net increase in members’ equity |
$ | 3,426 | ||
|
|
|
|||
53
Table of Contents
| 4. | Derivative Instruments |
The following is a summary of the fair value and location of the Company’s derivative instruments in the condensed consolidated statements of assets and liabilities held as of September 30, 2016 and December 31, 2015 (in thousands):
| Fair Value | ||||||||||
| Derivative Instrument |
Statement Location |
September 30, 2016 |
December 31, 2015 |
|||||||
| Cross currency swaps |
Unrealized appreciation on derivative instruments |
$ | 13,620 | $ | 8,247 | |||||
| Cross currency swaps |
Unrealized depreciation on derivative instruments |
(3,623 | ) | (304 | ) | |||||
| Foreign currency forward contracts |
Unrealized appreciation on derivative instruments |
939 | 2,258 | |||||||
| Foreign currency forward contracts |
Unrealized depreciation on derivative instruments |
(957 | ) | (541 | ) | |||||
| Interest rate swaps |
Unrealized appreciation on derivative instruments |
438 | 6,021 | |||||||
| Interest rate swaps |
Unrealized depreciation on derivative instruments |
(7,049 | ) | — | ||||||
| TRS |
Unrealized appreciation on derivative instruments |
4,828 | — | |||||||
| TRS |
Unrealized depreciation on derivative instruments |
— | (13,562 | ) | ||||||
|
|
|
|
|
|||||||
| Total |
$ | 8,196 | $ | 2,119 | ||||||
|
|
|
|
|
|||||||
Net realized and unrealized gains and losses on derivative instruments recorded by the Company for the three and nine months ended September 30, 2016 and 2015 are in the following locations in the condensed consolidated statements of operations (in thousands):
| Net Realized Gains (Losses) | ||||||||||||||||||
| Three Months Ended September 30, |
Nine Months Ended September 30, |
|||||||||||||||||
| Derivative Instruments |
Statement Location |
2016 | 2015 | 2016 | 2015 | |||||||||||||
| Cross currency swaps |
Net realized gains on derivative instruments |
$ | 1,326 | $ | 249 | $ | 7,997 | $ | 249 | |||||||||
| Foreign currency forward contracts |
Net realized gains (losses) on derivative instruments |
(4,029 | ) | 47,021 | (2,946 | ) | 71,081 | |||||||||||
| Interest rate swaps |
Net realized losses on derivative instruments |
(1,055 | ) | — | (3,121 | ) | — | |||||||||||
| TRS |
Net realized gains on derivative instruments |
3,197 | 4,090 | 8,896 | 9,603 | |||||||||||||
|
|
|
|
|
|
|
|
|
|||||||||||
| Total |
$ | (561 | ) | $ | 51,360 | $ | 10,826 | $ | 80,933 | |||||||||
|
|
|
|
|
|
|
|
|
|||||||||||
| Net Unrealized Gains (Losses) | ||||||||||||||||||
| Three Months Ended September 30, |
Nine Months Ended September 30, |
|||||||||||||||||
| Derivative Instruments |
Statement Location |
2016 | 2015 | 2016 | 2015 | |||||||||||||
| Cross currency swaps |
Net change in unrealized appreciation (depreciation) on derivative instruments |
$ | (1,942 | ) | $ | 302 | $ | 2,055 | $ | 302 | ||||||||
| Foreign currency forward contracts |
Net change in unrealized appreciation (depreciation) on derivative instruments |
2,126 | (42,016 | ) | (1,735 | ) | (40,059 | ) | ||||||||||
| Interest rate swaps |
Net change in unrealized appreciation (depreciation) on derivative instruments |
6,420 | — | (12,633 | ) | — | ||||||||||||
| TRS |
Net change in unrealized appreciation (depreciation) on derivative instruments |
8,880 | (3,636 | ) | 18,390 | 998 | ||||||||||||
|
|
|
|
|
|
|
|
|
|||||||||||
| Total |
$ | 15,484 | $ | (45,350 | ) | $ | 6,077 | $ | (38,759 | ) | ||||||||
|
|
|
|
|
|
|
|
|
|||||||||||
54
Table of Contents
| 4. | Derivative Instruments (continued) |
Offsetting of Derivative Instruments
The Company has derivative instruments that are subject to master netting agreements. These agreements include provisions to offset positions with the same counterparty in the event of default by one of the parties. The Company’s unrealized appreciation and depreciation on derivative instruments are reported as gross assets and liabilities, respectively, in the condensed consolidated statements of assets and liabilities. The following tables present the Company’s assets and liabilities related to derivatives by counterparty, net of amounts available for offset under a master netting arrangement and net of any collateral received or pledged by the Company for such assets and liabilities as of September 30, 2016 and December 31, 2015 (in thousands).
| As of September 30, 2016 | ||||||||||||||||||||
| Counterparty |
Derivative Assets Subject to Master Netting Agreement |
Derivatives Available for Offset |
Non-cash Collateral Received (1) |
Cash Collateral Received(1) |
Net Amount of Derivative Assets (2) |
|||||||||||||||
| Bank of Nova Scotia |
$ | 4,828 | $ | — | $ | — | $ | — | $ | 4,828 | ||||||||||
| J.P. Morgan Chase Bank |
14,997 | — | — | — | 14,997 | |||||||||||||||
|
|
|
|
|
|
|
|
|
|
|
|||||||||||
| Total |
$ | 19,825 | $ | — | $ | — | $ | — | $ | 19,825 | ||||||||||
|
|
|
|
|
|
|
|
|
|
|
|||||||||||
| Counterparty |
Derivative Liabilities Subject to Master Netting Agreement |
Derivatives Available for Offset |
Non-cash Collateral Pledged (1) |
Cash Collateral Pledged (1) |
Net Amount of Derivative Liabilities (3) |
|||||||||||||||
| J.P. Morgan Chase Bank |
$ | 11,629 | $ | — | $ | — | $ | — | $ | 11,629 | ||||||||||
|
|
|
|
|
|
|
|
|
|
|
|||||||||||
| Total |
$ | 11,629 | $ | — | $ | — | $ | — | $ | 11,629 | ||||||||||
|
|
|
|
|
|
|
|
|
|
|
|||||||||||
| As of December 31, 2015 | ||||||||||||||||||||
| Counterparty |
Derivative Assets Subject to Master Netting Agreement |
Derivatives Available for Offset |
Non-cash Collateral Received (1) |
Cash Collateral Received (1) |
Net Amount of Derivative Assets (2) |
|||||||||||||||
| J.P. Morgan Chase Bank |
$ | 16,526 | $ | — | $ | — | $ | — | $ | 16,526 | ||||||||||
|
|
|
|
|
|
|
|
|
|
|
|||||||||||
| Total |
$ | 16,526 | $ | — | $ | — | $ | — | $ | 16,526 | ||||||||||
|
|
|
|
|
|
|
|
|
|
|
|||||||||||
| Counterparty |
Derivative Liabilities Subject to Master Netting Agreement |
Derivatives Available for Offset |
Non-cash Collateral Pledged (1) |
Cash Collateral Pledged(1) |
Net Amount of Derivative Liabilities (3) |
|||||||||||||||
| Bank of Nova Scotia |
$ | 13,562 | $ | — | $ | — | $ | 13,562 | $ | — | ||||||||||
| J.P. Morgan Chase Bank |
845 | — | — | — | 845 | |||||||||||||||
|
|
|
|
|
|
|
|
|
|
|
|||||||||||
| Total |
$ | 14,407 | $ | — | $ | — | $ | 13,562 | $ | 845 | ||||||||||
|
|
|
|
|
|
|
|
|
|
|
|||||||||||
| (1) | In some instances, the actual amount of the collateral received and/or pledged may be more than the amount shown due to overcollateralization. |
| (2) | Net amount of derivative assets represents the net amount due from the counterparty to the Company in the event of default. |
| (3) | Net amount of derivative liabilities represents the net amount due from the Company to the counterparty in the event of default. |
55
Table of Contents
| 4. | Derivative Instruments (continued) |
Foreign Currency Forward Contracts and Cross Currency Swaps:
The Company may enter into foreign currency forward contracts and cross currency swaps from time to time to facilitate settlement of purchases and sales of investments denominated in foreign currencies and to economically hedge the impact that an adverse change in foreign exchange rates would have on the value of the Company’s investments denominated in foreign currencies. A foreign currency forward contract is a commitment to purchase or sell a foreign currency at a future date at a negotiated forward rate. These contracts are marked-to-market by recognizing the difference between the contract forward exchange rate and the forward market exchange rate on the last day of the period presented as unrealized appreciation or depreciation. Realized gains or losses are recognized when forward contracts are settled. Risks arise as a result of the potential inability of the counterparties to meet the terms of their contracts. The Company attempts to limit counterparty risk by only dealing with well-known counterparties.
Cross currency swaps are interest rate swaps in which interest cash flows are exchanged between two parties based on the notional amounts of two different currencies. These swaps are marked-to-market by recognizing the difference between the present value of cash flows of each leg of the swaps as unrealized appreciation or depreciation. Realized gain or loss is recognized when periodic payments are received or paid and the swaps are terminated. The entire notional value of a cross currency swap is subject to the risk that the counterparty to the swap will default on its contractual delivery obligations. The Company attempts to limit counterparty risk by only dealing with well-known counterparties.
The foreign currency forward contracts and cross currency swaps open at the end of the period are generally indicative of the volume of activity during the period.
As of September 30, 2016 and December 31, 2015, the Company’s open foreign currency forward contracts were as follows ($ in thousands):
| As of September 30, 2016 |
||||||||||||||||||||
| Foreign Currency |
Settlement Date |
Counterparty |
Amount and Transaction |
US$ Value at Settlement Date |
US$ Value at September 30, 2016 |
Unrealized Appreciation (Depreciation) |
||||||||||||||
| AUD |
Oct 13, 2016 |
JP Morgan Chase Bank |
A$ | 14,071 Sold | $ | 10,569 | $ | 10,768 | $ | (199 | ) | |||||||||
| AUD |
Jan 12, 2017 | JP Morgan Chase Bank |
A$ | 3,655 Sold | 2,720 | 2,790 | (70 | ) | ||||||||||||
| EUR |
Dec 12, 2016 | JP Morgan Chase Bank |
€ | 141,500 Sold | 159,511 | 159,452 | 59 | |||||||||||||
| EUR |
Jan 12, 2017 | JP Morgan Chase Bank |
€ | 8,800 Sold | 9,871 | 9,932 | (61 | ) | ||||||||||||
| GBP |
Oct 13, 2016 | JP Morgan Chase Bank |
£ | 5,500 Sold | 8,010 | 7,130 | 880 | |||||||||||||
| GBP |
Oct 13, 2016 | JP Morgan Chase Bank |
£ | 5,500 Bought | (7,757 | ) | (7,130 | ) | (627 | ) | ||||||||||
|
|
|
|
|
|
|
|||||||||||||||
| Total |
$ | 182,924 | $ | 182,942 | $ | (18 | ) | |||||||||||||
|
|
|
|
|
|
|
|||||||||||||||
| As of December 31, 2015 |
||||||||||||||||||||
| Foreign Currency |
Settlement |
Counterparty |
Amount and Transaction |
US$ Value at Settlement Date |
US$ Value at December 31, 2015 |
Unrealized Appreciation (Depreciation) |
||||||||||||||
| AUD |
Apr 7, 2016 |
JP Morgan Chase Bank |
A$ | 17,726 Sold | $ | 12,439 | $ | 12,859 | $ | (420 | ) | |||||||||
| EUR |
Jan 11, 2016 | JP Morgan Chase Bank |
€ | 50,485 Sold | 56,584 | 54,874 | 1,710 | |||||||||||||
| GBP |
Jan 11, 2016 | JP Morgan Chase Bank |
£ | 8,953 Sold | 13,747 | 13,199 | 548 | |||||||||||||
| GBP |
Jan 11, 2016 | JP Morgan Chase Bank |
£ | 3,700 Bought | (5,576 | ) | (5,455 | ) | (121 | ) | ||||||||||
|
|
|
|
|
|
|
|||||||||||||||
| Total |
$ | 77,194 | $ | 75,477 | $ | 1,717 | ||||||||||||||
|
|
|
|
|
|
|
|||||||||||||||
56
Table of Contents
| 4. | Derivative Instruments (continued) |
As of September 30, 2016 and December 31, 2015, the Company’s open cross currency swaps were as follows ($ in thousands).
| As of September 30, 2016 |
||||||||||||
| Counterparty |
Company Receives Fixed Rate |
Company Pays Fixed Rate |
Termination Date |
Unrealized Appreciation (Depreciation) |
||||||||
| JPMorgan Chase Bank, N.A |
0.300% on USD notional amount of $9,342 |
1.975% on AUD notional amount of A$13,161 | 6/30/2017 | $ | (804 | ) | ||||||
| JPMorgan Chase Bank, N.A |
0.759% on USD notional amount of $175,018 |
0.026% on EUR notional amount of €156,546 | 12/31/2017 | (2,819 | ) | |||||||
| JPMorgan Chase Bank, N.A |
0.590% on USD notional amount of $57,684 |
1.006% on GBP notional amount of £37,537 | 12/31/2017 | 8,427 | ||||||||
| JPMorgan Chase Bank, N.A |
0.913% on USD notional amount of $56,506 |
0.750% on GBP notional amount of £39,349 | 12/31/2017 | 5,193 | ||||||||
|
|
|
|||||||||||
| $ | 9,997 | |||||||||||
|
|
|
|||||||||||
| As of December 31, 2015 |
||||||||||||
| Counterparty |
Company Receives Fixed Rate |
Company Pays Fixed Rate |
Termination Date |
Unrealized Appreciation (Depreciation) |
||||||||
| JPMorgan Chase Bank, N.A |
0.300% on USD notional amount of $9,342 |
1.975% on AUD notional amount of A$13,161 | 6/30/2017 | $ | (304 | ) | ||||||
| JPMorgan Chase Bank, N.A |
0.759% on USD notional amount of $316,351 |
0.026% on EUR notional amount of €282,962 | 12/31/2017 | 4,402 | ||||||||
| JPMorgan Chase Bank, N.A |
0.590% on USD notional amount of $130,061 |
1.006% on GBP notional amount of £84,637 | 12/31/2017 | 3,845 | ||||||||
|
|
|
|||||||||||
| $ | 7,943 | |||||||||||
|
|
|
|||||||||||
As of September 30, 2016 and December 31, 2015, the combined contractual notional balance of the Company’s foreign currency forward contracts and cross currency swaps totaled $481.47 million and $532.95 million, respectively, all of which related to economic hedging of the Company’s foreign currency denominated debt investments. The tables below display the Company’s foreign currency denominated debt investments and foreign currency forward contracts, summarized by foreign currency type as of September 30, 2016 and December 31, 2015 (in thousands).
| Debt Investments Denominated in Foreign Currencies As of September 30, 2016 |
Hedges As of September 30, 2016 | |||||||||||||||||||
| (in thousands) |
Par Value in Local Currency |
Par Value in US$ |
Fair Value | Net Foreign Currency Hedge Amount in Local Currency |
Net Foreign Currency Hedge Amount in U.S. Dollars |
|||||||||||||||
| Euros |
€ | 381,166 | $ | 428,183 | $ | 361,045 | € | 306,846 | $ | 344,400 | ||||||||||
| British Pound Sterling |
£ | 70,607 | 91,517 | 92,015 | £ | 76,886 | 114,443 | |||||||||||||
| Australian Dollars |
A$ | 31,021 | 23,742 | 16,972 | A$ | 30,887 | 22,631 | |||||||||||||
|
|
|
|
|
|
|
|||||||||||||||
| Total |
$ | 543,442 | $ | 470,032 | $ | 481,474 | ||||||||||||||
|
|
|
|
|
|
|
|||||||||||||||
| Debt Investments Denominated in Foreign Currencies As of December 31, 2015 |
Hedges As of December 31, 2015 | |||||||||||||||||||
| (in thousands) |
Par Value in Local Currency |
Par Value in US$ |
Fair Value | Net Foreign Currency Hedge Amount in Local Currency |
Net Foreign Currency Hedge Amount in U.S. Dollars |
|||||||||||||||
| Euros |
€ | 404,360 | $ | 439,438 | $ | 368,746 | € | 333,447 | $ | 372,935 | ||||||||||
| British Pound Sterling |
£ | 121,426 | 179,006 | 177,509 | £ | 89,890 | 138,232 | |||||||||||||
| Australian Dollars |
A$ | 31,021 | 23,949 | 21,471 | A$ | 30,887 | 21,781 | |||||||||||||
|
|
|
|
|
|
|
|||||||||||||||
| Total |
$ | 642,393 | $ | 567,726 | $ | 532,948 | ||||||||||||||
|
|
|
|
|
|
|
|||||||||||||||
57
Table of Contents
| 4. | Derivative Instruments (continued) |
Interest Rate Swaps:
The Company entered into one interest rate swap with a notional amount of $100 million during the nine months ended September 30, 2016. Interest rate swap contracts are privately negotiated agreements between the Company and a counterparty. Pursuant to interest rate swap agreements, the Company makes fixed-rate payments to the counterparty in exchange for payments on a floating benchmark interest rate. Payments received or made are recorded as realized gains or losses. During the term of the outstanding swap agreement, changes in the underlying value of the swap are recorded as unrealized gains or losses. The value of the swap is determined by changes in the relationship between two rates of interest. The Company is exposed to credit loss in the event of non-performance by the swap counterparty. Risk may also arise from movements in interest rates. The Company attempts to limit counterparty risk by only dealing with well-known counterparties.
As of September 30, 2016 and December 31, 2015, the Company’s open interest rate swaps were as follows ($ in thousands).
| As of September 30, 2016 |
||||||||||||||||
| Counterparty |
Notional Amount |
Company Receives Floating Rate |
Company Pays Fixed Rate |
Termination Date |
Unrealized Appreciation (Depreciation) |
|||||||||||
| JPMorgan Chase Bank, N.A |
$ | 100,000 | 3-Month LIBOR | 1.36 | % | 12/31/2020 | $ | (1,192 | ) | |||||||
| JPMorgan Chase Bank, N.A |
$ | 100,000 | 3-Month LIBOR | 0.84 | % | 3/31/2019 | 438 | |||||||||
| JPMorgan Chase Bank, N.A |
$ | 400,000 | 3-Month LIBOR | 1.43 | % | 12/31/2020 | (5,857 | ) | ||||||||
|
|
|
|||||||||||||||
| $ | (6,611 | ) | ||||||||||||||
|
|
|
|||||||||||||||
| As of December 31, 2015 |
||||||||||||||||
| Counterparty |
Notional Amount | Company Receives Floating Rate |
Company Pays Fixed Rate |
Termination Date |
Unrealized Appreciation |
|||||||||||
| JPMorgan Chase Bank, N.A |
$ | 100,000 | 3-Month LIBOR | 1.36 | % | 12/31/2020 | $ | 1,457 | ||||||||
| JPMorgan Chase Bank, N.A |
$ | 400,000 | 3-Month LIBOR | 1.43 | % | 12/31/2020 | 4,564 | |||||||||
|
|
|
|||||||||||||||
| $ | 6,021 | |||||||||||||||
|
|
|
|||||||||||||||
Equity Options and Warrants:
The Company holds equity options and warrants in certain portfolio companies in an effort to achieve additional investment returns. In holding equity options and warrants, the Company bears the risk of an unfavorable change in the value of the underlying equity interests. Equity options and warrants are recorded as investments at fair value in the condensed consolidated statements of assets and liabilities. The aggregate fair value of equity options and warrants included in investments at fair value in the Company’s condensed consolidated statements of assets and liabilities represented 0.5% of the Company’s net assets as of each of September 30, 2016 and December 31, 2015.
Below is a summary of the Company’s investments in equity options and warrants as of September 30, 2016 and December 31, 2015 (in thousands, except share amounts):
| As of September 30, 2016 | ||||||||||||||||
|
|
Expiration Date |
No. Shares | Cost | Fair Value | ||||||||||||
| Amtek Global Technology Pte. Ltd. (SGP), Warrants |
12/31/2017 | 9,991 | $ | 4,636 | $ | 4,205 | ||||||||||
| Amtek Global Technology Pte. Ltd. (SGP), Warrants |
12/31/2018 | 9,991 | 4,785 | 4,359 | ||||||||||||
| Education Management Corp., Warrants |
1/5/2022 | 2,320,791 | 371 | — | ||||||||||||
| Hilding Anders, Equity Options |
12/31/2020 | 236,160,807 | 14,988 | 5,005 | ||||||||||||
| Home Partners of America, Inc., Warrants |
8/7/2024 | 2,675 | 292 | 529 | ||||||||||||
| Keystone Australia Holdings, Pty. Ltd., Warrants |
(1) | 1,588,469 | 1,019 | — | ||||||||||||
|
|
|
|
|
|||||||||||||
| Total |
$ | 26,091 | $ | 14,098 | ||||||||||||
|
|
|
|
|
|||||||||||||
| (1) | Expiration date contingent on certain events pursuant to underlying agreements. |
58
Table of Contents
| 4. | Derivative Instruments (continued) |
| As of December 31, 2015 | ||||||||||||||||
|
|
Expiration Date |
No. Shares | Cost | Fair Value | ||||||||||||
| Amtek Global Technology Pte. Ltd. (SGP), Warrants |
12/31/2017 | 9,991 | $ | 4,636 | $ | 4,551 | ||||||||||
| Amtek Global Technology Pte. Ltd. (SGP), Warrants |
12/31/2018 | 9,991 | 4,785 | 4,754 | ||||||||||||
| Education Management Corp., Warrants |
1/5/2022 | 2,320,791 | 371 | — | ||||||||||||
| Gruppo Argenta S.p.A., Warrants |
(1) | 225,289 | 5,342 | 2,332 | ||||||||||||
| Hilding Anders, Equity Options |
12/31/2020 | 236,160,807 | 14,988 | 213 | ||||||||||||
| Home Partners of America, Inc., Warrants |
8/7/2024 | 2,675 | 292 | 370 | ||||||||||||
| Keystone Australia Holdings, Pty. Ltd., Warrants |
(1) | 1,588,469 | 1,019 | — | ||||||||||||
|
|
|
|
|
|||||||||||||
| Total |
$ | 31,433 | $ | 12,220 | ||||||||||||
|
|
|
|
|
|||||||||||||
| (1) | Expiration date contingent on certain events pursuant to underlying agreements. |
The Company may enter into other derivative instruments and incur other exposures with other counterparties in the future. The derivative instruments held as of September 30, 2016 and December 31, 2015 generally reflect the volume of derivative activity throughout the periods presented.
Total Return Swaps:
On November 15, 2012, Halifax Funding entered into the TRS with the Bank of Nova Scotia (“BNS” or the “Counterparty”). The TRS arrangement with BNS consists of a set of TRS agreements. On October 22, 2015, Halifax Funding amended the TRS agreements. Pursuant to the amended TRS agreements, Halifax Funding may select a portfolio of single-name corporate loans and/or bonds (each, a “TRS asset” and together, the “TRS assets”) with a maximum aggregate notional amount of $500 million. Under the terms of the TRS agreements, each TRS asset included in the TRS portfolio constitutes a separate total return swap transaction, although all calculations, payments and transfers required to be made under the TRS agreements are calculated and treated on an aggregate basis, based upon all such transactions.
Halifax Funding receives quarterly from BNS (i) all collected interest and fees generated by the TRS assets and (ii) realized gains from the sale or principal payments/paydowns of TRS assets, if any. Halifax Funding pays to BNS (i) a financing charge on the TRS settled notional amount at a rate equal to the three-month LIBOR plus 1.40% per annum and (ii) realized losses, if any, related to the TRS assets. In addition, upon the termination of the TRS arrangement, Halifax Funding will either receive from BNS any net realized gain, or pay to BNS any net realized loss, on the liquidation of TRS assets.
Halifax Funding posts collateral in the form of certificates of deposit held by a custodian. Generally, the required collateral amount is at least 33.3% of the notional amount of each TRS asset at the time that such TRS asset is confirmed for acquisition by the Counterparty. Halifax Funding may be required to post additional collateral in the event the value of the TRS assets decreases below a specified amount. Halifax Funding is required to post additional collateral to ensure that the collateral’s market value, as solely determined by BNS, is at least equal to 25% of the value of the TRS portfolio.
The obligations of Halifax Funding under the TRS agreements are nonrecourse to the Company and the Company’s exposure to the TRS is limited to its equity in Halifax Funding, which is generally equal to the collateral posted by Halifax Funding. The Company has no contractual obligation to post any collateral or to pay any financing charges to BNS. The Company may, but is not obligated to, increase its equity investment in Halifax Funding for the purpose of funding additional collateral or payment obligations for which Halifax Funding may become obligated during the term of the TRS agreements. If the Company does not make any such additional equity investment in Halifax Funding and Halifax Funding fails to meet its obligations under the TRS agreements, then BNS will have the right to terminate the TRS agreements and use the collateral posted by Halifax Funding with the custodian to offset any amount owed to BNS. Halifax Funding may terminate the TRS agreements at any time upon providing at least 30 days’ notice prior to the proposed settlement date of the TRS assets related to such termination. In the absence of an early termination, the TRS will terminate on January 15, 2019. In the event of an early termination of the TRS, Halifax Funding may be required to pay a make-whole fee based on a minimum spread amount to be earned by BNS over the life of the amended TRS agreements. Halifax Funding would have been required to pay a make whole fee of $11.01 million if the TRS had been terminated as of September 30, 2016.
59
Table of Contents
| 4. | Derivative Instruments (continued) |
As of September 30, 2016 and December 31, 2015, Halifax Funding had selected 40 and 51 underlying debt positions, respectively, and had posted $95.0 million and $142.64 million, respectively, in collateral, which are recorded as collateral on deposit with custodian in the condensed consolidated statements of assets and liabilities. The following table reconciles the TRS settled notional amount, upon which the financing charge to BNS is based, to the total, or trade basis, notional amount as of September 30, 2016 and December 31, 2015 (in thousands).
| September 30, 2016 | December 31, 2015 | |||||||
| Settled notional amount |
$ | 263,226 | $ | 310,371 | ||||
| Unsettled additions |
28 | 14,595 | ||||||
| Unsettled deletions |
(4,732 | ) | — | |||||
|
|
|
|
|
|||||
| Total notional amount |
$ | 258,522 | $ | 324,966 | ||||
|
|
|
|
|
|||||
The following table summarizes the fair value components of the TRS portfolio (in thousands):
| September 30, 2016 | December 31, 2015 | |||||||
| Interest and fee income |
$ | 5,217 | $ | 4,658 | ||||
| Financing charge |
(1,026 | ) | (896 | ) | ||||
| Net realized gains (losses) |
191 | (571 | ) | |||||
| Net unrealized appreciation (depreciation) of TRS assets |
446 | (16,753 | ) | |||||
|
|
|
|
|
|||||
| TRS total fair value |
$ | 4,828 | $ | (13,562 | ) | |||
|
|
|
|
|
|||||
The following table summarizes the components of the net realized gains on derivative instruments relating to the TRS (in thousands):
| Three Months Ended September 30, |
Nine Months Ended September 30, |
|||||||||||||||
| 2016 | 2015 | 2016 | 2015 | |||||||||||||
| Interest and fee income |
$ | 4,639 | $ | 5,138 | $ | 14,390 | $ | 12,294 | ||||||||
| Financing charge |
(1,648 | ) | (1,181 | ) | (4,616 | ) | (2,889 | ) | ||||||||
| Net realized gains (losses) |
206 | 133 | (878 | ) | 198 | |||||||||||
|
|
|
|
|
|
|
|
|
|||||||||
| Net realized gains on derivative instruments related to the TRS |
$ | 3,197 | $ | 4,090 | $ | 8,896 | $ | 9,603 | ||||||||
|
|
|
|
|
|
|
|
|
|||||||||
The following is a summary of the TRS assets as of September 30, 2016 (in thousands):
| Company (a) |
Industry |
Interest Rate |
LIBOR Floor |
Maturity Date |
Notional Amount |
Fair Value |
Unrealized Appreciation (Depreciation) |
|||||||||||||||||||
| Senior Secured Loans - First Lien |
||||||||||||||||||||||||||
| ABB CONCISE Optical Group, LLC |
Retailing | L + 500 | 1.00 | % | 6/1/2023 | $ | 6,812 | $ | 6,915 | $ | 103 | |||||||||||||||
| ABILITY Network, Inc. |
Health Care Equipment & Services | L + 500 | 1.00 | % | 5/14/2021 | 10,045 | 10,018 | (27 | ) | |||||||||||||||||
| Alion Science & Technology Corp. |
Capital Goods | L + 450 | 1.00 | % | 8/19/2021 | 2,836 | 2,737 | (99 | ) | |||||||||||||||||
| Aspen Dental Management, Inc. |
Health Care Equipment & Services | L + 425 | 1.00 | % | 4/29/2022 | 2,522 | 2,547 | 25 | ||||||||||||||||||
| Caesars Entertainment Operating Co., Inc. (b)(c)(d) |
Consumer Services | L + 725 | 0.00 | % | 3/1/2017 | 3,773 | 4,403 | 630 | ||||||||||||||||||
| CityCenter Holdings, LLC |
Real Estate | L + 325 | 1.00 | % | 10/16/2020 | 10,252 | 10,323 | 71 | ||||||||||||||||||
| Commercial Barge Line Co. |
Transportation | L + 875 | 1.00 | % | 11/12/2020 | 11,600 | 11,733 | 133 | ||||||||||||||||||
| CPI International, Inc. |
Capital Goods | L + 325 | 1.00 | % | 11/17/2017 | 4,736 | 4,665 | (71 | ) | |||||||||||||||||
| CSM Bakery Products |
Food, Beverage & Tobacco | L + 400 | 1.00 | % | 7/3/2020 | 4,850 | 4,648 | (202 | ) | |||||||||||||||||
| CTI Foods Holding Co., LLC |
Food, Beverage & Tobacco | L + 350 | 1.00 | % | 6/29/2020 | 3,776 | 3,640 | (136 | ) | |||||||||||||||||
| Distribution International, Inc. |
Retailing | L + 500 | 1.00 | % | 12/15/2021 | 4,863 | 4,176 | (687 | ) | |||||||||||||||||
| DJO Finance, LLC |
Health Care Equipment & Services | L + 325 | 1.00 | % | 6/8/2020 | 8,757 | 8,512 | (245 | ) | |||||||||||||||||
| Emerald Expositions Holding, Inc. |
Media | L + 375 | 1.00 | % | 6/17/2020 | 4,304 | 4,298 | (6 | ) | |||||||||||||||||
| Grocery Outlet, Inc. |
Food & Staples Retailing | L + 400 | 1.00 | % | 10/21/2021 | 4,940 | 4,832 | (108 | ) | |||||||||||||||||
| Gymboree Corp. |
Retailing | L + 350 | 1.50 | % | 2/23/2018 | 918 | 805 | (113 | ) | |||||||||||||||||
| Gypsum Management & Supply, Inc. |
Capital Goods | L + 350 | 1.00 | % | 4/1/2021 | 8,289 | 8,309 | 20 | ||||||||||||||||||
| Hanson Building Products North America (b) |
Capital Goods | L + 550 | 1.00 | % | 3/13/2022 | 3,594 | 3,639 | 45 | ||||||||||||||||||
| Hillman Group, Inc. |
Consumer Durables & Apparel | L + 350 | 1.00 | % | 6/30/2021 | 9,886 | 9,885 | (1 | ) | |||||||||||||||||
| HUB International, Ltd. |
Insurance | L + 300 | 1.00 | % | 10/2/2020 | 6,012 | 6,122 | 110 | ||||||||||||||||||
| iPayment, Inc. |
Software & Services | L + 525 | 1.50 | % | 5/8/2017 | 14,724 | 14,018 | (706 | ) | |||||||||||||||||
| Kronos, Inc. |
Software & Services | L + 350 | 1.00 | % | 10/30/2019 | 9,692 | 9,745 | 53 | ||||||||||||||||||
| Learfield Communications, Inc. |
Media | L + 325 | 1.00 | % | 10/9/2020 | 7,288 | 7,248 | (40 | ) | |||||||||||||||||
| MCS AMS Sub-Holdings, LLC |
Commercial & Professional Services | L + 650 | 1.00 | % | 10/15/2019 | 11,080 | 12,207 | 1,127 | ||||||||||||||||||
| Neiman Marcus Group, LLC |
Retailing | L + 325 | 1.00 | % | 10/25/2020 | 8,730 | 8,083 | (647 | ) | |||||||||||||||||
| P2 Energy Solutions, Inc. (b) |
Software & Services | L + 400 | 1.00 | % | 10/30/2020 | 4,650 | 4,329 | (321 | ) | |||||||||||||||||
60
Table of Contents
| 4. | Derivative Instruments (continued) |
| Company (a) |
Industry |
Interest Rate |
LIBOR Floor |
Maturity Date |
Notional Amount |
Fair Value | Unrealized Appreciation (Depreciation) |
|||||||||||||||||||
| RedPrairie Corp. |
Software & Services | L + 500 | 1.00 | % | 12/21/2018 | 4,801 | 4,884 | 83 | ||||||||||||||||||
| Riverbed Technology, Inc. |
Technology Hardware & Equipment | L + 400 | 1.00 | % | 4/25/2022 | 4,853 | 4,919 | 66 | ||||||||||||||||||
| Savers, Inc. |
Retailing | L + 375 | 1.25 | % | 7/9/2019 | 10,998 | 10,687 | (311 | ) | |||||||||||||||||
| Talbots, Inc. |
Retailing | L + 450 | 1.00 | % | 3/19/2020 | 7,395 | 7,264 | (131 | ) | |||||||||||||||||
| TIBCO Software, Inc. |
Software & Services | L + 550 | 1.00 | % | 12/4/2020 | 4,679 | 4,849 | 170 | ||||||||||||||||||
| Triple Point Technology, Inc. |
Software & Services | L + 425 | 1.00 | % | 7/10/2020 | 6,894 | 6,719 | (175 | ) | |||||||||||||||||
| TruGreen, LP |
Consumer Services | L + 550 | 1.00 | % | 4/13/2023 | 4,906 | 4,989 | 83 | ||||||||||||||||||
|
|
|
|
|
|
|
|||||||||||||||||||||
| Total Senior Secured Loans - First Lien |
213,455 | 212,148 | (1,307 | ) | ||||||||||||||||||||||
|
|
|
|
|
|
|
|||||||||||||||||||||
| Senior Secured Loans - Second Lien |
||||||||||||||||||||||||||
| Applied Systems, Inc. |
Software & Services | L + 650 | 1.00 | % | 1/24/2022 | 4,658 | 4,657 | (1 | ) | |||||||||||||||||
| Misys, Ltd. (b) |
Software & Services | 12.00 | % | 6/12/2019 | 980 | 994 | 14 | |||||||||||||||||||
| NEP Group, Inc. |
Media | L + 875 | 1.25 | % | 7/22/2020 | 7,653 | 7,711 | 58 | ||||||||||||||||||
| RedPrairie Corp. |
Software & Services | L + 1000 | 1.25 | % | 12/21/2019 | 5,550 | 5,418 | (132 | ) | |||||||||||||||||
|
|
|
|
|
|
|
|||||||||||||||||||||
| Total Senior Secured Loans - Second Lien |
18,841 | 18,780 | (61 | ) | ||||||||||||||||||||||
|
|
|
|
|
|
|
|||||||||||||||||||||
| Senior Secured Bonds |
||||||||||||||||||||||||||
| Artesyn Technologies, Inc. |
Technology Hardware & Equipment | 9.75 | % | 10/15/2020 | 3,640 | 3,176 | (464 | ) | ||||||||||||||||||
| Direct ChassisLink, Inc. |
Transportation | 10.00 | % | 6/15/2023 | 12,084 | 12,688 | 604 | |||||||||||||||||||
|
|
|
|
|
|
|
|||||||||||||||||||||
| Total Senior Secured Bonds |
15,724 | 15,864 | 140 | |||||||||||||||||||||||
|
|
|
|
|
|
|
|||||||||||||||||||||
| Subordinated Debt |
||||||||||||||||||||||||||
| GCI, Inc. |
Telecommunication Services | 6.75 | % | 6/1/2021 | 1,002 | 1,026 | 24 | |||||||||||||||||||
| Solera Holdings, Inc. (b) |
Software & Services | 10.50 | % | 3/1/2024 | 9,500 | 11,150 | 1,650 | |||||||||||||||||||
|
|
|
|
|
|
|
|||||||||||||||||||||
| Total Subordinated Debt |
10,502 | 12,176 | 1,674 | |||||||||||||||||||||||
|
|
|
|
|
|
|
|||||||||||||||||||||
| TOTAL |
$ | 258,522 | $ | 258,968 | $ | 446 | ||||||||||||||||||||
|
|
|
|
|
|
|
|||||||||||||||||||||
| (a) | Security may be an obligation of one or more entities affiliated with the named company. |
| (b) | The investment is not a qualifying asset as defined in Section 55(a) under the 1940 Act. |
| (c) | TRS asset position or portion thereof unsettled as of September 30, 2016. |
| (d) | Investment was on non-accrual status as of September 30, 2016. |
The following is a summary of the TRS assets as of December 31, 2015 (in thousands):
| Company (a) |
Industry |
Interest Rate |
LIBOR Floor |
Maturity Date |
Notional Amount |
Fair Value |
Unrealized Appreciation (Depreciation) |
|||||||||||||||||||
| Senior Secured Loans - First Lien |
||||||||||||||||||||||||||
| ABILITY Network, Inc. |
Health Care Equipment & Services | L + 500 | 1.00 | % | 5/14/2021 | $ | 6,798 | $ | 6,737 | $ | (61 | ) | ||||||||||||||
| Acosta Holdco, Inc. |
Commercial & Professional Services | L + 325 | 1.00 | % | 9/26/2021 | 4,249 | 4,043 | (206 | ) | |||||||||||||||||
| Alion Science & Technology Corp. (c) |
Capital Goods | L + 450 | 1.00 | % | 8/19/2021 | 2,858 | 2,830 | (28 | ) | |||||||||||||||||
| Applied Systems, Inc. |
Software & Services | L + 325 | 1.00 | % | 1/25/2021 | 7,932 | 7,804 | (128 | ) | |||||||||||||||||
| Aspen Dental Management, Inc. |
Health Care Equipment & Services | L + 450 | 1.00 | % | 4/29/2022 | 6,169 | 6,174 | 5 | ||||||||||||||||||
| BJ’s Wholesale Club, Inc. |
Food & Staples Retailing | L + 350 | 1.00 | % | 9/26/2019 | 3,939 | 3,743 | (196 | ) | |||||||||||||||||
| Caesars Entertainment Operating Co., Inc. (b)(d) |
Consumer Services | L + 725 | 0.00 | % | 3/1/2017 | 3,745 | 3,493 | (252 | ) | |||||||||||||||||
| California Pizza Kitchen, Inc. |
Food & Staples Retailing | L + 425 | 1.00 | % | 3/29/2018 | 3,770 | 3,582 | (188 | ) | |||||||||||||||||
| Catalina Marketing Corp. |
Media | L + 350 | 1.00 | % | 4/9/2021 | 707 | 562 | (145 | ) | |||||||||||||||||
| CHG Companies, Inc. |
Health Care Equipment & Services | L + 325 | 1.00 | % | 11/19/2019 | 2,857 | 2,801 | (56 | ) | |||||||||||||||||
| CityCenter Holdings, LLC |
Real Estate | L + 325 | 1.00 | % | 10/16/2020 | 12,448 | 12,366 | (82 | ) | |||||||||||||||||
| Commercial Barge Line, Co. |
Transportation | L + 875 | 1.00 | % | 11/12/2020 | 11,898 | 11,459 | (439 | ) | |||||||||||||||||
| CPI International, Inc. |
Capital Goods | L + 325 | 1.00 | % | 11/17/2017 | 4,772 | 4,630 | (142 | ) | |||||||||||||||||
| CSM Bakery Products |
Food, Beverage & Tobacco | L + 400 | 1.00 | % | 7/3/2020 | 4,888 | 4,816 | (72 | ) | |||||||||||||||||
| CTI Foods Holding Co., LLC |
Food, Beverage & Tobacco | L + 350 | 1.00 | % | 6/29/2020 | 3,947 | 3,706 | (241 | ) | |||||||||||||||||
| Distribution International, Inc. |
Retailing | L + 500 | 1.00 | % | 12/10/2021 | 4,901 | 4,517 | (384 | ) | |||||||||||||||||
| DJO Finance, LLC |
Health Care Equipment & Services | L + 325 | 1.00 | % | 6/8/2020 | 8,824 | 8,507 | (317 | ) | |||||||||||||||||
| Emerald Expositions Holding, Inc. |
Media | L + 375 | 1.00 | % | 6/17/2020 | 9,933 | 9,725 | (208 | ) | |||||||||||||||||
| Four Seasons Holdings, Inc. (b) |
Consumer Services | L + 275 | 0.75 | % | 6/27/2020 | 405 | 404 | (1 | ) | |||||||||||||||||
| Grocery Outlet, Inc. |
Food & Staples Retailing | L + 375 | 1.00 | % | 10/21/2021 | 4,977 | 4,753 | (224 | ) | |||||||||||||||||
| Gymboree Corp. |
Retailing | L + 350 | 1.50 | % | 2/23/2018 | 2,834 | 1,616 | (1,218 | ) | |||||||||||||||||
| Gypsum Management & Supply, Inc. |
Capital Goods | L + 375 | 1.00 | % | 4/1/2021 | 8,353 | 7,918 | (435 | ) | |||||||||||||||||
| Hanson Building Products North America (b) |
Materials | L + 550 | 1.00 | % | 3/13/2022 | 12,463 | 12,183 | (280 | ) | |||||||||||||||||
| Harbor Freight Tools USA, Inc. |
Capital Goods | L + 375 | 1.00 | % | 7/26/2019 | 1,901 | 1,889 | (12 | ) | |||||||||||||||||
| Hillman Group, Inc. |
Consumer Durables & Apparel | L + 350 | 1.00 | % | 6/30/2021 | 9,962 | 9,670 | (292 | ) | |||||||||||||||||
| HUB International, Ltd. |
Insurance | L + 300 | 1.00 | % | 10/2/2020 | 12,947 | 12,398 | (549 | ) | |||||||||||||||||
| Hyland Software, Inc. |
Software & Services | L + 375 | 1.00 | % | 7/1/2022 | 6,921 | 6,747 | (174 | ) | |||||||||||||||||
| iPayment, Inc. (c) |
Software & Services | L + 525 | 1.50 | % | 5/8/2017 | 14,723 | 14,318 | (405 | ) | |||||||||||||||||
| Kronos, Inc. |
Software & Services | L + 350 | 1.00 | % | 10/30/2019 | 9,833 | 9,689 | (144 | ) | |||||||||||||||||
| Learfield Communications, Inc. |
Media | L + 350 | 1.00 | % | 10/9/2020 | 7,343 | 7,233 | (110 | ) | |||||||||||||||||
| MCS AMS Sub-Holdings, LLC (c) |
Commercial & Professional Services | L + 650 | 1.00 | % | 10/15/2019 | 12,150 | 12,000 | (150 | ) | |||||||||||||||||
61
Table of Contents
| 4. | Derivative Instruments (continued) |
| Company (a) |
Industry |
Interest Rate |
LIBOR Floor |
Maturity Date |
Notional Amount |
Fair Value | Unrealized Appreciation (Depreciation) |
|||||||||||||||||||
| MultiPlan, Inc. |
Health Care Equipment & Services |
L + 275 | 1.00 | % | 3/31/2021 | 8,351 | 8,104 | (247 | ) | |||||||||||||||||
| Neiman Marcus Group, LLC |
Retailing | L + 325 | 1.00 | % | 10/25/2020 | 8,797 | 7,835 | (962 | ) | |||||||||||||||||
| P2 Energy Solutions, Inc. (b) |
Software & Services | L + 400 | 1.00 | % | 10/30/2020 | 4,698 | 4,231 | (467 | ) | |||||||||||||||||
| RedPrairie Corp. |
Software & Services | L + 500 | 1.00 | % | 12/21/2018 | 4,838 | 4,385 | (453 | ) | |||||||||||||||||
| Riverbed Technology, Inc. |
Technology Hardware & Equipment | L + 500 | 1.00 | % | 4/24/2022 | 4,938 | 4,943 | 5 | ||||||||||||||||||
| Savers, Inc. |
Retailing | L + 375 | 1.25 | % | 7/9/2019 | 8,774 | 7,131 | (1,643 | ) | |||||||||||||||||
| Talbots, Inc. |
Retailing | L + 450 | 1.00 | % | 3/19/2020 | 8,425 | 7,979 | (446 | ) | |||||||||||||||||
| TIBCO Software, Inc. |
Software & Services | L + 550 | 1.00 | % | 12/4/2020 | 4,714 | 4,470 | (244 | ) | |||||||||||||||||
| Triple Point Technology, Inc. |
Software & Services | L + 425 | 1.00 | % | 7/10/2020 | 6,963 | 5,479 | (1,484 | ) | |||||||||||||||||
|
|
|
|
|
|
|
|||||||||||||||||||||
| Total Senior Secured Loans - First Lien |
269,945 | 256,870 | (13,075 | ) | ||||||||||||||||||||||
|
|
|
|
|
|
|
|||||||||||||||||||||
| Senior Secured Loans - Second Lien |
||||||||||||||||||||||||||
| Applied Systems, Inc. |
Software & Services | L + 650 | 1.00 | % | 1/24/2022 | 4,658 | 4,248 | (410 | ) | |||||||||||||||||
| Gypsum Management & Supply, Inc. |
Capital Goods | L + 675 | 1.00 | % | 4/1/2022 | 5,633 | 5,274 | (359 | ) | |||||||||||||||||
| Lightower Fiber, LLC |
Telecommunication Services |
L + 675 | 1.25 | % | 4/12/2021 | 7,331 | 7,261 | (70 | ) | |||||||||||||||||
| Maxim Crane, LP |
Capital Goods | L + 925 | 1.00 | % | 11/26/2018 | 9,021 | 8,688 | (333 | ) | |||||||||||||||||
| Misys, Ltd. (b) |
Software & Services | 12.00 | % | 6/12/2019 | 2,898 | 3,005 | 107 | |||||||||||||||||||
| NEP Group, Inc. |
Media | L + 875 | 1.25 | % | 7/22/2020 | 7,653 | 7,179 | (474 | ) | |||||||||||||||||
| Progressive Solutions |
Health Care Equipment & Services |
L + 850 | 1.00 | % | 10/22/2021 | 3,960 | 3,925 | (35 | ) | |||||||||||||||||
| RedPrairie Corp. |
Software & Services | L + 1000 | 1.25 | % | 12/21/2019 | 5,550 | 4,391 | (1,159 | ) | |||||||||||||||||
|
|
|
|
|
|
|
|||||||||||||||||||||
| Total Senior Secured Loans - Second Lien |
46,704 | 43,971 | (2,733 | ) | ||||||||||||||||||||||
|
|
|
|
|
|
|
|||||||||||||||||||||
| Senior Secured Bonds |
||||||||||||||||||||||||||
| Artesyn Technologies, Inc. |
Technology Hardware & Equipment | 9.75 | % | 10/15/2020 | 3,640 | 3,273 | (367 | ) | ||||||||||||||||||
| Hot Topic, Inc. |
Consumer Durables & Apparel | 9.25 | % | 6/15/2021 | 3,675 | 3,080 | (595 | ) | ||||||||||||||||||
|
|
|
|
|
|
|
|||||||||||||||||||||
| Total Senior Secured Bonds |
7,315 | 6,353 | (962 | ) | ||||||||||||||||||||||
|
|
|
|
|
|
|
|||||||||||||||||||||
| Subordinated Debt |
||||||||||||||||||||||||||
| GCI, Inc. |
Telecommunication Services |
6.75 | % | 6/1/2021 | 1,002 | 1,019 | 17 | |||||||||||||||||||
|
|
|
|
|
|
|
|||||||||||||||||||||
| Total Subordinated Debt |
1,002 | 1,019 | 17 | |||||||||||||||||||||||
|
|
|
|
|
|
|
|||||||||||||||||||||
| TOTAL |
$ | 324,966 | $ | 308,213 | $ | (16,753 | ) | |||||||||||||||||||
|
|
|
|
|
|
|
|||||||||||||||||||||
| (a) | Security may be an obligation of one or more entities affiliated with the named company. |
| (b) | The investment is not a qualifying asset as defined in Section 55(a) under the 1940 Act. |
| (c) | TRS asset position or portion thereof unsettled as of December 31, 2015. |
| (d) | Investment was on non-accrual status as of December 31, 2015. |
| 5. | Fair Value of Financial Instruments |
The Company’s investments were categorized in the fair value hierarchy described in Note 2. “Significant Accounting Policies”, as follows as of September 30, 2016 and December 31, 2015 (in thousands):
| September 30, 2016 | ||||||||||||||||
| Description |
Level 1 | Level 2 | Level 3 | Total | ||||||||||||
| Senior debt |
$ | — | $ | 792,625 | $ | 2,063,984 | $ | 2,856,609 | ||||||||
| Subordinated debt |
— | 221,931 | 353,224 | 575,155 | ||||||||||||
| Structured products |
— | — | 213,972 | 213,972 | ||||||||||||
| Equity/Other |
— | 10,239 | 380,233 | 390,472 | ||||||||||||
|
|
|
|
|
|
|
|
|
|||||||||
| Subtotal |
— | 1,024,795 | 3,011,413 | 4,036,208 | ||||||||||||
| Short term investments |
26,490 | — | — | 26,490 | ||||||||||||
|
|
|
|
|
|
|
|
|
|||||||||
| Total investments |
$ | 26,490 | $ | 1,024,795 | $ | 3,011,413 | $ | 4,062,698 | ||||||||
|
|
|
|
|
|
|
|
|
|||||||||
| Derivative Instruments |
Level 1 | Level 2 | Level 3 | Total | ||||||||||||
| Assets |
||||||||||||||||
| Cross currency swaps |
$ | — | $ | 13,620 | $ | — | $ | 13,620 | ||||||||
| Foreign currency forward contracts |
— | 939 | — | 939 | ||||||||||||
| Interest rate swaps |
— | 438 | — | 438 | ||||||||||||
| TRS |
— | — | 4,828 | 4,828 | ||||||||||||
| Liabilities |
||||||||||||||||
| Cross currency swaps |
— | (3,623 | ) | — | (3,623 | ) | ||||||||||
| Foreign currency forward contracts |
— | (957 | ) | — | (957 | ) | ||||||||||
| Interest rate swaps |
— | (7,049 | ) | — | (7,049 | ) | ||||||||||
|
|
|
|
|
|
|
|
|
|||||||||
| Total |
$ | — | $ | 3,368 | $ | 4,828 | $ | 8,196 | ||||||||
|
|
|
|
|
|
|
|
|
|||||||||
62
Table of Contents
| 5. | Fair Value of Financial Instruments (continued) |
| December 31, 2015 | ||||||||||||||||
| Description |
Level 1 | Level 2 | Level 3 | Total | ||||||||||||
| Senior debt |
$ | — | $ | 1,064,704 | $ | 1,814,254 | $ | 2,878,958 | ||||||||
| Subordinated debt |
— | 228,222 | 229,065 | 457,287 | ||||||||||||
| Structured products |
— | — | 116,208 | 116,208 | ||||||||||||
| Equity/Other |
— | 12,800 | 257,008 | 269,808 | ||||||||||||
|
|
|
|
|
|
|
|
|
|||||||||
| Subtotal |
— | 1,305,726 | 2,416,535 | 3,722,261 | ||||||||||||
| Short term investments |
7,071 | — | — | 7,071 | ||||||||||||
|
|
|
|
|
|
|
|
|
|||||||||
| Total investments |
$ | 7,071 | $ | 1,305,726 | $ | 2,416,535 | $ | 3,729,332 | ||||||||
|
|
|
|
|
|
|
|
|
|||||||||
| Derivative Instruments |
Level 1 | Level 2 | Level 3 | Total | ||||||||||||
| Assets |
||||||||||||||||
| Cross currency swaps |
$ | — | $ | 8,247 | $ | — | $ | 8,247 | ||||||||
| Foreign currency forward contracts |
— | 2,258 | — | 2,258 | ||||||||||||
| Interest rate swaps |
— | 6,021 | — | 6,021 | ||||||||||||
| Liabilities |
||||||||||||||||
| Cross currency swaps |
— | (304 | ) | — | (304 | ) | ||||||||||
| Foreign currency forward contracts |
— | (541 | ) | — | (541 | ) | ||||||||||
| TRS |
— | — | (13,562 | ) | (13,562 | ) | ||||||||||
|
|
|
|
|
|
|
|
|
|||||||||
| Total |
$ | — | $ | 15,681 | $ | (13,562 | ) | $ | 2,119 | |||||||
|
|
|
|
|
|
|
|
|
|||||||||
There were no transfers between Level 1 and Level 2 during the nine months ended September 30, 2016 and year ended December 31, 2015.
The carrying value of cash and foreign currency is classified as Level 1 with respect to the fair value hierarchy. The carrying values of the Company’s collateral on deposit with custodian, term loan and revolving credit facilities approximate their fair value and are classified as Level 2 with regards to the fair value hierarchy.
At September 30, 2016, the Company held 110 distinct investment positions classified as Level 3, representing an aggregate fair value of $3.01 billion and 74.1% of the total investment portfolio. At December 31, 2015, the Company held 93 distinct investment positions classified as Level 3, representing an aggregate fair value of $2.42 billion and 64.8% of the total investment portfolio. The ranges of unobservable inputs used in the fair value measurement of the Company’s Level 3 investments as of September 30, 2016 and December 31, 2015 were as follows ($ in thousands):
| As of September 30, 2016 | ||||||||||||
| Asset Group |
Fair Value(1)(2) | Valuation Techniques(3) |
Unobservable Inputs |
Range (Weighted Average)(4) |
Impact to | |||||||
| Senior Debt |
$ | 1,994,957 | Discounted Cash Flow | Discount Rate | 7.60% - 41.86% (11.79%) | Decrease | ||||||
| EBITDA Multiple | 3.78x - 17.88x (9.14x) | Increase | ||||||||||
| Tangible Book Value Multiple | 0.46x - 1.54x (1.30x) | Increase | ||||||||||
| Interest Rate Volatility | 25.00% (25.00%) | Decrease | ||||||||||
| 7,472 | Option Pricing Model/ Liquidation Analysis | EBITDA Multiple | 4.62x (4.62x) | Increase | ||||||||
| Implied Volatility | 30.00% (30.00%) | Increase | ||||||||||
| Risk Free Rate | 0.04% (0.04%) | Increase | ||||||||||
| Yield | 0.00% (0.00%) | Decrease | ||||||||||
| Term | 0.38 years (0.38 years) | Increase | ||||||||||
| Expected Recovery Given Liquidation | 13.70% (13.70%) | Increase | ||||||||||
63
Table of Contents
| 5. | Fair Value of Financial Instruments (continued) |
| As of September 30, 2016 | ||||||||||||
| Asset Group |
Fair Value(1)(2) | Valuation Techniques(3) |
Unobservable Inputs |
Range (Weighted Average)(4) |
Impact to | |||||||
| 4,624 | Option Pricing Model/ Quote/ Liquidation Analysis | EBITDA Multiple | 8.42x (8.42x) | Increase | ||||||||
| Implied Volatility | 24.40% (24.40%) | Increase | ||||||||||
| Risk Free Rate | 0.73% (0.73%) | Increase | ||||||||||
| Yield | 0.00% (0.00%) | Decrease | ||||||||||
| Term | 1.60 years (1.60 years) | Increase | ||||||||||
| Quote | 6.15% (6.15%) | Increase | ||||||||||
| Expected Recovery Given Liquidation | 0.00% (0.00%) | Increase | ||||||||||
| 27,338 | Liquidation Analysis | Expected Recovery Given Liquidation | 9.27% - 46.75% (44.06%) | Increase | ||||||||
| 29,593 | Waterfall | EBITDA Multiple | 6.07x (6.07x) | Increase | ||||||||
| Subordinated Debt |
349,367 | Discounted Cash Flow | Discount Rate | 10.03% -18.61% (14.09%) | Decrease | |||||||
| EBITDA Multiple | 8.11x – 11.73x (9.47x) | Increase | ||||||||||
| Interest Rate Volatility | 25.00% (25.00%) | Decrease | ||||||||||
| 3,857 | Option Pricing Model | EBITDA Multiple | 8.11x (8.11x) | Increase | ||||||||
| Implied Volatility | 30.00% (30.00%) | Increase | ||||||||||
| Risk Free Rate | 0.95% (0.95%) | Increase | ||||||||||
| Yield | 0.00% (0.00%) | Decrease | ||||||||||
| Term | 3.25 years (3.25 years) | Increase | ||||||||||
| Structured Products |
206,136 | Discounted Cash Flow | Discounted Rate | 10.78% -14.12% (11.73%) | Decrease | |||||||
| 7,836 | Book Value | Book Value Multiple | 1.00x (1.00x) | Increase | ||||||||
| Equity/Other |
23,365 | Waterfall | Asset Appraisals | N/A | Increase | |||||||
| 1,235 | Discounted Cash Flow | Discount Rate | 11.70% -12.20% (12.20%) | Decrease | ||||||||
| 192,868 | Net Asset Value | Net Asset Value | N/A | Increase | ||||||||
| 43,921 | Market Comparables | EBITDA Multiple | 4.62x - 15.50x (9.04x) | Increase | ||||||||
| Revenue Multiple | 0.25x - 2.54x (1.95x) | Increase | ||||||||||
| Additional Discounts | 0.00% - 32.50% (10.27%) | Decrease | ||||||||||
| 118,844 | Option Pricing Model | EBITDA Multiple | 4.62x - 8.11x (5.24x) | Increase | ||||||||
| Implied Volatility | 19.10% - 37.50% (20.43%) | Increase | ||||||||||
| Risk Free Rate | 0.00% - 0.95% (0.74%) | Increase | ||||||||||
| Yield | 0.00% - 0.00% (0.00%) | Decrease | ||||||||||
| Term | 0.38 years - 3.25 years (1.98 years) | Increase | ||||||||||
| Additional Discounts | 0.00% - 15.00% (10.00%) | Decrease | ||||||||||
|
|
|
|||||||||||
| Total |
$ | 3,011,413 | ||||||||||
|
|
|
|||||||||||
64
Table of Contents
| 5. | Fair Value of Financial Instruments (continued) |
| As of December 31, 2015 | ||||||||||||
| Asset Group |
Fair Value(1)(2) | Valuation Techniques(3) |
Unobservable Inputs |
Range (Weighted Average)(4) |
Impact to | |||||||
| Senior Debt |
$ | 1,795,749 | Discounted Cash Flow | Discount Rate | 8.11% - 21.34% (11.99%) | Decrease | ||||||
| Market Yield | 6.25% - 19.32% (9.56%) | Decrease | ||||||||||
| Yield Premium | 0.00% - 6.50% (2.35%) | Decrease | ||||||||||
| Weighted Average Cost of Capital | 6.40% - 19.70% (10.53%) | Decrease | ||||||||||
| EBITDA Multiple | 3.90x - 11.61x (8.21x) | Increase | ||||||||||
| Tangible Book Value Multiple | 1.30x - 1.40x (1.35x) | Increase | ||||||||||
| Interest Rate Volatility | 25.00% (25.00%) | Decrease | ||||||||||
| 9,353 | Option Pricing Model/ Liquidation Analysis | EBITDA Multiple | 6.26x (6.26x) | Increase | ||||||||
| Implied Volatility | 30.00% (30.00%) | Increase | ||||||||||
| Risk Free Rate | 0.33% (0.33%) | Increase | ||||||||||
| Yield | 0.00% (0.00%) | Decrease | ||||||||||
| Term | 0.38 years (0.38 years) | Increase | ||||||||||
| Illiquidity Discounts | 0.00% - 15.00% (7.50%) | Decrease | ||||||||||
| Expected Recovery Given Liquidation | 18.07% (18.07%) | Increase | ||||||||||
| 6,273 | Discounted Cash Flow/Quote/ Liquidation Analysis | Discount Rate | 146.51% (146.51%) | Increase | ||||||||
| Quote | 14.50% (14.50%) | Increase | ||||||||||
| Expected Recovery Given Liquidation | 0.00% (0.00%) | Increase | ||||||||||
| 2,879 | Liquidation Analysis | Expected Recovery Given Liquidation | 13.80% (13.80%) | Increase | ||||||||
| Subordinated Debt |
227,576 | Discounted Cash Flow | Discount Rate | 11.31% - 21.51% (15.12%) | Decrease | |||||||
| Market Yield | 7.21% - 19.53% (10.11%) | Decrease | ||||||||||
| Yield Premium | 0.00% - 4.25% (4.20%) | Decrease | ||||||||||
| Weighted Average Cost of Capital | 10.15% - 19.50% (14.69%) | Decrease | ||||||||||
| EBITDA Multiple | 6.42x - 22.99x (11.54x) | Increase | ||||||||||
| Interest Rate Volatility | 25.00% (25.00%) | Decrease | ||||||||||
| 1,489 | Option Pricing Model | EBITDA Multiple | 9.27x (9.27x) | Increase | ||||||||
| Implied Volatility | 20.00% (20.00%) | Increase | ||||||||||
| Risk Free Rate | 1.24% (1.24%) | Increase | ||||||||||
| Yield | 0.00% (0.00%) | Decrease | ||||||||||
| Term | 3.00 years (3.00 years) | Increase | ||||||||||
| Structured Products |
109,083 | Discounted Cash Flow | Discounted Rate | 11.22% - 17.38% (15.41%) | Decrease | |||||||
| 7,125 | Book Value | Book Value | 1.00x (1.00x) | Increase | ||||||||
65
Table of Contents
| 5. | Fair Value of Financial Instruments (continued) |
| As of December 31, 2015 | ||||||||||||
| Asset Group |
Fair Value(1)(2) | Valuation Techniques(3) |
Unobservable Inputs |
Range (Weighted Average)(4) |
Impact to | |||||||
| Equity/Other |
115,060 | Waterfall | Asset Appraisals | N/A | Increase | |||||||
| Change in Market Index | 3.93% (3.93%) | Increase | ||||||||||
| Additional Discounts | 3.00% (3.00%) | Decrease | ||||||||||
| 1,127 | Discounted Cash Flow | Discount Rate | 11.60% - 12.60% (12.60%) | Decrease | ||||||||
| 76,807 | Net Asset Value | Net Asset Value | N/A | Increase | ||||||||
| 52,295 | Market Comparables | EBITDA Multiple | 5.29x -12.52x (9.37x) | Increase | ||||||||
| Revenue Multiple | 0.24x - 2.24x (1.87x) | Increase | ||||||||||
| Illiquidity Discounts | 0.00% - 15.00% (7.86%) | Decrease | ||||||||||
| 11,719 | Option Pricing Model | EBITDA Multiple | 5.37x - 11.16x (6.53x) | Increase | ||||||||
| Implied Volatility | 20.00% - 37.50% (33.52%) | Increase | ||||||||||
| Risk Free Rate | 0.00% - 1.24% (0.25%) | Increase | ||||||||||
| Yield | 0.00% - 0.00% (0.00%) | Decrease | ||||||||||
| Term | 0.75 years - 3.00 years (2.60 years) | Increase | ||||||||||
| Illiquidity Discounts | 0.00% - 15.00% (10.03%) | Decrease | ||||||||||
| Total |
$ | 2,416,535 | ||||||||||
|
|
|
|||||||||||
| (1) | The TRS was valued in accordance with the TRS agreements as discussed in Note 2. “Significant Accounting Policies.” See Note 4. “Derivative Instruments” for quantitative disclosures of the fair value of the TRS. |
| (2) | Certain investments may be valued at cost for a period of time after an acquisition as the best indicator of fair value. |
| (3) | For the assets and investments that have more than one valuation technique, the Company may rely on the stated techniques individually or in the aggregate based on a weight ascribed to each valuation technique, ranging from 0 – 100%. Indicative broker quotes obtained for valuation purposes are reviewed by the Company relative to other valuation techniques. |
| (4) | Weighted average amounts are based on the estimated fair values. |
| (5) | This column represents the directional change in the fair value of the Level 3 investments that would result from an increase to the corresponding unobservable input. A decrease to the input would have the opposite effect. Significant changes in these inputs in isolation could result in significantly higher or lower fair value measurements. |
The above tables represent the significant unobservable inputs as they relate to the Company’s determination of fair values for the majority of its investments categorized within Level 3 as of September 30, 2016 and December 31, 2015. In addition to the techniques and inputs noted in the tables above, according to the Company’s valuation policy, it may also use other valuation techniques and methodologies when determining the fair value estimates for the Company’s investments. Any significant increases or decreases in the unobservable inputs would result in significant increases or decreases in the fair value of the Company’s investments.
Investments that do not have a readily available market value are valued utilizing a market approach, an income approach (i.e. discounted cash flow approach), or both approaches, as appropriate. The market comparables approach uses prices, including third-party indicative broker quotes, and other relevant information generated by market transactions involving identical or comparable assets or liabilities (including a business). The income approach uses valuation techniques to convert future amounts (for example, cash flows or earnings) that are discounted based on a required or expected discount rate to derive a single present value amount. The measurement is based on the value indicated by current market expectations about those future amounts. In following these approaches, the types of factors the Company may take into account to determine the fair value of its investments include, as relevant: available current market data, including an assessment of the credit quality of the security’s issuer, relevant and applicable market trading and transaction comparables, applicable market yields and multiples, illiquidity discounts, security covenants, call protection provisions, information rights, the nature and realizable value of any collateral, the portfolio company’s ability to make payments, its earnings and cash flows, the markets in which the portfolio company does business, comparisons of financial ratios of peer companies that are public, data derived from merger and acquisition activities for comparable companies, and enterprise values, among other factors.
66
Table of Contents
| 5. | Fair Value of Financial Instruments (continued) |
The following tables provide reconciliations for the three and nine months ended September 30, 2016 of investments for which Level 3 inputs were used in determining fair value (in thousands):
| Three Months Ended September 30, 2016 | ||||||||||||||||||||||||
| Senior Debt |
Subordinated Debt |
Structured Products |
Equity/ Other |
Total Return Swaps |
Total | |||||||||||||||||||
| Fair value balance as of July 1, 2016 |
$ | 1,951,828 | $ | 347,025 | $ | 184,510 | $ | 255,242 | $ | (4,052 | ) | $ | 2,734,553 | |||||||||||
| Additions (1) |
274,608 | 432 | 39,315 | 138,260 | — | 452,615 | ||||||||||||||||||
| Net realized gains (losses) (2) |
605 | — | — | 205 | 3,197 | 4,007 | ||||||||||||||||||
| Net change in unrealized appreciation (depreciation) (3) |
(6,276 | ) | 7,975 | (8,932 | ) | 12,628 | 8,880 | 14,275 | ||||||||||||||||
| Sales or repayments (4) |
(158,215 | ) | (2,628 | ) | (1,787 | ) | (26,102 | ) | (3,197 | ) | (191,929 | ) | ||||||||||||
| Net discount accretion |
1,434 | 420 | 866 | — | — | 2,720 | ||||||||||||||||||
|
|
|
|
|
|
|
|
|
|
|
|
|
|||||||||||||
| Fair value balance as of September 30, 2016 |
$ | 2,063,984 | $ | 353,224 | $ | 213,972 | $ | 380,233 | $ | 4,828 | $ | 3,016,241 | ||||||||||||
|
|
|
|
|
|
|
|
|
|
|
|
|
|||||||||||||
| Change in net unrealized appreciation (depreciation) in investments still held as of September 30, 2016 (3) |
$ | (7,255 | ) | $ | 7,943 | $ | (8,602 | ) | $ | 12,892 | $ | 8,880 | $ | 13,858 | ||||||||||
|
|
|
|
|
|
|
|
|
|
|
|
|
|||||||||||||
| Nine Months Ended September 30, 2016 | ||||||||||||||||||||||||
| Senior Debt |
Subordinated Debt |
Structured Products |
Equity/ Other |
Total Return Swaps |
Total | |||||||||||||||||||
| Fair value balance as of January 1, 2016 |
$ | 1,814,254 | $ | 229,065 | $ | 116,208 | $ | 257,008 | $ | (13,562 | ) | $ | 2,402,973 | |||||||||||
| Additions (1) |
554,920 | 140,120 | 113,870 | 206,833 | — | 1,015,743 | ||||||||||||||||||
| Net realized gains (losses) (2) |
(18,189 | ) | (3,794 | ) | — | 5,175 | 8,896 | (7,912 | ) | |||||||||||||||
| Net change in unrealized appreciation (depreciation) (3) |
(2,427 | ) | 19,687 | (14,043 | ) | (25,924 | ) | 18,390 | (4,317 | ) | ||||||||||||||
| Sales or repayments (4) |
(319,271 | ) | (32,939 | ) | (2,929 | ) | (62,859 | ) | (8,896 | ) | (426,894 | ) | ||||||||||||
| Net discount accretion |
3,999 | 1,085 | 866 | — | — | 5,950 | ||||||||||||||||||
| Transfers into Level 3 |
30,698 | — | — | — | — | 30,698 | ||||||||||||||||||
|
|
|
|
|
|
|
|
|
|
|
|
|
|||||||||||||
| Fair value balance as of September 30, 2016 |
$ | 2,063,984 | $ | 353,224 | $ | 213,972 | $ | 380,233 | $ | 4,828 | $ | 3,016,241 | ||||||||||||
|
|
|
|
|
|
|
|
|
|
|
|
|
|||||||||||||
| Change in net unrealized appreciation (depreciation) in investments still held as of September 30, 2016 (3) |
$ | (25,090 | ) | $ | 14,629 | $ | (13,506 | ) | $ | (13,373 | ) | $ | 18,390 | $ | (18,950 | ) | ||||||||
|
|
|
|
|
|
|
|
|
|
|
|
|
|||||||||||||
| (1) | Includes increases in the cost basis of investments resulting from new and add-on portfolio investments or the capitalization of PIK interest. |
| (2) | Included in net realized gains (losses) in the condensed consolidated statements of operations. |
| (3) | Included in net change in unrealized appreciation (depreciation) in the condensed consolidated statements of operations. |
| (4) | Includes principal payments/paydowns on debt investments, collection of PIK interest, TRS settlement payments, proceeds from sales of investments and distributions received on equity investments classified as return of capital. |
67
Table of Contents
| 5. | Fair Value of Financial Instruments (continued) |
The following tables provide reconciliations for the three and nine months ended September 30, 2015 of investments for which Level 3 inputs were used in determining fair value (in thousands):
| Three Months Ended September 30, 2015 | ||||||||||||||||||||||||
| Senior Debt |
Subordinated Debt |
Structured Products |
Equity/ Other |
Total Return Swaps |
Total | |||||||||||||||||||
| Fair Value Balance as of July 1, 2015 |
$ | 1,241,057 | $ | 157,475 | $ | 92,596 | $ | 240,189 | $ | 1,189 | $ | 1,732,506 | ||||||||||||
| Additions (1) |
190,089 | 87,442 | — | 72,646 | — | 350,177 | ||||||||||||||||||
| Net realized gains (losses) (2) |
(5,244 | ) | — | — | 812 | 4,090 | (342 | ) | ||||||||||||||||
| Net change in unrealized appreciation (depreciation) (3) |
(42,258 | ) | (12,392 | ) | (927 | ) | (12,522 | ) | (3,636 | ) | (71,735 | ) | ||||||||||||
| Sales or repayments (4) |
(30,450 | ) | — | — | (5,098 | ) | (4,090 | ) | (39,638 | ) | ||||||||||||||
| Net discount accretion |
998 | 284 | — | — | — | 1,282 | ||||||||||||||||||
|
|
|
|
|
|
|
|
|
|
|
|
|
|||||||||||||
| Fair Value Balance as of September 30, 2015 |
$ | 1,354,192 | $ | 232,809 | $ | 91,669 | $ | 296,027 | $ | (2,447 | ) | $ | 1,972,250 | |||||||||||
|
|
|
|
|
|
|
|
|
|
|
|
|
|||||||||||||
| Change in net unrealized appreciation (depreciation) in investments still held as of September 30, 2015 (3) |
$ | (50,059 | ) | $ | (12,392 | ) | $ | (927 | ) | $ | (12,522 | ) | $ | (3,636 | ) | $ | (79,536 | ) | ||||||
|
|
|
|
|
|
|
|
|
|
|
|
|
|||||||||||||
| Nine Months Ended September 30, 2015 | ||||||||||||||||||||||||
| Senior Debt |
Subordinated Debt |
Structured Products |
Equity/ Other |
Total Return Swaps |
Total | |||||||||||||||||||
| Fair Value Balance as of January 1, 2015 |
$ | 1,143,744 | $ | 196,859 | $ | 36,421 | $ | 125,308 | $ | (3,445 | ) | $ | 1,498,887 | |||||||||||
| Additions (1) |
386,372 | 123,133 | 52,000 | 204,120 | — | 765,625 | ||||||||||||||||||
| Net realized gains (losses) (2) |
(4,971 | ) | 1,154 | — | 6,516 | 9,603 | 12,302 | |||||||||||||||||
| Net change in unrealized appreciation (depreciation) (3) |
(73,826 | ) | (28,915 | ) | 3,248 | (23,606 | ) | 998 | (122,101 | ) | ||||||||||||||
| Sales or repayments (4) |
(99,990 | ) | (60,368 | ) | — | (16,311 | ) | (9,603 | ) | (186,272 | ) | |||||||||||||
| Net discount accretion |
2,863 | 946 | — | — | — | 3,809 | ||||||||||||||||||
|
|
|
|
|
|
|
|
|
|
|
|
|
|||||||||||||
| Fair Value Balance as of September 30, 2015 |
$ | 1,354,192 | $ | 232,809 | $ | 91,669 | $ | 296,027 | $ | (2,447 | ) | $ | 1,972,250 | |||||||||||
|
|
|
|
|
|
|
|
|
|
|
|
|
|||||||||||||
| Change in net unrealized appreciation (depreciation) in investments still held as of September 30, 2015 (3) |
$ | (75,927 | ) | $ | (28,619 | ) | $ | 5,846 | $ | (23,606 | ) | $ | 998 | $ | (121,308 | ) | ||||||||
|
|
|
|
|
|
|
|
|
|
|
|
|
|||||||||||||
| (1) | Includes increases in the cost basis of investments resulting from new and add-on portfolio investments or the capitalization of PIK interest. |
| (2) | Included in net realized gains (losses) in the condensed consolidated statements of operations. |
| (3) | Included in net change in unrealized appreciation (depreciation) in the condensed consolidated statements of operations. |
| (4) | Includes principal payments/paydowns on debt investments, collection of PIK interest, TRS settlement payments, proceeds from sales of investments and distributions received on equity investments classified as return of capital. |
Two securities were transferred into the Level 3 hierarchy and no securities were transferred out of the Level 3 hierarchy during the nine months ended September 30, 2016. No securities were transferred into or out of the Level 3 hierarchy during the nine months ended September 30, 2015. These investments were transferred at fair value as of the beginning of the quarter in which they were transferred. The classification transfers between Level 3 and Level 2 were based on the observed changes in liquidity based on information supplied by a third party pricing source, whereby such liquidity information is routinely reviewed no less frequently than monthly. All realized and unrealized gains and losses are included in earnings and are reported as separate line items within the Company’s condensed consolidated statements of operations.
68
Table of Contents
| 6. | Related Party Transactions |
CNL, certain CNL affiliates, and KKR receive compensation or reimbursement for advisory services and other services in connection with (i) the performance and supervision of administrative services, (ii) investment advisory activities and (iii) the Company’s Offerings.
CNL Securities Corp., an affiliate of CNL, serves as the managing dealer of the Company’s Offerings and in connection therewith receives selling commissions and marketing support fees. Prior to the closing of the Company’s Follow-On Offering to investors investing through the independent broker-dealer channel, sales of shares were subject to a sales load of up to 10% of the offering price, which included up to 7% of the offering price for sales commissions, and up to 3% of the offering price for marketing support fees. After the closing of the Company’s Follow-On Offering to investors investing through the independent broker-dealer channel, no sales commissions or marketing support fees were charged on purchases of shares of its common stock.
The Company is a party to an investment advisory agreement with CNL, as amended (the “Investment Advisory Agreement”) for the overall management of the Company’s investment activities. The Company and CNL have entered into a sub-advisory agreement with KKR (the “Sub-Advisory Agreement”), under which KKR is responsible for the day-to-day management of the Company’s investment portfolio. CNL compensates KKR for advisory services that it provides to the Company with 50% of the base management fees and performance-based incentive fees that CNL receives under the Investment Advisory Agreement. CNL earns a base management fee (referred to as an investment advisory fee) equal to an annual rate of 2% of the Company’s average gross assets as of the end of the two most recently completed months, computed and paid monthly. The computation of gross assets includes unrealized depreciation, appreciation and collateral posted with the custodian in connection with the TRS, and excludes deferred offering expenses. From and after April 1, 2016, the computation of gross assets also excludes cash and short-term investments.
CNL also earns performance-based incentive fees comprised of a subordinated incentive fee on income and an incentive fee on capital gains. The subordinated incentive fee on pre-incentive fee net investment income (as defined in the Investment Advisory Agreement) is paid quarterly if earned, and is computed as the sum of (A) 100% of quarterly pre-incentive fee net investment income in excess of 1.75% of average adjusted capital up to a limit of 0.4375% of average adjusted capital, and (B) 20% of pre-incentive fee net investment income in excess of 2.1875% of average adjusted capital.
The incentive fee on capital gains is paid annually if earned, and is equal to (A) 20% of all realized gains on a cumulative basis from inception, net of (1) all realized losses on a cumulative basis, (2) unrealized depreciation at year end and (3) disregarding any net realized gains associated with the TRS interest spread (which represents the difference between (a) the interest and fees received on the TRS, and (b) the financing fees paid to the TRS Counterparty), less (B) the aggregate amount of any previously paid incentive fee on capital gains.
The terms of the Investment Advisory Agreement entitle CNL (and indirectly KKR) to receive up to 5% of gross proceeds in connection with the Offerings as reimbursement for organization and offering expenses incurred by the Advisors on behalf of the Company. During the nine months ended September 30, 2016, the Company recorded $0.76 million in deferred offering expenses related to the Follow-On Offering, or 0.6% of gross offering proceeds of the Follow-On Offering for the same period.
In addition, under the terms of the Investment Advisory Agreement, the Advisors are entitled to reimbursement of certain expenses incurred on behalf of the Company including expenses incurred in connection with its investment operations and investment transactions.
The Company is a party to an administrative services agreement with CNL (the “Administrative Services Agreement”) whereby CNL performs, and oversees the performance of, various administrative services on behalf of the Company. Administrative services may include transfer agency oversight and supervisory services, shareholder communication services, general ledger accounting services, calculating the Company’s net asset value, maintaining required corporate and financial records, financial reporting for the Company and its subsidiaries, internal audit services, reporting to the Company’s board of directors and lenders, preparing and filing income tax returns, preparing and filing SEC reports, preparing, printing and disseminating shareholder reports, overseeing the payment of the Company’s expenses and shareholder distributions, administering the Company’s share repurchase program, and management and oversight of service providers in their performance of administrative and professional services rendered for the Company. CNL may also enter into agreements with its affiliates for the performance of select administrative services. The Company reimburses CNL for the professional services and expenses it incurs in performing its administrative obligations on behalf of the Company.
69
Table of Contents
| 6. | Related Party Transactions (continued) |
Related party fees, expenses and expenses incurred on behalf of the Company during the three and nine months ended September 30, 2016 and 2015 are summarized below (in thousands):
| Three Months Ended September 30, |
Nine Months Ended September 30, |
|||||||||||||||||
| Related Party |
Source Agreement & Description |
2016 | 2015 | 2016 | 2015 | |||||||||||||
| CNL Securities Corp. |
Managing Dealer Agreement: Selling commissions and marketing support fees |
$ | — | $ | 14,328 | $ | 9,649 | $ | 46,798 | |||||||||
| CNL and KKR |
Investment Advisory Agreement: Base management fees (investment advisory fees) |
21,441 | 18,867 | 61,109 | 51,004 | |||||||||||||
| CNL and KKR |
Investment Advisory Agreement: Subordinated incentive fee on income(1) |
5,816 | — | 19,218 | 7,983 | |||||||||||||
| CNL and KKR |
Investment Advisory Agreement: Offering expenses reimbursement(2) |
88 | 1,092 | 760 | 2,794 | |||||||||||||
| KKR |
Investment Sub-Advisory Agreement: Investment expenses reimbursement |
430 | 360 | 839 | 995 | |||||||||||||
| CNL |
Administrative Services Agreement: Administrative and compliance services |
500 | 432 | 1,558 | 1,108 | |||||||||||||
| (1) | Subordinated incentive fees on income are included in performance-based incentive fees in the condensed consolidated statements of operations. During the nine months ended September 30, 2016 and 2015, $14.15 and $13.09 million, respectively, of subordinated incentive fees on income were paid to the Advisors. |
| (2) | The following table provides additional details for the organization and offering expenses reimbursement (in thousands): |
| Offering Expenses Reimbursement for the Nine Months Ended September 30, |
2016 | 2015 | ||||||
| Offering expenses reimbursement payable as of January 1, |
$ | 210 | $ | 272 | ||||
| Additional offering expenses deferred during the nine months ended September 30, |
760 | 2,794 | ||||||
| Offering expenses reimbursement payable as of September 30, |
(45 | ) | (517 | ) | ||||
|
|
|
|
|
|||||
| Offering expenses reimbursement paid to the Advisors during the nine months ended September 30, |
$ | 925 | $ | 2,549 | ||||
|
|
|
|
|
|||||
| Outstanding unreimbursed offering expenses (net of amounts payable) as of September 30, |
$ | — | $ | 41 | ||||
|
|
|
|
|
|||||
During the nine months ended September 30, 2016 and 2015, there were no incentive fees on capital gains earned by the Advisors.
KKR is obligated to remit to the Company any earned capital structuring fees based on the Company’s pro-rata portion of the co-investment transactions or originated investments in which the Company participates. As a result, the Company earned capital structuring fees of $3.23 million and $5.08 million during the three and nine months ended September 30, 2016, respectively, and $1.03 million and $3.69 million during the three and nine months ended September 30, 2015, respectively. As of September 30, 2016 and December 31, 2015, $0.17 million and $0.18 million, respectively, of capital structuring fees were receivable from the Advisors.
Indemnification – The Investment Advisory Agreement and the Sub-Advisory Agreement provide certain indemnification in favor of the Advisors, their directors, officers, persons associated with the Advisors, and their affiliates. The managing dealer agreement contains certain indemnification provisions in favor of the managing dealer and each participating broker and their respective officers, directors, partners, employees, associated persons, agents and control persons. In addition, the Company’s articles of incorporation contains certain indemnification in favor of the Company’s officers, directors, agents, and certain other persons. As of September 30, 2016, management believed that the risk of incurring any losses for such indemnification was remote.
70
Table of Contents
| 7. | Fee Income |
Fee income, which is nonrecurring, consisted of the following (in thousands):
| Three Months Ended September 30, | Nine Months Ended September 30, | |||||||||||||||
| Fee Income |
2016 | 2015 | 2016 | 2015 | ||||||||||||
| Capital structuring fees |
$ | 3,227 | $ | 1,029 | $ | 5,080 | $ | 3,691 | ||||||||
| Amendment fees |
763 | 571 | 1,743 | 9,355 | ||||||||||||
| Acquisition fees |
— | 500 | — | 500 | ||||||||||||
| Commitment fees |
953 | 439 | 1,223 | 477 | ||||||||||||
| Other |
13 | — | 153 | — | ||||||||||||
|
|
|
|
|
|
|
|
|
|||||||||
| Total |
$ | 4,956 | $ | 2,539 | $ | 8,199 | $ | 14,023 | ||||||||
|
|
|
|
|
|
|
|
|
|||||||||
| 8. | Distributions |
The Company’s board of directors declared distributions for 39 record dates in each of the nine months ended September 30, 2016 and 2015, respectively. Declared distributions are paid monthly. The total and the sources of declared distributions on a GAAP basis for the nine months ended September 30, 2016 and 2015 are presented in the tables below (in thousands, except per share amounts).
| Nine Months Ended September 30, | ||||||||||||||||||||||||
| 2016 | 2015 | |||||||||||||||||||||||
| Per Share | Amount | Allocation | Per Share | Amount | Allocation | |||||||||||||||||||
| Total Declared Distributions |
$ | 0.60 | $ | 182,976 | 100.0 | % | $ | 0.60 | $ | 148,719 | 100.0 | % | ||||||||||||
| From net investment income |
0.52 | 156,736 | 85.7 | 0.52 | 127,578 | 85.8 | ||||||||||||||||||
| From net realized gains |
— | — | — | 0.08 | 21,141 | 14.2 | ||||||||||||||||||
| Distributions in excess of net investment income |
0.08 | 26,240 | 14.3 | — | — | — | ||||||||||||||||||
Sources of distributions, other than net investment income and realized gains on a GAAP basis, include (i) the ordinary income component of prior year tax basis undistributed earnings and (ii) required adjustments to GAAP net investment income and realized gains in the current period to determine taxable income available for distributions. The following table summarizes the primary sources of differences between (i) GAAP net investment income and realized gains and (ii) taxable income available for distributions that contribute to tax-related distributions in excess of net investment income for the nine months ended September 30, 2016 and 2015 (in thousands).
| Nine Months Ended September 30, |
2016 | 2015 | ||||||
| Ordinary income component of tax basis undistributed earnings |
$ | 67,198 | $ | 56,222 | ||||
| Offering expenses |
1,846 | 3,598 | ||||||
| Net change in unrealized depreciation on foreign currency forward contracts |
(1,735 | ) | (40,059 | ) | ||||
| Net change in unrealized appreciation on total return swaps |
18,390 | 998 | ||||||
|
|
|
|
|
|||||
| Total (1) |
$ | 85,699 | $ | 20,759 | ||||
|
|
|
|
|
|||||
| (1) | The above table does not present all adjustments to calculate taxable income available for distributions. |
For the nine months ended September 30, 2016, the tax-related sources of distributions of $85.70 million were greater than the distributions in excess of net investment income of $26.24 million. As a result, the Company estimates that none of the distributions declared during the nine months ended September 30, 2016 would be classified as a tax basis return of capital. None of the distributions declared during the year ended December 31, 2015 were classified as a tax basis return of capital.
On September 26, 2016, the Company’s board of directors declared distributions of $0.015483 per share for four record dates beginning on October 4, 2016 through and including October 25, 2016.
71
Table of Contents
| 9. | Share Transactions |
The following table summarizes the total shares issued and proceeds received in connection with the Company’s Offerings for the nine months ended September 30, 2016 and 2015 ($ in thousands except share and per share amounts).
| Nine Months Ended September 30, | ||||||||||||||||
| 2016 | 2015 | |||||||||||||||
| Shares | Amount | Shares | Amount | |||||||||||||
| Gross proceeds from offering |
13,434,421 | $ | 129,186 | 47,926,637 | $ | 519,048 | ||||||||||
| Commissions and marketing support fees |
— | (9,649 | ) | — | (46,798 | ) | ||||||||||
|
|
|
|
|
|
|
|
|
|||||||||
| Net proceeds to company |
13,434,421 | 119,537 | 47,926,637 | 472,250 | ||||||||||||
| Reinvestment of distributions |
10,428,645 | 93,033 | 7,798,343 | 76,446 | ||||||||||||
|
|
|
|
|
|
|
|
|
|||||||||
| Net proceeds from offering |
23,863,066 | $ | 212,570 | 55,724,980 | $ | 548,696 | ||||||||||
|
|
|
|
|
|
|
|
|
|||||||||
| Average net proceeds per share |
$8.91 | $9.85 | ||||||||||||||
As of September 30, 2016, the Company has sold or issued 320.01 million shares of common stock through the Offerings, including reinvestment of distributions, for total gross proceeds of $3.43 billion.
The Company conducts quarterly tender offers pursuant to its share repurchase program. The Company currently limits the number of shares to be repurchased during any calendar year to the number of shares it can repurchase with the proceeds it receives from the issuance of shares of its common stock under its distribution reinvestment plan. At the discretion of the Company’s board of directors, the Company may also use cash on hand, cash available from borrowings and cash from the sale of investments as of the end of the applicable period to repurchase shares. The Company limits repurchases in each quarter to 2.5% of the weighted average number of shares of common stock outstanding in the prior four calendar quarters. The Company’s board of directors may amend, suspend or terminate the share repurchase program upon 30 days’ notice.
The following table is a summary of the share repurchases completed during the nine months ended September 30, 2016 and 2015 ($ in thousands, except share and per share amounts):
| Repurchase Date |
Total Number of Shares Offered to Repurchase |
Total Number of Shares Repurchased |
Total Consideration |
No. of Shares Repurchased/ Total Offer |
Price Paid Per Share |
|||||||||||||||
| 2016: |
||||||||||||||||||||
| January 13, 2016 |
6,371,100 | 1,827,053 | $ | 16,297 | 29 | % | $ | 8.92 | ||||||||||||
| May 31, 2016 |
6,807,080 | 1,682,526 | 14,486 | 25 | % | $ | 8.61 | |||||||||||||
| August 29, 2016 |
7,166,150 | 3,475,590 | 30,620 | 49 | % | $ | 8.81 | |||||||||||||
|
|
|
|
|
|
|
|||||||||||||||
| Total |
20,344,330 | 6,985,169 | $ | 61,403 | 34 | % | ||||||||||||||
|
|
|
|
|
|
|
|||||||||||||||
| Repurchase Date |
Total Number of Shares Offered to Repurchase |
Total Number of Shares Repurchased |
Total Consideration |
No. of Shares Repurchased/ Total Offer |
Price Paid Per Share |
|||||||||||||||
| 2015: |
||||||||||||||||||||
| March 2, 2015 |
4,435,072 | 555,174 | $ | 5,452 | 13 | % | $ | 9.82 | ||||||||||||
| May 29, 2015 |
4,919,566 | 501,943 | 4,889 | 10 | % | $ | 9.74 | |||||||||||||
| August 28, 2015 |
5,424,683 | 1,093,421 | 10,573 | 20 | % | $ | 9.67 | |||||||||||||
|
|
|
|
|
|
|
|||||||||||||||
| Total |
14,779,321 | 2,150,538 | $ | 20,914 | 15 | % | ||||||||||||||
|
|
|
|
|
|
|
|||||||||||||||
72
Table of Contents
| 10. | Borrowings |
The Company’s outstanding borrowings as of September 30, 2016 and December 31, 2015 were as follows (in thousands):
| As of September 30, 2016 | As of December 31, 2015 | |||||||||||||||||||||||
| Total Aggregate Principal Amount Committed |
Principal Amount Outstanding |
Carrying Value |
Total Aggregate Principal Amount Committed |
Principal Amount Outstanding |
Carrying Value |
|||||||||||||||||||
| Senior Secured Revolving Credit Facility(1) |
$ | 928,000 | (2) | $ | 636,346 | (3) | $ | 636,346 | $ | 700,000 | (2) | $ | 632,980 | (3) | $ | 632,980 | ||||||||
| Deutsche Bank Credit Facility(1) |
175,000 | 167,000 | 167,000 | 250,000 | 210,000 | 210,000 | ||||||||||||||||||
| BNP Credit Facility(1) |
200,000 | 138,000 | 138,000 | 200,000 | 188,000 | 188,000 | ||||||||||||||||||
| SMBC Credit Facility(1) |
200,000 | 104,750 | 104,750 | 200,000 | — | — | ||||||||||||||||||
|
|
|
|
|
|
|
|
|
|
|
|
|
|||||||||||||
| Total credit facilities |
1,503,000 | 1,046,096 | 1,046,096 | 1,350,000 | 1,030,980 | 1,030,980 | ||||||||||||||||||
| 2014 Senior Secured Term Loan |
390,000 | 390,000 | 385,815 | (4) | 393,000 | 393,000 | 387,677 | (4) | ||||||||||||||||
| CS Facility(5) |
25,029 | 25,029 | 25,029 | — | — | — | ||||||||||||||||||
|
|
|
|
|
|
|
|
|
|
|
|
|
|||||||||||||
| Total borrowings |
$ | 1,918,029 | $ | 1,461,125 | $ | 1,456,940 | $ | 1,743,000 | $ | 1,423,980 | $ | 1,418,657 | ||||||||||||
|
|
|
|
|
|
|
|
|
|
|
|
|
|||||||||||||
| (1) | Subject to borrowing base and leverage restrictions. On September 8, 2016, the committed amount on the Deutsche Bank Credit Facility was reduced by $75 million. |
| (2) | Provides a feature that allows the Company, under certain circumstances, to increase the size of the Senior Secured Revolving Credit Facility to a maximum of $1.34 billion. |
| (3) | Includes $26.35 million and $49.70 million denominated in Euros as of September 30, 2016 and December 31, 2015, respectively and $58.28 million denominated in British Pound Sterling as of December 31, 2015. |
| (4) | Comprised of outstanding principal less the unaccreted original issue discount of $1.09 million and $1.39 million and deferring financing costs of $3.09 million and $3.93 million as of September 30, 2016 and December 31, 2015, respectively. |
| (5) | Borrowings denominated in Euros. |
The weighted average stated interest rate and weighted average remaining years to maturity of the Company’s outstanding borrowings as of September 30, 2016 were 2.99% and 3.2 years, respectively, and as of December 31, 2015 were 2.94% and 2.0 years, respectively.
Senior Secured Revolving Credit Facility
In September 2013, the Company entered into a revolving credit facility (the “Senior Secured Revolving Credit Facility”) with certain lenders and JPMorgan Chase Bank, N.A., acting as administrative agent. On April 15, 2016, the Company amended and restated its Senior Secured Revolving Credit Facility (the “Amendment”) increasing loans to be made in U.S. dollars and other foreign currencies to an aggregate amount of $893 million, with an “accordion” feature that allows the Company, under circumstances, to increase the size of the facility to a maximum of $1.34 billion. On April 28, 2016, the aggregate loan commitment under the Senior Secured Revolving Credit Facility was increased to $928 million. Availability under the Senior Secured Revolving Credit Facility, as amended, will terminate on April 15, 2020 (the “Termination Date”) and the outstanding loans will mature on April 15, 2021. In addition, the Senior Secured Revolving Credit Facility, as amended, requires mandatory prepayment of interest and principal upon certain events during the term-out period commencing on the Termination Date. The Senior Secured Revolving Credit Facility is secured by substantially all of the Company’s portfolio investments and its cash and securities accounts, excluding those held by CCT Funding, Paris Funding, Halifax Funding and CCT Tokyo Funding, and provides for a guaranty by certain other subsidiaries of the Company
The stated borrowing rate under the Amendment is generally based on LIBOR plus an applicable spread of 2.00% or 2.25%, depending on collateral levels, or with respect to borrowings in foreign currencies, on a base rate applicable to such currency borrowing plus an applicable spread of 2.00% to 2.25%, depending on collateral levels. The Company also pays an annual commitment fee on any unused commitment amounts between 0.375% and 1.50%, depending on utilization levels.
73
Table of Contents
| 10. | Borrowings (continued) |
The components of interest expense, average interest rates (i.e., base interest rate in effect plus the spread) and average outstanding balances for the Senior Secured Revolving Credit Facility for the three and nine months ended September 30, 2016 and 2015 were as follows (in thousands):
| Three Months Ended September 30, |
Nine Months Ended September 30, |
|||||||||||||||
| 2016 | 2015 | 2016 | 2015 | |||||||||||||
| Stated interest expense |
$ | 5,018 | $ | 2,878 | $ | 13,365 | $ | 6,001 | ||||||||
| Unused commitment fees |
205 | 256 | 683 | 1,233 | ||||||||||||
| Amortization of deferred financing costs |
492 | 446 | 1,420 | 1,310 | ||||||||||||
|
|
|
|
|
|
|
|
|
|||||||||
| Total interest expense |
$ | 5,715 | $ | 3,580 | $ | 15,468 | $ | 8,544 | ||||||||
|
|
|
|
|
|
|
|
|
|||||||||
| Weighted average interest rate |
2.8 | % | 2.8 | % | 2.9 | % | 2.8 | % | ||||||||
| Average borrowings |
$ | 714,398 | $ | 411,674 | $ | 628,598 | $ | 291,824 | ||||||||
Deutsche Bank Credit Facility
CCT Funding is party to a revolving credit facility (as amended, the “Deutsche Bank Credit Facility”) with Deutsche Bank AG, New York Branch (“Deutsche Bank”), as the administrative agent and lender, which allows CCT Funding to borrow up to $250 million. The Deutsche Bank Credit Facility is secured by the portfolio investments held in CCT Funding. The Deutsche Bank Credit Facility consists of a Tranche E loan commitment (the “Tranche E Loans”) of $75 million and a Tranche F loan commitment (the “Tranche F Loans”) of $100 million. On September 8, 2016, the Tranche E loan commitment was reduced from $150 million to $75 million. The Company paid a make-whole fee of $0.24 million in connection with the commitment reduction. The Tranche E Loans are scheduled to mature, and all accrued and unpaid interest thereunder will be due and payable on February 8, 2017. The Tranche F Loans are scheduled to mature, and all accrued and unpaid interest thereunder will be due and payable on September 11, 2017.
Interest on the Tranche E Loans is charged at the rate of three-month LIBOR plus 1.85%. Interest on the Tranche F Loans is charged at the rate of three-month LIBOR plus 1.95%. CCT Funding also pays an annual commitment fee on any unused commitment amounts of 0.50%, plus an additional annual commitment fee of 1.95% on the excess, if any, of (i) 80% of the total commitment less (ii) the aggregate principal amount outstanding. The components of interest expense, average interest rates (i.e., base interest rate in effect plus the spread) and average outstanding balances for the Deutsche Bank Credit Facility for the three and nine months ended September 30, 2016 and 2015 were as follows (in thousands):
| Three Months Ended September 30, |
Nine Months Ended September 30, |
|||||||||||||||
| 2016 | 2015 | 2016 | 2015 | |||||||||||||
| Stated interest expense |
$ | 1,601 | (1) | $ | 828 | $ | 4,259 | (1) | $ | 2,084 | ||||||
| Unused commitment fees |
111 | 27 | 409 | 213 | ||||||||||||
| Amortization of deferred financing costs |
95 | 59 | 274 | 218 | ||||||||||||
|
|
|
|
|
|
|
|
|
|||||||||
| Total interest expense |
$ | 1,807 | $ | 914 | $ | 4,942 | $ | 2,515 | ||||||||
|
|
|
|
|
|
|
|
|
|||||||||
| Weighted average interest rate |
3.2 | % | 2.2 | % | 2.8 | % | 2.2 | % | ||||||||
| Average borrowings |
$ | 202,609 | $ | 150,272 | $ | 207,518 | $ | 128,769 | ||||||||
| (1) | Stated interest expense for the three and nine months ended September 30, 2016 includes a make-whole fee of $0.24 million incurred on the Tranche E Loans commitment reduction. |
BNP Credit Facility
Paris Funding is party to a revolving credit facility with BNP Paribas Prime Brokerage, Inc. (“BNP”) under which it may borrow up to $200 million (as amended, the “BNP Credit Facility”). Paris Funding has the right to prepay loans under the BNP Credit Facility in whole or in part at any time. Paris Funding may terminate the BNP Credit Facility with 180 days’ notice. If certain margin and collateral requirements, minimum net assets or other covenants are not met, the BNP Credit Facility could be deemed in default and result in termination. BNP has the option to terminate the BNP Credit Facility with 29 days’ notice if BNP’s long-term credit rating has declined to a level three or more notches below its highest rating by S&P, Moody’s or Fitch (a “Funding Event”). Absent a default, facility termination event or Funding Event, BNP is required to provide Paris Funding with 364 days’ notice prior to terminating the BNP Credit Facility.
74
Table of Contents
| 10. | Borrowings (continued) |
Interest on the BNP Credit Facility is charged at the rate of one month LIBOR plus 1.10% and is payable monthly. Paris Funding also pays an annual commitment fee on any unused commitment amounts of 0.40% or 0.50%, depending on utilization levels. The components of interest expense, average interest rates (i.e., base interest rate in effect plus the spread) and average outstanding balances for the BNP Credit Facility for the three and nine months ended September 30, 2016 and 2015 were as follows (in thousands):
| Three Months Ended September 30, |
Nine Months Ended September 30, |
|||||||||||||||
| 2016 | 2015 | 2016 | 2015 | |||||||||||||
| Stated interest expense |
$ | 682 | $ | 540 | $ | 2,063 | $ | 1,061 | ||||||||
| Unused commitment fees |
35 | 38 | 80 | 313 | ||||||||||||
| Amortization of deferred financing costs |
— | — | — | — | ||||||||||||
|
|
|
|
|
|
|
|
|
|||||||||
| Total interest expense |
$ | 717 | $ | 578 | $ | 2,143 | $ | 1,374 | ||||||||
|
|
|
|
|
|
|
|
|
|||||||||
| Weighted average interest rate |
1.6 | % | 1.3 | % | 1.6 | % | 1.3 | % | ||||||||
| Average borrowings |
$ | 166,261 | $ | 163,000 | $ | 173,803 | $ | 108,630 | ||||||||
Paris Funding pledges certain of its assets as collateral to secure borrowings under the BNP Credit Facility. As of September 30, 2016 and December 31, 2015, Paris Funding had investments with a fair value of $205.39 million and $315.88 million, respectively, pledged as collateral under the BNP Credit Facility. Under the terms of the BNP Credit Facility, BNP has the ability to borrow a portion of the pledged collateral (“Rehypothecated Securities”), provided that, among other things, the fair value of the borrowed collateral does not exceed the value of the loan against which the collateral was pledged and any single borrowed security does not represent the entire position of such security held by Paris Funding. Paris Funding may designate any security within the pledged collateral as ineligible to be a Rehypothecated Security, provided there are eligible securities within the segregated custody account in an amount equal to the outstanding borrowings owed by Paris Funding to BNP. Paris Funding may recall any Rehypothecated Security at any time and BNP must, to the extent commercially reasonable, return such security or equivalent security within a commercially reasonable period. In the event BNP does not return the security, Paris Funding will have the right to, among other things, apply and set off an amount equal to 100% of the then-current fair market value of such Rehypothecated Securities against any outstanding borrowings owed to BNP under the BNP Credit Facility. Rehypothecated Securities are marked-to-market daily and if the value of all Rehypothecated Securities exceeds 100% of the outstanding borrowings owed by Paris Funding under the BNP Credit Facility, BNP may either reduce the amount of Rehypothecated Securities to eliminate such excess or deposit into the segregated custody account an amount of cash equal to such excess. Paris Funding will continue to receive interest and the scheduled repayment of principal balances on Rehypothecated Securities. Paris Funding may receive a fee from BNP in connection with Rehypothecated Securities meeting certain criteria. Paris Funding did not recognize any fees on Rehypothecated Securities during the nine months ended September 30, 2016 and 2015. As of September 30, 2016, there were no securities rehypothecated by BNP.
SMBC Credit Facility
CCT Tokyo Funding is party to a revolving credit facility (the “SMBC Credit Facility”) with Sumitomo Mitsui Banking Corporation (“SMBC”), as the administrative agent, collateral agent, and lender, which allows CCT Tokyo Funding to borrow up to $200 million. The SMBC Credit Facility is secured by all of the assets held by CCT Tokyo Funding, including its portfolio of assets. Such pledged assets are held in a segregated custody account with Wells Fargo Bank, National Association (“Wells Fargo”). The end of the reinvestment period and the stated maturity date for the SMBC Credit Facility are December 2, 2017 and December 2, 2020, respectively. The reinvestment period and the stated maturity date are both subject to two one-year extensions by mutual agreement.
Amounts available to borrow under the SMBC Funding Facility are subject to a borrowing base that applies an advance rate to assets held by CCT Tokyo Funding. At the option of CCT Tokyo Funding, interest is charged at either the rate of three month LIBOR plus 1.75%, if the average advances outstanding are greater than $100,000,000, otherwise plus 2.00%, or the higher of the Prime Rate (as defined in the Loan and Servicing Agreement) or the Federal Funds rate plus 0.50%, plus 0.75% if the average advances outstanding are greater than $100,000,000, otherwise plus 1.00%. Interest is payable quarterly. Effective June 2, 2016, CCT Tokyo Funding began paying a quarterly non-usage fee of 0.35% on any unused commitment amounts if the average daily amount of the advances outstanding during a remittance period is equal to or greater than the lesser of (i) 50% of the borrowing base during the remittance period and (ii) $100,000,000 (such lesser amount, the “Later Period Threshold Amount”). If the average daily amount of the advances outstanding during a remittance period is less than the Later Period Threshold Amount, CCT Tokyo Funding will pay a fee of 0.875% for any unused portion up to or equal to the difference of the Later Period Threshold Amount less the amount of advances outstanding in addition to the non-usage fee of 0.35% on any remaining unused portion.
75
Table of Contents
| 10. | Borrowings (continued) |
The components of interest expense, average interest rates (i.e., base interest rate in effect plus the spread) and average outstanding balances for the SMBC Credit Facility for the three and nine months ended September 30, 2016 and 2015 were as follows (in thousands):
| Three Months Ended September 30, |
Nine Months Ended September 30, |
|||||||
| 2016 | 2016 | |||||||
| Stated interest expense |
$ | 610 | $ | 610 | ||||
| Unused commitment fees(1) |
13 | 149 | ||||||
| Amortization of deferred financing costs |
426 | 426 | ||||||
|
|
|
|
|
|||||
| Total interest expense |
$ | 1,049 | $ | 1,185 | ||||
|
|
|
|
|
|||||
| Weighted average interest rate |
2.48 | % | 2.47 | % | ||||
| Average borrowings |
$ | 98,500 | $ | 33,072 | ||||
| (1) | CCT Tokyo Funding recorded unused commitment fees effective June 2, 2016. |
2014 Senior Secured Term Loan
The Company is party to a senior secured term loan credit facility (the “2014 Senior Secured Term Loan”) with certain lenders and JPMorgan Chase Bank, N.A., as administrative agent. The 2014 Senior Secured Term Loan initially provided the Company with $398 million in gross proceeds. The 2014 Senior Secured Term Loan matures in May 2019, and generally bears interest at LIBOR plus 3.25% (with a LIBOR floor of 0.75%). The 2014 Senior Secured Term Loan includes an accordion feature permitting the Company to expand the facility if certain conditions are satisfied; provided, however, that the aggregate amount of the 2014 Senior Secured Term Loan is limited to the amount as determined from time to time which would not cause the covered debt amount (i.e., the Company’s aggregate debt under both the 2014 Senior Secured Term Loan and the Senior Secured Revolving Credit Facility, other permitted debt and certain other unsecured debt) to exceed the borrowing/collateral base. The 2014 Senior Secured Term Loan is secured by substantially all of the Company’s portfolio investments and its cash and securities accounts, excluding those held by CCT Funding, Paris Funding, Halifax Funding and CCT Tokyo Funding.
Maturities of the 2014 Senior Secured Term Loan for the remainder of 2016 and each of the next three years, in aggregate, as of September 30, 2016 were as follows (in thousands):
| 2016 |
$ | 1,000 | ||
| 2017 |
4,000 | |||
| 2018 |
4,000 | |||
| 2019 |
381,000 | |||
|
|
|
|||
| $ | 390,000 | |||
|
|
|
The components of interest expense, average interest rates (i.e., base interest rate in effect plus the spread) and average outstanding balances for the 2014 Senior Secured Term Loan for the three and nine months ended September 30, 2016 and 2015 were as follows (in thousands):
| Three Months Ended September 30, |
Nine Months Ended September 30, |
|||||||||||||||
| 2016 | 2015 | 2016 | 2015 | |||||||||||||
| Stated interest expense |
$ | 3,998 | $ | 4,037 | $ | 11,935 | $ | 12,011 | ||||||||
| Accretion of original issue discount |
101 | 97 | 297 | 286 | ||||||||||||
| Amortization of deferred financing costs |
285 | 274 | 841 | 810 | ||||||||||||
|
|
|
|
|
|
|
|
|
|||||||||
| Total interest expense |
$ | 4,384 | $ | 4,408 | $ | 13,073 | $ | 13,107 | ||||||||
|
|
|
|
|
|
|
|
|
|||||||||
| Weighted average interest rate |
4.2 | % | 4.2 | % | 4.2 | % | 4.2 | % | ||||||||
| Average borrowings |
$ | 390,989 | $ | 394,989 | $ | 391,985 | $ | 395,978 | ||||||||
In connection with each of the credit facilities and 2014 Senior Secured Term Loan, the Company has made customary representations and warranties and is required to comply with various covenants, reporting requirements and other customary requirements for similar facilities. As of September 30, 2016 and December 31, 2015, the Company believes it was in compliance with the covenant requirements for all of its credit facilities and 2014 Senior Secured Term Loan.
76
Table of Contents
| 10. | Borrowings (continued) |
CS Facility
On June 30, 2016, the Company entered into a debt financing arrangement with Credit Suisse Securities (Europe) Limited (“CS”). The Company elected to structure the financing in the manner described more fully below in order to, among other things, obtain such financing at a lower cost than would be available through alternate arrangements.
On June 30, 2016, the Company purchased a portion of a Tranche B term loan issued by LSF IX Java Investments, Ltd (the “Tranche B Loan”) with a par value of €56.41 million from Credit Suisse AG. The company financed a portion of the purchase by entering into a repurchase transaction with CS effective as of June 30, 2016 (the “CS Facility”). Under the terms of the CS Facility, CS purchased the Tranche B Loan from the Company for a purchase price of €22.28 million. The Company will, on a monthly basis, repurchase the Tranche B Loan from CS and subsequently resell the Tranche B Loan to CS. The final repurchase transaction must occur no later than June 29, 2017. The repurchase price paid to CS for each repurchase of the Tranche B Loan will be equal to the purchase price paid by CS for the Tranche B Loan plus interest thereon accrued at EURIBOR plus a spread of 0.75% for the term of the first repurchase transaction and 1.50% for each subsequent repurchase transaction. The company recorded interest expense of $0.08 million for the CS Facility for the three and nine months ended September 30, 2016.
The CS Facility is secured by substantially all of the Company’s portfolio investments.
| 11. | Commitments and Contingencies |
Unfunded commitments to provide funds to portfolio companies are not recorded in the Company’s condensed consolidated statements of assets and liabilities. Since these commitments may expire without being drawn upon, the total commitment amount does not necessarily represent future cash requirements. The Company has sufficient liquidity to fund these commitments. As of September 30, 2016, the Company’s unfunded commitments consisted of the following (in thousands):
| Category / Company (1) | ||||
| Unfunded revolvers/delayed draw loan commitments: |
||||
| A10 Capital, LLC |
$ | 10,058 | ||
| BeyondTrust Software, Inc. |
1,090 | |||
| SouthernCarlson |
6,219 | |||
| SouthernCarlson |
5,182 | |||
| Safety Technology Holdings, Inc. |
421 | |||
| Smile Brands, Inc. |
3,589 | |||
| SquareTwo Financial Corp. |
2,704 | |||
| Centric Group LLC |
6,522 | |||
|
|
|
|||
| Total unfunded revolvers/delayed draw loan commitments |
$ | 35,785 | ||
|
|
|
|||
| Unfunded term loan commitments: |
||||
| Centric Group LLC(2) |
$ | 75,000 | ||
|
|
|
|||
| Total unfunded term loan commitments |
$ | 75,000 | ||
|
|
|
|||
| Unfunded equity commitments: |
||||
| Central Park Leasing SARL |
$ | 2,240 | ||
| GA Capital Specialty Lending Fund |
53,925 | |||
| Home Partners of America, Inc. |
2,150 | |||
| KKR BPT Holdings Aggregator, LLC |
9,500 | |||
| Orchard Marine, Ltd. |
8,838 | |||
| Polyconcept North America Holdings, Inc. |
1,211 | |||
| Star Mountain SMB Multi-Manager Credit Platform, LP |
31,400 | |||
| Toorak Capital |
26,120 | |||
|
|
|
|||
| Total unfunded equity commitments |
$ | 135,384 | ||
|
|
|
|||
| (1) | May be commitments to one or more entities affiliated with the named company. |
| (2) | Commitment funded on October 14, 2016. |
77
Table of Contents
| 11. | Commitments and Contingencies (continued) |
As of September 30, 2016, the Company also has an unfunded commitment to provide $345.10 million of capital to SCJV. The capital commitment can be satisfied with contributions of cash and/or investments. The capital commitments cannot be drawn without an affirmative vote by one of the Company’s representatives on SCJV’s board of managers.
As of September 30, 2016, the Company’s unfunded debt commitments have a fair value of ($0.59) million. The Company funds its equity investments as it receives funding notices from the portfolio companies. As of September 30, 2016, the Company’s unfunded equity commitments have a fair value of zero.
In the normal course of business, the Company may enter into guarantees on behalf of portfolio companies. Under these arrangements, the Company would be required to make payments to third parties if the portfolio companies were to default on their related payment obligations. The Company has no such guarantees outstanding at September 30, 2016 and December 31, 2015.
| 12. | Income Taxes |
The Company’s Taxable Subsidiaries are subject to U.S. Federal and State income taxes. As of September 30, 2016 and December 31, 2015, the aggregate net deferred tax asset, before valuation allowance, was $1.44 million and $2.47 million, respectively, which was primarily comprised of net operating losses and unrealized depreciation in the investments. The Company recorded a valuation allowance against the full amount of the deferred tax asset because as of September 30, 2016 and 2015, it believed that it was more likely than not that the deferred tax asset would not be realized in future periods. For the nine months September 30, 2016 and 2015, the Taxable Subsidiaries had an effective tax rate of zero.
During the nine months ended September 30, 2016 and 2015, the Company recorded foreign income tax expense of $0.98 million and $0.30 million, respectively, of which $0.97 million and $0.28 million, respectively, represents foreign tax withholding and is recorded net against the related interest income in the condensed consolidated statements of operations.
78
Table of Contents
| 13. | Financial Highlights |
The following is a schedule of financial highlights for one share of common stock during the nine months ended September 30, 2016 and 2015.
| Nine Months Ended September 30, |
||||||||
| 2016 | 2015 | |||||||
| OPERATING PERFORMANCE PER SHARE |
||||||||
| Net asset value, beginning of Period |
$ | 8.93 | $ | 9.79 | ||||
|
|
|
|
|
|||||
| Net investment income(1) |
0.52 | 0.52 | ||||||
| Net realized and unrealized gain (loss)(1)(2) |
0.11 | (0.48 | ) | |||||
|
|
|
|
|
|||||
| Net increase resulting from investment operations |
0.63 | 0.04 | ||||||
|
|
|
|
|
|||||
| Distributions from net investment income(3) |
(0.52 | ) | (0.52 | ) | ||||
| Distributions from realized gains(3) |
— | (0.08 | ) | |||||
| Distributions in excess of net investment income(3)(4) |
(0.08 | ) | — | |||||
|
|
|
|
|
|||||
| Net decrease resulting from distributions to common shareholders |
(0.60 | ) | (0.60 | ) | ||||
|
|
|
|
|
|||||
| Issuance of common stock above net asset value(5) |
0.01 | 0.03 | ||||||
| Repurchases of common stock(6) |
— | — | ||||||
|
|
|
|
|
|||||
| Net increase resulting from capital share transactions |
0.01 | 0.03 | ||||||
|
|
|
|
|
|||||
| Net asset value, end of period |
$ | 8.97 | $ | 9.26 | ||||
|
|
|
|
|
|||||
| OPERATING PERFORMANCE PER SHARE |
||||||||
| Total investment return-net price(7) |
6.62 | % | (0.55 | )% | ||||
| Total investment return-net asset value(8) |
7.45 | % | 0.57 | % | ||||
| RATIOS/SUPPLEMENTAL DATA (all amounts in thousands except ratios) |
||||||||
| Net assets, end of period |
$ | 2,758,081 | $ | 2,526,361 | ||||
| Average net assets(9) |
$ | 2,669,512 | $ | 2,385,563 | ||||
| Average borrowings(9) |
$ | 1,443,414 | $ | 925,201 | ||||
| Shares outstanding, end of period |
307,308 | 272,706 | ||||||
| Weighted average shares outstanding |
303,271 | 246,352 | ||||||
| Ratios to Average Net Assets:(9) |
||||||||
| Total operating expenses |
4.79 | % | 4.04 | % | ||||
| Net investment income |
5.87 | % | 5.35 | % | ||||
| Portfolio turnover rate |
23 | % | 8 | % | ||||
| Asset coverage ratio(10) |
2.70 | 2.82 | ||||||
| (1) | The per share data was derived by using the weighted average shares outstanding during the period. |
| (2) | The amount shown at this caption is the balancing figure derived from the other figures in the schedule. The amount shown at this caption for a share outstanding throughout the year may not agree with the change in the aggregate gains and losses in portfolio securities for the year because of the timing of sales of the Company’s shares in relation to fluctuating market values for the portfolio. |
| (3) | The per share data for distributions is the actual amount of distributions paid or payable per share of common stock outstanding during the entire period; distributions per share are rounded to the nearest $0.01. |
| (4) | See Note 8. “Distributions” for further information on the source of distributions from other than net investment income and realized gains. |
| (5) | The continuous issuance of common stock may cause an incremental increase in net asset value per share due to the sale of shares at the then prevailing public offering price and the receipt of net proceeds per share by the Company in excess of net asset value per share on each subscription closing date. The per share data was derived by computing (i) the sum of (A) the number of shares issued in connection with subscriptions and/or distribution reinvestment on each share transaction date times (B) the differences between the net proceeds per share and the net asset value per share on each share transaction date, divided by (ii) the total shares outstanding at the end of the period. |
| (6) | The per share impact of the Company’s repurchase of common stock is a reduction to net asset value of less than $0.01 per share during the applicable period. |
79
Table of Contents
| 13. | Financial Highlights (continued) |
| (7) | Total investment return-net price is a measure of total return for shareholders who purchased the Company’s common stock at the beginning of the period, including distributions declared during the period. Total investment return-net price is based on (i) the purchase of one share at the public offering price, net of sales load, on the first day of the period, (ii) the sale at the net asset value per share on the last day of the period, of (A) one share plus (B) any fractional shares issued in connection with the reinvestment of monthly distributions, and (iii) distributions payable relating to one share, if any, on the last day of the period. The total investment return-net price calculation assumes that (i) monthly cash distributions are reinvested in accordance with the Company’s distribution reinvestment plan and (ii) the fractional shares issued pursuant to the distribution reinvestment plan are issued at the then current public offering price, net of sales load, on each monthly distribution payment date. Since there is no public market for the Company’s shares, the terminal sales price per share is assumed to be equal to the net asset value per share on the last day of the period presented. The Company’s performance changes over time and currently may be different than that shown above. Past performance is no guarantee of future results. Investment performance is presented without regard to sales load that may be incurred by shareholders in the purchase of the Company’s shares of common stock. |
| (8) | Total investment return-net asset value is a measure of the change in total value for shareholders who held the Company’s common stock at the beginning and end of the period, including distributions declared during the period. Total investment return-net asset value is based on (i) net asset value per share on the first day of the period, (ii) the net asset value per share on the last day of the period, of (A) one share plus (B) any fractional shares issued in connection with the reinvestment of monthly distributions, and (iii) distributions payable relating to one share, if any, on the last day of the period. The total investment return-net asset value calculation assumes that (i) monthly cash distributions are reinvested in accordance with the Company’s distribution reinvestment plan and (ii) the fractional shares issued pursuant to the distribution reinvestment plan are issued at the then current public offering price, net of sales load, on each monthly distribution payment date. Since there is no public market for the Company’s shares, terminal market value per share is assumed to be equal to net asset value per share on the last day of the period presented. The Company’s performance changes over time and currently may be different than that shown above. Past performance is no guarantee of future results. Investment performance is presented without regard to sales load that may be incurred by shareholders in the purchase of the Company’s shares of common stock. |
| (9) | The computation of average net assets and average borrowings during the period is based on the daily value of net assets and borrowing balances, respectively. |
| (10) | Asset coverage ratio is equal to (i) the sum of (A) net assets at the end of the period and (B) debt outstanding at the end of the period, divided by (ii) total debt outstanding at the end of the period. For purposes of the asset coverage ratio test applicable to the Company as a business development company, the Company regards the TRS total notional amount at the end of the period, less the total amount of cash collateral posted by Halifax Funding under the TRS, as a senior security. These data are presented in Note 4. “Derivative Instruments” of the condensed consolidated financial statements. |
| 14. | Subsequent Events |
On October 7, 2016, the Company’s board of directors approved an amendment and restatement of the Company’s distribution reinvestment plan. Under the amended distribution reinvestment plan, cash distributions paid to participating stockholders will be reinvested in additional shares at a purchase price determined by the board of directors, or a committee thereof, in its sole discretion, that is (i) not less than the net asset value per share determined in good faith by the board of directors or a committee thereof, in its sole discretion, immediately prior to the payment of the distribution and (ii) not more than 2.5% greater than the net asset value per share as of such date. The Amended DRP will be effective as of, and will first apply to the reinvestment of cash distributions paid on or after, November 1, 2016.
On October 10, 2016, the Company’s board of directors increased the public offering price of common stock under the Follow-On Offering to $9.07 per share. Shares continue to be offered net of all sales commissions or marketing support fees. As a result of the increase in offering price, net proceeds per share correspondingly increased from $9.02 to $9.07.
On October 14, 2016, the Company filed a tender offer statement with the SEC on Schedule TO. The Company offered to repurchase up to 7,435,796 shares of common stock at a cash price of $8.97 per share. The tender offer will expire on November 17, 2016 at 5:00 pm central time.
On October 27, 2016, the Company’s board of directors declared distributions of $0.015483 per share for five record dates beginning on November 1, 2016 through and including November 29, 2016.
In October 2016, the Company’s Follow-On Offering was closed to new investors. During the period October 1, 2016 through November 10, 2016, the Company received additional net proceeds of approximately $17.67 million from its Follow-On Offering, through the registered investment advisor channel, including amounts through its distribution reinvestment plan.
80
Table of Contents
| Item 2. | Management’s Discussion and Analysis of Financial Condition and Results of Operations |
The following discussion is based on the unaudited condensed consolidated financial statements as of September 30, 2016 and December 31, 2015, and for the three and nine months ended September 30, 2016 and 2015. Amounts as of December 31, 2015 included in the unaudited condensed consolidated financial statements have been derived from the audited consolidated financial statements as of that date. This information should be read in conjunction with the accompanying unaudited condensed consolidated financial statements and the notes thereto, as well as the audited consolidated financial statements, notes and management’s discussion and analysis of financial condition and results of operations included in our Annual Report on Form 10-K for the year ended December 31, 2015. Capitalized terms used in this Item 2 have the same meaning as in the accompanying unaudited condensed consolidated financial statements in Item 1 unless otherwise defined herein.
Statement Regarding Forward-Looking Information
The following information contains statements that constitute forward-looking statements within the meaning of Section 27A of the Securities Act, and Section 21E of the Exchange Act. These statements generally are characterized by the use of terms such as “may,” “should,” “plan,” “anticipate,” “estimate,” “intend,” “predict,” “believe” and “expect” or the negative of these terms or other comparable terminology. Although we believe that the expectations reflected in such forward-looking statements are based upon reasonable assumptions, our actual results could differ materially from those set forth in the forward-looking statements. Some factors that might cause such a difference include the following: persistent economic weakness at the global or national level, increased direct competition, changes in government regulations or accounting rules, changes in local, national and global capital market conditions, our ability to obtain or maintain credit lines, credit facilities or repurchase agreement on satisfactory terms, changes in interest rates, availability of proceeds from our offering of shares, our ability to identify suitable investments, our ability to close on identified investments, our ability to maintain our qualification as a regulated investment company and as a business development company, the ability of our Advisors (defined below) and their affiliates to attract and retain highly talented professionals, inaccuracies of our accounting estimates, the ability of our Advisors to locate suitable borrowers for our loans and the ability of such borrowers to make payments under their respective loans. Given these uncertainties, we caution you not to place undue reliance on such statements, which apply only as of the date hereof. We undertake no obligation to publicly release the results of any revisions to these forward-looking statements that may be made to reflect future events or circumstances or to reflect the occurrence of unanticipated events. The forward-looking statements should be read in light of the risk factors identified in the “Risk Factors” section of our Annual Report on Form 10-K filing for the year ended December 31, 2015 and Item 1A in Part II of this Quarterly Report.
The forward-looking statements and projections contained in this report are excluded from the safe harbor protection provided by Section 27A of the Securities Act and Section 21E of the Exchange Act.
Overview
We are a non-diversified closed-end management investment company that has elected to be treated as a business development company under the 1940 Act. Formed as a Maryland corporation on June 9, 2010, we are externally managed by CNL Fund Advisors Company (“CNL”) and KKR Credit Advisors (US) LLC (“KKR”), collectively, the “Advisors,” which are responsible for sourcing potential investments, conducting due diligence on prospective investments, analyzing investment opportunities, structuring investments, determining the securities and other assets that we will purchase, retain or sell, and monitoring our portfolio on an ongoing basis. Both Advisors are registered as investment advisers with the Securities and Exchange Commission (the “SEC”). CNL also provides the administrative services necessary for us to operate.
Investment Objective, Investment Program and Primary Investment Types
Our investment objective is to provide our shareholders with current income and, to a lesser extent, long-term capital appreciation. We pursue our investment objective by investing primarily in the debt of privately owned and thinly traded U.S. companies (also referred to as “portfolio companies”) with a focus on originated transactions sourced through the networks of our Advisors. We define originated transactions as any negotiated investment where we, through our Advisors’ direct efforts, provide funds directly to a portfolio company. We also have the ability, as granted through our SEC Exemptive Order, to co-invest in privately negotiated transactions alongside other investment funds managed by or affiliated with KKR (the “Co-Investment Transactions”). We anticipate that a substantial portion of our investment portfolio will consist of senior and subordinated debt, which we believe offer potential opportunities for superior risk-adjusted returns and income generation. Our debt investments may take the form of corporate loans or bonds, may be secured or unsecured and may, in some cases, be accompanied by warrants, options or other forms of equity participation. We may separately purchase common or preferred equity interests in transactions, including non-controlling equity investments. Additionally, we may invest in convertible securities, derivatives and private investment funds. We may also co-invest with third parties through partnerships, joint ventures or other entities, thereby acquiring jointly controlled or non-controlling interests in certain investments in conjunction with participation by one or more third parties in such investment.
81
Table of Contents
Our investment program consisted of two main components. First, since the inception of our investment activities, we have been engaged in the direct purchase of debt and equity securities, primarily issued by portfolio companies, through both secondary market and direct lending transactions. We refer to this investment program component as our “Investment Portfolio” in this report. Second, beginning in November 2012, we supplemented our economic exposure to portfolio companies by entering into total return swap arrangements (the “TRS”) with a commercial bank counterparty and directing the creation of a portfolio of debt investments that serve as reference assets under the TRS. We refer to this investment program component as our portfolio of TRS assets or our “TRS Portfolio” in this report. In the case of our TRS Portfolio, we receive all (i) realized income and fees and (ii) realized capital gains generated by the TRS assets. In return, we must pay quarterly to the TRS counterparty a payment consisting of (i) realized capital losses generated by the TRS assets and (ii) financing costs that are based on (a) a floating financing rate and (b) the settled notional amount of TRS assets.
References in this report to the term “settled notional amount” in association with the TRS mean the aggregate cost of the TRS assets underlying the TRS that are settled and owned by the counterparty. In addition, this aggregate cost serves as the basis for our payments of financing charges to the counterparty under the TRS. References to the term “total notional amount” mean the settled notional amount plus the effect of the purchase and sale cost of all TRS assets where trade settlement is pending. We will receive additional economic benefit if the value of the underlying TRS asset appreciates relative to the total notional amount through the final settlement date following termination of the agreement. Conversely, we will be required to pay the counterparty the amount, if any, by which the value of the underlying TRS asset declines relative to the total notional amount through such final settlement date. We do not own, or have physical custody of, the TRS assets and the TRS assets are not direct investments by us. Our subsidiary is required to post collateral with a custodian of at least 33.3% of the notional amount of each TRS asset and may be required to post additional collateral in the event the value of the TRS assets decreases below a specified amount.
Our investment strategy is focused on creating and growing an Investment Portfolio that generates superior risk-adjusted returns by carefully selecting investments through rigorous due diligence and actively managing and monitoring our Investment Portfolio. When evaluating an investment and the related portfolio company, we use the resources of our Advisors to develop an investment thesis and a proprietary view of a potential portfolio company’s intrinsic value. We believe our flexible approach to investing allows us to take advantage of opportunities that offer favorable risk/reward characteristics.
We primarily focus on the following investment types:
| • | Senior Debt. We invest in senior debt, in which we generally take a security interest in the available assets of the portfolio company, including equity interests in any of its subsidiaries. These investments generally take the form of senior secured first lien loans, senior secured second lien loans or senior secured bonds. In some circumstances, our lien could be subordinated to claims of other creditors. |
| • | Subordinated Debt. Our subordinated debt investments are generally subordinated to senior debt and are generally unsecured. These investments are generally structured with interest-only payments throughout the life of the security, with the principal due at maturity. |
| • | Structured Products. We also invest in structured products, which may include collateralized debt obligations (“CDOs”), collateralized bond obligations (“CBOs”), collateralized loan obligations (“CLOs”), structured notes and credit-linked notes. The issuers of such investment products may be structured as trusts or other types of pooled investment vehicles. Such products may also involve the deposit with or purchase by an entity of the underlying investments and the issuance by that entity of one or more classes of securities backed by, or representing interests in, the underlying investments or referencing an indicator related to such investments. |
| • | Equity Investments. We also make selected equity investments. In addition, when we invest in senior and subordinated debt, we may acquire warrants or options to purchase equity securities or benefit from other types of equity participation. Our goal is ultimately to dispose of these equity interests and realize gains upon our disposition of such interests. |
| • | Convertible Securities. We may invest in convertible securities, such as bonds, debentures, notes, preferred stocks or other securities that may be converted into, or exchanged for, a specified amount of common stock of the same or different issuer within a particular period of time at a specified price or formula. |
| • | Investments in Private Investment Funds. We may invest in, or wholly own, private investment funds, including hedge funds, private equity funds, limited liability companies, REITs, and other business entities. In particular, we expect we may invest in asset-based opportunities through joint ventures, investment platforms or build-ups that provide one or more of the following services: origination or sourcing of potential investment opportunities, due diligence and negotiation of potential investment opportunities and/or servicing, development and management (including turnaround) and disposition of investments. Such investments in joint ventures, platforms and build-ups may be in or alongside existing or newly formed operators, consultants and/or managers that pursue such opportunities and may or may not include capital and/or assets contributed by third party investors. Such investments may include opportunities to direct-finance physical assets, such as airplanes and ships, and/or operating assets, such as financial service entities, as opposed to investment securities, or to invest in origination and/or |
82
Table of Contents
| servicing platforms directly. These asset-based opportunities are expected to offer mezzanine-like structural downside protection as well as asset collateral, and equity-like upside that can be achieved through appreciation at the asset-level or, in the case of platforms, through growth of the enterprise value. Key areas of focus include, without limitation, (i) aircraft, (ii) shipping, (iii) renewables, (iv) real estate, (v) consumer finance, and (vi) energy/infrastructure. |
| • | Derivatives. We may invest in various types of derivatives, including TRS, interest rate swaps and foreign currency forward contracts and options. |
| • | Investments with Third-Parties. We may co-invest with third parties through partnerships, joint ventures or other entities, thereby acquiring jointly-controlled or non-controlling interests in certain investments in conjunction with participation by one or more third parties in such investment. Such joint venture partners or third party managers may include former KKR personnel or associated persons. |
The level of our investment activity can and does vary substantially from period to period depending on many factors, including: the demand for debt from creditworthy privately owned U.S. companies, the level of merger, acquisition and refinancing activity involving private companies, the availability of credit to finance transactions, the general economic environment, the competitive investment environment for the types of investments we currently seek and intend to seek in the future, the amount of capital we may borrow and the amount of equity capital proceeds from our Follow-On Offering through the registered investment advisor channel.
As a business development company, we are required to comply with certain regulatory requirements. For instance, we may not acquire any assets other than “qualifying assets” as specified in the 1940 Act unless, at the time the acquisition is made, at least 70% of our total assets are qualifying assets as determined at the end of the prior quarter (with certain limited exceptions). Qualifying assets include investments in “eligible portfolio companies.” Under the relevant SEC rules, the term “eligible portfolio company” includes all private companies, companies whose securities are not listed on a national securities exchange and certain public companies that have listed their securities on a national securities exchange and have a market capitalization of less than $250 million. These rules also permit us to include as qualifying assets certain follow-on investments in companies that were eligible portfolio companies at the time of our initial investment but no longer meet the definition of eligible portfolio company at the time of the follow-on investment.
Revenues
We generate revenues primarily in the form of interest on the debt securities of portfolio companies that we acquire and hold for investment purposes. Our investments in debt securities generally have an expected maturity of three to ten years, although we have no lower or upper constraint on maturity, and typically earn interest at fixed or floating rates. Interest on our debt securities is generally payable to us quarterly or semi-annually. Some of our investments in debt securities contain payment-in-kind (“PIK”) interest provisions. The outstanding principal amount of our debt securities and any accrued but unpaid interest will generally become due at the maturity date. In addition, we may generate revenue in the form of dividends from equity investments, prepayment fees, commitment fees, origination fees and fees for providing significant managerial assistance. While the TRS assets also generate interest income and fees, such amounts, net of the financing expenses, are recognized as (i) realized gains pursuant to generally accepted accounting principles (“GAAP”) when payable to us quarterly and (ii) unrealized gains for any accrued but unpaid amounts.
Operating Expenses
Our primary operating expenses include an investment advisory fee and, depending on our operating results, performance-based incentive fees, interest expense, administrative expenses, custodian and accounting fees, other third-party professional services and expenses and amortization of deferred offering expenses. The investment advisory fee and performance-based incentive fees compensate the Advisors for their services in identifying, evaluating, negotiating, closing and monitoring our investments.
83
Table of Contents
Financial and Operating Highlights
The following table presents financial and operating highlights as of September 30, 2016 and December 31, 2015, and for the nine months ended September 30, 2016 and 2015:
| September 30, | December 31, | |||||||
| As of (in thousands, except ratios and per share amounts) |
2016 | 2015 | ||||||
| Total assets |
$ | 4,320,766 | $ | 4,041,190 | ||||
| Adjusted total assets (Total assets, net of payable for investments purchased) |
$ | 4,242,969 | $ | 4,041,190 | ||||
| Investments in portfolio companies |
$ | 4,036,208 | $ | 3,722,261 | ||||
| Borrowings |
$ | 1,461,125 | $ | 1,423,980 | ||||
| Deemed borrowings (TRS implied leverage classified as senior securities) |
$ | 163,522 | $ | 182,326 | ||||
| Net assets |
$ | 2,758,081 | $ | 2,594,022 | ||||
| Net asset value per share |
$ | 8.97 | $ | 8.93 | ||||
| Leverage ratio (Borrowings + Deemed borrowings)/Adjusted total assets) |
38 | % | 40 | % | ||||
| Activity for the Nine Months Ended | September 30, | |||||||
| (in thousands, except per share amounts) |
2016 | 2015 | ||||||
| Average net assets |
$ | 2,669,512 | $ | 2,385,563 | ||||
| Average borrowings |
$ | 1,443,414 | $ | 925,201 | ||||
| Purchases of investments |
$ | 1,156,797 | $ | 1,467,289 | ||||
| Sales, principal payments and other exits |
$ | 891,651 | $ | 637,250 | ||||
| Net investment income |
$ | 156,736 | $ | 127,578 | ||||
| Net realized (losses) gains on investments, derivative instruments and foreign currency transactions |
$ | (10,223 | ) | $ | 49,322 | |||
| Net change in unrealized appreciation (depreciation) on investments, derivative instruments and foreign currency translation |
$ | 49,355 | $ | (175,423 | ) | |||
| Net increase in net assets resulting from operations |
$ | 195,868 | $ | 1,477 | ||||
| Total distributions declared |
$ | 182,976 | $ | 148,719 | ||||
| Net investment income per share |
$ | 0.52 | $ | 0.52 | ||||
| Earnings per share |
$ | 0.65 | $ | 0.01 | ||||
| Distributions declared per share outstanding for the entire period |
$ | 0.60 | $ | 0.60 | ||||
| Summary of Common Stock Offerings for the Nine Months Ended | September 30, | |||||||
| (in thousands, except share and per share amounts) |
2016 | 2015 | ||||||
| Gross proceeds, excluding reinvestment of distributions |
$ | 129,186 | $ | 519,048 | ||||
| Net proceeds to Company, excluding reinvestment of distributions |
$ | 119,537 | $ | 472,250 | ||||
| Reinvestment of distributions |
$ | 93,033 | $ | 76,446 | ||||
| Average net proceeds per share |
$ | 8.91 | $ | 9.85 | ||||
| Shares issued in connection with Offerings, excluding reinvestment of distributions |
13,434,421 | 47,926,637 | ||||||
| Shares issued in connection with reinvestment of distributions |
10,428,645 | 7,798,343 | ||||||
Business Environment
During the nine months ended September 30, 2016, markets continued to be influenced by geopolitical concerns, the increased regulation of financial institutions, as well as sector specific dislocations. The credit markets, especially high yield, experienced a rally in mid-2016, and significant inflows and outflows in open end credit mutual funds and exchange traded funds continue. These factors, along with lagging volume in lending in the middle market compared to recent years, have contributed to an increase in volatility and resulted in a more competitive lending environment.
Given the backdrop we have experienced, we continue to believe that our closed-end structure and long term fundamental underwriting approach positions us well. We continue to focus on providing capital to companies that, for a variety of reasons, are unable to access the syndicated debt markets. We believe three items continue to support our underlying investment thesis. First, leveraged lending guidelines at traditional lenders result in corporate and financial buyers looking beyond traditional financial intermediaries to support their deals. Second, there is less capital available for small-to-medium-sized businesses, as banks reduce their footprints amidst shrinking net interest margins and heightened regulation. Finally, we believe the current environment offers attractive risk adjusted transaction terms through our ability to provide long term and large financing solutions to our borrowers.
We believe future lending opportunities will expand given financial regulation stemming from the 2009 credit crisis that is resulting in commercial banks reducing lending levels to middle market companies. We maintain a high degree of caution and believe continued focus on the fundamentals, including rigorous due diligence, robust credit underwriting and direct structuring of investments, best positions the portfolio to protect principal and generate attractive risk-adjusted returns.
84
Table of Contents
Portfolio and Investment Activity
Portfolio Investment Activity for the Three and Nine Months ended September 30, 2016 and 2015
The following table summarizes our investment activity as of September 30, 2016 and December 31, 2015 and for the three and nine months ended September 30, 2016 and 2015, excluding our short term investments:
| Investment Activity Summary as of ($ in thousands) |
||||||||||||||||
| September 30, 2016 | December 31, 2015 | |||||||||||||||
| Investment Portfolio |
TRS Portfolio | Investment Portfolio |
TRS Portfolio | |||||||||||||
| Total fair value |
$ | 4,036,208 | $ | 258,968 | $ | 3,722,261 | $ | 308,213 | ||||||||
| No. portfolio companies |
144 | 39 | 124 | 48 | ||||||||||||
| No. debt investments |
161 | 40 | 141 | 51 | ||||||||||||
| No. structured product investments |
7 | — | 5 | — | ||||||||||||
| No. equity/other investments |
35 | — | 32 | — | ||||||||||||
| Investment Portfolio Activity Summary ($ in thousands) |
||||||||||||||||
| Three Months Ended September 30, |
Nine Months Ended September 30, |
|||||||||||||||
| 2016 | 2015 | 2016 | 2015 | |||||||||||||
| Purchases of investments: |
||||||||||||||||
| Senior secured loans – first lien |
$ | 250,326 | $ | 98,333 | $ | 401,916 | $ | 437,733 | ||||||||
| Senior secured loans – second lien |
59,646 | 88,741 | 249,147 | 321,029 | ||||||||||||
| Senior secured bonds |
17,965 | 61,529 | 55,501 | 122,170 | ||||||||||||
| Subordinated debt |
22,837 | 164,646 | 227,621 | 334,523 | ||||||||||||
| Structured products |
39,315 | — | 113,871 | 52,000 | ||||||||||||
| Equity/other |
45,625 | 63,227 | 108,741 | 199,834 | ||||||||||||
|
|
|
|
|
|
|
|
|
|||||||||
| Total |
$ | 435,714 | $ | 476,476 | $ | 1,156,797 | $ | 1,467,289 | ||||||||
|
|
|
|
|
|
|
|
|
|||||||||
| Sales, principal payments and other exits: |
||||||||||||||||
| Senior secured loans – first lien |
$ | 142,238 | $ | 77,661 | $ | 315,538 | $ | 153,310 | ||||||||
| Senior secured loans – second lien |
103,437 | 16,925 | 268,280 | 169,232 | ||||||||||||
| Senior secured bonds |
89,786 | 63,449 | 108,002 | 66,203 | ||||||||||||
| Subordinated debt |
98,736 | 46,153 | 139,737 | 233,372 | ||||||||||||
| Structured products |
1,787 | — | 2,929 | — | ||||||||||||
| Equity/other |
20,408 | 5,197 | 57,165 | 15,133 | ||||||||||||
|
|
|
|
|
|
|
|
|
|||||||||
| Total |
$ | 456,392 | $ | 209,385 | $ | 891,651 | $ | 637,250 | ||||||||
|
|
|
|
|
|
|
|
|
|||||||||
| Portfolio Company Additions |
17 | 10 | 37 | 31 | ||||||||||||
| Portfolio Company Exits |
(8 | ) | (7 | ) | (17 | ) | (23 | ) | ||||||||
| Debt Investment Additions |
24 | 19 | 51 | 40 | ||||||||||||
| Debt Investment Exits |
(18 | ) | (12 | ) | (31 | ) | (32 | ) | ||||||||
85
Table of Contents
| TRS Portfolio Activity Summary ($ in thousands) |
||||||||||||||||
| Three Months Ended September 30, |
Nine Months Ended September 30, |
|||||||||||||||
| 2016 | 2015 | 2016 | 2015 | |||||||||||||
| Purchases of investments: |
||||||||||||||||
| Senior secured loans – first lien |
$ | 18,399 | $ | 14,320 | $ | 25,392 | $ | 140,344 | ||||||||
| Senior secured loans – second lien |
— | — | — | 21,788 | ||||||||||||
| Senior secured bonds |
— | — | 15,000 | — | ||||||||||||
| Subordinated debt |
— | — | 9,500 | — | ||||||||||||
| Structured products |
— | — | — | — | ||||||||||||
| Equity/other |
— | — | — | — | ||||||||||||
|
|
|
|
|
|
|
|
|
|||||||||
| Total |
$ | 18,399 | $ | 14,320 | $ | 49,892 | $ | 162,132 | ||||||||
|
|
|
|
|
|
|
|
|
|||||||||
| Sales, principal payments and other exits: |
||||||||||||||||
| Senior secured loans – first lien |
$ | 70,229 | $ | 81,655 | $ | 82,877 | $ | 120,761 | ||||||||
| Senior secured loans – second lien |
11,906 | 26 | 30,121 | 4,046 | ||||||||||||
| Senior secured bonds |
— | — | 3,222 | — | ||||||||||||
| Subordinated debt |
— | 190 | — | 723 | ||||||||||||
| Structured products |
— | — | — | — | ||||||||||||
| Equity/other |
— | — | — | — | ||||||||||||
|
|
|
|
|
|
|
|
|
|||||||||
| Total |
$ | 82,135 | $ | 81,871 | $ | 116,220 | $ | 125,530 | ||||||||
|
|
|
|
|
|
|
|
|
|||||||||
| Portfolio Company Additions |
1 | — | 4 | 12 | ||||||||||||
| Portfolio Company Exits |
(7 | ) | (10 | ) | (13 | ) | (10 | ) | ||||||||
| Debt Investment Additions |
2 | 3 | 6 | 16 | ||||||||||||
| Debt Investment Exits |
(9 | ) | (13 | ) | (17 | ) | (12 | ) | ||||||||
While the Investment Portfolio and the TRS Portfolio are accounted for and presented as two distinct portfolios, the two portfolios had 22 and 28 debt investment positions and 27 and 32 portfolio companies in common as of September 30, 2016 and December 31, 2015, respectively. The changes in the fair value of our Investment Portfolio and our TRS Portfolio are directly related to (i) the changes in their cost basis and notional amounts, respectively, as a result of incremental purchases, sales and principal payments as described in the table above, and (ii) the changes in fair value for assets held at the beginning and end of the period. The net change in unrealized appreciation (depreciation) for the three months ended September 30, 2016 and 2015 was $44.76 million and ($107.86) million, respectively, for our Investment Portfolio, and $8.59 million and ($3.03) million, respectively, for our TRS Portfolio. The net change in unrealized appreciation (depreciation) for the nine months ended September 30, 2016 and 2015 was $45.84 million and ($136.50) million, respectively, for our Investment Portfolio, and $17.20 million and $0.14 million, respectively, for our TRS Portfolio. See “Results of Operations – Net Change in Unrealized Appreciation or Depreciation” below for further details relating to the changes.
As discussed above under “— Overview,” since receiving our SEC Exemptive Order, we have increased our focus on originated investments, including Co-Investment Transactions, as a main element of our investment strategy. Co-Investment Transactions give us the opportunity to participate in those investments alongside KKR’s institutional clients and proprietary funds. Our total origination activity in Co-Investment Transactions, plus future expected fundings related to such investments, totaled approximately $661.15 million for the nine months ended September 30, 2016, representing 44.4% of the affiliated co-investing funds’ investments of approximately $1.49 billion and 31.0% of the $2.13 billion in total tranche size for Co-Investment Transactions.
The following summarizes our investment activity associated with our investment focus on new originated debt investments during the nine months ended September 30, 2016 and 2015 and the status of originated investments held in the Investment Portfolio as of September 30, 2016 and December 31, 2015:
| September 30, | ||||||||
| Originated Investment Activity for the Nine Months Ended ($ in thousands) |
2016 | 2015 | ||||||
| Number of originated investments, by issuer |
13 | 12 | ||||||
| Total amount of originated investments, at cost (1) |
$ | 719,994 | $ | 586,577 | ||||
| Originated investments as a percentage of total investment activity |
62.2 | % | 40.0 | % | ||||
| Fee income recognized in connection with originated investments |
$ | 5,081 | $ | 3,691 | ||||
| Originated Investments Summary as of ($ in thousands) |
September 30, 2016 | December 31, 2015 | ||||||
| Total originated investments, at fair value |
$ | 2,621,960 | $ | 2,305,938 | ||||
| Total originated investments as a percentage of total Investment Portfolio, at fair value |
65.0 | % | 61.9 | % | ||||
| Weighted average annual yield of originated debt investments (2)(3) |
10.3 | % | 10.3 | % | ||||
| (1) | The total amount of originated investments, at cost, includes new issuers during the reporting periods and any follow-on originated investments from existing issuers. |
| (2) | The weighted average annual yield on debt investments is based on amortized cost as of the end of the applicable period. The weighted average annual yield for our debt investments is computed as (i) the sum of (a) the annual interest rate of each accruing debt investment multiplied by its par amount as of the end of |
86
Table of Contents
| the applicable reporting period, plus (b) the annual amortization of the purchase or original issue discount or premium of accruing each debt investment, if any; divided by (ii) the total amortized cost of all accruing debt investments included in the calculated group as of the end of the applicable reporting period. |
| (3) | The weighted average annual yield of originated debt investments is higher than what investors in our Company will realize because it does not reflect expenses of the Company or any sales load. Total investment return – net price and total investment return – net asset value were 6.6% and 7.5%, respectively, for the nine months ended September 30, 2016 and (0.5%) and 0.6%, respectively, for the nine months ended September 30, 2015. See Note 13. “Financial Highlights” in our unaudited condensed consolidated financial statements for information on how such returns were calculated. |
The following information presents additional analysis of our Investment Portfolio and TRS Portfolio as of September 30, 2016 and December 31, 2015, excluding our short-term investments. Our investment program is not managed with any specific asset category target goals. The primary investment type concentrations include (i) senior debt, and (ii) subordinated debt securities.
| Investment Portfolio as of (in thousands) | ||||||||||||||||
| September 30, 2016 | December 31, 2015 | |||||||||||||||
| Asset Category |
Amortized Cost | Fair Value | Amortized Cost | Fair Value | ||||||||||||
| Senior debt |
||||||||||||||||
| Senior secured loans - first lien |
$ | 1,695,047 | $ | 1,605,818 | $ | 1,721,163 | $ | 1,593,668 | ||||||||
| Senior secured loans - second lien |
1,141,950 | 1,095,896 | 1,154,518 | 1,100,781 | ||||||||||||
| Senior secured bonds |
185,023 | 154,895 | 217,350 | 184,509 | ||||||||||||
|
|
|
|
|
|
|
|
|
|||||||||
| Total senior debt |
3,022,020 | 2,856,609 | 3,093,031 | 2,878,958 | ||||||||||||
| Subordinated debt |
603,467 | 575,155 | 525,301 | 457,287 | ||||||||||||
| Structured products |
223,447 | 213,972 | 111,640 | 116,208 | ||||||||||||
| Equity/Other |
441,208 | 390,472 | 292,059 | 269,808 | ||||||||||||
|
|
|
|
|
|
|
|
|
|||||||||
| Total |
$ | 4,290,142 | $ | 4,036,208 | $ | 4,022,031 | $ | 3,722,261 | ||||||||
|
|
|
|
|
|
|
|
|
|||||||||
| TRS Portfolio as of (in thousands) | ||||||||||||||||
| September 30, 2016 | December 31, 2015 | |||||||||||||||
| Asset Category |
Notional Amount | Fair Value | Notional Amount | Fair Value | ||||||||||||
| Senior debt |
||||||||||||||||
| Senior secured loans - first lien |
$ | 213,455 | $ | 212,148 | $ | 269,945 | $ | 256,870 | ||||||||
| Senior secured loans - second lien |
18,841 | 18,780 | 46,704 | 43,971 | ||||||||||||
| Senior secured bonds |
15,724 | 15,864 | 7,315 | 6,353 | ||||||||||||
|
|
|
|
|
|
|
|
|
|||||||||
| Total senior debt |
248,020 | 246,792 | 323,964 | 307,194 | ||||||||||||
| Subordinated debt |
10,502 | 12,176 | 1,002 | 1,019 | ||||||||||||
|
|
|
|
|
|
|
|
|
|||||||||
| Total |
$ | 258,522 | $ | 258,968 | $ | 324,966 | $ | 308,213 | ||||||||
|
|
|
|
|
|
|
|
|
|||||||||
The weighted average yield on debt investments at amortized cost and fair value held in our Investment Portfolio as of September 30, 2016 and December 31, 2015 were as follows:
| September 30, 2016 | December 31, 2015 | |||||||||||||||
| Asset Category |
Investment Portfolio at Amortized Cost |
TRS Portfolio at Notional Amount |
Investment Portfolio at Amortized Cost |
TRS Portfolio at Notional Amount |
||||||||||||
| Senior debt (1)(2) |
||||||||||||||||
| Senior secured loans - first lien |
9.1 | % | 5.6 | % | 8.7 | % | 5.8 | % | ||||||||
| Senior secured loans - second lien |
10.6 | % | 9.8 | % | 10.4 | % | 9.5 | % | ||||||||
| Senior secured bonds |
9.6 | % | 9.9 | % | 9.5 | % | 8.4 | % | ||||||||
| Subordinated debt(1)(2) |
10.9 | % | 10.6 | % | 10.1 | % | 6.8 | % | ||||||||
| Structured products (1)(2) |
6.4 | % | — | % | 10.8 | % | — | % | ||||||||
| (1) | The weighted average yield on debt investments is based on amortized cost as of the end of the applicable period. The weighted average yield for our debt investments is computed as, (i) the sum of (a) the annual interest rate of each accruing debt investment multiplied by its par amount as of the end of the applicable reporting period, plus (b) the annual amortization of the purchase or original issue discount or premium of each accruing debt investment, if any; divided by (ii) the total amortized cost of all accruing debt investments included in the calculated group as of the end of the applicable reporting period. |
| (2) | The weighted average annual yield of originated debt investments is higher than what investors in our Company will realize because it does not reflect expenses of the Company or any sales load. Total investment return – net price and total investment return – net asset value were 6.6% and 7.5%, respectively, for the nine months ended September 30, 2016 and (0.5%) and 0.6%, respectively, for the nine months ended September 30, 2015. See Note 13. “Financial Highlights” in our unaudited condensed consolidated financial statements for information on how such returns were calculated. |
87
Table of Contents
The following table presents a summary of interest rate and maturity statistics for the debt investments, based on par value, in our Investment Portfolio and the TRS Portfolio as of September 30, 2016 and December 31, 2015:
| Investment Portfolio as of | TRS Portfolio as of | |||||||||||||||
| Floating interest rate debt investments: |
September 30, 2016 |
December 31, 2015 |
September 30, 2016 |
December 31, 2015 |
||||||||||||
| Percent of debt portfolio |
77.8 | % | 71.4 | % | 89.6 | % | 96.7 | % | ||||||||
| Percent of floating rate debt investments with interest rate floors |
93.2 | % | 93.6 | % | 98.3 | % | 98.8 | % | ||||||||
| Weighted average interest rate floor |
1.0 | % | 1.0 | % | 1.1 | % | 1.1 | % | ||||||||
| Weighted average coupon spread to base rate |
798 | bps | 764 | bps | 486 | bps | 484 | bps | ||||||||
| Weighted average years to maturity |
4.6 | 4.9 | 3.8 | 4.5 | ||||||||||||
| Fixed interest rate debt investments: |
||||||||||||||||
| Percent of debt portfolio |
22.2 | % | 28.6 | % | 10.4 | % | 3.3 | % | ||||||||
| Weighted average coupon rate |
10.1 | % | 10.2 | % | 10.1 | % | 9.9 | % | ||||||||
| Weighted average years to maturity |
5.5 | 5.6 | 6.4 | 4.7 | ||||||||||||
All of our floating interest rate debt investments have base rate reset frequencies of less than twelve months with the majority resetting at least quarterly. The three-month LIBOR, the most prevalent index employed among our floating interest rate debt investments, ranged between 0.61% and 0.87%, and 0.25% and 0.35% during the nine months ended September 30, 2016 and 2015, respectively, and was 0.85% and 0.61% on September 30, 2016 and December 31, 2015, respectively. Base rate resets for floating interest rate investments will only result in interest income increases when the reset base interest rate exceeds the associated interest rate floor.
Our weighted average annual yield on debt investments was 9.8% as of September 30, 2016, compared to 9.5% as of December 31, 2015. The weighted average annual yield on debt investments is higher than what investors in our Company will realize because it does not reflect expenses of the Company or any sales load. Total investment return - net price and total investment return – net asset value were 6.6% and 7.5%, respectively, for the nine months ended September 30, 2016. See Note 13. “Financial Highlights” in our unaudited condensed consolidated financial statements.
The following table shows the credit ratings of the investments in our Investment Portfolio and TRS Portfolio, based upon the rating scale of Standard & Poor’s Ratings Services, as of September 30, 2016 and December 31, 2015:
| Investment Portfolio as of (in thousands) | TRS Portfolio as of (in thousands) | |||||||||||||||||||||||||||||||
| September 30, 2016 | December 31, 2015 | September 30, 2016 | December 31, 2015 | |||||||||||||||||||||||||||||
| Standard & Poor’s rating |
Fair Value | Percentage of Portfolio |
Fair Value | Percentage of Portfolio |
Fair Value | Percentage of Portfolio |
Fair Value | Percentage of Portfolio |
||||||||||||||||||||||||
| BB+ |
$ | 2,192 | 0.1 | % | $ | — | — | % | $ | — | — | % | $ | — | — | % | ||||||||||||||||
| BB |
— | — | — | — | 10,323 | 4.0 | 404 | 0.1 | ||||||||||||||||||||||||
| BB- |
27,567 | 0.7 | 43,253 | 1.2 | 18,012 | 7.0 | 24,999 | 8.1 | ||||||||||||||||||||||||
| B+ |
146,765 | 3.6 | 155,395 | 4.2 | 39,798 | 15.4 | 40,695 | 13.2 | ||||||||||||||||||||||||
| B |
177,792 | 4.4 | 265,440 | 7.1 | 84,616 | 32.6 | 147,430 | 47.9 | ||||||||||||||||||||||||
| B- |
200,581 | 5.0 | 316,944 | 8.5 | 69,205 | 26.7 | 55,993 | 18.2 | ||||||||||||||||||||||||
| CCC+ |
678,798 | 16.8 | 649,508 | 17.4 | 27,193 | 10.5 | 30,808 | 10.0 | ||||||||||||||||||||||||
| CCC |
177,596 | 4.4 | 102,191 | 2.7 | — | — | — | — | ||||||||||||||||||||||||
| CCC- |
46,698 | 1.2 | 48,501 | 1.3 | 5,418 | 2.1 | 4,391 | 1.4 | ||||||||||||||||||||||||
| CC |
4,711 | 0.1 | — | — | — | — | — | — | ||||||||||||||||||||||||
| D |
11,853 | 0.3 | 9,640 | 0.3 | 4,403 | 1.7 | 3,493 | 1.1 | ||||||||||||||||||||||||
| Not rated |
2,561,655 | 63.4 | 2,131,389 | 57.3 | — | — | — | — | ||||||||||||||||||||||||
|
|
|
|
|
|
|
|
|
|
|
|
|
|
|
|
|
|||||||||||||||||
| Total |
$ | 4,036,208 | 100.0 | % | $ | 3,722,261 | 100.0 | % | $ | 258,968 | 100.0 | % | $ | 308,213 | 100.0 | % | ||||||||||||||||
|
|
|
|
|
|
|
|
|
|
|
|
|
|
|
|
|
|||||||||||||||||
88
Table of Contents
The table below presents a summary of our debt investment positions held in our Investment Portfolio that feature PIK interest provisions for some or all of the portfolio companies’ interest payment obligations.
| PIK Summary as of ($ in thousands) |
September 30, 2016 |
December 31, 2015 |
||||||
| Total number of all investments with PIK feature |
17 | 23 | ||||||
| Par value of all investments with PIK feature |
$ | 561,181 | $ | 707,559 | ||||
| Total number of all investments that have active PIK election |
14 | 19 | ||||||
| Par value of all investments that have active PIK election |
$ | 509,806 | $ | 648,196 | ||||
| Percent of debt investment portfolio with active PIK election, at par value |
13.4 | % | 17.5 | % | ||||
| Number of originated investments with PIK feature and active PIK election |
7 | 12 | ||||||
| Par value of originated investments with PIK feature and active PIK election |
$ | 409,349 | $ | 524,303 | ||||
| September 30, | ||||||||
| PIK Interest Income Activity for the Nine Months Ended ($ in thousands) |
2016 | 2015 | ||||||
| PIK interest income |
$ | 16,406 | $ | 24,308 | ||||
| PIK interest income as a percentage of interest income and PIK interest income |
6.2 | % | 11.9 | % | ||||
| PIK interest income as a percentage of total investment income |
5.8 | % | 10.8 | % | ||||
As of September 30, 2016, our Investment Portfolio consisted of 144 portfolio companies, diversified across 20 industry classifications, as compared to our Investment Portfolio as of December 31, 2015 that consisted of 124 portfolio companies, diversified across 21 distinct industry classifications. As of September 30, 2016, the TRS Portfolio consisted of 39 portfolio companies, diversified across 15 distinct industry classifications, as compared to our TRS Portfolio as of December 31, 2015 that consisted of 48 portfolio companies, diversified across 16 distinct industry classifications. The following table presents a summary of our Investment Portfolio and TRS Portfolio arranged by industry classifications of the portfolio companies as of September 30, 2016 and December 31, 2015:
| Investment Portfolio as of (in thousands) |
TRS Portfolio as of (in thousands) |
|||||||||||||||||||||||||||||||
| September 30, 2016 | December 31, 2015 | September 30, 2016 | December 31, 2015 | |||||||||||||||||||||||||||||
| Industry Classification |
Fair Value |
Percentage of Portfolio |
Fair Value |
Percentage of Portfolio |
Fair Value | Percentage of Portfolio |
Fair Value | Percentage of Portfolio |
||||||||||||||||||||||||
| Capital Goods |
$ | 860,107 | 21.3 | % | $ | 621,721 | 16.7 | % | $ | 19,350 | 7.5 | % | $ | 31,229 | 10.1 | % | ||||||||||||||||
| Software & Services |
446,756 | 11.1 | 416,659 | 11.2 | 66,763 | 25.8 | 68,767 | 22.3 | ||||||||||||||||||||||||
| Diversified Financials |
393,774 | 9.8 | 231,820 | 6.2 | — | — | — | — | ||||||||||||||||||||||||
| Retailing |
260,528 | 6.5 | 309,014 | 8.3 | 37,930 | 14.6 | 29,078 | 9.4 | ||||||||||||||||||||||||
| Materials |
247,885 | 6.1 | 146,239 | 3.9 | — | — | 12,183 | 4.0 | ||||||||||||||||||||||||
| Health Care Equipment & Services |
218,316 | 5.4 | 178,069 | 4.8 | 21,077 | 8.1 | 36,248 | 11.8 | ||||||||||||||||||||||||
| Automobiles & Components |
198,244 | 4.9 | 178,077 | 4.8 | — | — | — | — | ||||||||||||||||||||||||
| Consumer Durables & Apparel |
190,114 | 4.7 | 358,089 | 9.6 | 9,885 | 3.8 | 12,750 | 4.1 | ||||||||||||||||||||||||
| Technology Hardware & Equipment |
179,843 | 4.5 | 176,343 | 4.7 | 8,095 | 3.1 | 8,216 | 2.7 | ||||||||||||||||||||||||
| Energy |
170,435 | 4.2 | 164,056 | 4.4 | — | — | — | — | ||||||||||||||||||||||||
| Transportation |
165,005 | 4.1 | 174,014 | 4.7 | 24,421 | 9.4 | 11,459 | 3.7 | ||||||||||||||||||||||||
| Real Estate |
138,038 | 3.4 | 82,720 | 2.2 | 10,323 | 4.0 | 12,366 | 4.0 | ||||||||||||||||||||||||
| Commercial & Professional Services |
129,141 | 3.2 | 155,039 | 4.2 | 12,207 | 4.7 | 16,043 | 5.2 | ||||||||||||||||||||||||
| Consumer Services |
105,815 | 2.6 | 89,389 | 2.4 | 9,392 | 3.6 | 3,897 | 1.3 | ||||||||||||||||||||||||
| Media |
60,648 | 1.5 | 85,122 | 2.3 | 19,257 | 7.4 | 24,699 | 8.0 | ||||||||||||||||||||||||
| Food & Beverage & Tobacco |
58,836 | 1.5 | 62,134 | 1.7 | 8,288 | 3.2 | 8,522 | 2.8 | ||||||||||||||||||||||||
| Pharmaceuticals, Biotechnology & Life Science |
57,380 | 1.4 | 53,634 | 1.4 | — | — | — | — | ||||||||||||||||||||||||
| Food & Staples Retailing |
56,845 | 1.4 | 101,854 | 2.7 | 4,832 | 1.9 | 12,078 | 3.9 | ||||||||||||||||||||||||
| Telecommunications Services |
52,400 | 1.3 | 80,681 | 2.2 | 1,026 | 0.4 | 8,280 | 2.7 | ||||||||||||||||||||||||
| Remaining Industries |
46,098 | 1.1 | 57,587 | 1.6 | 6,122 | 2.5 | 12,398 | 4.0 | ||||||||||||||||||||||||
|
|
|
|
|
|
|
|
|
|
|
|
|
|
|
|
|
|||||||||||||||||
| Total |
$ | 4,036,208 | 100.0 | % | $ | 3,722,261 | 100.0 | % | $ | 258,968 | 100.0 | % | $ | 308,213 | 100.0 | % | ||||||||||||||||
|
|
|
|
|
|
|
|
|
|
|
|
|
|
|
|
|
|||||||||||||||||
89
Table of Contents
Strategic Credit Opportunities Partners, LLC
In May 2016, SCJV, a joint venture between our Company and Conway Capital, LLC (“Conway”), an affiliate of Guggenheim Life and Annuity Company and Delaware Life Insurance Company, was formed pursuant to the terms of a limited liability company agreement between our Company and Conway. Pursuant to the terms of the agreement, we, along with Conway each have 50% voting control of SCJV and together are required to agree on all investment decisions as well as all other significant actions for SCJV. SCJV was formed to invest its capital in a range of investments, including senior secured loans (both first lien and second lien) to middle market companies, broadly syndicated loans, equity, warrants and other investments. We, along with Conway have agreed to provide capital to SCJV of up to $500 million in the aggregate. We will provide 87.5% and 12.5%, respectively, of the committed capital. As administrative agent of SCJV, we will perform certain day-to-day management responsibilities on behalf of SCJV.
In August 2016, we, along with Conway completed the initial funding of SCJV. As part of the initial funding, we sold investments with a fair value of $247.24 million to SCJV, in exchange for cash and a $92.40 million equity interest in SCJV. We recognized a net realized loss of $0.95 million in connection with the transaction. Conway completed its initial funding of SCJV with a cash contribution of $13.20 million.
On August 15, 2016, CSCOP SE I LLC (“Borrower SPV”), a wholly-owned subsidiary of SCJV, entered into a credit agreement (the “Credit Agreement”), with Bank of America Merrill Lynch. The Credit Agreement provides for a revolving credit facility which provides for up to $165.00 million in total commitments to Borrower SPV (the “Credit Facility”), and is secured by substantially all of the assets of Borrower SPV. The stated borrowing rate under the Credit Facility may take the form of either base rate loans or Eurocurrency rate loans and may be converted to either or during the term of the loan by delivering a notice to the Credit Agreement administrative agent and State Street Bank and Trust Company, as collateral administrator, pursuant to the terms of the Credit Agreement. Base rate loans shall bear interest at a rate per annum equal to the sum of (a) the fluctuating rate per annum equal to the highest of (i) the federal funds rate plus 0.5% of 1%, (ii) the prime rate set by Bank of America for such day and (iii) the 1-month LIBOR plus (b) 1.85%. Eurocurrency rate loans shall bear interest at the rate per annum equal to the sum of (a) LIBOR (or a comparable or successor rate approved by the Credit Agreement administrative agent) plus (b) 1.85%. Borrower SPV shall also pay a commitment fee for undrawn commitment in the amount between 0.75% to 1.75%. The Credit Facility matures on August 15, 2018. As of September 30, 2016, total outstanding borrowings under this Credit Facility were $143.60 million.
As of September 30, 2016, SCJV had total investments with a fair value of $238.89 million. As of September 30, 2016, SCJV had no investments on non-accrual status.
Below is a summary of SCJV’s portfolio, followed by a listing of the individual loans in SCJV’s portfolio as of September 30, 2016:
| September 30, 2016 | ||||
| Total debt investments (1) |
$ | 241,356 | ||
| Weighted average current interest rate on debt investments (2) |
7.18 | % | ||
| Number of borrowers in SCJV |
33 | |||
| Largest loan to a single borrower (1) |
$ | 21,268 | ||
| (1) | At par amount. |
| (2) | Computed as the (a) annual stated interest rate on accruing debt, divided by (b) total debt at par amount. |
Strategic Credit Opportunities Partners, LLC Portfolio
As of September 30, 2016 (in thousands)
Company (a) |
Footnotes | Industry |
Interest Rate |
Base Rate Floor |
Maturity Date |
Principal Amount(b) |
Cost |
Fair Value |
||||||||||||||||||||
| Senior Secured Loans-First Lien—113.6% |
|
|||||||||||||||||||||||||||
| ABILITY Network, Inc. |
(f)(1) | Health Care Equipment & Services | L + 500 | 1.00 | % | 5/14/2021 | $ | 8,834 | $ | 8,730 | $ | 8,787 | ||||||||||||||||
| Belk, Inc. |
(1) | Retailing | L + 475 | 1.00 | % | 12/12/2022 | 4,209 | 3,712 | 3,824 | |||||||||||||||||||
| CityCenter Holdings, LLC |
(1) | Real Estate | L + 325 | 1.00 | % | 10/16/2020 | 4,755 | 4,783 | 4,793 | |||||||||||||||||||
| David’s Bridal, Inc. |
(f)(1) | Retailing | L + 375 | 1.25 | % | 10/11/2019 | 6,479 | 6,043 | 6,111 | |||||||||||||||||||
| Grocery Outlet, Inc. |
(1) | Food & Staples Retailing | L + 400 | 1.00 | % | 10/21/2021 | 2,930 | 2,897 | 2,930 | |||||||||||||||||||
90
Table of Contents
Company (a) |
Footnotes | Industry |
Interest Rate |
Base Rate Floor |
Maturity Date |
Principal Amount(b) |
Cost |
Fair Value | ||||||||||||||||||||||
| Gymboree Corp. |
(c)(f)(1) | Retailing | L + 350 | 1.50 | % | 2/23/2018 | 4,385 | 3,376 | 3,494 | |||||||||||||||||||||
| Hanson Building Products North America |
(f)(1) | Capital Goods | L + 550 | 1.00 | % | 3/13/2022 | 8,509 | 8,465 | 8,483 | |||||||||||||||||||||
| Harbor Freight Tools USA, Inc. |
(f)(1) | Retailing | L + 325 | 0.75 | % | 8/18/2023 | 2,183 | 2,187 | 2,198 | |||||||||||||||||||||
| Koosharem, LLC |
(f)(1) | Commercial & Professional Services | L + 650 | 1.00 | % | 5/15/2020 | $ | 21,268 | $ | 18,770 | $ | 18,326 | ||||||||||||||||||
| MedAssets, Inc. |
(2) | Health Care Equipment & Services | L + 550 | 1.00 | % | 10/19/2022 | 7,090 | 7,156 | 7,152 | |||||||||||||||||||||
| Neiman Marcus Group, LLC |
(f)(1) | Retailing | L + 325 | 1.00 | % | 10/25/2020 | 3,921 | 3,661 | 3,619 | |||||||||||||||||||||
| Netsmart Technologies, Inc. |
(2) | Health Care Equipment & Services | L + 475 | 1.00 | % | 4/19/2023 | 1,981 | 1,993 | 1,993 | |||||||||||||||||||||
| RedPrairie Corp. |
(f)(2) | Software & Services | L + 500 | 1.00 | % | 12/21/2018 | 12,542 | 12,472 | 12,555 | |||||||||||||||||||||
| (c)(2) | L + 350 | 1.00 | % | 9/22/2023 | 11,288 | 11,232 | 11,317 | |||||||||||||||||||||||
| Savers, Inc., Common Shares A |
(f)(1) | Retailing | L + 375 | 1.25 | % | 7/9/2019 | 9,974 | 8,771 | 9,171 | |||||||||||||||||||||
| TIBCO Software, Inc. |
(f)(2) | Software & Services | L + 550 | 1.00 | % | 12/4/2020 | 19,281 | 18,717 | 19,049 | |||||||||||||||||||||
| Total Senior Secured Loans—First Lien |
$ | 122,965 | $ | 123,802 | ||||||||||||||||||||||||||
|
|
|
|
|
|||||||||||||||||||||||||||
| Senior Secured Loans—Second Lien—18.1% |
||||||||||||||||||||||||||||||
| Applied Systems, Inc. |
(f)(1) | Software & Services | L + 650 | 1.00 | % | 1/24/2022 | $ | 7,461 | $ | 7,500 | $ | 7,542 | ||||||||||||||||||
| Deltek, Inc. |
(f)(1) | Software & Services | L + 850 | 1.00 | % | 6/26/2023 | 7,000 | 7,113 | 7,096 | |||||||||||||||||||||
| Misys, Ltd. (GBR) |
(d) | Software & Services | 12.00% | 6/12/2019 | 4,866 | 5,081 | 5,134 | |||||||||||||||||||||||
| Total Senior Secured Loans—Second Lien |
$ | 19,694 | $ | 19,772 | ||||||||||||||||||||||||||
|
|
|
|
|
|||||||||||||||||||||||||||
| Senior Secured Bonds—21.2% |
||||||||||||||||||||||||||||||
| Artesyn Technologies, Inc. |
(e)(f) | Technology Hardware & Equipment | 9.75% | 10/15/2020 | $ | 8,900 | $ | 7,510 | $ | 8,077 | ||||||||||||||||||||
| Calumet Specialty Products Partners, LP |
(e)(f) | Energy | 11.50% | 1/15/2021 | 6,579 | 7,477 | 7,533 | |||||||||||||||||||||||
| Guitar Center, Inc. |
(e)(f) | Retailing | 6.50% | 4/15/2019 | 8,523 | 7,543 | 7,500 | |||||||||||||||||||||||
| Total Senior Secured Bonds |
|
$ | 22,530 | $ | 23,110 | |||||||||||||||||||||||||
|
|
|
|
|
|||||||||||||||||||||||||||
| Total Senior Debt |
|
$ | 165,189 | $ | 166,684 | |||||||||||||||||||||||||
|
|
|
|
|
|||||||||||||||||||||||||||
| Subordinated Debt—66.2% |
||||||||||||||||||||||||||||||
| Builders FirstSource, Inc. |
(e)(f) | Capital Goods | 10.75% | 8/15/2023 | $ | 6,564 | $ | 7,487 | $ | 7,532 | ||||||||||||||||||||
| Cequel Communications Holdings, LLC |
(e)(f) | Media | 5.13% | 12/15/2021 | 7,426 | 7,499 | 7,408 | |||||||||||||||||||||||
| ClubCorp Club Operations, Inc. |
(e)(f) | Consumer Services | 8.25% | 12/15/2023 | 2,773 | 2,903 | 2,981 | |||||||||||||||||||||||
| GCI, Inc. |
(f) | Telecommunication Services | 6.88% | 4/15/2025 | 7,211 | 7,497 | 7,391 | |||||||||||||||||||||||
| GCP Applied Technologies, Inc. |
(e)(f) | Materials | 9.50% | 2/1/2023 | 4,796 | 5,480 | 5,456 | |||||||||||||||||||||||
| Hillman Group, Inc. |
(e)(f) | Consumer Durables & Apparel | 6.38% | 7/15/2022 | 2,238 | 2,051 | 2,098 | |||||||||||||||||||||||
| IMS Health, Inc. |
(e)(f) | Health Care Equipment & Services | 6.00% | 11/1/2020 | 7,353 | 7,496 | 7,463 | |||||||||||||||||||||||
| Jo-Ann Stores, Inc.(e)(f) |
Retailing | 8.13% | 3/15/2019 | 2,090 | 2,050 | 2,085 | ||||||||||||||||||||||||
| Kenan Advantage Group, Inc. |
(e)(f) | Transportation | 7.88% | 7/31/2023 | 7,692 | 7,501 | 7,288 | |||||||||||||||||||||||
| Manitowoc Foodservice, Inc. |
(f) | Capital Goods | 9.50% | 2/15/2024 | 6,622 | 7,488 | 7,549 | |||||||||||||||||||||||
| Platform Specialty Products Corp. |
(e)(f) | Materials | 10.38% | 5/1/2021 | 6,813 | 7,138 | 7,358 | |||||||||||||||||||||||
| Solera Holdings, Inc. |
(e)(f) | Software & Services | 10.50% | 3/1/2024 | 6,818 | 7,491 | 7,602 | |||||||||||||||||||||||
| Total Subordinated Debt |
|
$ | 72,081 | $ | 72,211 | |||||||||||||||||||||||||
|
|
|
|
|
|||||||||||||||||||||||||||
| TOTAL INVESTMENTS — 219.1% |
|
$ | 237,270 | $ | 238,895 | |||||||||||||||||||||||||
|
|
|
|
|
|||||||||||||||||||||||||||
91
Table of Contents
| (a) | Security may be an obligation of one or more entities affiliated with the named company. |
| (b) | Denominated in U.S. dollars unless otherwise noted. |
| (c) | Position or portion thereof unsettled as of September 30, 2016. |
| (d) | A portfolio company domiciled in a foreign country. The jurisdiction of the security issuer may be a different country than the domicile of the portfolio company. |
| (e) | This security was acquired in a transaction that was exempt from the registration requirements of the Securities Act, pursuant to Rule 144A thereunder. This security may be resold only in transactions that are exempt from the registration requirements of the Securities Act, normally to qualified institutional buyers. |
| (f) | This investment is held by both us and SCJV as of September 30, 2016. |
| (1) | The interest rate on these investments is subject to a base rate of 3-Month LIBOR, which at September 30, 2016 was 0.85%. The current base rate for each investment may be different from the reference rate on September 30, 2016. |
| (2) | The interest rate on these investments is subject to a base rate of 1-Month LIBOR, which at September 30, 2016 was 0.53%. The current base rate for each investment may be different from the reference rate on September 30, 2016. |
Abbreviations:
GBR - United Kingdom
L = LIBOR—London Interbank Offered Rate, typically 3-Month
Below is selected balance sheet information for SCJV as of September 30, 2016 (in thousands):
| September 30, 2016 | ||||
| Selected Balance Sheet Information |
| |||
| Total investments, at fair value |
$ | 238,895 | ||
| Cash and other assets |
29,621 | |||
|
|
|
|||
| Total assets |
$ | 268,516 | ||
|
|
|
|||
| Debt |
$ | 143,600 | ||
| Payable for investments purchased |
15,694 | |||
| Other liabilities |
196 | |||
|
|
|
|||
| Total liabilities |
$ | 159,490 | ||
|
|
|
|||
| Member’s equity |
$ | 109,026 | ||
|
|
|
|||
Below is selected statement of operations information for SCJV for the period from August 15, 2016 (Inception) through September 30, 2016 (in thousands):
| Period from August 15, 2016 (Inception) through September 30, 2016 |
||||
| Selected Statement of Operations Information |
| |||
| Total investment income |
$ | 2,251 | ||
| Expenses |
||||
| Interest expense |
500 | |||
| Professional services |
23 | |||
| Administrative services |
8 | |||
| Custodian and accounting fees |
18 | |||
|
|
|
|||
| Total expenses |
549 | |||
|
|
|
|||
| Net investment income |
1,702 | |||
| Net realized and unrealized gains |
1,724 | |||
|
|
|
|||
| Net increase in members’ equity |
$ | 3,426 | ||
|
|
|
|||
Capital Resources and Liquidity
Sources and Uses of Capital
In October 2016, we closed our Follow-On Offering to new investors. Throughout the course of the Offerings, we sold 321.96 million shares of common stock for gross proceeds of $3.44 billion, including the reinvestment of distributions. We will continue to issue shares of common stock pursuant to our distribution reinvestment plan.
Our capital resources and liquidity are derived primarily from (i) cash flows from operations, including investment sales and repayments, (ii) our distribution reinvestment plan, (iii) borrowings and (iv) through October 2016, net proceeds from our Offerings. Our primary uses of funds include (i) investments in portfolio companies, (ii) distributions to our shareholders, (iii) repurchases under our share repurchase program, (iv) advisory fees, (v) payment of principal and interest on our borrowings, and (vi)
92
Table of Contents
operating expenses. We have used, and expect to continue to use, proceeds from the turnover of our Investment Portfolio and borrowings under our credit facilities to finance our investment activities primarily focused on directly originated investments in portfolio companies. In addition, in January 2015, we filed our Shelf Registration Statement with the SEC that was declared effective on January 16, 2015, under which we may offer, from time to time, up to $750 million of our debt and/or equity securities, on terms to be determined at the time of each such offering.
Liquidity
During the nine months ended September 30, 2016, proceeds from sales of investments and principal payments totaled $887.60 million. In addition, distributions reinvested in the company as a percentage of total distributions for the nine months ended September 30, 2016 was 51%, or $93.03 million. As of September 30, 2016, we had the following sources of immediate liquidity available to us:
| (in thousands) |
Amount | |||
| Cash and Foreign Currency |
$ | 43,871 | ||
| Short Term Investments |
26,490 | |||
| Credit Facilities-Effective Borrowing Capacity (1) |
320,350 | |||
| Less: Payable for Investments Purchased |
(77,797 | ) | ||
|
|
|
|||
| Total |
$ | 312,914 | ||
|
|
|
|||
| (1) | Effective borrowing capacity represents additional amounts that we could borrow from our credit facilities based on collateral in place as of September 30, 2016. |
Borrowings
Our outstanding borrowings as of September 30, 2016 and December 31, 2015 were as follows:
| As of September 30, 2016 | As of December 31, 2015 | |||||||||||||||||||||||
| (in thousands) |
Total Aggregate Principal Amount Committed |
Principal Amount Outstanding |
Carrying Value |
Total Aggregate Principal Amount Committed |
Principal Amount Outstanding |
Carrying Value |
||||||||||||||||||
| Senior Secured Revolving Credit Facility (1)(2) |
$ | 928,000 | $ | 636,346 | (3) | $ | 636,346 | $ | 700,000 | $ | 632,980 | (3) | $ | 632,980 | ||||||||||
| Deutsche Bank Credit Facility (1) |
175,000 | 167,000 | 167,000 | 250,000 | 210,000 | 210,000 | ||||||||||||||||||
| BNP Credit Facility (1) |
200,000 | 138,000 | 138,000 | 200,000 | 188,000 | 188,000 | ||||||||||||||||||
| SMBC Credit Facility (1) |
200,000 | 104,750 | 104,750 | 200,000 | — | — | ||||||||||||||||||
|
|
|
|
|
|
|
|
|
|
|
|
|
|||||||||||||
| Total credit facilities |
1,503,000 | 1,046,096 | 1,046,096 | 1,350,000 | 1,030,980 | 1,030,980 | ||||||||||||||||||
| 2014 Senior Secured Term Loan |
390,000 | 390,000 | 385,815 | (4) | 393,000 | 393,000 | 387,677 | (4) | ||||||||||||||||
| CS Facility (5) |
25,029 | 25,029 | 25,029 | — | — | — | ||||||||||||||||||
|
|
|
|
|
|
|
|
|
|
|
|
|
|||||||||||||
| Total |
$ | 1,918,029 | $ | 1,461,125 | $ | 1,456,940 | $ | 1,743,000 | $ | 1,423,980 | $ | 1,418,657 | ||||||||||||
|
|
|
|
|
|
|
|
|
|
|
|
|
|||||||||||||
| (1) | Subject to borrowing base and leverage restrictions. On September 8, 2016, the committed amount on the Deutsche Bank Credit Facility was reduced by $75 million. |
| (2) | Senior Secured Revolving Credit Facility includes a provision that allows us, under certain circumstances, to increase the size of the Senior Secured Revolving Credit Facility to a maximum of $1.34 billion. |
| (3) | Includes $26.35 million and $49.70 million denominated in Euros as of September 30, 2016 and December 31, 2015, respectively, and $58.28 million denominated in British Pound Sterling as of December 31, 2015. |
| (4) | Comprised of outstanding principal less unaccreted original issue discount of $1.09 million and $1.39 million and deferred financing costs of $3.09 million and $3.93 million as of September 30, 2016 and December 31, 2015, respectively. |
| (5) | Borrowings denominated in Euros. |
For the nine months ended September 30, 2016 and 2015, our total all-in cost of financing, including fees and expenses, was 3.43% and 3.71%, respectively. We expect to continue to draw on the revolving credit facilities to finance our acquisition of investment positions in portfolio companies. We intend to further increase our aggregate borrowing capacity in the future beyond the current combined commitment amount of $1.92 billion that is available to us from our existing financing arrangements.
See Note 10. “Borrowings” in our unaudited condensed consolidated financial statements for additional disclosures regarding our borrowings.
93
Table of Contents
Total Return Swaps
In 2012, Halifax Funding LLC (“Halifax Funding”), our wholly owned, special purpose financing subsidiary, entered into a TRS arrangement with The Bank of Nova Scotia (“BNS”).
The obligations of Halifax Funding under the TRS Agreements are non-recourse to us and our exposure under the TRS Agreements is limited to the amount of collateral that is posted by Halifax Funding pursuant to the terms of the TRS Agreements. As of September 30, 2016, the posted collateral of $95 million equaled 36.7% of the total notional amount, as compared to $142.64 million, or 43.9% of the total notional amount as of December 31, 2015. The minimum required collateral amount (33.3% of the total notional amount, plus additional required collateral due to concentration limits in the TRS Portfolio) was $86.17 million as of September 30, 2016.
Halifax Funding may terminate the TRS Agreements at any time upon providing at least 30 days’ notice prior to the proposed settlement date of the TRS assets related to such termination. In the absence of early termination, the TRS Agreements will terminate on January 15, 2019. In the event of early termination of the TRS Agreements, Halifax Funding may be required to pay an early termination fee.
See Note 4. “Derivative Instruments” in our unaudited condensed consolidated financial statements for additional disclosures on the TRS.
Commitments and Contingencies
See Note 11. “Commitments and Contingencies” in our unaudited condensed consolidated financial statements for information on our commitments and contingencies as of September 30, 2016.
Distributions to Shareholders
We pay monthly distributions to our shareholders in the form of cash. Shareholders may elect to reinvest their distributions as additional shares of our common stock under our distribution reinvestment plan. Dividends are taxable to our shareholders even if they are reinvested in additional shares of our common stock. The following table reflects the cash distributions per share and the total amount of distributions that we have declared on our common stock during each of the quarters during the nine months ended September 30, 2016 and 2015:
| (in thousands, except per share amounts) |
Per Share | Amount | ||||||
| Quarter Ended: |
||||||||
| September 30, 2016 (13 record dates) |
$ | 0.201279 | $ | 61,729 | ||||
| June 30, 2016 (13 record dates) |
0.201279 | 61,307 | ||||||
| March 31, 2016 (13 record dates) |
0.201279 | 59,940 | ||||||
|
|
|
|
|
|||||
| $ | 0.603837 | $ | 182,976 | |||||
|
|
|
|
|
|||||
| Quarter Ended: |
||||||||
| September 30, 2015 (13 record dates) |
$ | 0.201279 | $ | 53,144 | ||||
| June 30, 2015 (13 record dates) |
0.201279 | 49,745 | ||||||
| March 31, 2015 (13 record dates) |
0.201279 | 45,830 | ||||||
|
|
|
|
|
|||||
| $ | 0.603837 | $ | 148,719 | |||||
|
|
|
|
|
|||||
Approximately 51% of the distributions we declared in each of the nine months ended September 30, 2016 and 2015 were reinvested in shares of our common stock by participants in our distribution reinvestment plan and the reinvested distributions represent an additional source of capital to us. Net investment income and realized capital gains represent the primary sources for us to pay distributions. See Note 8. “Distributions” in our unaudited condensed consolidated financial statements for additional disclosures on distributions.
On October 7, 2016, our board of directors approved an amendment and restatement of our distribution reinvestment plan. Under the amended distribution reinvestment plan, cash distributions paid to participating stockholders will be reinvested in additional shares at a purchase price determined by our board of directors, or a committee thereof, in its sole discretion, that is (i) not less than the net asset value per share determined in good faith by our board of directors or a committee thereof, in its sole discretion, immediately prior to the payment of the distribution and (ii) not more than 2.5% greater than the net asset value per share as of such date. The Amended DRP will be effective as of, and will first apply to the reinvestment of cash distributions paid on or after, November 1, 2016.
We estimate we had sufficient taxable income to support 100% of our declared distributions for the nine months ended September 30, 2016. We do not expect to use equity capital or borrowed funds to pay distributions to shareholders nor do we expect any portion of our distributions paid in 2016 to be treated as a return of capital for tax purposes. We routinely disclose the sources of
94
Table of Contents
funds used to pay distributions to our shareholders in periodic reports that accompany (i) quarterly account statements and (ii) monthly distribution checks that are prepared and sent directly by our transfer agent to our shareholders. See Note 8. “Distributions” in our unaudited condensed consolidated financial statements for a discussion of the sources of funds used to pay distributions on a GAAP basis for the periods presented.
Results of Operations
As of September 30, 2016, the fair value of our investments totaled $4.04 billion for our Investment Portfolio and $258.97 million for our TRS Portfolio. The majority of our investments at September 30, 2016 consisted of debt investments. See the section entitled “Portfolio and Investment Activity” above for a discussion of the general terms and characteristics of our investments, and for information regarding investment activities during the nine months ended September 30, 2016 and 2015. The growth of our Investment Portfolio was the primary contributing factor to the significant increases in investment income, operating expenses, investment advisory fees, net investment income and net assets between the comparative periods, as discussed below.
The following is a summary of our operating results for the three and nine months ended September 30, 2016 and 2015:
| Three Months Ended September 30, |
Nine Months Ended September 30, |
|||||||||||||||
| (in thousands) |
2016 | 2015 | 2016 | 2015 | ||||||||||||
| Total investment income |
$ | 97,418 | $ | 77,931 | $ | 284,716 | $ | 224,051 | ||||||||
| Total operating expense |
(44,240 | ) | (32,213 | ) | (127,966 | ) | (96,342 | ) | ||||||||
| Income tax expense, including excise tax |
(14 | ) | (90 | ) | (14 | ) | (131 | ) | ||||||||
|
|
|
|
|
|
|
|
|
|||||||||
| Net investment income |
53,164 | 45,628 | 156,736 | 127,578 | ||||||||||||
| Net realized gains (losses) |
(1,375 | ) | 48,066 | (10,223 | ) | 49,322 | ||||||||||
| Net change in unrealized appreciation (depreciation) |
60,427 | (153,425 | ) | 49,355 | (175,423 | ) | ||||||||||
|
|
|
|
|
|
|
|
|
|||||||||
| Net increase (decrease) in net assets resulting from operations |
$ | 112,216 | $ | (59,731 | ) | $ | 195,868 | $ | 1,477 | |||||||
|
|
|
|
|
|
|
|
|
|||||||||
Investment income
Investment income consisted of the following for the three and nine months September 30, 2016 and 2015:
| Three Months Ended September 30, |
Nine Months Ended September 30, |
|||||||||||||||
| (in thousands) |
2016 | 2015 | 2016 | 2015 | ||||||||||||
| Interest income |
$ | 85,176 | $ | 61,641 | $ | 247,971 | $ | 179,600 | ||||||||
| Payment-in-kind interest income |
2,212 | 8,337 | 16,406 | 24,308 | ||||||||||||
|
|
|
|
|
|
|
|
|
|||||||||
| Subtotal |
87,388 | 69,978 | 264,377 | 203,908 | ||||||||||||
| Fee income |
4,956 | 2,539 | 8,199 | 14,023 | ||||||||||||
| Dividend and other income |
5,074 | 5,414 | 12,140 | 6,120 | ||||||||||||
|
|
|
|
|
|
|
|
|
|||||||||
| Total investment income |
$ | 97,418 | $ | 77,931 | $ | 284,716 | $ | 224,051 | ||||||||
|
|
|
|
|
|
|
|
|
|||||||||
The increase in interest income was due primarily to the growth of our portfolio of debt investments. Our average debt investment balance was $3.89 billion and $3.75 billion for the three and nine months ended September 30, 2016, respectively, as compared to $3.16 billion and $2.98 billion during the same periods in 2015, respectively, based on par value. Variations in interest income are also partly due to nonrecurring recognition of prepayment penalties and unamortized loan fees, discounts and premiums upon the prepayment of debt investments. We recorded interest income from these sources in the combined amount of $1.0 million and $8.70 million for the three and nine months ended September 30, 2016, respectively, and ($0.83) million and $5.16 million for the three and nine months ended September 30, 2015, respectively. For the three and nine months ended September 30, 2016, 2.5% and 6.2%, respectively, of our total interest income including PIK interest income was attributable to PIK interest income as compared to 11.9% for both periods in 2015. PIK interest income for the three months ended September 30, 2016 is net of a $3.93 million reversal of accrued PIK interest income for an investment placed on non-accrual status during the period. As of September 30, 2016, our weighted average annual yield on our accruing debt investments was 9.8% based on amortized cost, as defined above in “Portfolio and Investment Activity.” As of September 30, 2016, approximately 77.8% of our debt investments had floating rate interest; therefore, changes in interest rates could have a material impact on our interest income in the future. See Item 7A. “Quantitative and Qualitative Disclosures About Market Risk” for further information on the impact interest rate changes could have on our results of operations.
Interest income earned on TRS assets is not included in investment income in the unaudited condensed consolidated statements of operations, but rather is recorded as part of (i) realized gains or losses on derivative instruments in connection with quarterly TRS settlement payments and (ii) unrealized appreciation (depreciation) on derivatives for amounts not yet received from the counterparty as of period end.
Our fee income consists of transaction-based fees and is nonrecurring. Fee income was higher during the nine months ended September 30, 2015 as compared to the same period in 2016 due to an amendment fee received in the amount of $7.76 million earned during the first quarter of 2015 from one of our portfolio companies seeking financial covenant relief and a higher amount of
95
Table of Contents
capital restructuring fees earned related to our Co-Investment Transactions. Going forward, we expect to earn additional structuring services fees on Co-Investment Transactions as a result of our persistent focus on direct lending activities. See Note 7. “Fee Income” in Item 8. “Financial Statements and Supplementary Data” for additional information on fee income.
The increase in dividend and other income for the nine months ended September 30, 2016 and 2015 was primarily due to an increase in the number of income-producing equity investments in our Investment Portfolio which were largely originated by us after receiving our SEC Exemptive Order in May 2013.
Operating expenses
Our operating expenses for the three and nine months ended September 30, 2016 and 2015 were as follows:
| Three Months Ended September 30, |
Nine Months Ended September 30, |
|||||||||||||||
| (in thousands) |
2016 | 2015 | 2016 | 2015 | ||||||||||||
| Investment advisory fees |
$ | 21,441 | $ | 18,867 | $ | 61,109 | $ | 51,004 | ||||||||
| Performance-based incentive fees |
5,816 | — | 19,218 | 7,983 | ||||||||||||
| Interest expense |
13,465 | 9,487 | 36,890 | 25,561 | ||||||||||||
| Offering expenses |
361 | 957 | 1,846 | 3,598 | ||||||||||||
| Administrative services |
896 | 717 | 2,618 | 2,031 | ||||||||||||
| Professional services |
653 | 621 | 2,036 | 1,988 | ||||||||||||
| Custodian and accounting fees |
406 | 377 | 1,183 | 958 | ||||||||||||
| Director fees and expenses |
129 | 158 | 370 | 478 | ||||||||||||
| Other |
1,073 | 1,029 | 2,696 | 2,741 | ||||||||||||
|
|
|
|
|
|
|
|
|
|||||||||
| Total operating expenses |
$ | 44,240 | $ | 32,213 | $ | 127,966 | $ | 96,342 | ||||||||
|
|
|
|
|
|
|
|
|
|||||||||
Investment advisory fees and performance-based incentive fees - Our investment advisory fees are calculated at an annual rate of 2% of our average gross assets; therefore, the increase in these fees for the three and nine ended September 30, 2016 was primarily attributable to the net increase in our gross assets.
Our Advisors are also eligible to receive incentive fees based on our performance. Our performance-based incentive fees, which are comprised of two parts, consisted of the following for the three and nine months ended September 30, 2016 and 2015:
| Three Months Ended September 30, |
Nine Months Ended September 30, |
|||||||||||||||
| (in thousands) |
2016 | 2015 | 2016 | 2015 | ||||||||||||
| Subordinated incentive fee on income |
$ | 5,816 | $ | — | $ | 19,218 | $ | 7,983 | ||||||||
| Incentive fee on capital gains |
— | — | — | — | ||||||||||||
|
|
|
|
|
|
|
|
|
|||||||||
| Total performance-based incentive fees |
$ | 5,816 | $ | — | $ | 19,218 | $ | 7,983 | ||||||||
|
|
|
|
|
|
|
|
|
|||||||||
A subordinated incentive fee on income is payable to our Advisors each calendar quarter if our pre-incentive fee net investment fee income (as defined in the Investment Advisory Agreement and approved by our board of directors) exceeds the 1.75% quarterly preference return to our shareholders (the ratio of pre-incentive fee net investment income divided by average adjusted capital).
The annual incentive fees on capital gains recorded for GAAP purposes is equal to (i) 20% of our realized and unrealized capital gains on a cumulative basis since inception, net of all realized capital losses and unrealized depreciation on a cumulative basis from inception, less (ii) the aggregate amount of any previously paid incentive fees on capital gains. As discussed in Note 6. “Related Party Transactions” in our unaudited condensed consolidated financial statements, the calculation of performance-based incentive fees disregards any net realized and unrealized gains associated with the TRS interest spread. In addition, for financial reporting purposes, in accordance with GAAP, we include unrealized appreciation on our Investment Portfolio and derivative instruments in the calculation of incentive fees on capital gains; however, such amounts are not payable by us unless and until the net unrealized appreciation is actually realized. The actual amount of incentive fees on capital gains that are due and payable to the Advisors is determined at the end of the calendar year.
We did not record any incentive fee on capital gains for the three and nine months ended September 30, 2016 and 2015. As of September 30, 2016, we had unrealized losses of $299.37 million in excess of our cumulative realized net capital gains since inception. Due to the cumulative nature of the incentive fee on capital gains, we will not owe the Advisors any incentive fees on capital gains for future years until such time, if any, that our cumulative realized net capital gains since inception exceed our unrealized losses as of a particular measurement date by more than $11.61 million.
See “—Contractual Obligations —Investment Advisory Agreements,” below for further details about the performance-based incentive fees.
96
Table of Contents
Interest expense - The components of interest expense for the three and nine months ended September 30, 2016 and 2015 were as follows:
| Three Months Ended September 30, |
Nine Months Ended September 30, |
|||||||||||||||
| (in thousands) |
2016 | 2015 | 2016 | 2015 | ||||||||||||
| Stated interest expense |
$ | 11,986 | $ | 8,283 | $ | 32,310 | $ | 21,157 | ||||||||
| Unused commitment fees |
364 | 321 | 1,321 | 1,759 | ||||||||||||
| Amortization of deferred financing costs |
1,014 | 786 | 2,962 | 2,359 | ||||||||||||
| Accretion of discount on term loan |
101 | 97 | 297 | 286 | ||||||||||||
|
|
|
|
|
|
|
|
|
|||||||||
| Total interest expense |
$ | 13,465 | $ | 9,487 | $ | 36,890 | $ | 25,561 | ||||||||
|
|
|
|
|
|
|
|
|
|||||||||
The increase in interest expense during the three and nine months ended September 30, 2016 was primarily attributable to the increase in our weighted average debt outstanding to $1.60 billion and $1.44 billion, respectively, as compared to $1.12 billion and $925.20 million for the same periods in 2015, respectively.
Our performance-based incentive fees and interest expense, among other things, may increase or decrease our overall operating expenses and expense ratios relative to comparative periods depending on portfolio performance, an increase or reduction in borrowed funds and borrowing commitments, and changes in benchmark interest rates, such as LIBOR, among other factors.
All other operating expenses – In general, our other operating expenses increased period over period due to increased administrative and professional services associated with our owning a larger portfolio of investments. Our offering expenses are capitalized as deferred offering expenses and then subsequently expensed over a 12-month period. During the three and nine months ended September 30, 2016, we recorded deferred offering expenses of $0.09 million and $0.76 million, respectively, as compared to $1.09 million and $2.79 million, respectively, for the same periods in 2015. The $0.52 million of deferred offering expenses recorded in the unaudited condensed consolidated statements of assets and liabilities as of September 30, 2016 represents the amount that will be recorded as offering expenses in the consolidated statements of operations over the next 12 months. Going forward, we expect a reduction in offering expenses due to the October 2016 closing of our Follow-On Offering to new investors.
The ratio of core operating expenses (excluding investment advisory fees, performance-based incentive fees, interest expense and offering expenses) to average net assets was 0.47% and 0.45% during the three and nine months ended September 30, 2016, respectively, as compared to 0.46% and 0.47% during the three and nine months ended September 30, 2015, respectively.
Net realized gain and losses—Net realized gains and losses for the three and nine months ended September 30, 2016 and 2015 were as follows:
| Three Months Ended September 30, |
Nine Months Ended September 30, |
|||||||||||||||
| (in thousands) |
2016 | 2015 | 2016 | 2015 | ||||||||||||
| Net realized gains (losses) on investments |
$ | (227 | ) | $ | (1,094 | ) | $ | (22,657 | ) | $ | (28,783 | ) | ||||
| Net realized gains (losses) on derivative instruments |
(561 | ) | 51,360 | 10,826 | 80,933 | |||||||||||
| Net realized gains (losses) on foreign currency transactions |
(587 | ) | (2,200 | ) | 1,608 | (2,828 | ) | |||||||||
|
|
|
|
|
|
|
|
|
|||||||||
| Net realized gains (losses) |
$ | (1,375 | ) | $ | 48,066 | $ | (10,223 | ) | $ | 49,322 | ||||||
|
|
|
|
|
|
|
|
|
|||||||||
As the result of our investment sales and principal payments, as described above in “Portfolio and Investment Activity,” we realized net losses on investments for each of the periods presented. The net realized loss on investments for the three and nine months ended September 30, 2016 consisted of a net gain on the disposition of investments of $0.10 million and $8.36 million, respectively, and a net currency loss of $0.33 million and $31.02 million, respectively, on those investments that were denominated in foreign currencies. The net realized loss on investments for the three and nine months ended September 30, 2015 was partially due to a restructuring of one of the portfolio companies in whose debt securities we have invested, Towergate Finance PLC, resulting in a realized loss of $23.0 million.
Our net realized gains (losses) on derivative instruments for the three and nine months ended September 30, 2016 and 2015 consisted of the following:
| Three Months Ended September 30, |
Nine Months Ended September 30, |
|||||||||||||||
| (in thousands) |
2016 | 2015 | 2016 | 2015 | ||||||||||||
| Net realized gains (losses) on: |
||||||||||||||||
| Cross currency swaps |
$ | 1,326 | $ | 249 | $ | 7,997 | $ | 249 | ||||||||
| Foreign currency forward contracts |
(4,029 | ) | 47,021 | (2,946 | ) | 71,081 | ||||||||||
| Interest rate swaps |
(1,055 | ) | — | (3,121 | ) | — | ||||||||||
| TRS |
3,197 | 4,090 | 8,896 | 9,603 | ||||||||||||
|
|
|
|
|
|
|
|
|
|||||||||
| $ | (561 | ) | $ | 51,360 | $ | 10,826 | $ | 80,933 | ||||||||
|
|
|
|
|
|
|
|
|
|||||||||
97
Table of Contents
See Note 4. “Derivative Instruments” in our unaudited condensed consolidated financial statements for more information about the components of the realized gain on TRS recorded during each period.
As described in Note 4. “Derivative Instruments” in our unaudited condensed consolidated financial statements, we utilize foreign currency forward contracts and cross currency swaps to economically hedge the impact that changes in foreign exchange rates have on the value of our investments denominated in foreign currencies. We record realized gains on these derivative instruments upon periodic settlement dates and upon maturity or termination. In August 2015, we terminated all of our outstanding foreign currency forward contracts and entered into new foreign currency forward contracts and cross currency swaps. Although both types of instruments serve as an economic hedge against changes in foreign exchange rates, the unrealized gains and losses may have differing tax treatments. By hedging our foreign investments with a combination of foreign currency forward contracts and cross currency swaps, we expect to reduce potential volatility in our taxable income while maintaining some flexibility to increase or decrease the overall notional balance of our hedges when deemed necessary. The cross currency swaps generate realized gains or losses upon each quarterly settlement payment. During the three and nine months ended September 30, 2016, the scheduled amortization of our cross currency swaps resulted in a net exchange of currencies with our counterparty that generated a realized gain of $1.05 million and $6.77 million, respectively. The realized gains on foreign currency forward contracts and cross currency swaps help offset realized and unrealized losses in investments denominated in foreign currencies as a result of foreign currency movements, as described further below.
Net change in unrealized appreciation or depreciation
For the three and nine months ended September 30, 2016 and 2015, net unrealized appreciation and depreciation consisted of the following:
| Three Months Ended September 30, |
Nine Months Ended September 30, |
|||||||||||||||
| (in thousands) |
2016 | 2015 | 2016 | 2015 | ||||||||||||
| Net change in unrealized appreciation (depreciation) on: |
||||||||||||||||
| Investments |
$ | 44,755 | $ | (107,859 | ) | $ | 45,836 | $ | (136,499 | ) | ||||||
| Derivative instruments |
15,484 | (45,350 | ) | 6,077 | (38,759 | ) | ||||||||||
| Foreign currency translation |
188 | (216 | ) | (2,558 | ) | (165 | ) | |||||||||
|
|
|
|
|
|
|
|
|
|||||||||
| Net change in unrealized appreciation (depreciation) |
$ | 60,427 | $ | (153,425 | ) | $ | 49,355 | $ | (175,423 | ) | ||||||
|
|
|
|
|
|
|
|
|
|||||||||
The net change in unrealized appreciation (depreciation) on investments consisted of the following:
| Three Months Ended September 30, |
Nine Months Ended September 30, |
|||||||||||||||
| (in thousands) |
2016 | 2015 | 2016 | 2015 | ||||||||||||
| Net change in unrealized appreciation (depreciation) on investments: |
||||||||||||||||
| Unrealized appreciation |
$ | 97,387 | $ | 11,811 | $ | 134,912 | $ | 33,330 | ||||||||
| Unrealized depreciation |
(52,595 | ) | (125,439 | ) | (144,726 | ) | (189,017 | ) | ||||||||
| Net unrealized (appreciation) depreciation reversal related to net realized gains or losses (1) |
(37 | ) | 5,769 | 55,650 | 19,188 | |||||||||||
|
|
|
|
|
|
|
|
|
|||||||||
| Total net change in unrealized appreciation (depreciation) |
$ | 44,755 | $ | (107,859 | ) | $ | 45,836 | $ | (136,499 | ) | ||||||
|
|
|
|
|
|
|
|
|
|||||||||
| (1) | Represents the unrealized appreciation or depreciation recorded on the related asset at the end of prior period. |
Approximately 12.2% of our Investment Portfolio, measured at fair value, is denominated in foreign currencies. We do not isolate that portion of the results of operations resulting from changes in foreign exchange rates on investments from the fluctuations arising from changes in fair values of investments held; therefore, fluctuations related to foreign exchange rate conversions are included with unrealized appreciation (depreciation) on investments.
98
Table of Contents
We have entered into foreign currency forward contracts and cross currency swaps to economically hedge the impact that changes in foreign exchange rates have on the value of our investments denominated in foreign currencies. The following table presents the combined realized and unrealized gains and losses on investments, including the impact of our hedges. Changes in foreign currency exchange rates could impact our earnings to the extent that our investments denominated in foreign currencies are not hedged or the hedges are not effective. See Item 3. “Quantitative and Qualitative Disclosures About Market Risk” for further discussion of the impact of foreign currency exchange rates on our earnings.
| Three Months Ended September 30, |
Nine Months Ended September 30, |
|||||||||||||||
| (in thousands) |
2016 | 2015 | 2016 | 2015 | ||||||||||||
| Net realized and unrealized gains (losses) on investments |
$ | 44,528 | $ | (108,953 | ) | $ | 23,179 | $ | (165,282 | ) | ||||||
| Net realized and unrealized gains (losses) on foreign currency forward contracts |
(1,903 | ) | 5,005 | (4,681 | ) | 31,022 | ||||||||||
| Net realized and unrealized gains on cross currency swaps |
(616 | ) | 551 | 10,052 | 551 | |||||||||||
|
|
|
|
|
|
|
|
|
|||||||||
| $ | 42,009 | $ | (103,397 | ) | $ | 28,550 | $ | (133,709 | ) | |||||||
|
|
|
|
|
|
|
|
|
|||||||||
The net realized and unrealized gain and losses on investments during the three and nine months ended September 30, 2016, after applying the net impacts of movements in valuation on the underlying foreign currency forward contracts and cross currency swaps put in place to mitigate currency risk, were attributable to a tightening of credit spreads experienced during the three months ended September 30, 2016, which helped to offset a portion of the net losses incurred during the first quarter of 2016. The net realized and unrealized losses on investments during the three and nine months ended September 30, 2015 were partly attributable to declines in the fair values of the Company’s investments in securities of portfolio companies directly and indirectly related to the energy sector.
The net change in unrealized appreciation (depreciation) on derivative instruments consisted of the following:
| Three Months Ended September 30, |
Nine Months Ended September 30, |
|||||||||||||||
| (in thousands) |
2016 | 2015 | 2016 | 2015 | ||||||||||||
| Net change in unrealized appreciation (depreciation) on TRS: |
||||||||||||||||
| Unsettled amounts at end of period: |
||||||||||||||||
| Spread interest income |
$ | 4,191 | $ | 4,380 | $ | 4,191 | $ | 4,380 | ||||||||
| Realized gain (loss) on TRS assets |
191 | (517 | ) | 191 | (517 | ) | ||||||||||
| Receipt of prior period unsettled amounts |
(4,089 | ) | (4,466 | ) | (3,191 | ) | (3,006 | ) | ||||||||
| Unrealized appreciation (depreciation) on TRS assets |
8,587 | (3,033 | ) | 17,199 | 141 | |||||||||||
|
|
|
|
|
|
|
|
|
|||||||||
| 8,880 | (3,636 | ) | 18,390 | 998 | ||||||||||||
|
|
|
|
|
|
|
|
|
|||||||||
| Net change in unrealized appreciation on foreign currency forward contracts: |
||||||||||||||||
| Unrealized appreciation |
259 | 386 | 939 | 386 | ||||||||||||
| Unrealized depreciation |
(642 | ) | — | (957 | ) | — | ||||||||||
| Net unrealized (appreciation) depreciation reversal related to net realized gains or losses (1) |
2,509 | (42,402 | ) | (1,717 | ) | (40,445 | ) | |||||||||
|
|
|
|
|
|
|
|
|
|||||||||
| 2,126 | (42,016 | ) | (1,735 | ) | (40,059 | ) | ||||||||||
|
|
|
|
|
|
|
|
|
|||||||||
| Net change in unrealized appreciation (depreciation) on cross currency swaps: |
||||||||||||||||
| Unrealized appreciation |
1,071 | 1,531 | 9,776 | 1,531 | ||||||||||||
| Unrealized depreciation |
(3,013 | ) | (1,229 | ) | (7,721 | ) | (1,229 | ) | ||||||||
|
|
|
|
|
|
|
|
|
|||||||||
| (1,942 | ) | 302 | 2,055 | 302 | ||||||||||||
|
|
|
|
|
|
|
|
|
|||||||||
| Net change in unrealized appreciation (depreciation) on interest rate swaps: |
||||||||||||||||
| Unrealized appreciation |
6,420 | — | 437 | — | ||||||||||||
| Unrealized depreciation |
— | — | (13,070 | ) | — | |||||||||||
|
|
|
|
|
|
|
|
|
|||||||||
| 6,420 | — | (12,633 | ) | — | ||||||||||||
|
|
|
|
|
|
|
|
|
|||||||||
| Total net change in unrealized appreciation (depreciation) on derivative instruments |
$ | 15,484 | $ | (45,350 | ) | $ | 6,077 | $ | (38,759 | ) | ||||||
|
|
|
|
|
|
|
|
|
|||||||||
| (1) | Represents the unrealized appreciation or depreciation recorded at the end of prior period. |
We are not aware of any material trends or uncertainties, favorable or unfavorable, that may be reasonably anticipated to have a material impact on either capital resources or the revenues or income to be derived from our investments, other than those described above, risk factors, if any, identified in Part II, Item 1A of this report, and the “Management’s Discussion and Analysis of Financial Condition and Results of Operations” and “Risk Factors” sections of our Annual Report on Form 10-K for the year ended December 31, 2015.
99
Table of Contents
Adjusted net investment income
Our net investment income totaled $53.16 million ($0.17 per share) and $156.74 million ($0.52 per share) for the three and nine months ended September 30, 2016, respectively, as compared to $45.63 million ($0.17 per share) and $127.58 million ($0.52 per share) for the three and nine months ended September 30, 2015, respectively. As described above in “- Investment advisory fees and performance-based incentive fees,” we accrue estimated performance-based incentive fees with respect to any net realized and unrealized appreciation in our Investment Portfolio and derivative instruments. The performance-based incentive fees are treated as an operating expense and therefore are a deduction in calculating our net investment income on a GAAP basis. However, our net realized and unrealized appreciation on our Investment Portfolio and derivative instruments that partly determine these fees are not included in net investment income. Therefore, in order to evaluate our net investment income without regard to realized and unrealized appreciation in our Investment Portfolio, including the impact of related accrued performance-based fees, we have developed a supplemental, non-GAAP measure, which we refer to as “adjusted net investment income,” which presents net investment income before the effects of unearned performance-based incentive fees.
In addition, the relative utilization of the TRS can also cause variability in net investment income, because earnings on assets within the TRS Portfolio are not included in the calculation of net investment income in accordance with GAAP. The TRS Portfolio accrued interest income and financing charges are included in the fair value of the TRS and are not recorded as realized gain or loss on derivative instruments until quarterly TRS settlement payments are finalized. If the TRS assets had instead been included in our Investment Portfolio as owned assets, the interest income and financing charges, or TRS net interest spread, would have been included in net investment income. We include the TRS net interest spread in our calculation of adjusted net investment income.
We believe that adjusted net investment income is useful to assess the sustainability of our distributions and operating performance. Adjusted net investment income is not necessarily indicative of cash flows available to fund cash needs and should not be considered as an alternative to net investment income as an indication of our performance, as an alternative to cash flows from operations as an indication of our liquidity, or indicative of funds available to fund our cash needs including our ability to make future distributions to our shareholders. Adjusted net investment income should not be construed as a historic performance measure or as more relevant or accurate than the current GAAP methodology in calculating net investment income and its applicability in evaluating our operating performance.
The following table shows the TRS interest income and financing charges for the three and nine months ended September 30, 2016 and 2015.
| Three Months Ended September 30, |
Nine Months Ended September 30, |
|||||||||||||||
| (in thousands, except per share amounts) |
2016 | 2015 | 2016 | 2015 | ||||||||||||
| Interest and fee income included in TRS fair value |
$ | 5,217 | $ | 5,174 | $ | 5,217 | $ | 5,174 | ||||||||
| Financing charges included in TRS fair value |
(1,026 | ) | (794 | ) | (1,026 | ) | (794 | ) | ||||||||
|
|
|
|
|
|
|
|
|
|||||||||
| Subtotal |
4,191 | 4,380 | 4,191 | 4,380 | ||||||||||||
| Interest and fee income included in TRS net realized gains |
4,639 | 5,138 | 14,390 | 12,294 | ||||||||||||
| Financing charges included in TRS net realized gains |
(1,648 | ) | (1,181 | ) | (4,616 | ) | (2,889 | ) | ||||||||
| Less: amounts included in prior period fair value |
(3,975 | ) | (4,361 | ) | (3,762 | ) | (3,032 | ) | ||||||||
|
|
|
|
|
|
|
|
|
|||||||||
| TRS net interest spread |
$ | 3,207 | $ | 3,976 | $ | 10,203 | $ | 10,753 | ||||||||
|
|
|
|
|
|
|
|
|
|||||||||
| TRS net interest spread per share |
$ | 0.01 | $ | 0.02 | $ | 0.03 | $ | 0.04 | ||||||||
|
|
|
|
|
|
|
|
|
|||||||||
The following table presents a reconciliation of our net investment income to adjusted net investment income for the three and nine months ended September 30, 2016 and 2015; the increase in adjusted net investment income was primarily the result in the growth of our Investment Portfolio and earnings thereon.
| Three Months Ended September 30, |
Nine Months Ended September 30, |
|||||||||||||||
| (in thousands, except per share amounts) |
2016 | 2015 | 2016 | 2015 | ||||||||||||
| Net investment income (GAAP) |
$ | 53,164 | $ | 45,628 | $ | 156,736 | $ | 127,578 | ||||||||
| Add: Estimated unearned performance-based incentive fees |
— | — | — | — | ||||||||||||
| Add: TRS net interest spread |
3,207 | 3,976 | 10,203 | 10,753 | ||||||||||||
|
|
|
|
|
|
|
|
|
|||||||||
| Adjusted net investment income (non-GAAP) |
$ | 56,371 | $ | 49,604 | $ | 166,939 | $ | 138,331 | ||||||||
|
|
|
|
|
|
|
|
|
|||||||||
| Net investment income per share (GAAP) |
$ | 0.17 | $ | 0.17 | $ | 0.52 | $ | 0.52 | ||||||||
|
|
|
|
|
|
|
|
|
|||||||||
| Adjusted net investment income per share (non-GAAP) |
$ | 0.18 | $ | 0.19 | $ | 0.55 | $ | 0.56 | ||||||||
|
|
|
|
|
|
|
|
|
|||||||||
Net Assets, Net Asset Value per Share, Annual Investment Return and Total Return Since Inception
Net assets increased $164.06 million and $380.54 million during the nine months ended September 30, 2016 and 2015, respectively. The most significant increase in net assets during the nine months ended September 30, 2016 and 2015 was attributable
100
Table of Contents
to capital transactions including (i) the issuance of shares of common stock and (ii) reinvestment of distributions in the combined amount of $212.57 million and $548.70 million, respectively. Our operations resulted in net assets increasing $195.87 million and $1.48 million during the nine months ended September 30, 2016 and 2015, respectively. Our overall increase in net assets was partially offset by distributions to shareholders in the amount of $182.98 million and $148.72 million and the repurchase of shares of common stock in the amount of $61.40 million and $20.91 million during the nine months ended September 30, 2016 and 2015, respectively.
Our net asset value per share was $8.97 and $9.26 on September 30, 2016 and 2015, respectively. After considering (i) the overall changes in net asset value per share, (ii) distributions paid of approximately $0.60 per share during both nine months ended September 30, 2016 and 2015 and (iii) the assumed reinvestment of those distributions at 90% of the prevailing offering price per share, the total investment return was 7.45% and 0.57% (not annualized) for shareholders who held our shares over the entire nine-month period ending September 30, 2016 and 2015, respectively.
Initial shareholders who subscribed to the Initial Offering in June 2011 with an initial investment of $10,000 and an initial purchase price equal to $9.00 per share (public offering price net of sales load) have seen the value of their investment grow by 53.0% (see first chart below), or an annualized return of 8.4% (see second chart below). Initial shareholders who subscribed to the Initial Offering in June 2011 with an initial investment of $10,000 and an initial purchase price equal to $10.00 per share (the initial public offering price) have registered a total investment return of 37.7% (see first chart below), or an annualized return of 6.2% (see second chart below). The S&P/LSTA Leveraged Loan Index, a primary measure of senior debt covering the U.S. leveraged loan market, which currently consists of approximately 1,100 credit facilities throughout numerous industries, and the Merrill Lynch US High Yield Master II Index, a primary measure of subordinated debt consisting of approximately 2,000 high yield corporate bonds, registered cumulative total returns of approximately 24.2% and 39.7%, respectively, in the period from June 17, 2011 to September 30, 2016.
Growth of $10,000 Initial Investment(1)
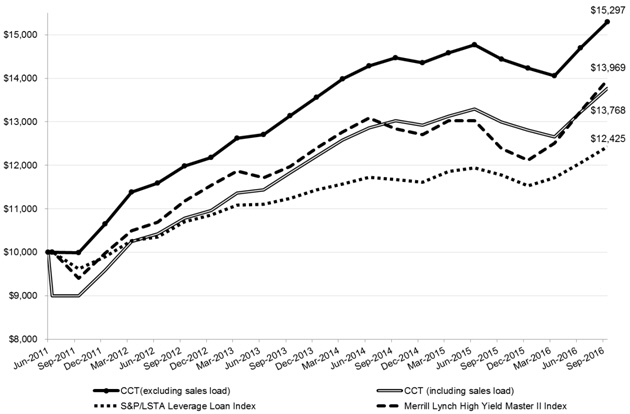
| (1) | Cumulative performance: June 17, 2011 to September 30, 2016 |
The calculations for the Growth of $10,000 Initial Investment in the shares of our common stock are based upon (i) an initial investment of $10,000 in our common stock at the beginning of the period at a share price of $10.00 per share (including sales load) and $9.00 per share (excluding sales load), (ii) assumed reinvestment of monthly distributions in accordance with our distribution reinvestment plan, (iii) the sale of the entire investment position at the net asset value per share on the last day of the period; and (iv) distributions payable, if any, on the last day of the period.
101
Table of Contents
Average Annualized Total Returns
as of September 30, 2016
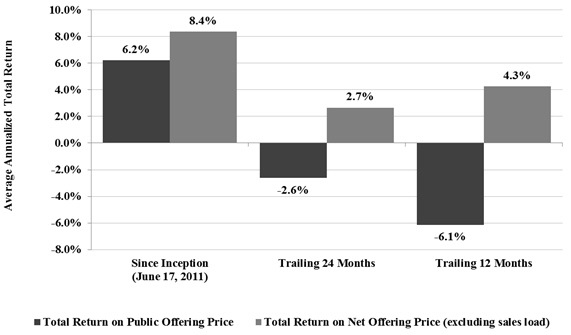
| Since Inception (June 17, 2011) |
Trailing 24 Months | Trailing 12 Months | ||||||||||
| Public Offering Price/Share |
$ | 10.00 | $ | 11.30 | $ | 10.45 | ||||||
| Net Offering Price/Share |
$ | 9.00 | $ | 10.17 | $ | 9.41 | ||||||
| Distributions/Share |
$ | 4.16 | $ | 1.61 | $ | 0.81 | ||||||
| Terminal Value/Share (NAV) |
$ | 8.97 | $ | 8.97 | $ | 8.97 | ||||||
In the chart above, we also present the average annual returns for the trailing 24 months and trailing 12 months, in each case assuming (i) the purchase of shares of common stock at the public offering price and net offering price (90% of public offering price) at the beginning of the period, (ii) reinvestment of distributions in the common stock, (iii) a terminal value at September 30, 2016 equal to net asset value of $8.97 per share and (iv) distributions payable to shareholders as of September 30, 2016.
Our shares are illiquid investments for which there is currently not a secondary market. You should not expect to be able to resell your shares regardless of how we perform. If you are able to sell your shares, you will likely receive less than your purchase price. Our net asset value and annualized returns — which are based in part upon determinations of fair value of Level 3 investments by our board of directors, not active market quotations — are inherently uncertain. Past performance is not a guarantee of future results.
Critical Accounting Policies and Estimates
Our discussion and analysis of our financial condition and results of operations are based upon our unaudited condensed consolidated financial statements which have been prepared in accordance with GAAP. The preparation of our unaudited condensed consolidated financial statements requires management to make estimates and assumptions that affect the reported amounts of assets, liabilities, revenues and expenses. Note 2. “Significant Accounting Policies” to our unaudited condensed consolidated financial statements describes the significant accounting policies and methods used in the preparation of our consolidated financial statements. We consider the accounting policies listed below to be critical because they involve management judgments and assumptions, require estimates about matters that are inherently uncertain and are important for understanding and evaluating our reported financial results. These judgments affect (i) the reported amounts of assets and liabilities, (ii) our disclosure of contingent assets and liabilities as of the dates of the financial statements and (iii) the reported amounts of revenue and expenses during the reporting periods. With different estimates or assumptions, materially different amounts could be reported in our financial statements. Changes in the economic environment, financial markets and any other parameters used in determining such estimates could cause actual results to differ materially from the amounts reported based on these policies.
102
Table of Contents
Valuation of Investments and Unrealized Gain (Loss) – Our investments consist primarily of investments in senior and subordinated debt of private U.S. companies and are presented in our consolidated financial statements at fair value. See Note 3. “Investments,” in our unaudited condensed consolidated financial statements for more information on our investments. As described more fully in Note 2. “Significant Accounting Policies” and Note 5. “Fair Value of Financial Instruments” in our unaudited condensed consolidated financial statements, a valuation hierarchy based on the level of independent, objective evidence available regarding value is used to measure the fair value of our investments. Investments for which market quotations are readily available are valued using market quotations, which are generally obtained from independent pricing services, broker-dealers or market makers. With respect to our portfolio investments for which market quotations are not readily available, our board of directors is responsible for determining in good faith the fair value of our portfolio investments in accordance with, and the consistent application of, the valuation policy and procedures approved by the board of directors, based on, among other things, the input of our Advisors, audit committee and independent third-party valuation firms.
We utilize several valuation techniques that use unobservable inputs and assumptions in determining the fair value of our Level 3 investments. For senior debt, subordinated debt and structured products categorized as Level 3 investments, we initially value the investment at its transaction price and subsequently value using (i) market data for similar instruments (e.g., recent transactions or indicative broker quotes), (ii) comparisons to benchmark derivative indices and/or (iii) valuation models. Valuation models are based on yield analysis and discounted cash flow techniques, where the key inputs are based on relative value analyses and the assignment of risk-adjusted discounted rates derived from the analysis of similar credit investments from similar issuers. In addition, an illiquidity discount is applied where appropriate. The valuation techniques used by us for other types of assets and liabilities that are classified as Level 3 investments are described in Note 2 to our unaudited condensed consolidated financial statements. The unobservable inputs and assumptions may differ by asset and in the application of our valuation methodologies. The reported fair value estimates could vary materially if we had chosen to incorporate different unobservable inputs and other assumptions.
We and our board of directors conduct our fair value determination process on a quarterly basis and any other time when a decision regarding the fair value of our portfolio investments is required. A determination of fair value involves subjective judgments and estimates. Due to the inherent uncertainty of determining the fair value of portfolio investments that do not have a readily available market value, the fair value of the our portfolio investments may differ significantly from the values that would have been determined had a readily available market value existed for such investments, and the differences could be material. Further, such investments are generally less liquid than publicly traded securities. If we were required to liquidate a portfolio investment that does not have a readily available market value in a forced or liquidation sale, we could realize significantly less than the fair value recorded by us.
The table below presents information on the significant presence of investments classified as Level 3 as of September 30, 2016 and December 31, 2015:
| (in thousands) |
September 30, 2016 | December 31, 2015 | ||||||
| Fair value of investments classified as Level 3 |
$ | 3,011,413 | $ | 2,416,535 | ||||
| Total fair value of investments |
$ | 4,062,698 | $ | 3,729,332 | ||||
| % of fair value classified as Level 3 |
74.1 | % | 64.8 | % | ||||
| Number of positions classified as Level 3 |
110 | 93 | ||||||
| Total number of positions |
205 | 180 | ||||||
| % of positions classified as Level 3 |
53.7 | % | 51.7 | % | ||||
| Fair value of individual positions classified as Level 3: |
||||||||
| Highest fair value |
$ | 137,019 | $ | 102,760 | ||||
| Lowest fair value |
$ | 0 | $ | 0 | ||||
| Average fair value |
$ | 27,376 | $ | 25,984 | ||||
The ranges of unobservable inputs used in the fair value measurement of the Company’s Level 3 investments as of September 30, 2016 and December 31, 2015 are described in Note 5. “Fair Value of Financial Instruments” in our unaudited condensed consolidated financial statements, as well as the directional impact to the valuation from an increase in various unobservable inputs.
103
Table of Contents
In addition to impacting the estimated fair value recorded for our investments in our statement of assets and liabilities, had we used different key unobservable inputs to determine the estimated fair value of our investments, amounts recorded in our statement of operations, including the net change in unrealized appreciation and depreciation on investments, investment advisory fees and performance-based incentive fees would also be impacted since such amounts are directly impacted by the estimated fair value of our assets. For instance, a 5% overstatement of the fair value of our Level 3 investments as of September 30, 2016, assuming all other estimates remain unchanged, would otherwise result in a $143.40 million overstatement of net change in unrealized appreciation on investments, a $0.24 million overstatement of our investment advisory fees payable to our Advisors, a $143.17 million overstatement of our net increase in net assets resulting from operations, a $0.47 overstatement in our earnings per share and a $0.47 overstatement of our net asset value per share.
Off-Balance Sheet Arrangements
We had no off-balance sheet arrangements as of September 30, 2016.
Contractual Obligations
Investment Advisory Agreements – We have entered into the Investment Advisory Agreement with CNL for the overall management of our investment activities. We and CNL have also entered into the Sub-Advisory Agreement with KKR, under which KKR is responsible for the day-to-day management of our Investment Portfolio and TRS Portfolio. CNL compensates KKR for advisory services that it provides to us with 50% of the base management fees and performance-based incentive fees that CNL receives under the Investment Advisory Agreement. Pursuant to the Investment Advisory Agreement, CNL earns a base management fee equal to an annual rate of 2% of our average gross assets (including unrealized appreciation or depreciation on the TRS and collateral posted with the custodian in connection with the TRS, but excluding deferred offering expenses and, from and after April 11, 2016, cash and short-term investments), and an incentive fee based on our performance. The incentive fee is comprised of the following two parts:
| (i) | a subordinated incentive fee on pre-incentive fee net investment income, paid quarterly, if earned, computed as the sum of (a) 100% of quarterly pre-incentive fee net investment income in excess of 1.75% of average adjusted capital up to a limit of 0.4375% of average adjusted capital, and (b) 20% of pre-incentive fee net investment income in excess of 2.1875% of average adjusted capital, and |
| (ii) | an incentive fee on capital gains paid annually, if earned, equal to (A) 20% of all realized gains on a cumulative basis from inception, net of (1) all realized losses on a cumulative basis, (2) unrealized depreciation at year-end and (3) disregarding any net realized gains associated with the TRS interest spread, which represents the difference between (a) the interest and fees received on total return swaps, and (b) the financing fees paid to the total return swaps counterparty, less (B) the aggregate amount of any previously paid incentive fee on capital gains. |
As of September 30, 2016, we had accrued a subordinated incentive fee on income of $5.82 million. See Note 6. “Related Party Transactions” in our unaudited condensed consolidated financial statements for expanded discussion of the Investment Advisory and Sub-Advisory Agreements.
Beginning January 1, 2017, the subordinated incentive fee on income will be subject to a total return requirement, which provides generally that no incentive fee will be payable except to the extent that 20.0% of the cumulative net increase in net assets resulting from operations over the then-current and three preceding calendar quarters (or, if four calendar quarters have not passed, then the time period since January 1, 2017) exceeds the cumulative incentive fees accrued and/or paid for the same period. Accordingly, any subordinated incentive fee on income that is payable in a calendar quarter will be limited to the lesser of (i) 20.0% of all of our pre-incentive fee net investment income when our pre-incentive fee net investment income exceeds the applicable quarterly hurdle rate for such calendar quarter, subject to the catch-up provision, and (ii) (x) 20.0% of the cumulative net increase in net assets resulting from operations for the then-current and three preceding calendar quarters minus (y) the cumulative incentive fees accrued and/or paid for the three preceding calendar quarters or period since January 1, 2017, whichever period is shorter. For the foregoing purpose, the “cumulative net increase in net assets resulting from operations” is the sum of our pre-incentive fee net investment income, base management fees, realized gains and losses and unrealized appreciation and depreciation for the then-current and three preceding calendar quarters. There will be no accumulation of amounts on the hurdle rate from quarter to quarter and, accordingly, there will be no clawback of amounts previously paid if subsequent quarters are below the applicable quarterly hurdle rate and there will be no delay of payment if prior quarters are below the applicable quarterly hurdle rate.
The terms of the Investment Advisory Agreement entitle CNL (and indirectly KKR) to receive up to 5% of gross proceeds in connection with the Offerings as reimbursement for organization and offering expenses incurred by the Advisors on our behalf.
As of September 30, 2016, the Advisors had incurred $10.66 million for offering expenses from the Follow-On Offering, or 0.7% of total gross offering proceeds of the Follow-On Offering, excluding the reinvestment of distributions. As of the date of this filing, the Advisors were fully reimbursed for all offering expenses in connection with the Follow-On Offering that they incurred on our behalf as of September 30, 2016. The Advisors continued to incur offering expenses on our behalf throughout the remainder of the Follow-On Offering period and we expect to continue reimbursement of the Advisors for offering expenses they incurred on our behalf during the fourth quarter of 2016. We expect the reimbursement rate to remain at or below 1.0% of total gross offering proceeds of the Follow-On Offering.
104
Table of Contents
Unfunded Commitments - Unfunded commitments to provide funds to portfolio companies are not recorded on our consolidated statements of assets and liabilities. Because these commitments may expire without being drawn upon, the total commitment amount does not necessarily represent future cash requirements. We intend to use cash flow from scheduled and early principal repayments and proceeds from borrowings and securities offerings to fund these commitments. As of September 30, 2016, our unfunded investment commitments are as follows:
| Category / Company (1) |
||||
| Unfunded revolvers/delayed draw loan commitments: |
||||
| A10 Capital, LLC |
$ | 10,058 | ||
| BeyondTrust Software, Inc. |
1,090 | |||
| SouthernCarlson |
6,219 | |||
| SouthernCarlson |
5,182 | |||
| Safety Technology Holdings, Inc. |
421 | |||
| Smile Brands, Inc. |
3,589 | |||
| SquareTwo Financial Corp. |
2,704 | |||
| Centric Group LLC |
6,522 | |||
|
|
|
|||
| Total unfunded revolvers/delayed draw loan commitments |
$ | 35,785 | ||
|
|
|
|||
| Unfunded term loan commitments: |
||||
| Centric Group LLC(2) |
$ | 75,000 | ||
|
|
|
|||
| Total unfunded term loan commitments |
$ | 75,000 | ||
|
|
|
|||
| Unfunded equity commitments: |
||||
| Central Park Leasing SARL |
$ | 2,240 | ||
| GA Capital Specialty Lending Fund |
53,925 | |||
| Home Partners of America, Inc. |
2,150 | |||
| KKR BPT Holdings Aggregator, LLC |
9,500 | |||
| Orchard Marine, Ltd. |
8,838 | |||
| Polyconcept North America Holdings, Inc. |
1,211 | |||
| Star Mountain SMB Multi-Manager Credit Platform, LP |
31,400 | |||
| Toorak Capital |
26,120 | |||
|
|
|
|||
| Total unfunded equity commitments |
$ | 135,384 | ||
|
|
|
|||
| (1) | May be commitments to one or more entities affiliated with the named company. |
| (2) | Commitment funded on October 14, 2016. |
We also have a commitment to provide up to $345.10 million of capital to SCJV. The capital commitment to SCJV can be satisfied with contributions of either cash or assets, and no capital commitment can be drawn without an affirmative vote by one of our representatives on SCJV’s board of managers.
We estimate we have sufficient liquidity in the form of cash on hand, borrowing capacity under our revolving credit facilities and scheduled and early principal repayments to fund such unfunded commitments when the need arises.
Borrowings - As discussed above under “Capital Resources and Liquidity – Borrowings,” we, either directly or through our wholly owned subsidiaries, have borrowing agreements with several lenders in connection with our revolving credit facilities and the 2014 Senior Secured Term Loan. As of September 30, 2016, the credit facilities provided for $320.35 million of additional borrowing capacity. (See — “Capital Resources and Liquidity — Borrowings” above and Note 10. “Borrowings” in our consolidated financial statements for expanded discussion of our borrowings.)
105
Table of Contents
A summary of our significant contractual payment obligations for the repayment of outstanding borrowings and interest expense and other fees related to our borrowings at September 30, 2016 is as follows:
| (in thousands) |
Total | < 1 year | 1-3 years | 3-5 years | After 5 years | |||||||||||||||
| BNP Credit Facility |
$ | 138,000 | $ | 138,000 | $ | — | $ | — | $ | — | ||||||||||
| Deutsche Bank Credit Facility |
167,000 | 167,000 | — | — | — | |||||||||||||||
| Senior Secured Revolving Credit Facility |
636,346 | — | — | 636,346 | — | |||||||||||||||
| 2014 Senior Secured Term Loan |
390,000 | 4,000 | 8,000 | 378,000 | — | |||||||||||||||
| Sumitomo Credit Facility |
104,750 | — | — | 104,750 | — | |||||||||||||||
| CS Facility |
25,029 | 25,029 | — | — | — | |||||||||||||||
| Interest and Credit Facilities Fees Payable(1) |
146,878 | 43,989 | 69,800 | 33,089 | — | |||||||||||||||
|
|
|
|
|
|
|
|
|
|
|
|||||||||||
| Total |
$ | 1,608,003 | $ | 378,018 | $ | 77,800 | $ | 1,152,185 | $ | — | ||||||||||
|
|
|
|
|
|
|
|
|
|
|
|||||||||||
| (1) | Estimated interest payments have been calculated based on interest rates of our borrowings as of September 30, 2016. |
Related Party Transactions
We have entered into agreements with our Advisors and certain of their affiliates, whereby, we agree to pay certain fees to, or reimburse certain expenses of, our Advisors and their affiliates for investment and advisory services, selling commissions and marketing support fees in connection with our Offerings, and reimbursement of offering and administrative and operating fees and costs. See Note 6. “Related Party Transactions” in our unaudited condensed consolidated financial statements and Part III—Item 13. “Certain Relationships and Related Transactions, and Director Independence” in our Form 10-K for the year ended December 31, 2015 for a discussion of the various related party transactions, agreements and fees.
Impact of Recent Accounting Pronouncements
See Item 1. “Financial Statements” for a summary of the impact of any recent accounting pronouncements, if any.
| Item 3. | Quantitative and Qualitative Disclosures About Market Risk |
Interest Rate Risk
We are subject to financial market risks, in particular changes in interest rates. Future changes in interest rates will likely have effects on the interest income we earn on our portfolio investments, the fair value of our fixed income investments, the interest rates and interest expense associated with the money we borrow and the fair value of loan balances.
Subject to the requirements of the 1940 Act, we may hedge against interest rate fluctuations by using standard hedging instruments such as futures, options and forward contracts. Although hedging activities may insulate us against adverse changes in interest rates, they may also limit our ability to participate in the benefits of lower interest rates. As of September 30, 2016, we have three pay-fixed, receive-floating interest rate swaps which we pay an annual fixed rate of 0.84% to 1.43% and receive three-month LIBOR on an aggregate notional amount of $600 million. The interest rate swaps have quarterly settlement payments.
As of September 30, 2016, approximately 77.8% of our portfolio of debt investments (excluding TRS assets), or approximately $3 billion measured at par value, featured floating or variable interest rates. The variable interest rate debt investments usually provide for interest payments based on three-month LIBOR (the base rate) and typically have durations of three months after which the base rates are reset to the then prevailing three-month LIBOR. As of September 30, 2016, approximately 93.2% of our portfolio of variable interest rate debt investments, or approximately $2.76 billion measured at par value, featured minimum base rates, or base rate floors, and the weighted average base rate floor for such investments was 1.0%. Variable interest rate investments that feature a base rate floor generally reset to the then prevailing three-month LIBOR only if the reset base rate exceeds the base rate floor on the applicable interest rate reset date, in which cases, we may benefit through an increase in interest income from such interest rate adjustments. At September 30, 2016, we held an aggregate investment position of $202.75 million at par value in variable interest rate debt investments that featured variable interest rates without any minimum base rates, or approximately 6.8% of our portfolio of variable interest rate debt investments. In the case of these “no base rate floor” variable interest debt investments held in our portfolio, we may benefit from increases in the base rates that may subsequently result in an increase in interest income from such interest rate adjustments.
Because we borrow money to make investments, our net investment income is partially dependent upon the difference between the interest rates at which we invest borrowed funds and the interest rates at which we borrow funds. In periods of rising interest rates, if we have borrowed capital with floating interest rates, our interest expense will increase, which will increase our financing costs and may reduce our net investment income, especially to the extent we continue to acquire and hold fixed-rate debt investments. As a result, there can be no assurance that a significant change in market interest rates will not have a material adverse effect on our net investment income.
Pursuant to the terms of our credit facilities, 2014 Senior Secured Term Loan and CS Facility, as discussed above (see “Capital Resources and Liquidity – Borrowings”), all of our borrowing as of September 30, 2016 provide for floating base rates based on short-term LIBOR or EURIBOR. Therefore, if we were to completely draw down (i) the unused commitment amounts in our
106
Table of Contents
Deutsche Bank Credit Facility (as amended), (ii) the maximum commitment amount in our BNP Credit Facility, (iii) the maximum commitment in our Senior Secured Revolving Credit Facility under an interest election of LIBOR plus 2.25%, and (iv) the maximum commitment in our SMBC Credit Facility, we expect that our weighted average direct interest rate would decrease by approximately 9 basis points (“bps”), as compared to our current weighted average direct interest cost for borrowed funds. We expect that any further expansion of our current revolving credit facilities, or any future credit facilities that we or any subsidiary may enter into, will also be based on a floating base rate. As a result, we are subject to continuous risks relating to changes in market interest rates.
Under the terms of the TRS Agreements between Halifax Funding and BNS, Halifax Funding pays interest to BNS at a floating rate based on three-month LIBOR in exchange for the right to receive the economic benefits of a portfolio of TRS assets having a maximum aggregate notional amount of $500 million.
Based on our September 30, 2016 balance sheet, the following table shows the annual impact of base rate changes in interest rates (considering interest rate floors for variable rate instruments) assuming no changes in our investment and borrowing structure:
| As of September 30, 2016 (in millions) | ||||||||||||||||||||
| Basis Point Change |
Interest Income |
Interest Expense |
Net Investment Income (1) |
TRS Portfolio (2) |
Interest Rate Swap (3) |
|||||||||||||||
| Down 50 basis points |
$ | (0.850 | ) | $ | (4.886 | ) | $ | 4.036 | $ | 1.276 | $ | (3.000 | ) | |||||||
| Up 50 basis points |
$ | 4.130 | $ | 6.745 | $ | (2.615 | ) | $ | (1.011 | ) | $ | 3.000 | ||||||||
| Up 100 basis points |
$ | 16.517 | $ | 14.050 | $ | 2.467 | $ | (1.315 | ) | $ | 6.000 | |||||||||
| Up 150 basis points |
$ | 29.297 | $ | 21.356 | $ | 7.941 | $ | (1.547 | ) | $ | 9.000 | |||||||||
| Up 200 basis points |
$ | 42.076 | $ | 28.661 | $ | 13.415 | $ | (1.779 | ) | $ | 12.000 | |||||||||
| (1) | Excludes the impact of performance-based incentive fees. See Note 6. “Related Party Transactions” in Item 8. “Financial Statements and Supplementary Data” for more information on the performance-based incentive fees. |
| (2) | Pursuant to the TRS Agreements, Halifax Funding receives from BNS all collected interest and fees derived from the TRS assets and pays to BNS interest at a rate equal to three-month LIBOR plus 140 bps per annum on the settled notional amount of TRS assets. As of September 30, 2016, 89.6% of the TRS assets, or approximately $237.27 million measured at par value, featured floating or variable interest rates. At September 30, 2016, 98.3% of the TRS assets with variable interest rates featured minimum base rate floors, or approximately $233.24 million measured at par value, and the weighted average base rate floor for such TRS assets was 1.1%. As of September 30, 2016, the total notional amount of the portfolio of TRS assets was $258.52 million, and the settled notional amount was $263.23 million. For the purpose of presenting the net interest sensitivity analysis above, we have assumed that all TRS assets are settled as of September 30, 2016 and that the TRS notional amount would equal $258.52 million upon which the financing payments to BNS are based. |
| (3) | Excludes the impact of quarterly fixed rate payments on interest rate swaps. See Note 4. “Derivative Instruments” in Item 8. “Financial Statements and Supplementary Data” for more information on our open interest rate swaps as of the end of the reporting period. |
The interest rate sensitivity analysis presented above does not consider the potential impact of the changes in fair value of our debt investments and the net asset value of our common stock in the event of sudden increases in interest rates associated with high yield corporate bonds. Approximately 22.2% of our debt investment portfolio was invested in fixed interest rate, high yield corporate debt investments as of September 30, 2016. Rising market interest rates will most likely lead to fair value declines for high yield corporate bonds and a decline in the net asset value of our common stock, while declining market interest rates will most likely lead to an increase in bond values.
As of September 30, 2016, approximately 45.7% of our fixed interest rate debt investments, or approximately $317.54 million measured at fair value, had prices that are generally available from third party pricing services. We consider these debt investments to be one of the more liquid subsets of our Investment Portfolio since these types of assets are generally broadly syndicated and owned by a wide group of institutional investors, business development companies, mutual funds and other investment funds. Additionally, this group of assets is susceptible to revaluation, or changes in bid-ask values, in response to sudden changes in expected rates of return associated with these investments. We have other fixed interest rate investments in the less liquid subset of our Investment Portfolio that are not included in this analysis.
We have computed a duration of approximately 5.0 for this liquid/fixed subset of our total portfolio. This implies that a sudden increase in the market’s expected rate of return of 100 basis points for this subset of our Investment Portfolio may result in a reduction in fair value of approximately 5.0%, all other financial and market factors assuming to remain unchanged. A 5.0% decrease in the valuation of this Investment Portfolio subset equates to a decrease of $15.79 million, or a 0.6% decline in net assets relative to $8.97 net asset value per share as of September 30, 2016.
107
Table of Contents
Foreign Currency Risk
From time to time, we may make investments that are denominated in a foreign currency that are subject to the effects of exchange rate movements between the foreign currency of each such investment and the U.S. dollar, which may affect future fair values and cash flows, as well as, amounts translated into U.S. dollars for inclusion in our consolidated financial statements.
The table below presents the effect that a 10% immediate, unfavorable change in the foreign currency exchange rates (i.e. strengthening of the U.S. Dollar) would have on the fair value of investments in our Investment Portfolio denominated in foreign currencies as of September 30, 2016, by foreign currency, all other valuation assumptions remaining constant. Our TRS Portfolio did not contain any investments denominated in foreign currencies as of September 30, 2016. In addition, the table below presents the par value of our investments denominated in foreign currencies and the notional amount of foreign currency forward contracts in local currency in place as of September 30, 2016, to hedge against foreign currency risks.
| Investments Denominated in Foreign Currencies | Hedges | |||||||||||||||||||||||
| As of September 30, 2016 | Reduction in Fair Value as of September 30, 2016 if 10% Adverse Change in Exchange Rate(2) |
As of September 30, 2016 | ||||||||||||||||||||||
| (in thousands) |
Par Value/ Cost in Local Currency(1) |
Par Value/ Cost in US$(1) |
Fair Value | Net Foreign Currency Hedge Amount in Local Currency |
Net Foreign Currency Hedge Amount in U.S. Dollars |
|||||||||||||||||||
| Euros |
€ | 389,613 | $ | 437,603 | $ | 369,610 | $ | 36,961 | € | 306,846 | $ | 344,400 | ||||||||||||
| British Pound Sterling |
£ | 76,838 | 100,755 | 99,768 | 9,977 | £ | 76,886 | 114,443 | ||||||||||||||||
| Australian Dollars |
A$ | 32,119 | 24,761 | 16,972 | 1,697 | A$ | 30,887 | 22,631 | ||||||||||||||||
| Swedish Kronor |
SEK | 97,249 | 15,145 | 5,006 | 501 | SEK | — | — | ||||||||||||||||
|
|
|
|
|
|
|
|
|
|||||||||||||||||
| Total |
$ | 578,264 | $ | 491,356 | $ | 49,136 | $ | 481,474 | ||||||||||||||||
|
|
|
|
|
|
|
|
|
|||||||||||||||||
| (1) | Amount represents the par value of debt investments and cost of equity investments denominated in foreign currencies. |
| (2) | Excludes effect, if any, of any foreign currency hedges. |
As illustrated in the table above, we use derivative instruments from time to time, including foreign currency forward contracts and cross currency swaps, to manage the impact of fluctuations in foreign currency exchange rates. In addition, we have the ability to borrow in foreign currencies under our Senior Secured Revolving Credit Facility, which provides a natural hedge with regard to changes in exchange rates between the foreign currencies and U.S. dollar and reduces our exposure to foreign exchange rate differences. We are typically a net receiver of these foreign currencies in respect of our international investment positions, and, as a result, our investments denominated in foreign currencies, to the extent not hedged, benefit from a weaker U.S. dollar and are adversely affected by a stronger U.S. dollar.
As of September 30, 2016, the net contractual amount of our foreign currency forward contracts and cross currency swaps totaled $481.47 million, all of which related to hedging of our foreign currency denominated debt investments. As of September 30, 2016, we had $51.38 million of outstanding borrowings denominated in foreign currencies on our Senior Secured Revolving Credit Facility and CS Facility.
During the three and nine months ended September 30, 2016, our foreign currency transactions and foreign currency translation adjustment recorded in our condensed consolidated statements of operations resulted in net realized and unrealized (losses) gains of ($0.40) million and ($1.0) million, respectively, including ($0.24) million and $1.02 million, respectively, from our borrowings denominated in foreign currencies. Our foreign currency forward contracts and cross currency swaps, employed for hedging purposes, generated net realized and unrealized gains (losses) of ($2.52) million and $5.37 million during the three and nine months ended September 30, 2016, respectively. We do not isolate that portion of the results of operations resulting from changes in foreign exchange rates on investments from the fluctuations arising from changes in fair values of investments held; therefore, the fluctuations related to foreign exchange rate conversion are included with the net realized gain (loss) and unrealized appreciation (depreciation) on investments. See “Results of Operations — Net Change in Unrealized Appreciation or Depreciation” for additional information on the foreign currency exchange changes.
108
Table of Contents
| Item 4. | Controls and Procedures |
Evaluation of Disclosure Controls and Procedures
Pursuant to Rule 13a-15(b) under the Exchange Act, under the supervision and with the participation of our management, including our principal executive officer and principal financial officer, we conducted an evaluation of the effectiveness of our disclosure controls and procedures (as defined under Rule 13a-15(e) under the Exchange Act) as of the end of the period covered by this report. Based upon that evaluation, our management, including our principal executive officer and principal financial officer, concluded that our disclosure controls and procedures are effective as of the end of the period covered by this report to provide reasonable assurance that material information required to be included in our periodic SEC reports is recorded, processed, summarized and reported within the time periods specified in the relevant SEC rules and forms.
Changes in Internal Control over Financial Reporting
During the most recent fiscal quarter, there was no change in our internal controls over financial reporting (as defined under Rule 13a-15(f) under the Exchange Act) that has materially affected, or is reasonably likely to materially affect, our internal controls over financial reporting.
| Item 1. | Legal Proceedings – None |
Investments in which we have a non-controlling interest may involve risks specific to third-party management of those investments.
We may also co-invest with third parties through partnerships, joint ventures or other entities, thereby acquiring jointly-controlled or non-controlling interests in certain investments in conjunction with participation by one or more third parties in such investment. Such joint venture partners or third party managers may include former KKR personnel or associated persons. As co-investors, we may have interests or objectives that are inconsistent with those of the third-party partners or co-venturers. Although we may not have full control over these investments and therefore, may have a limited ability to protect its position therein, we expect that we will negotiate appropriate rights to protect our interests. Nevertheless, such investments may involve risks not present in investments where a third party is not involved, including the possibility that a third-party partner or co-venturer may have financial difficulties, resulting in a negative impact on such investment, may have economic or business interests or goals which are inconsistent with ours, or may be in a position to take (or block) action in a manner contrary to the our investment objectives or the increased possibility of default by, diminished liquidity or insolvency of, the third party, due to a sustained or general economic downturn. Third-party partners or co-venturers may opt to liquidate an investment at a time during which such liquidation is not optimal for us. In addition, we may in certain circumstances be liable for the actions of its third-party partners or co-venturers. In those circumstances where such third parties involve a management group, such third parties may receive compensation arrangements relating to such investments, including incentive compensation arrangements.
| Item 2. | Unregistered Sales of Equity Securities and Use of Proceeds |
| (a) | None. |
| (b) | None. |
| (c) | The information required by this Item 2(c) is set forth in Note 9 – “Share Transactions” to the unaudited condensed consolidated financial statements included in Item 1 of Part 1 of this Quarterly Report on Form 10-Q and is incorporated by reference herein. |
| Item 3. | Defaults Upon Senior Securities – None |
| Item 4. | Mine Safety Disclosures – Not applicable |
| Item 5. | Other Information – None |
| Item 6. | Exhibits |
The exhibits required by this item are set forth in the Exhibit Index attached hereto and are filed or incorporated as part of this report.
109
Table of Contents
Pursuant to the requirements of Section 13 or 15(d) of the Securities Exchange Act of 1934, the registrant has duly caused this report to be signed on its behalf by the undersigned, thereunto duly authorized, on the 11th day of November 2016.
| CORPORATE CAPITAL TRUST, INC. | ||
| By: | /s/ Thomas K. Sittema | |
| THOMAS K. SITTEMA | ||
| Chief Executive Officer | ||
| (Principal Executive Officer) | ||
| By: | /s/ Steven D. Shackelford | |
| STEVEN D. SHACKELFORD | ||
| Chief Financial Officer | ||
| (Principal Financial and Accounting Officer) | ||
110
Table of Contents
The following exhibits are filed or incorporated as part of this report
| 4.1 | Amended and Restated Distribution Reinvestment Plan, effective as of November 1, 2016. (Incorporated by reference to the Company’s Current Report on Form 8-K filed on October 12, 2016.) | |
| 31.1 | Certification of Chief Executive Officer of Corporate Capital Trust, Inc., Pursuant to Rule 13a-14(a), as Adopted Pursuant to Section 302 of the Sarbanes-Oxley Act of 2002. (Filed herewith.) | |
| 31.2 | Certification of Chief Financial Officer of Corporate Capital Trust, Inc., Pursuant to Rule 13a-14(a), as Adopted Pursuant to Section 302 of the Sarbanes-Oxley Act of 2002. (Filed herewith.) | |
| 32.1 | Certification of Chief Executive Officer and Chief Financial Officer of Corporate Capital Trust, Inc., Pursuant to 18 U.S.C. Section 1350, as Adopted Pursuant to Section 906 of the Sarbanes-Oxley Act of 2002. (Filed herewith.) | |
111