Attached files
| file | filename |
|---|---|
| EX-32.1 - CERTIFICATION OF THE CEO AND THE CFO - Corporate Capital Trust, Inc. | d298119dex321.htm |
| EX-31.2 - CERTIFICATION OF THE CFO - Corporate Capital Trust, Inc. | d298119dex312.htm |
| EX-31.1 - CERTIFICATION OF THE CEO - Corporate Capital Trust, Inc. | d298119dex311.htm |
| EX-21.1 - SUBSIDIARIES OF THE REGISTRANT - Corporate Capital Trust, Inc. | d298119dex211.htm |
Table of Contents
UNITED STATES
SECURITIES AND EXCHANGE COMMISSION
Washington, D.C. 20549
FORM 10-K
(Mark One)
| ☒ | ANNUAL REPORT PURSUANT TO SECTION 13 OR 15 (d) OF THE SECURITIES EXCHANGE ACT OF 1934 |
For the fiscal year ended: December 31, 2016
OR
| ☐ | TRANSITION REPORT PURSUANT TO SECTION 13 OR 15 (d) OF THE SECURITIES EXCHANGE ACT OF 1934 |
Commission file number 814-00827
Corporate Capital Trust, Inc.
(Exact name of registrant as specified in its charter)
| Maryland | 27-2857503 | |
| (State or other jurisdiction of incorporation or organization) |
(I.R.S. Employer Identification No.) |
| CNL Center at City Commons 450 South Orange Avenue Orlando, Florida |
32801 | |
| (Address of principal executive offices) | (Zip Code) |
Registrant’s telephone number, including area code: (866) 745-3797
Securities registered pursuant to Section 12(b) of the Act:
| Title of each class |
Name of exchange on which registered | |
| None | Not applicable |
Securities registered pursuant to Section 12(g) of the Act:
Common Stock, $0.001 par value per share
(Title of class)
Indicate by check mark if the registrant is a well-known seasoned issuer, as defined in Rule 405 of the Securities Act. Yes ☐ No ☒
Indicate by check mark if the registrant is not required to file reports pursuant to Section 13 or Section 15(d) of the Act. Yes ☐ No ☒
Indicate by check mark whether the registrant (1) has filed all reports required to be filed by Section 13 or 15(d) of the Securities Exchange Act of 1934 during the preceding 12 months (or for such shorter period that the registrant was required to file such reports), and (2) has been subject to such filing requirements for the past 90 days. Yes ☒ No ☐
Indicate by check mark whether the registrant has submitted electronically and posted on its corporate Web site, if any, every Interactive Data File required to be submitted and posted pursuant to Rule 405 of Regulation S-T (§232.405 of this chapter) during the preceding 12 months (or for such shorter period that the registrant was required to submit and post such files). Yes ☐ No ☐
Indicate by check mark if disclosure of delinquent filers pursuant to Item 405 of Regulation S-K (229.05 of this chapter) is not contained herein, and will not be contained, to the best of registrant’s knowledge, in definitive proxy or information statements incorporated by reference in Part III of this Form 10-K or any amendment to this Form 10-K. ☒
Indicate by check mark whether the registrant is a large accelerated filer, an accelerated filer, a non-accelerated filer, or a smaller reporting company. See definitions of “large accelerated filer”, “accelerated filer” and “smaller reporting company” in Rule 12b-2 of the Exchange Act.
| Large accelerated filer | ☐ | Accelerated filer | ☐ | |||
| Non-accelerated filer | ☒ (Do not check if a smaller reporting company) | Smaller reporting company | ☐ | |||
Indicate by check mark whether the registrant is a shell company (as defined in Rule 12b-2 of the Act). Yes ☐ No ☒
There is no established market for the Registrant’s shares of common stock. The Registrant closed the public offering of its shares of common stock in October 2016. Shares were offered and sold at $8.97 as of June 30, 2016. The number of shares held by non-affiliates as of June 30, 2016 (the last business day of the registrant’s most recently completed second fiscal quarter) was approximately 306,407,826.
As of March 15, 2017, there were 307,689,440 shares of the registrant’s common stock outstanding.
DOCUMENTS INCORPORATED BY REFERENCE
Registrant incorporates by reference portions of the Corporate Capital Trust, Inc. definitive proxy statement for the 2017 Annual Meeting of Shareholders (Items 10, 11, 12, 13 and 14 of Part III) to be filed no later than April 30, 2017. Certain exhibits previously filed with the Securities and Exchange Commission are incorporated by reference into Part IV of this report.
Table of Contents
i
Table of Contents
STATEMENT REGARDING FORWARD LOOKING INFORMATION
The following information contains statements that constitute forward-looking statements, within the meaning of Section 27A of the Securities Act of 1933, as amended (the “Securities Act”), and Section 21E of the Securities Exchange Act of 1934, as amended (the “Exchange Act”). These statements generally are characterized by the use of terms such as “may,” “should,” “plan,” “anticipate,” “estimate,” “intend,” “predict,” “believe” and “expect” or the negative of these terms or other comparable terminology. Although we believe that the expectations reflected in such forward-looking statements are based upon reasonable assumptions, our actual results could differ materially from those set forth in the forward-looking statements. Some factors that might cause such a difference include the following: persistent economic weakness at the global or national level, increased direct competition, changes in government regulations or accounting rules, changes in local, national and global capital market conditions, our ability to obtain or maintain credit lines or credit facilities on satisfactory terms, changes in interest rates, availability of proceeds from our offering of shares, our ability to identify suitable investments, our ability to close on identified investments, our ability to maintain our qualification as a regulated investment company and as a business development company, the ability of our Advisors (defined below) and their affiliates to attract and retain highly talented professionals, inaccuracies of our accounting estimates, the ability of our Advisors to locate suitable borrowers for our loans and the ability of such borrowers to make payments under their respective loans. Given these uncertainties, we caution you not to place undue reliance on such statements, which apply only as of the date hereof. We undertake no obligation to publicly release the results of any revisions to these forward-looking statements that may be made to reflect future events or circumstances or to reflect the occurrence of unanticipated events. The forward-looking statements should be read in light of the risk factors identified in Item A. “Risk Factors” of this report.
The forward-looking statements and projections contained in this report are excluded from the safe harbor protection provided by Section 27A of the Securities Act and Section 21E of the Exchange Act.
| Item 1. | Business |
General
Corporate Capital Trust, Inc. (which is referred to in this report as “we,” “our,” “us” and “our company”) is a non-diversified closed-end management investment company that has elected to be regulated as a business development company under the Investment Company Act of 1940, as amended, or the “1940 Act.” Formed as a Maryland corporation on June 9, 2010, we are externally managed by CNL Fund Advisors Company (“CNL”) and KKR Credit Advisors (US) LLC (“KKR”). CNL, which is our investment advisor, and KKR, which is our investment sub-advisor, are referred to in this report as our “Advisors.” Our Advisors are collectively responsible for sourcing potential investments, conducting due diligence on prospective investments, analyzing investment opportunities, structuring investments and monitoring our portfolio on an ongoing basis. Both Advisors are registered as investment advisers with the U.S. Securities and Exchange Commission (“SEC”). CNL also provides the administrative services necessary for our company to operate.
Our Common Stock Offerings
Through October 2016, we were selling shares of our common stock pursuant to a registration statement on Form N-2 (as amended and supplemented, the “Follow-On Registration Statement”) covering our continuous public offering of up to 209 million shares of common stock (the “Follow-On Offering”). The Follow-On Registration Statement was declared effective by the SEC on November 1, 2013. Immediately prior to the commencement of the Follow-On Offering, we terminated our initial continuous public offering (the “Initial Offering”). The Initial Offering and Follow-On Offering are collectively referred to as the “Offerings.” On October 26, 2016, we closed our Follow-On Offering to new investors. See Item 5. “Market for Registrant’s Common Equity, Related Shareholder Matters and Issuer Purchases of Equity Securities” for information on our Follow-On Offering.
Liquidity Event
On or before December 31, 2018, our board of directors must consider, but is not required to recommend or complete, a liquidity event for our shareholders. A liquidity event could include: (i) a listing of our shares on a national securities exchange, (ii) a merger or another transaction approved by our board of directors in which our shareholders will receive cash or shares of a listed company, or (iii) a sale of all or substantially all of our assets either on a complete portfolio basis or individually followed by a liquidation. We do not know at this time what circumstances will exist in the future and therefore we do not know what factors our board of directors will consider in determining whether to pursue a liquidity event in the future.
Investment Objectives and Strategy
Our investment objective is to provide our shareholders with current income and, to a lesser extent, long-term capital appreciation. We pursue our investment objective by investing primarily in the debt of privately owned U.S. companies with a focus on originated transactions sourced through the networks of our Advisors. As of December 31, 2016, our investment portfolio, excluding our short term investments, totaled $4.03 billion and consisted primarily of senior and subordinated debt. As we continue to grow our investment portfolio we anticipate that a substantial portion of our portfolio will consist of senior and subordinated debt,
1
Table of Contents
which we believe offer opportunities for superior risk-adjusted returns and income generation. Our debt investments may take the form of corporate loans or bonds, may be secured or unsecured and may, in some cases, be accompanied by warrants, options, equity co-investments, or other forms of equity participation. We may separately purchase common or preferred equity interests in transactions. Our portfolio includes fixed-rate investments that generate absolute returns, as well as floating-rate investments that provide protection in rising interest rate and inflationary environments.
We will seek to continue to build on the strong investment expertise and sourcing networks of our Advisors and adhere to an investment approach that emphasizes strong fundamental credit analysis and rigorous portfolio monitoring. We intend to continue to be disciplined in selecting investments and focused on opportunities that we perceive offer favorable risk/reward characteristics and relative value. We believe the market for lending is currently characterized by significant demand for capital and that we will continue to have considerable opportunities as a provider of capital to achieve attractive pricing and terms on our investments.
Throughout this report, we may refer to the issuers of our debt and equity investments as portfolio companies.
Our Investment Focus
While we consider each investment opportunity independently, we generally focus on portfolio companies that share the following characteristics:
| • | Size. We seek to provide capital to medium- and large-sized private companies, which typically have more defensible market positions, stronger franchises and operations and better credit characteristics relative to their smaller peers. Although there are no strict lower or upper limits on the size of a company in which we may invest, we expect to focus on companies with EBITDAs (earnings before interest, taxes, depreciation and amortization) greater than $25 million. |
| • | Capital Structure. Our portfolio consists primarily of senior and subordinated debt, which may in some cases be accompanied by warrants, options, equity co-investments, or other forms of equity participation. We seek to invest in companies that generate free cash flow at the time of our investment and benefit from material investments from well-known equity investors. |
| • | Management Team. We seek to prioritize investing in portfolio companies with strong management teams that we believe have a clear strategic vision, long-standing experience in their industry and a successful operating track record. We favor companies in which management’s incentives appear to be closely aligned with the long-term performance of the business, such as through equity ownership. |
| • | Stage of Business Life Cycle. We seek mature, privately owned businesses that have long track records of stable, positive cash flow. We do not intend to invest in start-up companies or companies with speculative business plans. As a business development company, we generally must, under relevant SEC rules, invest at least 70% of our total assets in “qualifying assets,” which includes all private companies, companies whose securities are not listed on a national securities exchange, and certain public listed companies that have a market capitalization of less than $250 million. |
| • | Industry Focus. While we will consider opportunities within all industries, we seek to prioritize industries having, in our view, favorable characteristics from a lending perspective. For example, we seek companies in established industries with stable competitive and regulatory frameworks, where the main participants have enjoyed predictable, low-volatility earnings. We give less emphasis to industries that are frequently characterized by less predictable and more volatile earnings. |
| • | Geography. As a business development company under the 1940 Act, we focus on and invest at least 70% of our total assets in U.S. companies. To the extent we invest in foreign companies, we are required to do so in accordance with 1940 Act limitations and only in jurisdictions with established legal frameworks and a history of respecting creditor rights, including countries that are members of the European Union, as well as Canada, Australia and Japan. |
While we believe the criteria listed above are important in identifying and investing in portfolio companies, we consider each investment on a case-by-case basis. It is possible that not all of these criteria will be met by each portfolio company in which we invest. There is no limit on the maturity or duration of any investment in our portfolio. Substantially all of the investments held in our portfolio have either a sub-investment grade rating by Moody’s Investors Service and/or Standard & Poor’s or are not rated by any rating agency. Investment sizes vary as our capital base changes and are ultimately at the discretion of our Advisors subject to oversight by our board of directors.
Except as restricted by the 1940 Act or by the Internal Revenue Code of 1986, as amended (the “Code”), we deem all of our investment policies to be non-fundamental, which means that they may be changed by our board of directors without shareholder approval.
2
Table of Contents
Other Factors Affecting Portfolio Construction
As a business development company under the 1940 Act that intends to continue to qualify annually as a regulated investment company (“RIC”) under the Code, our investment activities are subject to certain regulatory restrictions. These restrictions include (i) requirements under the 1940 Act that we invest our capital primarily in U.S. companies either that are privately owned or that are listed on a national securities exchange with a market capitalization of less than $250 million, and (ii) investment diversification and source of income criteria imposed by the Code. For a description of certain valuation risks associated with our investments in portfolio companies, see Item 1A. “Risk Factors – Risks Related to Our Business.” A significant portion of our Investment Portfolio (as defined below) is recorded at fair value as determined in good faith by our board of directors and, as a result, there is and will be uncertainty as to the value of our portfolio investments and uncertainty as to the accuracy of our net asset value.
In addition, we generally are not permitted to co-invest alongside certain affiliates of our Advisors in privately negotiated transactions, absent an exemptive order from the SEC. On May 21, 2013, the SEC issued an order granting us exemptive relief that expands our ability to co-invest with certain of our affiliates in privately negotiated transactions. Subject to the conditions specified in the exemptive order, we are permitted to co-invest with those affiliates in certain additional investment opportunities, including investments originated and directly negotiated by KKR.
Portfolio and Investment Activity
As of December 31, 2016, our investment program consisted of two main components. First, since the inception of our investment activities, we have been engaged in the direct purchase of debt securities primarily issued by portfolio companies, and directly lending or providing equity capital to portfolio companies. We refer to this investment component as our “Investment Portfolio” in this report. Second, beginning in November 2012, we supplemented our economic exposure to portfolio companies by entering into total return swap (“TRS”) arrangements with a commercial bank counterparty and directing the creation of a portfolio of underlying corporate bonds and loans that serve as reference assets under the TRS. We refer to this investment component as either our portfolio of TRS assets, or our “TRS Portfolio.”
In the case of our TRS Portfolio, we receive all: (i) realized income and fees and (ii) realized capital gains generated by the TRS assets. In return, we must pay quarterly to the TRS counterparty a payment consisting of: (i) realized capital losses and (ii) financing costs that are based on (a) a floating financing rate and (b) the settled notional amount of the TRS assets. The settled notional amount of the TRS assets is the net aggregate cost of the TRS assets underlying the TRS Portfolio that are settled and owned by the counterparty. The total notional amount of TRS assets includes the settled notional amount plus the effect of the purchase and sale of TRS assets where a TRS asset trade settlement, if any, is pending. At the end of the TRS contract life, we will receive additional economic benefit if the net value of the portfolio of TRS assets appreciates relative to the settlement date TRS notional amount. Correspondingly, we will be required to pay the counterparty the amount, if any, by which the net value of the portfolio of TRS assets declines relative to the settlement date TRS notional amount. We do not own, or have physical custody of, the TRS assets. The TRS assets are not direct investments by us.
As of December 31, 2016 and 2015, our Investment Portfolio consisted of debt and equity securities relating to 129 and 124 portfolio companies, respectively, diversified across 21 industry classifications as of each period, and the TRS Portfolio consisted of debt securities relating to 43 and 48 portfolio companies, respectively, diversified across 16 industry classifications as of each period.
Our investment program is not managed with any specific investment diversification or dispersion target goals. The table below summarizes the composition of our Investment Portfolio and TRS Portfolio based on fair value as of December 31, 2016 and 2015, excluding our short term investments.
| Investment Portfolio as of (in thousands) | ||||||||||||||||
| December 31, 2016 | December 31, 2015 | |||||||||||||||
| Asset Category |
Fair Value | Percentage of Portfolio |
Fair Value | Percentage of Portfolio |
||||||||||||
| Senior debt |
||||||||||||||||
| Senior secured loans - first lien |
$ | 1,547,100 | 38.4 | % | $ | 1,593,668 | 42.8 | % | ||||||||
| Senior secured loans - second lien |
1,074,183 | 26.7 | 1,100,781 | 29.6 | ||||||||||||
| Senior secured bonds |
134,786 | 3.4 | 184,509 | 5.0 | ||||||||||||
|
|
|
|
|
|
|
|
|
|||||||||
| Total senior debt |
2,756,069 | 68.5 | 2,878,958 | 77.4 | ||||||||||||
| Subordinated debt |
642,427 | 16.0 | 457,287 | 12.3 | ||||||||||||
| Structured products |
210,871 | 5.2 | 116,208 | 3.1 | ||||||||||||
| Equity/Other (1) |
415,920 | 10.3 | 269,808 | 7.2 | ||||||||||||
|
|
|
|
|
|
|
|
|
|||||||||
| Total |
$ | 4,025,287 | 100.0 | % | $ | 3,722,261 | 100.0 | % | ||||||||
|
|
|
|
|
|
|
|
|
|||||||||
| (1) | Includes our investment in Strategic Credit Opportunities Partners, LLC. |
3
Table of Contents
| TRS Portfolio as of (in thousands) | ||||||||||||||||
| December 31, 2016 | December 31, 2015 | |||||||||||||||
| Asset Category |
Fair Value | Percentage of Portfolio |
Fair Value | Percentage of Portfolio |
||||||||||||
| Senior debt |
||||||||||||||||
| Senior secured loans - first lien |
$ | 200,326 | 77.6 | % | $ | 256,870 | 83.3 | % | ||||||||
| Senior secured loans - second lien |
30,026 | 11.6 | 43,971 | 14.3 | ||||||||||||
| Senior secured bonds |
15,632 | 6.1 | 6,353 | 2.1 | ||||||||||||
|
|
|
|
|
|
|
|
|
|||||||||
| Total senior debt |
245,984 | 95.3 | 307,194 | 99.7 | ||||||||||||
| Subordinated debt |
12,315 | 4.7 | 1,019 | 0.3 | ||||||||||||
|
|
|
|
|
|
|
|
|
|||||||||
| Total |
$ | 258,299 | 100.0 | % | $ | 308,213 | 100.0 | % | ||||||||
|
|
|
|
|
|
|
|
|
|||||||||
Joint Venture
We and Conway Capital, LLC (“Conway”), an affiliate of Guggenheim Life and Annuity Company and Delaware Life Insurance Company, also co-invest through an unconsolidated, limited liability company, Strategic Credit Opportunities Partners (“SCJV”). SCJV was formed in May 2016 to invest its capital in a range of investments, including senior secured loans (both first lien and second lien) to middle market companies, broadly syndicated loans, equity, warrants and other investments. We and Conway each have 50% voting control of SCJV and together will agree on all investment decisions as well as all other significant actions for SCJV. As of December 31, 2016, SCJV had total capital commitments of $500 million, $437.50 million of which was from us and the remaining $62.50 million from Conway. As of December 31, 2016, we had funded approximately $92.40 million of our commitment. Additionally, SCJV had $165 million of borrowing capacity through a revolving credit facility with Bank of America Merrill Lynch (“BAML Credit Facility”) with a stated maturity date of August 15, 2018. As of December 31, 2016, our investment in SCJV was approximately $99.00 million at fair value. We do not consolidate SCJV in our consolidated financial statements.
For a further discussion of our investment activities and investment attributes of both our Investment Portfolio and TRS Portfolio as of December 31, 2016 and 2015 and for the years then ended, see Item 7. “Management’s Discussion and Analysis of Financial Condition and Results of Operations – Portfolio and Investment Activity – Portfolio Investment Activity for the Years Ended December 31, 2016, 2015 and 2014.”
Competition
As a business development company with a particular focus on lending activities, we experience competition from other business development companies, commercial banks, specialty finance companies, open-end and closed-end investment companies, opportunity funds, private equity funds and institutional investors, many of which may have greater financial resources than we do for the purposes of lending to U.S. businesses within our stated investment focus. These competitors may also have a lower cost of capital, may be subject to less regulatory oversight, and may have lower overall operating costs. The level of competition impacts both our ability to raise capital, find suitable corporate borrowers that meet our investment criteria and acquire and originate loans to corporate borrowers. We may also face competition from other funds that affiliates of KKR participate in or advise.
We believe we have the following potential competitive advantages over other capital providers that operate in the markets we target, which allow us to take advantage of the market opportunities we have identified:
| • | Proprietary Sourcing and Deal Origination. Our Advisors, through their deep industry relationships and investment teams that actively source new investments, provide us with immediate access to an established source of proprietary investment opportunities. CNL and KKR have built leading franchises and deep relationships with major companies, financial institutions and other investment and advisory institutions for sourcing new investments. KKR’s investment professionals are also organized into industry groups that conduct their own primary research, develop views on industry themes and trends and proactively work to identify companies in which to invest, often on an exclusive basis. We believe that our Advisors’ broad networks and the internal deal generation strategies of their investment teams create favorable opportunities to deploy capital across a broad range of originated transactions that have attractive investment characteristics. |
| • | Focus on Preserving Capital and Minimizing Losses. We believe that protecting principal and avoiding capital losses are critical to generating attractive risk-adjusted returns. Toward that end, our investment process is designed to: (i) utilize our Advisors’ proprietary knowledge and deep industry relationships to identify attractive prospective portfolio companies, (ii) conduct rigorous due diligence to evaluate the creditworthiness of, and potential returns from, credit investments in such portfolio companies, (iii) stress test prospective investments to assess the viability of potential portfolio companies in a downside scenario and their ability to repay principal and (iv) structure investments and design covenants and other rights that anticipate and mitigate issues identified through this process. |
4
Table of Contents
| • | Experienced Management and Investment Expertise. Affiliates of each of our Advisors have more than 35 years of investment experience that spans a broad range of economic, market and financial conditions. By accessing the combined resources, skills and experience of our Advisors, we believe we benefit from CNL’s contrarian investment philosophy of focusing on underserved, undercapitalized markets and KKR’s rigorous investment approach, industry expertise and experience investing throughout a company’s capital structure. |
| • | Disciplined Credit Analysis and Portfolio Monitoring. Our Advisors provide us with immediate access to an established platform for evaluating investments, managing risk and focusing on opportunities that generate superior returns with appropriate levels of risk. Through KKR, we benefit from an investment infrastructure that allows for intensive due diligence to filter investment opportunities and helps select investments that offer favorable risk/reward characteristics. |
| • | Versatile Transaction Structuring and Flexible Capital. Our Advisors have experience and expertise in evaluating and structuring investments at all levels of a company’s capital structure and with varying features, providing numerous tools to manage risk while preserving opportunities for income, capital preservation and, to a lesser extent, long-term capital appreciation. We seek to continue to capitalize on this expertise and build our Investment Portfolio that performs in a broad range of economic conditions while meeting the unique needs of a broad range of borrowers. Although we are subject to regulation as a business development company, we are not subject to many of the regulatory limitations that govern traditional lending institutions. As a result, we believe that we can be more flexible in selecting and structuring investments and adjusting investment criteria. We believe borrowers view this flexibility as a benefit, making us an attractive financing partner. |
| • | Long-Term Investment Horizon. We believe that our flexibility to make investments with a long-term perspective provides us with the opportunity to generate favorable returns on invested capital and expands the types of investments that we may consider. The long-term nature of our capital helps us avoid disposing of assets at unfavorable prices and we believe makes us a better financing partner for portfolio companies. |
Business Development Company Requirements
Business development companies are closed-end funds that elect to be treated as business development companies under the 1940 Act. As such, business development companies are subject to only certain provisions of the 1940 Act, as well as the Exchange Act. Business development companies are provided greater flexibility under the 1940 Act than other investment companies in dealing with their portfolio companies, issuing securities, and compensating their advisors. Business development companies can be internally or externally managed and may qualify to elect to be taxed as RICs for federal tax purposes. The 1940 Act contains prohibitions and restrictions relating to transactions between business development companies and their affiliates, principal underwriters, and affiliates of those affiliates or underwriters. The 1940 Act requires that a majority of a business development company’s directors be persons other than “interested persons,” as that term is defined in the 1940 Act. In addition, the 1940 Act provides that we may not change the nature of our business so as to cease to be, or withdraw our election as, a business development company unless approved by a majority of our outstanding voting securities. The 1940 Act defines “a majority of the outstanding voting securities” as the lesser of: (1) 67% or more of the voting securities present at a meeting if the holders of more than 50% of our outstanding voting securities are present or represented by proxy or (2) 50% of our outstanding voting securities.
We are generally unable to issue and sell our common stock at a price below net asset value per share. We may, however, sell our common stock, or warrants, options, or rights to acquire our common stock, at a price below the then-current net asset value of our common stock if our board of directors determines that such sale is in our best interests and the best interests of our shareholders, and our shareholders approve such sale. In addition, we may generally issue new shares of our common stock at a price below net asset value in rights offerings to existing shareholders, in payment of dividends, and in certain other limited circumstances.
As a business development company, we are generally not permitted to invest in any portfolio company in which our Advisors or any of their affiliates currently have an investment, or to make any co-investments with our Advisors or any of their affiliates, without an exemptive order from the SEC. We may, however, invest alongside our Advisors and their affiliates’ other clients in certain circumstances where doing so is consistent with applicable law and SEC staff interpretations. For example, we may invest alongside such other clients’ accounts consistent with guidance promulgated by the SEC staff permitting us and such other clients’ accounts to purchase interests in a single class of privately placed securities so long as certain conditions are met, including that neither of our Advisors, acting on our behalf or on behalf of other clients, negotiates any term other than price. We may also invest alongside our Advisors’ respective other clients as otherwise permissible under regulatory guidance, applicable regulations and our Advisors’ allocation policies. Furthermore, on May 21, 2013, the SEC issued an order granting us exemptive relief that expands our ability to co-invest with certain of our affiliates in privately negotiated transactions (the “SEC Exemptive Order”). Subject to the conditions specified in the SEC Exemptive Order, we are permitted to co-invest with those affiliates in certain additional investment opportunities, including investments originated and directly negotiated by our Advisors.
5
Table of Contents
Financial Information About Industry Segments and Geographic Areas
Our primary objectives include investing in and originating a portfolio of loans, bonds and equity investments to commercial businesses located throughout the United States. We presently do not evaluate our investments by industry segment but rather, we review performance on an individual basis. Accordingly, we do not report industry or geographic area segment information.
Agreements for Investment Advisory Services, Managing Dealer Services and Administrative Services
We are party to an investment advisory agreement, or the Investment Advisory Agreement with CNL for the overall management of our company’s investment activities. Our company and CNL have also entered into a sub-advisory agreement, or the Sub-Advisory Agreement, with KKR under which KKR is responsible for the day-to-day management of our company’s investment portfolio. CNL compensates KKR for advisory services that it provides to our company with 50% of the fees that CNL receives under the Investment Advisory Agreement. For a further discussion of Investment Advisory and Sub-Advisory Agreements, see Item 7. “Management’s Discussion and Analysis of Financial Condition and Results of Operations — Contractual Obligations — Investment Advisory Agreements.”
We are also party to an administrative services agreement with CNL (the “Administrative Services Agreement”) whereby CNL performs, and oversees the performance of various administrative services on our behalf. Administrative services generally include investor services, general ledger accounting, fund accounting, maintaining required corporate and financial records, financial reporting for us and our subsidiaries, preparation of reports to our board of directors and lenders, calculating our net asset value, filing tax returns, preparing and filing SEC reports, preparing, printing and disseminating shareholder reports and proxy statements, overseeing the payment of our expenses and distributions on common stock, oversight of service providers and the performance of administrative and professional services rendered to our company by others.
By their terms, each of the Investment Advisory Agreement, the Sub-Advisory Agreement and the Administrative Services Agreement must be approved annually by our board of directors (including a majority of our independent directors), or the holders of a majority of our outstanding voting securities. On March 16, 2017, our board of directors, including our independent directors, approved the renewal of each of these agreements for an additional one-year term through March 18, 2018, subject to earlier termination in accordance with their respective terms.
Through the close of our Follow-On Offering in October 2016, CNL Securities Corp., an affiliate of CNL, served as the managing dealer of our Follow-On Offering (the “Managing Dealer”) and in connection therewith received certain compensation.
CNL, certain CNL affiliates, and KKR receive compensation and reimbursement of expenses and personnel time in connection with (i) the performance and supervision of administrative services on our behalf, and (ii) certain expenses associated with investment advisory activities. See Note 6. “Related Party Transactions” in Item 8. “Financial Statements and Supplementary Data” for additional information on amounts paid to these related parties.
Employees
We are externally managed and as such we do not have any employees.
Tax Status
Beginning with our 2011 tax year, we elected to be treated for federal income tax purposes, and intend to qualify annually, as a regulated investment company, or a RIC, under the Code. As a RIC, we generally will not be subject to federal income tax on distributed taxable income to the extent we distribute annually at least 90% of our taxable income (excluding capital gains) to our shareholders and meet other compliance requirements.
Corporate Information
Our executive offices are located at 450 S. Orange Ave., Orlando, FL 32801, and our telephone number is 866-650-0650.
We make available all of our annual reports on Form 10-K, quarterly reports on Form 10-Q, current reports on Form 8-K and amendments to such reports free of charge on our internet website at www.corporatecapitaltrust.com as soon as reasonably practical after such material is electronically filed with or furnished to the SEC. These reports are also available on the SEC’s internet website at www.sec.gov. The public may also read and copy paper filings we have made with the SEC at the SEC’s Public Reference Room, located at 100 F Street, NE, Washington, D.C. 20549. Information on the operation of the Public Reference Room may be obtained by calling (800) SEC-0330.
6
Table of Contents
| Item 1A. | Risk Factors |
Risks Related to Our Business
We have a limited operating history.
We are a relatively new company and are subject to all of the business risks and uncertainties associated with any business with a relatively short operating history, including the risk that we will not sustain our investment objective and that the value of our securities could decline substantially.
The lack of liquidity in our investments may adversely affect our business.
We acquire a significant percentage of our portfolio company investments from privately held companies in directly negotiated transactions. Substantially all of these securities are subject to legal and other restrictions on resale or are otherwise less liquid than exchange-listed securities. We typically would be unable to exit these investments unless and until the portfolio company has a liquidity event such as a sale, refinancing, or initial public offering.
The illiquidity of our investments may make it difficult or impossible for us to sell such investments if the need arises. In addition, if we are required to liquidate all or a portion of our portfolio quickly, we may realize significantly less than the value at which we have previously recorded our investments, which could have a material adverse effect on our business, financial condition and results of operations.
Moreover, securities purchased by us that are liquid at the time of purchase may subsequently become illiquid due to events relating to the issuer of the securities, market events, economic conditions or investor perceptions, or the absence of active investment market participants.
Price declines in the corporate leveraged loan market may adversely affect the fair value of our portfolio, reducing our net asset value through increased net unrealized depreciation and the incurrence of realized losses.
Conditions in the U.S. corporate debt market may experience disruption or deterioration in the future, which may cause pricing levels to decline or be volatile. As a result, our net asset value could decline through an increase in unrealized depreciation and incurrence of realized losses in connection with the sale of our investments, which could have a material adverse impact on us and our business, financial condition and results of operations.
Our ability to achieve our investment objective depends on our Advisors’ ability to manage and support our investment process. If our Advisors were to lose a significant number of their respective key professionals, or terminate the Investment Advisory Agreement and/or the Sub-Advisory Agreement, our ability to sustain our investment objective could be significantly harmed.
We do not have employees. Additionally, we have no internal management capacity other than our appointed executive officers and are dependent upon the investment expertise, skill and network of business contacts of our Advisors to achieve our investment objective. Our Advisors evaluate, negotiate, structure, execute, monitor, and service our investments. Our success depends to a significant extent on the continued service and coordination of our Advisors, including their respective key professionals. The departure of a significant number of key professionals from KKR and CNL could have a material adverse effect on our ability to sustain our investment objective. Our Advisors do not currently plan to enter into employment contracts with such key professionals.
Our ability to sustain our investment objective also depends on the continued ability of our Advisors to identify, analyze, invest in, finance, and monitor companies that meet our investment criteria. Our Advisors’ capabilities in structuring the investment process, providing competent, attentive and efficient services to us, and facilitating access to financing on acceptable terms depend on the involvement of investment professionals of adequate number and sophistication to match the corresponding flow of transactions. To sustain our investment objective, our Advisors may need to retain, hire, train, supervise, and manage new investment professionals to participate in our investment selection and monitoring process. Our Advisors may not be able to find qualified investment professionals in a timely manner or at all. Any failure to do so could have a material adverse effect on our business, financial condition and results of operations.
In addition, both the Investment Advisory Agreement and the Sub-Advisory Agreement have termination provisions that allow the agreements to be terminated by us on 60 days’ notice without penalty. Our Investment Advisory Agreement may be terminated at any time, without penalty, by CNL upon 120 days’ notice to us. The Sub-Advisory Agreement may be terminated at any time, without the payment of any penalty, by KKR upon 120 days’ notice and may be terminated, without the payment of penalty, by CNL upon 60 days’ notice if our independent directors or holders of a majority of our outstanding shares of common stock so direct. In addition, CNL and KKR have agreed that, in the event that one of them is removed by us other than for cause, or the advisory agreement of either of them is not renewed, the other will also terminate its agreement with us. The termination of either agreement may adversely affect the quality of our investment opportunities. In addition, in the event either agreement were terminated, it may be difficult for us to replace CNL or for CNL to replace KKR and we would no longer have the ability to co-invest in privately negotiated transactions unless we filed a new SEC Exemptive Order.
7
Table of Contents
The amount of any distributions we may make on our common stock is uncertain. We may not be able to pay you distributions, or be able to sustain distributions at any particular level, and our distributions per share, if any, may not grow over time, and our distributions per share may be reduced.
We pay distributions out of assets legally available for distribution. However, we cannot assure you that we will achieve investment results that will allow us to sustain a consistent targeted level of cash distributions or year-to-year increases in cash distributions. Our ability to pay distributions might be adversely affected by the impact of the risks described in this report. In addition, the inability to satisfy the asset coverage test applicable to us as a business development company and certain covenants in our credit facilities can limit our ability to pay distributions. We cannot assure you that we will continue to pay distributions to our shareholders in the future.
Distributions on our common stock may exceed our taxable earnings and profits; therefore, portions of the distributions that we pay may represent a return of capital to you, which will (i) lower your tax basis in your shares and thereby increase the amount of capital gain (or decrease the amount of capital loss) realized upon a subsequent sale or redemption of such shares, and (ii) reduce the amount of funds we have for investment in portfolio companies. We have not established any limit on the extent to which we may use borrowings, if any, or offering proceeds to fund distributions (which may reduce the amount of capital we ultimately invest in portfolio companies).
We may pay our distributions from offering proceeds or from borrowings in anticipation of future cash flow, which may constitute a return of your capital and will lower your tax basis in your shares, thereby increasing the amount of capital gain (or decreasing the amount of capital loss) realized upon a subsequent sale or redemption of such shares, even if such shares have not increased in value or have, in fact, lost value. Distributions from offering proceeds or from borrowings also could reduce the amount of capital we ultimately have available to invest in debt or equity securities of portfolio companies.
Because our business model depends to a significant extent upon relationships with corporations, financial institutions and investment firms, the inability of our Advisors to maintain or develop these relationships, or the failure of these relationships to generate investment opportunities, could adversely affect our business.
We expect that CNL and KKR will depend on their relationships with corporations, financial institutions and investment firms, and we rely to a significant extent upon these relationships to provide us with potential investment opportunities. If CNL or KKR fails to maintain its existing relationships or develop new relationships or sources of investment opportunities, we may not be able to grow our investment portfolio. In addition, individuals with whom CNL and KKR have relationships are not obligated to provide us with investment opportunities, and, therefore, there is no assurance that such relationships will generate investment opportunities for us.
We may face increasing competition for investment opportunities, which could delay further deployment of our capital, reduce returns and result in losses.
We compete for investments with other business development companies and investment funds (including registered investment companies, private equity funds and mezzanine funds), as well as traditional financial services companies such as commercial banks and other sources of funding. Moreover, alternative investment vehicles, such as hedge funds, continue to increase their investment focus in our target market of privately owned U.S. companies. We have experienced, and may continue to experience, increased competition from banks and investment vehicles who may continue to lend to the middle market. Additionally, the Federal Reserve and other bank regulators may periodically provide incentives to U.S. commercial banks to originate more loans in the middle market of private companies. As a result of these market participants and regulatory incentives, competition for investment opportunities in privately owned U.S. companies is strong and may intensify. Many of our competitors are substantially larger and have considerably greater financial, technical, and marketing resources than we do. For example, some competitors may have a lower cost of capital and access to funding sources that are not available to us. In addition, some competitors may have higher risk tolerances or different risk assessments than us. These characteristics could allow our competitors to consider a wider variety of investments, establish more relationships and offer better pricing and more flexible structuring than we are able to do.
We may lose investment opportunities if we do not match our competitors’ pricing, terms, and investment structure criteria. If we are forced to match these competitors’ investment terms criteria, we may not be able to achieve acceptable returns on our investments or may bear substantial risk of capital loss. A significant increase in the number and/or the size of our competitors in this target market could force us to accept less attractive investment terms. Furthermore, many competitors are not subject to the regulatory restrictions that the 1940 Act imposes on us as a business development company or the source of income, asset diversification and distribution requirements we must satisfy to maintain our RIC status. The competitive pressures we face, and the manner in which we react or adjust to competitive pressures, may have a material adverse effect on our business, financial condition, results of operations, effective yield on investments, investment returns, leverage ratio, and cash flows. As a result of this competition, we may not be able to take advantage of attractive investment opportunities from time to time. Also we may not be able to identify and make investments that are consistent with our investment objective.
8
Table of Contents
A majority of our investment portfolio is recorded at fair value as determined in good faith in accordance with procedures established by our board of directors and, as a result, there is and will be uncertainty as to the value of our portfolio investments.
A majority of our investment portfolio is comprised of investments that are negotiated and originated directly with portfolio companies. Such investments should be considered illiquid or requiring a lengthy time to sell. Additionally, such investments feature more uncertainty as to the precise accuracy of their fair market value since these investments are not positioned in any active securities exchange or secondary market that would otherwise enable informed market participants and dealers to submit bid prices.
Under the 1940 Act, we are required to carry our portfolio investments at market value or, if there is no readily available market value, at fair value as determined in accordance with procedures established by our board of directors. There is not a public market or active secondary market for many of the securities of the privately held companies in which we invest. The majority of our investments are not publicly traded or actively traded on a secondary market but, instead, may be traded on a privately negotiated over-the-counter secondary market for institutional investors. As a result, we value a majority of our securities quarterly at fair value as determined in good faith in accordance with valuation policy and procedures approved by our board of directors.
The determination of fair value, and thus the amount of unrealized gains or losses we may recognize in any reporting period, is to a degree subjective, and our Advisors have a conflict of interest in making recommendations of fair value. We value our investments quarterly at fair value as determined in good faith in accordance with procedures established by our board of directors based on input from our Advisors. Our board of directors utilizes the services of an independent third-party valuation firm to aid us in determining the fair value of certain securities. The types of factors that may be considered in determining the fair values of our investments include the nature and realizable value of any collateral, the portfolio company’s ability to make payments and its earnings, the markets in which the portfolio company does business, comparison to publicly traded companies, discounted cash flow, current market interest rates and other relevant factors. Because such valuations, and particularly valuations of private securities and private companies, are inherently uncertain, the valuations may fluctuate significantly over short periods of time due to changes in current market conditions. The determinations of fair value in accordance with procedures established by our board of directors may differ materially from the values that would have been used if an active market and market quotations existed for such investments. Our net asset value could be adversely affected if the determinations regarding the fair value of the investments were materially higher than the values that we ultimately realize upon the disposal of such investments. Additionally, a substantial over-estimate of the fair value of our investments may result in excessive borrowing advances relative to collateral value in certain of our credit facilities and lead to remedial margin calls.
Our board of directors may change our operating policies and strategies without prior notice or shareholder approval, the effects of which may be adverse to our shareholders.
Our board of directors has the authority to modify or waive current operating policies, investment criteria and strategies without prior notice and without shareholder approval. We cannot predict the effect any changes to current operating policies, investment criteria and strategies would have on our business, net asset value, operating results and the value of our securities. However, the effects might be adverse, which could negatively impact our ability to pay you distributions and cause you to lose all or part of your investment. Moreover, we will have significant flexibility in managing our portfolio of assets, including investing in ways with which investors may not agree.
Changes in laws or regulations governing our operations may adversely affect our business or cause us to alter our business strategy.
We and our portfolio companies are subject to regulation at the local, state, and federal levels. Changes to the laws and regulations governing our permitted investments may require a change to our investment strategy. Such changes could differ materially from our strategies and plans as set forth in our prospectus and may shift our investment focus from the areas of expertise of our Advisors. Thus, any such changes, if they occur, could have a material adverse effect on our results of operations and the value of your investment in us.
We may experience fluctuations in our operating results.
We could experience fluctuations in our operating results due to a number of factors, including our ability or inability to make investments in companies that meet our investment criteria, interest rates and default rates on the debt securities we acquire, the level of our expenses, variations in and the timing of the recognition of realized and unrealized gains or losses, the degree to which we encounter competition in our markets, and general economic conditions. These occurrences could have a material adverse effect on our results of operations, the value of your investment in us and our ability to pay distributions to you and our other shareholders.
Any unrealized losses we experience on our portfolio may be an indication of future realized losses, which could reduce our income available for distribution.
As a business development company, we are required to carry our investments at market value or, if no market value is ascertainable, at the fair value as determined in good faith in accordance with procedures established by our board of directors. Decreases in the market values or fair values of our investments relative to amortized cost will be recorded as unrealized depreciation. Any unrealized losses in our loan portfolio could be an indication of a portfolio company’s inability to meet its repayment obligations to us with respect to the affected loans. This could result in realized losses in the future and ultimately in reductions of our income available for distribution in future periods. In addition, decreases in the market value or fair value of our investments will reduce our net asset value.
9
Table of Contents
We are a non-diversified investment company within the meaning of the 1940 Act, and therefore we are not limited with respect to the proportion of our assets that may be invested in securities of a single issuer.
We are classified as a non-diversified investment company within the meaning of the 1940 Act, which means that we are not limited by the 1940 Act with respect to the proportion of our assets that we may invest in securities of a single issuer. To the extent that we hold large positions in the securities of a small number of issuers, or within a particular industry, our net asset value may fluctuate to a greater extent than that of a diversified investment company as a result of changes in the issuer’s financial condition or the market’s assessment of the issuer. We may also be more susceptible to any single economic or regulatory occurrence than a diversified investment company. However, we are subject to the diversification requirements applicable to RICs under Subchapter M of the Code.
We are dependent on information systems and systems failures could significantly disrupt our business, which may, in turn, negatively affect our liquidity, financial condition or results of operations.
Our business is dependent on our and third parties’ communications and information systems. Any failure or interruption of those systems, including as a result of the termination of an agreement with any third-party service providers, could cause delays or other problems in our activities. Our financial, accounting, data processing, backup or other operating systems and facilities may fail to operate properly or become disabled or damaged as a result of a number of factors including events that are wholly or partially beyond our control. There could be:
| • | sudden electrical or telecommunications outages; |
| • | natural disasters such as earthquakes, tornadoes and hurricanes; |
| • | disease pandemics; |
| • | events arising from local or larger scale political or social matters, including terrorist acts; and |
| • | cyber-attacks. |
These events, in turn, could have a material adverse effect on our operating results and negatively affect the net asset value of our common stock and our ability to pay dividends to our shareholders.
We, our affiliates, and their respective third-party service providers could be negatively impacted by cybersecurity attacks which could have a material adverse impact on our financial condition, business or results of operations.
We, our affiliates, and their respective third-party service providers may use a variety of information technology systems in the ordinary course of business, which are potentially vulnerable to unauthorized access, computer viruses and cyber-attacks, including attacks to our information technology infrastructure and attempts by others to gain access to our propriety or sensitive information, and ranging from individual attempts to advanced persistent threats. The procedures and controls we use to monitor these threats and mitigate our exposure may not be sufficient to prevent cybersecurity incidents. The results of these incidents could include misstated financial data, theft of trade secrets or other intellectual property, liability for disclosure of confidential information, increased costs arising from the implementation of additional protective measures, litigation and reputational damage, which could have a material adverse impact on our financial condition, business or results of operations. Any remedial costs or other liabilities related to cybersecurity incidents may not be fully insured or indemnified by other means.
We are exposed to risks resulting from the current low interest rate environment.
Since we will borrow money to make investments, our net investment income depends, in part, upon the difference between the rate at which we borrow funds and the rate at which we invest those funds. The current, historically low interest rate environment can, depending on our cost of capital, depress our net investment income, even though the terms of our investments generally will include a minimum interest rate. In addition, any reduction in the level of interest rates on new investments relative to interest rates on our current investments could adversely impact our net investment income, reducing our ability to service the interest obligations on, and to repay the principal of, our indebtedness, as well as our capacity to pay distributions. Any such developments would result in a decline in our net asset value and in net asset value per share. Floating interest rate investments tied to certain indices that tend to lag behind the market may perform better in a falling interest rate environment, while floating interest rate investments tied to other indices, such as LIBOR, may do better in a rising rate environment. Not all investments perform alike under different interest rate scenarios. Generally, our variable interest rate debt investments provide for interest payments based on three-month LIBOR (the base rate) and typically, every three months, the base rates are reset to then prevailing three-month LIBOR.
10
Table of Contents
The downgrade of the U.S. credit rating and the economic crisis in Europe could negatively impact our business, financial condition and results of operations.
In August 2011, and later affirmed in August 2013, Standard & Poor’s Rating Services lowered its long-term sovereign credit rating on the U.S. from “AAA” to “AA+.” Moody’s and Fitch Ratings, Inc. have also warned that they may downgrade the U.S. federal government’s credit rating. In addition, the economic downturn and the significant government interventions into the financial markets and fiscal stimulus spending over the last several years have contributed to significantly increased U.S. budget deficits. The U.S. government has on several occasions adopted legislation to suspend the federal debt ceiling. If the debt ceiling is not increased, the U.S. Treasury Department will not be authorized to issue additional debt that increases the current amount outstanding. Further downgrades or warnings by S&P or other rating agencies, and the U.S. government’s credit and deficit concerns in general, including issues around the federal debt ceiling, could cause interest rates and borrowing costs to rise, which may negatively impact both the perception of credit risk associated with our debt portfolio and our ability to access the debt markets on favorable terms. Furthermore, in February 2014, the Federal Reserve began scaling back its bond-buying program, or quantitative easing, which it ended in October 2014. Quantitative easing was designed to stimulate the economy and expand the Federal Reserve’s holdings of long-term securities until key economic indicators, such as the unemployment rate, showed signs of improvement. The Federal Reserve raised interest rates in December 2016, and indicated that it may raise interest rates again in 2017. It is unclear what effect, if any, the end of quantitative easing and the Federal Reserve’s stated intentions to raise interest rates will have on the value of our investments or our ability to access the debt markets on favorable terms.
Additionally, in 2010, a financial crisis emerged in Europe, triggered by high budget deficits and rising direct and contingent sovereign debt in Greece, Ireland, Italy, Portugal and Spain, which created concerns about the ability of these nations to continue to service their sovereign debt obligations. In 2012, Standard & Poor’s Rating Services lowered its long-term sovereign credit rating for several large European countries (“EU countries”), which has negatively impacted global markets and economic conditions. While the financial stability of such countries has improved, risks resulting from any future debt crisis in Europe or any similar crisis could have a detrimental impact on the global economic recovery, sovereign and non-sovereign debt in these countries and the financial condition of U.S. and European financial institutions. Market disruptions in Europe, including the increased cost of funding for certain governments and financial institutions, could negatively impact the global economy, and there can be no assurance that assistance packages will be available, or if available, will be sufficient to stabilize countries and markets in Europe. To the extent uncertainty regarding any economic recovery in Europe negatively impacts consumer confidence levels and spending, personal bankruptcy rates, levels of incurrence and default on consumer debt and home prices, or other credit factors, our business, financial condition and results of operations could be significantly and adversely affected.
Although the U.S. lawmakers have taken steps to avoid further downgrades, U.S. budget deficit concerns and similar conditions in Europe have increased the possibility of additional credit-rating downgrades and worsening global economic and market conditions. There can be no assurance that current or future governmental measures to mitigate these conditions will be effective. These conditions, government actions and future developments may cause interest rates and borrowing costs to rise, which may adversely impact our ability to access debt financing on favorable terms. Continued or future adverse economic conditions could have a material adverse effect on our business, financial condition and results of operations.
Future disruptions or instability in capital markets could have a material adverse effect on our business, financial condition and results of operations.
From time to time, the global capital markets may experience periods of disruption and instability, which could materially and adversely impact the broader financial and credit markets and reduce the availability to us of debt and equity capital. For example, between 2008 and 2009, instability in the global capital markets resulted in disruptions in liquidity in the debt capital markets, significant write-offs in the financial services sector, the repricing of credit risk in the broadly syndicated credit market, the failure of major domestic and international financial institutions and a response from the U.S. Federal Reserve of lowering interest rates and quantitative easing. While market conditions have experienced relative stability in recent years, there have been continuing periods of volatility and there can be no assurance that adverse market conditions will not repeat themselves in the future which may require similar, or more experimental action by the U.S. Federal Reserve, such as negative interest rates. Global capital markets are sensitive to U.S. domestic and international economic conditions, social and political tensions, military conflict, and terrorism, including the financial stability of EU countries, perceived or actual downturns in China’s economy, further and sustained depreciation in the price of oil, and political and social unrest and military conflict in the Middle East.
We monitor U.S. and global developments and seek to manage our investments in a manner consistent with achieving our investment objectives, however, there can be no assurance that we will be successful in doing so. The re-appearance of market conditions similar to those experienced from 2008 through 2009 for any substantial length of time could lead to increased market volatility and tighter credit markets, which could make it difficult to extend the maturity of or refinance our existing indebtedness or obtain new indebtedness with similar terms. Significant changes or volatility in the capital markets may also have a negative effect on the valuations of our investments. While most of our investments will not be publicly traded, applicable accounting standards require us to assume as part of our valuation process that our investments are sold in a principal market to market participants (even if we plan on holding an investment through its maturity) and impairments of the market values or fair market values of our investments, even if
11
Table of Contents
unrealized, must be reflected in our financial statements for the applicable period, which could result in significant reductions to our net asset value for the period. With certain limited exceptions, we are only allowed to borrow amounts or issue debt securities if our asset coverage, as calculated pursuant to the 1940 Act, equals at least 200% immediately after such borrowing. Equity capital may also be difficult to raise during periods of adverse or volatile market conditions because, subject to some limited exceptions, as a BDC, we are generally not able to issue additional shares of our common stock at a price less than net asset value without first obtaining approval for such issuance from our stockholders and our independent directors. If we are unable to raise capital or refinance existing debt on acceptable terms, then we may be limited in our ability to make new commitments or to fund existing commitments to our portfolio companies. Significant changes in the capital markets may also affect the pace of our investment activity and the potential for liquidity events involving our investments. Thus, the illiquidity of our investments may make it difficult for us to sell such investments to access capital if required, and as a result, we could realize significantly less than the value at which we have recorded our investments if we were required to sell them for liquidity purposes.
Risks Related to Our Advisors and their Respective Affiliates
Our Advisors and their respective affiliates have limited experience managing a business development company.
Our Advisors and their respective affiliates have only five years of experience managing a vehicle regulated as a business development company and may not be able to continue to operate our business successfully or achieve our investment objective. As a result, an investment in our securities may entail more risk than the securities of a comparable company with a substantial operating history.
The 1940 Act and the Code impose numerous constraints on the operations of business development companies and RICs that do not apply to the other types of investment vehicles previously managed by our Advisors and their respective affiliates. For example, under the 1940 Act, business development companies are generally required to invest at least 70% of their total assets primarily in securities of qualifying U.S. private or thinly traded companies. Moreover, qualification for RIC tax treatment under subchapter M of the Code requires satisfaction of source-of-income, asset diversification and other requirements. Any failure by us to comply with these provisions could prevent us from maintaining our qualification as a business development company or RIC or could force us to pay unexpected taxes and penalties, which could be material. Our Advisors’ and their respective affiliates’ limited experience in managing a portfolio of assets under such constraints may hinder their ability to take advantage of attractive investment opportunities and, as a result, achieve our investment objective.
Our Advisors and their respective affiliates, including our officers and some of our directors, may face conflicts of interest caused by compensation arrangements with us and our affiliates, which could result in increased risk-taking by us.
Our Advisors and their respective affiliates will receive substantial fees from us in return for their services, including certain incentive fees based on the amount of appreciation of our investments. These fees could influence the advice provided to us. Generally, the more equity we sell in public offerings and the greater the risk assumed by us with respect to our investments, the greater the potential for growth in our assets and profits (and, correlatively, the fees payable by us to the Managing Dealer and our Advisors). These compensation arrangements could affect our Advisors’ or their respective affiliates’ judgment with respect to public offerings of equity and investments made by us, which allow the Managing Dealer to earn additional selling commissions and marketing support fees and our Advisors to earn increased asset management fees.
The time and resources that individuals associated with our Advisors devote to us may be diverted, and we may face additional competition due to the fact that neither CNL nor KKR is prohibited from raising money for or managing another entity that makes the same types of investments that we target.
Our Advisors and their respective affiliates currently manage other investment entities and are not prohibited from raising money for and managing future investment entities that make the same types of investments as those we target. As a result, the time and resources that our Advisors devote to us may be diverted, and during times of intense activity in other programs they may devote less time and resources to our business than is necessary or appropriate. In addition, we may compete with any such investment entity for the same investors and investment opportunities.
Our Advisors will experience conflicts of interest in connection with the management of our business affairs.
Our Advisors will experience conflicts of interest in connection with the management of our business affairs, including relating to the allocation of investment opportunities by our Advisors and their respective affiliates; compensation to our Advisors; services that may be provided by our Advisors and their respective affiliates to issuers in which we invest; investments by us and other clients of our Advisors, subject to the limitations of the 1940 Act; the formation of additional investment funds by our Advisors; differing recommendations given by our Advisors to us versus other clients; our Advisors’ use of information gained from issuers in our portfolio for investments by other clients, subject to applicable law; and restrictions on our Advisors’ use of “inside information” with respect to potential investments by us.
12
Table of Contents
Our Advisors and their respective affiliates may experience conflicts of interest in connection with the negotiation of arranging and other transaction-related fees paid by our portfolio companies.
In negotiating originated loans and certain other originated credit investments on our behalf, our Advisors and their affiliates may have the ability to negotiate the payment of arranging and other transaction-related fees by the relevant counterparty to our Advisors and their affiliates and/or an original issue discount (“OID”). In such circumstances, our Advisors will face a conflict of interest to the extent that a portion of any arranging or transaction-related fees payable to our Advisors and their affiliates may be retained by our Advisors and their affiliates, whereas any OID provided by the relevant counterparty would solely benefit us.
Our Advisors may face conflicts of interest with respect to services performed for issuers in which we invest.
Our Advisors and their affiliates may provide a broad range of financial services to companies in which we invest, in compliance with applicable law, and will generally be paid fees for such services. In addition, affiliates of our Advisors may act as underwriters or placement agents in connection with an offering of securities by one of the companies in our portfolio. Any compensation received by our Advisors for providing these services will not be shared with us and may be received before we realize a return on our investment. Our Advisors may face conflicts of interest with respect to services performed for these companies, on the one hand, and investments recommended to us, on the other hand. Depending on the nature and magnitude of the fees, we could perform these services through a taxable subsidiary.
Our Advisors have incentives to favor their respective other accounts and clients over us, which may result in conflicts of interest that could be harmful to us.
Because our Advisors and their respective affiliates manage assets for other investment companies, pooled investment vehicles and/or other accounts (including institutional clients, pension plans and certain high net worth individuals), certain conflicts of interest are present. For instance, an Advisor and its affiliates may receive fees from certain accounts that are higher than the fees received by our Advisor from us, or receive a performance-based fee on certain accounts. In those instances, a portfolio manager for our Advisor has an incentive to favor the higher fee and/or performance-based fee accounts over us. In addition, a conflict of interest exists to the extent an Advisor has proprietary investments in certain accounts, where its portfolio managers or other employees have personal investments in certain accounts, or when certain accounts are investment options in our Advisor’s employee benefit plans. Our Advisors have an incentive to favor these accounts over us. Our board of directors monitors these conflicts.
An Advisor’s actions on behalf of its other accounts and clients may be adverse to us and our investments and harmful to us.
Our Advisors and their respective affiliates manage assets for accounts other than us, including private funds (for purposes of this section, “Advisor Funds”). Actions taken by an Advisor on behalf of its Advisor Funds may be adverse to us and our investments which could harm our performance. For example, we may invest in the same credit obligations as other Advisor Funds, although, to the extent permitted under the 1940 Act, our investments may include different obligations of the same issuer. Decisions made with respect to the securities held by one Advisor Fund may cause (or have the potential to cause) harm to a different class of securities of the issuer held by other Advisor Funds (including us). As a further example, an Advisor may manage accounts that engage in short sales of (or otherwise take short positions in) securities or other instruments of the type in which we invest, which could harm our performance for the benefit of the accounts taking short positions, if such short positions cause the market value of the securities to fall.
Our access to confidential information may restrict our ability to take action with respect to some investments, which, in turn, may negatively affect our results of operations.
We, directly or through our Advisors, may obtain confidential information about the companies in which we have invested or may invest. If we possess confidential information about such companies, there may be restrictions on our ability to make, dispose of, increase the amount of, or otherwise take action with respect to, an investment in those companies. The impact of these restrictions on our ability to take action with respect to our investments could have an adverse effect on our results of operations.
Our Advisors or their respective affiliates currently serve as advisers to one other business development company with substantially the same investment objectives and strategies as ours and may serve as advisers to other business development companies with substantially the same investment objective and strategies, thereby subjecting our Advisors and their respective affiliates to actual and potential conflicts of interests in connection with the management of our business affairs.
The members of the senior management and investment teams of CNL, KKR, and certain of their respective affiliates are presently, and plan in the future to continue to be, involved with activities which are unrelated to us, including serving as officers, directors or principals of entities that operate in the same or a related line of business as us. For example, CNL’s senior management and investment teams and other CNL personnel also serve in similar capacities to the investment adviser for Corporate Capital Trust II, another business development company affiliated with CNL Financial Group. By serving in these multiple capacities, they may have obligations to Corporate Capital Trust II and/or other entities, and to the investors of such entities, which may conflict with our best interests or the best interest of our shareholders. For instance, we rely on CNL to manage our day-to-day activities and to implement our investment strategy. As a result of these activities, CNL, its senior management, investment team and other personnel, and certain of CNL’s affiliates may have conflicts of interest in allocating their time between us and the other activities in which they
13
Table of Contents
are or may become involved, including the management of Corporate Capital Trust II and other entities affiliated with CNL Financial Group. Similarly, KKR, on which CNL relies to assist it in identifying investment opportunities and making investment recommendations, may have similar conflicts of interest, including serving as the investment sub-adviser to Corporate Capital Trust II. CNL, KKR and their respective managers, partners, officers and employees will devote only so much of its or their time to our business as CNL, KKR and their respective employees determine, in their respective judgments, is reasonably required, which may be substantially less than their full time.
Furthermore, our investment objectives overlap with those of Corporate Capital Trust II, and may overlap with the investment objectives of other clients and affiliates of CNL and KKR, subjecting our Advisors to additional conflicts of interest. For example, we may compete for investments with Corporate Capital Trust II, thereby subjecting our Advisors and their affiliates to certain conflicts of interest with respect to evaluating the suitability of investment opportunities and making or recommending acquisitions on our behalf. To mitigate these conflicts, our Advisors will seek to execute such transactions for all of the participating investment accounts, including us, on a fair and equitable basis and in accordance with their respective allocation policies, taking into account such factors as the relative amounts of capital available for new investments, the investment programs and portfolio positions of the participating investment accounts, the clients for which participation is appropriate, and any other factors deemed appropriate.
Our Advisors will face restrictions on their use of inside information about existing or potential investments that they acquire through their relationships with other advisory clients, and those restrictions may limit the freedom of our Advisors to enter into or exit from investments for us, which could have an adverse effect on our results of operations.
In the course of their respective duties, the members, officers, directors, employees, principals or affiliates of our Advisors may come into possession of material, non-public information. The possession of such information may, to our detriment, limit the ability of our Advisors to buy or sell a security or otherwise to participate in an investment opportunity for us. In certain circumstances, employees of our Advisors may serve as board members or in other capacities for portfolio or potential portfolio companies, which could restrict our ability to trade in the securities of such companies. For example, if personnel of an Advisor come into possession of material non-public information with respect to our investments, such personnel will be restricted by our Advisor’s information-sharing policies and procedures or by law or contract from sharing such information with our management team, even where the disclosure of such information would be in our best interests or would otherwise influence decisions taken by the members of the management team with respect to that investment. This conflict and these procedures and practices may limit the freedom of our Advisors to enter into or exit from potentially profitable investments for us which could have an adverse effect on our results of operations. Accordingly, there can be no assurance that we will be able to fully leverage the resources and industry expertise of our Advisors’ other businesses. Additionally, there may be circumstances in which one or more individuals associated with an Advisor will be precluded from providing services to us because of certain confidential information available to those individuals or to other parts of our Advisor.
We may be obligated to pay our Advisors incentive fees even if we incur a net decrease in net assets resulting from operations due to a decline in the value of our portfolio and even if our earned interest income is not payable in cash.
Our Investment Advisory Agreement entitles CNL to receive an incentive fee based on our pre-incentive fee net investment income regardless of any capital losses. In such case, we may be required to pay CNL an incentive fee for a fiscal quarter even if there is a decline in the value of our portfolio or if we incur a net decrease in net assets resulting from operations for that quarter. CNL will pay 50% of any such incentive fee to KKR.
Any incentive fee payable by us that relates to our pre-incentive fee net investment income may be computed and paid on income that may include interest that has been accrued but not yet received or interest in the form of securities received rather than cash (“payment-in-kind,” or “PIK,” income). If a portfolio company defaults on a loan that is structured to provide accrued interest income, it is possible that accrued interest income previously included in the calculation of the incentive fee will become uncollectible. Our Advisors are not obligated to reimburse us for any part of the incentive fee they received that was based on accrued interest income that we never received as a result of a subsequent default. PIK income will be included in the pre-incentive fee net investment income used to calculate the incentive fee to our Advisors even though we do not receive the income in the form of cash.
The quarterly incentive fee on income is recognized and paid without regard to: (i) the trend of pre-incentive fee net investment income as a percent of adjusted capital over multiple quarters in arrears which may in fact be consistently less than the preference return, or (ii) the net income or net loss in the current calendar quarter, the current year or any combination of prior periods.
For federal income tax purposes, we may be required to recognize taxable income in some circumstances in which we do not receive a corresponding payment in cash and to make distributions with respect to such income to maintain our status as a RIC and/or minimize excise tax. Under such circumstances, we may have difficulty meeting the annual distribution requirement necessary to maintain RIC tax treatment under the Code. This difficulty in making the required distribution may be amplified to the extent that we are required to pay a subordinated incentive fee on income with respect to such accrued income. As a result, we may have to sell some of our investments at times and/or at prices we would not consider advantageous, raise additional debt or equity capital, or forgo new investment opportunities for this purpose. If we are not able to obtain cash from other sources, we may fail to qualify for RIC tax treatment and thus become subject to corporate-level income tax.
14
Table of Contents
Our incentive fee may induce our Advisors to make speculative investments.
The incentive fee payable by us to CNL (50% of which will be paid to KKR) may create an incentive for our Advisors to make investments on our behalf that are risky or more speculative than would be the case in the absence of such compensation arrangements. The way in which the incentive fee is determined may encourage our Advisors to use leverage to increase the leveraged return on our investment portfolio.
In addition, the fact that our base management fee— a portion of which is paid to KKR —is payable based upon our average gross assets (which includes any borrowings for investment purposes, any unrealized depreciation or appreciation on the TRS Portfolio and any cash collateral on deposit pursuant to the terms of the TRS) may encourage our Advisors to use leverage to make additional investments. Such a practice could result in our investing in more speculative securities than would otherwise be the case, which could result in higher investment losses, particularly during cyclical economic downturns. Under certain circumstances, the use of substantial leverage may increase the likelihood of our defaulting on our borrowings, which would be detrimental to holders of our securities.
Our ability to enter into transactions with our affiliates will be restricted.
We are prohibited under the 1940 Act from participating in certain transactions with certain of our affiliates without the prior approval of a majority of our independent directors and, in some cases, the SEC. Any person that owns, directly or indirectly, 5% or more of our outstanding voting securities will be our affiliate for purposes of the 1940 Act, and we will generally be prohibited from buying or selling any securities from or to such affiliate on a principal basis, absent the prior approval of our board of directors and, in some cases, the SEC. The 1940 Act also prohibits certain “joint” transactions with certain of our affiliates, which in certain circumstances could include investments in the same portfolio company (whether at the same or different times to the extent the transaction involves a joint investment), without prior approval of our board of directors and, in some cases, the SEC. If a person acquires more than 25% of our voting securities, we will be prohibited from buying or selling any security from or to such person or certain of that person’s affiliates, or entering into prohibited joint transactions with such persons, absent the prior approval of the SEC. Similar restrictions limit our ability to transact business with our officers or directors or their affiliates. The SEC has interpreted the business development company regulations governing transactions with affiliates to prohibit certain joint transactions involving entities that share a common investment advisor. As a result of these restrictions, we may be prohibited from buying or selling any security from or to any portfolio company that is controlled by a fund managed by either of our Advisors or their respective affiliates without the prior approval of the SEC, which may limit the scope of investment opportunities that would otherwise be available to us.
We may, however, invest alongside our Advisors’ and their respective affiliates’ other clients, including other entities they manage, which we refer to as affiliates’ other clients, in certain circumstances when doing so is consistent with applicable law and SEC staff interpretations and guidance. We may also invest alongside the other clients of our Advisors, as otherwise permissible under regulatory guidance, applicable regulations and the Advisors’ allocation policies. It is our policy to base our board of directors’ determinations as to the amount of capital available for investment are based on such factors as: the amount of cash on-hand, existing commitments and reserves, the targeted leverage level, the targeted asset mix and diversification requirements and other investment policies and restrictions set by our board of directors or imposed by applicable laws, rules, regulations or interpretations. However, there can be no assurance that investment opportunities will be allocated to us fairly or equitably in the short-term or over time.
The SEC Exemptive Order granted by the SEC to us, our Advisors and certain of their respective affiliates, permits us to participate in certain transactions originated by the Advisors or their respective affiliates. However, affiliates of our Advisors whose primary business includes the origination of investments may engage in investment advisory businesses with client accounts that compete with us, and those affiliates have no obligation to make their originated investment opportunities available to our Advisors or to us.
In situations when co-investment with affiliates’ other clients is not permitted under the 1940 Act and related rules, existing or future staff guidance, or the terms and conditions of exemptive relief granted to us by the SEC (as discussed above), our Advisors will need to decide which client or clients will proceed with the investment. Generally, we will not have an entitlement to make a co-investment in these circumstances and, to the extent that another client elects to proceed with the investment, we will not be permitted to participate. Moreover, except in certain circumstances, we are unable to invest in any issuer in whom an affiliate’s other client holds a controlling interest.
We may make investments that could give rise to a conflict of interest.
We do not expect to invest in, or hold securities of, companies that are controlled by affiliates’ other clients. However, an affiliates’ other clients may invest in, and gain control over, one of our portfolio companies. If an affiliates’ other client, or clients, gains control over one of our portfolio companies, it may create conflicts of interest and may subject us to certain restrictions under the 1940 Act. As a result of these conflicts and restrictions our Advisors may be unable to implement our investment strategies as effectively as they could have in the absence of such conflicts or restrictions. For example, as a result of a conflict or restriction, our Advisors may be unable to engage in certain transactions that they would otherwise pursue. In order to avoid these conflicts and restrictions, our Advisors may choose to exit such investments prematurely and, as a result, we would forego any positive returns associated with such investments. In addition, to the extent that an affiliates’ other client holds a different class of securities than us as a result of such transactions, our interests may not be aligned.
15
Table of Contents
The recommendations given to us by our Advisors may differ from those rendered to their other clients.
Our Advisors and their affiliates may give advice and recommend securities to other clients which may differ from advice given to, or securities recommended or bought for, us even though such other clients’ investment objectives may be similar to ours.
We are not managed by KKR & Co. or CNL Financial Group, but rather subsidiaries of both and may not replicate the success of those entities.
We are managed by our Advisors and not by CNL Financial Group or KKR & Co. Our performance may be lower or higher than the performance of other entities managed by CNL Financial Group or KKR & Co. or their affiliates and their past performance is no guarantee of our future results.
Our Advisors’ liability is limited under the Investment Advisory Agreement and the Investment Sub-Advisory Agreement, and we are required to indemnify our Advisors against certain liabilities, which may lead our Advisors to act in a riskier manner on our behalf than it would when acting for its own account.
Our Advisors have not assumed any responsibility to us other than to render the services described in the Investment Advisory Agreement and the Investment Sub-Advisory Agreement, and they will not be responsible for any action of our board of directors in declining to follow our Advisors’ advice or recommendations. Pursuant to the Investment Advisory Agreement and the Investment Sub-Advisory Agreement, our Advisors and their respective directors, officers, shareholders, members, agents, employees, controlling persons, and any other person or entity affiliated with, or acting on behalf of our Advisors will not be liable to us for their acts under the Investment Advisory Agreement and the Investment Sub-Advisory Agreement, absent willful misfeasance, bad faith, gross negligence or reckless disregard in the performance of their duties. We have also agreed to indemnify, defend and protect our Advisors and their respective directors, officers, shareholders, members, agents, employees, controlling persons and any other person or entity affiliated with, or acting on behalf of our Advisors with respect to all damages, liabilities, costs and expenses resulting from acts of our Advisors not arising out of willful misfeasance, bad faith, gross negligence or reckless disregard in the performance of their duties. These protections may lead our Advisors to act in a riskier manner when acting on our behalf than it would when acting for its own account.
Risks Related to Business Development Companies
The requirement that we invest a sufficient portion of our assets in qualifying assets could preclude us from investing in accordance with our current business strategy; conversely, the failure to invest a sufficient portion of our assets in qualifying assets could result in our failure to maintain our status as a business development company.
As a business development company, the 1940 Act prohibits us from acquiring any assets other than certain qualifying assets unless, at the time of and after giving effect to such acquisition, at least 70% of our total assets are qualifying assets. Qualifying assets include investments in “eligible portfolio companies.” Under the relevant SEC rules, the term “eligible portfolio company” includes U.S. operating companies whose securities are not listed on a national securities exchange (i.e., private companies), and certain U.S. public operating companies that have listed their securities on a national securities exchange and have a market capitalization of less than $250 million. Therefore, we may be precluded from investing in what we believe are attractive investments if such investments are not qualifying assets. Conversely, if we fail to invest a sufficient portion of our assets in qualifying assets, we could lose our status as a business development company, which would have a material adverse effect on our business, financial condition, and results of operations. Similarly, these rules could prevent us from making additional investments in existing portfolio companies, which could result in the dilution of our position, or could require us to dispose of investments at an inopportune time to comply with the 1940 Act. If we were forced to sell non-qualifying investments in the portfolio for compliance purposes, the proceeds from such sale could be significantly less than the current value of such investments.
Failure to maintain our status as a business development company would reduce our operating flexibility.
If we do not remain a business development company, we might be regulated as a closed-end investment company under the 1940 Act, which would subject us to substantially more regulatory restrictions and correspondingly decrease our operating flexibility.
16
Table of Contents
Regulations governing our operation as a business development company and RIC affect our ability to raise capital and the way in which we raise additional capital or borrow for investment purposes, which may have a negative effect on our growth. As a business development company, the necessity of raising additional capital may expose us to risks, including risks associated with leverage.
As a result of the annual distribution requirement to qualify as a RIC, we may need to access the capital markets periodically to raise cash to fund new investments in portfolio companies. We may continue to issue “senior securities,” including borrowing money from banks or other financial institutions only in amounts such that our asset coverage, as defined in the 1940 Act, equals at least 200% after such incurrence or issuance. The senior securities we have issued, as well as senior securities we may issue in the future, expose us to risks associated with leverage, including an increased risk of loss. Our ability to issue different types of securities is also limited. Compliance with these distribution requirements may unfavorably limit our investment opportunities and reduce our ability in comparison to other companies to profit from favorable spreads between the rates at which we can borrow and the rates at which we can lend.
We have and may continue to borrow for investment purposes. If the value of our assets declines, we may be unable to satisfy the asset coverage test, which would prohibit us from paying distributions and could prevent us from qualifying as a RIC, which would generally result in a corporate-level tax on any income and net gains. If we cannot satisfy the asset coverage test, we may be required to sell a portion of our investments and, depending on the nature of our debt financing, repay a portion of our indebtedness at a time when such sales may be disadvantageous. Also, any amounts that we use to service our indebtedness would not be available for distributions to our shareholders.
In addition, we anticipate that as market conditions permit, we may securitize our loans to generate cash for funding new investments. To securitize loans, we may create a wholly owned subsidiary, contribute a pool of loans to the subsidiary and have the subsidiary issue primarily investment grade debt securities to purchasers who we would expect to be willing to accept a substantially lower interest rate than the loans earn. We would retain all or a portion of the equity in the securitized pool of loans. Our retained equity would be exposed to any losses on the portfolio of loans before any of the debt securities would be exposed to such losses. Accordingly, if the pool of loans experienced a low level of losses due to defaults, we would earn an incremental amount of income on our retained equity but we would be exposed, up to the amount of equity we retained, to that proportion of any losses we would have experienced if we had continued to hold the loans in our portfolio.
Risks Related to Our Investments
Our investments in portfolio companies may be risky, and we could lose all or part of our indirect investment.
We pursue a strategy focused on investing primarily in the debt of privately owned U.S. companies with a focus on originated transactions sourced through the networks of our Advisors. Short transaction closing timeframes associated with originated transactions coupled with added tax or accounting structuring complexity and international transactions may result in a higher risk in comparison to non-originated transactions.
| • | Senior Debt. When we invest in senior debt, we generally seek to take a security interest in the available assets of the portfolio company, including equity interests in any of its subsidiaries. These investments will generally take the form of senior secured first lien loans, senior secured second lien loans, or senior secured bonds. There is a risk that the collateral securing our investments may decrease in value over time or lose its entire value, may be difficult to sell in a timely manner, may be difficult to appraise and may fluctuate in value based upon the success of the business and market conditions, including as a result of the inability of the portfolio company to raise additional capital. Also, in some circumstances, our lien could be subordinated to claims of other creditors. In addition, deterioration in a portfolio company’s financial condition and prospects, including its inability to raise additional capital, may be accompanied by deterioration in the value of the collateral for the loan. Consequently, the fact that a loan is secured does not guarantee that we will receive principal and interest payments according to the loan’s terms, or at all, or that we will be able to collect on the loan should we decide to enforce our remedies. |
| • | Subordinated Debt. Our subordinated debt investments are generally subordinated to senior debt and are generally unsecured, which may result in a heightened level of risk and volatility or a loss of principal, which could lead to the loss of the entire investment. These investments may involve additional risks that could adversely affect our investment returns as compared to our senior debt investments. To the extent interest payments associated with such debt are deferred, such debt may be subject to greater fluctuations in valuations, and such debt could subject us and our shareholders to non-cash income. Since we will not receive any principal repayments prior to the maturity of some of our subordinated debt investments, such investments will be of greater risk than amortizing loans. |
| • | Equity Investments. We expect to make selected equity investments which may be illiquid with no readily available market and involve more risk than senior or subordinated debt. In addition, when we invest in senior and subordinated debt, we may acquire warrants or options to purchase equity securities or benefit from other types of equity participation. Our goal is ultimately to dispose of these equity interests and realize gains upon our disposition of such interests. However, the equity interests we receive may not appreciate in value and, in fact, may decline in value. Accordingly, we may not be able to realize gains from our equity interests, and any gains that we do realize on the disposition of any equity interests may not be sufficient to offset any other losses we experience. Depending on the nature of the equity investment, we could invest through a taxable subsidiary which could impact the return on investment. |
17
Table of Contents
| • | Convertible Securities. We may invest in convertible securities, such as bonds, debentures, notes, preferred stocks or other securities that may be converted into, or exchanged for, a specified amount of common stock of the same or different issuer within a particular period of time at a specified price or formula. A convertible security may be subject to redemption at the option of the issuer at a price established in the convertible security’s governing instrument. If a convertible security held by us is called for redemption, we will be required to permit the issuer to redeem the security, convert it into the underlying common stock or sell it to a third party. Any of these actions could have an adverse effect on our ability to achieve our investment objective. |
| • | Investments in Private Investment Funds or other subsidiaries. We may invest in, or wholly own, private investment funds, including hedge funds, private equity funds, limited liability companies, REITs, and other business entities. In valuing our investments in private investment funds, we rely primarily on information provided by managers of such funds. Valuations of illiquid securities, such as interests in certain private investment funds, involve various judgments and consideration of factors that may be subjective. There is a risk that inaccurate valuations provided by managers of private investment funds could adversely affect the value of our common stock. We may not be able to withdraw our investment in certain private investment funds promptly after we have made a decision to do so, which may result in a loss to us and adversely affect our investment returns. |
| • | Derivatives. Derivative investments have risks, including: the imperfect correlation between the value of such instruments and the underlying assets of the Company, which creates the possibility that the loss on such instruments may be greater than the gain in the value of the underlying assets in our portfolio; the loss of principal; the possible default of the other party to the transaction; and illiquidity of the derivative investments. If a counterparty becomes bankrupt or otherwise fails to perform its obligations under a derivative contract due to financial difficulties, we may experience significant delays in obtaining any recovery under the derivative contract in a bankruptcy or other reorganization proceeding, or may not recover at all. In addition, in the event of the insolvency of a counterparty to a derivative transaction, the derivative contract would typically be terminated at its fair market value. If we are owed this fair market value in the termination of the derivative contract and our claim is unsecured, we will be treated as a general creditor of such counterparty and will not have any claim with respect to the underlying security. Certain of the derivative investments in which we may invest may, in certain circumstances, give rise to a form of financial leverage, which may magnify the risk of owning such instruments. The ability to successfully use derivative investments depends on the ability of our Advisors to predict pertinent market movements, which cannot be assured. In addition, amounts paid by us as premiums and cash or other assets held in margin accounts with respect to our derivative investments would not be available to us for other investment purposes, which may result in lost opportunities for gain. |
The Dodd-Frank Act could, depending on future rulemaking by regulatory agencies, impact the use of derivatives. The Dodd-Frank Act is intended to regulate the OTC derivatives market by requiring many derivative transactions to be cleared and traded on an exchange, expanding entity registration requirements, imposing business conduct requirements on dealers and requiring banks to move some derivatives trading units to a non-guaranteed affiliate separate from the deposit-taking bank or divest them altogether. Future rulemaking to implement these requirements could potentially limit or completely restrict our ability to use these instruments as a part of our investment strategy, increase the costs of using these instruments or make them less effective. Limits or restrictions applicable to the counterparties with which we engage in derivative transactions could also prevent us from using these instruments or affect the pricing or other factors relating to these instruments, or may change availability of certain investments. The SEC has also indicated that it may adopt new policies on the use of derivatives by registered investment companies. Such policies could affect the nature and extent of our use of derivatives.
Most debt securities in which we invest will not be rated by any rating agency and, if they were rated, they would be rated as below investment grade quality. Debt securities rated below investment grade, which are often referred to as “junk” securities, are generally regarded as having predominantly speculative characteristics and may carry a greater risk with respect to a borrower’s capacity to pay interest and repay principal.
The credit ratings of certain of our investments may not be indicative of the actual credit risk of such rated instruments.
Rating agencies rate debt securities based upon their assessment of the likelihood of the receipt of principal and interest payments. Rating agencies do not consider the risks of fluctuations in market value or other factors that may influence the value of debt securities. Therefore, the credit rating assigned to a particular instrument may not fully reflect the true risks of an investment in such instrument. Credit rating agencies may change their methods of evaluating credit risk and determining ratings. These changes may occur quickly and often. While we may give some consideration to ratings, ratings may not be indicative of the actual credit risk of our investments in rated instruments.
18
Table of Contents
A redemption of convertible securities held by us could have an adverse effect on our ability to achieve our investment objective.
A convertible security may be subject to redemption at the option of the issuer at a price established in the convertible security’s governing instrument. If a convertible security held by us is called for redemption, we will be required to permit the issuer to redeem the security, convert it into the underlying common stock or sell it to a third party. Any of these actions could have an adverse effect on our ability to achieve our investment objective.
To the extent original issue discount (OID) and payment-in-kind (PIK) interest income constitute a portion of our income, we will be exposed to risks associated with the deferred receipt of cash representing such income.
Our investments may include OID and PIK instruments. To the extent OID and PIK constitute a portion of our income, we will be exposed to risks associated with such income being required to be included in income for financial reporting purposes in accordance with generally accepted accounting principles (“GAAP”) and taxable income prior to receipt of cash, including the following:
| • | OID and PIK instruments may have unreliable valuations because the accruals require judgments about collectability; |
| • | OID and PIK instruments may create heightened credit risks because the inducement to the borrower to accept higher interest rates in exchange for the deferral of cash payments typically represents, to some extent, speculation on the part of the borrower; |
| • | For GAAP purposes, cash distributions to shareholders that include a component of OID or PIK income are not considered a return of capital, although they may be paid from the offering proceeds. Thus, although a distribution of OID or PIK income may be funded from the cash invested by the shareholders, the 1940 Act does not require that shareholders be given notice of this fact; |
| • | The presence of OID and PIK creates the risk of non-refundable cash payments to our Advisors in the form of subordinated incentive fees on income based on non-cash OID and PIK income accruals that may never be realized; and |
| • | In the case of payment-in-kind, or “PIK,” “toggle” debt, the PIK election has the simultaneous effects of increasing the investment income, thus increasing the potential for realizing incentive fees. |
Our portfolio companies may incur debt that ranks equally with, or senior to, our investments in such companies.
We pursue a strategy focused on investing primarily in the debt of privately owned U.S. companies with a focus on originated transactions sourced through the networks of our Advisors. Our portfolio companies may have, or may be permitted to incur, other debt that ranks equally with, or senior to, the debt in which we invest. By their terms, such debt instruments may entitle the holders to receive payment of interest or principal on or before the dates on which we are entitled to receive payments with respect to the debt instruments in which we invest. Also, in the event of insolvency, liquidation, dissolution, reorganization or bankruptcy of a portfolio company, holders of debt instruments ranking senior to our investment in that portfolio company would typically be entitled to receive payment in full before we receive any distribution. After repaying such senior creditors, such portfolio company may not have any remaining assets to use for repaying its obligation to us. In the case of debt ranking equally with debt instruments in which we invest, we would have to share on an equal basis any distributions with other creditors holding such debt in the event of an insolvency, liquidation, dissolution, reorganization or bankruptcy of the relevant portfolio company.
If we cannot obtain debt financing or equity capital on acceptable terms, our ability to acquire investments and to expand our operations will be adversely affected.
Any working capital reserves we maintain may not be sufficient for investment purposes, and we may require additional debt financing or equity capital to operate. Pursuant to tax rules that apply to us, we are required to distribute at least 90% of our net ordinary income and net short-term capital gains in excess of net long-term capital losses, if any, to our shareholders to maintain our RIC status. Accordingly, in the event that we need additional capital in the future for investments or for any other reason we may need to access the capital markets periodically to issue debt or equity securities or borrow from financial institutions in order to obtain such additional capital. These sources of funding may not be available to us due to unfavorable economic conditions, which could increase our funding costs, limit our access to the capital markets or result in a decision by lenders not to extend credit to us. Consequently, if we cannot obtain further debt or equity financing on acceptable terms, our ability to acquire additional investments and to expand our operations will be adversely affected. As a result, we would be less able to achieve portfolio diversification and our investment objective, which may negatively impact our results of operations and reduce our ability to make distributions to our shareholders.
Subordinated liens on collateral securing debt investments that we have made or may make to portfolio companies may be subject to control by senior creditors with first priority liens. If there is a default, the value of the collateral may not be sufficient to repay in full both the first priority creditors and us.
Certain debt investments that we make in portfolio companies will be secured on a second priority basis by the same collateral securing senior debt of such companies. The first priority liens on the collateral will secure the portfolio company’s obligations under any outstanding senior debt and may secure certain other future debt that may be permitted to be incurred by the
19
Table of Contents
portfolio company under the agreements governing the debt. In the event of a default, the holders of obligations secured by the first priority liens on the collateral will generally control the liquidation of and be entitled to receive proceeds from any realization of the collateral to repay their obligations in full before us. In addition, the value of the collateral in the event of liquidation will depend on market and economic conditions, the availability of buyers and other factors. There can be no assurance that the proceeds, if any, from the sale or sales of all of the collateral would be sufficient to satisfy the debt obligations secured by the second priority liens after payment in full of all obligations secured by the first priority liens on the collateral. If such proceeds are not sufficient to repay amounts outstanding under the debt obligations secured by the second priority liens, then us, to the extent not repaid from the proceeds of the sale of the collateral, will only have an unsecured claim against the portfolio company’s remaining assets, if any.
We may also make unsecured debt investments in portfolio companies, meaning that such investments will not benefit from any interest in collateral of such companies. Liens on any such portfolio company’s collateral, if any, will secure the portfolio company’s obligations under its outstanding secured debt and may secure certain future debt that is permitted to be incurred by the portfolio company under its secured debt agreements. The holders of obligations secured by such liens will generally control the liquidation of, and be entitled to receive proceeds from, any realization of such collateral to repay their obligations in full before us. In addition, the value of such collateral in the event of liquidation will depend on market and economic conditions, the availability of buyers and other factors. There can be no assurance that the proceeds, if any, from sales of such collateral would be sufficient to satisfy our unsecured debt obligations after payment in full of all secured debt obligations. If such proceeds were not sufficient to repay the outstanding secured debt obligations, then our unsecured claims would rank equally with the unpaid portion of such secured creditors’ claims against the portfolio company’s remaining assets, if any.
The rights we may have with respect to the collateral securing the debt investments we make in our portfolio companies with senior debt outstanding may also be limited pursuant to the terms of one or more inter-creditor agreements that we enter into with the holders of senior debt. Under such an inter-creditor agreement, at any time obligations that have the benefit of the first priority liens are outstanding, any of the following actions that may be taken in respect of the collateral will be at the direction of the holders of the obligations secured by the first priority liens: the ability to cause the commencement of enforcement proceedings against the collateral; the ability to control the conduct of such proceedings; the approval of amendments to collateral documents; releases of liens on the collateral; and waivers of past defaults under collateral documents. We may not have the ability to control or direct such actions, even if our rights are adversely affected.
Certain of our investments may be adversely affected by laws relating to fraudulent conveyance or voidable preferences.
Certain of our investments could be subject to federal bankruptcy law and state fraudulent transfer laws, which vary from state to state, if the debt obligations relating to such investments were issued with the intent of hindering, delaying or defrauding creditors or, in certain circumstances, if the issuer receives less than reasonably equivalent value or fair consideration in return for issuing such debt obligations. If the debt is used for a buyout of shareholders, this risk is greater than if the debt proceeds are used for day-to-day operations or organic growth. If a court were to find that the issuance of the debt obligations was a fraudulent transfer or conveyance, the court could void or otherwise refuse to recognize the payment obligations under the debt obligations or the collateral supporting such obligations, further subordinate the debt obligations or the liens supporting such obligations to other existing and future indebtedness of the issuer or require us to repay any amounts received by us with respect to the debt obligations or collateral. In the event of a finding that a fraudulent transfer or conveyance occurred, we may not receive any repayment on the debt obligations.
Under certain circumstances, payments to us and distributions by us to our shareholders may be reclaimed if any such payment or distribution is later determined to have been a fraudulent conveyance, preferential payment or similar transaction under applicable bankruptcy and insolvency laws. Furthermore, investments in restructurings may be adversely affected by statutes relating to, among other things, fraudulent conveyances, voidable preferences, lender liability and the court’s discretionary power to disallow, subordinate or disenfranchise particular claims or recharacterize investments made in the form of debt as equity contributions.
There may be circumstances where our debt investments could be subordinated to claims of other creditors or we could be subject to lender liability claims.
Although we generally structure certain of our investments as senior debt, if one of our portfolio companies were to go bankrupt, depending on the facts and circumstances, including the extent to which we provided managerial assistance to that portfolio company or a representative of us or our Advisors sat on the board of directors of such portfolio company, a bankruptcy court might re-characterize our debt investment and subordinate all or a portion of our claim to that of other creditors. In situations where a bankruptcy carries a high degree of political significance, our legal rights may be subordinated to other creditors.
In addition, a number of U.S. judicial decisions have upheld judgments obtained by borrowers against lending institutions on the basis of various evolving legal theories, collectively termed “lender liability.” Generally, lender liability is founded on the premise that a lender has violated a duty (whether implied or contractual) of good faith, commercial reasonableness and fair dealing, or a similar duty owed to the borrower or has assumed an excessive degree of control over the borrower resulting in the creation of a fiduciary duty owed to the borrower or its other creditors or shareholders. Because of the nature of our investments in portfolio companies (including that, as a business development company, we may be required to provide managerial assistance to those portfolio companies), we may be subject to allegations of lender liability.
20
Table of Contents
We generally will not control the business operations of our portfolio companies and, due to the illiquid nature of our holdings in our portfolio companies, we may not be able to dispose of our interest in our portfolio companies.
We do not expect to control most of our portfolio companies, even though we may have board representation or board observation rights, and our debt agreements may impose certain restrictive covenants on our borrowers. As a result, we are subject to the risk that a portfolio company in which we invest may make business decisions with which we disagree and the management of such company, as representatives of the holders of their common equity, may take risks or otherwise act in ways that do not serve our interests as a debt investor. Due to the lack of liquidity for our investments in private companies, we may not be able to dispose of our interests in our portfolio companies as readily as we would like or at an appropriate valuation. As a result, a portfolio company may make decisions that could decrease the value of our portfolio holdings.
We are exposed to risks associated with changes in interest rates.
General interest rate fluctuations may have a substantial negative impact on our investments and investment opportunities and, accordingly, may have a material adverse effect on our ability to achieve our investment objective and the rate of return on invested capital. Because we borrow money and may issue debt securities to make investments, our net investment income is dependent, in part, upon the difference between the rate at which we borrow funds or pay interest on such debt securities and the rate at which we invest these funds. As a result, there can be no assurance that a significant change in market interest rates will not have a material adverse effect on our net investment income.
Trading prices for debt that pays a fixed rate of return tend to fall as interest rates rise. Trading prices tend to fluctuate more for fixed-rate securities that have longer maturities. We may enter into certain hedging transactions, such as interest rate swap agreements, to mitigate our exposure to adverse fluctuations in interest rates and we may increase our floating rate investments to position the portfolio for rate increases. However, we cannot assure you that such transactions will be successful in mitigating our exposure to interest rate risk or if we will enter into such interest rate hedges. Hedging transactions may also limit our ability to participate in the benefits of lower interest rates with respect to our portfolio investments.
We do not have a policy governing the maturities of our investments. This means that we are subject to greater risk (other things being equal) than a fund invested solely in shorter-term securities. A decline in the prices of the debt we own could adversely affect our net asset value. Also, an increase in interest rates available to investors could make an investment in our common stock less attractive if we are not able to increase our dividend rate.
International investments create additional risks.
We have made, and expect to continue to make, investments in portfolio companies that are domiciled outside of the United States. We anticipate that up to 30% of our investments may be in these types of assets. Our investments in foreign portfolio companies are deemed “non-qualifying assets,” which means, as required by the 1940 Act, they, along with other non-qualifying assets, may not constitute more than 30% of our total assets at the time of our acquisition of any asset, after giving effect to the acquisition. Notwithstanding the limitation on our ownership of foreign portfolio companies, such investments subject us to many of the same risks as our domestic investments, as well as certain additional risks, including the following:
| • | foreign governmental laws, rules and policies, including those restricting the ownership of assets in the foreign country or the repatriation of profits from the foreign country to the United States; |
| • | foreign currency devaluations that reduce the value of and returns on our foreign investments; |
| • | adverse changes in the availability, cost and terms of investments due to the varying economic policies of a foreign country in which we invest; |
| • | adverse changes in tax rates, the tax treatment of transaction structures and other changes in operating expenses of a particular foreign country in which we invest; |
| • | the assessment of foreign-country taxes (including withholding taxes, transfer taxes and value added taxes, any or all of which could be significant) on income or gains from our investments in the foreign country; |
| • | adverse changes in foreign-country laws, including those relating to taxation, bankruptcy and ownership of assets; |
| • | changes that adversely affect the social, political and/or economic stability of a foreign country in which we invest; |
| • | high inflation in the foreign countries in which we invest, which could increase the costs to us of investing in those countries; |
| • | deflationary periods in the foreign countries in which we invest, which could reduce demand for our assets in those countries and diminish the value of such investments and the related investment returns to us; and |
| • | legal and logistical barriers in the foreign countries in which we invest that materially and adversely limit our ability to enforce our contractual rights with respect to those investments. |
21
Table of Contents
In addition, we may make investments in countries whose governments or economies may prove unstable. Certain of the countries in which we may invest may have political, economic and legal systems that are unpredictable, unreliable or otherwise inadequate with respect to the implementation, interpretation and enforcement of laws protecting asset ownership and economic interests. In some of the countries in which we may invest, there may be a risk of nationalization, expropriation or confiscatory taxation, which may have an adverse effect on our portfolio companies in those countries and the rates of return that we are able to achieve on such investments. We may also lose the total value of any investment which is nationalized, expropriated or confiscated. The financial results and investment opportunities available to us, particularly in developing countries and emerging markets, may be materially and adversely affected by any or all of these political, economic and legal risks.
Our investments in private investment funds, including hedge funds, private equity funds, limited liability companies and other business entities, subject us indirectly to the underlying risks of such private investment funds and additional fees and expenses.
We may invest in private investment funds, including hedge funds, private equity funds, limited liability companies and other business entities which would be required to register as investment companies but for an exemption under Sections 3(c)(1) and 3(c)(7) of the 1940 Act. Our investments in such private investment funds expose us to the risks associated with the businesses of such funds or entities as well as such private investment funds’ portfolio companies. These private investment funds may or may not be registered investment companies and, thus, may not be subject to protections afforded by the 1940 Act, covering, among other areas, liquidity requirements, governance by an independent board, affiliated transaction restrictions, leverage limitations, public disclosure requirements and custody requirements.
We rely primarily on information provided by managers of private investment funds in valuing our investments in such funds. There is a risk that inaccurate valuations provided by managers of private investment funds could adversely affect the value of our common stock. In addition, there can be no assurance that a manager of a private investment fund will provide advance notice of any material change in such private investment fund’s investment program or policies and thus, our investment portfolio may be subject to additional risks which may not be promptly identified by our Advisors.
Before investing in any private investment fund, the Advisors, under the oversight of our board of directors, will conduct a due diligence review of the valuation methodology utilized by the private investment fund, which as a general matter we expect would utilize market values when available, and otherwise utilize principles of fair value that the Advisors reasonably believe to be consistent with those used by us for valuing our own investments. After investing in a private investment fund, the Advisors will monitor the valuation methodology used by the asset manager and/or issuer of the private investment fund. Following procedures adopted by our board of directors, in the absence of specific transaction activity in a particular private investment fund, our board of directors will consider whether it is appropriate, in light of all relevant circumstances, to value our investment at the net asset value reported by the private investment fund at the time of valuation or to adjust the value to reflect a premium or discount.
Our Advisors will provide our board of directors with periodic reports, no less frequently than quarterly, that discuss the functioning of the valuation process, if applicable to that period, and that identify issues and valuations problems that have arisen, if any. To the extent deemed necessary by the Advisors, our board of directors will review any securities valued by the Advisors in accordance with our valuation policies.
Our board of directors – with the assistance of the Advisors, officers and, through them, independent valuation agents – is responsible for determining in good faith the fair value of our portfolio investments for which market quotations are not readily available (as is the case of private investment funds). Our board of directors will make this determination on a quarterly basis and any other time when a decision is required regarding the fair value of our investments in private investment funds or other portfolio investments for which market quotations are not available. A determination of fair value involves subjective judgments and estimates, and it is possible that the fair value determined for a security may differ materially from the value that could be realized upon the sale of the security.
Investments in the securities of private investment funds may also involve duplication of advisory fees and certain other expenses. By investing in private investment funds indirectly through us, you bear a pro rata portion of our advisory fees and other expenses, and also indirectly bear a pro rata portion of the advisory fees, performance-based allocations and other expenses borne by us as an investor in the private investment funds. In addition, the purchase of the shares of some private investment funds requires the payment of sales loads and (in the case of closed-end investment companies) sometimes substantial premiums above the value of such investment companies’ portfolio securities.
In addition, certain private investment funds may not provide us with the liquidity we require and would thus subject us to liquidity risk. Further, even if an investment in a private investment fund is deemed liquid at the time of investment, the private investment fund may, in the future, alter the nature of our investments and cease to be a liquid investment fund, subjecting us to liquidity risk.
22
Table of Contents
We may acquire various structured financial instruments for purposes of “hedging” or reducing our risks, which may be costly and ineffective and could reduce the cash available to service our debt or for distribution to our shareholders.
We may seek to hedge against interest rate and currency exchange rate fluctuations and credit risk by using structured financial instruments such as futures, options, swaps and forward contracts, subject to the requirements of the 1940 Act. Use of structured financial instruments for hedging purposes may present significant risks, including the risk of loss of the amounts invested. Defaults by the other party to a hedging transaction can result in losses in the hedging transaction. Hedging activities also involve the risk of an imperfect correlation between the hedging instrument and the asset being hedged, which could result in losses both on the hedging transaction and on the instrument being hedged. Use of hedging activities may not prevent significant losses and could increase our losses. Further, hedging transactions may reduce cash available to service our debt or pay distributions to our shareholders.
The TRS and any other derivative transactions into which we may enter expose us to certain risks, including market risk, liquidity risk and other risks associated with the use of leverage.
In November 2012, our wholly owned special purpose financing subsidiary, Halifax Funding, became a party to a total return swap arrangement, or TRS, with The Bank of Nova Scotia, referred to as the counterparty. Pursuant to the TRS, we periodically receive any income generated by TRS assets underlying the TRS and collected by the counterparty. We also receive the net realized gains from the liquidation of TRS assets over the life of the TRS. Correspondingly, if there is a net realized loss from the liquidation of TRS assets over the life of the TRS, we are required to periodically pay the counterparty the amount of such net realized losses. Pursuant to the terms of the TRS arrangement, we must pay the counterparty a series of floating rate periodic payments over the life of the TRS. These periodic payments are based on the settled notional amounts of the underlying TRS assets.
The TRS effectively adds leverage to our portfolio by providing us investment and economic exposure to a security or portfolio of securities without our owning, investing directly in, or taking physical custody of such security or portfolio of securities.
The TRS is subject to market risk, liquidity risk and risk of imperfect correlation between the value of the TRS and the TRS assets underlying the TRS. In addition, because the TRS is a form of synthetic leverage, it is subject to risks associated with the use of leverage. Moreover, we may incur certain costs in connection with the TRS that could in the aggregate be significant.
The TRS is subject to the risk that the counterparty will default on its payment obligations under the TRS arrangement or that one party will otherwise not be able to meet its contractual obligations to the other. Under the TRS, we make periodic payments based on a variable interest rate and have to post collateral to secure our obligations to the counterparty. In addition, by making periodic payments based on a variable interest rate, we bear the risk of depreciation with respect to the value of the TRS assets underlying the TRS and may be required under the terms of the TRS to post additional collateral on a dollar-for-dollar basis in the event the value of the TRS assets underlying the TRS depreciates in a material amount relative to any cash collateral previously posted by us.
If the counterparty chooses to exercise its termination rights under the TRS, it is possible that, because of adverse market conditions existing at the time of such termination, we will owe more to the counterparty (or will be entitled to receive less from the counterparty) than we would otherwise have if we controlled the timing of such termination.
For purposes of determining our compliance with the asset coverage ratio test applicable to us as a business development company, we will treat the outstanding notional amount of the TRS and any further total return swap to which we are a party, less the actual amount of any cash collateral posted by us under the TRS and such further total return swap, as a senior security for the life of that instrument. Further, for purposes of determining our compliance with the 70% qualifying assets requirement of Section 55(a) under the 1940 Act, we will treat each loan or bond underlying the TRS and any further total return swap to which we are a party as a qualifying asset if the obligor on such loan is an eligible portfolio company and as a non-qualifying asset if the obligor is not an eligible portfolio company.
Economic recessions or downturns could impair our portfolio companies and harm our operating results.
Many of our portfolio companies are susceptible to economic slowdowns or recessions and may be unable to repay our debt investments during these periods. Therefore, the amount of any non-performing assets may increase, and the value of our portfolio is likely to decrease during these periods. Adverse economic conditions may also decrease the value of any collateral securing our senior or second lien loans. A severe recession may further decrease the value of such collateral and result in losses of value in our portfolio and a decrease in our revenues, net income, assets and net worth. Unfavorable economic conditions also could increase our funding costs, limit our access to the capital markets or result in a decision by lenders not to extend credit to us on terms we deem acceptable. These events could prevent us from increasing investments and harm our operating results.
In late 2007, the U.S. economy entered a recession that officially lasted until June 2009, although the effects continued thereafter. As a result of those economic conditions, the financial services sector was negatively impacted by significant write-offs as the value of the assets held by financial firms declined, impairing their capital positions and abilities to lend and invest. Such value declines were exacerbated by widespread forced liquidations. Such forced liquidations impacted many investors and investment vehicles, leading to a decline in the supply of capital for investment and depressed pricing levels for many assets. These events
23
Table of Contents
significantly diminished overall confidence in the debt and equity markets, created unprecedented declines in the values of certain assets and caused extreme economic uncertainty. Although there has been improvement in the U.S. economy since then, certain sectors remain weak and unemployment remains at higher than historical levels.
A return of recessionary conditions and/or continued negative developments in the domestic and international credit markets may significantly affect the markets in which we do business, the value of our loans and investments, and our ongoing operations, costs and profitability. Any such unfavorable economic conditions, including rising interest rates, may also increase our funding costs, limit our access to capital markets or negatively impact our ability to obtain additional financing, particularly from the debt markets. In addition, any future financial market uncertainty could lead to financial market disruptions and could impact our ability to obtain additional financing. These events could limit our investment originations, limit our ability to grow and negatively impact our operating results and financial condition.
Defaults by our portfolio companies will harm our operating results.
A portfolio company’s failure to satisfy financial or operating covenants imposed by us or other lenders could lead to defaults and, potentially, termination of its debt financing and foreclosure on its secured assets, which could trigger cross-defaults under other agreements and jeopardize a portfolio company’s ability to meet its obligations under the debt or equity securities that we hold. We may incur expenses to the extent necessary to seek recovery upon default or to negotiate new terms, which may include the waiver of certain financial covenants, with a defaulting portfolio company.
An investment strategy focused primarily on privately held companies presents certain challenges, including the lack of available information about these companies.
We invest primarily in privately held companies. Investments in private companies pose certain incremental risks as compared to investments in public companies including that they:
| • | have reduced access to the capital markets, resulting in diminished capital resources and ability to withstand financial distress; |
| • | may have limited financial resources and may be unable to meet their obligations under their debt securities that we hold, which may be accompanied by a deterioration in the value of any collateral and a reduction in the likelihood of us realizing any guarantees we may have obtained in connection with our investment; |
| • | may have shorter operating histories, narrower product lines and smaller market shares than larger businesses, which tend to render them more vulnerable to competitors’ actions and changing market conditions, as well as general economic downturns; |
| • | are more likely to depend on the management talents and efforts of a small group of persons; therefore, the death, disability, resignation or termination of one or more of these persons could have a material adverse impact on a privately held company and, in turn, on us; and |
| • | generally have less predictable operating results, may from time to time be parties to litigation, may be engaged in rapidly changing businesses with products subject to a substantial risk of obsolescence, and may require substantial additional capital to support their operations, finance expansion or maintain their competitive position. In addition, our executive officers, directors and members of the Advisors’ management may, in the ordinary course of business, be named as defendants in litigation arising from our investments in the portfolio companies. |
In addition, investments in private companies tend to be less liquid. The securities of private companies are not publicly traded or actively traded on the secondary market and are, instead, traded on a privately negotiated over-the-counter secondary market for institutional investors. These over-the-counter secondary markets may be inactive during an economic downturn or a credit crisis. In addition, the securities in these companies will be subject to legal and other restrictions on resale or will otherwise be less liquid than publicly traded securities. If there is no readily available market for these investments, we are required to carry these investments at fair value as determined by our board of directors. As a result, if we are required to liquidate all or a portion of our portfolio quickly, we may realize significantly less than the value at which we had previously recorded these investments. We may also face other restrictions on our ability to liquidate an investment in a portfolio company to the extent that we, our Advisors or any of their respective affiliates have material nonpublic information regarding such portfolio company or where the sale would be an impermissible joint transaction. The reduced liquidity of our investments may make it difficult for us to dispose of them at a favorable price, and, as a result, we may suffer losses.
Finally, little public information generally exists about private companies and these companies may not have third-party credit ratings or audited financial statements. We must therefore rely on the ability of our Advisors to obtain adequate information through due diligence to evaluate the creditworthiness and potential returns from investing in these companies. Additionally, these companies and their financial information will not generally be subject to the Sarbanes-Oxley Act of 2002 and other rules that govern public companies. If we are unable to uncover all material information about these companies, we may not make a fully informed investment decision, and we may lose money on our investments.
24
Table of Contents
Certain investment analyses and decisions by the Advisors may be required to be undertaken on an expedited basis.
Investment analyses and decisions by the Advisors may be required to be undertaken on an expedited basis to take advantage of investment opportunities. While we generally will not seek to make an investment until the Advisors have conducted sufficient due diligence to make a determination as to the acceptability of the credit quality of the investment and the underlying issuer, in such cases, the information available to the Advisors at the time of making an investment decision may be limited. Therefore, no assurance can be given that the Advisor will have knowledge of all circumstances that may adversely affect an investment. In addition, the Advisors expect often to rely upon independent consultants in connection with its evaluation of proposed investments. No assurance can be given as to the accuracy or completeness of the information provided by such independent consultants and we may incur liability as a result of such consultants’ actions.
We may not have the funds or ability to make additional investments in our portfolio companies or to fund our unfunded commitments.
After our initial investment in a portfolio company, we may be called upon from time to time to provide additional funds to such company or have the opportunity to increase our investment through the exercise of a warrant or other right to purchase common stock. There is no assurance that we will make, or will have sufficient funds to make, follow-on investments. Even if we do have sufficient capital to make a desired follow-on investment, we may elect not to make a follow-on investment because we may not want to increase our level of risk, we prefer other opportunities, we are limited in our ability to do so by compliance with business development company requirements, or we desire to maintain our RIC status. Our ability to make follow-on investments may also be limited by our Advisors’ allocation policies. Any decisions not to make a follow-on investment or any inability on our part to make such an investment may have a negative impact on a portfolio company in need of such an investment, may result in a missed opportunity for us to increase our participation in a successful operation or may reduce the expected return on the investment.
Prepayments of our debt investments by our portfolio companies could adversely impact our results of operations and reduce our return on equity.
We are subject to the risk that the investments we make in our portfolio companies may be repaid prior to maturity. When this occurs, we will generally reinvest these proceeds in temporary investments, pending their future investment in new portfolio companies. These temporary investments will typically have substantially lower yields than the debt being prepaid and we could experience significant delays in reinvesting these amounts. Any future investment in a new portfolio company may also be at lower yields than the debt that was repaid. As a result, our results of operations could be materially adversely affected if one or more of our portfolio companies elect to prepay amounts owed to us. Additionally, prepayments, net of prepayment fees, could negatively impact our return on equity.
The agreements governing each of our revolving credit facilities and our senior secured term loan contain various covenants which, if not complied with, could accelerate repayment under the relevant facility, thereby materially and adversely affecting our liquidity, financial condition, results of operations and our ability to service our debt or pay distributions to our shareholders.
We and each of our wholly owned, special purpose financing subsidiaries are party to revolving or term credit facilities with one or more lenders. We or our special purpose financing subsidiaries may become party to additional such facilities in the future. The agreements governing these facilities currently, and are likely to continue to, contain default provisions such as:
| • | the failure to make principal payments when due or interest payments within three business days of when due; |
| • | borrowings under the facility exceeding the applicable advance rates; |
| • | the purchase by us or the relevant financing subsidiary, as applicable, of certain ineligible assets; |
| • | the insolvency or bankruptcy of us or the relevant financing subsidiary; |
| • | the decline of our or the relevant financing subsidiary’s, as applicable, net asset value below a specified threshold; and |
| • | fraud or other illicit acts by us, KKR or CNL in our or their respective investment advisory capacities. |
An event of default under any one credit facility may result, among other things, in the termination of the availability of further funds under that facility and other unrelated credit facilities, and an accelerated maturity date for all amounts outstanding under the credit facility or facilities. This could disrupt our business, reduce our revenues and, by delaying any dividends allowed to us under the facility until the lender has been paid in full, reduce our liquidity and cash flow and impair our ability to grow our business, service our debt, make distribution payments to our shareholders and maintain our status as a RIC.
The agreements governing each credit facility would require us or the relevant financing subsidiary, as applicable, to comply with certain operational covenants. These covenants may, for example, require us or the relevant financing subsidiary, as applicable, to, among other things, maintain eligible assets with an aggregate equity value, net of borrowing balance, equal to or exceeding specified amounts under the facility. In addition, under the relevant facility, the occurrence of certain “Super- Collateralization Events” may result in an increase of the collateral equity value that we or the relevant financing subsidiary, as applicable, is required to maintain. Super-Collateralization Events would include, among other things:
25
Table of Contents
| • | certain key employees ceasing to be directors, principals, officers or investment managers of KKR; |
| • | the bankruptcy or insolvency of KKR or CNL; |
| • | KKR or CNL ceasing to act as sub-advisor or advisor for us or the relevant financing subsidiary; |
| • | our ceasing to act as the relevant financing subsidiary’s investment manager, becoming bankrupt or insolvent, defaulting on certain material agreements or failing to maintain a net asset value above a specified threshold; and |
| • | fraud or other illicit acts by us, KKR or CNL in our or their respective investment advisory capacities. |
A decline in the value of assets owned by us or the relevant financing subsidiary, as applicable or the occurrence of a Super-Collateralization Event under the relevant facility could result in our being required to retain, acquire or contribute to the relevant financing subsidiary, as applicable, additional assets, which would likely disrupt our business and impact our ability to meet our investment objectives, service our debt and pay distributions to our shareholders.
The failure to meet collateral requirements under the relevant facility or the occurrence of any other event of default that results in the termination of such facility may force us to liquidate positions at a time and/or at a price that is disadvantageous to us and could result in losses. In addition, upon the occurrence of an event of default under the relevant facility, the related lender would have the right to the assets pledged as collateral supporting the amounts outstanding under the facility and could sell such assets in order to satisfy amounts due under the facility.
Each borrowing under any credit facility will be subject to the satisfaction of certain conditions. We cannot assure you that we or the relevant financing subsidiary, as applicable, will be able to borrow funds under the relevant facility at any particular time or at all.
To the extent that we borrow money, the potential for gain or loss on amounts invested in us will be magnified and may increase the risk of investing in us. Borrowed money may also adversely affect the return on our assets, reduce cash available to service our debt or for distribution to our shareholders, and result in losses.
The use of borrowings, also known as leverage, increases the volatility of investments by magnifying the potential for gain or loss on invested equity capital. Since we use leverage to partially finance our investments, through borrowing from banks and other lenders, you will experience increased risks of investing in our securities. If the value of our assets decreases, leveraging will cause our net asset value to decline more sharply than it otherwise would if we had not borrowed and employed leverage. Similarly, any decrease in our income would cause our net income to decline more sharply than it would have if we had not borrowed and employed leverage. Such a decline could negatively affect our ability to service our debt or make distributions to our shareholders. In addition, our shareholders will bear the burden of any increase in our expenses as a result of our use of leverage, including interest expenses and any increase in the management or incentive fees payable to our Advisors.
The amount of leverage that we employ depends on our Advisors’ and our board of directors’ assessment of market and other factors at the time of any proposed borrowing. There can be no assurance that additional leveraged financing will be available to us on favorable terms or at all. However, to the extent that we use leverage to finance our assets, our financing costs will reduce cash available for servicing our debt or distributions to shareholders. Moreover, we may not be able to meet our financing obligations and, to the extent that we cannot, we risk the loss of some or all of our assets to liquidation or sale to satisfy the obligations. In such an event, we may be forced to sell assets at significantly depressed prices due to market conditions or otherwise, which may result in losses.
As a business development company, we are required to meet a coverage ratio of total assets to total borrowings and other senior securities, which include all of our borrowings and any preferred stock that we may issue in the future, of at least 200%. If this ratio declines below 200%, we cannot incur additional debt and could be required to sell a portion of our investments to repay some debt when it is disadvantageous to do so. This could have a material adverse effect on our operations, and we may not be able to service our debt or make distributions.
Legislation was previously introduced in the U.S. House of Representatives that proposed a modification of this section of the 1940 Act to permit an increase in the amount of debt that business development companies could incur by modifying the percentage from 200% to 150%. Similar legislation may be reintroduced and may pass that permits us to incur additional leverage under the 1940 Act. As a result, we may be able to incur additional indebtedness in the future, and, therefore, the risk of an investment in us may increase.
26
Table of Contents
Investments in which we have a non-controlling interest may involve risks specific to third-party management of those investments.
We may also co-invest with third parties through partnerships, joint ventures or other entities, thereby acquiring jointly-controlled or non-controlling interests in certain investments in conjunction with participation by one or more third parties in such investment. Such joint venture partners or third party managers may include former KKR personnel or associated persons. As co-investors, we may have interests or objectives that are inconsistent with those of the third-party partners or co-venturers. Although we may not have full control over these investments and therefore, may have a limited ability to protect its position therein, we expect that we will negotiate appropriate rights to protect our interests. Nevertheless, such investments may involve risks not present in investments where a third party is not involved, including the possibility that a third-party partner or co-venturer may have financial difficulties, resulting in a negative impact on such investment, may have economic or business interests or goals which are inconsistent with ours, or may be in a position to take (or block) action in a manner contrary to the our investment objectives or the increased possibility of default by, diminished liquidity or insolvency of, the third party, due to a sustained or general economic downturn. Third-party partners or co-venturers may opt to liquidate an investment at a time during which such liquidation is not optimal for us. In addition, we may in certain circumstances be liable for the actions of its third-party partners or co-venturers. In those circumstances where such third parties involve a management group, such third parties may receive compensation arrangements relating to such investments, including incentive compensation arrangements.
Risks Related to an Investment in our Common Stock
Our shares are not listed on an exchange or quoted through a quotation system and may not be listed for the foreseeable future, if ever; and we are not required to complete a liquidity event by a specific date. Therefore, our shareholders will have limited liquidity and may not receive a full return of invested capital (including front-end commissions, fees and expenses), upon selling their shares or upon liquidation of our company.
Our shares are illiquid investments for which there is not a secondary market nor is it expected that any such secondary market will develop in the future. Therefore it is difficult for a shareholder to sell his or her shares. On or before December 31, 2018, our board of directors must consider, but is not required to recommend, a liquidity event for our shareholders. A future liquidity event could include: (i) a listing of our shares on a national securities exchange; (ii) a merger or another transaction approved by our board of directors in which our shareholders will receive cash or shares of a listed company; or (iii) a sale of all or substantially all of our assets either on a complete portfolio basis or individually followed by a liquidation. Certain types of liquidity events, such as a listing, would allow us to retain our investment portfolio intact while providing our shareholders with access to a trading market for their securities.
We do not know at this time what circumstances will exist in the future and therefore we do not know what factors our board of directors will consider in determining whether to pursue a liquidity event in the future. A liquidity event may include a sale, merger or rollover transaction with one or more affiliated investment companies managed by our Advisors.
Even if we do complete a liquidity event, you may not receive a return of all of your invested capital. If we do not successfully complete a liquidity event, liquidity for your shares will be limited to participation in our share repurchase program, which we have no obligation to maintain.
In addition, any shares repurchased pursuant to our share repurchase program may be purchased at a price which may reflect a discount from the purchase price shareholders paid for the shares being repurchased. If our shares are listed on a national securities exchange or quoted through a quotation system, we cannot assure you a public trading market will develop or, if one develops, that such trading market can be sustained. Shares of companies offered in an initial public offering often trade at a discount to the initial offering price due to underwriting discounts and related offering expenses. Also, shares of closed-end investment companies and business development companies frequently trade at a discount from their net asset value. This characteristic of closed-end investment companies is separate and distinct from the risk that our net asset value per share of common stock may decline. We cannot predict whether our common stock, if listed on a national securities exchange, will trade at, above or below net asset value.
We intend, but are not required, to offer to repurchase our shares on a quarterly basis. As a result shareholders will have limited opportunities to sell their shares.
We have adopted a share repurchase program to allow you to tender your shares to us on a quarterly basis at a price that is approximately equal to our net asset value as of the last business date of each relevant calendar quarter. The share repurchase program includes numerous restrictions that limit your ability to sell your shares. We intend to limit the number of shares to be repurchased during any calendar year to the number of shares we can repurchase with the proceeds we receive from the issuance of shares of our common stock under our distribution reinvestment plan, although at the discretion of our board of directors, we may also use cash on hand, cash available from borrowings and cash from the sale of our investments as of the end of the applicable period to repurchase shares. We limit repurchases in each quarter to 2.5% of the weighted average number of shares of our common stock outstanding in the prior four calendar quarters. To the extent that the number of shares put to us for repurchase exceeds the number of shares that we are able to purchase, we will repurchase shares on a pro rata basis, not on a first-come, first-served basis. Further, we will have no obligation to repurchase shares if the repurchase would violate the restrictions on distributions under federal law or Maryland law,
27
Table of Contents
which prohibits distributions that would cause a corporation to fail to meet statutory tests of solvency. Further, certain covenants in our senior credit facility may limit our ability to offer to repurchase your shares on a quarterly basis. These limits may prevent us from accommodating all repurchase requests made in any year. Our board of directors may amend, suspend or terminate the share repurchase program upon 30 days’ notice. We will notify our shareholders of such developments: (i) in our quarterly reports or (ii) by means of a separate mailing to you, accompanied by disclosure in a current or periodic report under the Exchange Act. In addition, under the quarterly share repurchase program, we have discretion to not repurchase shares, to suspend the program, and to cease repurchases. Further, the program has many limitations and should not be relied upon as a method to sell shares promptly and at a desired price.
The timing of our repurchase offers pursuant to our share repurchase program may be at a time that is disadvantageous to our shareholders, and, to the extent you are able to sell your shares under the program, you may not be able to recover the amount of your investment in our shares.
When we make repurchase offers pursuant to the share repurchase program, we may offer to repurchase shares at a price that is lower than the price that you paid for our shares. As a result, to the extent you paid a price that includes the related sales load and to the extent you have the ability to sell your shares pursuant to our share repurchase program, then the price at which you may sell shares, which will be approximately equivalent to our estimated net asset value on the last business day of the prior calendar quarter, may be lower than the amount you paid in connection with the purchase of your shares in the offering.
A shareholder’s interest in us will be diluted if we issue additional shares, which could reduce the overall value of an investment in us.
Our shareholders do not have preemptive rights to any shares we issue in the future. Our charter, which we refer to herein as the articles of incorporation, authorizes us to issue up to 1,000,000,000 shares of common stock. Pursuant to our articles of incorporation, a majority of our entire board of directors may amend our articles of incorporation to increase or decrease the aggregate number of authorized shares of stock or the number of authorized shares of stock of any class or series without shareholder approval. Our board may elect to sell additional shares in the future or issue equity interests in private offerings. To the extent we issue additional equity interests at or below net asset value, your percentage ownership interest in us may be diluted. In addition, depending upon the terms and pricing of any additional offerings and the value of our investments, you may also experience dilution in the book value and fair value of your shares.
Under the 1940 Act, we generally are prohibited from issuing or selling our common stock at a price below net asset value per share, which may be a disadvantage as compared with certain public companies. We may, however, sell our common stock, or warrants, options, or rights to acquire our common stock, at a price below the current net asset value of our common stock if our board of directors and independent directors determine that such sale is in our best interests and the best interests of our shareholders, and our shareholders, including a majority of those shareholders that are not affiliated with us, approve such sale. In any such case, the price at which our securities are to be issued and sold may not be less than a price that, in the determination of our board of directors, closely approximates the fair value of such securities (less any distributing commission or discount). If we raise additional funds by issuing common stock or senior securities convertible into, or exchangeable for, our common stock, then the percentage ownership of our shareholders at that time will decrease and you will experience dilution.
If we list our shares common stock on a national securities exchange, our shares of common stock may trade at a discount from net asset value, which could limit our ability to raise additional equity capital. If our shares of common stock are trading at a price below its net asset value per share, we will generally not be able to issue additional shares of our common stock at their market price without first obtaining approval for such issuance from our shareholders and our independent directors. We may not be able to obtain the necessary approvals to sell shares of common stock below net asset value.
Preferred stock could be issued with rights and preferences that would adversely affect holders of our common stock.
Under the terms of our articles of incorporation, our board of directors is authorized to issue shares of preferred stock in one or more series without shareholder approval, which could potentially adversely affect the interests of existing shareholders.
Certain provisions of the Maryland General Corporation Law could deter takeover attempts.
Our bylaws exempt us from the Maryland Control Share Acquisition Act, which significantly restricts the voting rights of control shares of a Maryland corporation acquired in a control share acquisition. If our bylaws were amended to repeal this exemption from the Maryland Control Share Acquisition Act, that statute may make it more difficult for a third party to obtain control of us and increase the difficulty of consummating such a transaction. Although we do not presently intend to adopt such an amendment to our bylaws, there can be no assurance that we will not so amend our bylaws at some time in the future. We will not, however, amend our bylaws to make us subject to the Maryland Control Share Acquisition Act without our board of directors determining that doing so would not conflict with the 1940 Act and obtaining confirmation from the SEC that it does not object to that determination.
Additionally, our board of directors may, without shareholder action, authorize the issuance of shares of stock in one or more classes or series, including preferred stock. Our board of directors may also, without shareholder action, amend our articles of incorporation to increase or decrease the aggregate number of shares of stock or the number of shares of stock of any class or series that we have authority to issue. These provisions may inhibit a change of control in circumstances that could give the holders of our common stock the opportunity to realize a premium over the value of our common stock.
28
Table of Contents
Investing in our common stock involves a high degree of risk.
The investments we make in accordance with our investment objective may result in a higher amount of risk than alternative investment options and includes volatility or loss of principal. Our investments in portfolio companies may be highly speculative and aggressive and, therefore, an investment in our common stock may not be suitable for someone with lower risk tolerance.
The net asset value of our common stock may fluctuate significantly.
The net asset value and liquidity, if any, of the market for shares of our common stock may be significantly affected by numerous factors, some of which are beyond our control and may not be directly related to our operating performance. These factors include:
| • | changes in the value of our portfolio of investments and derivative instruments as a result of changes in market factors, such as interest rate shifts, and also portfolio specific performance, such as portfolio company defaults, among other reasons; |
| • | changes in regulatory policies or tax guidelines, particularly with respect to RICs or business development companies; |
| • | loss of RIC or business development company status; |
| • | distributions that exceed our net investment income and net income as reported according to GAAP; |
| • | changes in earnings or variations in operating results; |
| • | changes in accounting guidelines governing valuation of our investments; |
| • | any shortfall in revenue or net income or any increase in losses from levels expected by investors; |
| • | departure of either of our Advisors or certain of their respective key personnel; |
| • | general economic trends and other external factors; and |
| • | loss of a major funding source. |
We may pay distributions from offering proceeds, borrowings or the sale of assets to the extent our cash flows from operations, net investment income or earnings are not sufficient to fund declared distributions.
We may fund distributions from the uninvested proceeds of an offering and borrowings, and we have not established limits on the amount of funds we may use from such proceeds or borrowings to make any such distributions. We have paid and may continue to pay distributions from the sale of assets to the extent distributions exceed our earnings or cash flows from operations. Distributions from offering proceeds or from borrowings could reduce the amount of capital we ultimately invest in our investment portfolio.
Shareholders may experience dilution in their ownership percentage if they do not participate in our distribution reinvestment plan.
All distributions declared in cash payable to shareholders that are participants in our distribution reinvestment plan will generally be automatically reinvested in shares of our common stock. As a result, shareholders that do not participate in our distribution reinvestment plan may experience dilution over time. Shareholders who do not participate in our distribution reinvestment plan may experience accretion to the net asset value of their shares if our shares are trading at a premium to net asset value and dilution if our shares are trading at a discount to net asset value. The level of accretion or discount would depend on various factors, including the proportion of our shareholders who participate in the plan, the level of premium or discount at which our shares are trading and the amount of the distribution payable to shareholders.
The existence of a large number of outstanding shares and shareholders prior to completion of the listing of our securities on a national securities exchange could negatively affect our stock price.
As of December 31, 2016, we had approximately 309 million shares of our common stock outstanding and the ability of our shareholders to liquidate their investments is limited. If we were to list our common stock on a securities exchange in the future, a large volume of sales of these shares could decrease the prevailing market prices of our common stock and could impair our ability to raise additional capital through the sale of equity securities in the future. Even if a substantial number of sales are not effected, the mere perception of the possibility of these sales could depress the market price of our common stock and have a negative effect on our ability to raise capital in the future. In addition, anticipated downward pressure on our common stock price due to actual or anticipated sales of common stock from this market overhang could cause some institutions or individuals to engage in short sales of our common stock, which may itself cause the price of our stock to decline.
29
Table of Contents
Your interest in us may be diluted if you do not fully exercise your subscription rights in any rights offering. In addition, if the subscription price is less than our net asset value per share, then you will experience an immediate dilution of the aggregate net asset value of your shares.
In the event we issue subscription rights, shareholders who do not fully exercise their subscription rights should expect that they will, at the completion of a rights offering pursuant to our prospectus, own a smaller proportional interest in us than would otherwise be the case if they fully exercised their rights. We cannot state precisely the amount of any such dilution in share ownership because we do not know at this time what proportion of the shares will be purchased as a result of such rights offering.
In addition, if the subscription price is less than the net asset value per share of our common stock, then our shareholders would experience an immediate dilution of the aggregate net asset value of their shares as a result of the offering. The amount of any decrease in net asset value is not predictable because it is not known at this time what the subscription price and net asset value per share will be on the expiration date of a rights offering or what proportion of the shares will be purchased as a result of such rights offering. Such dilution could be substantial.
These dilutive effects may be exacerbated if we were to conduct multiple subscription rights offerings, particularly if such offerings were to occur over a short period of time. In addition, subscription rights offerings and the prospect of future subscription rights offerings may create downward pressure on the secondary market price of our common stock due to the potential for the issuance of shares at a price below our net asset value, without a corresponding change to our net asset value.
If we issue preferred stock, debt securities or convertible debt securities, the net asset value of our common stock may become more volatile.
We cannot assure you that the issuance of preferred stock and/or debt securities would result in a higher yield or return to the holders of our common stock. The issuance of preferred stock, debt securities or convertible debt would likely cause the net asset value of our common stock to become more volatile. If the dividend rate on the preferred stock, or the interest rate on the debt securities, were to approach the net rate of return on our investment portfolio, the benefit of leverage to the holders of our common stock would be reduced. If the dividend rate on the preferred stock, or the interest rate on the debt securities, were to exceed the net rate of return on our portfolio, the use of leverage would result in a lower rate of return to the holders of common stock than if we had not issued the preferred stock or debt securities. Any decline in the net asset value of our investment would be borne entirely by the holders of our common stock. Therefore, if the market value of our portfolio were to decline, the leverage would result in a greater decrease in net asset value to the holders of our common stock than if we were not leveraged through the issuance of preferred stock. This decline in net asset value would also tend to cause a greater decline in the market price, if any, for our common stock.
There is also a risk that, in the event of a sharp decline in the value of our net assets, we would be in danger of failing to maintain required asset coverage ratios which may be required by the preferred stock, debt securities or convertible debt or our current investment income might not be sufficient to meet the dividend requirements on the preferred stock or the interest payments on the debt securities. In order to counteract such an event, we might need to liquidate investments in order to fund redemption of some or all of the preferred stock, debt securities or convertible debt. In addition, we would pay (and the holders of our common stock would bear) all costs and expenses relating to the issuance and ongoing maintenance of the preferred stock, debt securities, convertible debt, any combination of these securities. Holders of preferred stock, debt securities or convertible debt may have different interests than holders of common stock and may at times have disproportionate influence over our affairs.
Holders of any preferred stock that we may issue will have the right to elect members of the board of directors and have class voting rights on certain matters.
The 1940 Act requires that holders of shares of preferred stock must be entitled as a class to elect two directors at all times and to elect a majority of the directors if dividends on such preferred stock are in arrears by two years or more, until such arrearage is eliminated. In addition, certain matters under the 1940 Act require the separate vote of the holders of any issued and outstanding preferred stock, including changes in fundamental investment restrictions and conversion to open-end status and, accordingly, preferred shareholders could veto any such changes. Restrictions imposed on the declarations and payment of dividends or other distributions to the holders of our common stock and preferred stock, both by the 1940 Act and by requirements imposed by rating agencies, might impair our ability to maintain our qualification as a RIC for U.S. federal income tax purposes.
Federal Income Tax Risks
We will be subject to corporate-level income tax if we are unable to maintain our qualification as a RIC under Subchapter M of the Code or if we make investments through taxable subsidiaries.
To maintain RIC tax treatment under the Code, we must meet the following minimum annual distribution, income source and asset diversification requirements.
30
Table of Contents
The minimum annual distribution requirement for a RIC will be satisfied if we distribute to our shareholders on an annual basis at least 90% of our investment company taxable income. In addition, a RIC may, in certain cases, satisfy the 90% distribution requirement by distributing dividends relating to a taxable year after the close of such taxable year under the “spillback dividend” provisions of subchapter M. We would be taxed, at regular corporate rates, on retained income and/or gains, including any short-term capital gains or long-term capital gains. We must also satisfy an additional annual distribution requirement with respect to each calendar year in order to avoid a 4% excise tax on the amount of the under-distribution. Because we use debt financing, we are subject to (i) an asset coverage ratio requirement under the 1940 Act and (ii) certain financial covenants under loan and credit agreements that could, under certain circumstances, restrict us from making distributions necessary to satisfy the distribution requirements. If we are unable to obtain cash from other sources, or chose or be required to retain a portion of our taxable income or gains, we could (1) be required to pay excise tax and (2) fail to qualify for RIC tax treatment, and thus become subject to corporate-level income tax on our taxable income (including gains).
The income source requirement will be satisfied if we obtain at least 90% of our annual income from dividends, interest, gains from the sale of stock or securities, or other income derived from the business of investing in stock or securities.
The asset diversification requirement will be satisfied if we meet certain asset diversification requirements at the end of each quarter of our taxable year. To satisfy this requirement, at least 50% of the value of our assets must consist of cash, cash equivalents (including receivables), U.S. Government securities, securities of other RICs, and other acceptable securities; and no more than 25% of the value of our assets can be invested in the securities, other than U.S. government securities or securities of other RICs, of one issuer, of two or more issuers that are controlled, as determined under applicable Code rules, by us and that are engaged in the same or similar or related trades or businesses or of certain “qualified publicly traded partnerships.” Failure to meet these requirements may result in our having to dispose of certain investments quickly in order to prevent the loss of RIC status. Because most of our investments will be in private companies, and therefore will be relatively illiquid, any such dispositions could be made at disadvantageous prices and could result in substantial losses.
If we fail to qualify for or maintain RIC tax treatment for any reason and are subject to corporate income tax, the resulting corporate taxes could substantially reduce our net assets, the amount of income available for distribution, and the amount of our distributions.
We may invest in certain debt and equity investments through taxable subsidiaries and the net taxable income of these taxable subsidiaries will be subject to federal and state corporate income taxes. We may invest in certain foreign debt and equity investments which could be subject to foreign taxes (such as income tax, withholding, and value added taxes).
We may have difficulty paying our required distributions if we recognize income before or without receiving cash representing such income.
For federal income tax purposes, we may be required to recognize taxable income in circumstances in which we do not receive a corresponding payment in cash. For example, since we will likely hold debt obligations that are treated under applicable tax rules as having original issue discount (such as debt instruments with PIK, secondary market purchases of debt securities at a discount to par, interest or, in certain cases, increasing interest rates or debt instruments that were issued with warrants), we must include in income each year a portion of the original issue discount that accrues over the life of the obligation, regardless of whether cash representing such income is received by us in the same taxable year. We may also have to include in income other amounts that we have not yet received in cash, such as unrealized appreciation for foreign currency forward contracts and deferred loan origination fees that are paid after origination of the loan or are paid in non-cash compensation such as warrants or stock. Furthermore, we may invest in non-U.S. corporations (or other non-U.S. entities treated as corporations for U.S. federal income tax purposes) that could be treated under the Code and U.S. Treasury regulations as “passive foreign investment companies” and/or “controlled foreign corporations.” The rules relating to investment in these types of non-U.S. entities are designed to ensure that U.S. taxpayers are either, in effect, taxed currently (or on an accelerated basis with respect to corporate level events) or taxed at increased tax rates at distribution or disposition. In certain circumstances this could require us to recognize income where we do not receive a corresponding payment in cash.
Unrealized appreciation on derivatives, such as foreign currency forward contracts, may be included in taxable income while the receipt of cash may occur in a subsequent period when the related contract expires. Any unrealized depreciation on investments that the foreign currency forward contracts are designed to hedge is not currently deductible for tax purposes. This can result in increased taxable income whereby we may not have sufficient cash to pay distributions or we may opt to retain such taxable income and pay a 4% excise tax. In such case we could still rely upon the “spillback provisions” to maintain RIC qualification.
A portion of our income may constitute original issue discount or other income required to be included in taxable income prior to receipt of cash. Further, we may elect to amortize market discounts with respect to debt securities acquired in the secondary market and include such amounts in our taxable income in the current year, instead of upon disposition, as an election not to do so would limit our ability to deduct interest expenses for tax purposes. Because any original issue discount or other amounts accrued will be included in our investment company taxable income for the year of the accrual, we may be required to make a distribution to our shareholders in order to satisfy the annual distribution requirement, even if we will not have received any corresponding cash amount. As a result, we may have difficulty meeting the annual distribution requirement necessary to maintain RIC tax treatment under the
31
Table of Contents
Code. We may have to sell some of our investments at times and/or at prices we would not consider advantageous, raise additional debt or equity capital, make a partial share distribution, or forgo new investment opportunities for this purpose. If we are not able to obtain cash from other sources, and choose not to make a qualifying share distribution, we may fail to qualify for RIC tax treatment and thus become subject to corporate-level income tax.
| Item 1B. | Unresolved Staff Comments |
Not applicable.
| Item 2. | Properties |
We do not own any real estate or other physical properties materially important to our operation. We believe that the office facilities of the Advisor are suitable and adequate for our business as it is contemplated to be conducted.
| Item 3. | Legal Proceedings |
Neither we nor any of our subsidiaries, are currently subject to any material legal proceedings, nor, to our knowledge, is any material legal proceeding threatened against us or our subsidiaries. In addition, to our knowledge, none of our Advisors or our Administrator is currently subject to any material legal proceedings nor is any material legal proceeding threatened against them. From time to time, we, our subsidiaries, our Advisors or Administrator may be a party to certain legal proceedings in the ordinary course of, or incidental to the normal course of, our business, including the enforcement of our rights under contracts with our portfolio companies. While we cannot predict the outcome of these legal proceedings with certainty, we do not expect that these proceedings will have a material adverse effect on our results of operations or financial condition.
| Item 4. | Mine Safety Disclosures |
Not applicable.
32
Table of Contents
| Item 5. | Market for Registrant’s Common Equity, Related Shareholder Matters and Issuer Purchases of Equity Securities |
Market Information
There is currently no established public trading market for our common stock. Therefore, there is a risk that a shareholder may not be able to sell our shares of common stock at a time or price acceptable to the shareholder, or at all.
In October 2016, we closed our Follow-On Offering to new investors. Following the closing of our continuous public offering, we have continued to issue shares pursuant to our distribution reinvestment plan.
Set forth below is a chart that reconciles gross and net proceeds from the Offerings since we commenced our Initial Offering on April 4, 2011:
| As of December 31, 2016 | ||||||||
| (in thousands, except share and per share amounts) |
Shares | Amount | ||||||
| Gross Proceeds from Offerings |
286,669,960 | $ | 3,106,850 | |||||
| Commissions and Marketing Support Fees |
— | (284,052 | ) | |||||
| Reinvestment of Distributions |
37,662,667 | 358,851 | ||||||
|
|
|
|
|
|||||
| Net Proceeds from Offerings |
324,332,627 | $ | 3,181,649 | |||||
|
|
|
|
|
|||||
| Average Net Proceeds Per Share |
$9.81 | |||||||
Holders
As of March 15, 2017, we had 71,049 record holders of our common stock.
Recent Sales of Unregistered Securities
None.
Share Repurchase Program
We commenced our share repurchase program in July 2012 and the first repurchase of shares occurred in August 2012. We limit repurchases in each quarter to 2.5% of the weighted average number of shares of our common stock outstanding in the prior four calendar quarters. We currently intend to limit the number of shares to be repurchased during any calendar year to the number of shares we can repurchase with the proceeds we receive from the issuance of shares of our common stock under our distribution reinvestment plan. At the discretion of our board of directors, we may also use cash on hand, cash available from borrowings and cash from the sale of our investments as of the end of the applicable period to repurchase shares. Our board of directors may amend, suspend or terminate the share repurchase program upon 30 days’ notice. All shares purchased by us pursuant to the terms of each tender offer will be retired and thereafter will be authorized and unissued shares. The table below provides information concerning our repurchases of shares of our common stock during the quarter ended December 31, 2016 pursuant to our share repurchase program.
| Period |
Total Number of Shares Purchased |
Average Price Paid per Share |
Total Number of Shares Purchased as Part of Publicly Announced Programs |
Maximum Number of Shares that May Yet Be Purchased Under the Program |
||||||||||||
| October 1, 2016 through October 31, 2016 |
— | $ | — | — | — | |||||||||||
| November 1, 2016 through November 30, 2016 |
2,584,903 | 8.97 | 2,584,903 | — | ||||||||||||
| December 1, 2016 through December 31, 2016 |
— | — | — | — | ||||||||||||
|
|
|
|
|
|
|
|
|
|||||||||
| Total |
2,584,903 | $ | 8.97 | 2,584,903 | — | |||||||||||
|
|
|
|
|
|
|
|
|
|||||||||
Distributions
Distributions to our shareholders are governed by our articles of incorporation. Our board of directors declares a weekly record date, a weekly distribution rate and a monthly payment date. We intend to continue to pay monthly distributions to our shareholders. The timing and amount of our monthly distributions, if any, is determined by our board of directors. Any distributions to our shareholders are declared out of assets legally available for distribution. (See Note 8. “Distributions” and Note 12. “Federal Income Taxes” included in Item 8. “Financial Statements and Supplementary Data.”)
33
Table of Contents
The following table presents the total cash distributions declared per share of common stock outstanding during the years ended December 31, 2016 and 2015:
| Cash Distributions Declared Per Share | ||||||||
| Quarter |
2016 | 2015 | ||||||
| First |
$ | 0.201279 | $ | 0.201279 | ||||
| Second |
0.201279 | 0.201279 | ||||||
| Third |
0.201279 | 0.201279 | ||||||
| Fourth |
0.201279 | 0.201279 | ||||||
|
|
|
|
|
|||||
| Total |
$ | 0.805116 | $ | 0.805116 | ||||
|
|
|
|
|
|||||
Because we intend to maintain our qualification as a RIC, we intend to distribute at least 90% of our annual taxable income to our shareholders. To the extent our taxable earnings fall below the total amount of our paid distributions for any given fiscal year, a portion of those paid distributions may be deemed to be a tax return of capital to our shareholders. For the years ended December 31, 2016 and 2015, 100% of the distributions paid to shareholders were comprised of taxable income (ordinary income and capital gains, if any) for federal income tax purposes, and none of the paid distributions were determined to be a return of capital. As required, in January 2017 and 2016, a Form 1099-DIV was sent to our shareholders which stated the amount and sources of the paid distributions and provided information with respect to appropriate tax treatment of the paid distributions.
On December 14, 2016, January 27, 2017, February 24, 2017 and March 16, 2017, our board of directors declared distributions for January 2017, February 2017, March 2017 and April 2017, respectively. It is anticipated that these distributions, in the aggregate, will be substantially supported by our taxable income and the sources of distributions will be disclosed in our regular financial reports. Distributions will be recorded weekly and paid monthly in accordance with the schedule below.
| Record Date |
Distribution Payment Date |
Declared Distribution Per Share Per Record Date |
||||||
| January 3, 10, 17, 24 and 31, 2017 |
February 1, 2017 | $ | 0.015483 | |||||
| February 7, 14, 21 and 28, 2017 |
March 1, 2017 | $ | 0.015483 | |||||
| March 7, 14, 21 and 28, 2017 |
March 29, 2017 | $ | 0.015483 | |||||
| April 4, 11, 18 and 25, 2017 |
April 26, 2017 | $ | 0.015483 | |||||
We have adopted a distribution reinvestment plan that enables our shareholders to elect for the reinvestment of distributions in shares of common stock. As a result, if our board of directors authorizes and declares a cash distribution, then shareholders who have elected to participate in the distribution reinvestment plan will have their cash distributions automatically reinvested in additional shares of common stock at a price equivalent to the public offering prices exclusive of selling commissions and marketing support fees, rather than receiving the cash distributions.
On October 7, 2016, we amended and restated our distribution reinvestment plan, which first applied to the reinvestment of cash distributions paid on or after, November 1, 2016. Under the original plan, cash distributions to participating stockholders were reinvested in additional shares of our common stock at a purchase price equal to 90% of the public offering price per share in effect as of the date of issuance. Under the amended plan, cash distributions paid to participating stockholders will be reinvested in additional shares of our common stock at a purchase price determined by our board of directors, or a committee thereof, in its sole discretion, that is (i) not less than the net asset value per share of our common stock as determined in good faith by our board of directors or a committee thereof, in its sole discretion, immediately prior to the payment of the distribution and (ii) not more than 2.5% greater than the net asset value per share of our common stock as of such date.
34
Table of Contents
| Item 6. | Selected Financial Data |
The following selected financial data as of and for the years ended December 31, 2016, 2015, 2014, 2013 and 2012 is derived from our consolidated financial statements. The following selected financial data should be read in conjunction with Item 7. “Management’s Discussion and Analysis of Financial Condition and Results of Operations” and Item 8. “Financial Statements and Supplementary Data” included elsewhere in this report.
| ($ in thousands, except per share amounts) |
Year Ended December 31, | |||||||||||||||||||
| 2016 | 2015 | 2014 | 2013 | 2012 | ||||||||||||||||
| Statement of operations data: |
||||||||||||||||||||
| Investment income |
$ | 386,468 | $ | 311,097 | $ | 230,712 | $ | 119,573 | $ | 35,583 | ||||||||||
|
|
|
|
|
|
|
|
|
|
|
|||||||||||
| Operating expenses |
||||||||||||||||||||
| Total expenses |
173,061 | 131,443 | 99,194 | 68,502 | 19,651 | |||||||||||||||
| Reimbursement of expense support |
— | — | — | 1,136 | 1,830 | |||||||||||||||
| Advisors’ expense support |
— | — | — | — | (1,590 | ) | ||||||||||||||
|
|
|
|
|
|
|
|
|
|
|
|||||||||||
| Net expenses |
173,061 | 131,443 | 99,194 | 69,638 | 19,891 | |||||||||||||||
|
|
|
|
|
|
|
|
|
|
|
|||||||||||
| Net investment income before taxes |
213,407 | 179,654 | 131,518 | 49,935 | 15,692 | |||||||||||||||
| Income tax expense, including excise tax |
3,311 | 2,966 | 1,392 | — | — | |||||||||||||||
|
|
|
|
|
|
|
|
|
|
|
|||||||||||
| Net investment income |
210,096 | 176,688 | 130,126 | 49,935 | 15,692 | |||||||||||||||
| Net realized and unrealized gains (losses) (4) |
33,019 | (214,895 | ) | (45,809 | ) | 55,022 | 9,962 | |||||||||||||
|
|
|
|
|
|
|
|
|
|
|
|||||||||||
| Net (decrease) increase in net assets resulting from operations |
$ | 243,115 | $ | (38,207 | ) | $ | 84,317 | $ | 104,957 | $ | 25,654 | |||||||||
|
|
|
|
|
|
|
|
|
|
|
|||||||||||
| Per share data: |
||||||||||||||||||||
| Net investment income – basic and diluted |
$ | 0.69 | $ | 0.69 | $ | 0.73 | $ | 0.48 | $ | 0.50 | ||||||||||
| Net (decrease) increase in net assets resulting from operations – basic and diluted |
$ | 0.80 | $ | (0.15 | ) | $ | 0.48 | $ | 1.00 | $ | 0.82 | |||||||||
| Distributions declared |
$ | 0.80 | $ | 0.80 | $ | 0.80 | $ | 0.83 | $ | 0.76 | ||||||||||
| Other data: |
||||||||||||||||||||
| Total investment return-net price (1) |
8.5 | % | (2.0 | )% | 4.1 | % | 10.2 | % | 14.2 | % | ||||||||||
| Total investment return-net asset value (2) |
9.4 | % | (0.9 | )% | 5.9 | % | 11.4 | % | 14.3 | % | ||||||||||
| Number of portfolio companies at period end (3) |
129 | 124 | 112 | 94 | 126 | |||||||||||||||
| Total portfolio investments for the period (3) |
$ | 1,669,095 | $ | 2,068,738 | $ | 1,899,447 | $ | 2,090,370 | $ | 991,952 | ||||||||||
| Investment sales and prepayments for the period (3) |
$ | 1,378,020 | $ | 842,372 | $ | 1,058,221 | $ | 925,095 | $ | 410,530 | ||||||||||
| As of December 31, | ||||||||||||||||||||
| 2016 | 2015 | 2014 | 2013 | 2012 | ||||||||||||||||
| Balance sheet data: |
||||||||||||||||||||
| Total assets |
$ | 4,430,696 | $ | 4,045,125 | $ | 2,971,720 | $ | 2,281,186 | $ | 850,324 | ||||||||||
| Borrowings, net |
$ | 1,627,657 | $ | 1,418,657 | $ | 772,678 | $ | 707,389 | $ | 159,620 | ||||||||||
| Total net assets |
$ | 2,759,332 | $ | 2,594,022 | $ | 2,145,821 | $ | 1,430,434 | $ | 611,484 | ||||||||||
| (1) | Total investment return-net price is a measure of total return for shareholders who purchased our common stock at the beginning of the period, including distributions declared during the period. Total investment return-net price is based on (i) the purchase of one share at the public offering price, net of sales load, on the first day of the period, (ii) the sale at the net asset value per share on the last day of the period, of (A) one share plus (B) any fractional shares issued in connection with the reinvestment of monthly distributions, and (iii) the cash payment for distributions payable, if any, on the last day of the period. The total investment return-net price calculation assumes that (i) monthly cash distributions are reinvested in accordance with our distribution reinvestment plan and (ii) the fractional shares issued pursuant to the distribution reinvestment plan are issued at the then public offering price, net of sales load, on each monthly distribution payment date. There is no public market for our shares and the market value at sale is assumed to be equal to net asset value per share on the last day of the period. Our performance changes over time and currently may be different than that shown above. Past performance is no guarantee of future results. Investment performance is presented without regard to sales load that may be incurred by our shareholders in the purchase of our shares of common stock. |
| (2) | Total investment return-net asset value is a measure of the change in total value for shareholders who held our common stock at the beginning and end of the period, including distributions declared during the period. Total investment return-net asset value is based on (i) the beginning period net asset value per share on the first day of the period, (ii) the net asset value per share on the last day of the period, of (A) one share plus (B) any fractional shares issued in connection with the reinvestment of monthly distributions, and (iii) the value of distributions payable, if any, on the last day of the period. The total investment return-net asset value calculation assumes that (i) monthly cash distributions are reinvested in accordance with our distribution reinvestment plan and (ii) the fractional shares issued pursuant to the distribution reinvestment plan are issued at the then public offering price, net of sales load, on each monthly distribution payment date. There is no public market for our shares. Our performance changes over time and currently may be different than that shown above. Past performance is no guarantee of future results. Investment performance is presented without regard to sales load that may be incurred by our shareholders in the purchase of our shares of common stock. |
| (3) | Excludes TRS portfolio companies and TRS transactions. |
| (4) | See Item 7. “Management’s Discussion and Analysis of Financial Condition and Results of Operations – Results of Operations” for a discussion of realized and unrealized gains and losses for the years ended December 31, 2016 and 2015. |
35
Table of Contents
| Item 7. | Management’s Discussion and Analysis of Financial Condition and Results of Operations |
The information contained in this section should be read in conjunction with our consolidated financial statements and related notes thereto appearing elsewhere in this annual report on Form 10-K. In this report, “we,” “our,” “us” and “our company” refer to Corporate Capital Trust, Inc.
Overview
We are a non-diversified closed-end management investment company that has elected to be treated as a business development company under the 1940 Act. Formed as a Maryland corporation on June 9, 2010, we are externally managed by CNL Fund Advisors Company (“CNL”) and KKR Credit Advisors (US) LLC (“KKR”), collectively, the “Advisors,” which are responsible for sourcing potential investments, conducting due diligence on prospective investments, analyzing investment opportunities, structuring investments, determining the securities and other assets that we will purchase, retain or sell, and monitoring our portfolio on an ongoing basis. Both Advisors are registered as investment advisers with the Securities and Exchange Commission (the “SEC”). CNL also provides the administrative services necessary for us to operate.
Investment Objective, Investment Program and Primary Investment Types
Our investment objective is to provide our shareholders with current income and, to a lesser extent, long-term capital appreciation. We pursue our investment objective by investing primarily in the debt of privately owned and thinly traded U.S. companies (also referred to as “portfolio companies”) with a focus on originated transactions sourced through the networks of our Advisors. We define originated transactions as any negotiated investment where we, through our Advisors’ direct efforts, provide funds directly to a portfolio company. We also have the ability, as granted through our SEC Exemptive Order, to co-invest in privately negotiated transactions alongside other investment funds managed by or affiliated with KKR (the “Co-Investment Transactions”). We anticipate that a substantial portion of our investment portfolio will consist of senior and subordinated debt, which we believe offer potential opportunities for superior risk-adjusted returns and income generation. Our debt investments may take the form of corporate loans or bonds, may be secured or unsecured and may, in some cases, be accompanied by warrants, options or other forms of equity participation. We may separately purchase common or preferred equity interests in transactions, including non-controlling equity investments. Additionally, we may invest in convertible securities, derivatives and private investment funds. We may also co-invest with third parties through partnerships, joint ventures or other entities, thereby acquiring jointly controlled or non-controlling interests in certain investments in conjunction with participation by one or more third parties in such investment.
Our investment program consists of two main components. First, since the inception of our investment activities, we have been engaged in the direct purchase of debt and equity securities, primarily issued by portfolio companies, through both secondary market and direct lending transactions. We refer to this investment program component as our “Investment Portfolio” in this report. Second, beginning in November 2012, we supplemented our economic exposure to portfolio companies by entering into total return swap arrangements (the “TRS”) with a commercial bank counterparty and directing the creation of a portfolio of debt investments that serve as reference assets under the TRS. We refer to this investment program component as our portfolio of TRS assets or our “TRS Portfolio” in this report. In the case of our TRS Portfolio, we receive all (i) realized income and fees and (ii) realized capital gains generated by the TRS assets. In return, we must pay quarterly to the TRS counterparty a payment consisting of (i) realized capital losses generated by the TRS assets and (ii) financing costs that are based on (a) a floating financing rate and (b) the settled notional amount of TRS assets.
References in this report to the term “settled notional amount” in association with the TRS mean the aggregate cost of the TRS assets underlying the TRS that are settled and owned by the counterparty. In addition, this aggregate cost serves as the basis for our payments of financing charges to the counterparty under the TRS. References to the term “total notional amount” mean the settled notional amount plus the effect of the purchase and sale cost of all TRS assets where trade settlement is pending. We will receive additional economic benefit if the value of the underlying TRS asset appreciates relative to the total notional amount through the final settlement date following termination of the agreement. Conversely, we will be required to pay the counterparty the amount, if any, by which the value of the underlying TRS asset declines relative to the total notional amount through such final settlement date. We do not own, or have physical custody of, the TRS assets and the TRS assets are not direct investments by us. Our subsidiary is required to post collateral with a custodian of at least 33.3% of the notional amount of each TRS asset and may be required to post additional collateral in the event the value of the TRS assets decreases below a specified amount.
Our investment strategy is focused on creating and growing an Investment Portfolio that generates superior risk-adjusted returns by carefully selecting investments through rigorous due diligence and actively managing and monitoring our Investment Portfolio. When evaluating an investment and the related portfolio company, we use the resources of our Advisors to develop an investment thesis and a proprietary view of a potential portfolio company’s intrinsic value. We believe our flexible approach to investing allows us to take advantage of opportunities that offer favorable risk/reward characteristics.
36
Table of Contents
We primarily focus on the following investment types:
| • | Senior Debt. We invest in senior debt, in which we generally take a security interest in the available assets of the portfolio company, including equity interests in any of its subsidiaries. These investments generally take the form of senior secured first lien loans, senior secured second lien loans or senior secured bonds. In some circumstances, our lien could be subordinated to claims of other creditors. |
| • | Subordinated Debt. Our subordinated debt investments are generally subordinated to senior debt and are generally unsecured. These investments are generally structured with interest-only payments throughout the life of the security, with the principal due at maturity. |
| • | Structured Products. We also invest in structured products, which may include collateralized debt obligations (“CDOs”), collateralized bond obligations (“CBOs”), collateralized loan obligations (“CLOs”), structured notes and credit-linked notes. The issuers of such investment products may be structured as trusts or other types of pooled investment vehicles. Such products may also involve the deposit with or purchase by an entity of the underlying investments and the issuance by that entity of one or more classes of securities backed by, or representing interests in, the underlying investments or referencing an indicator related to such investments. |
| • | Equity Investments. We also make selected equity investments. In addition, when we invest in senior and subordinated debt, we may acquire warrants or options to purchase equity securities or benefit from other types of equity participation. Our goal is ultimately to dispose of these equity interests and realize gains upon our disposition of such interests. |
| • | Convertible Securities. We may invest in convertible securities, such as bonds, debentures, notes, preferred stocks or other securities that may be converted into, or exchanged for, a specified amount of common stock of the same or different issuer within a particular period of time at a specified price or formula. |
| • | Investments in Private Investment Funds. We may invest in, or wholly own, private investment funds, including hedge funds, private equity funds, limited liability companies, REITs, and other business entities. In particular, we expect we may invest in asset-based opportunities through joint ventures, investment platforms or build-ups that provide one or more of the following services: origination or sourcing of potential investment opportunities, due diligence and negotiation of potential investment opportunities and/or servicing, development and management (including turnaround) and disposition of investments. Such investments in joint ventures, platforms and build-ups may be in or alongside existing or newly formed operators, consultants and/or managers that pursue such opportunities and may or may not include capital and/or assets contributed by third party investors. Such investments may include opportunities to direct-finance physical assets, such as airplanes and ships, and/or operating assets, such as financial service entities, as opposed to investment securities, or to invest in origination and/or servicing platforms directly. These asset-based opportunities are expected to offer mezzanine-like structural downside protection as well as asset collateral, and equity-like upside that can be achieved through appreciation at the asset-level or, in the case of platforms, through growth of the enterprise value. Key areas of focus include, without limitation, (i) aircraft, (ii) shipping, (iii) renewables, (iv) real estate, (v) consumer finance, and (vi) energy/infrastructure. |
| • | Derivatives. We may invest in various types of derivatives, including TRS, interest rate swaps and foreign currency forward contracts and options. |
| • | Investments with Third-Parties. We may co-invest with third parties through partnerships, joint ventures or other entities, thereby acquiring jointly-controlled or non-controlling interests in certain investments in conjunction with participation by one or more third parties in such investment. Such joint venture partners or third party managers may include former KKR personnel or associated persons. |
The level of our investment activity can and does vary substantially from period to period depending on many factors, including: the demand for debt from creditworthy privately owned U.S. companies, the level of merger, acquisition and refinancing activity involving private companies, the availability of credit to finance transactions, the general economic environment, the competitive investment environment for the types of investments we currently seek and intend to seek in the future, cash available from operations and the amount of capital we may borrow.
As a business development company, we are required to comply with certain regulatory requirements. For instance, we may not acquire any assets other than “qualifying assets” as specified in the 1940 Act unless, at the time the acquisition is made, at least 70% of our total assets are qualifying assets as determined at the end of the prior quarter (with certain limited exceptions). Qualifying assets include investments in “eligible portfolio companies.” Under the relevant SEC rules, the term “eligible portfolio company” includes all private companies, companies whose securities are not listed on a national securities exchange and certain public companies that have listed their securities on a national securities exchange and have a market capitalization of less than $250 million. These rules also permit us to include as qualifying assets certain follow-on investments in companies that were eligible portfolio companies at the time of our initial investment but no longer meet the definition of eligible portfolio company at the time of the follow-on investment.
37
Table of Contents
Revenues
We generate revenues primarily in the form of interest on the debt securities of portfolio companies that we acquire and hold for investment purposes. Our investments in debt securities generally have an expected maturity of three to ten years, although we have no lower or upper constraint on maturity, and typically earn interest at fixed or floating rates. Interest on our debt securities is generally payable to us quarterly or semi-annually. Some of our investments in debt securities contain payment-in-kind (“PIK”) interest provisions. The outstanding principal amount of our debt securities and any accrued but unpaid interest will generally become due at the maturity date. In addition, we may generate revenue in the form of dividends from equity investments, prepayment fees, commitment fees, origination fees and fees for providing significant managerial assistance. While the TRS assets also generate interest income and fees, such amounts, net of the financing expenses, are recognized as (i) realized gains pursuant to generally accepted accounting principles (“GAAP”) when payable to us quarterly and (ii) unrealized gains for any accrued but unpaid amounts.
Operating Expenses
Our primary operating expenses include an investment advisory fee and, depending on our operating results, performance-based incentive fees, interest expense, administrative expenses, custodian and accounting fees, other third-party professional services and expenses and amortization of deferred offering expenses. The investment advisory fee and performance-based incentive fees compensate the Advisors for their services in identifying, evaluating, negotiating, closing and monitoring our investments.
Financial and Operating Highlights
The following table presents financial and operating highlights as of and for the years ended December 31, 2016 and 2015, and for the year ended December 31, 2014:
| As of December 31, (in thousands, except ratios and per share amounts) |
2016 | 2015 | ||||||||||
| Total assets |
$ | 4,430,696 | $ | 4,041,190 | ||||||||
| Adjusted total assets (Total assets, net of payable for investments purchased) |
$ | 4,408,491 | $ | 4,041,190 | ||||||||
| Investments in portfolio companies |
$ | 4,025,287 | $ | 3,722,261 | ||||||||
| Borrowings |
$ | 1,631,454 | $ | 1,423,980 | ||||||||
| Deemed borrowings (TRS implied leverage classified as senior securities) |
$ | 163,689 | $ | 182,326 | ||||||||
| Net assets |
$ | 2,759,332 | $ | 2,594,022 | ||||||||
| Net asset value per share |
$ | 8.93 | $ | 8.93 | ||||||||
| Leverage ratio (Borrowings + Deemed borrowings)/Adjusted total assets) |
41 | % | 40 | % | ||||||||
| Activity for the Year Ended December 31, (in thousands, except ratios and per share amounts) |
2016 | 2015 | 2014 | |||||||||
| Average net assets |
$ | 2,698,040 | $ | 2,428,271 | $ | 1,783,121 | ||||||
| Average borrowings |
$ | 1,476,426 | $ | 1,011,175 | $ | 572,484 | ||||||
| Purchases of investments |
$ | 1,669,095 | $ | 2,068,738 | $ | 1,899,447 | ||||||
| Sales, principal payments and other exits |
$ | 1,378,020 | $ | 842,372 | $ | 1,058,221 | ||||||
| Net investment income |
$ | 210,096 | $ | 176,688 | $ | 130,126 | ||||||
| Net realized (losses) gains on investments, derivative instruments and foreign currency transactions |
$ | (2,645 | ) | $ | 50,657 | $ | 18,997 | |||||
| Net change in unrealized appreciation (depreciation) on investments, derivative instruments and foreign currency translation |
$ | 35,664 | $ | (265,552 | ) | $ | (64,806 | ) | ||||
| Net increase (decrease) in net assets resulting from operations |
$ | 243,115 | $ | (38,207 | ) | $ | 84,317 | |||||
| Total distributions declared |
$ | 244,950 | $ | 205,044 | $ | 142,018 | ||||||
| Net investment income before unearned incentive fees per share |
$ | 0.69 | $ | 0.69 | $ | 0.68 | ||||||
| Net investment income per share |
$ | 0.69 | $ | 0.69 | $ | 0.73 | ||||||
| Earnings (losses) per share |
$ | 0.80 | $ | (0.15 | ) | $ | 0.48 | |||||
| Distributions declared per share outstanding for the entire period |
$ | 0.80 | $ | 0.80 | $ | 0.80 | ||||||
| Summary of Common Stock Offerings for the Year Ended December 31, (in
thousands, except share and |
2016 | 2015 | 2014 | |||||||||
| Gross proceeds, excluding reinvestment of distributions |
$ | 137,245 | $ | 679,862 | $ | 781,169 | ||||||
| Net proceeds to Company, excluding reinvestment of distributions |
$ | 127,596 | $ | 618,505 | $ | 709,070 | ||||||
| Reinvestment of distributions |
$ | 124,139 | $ | 105,363 | $ | 80,646 | ||||||
| Average net proceeds per share |
$ | 8.93 | $ | 9.69 | $ | 10.16 | ||||||
| Shares issued in connection with Offerings, excluding reinvestment of distributions |
14,323,113 | 63,742,355 | 69,802,396 | |||||||||
| Shares issued in connection with reinvestment of distributions |
13,858,169 | 10,950,275 | 7,952,695 | |||||||||
38
Table of Contents
Business Environment
After the financial crisis of 2008-2009, volatility spikes have become the norm, and 2016 was no exception. In the last 12 months, markets have been surprised by events such as the United Kingdom’s prospective withdrawal from the European Union (“Brexit”) and the outcome of the U.S. presidential election. Despite the volatility, improving macroeconomic conditions have led to strengthening fundamentals and also positive returns in leveraged credit. With this improvement, a large volume of deals made the fourth quarter of 2016 the busiest of the year for the market.
Given the backdrop we have experienced and the need for capital in the marketplace, we continue to believe that our closed-end structure, our predominately floating rate debt portfolio, and long term fundamental underwriting approach positions us well. We continue to focus on providing capital to companies that, for a variety of reasons, are unable to access the syndicated debt markets.
We believe three items continue to support our underlying investment thesis. First, leveraged lending guidelines at traditional lenders result in corporate and financial buyers looking beyond traditional financial intermediaries to support their transaction-related financings. Second, the capabilities of our Advisors, surety to close, and long term hold strategy have become understood and appreciated by borrowers. Finally, we believe the current environment offers attractive risk adjusted transaction terms through our ability to provide long term and sizeable financing solutions to our borrowers.
Since the financial crisis of 2008-2009, traditional lenders have been the subject of numerous regulatory changes which has facilitated the entrance into the debt markets of alternative lenders like our company; however, the new administration has proposed loosening regulations on traditional lenders – but by how much, when, and what this means remains uncertain. We believe continued focus on our fundamentals, including rigorous due diligence, robust credit underwriting and direct structuring of investments, best positions the portfolio to protect principal and generate attractive risk-adjusted returns.
Portfolio and Investment Activity
Portfolio Investment Activity as of and for the Years ended December 31, 2016 and 2015
The following tables summarize our investment activity as of and for the years ended December 31, 2016 and 2015 and for the year ended December 31, 2014, excluding our short term investments:
| Investment Activity Summary as of ($ in thousands) |
||||||||||||||||
| December 31, 2016 | December 31, 2015 | |||||||||||||||
| Investment Portfolio |
TRS Portfolio |
Investment Portfolio |
TRS Portfolio |
|||||||||||||
| Total fair value |
$ | 4,025,287 | $ | 258,299 | $ | 3,722,261 | $ | 308,213 | ||||||||
| No. portfolio companies |
129 | 43 | 124 | 48 | ||||||||||||
| No. debt investments |
141 | 47 | 141 | 51 | ||||||||||||
| No. structured product investments |
7 | — | 5 | — | ||||||||||||
| No. equity/other investments |
42 | — | 32 | — | ||||||||||||
39
Table of Contents
| Investment Portfolio Activity Summary ($ in thousands) |
TRS Portfolio Activity Summary ($ in thousands) |
|||||||||||||||||||||||
| Year Ended December 31, | Year Ended December 31, | |||||||||||||||||||||||
| 2016 | 2015 | 2014 | 2016 | 2015 | 2014 | |||||||||||||||||||
| Purchases of investments: |
||||||||||||||||||||||||
| Senior secured loans – first lien |
$ | 655,182 | $ | 785,833 | $ | 965,332 | $ | 70,504 | $ | 174,138 | $ | 264,268 | ||||||||||||
| Senior secured loans – second lien |
357,841 | 514,469 | 458,531 | 4,185 | 33,892 | 16,759 | ||||||||||||||||||
| Senior secured bonds |
68,458 | 123,404 | 72,767 | 15,000 | — | — | ||||||||||||||||||
| Subordinated debt |
332,196 | 343,916 | 291,214 | 9,500 | — | 1,002 | ||||||||||||||||||
| Structured products |
117,519 | 141,892 | 3,000 | — | — | — | ||||||||||||||||||
| Equity/other |
137,899 | 159,224 | 108,603 | — | — | — | ||||||||||||||||||
|
|
|
|
|
|
|
|
|
|
|
|
|
|||||||||||||
| Total |
$ | 1,669,095 | $ | 2,068,738 | $ | 1,899,447 | $ | 99,189 | $ | 208,030 | $ | 282,029 | ||||||||||||
|
|
|
|
|
|
|
|
|
|
|
|
|
|||||||||||||
| Sales, principal payments and other exits: |
||||||||||||||||||||||||
| Senior secured loans – first lien |
$ | 629,222 | $ | 205,660 | $ | 468,091 | $ | 127,166 | $ | 159,172 | $ | 45,349 | ||||||||||||
| Senior secured loans – second lien |
402,022 | 217,911 | 258,572 | 35,515 | 9,968 | — | ||||||||||||||||||
| Senior secured bonds |
121,132 | 72,082 | 86,497 | 3,221 | — | 3,780 | ||||||||||||||||||
| Subordinated debt |
154,230 | 263,178 | 215,044 | — | 875 | 6,930 | ||||||||||||||||||
| Structured products |
4,079 | 5,743 | 24,597 | — | — | — | ||||||||||||||||||
| Equity/other |
67,335 | 77,798 | 5,420 | — | — | — | ||||||||||||||||||
|
|
|
|
|
|
|
|
|
|
|
|
|
|||||||||||||
| Total |
$ | 1,378,020 | $ | 842,372 | $ | 1,058,221 | $ | 165,902 | $ | 170,015 | $ | 56,059 | ||||||||||||
|
|
|
|
|
|
|
|
|
|
|
|
|
|||||||||||||
| Portfolio Company Additions |
35 | 40 | 49 | 13 | 15 | 37 | ||||||||||||||||||
| Portfolio Company Exits |
(30 | ) | (28 | ) | (31 | ) | (18 | ) | (14 | ) | (10 | ) | ||||||||||||
| Debt Investment Additions |
60 | 52 | 81 | 19 | 18 | 42 | ||||||||||||||||||
| Debt Investment Exits |
(60 | ) | (38 | ) | (57 | ) | (23 | ) | (16 | ) | (13 | ) | ||||||||||||
While the Investment Portfolio and the TRS Portfolio are accounted for and presented as two distinct portfolios, the two portfolios had 17 and 28 debt investment positions and 24 and 32 portfolio companies in common as of December 31, 2016 and 2015, respectively. The changes in the fair value of our Investment Portfolio and our TRS Portfolio are directly related to (i) the changes in their cost basis and notional amounts, respectively, as a result of incremental purchases, sales and principal payments as described in the table above, and (ii) the changes in fair value for assets held at the beginning and end of the period. The net change in unrealized depreciation for the years ended December 31, 2016, 2015 and 2014 was ($1.86) million, ($232.45) million and ($104.59) million, respectively, for our Investment Portfolio, and $16.36 million, (10.30) million and ($6.64) million, respectively, for our TRS Portfolio. See “Results of Operations – Net Change in Unrealized Appreciation or Depreciation” below for further details relating to the changes.
As discussed above under “— Overview,” since receiving our SEC Exemptive Order, we have increased our focus on originated investments, including Co-Investment Transactions, as a main element of our investment strategy. Co-Investment Transactions give us the opportunity to participate in those investments alongside KKR’s institutional clients and proprietary funds. Our total origination activity in Co-Investment Transactions, plus future expected fundings related to such investments, totaled approximately $1.11 billion, $1.19 billion and $1.04 billion for the years ended December 31, 2016, 2015 and 2014, representing 46%, 34% and 34% of the affiliated co-investing funds’ investments of approximately $2.41 billion, $3.49 billion and $3.05 billion, respectively, in total tranche size for Co-Investment Transactions.
The following summarizes our investment activity associated with our investment focus on new originated debt investments during the years ended December 31, 2016, 2015 and 2014 and the status of originated investments held in the Investment Portfolio as of December 31, 2016 and 2015:
| Originated Investment Activity for the Year Ended December 31, ($ in thousands) |
2016 | 2015 | 2014 | |||||||||
| Number of originated investments, by issuer |
20 | 20 | 22 | |||||||||
| Total amount of originated investments, at cost (1) |
$ | 1,126,559 | $ | 1,167,195 | $ | 897,628 | ||||||
| Originated investments as a percentage of total investment activity |
67.5 | % | 56.4 | % | 47.3 | % | ||||||
| Fee income recognized in connection with originated investments |
$ | 10,352 | $ | 7,610 | $ | 5,706 | ||||||
| Originated Investments Summary as of December 31, (in thousands) |
2016 | 2015 | ||||||||||
| Total originated investments, at fair value |
$ | 2,778,713 | $ | 2,305,938 | ||||||||
| Total originated investments as a percentage of total Investment Portfolio, at fair value |
69.0 | % | 61.9 | % | ||||||||
| Weighted average annual yield of originated debt investments (2) (3) |
10.0 | % | 10.3 | % | ||||||||
| (1) | The total amount of originated investments, at cost, includes new issuers during the reporting periods and any follow-on originated investments from existing issuers. |
| (2) | The weighted average annual yield on debt investments is based on amortized cost as of the end of the applicable period. The weighted average annual yield for our debt investments is computed as (i) the sum of (a) the annual interest rate of each accruing debt investment multiplied by its par amount as of the end of the applicable reporting period, plus (b) the annual amortization of the purchase or original issue discount or premium of accruing each debt investment, if any; divided by (ii) the total amortized cost of all accruing debt investments included in the calculated group as of the end of the applicable reporting period. |
40
Table of Contents
| (3) | The weighted average annual yield of originated debt investments is higher than what investors in our Company will realize because it does not reflect expenses of the Company or any sales load. Total investment return – net price and total investment return – net asset value were 8.5% and 9.4%, respectively, for the year ended December 31, 2016 and (2.0%) and (0.9)%, respectively, for the year ended December 31, 2015. See Note 13. “Financial Highlights” in Item 8. “Financial Statements and Supplementary Data” for information on how such returns were calculated. |
The following information presents additional analysis of our Investment Portfolio and TRS Portfolio as of December 31, 2016 and 2015, excluding our short-term investments. Our investment program is not managed with any specific asset category target goals. The primary investment type concentrations include (i) senior debt, and (ii) subordinated debt securities.
| Investment Portfolio as of (in thousands) | ||||||||||||||||
| December 31, 2016 | December 31, 2015 | |||||||||||||||
| Asset Category |
Amortized Cost | Fair Value | Amortized Cost | Fair Value | ||||||||||||
| Senior debt |
||||||||||||||||
| Senior secured loans - first lien |
$ | 1,641,759 | $ | 1,547,100 | $ | 1,721,163 | $ | 1,593,668 | ||||||||
| Senior secured loans - second lien |
1,131,035 | 1,074,183 | 1,154,518 | 1,100,781 | ||||||||||||
| Senior secured bonds |
177,826 | 134,786 | 217,350 | 184,509 | ||||||||||||
|
|
|
|
|
|
|
|
|
|||||||||
| Total senior debt |
2,950,620 | 2,756,069 | 3,093,031 | 2,878,958 | ||||||||||||
| Subordinated debt |
683,640 | 642,427 | 525,301 | 457,287 | ||||||||||||
| Structured products |
226,807 | 210,871 | 111,640 | 116,208 | ||||||||||||
| Equity/Other (1) |
465,850 | 415,920 | 292,059 | 269,808 | ||||||||||||
|
|
|
|
|
|
|
|
|
|||||||||
| Total |
$ | 4,326,917 | $ | 4,025,287 | $ | 4,022,031 | $ | 3,722,261 | ||||||||
|
|
|
|
|
|
|
|
|
|||||||||
| (1) | Includes our investment in Strategic Credit Opportunities Partners, LLC. |
| TRS Portfolio as of (in thousands) | ||||||||||||||||
| December 31, 2016 | December 31, 2015 | |||||||||||||||
| Asset Category |
Notional Amount | Fair Value | Notional Amount | Fair Value | ||||||||||||
| Senior debt |
||||||||||||||||
| Senior secured loans - first lien |
$ | 202,506 | $ | 200,326 | $ | 269,945 | $ | 256,870 | ||||||||
| Senior secured loans - second lien |
29,957 | 30,026 | 46,704 | 43,971 | ||||||||||||
| Senior secured bonds |
15,724 | 15,632 | 7,315 | 6,353 | ||||||||||||
|
|
|
|
|
|
|
|
|
|||||||||
| Total senior debt |
248,187 | 245,984 | 323,964 | 307,194 | ||||||||||||
| Subordinated debt |
10,502 | 12,315 | 1,002 | 1,019 | ||||||||||||
|
|
|
|
|
|
|
|
|
|||||||||
| Total |
$ | 258,689 | $ | 258,299 | $ | 324,966 | $ | 308,213 | ||||||||
|
|
|
|
|
|
|
|
|
|||||||||
The decrease in senior debt and the increase in Equity/Other as a percentage of the total Investment Portfolio as of December 31, 2016 as compared to December 31, 2015 are partially due to the sale of senior debt investments to Strategic Credit Opportunities Partners, LLC, as explained in more detail below under “—Strategic Credit Opportunities Partners.”
The weighted average yield on debt investments at amortized cost and fair value held in our Investment Portfolio as of December 31, 2016 and 2015 were as follows:
| December 31, 2016 | December 31, 2015 | |||||||||||||||
| Asset Category |
Investment Portfolio at Amortized Cost |
TRS Portfolio at Notional Amount |
Investment Portfolio at Amortized Cost |
TRS Portfolio at Notional Amount |
||||||||||||
| Senior debt (1)(2) |
||||||||||||||||
| Senior secured loans - first lien |
9.2 | % | 7.9 | % | 8.7 | % | 5.8 | % | ||||||||
| Senior secured loans - second lien |
10.0 | % | 9.8 | % | 10.4 | % | 9.5 | % | ||||||||
| Senior secured bonds |
10.5 | % | 12.3 | % | 9.5 | % | 8.4 | % | ||||||||
| Subordinated debt(1)(2) |
10.5 | % | 10.9 | % | 10.1 | % | 6.8 | % | ||||||||
| Structured products (1)(2) |
10.6 | % | — | % | 10.8 | % | — | % | ||||||||
| (1) | The weighted average yield on debt investments is based on amortized cost as of the end of the applicable period. The weighted average yield for our debt investments is computed as, (i) the sum of (a) the annual interest rate of each accruing debt investment multiplied by its par amount as of the end of the applicable reporting period, plus (b) the annual amortization of the purchase or original issue discount or premium of each accruing debt investment, if any; divided by (ii) the total amortized cost of all accruing debt investments included in the calculated group as of the end of the applicable reporting period. |
| (2) | The weighted average annual yield of originated debt investments is higher than what investors in our Company will realize because it does not reflect expenses of the Company or any sales load. Total investment return – net price and total investment return – net asset value were 8.5% and 9.4%, respectively, for the year ended December 31, 2016 and (2.0%) and (0.9)%, respectively, for the year ended December 31, 2015. See Note 13. “Financial Highlights” in Item 8. “Financial Statements and Supplementary Data” for information on how such returns were calculated. |
41
Table of Contents
The following table presents a summary of interest rate and maturity statistics for the debt investments, based on par value, in our Investment Portfolio and the TRS Portfolio as of December 31, 2016 and 2015:
| Investment Portfolio as of December 31, |
TRS Portfolio as of December 31, |
|||||||||||||||
| Floating interest rate debt investments: |
2016 | 2015 | 2016 | 2015 | ||||||||||||
| Percent of debt portfolio |
77.8 | % | 71.4 | % | 89.6 | % | 96.7 | % | ||||||||
| Percent of floating rate debt investments with interest rate floors |
92.6 | % | 93.6 | % | 100.0 | % | 98.8 | % | ||||||||
| Weighted average interest rate floor |
1.0 | % | 1.0 | % | 1.0 | % | 1.1 | % | ||||||||
| Weighted average coupon spread to base rate |
806 bps | 764 bps | 505 bps | 484 bps | ||||||||||||
| Weighted average years to maturity |
4.5 | 4.9 | 3.8 | 4.5 | ||||||||||||
| Fixed interest rate debt investments: |
||||||||||||||||
| Percent of debt portfolio |
22.2 | % | 28.6 | % | 10.4 | % | 3.3 | % | ||||||||
| Weighted average coupon rate |
10.2 | % | 10.2 | % | 10.1 | % | 9.9 | % | ||||||||
| Weighted average years to maturity |
5.4 | 5.6 | 6.2 | 4.7 | ||||||||||||
All of our floating interest rate debt investments have base rate reset frequencies of less than twelve months with the majority resetting at least quarterly. The three-month LIBOR, the most prevalent index employed among our floating interest rate debt investments, ranged between 0.612% and 0.998%, and 0.251% and 0.613% during the years ended December 31, 2016 and 2015, respectively, and was 0.998% and 0.613% on December 31, 2016 and 2015, respectively. Base rate resets for floating interest rate investments will only result in interest income increases when the reset base interest rate exceeds the associated interest rate floor.
Our weighted average annual yield on debt investments was 9.7% as of December 31, 2016, compared to 9.5% as of December 31, 2015. The weighted average annual yield on debt investments is higher than what investors in our Company will realize because it does not reflect expenses of the Company or any sales load. Total investment return—net price and total investment return – net asset value were 8.5% and 9.4%, respectively, for the year ended December 31, 2016. See Note 13. “Financial Highlights” in Item 8. “Financial Statements and Supplementary Data”.
The following table shows the credit ratings of the investments in our Investment Portfolio and TRS Portfolio, based upon the rating scale of Standard & Poor’s Ratings Services, as of December 31, 2016 and 2015:
| Investment Portfolio as of December 31, (in thousands) | TRS Portfolio as of December 31, (in thousands) | |||||||||||||||||||||||||||||||
| 2016 | 2015 | 2016 | 2015 | |||||||||||||||||||||||||||||
| Standard & Poor’s rating |
Fair Value |
Percentage of Portfolio |
Fair Value |
Percentage of Portfolio |
Fair Value |
Percentage of Portfolio |
Fair Value |
Percentage of Portfolio |
||||||||||||||||||||||||
| BB |
$ | — | — | % | $ | — | — | % | $ | 10,360 | 4.0 | % | $ | 404 | 0.1 | % | ||||||||||||||||
| BB- |
41,193 | 1.0 | 43,253 | 1.2 | 17,764 | 6.9 | 24,999 | 8.1 | ||||||||||||||||||||||||
| B+ |
156,336 | 3.9 | 155,395 | 4.2 | 39,868 | 15.4 | 40,695 | 13.2 | ||||||||||||||||||||||||
| B |
191,565 | 4.8 | 265,440 | 7.1 | 103,907 | 40.2 | 147,430 | 47.9 | ||||||||||||||||||||||||
| B- |
145,753 | 3.6 | 316,944 | 8.5 | 54,433 | 21.1 | 55,993 | 18.2 | ||||||||||||||||||||||||
| CCC+ |
612,476 | 15.2 | 649,508 | 17.4 | 20,277 | 7.8 | 30,808 | 10.0 | ||||||||||||||||||||||||
| CCC |
203,931 | 5.1 | 102,191 | 2.7 | 11,022 | 4.3 | — | — | ||||||||||||||||||||||||
| CCC- |
17,549 | 0.4 | 48,501 | 1.3 | 668 | 0.3 | 4,391 | 1.4 | ||||||||||||||||||||||||
| CC |
4,217 | 0.1 | — | — | — | — | — | — | ||||||||||||||||||||||||
| D |
— | — | 9,640 | 0.3 | — | — | 3,493 | 1.1 | ||||||||||||||||||||||||
| Not rated |
2,652,267 | 65.9 | 2,131,389 | 57.3 | — | — | — | — | ||||||||||||||||||||||||
|
|
|
|
|
|
|
|
|
|
|
|
|
|
|
|
|
|||||||||||||||||
| Total |
$ | 4,025,287 | 100.0 | % | $ | 3,722,261 | 100.0 | % | $ | 258,299 | 100.0 | % | $ | 308,213 | 100.0 | % | ||||||||||||||||
|
|
|
|
|
|
|
|
|
|
|
|
|
|
|
|
|
|||||||||||||||||
42
Table of Contents
The table below presents a summary of our debt investment positions held in our Investment Portfolio that feature PIK interest provisions for some or all of the portfolio companies’ interest payment obligations.
| PIK Summary as of December 31, ($ in thousands) |
2016 | 2015 | ||||||
| Total number of all investments with PIK feature |
18 | 23 | ||||||
| Par value of all investments with PIK feature |
$ | 582,492 | $ | 707,559 | ||||
| Total number of all investments that have active PIK election |
15 | 19 | ||||||
| Par value of all investments that have active PIK election |
$ | 534,394 | $ | 648,196 | ||||
| Percent of debt investment portfolio with active PIK election, at par value |
14.0 | % | 17.5 | % | ||||
| Number of originated investments with PIK feature and active PIK election |
9 | 12 | ||||||
| Par value of originated investments with PIK feature and active PIK election |
$ | 409,045 | $ | 524,303 | ||||
| PIK Interest Income Activity for the Year Ended December 31, ($ in thousands) |
2016 | 2015 | 2014 | |||||||||
| PIK interest income |
$ | 19,490 | $ | 30,402 | $ | 35,041 | ||||||
| PIK interest income as a percentage of interest income and PIK interest income |
5.5 | % | 10.8 | % | 16.3 | % | ||||||
| PIK interest income as a percentage of total investment income |
5.0 | % | 9.8 | % | 15.2 | % | ||||||
| Collections of PIK interest (1) |
$ | 18,932 | $ | 853 | $ | 6,803 | ||||||
| (1) | Includes both principal payments and proceeds from sales of investments. |
As of December 31, 2016, our Investment Portfolio consisted of 129 portfolio companies, diversified across 21 industry classifications, as compared to our Investment Portfolio as of December 31, 2015 that consisted of 124 portfolio companies, diversified across 21 distinct industry classifications. As of December 31, 2016, the TRS Portfolio consisted of 43 portfolio companies, diversified across 16 distinct industry classifications, as compared to our TRS Portfolio as of December 31, 2015 that consisted of 48 portfolio companies, diversified across 16 distinct industry classifications. The following table presents a summary of our Investment Portfolio and TRS Portfolio arranged by industry classifications of the portfolio companies as of December 31, 2016 and 2015:
| Investment Portfolio as of (in thousands) | TRS Portfolio as of (in thousands) | |||||||||||||||||||||||||||||||
| December 31, 2016 | December 31, 2015 | December 31, 2016 | December 31, 2015 | |||||||||||||||||||||||||||||
| Industry Classification |
Fair Value |
Percentage of Portfolio |
Fair Value |
Percentage of Portfolio |
Fair Value |
Percentage of Portfolio |
Fair Value |
Percentage of Portfolio |
||||||||||||||||||||||||
| Capital Goods |
$ | 853,615 | 21.2 | % | $ | 621,721 | 16.7 | % | $ | 15,674 | 6.1 | % | $ | 31,229 | 10.1 | % | ||||||||||||||||
| Diversified Financials |
419,478 | 10.4 | 231,820 | 6.2 | — | — | — | — | ||||||||||||||||||||||||
| Software & Services |
350,413 | 8.7 | 416,659 | 11.2 | 59,848 | 23.2 | 68,767 | 22.3 | ||||||||||||||||||||||||
| Retailing |
318,624 | 7.9 | 309,014 | 8.3 | 33,698 | 13.0 | 29,078 | 9.4 | ||||||||||||||||||||||||
| Materials |
242,410 | 6.0 | 146,239 | 3.9 | 7,235 | 2.8 | 12,183 | 4.0 | ||||||||||||||||||||||||
| Automobiles & Components |
237,152 | 5.9 | 178,077 | 4.8 | — | — | — | — | ||||||||||||||||||||||||
| Real Estate |
216,371 | 5.4 | 82,720 | 2.2 | — | — | 12,366 | 4.0 | ||||||||||||||||||||||||
| Health Care Equipment & Services |
196,315 | 4.9 | 178,069 | 4.8 | 27,742 | 10.7 | 36,248 | 11.8 | ||||||||||||||||||||||||
| Technology Hardware & Equipment |
178,017 | 4.4 | 176,343 | 4.7 | 8,087 | 3.1 | 8,216 | 2.7 | ||||||||||||||||||||||||
| Consumer Durables & Apparel |
167,194 | 4.2 | 358,089 | 9.6 | 9,786 | 3.8 | 12,750 | 4.1 | ||||||||||||||||||||||||
| Energy |
161,950 | 4.0 | 164,056 | 4.4 | — | — | — | — | ||||||||||||||||||||||||
| Transportation |
161,398 | 4.0 | 174,014 | 4.7 | 23,641 | 9.2 | 11,459 | 3.7 | ||||||||||||||||||||||||
| Consumer Services |
119,313 | 3.0 | 89,389 | 2.4 | 19,716 | 7.6 | 3,897 | 1.3 | ||||||||||||||||||||||||
| Commercial & Professional Services |
82,657 | 2.1 | 155,039 | 4.2 | 14,228 | 5.5 | 16,043 | 5.2 | ||||||||||||||||||||||||
| Food, Beverage & Tobacco |
57,203 | 1.4 | 62,134 | 1.7 | 8,081 | 3.1 | 8,522 | 2.8 | ||||||||||||||||||||||||
| Pharmaceuticals, Biotechnology & Life Science |
56,892 | 1.4 | 53,634 | 1.4 | 1,027 | 0.4 | — | — | ||||||||||||||||||||||||
| Food & Staples Retailing |
51,970 | 1.3 | 101,854 | 2.7 | 9,838 | 3.8 | 12,078 | 3.9 | ||||||||||||||||||||||||
| Insurance |
45,554 | 1.1 | 48,763 | 1.3 | 6,121 | 2.4 | 12,398 | 4.0 | ||||||||||||||||||||||||
| Telecommunications Services |
36,781 | 0.9 | 80,681 | 2.2 | 1,027 | 0.4 | 8,280 | 2.7 | ||||||||||||||||||||||||
| Remaining Industries |
71,980 | 1.8 | 93,946 | 2.6 | 12,550 | 4.9 | 24,699 | 8.0 | ||||||||||||||||||||||||
|
|
|
|
|
|
|
|
|
|
|
|
|
|
|
|
|
|||||||||||||||||
| Total |
$ | 4,025,287 | 100.0 | % | $ | 3,722,261 | 100.0 | % | $ | 258,299 | 100.0 | % | $ | 308,213 | 100.0 | % | ||||||||||||||||
|
|
|
|
|
|
|
|
|
|
|
|
|
|
|
|
|
|||||||||||||||||
43
Table of Contents
Strategic Credit Opportunities Partners, LLC
In May 2016, Strategic Credit Opportunities Partners, LLC (“SCJV”), a joint venture between our company and Conway Capital, LLC (“Conway”), an affiliate of Guggenheim Life and Annuity Company and Delaware Life Insurance Company, was formed pursuant to the terms of a limited liability company agreement between our company and Conway. Pursuant to the terms of the agreement, we, along with Conway each have 50% voting control of SCJV and together are required to agree on all investment decisions as well as all other significant actions for SCJV. SCJV was formed to invest its capital in a range of investments, including senior secured loans (both first lien and second lien) to middle market companies, broadly syndicated loans, equity, warrants and other investments. We, along with Conway have agreed to provide capital to SCJV of up to $500 million in the aggregate. We will provide 87.5% and 12.5%, respectively, of the committed capital. As administrative agent of SCJV, we will perform certain day-to-day management responsibilities on behalf of SCJV.
In August 2016, we, along with Conway completed the initial funding of SCJV. As part of the initial funding, we sold investments with a fair value of $247.24 million to SCJV, in exchange for cash and a $92.40 million equity interest in SCJV. We recognized a net realized loss of $0.95 million in connection with the transaction. Conway completed its initial funding of SCJV with a cash contribution of $13.20 million. In December 2016, we sold investments with a fair value of $45.88 million to SCJV. We recognized a net realized gain of $1.03 million in connection with the transaction.
On August 15, 2016, CSCOP SE I LLC (“Borrower SPV”), a wholly-owned subsidiary of SCJV, entered into a credit agreement (the “Credit Agreement”), with Bank of America Merrill Lynch. The Credit Agreement provides for a revolving credit facility which provides for up to $165.00 million in total commitments to Borrower SPV (the “BAML Credit Facility”), and is secured by substantially all of the assets of Borrower SPV. The stated borrowing rate under the BAML Credit Facility may take the form of either base rate loans or Eurocurrency rate loans and may be converted to either or during the term of the loan by delivering a notice to the Credit Agreement administrative agent and State Street Bank and Trust Company, as collateral administrator, pursuant to the terms of the Credit Agreement. Base rate loans shall bear interest at a rate per annum equal to the sum of (a) the fluctuating rate per annum equal to the highest of (i) the federal funds rate plus 0.5% of 1%, (ii) the prime rate set by Bank of America for such day and (iii) the 1-month LIBOR plus (b) 1.85%. Eurocurrency rate loans shall bear interest at the rate per annum equal to the sum of (a) LIBOR (or a comparable or successor rate approved by the Credit Agreement administrative agent) plus (b) 1.85%. Borrower SPV shall also pay a commitment fee for undrawn commitment in the amount between 0.75% to 1.75%. The BAML Credit Facility matures on August 15, 2018. As of December 31, 2016, total outstanding borrowings under the BAML Credit Facility were $152.00 million.
As of December 31, 2016, SCJV had total investments with a fair value of $248.60 million. As of December 31, 2016, SCJV had no investments on non-accrual status.
Below is a summary of SCJV’s portfolio, followed by a listing of the individual loans in SCJV’s portfolio as of December 31, 2016:
| December 31, 2016 | ||||
| Total debt investments (1) |
$ | 250,320 | ||
| Weighted average current interest rate on debt investments (2) |
7.08 | % | ||
| Number of borrowers in SCJV |
36 | |||
| Largest loan to a single borrower (1) |
$ | 21,214 | ||
| (1) | At par amount. |
| (2) | Computed as the (a) annual stated interest rate on accruing debt, divided by (b) total debt at par amount. |
Strategic Credit Opportunities Partners, LLC Portfolio
As of December 31, 2016 (in thousands)
|
|
|
|
Interest Rate |
Base Rate Floor |
Maturity Date |
Principal Amount(b) |
Cost | Fair Value | ||||||||||||||||||||
| Senior Secured Loans - First Lien—130.9% |
| |||||||||||||||||||||||||||
| ABILITY Network, Inc. |
(e)(1) | Health Care Equipment & Services |
L + 500 | 1.00 | % | 5/14/2021 | $ | 8,812 | $ | 8,713 | $ | 8,856 | ||||||||||||||||
| Bay Club, Co. |
(1) | Consumer Services |
L + 650 | 1.00 | % | 8/31/2022 | 8,977 | 9,056 | 9,056 | |||||||||||||||||||
| Belk, Inc. |
(1) | Retailing |
L + 475 | 1.00 | % | 12/12/2022 | 4,198 | 3,718 | 3,635 | |||||||||||||||||||
| CityCenter Holdings, LLC |
(2) | Real Estate |
L + 325 | 1.00 | % | 10/16/2020 | 4,755 | 4,781 | 4,818 | |||||||||||||||||||
| Commercial Barge Line, Co. |
(1) | Transportation |
L + 875 | 1.00 | % | 11/12/2020 | 7,417 | 7,050 | 7,021 | |||||||||||||||||||
| David’s Bridal, Inc. |
(1) | Retailing |
L + 400 | 1.25 | % | 10/11/2019 | 6,792 | 6,367 | 6,025 | |||||||||||||||||||
44
Table of Contents
|
|
|
|
Interest Rate |
Base Rate Floor |
Maturity Date |
Principal Amount(b) |
Cost |
Fair Value | ||||||||||||||||||||
| Grocery Outlet, Inc. |
(1) | Food & Staples Retailing |
L + 400 | 1.00 | % | 10/21/2021 | 2,923 | 2,891 | 2,927 | |||||||||||||||||||
| Gymboree Corp. |
(e)(1) | Retailing |
L + 350 | 1.50 | % | 2/23/2018 | 4,385 | 3,376 | 2,344 | |||||||||||||||||||
| Harbor Freight Tools USA, Inc. |
(1) | Retailing |
L + 300 | 0.75 | % | 8/18/2023 | 2,677 | 2,688 | 2,719 | |||||||||||||||||||
| inVentive Health, Inc. |
(1) | Health Care Equipment & Services |
L + 375 | 1.00 | % | 11/9/2023 | 8,750 | 8,833 | 8,842 | |||||||||||||||||||
| Koosharem, LLC |
(b)(1) | Commercial & Professional Services |
L + 650 | 1.00 | % | 5/15/2020 | 21,214 | 18,858 | 19,225 | |||||||||||||||||||
| MedAssets, Inc. |
(3) | Health Care Equipment & Services |
L + 550 | 1.00 | % | 10/19/2022 | 7,073 | 7,136 | 7,179 | |||||||||||||||||||
| Neiman Marcus Group, LLC |
(3) | Retailing |
L + 325 | 1.00 | % | 10/25/2020 | 4,876 | 4,532 | 4,253 | |||||||||||||||||||
| Netsmart Technologies, Inc. |
(1) | Health Care Equipment & Services |
L + 450 | 1.00 | % | 4/19/2023 | 1,976 | 1,988 | 1,987 | |||||||||||||||||||
| RedPrairie Corp. |
(3) | Software & Services |
L + 350 | 1.00 | % | 10/12/2023 | 11,288 | 11,233 | 11,431 | |||||||||||||||||||
| Riverbed Technology, Inc. |
(3) | Technology Hardware & Equipment |
L + 325 | 1.00 | % | 4/25/2022 | 7,971 | 8,042 | 8,040 | |||||||||||||||||||
| Savers, Inc., Common Shares A |
(1) | Retailing |
L + 375 | 1.25 | % | 7/9/2019 | 9,948 | 8,835 | 9,258 | |||||||||||||||||||
| Standard Aero, Ltd. |
(1) | Capital Goods |
L + 425 | 1.00 | % | 7/7/2022 | 995 | 1,002 | 1,004 | |||||||||||||||||||
| TIBCO Software, Inc. |
(e)(3) | Software & Services |
L + 550 | 1.00 | % | 12/4/2020 | 19,232 | 18,698 | 19,347 | |||||||||||||||||||
| TruGreen, LP |
(3) | Consumer Services |
L + 550 | 1.00 | % | 4/13/2023 | 9,950 | 10,111 | 10,112 | |||||||||||||||||||
|
|
|
|
|
|||||||||||||||||||||||||
| Total Senior Secured Loans - First Lien |
|
$ | 147,908 | $ | 148,079 | |||||||||||||||||||||||
|
|
|
|
|
|||||||||||||||||||||||||
| Senior Secured Loans - Second Lien—11.2% |
| |||||||||||||||||||||||||||
| Applied Systems, Inc. |
(e)(1) | Software & Services |
L + 650 | 1.00 | % | 1/24/2022 | $ | 7,461 | $ | 7,499 | $ | 7,556 | ||||||||||||||||
| Misys, Ltd. (GBR) |
(c)(e) |
Software & Services |
12.00 | % | 6/12/2019 | 4,866 | 5,064 | 5,177 | ||||||||||||||||||||
|
|
|
|
|
|||||||||||||||||||||||||
| Total Senior Secured Loans - Second Lien |
|
$ | 12,563 | $ | 12,733 | |||||||||||||||||||||||
|
|
|
|
|
|||||||||||||||||||||||||
| Senior Secured Bonds—20.7% |
| |||||||||||||||||||||||||||
| Artesyn Technologies, Inc. |
(d)(e) |
Technology Hardware & Equipment |
9.75 | % | 10/15/2020 | $ | 8,900 | $ | 7,572 | $ | 8,143 | |||||||||||||||||
| Calumet Specialty Products Partners, LP |
(d)(e) |
Energy |
11.50 | % | 1/15/2021 | 6,579 | 7,433 | 7,517 | ||||||||||||||||||||
| Guitar Center, Inc. |
(d)(e) |
Retailing |
6.50 | % | 4/15/2019 | 8,523 | 7,626 | 7,735 | ||||||||||||||||||||
|
|
|
|
|
|||||||||||||||||||||||||
| Total Senior Secured Bonds |
|
$ | 22,631 | $ | 23,395 | |||||||||||||||||||||||
|
|
|
|
|
|||||||||||||||||||||||||
| Total Senior Debt |
|
$ | 183,102 | $ | 184,207 | |||||||||||||||||||||||
|
|
|
|
|
|||||||||||||||||||||||||
| Subordinated Debt—56.9% |
| |||||||||||||||||||||||||||
| Builders FirstSource, Inc. |
(d)(e) |
Capital Goods |
10.75 | % | 8/15/2023 | $ | 6,564 | $ | 7,460 | $ | 7,533 | |||||||||||||||||
| Cequel Communications Holdings, LLC |
(d) |
Media |
5.13 | % | 12/15/2021 | 7,426 | 7,496 | 7,556 | ||||||||||||||||||||
| ClubCorp Club Operations, Inc. |
(d)(e) |
Consumer Services |
8.25 | % | 12/15/2023 | 2,773 | 2,900 | 2,939 | ||||||||||||||||||||
| GCI, Inc. |
(e) | Telecommunication Services |
6.88 | % | 4/15/2025 | 7,211 | 7,490 | 7,319 | ||||||||||||||||||||
| GCP Applied Technologies, Inc. |
(d)(e) |
Materials |
9.50 | % | 2/1/2023 | 4,796 | 5,458 | 5,503 | ||||||||||||||||||||
| Hillman Group, Inc. |
(d)(e) |
Consumer Durables & Apparel |
6.38 | % | 7/15/2022 | 2,238 | 2,057 | 2,104 | ||||||||||||||||||||
| Jo-Ann Stores, Inc. |
(d)(e) |
Retailing |
8.13 | % | 3/15/2019 | 829 | 815 | 825 | ||||||||||||||||||||
| Kenan Advantage Group, Inc. |
(d)(e) |
Transportation |
7.88 | % | 7/31/2023 | 7,692 | 7,507 | 7,769 | ||||||||||||||||||||
| Manitowoc Foodservice, Inc. |
Capital Goods |
9.50 | % | 2/15/2024 | 6,622 | 7,465 | 7,632 | |||||||||||||||||||||
| Platform Specialty Products Corp. |
(d)(e) |
Materials |
10.38 | % | 5/1/2021 | 6,813 | 7,123 | 7,545 | ||||||||||||||||||||
45
Table of Contents
|
|
|
|
Interest Rate |
Base Rate Floor |
Maturity Date |
Principal Amount(b) |
Cost |
Fair Value | ||||||||||||||||||
| Solera Holdings, Inc. |
(d)(e) |
Software & Services |
10.50 | % | 3/1/2024 | 6,818 | 7,474 | 7,670 | ||||||||||||||||||
|
|
|
|
|
|||||||||||||||||||||||
| Total Subordinated Debt |
|
$ | 63,245 | $ | 64,395 | |||||||||||||||||||||
|
|
|
|
|
|||||||||||||||||||||||
| TOTAL INVESTMENTS — 219.7% |
|
$ | 246,347 | $ | 248,602 | |||||||||||||||||||||
|
|
|
|
|
|||||||||||||||||||||||
| (a) | Security may be an obligation of one or more entities affiliated with the named company. |
| (b) | Denominated in U.S. dollars unless otherwise noted. |
| (c) | A portfolio company domiciled in a foreign country. The jurisdiction of the security issuer may be a different country than the domicile of the portfolio company. |
| (d) | This security was acquired in a transaction that was exempt from the registration requirements of the Securities Act of 1933 pursuant to Rule 144A thereunder. This security may be resold only in transactions that are exempt from the registration requirements of the Securities Act, normally to qualified institutional buyers. |
| (e) | This investment is held by both the Company and SCJV as of December 31, 2016. |
| (1) | The interest rate on these investments is subject to a base rate of 3-Month LIBOR, which at December 31, 2016 was 1.00%. The current base rate for each investment may be different from the reference rate on December 31, 2016. |
| (2) | The interest rate on these investments is subject to a base rate of 2-Month LIBOR, which at December 31, 2016 was 0.82%. The current base rate for each investment may be different from the reference rate on December 31, 2016. |
| (3) | The interest rate on these investments is subject to a base rate of 1-Month LIBOR, which at December 31, 2016 was 0.77%. The current base rate for each investment may be different from the reference rate on December 31, 2016. |
Abbreviations:
GBR - United Kingdom
L = LIBOR - London Interbank Offered Rate, typically 3-Month
Below is selected balance sheet information for SCJV as of December 31, 2016 (in thousands):
| December 31, 2016 | ||||
| Selected Balance Sheet Information |
||||
| Total investments, at fair value |
$ | 248,602 | ||
| Cash and other assets |
16,876 | |||
|
|
|
|||
| Total assets |
$ | 265,478 | ||
|
|
|
|||
| Debt |
$ | 152,000 | ||
| Other liabilities |
338 | |||
|
|
|
|||
| Total liabilities |
$ | 152,338 | ||
|
|
|
|||
| Member’s equity |
$ | 113,140 | ||
|
|
|
|||
Below is selected statement of operations information for SCJV for the period from August 15, 2016 (Inception) through December 31, 2016 (in thousands):
| Period from August 15, 2016 (Inception) through December 31, 2016 |
||||
| Selected Statement of Operations Information |
||||
| Total investment income |
$ | 6,910 | ||
| Expenses |
||||
| Interest expense |
1,553 | |||
| Professional services |
94 | |||
| Custodian and accounting fees |
79 | |||
| Administrative services |
21 | |||
| Director fees and expenses |
3 | |||
| Other |
1 | |||
|
|
|
|||
| Total expenses |
1,751 | |||
|
|
|
|||
| Net investment income |
5,159 | |||
| Net realized and unrealized gains |
2,381 | |||
|
|
|
|||
| Net increase in net assets resulting from operations |
$ | 7,540 | ||
|
|
|
|||
46
Table of Contents
Capital Resources and Liquidity
Sources and Uses of Capital
In October 2016, we closed our Follow-On Offering to new investors. Throughout the course of the Offerings, we sold 321.96 million shares of common stock for gross proceeds of $3.44 billion, including the reinvestment of distributions. We will continue to issue shares of common stock pursuant to our distribution reinvestment plan.
Our capital resources and liquidity are derived primarily from (i) cash flows from operations, including investment sales and repayments, (ii) our distribution reinvestment plan, (iii) borrowings and (iv) through October 2016, net proceeds from our Offerings. Our primary uses of funds include (i) investments in portfolio companies, (ii) distributions to our shareholders, (iii) repurchases under our share repurchase program, (iv) advisory fees, (v) payment of principal and interest on our borrowings, and (vi) operating expenses. We have used, and expect to continue to use, proceeds from the turnover of our Investment Portfolio and borrowings under our credit facilities to finance our investment activities primarily focused on directly originated investments in portfolio companies. In addition, in January 2015, we filed our Shelf Registration Statement with the SEC that was declared effective on January 16, 2015, under which we may offer, from time to time, up to $750 million of our debt and/or equity securities, on terms to be determined at the time of each such offering.
Liquidity
During the year ended December 31, 2016, proceeds from sales of investments and principal payments totaled $1.38 billion. In addition, distributions reinvested in the company as a percentage of total distributions for the year ended December 31, 2016 was 51%, or $124.14 million. As of December 31, 2016, we had the following sources of immediate liquidity available to us:
| (in thousands) |
Amount | |||
| Cash and Foreign Currency |
$ | 132,260 | ||
| Short Term Investments |
6 | |||
| Credit Facilities-Effective Borrowing Capacity (1) |
217,857 | |||
| Less: Payable for Investments Purchased |
(22,205 | ) | ||
|
|
|
|||
| Total |
$ | 327,918 | ||
|
|
|
|||
| (1) | Effective borrowing capacity represents additional amounts that we could borrow from our credit facilities based on collateral in place as of December 31, 2016. |
Borrowings
Our outstanding borrowings as of December 31, 2016 and 2015 were as follows:
| As of December 31, 2016 | As of December 31, 2015 | |||||||||||||||||||||||
| (in thousands) |
Total Aggregate Principal Amount Committed |
Principal Amount Outstanding |
Carrying Value |
Total Aggregate Principal Amount Committed |
Principal Amount Outstanding |
Carrying Value |
||||||||||||||||||
| Senior Secured Revolving Credit Facility (1)(2) |
$ | 928,000 | $ | 799,000 | $ | 799,000 | $ | 700,000 | $ | 632,980 | (3) | $ | 632,980 | |||||||||||
| Deutsche Bank Credit Facility (1) |
— | — | — | 250,000 | 210,000 | 210,000 | ||||||||||||||||||
| BNP Credit Facility (1) |
200,000 | 183,000 | 183,000 | 200,000 | 188,000 | 188,000 | ||||||||||||||||||
| SMBC Credit Facility (1) |
200,000 | 102,000 | 102,000 | 200,000 | — | — | ||||||||||||||||||
| JPM Credit Facility |
300,000 | 135,000 | 135,000 | — | — | — | ||||||||||||||||||
|
|
|
|
|
|
|
|
|
|
|
|
|
|||||||||||||
| Total credit facilities |
1,628,000 | 1,219,000 | 1,219,000 | 1,350,000 | 1,030,980 | 1,030,980 | ||||||||||||||||||
| 2014 Senior Secured Term Loan |
389,000 | 389,000 | 385,203 | (4) | 393,000 | 393,000 | 387,677 | (4) | ||||||||||||||||
| CS Facility (5) |
23,454 | 23,454 | 23,454 | — | — | — | ||||||||||||||||||
|
|
|
|
|
|
|
|
|
|
|
|
|
|||||||||||||
| Total |
$ | 2,040,454 | $ | 1,631,454 | $ | 1,627,657 | $ | 1,743,000 | $ | 1,423,980 | $ | 1,418,657 | ||||||||||||
|
|
|
|
|
|
|
|
|
|
|
|
|
|||||||||||||
| (1) | Subject to borrowing base and leverage restrictions. On December 28, 2016, the Deutsche Bank Credit Facility was terminated. |
| (2) | Senior Secured Revolving Credit Facility includes a provision that allows us, under certain circumstances, to increase the size of the Senior Secured Revolving Credit Facility to a maximum of $1.34 billion. |
| (3) | Includes $49.70 million denominated in Euros and $58.28 million denominated in British Pound Sterling as of December 31, 2015. |
| (4) | Comprised of outstanding principal less unaccreted original issue discount of $0.99 million and $1.39 million and deferred financing costs of $2.81 million and $3.93 million as of December 31, 2016 and 2015, respectively. |
| (5) | Borrowings denominated in Euros. |
47
Table of Contents
For the years ended December 31, 2016 and 2015, our total all-in cost of financing, including fees and expenses, was 3.49% and 3.59%, respectively. We expect to continue to draw on the revolving credit facilities to finance our acquisition of investment positions in portfolio companies. We intend to further increase our aggregate borrowing capacity in the future beyond the current combined commitment amount of $2.04 billion that is available to us from our existing financing arrangements.
See Note 10. “Borrowings” in Item 8. “Financial Statements and Supplementary Data” for additional disclosures regarding our borrowings.
Total Return Swaps
In 2012, Halifax Funding LLC (“Halifax Funding”), our wholly owned, special purpose financing subsidiary, entered into a TRS arrangement with The Bank of Nova Scotia (“BNS”).
The obligations of Halifax Funding under the TRS Agreements are non-recourse to us and our exposure under the TRS Agreements is limited to the amount of collateral that is posted by Halifax Funding pursuant to the terms of the TRS Agreements. As of December 31, 2016, the posted collateral of $95 million equaled 36.7% of the total notional amount, as compared to $142.64 million, or 43.9% of the total notional amount as of December 31, 2015. The minimum required collateral amount (33.3% of the total notional amount, plus additional required collateral due to concentration limits in the TRS Portfolio) was $85.42 million as of December 31, 2016.
Halifax Funding may terminate the TRS Agreements at any time upon providing at least 30 days’ notice prior to the proposed settlement date of the TRS assets related to such termination. In the absence of early termination, the TRS Agreements will terminate on January 15, 2019. In the event of early termination of the TRS Agreements, Halifax Funding may be required to pay a make-whole fee based on a minimum spread amount to be earned by BNS over the life of the amended TRS Agreements.
See Note 4. “Derivative Instruments” in Item 8. “Financial Statements and Supplementary Data” for additional disclosures on the TRS.
Commitments and Contingencies
See Note 11. “Commitments and Contingencies” in Item 8. “Financial Statements and Supplementary Data” for information on our commitments and contingencies as of December 31, 2016.
Distributions to Shareholders
We pay monthly distributions to our shareholders in the form of cash. Shareholders may elect to reinvest their distributions as additional shares of our common stock under our distribution reinvestment plan. Dividends are taxable to our shareholders even if they are reinvested in additional shares of our common stock. The following table reflects the cash distributions per share and the total amount of distributions that we have declared on our common stock during the years ended December 31, 2016 and 2015:
| (in thousands, except per share amounts) |
Per Share | Amount | ||||||
| December 31, 2016 |
$ | 0.80 | $ | 244,950 | ||||
| December 31, 2015 |
$ | 0.80 | $ | 205,044 | ||||
| December 31, 2014 |
$ | 0.80 | $ | 142,018 | ||||
Approximately 51% of the distributions we declared in each of the years ended December 31, 2016, 2015 and 2014 were reinvested in shares of our common stock by participants in our distribution reinvestment plan and the reinvested distributions represent an additional source of capital to us. Net investment income and realized capital gains represent the primary sources for us to pay distributions. See Note 8. “Distributions” in Item 8. “Financial Statements and Supplementary Data” for additional disclosures on distributions.
On October 7, 2016, our board of directors approved an amendment and restatement of our distribution reinvestment plan. Under the amended distribution reinvestment plan, cash distributions paid to participating stockholders will be reinvested in additional shares at a purchase price determined by our board of directors, or a committee thereof, in its sole discretion, that is (i) not less than the net asset value per share determined in good faith by our board of directors or a committee thereof, in its sole discretion, immediately prior to the payment of the distribution and (ii) not more than 2.5% greater than the net asset value per share as of such date. The amended distribution reinvestment plan will be effective as of, and will first apply to the reinvestment of cash distributions paid on or after, November 1, 2016.
We had sufficient taxable income to support 100% of our declared distributions for the year ended December 31, 2016. We do not expect to use borrowed funds to pay distributions to shareholders. We routinely disclose the sources of funds used to pay distributions to our shareholders in periodic reports that accompany (i) quarterly account statements and (ii) monthly distribution checks that are prepared and sent directly by our transfer agent to our shareholders. See Note 8. “Distributions” in Item 8. “Financial Statements and Supplementary Data” for a discussion of the sources of funds used to pay distributions on a GAAP basis for the periods presented.
48
Table of Contents
Results of Operations
As of December 31, 2016, the fair value of our investments totaled $4.03 billion for our Investment Portfolio and $258.30 million for our TRS Portfolio. The majority of our investments at December 31, 2016 consisted of debt investments. See the section entitled “Portfolio and Investment Activity” above for a discussion of the general terms and characteristics of our investments, and for information regarding investment activities during the years ended December 31, 2016 and 2015. The growth of our Investment Portfolio was the primary contributing factor to the significant increases in investment income, operating expenses, investment advisory fees, net investment income and net assets between the comparative periods, as discussed below.
The following is a summary of our operating results for the years ended December 31, 2016 and 2015:
| Year Ended December 31, | ||||||||||||
| (in thousands) |
2016 | 2015 | 2014 | |||||||||
| Total investment income |
$ | 386,468 | $ | 311,097 | $ | 230,712 | ||||||
| Net operating expenses |
(173,061 | ) | (131,443 | ) | (99,194 | ) | ||||||
| Income tax expense, including excise tax |
(3,311 | ) | (2,966 | ) | (1,392 | ) | ||||||
|
|
|
|
|
|
|
|||||||
| Net investment income |
210,096 | 176,688 | 130,126 | |||||||||
| Net realized gains (losses) |
(2,645 | ) | 50,657 | 18,997 | ||||||||
| Net change in unrealized appreciation (depreciation) |
35,664 | (265,552 | ) | (64,806 | ) | |||||||
|
|
|
|
|
|
|
|||||||
| Net increase (decrease) in net assets resulting from operations |
$ | 243,115 | $ | (38,207 | ) | $ | 84,317 | |||||
|
|
|
|
|
|
|
|||||||
Investment income
Investment income consisted of the following for the years ended December 31, 2016 and 2015:
| Year Ended December 31, | ||||||||||||
| (in thousands) |
2016 | 2015 | 2014 | |||||||||
| Interest income |
$ | 337,850 | $ | 250,599 | $ | 179,972 | ||||||
| Payment-in-kind interest income |
19,490 | 30,402 | 35,041 | |||||||||
|
|
|
|
|
|
|
|||||||
| Subtotal |
357,340 | 281,001 | 215,013 | |||||||||
| Fee income |
13,582 | 18,305 | 7,030 | |||||||||
| Dividend and other income |
15,546 | 11,791 | 8,669 | |||||||||
|
|
|
|
|
|
|
|||||||
| Total investment income |
$ | 386,468 | $ | 311,097 | $ | 230,712 | ||||||
|
|
|
|
|
|
|
|||||||
The increase in interest income was due primarily to the growth of our portfolio of debt investments. Our average debt investment balance was $3.76 billion, $3.20 billion and $2.29 billion for the years ended December 31, 2016, 2015 and 2014, respectively, based on par value. Variations in interest income are also partly due to nonrecurring recognition of prepayment penalties and unamortized loan fees, discounts and premiums upon the prepayment of debt investments. We recorded interest income from these sources in the combined amount of $16.93 million, $6.37 million and $12.37 million for the years ended December 31, 2016, 2015 and 2014, respectively. For the year ended December 31, 2016, 5.5% of our total interest income including PIK interest income was attributable to PIK interest income as compared to 10.8% and 16.3% for the same periods in 2015 and 2014, respectively. The decrease in PIK interest income during the year ended December 31, 2016 is primarily due to investments that were sold or repaid during the period ($7.29 million) and investments that were placed on non-accrual status during the period ($5.90 million). We also recorded a partial write-down of PIK interest income in the amount of $2.66 million for one investment with a valuation that indicated the PIK interest income may not be fully collectible. These reductions in PIK interest income were partially offset by increases due to new PIK investments added to the portfolio as well as increases caused by the compounding nature of PIK. As of December 31, 2016, our weighted average annual yield on our accruing debt investments was 9.7% based on amortized cost, as defined above in “Portfolio and Investment Activity.” As of December 31, 2016, approximately 77.8% of our debt investments had floating rate interest; therefore, changes in interest rates could have a material impact on our interest income in the future. See Item 7A. “Quantitative and Qualitative Disclosures About Market Risk” for further information on the impact interest rate changes could have on our results of operations.
Interest income earned on TRS assets is not included in investment income in the consolidated statements of operations, but rather is recorded as part of (i) realized gains or losses on derivative instruments in connection with quarterly TRS settlement payments and (ii) unrealized appreciation (depreciation) on derivatives for amounts not yet received from the counterparty as of period end.
Our fee income consists of transaction-based fees and is nonrecurring. Fee income was higher during the year ended December 31, 2015 as compared to the same period in 2016 due primarily to an amendment fee received in the amount of $7.76 million earned during the first quarter of 2015 from one of our portfolio companies seeking financial covenant relief. The decrease in amendment fees earned during the year ended December 31, 2016 was partially offset by an increase in capital structuring fees earned related to our Co-Investment Transactions. Going forward, we expect to earn additional structuring services fees on Co-Investment Transactions as a result of our persistent focus on direct lending activities. See Note 7. “Fee Income” in Item 8. “Financial Statements and Supplementary Data” for additional information on fee income.
49
Table of Contents
The increase in dividend and other income for the years ended December 31, 2016 and 2015 was primarily due to an increase in the number of income-producing equity investments in our Investment Portfolio which were largely originated by us after receiving our SEC Exemptive Order in May 2013.
Operating expenses
Our operating expenses for the years ended December 31, 2016, 2015 and 2014 were as follows:
| Year Ended December 31, | ||||||||||||
| (in thousands) |
2016 | 2015 | 2014 | |||||||||
| Investment advisory fees |
$ | 82,736 | $ | 70,298 | $ | 48,903 | ||||||
| Interest expense |
51,519 | 36,311 | 25,518 | |||||||||
| Performance-based incentive fees |
24,123 | 8,733 | 8,229 | |||||||||
| Offering expense |
2,285 | 4,481 | 6,833 | |||||||||
| Administrative services |
3,446 | 2,728 | 2,997 | |||||||||
| Professional services |
2,876 | 2,913 | 2,016 | |||||||||
| Custodian and accounting fees |
1,569 | 1,309 | 883 | |||||||||
| Director fees and expenses |
495 | 569 | 560 | |||||||||
| Other |
4,012 | 4,101 | 3,255 | |||||||||
|
|
|
|
|
|
|
|||||||
| Total operating expenses |
$ | 173,061 | $ | 131,443 | $ | 99,194 | ||||||
|
|
|
|
|
|
|
|||||||
Investment advisory fees and performance-based incentive fees - Our investment advisory fees are calculated at an annual rate of 2% of our average gross assets; therefore, the increase in these fees year over year was primarily attributable to the net increase in our gross assets.
Our Advisors are also eligible to receive incentive fees based on our performance. Our performance-based incentive fees, which are comprised of two parts, consisted of the following for the years ended December 31, 2016, 2015 and 2014:
| Year Ended December 31, | ||||||||||||
| (in thousands) |
2016 | 2015 | 2014 | |||||||||
| Subordinated incentive fee on income |
$ | 24,123 | $ | 8,733 | $ | 17,034 | ||||||
| Incentive fee on capital gains |
— | — | (8,805 | ) | ||||||||
|
|
|
|
|
|
|
|||||||
| Total performance-based incentive fees |
$ | 24,123 | $ | 8,733 | $ | 8,229 | ||||||
|
|
|
|
|
|
|
|||||||
A subordinated incentive fee on income is payable to our Advisors each calendar quarter if our pre-incentive fee net investment fee income (as defined in the Investment Advisory Agreement and approved by our board of directors) exceeds the 1.75% quarterly preference return to our shareholders (the ratio of pre-incentive fee net investment income divided by average adjusted capital).
The annual incentive fees on capital gains recorded for GAAP purposes is equal to (i) 20% of our realized and unrealized capital gains on a cumulative basis since inception, net of all realized capital losses and unrealized depreciation on a cumulative basis from inception, less (ii) the aggregate amount of any previously paid incentive fees on capital gains. As discussed in Note 6. “Related Party Transactions” in Item 8. “Financial Statements and Supplementary Data,” the calculation of performance-based incentive fees disregards any net realized and unrealized gains associated with the TRS interest spread. In addition, for financial reporting purposes, in accordance with GAAP, we include unrealized appreciation on our Investment Portfolio and derivative instruments in the calculation of incentive fees on capital gains; however, such amounts are not payable by us unless and until the net unrealized appreciation is actually realized. The actual amount of incentive fees on capital gains that are due and payable to the Advisors is determined at the end of the calendar year.
We did not record any incentive fee on capital gains for the years ended December 31, 2016 and 2015. During the year ended December 31, 2014, we recorded a reversal of previously accrued incentive fees on capital gains of $8.80 million. As of December 31, 2016, we had unrealized losses of $336.60 million in excess of our cumulative realized net capital gains since inception. The Advisors earned incentive fees on capital gains of $2.32 million during the year ended December 31, 2013, at which time we had cumulative net realized capital gains of $11.61 million in excess of our unrealized losses. Due to the cumulative nature of the incentive fee on capital gains, we will not owe the Advisors any incentive fees on capital gains for future years until such time, if any, that our cumulative realized net capital gains since inception exceed our unrealized losses as of a particular measurement date by more than $11.61 million.
See “— Contractual Obligations — Investment Advisory Agreements,” below for further details about the performance-based incentive fees.
50
Table of Contents
Interest expense - The components of interest expense for the years ended December 31, 2016, 2015 and 2014 were as follows:
| Year Ended December 31, | ||||||||||||
| (in thousands) |
2016 | 2015 | 2014 | |||||||||
| Stated interest expense |
$ | 45,126 | $ | 30,522 | $ | 17,270 | ||||||
| Unused commitment fees |
1,845 | 2,172 | 5,086 | |||||||||
| Amortization of deferred financing costs |
4,150 | 3,233 | 2,934 | |||||||||
| Accretion of discount on term loan |
398 | 384 | 228 | |||||||||
|
|
|
|
|
|
|
|||||||
| Total interest expense |
$ | 51,519 | $ | 36,311 | $ | 25,518 | ||||||
|
|
|
|
|
|
|
|||||||
The increase in interest expense during the year ended December 31, 2016 was primarily attributable to the increase in our weighted average debt outstanding to $1.48 billion, as compared to $1.01 billion for the same period in 2015. This increase is partially offset by a decrease in our all-in cost of financing, including fees and expenses, to 3.49%, as compared to 3.59% for the same period in 2015. The increase in interest expense during the year ended December 31, 2015 was primarily attributable to the increase in our weighted average debt outstanding to $1.01 billion, as compared to $572.48 million for the same period in 2014. This increase is partially offset by a decrease in our all-in cost of financing, including fees and expenses, to 3.59%, as compared to 4.45% for the same period in 2014. Our all-in cost of financing was higher during the year ended December 31, 2014 because our 2014 Senior Secured Term Loan comprised a higher proportion of our total borrowings during the period, as compared to other periods. Our all-in cost of financing will fluctuate between periods depending on the relative use of the 2014 Senior Secured Term Loan as compared to our other credit facilities, which bear lower stated interest rates.
Our performance-based incentive fees and interest expense, among other things, may increase or decrease our overall operating expenses and expense ratios relative to comparative periods depending on portfolio performance, an increase or reduction in borrowed funds and borrowing commitments, and changes in benchmark interest rates, such as LIBOR, among other factors.
All other operating expenses – In general, our other operating expenses increased period over period due to increased administrative and professional services associated with our owning a larger portfolio of investments. Our offering expenses are capitalized as deferred offering expenses and then subsequently expensed over a 12-month period. During the years ended December 31, 2016, 2015 and 2014, we recorded deferred offering expenses of $1.08 million, $3.48 million and $6.05 million, respectively. The $0.40 million of deferred offering expenses recorded in the consolidated statements of assets and liabilities as of December 31, 2016 represents the amount that will be recorded as offering expenses in the consolidated statements of operations over the next 12 months.
During the years ended December 31, 2016, 2015 and 2014, the ratio of core operating expenses (excluding investment advisory fees, performance-based incentive fees, interest expense and offering expenses) to average net assets was 0.46%, 0.48% and 0.54%, respectively.
Income tax expense, including excise tax
We have elected to be treated as a RIC under the Code and operate in a manner so as to qualify for the tax treatment applicable to RICs. To qualify as a RIC, we must, among other things, timely distribute to our shareholders generally at least 90% of our investment company taxable income, as defined by the Code, for each year. In order to maintain our RIC status, we, among other things, have made and intend to continue to make the requisite distributions to our shareholders which will generally relieve us from U.S. federal corporate-level income taxes.
Depending on the level of taxable income earned in a tax year, we may choose to carry forward taxable income in excess of current calendar year dividend distributions into the next tax year and pay a 4% excise tax on the amount of current year taxable income in excess of distributions, as required. As a result of our estimated taxable income exceeding distributions paid to our shareholders, we recorded net excise tax expense of $3.31 million, $2.89 million and $1.39 million for the years ended December 31, 2016, 2015 and 2014, respectively.
Certain of our consolidated subsidiaries are subject to U.S. federal and state income taxes and foreign income taxes. For the years ended December 31, 2016 and 2015, we recorded a net tax expense of approximately $1.26 million and $0.56 million, respectively, for these subsidiaries, of which $1.26 million and $0.48 million, respectively, represents foreign tax withholding and is recorded net against the related interest income in the consolidated statements of operations. We did not record any net U.S. federal and state income tax expense or foreign income tax expense during the year ended December 31, 2014.
51
Table of Contents
Net realized gain and losses – Net realized gains and losses for the years ended December 31, 2016, 2015 and 2014 were as follows:
| Year Ended December 31, | ||||||||||||
| (in thousands) |
2016 | 2015 | 2014 | |||||||||
| Net realized (losses) gains on investments |
$ | (27,548 | ) | $ | (29,310 | ) | $ | 17,594 | ||||
| Net realized gains on derivative instruments |
24,306 | 83,550 | 7,354 | |||||||||
| Net realized gains (losses) on foreign currency transactions |
597 | (3,583 | ) | (5,951 | ) | |||||||
|
|
|
|
|
|
|
|||||||
| Net realized gains |
$ | (2,645 | ) | $ | 50,657 | $ | 18,997 | |||||
|
|
|
|
|
|
|
|||||||
The net realized loss on investments for the year ended December 31, 2016 consisted of a net gain on the disposition of investments of $5.86 million and a net currency loss of $33.41 million on those investments that were denominated in foreign currencies. The net realized loss on investments for the year ended December 31, 2015 was partially due to a restructuring of one of the portfolio companies in whose debt securities we have invested, Towergate Finance PLC, resulting in a realized loss of $23.0 million.
Our net realized gains (losses) on derivative instruments for the years ended December 31, 2016, 2015 and 2014 consisted of the following:
| Year Ended December 31, | ||||||||||||
| (in thousands) |
2016 | 2015 | 2014 | |||||||||
| Net realized gains (losses) on: |
||||||||||||
| Cross currency swaps |
$ | 8,328 | $ | 541 | $ | — | ||||||
| Foreign currency forward contracts |
7,344 | 70,096 | 2,867 | |||||||||
| Interest rate swaps |
(3,851 | ) | — | — | ||||||||
| TRS |
12,485 | 12,913 | 4,487 | |||||||||
|
|
|
|
|
|
|
|||||||
| Net realized gains on derivative instruments |
$ | 24,306 | $ | 83,550 | $ | 7,354 | ||||||
|
|
|
|
|
|
|
|||||||
See Note 4. “Derivative Instruments” in Item 8. “Financial Statements and Supplementary Data” for more information about the components of the realized gain on TRS recorded during each period.
As described in Note 4. “Derivative Instruments” in Item 8. “Financial Statements and Supplementary Data,” we utilize foreign currency forward contracts and cross currency swaps to economically hedge the impact that changes in foreign exchange rates have on the value of our investments denominated in foreign currencies. We record realized gains on these derivative instruments upon periodic settlement dates and upon maturity or termination. In August 2015, we terminated all of our outstanding foreign currency forward contracts and entered into new foreign currency forward contracts and cross currency swaps. Although both types of instruments serve as an economic hedge against changes in foreign exchange rates, the unrealized gains and losses may have differing tax treatments. By hedging our foreign investments with a combination of foreign currency forward contracts and cross currency swaps, we expect to reduce potential volatility in our taxable income while maintaining some flexibility to increase or decrease the overall notional balance of our hedges when deemed necessary. The cross currency swaps generate realized gains or losses upon each quarterly settlement payment. During the year ended December 31, 2016, the scheduled amortization of our cross currency swaps resulted in a net exchange of currencies with our counterparty that generated a realized gain of $6.77 million. The realized gains on foreign currency forward contracts and cross currency swaps help offset realized and unrealized losses in investments denominated in foreign currencies as a result of foreign currency movements, as described further below.
Net change in unrealized appreciation or depreciation
For the years ended December 31, 2016, 2015 and 2014, net unrealized appreciation and depreciation consisted of the following:
| Year Ended December 31, | ||||||||||||
| (in thousands) |
2016 | 2015 | 2014 | |||||||||
| Net change in unrealized appreciation (depreciation) on: |
||||||||||||
| Investments |
$ | (1,860 | ) | $ | (232,449 | ) | $ | (104,589 | ) | |||
| Derivative instruments |
40,141 | (34,881 | ) | 38,320 | ||||||||
| Foreign currency translation |
(551 | ) | 1,778 | 1,463 | ||||||||
| Provision for taxes |
(2,066 | ) | — | — | ||||||||
|
|
|
|
|
|
|
|||||||
| Net change in unrealized appreciation (depreciation) |
$ | 35,664 | $ | (265,552 | ) | $ | (64,806 | ) | ||||
|
|
|
|
|
|
|
|||||||
52
Table of Contents
The net change in unrealized appreciation (depreciation) on investments consisted of the following:
| Year Ended December 31, | ||||||||||||
| (in thousands) |
2016 | 2015 | 2014 | |||||||||
| Net change in unrealized appreciation (depreciation) on investments: |
||||||||||||
| Unrealized appreciation |
$ | 133,870 | $ | 29,519 | $ | 33,991 | ||||||
| Unrealized depreciation |
(206,953 | ) | (281,185 | ) | (123,771 | ) | ||||||
| Net unrealized (appreciation) depreciation reversal related to net realized gains or losses (1) |
71,223 | 19,217 | (14,809 | ) | ||||||||
|
|
|
|
|
|
|
|||||||
| Total net change in unrealized appreciation (depreciation) |
$ | (1,860 | ) | $ | (232,449 | ) | $ | (104,589 | ) | |||
|
|
|
|
|
|
|
|||||||
| (1) | Represents the unrealized appreciation or depreciation recorded on the related asset at the end of prior period. |
Approximately 11.3% of our Investment Portfolio, measured at fair value, is denominated in foreign currencies. Those investments expose our portfolio to the risk that the value of the investments will be affected by changes in exchange rates between the currency in which the investments are denominated and the currency in which the investments are made. Our practice is to minimize these risks in certain cases by employing hedging techniques, including using foreign currency options and foreign exchange forward contracts, to reduce exposure to changes in exchange rates when a meaningful amount of capital has been invested in foreign currencies. We do not, however, hedge our currency exposure in all currencies or all investments.
The success of our hedging transactions will depend on our ability to correctly predict movements in currencies and interest rates. Therefore, while we may enter into such transactions to seek to reduce currency exchange rate and interest rate risks, unanticipated changes in currency exchange rates or interest rates may result in poorer overall investment performance than if we had not engaged in any such hedging transactions. In addition, the degree of correlation between price movements of the instruments used in a hedging strategy and price movements in the portfolio positions being hedged may vary. Moreover, for a variety of reasons, we may not seek to (or be able to) establish a perfect correlation between such hedging instruments and the portfolio holdings being hedged. Any such imperfect correlation may prevent us from achieving the intended hedge and expose us to risk of loss. In addition, it may not be possible to hedge fully or perfectly against currency fluctuations affecting the value of securities denominated in non-U.S. currencies because the value of those securities is likely to fluctuate as a result of factors not related to currency fluctuations.
We do not isolate that portion of the results of operations resulting from changes in foreign exchange rates on investments from the fluctuations arising from changes in fair values of investments held; therefore, fluctuations related to foreign exchange rate conversions are included with unrealized appreciation (depreciation) on investments. The following table presents the combined realized and unrealized gains and losses on investments, including the impact of our hedges. Changes in foreign currency exchange rates could impact our earnings to the extent that our investments denominated in foreign currencies are not hedged or the hedges are not effective. See Item 3. “Quantitative and Qualitative Disclosures About Market Risk” for further discussion of the impact of foreign currency exchange rates on our earnings.
| Year Ended December 31, | ||||||||||||
| (in thousands) |
2016 | 2015 | 2014 | |||||||||
| Net realized and unrealized losses on investments |
$ | (29,408 | ) | $ | (261,759 | ) | $ | (86,995 | ) | |||
| Net realized and unrealized gains on foreign currency forward contracts |
9,131 | 31,368 | 46,493 | |||||||||
| Net realized and unrealized gains on cross currency swaps |
26,882 | 8,484 | — | |||||||||
|
|
|
|
|
|
|
|||||||
| $ | 6,605 | $ | (221,907 | ) | $ | (40,502 | ) | |||||
|
|
|
|
|
|
|
|||||||
The net realized and unrealized gains and losses on investments during the year ended December 31, 2016, after applying the net impacts of movements in valuation on the underlying foreign currency forward contracts and cross currency swaps put in place to mitigate currency risk, were attributable to a tightening of credit spreads and a general improvement in market conditions experienced during the second half of 2016. These conditions helped to offset a portion of the net losses incurred during the first quarter of 2016, and losses related to underperforming investments. The net realized and unrealized losses on investments during the year ended December 31, 2015, after applying the net impacts of movements in valuation on the underlying foreign currency forward contracts and cross currency swaps put in place to mitigate currency risk, were partly attributable to declines in the fair values of the Company’s investments in securities of portfolio companies directly or indirectly related to the energy sector. During the year ended December 31, 2015, volatility in commodities, energy and equities impacted various credits contributing to increasing unrealized depreciation in the portfolio. The net realized and unrealized losses on investments during the year ended December 31, 2014, were partly due to a $17.41 million unrealized decline in the fair value of our investment in our portfolio company Towergate Finance PLC.
53
Table of Contents
The net change in unrealized appreciation (depreciation) on derivative instruments consisted of the following:
| Year Ended December 31, | ||||||||||||
| (in thousands) |
2016 | 2015 | 2014 | |||||||||
| Net change in unrealized appreciation (depreciation) on TRS Portfolio: |
||||||||||||
| Unsettled amounts at end of period: |
||||||||||||
| Spread interest income |
$ | 3,346 | $ | 3,762 | $ | 3,032 | ||||||
| Realized gains (losses) on TRS assets |
441 | (571 | ) | (26 | ) | |||||||
| Receipt of prior period unsettled amounts |
(3,191 | ) | (3,006 | ) | (1,676 | ) | ||||||
| Unrealized appreciation (depreciation) on TRS assets |
16,363 | (10,302 | ) | (6,636 | ) | |||||||
|
|
|
|
|
|
|
|||||||
| 16,959 | (10,117 | ) | (5,306 | ) | ||||||||
|
|
|
|
|
|
|
|||||||
| Net change in unrealized appreciation (depreciation) on foreign currency forward contracts |
||||||||||||
| Unrealized appreciation |
3,504 | 2,258 | 41,659 | |||||||||
| Unrealized depreciation |
— | (541 | ) | (458 | ) | |||||||
| Net unrealized (appreciation) depreciation reversal related to net realized gains or losses (1) |
(1,717 | ) | (40,445 | ) | 2,425 | |||||||
|
|
|
|
|
|
|
|||||||
| 1,787 | (38,728 | ) | 43,626 | |||||||||
|
|
|
|
|
|
|
|||||||
| Net change in unrealized appreciation (depreciation) on cross currency swaps: |
||||||||||||
| Unrealized appreciation |
18,554 | 8,247 | — | |||||||||
| Unrealized depreciation |
— | (304 | ) | — | ||||||||
|
|
|
|
|
|
|
|||||||
| 18,554 | 7,943 | — | ||||||||||
|
|
|
|
|
|
|
|||||||
| Net change in unrealized appreciation (depreciation) on interest rate swaps |
||||||||||||
| Unrealized appreciation |
2,841 | 6,021 | — | |||||||||
|
|
|
|
|
|
|
|||||||
| 2,841 | ||||||||||||
| 2,841 | 6,021 | — | ||||||||||
|
|
|
|
|
|
|
|||||||
| Total net change in unrealized appreciation (depreciation) on derivative instruments |
$ | 40,141 | $ | (34,881 | ) | $ | 38,320 | |||||
|
|
|
|
|
|
|
|||||||
| (1) | Represents the unrealized appreciation or depreciation recorded at the end of prior period. |
The provision for taxes is primarily attributable to four debt investments held in one of our wholly-owned subsidiaries.
We are not aware of any material trends or uncertainties, favorable or unfavorable, that may be reasonably anticipated to have a material impact on either capital resources or the revenues or income to be derived from our investments, other than those described above, and the risk factors identified in Part II, Item 1A of this report.
Adjusted net investment income
Our net investment income totaled $210.10 million ($0.69 per share), $176.69 million ($0.69 per share) and $130.13 million ($0.73 per share) for the years ended December 31, 2016, 2015 and 2014, respectively. As described above in “- Investment advisory fees and performance-based incentive fees,” we accrue estimated performance-based incentive fees with respect to any net realized and unrealized appreciation in our Investment Portfolio and derivative instruments. The performance-based incentive fees are treated as an operating expense and therefore are a deduction in calculating our net investment income on a GAAP basis. However, our net realized and unrealized appreciation on our Investment Portfolio and derivative instruments that partly determine these fees are not included in net investment income. Therefore, in order to evaluate our net investment income without regard to realized and unrealized appreciation in our Investment Portfolio, including the impact of related accrued performance-based fees, we have developed a supplemental, non-GAAP measure, which we refer to as “adjusted net investment income,” which presents net investment income before the effects of unearned performance-based incentive fees.
In addition, the relative utilization of the TRS can also cause variability in net investment income, because earnings on assets within the TRS Portfolio are not included in the calculation of net investment income in accordance with GAAP. The TRS Portfolio accrued interest income and financing charges are included in the fair value of the TRS and are not recorded as realized gain or loss on derivative instruments until quarterly TRS settlement payments are finalized. If the TRS assets had instead been included in our Investment Portfolio as owned assets, the interest income and financing charges, or TRS net interest spread, would have been included in net investment income. We include the TRS net interest spread in our calculation of adjusted net investment income.
We believe that adjusted net investment income is useful to assess the sustainability of our distributions and operating performance. Adjusted net investment income is not necessarily indicative of cash flows available to fund cash needs and should not be considered as an alternative to net investment income as an indication of our performance, as an alternative to cash flows from operations as an indication of our liquidity, or indicative of funds available to fund our cash needs including our ability to make future distributions to our shareholders. Adjusted net investment income should not be construed as a historic performance measure or as more relevant or accurate than the current GAAP methodology in calculating net investment income and its applicability in evaluating our operating performance.
54
Table of Contents
The following table shows the TRS interest income and financing charges for the years ended December 31, 2016, 2015 and 2014.
| Year Ended December 31, | ||||||||||||
| (in thousands, except per share amounts) |
2016 | 2015 | 2014 | |||||||||
| Interest and fee income included in TRS fair value |
$ | 4,215 | $ | 4,658 | $ | 3,545 | ||||||
| Financing charges included in TRS fair value |
(869 | ) | (896 | ) | (513 | ) | ||||||
|
|
|
|
|
|
|
|||||||
| Subtotal |
3,346 | 3,762 | 3,032 | |||||||||
| Interest and fee income included in TRS net realized gains |
19,170 | 17,242 | 4,928 | |||||||||
| Financing charges included in TRS net realized gains |
(6,109 | ) | (4,028 | ) | (696 | ) | ||||||
| Amounts included in prior period fair value |
(3,762 | ) | (3,032 | ) | (1,703 | ) | ||||||
|
|
|
|
|
|
|
|||||||
| TRS net interest spread |
$ | 12,645 | $ | 13,944 | $ | 5,561 | ||||||
|
|
|
|
|
|
|
|||||||
| TRS Net interest spread per share |
$ | 0.04 | $ | 0.05 | $ | 0.03 | ||||||
|
|
|
|
|
|
|
|||||||
The following table presents a reconciliation of our net investment income to adjusted net investment income for the years ended December 31, 2016, 2015 and 2014; the increase in adjusted net investment income was primarily the result in the growth of our Investment Portfolio and earnings thereon.
| Year Ended December 31, | ||||||||||||
| (in thousands, except per share amounts) |
2016 | 2015 | 2014 | |||||||||
| Net investment income (GAAP) |
$ | 210,096 | $ | 176,688 | $ | 130,126 | ||||||
| Add: Estimated unearned performance-based incentive fees |
— | — | (8,805 | ) | ||||||||
| Add: TRS net interest spread |
12,645 | 13,944 | 5,561 | |||||||||
|
|
|
|
|
|
|
|||||||
| Adjusted net investment income (non-GAAP) |
$ | 222,741 | $ | 190,632 | $ | 126,882 | ||||||
|
|
|
|
|
|
|
|||||||
| Net investment income per share (GAAP) |
$ | 0.69 | $ | 0.69 | $ | 0.73 | ||||||
|
|
|
|
|
|
|
|||||||
| Adjusted net investment income per share (non-GAAP) |
$ | 0.73 | $ | 0.75 | $ | 0.72 | ||||||
|
|
|
|
|
|
|
|||||||
Net Assets, Net Asset Value per Share, Annual Investment Return and Total Return Since Inception
Net assets increased $165.31 million, $448.20 million and $715.39 million during the years ended December 31, 2016, 2015 and 2014, respectively. The most significant increase in net assets year over year was attributable to capital transactions including (i) the issuance of shares of common stock and (ii) reinvestment of distributions in the combined amount of $251.74 million, $723.87 million and $789.72 million, respectively. Our operations resulted in net assets increasing (decreasing) $243.11 million, ($38.21) million and $84.32 million during the years ended December 31, 2016, 2015 and 2014, respectively. Our overall increase in net assets was partially offset by distributions to shareholders in the amount of $244.95 million, $205.04 million and $142.02 million and the repurchase of shares of common stock in the amount of $84.59 million, $32.42 million and $16.63 million during the years ended December 31, 2016, 2015 and 2014, respectively.
Our net asset value per share was $8.93, $8.93 and $9.79 on December 31, 2016, 2015 and 2014, respectively. After considering (i) the overall changes in net asset value per share, (ii) distributions paid of approximately $0.80 per share during each of the years ended December 31, 2016, 2015 and 2014, and (iii) the assumed reinvestment of those distributions at 90% of the prevailing offering price per share, the total investment return was 9.5%, (0.9)% and 5.9% for shareholders who held our shares over the entire 12-month period ended December 31, 2016, 2015 and 2014, respectively.
Initial shareholders who subscribed to the Initial Offering in June 2011 with an initial investment of $10,000 and an initial purchase price equal to $9.00 per share (public offering price net of sales load) have seen the value of their investment grow by 55.7% (see first chart below), or an annualized return of 8.3% (see second chart below). Initial shareholders who subscribed to the Initial Offering in June 2011 with an initial investment of $10,000 and an initial purchase price equal to $10.00 per share (the initial public offering price) have registered a total investment return of 40.1% (see first chart below), or an annualized return of 6.3% (see second chart below). The S&P/LSTA Leveraged Loan Index, a primary measure of senior debt covering the U.S. leveraged loan market, which currently consists of approximately 1,100 credit facilities throughout numerous industries, and the Merrill Lynch US High Yield Master II Index, a primary measure of subordinated debt consisting of approximately 2,000 high yield corporate bonds, registered cumulative total returns of approximately 27.1% and 42.3%, respectively, in the period from June 17, 2011 to December 31, 2016.
55
Table of Contents
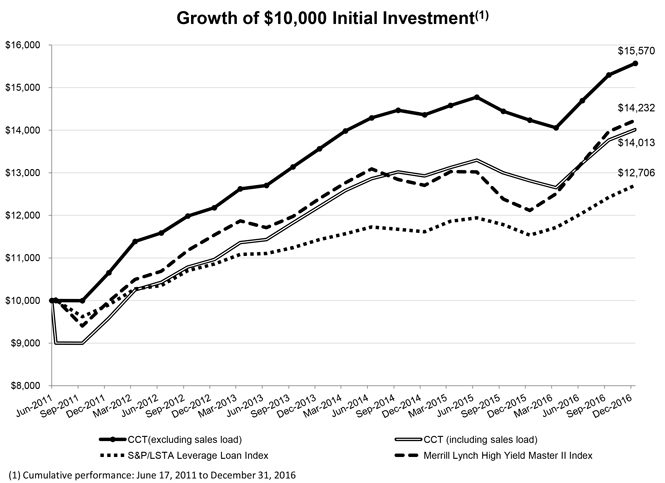
The calculations for the Growth of $10,000 Initial Investment in the shares of our common stock are based upon (i) an initial investment of $10,000 in our common stock at the beginning of the period at a share price of $10.00 per share (including sales load) and $9.00 per share (excluding sales load), (ii) assumed reinvestment of monthly distributions in accordance with our distribution reinvestment plan, (iii) the sale of the entire investment position at the net asset value per share on the last day of the period; and (iv) distributions payable, if any, on the last day of the period.
56
Table of Contents
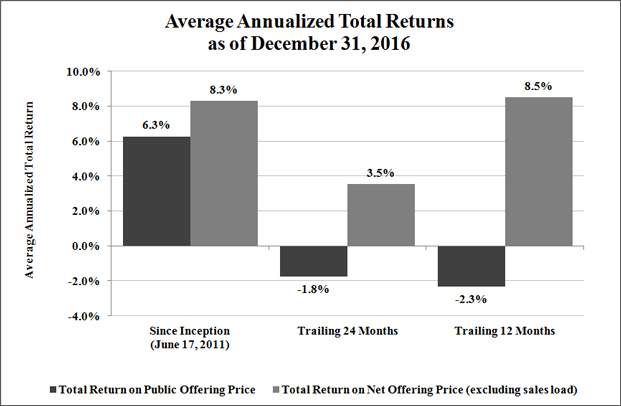
| Since Inception (June 17, 2011) |
Trailing 24 Months | Trailing 12 Months | ||||
| Public Offering Price/Share |
$10.00 | $11.00 | $10.00 | |||
| Net Offering Price/Share |
$ 9.00 | $ 9.90 | $ 9.00 | |||
| Distributions/Share |
$ 4.36 | $ 1.61 | $ 0.80 | |||
| Terminal Value/Share (NAV) |
$ 8.93 | $ 8.93 | $ 8.93 |
In the chart above, we also present the average annual returns for the trailing 24 months and trailing 12 months, in each case assuming (i) the purchase of shares of common stock at the public offering price and net offering price (90% of public offering price) at the beginning of the period, (ii) reinvestment of distributions in the common stock, (iii) a terminal value at December 31, 2016 equal to net asset value of $8.93 per share and (iv) distributions payable to shareholders as of December 31, 2016.
Our shares are illiquid investments for which there is currently not a secondary market. You should not expect to be able to resell your shares regardless of how we perform. If you are able to sell your shares, you will likely receive less than your purchase price. Our net asset value and annualized returns — which are based in part upon determinations of fair value of Level 3 investments by our board of directors, not active market quotations — are inherently uncertain. Past performance is not a guarantee of future results.
Critical Accounting Policies and Estimates
Our discussion and analysis of our financial condition and results of operations are based upon our consolidated financial statements which have been prepared in accordance with GAAP. The preparation of our consolidated financial statements requires management to make estimates and assumptions that affect the reported amounts of assets, liabilities, revenues and expenses. Note 2. “Significant Accounting Policies” in Item 8. “Financial Statements and Supplementary Data” describes the significant accounting policies and methods used in the preparation of our consolidated financial statements. We consider the accounting policies listed below to be critical because they involve management judgments and assumptions, require estimates about matters that are inherently uncertain and are important for understanding and evaluating our reported financial results. These judgments affect (i) the reported amounts of assets and liabilities, (ii) our disclosure of contingent assets and liabilities as of the dates of the financial statements and (iii) the reported amounts of revenue and expenses during the reporting periods. With different estimates or assumptions, materially different amounts could be reported in our financial statements. Changes in the economic environment, financial markets and any other parameters used in determining such estimates could cause actual results to differ materially from the amounts reported based on these policies.
57
Table of Contents
Valuation of Investments and Unrealized Gain (Loss) – Our investments consist primarily of investments in senior and subordinated debt of private U.S. companies and are presented in our consolidated financial statements at fair value. See Note 3. “Investments,” in Item 8. “Financial Statements and Supplementary Data” for more information on our investments. As described more fully in Note 2. “Significant Accounting Policies” and Note 5. “Fair Value of Financial Instruments” in Item 8. “Financial Statements and Supplementary Data,” a valuation hierarchy based on the level of independent, objective evidence available regarding value is used to measure the fair value of our investments. Investments for which market quotations are readily available are valued using market quotations, which are generally obtained from independent pricing services, broker-dealers or market makers. With respect to our portfolio investments for which market quotations are not readily available, our board of directors is responsible for determining in good faith the fair value of our portfolio investments in accordance with, and the consistent application of, the valuation policy and procedures approved by the board of directors, based on, among other things, the input of our Advisors, audit committee and independent third-party valuation firms.
We utilize several valuation techniques that use unobservable inputs and assumptions in determining the fair value of our Level 3 investments. For senior debt, subordinated debt and structured products categorized as Level 3 investments, we initially value the investment at its transaction price and subsequently value using (i) market data for similar instruments (e.g., recent transactions or indicative broker quotes), (ii) comparisons to benchmark derivative indices and/or (iii) valuation models. Valuation models are based on yield analysis and discounted cash flow techniques, where the key inputs are based on relative value analyses and the assignment of risk-adjusted discounted rates derived from the analysis of similar credit investments from similar issuers. In addition, an illiquidity discount is applied where appropriate. The valuation techniques used by us for other types of assets and liabilities that are classified as Level 3 investments are described in Note 2 to our consolidated financial statements. The unobservable inputs and assumptions may differ by asset and in the application of our valuation methodologies. The reported fair value estimates could vary materially if we had chosen to incorporate different unobservable inputs and other assumptions.
We and our board of directors conduct our fair value determination process on a quarterly basis and any other time when a decision regarding the fair value of our portfolio investments is required. A determination of fair value involves subjective judgments and estimates. Due to the inherent uncertainty of determining the fair value of portfolio investments that do not have a readily available market value, the fair value of the our portfolio investments may differ significantly from the values that would have been determined had a readily available market value existed for such investments, and the differences could be material. Further, such investments are generally less liquid than publicly traded securities. If we were required to liquidate a portfolio investment that does not have a readily available market value in a forced or liquidation sale, we could realize significantly less than the fair value recorded by us.
The table below presents information on the significant presence of investments classified as Level 3 as of December 31, 2016 and 2015:
| As of December 31, (in thousands) |
2016 | 2015 | ||||||
| Fair value of investments classified as Level 3 |
$ | 3,189,484 | $ | 2,416,535 | ||||
| Total fair value of investments |
$ | 4,025,293 | $ | 3,729,332 | ||||
| % of fair value classified as Level 3 |
79.2 | % | 64.8 | % | ||||
| Number of positions classified as Level 3 |
126 | 93 | ||||||
| Total number of positions |
191 | 180 | ||||||
| % of positions classified as Level 3 |
65.6 | % | 51.7 | % | ||||
| Fair value of individual positions classified as Level 3: |
||||||||
| Highest fair value |
$ | 138,564 | $ | 102,760 | ||||
| Lowest fair value |
$ | — | $ | — | ||||
| Average fair value |
$ | 25,313 | $ | 25,984 | ||||
The ranges of unobservable inputs used in the fair value measurement of the Company’s Level 3 investments as of December 31, 2016 and 2015 are described in Note 5. “Fair Value of Financial Instruments” in Item 8. “Financial Statements and Supplementary Data,” as well as the directional impact to the valuation from an increase in various unobservable inputs.
In addition to impacting the estimated fair value recorded for our investments in our statement of assets and liabilities, had we used different key unobservable inputs to determine the estimated fair value of our investments, amounts recorded in our statement of operations, including the net change in unrealized appreciation and depreciation on investments, investment advisory fees and performance-based incentive fees would also be impacted since such amounts are directly impacted by the estimated fair value of our assets. For instance, a 5% overstatement of the fair value of our Level 3 investments as of December 31, 2016, assuming all other estimates remain unchanged, would otherwise result in a $151.88 million overstatement of net change in unrealized appreciation on investments, a $0.26 million overstatement of our investment advisory fees payable to our Advisors, a $151.62 million overstatement of our net increase in net assets resulting from operations, a $0.50 overstatement in our earnings per share and a $0.49 overstatement of our net asset value per share.
58
Table of Contents
Off-Balance Sheet Arrangements
We had no off-balance sheet arrangements as of December 31, 2016.
Contractual Obligations
Investment Advisory Agreements – We have entered into the Investment Advisory Agreement with CNL for the overall management of our investment activities. We and CNL have also entered into the Sub-Advisory Agreement with KKR, under which KKR is responsible for the day-to-day management of our Investment Portfolio and TRS Portfolio. CNL compensates KKR for advisory services that it provides to us with 50% of the base management fees and performance-based incentive fees that CNL receives under the Investment Advisory Agreement. Pursuant to the Investment Advisory Agreement, CNL earns a base management fee equal to an annual rate of 2% of our average gross assets (including unrealized appreciation or depreciation on the TRS and collateral posted with the custodian in connection with the TRS, but excluding deferred offering expenses and, from and after April 11, 2016, cash and short-term investments), and an incentive fee based on our performance. The incentive fee is comprised of the following two parts:
| (i) | a subordinated incentive fee on pre-incentive fee net investment income, paid quarterly, if earned, computed as the sum of (a) 100% of quarterly pre-incentive fee net investment income in excess of 1.75% of average adjusted capital up to a limit of 0.4375% of average adjusted capital, and (b) 20% of pre-incentive fee net investment income in excess of 2.1875% of average adjusted capital, and |
| (ii) | an incentive fee on capital gains paid annually, if earned, equal to (A) 20% of all realized gains on a cumulative basis from inception, net of (1) all realized losses on a cumulative basis, (2) unrealized depreciation at year-end and (3) disregarding any net realized gains associated with the TRS interest spread, which represents the difference between (a) the interest and fees received on total return swaps, and (b) the financing fees paid to the total return swaps counterparty, less (B) the aggregate amount of any previously paid incentive fee on capital gains. |
As of December 31, 2016, we had accrued a subordinated incentive fee on income of $4.91 million. See Note 6. “Related Party Transactions” in Item 8. “Financial Statements and Supplementary Data” for expanded discussion of the Investment Advisory and Sub-Advisory Agreements.
Beginning January 1, 2017, the subordinated incentive fee on income will be subject to a total return requirement, which provides generally that no incentive fee will be payable except to the extent that 20.0% of the cumulative net increase in net assets resulting from operations over the then-current and three preceding calendar quarters (or, if four calendar quarters have not passed, then the time period since January 1, 2017) exceeds the cumulative incentive fees accrued and/or paid for the same period. Accordingly, any subordinated incentive fee on income that is payable in a calendar quarter will be limited to the lesser of (i) 20.0% of all of our pre-incentive fee net investment income when our pre-incentive fee net investment income exceeds the applicable quarterly hurdle rate for such calendar quarter, subject to the catch-up provision, and (ii) (x) 20.0% of the cumulative net increase in net assets resulting from operations for the then-current and three preceding calendar quarters minus (y) the cumulative incentive fees accrued and/or paid for the three preceding calendar quarters or period since January 1, 2017, whichever period is shorter. For the foregoing purpose, the “cumulative net increase in net assets resulting from operations” is the sum of our pre-incentive fee net investment income, base management fees, realized gains and losses and unrealized appreciation and depreciation for the then-current and three preceding calendar quarters. There will be no accumulation of amounts on the hurdle rate from quarter to quarter and, accordingly, there will be no clawback of amounts previously paid if subsequent quarters are below the applicable quarterly hurdle rate and there will be no delay of payment if prior quarters are below the applicable quarterly hurdle rate.
The terms of the Investment Advisory Agreement entitle CNL (and indirectly KKR) to receive up to 5% of gross proceeds in connection with the Offerings as reimbursement for organization and offering expenses incurred by the Advisors on our behalf.
Over the course of the Offerings, the Advisors incurred $22.60 million for offering expenses, or 0.7% of total gross offering proceeds of the Offerings, excluding the reinvestment of distributions. As of the date of this filing, the Advisors were fully reimbursed for all offering expenses in connection with the Offerings that they incurred on our behalf as of December 31, 2016.
59
Table of Contents
Unfunded Commitments - Unfunded commitments to provide funds to portfolio companies are not recorded on our consolidated statements of assets and liabilities. Because these commitments may expire without being drawn upon, the total commitment amount does not necessarily represent future cash requirements. We intend to use cash flow from scheduled and early principal repayments and proceeds from borrowings and securities offerings to fund these commitments. As of December 31, 2016, our unfunded investment commitments are as follows:
| Category / Company (1) |
||||
| Unfunded revolvers/delayed draw loan commitments: |
||||
| A10 Capital, LLC |
$ | 10,058 | ||
| BeyondTrust Software, Inc. |
1,090 | |||
| Centric Group LLC |
5,870 | |||
| Dentix Health Corporation, S.L.U. |
9,473 | |||
| Safety Technology Holdings, Inc. |
421 | |||
| Smile Brands, Inc. |
3,589 | |||
| SouthernCarlson |
6,219 | |||
| SouthernCarlson |
5,182 | |||
| SquareTwo Financial Corp. |
2,704 | |||
|
|
|
|||
| Total unfunded revolvers/delayed draw loan commitments |
$ | 44,606 | ||
|
|
|
|||
| Unfunded equity commitments: |
||||
| Central Park Leasing SARL |
$ | 1,292 | ||
| GA Capital Specialty Lending Fund |
34,855 | |||
| Home Partners of America, Inc. |
2,150 | |||
| KKR BPT Holdings Aggregator, LLC |
6,800 | |||
| Orchard Marine, Ltd. |
6,138 | |||
| Polyconcept North America Holdings, Inc. |
1,211 | |||
| Star Mountain SMB Multi-Manager Credit Platform, LP |
28,307 | |||
| Toorak Capital |
23,016 | |||
|
|
|
|||
| Total unfunded equity commitments |
$ | 103,769 | ||
|
|
|
| (1) | May be commitments to one or more entities affiliated with the named company. |
We also have a commitment to provide up to $345.10 million of capital to SCJV. The capital commitment to SCJV can be satisfied with contributions of either cash or assets, and no capital commitment can be drawn without an affirmative vote by one of our representatives on SCJV’s board of managers.
We estimate we have sufficient liquidity in the form of cash on hand, borrowing capacity under our revolving credit facilities and scheduled and early principal repayments to fund such unfunded commitments when the need arises.
Borrowings - As discussed above under “Capital Resources and Liquidity – Borrowings,” we, either directly or through our wholly owned subsidiaries, have borrowing agreements with several lenders in connection with our revolving credit facilities and the 2014 Senior Secured Term Loan. As of December 31, 2016, the credit facilities provided for $217.86 million of additional borrowing capacity. (See — “Capital Resources and Liquidity — Borrowings” above and Note 10. “Borrowings” in our consolidated financial statements for expanded discussion of our borrowings.)
A summary of our significant contractual payment obligations for the repayment of outstanding borrowings and interest expense and other fees related to our borrowings at December 31, 2016 is as follows:
| (in thousands) |
Total | < 1 year | 1-3 years | 3-5 years | After 5 years | |||||||||||||||
| Senior Secured Revolving Credit Facility |
$ | 799,000 | $ | — | $ | — | $ | 799,000 | $ | — | ||||||||||
| BNP Credit Facility |
183,000 | 183,000 | — | — | — | |||||||||||||||
| Sumitomo Credit Facility |
102,000 | — | — | 102,000 | — | |||||||||||||||
| JPM Credit Facility |
135,000 | — | — | 135,000 | — | |||||||||||||||
| 2014 Senior Secured Term Loan |
389,000 | 4,000 | 8,000 | 377,000 | — | |||||||||||||||
| CS Facility |
23,454 | 23,454 | — | — | — | |||||||||||||||
| Interest and Credit Facilities Fees Payable(1) |
187,377 | 54,194 | 91,696 | 41,487 | — | |||||||||||||||
|
|
|
|
|
|
|
|
|
|
|
|||||||||||
| Total |
$ | 1,818,831 | $ | 264,648 | $ | 99,696 | $ | 1,454,487 | $ | — | ||||||||||
|
|
|
|
|
|
|
|
|
|
|
|||||||||||
| (1) | Estimated interest payments have been calculated based on interest rates of our borrowings as of December 31, 2016. |
60
Table of Contents
Related Party Transactions
We have entered into agreements with our Advisors and certain of their affiliates, whereby, we agree to pay certain fees to, or reimburse certain expenses of, our Advisors and their affiliates for investment and advisory services, selling commissions and marketing support fees in connection with our Offerings, and reimbursement of offering and administrative and operating fees and costs. See Note 6. “Related Party Transactions” in Item 8. “Financial Statements and Supplementary Data” and Item 13. “Certain Relationships and Related Transactions, and Director Independence” for a discussion of the various related party transactions, agreements and fees.
Impact of Recent Accounting Pronouncements
See Note 2. “Significant Accounting Policies” in Item 8. “Financial Statements and Supplementary Data” for a summary of the impact of any recent accounting pronouncements, if any.
| Item 7A. | Quantitative and Qualitative Disclosures About Market Risk |
Interest Rate Risk
We are subject to financial market risks, in particular changes in interest rates. Future changes in interest rates will likely have effects on the interest income we earn on our portfolio investments, the fair value of our fixed income investments, the interest rates and interest expense associated with the money we borrow and the fair value of loan balances.
Subject to the requirements of the 1940 Act, we may hedge against interest rate fluctuations by using standard hedging instruments such as futures, options and forward contracts. Although hedging activities may insulate us against adverse changes in interest rates, they may also limit our ability to participate in the benefits of lower interest rates. As of December 31, 2016, we have three pay-fixed, receive-floating interest rate swaps which we pay an annual fixed rate of 0.84% to 1.43% and receive three-month LIBOR on an aggregate notional amount of $600 million. The interest rate swaps have quarterly settlement payments.
As of December 31, 2016, approximately 77.8% of our portfolio of debt investments (excluding TRS assets), or approximately $2.97 billion measured at par value, featured floating or variable interest rates. The variable interest rate debt investments usually provide for interest payments based on three-month LIBOR (the base rate) and typically have durations of three months after which the base rates are reset to then prevailing three-month LIBOR. As of December 31, 2016, approximately 92.6% of our portfolio of variable interest rate debt investments, or approximately $2.75 billion measured at par value, featured minimum base rates, or base rate floors, and the weighted average base rate floor for such investments was 1.0%. Variable interest rate investments that feature a base rate floor generally reset to the then prevailing three-month LIBOR only if the reset base rate exceeds the base rate floor on the applicable interest rate reset date, in which cases, we may benefit through an increase in interest income from such interest rate adjustments. At December 31, 2016, we held an aggregate investment position of $218.46 million at par value in variable interest rate debt investments that featured variable interest rates without any minimum base rates, or approximately 7.4% of our portfolio of variable interest rate debt investments. In the case of these “no base rate floor” variable interest debt investments held in our portfolio, we may benefit from increases in the base rates that may subsequently result in an increase in interest income from such interest rate adjustments.
Because we borrow money to make investments, our net investment income is partially dependent upon the difference between the interest rates at which we invest borrowed funds and the interest rates at which we borrow funds. In periods of rising interest rates, if we have borrowed capital with floating interest rates, our interest expense will increase, which will increase our financing costs and may reduce our net investment income, especially to the extent we continue to acquire and hold fixed-rate debt investments. As a result, there can be no assurance that a significant change in market interest rates will not have a material adverse effect on our net investment income.
Pursuant to the terms of our credit facilities and 2014 Senior Secured Term Loan, as discussed above (see “Capital Resources and Liquidity – Borrowings – Credit Facilities and Term Loan”), all of our borrowing as of December 31, 2016 provide for floating base rates based on short-term LIBOR. Therefore, if we were to completely draw down the unused commitments in each of our credit facilities, we expect that our weighted average direct interest rate would increase by approximately 2 basis points (“bps”), as compared to our current weighted average direct interest cost for borrowed funds. We expect that any further expansion of our current revolving credit facilities, or any future credit facilities that we or any subsidiary may enter into, will also be based on a floating base rate. As a result, we are subject to continuous risks relating to changes in market interest rates.
Under the terms of the TRS Agreements between Halifax Funding and BNS, Halifax Funding pays interest to BNS at a floating rate based on three-month LIBOR in exchange for the right to receive the economic benefits of a portfolio of TRS assets having a maximum aggregate notional amount of $500 million.
61
Table of Contents
Based on our December 31, 2016 balance sheet, the following table shows the annual impact on net investment income of base rate changes in interest rates (considering interest rate floors for variable rate instruments) assuming no changes in our investment and borrowing structure:
| As of December 31, 2016 (in millions) | ||||||||||||||||||||
| Basis Point Change |
Interest Income |
Interest Expense |
Net Investment Income (1) |
TRS Portfolio (2) |
Interest Rate Swap (3) |
|||||||||||||||
| Down 50 basis points |
$ | (0.921 | ) | $ | (7.059 | ) | $ | 6.138 | $ | 1.293 | $ | (3.000 | ) | |||||||
| Up 50 basis points |
$ | 12.169 | $ | 8.071 | $ | 4.098 | $ | (0.339 | ) | $ | 3.000 | |||||||||
| Up 100 basis points |
$ | 25.030 | $ | 16.228 | $ | 8.802 | $ | (0.571 | ) | $ | 6.000 | |||||||||
| Up 150 basis points |
$ | 37.891 | $ | 24.385 | $ | 13.506 | $ | (0.802 | ) | $ | 9.000 | |||||||||
| Up 200 basis points |
$ | 50.752 | $ | 32.543 | $ | 18.209 | $ | (1.033 | ) | $ | 12.000 | |||||||||
| (1) | Excludes the impact of performance-based incentive fees. See Note 6. “Related Party Transactions” in Item 8. “Financial Statements and Supplementary Data” for more information on the performance-based incentive fees. |
| (2) | Pursuant to the TRS Agreements, Halifax Funding receives from BNS all collected interest and fees derived from the TRS assets and pays to BNS interest at a rate equal to three-month LIBOR plus 140 bps per annum on the settled notional amount of TRS assets. As of December 31, 2016, 89.6% of the TRS assets, or approximately $238.01 million measured at par value, featured floating or variable interest rates. At December 31, 2016, 100% of the TRS assets with variable interest rates featured minimum base rate floors, or approximately $238.01 million measured at par value, and the weighted average base rate floor for such TRS assets was 1.0%. As of December 31, 2016, the total notional amount of the portfolio of TRS assets was $258.69 million, and the settled notional amount was $225.92 million. For the purpose of presenting the net interest sensitivity analysis above, we have assumed that all TRS assets are settled as of December 31, 2016 and that the TRS notional amount would equal $258.69 million upon which the financing payments to BNS are based. |
| (3) | Excludes the impact of quarterly fixed rate payments on interest rate swaps. See Note 4. “Derivative Instruments” in Item 8. “Financial Statements and Supplementary Data” for more information on our open interest rate swaps as of the end of the reporting period. |
The interest rate sensitivity analysis presented above does not consider the potential impact of the changes in fair value of our debt investments and the net asset value of our common stock in the event of sudden increases in interest rates associated with high yield corporate bonds. Approximately 22.2% of our debt investment portfolio was invested in fixed interest rate, high yield corporate debt investments as of December 31, 2016. Rising market interest rates will most likely lead to fair value declines for high yield corporate bonds and a decline in the net asset value of our common stock, while declining market interest rates will most likely lead to an increase in bond values.
As of December 31, 2016, approximately 48.0% of our fixed interest rate debt investments, or approximately $321.76 million measured at fair value, had prices that are generally available from third party pricing services. We consider these debt investments to be one of the more liquid subsets of our Investment Portfolio since these types of assets are generally broadly syndicated and owned by a wide group of institutional investors, business development companies, mutual funds and other investment funds. Additionally, this group of assets is susceptible to revaluation, or changes in bid-ask values, in response to sudden changes in expected rates of return associated with these investments. We have other fixed interest rate investments in the less liquid subset of our Investment Portfolio that are not included in this analysis.
We have computed a duration of approximately 4.8 for this liquid/fixed subset of our total portfolio. This implies that a sudden increase in the market’s expected rate of return of 100 basis points for this subset of our Investment Portfolio may result in a reduction in fair value of approximately 4.8%, all other financial and market factors assuming to remain unchanged. A 4.8% decrease in the valuation of this Investment Portfolio subset equates to a decrease of $15.34 million, or a 0.6% decline in net assets relative to $8.93 net asset value per share as of December 31, 2016.
Foreign Currency Risk
From time to time, we may make investments that are denominated in a foreign currency that are subject to the effects of exchange rate movements between the foreign currency of each such investment and the U.S. dollar, which may affect future fair values and cash flows, as well as amounts translated into U.S. dollars for inclusion in our consolidated financial statements.
62
Table of Contents
The table below presents the effect that a 10% immediate, unfavorable change in the foreign currency exchange rates (i.e. further strengthening U.S. Dollar) would have on the fair value of investments in our Investment Portfolio denominated in foreign currencies as of December 31, 2016, by foreign currency, all other valuation assumptions remaining constant. Our TRS Portfolio did not contain any investments denominated in foreign currencies as of December 31, 2016. In addition, the table below presents the par value of our investments denominated in foreign currencies and the notional amount of foreign currency forward contracts in local currency in place as of December 31, 2016, to hedge against foreign currency risks.
| Investments Denominated in Foreign Currencies | Hedges | |||||||||||||||||||||||||||||
| As of December 31, 2016 | Reduction in Fair Value as of |
As of December 31, 2016 | ||||||||||||||||||||||||||||
| December 31, | Net Foreign | Net Foreign | ||||||||||||||||||||||||||||
| Par Value/ | 2016 if 10% | Currency | Currency | |||||||||||||||||||||||||||
| Cost in Local | Par Value/ | Adverse Change | Hedge Amount | Hedge Amount | ||||||||||||||||||||||||||
| (in thousands) |
Currency(1) | Cost in US$(1) | Fair Value | in Exchange Rate(2) | in Local Currency | in U.S. Dollars | ||||||||||||||||||||||||
| Euros |
€ | 433,733 | $ | 456,736 | $ | 346,630 | $ | 34,663 | € | 355,146 | $ | 389,690 | ||||||||||||||||||
| British Pound Sterling |
£ | 76,838 | 96,374 | 93,865 | 9,387 | £ | 76,886 | 114,190 | ||||||||||||||||||||||
| Australian Dollars |
A$ | 32,119 | 23,379 | 11,813 | 1,181 | A$ | 30,887 | 22,616 | ||||||||||||||||||||||
| Swedish Kronor |
SEK | 97,249 | 15,145 | 2,253 | 225 | SEK | — | — | ||||||||||||||||||||||
|
|
|
|
|
|
|
|
|
|||||||||||||||||||||||
| Total |
$ | 591,634 | $ | 454,561 | $ | 45,456 | $ | 526,496 | ||||||||||||||||||||||
|
|
|
|
|
|
|
|
|
|||||||||||||||||||||||
| (1) | Amount represents the par value of debt investments and cost of equity investments denominated in foreign currencies. |
| (2) | Excludes effect, if any, of any foreign currency hedges. |
As illustrated in the table above, we use derivative instruments from time to time, including foreign currency forward contracts, to manage the impact of fluctuations in foreign currency exchange rates. In addition, we have the ability to borrow in foreign currencies under our Senior Secured Revolving Credit Facility, which provides a natural hedge with regard to changes in exchange rates between the foreign currencies and U.S. dollar and reduces our exposure to foreign exchange rate differences. We are typically a net receiver of these foreign currencies as related for our international investment positions, and, as a result, our investments denominated in foreign currencies, to the extent not hedged, benefit from a weaker U.S. dollar and are adversely affected by a stronger U.S. dollar.
As of December 31, 2016, the net contractual notional balance of our foreign currency forward contracts and cross currency swaps totaled $526.50 million, all of which related to hedging of our foreign currency denominated debt investments. As of December 31, 2016, we did not have any outstanding borrowings denominated in foreign currencies on our Senior Secured Revolving Credit Facility.
During the year ended December 31, 2016, our foreign currency transactions and foreign currency translation adjustment recorded in our consolidated statements of operations resulted in net realized and unrealized losses of less than $0.01 million, including $1.20 million of net realized and unrealized gains from our borrowings denominated in foreign currencies. Our foreign currency forward contracts and cross currency swaps, employed for hedging purposes, generated net realized and unrealized gains of $36.01 million during the year ended December 31, 2016. We do not isolate that portion of the results of operations resulting from changes in foreign exchange rates on investments from the fluctuations arising from changes in fair values of investments held; therefore, the fluctuations related to foreign exchange rate conversion are included with the net realized gain (loss) and unrealized appreciation (depreciation) on investments. See “Results of Operations – Net Change in Unrealized Appreciation or Depreciation” for additional information on the foreign currency exchange changes.
| Item 8. | Financial Statements and Supplementary Data. |
Information required by this Item is included herein beginning on page F-1.
| Item 9. | Changes in and Disagreements With Accountants on Accounting and Financial Disclosure |
None.
| Item 9A. | Controls and Procedures |
Evaluation of Disclosure Controls and Procedures
Pursuant to Rule 13a-15(b) under the Exchange Act, under the supervision and with the participation of our management, including our principal executive officer and principal financial officer, we conducted an evaluation of the effectiveness of our disclosure controls and procedures (as defined under Rule 13a-15(e) under the Exchange Act) as of the end of the period covered by this report. Based upon that evaluation, our management, including our principal executive officer and principal financial officer, concluded that our disclosure controls and procedures are effective as of the end of the period covered by this report.
63
Table of Contents
Management’s Annual Report on Internal Control Over Financial Reporting
Management is responsible for establishing and maintaining adequate internal control over financial reporting (as defined in Rule 13a-15(f) under the Exchange Act). Our internal control over financial reporting is designed to provide reasonable assurance to our management and board of directors regarding the preparation and fair presentation of published financial statements.
Because of its inherent limitations, internal control over financial reporting may not prevent or detect misstatements. Also, projections of any evaluation of effectiveness to future periods are subject to the risk that controls may become inadequate because of changes in conditions, or that the degree of compliance with the policies or procedures may deteriorate.
Based on management’s assessment, we maintained, in all material respects, effective internal control over financial reporting as of December 31, 2016 using the criteria set forth by the Committee of Sponsoring Organizations of the Treadway Commission (COSO) in “Internal Control Integrated Framework (2013)”.
Pursuant to rules established by the SEC, this annual report does not include an attestation report of our independent registered public accounting firm regarding internal control over financial reporting.
Changes in Internal Control over Financial Reporting
During the most recent fiscal quarter, there was no change in our internal controls over financial reporting (as defined under Rule 13a-15(f) under the Exchange Act) that has materially affected, or is reasonably likely to materially affect, our internal controls over financial reporting.
| Item 9B. | Other Information |
Not applicable.
64
Table of Contents
| Item 10. | Directors, Executive Officers and Corporate Governance |
The information required by this Item is incorporated by reference to our 2017 Proxy Statement to be filed with the SEC within 120 days following the end of our company’s fiscal year.
| Item 11. | Executive Compensation |
The information required by this Item is incorporated by reference to our 2017 Proxy Statement to be filed with the SEC within 120 days following the end of our company’s fiscal year.
| Item 12. | Security Ownership of Certain Beneficial Owners and Management and Related Shareholder Matters |
The information required by this Item is incorporated by reference to our 2017 Proxy Statement to be filed with the SEC within 120 days following the end of our company’s fiscal year.
| Item 13. | Certain Relationships and Related Transactions and Director Independence |
The information required by this Item is incorporated by reference to our 2017 Proxy Statement to be filed with the SEC within 120 days following the end of our company’s fiscal year.
| Item 14. | Principal Accountant Fees and Services |
The information required by this Item is incorporated by reference to our 2017 Proxy Statement to be filed with the SEC within 120 days following the end of our company’s fiscal year.
65
Table of Contents
| Item 15. | Exhibits and Financial Statement Schedules |
| a. | The following financial statements are filed as part of this report in Part II, Item 8: |
| Page | ||||
| Report of Independent Registered Certified Public Accounting Firm |
F-1 | |||
| F-2 | ||||
| F-3 | ||||
| F-4 | ||||
| F-5 | ||||
| F-6 | ||||
| F-42 | ||||
| b. | No financial statement schedules are being filed because the required information is not applicable or is presented in the consolidated financial statements or notes. |
| c. | The following exhibits are filed or incorporated as part of this report. |
| 3.1 | Second Amended and Restated Articles of Incorporation of the Registrant. (Incorporated by reference to Exhibit 3.1 to the Company’s Current Report on Form 8-K filed on May 8, 2012.) | |
| 3.2 | Second Amended and Restated Bylaws of the Registrant. (Incorporated by reference to Exhibit 3.1 to the Company’s Current Report on Form 8-K filed on September 8, 2014.) | |
| 4.1 | Form of Indenture. (Incorporated by reference to Exhibit 2(d)(2) of the Company’s registration statement on Form N-2 (File No. 333-201499) filed on January 14, 2015.) | |
| 10.1 | Form of Managing Dealer Agreement by and between the Registrant and CNL Securities Corp. (Incorporated by reference to Exhibit 2(h)(1) filed with Pre-Effective Amendment No. 1 to the Company’s registration statement on Form N-2 (File No. 333-189544) filed on October 16, 2013.) | |
| 10.2 | Form of Participating Broker Agreement. (Incorporated by reference to Exhibit 2(h)(2) filed with Pre-Effective Amendment No. 1 to the Company’s registration statement on Form N-2 (File No. 333-189544) filed on October 16, 2013.) | |
| 10.3 | Amended and Restated Distribution Reinvestment Plan, effective as of November 1, 2016. (Incorporated by reference to Exhibit 4.1 to the Company’s Current Report on Form 8-K filed on October 12, 2016.) | |
| 10.4 | Form of Intellectual Property License Agreement by and between the Registrant and CNL Intellectual Properties, Inc. (Incorporated by reference to Exhibit 2(k)(3) filed with Pre-Effective Amendment No. 2 to the Company’s registration statement on Form N-2 (File No. 333-167730) filed on February 18, 2011.) | |
| 10.5 | Administrative Services Agreement by and between the Registrant and CNL Fund Advisors Company. (Incorporated by reference to Exhibit 2(k)(2) filed with Pre-Effective Amendment No. 3 to the Company’s registration statement on Form N-2 (File No. 333-167730) filed on March 29, 2011.) | |
| 10.6 | Custodian Agreement. (Incorporated by reference to Exhibit 2(j) filed with Pre-Effective Amendment No. 3 to the Company’s registration statement on Form N-2 (File No. 333-167730) filed on March 29, 2011.) | |
| 10.7 | Investment Advisory Agreement by and between the Registrant and CNL Fund Advisors Company. (Incorporated by reference to Exhibit 2(g)(1) filed with Pre-Effective Amendment No. 3 to the Company’s registration statement on Form N-2 (File No. 333-167730) filed on March 29, 2011.) | |
| 10.8 | Sub-Advisory Agreement by and among the Registrant, CNL Fund Advisors Company and KKR Asset Management LLC. (Incorporated by reference to Exhibit 2(g)(2) filed with Pre-Effective Amendment No. 3 to the Company’s registration statement on Form N-2 (File No. 333-167730) filed on March 29, 2011.) | |
| 10.9 | Amended and Restated Escrow Agreement by and among the Registrant, UMB Bank N.A., and CNL Securities Corp. (Incorporated by reference to Exhibit 10.10 to the Company’s Quarterly Report on Form 10-Q filed on August 12, 2011.) | |
66
Table of Contents
| 10.10 | Limited Liability Company Agreement of CCT Funding LLC. (Incorporated by reference to Exhibit 10.13 to the Company’s Quarterly Report on Form 10-Q filed on November 10, 2011.) | |
| 10.11 | Credit Agreement between CCT Funding LLC and Deutsche Bank AG, New York Branch. (Incorporated by reference to Exhibit 10.14 to the Company’s Quarterly Report on Form 10-Q filed on November 10, 2011.) (Confidential portions of this exhibit have been omitted pursuant to a request for confidential treatment and filed separately with the SEC.) | |
| 10.12 | Custodial Agreement among the Registrant, CCT Funding LLC, Deutsche Bank AG, New York Branch and Deutsche Bank Trust Company Americas. (Incorporated by reference to Exhibit 10.15 to the Company’s Quarterly Report on Form 10-Q filed on November 10, 2011.) (Confidential portions of this exhibit have been omitted pursuant to a request for confidential treatment and filed separately with the SEC.) | |
| 10.13 | Asset Contribution Agreement between the Registrant and CCT Funding LLC. (Incorporated by reference to Exhibit 10.16 to the Company’s Quarterly Report on Form 10-Q filed on November 10, 2011.) | |
| 10.14 | Security Agreement between CCT Funding LLC and Deutsche Bank AG, New York Branch. (Incorporated by reference to Exhibit 10.17 to the Company’s Quarterly Report on Form 10-Q filed on November 10, 2011.) | |
| 10.15 | Investment Management Agreement between the Registrant and CCT Funding LLC. (Incorporated by reference to Exhibit 10.18 to the Company’s Quarterly Report on Form 10-Q filed on November 10, 2011.) | |
| 10.16 | First Amendment to Credit Agreement between CCT Funding LLC and Deutsche Bank AG, New York Branch. (Incorporated by reference to Exhibit 10.17 to the Company’s Annual Report on Form 10-K filed on March 16, 2012.) (Confidential portions of this exhibit have been omitted pursuant to a request for confidential treatment and filed separately with the SEC.) | |
| 10.17 | Amended and Restated Expense Support and Conditional Reimbursement Agreement by and among the Registrant, CNL Fund Advisors Company and KKR Asset Management LLC. (Incorporated by reference to Exhibit 10.18 to the Company’s Annual Report on Form 10-K filed on March 16, 2012.) | |
| 10.18 | Amendment No. 1 to Investment Advisory Agreement by and between the Registrant and CNL Fund Advisors Company. (Incorporated by reference to Exhibit 10.19 to the Company’s Annual Report on Form 10-K filed on March 16, 2012.) | |
| 10.19 | Second Amendment to Credit Agreement between CCT Funding LLC and Deutsche Bank AG, New York Branch. (Incorporated by reference to Exhibit 10.1 to the Company’s Current Report on Form 8-K filed on August 24, 2012.) (Confidential portions of this exhibit have been omitted pursuant to a request for confidential treatment and filed separately with the SEC.) | |
| 10.20 | ISDA 2002 Master Agreement, together with the Schedule thereto and Credit Support Annex to such Schedule, each dated as of November 15, 2012, by and between Halifax Funding LLC and The Bank of Nova Scotia. (Incorporated by reference to Exhibit 10.1 to the Company’s Current Report on Form 8-K filed on November 21, 2012.) | |
| 10.21 | Confirmation Letter Agreement, dated as of November 15, 2012, by and between Halifax Funding LLC and The Bank of Nova Scotia. (Incorporated by reference to Exhibit 10.2 to the Company’s Current Report on Form 8-K filed on November 21, 2012.) | |
| 10.22 | Amendment to Amended and Restated Expense Support and Conditional Reimbursement Agreement by and among the Registrant, CNL Fund Advisors Company and KKR Asset Management LLC. (Incorporated by reference to Exhibit 10.1 to the Company’s Current Report on Form 8-K filed on January 7, 2013.) | |
| 10.23 | Third Amendment to Credit Agreement between CCT Funding LLC, the lenders referred to therein and Deutsche Bank AG, New York Branch. (Incorporated by reference to Exhibit 10.1 to the Company’s Current Report on Form 8-K filed on February 14, 2013.) (Confidential portions of this exhibit have been omitted pursuant to a request for confidential treatment and filed separately with the SEC.) | |
67
Table of Contents
| 10.24 | U.S. PB Agreement, dated as of June 4, 2013, by and between the Registrant and BNP Paribas Prime Brokerage, Inc. (Incorporated by reference to Exhibit 10.2 to the Company’s Current Report on Form 8-K filed on June 18, 2013.) | |
| 10.25 | Special Custody and Pledge Agreement, dated as of June 4, 2013, by and between the Registrant, BNP Paribas Prime Brokerage, Inc. and State Street Bank and Trust Company. (Incorporated by reference to Exhibit 10.3 to the Company’s Current Report on Form 8-K filed on June 18, 2013.) | |
| 10.26 | Control Agreement, dated as of July 22, 2013, by and among Halifax Funding LLC, The Bank of Nova Scotia, and State Street Bank and Trust Company (Incorporated by reference to Exhibit 10.1 to the Company’s Current Report on Form 8-K filed on July 26, 2013.) | |
| 10.27 | Amending Agreement, dated as of July 22, 2013, by and among the Registrant, Halifax Funding LLC, The Bank of Nova Scotia, and The Bank of Nova Scotia Trust Company of New York. (Incorporated by reference to Exhibit 10.2 to the Company’s Current Report on Form 8-K filed on July 26, 2013.) | |
| 10.28 | Amended and Restated Committed Facility Agreement, dated as of August 29, 2013, by and between Paris Funding LLC and BNP Paribas Prime Brokerage, Inc. (Incorporated by reference to Exhibit 10.1 to the Company’s Current Report on Form 8-K filed on September 5, 2013.) | |
| 10.29 | Amended and Restated Senior Secured Revolving Credit Agreement, dated as of April 15, 2016, among the Registrant, as borrower, the lenders from time to time party thereto, JPMorgan Chase Bank, N.A., as administrative agent, and ING Capital LLC as syndication agent. (Incorporated by reference to Exhibit 10.1 to the Company’s Current Report on Form 8-K filed on April 18, 2016.) | |
| 10.30 | Guarantee and Security Agreement, dated as of September 4, 2013, and entered into among the Registrant, as borrower, and JPMorgan Chase Bank, N.A., as administrative agent and as collateral agent, and the other parties thereto (Incorporated by reference to Exhibit 10.1 to the Company’s Current Report on Form 8-K filed on September 10, 2013.) | |
| 10.31 | Control Agreement, dated as of September 4, 2013, among the Registrant, as borrower, JPMorgan Chase Bank, N.A., as collateral agent, and State Street Bank and Trust Company, as custodian (Incorporated by reference to Exhibit 10.1 to the Company’s Current Report on Form 8-K filed on September 10, 2013.) | |
| 10.32 | Amending Agreement, dated as of November 12, 2013, by and between Halifax Funding LLC and The Bank of Nova Scotia. (Incorporated by reference to Exhibit 10.32 to the Company’s Quarterly Report on Form 10-Q filed on November 14, 2013.) | |
| 10.33 | Fourth Amendment to Credit Agreement between CCT Funding LLC, the lenders referred to therein and Deutsche Bank AG, New York Branch. (Incorporated by reference to Exhibit 10.26 to the Company’s Current Report on Form 8-K filed on January 31, 2014.) (Confidential portions of this exhibit have been omitted pursuant to a request for confidential treatment and filed separately with the SEC.) | |
| 10.34 | Commitment Increase Agreement, dated as of March 31, 2014, among the Registrant, the lenders from time to time party thereto and JPMorgan Chase Bank, N.A., as administrative agent and issuing bank. (Incorporated by reference to Exhibit 10.1 to the Company’s Current Report on Form 8-K filed on April 10, 2014.) | |
| 10.35 | Selected Dealer Agreement among the Registrant, CNL Securities Corp., CNL Fund Advisors Company, CNL Financial Group, LLC, KKR Asset Management LLC and Ameriprise Financial Services, Inc. (Incorporated by reference to Exhibit 10.34 to the Company’s Annual Report on Form 10-K filed on March 20, 2014.) (Confidential portions of this exhibit have been omitted pursuant to a request for confidential treatment and filed separately with the SEC.) | |
| 10.36 | Omnibus Amendment to the Senior Secured Term Loan Agreement, dated as of May 19, 2014, among the Registrant, as borrower, the subsidiary guarantor party thereto, the lenders party thereto and JPMorgan Chase Bank, N.A., as administrative agent and collateral agent. (Incorporated by reference to Exhibit 10.1 to the Company’s Current Report on Form 8-K filed on May 22, 2014.) | |
| 10.37 | Senior Secured Term Loan Agreement, dated as of May 20, 2014, among the Registrant, as borrower, the lenders from time to time party thereto and JPMorgan Chase Bank, N.A., as administrative agent. (Incorporated by reference to Exhibit 10.2 to the Company’s Current Report on Form 8-K filed on May 22, 2014.) | |
68
Table of Contents
| 10.38 | First Amendment Agreement, dated as of November 6, 2014, to the Amended and Restated Committed Facility Agreement dated August 29, 2013, between BNP Paribas Prime Brokerage, Inc. and Paris Funding LLC. (Incorporated by reference to Exhibit 10.38 to the Company’s Quarterly Report on Form 10-Q filed on November 13, 2014.) | |
| 10.39 | Commitment Increase Agreement, dated as of November 24, 2014, by and among the Registrant, the lenders party thereto and JPMorgan Chase Bank, N.A., as administrative agent and issuing bank. (Incorporated by reference to Exhibit 10.1 to the Company’s Current Report on Form 8-K filed on November 25, 2014.) | |
| 10.40 | Fifth Amendment to Credit Agreement between CCT Funding LLC, the lenders referred to therein and Deutsche Bank AG, New York Branch, as administrative agent. (Incorporated by reference to Exhibit 10.39 to the Company’s Current Report on Form 8-K filed on January 9, 2015.) | |
| 10.41 | Sixth Amendment to Credit Agreement, dated September 11, 2015, by and among CCT Funding LLC, Deutsche Bank AG, New York Branch, as administrative agent, and the lenders party thereto. (Incorporated by reference to Exhibit 10.1 to the Company’s Current Report on Form 8-K filed on September 16, 2015.) | |
| 10.42 | Loan and Servicing Agreement, dated as of December 2, 2015, among CCT Tokyo Funding LLC, Corporate Capital Trust, Inc. and Sumitomo Mitsui Banking Corporation. (Incorporated by reference to Exhibit 10.42 to the Company’s Annual Report on Form 10-K filed on March 21, 2016.) | |
| 10.43 | Custody Agreement, dated as of December 2, 2015, among CCT Tokyo Funding LLC, Corporate Capital Trust, Inc., Sumitomo Mitsui Banking Corporation and Wells Fargo Bank, National Association. (Incorporated by reference to Exhibit 10.43 to the Company’s Annual Report on Form 10-K filed on March 21, 2016.) | |
| 10.44 | Securities Account Control Agreement, dated as of December 2, 2015, among CCT Tokyo Funding LLC, Corporate Capital Trust, Inc., Sumitomo Mitsui Banking Corporation and Wells Fargo Bank, National Association. (Incorporated by reference to Exhibit 10.44 to the Company’s Annual Report on Form 10-K filed on March 21, 2016.) | |
| 10.45 | Loan and Security Agreement, dated as of November 29, 2016, among CCT SE I LLC, as borrower, JPMorgan Chase Bank, National Association, as administrative agent, the Registrant, as portfolio manager, the lenders party thereto and the collateral agent, collateral administrator and intermediary party thereto. (Incorporated by reference to Exhibit 10.1 to the Company’s Current Report on Form 8-K filed on December 2, 2016.) | |
| 14.1 | Amended and Restated Code of Ethics of the Registrant. (Incorporated by reference to Exhibit 14.1 to the Company’s Annual Report on Form 10-K filed on March 16, 2012.) | |
| 21.1 | Subsidiaries of the Registrant (Filed herewith.) | |
| 31.1 | Certification of Chief Executive Officer of Corporate Capital Trust, Inc., Pursuant to Rule 13a-14(a), as Adopted Pursuant to Section 302 of the Sarbanes-Oxley Act of 2002. (Filed herewith.) | |
| 31.2 | Certification of Chief Financial Officer of Corporate Capital Trust, Inc., Pursuant to Rule 13a-14(a), as Adopted Pursuant to Section 302 of the Sarbanes-Oxley Act of 2002. (Filed herewith.) | |
| 32.1 | Certification of Chief Executive Officer and Chief Financial Officer of Corporate Capital Trust, Inc., Pursuant to 18 U.S.C. Section 1350, as Adopted Pursuant to Section 906 of the Sarbanes-Oxley Act of 2002. (Filed herewith.) | |
| Item 16. | Form 10-K Summary |
None.
69
Table of Contents
Pursuant to the requirements of Section 13 or 15(d) of the Securities Exchange Act of 1934, the registrant has duly caused this report to be signed on its behalf by the undersigned, thereunto duly authorized, on the 17th day of March 2017.
| CORPORATE CAPITAL TRUST, INC. | ||
| By: | /s/ Thomas K. Sittema | |
| THOMAS K. SITTEMA | ||
| Chief Executive Officer | ||
| (Principal Executive Officer) | ||
| By: | /s/ Chirag J. Bhavsar | |
| CHIRAG J. BHAVSAR | ||
| Chief Financial Officer | ||
| (Principal Financial and Accounting Officer) | ||
Pursuant to the requirements of the Securities Exchange Act of 1934, this report has been signed below by the following persons on behalf of the Registrant and in the capacities and on the dates indicated.
| Signature |
Title |
Date | ||
| /s/ Thomas K. Sittema Thomas K. Sittema |
Director, Chairman of the Board and Chief Executive Officer (Principal Executive Officer) |
March 17, 2017 | ||
| /s/ Erik A. Falk Erik A. Falk |
Director |
March 17, 2017 | ||
| /s/ Frederick Arnold Frederick Arnold |
Independent Director |
March 17, 2017 | ||
| /s/ James H. Kropp James H. Kropp |
Independent Director |
March 17, 2017 | ||
| /s/ Kenneth C. Wright Kenneth C. Wright |
Independent Director |
March 17, 2017 | ||
| /s/ Chirag J. Bhavsar Chirag J. Bhavsar |
Chief Financial Officer (Principal Financial and Accounting Officer) |
March 17, 2017 | ||
70
Table of Contents
REPORT OF INDEPENDENT REGISTERED PUBLIC ACCOUNTING FIRM
To the Board of Directors and Shareholders of
Corporate Capital Trust, Inc.:
Orlando, Florida
We have audited the accompanying consolidated statements of assets and liabilities of Corporate Capital Trust, Inc. and subsidiaries (the “Company”), including the consolidated schedules of investments, as of December 31, 2016 and 2015, and the related consolidated statements of operations, changes in net assets, and cash flows for each of the three years in the period ended December 31, 2016 and the consolidated financial highlights for each of the five years in the period ended December 31, 2016. These financial statements and financial highlights are the responsibility of the Company’s management. Our responsibility is to express an opinion on these financial statements and financial highlights based on our audits.
We conducted our audits in accordance with the standards of the Public Company Accounting Oversight Board (United States). Those standards require that we plan and perform the audit to obtain reasonable assurance about whether the financial statements and financial highlights are free of material misstatement. The Company is not required to have, nor were we engaged to perform, an audit of its internal control over financial reporting. Our audits included consideration of internal control over financial reporting as a basis for designing audit procedures that are appropriate in the circumstances, but not for the purpose of expressing an opinion on the effectiveness of the Company’s internal control over financial reporting. Accordingly, we express no such opinion. An audit also includes examining, on a test basis, evidence supporting the amounts and disclosures in the financial statements, assessing the accounting principles used and significant estimates made by management, as well as evaluating the overall financial statement presentation. Our procedures included confirmation of securities owned as of December 31, 2016 and 2015, by correspondence with the custodians, or loan agents; where replies were not received we performed other auditing procedures. We believe that our audits provide a reasonable basis for our opinion.
In our opinion, such consolidated financial statements and consolidated financial highlights referred to above present fairly, in all material respects, the financial position of Corporate Capital Trust, Inc. and subsidiaries as of December 31, 2016 and 2015, and the results of their operations, changes in their net assets, and their cash flows for each of the three years in the period ended December 31, 2016 and the financial highlights for each of the five years in the period ended December 31, 2016, in conformity with accounting principles generally accepted in the United States of America.
/s/ Deloitte & Touche LLP
San Francisco, CA
March 17, 2017
F-1
Table of Contents
Corporate Capital Trust, Inc. and Subsidiaries
Consolidated Statements of Assets and Liabilities
(in thousands, except share and per share amounts)
| December 31, | ||||||||
| 2016 | 2015 | |||||||
| Assets |
||||||||
| Investments at fair value: |
||||||||
| Non-controlled, non-affiliated investments (amortized cost of $3,797,345 and $3,643,035 respectively) - including $345,774 and $315,881, respectively, of investments pledged to creditors (Note 10) |
$ | 3,622,442 | $ | 3,422,335 | ||||
| Non-controlled, affiliated investments (amortized cost of $187,703 and $302,648, respectively) |
142,855 | 219,099 | ||||||
| Controlled, affiliated investments (amortized cost of $341,875 and $83,419, respectively) |
259,996 | 87,898 | ||||||
|
|
|
|
|
|||||
|
Total investments, at fair value (amortized cost of $4,326,923 and $4,029,102, respectively) |
4,025,293 | 3,729,332 | ||||||
| Cash |
127,031 | 54,016 | ||||||
| Cash denominated in foreign currency (cost of $5,314 and $15,171, respectively) |
5,229 | 15,188 | ||||||
| Restricted cash |
14,353 | — | ||||||
| Collateral on deposit with custodian |
95,000 | 142,640 | ||||||
| Dividends and interest receivable |
53,484 | 46,533 | ||||||
| Receivable for investments sold |
49,324 | 25,587 | ||||||
| Principal receivable |
2,942 | 2,234 | ||||||
| Unrealized appreciation on derivative instruments |
42,511 | 16,526 | ||||||
| Receivable from advisors |
2,040 | 181 | ||||||
| Deferred offering expense |
402 | 1,608 | ||||||
| Prepaid and other deferred expenses |
13,087 | 7,345 | ||||||
|
|
|
|
|
|||||
| Total assets |
4,430,696 | 4,041,190 | ||||||
|
|
|
|
|
|||||
| Liabilities |
| |||||||
| Revolving credit facilities |
1,219,000 | 1,030,980 | ||||||
| Term loan payable, net |
385,203 | 387,677 | ||||||
| Repurchase agreement payable |
23,454 | — | ||||||
| Payable for investments purchased |
22,205 | — | ||||||
| Unrealized depreciation on derivative instruments |
251 | 14,407 | ||||||
| Accrued performance-based incentive fees |
4,905 | 749 | ||||||
| Accrued investment advisory fees |
7,332 | 6,748 | ||||||
| Accrued directors’ fees |
— | 12 | ||||||
| Deferred tax liability |
1,991 | — | ||||||
| Other accrued expenses and liabilities |
7,023 | 6,595 | ||||||
|
|
|
|
|
|||||
| Total liabilities |
1,671,364 | 1,447,168 | ||||||
| Commitments and contingencies (Note 11) |
||||||||
|
|
|
|
|
|||||
| Net Assets |
$ | 2,759,332 | $ | 2,594,022 | ||||
|
|
|
|
|
|||||
| Components of Net Assets |
||||||||
| Common stock, $0.001 par value per share, 1,000,000,000 shares authorized, 309,041,547 and 290,430,338 shares issued and outstanding at December 31, 2016 and 2015, respectively |
$ | 309 | $ | 290 | ||||
| Paid-in capital in excess of par value |
3,012,062 | 2,850,563 | ||||||
| Undistributed net investment income |
39,566 | 67,248 | ||||||
| Accumulated net realized losses |
(32,331 | ) | (28,141 | ) | ||||
| Accumulated net unrealized depreciation on investments, derivative instruments and |
(260,274 | ) | (295,938 | ) | ||||
|
|
|
|
|
|||||
| Net assets |
$ | 2,759,332 | $ | 2,594,022 | ||||
|
|
|
|
|
|||||
| Net asset value per share |
$ | 8.93 | $ | 8.93 | ||||
|
|
|
|
|
|||||
See notes to consolidated financial statements.
F-2
Table of Contents
Corporate Capital Trust, Inc. and Subsidiaries
Consolidated Statements of Operations
(in thousands, except share and per share amounts)
| Year Ended December 31, | ||||||||||||
| 2016 | 2015 | 2014 | ||||||||||
| Investment income |
||||||||||||
| Interest income: |
||||||||||||
| Non-controlled, non-affiliated investments (net of tax withholding, $1,257, $479, and $-, respectively) |
$ | 337,850 | $ | 248,362 | $ | 179,059 | ||||||
| Non-controlled, affiliated investments |
— | 2,237 | 913 | |||||||||
|
|
|
|
|
|
|
|||||||
| Total interest income |
337,850 | 250,599 | 179,972 | |||||||||
|
|
|
|
|
|
|
|||||||
| Payment-in-kind interest income: |
||||||||||||
| Non-controlled, non-affiliated investments |
6,692 | 16,853 | 22,743 | |||||||||
| Non-controlled, affiliated investments |
12,798 | 13,549 | 12,298 | |||||||||
|
|
|
|
|
|
|
|||||||
| Total payment-in-kind interest income |
19,490 | 30,402 | 35,041 | |||||||||
|
|
|
|
|
|
|
|||||||
| Fee income: |
||||||||||||
| Non-controlled, non-affiliated investments |
13,582 | 18,305 | 6,438 | |||||||||
| Non-controlled, affiliated investments |
— | — | 592 | |||||||||
|
|
|
|
|
|
|
|||||||
| Total fee income |
13,582 | 18,305 | 7,030 | |||||||||
|
|
|
|
|
|
|
|||||||
| Dividend and other income: |
||||||||||||
| Non-controlled, non-affiliated investments |
7,659 | 340 | 5,515 | |||||||||
| Non-controlled, affiliated investments |
1,810 | 1,505 | 3,154 | |||||||||
| Controlled, affiliated investments |
6,077 | 9,946 | — | |||||||||
|
|
|
|
|
|
|
|||||||
| Total dividend and other income |
15,546 | 11,791 | 8,669 | |||||||||
|
|
|
|
|
|
|
|||||||
| Total investment income |
386,468 | 311,097 | 230,712 | |||||||||
|
|
|
|
|
|
|
|||||||
| Operating expenses |
||||||||||||
| Investment advisory fees |
82,736 | 70,298 | 48,903 | |||||||||
| Interest expense |
51,519 | 36,311 | 25,518 | |||||||||
| Performance-based incentive fees |
24,123 | 8,733 | 8,229 | |||||||||
| Offering expenses |
2,285 | 4,481 | 6,833 | |||||||||
| Administrative services |
3,446 | 2,728 | 2,997 | |||||||||
| Professional services |
2,876 | 2,913 | 2,016 | |||||||||
| Custodian and accounting fees |
1,569 | 1,309 | 883 | |||||||||
| Director fees and expenses |
495 | 569 | 560 | |||||||||
| Other |
4,012 | 4,101 | 3,255 | |||||||||
|
|
|
|
|
|
|
|||||||
| Total operating expenses |
173,061 | 131,443 | 99,194 | |||||||||
|
|
|
|
|
|
|
|||||||
| Net investment income before taxes |
213,407 | 179,654 | 131,518 | |||||||||
| Income tax expense, including excise tax |
3,311 | 2,966 | 1,392 | |||||||||
|
|
|
|
|
|
|
|||||||
| Net investment income |
210,096 | 176,688 | 130,126 | |||||||||
|
|
|
|
|
|
|
|||||||
| Net realized and unrealized gains (losses) |
||||||||||||
| Net realized gains (losses) on: |
||||||||||||
| Non-controlled, non-affiliated investments |
(22,721 | ) | (29,310 | ) | 17,594 | |||||||
| Non-controlled, affiliated investments |
(4,827 | ) | — | — | ||||||||
| Derivative instruments |
24,306 | 83,550 | 7,354 | |||||||||
| Foreign currency transactions |
597 | (3,583 | ) | (5,951 | ) | |||||||
|
|
|
|
|
|
|
|||||||
| Net realized gains (losses) |
(2,645 | ) | 50,657 | 18,997 | ||||||||
|
|
|
|
|
|
|
|||||||
| Net change in unrealized appreciation (depreciation) on: |
||||||||||||
| Non-controlled, non-affiliated investments |
45,797 | (164,032 | ) | (93,929 | ) | |||||||
| Non-controlled, affiliated investments |
38,701 | (72,896 | ) | (10,660 | ) | |||||||
| Controlled, affiliated investments |
(86,358 | ) | 4,479 | — | ||||||||
| Derivative instruments |
40,141 | (34,881 | ) | 38,320 | ||||||||
| Foreign currency translation |
(551 | ) | 1,778 | 1,463 | ||||||||
| Provision for taxes |
(2,066 | ) | — | — | ||||||||
|
|
|
|
|
|
|
|||||||
| Net change in unrealized appreciation (depreciation) |
35,664 | (265,552 | ) | (64,806 | ) | |||||||
|
|
|
|
|
|
|
|||||||
| Net realized and unrealized gains (losses) |
33,019 | (214,895 | ) | (45,809 | ) | |||||||
|
|
|
|
|
|
|
|||||||
| Net increase (decrease) in net assets resulting from operations |
$ | 243,115 | $ | (38,207 | ) | $ | 84,317 | |||||
|
|
|
|
|
|
|
|||||||
| Net investment income per share |
$ | 0.69 | $ | 0.69 | $ | 0.73 | ||||||
|
|
|
|
|
|
|
|||||||
| Diluted and basic earnings per share |
$ | 0.80 | $ | (0.15 | ) | $ | 0.48 | |||||
|
|
|
|
|
|
|
|||||||
| Weighted average number of shares of common stock outstanding (basic and diluted) |
304,493,054 | 254,845,972 | 177,394,267 | |||||||||
|
|
|
|
|
|
|
|||||||
| Distributions declared per share |
$ | 0.80 | $ | 0.80 | $ | 0.80 | ||||||
|
|
|
|
|
|
|
|||||||
See notes to consolidated financial statements.
F-3
Table of Contents
Corporate Capital Trust, Inc. and Subsidiaries
Consolidated Statements of Changes in Net Assets
(in thousands, except share amounts)
| Year Ended December 31, | ||||||||||||
| 2016 | 2015 | 2014 | ||||||||||
| Operations |
| |||||||||||
| Net investment income |
$ | 210,096 | $ | 176,688 | $ | 130,126 | ||||||
| Net realized gains (losses) on investments, derivative instruments and foreign currency transactions |
(2,645 | ) | 50,657 | 18,997 | ||||||||
| Net change in unrealized appreciation (depreciation) on investments, derivative instruments and foreign currency translation |
35,664 | (265,552 | ) | (64,806 | ) | |||||||
|
|
|
|
|
|
|
|||||||
| Net increase in net assets resulting from operations |
243,115 | (38,207 | ) | 84,317 | ||||||||
|
|
|
|
|
|
|
|||||||
| Distributions to shareholders from |
| |||||||||||
| Net investment income |
(210,096 | ) | (176,688 | ) | (130,126 | ) | ||||||
| Net realized gains |
— | (28,356 | ) | (11,892 | ) | |||||||
| Distributions in excess of net investment income (Note 8) |
(34,854 | ) | — | — | ||||||||
|
|
|
|
|
|
|
|||||||
| Net decrease in net assets resulting from shareholders’ distributions |
(244,950 | ) | (205,044 | ) | (142,018 | ) | ||||||
|
|
|
|
|
|
|
|||||||
| Capital share transactions |
| |||||||||||
| Issuance of shares of common stock |
127,596 | 618,505 | 709,070 | |||||||||
| Reinvestment of shareholders’ distributions |
124,139 | 105,363 | 80,646 | |||||||||
| Repurchase of shares of common stock |
(84,590 | ) | (32,416 | ) | (16,628 | ) | ||||||
|
|
|
|
|
|
|
|||||||
| Net increase in net assets resulting from capital share transactions |
167,145 | 691,452 | 773,088 | |||||||||
|
|
|
|
|
|
|
|||||||
| Total increase in net assets |
165,310 | 448,201 | 715,387 | |||||||||
| Net assets at beginning of year |
2,594,022 | 2,145,821 | 1,430,434 | |||||||||
|
|
|
|
|
|
|
|||||||
| Net assets at end of year |
$ | 2,759,332 | $ | 2,594,022 | $ | 2,145,821 | ||||||
|
|
|
|
|
|
|
|||||||
| Capital share activity |
| |||||||||||
| Shares issued from subscriptions |
14,323,113 | 63,742,355 | 69,802,396 | |||||||||
| Shares issued from reinvestment of distributions |
13,858,168 | 10,950,275 | 7,952,695 | |||||||||
| Shares repurchased |
(9,570,072 | ) | (3,394,021 | ) | (1,647,464 | ) | ||||||
|
|
|
|
|
|
|
|||||||
| Net increase in shares outstanding |
18,611,209 | 71,298,609 | 76,107,627 | |||||||||
|
|
|
|
|
|
|
|||||||
| Undistributed net investment income at end of year |
39,354 | 67,248 | 9,099 | |||||||||
|
|
|
|
|
|
|
|||||||
See notes to consolidated financial statements.
F-4
Table of Contents
Corporate Capital Trust, Inc. and Subsidiaries
Consolidated Statements of Cash Flows
(in thousands)
| Year Ended December 31, | ||||||||||||
| 2016 | 2015 | 2014 | ||||||||||
| Operating Activities: |
|
|||||||||||
| Net increase (decrease) in net assets resulting from operations |
$ | 243,115 | $ | (38,207 | ) | $ | 84,317 | |||||
| Adjustments to reconcile net increase (decrease) in net assets resulting from operations to net cash used in operating activities: |
||||||||||||
| Purchases of investments |
(1,669,095 | ) | (2,068,738 | ) | (1,899,447 | ) | ||||||
| Increase (decrease) in payable for investments purchased |
22,204 | (34,888 | ) | (66,149 | ) | |||||||
| Payment-in-kind interest capitalized |
(21,195 | ) | (29,730 | ) | (35,041 | ) | ||||||
| Proceeds from sales of investments |
614,546 | 303,077 | 500,294 | |||||||||
| Proceeds from principal payments |
763,474 | 539,295 | 557,927 | |||||||||
| Net realized loss (gain) on investments |
27,548 | 29,310 | (17,594 | ) | ||||||||
| Net change in unrealized depreciation on investments |
1,860 | 232,449 | 104,589 | |||||||||
| Net change in unrealized (appreciation) depreciation on derivative instruments |
(40,141 | ) | 34,881 | (38,320 | ) | |||||||
| Net change in unrealized (appreciation) depreciation on foreign currency translation |
551 | (1,778 | ) | (1,463 | ) | |||||||
| Amortization of premium/discount, net |
(20,164 | ) | (7,353 | ) | (6,430 | ) | ||||||
| Amortization of deferred financing costs |
4,150 | 3,233 | 2,934 | |||||||||
| Accretion of discount on term loan payable |
398 | 384 | 228 | |||||||||
| Decrease (increase) in short-term investments, net |
7,065 | (6,442 | ) | 149,274 | ||||||||
| Decrease (increase) in collateral on deposit with custodian |
47,640 | (26,940 | ) | (78,199 | ) | |||||||
| Increase in dividends and interest receivable |
(6,953 | ) | (13,973 | ) | (6,987 | ) | ||||||
| Decrease (increase) in receivable for investments sold |
(23,678 | ) | (25,693 | ) | 46,453 | |||||||
| Increase in principal receivable |
(708 | ) | (814 | ) | (625 | ) | ||||||
| Increase in receivable from advisors |
(1,859 | ) | (181 | ) | — | |||||||
| Decrease in other assets |
1,524 | 421 | 283 | |||||||||
| Increase in accrued investment advisory fees |
584 | 1,784 | 1,139 | |||||||||
| Increase (decrease) in accrued performance-based incentive fees |
4,156 | (4,359 | ) | (11,305 | ) | |||||||
| Increase in deferred tax liability |
2,066 | — | — | |||||||||
| Increase in other accrued expenses and liabilities |
416 | 2,249 | 96 | |||||||||
|
|
|
|
|
|
|
|||||||
| Net cash used in operating activities |
(42,496 | ) | (1,112,013 | ) | (714,026 | ) | ||||||
|
|
|
|
|
|
|
|||||||
| Financing Activities: |
||||||||||||
| Proceeds from issuance of shares of common stock |
127,596 | 618,505 | 709,070 | |||||||||
| Payments on repurchases of shares of common stock |
(84,590 | ) | (32,416 | ) | (16,628 | ) | ||||||
| Distributions paid |
(120,811 | ) | (99,681 | ) | (76,295 | ) | ||||||
| Borrowings under term loan payable |
— | — | 398,000 | |||||||||
| Repayments under term loan payable |
(4,000 | ) | (4,000 | ) | (3,000 | ) | ||||||
| Borrowings under revolving credit facilities |
1,125,000 | 1,114,792 | 692,000 | |||||||||
| Repayments of revolving credit facilities |
(938,792 | ) | (459,450 | ) | (1,020,331 | ) | ||||||
| Borrowings under repurchase agreement |
24,726 | — | — | |||||||||
| Deferred financing costs paid |
(9,122 | ) | (3,556 | ) | (7,989 | ) | ||||||
|
|
|
|
|
|
|
|||||||
| Net cash provided by financing activities |
120,007 | 1,134,194 | 674,827 | |||||||||
|
|
|
|
|
|
|
|||||||
| Effect of exchange rate changes on cash |
(102 | ) | 46 | (29 | ) | |||||||
|
|
|
|
|
|
|
|||||||
| Net increase (decrease) in cash |
77,409 | 22,227 | (39,228 | ) | ||||||||
| Cash and cash denominated in foreign currency, beginning of year |
69,204 | 46,977 | 86,205 | |||||||||
|
|
|
|
|
|
|
|||||||
| Cash and cash denominated in foreign currency, end of year |
$ | 146,613 | $ | 69,204 | $ | 46,977 | ||||||
|
|
|
|
|
|
|
|||||||
| Supplemental disclosure of cash flow information and non-cash financing activities: |
||||||||||||
| Cash paid for interest |
$ | 47,011 | $ | 32,041 | $ | 22,839 | ||||||
|
|
|
|
|
|
|
|||||||
| Taxes paid, including excise tax |
$ | 2,844 | $ | 2,047 | $ | — | ||||||
|
|
|
|
|
|
|
|||||||
| Deferred financing costs accrued in other expenses and liabilities |
$ | — | $ | — | $ | 255 | ||||||
|
|
|
|
|
|
|
|||||||
| Distributions reinvested |
$ | 124,139 | $ | 105,363 | $ | 80,646 | ||||||
|
|
|
|
|
|
|
|||||||
See notes to consolidated financial statements.
F-5
Table of Contents
Corporate Capital Trust, Inc. and Subsidiaries
Consolidated Schedule of Investments
As of December 31, 2016
(in thousands, except share amounts)
Company (a)(b) |
Footnotes |
Industry |
Interest Rate |
Base Rate Floor |
Maturity Date (c) |
No. Shares/ Principal Amount (d) |
Cost (e) |
Fair Value |
||||||||||||||||||||
| Senior Secured Loans - First Lien—56.1% |
|
|||||||||||||||||||||||||||
| A10 Capital, LLC |
(f)(g)(3) | Real Estate | L + 700 | 1.00 | % | 10/15/2021 | $ | 27,659 | $ | 27,339 | $ | 27,936 | ||||||||||||||||
| Abaco Systems, Inc. |
(f)(h)(2) | Capital Goods | L + 600 | 1.00 | % | 12/7/2021 | 65,678 | 63,136 | 64,364 | |||||||||||||||||||
| ABILITY Network, Inc. |
(2) | Health Care Equipment & Services | L + 500 | 1.00 | % | 5/14/2021 | 634 | 625 | 637 | |||||||||||||||||||
| Accuride Corp. |
(2) | Capital Goods | L + 700 | 1.00 | % | 11/3/2023 | 11,004 | 10,676 | 10,784 | |||||||||||||||||||
| Agro Merchants NAI Holdings, LLC |
(f)(h)(2) | Transportation | L + 700 | 1.00 | % | 10/1/2020 | 73,448 | 72,814 | 72,826 | |||||||||||||||||||
| Algeco/Scotsman (LUX) |
(f)(g)(i)(j)(k) | Consumer Durables & Apparel | |
15.75% PIK (15.75% Max PIK) |
|
5/1/2018 | 41,958 | 32,642 | 8,024 | |||||||||||||||||||
| AltEn, LLC |
(f)(j)(k)(l)(3) | Energy | |
L + 900 (L + 900 Max PIK) |
|
9/12/2018 | 36,567 | 29,836 | 8,733 | |||||||||||||||||||
| AM General LLC |
(f)(h)(2) | Automobiles & Components | L + 725 | 1.00 | % | 12/28/2021 | 97,338 | 95,880 | 95,878 | |||||||||||||||||||
| American Freight, Inc. |
(f)(2) | Retailing | L + 625 | 1.00 | % | 10/31/2020 | 32,036 | 31,925 | 32,036 | |||||||||||||||||||
| Amtek Global Technology Pte. Ltd. (SGP) |
(f)(g)(i)(5)(EUR) | Automobiles & Components | E + 900 | 1.00 | % | 11/10/2019 | € | 7,633 | 8,338 | 7,876 | ||||||||||||||||||
| (f)(g)(i)(5)(EUR) | E + 900 | 1.00 | % | 11/10/2019 | 56,564 | 57,986 | 58,366 | |||||||||||||||||||||
| (f)(g)(i)(5)(EUR) | E + 900 | 1.00 | % | 11/10/2019 | 58,055 | 59,514 | 59,905 | |||||||||||||||||||||
| (f)(g)(i)(5)(EUR) | E + 900 | 1.00 | % | 11/10/2019 | 8,078 | 8,281 | 8,336 | |||||||||||||||||||||
See notes to consolidated financial statements.
F-6
Table of Contents
Corporate Capital Trust, Inc. and Subsidiaries
Consolidated Schedule of Investments (continued)
As of December 31, 2016
(in thousands, except share amounts)
Company (a)(b) |
Footnotes |
Industry |
Interest Rate |
Base Rate Floor |
Maturity Date (c) |
No. Shares/ Principal Amount (d) |
Cost (e) |
Fair Value |
||||||||||||||||||||
| BeyondTrust Software, Inc. |
(f)(2) | Software & Services | L + 700 | 1.00% | 9/25/2019 | $ | 11,926 | $ | 11,841 | $ | 11,548 | |||||||||||||||||
|
Casual Dining BidCo, Ltd. (GBR) |
(f)(g)(i)(2)(GBP) | Consumer Services | L + 825 | 12/11/2020 | £ | 40,546 | 60,338 | 49,635 | ||||||||||||||||||||
| Centric Group, LLC |
(f)(7) | Retailing | P + 575 | 10/14/2021 | $ | 652 | 526 | 127 | ||||||||||||||||||||
| (f)(3) | L + 675 | 1.00% | 10/14/2022 | 75,000 | 73,540 | 74,691 | ||||||||||||||||||||||
| Charlotte Russe, Inc. |
(2) | Retailing | L + 550 | 1.25% | 5/22/2019 | 4,478 | 4,463 | 2,723 | ||||||||||||||||||||
| (2) | L + 550 | 1.25% | 5/22/2019 | 18,291 | 18,190 | 11,123 | ||||||||||||||||||||||
| Dentix (SPN) |
(f)(g)(i)(5)(EUR) | Health Care Equipment & Services | E + 825 | 12/14/2021 | € | 21,000 | 21,161 | 21,159 | ||||||||||||||||||||
| Distribution International, Inc. |
(2) | Retailing | L + 500 | 1.00% | 12/15/2021 | $ | 4,148 | 3,494 | 3,588 | |||||||||||||||||||
| EagleView Technology Corp. |
(2) | Software & Services | L + 425 | 1.00% | 7/15/2022 | 6,913 | 6,856 | 6,941 | ||||||||||||||||||||
| FleetPride Corp. |
(2) | Capital Goods | L + 400 | 1.25% | 11/19/2019 | 888 | 786 | 844 | ||||||||||||||||||||
| Greystone & Co., Inc. |
(f)(2) | Diversified Financials | L + 800 | 1.00% | 3/26/2021 | 33,080 | 32,685 | 32,746 | ||||||||||||||||||||
| Gymboree Corp. |
(2) | Retailing | L + 350 | 1.50% | 2/23/2018 | 10 | 8 | 5 | ||||||||||||||||||||
| Imagine! Print Solutions, Inc. |
(f)(2) | Media | L + 625 | 1.00% | 3/31/2023 | 14,888 | 14,345 | 14,888 | ||||||||||||||||||||
| iPayment, Inc. |
(2) | Software & Services | L + 525 | 1.50% | 5/8/2017 | 11,885 | 11,871 | 11,469 | ||||||||||||||||||||
| Jacuzzi Brands, Inc. |
(f)(2) | Capital Goods | L + 650 | 1.25% | 7/3/2019 | 16,132 | 15,970 | 15,909 | ||||||||||||||||||||
| (f)(2) | L + 650 | 1.25% | 7/3/2019 | 15,000 | 14,700 | 14,792 | ||||||||||||||||||||||
See notes to consolidated financial statements.
F-7
Table of Contents
Corporate Capital Trust, Inc. and Subsidiaries
Consolidated Schedule of Investments (continued)
As of December 31, 2016
(in thousands, except share amounts)
Company (a)(b) |
Footnotes |
Industry |
Interest Rate |
Base Rate Floor |
Maturity Date (c) |
No. Shares/ Principal Amount (d) |
Cost (e) |
Fair Value |
||||||||||||||||||||
| Jacuzzi Brands, Inc. (LUX) |
(f)(i)(2) | Capital Goods | L + 650 | 1.25 | % | 7/3/2019 | $ | 20,118 | $ | 19,916 | $ | 19,840 | ||||||||||||||||
| JHT Holdings, Inc. |
(f)(h)(2) | Capital Goods | L + 850 | 1.00 | % | 5/4/2022 | 36,025 | 35,366 | 36,613 | |||||||||||||||||||
| KeyPoint Government Solutions, Inc. |
(f)(2) | Capital Goods | L + 650 | 1.25 | % | 11/13/2017 | 27,902 | 27,774 | 27,902 | |||||||||||||||||||
|
Keystone Australia Holdings, Pty. Ltd. (AUS) |
(f)(g)(i)(k)(m)(AUD) | Consumer Services | 15.00% | 8/7/2019 | A$ | 31,021 | 27,501 | 11,813 | ||||||||||||||||||||
| Koosharem, LLC |
(h)(2) | Commercial & Professional Services | L + 650 | 1.00 | % | 5/15/2020 | $ | 19,006 | 18,882 | 17,224 | ||||||||||||||||||
| Marshall Retail Group, LLC |
(f)(2) | Retailing | L + 600 | 1.00 | % | 8/25/2020 | 16,468 | 16,354 | 14,825 | |||||||||||||||||||
| MCS AMS Sub-Holdings, LLC |
(h)(2) | Commercial & Professional Services | L + 650 | 1.00 | % | 10/15/2019 | 24,994 | 24,557 | 23,369 | |||||||||||||||||||
| NEP Group, Inc. |
(2) | Media | L + 325 | 1.00 | % | 1/22/2020 | 497 | 490 | 501 | |||||||||||||||||||
| New Enterprise Stone & Lime Co., Inc. |
(f)(h)(2) | Capital Goods | L + 850 | 1.00 | % | 3/19/2021 | 102,461 | 101,519 | 104,833 | |||||||||||||||||||
| (f)(h)(2) | L + 850 | 1.00 | % | 3/19/2021 | 51,745 | 51,269 | 52,943 | |||||||||||||||||||||
| Nine West Holdings, Inc. |
(2) | Consumer Durables & Apparel | L + 375 | 1.00 | % | 10/8/2019 | 13,281 | 13,110 | 8,325 | |||||||||||||||||||
| NMI Holdings, Inc. |
(f)(g)(2) | Insurance | L + 750 | 1.00 | % | 11/15/2018 | 37,431 | 37,071 | 37,398 | |||||||||||||||||||
| P & L Development, LLC |
(f)(h)(j)(3) | Pharmaceuticals, Biotechnology & Life Sciences | |
L + 750, 1.00% PIK (1.00% Max PIK) |
|
|
1.00 |
% |
5/1/2020 | 56,312 | 55,918 | 56,892 | ||||||||||||||||
| Pacific Union Financial, LLC |
(f)(3) | Diversified Financials | L + 800 | 1.00 | % | 5/31/2019 | 58,062 | 57,359 | 58,933 | |||||||||||||||||||
See notes to consolidated financial statements.
F-8
Table of Contents
Corporate Capital Trust, Inc. and Subsidiaries
Consolidated Schedule of Investments (continued)
As of December 31, 2016
(in thousands, except share amounts)
Company (a)(b) |
Footnotes |
Industry |
Interest Rate |
Base Rate Floor |
Maturity Date (c) |
No. Shares/ Principal Amount (d) |
Cost (e) |
Fair Value |
||||||||||||||||||||
| Paradigm Acquisition Corp. |
(2) | Health Care Equipment & Services | L + 500 | 1.00 | % | 6/2/2022 | $ | 10,925 | $ | 10,791 | $ | 10,875 | ||||||||||||||||
| Petroplex Acidizing, Inc., 1.00% |
(f)(j)(k) | Energy | |
15.00% PIK (15.00% Max PIK) |
|
12/5/2019 | 17,740 | 13,809 | 1,012 | |||||||||||||||||||
| (f)(j)(2) | |
L + 725, 1.75% PIK (1.75% Max PIK) |
|
1.00 | % | 12/5/2019 | 22,268 | 22,268 | 20,866 | |||||||||||||||||||
| Plaskolite, LLC |
(2) | Materials | L + 475 | 1.00 | % | 11/3/2022 | 8 | 8 | 8 | |||||||||||||||||||
| Proserv Acquisition, LLC |
(f)(g)(2) | Energy | L + 537.5 | 1.00 | % | 12/22/2021 | 27,033 | 21,357 | 17,266 | |||||||||||||||||||
| Proserv Acquisition, LLC (GBR) |
(f)(g)(i)(2) | Energy | L + 537.5 | 1.00 | % | 12/22/2021 | 15,867 | 12,535 | 10,134 | |||||||||||||||||||
| Raley’s |
(2) | Food & Staples Retailing | L + 625 | 1.00 | % | 5/18/2022 | 11,383 | 11,055 | 11,511 | |||||||||||||||||||
| Safety Technology Holdings, Inc. |
(f)(2) | Technology Hardware & Equipment | L + 600 | 1.00 | % | 7/7/2022 | 7,481 | 7,275 | 7,428 | |||||||||||||||||||
| SARquavitae Servicios a la Dependencia, S.L. (LUX) |
(f)(g)(i)(j)(5)(EUR) | Health Care Equipment & Services | |
E + 800 (2.00% Max PIK) |
|
1.00 | % | 9/30/2022 | € | 28,297 | 29,240 | 29,965 | ||||||||||||||||
| (f)(g)(i)(j)(5)(EUR) | |
E + 800 (2.00% Max PIK) |
|
1.00 | % | 9/30/2022 | 14,306 | 14,782 | 15,149 | |||||||||||||||||||
| (f)(g)(i)(j)(5)(EUR) | |
E + 800 (2.00% Max PIK) |
|
1.00 | % | 9/30/2022 | 3,131 | 3,235 | 3,316 | |||||||||||||||||||
| Sequa Corp. |
(2) | Capital Goods | L + 400 | 1.25 | % | 6/19/2017 | $ | 7,352 | 6,763 | 6,983 | ||||||||||||||||||
| SIRVA Worldwide, Inc. |
(n)(2) | Commercial & Professional Services | L + 650 | 1.00 | % | 11/18/2022 | 22,773 | 22,204 | 22,375 | |||||||||||||||||||
See notes to consolidated financial statements.
F-9
Table of Contents
Corporate Capital Trust, Inc. and Subsidiaries
Consolidated Schedule of Investments (continued)
As of December 31, 2016
(in thousands, except share amounts)
Company (a)(b) |
Footnotes |
Industry |
Interest Rate |
Base Rate Floor |
Maturity Date (c) |
No. Shares/ Principal Amount (d) |
Cost (e) |
Fair Value |
||||||||||||||||||||||||||||
| Smile Brands Group, Inc. |
(f)(2) | Health Care Equipment & Services | L + 625 | 1.00 | % | 8/15/2018 | $ | 12,469 | $ | 12,320 | $ | 12,709 | ||||||||||||||||||||||||
| SouthernCarlson |
(f)(2) | Capital Goods | L + 700 | 1.00 | % | 6/30/2022 | 38,349 | 37,764 | 38,402 | |||||||||||||||||||||||||||
| Tibco Software, Inc. |
(3) | Software & Services | L + 550 | 1.00 | % | 12/4/2020 | 1,923 | 1,881 | 1,935 | |||||||||||||||||||||||||||
| Traverse Midstream Partners, LLC |
(f)(2) | Energy | L + 1000 | 1.00 | % | 11/10/2020 | 2,348 | 2,310 | 2,312 | |||||||||||||||||||||||||||
| (f)(2) | L + 1000 | 1.00 | % | 11/10/2020 | 15,263 | 15,012 | 15,027 | |||||||||||||||||||||||||||||
| (f)(2) | L + 1000 | 1.00 | % | 11/10/2020 | 7,044 | 6,928 | 6,936 | |||||||||||||||||||||||||||||
| (f)(2) | L + 1000 | 1.00 | % | 11/10/2020 | 11,741 | 11,545 | 11,559 | |||||||||||||||||||||||||||||
| TTM Technologies, Inc. |
(g)(2) | Technology Hardware & Equipment | L + 425 | 1.00 | % | 5/31/2021 | 8,827 | 8,585 | 8,960 | |||||||||||||||||||||||||||
| Waste Pro USA, Inc. |
(f)(h)(2) | Transportation | L + 750 | 1.00 | % | 10/15/2020 | 35,948 | 35,948 | 36,127 | |||||||||||||||||||||||||||
| Willbros Group, Inc. |
(f)(h)(2) | Energy | L + 975 | 1.25 | % | 12/15/2019 | 25,599 | 25,599 | 25,078 | |||||||||||||||||||||||||||
| Z Gallerie, Inc. |
(f)(2) | Retailing | L + 650 | 1.00 | % | 10/8/2020 | 31,948 | 31,693 | 31,867 | |||||||||||||||||||||||||||
| Total Senior Secured Loans—First Lien |
$ | 1,641,759 | $ | 1,547,100 | ||||||||||||||||||||||||||||||||
|
|
|
|
|
|||||||||||||||||||||||||||||||||
| Senior Secured Loans—Second Lien—38.9% |
||||||||||||||||||||||||||||||||||||
| Abaco Systems, Inc. |
(f)(h)(2) | Capital Goods | L + 1050 | 1.00 | % | 6/7/2022 | $ | 63,371 | $ | 62,243 | $ | 63,400 | ||||||||||||||||||||||||
| Angelica Corporation |
(f)(k)(4) | Health Care Equipment & Services | L + 875 | 1.25 | % | 8/20/2019 | 52,169 | 50,869 | 9,201 | |||||||||||||||||||||||||||
| Applied Systems, Inc. |
(2) | Software & Services | L + 650 | 1.00 | % | 1/24/2022 | 21,242 | 21,293 | 21,513 | |||||||||||||||||||||||||||
See notes to consolidated financial statements.
F-10
Table of Contents
Corporate Capital Trust, Inc. and Subsidiaries
Consolidated Schedule of Investments (continued)
As of December 31, 2016
(in thousands, except share amounts)
Company (a)(b) |
Footnotes |
Industry |
Interest Rate |
Base Rate Floor |
Maturity Date (c) |
No. Shares/ Principal Amount (d) |
Cost (e) |
Fair Value |
||||||||||||||||||||||||||||
| Belk, Inc. |
(f)(h)(2) | Retailing | 10.50% | 6/12/2023 | $ | 99,615 | $ | 97,813 | $ | 94,154 | ||||||||||||||||||||||||||
| Bon-Ton Department Stores, Inc. |
(f)(g)(2) | Retailing | L + 950 | 1.00 | % | 3/18/2021 | 13,529 | 13,272 | 13,036 | |||||||||||||||||||||||||||
| CPI International, Inc. |
(f)(3) | Capital Goods | L + 700 | 1.00 | % | 9/16/2017 | 28,000 | 27,741 | 28,000 | |||||||||||||||||||||||||||
| CTI Foods Holding Co., LLC |
(2) | Food, Beverage & Tobacco | L + 725 | 1.00 | % | 6/28/2021 | 23,219 | 22,994 | 21,129 | |||||||||||||||||||||||||||
| Culligan International Co |
(f)(2) | Household & Personal Products | L + 850 | 1.00 | % | 11/15/2024 | 37,500 | 36,753 | 36,750 | |||||||||||||||||||||||||||
| EagleView Technology Corp. |
(2) | Software & Services | L + 825 | 1.00 | % | 7/14/2023 | 33,000 | 32,565 | 32,949 | |||||||||||||||||||||||||||
| Excelitas Technologies Corp. |
(f)(j)(2) | Technology Hardware & Equipment | |
L + 975, 3.00% PIK (3.00% Max PIK) |
|
1.00 | % | 4/29/2021 | 114,273 | 114,273 | 109,883 | |||||||||||||||||||||||||
| Genoa (QoL) |
(2) | Health Care Equipment & Services | L + 800 | 1.00 | % | 10/28/2024 | 10,828 | 10,668 | 10,828 | |||||||||||||||||||||||||||
| Greenway Medical Technologies |
(2) | Health Care Equipment & Services | L + 825 | 1.00 | % | 11/4/2021 | 4,066 | 4,024 | 3,964 | |||||||||||||||||||||||||||
| Grocery Outlet, Inc. |
(2) | Food & Staples Retailing | L + 825 | 1.00 | % | 10/21/2022 | 40,346 | 39,268 | 40,459 | |||||||||||||||||||||||||||
| iParadigms Holdings, LLC |
(2) | Software & Services | L + 725 | 1.00 | % | 7/29/2022 | 22,595 | 22,456 | 21,804 | |||||||||||||||||||||||||||
| MedAssets, Inc. |
(f)(h)(3) | Health Care Equipment & Services | L + 975 | 1.00 | % | 4/19/2023 | 63,000 | 61,232 | 62,856 | |||||||||||||||||||||||||||
| NEP Group, Inc. |
(2) | Media | L + 875 | 1.25 | % | 7/22/2020 | 641 | 625 | 647 | |||||||||||||||||||||||||||
| NewWave Communications, Inc. |
(2) | Media | L + 800 | 1.00 | % | 10/30/2020 | 13,712 | 13,684 | 13,352 | |||||||||||||||||||||||||||
| P2 Energy Solutions, Inc. |
(2) | Software & Services | L + 800 | 1.00 | % | 4/30/2021 | 3,538 | 3,513 | 3,241 | |||||||||||||||||||||||||||
| (2) | L + 800 | 1.00 | % | 4/30/2021 | 74,312 | 72,776 | 68,088 | |||||||||||||||||||||||||||||
See notes to consolidated financial statements.
F-11
Table of Contents
Corporate Capital Trust, Inc. and Subsidiaries
Consolidated Schedule of Investments (continued)
As of December 31, 2016
(in thousands, except share amounts)
Company (a)(b) |
Footnotes |
Industry |
Interest Rate |
Base Rate Floor |
Maturity Date (c) |
No. Shares/ Principal Amount (d) |
Cost (e) |
Fair Value |
||||||||||||||||||||||||||||
| Petrochoice Holdings, Inc. |
(f)(h)(2) | Capital Goods | L + 875 | 1.00 | % | 8/21/2023 | $ | 65,000 | $ | 63,272 | $ | 64,541 | ||||||||||||||||||||||||
| Plaskolite, LLC |
(f)(2) | Materials | L + 825 | 1.00 | % | 11/3/2023 | 33,543 | 32,605 | 33,879 | |||||||||||||||||||||||||||
| Polyconcept North America, Inc. |
(f)(3) | Consumer Durables & Apparel | L + 1000 | 1.00 | % | 12/31/2023 | 29,376 | 28,675 | 28,970 | |||||||||||||||||||||||||||
| Press Ganey Holdings, Inc. |
(3) | Health Care Equipment & Services | L + 800 | 1.00 | % | 10/21/2024 | 6,703 | 6,636 | 6,837 | |||||||||||||||||||||||||||
| SI Organization, Inc. |
(2) | Capital Goods | L + 875 | 1.00 | % | 5/23/2020 | 87,673 | 86,737 | 88,623 | |||||||||||||||||||||||||||
| SquareTwo Financial Corp. |
(f)(j)(2) | Diversified Financials | |
L + 1000 PIK (L + 1000 Max PIK) |
|
1.00 | % | 5/24/2019 | 11,026 | 11,026 | 5,977 | |||||||||||||||||||||||||
| (f)(j)(2) | |
L + 950 PIK (L + 950 Max PIK) |
|
1.00 | % | 5/24/2019 | 2,852 | 2,807 | 2,852 | |||||||||||||||||||||||||||
| Valeo Foods Group Ltd. (IRL) |
(f)(g)(i)(3)(GBP) | Food, Beverage & Tobacco | L + 800 | 1.00 | % | 5/8/2023 | £ | 29,125 | 43,749 | 36,074 | ||||||||||||||||||||||||||
| Vertafore, Inc. |
(f)(2) | Software & Services | L + 900 | 1.00 | % | 6/30/2024 | $ | 81,500 | 79,179 | 82,722 | ||||||||||||||||||||||||||
| Vestcom International, Inc. |
(f)(2) | Consumer Services | L + 850 | 1.00 | % | 4/28/2024 | 58,000 | 57,135 | 57,130 | |||||||||||||||||||||||||||
| WireCo WorldGroup, Inc. |
(2) | Capital Goods | L + 950 | 1.00 | % | 7/12/2024 | 11,226 | 11,152 | 11,324 | |||||||||||||||||||||||||||
| Total Senior Secured Loans—Second Lien |
$ | 1,131,035 | $ | 1,074,183 | ||||||||||||||||||||||||||||||||
|
|
|
|
|
|||||||||||||||||||||||||||||||||
| Senior Secured Bonds—4.9% |
||||||||||||||||||||||||||||||||||||
| Artesyn Technologies, Inc. |
(o)(p) | Technology Hardware & Equipment | 9.75% | 10/15/2020 | $ | 16,059 | $ | 15,625 | $ | 14,694 | ||||||||||||||||||||||||||
| Calumet Specialty Products Partners, LP |
(g)(o)(p) | Energy | 11.50% | 1/15/2021 | 13,398 | 13,199 | 15,307 | |||||||||||||||||||||||||||||
See notes to consolidated financial statements.
F-12
Table of Contents
Corporate Capital Trust, Inc. and Subsidiaries
Consolidated Schedule of Investments (continued)
As of December 31, 2016
(in thousands, except share amounts)
Company (a)(b) |
Footnotes |
Industry |
Interest Rate |
Base Rate Floor |
Maturity Date (c) |
No. Shares/ Principal Amount (d) |
Cost (e) |
Fair Value |
||||||||||||||||||||||||||||
| Direct ChassisLink, Inc. |
(o)(p) |
Transportation |
10.00% | 6/15/2023 | $ | 5,726 | $ | 5,821 | $ | 5,912 | ||||||||||||||||||||||||||
| Guitar Center, Inc. |
(o)(p) |
Retailing |
6.50% | 4/15/2019 | 19,256 | 19,003 | 17,475 | |||||||||||||||||||||||||||||
| iPayment, Inc. |
(f)(o)(p) |
Software & Services |
9.50% | 12/15/2019 | 4,611 | 4,611 | 4,217 | |||||||||||||||||||||||||||||
| Louisiana Public Facilities Authority |
(f)(k)(2) |
Energy |
L + 1000 | 1.50 | % | 1/1/2020 | 34,330 | 33,586 | 13,026 | |||||||||||||||||||||||||||
|
(f)(k)(p)(2) |
L + 1000 | 1/1/2020 | 10,650 | 10,650 | 4,041 | |||||||||||||||||||||||||||||||
| Maxim Crane, LP |
(o)(p) |
Capital Goods |
10.13% | 8/1/2024 | 3,821 | 3,821 | 4,088 | |||||||||||||||||||||||||||||
| NESCO, LLC |
(o)(p) |
Capital Goods |
6.88% | 2/15/2021 | 12,885 | 8,624 | 10,566 | |||||||||||||||||||||||||||||
| OAG Holdings, LLC |
(f)(j)(k) |
Energy |
|
8.00%, 2.00% PIK (2.00% Max PIK) |
|
12/20/2020 | 21,260 | 18,694 | 1,546 | |||||||||||||||||||||||||||
| PQ Corp. |
(o)(p) |
Materials |
6.75% | 11/15/2022 | 1,052 | 1,052 | 1,126 | |||||||||||||||||||||||||||||
| RedPrairie Corp. |
(o)(p) |
Software & Services |
7.38% | 10/15/2024 | 13,805 | 13,805 | 14,305 | |||||||||||||||||||||||||||||
| Rockport Group, LLC |
(f) | Consumer Durables & Apparel | 9.50% | 7/31/2022 | 28,516 | 27,913 | 27,422 | |||||||||||||||||||||||||||||
| Towergate (GBR) |
(g)(i)(o)(p)(GBP) |
Insurance |
8.75% | 4/2/2020 | £ | 936 | 1,422 | 1,061 | ||||||||||||||||||||||||||||
| Total Senior Secured Bonds |
$ | 177,826 | $ | 134,786 | ||||||||||||||||||||||||||||||||
|
|
|
|
|
|||||||||||||||||||||||||||||||||
| Total Senior Debt |
$ | 2,950,620 | $ | 2,756,069 | ||||||||||||||||||||||||||||||||
|
|
|
|
|
|||||||||||||||||||||||||||||||||
| Subordinated Debt—23.3% |
||||||||||||||||||||||||||||||||||||
| Alion Science & Technology Corp. |
(f)(h)(p) | Capital Goods | 11.00% | 8/19/2022 | $ | 68,603 | $ | 67,706 | $ | 65,471 | ||||||||||||||||||||||||||
See notes to consolidated financial statements.
F-13
Table of Contents
Corporate Capital Trust, Inc. and Subsidiaries
Consolidated Schedule of Investments (continued)
As of December 31, 2016
(in thousands, except share amounts)
Company (a)(b) |
Footnotes |
Industry |
Interest Rate |
Base Rate Floor |
Maturity Date (c) |
No. Shares/ Principal Amount (d) |
Cost (e) |
Fair Value |
||||||||||||||||||||||||||||
| Block Communications, Inc. |
(o)(p) | Media | 7.25% | 2/1/2020 | $ | 845 | $ | 849 | $ | 856 | ||||||||||||||||||||||||||
| Builders FirstSource, Inc. |
(g)(o)(p) | Capital Goods | 10.75% | 8/15/2023 | 1,431 | 1,431 | 1,642 | |||||||||||||||||||||||||||||
| Cemex Materials, LLC |
(o)(p) | Materials | 7.70% | 7/21/2025 | 58,454 | 61,983 | 61,669 | |||||||||||||||||||||||||||||
| ClubCorp Club Operations, Inc. |
(o)(p) | Consumer Services | 8.25% | 12/15/2023 | 693 | 661 | 735 | |||||||||||||||||||||||||||||
| Datatel, Inc. |
(o)(p) | Software & Services | 9.00% | 9/30/2023 | 3,320 | 3,212 | 3,519 | |||||||||||||||||||||||||||||
| Exemplis Corp. |
(f)(j)(2) | Commercial & Professional Services |
|
L + 700, 4.00% PIK (4.00% Max PIK) |
|
3/23/2020 | 19,398 | 19,398 | 19,689 | |||||||||||||||||||||||||||
| GCI, Inc. |
(o) | Telecommunication Services | 6.75% | 6/1/2021 | 890 | 885 | 912 | |||||||||||||||||||||||||||||
| (o) | 6.88% | 4/15/2025 | 13,693 | 13,620 | 13,898 | |||||||||||||||||||||||||||||||
| GCP Applied Technologies, Inc. |
(g)(o)(p) | Materials | 9.50% | 2/1/2023 | 911 | 911 | 1,045 | |||||||||||||||||||||||||||||
| Genesys Telecommunications Laboratories Inc. |
(o)(p) | Software & Services | 10.00% | 11/30/2024 | 17,516 | 17,516 | 18,611 | |||||||||||||||||||||||||||||
| Hilding Anders (SWE) |
(f)(g)(i)(j)(q)(EUR) | Consumer Durables & Apparel | |
13.00% PIK (13.00% Max PIK) |
|
6/30/2021 | € | 112,535 | 130,162 | 77,837 | ||||||||||||||||||||||||||
| (f)(g)(i)(j)(k)(q)(EUR) | |
12.00% PIK (12.00% Max PIK) |
|
12/31/2022 | 2,733 | 507 | 505 | |||||||||||||||||||||||||||||
| (f)(g)(i)(j)(k)(q)(EUR) | |
12.00% PIK (12.00% Max PIK) |
|
12/31/2023 | 22,230 | 939 | 2 | |||||||||||||||||||||||||||||
| (f)(g)(i)(j)(k)(q)(EUR) | |
18.00% PIK (18.00% Max PIK) |
|
12/31/2024 | 34,358 | 12,697 | 6,349 | |||||||||||||||||||||||||||||
See notes to consolidated financial statements.
F-14
Table of Contents
Corporate Capital Trust, Inc. and Subsidiaries
Consolidated Schedule of Investments (continued)
As of December 31, 2016
(in thousands, except share amounts)
Company (a)(b) |
Footnotes |
Industry |
Interest Rate |
Base Rate Floor |
Maturity Date (c) |
No. Shares/ Principal Amount (d) |
Cost (e) |
Fair Value |
||||||||||||||||||||||||||||
| Hillman Group, Inc. |
(o)(p) | Consumer Durables & Apparel | 6.38% | 7/15/2022 | $ | 559 | $ | 540 | $ | 525 | ||||||||||||||||||||||||||
| Home Partners of America |
(f)(3) | Real Estate | L + 700 | 1.00 | % | 6/8/2023 | 75,000 | 73,540 | 74,815 | |||||||||||||||||||||||||||
| JC Penney Corp., Inc. |
(g)(o) | Retailing | 5.65% | 6/1/2020 | 8,354 | 6,003 | 8,239 | |||||||||||||||||||||||||||||
| Jo-Ann Stores, Inc. |
(o)(p) | Retailing | 8.13% | 3/15/2019 | 10,186 | 10,136 | 10,135 | |||||||||||||||||||||||||||||
| Kenan Advantage Group, Inc. |
(o)(p) | Transportation | 7.88% | 7/31/2023 | 25,773 | 25,624 | 26,031 | |||||||||||||||||||||||||||||
| Lightower Fiber, LLC |
(f) | Telecommunication Services | 10.00% | 2/12/2022 | 11,555 | 11,350 | 11,752 | |||||||||||||||||||||||||||||
| (f)(j) | |
12.00% PIK (12.00% Max PIK) |
|
8/12/2025 | 9,999 | 9,840 | 10,219 | |||||||||||||||||||||||||||||
| MultiPlan, Inc. |
(o)(p) | Health Care Equipment & Services | 7.13% | 6/1/2024 | 2,336 | 2,336 | 2,459 | |||||||||||||||||||||||||||||
| Platform Specialty Products Corp. |
(g)(o)(p) | Materials | 10.38% | 5/1/2021 | 2,747 | 2,747 | 3,042 | |||||||||||||||||||||||||||||
| PQ Corp. |
(f)(p)(2) | Materials | L + 1075 | 1.00 | % | 5/1/2022 | 133,488 | 130,981 | 138,564 | |||||||||||||||||||||||||||
| Riverbed Technology, Inc. |
(o)(p) | Technology Hardware & Equipment | 8.88% | 3/1/2023 | 10,662 | 10,763 | 11,302 | |||||||||||||||||||||||||||||
| Solera Holdings, Inc. |
(o)(p) | Software & Services | 10.50% | 3/1/2024 | 20,864 | 20,141 | 23,472 | |||||||||||||||||||||||||||||
| Surgery Center Holdings, Inc. |
(g)(o)(p) | Health Care Equipment & Services | 8.88% | 4/15/2021 | 5,972 | 6,021 | 6,360 | |||||||||||||||||||||||||||||
| TIBCO Software, Inc. |
(o)(p) | Software & Services | 11.38% | 12/1/2021 | 22,443 | 21,963 | 22,443 | |||||||||||||||||||||||||||||
See notes to consolidated financial statements.
F-15
Table of Contents
Corporate Capital Trust, Inc. and Subsidiaries
Consolidated Schedule of Investments (continued)
As of December 31, 2016
(in thousands, except share amounts)
Company (a)(b) |
Footnotes |
Industry |
Interest Rate |
Base Rate Floor |
Maturity Date (c) |
No. Shares/ Principal Amount (d) |
Cost (e) |
Fair Value |
||||||||||||||||||||||||||||
| Vertiv Co. |
(o)(p) | Technology Hardware & Equipment | 9.25% | 10/15/2024 | $ | 19,178 | $ | 19,178 | $ | 20,329 | ||||||||||||||||||||||||||
| Total Subordinated Debt |
$ | 683,640 | $ | 642,427 | ||||||||||||||||||||||||||||||||
|
|
|
|
|
|||||||||||||||||||||||||||||||||
| Structured Products—7.6% |
||||||||||||||||||||||||||||||||||||
| Central Park Leasing SARL (LUX), Partnership Interest |
(f)(g)(i)* | Capital Goods | N/A | $ | 64,367 | $ | 64,509 | |||||||||||||||||||||||||||||
| Comet Aircraft SARL (LUX), Common Shares |
(f)(g)(i)(q) | Capital Goods | 549,451 | 49,618 | 49,157 | |||||||||||||||||||||||||||||||
| Guardian Investors, LLC, Membership Interest |
(f)(g)(q) | Diversified Financials | N/A | 8,860 | 3,704 | |||||||||||||||||||||||||||||||
| Innovating Partners, LLC, Membership Interest |
(f)(g)(q) | Diversified Financials | N/A | 11,363 | 4,372 | |||||||||||||||||||||||||||||||
| KKR BPT Holdings Aggregator, LLC, Membership Interest |
(f)(g)(q)* | Diversified Financials | N/A | 13,200 | 9,835 | |||||||||||||||||||||||||||||||
| LSF IX Java Investments, Ltd (IRL), Facility B |
(f)(g)(i)(r)(6)(EUR) | Diversified Financials | E + 315 | 12/3/2019 | € | 56,406 | 51,178 | 51,073 | ||||||||||||||||||||||||||||
| Trade Finance Funding I, Ltd. 2013—1A Class B (CYM) |
(f)(g)(i)(p) | Diversified Financials | 10.75% | 11/13/2018 | $ | 28,221 | 28,221 | 28,221 | ||||||||||||||||||||||||||||
| Total Structured Products |
$ | 226,807 | $ | 210,871 | ||||||||||||||||||||||||||||||||
|
|
|
|
|
|||||||||||||||||||||||||||||||||
| Equity/Other—15.1% |
||||||||||||||||||||||||||||||||||||
| Alion Science & Technology Corp., Class A Membership Interest |
(f)* | Capital Goods | N/A | $ | 7,350 | $ | 6,685 | |||||||||||||||||||||||||||||
| AltEn, LLC, Membership Units |
(f)* | Energy | 2,384 | 2,955 | — | |||||||||||||||||||||||||||||||
| Amtek Global Technology Pte. Ltd. (SGP), Warrants |
(f)(g)(i)*(EUR) | Automobiles & Components | 12/31/2017 | 9,991 | 4,636 | 3,379 | ||||||||||||||||||||||||||||||
| (f)(g)(i)*(EUR) | 12/31/2018 | 9,991 | 4,785 | 3,413 | ||||||||||||||||||||||||||||||||
See notes to consolidated financial statements.
F-16
Table of Contents
Corporate Capital Trust, Inc. and Subsidiaries
Consolidated Schedule of Investments (continued)
As of December 31, 2016
(in thousands, except share amounts)
Company (a)(b) |
Footnotes |
Industry |
Interest Rate |
Base Rate Floor |
Maturity Date (c) |
No. Shares/ Principal Amount (d) |
Cost (e) |
Fair Value |
||||||||||||||||||||||||
| Belk, Inc., Units |
(f) | Retailing | 1,642 | $ | 7,846 | $ | 4,600 | |||||||||||||||||||||||||
| Cengage Learning Holdings II, LP, Common Stock |
(f) | Media | 227,802 | 7,529 | 4,985 | |||||||||||||||||||||||||||
| Education Management Corp., Common Stock |
(f)* | Consumer Services | 3,779,591 | 1,047 | — | |||||||||||||||||||||||||||
| Education Management Corp., Warrants |
(f) * | 1/5/2022 | 2,320,791 | 371 | — | |||||||||||||||||||||||||||
| Excelitas Technologies Corp., Class A Membership Interest |
(f)* | Technology Hardware & Equipment | N/A | 5,636 | 5,421 | |||||||||||||||||||||||||||
| GA Capital Specialty Lending Fund, Limited Partnership Interest |
(f)(g) | Diversified Financials | N/A | 65,145 | 65,145 | |||||||||||||||||||||||||||
| Genesys Telecommunications Laboratories, Inc., Preferred Shares |
(f)* | Software Services | 1,050,465 | — | — | |||||||||||||||||||||||||||
| Genesys Telecommunications Laboratories, Inc., Ordinary Shares |
(f)* | 2,768,806 | — | — | ||||||||||||||||||||||||||||
| Genesys Telecommunications Laboratories, Inc., Class A Shares |
(f)* | 40,529 | — | — | ||||||||||||||||||||||||||||
| Genesys Telecommunications Laboratories, Inc., Class A1 – A5 Shares |
(f) | 3,463,150 | 120 | 686 | ||||||||||||||||||||||||||||
| Genesys Telecommunications Laboratories, Inc., Ordinary Shares |
(f)* | 41,339 | — | — | ||||||||||||||||||||||||||||
| Hilding Anders (SWE), Arle PIK Interest |
(f)(g)(i)(l)*(EUR) | Consumer Durables & Apparel | N/A | — | — | |||||||||||||||||||||||||||
| Hilding Anders (SWE), Class A Common Stock |
(f)(g)(i)(q)*(SEK) | 4,503,408 | 132 | — | ||||||||||||||||||||||||||||
| Hilding Anders (SWE), Class B Common Stock |
(f)(g)(i)(q)*(SEK) | 574,791 | 25 | — | ||||||||||||||||||||||||||||
| Hilding Anders (SWE), Class C Common Stock |
(f)(g)(i)(q)*(SEK) | 213,201 | — | — | ||||||||||||||||||||||||||||
| Hilding Anders (SWE), Equity Options |
(f)(g)(i)(q)*(SEK) | 12/31/2020 | 236,160,807 | 14,988 | 2,253 | |||||||||||||||||||||||||||
See notes to consolidated financial statements.
F-17
Table of Contents
Corporate Capital Trust, Inc. and Subsidiaries
Consolidated Schedule of Investments (continued)
As of December 31, 2016
(in thousands, except share amounts)
Company (a)(b) |
Footnotes |
Industry |
Interest Rate |
Base Rate Floor |
Maturity Date (c) |
No. Shares/ Principal Amount (d) |
Cost (e) |
Fair Value |
||||||||||||||||||||||||||||
| Home Partners of America, Inc., Common Stock |
(f)(l)* | Real Estate | 98,053 | $ | 99,725 | $ | 113,013 | |||||||||||||||||||||||||||||
| Home Partners of America, Inc., Warrants |
(f)(l)* | 8/7/2024 | 2,674 | 292 | 607 | |||||||||||||||||||||||||||||||
| iPayment, Inc., Common Stock |
(f)* | Software & Services | 538,143 | 1,988 | 950 | |||||||||||||||||||||||||||||||
| Jacuzzi Brands, Inc., Warrants |
(f)* | Capital Goods | 7/3/2019 | 49,888 | — | 1,400 | ||||||||||||||||||||||||||||||
| Jones Apparel Group Holdings, Inc., Common Stock |
(f)* | Consumer Durables & Apparel | 5,451 | 872 | 3,025 | |||||||||||||||||||||||||||||||
| Keystone Australia Holdings, Pty. Ltd. (AUS), Warrants |
(f)(g)(i)(s)*(AUD) | Consumer Services | 1,588,469 | 1,019 | — | |||||||||||||||||||||||||||||||
| Nine West Holdings, Inc., Common Stock |
(f)* | Consumer Durables & Apparel | 5,451 | 6,541 | — | |||||||||||||||||||||||||||||||
| OAG Holdings, LLC, Overriding Royalty Interest |
(f) | Energy | N/A | 2,354 | — | |||||||||||||||||||||||||||||||
| Orchard Marine, Ltd. (VGB), Class B Common Stock |
(f)(g)(i)(l)* | Transportation | 1,964 | 3,069 | — | |||||||||||||||||||||||||||||||
| Orchard Marine, Ltd. (VGB), Series A Preferred Stock |
(f)(g)(i)(j)(l)(t) | 9.00 | % | 52,782 | 51,825 | 20,502 | ||||||||||||||||||||||||||||||
| Petroplex Acidizing, Inc., Warrants |
(f)* | Energy | 12/29/2026 | 8 | — | — | ||||||||||||||||||||||||||||||
| Polyconcept North America Holdings, Inc., Class A-1 Units |
(f)* | Consumer Durables & Apparel | 29,376 | 2,938 | 2,708 | |||||||||||||||||||||||||||||||
| PQ Corp., Class B Common Stock |
(f)* | Materials | 18,059 | 3,337 | 3,077 | |||||||||||||||||||||||||||||||
| Sentry Holdings, Ltd. (JEY), Common Shares A |
(f)(g)(i)*(GBP) | Insurance | 16,450 | — | — | |||||||||||||||||||||||||||||||
| Sentry Holdings, Ltd. (JEY), Preferred B Shares |
(f)(g)(i)*(GBP) | 6,113,719 | 9,064 | 6,962 | ||||||||||||||||||||||||||||||||
See notes to consolidated financial statements.
F-18
Table of Contents
Corporate Capital Trust, Inc. and Subsidiaries
Consolidated Schedule of Investments (continued)
As of December 31, 2016
(in thousands, except share amounts)
Company (a)(b) |
Footnotes |
Industry |
Interest Rate |
Base Rate Floor |
Maturity Date (c) |
No. Shares/ Principal Amount (d) |
Cost (e) |
Fair Value |
||||||||||||||||||
| SquareTwo Financial Corp., Series A Preferred Stock |
(f)(k) | Diversified Financials | 12.50% | 16,044 | $ | 5,457 | $ | — | ||||||||||||||||||
| Star Mountain SMB Multi-Manager Credit Platform, LP, Limited Partnership Interest |
(f)(g) | Diversified Financials | N/A | 47,487 | 50,638 | |||||||||||||||||||||
| Strategic Credit Opportunities Partners, LLC, Units |
(f)(g)(q)* | Diversified Financials | 92,400 | 92,400 | 98,998 | |||||||||||||||||||||
| Stuart Weitzman, Inc., Common Stock |
(f)* | Consumer Durables & Apparel | 5,451 | — | 1,249 | |||||||||||||||||||||
| Toorak Capital Partners, LLC, Membership Interest |
(f)(g)(q)* | Diversified Financials | N/A | 6,984 | 6,984 | |||||||||||||||||||||
| Towergate (GBR), Ordinary Shares |
(f)(g)(i)*(GBP) | Insurance | 116,814 | 173 | 133 | |||||||||||||||||||||
| Willbros Group, Inc., Common Stock |
* | Energy | 2,810,814 | 7,760 | 9,107 | |||||||||||||||||||||
| Total Equity/Other |
$ | 465,850 | $ | 415,920 | ||||||||||||||||||||||
|
|
|
|
|
|||||||||||||||||||||||
| Total Investments, excluding Short Term Investments — 145.9% |
$ | 4,326,917 | $ | 4,025,287 | ||||||||||||||||||||||
|
|
|
|
|
|||||||||||||||||||||||
| Short Term Investments—0.0% |
| |||||||||||||||||||||||||
| Goldman Sachs Financial Square Funds—Prime Obligations Fund FST Preferred Shares |
(u) | 0.74% | 5,522 | $ | 6 | $ | 6 | |||||||||||||||||||
| Total Short Term Investments |
$ | 6 | $ | 6 | ||||||||||||||||||||||
|
|
|
|
|
|||||||||||||||||||||||
| TOTAL INVESTMENTS — 145.9%(v) |
$ | 4,326,923 | $ | 4,025,293 | ||||||||||||||||||||||
|
|
|
|
|
|||||||||||||||||||||||
| LIABILITIES IN EXCESS OF OTHER ASSETS—(45.8%) |
|
(1,265,961 | ) | |||||||||||||||||||||||
|
|
|
|||||||||||||||||||||||||
| NET ASSETS—100.0% |
|
$ | 2,759,332 | |||||||||||||||||||||||
|
|
|
|||||||||||||||||||||||||
See notes to consolidated financial statements.
F-19
Table of Contents
Corporate Capital Trust, Inc. and Subsidiaries
Consolidated Schedule of Investments (continued)
As of December 31, 2016
(in thousands, except share amounts)
Company (a)(b) |
Footnotes |
Industry |
Interest Rate |
Base Rate Floor |
Maturity Date (c) |
No. Shares/ Principal Amount (d) |
Cost (e) |
Fair Value |
||||||||||||||||||||||||||||
| Collateral on Deposit with Custodian—3.4% |
||||||||||||||||||||||||||||||||||||
| Bank of Nova Scotia—Certificate of Deposit |
3/31/2017 | $ | 95,000 | $ | 95,000 | $ | 95,000 | |||||||||||||||||||||||||||||
| Total Collateral on Deposit with Custodian |
$ | 95,000 | $ | 95,000 | ||||||||||||||||||||||||||||||||
|
|
|
|
|
|||||||||||||||||||||||||||||||||
| Derivative Instruments (Note 4)—1.5% |
||||||||||||||||||||||||||||||||||||
| Cross currency swaps |
(f) | $ | — | 26,497 | ||||||||||||||||||||||||||||||||
| Foreign currency forward contracts |
(f) | $ | — | 3,504 | ||||||||||||||||||||||||||||||||
| Interest rate swaps |
(f) | $ | — | 8,862 | ||||||||||||||||||||||||||||||||
| Total return swaps |
(f)(g) | $ | — | 3,397 | ||||||||||||||||||||||||||||||||
| Total Derivative Instruments |
$ | — | $ | 42,260 | ||||||||||||||||||||||||||||||||
|
|
|
|
|
|||||||||||||||||||||||||||||||||
| (a) | Security may be an obligation of one or more entities affiliated with the named company. |
| (b) | Non-controlled/non-affiliated investments as defined by the Investment Company Act of 1940, as amended (“1940 Act”), unless otherwise indicated. Non-controlled/non-affiliated investments are investments that are neither controlled investments nor affiliated investments. |
| (c) | Represents maturity of debt securities and expiration of applicable equity investments. |
| (d) | Denominated in U.S. dollars unless otherwise noted. |
| (e) | Represents amortized cost for debt securities and cost for equity investments translated to U.S. dollars. |
| (f) | Investments classified as Level 3 whereby fair value was determined by the Company’s Board of Directors (see Note 2). |
| (g) | The investment is not a qualifying asset as defined in Section 55(a) under the 1940 Act. A business development company may not acquire any asset other than qualifying assets, unless, at the time the acquisition is made, qualifying assets represent at least 70% of the company’s total assets. The Company calculates its compliance with the qualifying assets test on a “look through” basis by disregarding the value of the Company’s total return swaps and treating each loan underlying the total return swaps as either a qualifying asset or non-qualifying asset based on whether the obligor is an eligible portfolio company. On this basis, 74.7% of the Company’s total assets represented qualifying assets as of December 31, 2016. |
| (h) | Security or portion thereof was held within CCT SE I LLC and was pledged as collateral supporting the amounts outstanding under the revolving credit facility with JPMorgan Chase Bank as of December 31, 2016. |
See notes to consolidated financial statements.
F-20
Table of Contents
Corporate Capital Trust, Inc. and Subsidiaries
Consolidated Schedule of Investments (continued)
As of December 31, 2016
(in thousands, except share amounts)
| (i) | A portfolio company domiciled in a foreign country. The jurisdiction of the security issuer may be a different country than the domicile of the portfolio company. |
| (j) | The underlying credit agreement or indenture contains a PIK provision, whereby the issuer has either the option or the obligation to make interest payments with the issuance of additional securities. The interest rate in the schedule represents the current interest rate in effect for these investments. |
| (k) | Investment was on non-accrual status as of December 31, 2016. |
| (l) | Affiliated investment as defined by the 1940 Act, whereby the Company owns between 5% and 25% of the portfolio company’s outstanding voting securities and the investments are not classified as controlled investments. The aggregate fair value of non-controlled, affiliated investments at December 31, 2016 represented 8.3% of the Company’s net assets. Fair value as of December 31, 2015 and December 31, 2016 along with transactions during the year ended December 31, 2016 in these affiliated investments were as follows (amounts in thousands): |
| Year Ended December 31, 2016 | Year Ended December 31, 2016 | |||||||||||||||||||||||||||||||||||
| Non-Controlled, Affiliated |
Fair Value at December 31, 2015 |
Gross Additions (Cost)* |
Gross Reductions (Cost)** |
Net Unrealized Gain (Loss) |
Fair Value at December 31, 2016 |
Net Realized Gain (Loss) |
Interest Income*** |
Fee Income |
Dividend Income |
|||||||||||||||||||||||||||
| AltEn, LLC |
||||||||||||||||||||||||||||||||||||
| Membership Units |
$ | - | $ | - | $ | - | $ |
- |
|
$ | - | $ | - | $ | - | $ | - | $ | - | |||||||||||||||||
| Term Loan |
9,353 | - | - | (620 | ) | 8,733 | - | - | - | - | ||||||||||||||||||||||||||
| Hilding Anders (1) |
||||||||||||||||||||||||||||||||||||
| Subordinated Debt |
94,473 | 13,976 | (149,132 | ) | 40,683 | - | (4,827 | ) | 12,798 | - | - | |||||||||||||||||||||||||
| Class A Common Stock |
- | - | (132 | ) | 132 | - | - | - | - | - | ||||||||||||||||||||||||||
| Class B Common Stock |
- | - | (25 | ) | 25 | - | - | - | - | - | ||||||||||||||||||||||||||
| Equity Options |
213 | - | (14,988 | ) | 14,775 | - | - | - | - | - | ||||||||||||||||||||||||||
| Home Partners of America, Inc. |
||||||||||||||||||||||||||||||||||||
| Common Stock |
76,608 | 26,518 | - | 9,887 | 113,013 | - | - | - | - | |||||||||||||||||||||||||||
| Warrants |
370 | - | - | 237 | 607 | - | - | - | - | |||||||||||||||||||||||||||
| Orchard Marine, Ltd. |
||||||||||||||||||||||||||||||||||||
| Class B Common Stock |
- | - | - | - | - | - | - | - | - | |||||||||||||||||||||||||||
| Series A Preferred Stock |
38,082 | 8,838 | - | (26,418 | ) | 20,502 | - | - | - | 1,810 | ||||||||||||||||||||||||||
|
|
|
|
|
|
|
|
|
|
|
|
|
|
|
|
|
|
|
|||||||||||||||||||
| Totals |
$ | 219,099 | $ | 49,332 | $ | (164,277 | ) | $ | 38,701 | $ | 142,855 | $ | (4,827 | ) | $ | 12,798 | $ | - | $ | 1,810 | ||||||||||||||||
|
|
|
|
|
|
|
|
|
|
|
|
|
|
|
|
|
|
|
|||||||||||||||||||
| * | Gross additions include increases in the cost basis of investments resulting from new portfolio investments, PIK interest, the amortization of unearned income, the exchange of one or more existing securities for one or more new securities and the movement of an existing portfolio company into this category from a different category. |
| ** | Gross reductions include decreases in the cost basis of investments resulting from principal collections related to investment repayments or sales, the exchange of one or more existing securities for one or more new securities and the movement of an existing portfolio company out of this category into a different category. |
| *** | Includes payment-in-kind interest income. |
| (1) | The company acquired additional shares of the outstanding voting securities of this portfolio company on December 31, 2016, resulting in the investments being classified as controlled investments as of December 31, 2016. |
See notes to consolidated financial statements.
F-21
Table of Contents
Corporate Capital Trust, Inc. and Subsidiaries
Consolidated Schedule of Investments (continued)
As of December 31, 2016
(in thousands, except share amounts)
| (m) | The interest rate on this investment is comprised of a 7.00% cash payment plus an 8.00% redemption premium, to be paid upon redemption of the notes. |
| (n) | Position or portion thereof unsettled as of December 31, 2016. |
| (o) | Security or portion thereof is held within Paris Funding, LLC and is pledged as collateral supporting the amounts outstanding under the committed facility agreement with BNP Paribas Prime Brokerage, Inc. and eligible to be hypothecated as allowed under Rule 15c2-1(a)(1) of the Securities Exchange Act of 1934 (“Exchange Act”) subject to the limits of the Rehypothecation Agreement. See Note 10 “Borrowings” for additional information. |
| (p) | This security was acquired in a transaction that was exempt from the registration requirements of the Securities Act of 1933, as amended (the “Securities Act”), pursuant to Rule 144A thereunder. This security may be resold only in transactions that are exempt from the registration requirements of the Securities Act, normally to qualified institutional buyers. |
| (q) | Controlled investment as defined by the 1940 Act, whereby the Company owns more than 25% of the portfolio company’s outstanding voting securities or maintains the ability to nominate greater than 50% of the board representation. The aggregate fair value of controlled at December 31, 2016 represented 6.3% of the Company’s net assets. Fair value as of December 31, 2015 and December 31, 2016 along with transactions during the year ended December 31, 2016 in these controlled investments were as follows (amounts in thousands): |
| Year Ended December 31, 2016 | Year Ended December 31, 2016 | |||||||||||||||||||||||||||||||||
| Controlled Investments |
Fair Value at |
Gross Additions (Cost)* |
Gross Reductions (Cost)** |
Net Unrealized Gain (Loss) |
Fair Value at December 31, 2016 |
Net Realized Gain (Loss) |
Interest Income |
Fee Income |
Dividend Income |
|||||||||||||||||||||||||
| Comet Aircraft S.A.R.L |
$52,126 | $ | — | $ | — | $ | (2,969 | ) | $ | 49,157 | $ | — | $ | — | $ | — | $ | 4,001 | ||||||||||||||||
| Guardian Investors, LLC |
11,821 | — | (1,569 | ) | (6,548 | ) | 3,704 | — | — | — | 894 | |||||||||||||||||||||||
| Hilding Anders |
||||||||||||||||||||||||||||||||||
| Subordinated Debt |
— | 144,305 | — | (59,612 | ) | 84,693 | — | — | — | — | ||||||||||||||||||||||||
| Arle PIK Interest |
— | — | — | — | — | — | — | — | — | |||||||||||||||||||||||||
| Class A Common Stock |
— | 132 | — | (132 | ) | — | — | — | — | — | ||||||||||||||||||||||||
| Class B Common Stock |
— | 25 | — | (25 | ) | — | — | — | — | — | ||||||||||||||||||||||||
| Class C Common Stock |
— | — | — | — | — | — | — | — | — | |||||||||||||||||||||||||
| Equity Options |
— | 14,988 | — | (12,735 | ) | 2,253 | — | — | — | — | ||||||||||||||||||||||||
| Innovating Partners, LLC |
16,826 | — | (2,509 | ) | (9,945 | ) | 4,372 | — | — | — | 1,182 | |||||||||||||||||||||||
| KKR BPT Holdings |
||||||||||||||||||||||||||||||||||
| Aggregator, LLC |
7,125 | 3,700 | — | (990 | ) | 9,835 | — | — | — | — | ||||||||||||||||||||||||
| Strategic Credit |
||||||||||||||||||||||||||||||||||
| Opportunities Partners, LLC |
— | 92,400 | — | 6,598 | 98,998 | — | — | — | — | |||||||||||||||||||||||||
| Toorak Capital Partners, LLC |
— | 6,984 | — | — | 6,984 | — | — | — | — | |||||||||||||||||||||||||
|
|
|
|
|
|
|
|
|
|
|
|
|
|
|
|
|
|
||||||||||||||||||
| Totals |
$87,898 | $ | 262,534 | $ | (4,078 | ) | $ | (86,358 | ) | $ | 259,996 | $ | — | $ | — | $ | — | $ | 6,077 | |||||||||||||||
|
|
|
|
|
|
|
|
|
|
|
|
|
|
|
|
|
|
||||||||||||||||||
| * | Gross additions include increases in the cost basis of investments resulting from new portfolio investments, PIK interest, the amortization of unearned income, the exchange of one or more existing securities for one or more new securities and the movement of an existing portfolio company into this category from a different category. |
| ** | Gross reductions include decreases in the cost basis of investments resulting from principal collections related to investment repayments or sales, the exchange of one or more existing securities for one or more new securities and the movement of an existing portfolio company out of this category into a different category. |
| (r) | Security is pledged as collateral supporting the amounts outstanding under the repurchase agreement with Credit Suisse Securities (Europe) Limited. See Note 10. “Borrowings” for additional information. |
| (s) | Expiration date contingent on certain events pursuant to underlying agreements. |
| (t) | The issuer of this investment has elected to pay the stated dividend rate upon liquidation of the investment. |
| (u) | 7-day effective yield as of December 31, 2016. |
| (v) | As of December 31, 2016, the aggregate gross unrealized appreciation for all securities in which there was an excess of value over tax cost was $90,073; the aggregate gross unrealized depreciation for all securities in which there was an excess of tax cost over value was $388,565; the net unrealized depreciation was $298,492; the aggregate cost of securities for Federal income tax purposes was $4,323,785. |
| * | Non-income producing security. |
See notes to consolidated financial statements.
F-22
Table of Contents
Corporate Capital Trust, Inc. and Subsidiaries
Consolidated Schedule of Investments (continued)
As of December 31, 2016
(in thousands, except share amounts)
| (1) | Not used. |
| (2) | The interest rate on these investments is subject to a base rate of 3-Month LIBOR, which at December 31, 2016 was 1.00%. The current base rate for each investment may be different from the reference rate on December 31, 2016. |
| (3) | The interest rate on these investments is subject to a base rate of 1-Month LIBOR, which at December 31, 2016 was 0.77%. The current base rate for each investment may be different from the reference rate on December 31, 2016. |
| (4) | The interest rate on these investments is subject to a base rate of 12-Month LIBOR, which at December 31, 2016 was 1.69%. The current base rate for each investment may be different from the reference rate on December 31, 2016. |
| (5) | The interest rate on these investments is subject to the base rate of 3-month EURIBOR, which at December 31, 2016 was (0.32%). The current base rate for each investment may be different from the reference rate on December 31, 2016. |
| (6) | The interest rate on these investments is subject to the base rate of 1-month EURIBOR, which at December 31, 2016 was (0.37%). The current base rate for each investment may be different from the reference rate on December 31, 2016. |
| (7) | The interest rate on these investments is subject to the base rate of PRIME, which at December 31, 2016 was 3.75%. The current base rate for each investment may be different from the reference rate on December 31, 2016. |
Abbreviations:
AUD - Australian Dollar; local currency investment amount is denominated in Australian Dollar. A$1 / US $0.720 as of December 31, 2016.
EUR - Euro; local currency investment amount is denominated in Euros. €1 / US $1.052 as of December 31, 2016.
GBP - British Pound Sterling; local currency investment amount is denominated in Pound Sterling. £1 / US $1.234 as of December 31, 2016.
SEK - Swedish Krona; local currency investment amount is denominated in Swedish Kronor. SEK1 / US $0.109 as of December 31, 2016.
AUS - Australia
CAN - Canada
CYM - Cayman Islands
FRA - France
GBR - United Kingdom
IRL - Ireland
JEY - Jersey
LUX - Luxembourg
NLD - The Netherlands
SGP - Singapore
SPN - Spain
SWE - Sweden
VGB - British Virgin Islands
E = EURIBOR - Euro Interbank Offered Rate
L = LIBOR - London Interbank Offered Rate
P = PRIME – U.S. Prime Rate
PIK - Payment-in-kind; the issuance of additional securities by the borrower to settle interest payment obligations.
See notes to consolidated financial statements.
F-23
Table of Contents
Corporate Capital Trust, Inc. and Subsidiaries
Consolidated Schedule of Investments
As of December 31, 2015
(in thousands, except share amounts)
| Company (a)(b) |
Footnotes |
Industry |
Interest Rate |
Base Rate Floor |
Maturity Date |
No. Shares/ Principal Amount (c) |
Cost (d) |
Fair Value |
||||||||||||||||||||||||||
|
Senior Secured Loans—First Lien—61.5% |
| |||||||||||||||||||||||||||||||||
| Abaco Systems, Inc. |
(e)(f) | Capital Goods | L + 600 | 1.00 | % | 12/7/2021 | $ | 106,016 | $ | 101,282 | $ | 101,245 | ||||||||||||||||||||||
| ABILITY Network, Inc. |
(e)(g) | Health Care Equipment & Services | L + 500 | 1.00 | % | 5/14/2021 | 19,962 | 19,785 | 19,762 | |||||||||||||||||||||||||
| Agro Merchants NAI Holdings, LLC |
(e)(f) | Transportation | L + 700 | 1.00 | % | 10/1/2020 | 71,696 | 70,998 | 70,132 | |||||||||||||||||||||||||
| Algeco/Scotsman (LUX) |
(h)(i)(j)(f)(k) | Consumer Durables & Apparel | 15.75% PIK (15.75% Max PIK) |
5/1/2018 | 35,983 | 32,642 | 6,273 | |||||||||||||||||||||||||||
| AltEn, LLC |
(f)(j)(k)(l)(m) | Energy | L + 900 PIK (L + 900 Max PIK) |
1.00 | % | 9/12/2018 | 33,055 | 29,834 | 9,353 | |||||||||||||||||||||||||
| American Freight, Inc. |
(e)(f) | Retailing | L + 625 | 1.00 | % | 10/31/2020 | 32,363 | 32,227 | 31,978 | |||||||||||||||||||||||||
| Amtek Global Technology Pte. Ltd. (SGP) |
(f)(h)(i)(n)(EUR) | Automobiles & Components | E + 900 | 1.00 | % | 11/10/2019 | € | 59,707 | 60,594 | 58,235 | ||||||||||||||||||||||||
| (f)(h)(i)(n)(EUR) | E + 900 | 1.00 | % | 11/10/2019 | 61,150 | 62,059 | 59,642 | |||||||||||||||||||||||||||
| (f)(h)(i)(n)(EUR) | E + 900 | 1.00 | % | 11/10/2019 | 8,515 | 8,641 | 8,305 | |||||||||||||||||||||||||||
| Applied Systems, Inc. |
(e)(g) | Software & Services | L + 325 | 1.00 | % | 1/25/2021 | $ | 648 | 644 | 637 | ||||||||||||||||||||||||
| Belk, Inc. |
(e) | Retailing | L + 475 | 1.00 | % | 11/18/2022 | 4,230 | 4,030 | 3,744 | |||||||||||||||||||||||||
| BeyondTrust Software, Inc. |
(e)(f) | Software & Services | L + 700 | 1.00 | % | 9/25/2019 | 12,882 | 12,768 | 12,477 | |||||||||||||||||||||||||
| BRG Sports, Inc. |
(l) | Consumer Durables & Apparel | L + 550 | 1.00 | % | 4/15/2021 | 3,869 | 3,807 | 3,826 | |||||||||||||||||||||||||
| Caesars Entertainment Operating Co., Inc. |
(e)(g)(i)(k) | Consumer Services | L + 725 | 3/1/2017 | 10,800 | 10,164 | 9,639 | |||||||||||||||||||||||||||
| California Pizza Kitchen, Inc. |
(e)(g) | Food & Staples Retailing | L + 425 | 1.00 | % | 3/29/2018 | 17,012 | 16,471 | 15,800 | |||||||||||||||||||||||||
See notes to consolidated financial statements.
F-24
Table of Contents
Corporate Capital Trust, Inc. and Subsidiaries
Consolidated Schedule of Investments (continued)
As of December 31, 2015
(in thousands, except share amounts)
Company (a)(b) |
Footnotes |
Industry |
Interest Rate |
Base Rate Floor |
Maturity Date |
No. Shares/ Principal Amount (c) |
Cost (d) |
Fair Value |
||||||||||||||||||||||||||||
| Casual Dining Bidco Limited |
(f)(h)(i)(w)(GBP) | Consumer Services | L + 825 | 12/11/2020 | £ | 40,546 | $ | 60,143 | $ | 58,279 | ||||||||||||||||||||||||||
| Charlotte Russe, Inc. |
(e) | Retailing | L + 550 | 1.25 | % | 5/22/2019 | $ | 4,478 | 4,457 | 3,119 | ||||||||||||||||||||||||||
| (e) | L + 550 | 1.25 | % | 5/22/2019 | 18,291 | 18,155 | 12,895 | |||||||||||||||||||||||||||||
| CityCenter Holdings, LLC |
(g)(l) | Real Estate | L + 325 | 1.00 | % | 10/16/2020 | 5,773 | 5,729 | 5,742 | |||||||||||||||||||||||||||
| David’s Bridal, Inc. |
(e)(g) | Retailing | L + 400 | 1.25 | % | 10/11/2019 | 8,368 | 8,170 | 6,971 | |||||||||||||||||||||||||||
| Distribution International, Inc. |
(g)(l) | Retailing | L + 500 | 1.00 | % | 12/10/2021 | 6,359 | 6,303 | 5,914 | |||||||||||||||||||||||||||
| EagleView Technology Corp. |
(e) | Software & Services | L + 425 | 1.00 | % | 7/15/2022 | 6,930 | 6,864 | 6,794 | |||||||||||||||||||||||||||
| Emerald Performance Materials, LLC |
(g)(l) | Materials | L + 350 | 1.00 | % | 7/30/2021 | 635 | 632 | 624 | |||||||||||||||||||||||||||
| Exemplis Corp. |
(e)(f) | Commercial & Professional Services | L + 650 | 1.00 | % | 3/23/2022 | 67,777 | 67,163 | 67,974 | |||||||||||||||||||||||||||
| Football Association of Ireland (IRL) |
(f)(h)(i)(EUR) | Consumer Durables & Apparel | 6.40% | 12/20/2020 | € | 41,615 | 55,884 | 46,258 | ||||||||||||||||||||||||||||
| Greystone & Co., Inc. |
(e)(f) | Diversified Financials | L + 800 | 1.00 | % | 3/26/2021 | $ | 33,581 | 33,107 | 32,228 | ||||||||||||||||||||||||||
| Grocery Outlet, Inc. |
(e)(g) | Food & Staples Retailing | L + 375 | 1.00 | % | 10/21/2021 | 2,953 | 2,962 | 2,849 | |||||||||||||||||||||||||||
| Gymboree Corp. |
(e) | Retailing | L + 350 | 1.50 | % | 2/23/2018 | 11,892 | 10,958 | 6,142 | |||||||||||||||||||||||||||
| Hanson Building Products North America |
(e)(g)(i) | Materials | L + 550 | 1.00 | % | 3/13/2022 | 22,995 | 22,802 | 22,363 | |||||||||||||||||||||||||||
| Harbor Freight Tools USA, Inc. |
(e)(g) | Capital Goods | L + 375 | 1.00 | % | 7/26/2019 | 2,823 | 2,828 | 2,824 | |||||||||||||||||||||||||||
| Hillman Group, Inc. |
(e)(g) | Consumer Durables & Apparel | L + 350 | 1.00 | % | 6/30/2021 | 829 | 831 | 804 | |||||||||||||||||||||||||||
See notes to consolidated financial statements.
F-25
Table of Contents
Corporate Capital Trust, Inc. and Subsidiaries
Consolidated Schedule of Investments (continued)
As of December 31, 2015
(in thousands, except share amounts)
Company (a)(b) |
Footnotes |
Industry |
Interest Rate |
Base Rate Floor |
Maturity Date |
No. Shares/ Principal Amount (c) |
Cost (d) |
Fair Value |
||||||||||||||||||||||||||||||||
| iPayment, Inc. |
(e)(g) | Software & Services | L + 525 | 1.50 | % | 5/8/2017 | $ | 29,163 | $ | 29,016 | $ | 28,037 | ||||||||||||||||||||||||||||
| Jacuzzi Brands, Inc. |
(e)(f) | Capital Goods | L + 650 | 1.25 | % | 7/3/2019 | 18,200 | 17,960 | 18,054 | |||||||||||||||||||||||||||||||
| Jacuzzi Brands, Inc. (LUX) |
(e)(f)(h) | Capital Goods | L + 650 | 1.25 | % | 7/3/2019 | 20,118 | 19,853 | 19,956 | |||||||||||||||||||||||||||||||
| KeyPoint Government Solutions, Inc. |
(e)(f) | Capital Goods | L + 650 | 1.25 | % | 11/13/2017 | 32,217 | 31,949 | 32,242 | |||||||||||||||||||||||||||||||
|
Keystone Australia Holdings, Pty. Ltd. (AUS) |
(f)(h)(i)(AUD) | Consumer Services | 15.00% | 8/7/2019 | A$ | 31,021 | 29,176 | 21,471 | ||||||||||||||||||||||||||||||||
| Koosharem, LLC |
(e)(g) | Commercial & Professional Services | L + 650 | 1.00 | % | 5/15/2020 | $ | 42,645 | 42,283 | 40,087 | ||||||||||||||||||||||||||||||
| Kurt Geiger Ltd. (GBR) |
(f)(h)(i)(j)(GBP) | Consumer Durables & Apparel | |
10.00% 1.00% PIK (1.00% Max PIK) |
|
4/8/2019 | £ | 47,339 | 78,021 | 71,880 | ||||||||||||||||||||||||||||||
| Marshall Retail Group, LLC |
(e)(f) | Retailing | L + 600 | 1.00 | % | 8/25/2020 | $ | 16,636 | 16,483 | 15,088 | ||||||||||||||||||||||||||||||
| MCS AMS Sub-Holdings, LLC |
(e) | Commercial & Professional Services | L + 650 | 1.00 | % | 10/15/2019 | 26,981 | 26,353 | 22,124 | |||||||||||||||||||||||||||||||
| MSX International, Inc. |
(e) | Software & Services | L + 500 | 1.00 | % | 8/18/2020 | 2,368 | 2,270 | 2,362 | |||||||||||||||||||||||||||||||
| Neiman Marcus Group, LLC |
(e)(g) | Retailing | L + 325 | 1.00 | % | 10/25/2020 | 4,926 | 4,863 | 4,374 | |||||||||||||||||||||||||||||||
|
New Enterprise Stone & Lime Co., Inc. |
(e)(f) | Capital Goods | L + 700 | 1.00 | % | 2/12/2019 | 56,298 | 56,298 | 55,234 | |||||||||||||||||||||||||||||||
| Nine West Holdings, Inc. |
(e)(g) | Consumer Durables & Apparel | L + 375 | 1.00 | % | 10/8/2019 | 13,417 | 13,214 | 9,486 | |||||||||||||||||||||||||||||||
| NMI Holdings, Inc. |
(f)(i)(o) | Insurance | L + 750 | 1.00 | % | 11/15/2018 | 37,810 | 37,447 | 37,610 | |||||||||||||||||||||||||||||||
See notes to consolidated financial statements
F-26
Table of Contents
Corporate Capital Trust, Inc. and Subsidiaries
Consolidated Schedule of Investments (continued)
As of December 31, 2015
(in thousands, except share amounts)
Company (a)(b) |
Footnotes |
Industry |
Interest Rate |
Base Rate Floor |
Maturity Date |
No. Shares/ Principal Amount (c) |
Cost (d) |
Fair Value |
||||||||||||||||||||||||||||
| P & L Development, LLC |
(f)(j)(l) | Pharmaceuticals, Biotechnology & Life Sciences |
|
L + 750 1.00% PIK (1.00% Max PIK) |
|
5/1/2020 | $ | 56,305 | $ | 55,805 | $ | 53,634 | ||||||||||||||||||||||||
| Pacific Union Financial, LLC |
(f)(l) | Diversified Financials | L + 800 | 1.00 | % | 5/31/2019 | 60,650 | 59,793 | 58,703 | |||||||||||||||||||||||||||
| Paradigm Acquisition Corp. |
(e) | Health Care Equipment & Services | L + 500 | 1.00 | % | 6/2/2022 | 11,036 | 10,881 | 10,833 | |||||||||||||||||||||||||||
| Payless, Inc. |
(e)(f) | Retailing | L + 625 | 1.00 | % | 3/2/2019 | 12,973 | 12,771 | 12,766 | |||||||||||||||||||||||||||
| Petroplex Acidizing, Inc. |
(e)(f)(j) | Energy | |
L + 625 1.75% PIK (1.75% Max PIK) |
1.00 | % | 12/4/2019 | 36,623 | 36,173 | 28,473 | ||||||||||||||||||||||||||
| Plaskolite, LLC |
(e)(g) | Materials | L + 475 | 1.00 | % | 11/3/2022 | 3,250 | 3,218 | 3,234 | |||||||||||||||||||||||||||
| Proserv Acquisition, LLC |
(e)(i) | Energy | L + 538 | 1.00 | % | 12/22/2021 | 27,309 | 21,576 | 19,344 | |||||||||||||||||||||||||||
| Proserv Acquisition, LLC (GBR) |
(e)(h)(i) | Energy | L + 538 | 1.00 | % | 12/22/2021 | 16,029 | 12,663 | 11,354 | |||||||||||||||||||||||||||
| Raley’s |
(e) | Food & Staples Retailing | L + 625 | 1.00 | % | 4/10/2022 | 29,216 | 28,259 | 29,070 | |||||||||||||||||||||||||||
| RedPrairie Corp. |
(e)(g) | Software & Services | L + 500 | 1.00 | % | 12/21/2018 | 26,276 | 25,400 | 23,498 | |||||||||||||||||||||||||||
| Riverbed Technology, Inc. |
(e)(g) | Technology Hardware & Equipment | L + 500 | 1.00 | % | 4/24/2022 | 7,672 | 7,636 | 7,652 | |||||||||||||||||||||||||||
| SARquavitae Servicios a la Dependencia, S.L. (LUX) |
(f)(h)(i)(n)(EUR) (f)(h)(i)(n)(EUR) (f)(h)(i)(n)(EUR) |
Health Care Equipment & Services | |
E + 800 E + 800 E + 800 |
|
|
1.00 1.00 1.00 |
% % % |
|
9/30/2022 9/30/2022 9/30/2022 |
|
€ |
3,131 14,306 28,297 |
|
|
3,226 14,741 29,158 |
|
|
3,304 15,096 29,861 |
| ||||||||||||||||
See notes to consolidated financial statements.
F-27
Table of Contents
Corporate Capital Trust, Inc. and Subsidiaries
Consolidated Schedule of Investments (continued)
As of December 31, 2015
(in thousands, except share amounts)
Company (a)(b) |
Footnotes |
Industry |
Interest Rate |
Base Rate Floor |
Maturity Date |
No. Shares/ Principal Amount (c) |
Cost (d) |
Fair Value |
||||||||||||||||||||||||||||
| TIBCO Software, Inc. |
(g)(l) | Software & Services | L + 550 | 1.00 | % | 12/4/2020 | $ | 57,661 | $ | 56,102 | $ | 52,543 | ||||||||||||||||||||||||
| Traverse Midstream Partners, LLC |
(f)(l) | Energy | L + 1000 | 1.00 | % | 11/10/2020 | 17,611 | 17,267 | 16,301 | |||||||||||||||||||||||||||
| TTM Technologies, Inc. |
(e)(i) | Technology Hardware & Equipment | L + 500 | 1.00 | % | 5/31/2021 | 11,950 | 11,562 | 10,845 | |||||||||||||||||||||||||||
| Tweddle Group, Inc. |
(e)(f) | Automobiles & Components | L + 675 | 1.00 | % | 4/7/2020 | 42,905 | 42,069 | 42,590 | |||||||||||||||||||||||||||
| Waste Pro USA, Inc. |
(e)(f) | Transportation | L + 750 | 1.00 | % | 10/15/2020 | 36,314 | 36,314 | 35,891 | |||||||||||||||||||||||||||
| Willbros Group, Inc. |
(e)(f) | Energy | L + 975 | 1.25 | % | 12/15/2019 | 26,467 | 26,467 | 25,686 | |||||||||||||||||||||||||||
| Z Gallerie, Inc. |
(e)(f) | Retailing | L + 650 | 1.00 | % | 10/8/2020 | 32,273 | 31,962 | 32,157 | |||||||||||||||||||||||||||
| Total Senior Secured Loans—First Lien |
$ | 1,721,163 | $ | 1,593,668 | ||||||||||||||||||||||||||||||||
|
|
|
|
|
|||||||||||||||||||||||||||||||||
| Senior Secured Loans—Second Lien—42.4% |
||||||||||||||||||||||||||||||||||||
| Abaco Systems, Inc. |
(e)(f) | Capital Goods | L + 1050 | 1.00 | % | 6/7/2022 | $ | 63,371 | $ | 62,107 | $ | 62,104 | ||||||||||||||||||||||||
| Angelica Corp. |
(e)(f) | Health Care Equipment & Services | L + 875 | 1.25 | % | 8/20/2019 | 50,869 | 50,869 | 44,179 | |||||||||||||||||||||||||||
| Applied Systems, Inc. |
(e)(g) | Software & Services | L + 650 | 1.00 | % | 1/24/2022 | 36,703 | 36,953 | 34,134 | |||||||||||||||||||||||||||
| Belk, Inc. |
(f) | Retailing | 10.50% | 6/12/2023 | 99,615 | 97,627 | 95,730 | |||||||||||||||||||||||||||||
| Brake Bros Ltd. (GBR) |
(h)(i)(j)(w)(GBP) | Food & Staples Retailing | |
L + 325 3.00% PIK (3.00% Max PIK) |
|
3/12/2017 | £ | 3,480 | 5,014 | 5,130 | ||||||||||||||||||||||||||
| BRG Sports, Inc. |
(l) | Consumer Durables & Apparel | L + 925 | 1.00 | % | 4/15/2022 | $ | 23,855 | 23,678 | 21,947 | ||||||||||||||||||||||||||
See notes to consolidated financial statements.
F-28
Table of Contents
Corporate Capital Trust, Inc. and Subsidiaries
Consolidated Schedule of Investments (continued)
As of December 31, 2015
(in thousands, except share amounts)
Company (a)(b) |
Footnotes |
Industry |
Interest Rate |
Base Rate Floor |
Maturity Date |
No. Shares/ Principal Amount (c) |
Cost (d) |
Fair Value |
||||||||||||||||||||||||||||
| CPI International, Inc. |
(e)(f) | Capital Goods | L + 700 | 1.00 | % | 9/16/2017 | $ | 28,000 | $ | 27,504 | $ | 27,175 | ||||||||||||||||||||||||
| CTI Foods Holding Co., LLC |
(e) | Food, Beverage & Tobacco | L + 725 | 1.00 | % | 6/28/2021 | 23,219 | 22,954 | 21,129 | |||||||||||||||||||||||||||
| Deltek, Inc. |
(e)(g) | Software & Services | L + 850 | 1.00 | % | 6/17/2023 | 62,369 | 61,775 | 61,823 | |||||||||||||||||||||||||||
| EagleView Technology Corp. |
(e) | Software & Services | L + 825 | 1.00 | % | 7/14/2023 | 33,000 | 32,522 | 31,639 | |||||||||||||||||||||||||||
| Emerald Performance Materials, LLC |
(g)(l) | Materials | L + 675 | 1.00 | % | 8/1/2022 | 2,041 | 2,032 | 1,939 | |||||||||||||||||||||||||||
| Excelitas Technologies Corp. |
(e)(f)(j) | Technology Hardware & Equipment | |
L + 975 3.00% PIK (3.00% Max PIK) |
1.00 | % | 4/29/2021 | 110,862 | 110,862 | 102,760 | ||||||||||||||||||||||||||
| Genoa, a QoL Healthcare Co., LLC |
(e) | Health Care Equipment & Services | L + 775 | 1.00 | % | 4/28/2023 | 6,403 | 6,342 | 6,019 | |||||||||||||||||||||||||||
| Greenway Medical Technologies |
(e) | Health Care Equipment & Services | L + 825 | 1.00 | % | 11/4/2021 | 23,057 | 22,779 | 22,135 | |||||||||||||||||||||||||||
| Grocery Outlet, Inc. |
(e)(g) | Food & Staples Retailing | L + 825 | 1.00 | % | 10/21/2022 | 49,688 | 48,285 | 49,005 | |||||||||||||||||||||||||||
| Gruppo Argenta S.p.A. (LUX) |
(f)(h)(i)(j)(EUR) | Retailing | |
12.00% PIK (12.00% Max PIK) |
1/31/2019 | € | 25,598 | 29,189 | 24,415 | |||||||||||||||||||||||||||
| (f)(h)(i)(j)(EUR) | |
12.00% PIK (12.00% Max PIK) |
1/31/2019 | 3,485 | 3,747 | 3,324 | ||||||||||||||||||||||||||||||
| Gypsum Management & Supply, Inc. |
(e)(g) | Capital Goods | L + 675 | 1.00 | % | 4/1/2022 | $ | 14,802 | 14,411 | 13,886 | ||||||||||||||||||||||||||
| iParadigms Holdings, LLC |
(e) | Software & Services | L + 725 | 1.00 | % | 7/29/2022 | 24,366 | 24,205 | 23,879 | |||||||||||||||||||||||||||
See notes to consolidated financial statements
F-29
Table of Contents
Corporate Capital Trust, Inc. and Subsidiaries
Consolidated Schedule of Investments (continued)
As of December 31, 2015
(in thousands, except share amounts)
Company (a)(b) |
Footnotes |
Industry |
Interest Rate |
Base Rate Floor |
Maturity Date |
No. Shares/ Principal Amount (c) |
Cost (d) |
Fair Value |
||||||||||||||||||||||||||||
| Learfield Communications, Inc. |
(e) | Media | L + 775 | 1.00 | % | 10/8/2021 | $ | 26,434 | $ | 26,620 | $ | 26,170 | ||||||||||||||||||||||||
| Lightower Fiber, LLC |
(e)(g) | Telecommunication Services | L + 675 | 1.25 | % | 4/12/2021 | 29,022 | 28,565 | 28,097 | |||||||||||||||||||||||||||
| Maxim Crane, LP |
(g)(l) | Capital Goods | L + 925 | 1.00 | % | 11/26/2018 | 970 | 988 | 960 | |||||||||||||||||||||||||||
| Misys Ltd. (GBR) |
(g)(h)(i) | Software & Services | 12.00% | 6/12/2019 | 3,000 | 3,259 | 3,215 | |||||||||||||||||||||||||||||
| NEP Group, Inc. |
(e)(g) | Media | L + 875 | 1.25 | % | 7/22/2020 | 1,150 | 1,116 | 1,087 | |||||||||||||||||||||||||||
| NewWave Communications |
(e) | Media | L + 800 | 1.00 | % | 10/30/2020 | 13,712 | 13,678 | 13,370 | |||||||||||||||||||||||||||
| P2 Energy Solutions, Inc. |
(e)(i) | Software & Services | L + 800 | 1.00 | % | 4/30/2021 | 74,312 | 72,439 | 62,236 | |||||||||||||||||||||||||||
| (e)(g)(i) | L + 800 | 1.00 | % | 4/30/2021 | 9,283 | 9,210 | 7,774 | |||||||||||||||||||||||||||||
| Petrochoice Holdings, Inc. |
(f)(l) | Capital Goods | L + 875 | 1.00 | % | 8/21/2023 | 50,000 | 49,024 | 47,943 | |||||||||||||||||||||||||||
| Plaskolite, LLC |
(e)(f) | Materials | L + 825 | 1.00 | % | 9/14/2023 | 29,350 | 28,410 | 27,990 | |||||||||||||||||||||||||||
| Polyconcept Finance B.V. (NLD) |
(f)(h)(i)(l) | Consumer Durables & Apparel | L + 875 | 1.25 | % | 6/28/2020 | 46,727 | 46,727 | 45,852 | |||||||||||||||||||||||||||
| Progressive Solutions |
(l) | Health Care Equipment & Services | L + 850 | 1.00 | % | 10/22/2021 | 17,145 | 17,007 | 16,974 | |||||||||||||||||||||||||||
| RedPrairie Corp. |
(e) | Software & Services | L+1000 | 1.25 | % | 12/21/2019 | 39,868 | 37,602 | 32,925 | |||||||||||||||||||||||||||
| Safety Technology Holdings, Inc. |
(e)(f) | Technology Hardware & Equipment | L + 825 | 1.00 | % | 6/2/2020 | 30,402 | 29,834 | 30,244 | |||||||||||||||||||||||||||
| SI Organization, Inc. |
(e) | Capital Goods | L + 800 | 1.00 | % | 5/23/2020 | 56,000 | 55,558 | 55,020 | |||||||||||||||||||||||||||
| Talbots, Inc. |
(e)(g) | Retailing | L + 850 | 1.00 | % | 3/19/2021 | 8,022 | 7,993 | 7,567 | |||||||||||||||||||||||||||
See notes to consolidated financial statements.
F-30
Table of Contents
Corporate Capital Trust, Inc. and Subsidiaries
Consolidated Schedule of Investments (continued)
As of December 31, 2015
(in thousands, except share amounts)
Company (a)(b) |
Footnotes |
Industry |
Interest Rate |
Base Rate Floor |
Maturity Date |
No. Shares/ Principal Amount (c) |
Cost (d) |
Fair Value |
||||||||||||||||||||||||||||
| Valeo Foods Group Ltd. (IRL) |
(f)(h)(i)(x)(GBP) | Food, Beverage & Tobacco | L + 800 | 1.00 | % | 5/8/2023 | £ | 29,125 | $ | 43,633 | $ | 41,005 | ||||||||||||||||||||||||
| Total Senior Secured Loans—Second Lien |
|
$ | 1,154,518 | $ | 1,100,781 | |||||||||||||||||||||||||||||||
|
|
|
|
|
|||||||||||||||||||||||||||||||||
| Senior Secured Bonds—7.1% |
||||||||||||||||||||||||||||||||||||
| Altice International S.A.R.L. (LUX) |
(h)(i)(r)(s) | Media | 6.63% | 2/15/2023 | $ | 1,420 | $ | 1,420 | $ | 1,402 | ||||||||||||||||||||||||||
| Artesyn Technologies, Inc. |
(g)(r)(s) | Technology Hardware & Equipment | 9.75% | 10/15/2020 | 24,387 | 23,937 | 21,643 | |||||||||||||||||||||||||||||
| Guitar Center, Inc. |
(r)(s) | Retailing | 6.50% | 4/15/2019 | 27,739 | 27,336 | 23,578 | |||||||||||||||||||||||||||||
| Hot Topic, Inc. |
(r)(s) | Consumer Durables & Apparel | 9.25% | 6/15/2021 | 887 | 961 | 785 | |||||||||||||||||||||||||||||
| iPayment, Inc. |
(r)(s) | Software & Services | 9.50% | 12/15/2019 | 8,597 | 8,597 | 8,919 | |||||||||||||||||||||||||||||
| Louisiana Public Facilities Authority |
(f)(k) | Energy | 11.50% | 1/1/2020 | 34,330 | 33,586 | 32,946 | |||||||||||||||||||||||||||||
| (f)(k)(r) | L + 1000 | 1/1/2020 | 10,650 | 10,650 | 10,159 | |||||||||||||||||||||||||||||||
| NESCO, LLC |
(r)(s) | Capital Goods | 6.88% | 2/15/2021 | 12,190 | 8,153 | 7,314 | |||||||||||||||||||||||||||||
| New Enterprise Stone & Lime Co., Inc. |
(j)(s) | Capital Goods | |
7.00% 6.00% PIK (12.00% Max PIK) |
|
3/15/2018 | 36,933 | 39,189 | 37,672 | |||||||||||||||||||||||||||
| OAG Holdings, LLC |
(f)(j) | Energy | |
8.00% 2.00% PIK (2.00% Max PIK) |
|
12/20/2020 | 20,834 | 18,376 | 2,879 | |||||||||||||||||||||||||||
| Rockport Group, LLC |
(f) | Consumer Durables & Apparel | 9.50% | 7/31/2022 | 28,516 | 27,836 | 27,173 | |||||||||||||||||||||||||||||
See notes to consolidated financial statements.
F-31
Table of Contents
Corporate Capital Trust, Inc. and Subsidiaries
Consolidated Schedule of Investments (continued)
As of December 31, 2015
(in thousands, except share amounts)
Company (a)(b) |
Footnotes |
Industry |
Interest Rate |
Base Rate Floor |
Maturity Date |
No. Shares/ Principal Amount (c) |
Cost (d) |
Fair Value |
||||||||||||||||||||||||||||
| SquareTwo Financial Corp. |
(k)(s) | Banks | 11.63% | 4/1/2017 | $ | 16,044 | $ | 15,885 | $ | 8,824 | ||||||||||||||||||||||||||
| Towergate (GBR) |
(h)(i)(s)(GBP) | Insurance | 8.75% | 4/2/2020 | £ | 936 | 1,424 | 1,215 | ||||||||||||||||||||||||||||
| Total Senior Secured Bonds |
$ | 217,350 | $ | 184,509 | ||||||||||||||||||||||||||||||||
|
|
|
|
|
|||||||||||||||||||||||||||||||||
| Total Senior Debt |
$ | 3,093,031 | $ | 2,878,958 | ||||||||||||||||||||||||||||||||
|
|
|
|
|
|||||||||||||||||||||||||||||||||
| Subordinated Debt—17.6% |
| |||||||||||||||||||||||||||||||||||
| Alion Science & Technology Corp. |
(f)(r) |
Capital Goods |
11.00% | 8/19/2022 | $ | 68,603 | $ | 67,598 | $ | 64,606 | ||||||||||||||||||||||||||
| Block Communications, Inc. |
(r)(s) |
Media |
7.25% | 2/1/2020 | 463 | 473 | 461 | |||||||||||||||||||||||||||||
| Builders FirstSource, Inc. |
(i)(r)(s) |
Capital Goods |
10.75% | 8/15/2023 | 15,522 | 15,522 | 15,405 | |||||||||||||||||||||||||||||
| Cemex Materials, LLC |
(r)(s) |
Materials |
7.70% | 7/21/2025 | 58,454 | 62,281 | 55,209 | |||||||||||||||||||||||||||||
| Cequel Communications Holdings, LLC |
(r)(s) |
Media |
5.13% | 12/15/2021 | 20,751 | 20,536 | 18,676 | |||||||||||||||||||||||||||||
|
(i)(r)(s) |
7.75% | 7/15/2025 | 20,456 | 20,135 | 18,717 | |||||||||||||||||||||||||||||||
| CHS/Community Health Systems, Inc. |
(i)(s) |
Health Care Equipment & Services |
6.88% | 2/1/2022 | 114 | 114 | 108 | |||||||||||||||||||||||||||||
| Datatel, Inc. |
(r)(s) |
Software & Services |
9.00% | 9/30/2023 | 3,120 | 3,014 | 3,015 | |||||||||||||||||||||||||||||
| Essar Steel Algoma, Inc. (CAN) |
(h)(i)(j)(k)(s) |
Materials |
|
14.00% PIK (14.00% Max PIK) |
2/13/2020 | 5,069 | 4,383 | 1 | ||||||||||||||||||||||||||||
| Exemplis Corp. |
(e)(f)(j) |
Commercial & Professional Services |
|
L + 700 2.00% PIK (2.00% Max PIK) |
3/23/2020 | 25,167 | 25,167 | 24,854 | ||||||||||||||||||||||||||||
See notes to consolidated financial statements.
F-32
Table of Contents
Corporate Capital Trust, Inc. and Subsidiaries
Consolidated Schedule of Investments (continued)
As of December 31, 2015
(in thousands, except share amounts)
Company (a)(b) |
Footnotes |
Industry |
Interest Rate |
Base Rate Floor |
Maturity Date |
No. Shares/ Principal Amount (c) |
Cost (d) |
Fair Value |
||||||||||||||||||||
| GCI, Inc. |
(s) | Telecommunication Services | 6.75% | 6/1/2021 | $ | 2,430 | $ | 2,424 | $ | 2,466 | ||||||||||||||||||
| (s) | 6.88% | 4/15/2025 | 30,141 | 29,979 | 30,819 | |||||||||||||||||||||||
| Global Closure Systems (FRA) |
(f)(h)(i)(j)(EUR) | Materials | |
13.00% PIK (13.00% Max PIK) |
11/15/2019 | € | 22,936 | 29,782 | 25,175 | |||||||||||||||||||
| Gruppo Argenta S.p.A. (LUX) |
(f)(h)(i)(j)(EUR) | Retailing | |
15.00% PIK (15.00% Max PIK) |
11/11/2018 | 773 | 1,035 | 658 | ||||||||||||||||||||
| Hilding Anders (SWE) |
(f)(h)(i)(j)(m)(EUR) | Consumer Durables & Apparel | |
13.00% PIK (13.00% Max PIK) |
6/30/2021 | 105,174 | 125,732 | 92,984 | ||||||||||||||||||||
| (f)(h)(i)(j)(k)(m)(EUR) | |
12.00% PIK (12.00% Max PIK) |
12/31/2023 | 19,813 | 939 | 0 | ||||||||||||||||||||||
| (f)(h)(i)(j)(k)(m)(EUR) | |
18.00% PIK (18.00% Max PIK) |
12/31/2024 | 9,860 | 8,485 | 1,489 | ||||||||||||||||||||||
| Hillman Group, Inc. |
(r)(s) | Consumer Durables & Apparel | 6.38% | 7/15/2022 | $ | 3,953 | 3,812 | 3,281 | ||||||||||||||||||||
| Hot Topic, Inc. |
(j)(r)(s) | Consumer Durables & Apparel | |
12.00% (12.75% Max PIK) |
5/15/2019 | 9,662 | 9,616 | 8,068 | ||||||||||||||||||||
| IMS Health, Inc. |
(i)(r)(s) | Health Care Equipment & Services | 6.00% | 11/1/2020 | 9,513 | 9,880 | 9,798 | |||||||||||||||||||||
| JC Penney Corp., Inc. |
(i)(s) | Retailing | 5.65% | 6/1/2020 | 8,440 | 6,069 | 6,752 | |||||||||||||||||||||
See notes to consolidated financial statements.
F-33
Table of Contents
Corporate Capital Trust, Inc. and Subsidiaries
Consolidated Schedule of Investments (continued)
As of December 31, 2015
(in thousands, except share amounts)
Company (a)(b) |
Footnotes |
Industry |
Interest Rate |
Base Rate Floor |
Maturity Date |
No. Shares/ Principal Amount (c) |
Cost (d) |
Fair Value |
||||||||||||||||||||||||||||
| Kenan Advantage Group, Inc. |
(r)(s) | Transportation | 7.88% | 7/31/2023 | $ | 30,097 | $ | 30,097 | $ | 29,909 | ||||||||||||||||||||||||||
| Lightower Fiber, LLC |
(f) | Telecommunication Services | 10.00% | 2/12/2022 | 11,555 | 11,324 | 11,187 | |||||||||||||||||||||||||||||
| (f)(j) | |
12.00% PIK (12.00% Max PIK) |
|
8/12/2025 | 8,531 | 8,362 | 8,112 | |||||||||||||||||||||||||||||
| Platform Specialty Products Corp. |
(i)(r) | Materials | 10.38% | 5/1/2021 | 7,813 | 7,813 | 7,793 | |||||||||||||||||||||||||||||
| TIBCO Software, Inc. |
(r)(s) | Software & Services | 11.38% | 12/1/2021 | 21,219 | 20,729 | 17,744 | |||||||||||||||||||||||||||||
| Total Subordinated Debt |
|
$ | 525,301 | $ | 457,287 | |||||||||||||||||||||||||||||||
|
|
|
|
|
|||||||||||||||||||||||||||||||||
| Structured Products—4.5% |
| |||||||||||||||||||||||||||||||||||
| Comet Aircraft S.A.R.L. (LUX), Common Shares |
(f)(h)(i)(t) | Capital Goods | $ | 49,618 | $ | 49,618 | $ | 52,126 | ||||||||||||||||||||||||||||
| Guardian Investors, LLC, Membership Interest |
(f)(i)(t) | Diversified Financials | N/A | 10,429 | 11,821 | |||||||||||||||||||||||||||||||
| Innovating Partners, LLC, Membership Interest |
(f)(i)(t) | Diversified Financials | N/A | 13,872 | 16,826 | |||||||||||||||||||||||||||||||
| KKR BPT Holdings Aggregator, LLC, Membership Interest |
(f)(i)(t)* | Diversified Financials | N/A | 9,500 | 7,125 | |||||||||||||||||||||||||||||||
| Trade Finance Funding I, Ltd. 2013-1A Class B (CYM) |
(f)(h)(i)(r) | Diversified Financials | 10.75% | 11/13/2018 | 28,221 | 28,221 | 28,310 | |||||||||||||||||||||||||||||
| Total Structured Products |
|
$ | 111,640 | $ | 116,208 | |||||||||||||||||||||||||||||||
|
|
|
|
|
|||||||||||||||||||||||||||||||||
| Equity/Other—10.4% |
| |||||||||||||||||||||||||||||||||||
| Alion Science & Technology Corp., Membership Interest |
(f)* | Capital Goods | N/A | $ | 7,350 | $ | 7,955 | |||||||||||||||||||||||||||||
| AltEn, LLC, Membership Units |
(f)(m)* | Energy | 2,384 | 2,955 | — | |||||||||||||||||||||||||||||||
See notes to consolidated financial statements.
F-34
Table of Contents
Corporate Capital Trust, Inc. and Subsidiaries
Consolidated Schedule of Investments (continued)
As of December 31, 2015
(in thousands, except share amounts)
Company (a)(b) |
Footnotes |
Industry |
Interest Rate |
Base Rate Floor |
Maturity Date |
No. Shares/ Principal Amount (c) |
Cost (d) |
Fair Value |
||||||||||||||||||||||||
| Amtek Global Technology Pte. Ltd. (SGP), Warrants |
(f)(h)(i)*(EUR) | Automobiles & Components | 12/31/2017 | 9,991 | $ | 4,636 | $ | 4,551 | ||||||||||||||||||||||||
| (f)(h)(i)*(EUR) | 12/31/2018 | 9,991 | 4,785 | 4,754 | ||||||||||||||||||||||||||||
| Belk, Inc., Common Stock |
(f)* | Retailing | 1,642 | 9,961 | 9,510 | |||||||||||||||||||||||||||
| Cengage Learning Holdings II, LP, Common Stock |
Media | 227,802 | 7,529 | 5,239 | ||||||||||||||||||||||||||||
| Education Management Corp., Common Stock |
(f)* | Consumer Services | 3,779,591 | 1,047 | — | |||||||||||||||||||||||||||
| Education Management Corp., Warrants |
(f)* | 1/5/2022 | 2,320,791 | 371 | — | |||||||||||||||||||||||||||
| Excelitas Technologies Corp., Class A Membership Interest |
(f)* | Technology Hardware & Equipment | N/A | 5,636 | 3,199 | |||||||||||||||||||||||||||
| GA Capital Specialty Lending Fund, Limited Partnership Interest |
(f)(i) | Diversified Financials | N/A | 33,881 | 33,881 | |||||||||||||||||||||||||||
| Genesys Telecommunications Laboratories, Inc., Common Stock |
(f)* | Software & Services | 5,775 | 449 | 712 | |||||||||||||||||||||||||||
| Global Closure Systems (FRA), Limited Partnership Interest |
(f)(h)(i)*(EUR) | Materials | N/A | 823 | 1,911 | |||||||||||||||||||||||||||
| Gruppo Argenta S.p.A. (LUX), Warrants |
(f)(h)(i)*(EUR) | Retailing | (y | ) | 225,289 | 5,342 | 2,332 | |||||||||||||||||||||||||
| Hilding Anders (SWE), Class A Common Stock |
(f)(h)(i)(m)*(SEK) | Consumer Durables & Apparel | 1,394,288 | 132 | — | |||||||||||||||||||||||||||
| Hilding Anders (SWE), Class B Common Stock |
(f)(h)(i)(m)*(SEK) | 260,253 | 25 | — | ||||||||||||||||||||||||||||
| Hilding Anders (SWE), Equity Options |
(f)(h)(i)(m)*(SEK) | 12/31/2020 | 236,160,807 | 14,988 | 213 | |||||||||||||||||||||||||||
| Home Partners of America, Inc., Common Stock |
(f)(m)* | Real Estate | 73,500 | 73,208 | 76,608 | |||||||||||||||||||||||||||
| Home Partners of America, Inc., Warrants |
(f)(m)* | 8/7/2024 | 2,675 | 292 | 370 | |||||||||||||||||||||||||||
| iPayment, Inc., Common Stock |
(f)* | Software & Services | 538,144 | 1,988 | 2,296 | |||||||||||||||||||||||||||
See notes to consolidated financial statements.
F-35
Table of Contents
Corporate Capital Trust, Inc. and Subsidiaries
Consolidated Schedule of Investments (continued)
As of December 31, 2015
(in thousands, except share amounts)
Company (a)(b) |
Footnotes |
Industry |
Interest Rate |
Base Rate Floor |
Maturity Date |
No. Shares/ Principal Amount (c) |
Cost (d) |
Fair Value |
||||||||||||||||||||||||||||
| Jones Apparel Group Holdings, Inc., Common Stock |
(f)* | Consumer Durables & Apparel | 5,451 | $ | 872 | $ | 2,289 | |||||||||||||||||||||||||||||
|
Keystone Australia Holdings, Pty. Ltd. (AUS), Warrants |
(f)(h)(i)*(AUD) | Consumer Services | (y | ) | 1,588,469 | 1,019 | — | |||||||||||||||||||||||||||||
| Kurt Geiger Ltd. (GBR), Common Stock |
(f)(h)(i) | Consumer Durables & Apparel | 5,451 | 65 | 14,272 | |||||||||||||||||||||||||||||||
| Nine West Holdings, Inc., Common Stock |
(f)* | Consumer Durables & Apparel | 5,451 | 6,541 | 82 | |||||||||||||||||||||||||||||||
| OAG Holdings, LLC, Overriding Royalty Interest |
(f) | Energy | N/A | 2,354 | — | |||||||||||||||||||||||||||||||
| Orchard Marine, Ltd. (VGB), Class B Common Stock |
(f)(h)(i)(m)* | Transportation | 1,964 | 3,069 | — | |||||||||||||||||||||||||||||||
| Orchard Marine, Ltd. (VGB), Series A Preferred Stock |
(f)(h)(i)(m) | 9.00 | % | 43,945 | 42,987 | 38,082 | ||||||||||||||||||||||||||||||
| Star Mountain SMB Multi-Manager Credit Platform, LP, Limited Partnership Interest |
(f)(i) | Diversified Financials | N/A | 42,756 | 42,926 | |||||||||||||||||||||||||||||||
| Stuart Weitzman, Inc., Other |
(f) | Consumer Durables & Apparel | N/A | — | 1,127 | |||||||||||||||||||||||||||||||
| SUN NewCo, Common Shares A |
(f)(i)*(GBP) | Insurance | 16,450 | — | — | |||||||||||||||||||||||||||||||
| SUN NewCo, Preference B Shares |
(f)(i)*(GBP) | 6,113,719 | 9,065 | 9,752 | ||||||||||||||||||||||||||||||||
| Towergate (GBR), Ordinary Shares |
(f)(h)(i)*(GBP) | Insurance | 116,814 | 173 | 186 | |||||||||||||||||||||||||||||||
| Willbros Group, Inc., Common Stock |
* | Energy | 2,810,814 | 7,760 | 7,561 | |||||||||||||||||||||||||||||||
| Total Equity/Other |
$ | 292,059 | $ | 269,808 | ||||||||||||||||||||||||||||||||
|
|
|
|
|
|||||||||||||||||||||||||||||||||
| Total Investments, excluding Short Term Investments — 143.5% |
$ | 4,022,031 | $ | 3,722,261 | ||||||||||||||||||||||||||||||||
|
|
|
|
|
|||||||||||||||||||||||||||||||||
| Short Term Investments—0.3% |
||||||||||||||||||||||||||||||||||||
| Goldman Sachs Financial Square Funds—Prime Obligations Fund FST Preferred Shares |
(g)(u) | 0.14 | % | 3,669,013 | $ | 3,669 | $ | 3,669 | ||||||||||||||||||||||||||||
See notes to consolidated financial statements.
F-36
Table of Contents
Corporate Capital Trust, Inc. and Subsidiaries
Consolidated Schedule of Investments (continued)
As of December 31, 2015
(in thousands, except share amounts)
Company (a)(b) |
Footnotes |
Industry |
Interest Rate |
Base Rate Floor |
Maturity Date |
No. Shares/ Principal Amount (c) |
Cost (d) |
Fair Value |
||||||||||||||||||||||||||||
| State Street Institutional Liquid Reserves Fund, Premier Class |
(u) | 0.23 | % | 3,401,999 | $ | 3,402 | $ | 3,402 | ||||||||||||||||||||||||||||
| Total Short Term Investments |
$ | 7,071 | $ | 7,071 | ||||||||||||||||||||||||||||||||
|
|
|
|
|
|||||||||||||||||||||||||||||||||
| TOTAL INVESTMENTS — 143.8%(v) |
$ | 4,029,102 | $ | 3,729,332 | ||||||||||||||||||||||||||||||||
|
|
|
|
|
|||||||||||||||||||||||||||||||||
| LIABILITIES IN EXCESS OF OTHER ASSETS—(43.8%) |
(1,135,310 | ) | ||||||||||||||||||||||||||||||||||
|
|
|
|||||||||||||||||||||||||||||||||||
| NET ASSETS—100.0% |
$ | 2,594,022 | ||||||||||||||||||||||||||||||||||
|
|
|
|||||||||||||||||||||||||||||||||||
| Collateral on Deposit with Custodian—5.5% |
||||||||||||||||||||||||||||||||||||
| Bank of Nova Scotia— Certificate of Deposit |
0.51 | % | 3/31/2016 | 142,640 | $ | 142,640 | 142,640 | |||||||||||||||||||||||||||||
| Total Collateral on Deposit with Custodian |
$ | 142,640 | $ | 142,640 | ||||||||||||||||||||||||||||||||
|
|
|
|
|
|||||||||||||||||||||||||||||||||
| Derivative Instruments (Note 4)—0.1% |
||||||||||||||||||||||||||||||||||||
| Cross Currency Swaps |
(i) | $ | — | $ | 7,943 | |||||||||||||||||||||||||||||||
| Foreign currency forward contracts |
(i) | $ | — | 1,717 | ||||||||||||||||||||||||||||||||
| Interest rate swaps |
(i) | $ | — | 6,021 | ||||||||||||||||||||||||||||||||
| Total return swaps |
(f)(i) | $ | — | $ | (13,562 | ) | ||||||||||||||||||||||||||||||
| Total Derivative Instruments |
$ | — | $ | 2,119 | ||||||||||||||||||||||||||||||||
|
|
|
|
|
|||||||||||||||||||||||||||||||||
| * | Non-income producing security. |
| (a) | Security may be an obligation of one or more entities affiliated with the named company. |
See notes to consolidated financial statements.
F-37
Table of Contents
Corporate Capital Trust, Inc. and Subsidiaries
Consolidated Schedule of Investments (continued)
As of December 31, 2015
(in thousands, except share amounts)
| (b) | Non-controlled/non-affiliated investments as defined by the Investment Company Act of 1940, as amended (“1940 Act”), unless otherwise indicated. Non-controlled/non-affiliated investments are investments that are neither controlled investments nor affiliated investments. |
| (c) | Denominated in U.S. dollars unless otherwise noted. |
| (d) | Represents amortized cost for debt securities and cost for common stocks translated to U.S. dollars. |
| (e) | The interest rate on these investments is subject to a base rate of 3-Month LIBOR, which at December 31, 2015 was 0.61%. The current base rate for each investment may be different from the reference rate on December 31, 2015. |
| (f) | Investments classified as Level 3 whereby fair value was determined by the Company’s Board of Directors (see Note 2). |
| (g) | Security or portion thereof was held within CCT Funding, LLC and was pledged as collateral supporting the amounts outstanding under the revolving credit facility with Deutsche Bank as of December 31, 2015. |
| (h) | A portfolio company domiciled in a foreign country. The jurisdiction of the security issuer may be a different country than the domicile of the portfolio company. |
| (i) | The investment is not a qualifying asset as defined in Section 55(a) under the 1940 Act. A business development company may not acquire any asset other than qualifying assets, unless, at the time the acquisition is made, qualifying assets represent at least 70% of the company’s total assets. The Company calculates its compliance with the qualifying assets test on a “look through” basis by disregarding the value of the Company’s total return swaps and treating each loan underlying the total return swaps as either a qualifying asset or non-qualifying asset based on whether the obligor is an eligible portfolio company. On this basis, 72.7% of the Company’s total assets represented qualifying assets as of December 31, 2015. |
| (j) | The underlying credit agreement or indenture contains a PIK provision, whereby the issuer has either the option or the obligation to make interest payments with the issuance of additional securities. The interest rate in the schedule represents the current interest rate in effect for these investments. |
| (k) | Investment was on non-accrual status as of December 31, 2015. |
| (l) | The interest rate on these investments is subject to a base rate of 1-Month LIBOR, which at December 31, 2015 was 0.43%. The current base rate for each investment may be different from the reference rate on December 31, 2015. |
| (m) | Affiliated investment as defined by the 1940 Act, whereby the Company owns between 5% and 25% of the portfolio company’s outstanding voting securities and the investments are not classified as controlled investments. The aggregate fair value of non-controlled, affiliated investments at December 31, 2015 represented 8.5% of the Company’s net assets. Fair value as of December 31, 2015 and 2014 along with transactions during the year ended December 31, 2015 in these affiliated investments were as follows (amounts in thousands): |
See notes to consolidated financial statements.
F-38
Table of Contents
Corporate Capital Trust, Inc. and Subsidiaries
Consolidated Schedule of Investments (continued)
As of December 31, 2015
(in thousands, except share amounts)
| Year Ended December 31, 2015 | Year Ended December 31, 2015 | |||||||||||||||||||||||||||||||||||
| Non-Controlled,
Affiliated |
Fair Value at December 31, 2014 |
Gross Additions (Cost)+ |
Gross Reductions (Cost)++ |
Net Unrealized Gain (Loss) |
Fair Value at December 31, 2015 |
Net Realized Gain (Loss) |
Interest Income+++ |
Fee Income | Dividend Income |
|||||||||||||||||||||||||||
| AltEn, LLC |
||||||||||||||||||||||||||||||||||||
| Common Stock |
$ | 2,787 | $ | - | $ | - | $ | (2,787 | ) | $ | - | $ | - | $ | - | $ | - | $ | - | |||||||||||||||||
| Term Loan |
25,792 | 3,011 | - | (19,450 | ) | 9,353 | - | 2,237 | - | - | ||||||||||||||||||||||||||
| Hilding Anders |
||||||||||||||||||||||||||||||||||||
| Subordinated Debt |
110,973 | 14,867 | - | (31,367 | ) | 94,473 | - | 13,549 | - | - | ||||||||||||||||||||||||||
| Class A Common Stock |
257 | - | - | (257 | ) | - | - | - | - | - | ||||||||||||||||||||||||||
| Class B Common Stock |
48 | - | - | (48 | ) | - | - | - | - | - | ||||||||||||||||||||||||||
| Equity Options |
11,724 | - | - | (11,511 | ) | 213 | - | - | - | - | ||||||||||||||||||||||||||
| Home Partners of America, Inc. |
||||||||||||||||||||||||||||||||||||
| Common Stock |
22,223 | 51,267 | - | 3,118 | 76,608 | - | - | - | - | |||||||||||||||||||||||||||
| Warrants |
78 | 215 | - | 77 | 370 | - | - | - | - | |||||||||||||||||||||||||||
| Warrants Delivery Rights |
32 | - | (32 | ) | - | - | - | - | - | - | ||||||||||||||||||||||||||
| Orchard Marine, Ltd. |
||||||||||||||||||||||||||||||||||||
| Class B Common Stock |
3,001 | - | - | (3,001 | ) | - | - | - | - | - | ||||||||||||||||||||||||||
| Series A Preferred Stock |
23,760 | 19,395 | - | (5,073 | ) | 38,082 | - | - | - | 1,505 | ||||||||||||||||||||||||||
| VSK Holdings, Ltd. |
||||||||||||||||||||||||||||||||||||
| Class B Preferred Shares |
2,597 | - | - | (2,597 | ) | - | - | - | - | - | ||||||||||||||||||||||||||
|
|
|
|
|
|
|
|
|
|
|
|
|
|
|
|
|
|
|
|||||||||||||||||||
| Totals |
$ | 203,272 | $ | 88,755 | $ | (32 | ) | $ | (72,896 | ) | $ | 219,099 | $ | - | $ | 15,786 | $ | - | $ | 1,505 | ||||||||||||||||
|
|
|
|
|
|
|
|
|
|
|
|
|
|
|
|
|
|
|
|||||||||||||||||||
| + | Gross additions include increases in the cost basis of investments resulting from new portfolio investments, PIK interest, the amortization of unearned income, the exchange of one or more existing securities for one or more new securities and the movement of an existing portfolio company into this category from a different category. |
| ++ | Gross reductions include decreases in the cost basis of investments resulting from principal collections related to investment repayments or sales, the exchange of one or more existing securities for one or more new securities and the movement of an existing portfolio company out of this category into a different category. |
| +++ | Includes payment-in-kind interest income. |
| (n) | The interest rate on these investments is subject to the base rate of 3-Month EURIBOR, which at December 31, 2015 was -0.13%. The current base rate for each investment may be different from the reference rate on December 31, 2015. |
| (o) | The interest rate on these investments is subject to a base rate of 6-Month LIBOR, which at December 31, 2015 was 0.85%. The current base rate for each investment may be different from the reference rate on December 31, 2015. |
| (p) | Position or portion thereof unsettled as of December 31, 2015. |
| (q) | The interest rate on these investments is subject to the base rate of 1-Month EURIBOR, which at December 31, 2015 was -0.21%. The current base rate for each investment may be different from the reference rate on December 31, 2015. |
| (r) | This security was acquired in a transaction that was exempt from the registration requirements of the Securities Act pursuant to Rule 144A thereunder. This security may be resold only in transactions that are exempt from the registration requirements of the Securities Act, normally to qualified institutional buyers. |
| (s) | Security or portion thereof is held within Paris Funding, LLC and is pledged as collateral supporting the amounts outstanding under the committed facility agreement with BNP Paribas Prime Brokerage, Inc. and eligible to be hypothecated as allowed under Rule 15c2-1(a)(1) of the Exchange Act subject to the limits of the Rehypothecation Agreement. See Note 10, “Borrowings “ for additional information. |
See notes to consolidated financial statements.
F-39
Table of Contents
Corporate Capital Trust, Inc. and Subsidiaries
Consolidated Schedule of Investments (continued)
As of December 31, 2015
(in thousands, except share amounts)
| (t) | Controlled investment as defined by the 1940 Act, whereby the Company owns more than 25% of the portfolio company’s outstanding voting securities or maintains the ability to nominate greater than 50% of the board representation. The aggregate fair value of controlled investments at December 31, 2015 represented 3.4% of the Company’s net assets. Fair value as of December 31, 2014 and December 31, 2015 along with transactions during the year ended December 31, 2015 in these controlled investments were as follows (amounts in thousands): |
| Year Ended December 31, 2015 | Year Ended December 31, 2015 | |||||||||||||||||||||||||||||||||||
| Controlled Investments |
Fair Value at December 31, 2014 |
Gross Additions (Cost)+ |
Gross Reductions (Cost)++ |
Net Unrealized Gain (Loss) |
Fair Value at December 31, 2015 |
Net Realized Gain (Loss) |
Interest Income |
Fee Income |
Dividend Income |
|||||||||||||||||||||||||||
| Comet Aircraft S.A.R.L |
||||||||||||||||||||||||||||||||||||
| Structured Products |
$ | — | $ | 49,618 | $ | — | $ | 2,508 | $ | 52,126 | $ | — | $ | — | $ | — | $ | 4,921 | ||||||||||||||||||
| Guardian Investors, LLC, Membership Interest |
— | 10,429 | — | 1,392 | 11,821 | — | — | — | 1,759 | |||||||||||||||||||||||||||
| Innovating Partners, LLC, |
||||||||||||||||||||||||||||||||||||
| Membership Interest |
— | 13,872 | — | 2,954 | 16,826 | — | — | — | 3,266 | |||||||||||||||||||||||||||
| KKR BPT Holdings Aggregator, LLC, Structured Product |
5,500 | 4,000 | — | (2,375 | ) | 7,125 | — | — | — | — | ||||||||||||||||||||||||||
|
|
|
|
|
|
|
|
|
|
|
|
|
|
|
|
|
|
|
|||||||||||||||||||
| Totals |
$ | 5,500 | $ | 77,919 | $ | — | $ | 4,479 | $ | 87,898 | $ | — | $ | — | $ | — | $ | 9,946 | ||||||||||||||||||
|
|
|
|
|
|
|
|
|
|
|
|
|
|
|
|
|
|
|
|||||||||||||||||||
| + | Gross additions include increases in the cost basis of investments resulting from new portfolio investments, PIK interest, the amortization of unearned income, the exchange of one or more existing securities for one or more new securities and the movement of an existing portfolio company into this category from a different category. |
| ++ | Gross reductions include decreases in the cost basis of investments resulting from principal collections related to investment repayments or sales, the exchange of one or more existing securities for one or more new securities and the movement of an existing portfolio company out of this category into a different category. |
| (u) | 7-day effective yield as of December 31, 2015. |
| (v) | As of December 31, 2015, the aggregate gross unrealized appreciation for all securities in which there was an excess of value over tax cost was $52,143; the aggregate gross unrealized depreciation for all securities in which there was an excess of tax cost over value was $350,640; the net unrealized depreciation was $298,497; the aggregate cost of securities for Federal income tax purposes was $4,027,829. |
| (w) | The interest rate on these investments is subject to the base rate of 3-Month GBP LIBOR, which at December 31, 2015 was 0.59%. The current base rate for each investment may be different from the reference rate on December 31, 2015. |
| (x) | The interest rate on these investments is subject to the base rate of 1-Month GBP LIBOR, which at December 31, 2015 was 0.51%. The current base rate for each investment may be different from the reference rate on December 31, 2015. |
| (y) | Expiration date contingent on certain events pursuant to underlying agreements. |
See notes to consolidated financial statements.
F-40
Table of Contents
Corporate Capital Trust, Inc. and Subsidiaries
Consolidated Schedule of Investments (continued)
As of December 31, 2015
(in thousands, except share amounts)
Abbreviations:
AUD - Australian Dollar; local currency investment amount is denominated in Australian Dollar. A$1 / US $0.730 as of December 31, 2015.
EUR - Euro; local currency investment amount is denominated in Euros. €1 / US $1.091 as of December 31, 2015.
GBP - British Pound Sterling; local currency investment amount is denominated in Pound Sterling. £1 / US $1.480 as of December 31, 2015.
SEK - Swedish Krona; local currency investment amount is denominated in Swedish Kronor. SEK1 / US $0.119 as of December 31, 2015.
AUS - Australia
CAN - Canada
CYM - Cayman Islands
FRA - France
GBR - United Kingdom
IRL - Ireland
LUX - Luxembourg
NLD - The Netherlands
SGP - Singapore
SWE - Sweden
VGB - British Virgin Islands
E = EURIBOR - Euro Interbank Offered Rate
L = LIBOR - London Interbank Offered Rate, typically 3-Month
PIK - Payment-in-kind; the issuance of additional securities by the borrower to settle interest payment obligations.
See notes to consolidated financial statements.
F-41
Table of Contents
CORPORATE CAPITAL TRUST, INC. AND SUBSIDIARIES
Notes to Consolidated Financial Statements
| 1. | Principal Business and Organization |
Corporate Capital Trust, Inc. (the “Company”) was incorporated under the general corporation laws of the State of Maryland on June 9, 2010. The Company is a non-diversified closed-end management investment company and regulated as a business development company (“BDC”) under the Investment Company Act of 1940, as amended (the “1940 Act”). The Company’s investment objective is to provide its shareholders with current income and, to a lesser extent, long-term capital appreciation, by investing primarily in the debt of privately owned U.S. companies with a focus on originated transactions sourced through the networks of its advisors. The Company commenced business operations on June 17, 2011 and investment operations on July 1, 2011. The Company has elected to be treated as a regulated investment company (“RIC”) under the Internal Revenue Code of 1986, as amended (the “Code”) and operates in a manner so as to qualify for the tax treatment applicable to RICs.
The Company is externally managed by CNL Fund Advisors Company (“CNL”) and KKR Credit Advisors (US) LLC (“KKR”) (collectively, the “Advisors”), which are responsible for sourcing potential investments, analyzing and conducting due diligence on prospective investment opportunities, structuring investments and ongoing monitoring of the Company’s investment portfolio. Both Advisors are registered as investment advisers with the Securities and Exchange Commission (“SEC”). CNL also provides the administrative services necessary for the Company to operate.
The Company sold approximately 141 million shares of common stock through its initial continuous public offering (the “Initial Offering”) and approximately 181 million shares of common stock through its follow-on continuous public offering (the “Follow-On Offering”). The Initial Offering and Follow-On Offering are collectively referred to as the “Offerings.” In February 2016, the Company closed the Follow-On Offering to investors who purchased shares through the independent broker-dealer channel. The Follow-On Offering remained open to investors who purchased through the registered investment advisor channel. In October 2016, the Company closed the Follow-On Offering to new investors.
In January 2015, the Company filed a shelf registration statement with the SEC on Form N-2 (the “Shelf Registration Statement”) to provide for the Company the ability to offer, from time to time, in one or more offerings or series up to $750 million of its securities, on terms to be determined at the time of each such offering. The Shelf Registration Statement was declared effective by the SEC in January 2015. As of December 31, 2016, the Company has not yet offered any securities pursuant to the Shelf Registration Statement.
As of December 31, 2016, the Company had various wholly owned subsidiaries including, among others, (i) Paris Funding LLC (“Paris Funding”), CCT Tokyo Funding LLC (“CCT Tokyo Funding”) and CCT SE I LLC (“CCT SE”), special purpose financing subsidiaries organized for the purpose of arranging secured debt financing with banks and borrowing money to invest in portfolio companies, (ii) Halifax Funding LLC (“Halifax Funding”), a special purpose financing subsidiary organized to enter into total return swaps (“TRS”) and (iii) FCF LLC and CCT Holdings LLC, taxable subsidiaries (the “Taxable Subsidiaries”), which are taxed as corporations for federal income tax purposes and were organized to hold certain equity securities of portfolio companies organized as pass-through entities for U.S. tax purposes.
| 2. | Significant Accounting Policies |
Basis of Presentation - The accompanying consolidated financial statements of the Company are prepared in accordance with the instructions to Form 10-K and accounting principles generally accepted in the United States of America (“GAAP”). The Company is an investment company following accounting and reporting guidance in Financial Accounting Standards Board (“FASB”) Accounting Standards Codification (“ASC”) Topic 946, Financial Services—Investment Companies (“ASC Topic 946” ).
Principles of Consolidation – Under ASC Topic 946, the Company is precluded from consolidating any entity other than another investment company or an operating company which provides substantially all of its services to benefit the Company. In accordance therewith, the Company has consolidated the results of its wholly owned subsidiaries in its consolidated financial statements. All intercompany account balances and transactions have been eliminated in consolidation.
F-42
Table of Contents
| 2. | Significant Accounting Policies (continued) |
In accordance with the guidance for the consolidation of variable interest entities (“VIE”s), the Company analyzes its variable interests, including its equity investments, to determine if the entity in which it has a variable interest is a variable interest entity. The Company’s analysis includes both quantitative and qualitative reviews. The Company bases its quantitative analysis on the forecasted cash flows of the entity, and its qualitative analysis on its review of the design of the entity, its organizational structure including decision-making ability and financial agreements. The Company also uses its quantitative and qualitative analyses to determine if it is the primary beneficiary of the VIE, and if such determination is made, it will include the accounts of the VIE in its consolidated financial statements.
The Company does not consolidate its equity interest in Strategic Credit Opportunities Partners, LLC (“SCJV”). For further description of the Company’s investment in SCJV, see Note 3. “Investments”.
Use of Estimates – The preparation of the consolidated financial statements in conformity with GAAP requires management to make estimates and assumptions that affect (i) the reported amounts of assets and liabilities at the date of the consolidated financial statements, (ii) the reported amounts of income and expenses during the reporting periods presented and (iii) disclosure of contingent assets and liabilities at the date of the consolidated financial statements. Actual results could differ from those estimates.
Cash – Cash consists of demand deposits and foreign currency.
Valuation of Investments – The Company measures the value of its investments in accordance with ASC Topic 820, Fair Value Measurements and Disclosure (“ASC Topic 820”), issued by FASB. Fair value is the price that would be received to sell an asset or paid to transfer a liability in an orderly transaction between market participants at the measurement date. Market participants are defined as buyers and sellers in the principal or most advantageous market (which may be a hypothetical market) that are independent, knowledgeable, and willing and able to transact. In accordance with ASC Topic 820, the Company considers its principal market to be the market that has the greatest volume and level of activity.
ASC Topic 820 defines hierarchical levels directly related to the amount of subjectivity associated with the inputs used to determine fair values of assets and liabilities. The hierarchical levels and types of inputs used to measure fair value for each level are described as follows:
Level 1 – Quoted prices are available in active markets for identical investments as of the reporting date. Publicly listed equities and debt securities, publicly listed derivatives, money market/short-term investment funds and foreign currency are generally included in Level 1. The Company does not adjust the quoted price for these investments.
Level 2 – Valuation inputs are other than quoted prices in active markets, which are either directly or indirectly observable as of the reporting date, and fair value is determined through the use of models or other valuation methodologies. In certain cases, debt and equity securities are valued on the basis of prices from orderly transactions for similar investments in active markets between market participants and provided by reputable dealers or independent pricing services. In determining the value of a particular investment, independent pricing services may use certain information with respect to transactions in such investments, quotations from dealers, pricing matrices, market transactions in comparable investments, and various relationships between investments. Investments generally included in this category are corporate bonds and loans, convertible debt indexed to publicly listed securities, foreign currency forward contracts, cross currency and interest rate swaps and certain over-the-counter derivatives.
Level 3 – Valuation inputs are unobservable for the investment and include situations where there is little, if any, market activity for the investment. The inputs into the determination of fair value require significant judgment or estimation. Investments generally included in this category are TRS agreements, illiquid corporate bonds and loans, unlisted common and preferred stock investments, and equity options that lack observable market pricing.
In certain cases, the inputs used to measure fair value may fall within different levels of the fair value hierarchy. In such cases, an investment’s level within the fair value hierarchy is based on the lowest level of input that is significant to the fair value measurement. Depending on the relative liquidity in the markets for certain investments, the Company may transfer assets to Level 3 if it determines that observable quoted prices, obtained directly or indirectly, are not available or reliable. The Company’s assessment of the significance of a particular input to the fair value measurement requires judgment, and the consideration of factors specific to the investment.
F-43
Table of Contents
| 2. | Significant Accounting Policies (continued) |
Investments for which market quotations are readily available are valued using market quotations, which are generally obtained from independent pricing services, broker-dealers or market makers. With respect to the Company’s portfolio investments for which market quotations are not readily available, the Company’s board of directors is responsible for determining in good faith the fair value of the Company’s portfolio investments in accordance with the valuation policy and procedures approved by the board of directors, based on, among other things, the input of the Company’s Advisors and management, its audit committee, and independent third-party valuation firms.
The Company and the board of directors conduct its fair value determination process on a quarterly basis and any other time when a decision regarding the fair value of the portfolio investments is required. A determination of fair value involves subjective judgments and estimates. Due to the inherent uncertainty of determining the fair value of portfolio investments that do not have a readily available market value, the fair value of the investments may differ significantly from the values that would have been determined had a readily available market value existed for such investments, and the differences could be material. Further, such investments are generally less liquid than publicly traded securities. If the Company was required to liquidate a portfolio investment that does not have a readily available market value in a forced or liquidation sale, the Company could realize significantly less than the value recorded by the Company.
The Company and its Advisors undertake a multi-step valuation process each quarter for determining the fair value of the Company’s investments the market prices of which are not readily available, as described below:
| • | Each portfolio company or investment is initially valued by KKR (internal valuation) and/or the Company’s independent third party valuation firm (external valuation), which provides a valuation range. |
| • | Valuation recommendations are formulated and documented by KKR and reviewed by KKR’s valuation committee. The KKR valuation committee then provides its valuation recommendation for each portfolio investment, along with supporting documentation, to CNL and the Company. |
| • | After the Company’s management has substantially completed its review, it forwards the valuation recommendations and supporting documentation for audit committee review. |
| • | The Company’s board of directors then discusses the investment valuation recommendations with the Advisors and management and, based on those discussions and the related review process conducted by the Company’s audit committee, determines the fair value of the investments in good faith. |
The valuation techniques used by the Company for the assets and liabilities that are classified as Level 3 in the fair value hierarchy are described below.
Senior Debt and Subordinated Debt: Senior debt and subordinated debt investments are initially valued at transaction price and are subsequently valued using (i) market data for similar instruments (e.g., recent transactions or indicative broker quotes), (ii) comparisons to benchmark derivative indices or (iii) valuation models. Valuation models are generally based on yield analysis and discounted cash flow techniques, where the key inputs are based on relative value analyses and the assignment of risk-adjusted discounted rates, based on the analysis of similar instruments from similar issuers. In addition, an illiquidity discount is applied where appropriate.
Equity/Other Investments: Equity/other investments are initially valued at transaction price and are subsequently valued using valuation models in the absence of readily observable market prices. Valuation models are generally based on (i) market and income (discounted cash flow) approaches, in which various internal and external factors are considered, and (ii) earnings before interest, taxes, depreciation and amortization (“EBITDA”) valuation multiples analysis. Factors include key financial inputs and recent public and private transactions for comparable investments. Key inputs used for the discounted cash flow approach include the weighted average cost of capital and assumed inputs used to calculate terminal values, such as EBITDA exit multiples. The fair value for a particular investment will generally be within the value range conclusions derived by the two approaches. Upon completion of the valuations conducted, an illiquidity discount is applied where appropriate.
F-44
Table of Contents
| 2. | Significant Accounting Policies (continued) |
The Company relies primarily on information provided by managers of private investment funds in valuing the Company’s investments in such funds. The Advisors monitor the valuation methodology used by the asset manager and/or issuer of the private investment fund. Following procedures adopted by the Company’s board of directors, in the absence of specific transaction activity in a particular private investment fund, the Company’s board of directors considers whether it is appropriate, in light of all relevant circumstances, to value the Company’s investment at the net asset value reported by the private investment fund at the time of valuation or to adjust the value to reflect a premium or discount.
Total Return Swaps: The Company values its TRS in accordance with the TRS agreements between its wholly owned subsidiary and the TRS counterparty, which collectively established the TRS. Pursuant to the TRS agreements, the value of the TRS is based on (i) the increase or decrease in the value of the TRS assets relative to the notional amounts, (ii) collected and accrued interest income and fee income related to the TRS assets, (iii) TRS financing costs on the TRS settled notional amounts, and (iv) certain other expenses incurred under the TRS. The TRS assets are valued pursuant to the valuation algorithm specified in the TRS agreements, including reliance on indicative bid prices provided by independent third-party pricing services. Bid prices reflect the highest price that market participants may be willing to pay. On a quarterly basis, the Company’s Advisors review, test and compare (i) the indicative bid prices assigned to each TRS asset by the TRS counterparty with (ii) pricing inputs that are independently sourced by the Company’s management and/or its Advisors from third-party pricing services. Additionally, the Company’s Advisors review the calculations of (i) collected and accrued interest, (ii) TRS financing costs, and (iii) realized gains and losses as included components of the TRS fair value. For additional disclosures on the Company’s TRS, including quantitative disclosures of the current period fair value components, see Note 4. “Derivative Instruments.”
The Company utilizes several valuation techniques that use unobservable pricing inputs and assumptions in determining the fair value of its Level 3 investments. The valuation techniques, as well as the key unobservable inputs that have a significant impact on the Company’s Level 3 valuations, are described in Note 5. “Fair Value of Financial Instruments.” The unobservable pricing inputs and assumptions may differ by asset and in the application of the Company’s valuation methodologies. The reported fair value estimates could vary materially if the Company had chosen to incorporate different unobservable pricing inputs and other assumptions.
Security Transactions, Realized/Unrealized Gains or Losses, and Income Recognition – Investments purchased on a secondary basis are recorded on the trade date. Loan originations are recorded on the funding date. The Company measures realized gains or losses from the sale of investments using the specific identification method. Realized gains or losses are measured by the difference between the net proceeds from the sale and the amortized cost basis of the investment without regard to unrealized gains or losses previously recognized, and include investments charged off during the period, net of recoveries. Unrealized gains or losses primarily reflect the change in investment values, including the reversal of previously recorded unrealized gains or losses when gains or losses are realized. The amortized cost basis of investments includes (i) the original cost and (ii) adjustments for the accretion/amortization of market discounts and premiums, original issue discount and loan origination fees. The Company reports changes in fair value of investments as a component of net change in unrealized appreciation (depreciation) on investments in the consolidated statements of operations.
Interest Income – Interest income is recorded on an accrual basis and includes amortization of premiums to par value and accretion of discounts to par value. Discounts and premiums to par value on securities purchased are accreted/amortized into interest income over the life of the respective security using the effective interest method. Generally, loan origination, closing, commitment and other fees received by the Company directly or indirectly from borrowers in connection with the closing of investments are accreted over the contractual life of the debt investment as interest income based on the effective interest method. Upon prepayment of a debt investment, any prepayment penalties and unamortized loan fees and discounts are recorded as interest income.
Certain of the Company’s investments in debt securities contain a contractual payment-in-kind (“PIK”) interest provision. The PIK provisions generally feature the obligation or the option at each interest payment date of making interest payments in (i) cash, (ii) additional debt securities or (iii) a combination of cash and additional debt securities. PIK interest, computed at the contractual rate specified in the investment’s credit agreement, is accrued as interest income and recorded as interest receivable up to the interest payment date. On the interest payment dates, the Company will capitalize the accrued interest receivable attributable to PIK as additional principal due from the borrower. When additional PIK securities are received on the interest payment date, they typically have the same terms, including maturity dates and interest rates as the original securities issued. PIK interest generally becomes due at maturity of the investment or upon the investment being called by the issuer.
F-45
Table of Contents
| 2. | Significant Accounting Policies (continued) |
If the portfolio company valuation indicates the value of the PIK investment is not sufficient to cover the contractual PIK interest, the Company will not accrue additional PIK interest income and will record an allowance for any accrued PIK interest receivable as a reduction of interest income in the period the Company determines it is not collectible.
Debt securities are placed on nonaccrual status when principal or interest payments are at least 90 days past due or when there is reasonable doubt that principal or interest will be collected. Generally, accrued interest is reversed against interest income when a debt security is placed on nonaccrual status. Interest payments received on debt securities on nonaccrual status may be recognized as interest income or applied to principal based on management’s judgment. Debt securities on nonaccrual status are restored to accrual status when past due principal and interest are paid and, in management’s judgment, such investments are likely to remain current on interest payment obligations. The Company may make exceptions to this treatment if the debt security has sufficient collateral value and is in the process of collection.
Fee Income – In its role as the Company’s investment sub-advisor, KKR or its affiliates may provide financial advisory services to portfolio companies and in return may receive fees for capital structuring services. KKR is obligated to remit to the Company any earned capital structuring fees based on the pro-rata portion of the Company’s investment in co-investment transactions and originated investments. These fees are generally nonrecurring and are recognized as fee income by the Company upon the investment closing date.
The Company may also receive fees for commitments, amendments and other services rendered to portfolio companies. Such fees are recognized as fee income when earned or the services are rendered.
Dividend Income – Dividend income on preferred equity securities is recorded as dividend income on an accrual basis to the extent such amounts are payable by the portfolio company and are expected to be collected. Dividend income on common equity securities is recorded on the record date for private portfolio companies or on the ex-dividend date for publicly traded portfolio companies. Each distribution received from limited liability company (“LLC”) and limited partnership (“LP”) investments are evaluated to determine if the distribution should be recorded as dividend income or a return of capital. Generally, the Company will not record distributions from equity investments in LLCs and LPs as dividend income unless there are sufficient accumulated earnings in the LLC or LP prior to the distribution. Distributions that are classified as a return of capital are recorded as a reduction in the cost basis of the investment.
Derivative Instruments – The Company’s derivative instruments include foreign currency forward contracts, cross currency swaps, interest rate swaps and the TRS. The Company recognizes all derivative instruments as assets or liabilities at fair value in its consolidated financial statements. Derivative contracts entered into by the Company are not designated as hedging instruments, and as a result, the Company presents changes in fair value through net change in unrealized appreciation (depreciation) on derivative instruments in the consolidated statements of operations. TRS unrealized appreciation (depreciation) is composed of accrued interest income, net of accrued TRS financing charges owed, and the overall change in fair value of the TRS assets. Realized gains and losses that occur upon the cash settlement of the derivative instruments are included in net realized gains (losses) on derivative instruments in the consolidated statements of operations. TRS realized gains and losses are composed of realized gains or losses on the TRS assets and the net interest and fees received or paid on the quarterly TRS settlement date.
Deferred Financing Costs – Financing costs, including upfront fees, commitment fees and legal fees related to the Company’s credit facilities, term loan and the TRS are deferred and amortized over the life of the related financing instrument using either the effective interest method or straight-line method. The amortization of deferred financing costs is included in interest expense in the consolidated statements of operations.
Paid In Capital – The Company records the proceeds from the sale of its common stock on a net basis to (i) capital stock and (ii) paid-in capital in excess of par value, excluding selling commissions and marketing support fees.
Foreign Currency Translation, Transactions and Gains/Losses – Foreign currency amounts are translated into U.S. dollars on the following basis: (i) at the exchange rate on the last business day of the reporting period for the fair value of investment securities, other assets and liabilities; and (ii) at the prevailing exchange rate on the respective recording dates for the purchase and sale of investment securities, income, expenses, gains and losses.
Net assets and fair values are presented based on the applicable foreign exchange rates described above and the Company does not isolate that portion of the results of operations resulting from changes in foreign exchange rates on investments from the fluctuations arising from changes in fair values of investments held; therefore, fluctuations related to foreign exchange rate conversions are included with the net realized gains (losses) and unrealized appreciation (depreciation) on investments.
F-46
Table of Contents
| 2. | Significant Accounting Policies (continued) |
Net realized gains or losses on foreign currency transactions arise from sales of foreign currency, currency gains or losses realized between the trade and settlement dates on securities transactions, and the difference between the amounts of dividends, interest, and foreign withholding taxes recorded by the Company and the U.S. dollar equivalent of the amounts actually received or paid by the Company.
Unrealized appreciation (depreciation) from foreign currency translation for foreign currency forward contracts and cross currency swaps is included in net change in unrealized appreciation (depreciation) in derivative instruments in the consolidated statements of operations and is included with unrealized appreciation (depreciation) on derivative instruments in the consolidated statements of assets and liabilities. Unrealized appreciation (depreciation) from foreign currency translation for other receivables or payables is presented as net change in unrealized appreciation (depreciation) in foreign currency translation in the consolidated statements of operations.
Management Fees – The Company incurs a base management fee (recorded as investment advisory fees) and performance-based incentive fees, including (i) a subordinated incentive fee on income and (ii) an incentive fee on capital gains, due to its Advisors pursuant to an investment advisory agreement described in Note 6. “Related Party Transactions.” The two components of performance-based incentive fees are combined and expensed in the consolidated statements of operations and accrued in the consolidated statements of assets and liabilities as accrued performance-based incentive fees. Pursuant to the terms of the investment advisory agreement, the incentive fee on capital gains is determined and payable in arrears as of the end of each calendar year (or upon termination of the investment advisory agreement) based on the Company’s realized capitalized gains on a cumulative basis from inception, net of all realized capital losses on a cumulative basis and unrealized depreciation at year end, less the aggregate amount of any previously paid capital gains incentive fees. Although the terms of the investment advisory agreement do not provide for the inclusion of unrealized gains in the calculation of the incentive fee on capital gains, pursuant to an interpretation of an American Institute of Certified Public Accountants Technical Practice Aid for investment companies, for GAAP purposes, the Company includes unrealized gains in the calculation of the incentive fee on capital gains expense and related accrued incentive fee on capital gains. This accrual reflects the incentive fees that would be payable to the Advisors if the Company’s entire portfolio was liquidated at its fair value as of the balance sheet date even though the Advisors are not entitled to an incentive fee with respect to unrealized gains unless and until such gains are actually realized.
Offering Expenses – Offering expenses incurred in connection with the Company’s Offerings, including reimbursement payments to the Advisors, but excluding selling commissions and marketing support fees, are accumulated monthly and capitalized as deferred offering expenses and then subsequently expensed over a 12-month period.
Earnings per Share – Earnings per share is calculated based upon the weighted average number of shares of common stock outstanding during the reporting period.
Distributions – Weekly distributions are generally declared monthly by the Company’s board of directors and recognized as a liability on the applicable record date. Distributions are paid monthly. The Company has adopted a distribution reinvestment plan that provides for reinvestment of distributions on behalf of shareholders. Shareholders who have elected to participate in the distribution reinvestment plan will have their cash distribution automatically reinvested in additional shares of common stock at a price per share equivalent to the then current public offering price, net of selling commissions and marketing support fees.
Federal Income Taxes – The Company has elected to be treated for federal income tax purposes, and intends to maintain its qualification, as a RIC under Subchapter M of the Code. Generally, a RIC is not subject to federal income taxes on distributed income and gains if it distributes at least 90% of its “Investment Company Taxable Income,” as defined in the Code. The Company intends to distribute sufficient dividends to maintain its RIC status each year.
The Company is generally subject to nondeductible federal excise taxes if it does not distribute to its shareholders an amount at least equal to the sum of (i) 98% of its net ordinary income for the calendar year, (ii) 98.2% of its capital gains in excess of capital losses for the one-year period generally ending on October 31 of the calendar year and (iii) any ordinary income and net capital gains for preceding years that were not distributed during such years and on which the Company paid no federal income tax.
F-47
Table of Contents
| 2. | Significant Accounting Policies (continued) |
The Taxable Subsidiaries hold certain of the Company’s portfolio investments. The Taxable Subsidiaries are consolidated for GAAP reporting purposes, and the portfolio investments held by such entities are included in the consolidated financial statements. The Taxable Subsidiaries may generate income tax expense, or benefit, and related tax assets and liabilities. As a result, any such income tax expense, or benefit and the related tax assets and liabilities are recorded in the Company’s consolidated financial statements. Deferred tax assets and liabilities are recorded for temporary differences between the tax basis of assets and liabilities and their reported amounts in the financial statements, using statutory tax rates in effect for the year in which the temporary differences are expected to reverse. Valuation allowances are established when necessary to reduce deferred tax assets to the amount expected to be realized. Similarly, certain foreign investments, which may be held outside of the Taxable Subsidiaries, might incur foreign income taxes and have deferred tax assets and liabilities.
The Company recognizes in its consolidated financial statements the effect of a tax position when it is deemed more likely than not, based on the technical merits, that the position will be sustained upon examination. Tax benefits of positions not deemed to meet the more-likely-than-not threshold are recorded as a tax expense in the current year. The Company did not have any uncertain tax positions that met the recognition or measurement criteria of ASC 740-10-25, Income Taxes – Overall –Recognition, nor did it have any unrecognized tax benefits for the periods presented herein. Although the Company and the Taxable Subsidiaries file federal and state tax returns, their major tax jurisdiction is federal.
Permanent book and tax basis differences are reclassified among the Company’s capital accounts, as appropriate. Additionally, the tax character and amount of distributions is determined in accordance with the Code which differs from GAAP.
Recent Accounting Pronouncements – In February 2015, the FASB issued Accounting Standard Update (“ASU”) 2015-02, “Amendments to the Consolidation Analysis,” which requires amendments to both the variable interest entity (“VIE”) and voting models. The amendments (i) modify the identification of variable interests (fees paid to a decision maker or service provider), the VIE characteristics for a limited partnership or similar entity and primary beneficiary determination under the VIE model, and (ii) eliminate the presumption within the current voting model that a general partner controls a limited partnership or similar entity. The new guidance is effective for annual reporting periods, and interim periods within those annual periods, beginning after December 15, 2015 with early adoption permitted. The amendments may be applied using either a modified retrospective or full retrospective approach. The application of this guidance has not had material impact on the Company’s consolidated financial position, results of operations and cash flows.
In April 2015, the FASB issued ASU 2015-03, “Simplifying the Presentation of Debt Issuance Costs,” which requires that loan costs related to a recognized debt liability be presented in the balance sheet as a direct deduction from the carrying amount of that debt liability, consistent with debt discounts or premiums. The new guidance is effective for annual reporting periods, and interim periods within those annual periods, beginning after December 15, 2015 with early adoption permitted. The ASU is to be applied retrospectively for each period presented. Upon adoption, an entity is required to comply with the applicable disclosures for a change in an accounting principle. The FASB subsequently issued ASU 2015-15, “Presentation and Subsequent Measurement of Debt Issuance Costs Associated with Line-of-Credit Arrangements,” which clarifies that, given the absence of authoritative guidance in ASU 2015-03 regarding presentation and subsequent measurement of loan costs related to line-of-credit arrangements, the SEC Staff would not object to an entity deferring and presenting loan costs as an asset and subsequently amortizing the loan costs ratably over the term of the line-of-credit arrangement, regardless of whether there are any outstanding borrowings on the line-of-credit arrangement. Prior to adoption of this ASU, the Company included all deferred financing costs in prepaid and other deferred expenses in the consolidated statements of assets and liabilities. Upon adoption, the Company reclassified the deferred financing costs related to the Company’s term loan to be a direct deduction from the carrying amount of the term loan payable in the consolidated statements of assets and liabilities. The Company also retrospectively reclassified $3.93 million of unamortized deferred financing costs that were previously presented as prepaid and other deferred expenses as of December 31, 2015.
In August 2016, the FASB issued ASU 2016-15, “Statement of Cash Flows (Topic 230): Classification of Certain Cash Receipts and Cash Payments,” which will make eight targeted changes to how cash receipts and cash payments are presented and classified in the statement of cash flows. The ASU further clarifies how the predominance principle should be applied to cash receipts and payments relating to more than one class of cash flows. The ASU is effective for annual reporting periods, and interim periods within those annual periods, beginning after December 15, 2017. The ASU is to be applied retrospectively for each period presented. The Company is currently evaluating the impact this ASU will have on the Company’s consolidated statement of cash flows.
F-48
Table of Contents
| 2. | Significant Accounting Policies (continued) |
In November 2016, the FASB issued ASU 2016-18, “Statement of Cash Flows (Topic 230): Restricted Cash,” which modifies the presentation of the statement of cash flows and requires reconciliation to the overall change in the total of cash, cash equivalents, restricted cash and restricted cash equivalents. As a result, the statement of cash flows will no longer present transfers between cash and cash equivalents and restricted cash and restricted cash equivalents. The ASU is effective for annual reporting periods, and interim periods within those annual periods, beginning after December 15, 2017, with early adoption permitted. The ASU is to be applied retrospectively for each period presented. The Company adopted this ASU on December 31, 2016 and has determined that adoption will not materially impact the presentation of the Company’s consolidated cash flows.
| 3. | Investments |
The Company is engaged in a strategy to invest primarily in the debt of privately owned and thinly traded U.S. companies. The primary investment concentrations include (i) senior debt securities and (ii) subordinated debt securities. The Company’s investments may, in some cases, be accompanied by warrants, options or other forms of equity participation. The Company may separately purchase common or preferred equity interests in transactions, including non-controlling equity investments. Additionally, the Company may invest in convertible securities, derivatives and private investment funds. The Company may also co-invest with third parties through partnerships, joint ventures or other entities, thereby acquiring jointly controlled or non-controlling interests in certain investments in conjunction with participation by one or more third parties in such investment. The fair value of the Company’s investments will generally fluctuate with, among other things, changes in prevailing interest rates, the general supply of, and demand for, debt capital among private and public companies, general domestic and global economic conditions, the condition of certain financial markets, developments or trends in any particular industry and changes in the financial condition and credit quality of each security’s issuer.
As of December 31, 2016 and 2015, the Company’s investment portfolio consisted of the following (in thousands):
| As of December 31, 2016 | ||||||||||||||||
| Asset Category |
Amortized Cost |
Fair Value |
Percentage of Investment Portfolio |
Percentage of Net Assets |
||||||||||||
| Senior debt |
||||||||||||||||
| Senior secured loans – first lien |
$ | 1,641,759 | $ | 1,547,100 | 38.4% | 56.1% | ||||||||||
| Senior secured loans – second lien |
1,131,035 | 1,074,183 | 26.7 | 38.9 | ||||||||||||
| Senior secured bonds |
177,826 | 134,786 | 3.4 | 4.9 | ||||||||||||
|
|
|
|
|
|
|
|
|
|||||||||
| Total senior debt |
2,950,620 | 2,756,069 | 68.5 | 99.9 | ||||||||||||
| Subordinated debt |
683,640 | 642,427 | 16.0 | 23.3 | ||||||||||||
| Structured products |
226,807 | 210,871 | 5.2 | 7.6 | ||||||||||||
| Equity/Other (1) |
465,850 | 415,920 | 10.3 | 15.1 | ||||||||||||
|
|
|
|
|
|
|
|
|
|||||||||
| Subtotal |
4,326,917 | 4,025,287 | 100.0% | 145.9% | ||||||||||||
|
|
|
|||||||||||||||
| Short-term investments |
6 | 6 | — | |||||||||||||
|
|
|
|
|
|
|
|||||||||||
| Total investments |
$ | 4,326,923 | $ | 4,025,293 | 145.9% | |||||||||||
|
|
|
|
|
|
|
|||||||||||
| (1) | Includes the Company’s investment in Strategic Credit Opportunities Partners, LLC. |
| As of December 31, 2015 | ||||||||||||||||
| Asset Category |
Amortized Cost |
Fair Value |
Percentage of Investment Portfolio |
Percentage of Net Assets |
||||||||||||
| Senior debt |
||||||||||||||||
| Senior secured loans – first lien |
$ | 1,721,163 | $ | 1,593,668 | 42.8% | 61.5% | ||||||||||
| Senior secured loans – second lien |
1,154,518 | 1,100,781 | 29.6 | 42.4 | ||||||||||||
| Senior secured bonds |
217,350 | 184,509 | 5.0 | 7.1 | ||||||||||||
|
|
|
|
|
|
|
|
|
|||||||||
| Total senior debt |
3,093,031 | 2,878,958 | 77.4 | 111.0 | ||||||||||||
| Subordinated debt |
525,301 | 457,287 | 12.3 | 17.6 | ||||||||||||
| Structured products |
111,640 | 116,208 | 3.1 | 4.5 | ||||||||||||
| Equity/Other |
292,059 | 269,808 | 7.2 | 10.4 | ||||||||||||
|
|
|
|
|
|
|
|
|
|||||||||
| Subtotal |
4,022,031 | 3,722,261 | 100.0% | 143.5% | ||||||||||||
|
|
|
|||||||||||||||
| Short-term investments |
7,071 | 7,071 | 0.3 | |||||||||||||
|
|
|
|
|
|
|
|||||||||||
| Total investments |
$ | 4,029,102 | $ | 3,729,332 | 143.8% | |||||||||||
|
|
|
|
|
|
|
|||||||||||
F-49
Table of Contents
| 3. | Investments (continued) |
As of December 31, 2016, investments on non-accrual status represented 5.5% and 1.6% of total investments on an amortized cost basis and fair value basis, respectively. As of December 31, 2015, debt investments on nonaccrual status represented 3.6% and 2.1% of total investments on an amortized cost basis and fair value basis, respectively.
The industry composition, geographic dispersion, and local currencies of the Company’s investment portfolio as a percentage of total fair value of the Company’s investments, excluding short term investments and derivative instruments, as of December 31, 2016 and 2015 were as follows:
| As of December 31, | ||||||||
| Industry Composition |
2016 | 2015 | ||||||
| Capital Goods |
21.2% | 16.7% | ||||||
| Diversified Financials |
10.4 | 6.2 | ||||||
| Software & Services |
8.7 | 11.2 | ||||||
| Retailing |
7.9 | 8.3 | ||||||
| Materials |
6.0 | 3.9 | ||||||
| Automobiles & Components |
5.9 | 4.8 | ||||||
| Real Estate |
5.4 | 2.2 | ||||||
| Health Care Equipment & Services |
4.9 | 4.8 | ||||||
| Technology Hardware & Equipment |
4.4 | 4.7 | ||||||
| Consumer Durables & Apparel |
4.2 | 9.6 | ||||||
| Energy |
4.0 | 4.4 | ||||||
| Transportation |
4.0 | 4.7 | ||||||
| Consumer Services |
3.0 | 2.4 | ||||||
| Commercial & Professional Services |
2.1 | 4.2 | ||||||
| Food, Beverage & Tobacco |
1.4 | 1.7 | ||||||
| Pharmaceuticals, Biotechnology & Life Sciences |
1.4 | 1.4 | ||||||
| Food & Staples Retailing |
1.3 | 2.7 | ||||||
| Insurance |
1.1 | 1.3 | ||||||
| Telecommunication Services |
0.9 | 2.2 | ||||||
| Household & Personal Products |
0.9 | — | ||||||
| Remaining Industries |
0.9 | 2.6 | ||||||
|
|
|
|
|
|||||
| Total |
100.0% | 100.0% | ||||||
|
|
|
|
|
|||||
| Geographic Dispersion (1) |
||||||||
| United States |
83.7% | 78.4% | ||||||
| Luxembourg |
4.7 | 4.3 | ||||||
| Singapore |
3.5 | 3.6 | ||||||
| Ireland |
2.2 | 2.3 | ||||||
| Sweden |
2.2 | 2.5 | ||||||
| United Kingdom |
1.5 | 4.4 | ||||||
| Cayman Islands |
0.7 | 0.8 | ||||||
| Spain |
0.5 | — | ||||||
| British Virgin Islands |
0.5 | 1.0 | ||||||
| Australia |
0.3 | 0.6 | ||||||
| Remaining Countries |
0.2 | 2.1 | ||||||
|
|
|
|
|
|||||
| Total |
100.0% | 100.0% | ||||||
|
|
|
|
|
|||||
| Local Currency |
||||||||
| U.S. Dollar |
88.7% | 84.1% | ||||||
| Euro |
8.6 | 10.3 | ||||||
| British Pound Sterling |
2.3 | 5.0 | ||||||
| Australian Dollar |
0.3 | 0.6 | ||||||
| Swedish Krona |
0.1 | — | ||||||
|
|
|
|
|
|||||
| Total |
100.0% | 100.0% | ||||||
|
|
|
|
|
|||||
| (1) | The geographic dispersion is determined by the portfolio company’s country of domicile or the jurisdiction of the security’s issuer. |
F-50
Table of Contents
| 3. | Investments (continued) |
Strategic Credit Opportunities Partners, LLC
In May 2016, SCJV, a joint venture between the Company and Conway Capital, LLC (“Conway”), an affiliate of Guggenheim Life and Annuity Company and Delaware Life Insurance Company, was formed pursuant to the terms of a limited liability company agreement between the Company and Conway. Pursuant to the terms of the agreement, the Company and Conway each have 50% voting control of SCJV and together will agree on all investment decisions as well as all other significant actions for SCJV. SCJV was formed to invest its capital in a range of investments, including senior secured loans (both first lien and second lien) to middle market companies, broadly syndicated loans, equity, warrants and other investments. The Company and Conway have agreed to provide capital to SCJV of up to $500 million in the aggregate. The Company and Conway will provide 87.5% and 12.5%, respectively, of the committed capital. As administrative agent of SCJV, the Company will perform certain day-to-day management responsibilities on behalf of SCJV.
In August 2016, the Company and Conway completed the initial funding of SCJV. As part of the initial funding, the Company sold investments with a fair value of $247.24 million to SCJV, in exchange for cash and a $92.40 million equity interest in SCJV. The Company recognized a net realized loss of $0.95 million in connection with the transaction. Conway completed its initial funding of SCJV with a cash contribution of $13.20 million. In December 2016, the Company sold investments with a fair value of $45.88 million to SCJV. The Company recognized a net realized gain of $1.03 million in connection with the transaction.
On August 15, 2016, CSCOP SE I LLC (“Borrower SPV”), a wholly-owned subsidiary of SCJV, entered into a credit agreement (the “Credit Agreement”), with Bank of America Merrill Lynch. The Credit Agreement provides for a revolving credit facility which provides for up to $165.00 million in total commitments to Borrower SPV (the “BAML Credit Facility”), and is secured by substantially all of the assets of Borrower SPV. The stated borrowing rate under the BAML Credit Facility may take the form of either base rate loans or Eurocurrency rate loans and may be converted to either or during the term of the loan by delivering a notice to the Credit Agreement administrative agent and State Street Bank and Trust Company, as collateral administrator, pursuant to the terms of the Credit Agreement. Base rate loans shall bear interest at a rate per annum equal to the sum of (a) the fluctuating rate per annum equal to the highest of (i) the federal funds rate plus 0.5% of 1%, (ii) the prime rate set by Bank of America for such day and (iii) the 1-month LIBOR plus (b) 1.85%. Eurocurrency rate loans shall bear interest at the rate per annum equal to the sum of (a) LIBOR (or a comparable or successor rate approved by the Credit Agreement administrative agent) plus (b) 1.85%. Borrower SPV also pays a commitment fee for undrawn commitment in the amount between 0.75% to 1.75%. The BAML Credit Facility matures on August 15, 2018. As of December 31, 2016, total outstanding borrowings under the BAML Credit Facility were $152.00 million.
As of December 31, 2016, SCJV had total investments with a fair value of $248.60 million. As of December 31, 2016, SCJV had no investments on non-accrual status.
Below is a summary of SCJV’s portfolio, followed by a listing of the individual loans in SCJV’s portfolio as of December 31, 2016:
| December 31, 2016 | ||||
| Total debt investments (1) |
$ | 250,320 | ||
| Weighted average current interest rate on debt investments (2) |
7.08 | % | ||
| Number of borrowers in SCJV |
36 | |||
| Largest loan to a single borrower (1) |
$ | 21,214 | ||
| (1) | At par amount. |
| (2) | Computed as the (a) annual stated interest rate on accruing debt, divided by (b) total debt at par amount. |
F-51
Table of Contents
| 3. | Investments (continued) |
Strategic Credit Opportunities Partners, LLC Portfolio
As of December 31, 2016 (in thousands)
| Company (a) |
Footnotes | x Industry | Interest Rate |
Base Rate Floor |
Maturity Date |
Principal Amount(b) |
Cost | Fair Value | ||||||||||||||||||
| Senior Secured Loans - First Lien—130.9% |
| |||||||||||||||||||||||||
| ABILITY Network, Inc. |
(e)(1) |
Health Care Equipment & Services |
L + 500 | 1.00 | % | 5/14/2021 | $ | 8,812 | $ | 8,713 | $ | 8,856 | ||||||||||||||
| Bay Club, Co. |
(1) |
Consumer Services |
L + 650 | 1.00 | % | 8/31/2022 | 8,977 | 9,056 | 9,056 | |||||||||||||||||
| Belk, Inc. |
(1) |
Retailing |
L + 475 | 1.00 | % | 12/12/2022 | 4,198 | 3,718 | 3,635 | |||||||||||||||||
| CityCenter Holdings, LLC |
(2) |
Real Estate |
L + 325 | 1.00 | % | 10/16/2020 | 4,755 | 4,781 | 4,818 | |||||||||||||||||
| Commercial Barge Line, Co. |
(1) |
Transportation |
L + 875 | 1.00 | % | 11/12/2020 | 7,417 | 7,050 | 7,021 | |||||||||||||||||
| David’s Bridal, Inc. |
(1) |
Retailing |
L + 400 | 1.25 | % | 10/11/2019 | 6,792 | 6,367 | 6,025 | |||||||||||||||||
| Grocery Outlet, Inc. |
(1) |
Food & Staples Retailing |
L + 400 | 1.00 | % | 10/21/2021 | 2,923 | 2,891 | 2,927 | |||||||||||||||||
| Gymboree Corp. |
(e)(1) |
Retailing |
L + 350 | 1.50 | % | 2/23/2018 | 4,385 | 3,376 | 2,344 | |||||||||||||||||
| Harbor Freight Tools USA, Inc. |
(1) |
Retailing |
L + 300 | 0.75 | % | 8/18/2023 | 2,677 | 2,688 | 2,719 | |||||||||||||||||
| inVentive Health, Inc. |
(1) |
Health Care Equipment & Services |
L + 375 | 1.00 | % | 11/9/2023 | 8,750 | 8,833 | 8,842 | |||||||||||||||||
| Koosharem, LLC |
(e)(1) |
Commercial & Professional Services |
L + 650 | 1.00 | % | 5/15/2020 | 21,214 | 18,858 | 19,225 | |||||||||||||||||
| MedAssets, Inc. |
(3) |
Health Care Equipment & Services |
L + 550 | 1.00 | % | 10/19/2022 | 7,073 | 7,136 | 7,179 | |||||||||||||||||
| Neiman Marcus Group, LLC |
(3) |
Retailing |
L + 325 | 1.00 | % | 10/25/2020 | 4,876 | 4,532 | 4,253 | |||||||||||||||||
| Netsmart Technologies, Inc. |
(1) |
Health Care Equipment & Services |
L + 450 | 1.00 | % | 4/19/2023 | 1,976 | 1,988 | 1,987 | |||||||||||||||||
| RedPrairie Corp. |
(3) |
Software & Services |
L + 350 | 1.00 | % | 10/12/2023 | 11,288 | 11,233 | 11,431 | |||||||||||||||||
| Riverbed Technology, Inc. |
(3) |
Technology Hardware & Equipment |
L + 325 | 1.00 | % | 4/25/2022 | 7,971 | 8,042 | 8,040 | |||||||||||||||||
| Savers, Inc., Common Shares A |
(1) |
Retailing |
L + 375 | 1.25 | % | 7/9/2019 | 9,948 | 8,835 | 9,258 | |||||||||||||||||
| Standard Aero, Ltd. |
(1) |
Capital Goods |
L + 425 | 1.00 | % | 7/7/2022 | 995 | 1,002 | 1,004 | |||||||||||||||||
| TIBCO Software, Inc. |
(e)(3) |
Software & Services |
L + 550 | 1.00 | % | 12/4/2020 | 19,232 | 18,698 | 19,347 | |||||||||||||||||
| TruGreen, LP |
(3) |
Consumer Services |
L + 550 | 1.00 | % | 4/13/2023 | 9,950 | 10,111 | 10,112 | |||||||||||||||||
|
|
|
|
|
|||||||||||||||||||||||
| Total Senior Secured Loans - First Lien |
|
$ | 147,908 | $ | 148,079 | |||||||||||||||||||||
|
|
|
|
|
|||||||||||||||||||||||
| Senior Secured Loans - Second Lien - 11.2% |
| |||||||||||||||||||||||||
| Applied Systems, Inc. |
(e)(1) |
Software & Services |
L + 650 | 1.00 | % | 1/24/2022 | $ | 7,461 | $ | 7,499 | $ | 7,556 | ||||||||||||||
| Misys, Ltd. (GBR) |
(c)(e) |
Software & Services |
12.00% | 6/12/2019 | 4,866 | 5,064 | 5,177 | |||||||||||||||||||
|
|
|
|
|
|||||||||||||||||||||||
| Total Senior Secured Loans - Second Lien |
|
$ | 12,563 | $ | 12,733 | |||||||||||||||||||||
|
|
|
|
|
|||||||||||||||||||||||
| Senior Secured Bonds - 20.7% |
| |||||||||||||||||||||||||
| Artesyn Technologies, Inc. |
(d)(e) |
Technology Hardware & Equipment |
9.75% | 10/15/2020 | $ | 8,900 | $ | 7,572 | $ | 8,143 | ||||||||||||||||
| Calumet Specialty Products Partners, LP |
(d)(e) |
Energy |
11.50% | 1/15/2021 | 6,579 | 7,433 | 7,517 | |||||||||||||||||||
| Guitar Center, Inc. |
(d)(e) |
Retailing |
6.50% | 4/15/2019 | 8,523 | 7,626 | 7,735 | |||||||||||||||||||
|
|
|
|
|
|||||||||||||||||||||||
| Total Senior Secured Bonds |
|
$ | 22,631 | $ | 23,395 | |||||||||||||||||||||
|
|
|
|
|
|||||||||||||||||||||||
| Total Senior Debt |
|
$ | 183,102 | $ | 184,207 | |||||||||||||||||||||
|
|
|
|
|
|||||||||||||||||||||||
| Subordinated Debt—56.9% |
| |||||||||||||||||||||||||
| Builders FirstSource, Inc. |
(d)(e) |
Capital Goods |
10.75% | 8/15/2023 | $ | 6,564 | $ | 7,460 | $ | 7,533 | ||||||||||||||||
| Cequel Communications Holdings, LLC |
(d) |
Media |
5.13% | 12/15/2021 | 7,426 | 7,496 | 7,556 | |||||||||||||||||||
| ClubCorp Club Operations, Inc. |
(d)(e) |
Consumer Services |
8.25% | 12/15/2023 | 2,773 | 2,900 | 2,939 | |||||||||||||||||||
| GCI, Inc. |
(e) |
Telecommunication Services |
6.88% | 4/15/2025 | 7,211 | 7,490 | 7,319 | |||||||||||||||||||
| GCP Applied Technologies, Inc. |
(d)(e) |
Materials |
9.50% | 2/1/2023 | 4,796 | 5,458 | 5,503 | |||||||||||||||||||
F-52
Table of Contents
| 3. | Investments (continued) |
| Company (a) | Footnotes | Industry | Interest Rate |
Base Rate Floor |
Maturity Date |
Principal Amount(b) |
Cost | Fair Value | ||||||||||||||||||
| Hillman Group, Inc. |
(d)(e) | Consumer Durables & Apparel |
6.38 | % | 7/15/2022 | $ | 2,238 | $ | 2,057 | $ | 2,104 | |||||||||||||||
| Jo-Ann Stores, Inc. |
(d)(e) | Retailing |
8.13 | % | 3/15/2019 | 829 | 815 | 825 | ||||||||||||||||||
| Kenan Advantage Group, Inc. |
(d)(e) | Transportation |
7.88 | % | 7/31/2023 | 7,692 | 7,507 | 7,769 | ||||||||||||||||||
| Manitowoc Foodservice, Inc. |
Capital Goods |
9.50 | % | 2/15/2024 | 6,622 | 7,465 | 7,632 | |||||||||||||||||||
| Platform Specialty Products Corp. |
(d)(e) | Materials |
10.38 | % | 5/1/2021 | 6,813 | 7,123 | 7,545 | ||||||||||||||||||
| Solera Holdings, Inc. |
(d)(e) | Software & Services |
10.50 | % | 3/1/2024 | 6,818 | 7,474 | 7,670 | ||||||||||||||||||
| Total Subordinated Debt |
|
$ | 63,245 | $ | 64,395 | |||||||||||||||||||||
|
|
|
|
|
|||||||||||||||||||||||
| TOTAL INVESTMENTS — 219.7% |
|
$ | 246,347 | $ | 248,602 | |||||||||||||||||||||
|
|
|
|
|
|||||||||||||||||||||||
| (a) | Security may be an obligation of one or more entities affiliated with the named company. |
| (b) | Denominated in U.S. dollars unless otherwise noted. |
| (c) | A portfolio company domiciled in a foreign country. The jurisdiction of the security issuer may be a different country than the domicile of the portfolio company. |
| (d) | This security was acquired in a transaction that was exempt from the registration requirements of the Securities Act of 1933 pursuant to Rule 144A thereunder. This security may be resold only in transactions that are exempt from the registration requirements of the Securities Act, normally to qualified institutional buyers. |
| (e) | This investment is held by both the Company and SCJV as of December 31, 2016. |
| (1) | The interest rate on these investments is subject to a base rate of 3-Month LIBOR, which at December 31, 2016 was 1.00%. The current base rate for each investment may be different from the reference rate on December 31, 2016. |
| (2) | The interest rate on these investments is subject to a base rate of 2-Month LIBOR, which at December 31, 2016 was 0.82%. The current base rate for each investment may be different from the reference rate on December 31, 2016. |
| (3) | The interest rate on these investments is subject to a base rate of 1-Month LIBOR, which at December 31, 2016 was 0.77%. The current base rate for each investment may be different from the reference rate on December 31, 2016. |
Abbreviations:
GBR - United Kingdom
L = LIBOR - London Interbank Offered Rate, typically 3-Month
Below is selected balance sheet information for SCJV as of December 31, 2016 (in thousands):
| December 31, 2016 | ||||
| Selected Balance Sheet Information |
||||
| Total investments, at fair value |
$ | 248,602 | ||
| Cash and other assets |
16,876 | |||
|
|
|
|||
| Total assets |
$ | 265,478 | ||
|
|
|
|||
| Debt |
$ | 152,000 | ||
| Other liabilities |
338 | |||
|
|
|
|||
| Total liabilities |
$ | 152,338 | ||
|
|
|
|||
| Member’s equity |
$ | 113,140 | ||
|
|
|
|||
F-53
Table of Contents
| 3. | Investments (continued) |
Below is selected statement of operations information for SCJV for the period from August 15, 2016 (Inception) through December 31, 2016 (in thousands):
| Period from August 15, 2016 (Inception) through December 31, 2016 |
||||
| Selected Statement of Operations Information |
||||
| Total investment income |
$ | 6,910 | ||
| Expenses |
||||
| Interest expense |
1,553 | |||
| Professional services |
94 | |||
| Custodian and accounting fees |
79 | |||
| Administrative services |
21 | |||
| Director fees and expenses |
3 | |||
| Other |
1 | |||
|
|
|
|||
| Total expenses |
1,751 | |||
|
|
|
|||
| Net investment income |
5,159 | |||
| Net realized and unrealized gains |
2,381 | |||
|
|
|
|||
| Net increase in net assets resulting from operations |
$ | 7,540 | ||
|
|
|
|||
| 4. | Derivative Instruments |
The following is a summary of the fair value and location of the Company’s derivative instruments in the consolidated statements of assets and liabilities held as of December 31, 2016 and 2015 (in thousands):
| Fair Value as of December 31, |
||||||||
| Derivative Instrument |
Statement Location |
2016 |
2015 | |||||
| Cross currency swaps |
Unrealized appreciation on derivative instruments |
$26,748 | $ | 8,247 | ||||
| Cross currency swaps |
Unrealized depreciation on derivative instruments |
(251) | (304 | ) | ||||
| Foreign currency forward contracts |
Unrealized appreciation on derivative instruments |
3,504 | 2,258 | |||||
| Foreign currency forward contracts |
Unrealized depreciation on derivative instruments |
— | (541 | ) | ||||
| Interest rate swaps |
Unrealized appreciation on derivative instruments |
8,862 | 6,021 | |||||
| TRS |
Unrealized appreciation on derivative instruments |
3,397 | — | |||||
| TRS |
Unrealized depreciation on derivative instruments |
— | (13,562 | ) | ||||
|
|
|
|
||||||
| Total |
$42,260 | $ | 2,119 | |||||
|
|
|
|
||||||
F-54
Table of Contents
| 4. | Derivative Instruments (continued) |
Net realized and unrealized gains and losses on derivative instruments recorded by the Company for the years ended December 31, 2016, 2015 and 2014 are in the following locations in the consolidated statements of operations (in thousands):
| Realized Gains (Losses) | ||||||||||||||
| Year Ended December 31, | ||||||||||||||
| Derivative Instrument |
Statement Location |
2016 | 2015 | 2014 | ||||||||||
| Cross currency swaps |
Net realized gains on derivative instruments |
$ | 8,328 | $ | 541 | $ | - | |||||||
| Foreign currency forward contracts |
Net realized gains on derivative instruments |
7,344 | 70,096 | 2,867 | ||||||||||
| Interest rate swaps |
Net realized gains on derivative instruments |
(3,851 | ) | - | - | |||||||||
| TRS |
Net realized gains on derivative instruments |
12,485 | 12,913 | 4,487 | ||||||||||
|
|
|
|
|
|
|
|||||||||
| Total |
$ | 24,306 | $ | 83,550 | $ | 7,354 | ||||||||
|
|
|
|
|
|
|
|||||||||
| Unrealized Gains (Losses) | ||||||||||||||
| Year Ended December 31, | ||||||||||||||
| Derivative Instrument |
Statement Location |
2016 | 2015 | 2014 | ||||||||||
| Cross currency swaps |
Net change in unrealized appreciation on derivative instruments |
$ | 18,554 | $ | 7,943 | $ | - | |||||||
| Foreign currency forward contracts |
Net change in unrealized appreciation (depreciation) on derivative instruments |
1,787 | (38,728) | 43,626 | ||||||||||
| Interest rate swaps |
Net change in unrealized appreciation on derivative instruments |
2,841 | 6,021 | - | ||||||||||
| TRS |
Net change in unrealized appreciation (depreciation) on derivative instruments |
16,959 | (10,117) | (5,306) | ||||||||||
|
|
|
|
|
|
|
|||||||||
| Total |
$ | 40,141 | $ | (34,881) | $ | 38,320 | ||||||||
|
|
|
|
|
|
|
|||||||||
Offsetting of Derivative Instruments
The Company has derivative instruments that are subject to master netting agreements. These agreements include provisions to offset positions with the same counterparty in the event of default by one of the parties. The Company’s unrealized appreciation and depreciation on derivative instruments are reported as gross assets and liabilities, respectively, in the consolidated statements of assets and liabilities. The following tables present the Company’s assets and liabilities related to derivatives by counterparty, net of amounts available for offset under a master netting arrangement and net of any collateral received or pledged by the Company for such assets and liabilities as of December 31, 2016 and 2015 (in thousands).
| As of December 31, 2016 | ||||||||||||||||||||
| Counterparty |
Derivative Assets Subject to Master Netting Agreement |
Derivatives Available for Offset |
Non-cash Collateral Received (1) |
Cash Collateral Received (1) |
Net Amount of Derivative Assets (2) |
|||||||||||||||
| Bank of Nova Scotia |
$ | 3,397 | $ | - | $ | - | $ | - | $ | 3,397 | ||||||||||
| J.P. Morgan Chase Bank |
39,114 | - | - | - | 39,114 | |||||||||||||||
|
|
|
|
|
|
|
|
|
|
|
|||||||||||
| Total |
$ | 42,511 | $ | - | $ | - | $ | - | $ | 42,511 | ||||||||||
|
|
|
|
|
|
|
|
|
|
|
|||||||||||
| Counterparty |
Derivative Liabilities Subject to Master Netting Agreement |
Derivatives Available for Offset |
Non-cash Collateral Pledged (1) |
Cash Collateral Pledged (1) |
Net Amount of Derivative Liabilities (3) |
|||||||||||||||
| J.P. Morgan Chase Bank |
$ | 251 | $ | - | $ | - | $ | - | $ | 251 | ||||||||||
|
|
|
|
|
|
|
|
|
|
|
|||||||||||
| Total |
$ | 251 | $ | - | $ | - | $ | - | $ | 251 | ||||||||||
|
|
|
|
|
|
|
|
|
|
|
|||||||||||
F-55
Table of Contents
| 4. | Derivative Instruments (continued) |
| As of December 31, 2015 | ||||||||||||||||||||
| Counterparty |
Derivative Assets Subject to Master Netting Agreement |
Derivatives Available for Offset |
Non-cash Collateral Received (1) |
Cash Collateral Received (1) |
Net Amount of Derivative Assets (2) |
|||||||||||||||
| J.P. Morgan Chase Bank |
$ | 16,526 | $ | - | $ | - | $ | - | $ | 16,526 | ||||||||||
|
|
|
|
|
|
|
|
|
|
|
|||||||||||
| Total |
$ | 16,526 | $ | - | $ | - | $ | - | $ | 16,526 | ||||||||||
|
|
|
|
|
|
|
|
|
|
|
|||||||||||
| Counterparty |
Derivative Liabilities Subject to Master Netting Agreement |
Derivatives Available for Offset |
Non-cash Collateral Pledged (1) |
Cash Collateral Pledged (1) |
Net Amount of Derivative Liabilities (3) |
|||||||||||||||
| Bank of Nova Scotia |
$ | 13,562 | $ | - | $ | - | $ | 13,562 | $ | - | ||||||||||
| J.P. Morgan Chase Bank |
845 | - | - | - | 845 | |||||||||||||||
|
|
|
|
|
|
|
|
|
|
|
|||||||||||
| Total |
$ | 14,407 | $ | - | $ | - | $ | 13,562 | $ | 845 | ||||||||||
|
|
|
|
|
|
|
|
|
|
|
|||||||||||
| (1) | In some instances, the actual amount of the collateral received and/or pledged may be more than the amount shown due to overcollateralization. |
| (2) | Net amount of derivative assets represents the net amount due from the counterparty to the Company in the event of default. |
| (3) | Net amount of derivative liabilities represents the net amount due from the Company to the counterparty in the event of default. |
Foreign Currency Forward Contracts and Cross Currency Swaps:
The Company may enter into foreign currency forward contracts and cross currency swaps from time to time to facilitate settlement of purchases and sales of investments denominated in foreign currencies and to economically hedge the impact that an adverse change in foreign exchange rates would have on the value of the Company’s investments denominated in foreign currencies. A foreign currency forward contract is a commitment to purchase or sell a foreign currency at a future date at a negotiated forward rate. These contracts are marked-to-market by recognizing the difference between the contract forward exchange rate and the forward market exchange rate on the last day of the period presented as unrealized appreciation or depreciation. Realized gains or losses are recognized when forward contracts are settled. Risks arise as a result of the potential inability of the counterparties to meet the terms of their contracts. The Company attempts to limit counterparty risk by only dealing with well-known counterparties.
Cross currency swaps are interest rate swaps in which interest cash flows are exchanged between two parties based on the notional amounts of two different currencies. These swaps are marked-to-market by recognizing the difference between the present value of cash flows of each leg of the swaps as unrealized appreciation or depreciation. Realized gain or loss is recognized when periodic payments are received or paid and the swaps are terminated. The entire notional value of a cross currency swap is subject to the risk that the counterparty to the swap will default on its contractual delivery obligations. The Company attempts to limit counterparty risk by only dealing with well-known counterparties.
The foreign currency forward contracts and cross currency swaps open at the end of the period are generally indicative of the volume of activity during the period.
F-56
Table of Contents
| 4. | Derivative Instruments (continued) |
As of December 31, 2016 and 2015, the Company’s open foreign currency forward contracts were as follows ($ in thousands):
| As of December 31, 2016 | ||||||||||||||||||||||||
| Foreign Currency |
Settlement Date | Counterparty | Amount and Transaction |
US$ Value at Settlement Date |
US$ Value at December 31, 2016 |
Unrealized Appreciation |
||||||||||||||||||
| AUD |
Jan 12, 2017 | JP Morgan Chase Bank | A$ | 3,655 Sold | $ | 2,720 | $ | 2,637 | $ | 83 | ||||||||||||||
| AUD |
Apr 7, 2017 | JP Morgan Chase Bank | A$ | 14,071 Sold | 10,554 | 10,131 | 423 | |||||||||||||||||
| EUR |
Jan 12, 2017 | JP Morgan Chase Bank | € | 8,800 Sold | 9,871 | 9,269 | 602 | |||||||||||||||||
| EUR |
Apr 7, 2017 | JP Morgan Chase Bank | € | 141,500 Sold | 150,242 | 149,673 | 569 | |||||||||||||||||
| EUR |
Jul 7, 2017 | JP Morgan Chase Bank | € | 27,300 Sold | 30,812 | 29,009 | 1,803 | |||||||||||||||||
| EUR |
Jan 14, 2020 | JP Morgan Chase Bank | € | 21,000 Sold | 23,747 | 23,723 | 24 | |||||||||||||||||
|
|
|
|
|
|
|
|||||||||||||||||||
| Total |
$ | 227,946 | $ | 224,442 | $ | 3,504 | ||||||||||||||||||
|
|
|
|
|
|
|
|||||||||||||||||||
| As of December 31, 2015 | ||||||||||||||||||||||||
| Foreign Currency |
Settlement Date | Counterparty | Amount and Transaction |
US$ Value at Settlement Date |
US$ Value at December 31, 2015 |
Unrealized Appreciation (Depreciation) |
||||||||||||||||||
| AUD |
Apr 7, 2016 | JP Morgan Chase Bank | A$ | 17,726 Sold | $ | 12,439 | $ | 12,859 | $ | (420) | ||||||||||||||
| EUR |
Jan 11, 2016 | JP Morgan Chase Bank | € | 50,485 Sold | 56,584 | 54,874 | 1,710 | |||||||||||||||||
| GBP |
Jan 11, 2016 | JP Morgan Chase Bank | £ | 8,953 Sold | 13,747 | 13,199 | 548 | |||||||||||||||||
| GBP |
Jan 11, 2016 | JP Morgan Chase Bank | £ | 3,700 Bought | (5,576) | (5,455) | (121) | |||||||||||||||||
|
|
|
|
|
|
|
|||||||||||||||||||
| Total |
$ | 77,194 | $ | 75,477 | $ | 1,717 | ||||||||||||||||||
|
|
|
|
|
|
|
|||||||||||||||||||
As of December 31, 2016 and 2015, the Company’s open cross currency swaps were as follows ($ in thousands).
| As of December 31, 2016 | ||||||||||||
| Counterparty |
Company Receives Fixed Rate |
Company Pays Fixed Rate |
Termination Date |
Unrealized Appreciation (Depreciation) |
||||||||
| JPMorgan Chase Bank, N.A |
0.300% on USD notional amount of $9,342 |
1.975% on AUD notional amount of A$13,161 | 6/30/2017 | $ | (251) | |||||||
| JPMorgan Chase Bank, N.A |
0.759% on USD notional amount of $175,018 |
0.026% on EUR notional amount of €156,546 | 12/31/2017 | 8,040 | ||||||||
| JPMorgan Chase Bank, N.A |
0.590% on USD notional amount of $57,684 |
1.006% on GBP notional amount of £37,537 | 12/31/2017 | 10,946 | ||||||||
| JPMorgan Chase Bank, N.A |
0.913% on USD notional amount of $56,506 |
0.750% on GBP notional amount of £39,349 | 6/30/2017 | 7,762 | ||||||||
|
|
|
|||||||||||
| $ | 26,497 | |||||||||||
|
|
|
|||||||||||
| As of December 31, 2015 | ||||||||||||
| Counterparty |
Company Receives Fixed Rate |
Company Pays Fixed Rate |
Termination Date |
Unrealized Appreciation (Depreciation) |
||||||||
| JPMorgan Chase Bank, N.A |
0.300% on USD notional amount of $9,342 |
1.975% on AUD notional amount of A$13,161 | 6/30/2017 | $ | (304) | |||||||
| JPMorgan Chase Bank, N.A |
0.759% on USD notional amount of $316,351 |
0.026% on EUR notional amount of €282,962 | 12/31/2017 | 4,402 | ||||||||
| JPMorgan Chase Bank, N.A |
0.590% on USD notional amount of $130,061 |
1.006% on GBP notional amount of £84,637 | 12/31/2017 | 3,845 | ||||||||
|
|
|
|||||||||||
| $ | 7,943 | |||||||||||
|
|
|
|||||||||||
F-57
Table of Contents
| 4. | Derivative Instruments (continued) |
As of December 31, 2016 and 2015, the combined contractual notional balance of the Company’s foreign currency forward contracts and cross currency swaps totaled $526.50 million and $532.95 million, respectively, all of which related to economic hedging of the Company’s foreign currency denominated debt investments. The tables below display the Company’s foreign currency denominated debt investments and foreign currency forward contracts, summarized by foreign currency type as of December 31, 2016 and 2015 (in thousands).
| Debt Investments Denominated in Foreign Currencies | Hedges | |||||||||||||||||||
| As of December 31, 2016 | As of December 31, 2016 | |||||||||||||||||||
| (in thousands) |
Par Value in Local Currency |
Par Value in US$ |
Fair Value |
Net Foreign Currency Hedge Amount in Local Currency |
Net Foreign Currency Hedge Amount in U.S. Dollars |
|||||||||||||||
| Euros |
€ | 425,326 | $ | 447,315 | $ | 339,838 | € | 355,146 | $ | 389,690 | ||||||||||
| British Pound Sterling |
£ | 70,607 | 87,136 | 86,770 | £ | 76,886 | 114,190 | |||||||||||||
| Australian Dollars |
A$ | 31,021 | 22,360 | 11,813 | A$ | 30,887 | 22,616 | |||||||||||||
|
|
|
|
|
|
|
|||||||||||||||
| Total |
$ | 556,811 | $ | 438,421 | $ | 526,496 | ||||||||||||||
|
|
|
|
|
|
|
|||||||||||||||
| Debt Investments Denominated in Foreign Currencies | Hedges | |||||||||||||||||||
| As of December 31, 2015 | As of December 31, 2015 | |||||||||||||||||||
| (in thousands) |
Par Value in Local Currency |
Par Value in US$ |
Fair Value |
Net Foreign Currency Hedge Amount in Local Currency |
Net Foreign Currency Hedge Amount in U.S. Dollars |
|||||||||||||||
| Euros |
€ | 404,360 | $ | 439,438 | $ | 368,746 | € | 333,447 | $ | 372,935 | ||||||||||
| British Pound Sterling |
£ | 121,426 | 179,006 | 177,509 | £ | 89,890 | 138,232 | |||||||||||||
| Australian Dollars |
A$ | 31,021 | 23,949 | 21,471 | A$ | 30,887 | 21,781 | |||||||||||||
|
|
|
|
|
|
|
|||||||||||||||
| Total |
$ | 642,393 | $ | 567,726 | $ | 532,948 | ||||||||||||||
|
|
|
|
|
|
|
|||||||||||||||
Interest Rate Swaps:
Interest rate swap contracts are privately negotiated agreements between the Company and a counterparty. Pursuant to interest rate swap agreements, the Company makes fixed-rate payments to a counterparty in exchange for payments on a floating benchmark interest rate. Payments received or made are recorded as realized gains or losses. During the term of the outstanding swap agreement, changes in the underlying value of the swap are recorded as unrealized gains or losses. The value of the swap is determined by changes in the relationship between two rates of interest. The Company is exposed to credit loss in the event of non-performance by the swap counterparty. Risk may also arise from movements in interest rates. The Company attempts to limit counterparty risk by only dealing with well-known counterparties.
The interest rate swaps open at the end of the period are generally indicative of the volume of activity during the period.
As of December 31, 2016 and 2015, the Company’s open interest rate swaps were as follows ($ in thousands).
| As of December 31, 2016 |
||||||||||||||||||||
| Counterparty |
Notional Amount |
Company Receives Floating Rate |
Company Pays Fixed Rate |
Termination Date |
Unrealized Appreciation |
|||||||||||||||
| JPMorgan Chase Bank, N.A |
$ | 100,000 | 3-Month LIBOR | 1.36 | % | 12/31/2020 | $ | 1,687 | ||||||||||||
| JPMorgan Chase Bank, N.A |
$ | 100,000 | 3-Month LIBOR | 0.84 | % | 3/31/2019 | 1,443 | |||||||||||||
| JPMorgan Chase Bank, N.A |
$ | 400,000 | 3-Month LIBOR | 1.43 | % | 12/31/2020 | 5,732 | |||||||||||||
|
|
|
|||||||||||||||||||
| $ | 8,862 | |||||||||||||||||||
|
|
|
|||||||||||||||||||
F-58
Table of Contents
| 4. | Derivative Instruments (continued) |
| As of December 31, 2015 |
||||||||||||||||||||
| Counterparty |
Notional Amount |
Company Receives Floating Rate |
Company Pays Fixed Rate |
Termination Date |
Unrealized Appreciation |
|||||||||||||||
| JPMorgan Chase Bank, N.A |
$ | 100,000 | 3-Month LIBOR | 1.36 | % | 12/31/2020 | $ | 1,457 | ||||||||||||
| JPMorgan Chase Bank, N.A |
$ | 400,000 | 3-Month LIBOR | 1.43 | % | 12/31/2020 | 4,564 | |||||||||||||
|
|
|
|||||||||||||||||||
| $ | 6,021 | |||||||||||||||||||
|
|
|
|||||||||||||||||||
Equity Options and Warrants:
The Company holds equity options and warrants in certain portfolio companies in an effort to achieve additional investment returns. In holding equity options and warrants, the Company bears the risk of an unfavorable change in the value of the underlying equity interests. Equity options and warrants are recorded as investments at fair value in the consolidated statements of assets and liabilities. The aggregate fair value of equity options and warrants included in investments at fair value in the Company’s consolidated statements of assets and liabilities represented 0.4% and 0.5% of the Company’s net assets as of each of December 31, 2016 and 2015, respectively.
Below is a summary of the Company’s investments in equity options and warrants as of December 31, 2016 and 2015 (in thousands, except share amounts):
| As of December 31, 2016 | ||||||||||||||||
| Company |
Expiration Date |
No. Shares | Cost | Fair Value |
||||||||||||
| Amtek Global Technology Pte. Ltd. (SGP), Warrants |
12/31/2017 | 9,991 | $ | 4,636 | $ | 3,379 | ||||||||||
| Amtek Global Technology Pte. Ltd. (SGP), Warrants |
12/31/2018 | 9,991 | 4,785 | 3,413 | ||||||||||||
| Education Management Corp., Warrants |
1/5/2022 | 2,320,791 | 371 | - | ||||||||||||
| Hilding Anders, Equity Options |
12/31/2020 | 236,160,807 | 14,988 | 2,253 | ||||||||||||
| Home Partners of America, Inc., Warrants |
8/7/2024 | 2,674 | 292 | 607 | ||||||||||||
| Jacuzzi Brands, Inc., Warrants |
7/3/2019 | 49,888 | - | 1,400 | ||||||||||||
| Keystone Australia Holdings, Pty. Ltd., Warrants |
(1) | 1,588,469 | 1,019 | - | ||||||||||||
| Petroplex Acidizing, Inc., Warrants |
12/29/2026 | 8 | - | - | ||||||||||||
|
|
|
|
|
|||||||||||||
| Total |
$ | 26,091 | $ | 11,052 | ||||||||||||
|
|
|
|
|
|||||||||||||
| (1) | Expiration date contingent on certain events pursuant to underlying agreements. |
| As of December 31, 2015 | ||||||||||||||||
| Company |
Expiration Date |
No. Shares | Cost | Fair Value |
||||||||||||
| Amtek Global Technology Pte. Ltd. (SGP), Warrants |
12/31/2017 | 9,991 | $ | 4,636 | $ | 4,551 | ||||||||||
| Amtek Global Technology Pte. Ltd. (SGP), Warrants |
12/31/2018 | 9,991 | 4,785 | 4,754 | ||||||||||||
| Education Management Corp., Warrants |
1/5/2022 | 2,320,791 | 371 | - | ||||||||||||
| Gruppo Argenta S.p.A., Warrants |
(1) | 225,289 | 5,342 | 2,332 | ||||||||||||
| Hilding Anders, Equity Options |
12/31/2020 | 236,160,807 | 14,988 | 213 | ||||||||||||
| Home Partners of America, Inc., Warrants |
8/7/2024 | 2,675 | 292 | 370 | ||||||||||||
| Keystone Australia Holdings, Pty. Ltd., Warrants |
(1) | 1,588,469 | 1,019 | - | ||||||||||||
|
|
|
|
|
|||||||||||||
| Total |
$ | 31,433 | $ | 12,220 | ||||||||||||
|
|
|
|
|
|||||||||||||
| (1) | Expiration date contingent on certain events pursuant to underlying agreements. |
The Company may enter into other derivative instruments and incur other exposures with other counterparties in the future. The derivative instruments held as of December 31, 2016 and 2015 generally reflect the volume of derivative activity throughout the periods presented.
F-59
Table of Contents
| 4. | Derivative Instruments (continued) |
Total Return Swaps:
On November 15, 2012, Halifax Funding entered into the TRS with the Bank of Nova Scotia (“BNS” or the “Counterparty”). The TRS arrangement with BNS consists of a set of TRS agreements. On October 22, 2015, Halifax Funding amended the TRS agreements. Pursuant to the amended TRS agreements, Halifax Funding may select a portfolio of single-name corporate loans and/or bonds (each, a “TRS asset” and together, the “TRS assets”) with a maximum aggregate notional amount of $500 million. Under the terms of the TRS agreements, each TRS asset included in the TRS portfolio constitutes a separate total return swap transaction, although all calculations, payments and transfers required to be made under the TRS agreements are calculated and treated on an aggregate basis, based upon all such transactions.
Halifax Funding receives quarterly from BNS (i) all collected interest and fees generated by the TRS assets and (ii) realized gains from the sale or principal payments/paydowns of TRS assets, if any. Halifax Funding pays to BNS (i) a financing charge on the TRS settled notional amount at a rate equal to the three-month LIBOR plus 1.40% per annum and (ii) realized losses, if any, related to the TRS assets. In addition, upon the termination of the TRS arrangement, Halifax Funding will either receive from BNS any net realized gain, or pay to BNS any net realized loss, on the liquidation of TRS assets.
Halifax Funding posts collateral in the form of certificates of deposit held by a custodian. Generally, the required collateral amount is at least 33.3% of the notional amount of each TRS asset at the time that such TRS asset is confirmed for acquisition by the Counterparty. Halifax Funding may be required to post additional collateral in the event the value of the TRS assets decreases below a specified amount. Halifax Funding is required to post additional collateral to ensure that the collateral’s market value, as solely determined by BNS, is at least equal to 25% of the value of the TRS portfolio.
The obligations of Halifax Funding under the TRS agreements are nonrecourse to the Company and the Company’s exposure to the TRS is limited to its equity in Halifax Funding, which is generally equal to the collateral posted by Halifax Funding. The Company has no contractual obligation to post any collateral or to pay any financing charges to BNS. The Company may, but is not obligated to, increase its equity investment in Halifax Funding for the purpose of funding additional collateral or payment obligations for which Halifax Funding may become obligated during the term of the TRS agreements. If the Company does not make any such additional equity investment in Halifax Funding and Halifax Funding fails to meet its obligations under the TRS agreements, then BNS will have the right to terminate the TRS agreements and use the collateral posted by Halifax Funding with the custodian to offset any amount owed to BNS. Halifax Funding may terminate the TRS agreements at any time upon providing at least 30 days’ notice prior to the proposed settlement date of the TRS assets related to such termination. In the absence of an early termination, the TRS will terminate on January 15, 2019. In the event of an early termination of the TRS, Halifax Funding may be required to pay a make-whole fee based on a minimum spread amount to be earned by BNS over the life of the amended TRS agreements. Halifax Funding would have been required to pay a make whole fee of $9.05 million if the TRS had been terminated as of December 31, 2016.
As of December 31, 2016 and 2015, Halifax Funding had selected 47 and 51 underlying debt positions, respectively, and had posted $95.0 million and $142.64 million, respectively, in collateral, which are recorded as collateral on deposit with custodian in the consolidated statements of assets and liabilities. The following table reconciles the TRS settled notional amount, upon which the financing charge to BNS is based, to the total, or trade basis, notional amount as of December 31, 2016 and 2015 (in thousands).
| December 31, 2016 | December 31, 2015 | |||||||
| Settled notional amount |
$ | 225,919 | $ | 310,371 | ||||
| Unsettled additions |
37,737 | 14,595 | ||||||
| Unsettled deletions |
(4,967 | ) | - | |||||
|
|
|
|
|
|||||
| Total notional amount |
$ | 258,689 | $ | 324,966 | ||||
|
|
|
|
|
|||||
The following table summarizes the fair value components of the TRS portfolio (in thousands):
| December 31, 2016 | December 31, 2015 | |||||||
| Interest and fee income |
$ | 4,215 | $ | 4,658 | ||||
| Financing charge |
(869 | ) | (896 | ) | ||||
| Net realized gains (losses) |
441 | (571 | ) | |||||
| Net unrealized depreciation of TRS assets |
(390 | ) | (16,753 | ) | ||||
|
|
|
|
|
|||||
| TRS total fair value |
$ | 3,397 | $ | (13,562 | ) | |||
|
|
|
|
|
|||||
F-60
Table of Contents
| 4. | Derivative Instruments (continued) |
The following table summarizes the components of the net realized gains on derivative instruments relating to the TRS (in thousands):
| Year Ended December 31, | ||||||||
| 2016 | 2015 | |||||||
| Interest and fee income |
$ | 19,170 | $ | 17,242 | ||||
| Financing charge |
(6,109 | ) | (4,028 | ) | ||||
| Net realized loss |
(576 | ) | (301 | ) | ||||
|
|
|
|
|
|||||
| Net realized gains on derivative instruments related to the TRS |
$ | 12,485 | $ | 12,913 | ||||
|
|
|
|
|
|||||
The following is a summary of the TRS assets as of December 31, 2016 (in thousands):
| Company (a) | Industry | Interest Rate |
LIBOR Floor |
Maturity Date |
Notional Amount |
Fair Value | Unrealized Appreciation (Depreciation) |
|||||||||||||||||||
| Senior Secured Loans—First Lien |
||||||||||||||||||||||||||
| ABB CONCISE Optical Group, LLC |
Retailing | L + 500 | 1.00 | % | 06/15/2023 | $ | 6,795 | $ | 6,928 | $ | 133 | |||||||||||||||
| ABILITY Network, Inc. (d) |
Health Care Equipment & Services | L + 500 | 1.00 | % | 5/14/2021 | 11,370 | 11,402 | 32 | ||||||||||||||||||
| Alion Science & Technology Corp. |
Capital Goods | L + 450 | 1.00 | % | 08/19/2021 | 2,829 | 2,780 | (49 | ) | |||||||||||||||||
| Applied Systems, Inc. (c) (d) |
Software & Services | L + 300 | 1.00 | % | 1/25/2021 | 648 | 646 | (2 | ) | |||||||||||||||||
| Aspen Dental Management, Inc. |
Health Care Equipment & Services | L + 425 | 1.00 | % | 4/29/2022 | 2,515 | 2,544 | 29 | ||||||||||||||||||
| Bay Club Co. (c) |
Consumer Services | L + 650 | 1.00 | % | 8/31/2022 | 4,371 | 4,333 | (38 | ) | |||||||||||||||||
| CityCenter Holdings, LLC |
Real Estate | L + 325 | 1.00 | % | 10/16/2020 | 10,252 | 10,360 | 108 | ||||||||||||||||||
| Commercial Barge Line, Co. |
Transportation | L + 875 | 1.00 | % | 11/12/2020 | 11,452 | 11,194 | (258 | ) | |||||||||||||||||
| CPI International, Inc. |
Capital Goods | L + 325 | 1.00 | % | 11/17/2017 | 4,569 | 4,512 | (57 | ) | |||||||||||||||||
| CSM Bakery Products |
Food, Beverage & Tobacco | L + 400 | 1.00 | % | 7/3/2020 | 4,838 | 4,403 | (435 | ) | |||||||||||||||||
| CTI Foods Holding Co., LLC |
Food, Beverage & Tobacco | L + 350 | 1.00 | % | 6/29/2020 | 3,776 | 3,678 | (98 | ) | |||||||||||||||||
| Distribution International, Inc. (c) (d) |
Retailing | L + 500 | 1.00 | % | 12/15/2021 | 9,783 | 9,013 | (770 | ) | |||||||||||||||||
| DJO Finance, LLC |
Health Care Equipment & Services | L + 325 | 1.00 | % | 6/8/2020 | 8,735 | 8,303 | (432 | ) | |||||||||||||||||
| Emerald Expositions Holding, Inc. (c) |
Media | L + 375 | 1.00 | % | 6/17/2020 | 4,291 | 4,290 | (1 | ) | |||||||||||||||||
| Emerald Performance Materials, LLC (c) |
Materials | L + 350 | 1.00 | % | 7/30/2021 | 634 | 633 | (1 | ) | |||||||||||||||||
| Grocery Outlet, Inc. |
Food & Staples Retailing | L + 400 | 1.00 | % | 10/21/2021 | 4,927 | 4,842 | (85 | ) | |||||||||||||||||
| Gymboree Corp. (d) |
Retailing | L + 350 | 1.50 | % | 2/23/2018 | 918 | 534 | (384 | ) | |||||||||||||||||
| Heartland Dental Care, LLC (c) |
Pharmaceuticals, Biotechnology & Life Sciences | L + 450 | 1.00 | % | 12/21/2018 | 1,034 | 1,027 | (7 | ) | |||||||||||||||||
| Hillman Group, Inc. |
Consumer Durables & Apparel | L + 350 | 1.00 | % | 6/30/2021 | 9,779 | 9,786 | 7 | ||||||||||||||||||
| HUB International, Ltd. |
Insurance | L + 300 | 1.00 | % | 10/2/2020 | 5,981 | 6,121 | 140 | ||||||||||||||||||
| inVentiv Health, Inc. (c) |
Health Care Equipment & Services | L + 375 | 1.00 | % | 11/9/2023 | 5,541 | 5,493 | (48 | ) | |||||||||||||||||
| iPayment, Inc. (d) |
Software & Services | L + 525 | 1.50 | % | 5/8/2017 | 13,563 | 13,170 | (393 | ) | |||||||||||||||||
| Koosharem, LLC (c) (d) |
Commercial & Professional Services | L + 650 | 1.00 | % | 5/15/2020 | 1,802 | 1,800 | (2 | ) | |||||||||||||||||
| MCS AMS Sub-Holdings, LLC (d) |
Commercial & Professional Services | L + 650 | 1.00 | % | 10/15/2019 | 10,824 | 12,428 | 1,604 | ||||||||||||||||||
| Neiman Marcus Group, LLC |
Retailing | L + 325 | 1.00 | % | 10/25/2020 | 8,707 | 7,637 | (1,070 | ) | |||||||||||||||||
| P2 Energy Solutions, Inc. (c) |
Software & Services | L + 400 | 1.00 | % | 10/30/2020 | 4,638 | 4,386 | (252 | ) | |||||||||||||||||
| Plaskolite, LLC (c) (d) |
Materials | L + 475 | 1.00 | % | 11/3/2022 | 3,232 | 3,205 | (27 | ) | |||||||||||||||||
| PQ Corp. (c) |
Materials | L + 425 | 1.00 | % | 11/4/2022 | 696 | 694 | (2 | ) | |||||||||||||||||
| Riverbed Technology, Inc. |
Technology Hardware & Equipment | L + 325 | 1.00 | % | 4/25/2022 | 4,853 | 4,902 | 49 | ||||||||||||||||||
| Savers, Inc. |
Retailing | L + 375 | 1.25 | % | 7/9/2019 | 6,704 | 6,598 | (106 | ) | |||||||||||||||||
| Sequa Corp. (c) (d) |
Capital Goods | L + 400 | 1.25 | % | 6/19/2017 | 677 | 668 | (9 | ) | |||||||||||||||||
| TIBCO Software, Inc. (d) |
Software & Services | L + 550 | 1.00 | % | 12/4/2020 | 10,700 | 10,946 | 246 | ||||||||||||||||||
| Triple Point Technology, Inc. |
Software & Services | L + 425 | 1.00 | % | 7/10/2020 | 6,871 | 6,631 | (240 | ) | |||||||||||||||||
| TRUGREEN LIMITED PARTNERSHIP |
Consumer Services | L + 550 | 1.00 | % | 4/13/2023 | 4,894 | 5,023 | 129 | ||||||||||||||||||
| Vertafore Inc (c) |
Software & Services | L + 325 | 1.00 | % | 6/30/2023 | 1,039 | 1,034 | (5 | ) | |||||||||||||||||
| GYP Holdings III Corp. |
Capital Goods | L + 375 | 1.00 | % | 4/1/2021 | 8,268 | 8,382 | 114 | ||||||||||||||||||
|
|
|
|
|
|
|
|||||||||||||||||||||
| Total Senior Secured Loans—First Lien |
202,506 | 200,326 | (2,180 | ) | ||||||||||||||||||||||
|
|
|
|
|
|
|
|||||||||||||||||||||
| Senior Secured Loans—Second Lien |
||||||||||||||||||||||||||
| Applied Systems, Inc. (d) |
Software & Services | L + 650 | 1.00 | % | 1/24/2022 | 7,706 | 7,698 | (8 | ) | |||||||||||||||||
| Emerald Performance Materials, LLC |
Materials | L + 775 | 1.00 | % | 8/1/2022 | 2,043 | 2,035 | (8 | ) | |||||||||||||||||
| Grocery Outlet, Inc. (c) (d) |
Food & Staples Retailing | L + 825 | 1.00 | % | 10/21/2022 | 5,011 | 4,996 | (15 | ) | |||||||||||||||||
| Misys, Ltd. (b) |
Software & Services | 12.00% | 6/12/2019 | 980 | 1,011 | 31 | ||||||||||||||||||||
| NEP Group, Inc. (d) |
Media | L + 875 | 1.25 | % | 7/22/2020 | 8,166 | 8,260 | 94 | ||||||||||||||||||
| P2 Energy Solutions, Inc. (c) (d) |
Software & Services | L + 800 | 1.00 | % | 4/30/2021 | 3,038 | 3,038 | — | ||||||||||||||||||
| Talbots, Inc. (c) |
Retailing | L + 850 | 1.00 | % | 3/19/2021 | 3,013 | 2,988 | (25 | ) | |||||||||||||||||
|
|
|
|
|
|
|
|||||||||||||||||||||
| Total Senior Secured Loans—Second Lien |
29,957 | 30,026 | 69 | |||||||||||||||||||||||
|
|
|
|
|
|
|
|||||||||||||||||||||
| Senior Secured Bonds |
||||||||||||||||||||||||||
| Artesyn Technologies, Inc. (d) |
Technology Hardware & Equipment | 9.75% | 10/15/2020 | 3,640 | 3,185 | (455 | ) | |||||||||||||||||||
| Direct ChassisLink, Inc. (d) |
Transportation | 10.00% | 6/15/2023 | 12,084 | 12,447 | 363 | ||||||||||||||||||||
|
|
|
|
|
|
|
|||||||||||||||||||||
| Total Senior Secured Bonds |
15,724 | 15,632 | (92 | ) | ||||||||||||||||||||||
|
|
|
|
|
|
|
|||||||||||||||||||||
F-61
Table of Contents
| 4. | Derivative Instruments (continued) |
| Company (a) | Industry | Interest Rate |
LIBOR Floor |
Maturity Date |
Notional Amount |
Fair Value | Unrealized Appreciation (Depreciation) |
|||||||||||||||||||
| Subordinated Debt |
||||||||||||||||||||||||||
| GCI, Inc. (d) |
Telecommunication Services | 6.75% | 6/1/2021 | 1,002 | 1,027 | 25 | ||||||||||||||||||||
| Solera Holdings, Inc. (d) |
Software & Services | 10.50% | 3/1/2024 | 9,500 | 11,288 | 1,788 | ||||||||||||||||||||
|
|
|
|
|
|
|
|||||||||||||||||||||
| Total Subordinated Debt |
10,502 | 12,315 | 1,813 | |||||||||||||||||||||||
|
|
|
|
|
|
|
|||||||||||||||||||||
| TOTAL |
$ | 258,689 | $ | 258,299 | $ | (390 | ) | |||||||||||||||||||
|
|
|
|
|
|
|
|||||||||||||||||||||
(a) Security may be an obligation of one or more entities affiliated with the named company.
(b) The investment is not a qualifying asset as defined in Section 55(a) under the 1940 Act.
(c) TRS asset position or portion thereof unsettled as of December 31, 2016.
(d) This investment is held both by the Company and within the TRS as of December 31, 2016.
The following is a summary of the TRS assets as of December 31, 2015 (in thousands):
| Company (a) | Industry | Interest Rate |
LIBOR Floor |
Maturity Date |
Notional Amount |
Fair Value | Unrealized Appreciation (Depreciation) |
|||||||||||||||||||
| Senior Secured Loans - First Lien |
||||||||||||||||||||||||||
| ABILITY Network, Inc. (e) |
Health Care Equipment & Services | L + 500 | 1.00 | % | 5/14/2021 | $ | 6,798 | $ | 6,737 | $ | (61 | ) | ||||||||||||||
| Acosta Holdco, Inc. |
Commercial & Professional Services | L + 325 | 1.00 | % | 9/26/2021 | 4,249 | 4,043 | (206 | ) | |||||||||||||||||
| Alion Science & Technology Corp. (c) |
Capital Goods | L + 450 | 1.00 | % | 8/19/2021 | 2,858 | 2,830 | (28 | ) | |||||||||||||||||
| Applied Systems, Inc. (e) |
Software & Services | L + 325 | 1.00 | % | 1/25/2021 | 7,932 | 7,804 | (128 | ) | |||||||||||||||||
| Aspen Dental Management, Inc. |
Health Care Equipment & Services | L + 450 | 1.00 | % | 4/29/2022 | 6,169 | 6,174 | 5 | ||||||||||||||||||
| BJ’s Wholesale Club, Inc. |
Food & Staples Retailing | L + 350 | 1.00 | % | 9/26/2019 | 3,939 | 3,743 | (196 | ) | |||||||||||||||||
| Caesars Entertainment Operating Co., Inc.(b) (d) (e) |
Consumer Services | L + 725 | 0.00 | % | 3/1/2017 | 3,745 | 3,493 | (252 | ) | |||||||||||||||||
| California Pizza Kitchen, Inc. (e) |
Food & Staples Retailing | L + 425 | 1.00 | % | 3/29/2018 | 3,770 | 3,582 | (188 | ) | |||||||||||||||||
| Catalina Marketing Corp. |
Media | L + 350 | 1.00 | % | 4/9/2021 | 707 | 562 | (145 | ) | |||||||||||||||||
| CHG Companies, Inc. |
Health Care Equipment & Services | L + 325 | 1.00 | % | 11/19/2019 | 2,857 | 2,801 | (56 | ) | |||||||||||||||||
| CityCenter Holdings, LLC (e) |
Real Estate | L + 325 | 1.00 | % | 10/16/2020 | 12,448 | 12,366 | (82 | ) | |||||||||||||||||
| Commercial Barge Line, Co. |
Transportation | L + 875 | 1.00 | % | 11/12/2020 | 11,898 | 11,459 | (439 | ) | |||||||||||||||||
| CPI International, Inc. |
Capital Goods | L + 325 | 1.00 | % | 11/17/2017 | 4,772 | 4,630 | (142 | ) | |||||||||||||||||
| CSM Bakery Products |
Food, Beverage & Tobacco | L + 400 | 1.00 | % | 7/3/2020 | 4,888 | 4,816 | (72 | ) | |||||||||||||||||
| CTI Foods Holding Co., LLC |
Food, Beverage & Tobacco | L + 350 | 1.00 | % | 6/29/2020 | 3,947 | 3,706 | (241 | ) | |||||||||||||||||
| Distribution International, Inc. (e) |
Retailing | L + 500 | 1.00 | % | 12/10/2021 | 4,901 | 4,517 | (384 | ) | |||||||||||||||||
| DJO Finance, LLC |
Health Care Equipment & Services | L + 325 | 1.00 | % | 6/8/2020 | 8,824 | 8,507 | (317 | ) | |||||||||||||||||
| Emerald Expositions Holding, Inc. |
Media | L + 375 | 1.00 | % | 6/17/2020 | 9,933 | 9,725 | (208 | ) | |||||||||||||||||
| Four Seasons Holdings, Inc. (b) |
Consumer Services | L + 275 | 0.75 | % | 6/27/2020 | 405 | 404 | (1 | ) | |||||||||||||||||
| Grocery Outlet, Inc. (e) |
Food & Staples Retailing | L + 375 | 1.00 | % | 10/21/2021 | 4,977 | 4,753 | (224 | ) | |||||||||||||||||
| Gymboree Corp. (e) |
Retailing | L + 350 | 1.50 | % | 2/23/2018 | 2,834 | 1,616 | (1,218 | ) | |||||||||||||||||
| Gypsum Management & Supply, Inc. |
Capital Goods | L + 375 | 1.00 | % | 4/1/2021 | 8,353 | 7,918 | (435 | ) | |||||||||||||||||
| Hanson Building Products North America (b) (e) |
Materials | L + 550 | 1.00 | % | 3/13/2022 | 12,463 | 12,183 | (280 | ) | |||||||||||||||||
| Harbor Freight Tools USA, Inc. (e) |
Capital Goods | L + 375 | 1.00 | % | 7/26/2019 | 1,901 | 1,889 | (12 | ) | |||||||||||||||||
| Hillman Group, Inc. (e) |
Consumer Durables & Apparel | L + 350 | 1.00 | % | 6/30/2021 | 9,962 | 9,670 | (292 | ) | |||||||||||||||||
| HUB International, Ltd. |
Insurance | L + 300 | 1.00 | % | 10/2/2020 | 12,947 | 12,398 | (549 | ) | |||||||||||||||||
| Hyland Software, Inc. |
Software & Services | L + 375 | 1.00 | % | 7/1/2022 | 6,921 | 6,747 | (174 | ) | |||||||||||||||||
| iPayment, Inc. (c) (e) |
Software & Services | L + 525 | 1.50 | % | 5/8/2017 | 14,723 | 14,318 | (405 | ) | |||||||||||||||||
| Kronos, Inc. |
Software & Services | L + 350 | 1.00 | % | 10/30/2019 | 9,833 | 9,689 | (144 | ) | |||||||||||||||||
| Learfield Communications, Inc. |
Media | L + 350 | 1.00 | % | 10/9/2020 | 7,343 | 7,233 | (110 | ) | |||||||||||||||||
| MCS AMS Sub-Holdings, LLC (c) (e) |
Commercial & Professional Services | L + 650 | 1.00 | % | 10/15/2019 | 12,150 | 12,000 | (150 | ) | |||||||||||||||||
| MultiPlan, Inc. |
Health Care Equipment & Services | L + 275 | 1.00 | % | 3/31/2021 | 8,351 | 8,104 | (247 | ) | |||||||||||||||||
| Neiman Marcus Group, LLC (e) |
Retailing | L + 325 | 1.00 | % | 10/25/2020 | 8,797 | 7,835 | (962 | ) | |||||||||||||||||
| P2 Energy Solutions, Inc. (b) |
Software & Services | L + 400 | 1.00 | % | 10/30/2020 | 4,698 | 4,231 | (467 | ) | |||||||||||||||||
| RedPrairie Corp. (e) |
Software & Services | L + 500 | 1.00 | % | 12/21/2018 | 4,838 | 4,385 | (453 | ) | |||||||||||||||||
| Riverbed Technology, Inc. (e) |
Technology Hardware & Equipment | L + 500 | 1.00 | % | 4/24/2022 | 4,938 | 4,943 | 5 | ||||||||||||||||||
| Savers, Inc. |
Retailing | L + 375 | 1.25 | % | 7/9/2019 | 8,774 | 7,131 | (1,643 | ) | |||||||||||||||||
| Talbots, Inc. |
Retailing | L + 450 | 1.00 | % | 3/19/2020 | 8,425 | 7,979 | (446 | ) | |||||||||||||||||
| TIBCO Software, Inc. (e) |
Software & Services | L + 550 | 1.00 | % | 12/4/2020 | 4,714 | 4,470 | (244 | ) | |||||||||||||||||
| Triple Point Technology, Inc. |
Software & Services | L + 425 | 1.00 | % | 7/10/2020 | 6,963 | 5,479 | (1,484 | ) | |||||||||||||||||
|
|
|
|
|
|
|
|||||||||||||||||||||
| Total Senior Secured Loans - First Lien |
269,945 | 256,870 | (13,075 | ) | ||||||||||||||||||||||
|
|
|
|
|
|
|
|||||||||||||||||||||
| Senior Secured Loans - Second Lien |
||||||||||||||||||||||||||
| Applied Systems, Inc. (e) |
Software & Services | L + 650 | 1.00 | % | 1/24/2022 | 4,658 | 4,248 | (410 | ) | |||||||||||||||||
| Gypsum Management & Supply, Inc. (e) |
Capital Goods | L + 675 | 1.00 | % | 4/1/2022 | 5,633 | 5,274 | (359 | ) | |||||||||||||||||
| Lightower Fiber, LLC (e) |
Telecommunication Services | L + 675 | 1.25 | % | 4/12/2021 | 7,331 | 7,261 | (70 | ) | |||||||||||||||||
| Maxim Crane, LP (e) |
Capital Goods | L + 925 | 1.00 | % | 11/26/2018 | 9,021 | 8,688 | (333 | ) | |||||||||||||||||
F-62
Table of Contents
| 4. | Derivative Instruments (continued) |
| Company (a) | Industry | Interest Rate |
LIBOR Floor |
Maturity Date |
Notional Amount |
Fair Value | Unrealized Appreciation (Depreciation) |
|||||||||||||||||||
| Misys, Ltd. (b) (e) |
Software & Services | 12.00% | 6/12/2019 | 2,898 | 3,005 | 107 | ||||||||||||||||||||
| NEP Group, Inc. (e) |
Media | |
L + 875 |
|
1.25 | % | 7/22/2020 | 7,653 | 7,179 | (474 | ) | |||||||||||||||
| Progressive Solutions (e) |
Health Care Equipment & Services | |
L + 850 |
|
1.00 | % | 10/22/2021 | 3,960 | 3,925 | (35 | ) | |||||||||||||||
| RedPrairie Corp. (e) |
Software & Services | |
L + 1000 |
|
1.25 | % | 12/21/2019 | 5,550 | 4,391 | (1,159 | ) | |||||||||||||||
|
|
|
|
|
|
|
|||||||||||||||||||||
| Total Senior Secured Loans - Second Lien |
46,704 | 43,971 | (2,733 | ) | ||||||||||||||||||||||
|
|
|
|
|
|
|
|||||||||||||||||||||
| Senior Secured Bonds |
||||||||||||||||||||||||||
| Artesyn Technologies, Inc. (e) |
Technology Hardware & Equipment | 9.75% | 10/15/2020 | 3,640 | 3,273 | (367 | ) | |||||||||||||||||||
| Hot Topic, Inc. (e) |
Consumer Durables & Apparel | 9.25% | 6/15/2021 | 3,675 | 3,080 | (595 | ) | |||||||||||||||||||
|
|
|
|
|
|
|
|||||||||||||||||||||
| Total Senior Secured Bonds |
7,315 | 6,353 | (962 | ) | ||||||||||||||||||||||
|
|
|
|
|
|
|
|||||||||||||||||||||
| Subordinated Debt |
||||||||||||||||||||||||||
| GCI, Inc. (e) |
Telecommunication Services | 6.75% | 6/1/2021 | 1,002 | 1,019 | 17 | ||||||||||||||||||||
|
|
|
|
|
|
|
|||||||||||||||||||||
| Total Subordinated Debt |
1,002 | 1,019 | 17 | |||||||||||||||||||||||
|
|
|
|
|
|
|
|||||||||||||||||||||
| TOTAL |
$ | 324,966 | $ | 308,213 | $ | (16,753 | ) | |||||||||||||||||||
|
|
|
|
|
|
|
|||||||||||||||||||||
(a) Security may be an obligation of one or more entities affiliated with the named company.
(b) The investment is not a qualifying asset as defined in Section 55(a) under the 1940 Act.
(c) TRS asset position or portion thereof unsettled as of December 31, 2015.
(d) Investment was on non-accrual status as of December 31, 2015.
(e) This investment is held both by the Company and within the TRS as of December 31, 2015.
| 5. | Fair Value of Financial Instruments |
The Company’s investments were categorized in the fair value hierarchy described in Note 2. “Significant Accounting Policies”, as follows as of December 31, 2016 and 2015 (in thousands):
| December 31, 2016 | ||||||||||||||||
| Description |
Level 1 | Level 2 | Level 3 | Total | ||||||||||||
| Senior debt |
$ | - | $ | 589,472 | $ | 2,166,597 | $ | 2,756,069 | ||||||||
| Subordinated debt |
- | 237,224 | 405,203 | 642,427 | ||||||||||||
| Structured products |
- | - | 210,871 | 210,871 | ||||||||||||
| Equity/Other |
- | 9,107 | 406,813 | 415,920 | ||||||||||||
|
|
|
|
|
|
|
|
|
|||||||||
| Subtotal |
- | 835,803 | 3,189,484 | 4,025,287 | ||||||||||||
| Short term investments |
6 | - | - | 6 | ||||||||||||
|
|
|
|
|
|
|
|
|
|||||||||
| Total investments |
$ | 6 | $ | 835,803 | $ | 3,189,484 | $ | 4,025,293 | ||||||||
|
|
|
|
|
|
|
|
|
|||||||||
| Derivative Instruments |
Level 1 | Level 2 | Level 3 | Total | ||||||||||||
| Assets |
||||||||||||||||
| Cross currency swaps |
$ | - | $ | 26,748 | $ | - | $ | 26,748 | ||||||||
| Foreign currency forward contracts |
- | 3,504 | - | 3,504 | ||||||||||||
| Interest rate swaps |
- | 8,862 | - | 8,862 | ||||||||||||
| TRS |
- | - | 3,397 | 3,397 | ||||||||||||
| Liabilities |
||||||||||||||||
| Cross currency swaps |
- | (251 | ) | - | (251 | ) | ||||||||||
| Foreign currency forward contracts |
- | - | - | - | ||||||||||||
| Interest rate swaps |
- | - | - | - | ||||||||||||
| TRS |
- | - | - | - | ||||||||||||
|
|
|
|
|
|
|
|
|
|||||||||
| Total |
$ | - | $ | 38,863 | $ | 3,397 | $ | 42,260 | ||||||||
|
|
|
|
|
|
|
|
|
|||||||||
F-63
Table of Contents
| 5. | Fair Value of Financial Instruments (continued) |
| December 31, 2015 | ||||||||||||||||
| Description |
Level 1 | Level 2 | Level 3 | Total | ||||||||||||
| Senior debt |
$ | - | $ | 1,064,704 | $ | 1,814,254 | $ | 2,878,958 | ||||||||
| Subordinated debt |
- | 228,222 | 229,065 | 457,287 | ||||||||||||
| Structured products |
- | - | 116,208 | 116,208 | ||||||||||||
| Equity/Other |
- | 12,800 | 257,008 | 269,808 | ||||||||||||
|
|
|
|
|
|
|
|
|
|||||||||
| Subtotal |
- | 1,305,726 | 2,416,535 | 3,722,261 | ||||||||||||
| Short term investments |
7,071 | - | - | 7,071 | ||||||||||||
|
|
|
|
|
|
|
|
|
|||||||||
| Total investments |
$ | 7,071 | $ | 1,305,726 | $ | 2,416,535 | $ | 3,729,332 | ||||||||
|
|
|
|
|
|
|
|
|
|||||||||
| Derivative Instruments |
Level 1 | Level 2 | Level 3 | Total | ||||||||||||
| Assets |
||||||||||||||||
| Cross currency swaps |
$ | - | $ | 8,247 | $ | - | $ | 8,247 | ||||||||
| Foreign currency forward contracts |
- | 2,258 | - | 2,258 | ||||||||||||
| Interest rate swaps |
- | 6,021 | - | 6,021 | ||||||||||||
| Liabilities |
||||||||||||||||
| Cross currency swaps |
- | (304) | - | (304) | ||||||||||||
| Foreign currency forward contracts |
- | (541) | - | (541) | ||||||||||||
| TRS |
- | - | (13,562) | (13,562) | ||||||||||||
|
|
|
|
|
|
|
|
|
|||||||||
| Total |
$ | - | $ | 15,681 | $ | (13,562) | $ | 2,119 | ||||||||
|
|
|
|
|
|
|
|
|
|||||||||
There were no transfers between Level 1 and Level 2 during the years ended December 31, 2016 and 2015.
The carrying value of cash and foreign currency is classified as Level 1 with respect to the fair value hierarchy. The carrying values of the Company’s collateral on deposit with custodian, term loan and revolving credit facilities approximate their fair value and are classified as Level 2 with regards to the fair value hierarchy.
F-64
Table of Contents
| 5. | Fair Value of Financial Instruments (continued) |
At December 31, 2016, the Company held 126 distinct investment positions classified as Level 3, representing an aggregate fair value of $3.19 billion and 79.2% of the total investment portfolio. At December 31, 2015, the Company held 93 distinct investment positions classified as Level 3, representing an aggregate fair value of $2.42 billion and 64.8% of the total investment portfolio. The ranges of unobservable inputs used in the fair value measurement of the Company’s Level 3 investments as of December 31, 2016 and 2015 were as follows ($ in thousands):
| As of December 31, 2016 |
||||||||||||||
| Asset Group | Fair Value (1)(2) | Valuation Techniques (3) | Unobservable Inputs | Range (Weighted Average) (4) | Impact to Valuation from an Increase in Input (5) |
|||||||||
| Senior Debt |
$1,945,023 | Discounted Cash Flow | Discount Rate | 4.16% - 20.38% (10.71%) | Decrease | |||||||||
| EBITDA Multiple | 4.22x - 16.24x (9.12x) | Increase | ||||||||||||
| Book Value Multiple | 1.29x - 1.62x (1.45x) | Increase | ||||||||||||
| Interest Rate Volatility | 30.00% (30.00%) | Decrease | ||||||||||||
| 134,483 | Discounted Cash Flow/ Price Given Sale | Discount Rate | 11.47% (11.47%) | Decrease | ||||||||||
| Price Given Sale of Issuer | 101.00% (101.00%) | Increase | ||||||||||||
| 8,733 | Option Pricing Model/ Liquidation Analysis | EBITDA Multiple | 4.22x (4.22x) | Increase | ||||||||||
| Implied Volatility | 30.00% (30.00%) | Increase | ||||||||||||
| Risk Free Rate | 0.54% (0.54%) | Increase | ||||||||||||
| Yield | 0.00% (0.00%) | Decrease | ||||||||||||
| Term | 0.38 years (0.38 years) | Increase | ||||||||||||
| Expected Recovery Given Liquidation | 13.35% (13.35%) | Increase | ||||||||||||
| 8,024 | Option Pricing Model/ Quote/Liquidation Analysis | EBITDA Multiple | 7.25x (7.25x) | Increase | ||||||||||
| Implied Volatility | 26.80% (26.80%) | Increase | ||||||||||||
| Risk Free Rate | 0.97% (0.97%) | Increase | ||||||||||||
| Yield | 0.00% (0.00%) | Decrease | ||||||||||||
| Term | 1.30 years (1.30 years) | Increase | ||||||||||||
| Quote | 5.85% (5.85%) | Increase | ||||||||||||
| Expected Recovery Given Liquidation | 0.00% (0.00%) | Increase | ||||||||||||
| 1,546 | Liquidation Analysis | Expected Recovery Given Liquidation | 7.30% (7.30%) | Increase | ||||||||||
| 21,878 | Waterfall | EBITDA Multiple | 11.13x (11.13x) | Increase | ||||||||||
| 46,910 | Waterfall | Expected Recovery Upon Sale of Issuer | 16.80% - 100.00% (32.85%) | Increase | ||||||||||
| Subordinated Debt |
320,510 | Discounted Cash Flow | Discount Rate | 9.57% - 13.43% (11.85%) | Decrease | |||||||||
| EBITDA Multiple | 4.40x - 12.02x (9.04x) | Increase | ||||||||||||
| Book Value Multiple | 1.10x (1.10x) | Increase | ||||||||||||
| Interest Rate Volatility | 30.00% (30.00%) | Decrease | ||||||||||||
| 77,837 | Waterfall | EBITDA Multiple | 8.48x (8.48x) | Increase | ||||||||||
| 6,856 | Option Pricing Model | EBITDA Multiple | 8.48x (8.48x) | Increase | ||||||||||
| Implied Volatility | 25.00% (25.00%) | Increase | ||||||||||||
| Risk Free Rate | 1.50% (1.50%) | Increase | ||||||||||||
| Yield | 0.00% (0.00%) | Decrease | ||||||||||||
| Term | 3.50 years (3.50 years) | Increase | ||||||||||||
| Structured Products |
201,036 | Discounted Cash Flow | Discounted Rate | 9.39% - 14.51% (11.58%) | Decrease | |||||||||
| 9,835 | Book Value | Book Value Multiple | 0.95x (0.95x) | Increase | ||||||||||
| Equity/Other |
20,502 | Waterfall | Asset Appraisals | N/A | Increase | |||||||||
| 1,249 | Discounted Cash Flow | Discount Rate | 12.30% - 13.00% (13.00%) | Decrease | ||||||||||
| 221,765 | Net Asset Value | Net Asset Value | N/A | Increase | ||||||||||
| 42,886 | Market Comparables | EBITDA Multiple | 6.59x - 12.02x (9.94x) | Increase | ||||||||||
| Revenue Multiple | 0.27x - 2.56x (1.87x) | Increase | ||||||||||||
| Additional Discounts | 0.00% - 15.00% (9.51%) | Decrease | ||||||||||||
| 120,411 | Option Pricing Model | EBITDA Multiple | 4.22x - 8.48x (5.46x) | Increase | ||||||||||
| Implied Volatility | 20.20% - 42.50% (21.17%) | Increase | ||||||||||||
| Risk Free Rate | 0.54% - 1.50% (1.10%) | Increase | ||||||||||||
| Yield | 0.00% - 0.00% (0.00%) | Decrease | ||||||||||||
| Term | 0.38 years - 3.50 years (1.97 years) | Increase | ||||||||||||
| Additional Discounts | 0.00% - 20.00% (10.00%) | Decrease | ||||||||||||
| Total |
$3,189,484 | |||||||||||||
|
|
|
|||||||||||||
F-65
Table of Contents
| 5. | Fair Value of Financial Instruments (continued) |
| As of December 31, 2015 | ||||||||||||
| Asset Group | Fair Value (1)(2) | Valuation Techniques (3) | Unobservable Inputs | Range (Weighted Average) (4) | Impact to Valuation from an Increase in Input (5) | |||||||
| Senior Debt |
$1,795,749 | Discounted Cash Flow | Discount Rate | 8.11% - 21.34% (11.99%) | Decrease | |||||||
| Market Yield | 6.25% - 19.32% (9.56%) | Decrease | ||||||||||
| Yield Premium | 0.00% - 6.50% (2.35%) | Decrease | ||||||||||
| Weighted Average Cost of Capital | 6.40% - 19.70% (10.53%) | Decrease | ||||||||||
| EBITDA Multiple | 3.90x - 11.61x (8.21x) | Increase | ||||||||||
| Tangible Book Value Multiple | 1.30x - 1.40x (1.35x) | Increase | ||||||||||
| Interest Rate Volatility | 25.00% (25.00%) | Decrease | ||||||||||
| 9,353 | Option Pricing Model/ Liquidation Analysis | EBITDA Multiple | 6.26x (6.26x) | Increase | ||||||||
| Implied Volatility | 30.00% (30.00%) | Increase | ||||||||||
| Risk Free Rate | 0.33% (0.33%) | Increase | ||||||||||
| Yield | 0.00% (0.00%) | Decrease | ||||||||||
| Term | 0.38 years (0.38 years) | Increase | ||||||||||
| Illiquidity Discounts | 0.00% - 15.00% (7.50%) | Decrease | ||||||||||
| Expected Recovery Given Liquidation | 18.07% (18.07%) | Increase | ||||||||||
| 6,273 | Discounted Cash Flow/Quote/ Liquidation Analysis | Discount Rate | 146.51% (146.51%) | Increase | ||||||||
| Quote | 14.50% (14.50%) | Increase | ||||||||||
| Expected Recovery Given Liquidation | 0.00% (0.00%) | Increase | ||||||||||
| 2,879 | Liquidation Analysis | Expected Recovery Given Liquidation | 13.80% (13.80%) | Increase | ||||||||
| Subordinated Debt |
227,576 | Discounted Cash Flow | Discount Rate | 11.31% - 21.51% (15.12%) | Decrease | |||||||
| Market Yield | 7.21% - 19.53% (10.11%) | Decrease | ||||||||||
| Yield Premium | 0.00% - 4.25% (4.20%) | Decrease | ||||||||||
| Weighted Average Cost of Capital | 10.15% - 19.50% (14.69%) | Decrease | ||||||||||
| EBITDA Multiple | 6.42x - 22.99x (11.54x) | Increase | ||||||||||
| Interest Rate Volatility | 25.00% (25.00%) | Decrease | ||||||||||
| 1,489 | Option Pricing Model | EBITDA Multiple | 9.27x (9.27x) | Increase | ||||||||
| Implied Volatility | 20.00% (20.00%) | Increase | ||||||||||
| Risk Free Rate | 1.24% (1.24%) | Increase | ||||||||||
| Yield | 0.00% (0.00%) | Decrease | ||||||||||
| Term | 3.00 years (3.00 years) | Increase | ||||||||||
| Structured Products |
109,083 | Discounted Cash Flow | Discounted Rate | 11.22% - 17.38% (15.41%) | Decrease | |||||||
| 7,125 | Book Value | Book Value | 1.00x (1.00x) | Increase | ||||||||
| Equity/Other |
115,060 | Waterfall | Asset Appraisals | N/A | Increase | |||||||
| Change in Market Index | 3.93% (3.93%) | Increase | ||||||||||
| Additional Discounts | 3.00% (3.00%) | Decrease | ||||||||||
| 1,127 | Discounted Cash Flow | Discount Rate | 11.60% - 12.60% (12.60%) | Decrease | ||||||||
| 76,807 | Net Asset Value | Net Asset Value | N/A | Increase | ||||||||
| 52,295 | Market Comparables | EBITDA Multiple | 5.29x - 12.52x (9.37x) | Increase | ||||||||
| Revenue Multiple | 0.24x - 2.24x (1.87x) | Increase | ||||||||||
| Illiquidity Discounts | 0.00% - 15.00% (7.86%) | Decrease | ||||||||||
| 11,719 | Option Pricing Model | EBITDA Multiple | 5.37x - 11.16x (6.53x) | Increase | ||||||||
| Implied Volatility | 20.00% - 37.50% (33.52%) | Increase | ||||||||||
| Risk Free Rate | 0.00% - 1.24% (0.25%) | Increase | ||||||||||
| Yield | 0.00% - 0.00% (0.00%) | Decrease | ||||||||||
| Term | 0.75 years - 3.00 years (2.60 years) | Increase | ||||||||||
| Illiquidity Discounts | 0.00% - 15.00% (10.03%) | Decrease | ||||||||||
| Total |
$2,416,535 | |||||||||||
|
|
|
|||||||||||
| (1) | The TRS was valued in accordance with the TRS agreements as discussed in Note 2 “Significant Accounting Policies.” See Note 4 “Derivative Instruments” for quantitative disclosures of the fair value of the TRS. |
| (2) | Certain investments may be valued at cost for a period of time after an acquisition as the best indicator of fair value. |
| (3) | For the assets and investments that have more than one valuation technique, the Company may rely on the stated techniques individually or in the aggregate based on a weight ascribed to each valuation technique, ranging from 0 – 100%. Indicative broker quotes obtained for valuation purposes are reviewed by the Company relative to other valuation techniques. |
| (4) | Weighted average amounts are based on the estimated fair values. |
| (5) | This column represents the directional change in the fair value of the Level 3 investments that would result from an increase to the corresponding unobservable input. A decrease to the input would have the opposite effect. Significant changes in these inputs in isolation could result in significantly higher or lower fair value measurements. |
F-66
Table of Contents
| 5. | Fair Value of Financial Instruments (continued) |
The above tables represent the significant unobservable inputs as they relate to the Company’s determination of fair values for the majority of its investments categorized within Level 3 as of December 31, 2016 and 2015. In addition to the techniques and inputs noted in the tables above, according to the Company’s valuation policy, it may also use other valuation techniques and methodologies when determining the fair value estimates for the Company’s investments. Any significant increases or decreases in the unobservable inputs would result in significant increases or decreases in the fair value of the Company’s investments.
Investments that do not have a readily available market value are valued utilizing a market approach, an income approach (i.e. discounted cash flow approach), or both approaches, as appropriate. The market comparables approach uses prices, including third-party indicative broker quotes, and other relevant information generated by market transactions involving identical or comparable assets or liabilities (including a business). The income approach uses valuation techniques to convert future amounts (for example, cash flows or earnings) that are discounted based on a required or expected discount rate to derive a single present value amount. The measurement is based on the value indicated by current market expectations about those future amounts. In following these approaches, the types of factors the Company may take into account to determine the fair value of its investments include, as relevant: available current market data, including an assessment of the credit quality of the security’s issuer, relevant and applicable market trading and transaction comparables, applicable market yields and multiples, illiquidity discounts, security covenants, call protection provisions, information rights, the nature and realizable value of any collateral, the portfolio company’s ability to make payments, its earnings and cash flows, the markets in which the portfolio company does business, comparisons of financial ratios of peer companies that are public, data derived from merger and acquisition activities for comparable companies, and enterprise values, among other factors.
The following tables provide reconciliations for the years ended December 31, 2016 and 2015 of investments for which Level 3 inputs were used in determining fair value (in thousands):
| Year Ended December 31, 2016 | ||||||||||||||||||||||||
| Senior | Subordinated | Structured | Equity/ | Total Return | ||||||||||||||||||||
| Debt | Debt | Products | Other | Swaps | Total | |||||||||||||||||||
| Fair value balance as of January 1, 2016 |
$ | 1,814,254 | $ | 229,065 | $ | 116,208 | $ | 257,008 | $ | (13,562 | ) | $ | 2,402,973 | |||||||||||
| Additions (1) |
835,954 | 223,899 | 117,519 | 235,993 | - | 1,413,365 | ||||||||||||||||||
| Net realized gains (losses) (2) |
(15,970 | ) | (8,621 | ) | - | 5,371 | 12,485 | (6,735 | ) | |||||||||||||||
| Net change in unrealized appreciation (depreciation) (3) |
(38,772 | ) | (2,558 | ) | (20,503 | ) | (29,225 | ) | 16,959 | (74,099 | ) | |||||||||||||
| Sales or repayments (4) |
(474,013 | ) | (38,128 | ) | (4,079 | ) | (67,573 | ) | (12,485 | ) | (596,278 | ) | ||||||||||||
| Net discount accretion |
5,526 | 1,546 | 1,726 | - | - | 8,798 | ||||||||||||||||||
| Transfers into Level 3 |
39,618 | - | - | 5,239 | - | 44,857 | ||||||||||||||||||
|
|
|
|
|
|
|
|
|
|
|
|
|
|||||||||||||
| Fair value balance as of December 31, 2016 |
$ | 2,166,597 | $ | 405,203 | $ | 210,871 | $ | 406,813 | $ | 3,397 | $ | 3,192,881 | ||||||||||||
|
|
|
|
|
|
|
|
|
|
|
|
|
|||||||||||||
| Change in net unrealized appreciation (depreciation) in investments still held as of December 31, 2016 (3) |
$ | (71,384 | ) | $ | (10,879 | ) | $ | (19,760 | ) | $ | (16,670 | ) | $ | 16,959 | $ | (101,734 | ) | |||||||
|
|
|
|
|
|
|
|
|
|
|
|
|
|||||||||||||
| (1) | Includes increases in the cost basis of investments resulting from new and add-on portfolio investments, the capitalization of PIK interest or the exchange of one or more existing securities for one or more new securities. |
| (2) | Included in net realized gain (loss) in the consolidated statements of operations. |
| (3) | Included in net change in unrealized appreciation/depreciation in the consolidated statements of operations. |
| (4) | Includes principal payments/paydowns on debt investments, collection of PIK interest, TRS settlement payments, proceeds from sales of investments, distributions received on equity investments classified as return of capital or the exchange of one or more existing securities for one or more new securities. |
F-67
Table of Contents
| 5. | Fair Value of Financial Instruments (continued) |
| Year Ended December 31, 2015 | ||||||||||||||||||||||||
| Senior | Subordinated | Structured | Equity/ | Total Return | ||||||||||||||||||||
| Debt | Debt | Products | Other | Swaps | Total | |||||||||||||||||||
| Fair value balance as of January 1, 2015 |
$ | 1,143,744 | $ | 196,859 | $ | 36,421 | $ | 125,308 | $ | (3,445 | ) | $ | 1,498,887 | |||||||||||
| Additions (1) |
921,963 | 131,879 | 141,892 | 163,608 | - | 1,359,342 | ||||||||||||||||||
| Net realized gains (losses) (2) |
(5,189 | ) | 1,069 | 5,361 | 6,282 | 12,913 | 20,436 | |||||||||||||||||
| Net change in unrealized depreciation (3) |
(112,169 | ) | (37,597 | ) | 1,868 | (22,943 | ) | (10,117 | ) | (180,958 | ) | |||||||||||||
| Sales or repayments (4) |
(138,147 | ) | (64,314 | ) | (69,334 | ) | (15,247 | ) | (12,913 | ) | (299,955 | ) | ||||||||||||
| Net discount accretion |
4,052 | 1,169 | - | - | - | 5,221 | ||||||||||||||||||
|
|
|
|
|
|
|
|
|
|
|
|
|
|||||||||||||
| Fair value balance as of December 31, 2015 |
$ | 1,814,254 | $ | 229,065 | $ | 116,208 | $ | 257,008 | $ | (13,562 | ) | $ | 2,402,973 | |||||||||||
|
|
|
|
|
|
|
|
|
|
|
|
|
|||||||||||||
| Change in net unrealized appreciation (depreciation) in investments still held as of December 31, 2015 (3) |
$ | (114,379 | ) | $ | (37,501 | ) | $ | 4,465 | $ | (23,068 | ) | $ | (10,117 | ) | $ | (180,600 | ) | |||||||
|
|
|
|
|
|
|
|
|
|
|
|
|
|||||||||||||
| (1) | Includes increases in the cost basis of investments resulting from new and add-on portfolio investments, the capitalization of PIK interest or the exchange of one or more existing securities for one or more new securities. |
| (2) | Included in net realized gains (losses) in the consolidated statements of operations. |
| (3) | Included in net change in unrealized appreciation (depreciation) in the consolidated statements of operations. |
| (4) | Includes principal payments/paydowns on debt investments, collection of PIK interest, TRS settlement payments, proceeds from sales of investments, distributions received on equity investments classified as return of capital or the exchange of one or more existing securities for one or more new securities. |
Two securities were transferred into the Level 3 hierarchy and no securities were transferred out of the Level 3 hierarchy during the year ended December 31, 2016. No securities were transferred into or out of the Level 3 hierarchy during the year ended December 31, 2015. These investments were transferred at fair value as of the beginning of the quarter in which they were transferred. The classification transfers between Level 3 and Level 2 were based on the observed changes in liquidity based on information supplied by a third party pricing source, whereby such liquidity information is routinely reviewed no less frequently than monthly. All realized and unrealized gains and losses are included in earnings and are reported as separate line items within the Company’s consolidated statements of operations.
| 6. | Related Party Transactions |
CNL, certain CNL affiliates, and KKR receive compensation or reimbursement for advisory services and other services in connection with (i) the performance and supervision of administrative services (ii) investment advisory activities and (iii) prior to the conclusion of the Follow-On Offering, the Company’s Offerings.
The Company is a party to an investment advisory agreement with CNL, as amended (the “Investment Advisory Agreement”) for the overall management of the Company’s investment activities. The Company and CNL have entered into a sub-advisory agreement with KKR (the “Sub-Advisory Agreement”), under which KKR is responsible for the day-to-day management of the Company’s investment portfolio. CNL compensates KKR for advisory services that it provides to the Company with 50% of the base management fees and performance-based incentive fees that CNL receives under the Investment Advisory Agreement. CNL earns a base management fee (referred to as an investment advisory fee) equal to an annual rate of 2% of the Company’s average gross assets as of the end of the two most recently completed months, computed and paid monthly. The computation of gross assets includes unrealized depreciation, appreciation and collateral posted with the custodian in connection with the TRS, and excludes deferred offering expenses. From and after April 1, 2016, the computation of gross assets also excludes cash and short-term investments.
CNL also earns performance-based incentive fees comprised of a subordinated incentive fee on income and an incentive fee on capital gains. The subordinated incentive fee on pre-incentive fee net investment income (as defined in the Investment Advisory Agreement) is paid quarterly if earned, and is computed as the sum of (A) 100% of quarterly pre-incentive fee net investment income in excess of 1.75% of average adjusted capital up to a limit of 0.4375% of average adjusted capital, and (B) 20% of pre-incentive fee net investment income in excess of 2.1875% of average adjusted capital.
The incentive fee on capital gains is paid annually if earned, and is equal to (A) 20% of all realized gains on a cumulative basis from inception, net of (1) all realized losses on a cumulative basis, (2) unrealized depreciation at year end and (3) disregarding any net realized gains associated with the TRS interest spread (which represents the difference between (a) the interest and fees received on the TRS, and (b) the financing fees paid to the TRS Counterparty), less (B) the aggregate amount of any previously paid incentive fee on capital gains.
F-68
Table of Contents
| 6. | Related Party Transactions (continued) |
The terms of the Investment Advisory Agreement entitle CNL (and indirectly KKR) to receive up to 5% of gross proceeds in connection with the Offerings as reimbursement for organization and offering expenses incurred by the Advisors on behalf of the Company. During the year ended December 31, 2016, the Company recorded $1.08 million in deferred offering expenses related to the Follow-On Offering, or 0.8% of gross offering proceeds of the Follow-On Offering for the same period.
In addition, under the terms of the Investment Advisory Agreement, the Advisors are entitled to reimbursement of certain expenses incurred on behalf of the Company including expenses incurred in connection with its investment operations and investment transactions.
The Company is a party to an administrative services agreement with CNL (the “Administrative Services Agreement”) whereby CNL performs, and oversees the performance of, various administrative services on behalf of the Company. Administrative services may include transfer agency oversight and supervisory services, shareholder communication services, general ledger accounting services, calculating the Company’s net asset value, maintaining required corporate and financial records, financial reporting for the Company and its subsidiaries, internal audit services, reporting to the Company’s board of directors and lenders, preparing and filing income tax returns, preparing and filing SEC reports, preparing, printing and disseminating shareholder reports, overseeing the payment of the Company’s expenses and shareholder distributions, administering the Company’s share repurchase program, and management and oversight of service providers in their performance of administrative and professional services rendered for the Company. CNL may also enter into agreements with its affiliates for the performance of select administrative services. The Company reimburses CNL for the professional services and expenses it incurs in performing its administrative obligations on behalf of the Company.
CNL Securities Corp., an affiliate of CNL, served as the managing dealer of the Company’s Offerings and in connection therewith received selling commissions and marketing support fees. Prior to the closing of the Company’s Follow-On Offering to investors investing through the independent broker-dealer channel, sales of shares were subject to a sales load of up to 10% of the offering price, which included up to 7% of the offering price for sales commissions, and up to 3% of the offering price for marketing support fees. After the closing of the Company’s Follow-On Offering to investors investing through the independent broker-dealer channel, no sales commissions or marketing support fees were charged on purchases of shares of its common stock.
Related party fees, expenses and expenses incurred on behalf of the Company during the years ended December 31, 2016, 2015 and 2014 are summarized below (in thousands):
| Year Ended December 31, | ||||||||||||||
| Related Party |
Source Agreement & Description |
2016 | 2015 | 2014 | ||||||||||
| CNL Securities Corp. |
Managing Dealer Agreement: Selling commissions and marketing support fees |
$ | 9,649 | $ | 61,357 | $ | 72,099 | |||||||
| CNL and KKR |
Investment Advisory Agreement: Base management fees (investment advisory fees) |
82,736 | 70,298 | 48,903 | ||||||||||
| CNL and KKR |
Investment Advisory Agreement: Subordinated incentive fee on income(1) |
24,123 | 8,733 | 17,034 | ||||||||||
| CNL and KKR |
Investment Advisory Agreement: Incentive fee on capital gains(2) |
- | - | - | ||||||||||
| CNL and KKR |
Investment Advisory Agreement: Offering expenses reimbursement(3) |
1,079 | 3,477 | 6,051 | ||||||||||
| KKR |
Investment Sub-Advisory Agreement: Investment expenses reimbursement |
1,316 | 1,518 | 910 | ||||||||||
| CNL |
Administrative Services Agreement: Administrative and compliance services(4) |
2,085 | 1,536 | 2,125 | ||||||||||
| (1) | Subordinated incentive fees on income are included in performance-based incentive fees in the consolidated statements of operations. During the years ended December 31, 2016, 2015 and 2014, $19.97 million, $13.09 million and $17.21 million, respectively, of subordinated incentive fees on income were paid to the Advisors. As of December 31, 2016 and 2015, a subordinated incentive fee on income of $4.91 million and $0.75 million, respectively, was payable to the Advisors. |
F-69
Table of Contents
| 6. | Related Party Transactions (continued) |
| (2) | Incentive fees on capital gains are included in performance-based incentive fees in the consolidated statements of operations. The following table provides additional details for the incentive fee on capital gains for the years ended December 31, 2016, 2015 and 2014 (in thousands): |
| Incentive Fee on Capital Gains for the Year Ended December 31, |
2016 | 2015 | 2014 | |||||||||
| Accrued incentive fee on capital gains as of January 1, |
$ | - | $ | - | $ | 11,128 | ||||||
| Incentive fee on capital gains expense during the year ended December 31, |
- | - | (8,805 | ) | ||||||||
| Less: Incentive fee on capital gains paid to the Advisors during the year ended December 31, |
- | - | (2,323 | ) | ||||||||
|
|
|
|
|
|
|
|||||||
| Accrued incentive fee on gains as of December 31, |
- | - | - | |||||||||
| Less: Accrued incentive fee on capital gains attributable to unrealized gains as of December 31, |
- | - | - | |||||||||
|
|
|
|
|
|
|
|||||||
| Incentive fee on capital gains earned by and payable to the Advisors as of December 31, |
$ | - | $ | - | $ | - | ||||||
|
|
|
|
|
|
|
|||||||
| (3) | The following table provides additional details for the organization and offering expenses reimbursement (in thousands): |
| Offering Expenses Reimbursement for the Year Ended December 31, |
2016 | 2015 | 2014 | |||||||||
| Offering expenses reimbursement payable as of January 1, |
$ | 210 | $ | 272 | $ | 240 | ||||||
| Additional offering expenses deferred during the year ended December 31, |
1,079 | 3,477 | 6,051 | |||||||||
| Offering expenses reimbursement payable as of December 31, |
(39 | ) | (210 | ) | (272 | ) | ||||||
|
|
|
|
|
|
|
|||||||
| Offering expenses reimbursement paid to the Advisors during the year ended December 31, |
$ | 1,250 | $ | 3,539 | $ | 6,019 | ||||||
|
|
|
|
|
|
|
|||||||
| Outstanding unreimbursed offering expenses (net of amounts payable) as of December 31, |
$ | - | $ | - | $ | - | ||||||
|
|
|
|
|
|
|
|||||||
| (4) | Includes $0.66 million for reimbursement payments to CNL for services provided to the Company for its Chief Compliance Officer and Chief Financial Officer for the year ended December 31, 2014. Effective January 1, 2015, these services were no longer reimbursable Advisor expenses. |
KKR is obligated to remit to the Company any earned capital structuring fees based on the Company’s pro-rata portion of the co-investment transactions or originated investments in which the Company participates. As a result, the Company earned capital structuring fees of $10.35 million, $7.61 million and $5.71 million during the years ended December 31, 2016, 2015 and 2014, respectively. As of December 31, 2016 and 2015, $2.04 million and $0.18 million, respectively, of capital structuring fees were receivable from the Advisors.
Indemnification - The Investment Advisory Agreement and the Sub-Advisory Agreement provide certain indemnification in favor of the Advisors, their directors, officers, persons associated with the Advisors, and their affiliates. The managing dealer agreement contains certain indemnification provisions in favor of the managing dealer and each participating broker and their respective officers, directors, partners, employees, associated persons, agents and control persons. In addition, the Company’s articles of incorporation contains certain indemnification in favor of the Company’s officers, directors, agents, and certain other persons. As of December 31, 2016, management believed that the risk of incurring any losses for such indemnification was remote.
| 7. | Fee Income |
Fee income, which is nonrecurring, consisted of the following (in thousands):
| Year Ended December 31, | ||||||||||||||
| Fee Income |
2016 | 2015 | 2014 | |||||||||||
| Capital structuring fees |
$ | 10,352 | $ | 7,610 | $ | 5,706 | ||||||||
| Amendment fees |
1,827 | 9,689 | 219 | |||||||||||
| Commitment fees |
1,223 | 477 | 498 | |||||||||||
| Consent fees |
— | — | 455 | |||||||||||
| Other |
180 | 529 | 152 | |||||||||||
|
|
|
|
|
|
|
|||||||||
| Total |
$ | 13,582 | $ | 18,305 | $ | 7,030 | ||||||||
|
|
|
|
|
|
|
|||||||||
F-70
Table of Contents
| 8. | Distributions |
The Company’s board of directors declared distributions for 52 record dates in each of the years ended December 31, 2016, 2015 and 2014, respectively. Declared distributions are paid monthly. The total and the sources of declared distributions on a GAAP basis for the years ended December 31, 2016, 2015 and 2014 are presented in the tables below (in thousands, except per share amounts).
| Year Ended December 31, | ||||||||||||||||||||||||||||||||||||
| 2016 | 2015 | 2014 | ||||||||||||||||||||||||||||||||||
| Per Share | Amount | Allocation | Per Share | Amount | Allocation | Per Share | Amount | Allocation | ||||||||||||||||||||||||||||
| Total Declared Distributions |
$ | 0.80 | $ | 244,950 | 100.0 | % | $ | 0.80 | $ | 205,044 | 100.0 | % | $ | 0.80 | $ | 142,018 | 100.0 | % | ||||||||||||||||||
| From net investment income |
0.69 | 210,096 | 85.8 | 0.69 | 176,688 | 86.2 | 0.73 | 130,126 | 91.6 | |||||||||||||||||||||||||||
| From net realized gains |
— | — | — | 0.11 | 28,356 | 13.8 | 0.07 | 11,892 | 8.4 | |||||||||||||||||||||||||||
| Distributions in excess of net investment income |
0.11 | 34,854 | 14.2 | — | — | — | — | — | — | |||||||||||||||||||||||||||
Sources of distributions, other than net investment income and realized gains on a GAAP basis, include (i) the ordinary income component of prior year tax basis undistributed earnings and (ii) required adjustments to GAAP net investment income and realized gains in the current period to determine taxable income available for distributions. The following table summarizes the primary sources of differences between (i) GAAP net investment income and realized gains and (ii) taxable income available for distributions that contribute to tax-related distributions in excess of net investment income for the years ended December 31, 2016, 2015 and 2014 (in thousands).
| Year Ended December 31, |
2016 | 2015 | 2014 | |||||||||
| Ordinary income component of tax basis undistributed earnings |
$ | 67,198 | $ | 56,222 | $ | 3,531 | ||||||
| Net change in unrealized (appreciation) depreciation on foreign currency forward contracts |
1,787 | (38,728) | 43,626 | |||||||||
| Net change in unrealized (appreciation) depreciation on total return swaps |
16,959 | (10,117) | (5,306) | |||||||||
| Realized losses not currently deductible |
1,779 | 21,802 | — | |||||||||
| Net investment loss from Taxable Subsidiaries |
424 | 2,604 | 1,002 | |||||||||
| Unearned performance-based incentive fees on unrealized gains |
— | — | (8,805) | |||||||||
| Offering expenses |
2,285 | 4,481 | 6,833 | |||||||||
| Taxable income from investments on non-accrual status |
37,845 | 8,455 | 2,615 | |||||||||
| Income from partnerships |
4,340 | — | — | |||||||||
| Non-deductible tax expense |
5,377 | 2,890 | 1,392 | |||||||||
| Other book-tax differences |
44 | (455) | (184) | |||||||||
|
|
|
|
|
|
|
|||||||
| Total (1) |
$ | 138,038 | $ | 47,154 | $ | 44,704 | ||||||
|
|
|
|
|
|
|
|||||||
| (1) | See Note 12 for a reconciliation of net increase in net assets resulting from operations to taxable income available for distributions. |
For the year ended December 31, 2016, the tax-related sources of distributions of $138.04 million was greater than the distributions in excess of net investment income of $34.85 million. For the years ended December 31, 2015 and 2014, there were no distributions in excess of net investment income. None of the distributions declared during the years ended December 31, 2016, 2015 and 2014 were classified as a tax basis return of capital.
On December 14, 2016, the Company’s board of directors declared distributions of $0.015483 per share for five record dates beginning on January 3, 2017 through and including January 31, 2017.
F-71
Table of Contents
| 9. | Share Transactions |
The following table summarizes the total shares issued and proceeds received in connection with the Company’s Offerings for the years ended December 31, 2016, 2015 and 2014 ($ in thousands except share and per share amounts).
| Year Ended December 31, | ||||||||||||||||||||||||
| 2016 | 2015 | 2014 | ||||||||||||||||||||||
| Shares | Amount | Shares | Amount | Shares | Amount | |||||||||||||||||||
| Gross proceeds from offering |
14,323,113 | $ | 137,245 | 63,742,355 | $ | 679,862 | 69,802,396 | $ | 781,169 | |||||||||||||||
| Commissions and marketing support fees |
— | (9,649 | ) | — | (61,357 | ) | — | (72,099 | ) | |||||||||||||||
|
|
|
|
|
|
|
|
|
|
|
|
|
|||||||||||||
| Net proceeds to company |
14,323,113 | 127,596 | 63,742,355 | 618,505 | 69,802,396 | 709,070 | ||||||||||||||||||
| Reinvestment of distributions |
13,858,168 | 124,139 | 10,950,275 | 105,363 | 7,952,695 | 80,646 | ||||||||||||||||||
|
|
|
|
|
|
|
|
|
|
|
|
|
|||||||||||||
| Net proceeds from offering |
28,181,281 | $ | 251,735 | 74,692,630 | $ | 723,868 | 77,755,091 | $ | 789,716 | |||||||||||||||
|
|
|
|
|
|
|
|
|
|
|
|
|
|||||||||||||
| Average net proceeds per share |
$8.93 | $9.69 | $10.16 | |||||||||||||||||||||
As of December 31, 2016, the Company has sold or issued 324.33 million shares of common stock through the Offerings, including reinvestment of distributions, for total gross proceeds of $3.47 billion.
The Company conducts quarterly tender offers pursuant to its share repurchase program. The Company currently limits the number of shares to be repurchased during any calendar year to the number of shares it can repurchase with the proceeds it receives from the issuance of shares of its common stock under its distribution reinvestment plan. At the discretion of the Company’s board of directors, the Company may also use cash on hand, cash available from borrowings and cash from the sale of investments as of the end of the applicable period to repurchase shares. The Company limits repurchases in each quarter to 2.5% of the weighted average number of shares of common stock outstanding in the prior four calendar quarters. The Company’s board of directors may amend, suspend or terminate the share repurchase program upon 30 days’ notice.
The following table is a summary of the share repurchases completed during the years ended December 31, 2016, 2015 and 2014 ($ in thousands, except share and per share amounts):
| Repurchase Date |
Total Number of Shares Offered to Repurchase |
Total Number of Shares Repurchased |
Total Consideration |
No. of Shares Repurchased/Total Offer |
Price Paid Per Share |
|||||||||||||||
| 2016: |
||||||||||||||||||||
| January 13, 2016 |
6,371,100 | 1,827,053 | $ | 16,297 | 29 | % | $ | 8.92 | ||||||||||||
| May 31, 2016 |
6,807,080 | 1,682,526 | 14,486 | 25 | % | 8.61 | ||||||||||||||
| August 29, 2016 |
7,166,150 | 3,475,590 | 30,620 | 49 | % | 8.81 | ||||||||||||||
| November 22, 2016 |
7,435,796 | 2,584,903 | 23,187 | 35 | % | 8.97 | ||||||||||||||
|
|
|
|
|
|
|
|||||||||||||||
| Total |
27,780,126 | 9,570,072 | $ | 84,590 | 34 | % | ||||||||||||||
|
|
|
|
|
|
|
|||||||||||||||
| Repurchase Date |
Total Number of Shares Offered to Repurchase |
Total Number of Shares Repurchased |
Total Consideration |
No. of Shares Repurchased/Total Offer |
Price Paid Per Share |
|||||||||||||||
| 2015: |
||||||||||||||||||||
| March 2, 2015 |
4,435,072 | 555,174 | $ | 5,452 | 13 | % | $ | 9.82 | ||||||||||||
| May 29, 2015 |
4,919,566 | 501,943 | 4,889 | 10 | % | 9.74 | ||||||||||||||
| August 28, 2015 |
5,424,683 | 1,093,421 | 10,573 | 20 | % | 9.67 | ||||||||||||||
| December 1, 2015 |
5,911,358 | 1,243,483 | 11,502 | 21 | % | 9.25 | ||||||||||||||
|
|
|
|
|
|
|
|||||||||||||||
| Total |
20,690,679 | 3,394,021 | $ | 32,416 | 16 | % | ||||||||||||||
|
|
|
|
|
|
|
|||||||||||||||
| Repurchase Date |
Total Number of Shares Offered to Repurchase |
Total Number of Shares Repurchased |
Total Consideration |
No. of Shares Repurchased/Total Offer |
Price Paid per Share |
|||||||||||||||
| 2014: |
||||||||||||||||||||
| March 3, 2014 |
2,612,555 | 323,324 | $ | 3,233 | 12 | % | $ | 10.00 | ||||||||||||
| June 2, 2014 |
3,091,175 | 307,909 | 3,116 | 10 | % | 10.12 | ||||||||||||||
| August 29, 2014 |
3,550,268 | 615,007 | 6,242 | 17 | % | 10.15 | ||||||||||||||
| December 1, 2014 |
4,000,694 | 401,224 | 4,037 | 10 | % | 10.06 | ||||||||||||||
|
|
|
|
|
|
|
|||||||||||||||
| Total |
13,254,692 | 1,647,464 | $ | 16,628 | 12 | % | ||||||||||||||
|
|
|
|
|
|
|
|||||||||||||||
F-72
Table of Contents
| 10. | Borrowings |
The Company’s outstanding borrowings as of December 31, 2016 and 2015 were as follows (in thousands):
| As of December 31, 2016 | As of December 31, 2015 | |||||||||||||||||||||||
| Total Aggregate Principal Amount Committed |
Principal Amount Outstanding |
Carrying Value |
Total Aggregate Principal Amount Committed |
Principal Amount Outstanding |
Carrying Value |
|||||||||||||||||||
| Senior Secured Revolving Credit Facility(1) |
$ | 928,000 | (2) | $ | 799,000 | $ | 799,000 | $ | 700,000 | (2) | $ | 632,980 | (3) | $ | 632,980 | |||||||||
| Deutsche Bank Credit Facility(1) |
— | — | — | 250,000 | 210,000 | 210,000 | ||||||||||||||||||
| BNP Credit Facility(1) |
200,000 | 183,000 | 183,000 | 200,000 | 188,000 | 188,000 | ||||||||||||||||||
| SMBC Credit Facility(1) |
200,000 | 102,000 | 102,000 | 200,000 | — | — | ||||||||||||||||||
| JPM Credit Facility(1) |
300,000 | 135,000 | 135,000 | — | — | — | ||||||||||||||||||
|
|
|
|
|
|
|
|
|
|
|
|
|
|||||||||||||
| Total credit facilities |
1,628,000 | 1,219,000 | 1,219,000 | 1,350,000 | 1,030,980 | 1,030,980 | ||||||||||||||||||
| 2014 Senior Secured Term Loan |
389,000 | 389,000 | 385,203 | (4) | 393,000 | 393,000 | 387,677 | (4) | ||||||||||||||||
| CS Facility(5) |
23,454 | 23,454 | 23,454 | — | — | — | ||||||||||||||||||
|
|
|
|
|
|
|
|
|
|
|
|
|
|||||||||||||
| Total borrowings |
$ | 2,040,454 | $ | 1,631,454 | $ | 1,627,657 | $ | 1,743,000 | $ | 1,423,980 | $ | 1,418,657 | ||||||||||||
|
|
|
|
|
|
|
|
|
|
|
|
|
|||||||||||||
| (1) | Subject to borrowing base and leverage restrictions. |
| (2) | Provides a feature that allows the Company, under certain circumstances, to increase the size of the Senior Secured Revolving Credit Facility to a maximum of $1.34 billion. |
| (3) | Includes $49.70 million denominated in Euros and $58.28 million denominated in British Pound Sterling as of December 31, 2015. |
| (4) | Comprised of outstanding principal less the unaccreted original issue discount of $0.99 million and $1.39 million and deferring financing costs of $2.81 million and $3.93 million as of December 31, 2016 and December 31, 2015, respectively. |
| (5) | Borrowings denominated in Euros. |
The weighted average stated interest rate and weighted average remaining years to maturity of the Company’s outstanding borrowings as of December 31, 2016 were 3.22% and 3.4 years, respectively, and as of December 31, 2015 were 2.94% and 2.0 years, respectively.
Senior Secured Revolving Credit Facility
In September 2013, the Company entered into a revolving credit facility (the “Senior Secured Revolving Credit Facility”) with certain lenders and JPMorgan Chase Bank, N.A., acting as administrative agent. On April 15, 2016, the Company amended and restated its Senior Secured Revolving Credit Facility (the “Amendment”) increasing loans to be made in U.S. dollars and other foreign currencies to an aggregate amount of $893 million, with an “accordion” feature that allows the Company, under circumstances, to increase the size of the facility to a maximum of $1.34 billion. On April 28, 2016, the aggregate loan commitment under the Senior Secured Revolving Credit Facility was increased to $928 million. Availability under the Senior Secured Revolving Credit Facility, as amended, will terminate on April 15, 2020 (the “Termination Date”) and the outstanding loans will mature on April 15, 2021. In addition, the Senior Secured Revolving Credit Facility, as amended, requires mandatory prepayment of interest and principal upon certain events during the term-out period commencing on the Termination Date. The Senior Secured Revolving Credit Facility is secured by substantially all of the Company’s portfolio investments and its cash and securities accounts, excluding those held by CCT Funding, Paris Funding, Halifax Funding, CCT Tokyo Funding and CCT SE, and provides for a guaranty by certain other subsidiaries of the Company
The stated borrowing rate under the Amendment is generally based on LIBOR plus an applicable spread of 2.00% or 2.25%, depending on collateral levels, or with respect to borrowings in foreign currencies, on a base rate applicable to such currency borrowing plus an applicable spread of 2.00% to 2.25%, depending on collateral levels. The Company also pays an annual commitment fee on any unused commitment amounts between 0.375% and 1.50%, depending on utilization levels.
F-73
Table of Contents
| 10. | Borrowings (continued) |
The components of interest expense, average interest rates (i.e., base interest rate in effect plus the spread) and average outstanding balances for the Senior Secured Revolving Credit Facility for the years ended December 31, 2016, 2015 and 2014 were as follows (in thousands):
| Year Ended December 31, | ||||||||||||
| 2016 | 2015 | 2014 | ||||||||||
| Stated interest expense |
$ | 18,724 | $ | 9,626 | $ | 3,344 | ||||||
| Unused commitment fees |
869 | 1,413 | 3,093 | |||||||||
| Amortization of deferred financing costs |
1,915 | 1,763 | 1,263 | |||||||||
|
|
|
|
|
|
|
|||||||
| Total interest expense |
$ | 21,508 | $ | 12,802 | $ | 7,700 | ||||||
|
|
|
|
|
|
|
|||||||
| Weighted average interest rate |
2.9% | 2.8% | 3.1% | |||||||||
| Average borrowings |
$ | 655,365 | $ | 347,175 | $ | 108,193 | ||||||
Deutsche Bank Credit Facility
CCT Funding was party to a revolving credit facility (as amended, the “Deutsche Bank Credit Facility”) with Deutsche Bank AG, New York Branch (“Deutsche Bank”), as the administrative agent and lender, which allowed CCT Funding to borrow up to $250 million. The Deutsche Bank Credit Facility was secured by the portfolio investments held in CCT Funding. The Deutsche Bank Credit Facility consisted of a Tranche E loan commitment (the “Tranche E Loans”) of $75 million and a Tranche F loan commitment (the “Tranche F Loans”) of $100 million. On September 8, 2016, the Tranche E loan commitment was reduced from $150 million to $75 million. The Company paid a make-whole fee of $0.24 million in connection with the commitment reduction. On December 28, 2016, the company terminated the Deutsche Bank Credit Facility with Deutsche Bank and paid a make-whole fee of $0.61 million.
Interest on the Tranche E Loans was charged at the rate of three-month LIBOR plus 1.85%. Interest on the Tranche F Loans was charged at the rate of three-month LIBOR plus 1.95%. CCT Funding also paid an annual commitment fee on any unused commitment amounts of 0.50%, plus an additional annual commitment fee of 1.95% on the excess, if any, of (i) 80% of the total commitment less (ii) the aggregate principal amount outstanding. The components of interest expense, average interest rates (i.e., base interest rate in effect plus the spread) and average outstanding balances for the Deutsche Bank Credit Facility for the years ended December 31, 2016, 2015 and 2014 were as follows (in thousands):
| Year Ended December 31, | ||||||||||||
| 2016 | 2015 | 2014 | ||||||||||
| Stated interest expense |
$ | 5,855(1) | $ | 3,241 | $ | 2,557 | ||||||
| Unused commitment fees |
514 | 404 | 1,310 | |||||||||
| Amortization of deferred financing costs |
498 | 309 | 788 | |||||||||
|
|
|
|
|
|
|
|||||||
| Total interest expense |
$ | 6,867 | $ | 3,954 | $ | 4,655 | ||||||
|
|
|
|
|
|
|
|||||||
| Weighted average interest rate |
3.1% | 2.2% | 2.3% | |||||||||
| Average borrowings (2) |
$ | 191,791 | $ | 147,148 | $ | 111,976 | ||||||
| (1) | Stated interest expense for the year ended December 31, 2016 includes make-whole fees of $0.24 million incurred on the September 2016 Tranche E Loans commitment reduction and $0.61 million incurred on the December 2016 facility termination. |
| (2) | Average borrowings for the Deutsche Bank Credit Facility for the year ended December 31, 2016 are calculated through the termination date of the facility, or December 28, 2016. |
BNP Credit Facility
Paris Funding is party to a revolving credit facility with BNP Paribas Prime Brokerage, Inc. (“BNP”) under which it may borrow up to $200 million (as amended, the “BNP Credit Facility”). Paris Funding has the right to prepay loans under the BNP Credit Facility in whole or in part at any time. Paris Funding may terminate the BNP Credit Facility with 180 days’ notice. If certain margin and collateral requirements, minimum net assets or other covenants are not met, the BNP Credit Facility could be deemed in default and result in termination. BNP has the option to terminate the BNP Credit Facility with 29 days’ notice if BNP’s long-term credit rating has declined to a level three or more notches below its highest rating by S&P, Moody’s or Fitch (a “Funding Event”). Absent a default, facility termination event or Funding Event, BNP is required to provide Paris Funding with 364 days’ notice prior to terminating the BNP Credit Facility.
F-74
Table of Contents
| 10. | Borrowings (continued) |
Interest on the BNP Credit Facility is charged at the rate of one month LIBOR plus 1.10% and is payable monthly. Paris Funding also pays an annual commitment fee on any unused commitment amounts of 0.40% or 0.50%, depending on utilization levels. The components of interest expense, average interest rates (i.e., base interest rate in effect plus the spread) and average outstanding balances for the BNP Credit Facility for the years ended December 31, 2016, 2015 and 2014 were as follows (in thousands):
| Year Ended December 31, | ||||||||||||
| 2016 | 2015 | 2014 | ||||||||||
| Stated interest expense |
$ | 2,739 | $ | 1,616 | $ | 1,356 | ||||||
| Unused commitment fees |
126 | 355 | 683 | |||||||||
| Amortization of deferred financing costs |
— | — | 208 | |||||||||
|
|
|
|
|
|
|
|||||||
| Total interest expense |
$ | 2,865 | $ | 1,971 | $ | 2,247 | ||||||
|
|
|
|
|
|
|
|||||||
| Weighted average interest rate |
1.6% | 1.3% | 1.3% | |||||||||
| Average borrowings |
$ | 168,929 | $ | 121,375 | $ | 106,577 | ||||||
Paris Funding pledges certain of its assets as collateral to secure borrowings under the BNP Credit Facility. As of December 31, 2016 and December 31, 2015, Paris Funding had investments with a fair value of $294.70 million and $315.88 million, respectively, pledged as collateral under the BNP Credit Facility. Under the terms of the BNP Credit Facility, BNP has the ability to borrow a portion of the pledged collateral (“Rehypothecated Securities”), provided that, among other things, the fair value of the borrowed collateral does not exceed the value of the loan against which the collateral was pledged and any single borrowed security does not represent the entire position of such security held by Paris Funding. Paris Funding may designate any security within the pledged collateral as ineligible to be a Rehypothecated Security, provided there are eligible securities within the segregated custody account in an amount equal to the outstanding borrowings owed by Paris Funding to BNP. Paris Funding may recall any Rehypothecated Security at any time and BNP must, to the extent commercially reasonable, return such security or equivalent security within a commercially reasonable period. In the event BNP does not return the security, Paris Funding will have the right to, among other things, apply and set off an amount equal to 100% of the then-current fair market value of such Rehypothecated Securities against any outstanding borrowings owed to BNP under the BNP Credit Facility. Rehypothecated Securities are marked-to-market daily and if the value of all Rehypothecated Securities exceeds 100% of the outstanding borrowings owed by Paris Funding under the BNP Credit Facility, BNP may either reduce the amount of Rehypothecated Securities to eliminate such excess or deposit into the segregated custody account an amount of cash equal to such excess. Paris Funding will continue to receive interest and the scheduled repayment of principal balances on Rehypothecated Securities. Paris Funding may receive a fee from BNP in connection with Rehypothecated Securities meeting certain criteria. Paris Funding did not recognize any fees on Rehypothecated Securities during the years ended December 31, 2016 and 2015. As of December 31, 2016, there were no securities rehypothecated by BNP. Paris Funding recognized fees on Rehypothecated Securities of $0.03 million during the year ended December 31, 2014.
SMBC Credit Facility
CCT Tokyo Funding is party to a revolving credit facility (the “SMBC Credit Facility”) with Sumitomo Mitsui Banking Corporation (“SMBC”), as the administrative agent, collateral agent, and lender, which allows CCT Tokyo Funding to borrow up to $200 million. The SMBC Credit Facility is secured by all of the assets held by CCT Tokyo Funding, including its portfolio of assets. Such pledged assets are held in a segregated custody account with Wells Fargo Bank, National Association (“Wells Fargo”). The end of the reinvestment period and the stated maturity date for the SMBC Credit Facility are December 2, 2017 and December 2, 2020, respectively. The reinvestment period and the stated maturity date are both subject to two one-year extensions by mutual agreement.
Amounts available to borrow under the SMBC Funding Facility are subject to a borrowing base that applies an advance rate to assets held by CCT Tokyo Funding. At the option of CCT Tokyo Funding, interest is charged at either the rate of three month LIBOR plus 1.75%, if the average advances outstanding are greater than $100,000,000, otherwise plus 2.00%, or the higher of the Prime Rate (as defined in the Loan and Servicing Agreement) or the Federal Funds rate plus 0.50%, plus 0.75% if the average advances outstanding are greater than $100,000,000, otherwise plus 1.00%. Interest is payable quarterly. Effective June 2, 2016, CCT Tokyo Funding began paying a quarterly non-usage fee of 0.35% on any unused commitment amounts if the average daily amount of the advances outstanding during a remittance period is equal to or greater than the lesser of (i) 50% of the borrowing base during the remittance period and (ii) $100,000,000 (such lesser amount, the “Later Period Threshold Amount”). If the average daily amount of the advances outstanding during a remittance period is less than the Later Period Threshold Amount, CCT Tokyo Funding will pay a fee of 0.875% for any unused portion up to or equal to the difference of the Later Period Threshold Amount less the amount of advances outstanding in addition to the non-usage fee of 0.35% on any remaining unused portion.
F-75
Table of Contents
| 10. | Borrowings (continued) |
The components of interest expense, average interest rates (i.e., base interest rate in effect plus the spread) and average outstanding balances for the SMBC Credit Facility for the years ended December 31, 2016 and 2015 were as follows (in thousands):
| Year Ended December 31, | ||||||||
| 2016 | 2015 | |||||||
| Stated interest expense |
$ | 1,325 | $ | — | ||||
| Unused commitment fees(1) |
232 | — | ||||||
| Amortization of deferred financing costs |
569 | 40 | ||||||
|
|
|
|
|
|||||
| Total interest expense |
$ | 2,126 | $ | 40 | ||||
|
|
|
|
|
|||||
| Weighted average interest rate |
2.6% | —% | ||||||
| Average borrowings |
$ | 51,475 | $ | — | ||||
| (1) | CCT Tokyo Funding recorded unused commitment fees effective June 2, 2016. |
JPM Credit Facility
On November 29, 2016, CCT SE entered into a revolving credit facility (the “JPM Credit Facility”) pursuant to a Loan and Security Agreement with the Company, as the portfolio manager, JPMorgan Chase Bank, National Association (“JPMorgan”), as administrative agent and lender, together with any additional lenders from time to time party thereto, and the collateral administrator, collateral agent and securities intermediary party thereto (the “Loan Agreement”). CCT SE’s obligations to JPMorgan under the JPM Credit Facility are secured by a first priority security interest in substantially all of the assets of CCT SE, including its portfolio of loans. The obligations of CCT SE under the JPM Credit Facility are non-recourse to the Company.
The JPM Credit Facility provides for borrowings in an aggregate principal amount up to $300 million with an accordion feature which allows for the expansion of the borrowing limit up to $400 million, subject to consent from the lender and other customary conditions. Borrowings under the JPM Credit Facility are subject to compliance with a net asset value coverage ratio with respect to the value of CCT SE’s portfolio and various eligibility criteria must be satisfied with respect to the acquisition of each loan in CCT SE’s portfolio. Any amounts borrowed under the JPM Credit Facility will mature, and all accrued and unpaid interest thereunder will be due and payable, on November 29, 2020.
Interest on the JPM Credit Facility is charged at the rate of three month LIBOR plus 3.00% and is payable quarterly. CCT SE also pays an annual commitment fee on any unused commitment amounts of 0.50% through May 29, 2017, and 1.00% thereafter. CCT SE also paid an upfront fee and incurred certain other customary costs and expenses in connection with obtaining the JPM Credit Facility. The components of interest expense, average interest rates (i.e., base interest rate in effect plus the spread) and average outstanding balances for the JPM Credit Facility for the year ended December 31, 2016 were as follows (in thousands):
| Year Ended December 31, 2016 |
||||
| Stated interest expense |
$ | 265 | ||
| Unused commitment fees |
104 | |||
| Amortization of deferred financing costs |
39 | |||
|
|
|
|||
| Total interest expense |
$ | 408 | ||
|
|
|
|||
| Weighted average interest rate |
4.1% | |||
| Average borrowings(1) |
$ | 73,182 | ||
| (1) | Average borrowings for the JPM Credit Facility for the year ended December 31, 2016 are calculated since the inception of the facility, or November 29, 2016. |
F-76
Table of Contents
| 10. | Borrowings (continued) |
2014 Senior Secured Term Loan
The Company is party to a senior secured term loan credit facility (the “2014 Senior Secured Term Loan”) with certain lenders and JPMorgan Chase Bank, N.A., as administrative agent. The 2014 Senior Secured Term Loan initially provided the Company with $398 million in gross proceeds. The 2014 Senior Secured Term Loan matures in May 2019, and generally bears interest at LIBOR plus 3.25% (with a LIBOR floor of 0.75%). The 2014 Senior Secured Term Loan includes an accordion feature permitting the Company to expand the facility if certain conditions are satisfied; provided, however, that the aggregate amount of the 2014 Senior Secured Term Loan is limited to the amount as determined from time to time which would not cause the covered debt amount (i.e., the Company’s aggregate debt under both the 2014 Senior Secured Term Loan and the Senior Secured Revolving Credit Facility, other permitted debt and certain other unsecured debt) to exceed the borrowing/collateral base. The 2014 Senior Secured Term Loan is secured by substantially all of the Company’s portfolio investments and its cash and securities accounts, excluding those held by CCT Funding, Paris Funding, Halifax Funding, CCT Tokyo Funding and CCT SE.
Maturities of the 2014 Senior Secured Term Loan for each of the next three years, in aggregate, as of December 31, 2016 were as follows (in thousands):
| 2017 |
$ | 4,000 | ||
| 2018 |
4,000 | |||
| 2019 |
381,000 | |||
|
|
|
|||
| $ | 389,000 | |||
|
|
|
The components of interest expense, average interest rates (i.e., base interest rate in effect plus the spread) and average outstanding balances for the 2014 Senior Secured Term Loan for the years ended December 31, 2016, 2015 and 2014 were as follows (in thousands):
| Year Ended December 31, | ||||||||||||
| 2016 | 2015 | 2014 | ||||||||||
| Stated interest expense |
$ | 16,047 | $ | 16,039 | $ | 10,014 | ||||||
| Accretion of original issue discount |
398 | 384 | 228 | |||||||||
| Amortization of deferred financing costs |
1,128 | 1,088 | 646 | |||||||||
|
|
|
|
|
|
|
|||||||
| Total interest expense |
$ | 17,573 | $ | 17,511 | $ | 10,888 | ||||||
|
|
|
|
|
|
|
|||||||
| Weighted average interest rate |
4.2% | 4.2% | 4.2% | |||||||||
| Average borrowings (1) |
$ | 391,484 | $ | 395,477 | $ | 398,765 | ||||||
| (1) | Average borrowings for the 2014 Senior Secured Term Loan for the year ended December 31, 2014 are calculated since the inception date of the facility, or May 20, 2014. |
In connection with each of the credit facilities and 2014 Senior Secured Term Loan, the Company has made customary representations and warranties and is required to comply with various covenants, reporting requirements and other customary requirements for similar facilities. As of December 31, 2016 and December 31, 2015, the Company believes it was in compliance with the covenant requirements for all of its credit facilities and 2014 Senior Secured Term Loan.
CS Facility
On June 30, 2016, the Company entered into a debt financing arrangement with Credit Suisse Securities (Europe) Limited (“CS”). The Company elected to structure the financing in the manner described more fully below in order to, among other things, obtain such financing at a lower cost than would be available through alternate arrangements.
On June 30, 2016, the Company purchased a portion of a Tranche B term loan issued by LSF IX Java Investments, Ltd (the “Tranche B Loan”) with a par value of €56.41 million from Credit Suisse AG. The company financed a portion of the purchase by entering into a repurchase transaction with CS effective as of June 30, 2016 (the “CS Facility”). Under the terms of the CS Facility, CS purchased the Tranche B Loan from the Company for a purchase price of €22.28 million. The Company will, on a monthly basis, repurchase the Tranche B Loan from CS and subsequently resell the Tranche B Loan to CS. The final repurchase transaction must occur no later than June 29, 2017. The repurchase price paid to CS for each repurchase of the Tranche B Loan will be equal to the purchase price paid by CS for the Tranche B Loan plus interest thereon accrued at EURIBOR plus a spread of 0.75% for the term of the first repurchase transaction and 1.50% for each subsequent repurchase transaction. The company recorded interest expense of $0.17 million for the CS Facility for the year ended December 31, 2016.
The CS Facility is secured by substantially all of the Company’s portfolio investments.
F-77
Table of Contents
| 11. | Commitments and Contingencies |
Unfunded commitments to provide funds to portfolio companies are not recorded in the Company’s consolidated statements of assets and liabilities. Since these commitments may expire without being drawn upon, the total commitment amount does not necessarily represent future cash requirements. The Company has sufficient liquidity to fund these commitments. As of December 31, 2016, the Company’s unfunded commitments consisted of the following (in thousands):
| Category / Company (1) |
||||
| Unfunded revolvers/delayed draw loan commitments: |
||||
| A10 Capital, LLC |
$ | 10,058 | ||
| BeyondTrust Software, Inc. |
1,090 | |||
| Centric Group LLC |
5,870 | |||
| Dentix Health Corporation, S.L.U. |
9,473 | |||
| Safety Technology Holdings, Inc. |
421 | |||
| Smile Brands, Inc. |
3,589 | |||
| SouthernCarlson |
6,219 | |||
| SouthernCarlson |
5,182 | |||
| SquareTwo Financial Corp. |
2,704 | |||
|
|
|
|||
| Total unfunded revolvers/delayed draw loan commitments |
$ | 44,606 | ||
|
|
|
|||
| Unfunded equity commitments: |
||||
| Central Park Leasing SARL |
$ | 1,292 | ||
| GA Capital Specialty Lending Fund |
34,855 | |||
| Home Partners of America, Inc. |
2,150 | |||
| KKR BPT Holdings Aggregator, LLC |
6,800 | |||
| Orchard Marine, Ltd. |
6,138 | |||
| Polyconcept North America Holdings, Inc. |
1,211 | |||
| Star Mountain SMB Multi-Manager Credit Platform, LP |
28,307 | |||
| Toorak Capital |
23,016 | |||
|
|
|
|||
| Total unfunded equity commitments |
$ | 103,769 | ||
|
|
|
| (1) | May be commitments to one or more entities affiliated with the named company. |
As of December 31, 2016, the Company also has an unfunded commitment to provide $345.10 million of capital to SCJV. The capital commitment can be satisfied with contributions of cash and/or investments. The capital commitments cannot be drawn without an affirmative vote by one of the Company’s representatives on SCJV’s board of managers.
As of December 31, 2016, the Company’s unfunded debt commitments have a fair value of $(0.96) million. The Company funds its equity investments as it receives funding notices from the portfolio companies. As of December 31, 2016, the Company’s unfunded equity commitments have a fair value of zero.
In the normal course of business, the Company may enter into guarantees on behalf of portfolio companies. Under such arrangements, the Company would be required to make payments to third parties if the portfolio companies were to default on their related payment obligations. The Company has no such guarantees outstanding at December 31, 2016 and 2015.
| 12. | Federal Income Taxes |
Income and capital gain distributions are determined in accordance with the Code and federal tax regulations, which may differ from amounts determined in accordance with GAAP. The book-to-tax differences, which could be material, are primarily due to differing treatments of income and gains on various investment securities held by the Company and expenses incurred by the Company. Permanent book and tax differences, both in timing and character, result in reclassifications to (i) paid-in capital in excess of par value, (ii) undistributed net investment income, (iii) accumulated net realized gains (losses) and (iv) accumulated net unrealized depreciation on investments, derivative instruments and foreign currency translation, as appropriate. As of December 31, 2016 and 2015, the Company made the following reclassifications of permanent book and tax basis differences (in thousands):
| Capital Accounts |
2016 | 2015 | ||||||
| Paid in capital in excess of par value |
$ | (5,627) | $ | (7,372) | ||||
| Distributions in excess of net investment income |
7,172 | 58,149 | ||||||
| Accumulated realized gains (losses) |
(1,545) | (50,777) | ||||||
F-78
Table of Contents
| 12. | Federal Income Taxes (continued) |
As of December 31, 2016 and 2015, the components of tax basis accumulated earnings were as follows (in thousands):
| 2016 | 2015 | |||||||
| Undistributed ordinary income – net |
$ | 98,473 | $ | 69,853 | ||||
| Undistributed capital gains |
— | — | ||||||
| Unrealized gains (losses) – net |
(262,018) | (282,819) | ||||||
| Other temporary adjustments |
(45,911) | (15,879) | ||||||
| Capital loss carryover |
(41,565) | (27,986) | ||||||
|
|
|
|
|
|||||
| Total accumulated earnings – net |
$ | (251,021) | $ | (256,831) | ||||
|
|
|
|
|
|||||
The following table reconciles net increase in net assets resulting from operations to estimated taxable income available for distributions for years ended December 31, 2016, 2015 and 2014, (in thousands):
| Years Ended December 31, | ||||||||||||
| 2016 | 2015 | 2014 | ||||||||||
| Net (decrease) increase in net assets resulting from operations |
$ | 243,115 | $ | (38,207) | $ | 84,317 | ||||||
| Net change in unrealized (appreciation) depreciation on investments |
1,860 | 232,449 | 104,589 | |||||||||
| Net change in unrealized appreciation on cross currency swaps |
(18,554) | (7,943) | — | |||||||||
| Net change in unrealized appreciation on interest rate swaps |
(2,841) | (6,021) | — | |||||||||
| Net change in unrealized (appreciation) depreciation on foreign currency translation |
551 | (1,778) | (1,463) | |||||||||
| Realized losses not currently deductible |
1,779 | 21,802 | — | |||||||||
| Net investment loss from Taxable Subsidiaries |
424 | 2,604 | 1,002 | |||||||||
| Unearned performance-based incentive fee on unrealized gains |
— | — | (8,805) | |||||||||
| Offering expense |
2,285 | 4,481 | 6,833 | |||||||||
| Taxable income from investments on non-accrual status |
37,845 | 8,455 | 2,615 | |||||||||
| Income from partnerships |
4,340 | — | — | |||||||||
| Non-deductible tax expense |
5,377 | 2,890 | 1,392 | |||||||||
| Other book-tax differences |
44 | (455) | (184) | |||||||||
|
|
|
|
|
|
|
|||||||
| Taxable income available for distributions |
$ | 276,225 | $ | 218,277 | $ | 190,296 | ||||||
|
|
|
|
|
|
|
|||||||
The tax character of shareholder distributions attributable to the fiscal years ended December 31, 2016, 2015 and 2014 were as follows (in thousands):
| 2016 | 2015 | 2014 | ||||||||||||||||||||||
| Paid Distributions attributable to: |
Amount | Percentage | Amount | Percentage | Amount | Percentage | ||||||||||||||||||
| Ordinary Income |
$ | 244,950 | 100.0(1) | $ | 204,646 | 99.8(1) | $ | 139,453 | 98.2(1) | |||||||||||||||
| Realized long term capital gains |
— | — | 398 | 0.2 | 2,565 | 1.8 | ||||||||||||||||||
|
|
|
|
|
|
|
|
|
|
|
|
|
|||||||||||||
| Total |
$ | 244,950 | 100.0% | $ | 205,044 | 100.0% | $ | 142,018 | 100.0% | |||||||||||||||
|
|
|
|
|
|
|
|
|
|
|
|
|
|||||||||||||
| Paid distributions as a percentage of taxable income available for distributions |
89% | 94% | 75% | |||||||||||||||||||||
| (1) | Including short term capital gains of $–, $– and $15,985 for the years ended December 31, 2016, 2015 and 2014, respectively. |
The Company is generally subject to nondeductible federal excise taxes if it does not distribute to its shareholders an amount at least equal to the sum of (i) 98% of its net ordinary income for the calendar year, (ii) 98.2% of its capital gains in excess of capital losses for the one-year period generally ending on October 31 of the calendar year and (iii) any ordinary income and net capital gains for preceding years that were not distributed during such years and on which the Company paid no federal income tax. For the years ended December 31, 2016, 2015 and 2014, the Company determined it had excess excise tax base income over the current year distributions. Accordingly, the Company recorded U.S. federal excise tax of $3.31 million, $2.89 million, and $1.39 million for the years ended December 31, 2016, 2015 and 2014, respectively.
F-79
Table of Contents
| 12. | Federal Income Taxes (continued) |
The components of the provision for income taxes for the years ended December 31, 2016, 2015 and 2014 were as follows (in thousands):
| Years Ended December 31, | ||||||||||||
| 2016 | 2015 | 2014 | ||||||||||
| Current tax expense (benefit): |
||||||||||||
| Federal, including excise tax |
$ | 3311 | $ | 2,890 | $ | 1,392 | ||||||
| Foreign (1) |
1,257 | 555 | — | |||||||||
|
|
|
|
|
|
|
|||||||
| Total current tax expense (benefit) |
4,568 | 3,445 | 1,392 | |||||||||
|
|
|
|
|
|
|
|||||||
| Deferred tax expense (benefit): |
||||||||||||
| Federal |
— | — | — | |||||||||
| Foreign |
2,066 | — | — | |||||||||
|
|
|
|
|
|
|
|||||||
| Total deferred tax expense (benefit) |
2,066 | — | — | |||||||||
|
|
|
|
|
|
|
|||||||
| Total tax expense (benefit) |
$ | 6,634 | $ | 3,445 | $ | 1,392 | ||||||
|
|
|
|
|
|
|
|||||||
| (1) | For the years ended December 31, 2016, 2015 and 2014, $1.26 million, $0.56 million and $— million, respectively, of the current foreign income tax expense represents foreign tax withholding and is recorded net against the related interest income in the consolidated statements of operations. |
The significant components of the net deferred tax assets as of December 31, 2016 and 2015 were as follows (in thousands):
| As of December 31, | ||||||||
| 2016 | 2015 | |||||||
| Deferred tax assets: |
||||||||
| Net operating losses |
$ | 2,467 | $ | 1,789 | ||||
| Partnership basis differences |
— | 528 | ||||||
| Other |
22 | 154 | ||||||
|
|
|
|
|
|||||
| Subtotal deferred tax assets |
2,489 | 2,471 | ||||||
|
|
|
|
|
|||||
| Deferred tax liabilities: |
||||||||
| Partnership basis differences |
(1,319) | — | ||||||
| Other basis adjustments |
(1,991) | — | ||||||
|
|
|
|
|
|||||
| Subtotal deferred tax liabilities |
(3,310) | — | ||||||
|
|
|
|
|
|||||
| Net deferred tax liability before valuation allowance |
(821) | 2,471 | ||||||
|
|
|
|
|
|||||
| Valuation allowance |
(1,170) | (2,471) | ||||||
|
|
|
|
|
|||||
| Net deferred tax liability |
$ | (1,991) | $ | — | ||||
|
|
|
|
|
|||||
A reconciliation of taxes computed at the statutory federal tax rate on net increase (decrease) in net assets from operations before income taxes to the provision (benefit) for income taxes is as follows (in thousands):
| Year Ended December 31, | ||||||||||||||||||||||||
| 2016 | 2015 | 2014 | ||||||||||||||||||||||
| Expected tax expense/(benefit) at federal statutory rate |
$ | 85,090 | 35.0% | $ | (13,373) | 35.0% | $ | 29,511 | 35.0% | |||||||||||||||
| Foreign expense |
3,323 | 1.4% | 555 | (1.5)% | — | 0.0% | ||||||||||||||||||
| Change in valuation allowance |
— | 0.0% | — | 0.0% | — | 0.0% | ||||||||||||||||||
| Benefit of RIC election |
(85,090) | (35.0)% | 13,373 | (35.0)% | (29,511) | (35.0)% | ||||||||||||||||||
| Excise tax |
3,311 | 1.3% | 2,890 | (7.5)% | 1,392 | 1.7% | ||||||||||||||||||
|
|
|
|
|
|
|
|
|
|
|
|
|
|||||||||||||
| Total expense |
$ | 6,634 | 2.7% | $ | 3,445 | (9.0)% | $ | 1,392 | 1.7% | |||||||||||||||
|
|
|
|
|
|
|
|
|
|
|
|
|
|||||||||||||
The Company analyzed its material tax positions and determined it has not taken any uncertain tax positions.
The Company’s capital losses in excess of capital gains earned in a tax year may generally be carried forward and used to offset capital gains, subject to certain limitations. The Regulated Investment Company Modernization Act (the “RIC Modernization Act”) was enacted on December 22, 2010. Under the RIC Modernization Act, capital losses incurred by taxpayers in taxable years beginning after the date of enactment will be allowed to be carried forward indefinitely and are allowed to retain their character as either short-term or long-term losses. As such, the Company’s cumulative capital loss carryover as of December 31, 2016 of $41.56 million will not be subject to expiration.
F-80
Table of Contents
| 12. | Federal Income Taxes (continued) |
For the year ended December 31, 2016, the Company had estimated taxable income in excess of the distributions made from such taxable income during the year. The undistributed taxable income for the year ended December 31, 2016 is estimated to be approximately $98.47 million, which will not be finalized until the 2016 tax returns are filed in 2017. For the years ended December 31, 2015 and 2014, the Company had taxable income in excess of the distributions made from such taxable income during the year, and therefore, the amounts carried forward to 2016 and 2015 were approximately $69.85 million and $51.81 million, respectively.
| 13. | Financial Highlights |
The following is a schedule of financial highlights for one share of common stock during the years ended December 31, 2016, 2015, 2014, 2013 and 2012.
| Year Ended December 31, | ||||||||||||||||||||
| 2016 | 2015 | 2014 | 2013 | 2012 | ||||||||||||||||
| OPERATING PERFORMANCE PER SHARE |
||||||||||||||||||||
| Net asset value, beginning of Year |
$ | 8.93 | $ | 9.79 | $ | 10.00 | $ | 9.75 | $ | 9.21 | ||||||||||
|
|
|
|
|
|
|
|
|
|
|
|||||||||||
| Net investment income before expense support/ reimbursement(1) |
0.69 | 0.69 | 0.73 | 0.49 | 0.51 | |||||||||||||||
| Expense support/reimbursement(1) |
— | — | — | (0.01) | (0.01) | |||||||||||||||
|
|
|
|
|
|
|
|
|
|
|
|||||||||||
| Net investment income(1) |
0.69 | 0.69 | 0.73 | 0.48 | 0.50 | |||||||||||||||
| Net realized and unrealized gain (loss)(1)(2) |
0.10 | (0.79) | (0.18) | 0.55 | 0.70 | |||||||||||||||
|
|
|
|
|
|
|
|
|
|
|
|||||||||||
| Net increase (decrease) resulting from investment operations |
0.79 | (0.10 | ) | 0.55 | 1.03 | 1.20 | ||||||||||||||
|
|
|
|
|
|
|
|
|
|
|
|||||||||||
| Distributions from net investment income(3) |
(0.69) | (0.69) | (0.73) | (0.47) | (0.51) | |||||||||||||||
| Distributions from realized gains(3) |
— | (0.11) | (0.07) | (0.27) | (0.10) | |||||||||||||||
| Distributions in excess of net investment income(3)(4) |
(0.11) | — | — | (0.09) | (0.15) | |||||||||||||||
|
|
|
|
|
|
|
|
|
|
|
|||||||||||
| Net increase (decrease) resulting from distributions to common shareholders |
(0.80 | ) | (0.80 | ) | (0.80 | ) | (0.83 | ) | (0.76 | ) | ||||||||||
|
|
|
|
|
|
|
|
|
|
|
|||||||||||
| Issuance of common stock above net asset value(5) |
0.01 | 0.04 | 0.04 | 0.05 | 0.10 | |||||||||||||||
| Repurchases of common stock(6) |
— | — | — | — | — | |||||||||||||||
|
|
|
|
|
|
|
|
|
|
|
|||||||||||
| Net increase resulting from capital share transactions |
0.01 | 0.04 | 0.04 | 0.05 | 0.10 | |||||||||||||||
|
|
|
|
|
|
|
|
|
|
|
|||||||||||
| Net asset value, end of year |
$ | 8.93 | $ | 8.93 | $ | 9.79 | $ | 10.00 | $ | 9.75 | ||||||||||
|
|
|
|
|
|
|
|
|
|
|
|||||||||||
| OPERATING PERFORMANCE PER SHARE |
||||||||||||||||||||
| Total investment return-net price(7) |
8.5% | (2.0)% | 4.1% | 10.2% | 14.2% | |||||||||||||||
| Total investment return-net asset value(8) |
9.4% | (0.9)% | 5.9% | 11.4% | 14.3% | |||||||||||||||
| RATIOS/SUPPLEMENTAL DATA (all amounts in thousands except ratios) |
||||||||||||||||||||
| Net assets, end of year |
$ | 2,759,332 | $ | 2,594,022 | $ | 2,145,821 | $ | 1,430,434 | $ | 611,484 | ||||||||||
| Average net assets(9) |
$ | 2,698,040 | $ | 2,428,271 | $ | 1,783,121 | $ | 1,036,498 | $ | 304,261 | ||||||||||
| Average borrowings(9) |
$ | 1,476,426 | $ | 1,011,175 | $ | 572,484 | $ | 339,271 | $ | 110,072 | ||||||||||
| Shares outstanding, end of year |
309,042 | 290,430 | 219,132 | 143,024 | 62,728 | |||||||||||||||
| Weighted average shares outstanding |
304,493 | 254,846 | 177,394 | 104,506 | 31,395 | |||||||||||||||
| Ratios to Average Net Assets:(9) |
||||||||||||||||||||
| Total operating expenses before expense support/ reimbursement |
6.54% | 5.54% | 5.56% | 6.61% | 6.46% | |||||||||||||||
| Total operating expense |
6.54% | 5.54% | 5.56% | 6.72% | 6.54% | |||||||||||||||
| Net investment income |
7.79% | 7.28% | 7.30% | 4.82% | 5.16% | |||||||||||||||
| Portfolio turnover rate |
35% | 26% | 23% | 73% | 85% | |||||||||||||||
| Asset coverage ratio(10) |
2.54 | 2.61 | 3.27 | 2.96 | 3.59 | |||||||||||||||
| (1) | The per share data was derived by using the weighted average shares outstanding during the period. |
| (2) | The amount shown at this caption is the balancing figure derived from the other figures in the schedule. The amount shown at this caption for a share outstanding throughout the year may not agree with the change in the aggregate gains and losses in portfolio securities for the year because of the timing of sales of the Company’s shares in relation to fluctuating market values for the portfolio. |
| (3) | The per share data for distributions is the actual amount of distributions paid or payable per share of common stock outstanding during the entire period; distributions per share are rounded to the nearest $0.01. |
| (4) | See Note 8. “Distributions” for further information on the source of distributions from other than net investment income and realized gains. |
F-81
Table of Contents
| 13. | Financial Highlights (continued) |
| (5) | The continuous issuance of common stock may cause an incremental increase in net asset value per share due to the sale of shares at the then prevailing public offering price and the receipt of net proceeds per share by the Company in excess of net asset value per share on each subscription closing date. The per share data was derived by computing (i) the sum of (A) the number of shares issued in connection with subscriptions and/or distribution reinvestment on each share transaction date times (B) the differences between the net proceeds per share and the net asset value per share on each share transaction date, divided by (ii) the total shares outstanding at the end of the period. |
| (6) | The per share impact of the Company’s repurchase of common stock is a reduction to net asset value of less than $0.01 per share during the applicable period. |
| (7) | Total investment return-net price is a measure of total return for shareholders who purchased the Company’s common stock at the beginning of the period, including distributions declared during the period. Total investment return-net price is based on (i) the purchase of one share at the public offering price, net of sales load, on the first day of the period, (ii) the sale at the net asset value per share on the last day of the period, of (A) one share plus (B) any fractional shares issued in connection with the reinvestment of monthly distributions, and (iii) distributions payable relating to one share, if any, on the last day of the period. The total investment return-net price calculation assumes that (i) monthly cash distributions are reinvested in accordance with the Company’s distribution reinvestment plan and (ii) the fractional shares issued pursuant to the distribution reinvestment plan are issued at the then current public offering price, net of sales load, on each monthly distribution payment date. Since there is no public market for the Company’s shares, the terminal sales price per share is assumed to be equal to the net asset value per share on the last day of the period presented. The Company’s performance changes over time and currently may be different than that shown above. Past performance is no guarantee of future results. Investment performance is presented without regard to sales load that may be incurred by shareholders in the purchase of the Company’s shares of common stock. |
| (8) | Total investment return-net asset value is a measure of the change in total value for shareholders who held the Company’s common stock at the beginning and end of the period, including distributions declared during the period. Total investment return-net asset value is based on (i) net asset value per share on the first day of the period, (ii) the net asset value per share on the last day of the period, of (A) one share plus (B) any fractional shares issued in connection with the reinvestment of monthly distributions, and (iii) distributions payable relating to one share, if any, on the last day of the period. The total investment return-net asset value calculation assumes that (i) monthly cash distributions are reinvested in accordance with the Company’s distribution reinvestment plan and (ii) the fractional shares issued pursuant to the distribution reinvestment plan are issued at the then current public offering price, net of sales load, on each monthly distribution payment date. Since there is no public market for the Company’s shares, terminal market value per share is assumed to be equal to net asset value per share on the last day of the period presented. The Company’s performance changes over time and currently may be different than that shown above. Past performance is no guarantee of future results. Investment performance is presented without regard to sales load that may be incurred by shareholders in the purchase of the Company’s shares of common stock. |
| (9) | The computation of average net assets and average borrowings during the period is based on the daily value of net assets and borrowing balances, respectively. |
| (10) | Asset coverage ratio is equal to (i) the sum of (A) net assets at the end of the period and (B) debt outstanding at the end of the period, divided by (ii) total debt outstanding at the end of the period. For purposes of the asset coverage ratio test applicable to the Company as a business development company, the Company regards the TRS total notional amount at the end of the period, less the total amount of cash collateral posted by Halifax Funding under the TRS, as a senior security. These data are presented in Note 4. “Derivative Instruments” of the consolidated financial statements. |
F-82
Table of Contents
| 14. | Significant Subsidiaries |
In accordance with SEC Regulation S-X Rules 3-09 and 4-08(g), the Company must determine which of its unconsolidated controlled portfolio companies, if any, are considered “significant subsidiaries.” After performing this analysis, the Company determined that none of its portfolio companies are significant subsidiaries for the year ended December 31, 2016. The Company also determined that two of its portfolio companies, Comet Aircraft S.A.R.L. (“Comet Aircraft”) and Innovating Partners, LLC (“Innovating Partners”) are significant subsidiaries for the year ended December 31, 2015 under at least one of the significance conditions of Rule 4-08(g) of SEC Regulation S-X. Accordingly, financial information for the year ended December 31, 2016 and for the period from February 20, 2015 (commencement of operations) through December 31, 2015 for Comet Aircraft and for the year ended December 31, 2016 and for the period from April 14, 2015 (commencement of operations) through December 31, 2015 for Innovating Partners have been included as follows (in thousands):
| Comet Aircraft | ||||||||
| As of December 31, | ||||||||
| Balance sheet items |
2016 | 2015 | ||||||
| Current assets |
$ | 40,732 | $ | 33,993 | ||||
| Noncurrent assets |
634,791 | 692,352 | ||||||
| Current liabilities |
62,410 | 58,250 | ||||||
| Noncurrent liabilities |
654,202 | 688,719 | ||||||
| Equity |
(41,089) | (20,624) | ||||||
| Statement of operations items |
For the year ended December 31, 2016 |
For the period from February 20, 2015 (commencement of operations) through December 31, 2015 |
||||||
| Total revenue |
$ | 77,428 | $ | 41,550 | ||||
| Total operating expense |
93,892 | 62,174 | ||||||
| Net operating loss |
(16,464) | (20,624) | ||||||
| Income tax expense |
58 | — | ||||||
| Net loss |
(16,522) | (20,624) | ||||||
| Innovating Partners | ||||||||
| As of December 31, | ||||||||
| Balance sheet items |
2016 | 2015 | ||||||
| Current assets |
$ | 247 | $ | 429 | ||||
| Noncurrent assets |
4,902 | 19,376 | ||||||
| Current liabilities |
63 | — | ||||||
| Equity |
5,086 | 19,805 | ||||||
| Statement of operations items |
For the year ended December 31, 2016 |
For the period from April 14, 2015 (commencement of operations) through December 31, 2015 |
||||||
| Total revenue |
$ | 1,784 | $ | 7,360 | ||||
| Total operating expense |
896 | 729 | ||||||
| Net operating income |
888 | 6,631 | ||||||
| Net income (loss) |
(10,427) | 7,473 | ||||||
F-83
Table of Contents
| 15. | Selected Quarterly Financial Data (Unaudited) |
The following is the quarterly results of operations for the years ended December 31, 2016 and 2015. The following information reflects all normal recurring adjustments necessary for a fair presentation of the information for the periods presented. The operating results for any quarter are not necessarily indicative of results for any future period (in thousands, except per share amounts).
| Year Ended | Quarter Ended | |||||||||||||||||||
| December 31, 2016 |
December 31, 2016 |
September 30, 2016 |
June 30, 2016 |
March 31, 2016 |
||||||||||||||||
| Total investment income |
$ | 386,468 | $ | 101,752 | $ | 97,418 | $ | 98,447 | $ | 88,851 | ||||||||||
| Net investment income |
210,096 | 53,360 | 53,164 | 52,237 | 51,335 | |||||||||||||||
| Net realized and unrealized gains (losses) |
33,019 | (6,113) | 59,052 | 66,700 | (86,620) | |||||||||||||||
| Net increase (decrease) in net assets resulting from operations |
243,115 | 47,247 | 112,216 | 118,937 | (35,285) | |||||||||||||||
| Basic and diluted earnings (losses) per common share |
0.80 | 0.15 | 0.37 | 0.39 | (0.12) | |||||||||||||||
| Net asset value per common share at end of period |
8.93 | 8.93 | 8.97 | 8.81 | 8.62 | |||||||||||||||
| Year Ended | Quarter Ended | |||||||||||||||||||
| December 31, 2015 |
December 31, 2015 |
September 30, 2015 |
June 30, 2015 |
March 31, 2015 |
||||||||||||||||
| Total investment income |
$ | 311,097 | $ | 87,046 | $ | 77,931 | $ | 72,166 | $ | 73,954 | ||||||||||
| Net investment income |
176,688 | 49,110 | 45,628 | 42,760 | 39,190 | |||||||||||||||
| Net realized and unrealized losses |
(214,895) | (88,794) | (105,359) | (13,336) | (7,406) | |||||||||||||||
| Net increase (decrease) in net assets resulting from operations |
(38,207) | (39,684) | (59,731) | 29,424 | 31,784 | |||||||||||||||
| Basic and diluted earnings (losses) per common share |
(0.15) | (0.14) | (0.23) | 0.12 | 0.14 | |||||||||||||||
| Net asset value per common share at end of period |
8.93 | 8.93 | 9.26 | 9.67 | 9.74 | |||||||||||||||
| 16. | Subsequent Events |
On January 17, 2017, the Company filed a tender offer statement with the SEC on Schedule TO. The Company offered to repurchase up to 7,612,326 shares of common stock at a cash price of $9.00 per share. On February 15, 2017, the Company filed an amendment to the tender offer statement with the SEC on Schedule TO extending the expiration of the tender offer from February 17, 2017 at 5:00 pm central time to March 3, 2017 at 5:00 pm central time. The tender offer terminated on March 3, 2017, upon which the Company repurchased 3.71 million shares of common stock for an aggregate purchase price of $33.38 million.
On January 27, 2017, the Company’s board of directors declared distributions of $0.015483 per share for four record dates beginning on February 7, 2017 through and including February 28, 2017. On February 24, 2017, the Company’s board of directors declared distributions of $0.015483 per share for four record dates beginning on March 7, 2017 through and including March 28, 2017. On March 16, 2017, the Company’s board of directors declared distributions of $0.015483 per share for four record dates beginning on April 4, 2017 through and including April 25, 2017.
On February 28, 2017, Paris Funding notified BNP of its intent to terminate the BNP Credit Facility on August 27, 2017.
F-84