Attached files
| file | filename |
|---|---|
| 8-K - FORM 8-K - BEAR STATE FINANCIAL, INC. | bsf20160915_8k.htm |
Exhibit 99.1


|
|
FOR IMMEDIATE RELEASE |
|
|
|
|
|
|
|
900 S. Shackleford, Suite 401 |
FOR FURTHER INFORMATION CONTACT: |
|
Little Rock, AR 72211 |
Mark McFatridge | CEO |
|
|
Sherri Billings | CFO |
| 501.975.6033 |

Bear State Financial, Inc. Announces Second Quarter 2016 Earnings
FINANCIAL HIGHLIGHTS:
|
● |
Second quarter 2016 GAAP net income was $4.5 million, a 79% increase from $2.5 million for the second quarter of 2015. Diluted earnings per common share for the second quarter of 2016 was $0.12, a 50% increase from $0.08 for the second quarter of 2015. |
|
● |
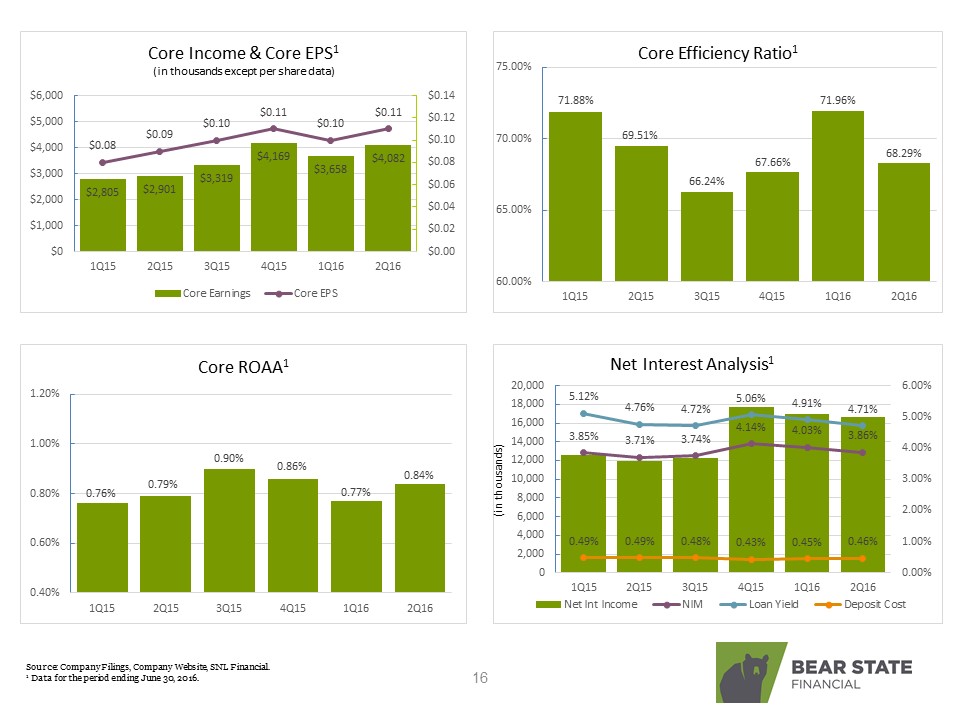
Second quarter 2016 core earnings were $4.1 million, a 41% increase from $2.9 million for the second quarter of 2015. Diluted core earnings per common share for the second quarter of 2016 was $0.11, a 22% increase from $0.09 for the second quarter of 2015. |
|
● |
Book value per common share was $6.08 at June 30, 2016, a 16% increase from $5.24 at June 30, 2015. |
|
● |
Tangible book value per common share was $4.72 at June 30, 2016, an 11% increase from $4.26 at June 30, 2015. |
Little Rock, AR – July 21, 2016 – Bear State Financial, Inc. (the “Company,” NASDAQ: BSF), today reported earnings of $4.5 million and earnings per diluted common share of $0.12 in the second quarter of 2016, compared to earnings of $2.5 million or $0.08 per diluted common share in the second quarter of 2015. Core earnings for the second quarter of 2016 were $4.1 million or $0.11 per diluted common share compared to core earnings of $2.9 million or $0.09 per diluted common share in the second quarter of 2015.
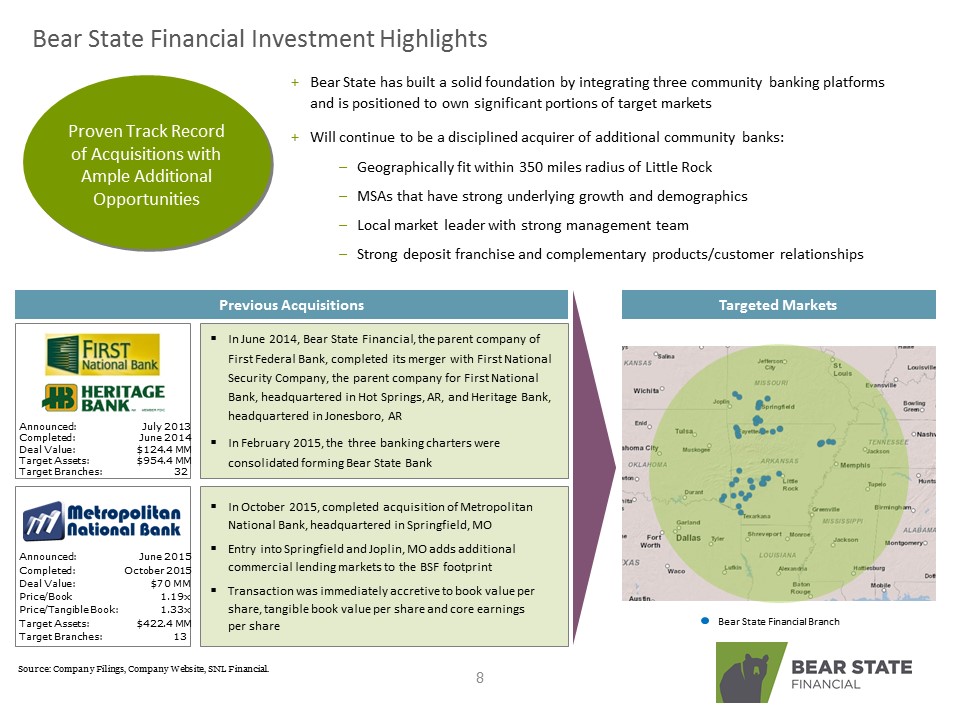
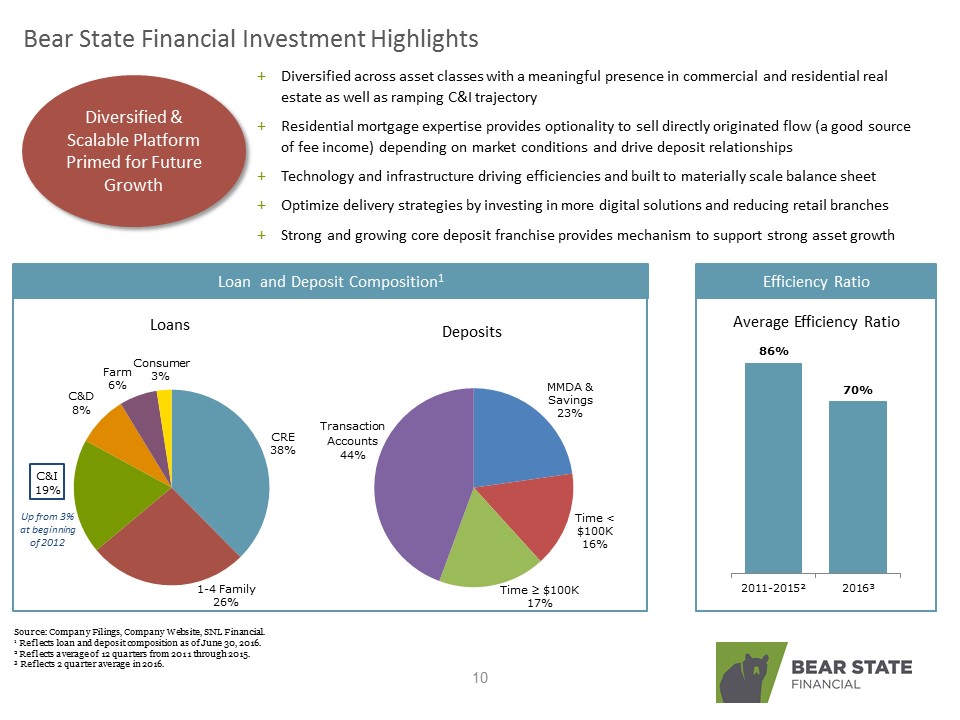
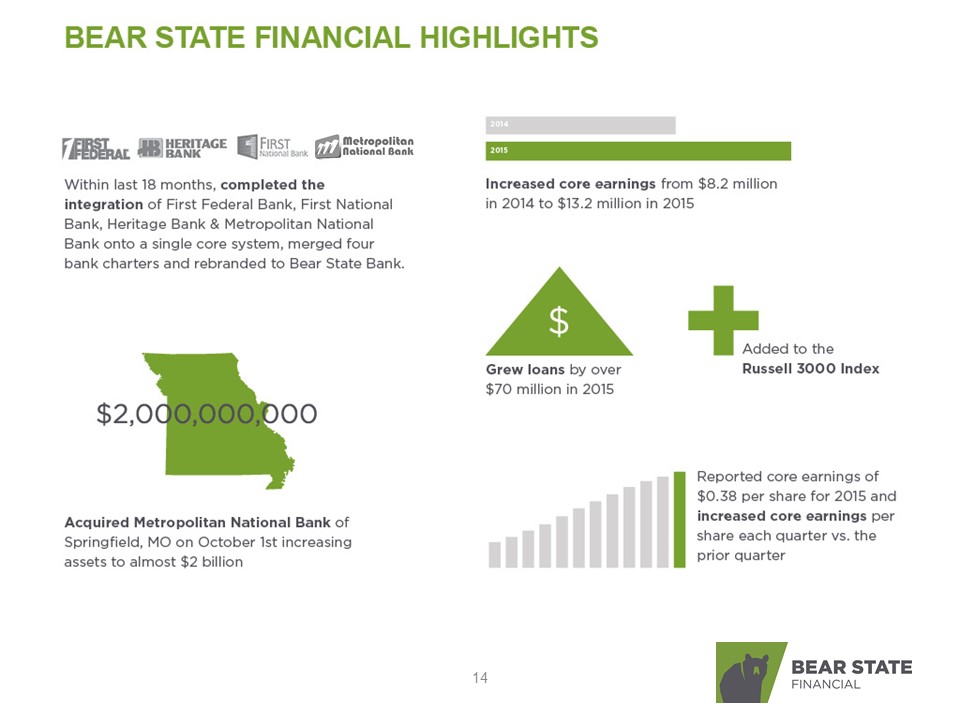
During the first quarter of 2016, the Company integrated Metropolitan National Bank (Springfield, MO) (“MNB”) into Bear State Bank. In addition, on April 29, 2016, the Company consolidated six branch locations, or 11% of the branch network. The benefits of these operational and organizational efficiencies began to be realized in the second quarter of 2016 as evidenced by the improvement in this quarter’s core efficiency ratio to 68% compared to the previous quarter ratio of 72%. Revenue from the profit on sale of mortgage loans increased 63% in the second quarter compared to the first quarter which also contributed to the improvement in the core efficiency ratio.
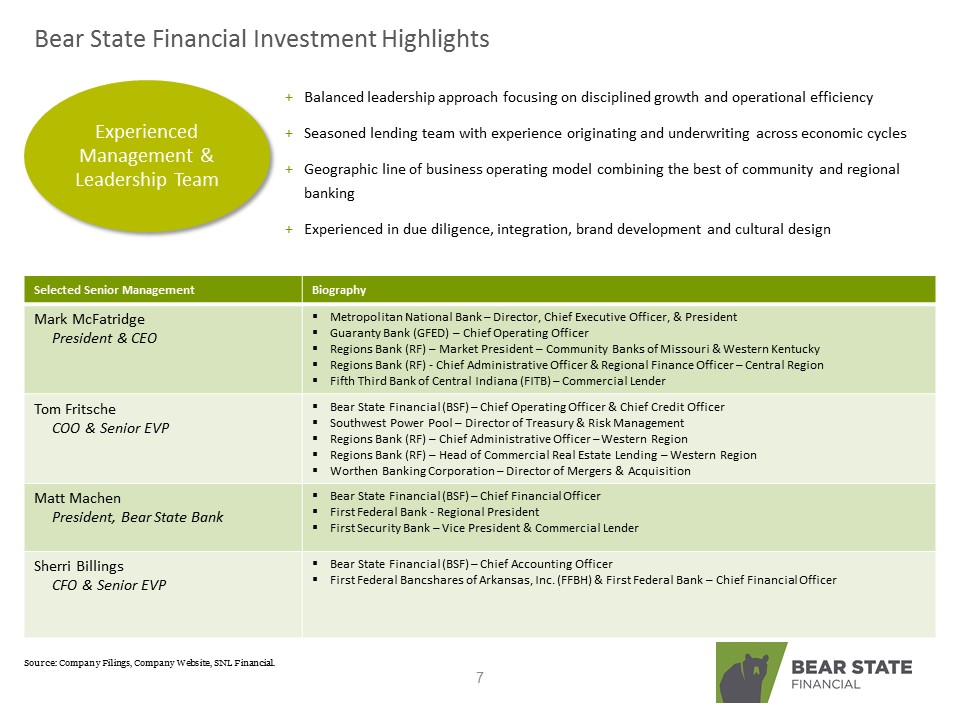
"Our second quarter results demonstrated the strength of Bear State’s value proposition, of competing with more than price, and the successes we have experienced with the integration of Metropolitan," said Mark McFatridge, President and CEO at Bear State Financial. "This is evident by our record mortgage production and profitability, while continuing to diversify within our loan portfolio and maintaining our strong credit culture. In the first half of this year, we have shown our ability to successfully integrate an acquisition already accretive to earnings as well as exceed planned synergies and efficiencies while continuing to make progress on multiple strategic initiatives. We remain focused on executing our strategic priorities designed to strengthen customer relationships and capitalizing on technology and innovation which will positively impact the Company going forward.”
FINANCIAL CONDITION
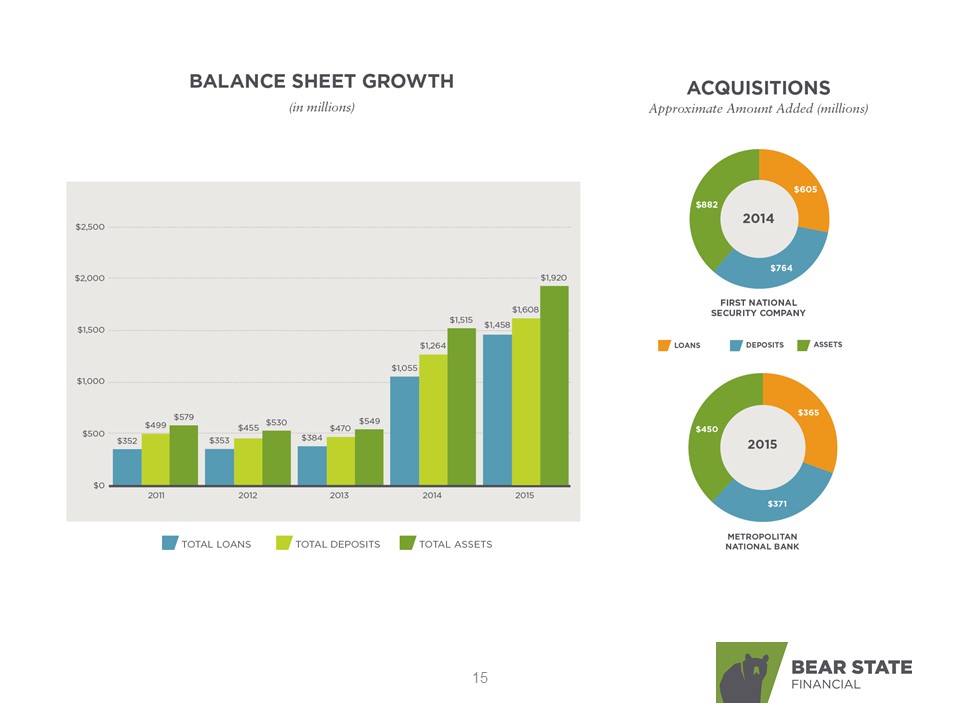
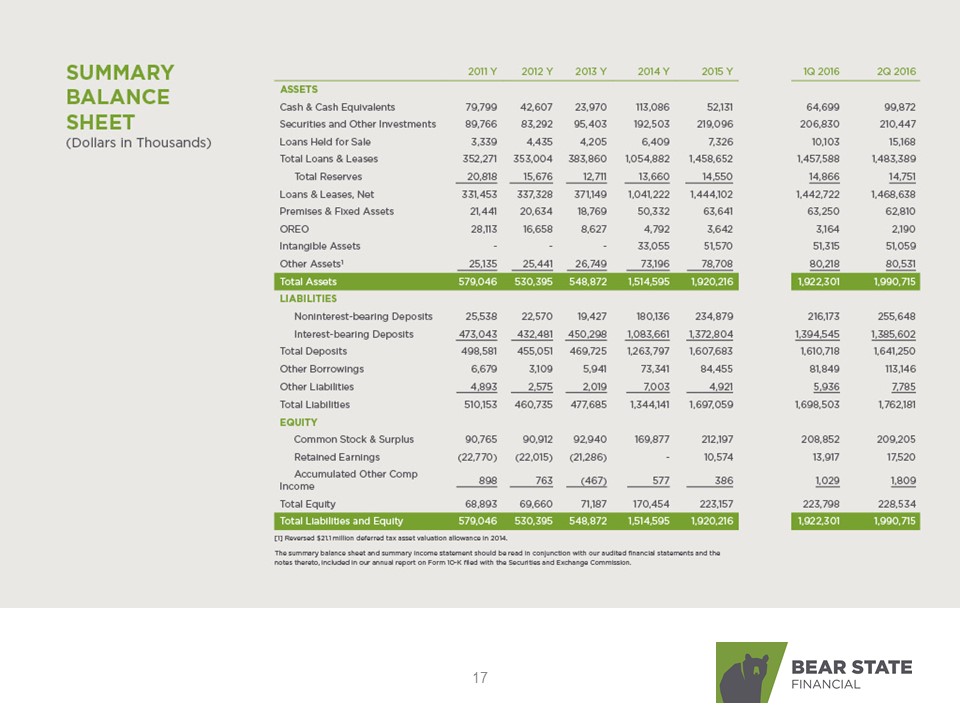
Total assets were $1.99 billion at June 30, 2016, a 37% increase compared to $1.45 billion at June 30, 2015. Total loans were $1.48 billion at June 30, 2016, an increase of $428 million, or 41% compared to June 30, 2015. Total deposits were $1.64 billion at June 30, 2016, a 36% increase compared to $1.21 billion at June 30, 2015. The increases in total assets, loans and deposits were primarily due to the MNB acquisition on October 1, 2015.
Total stockholders’ equity was $229 million at June 30, 2016, a 31% increase from $175 million at June 30, 2015. Tangible common stockholders’ equity was $177 million at June 30, 2016, a 25% increase from $142 million at June 30, 2015. Book value per common share was $6.08 at June 30, 2016, a 16% increase from $5.24 at June 30, 2015. Tangible book value per common share was $4.72 at June 30, 2016, an 11% increase from $4.26 at June 30, 2015. The Company’s ratio of total stockholders’ equity to total assets decreased to 11.48% at June 30, 2016, compared to 12.05% at June 30, 2015. The calculation of the Company’s tangible book value per common share, tangible common stockholders’ equity and the reconciliation of such non-GAAP financial measures to the most comparable GAAP measures are included in the schedules accompanying this release.
RESULTS OF OPERATIONS
The Company recognized second quarter 2016 net income of $4.5 million or $0.12 per diluted common share compared to net income of $2.5 million or $0.08 per diluted common share in the second quarter of 2015, resulting in a return on average assets of 0.94% in the second quarter of 2016, compared to 0.69% in the second quarter of 2015. Calculation of net income in accordance with GAAP includes what the Company considers “non-core items,” which are items that we do not consider indicative of our core operating performance and which are not necessarily comparable from year to year. The reconciliation of GAAP net income to core earnings, a non-GAAP financial measure, together with related financial measures and ratios is included in the schedules accompanying this release.
Second quarter 2016 core earnings totaled $4.1 million or $0.11 per diluted common share, compared to core earnings of $2.9 million or $0.09 per diluted common share in the second quarter of 2015. The core return on average assets measured 0.84% and 0.79%, core return on average equity measured 7.23% and 6.65% and core return on average tangible equity measured 9.34% and 8.18% each for the second quarters of 2016 and 2015, respectively. Non-core items during the second quarter of 2016 included a deferred tax valuation allowance reversal of $897,000; branch restructuring expenses of $571,000; and merger, acquisition and integration expenses of $137,000 related to the acquisition of MNB. Collectively, the effect of all non-core items, net of taxes, increased GAAP net income by approximately $460,000, or approximately $0.01 of diluted earnings per share.
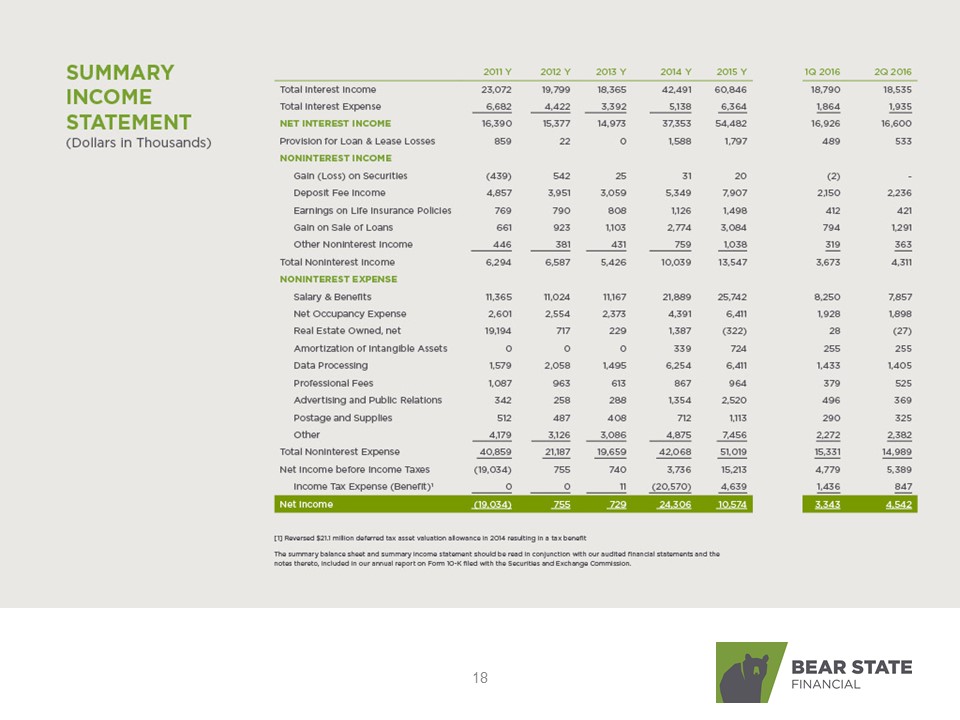
Net interest income for the second quarter of 2016 was $16.6 million compared to $12.0 million for the same period in 2015. Net interest income for the six months ended June 30, 2016 was $33.5 million, compared to $24.5 million for the same period in 2015. Interest income for the second quarter of 2016 was $18.5 million compared to $13.5 million for the same period in 2015. Interest income for the six months ended June 30, 2016 was $37.3 million compared to $27.6 million for the same period in 2015 .The increases in interest income for the three and six months ended June 30, 2016, compared to the same periods in 2015, were primarily related to increases in the average balance of loans receivable as a result of the MNB acquisition. Interest expense for the second quarter of 2016 was $1.9 million compared to $1.6 million for the same period in 2015. Interest expense for the six months ended June 30, 2016 was $3.8 million compared to $3.1 million for the same period in 2015. The increases in interest expense for the three and six months ended June 30, 2016 compared to the same periods in 2015 were primarily due to increases in the average balance of interest bearing deposits as a result of the MNB acquisition.
Net interest margin measured 3.86% for the second quarter of 2016, compared to 3.71% for the same period in 2015. Net interest margin for the six months ended June 30, 2016 was 3.95%, compared to 3.77% for the same period in 2015. The Company’s net interest margin increased primarily as a result of an increase in average yield on interest earning assets resulting from a higher percentage of loans in the mix of interest earning assets. The average cost of total interest-bearing liabilities decreased to 0.52% for the second quarter 2016, compared to 0.56% for the same period in 2015. The average cost of total interest-bearing liabilities for the six months ended June 30, 2016 was 0.52%, compared to 0.55% for the same period in 2015.
Noninterest income is generated primarily through deposit account fee income, profit on sale of mortgage loans, and earnings on life insurance policies. Total noninterest income for the three months ended June 30, 2016 increased to $4.3 million from $3.4 million for the same period in 2015, a 27% increase. Total noninterest income of $8.0 million for the six months ended June 30, 2016 increased from $6.5 million for the same period in 2015, a 23% increase. The increases in the three and six month comparison periods were primarily due to increases in deposit fee income and gain on sale of mortgage loans sold. The increase in deposit fee income was primarily due to an increase in deposit accounts resulting from the acquisition of MNB. The increase in gain on sale of loans was due to an increase in the volume of mortgage loans sold.
Total noninterest expense increased $3.7 million or 33% for the second quarter of 2016 compared to the second quarter of 2015. Total noninterest expense increased $6.8 million or 29% during the six months ended June 30, 2016 compared to the same period in 2015. The increases in total noninterest expense were primarily related to the increase in personnel and overhead costs incurred in connection with the MNB acquisition. The Company’s core efficiency ratio was 68% in the second quarter of 2016 compared to 70% in the second quarter of 2015.
Income tax provision decreased by $406,000 or 32% for the second quarter of 2016 compared to the second quarter of 2015 as a result of recording a valuation allowance reversal of $897,000 on deferred tax assets which was partially offset by an increase in taxable income between the two periods. Income tax provision for the six months ended June 30, 2016 increased by $146,000 or 7% compared to the same period in 2015 as a result of an increase in taxable income which was partially offset by the valuation allowance reversal.
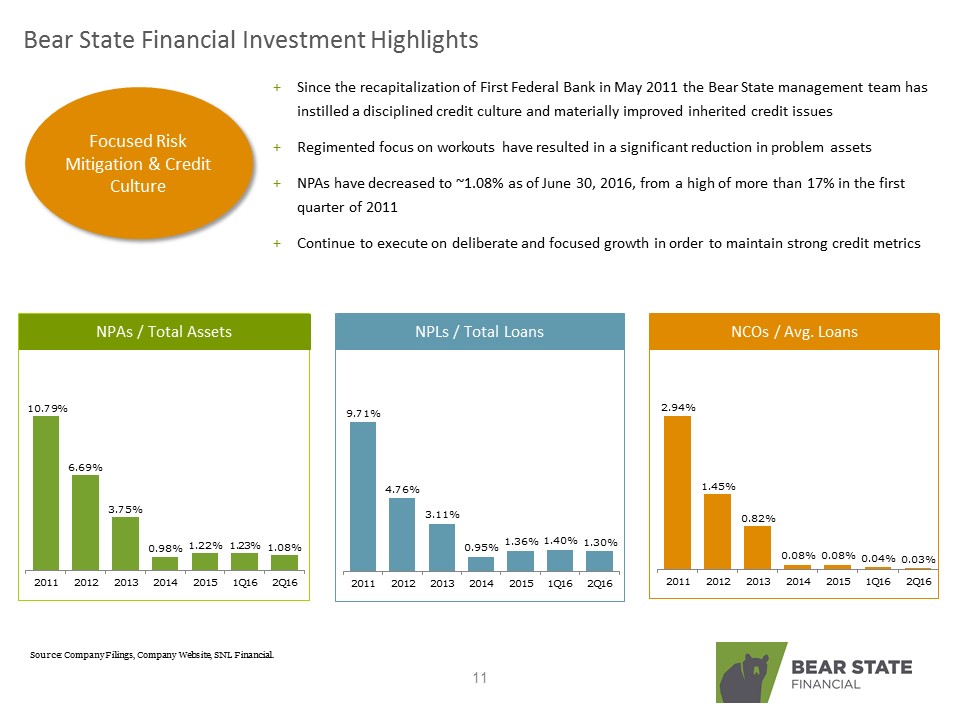
The ratio of nonperforming assets to total assets increased to 1.08% at June 30, 2016, compared to 0.94% at June 30, 2015. The allowance for loan losses represented 0.99% of total loans at June 30, 2016, compared to 1.31% at June 30, 2015. The ratio of allowance for loan losses plus discount on acquired loans to total loans was 1.85% at June 30, 2016, compared to 2.09% at June 30, 2015. The ratio of the allowance for loan losses to nonperforming loans was 76% at June 30, 2016, compared to 135% at June 30, 2015. Annualized net charge-offs as a percentage of average loans for the quarter ended June 30, 2016 was 0.03% compared to 0.08% for the quarter ended June 30, 2015. Provision for loan losses increased from $300,000 for the second quarter of 2015 to $533,000 for the second quarter of 2016. Provision for loans losses for the six months ended June 30, 2016 was $1.0 million, compared to $600,000 for the same period in 2015. The increase in the provision is attributable to loan originations and a migration of acquired loans from the purchased loan portfolio to the originated loan portfolio.
About Bear State Financial, Inc.
Bear State Financial, Inc. is the parent company for Bear State Bank. Bear State Financial, Inc. common stock is traded on the NASDAQ Global Market under the symbol BSF. For more information on Bear State Financial, please visit www.bearstatefinancial.com. Its principal subsidiary, Bear State Bank, is a community oriented financial institution providing a broad line of financial products to individuals and business customers. Bear State Bank operates 49 branches and four loan production offices throughout Arkansas, Southwest Missouri and Southeast Oklahoma.
Non-GAAP Financial Measures
This release contains certain non-GAAP financial measures in addition to results presented in accordance with accounting principles generally accepted in the United States (“GAAP”). These non-GAAP measures provide supplemental perspectives on operating results, performance trends, and financial condition. They are not a substitute for GAAP measures and they should be read and used in conjunction with the Company’s GAAP financial information. In all cases, it should be understood that non-GAAP per share measures do not depict amounts that accrue directly to the benefit of shareholders. The Company utilizes the non-GAAP measure of core earnings, which management believes is useful in evaluating operating trends, including components of core revenue and core expense. Core earnings and its components exclude amounts that the Company views as unrelated to its normalized operations. The Company also reports certain non-GAAP equity measures (including tangible stockholders’ equity, tangible book value per common share and related ratios) that exclude intangible assets from their calculation due to the importance of these non-GAAP measures to the investment community. A reconciliation of non-GAAP financial measures to GAAP measures is included in the accompanying financial tables.
Forward-Looking Statements
This press release contains statements about future events that constitute forward-looking statements within the meaning of Section 27A of the Securities Act of 1933, as amended and Section 21E of the Securities Exchange Act of 1934, as amended. Such forward-looking statements may be identified by reference to a future period or periods, or by the use of forward-looking terminology, such as “may,” “will,” “believe,” “plan,” “intend,” “anticipate,” “expect,” or similar terms or variations of those terms, or the negative of those terms. Forward-looking statements are subject to numerous risks and uncertainties, including, but not limited to, those risks previously disclosed in the Company’s filings with the SEC, general economic conditions, changes in interest rates, regulatory considerations, competition, technological developments, retention and recruitment of qualified personnel, and market acceptance of Bear State Bank’s pricing, products and services, and with respect to the loans extended by Bear State Bank and real estate owned, market prices of the property securing loans and the costs of collection and sales. The Company wishes to caution readers not to place undue reliance on any such forward-looking statements, which speak only as of the date made. The Company does not undertake and specifically declines any obligation to publicly release the result of any revisions that may be made to any forward-looking statements to reflect events or circumstances after the date of such statements or to reflect the occurrence of anticipated or unanticipated events.
|
BEAR STATE FINANCIAL, INC. | ||||||||||
|
SELECTED CONSOLIDATED FINANCIAL DATA - UNAUDITED | ||||||||||
|
(In thousands) |
|
June |
March |
December |
September |
June |
||||||||||||||||
|
2016 |
2016 |
2015 |
2015 |
2015 |
||||||||||||||||
|
Balance sheet data, at quarter end: |
||||||||||||||||||||
|
Commercial real estate - mortgage loans |
$ | 557,612 | $ | 555,264 | $ | 561,910 | $ | 401,044 | $ | 378,878 | ||||||||||
|
Consumer real estate - mortgage loans |
390,743 | 395,509 | 401,594 | 309,951 | 307,183 | |||||||||||||||
|
Farmland |
92,452 | 93,380 | 94,235 | 53,192 | 48,058 | |||||||||||||||
|
Construction and land development |
124,369 | 117,283 | 116,015 | 93,688 | 103,094 | |||||||||||||||
|
Commercial and industrial loans |
281,874 | 258,479 | 246,304 | 186,772 | 185,266 | |||||||||||||||
|
Consumer and other |
36,339 | 37,673 | 38,594 | 32,428 | 32,455 | |||||||||||||||
|
Total loans |
1,483,389 | 1,457,588 | 1,458,652 | 1,077,075 | 1,054,934 | |||||||||||||||
|
Allowance for loan losses |
(14,751 | ) | (14,866 | ) | (14,550 | ) | (13,975 | ) | (13,854 | ) | ||||||||||
|
Investment securities |
192,549 | 185,143 | 198,585 | 164,564 | 182,525 | |||||||||||||||
|
Goodwill |
40,196 | 40,196 | 40,196 | 25,717 | 25,717 | |||||||||||||||
|
Core deposit intangible, net |
10,863 | 11,119 | 11,374 | 6,869 | 7,026 | |||||||||||||||
|
Total assets |
1,990,715 | 1,922,301 | 1,920,216 | 1,470,725 | 1,451,281 | |||||||||||||||
|
Noninterest-bearing deposits |
255,648 | 216,173 | 234,879 | 173,525 | 168,225 | |||||||||||||||
|
Total deposits |
1,641,250 | 1,610,718 | 1,607,683 | 1,209,176 | 1,208,800 | |||||||||||||||
|
Short term borrowings |
14,964 | 8,990 | 12,075 | 10,366 | 3,530 | |||||||||||||||
|
FHLB advances |
75,282 | 50,178 | 53,518 | 49,457 | 41,591 | |||||||||||||||
|
Other borrowings |
22,900 | 22,681 | 18,862 | 18,843 | 18,450 | |||||||||||||||
|
Total stockholders' equity |
228,534 | 223,798 | 223,157 | 178,670 | 174,831 | |||||||||||||||
|
Balance sheet data, quarterly averages: |
||||||||||||||||||||
|
Total loans |
$ | 1,492,504 | $ | 1,461,091 | $ | 1,445,357 | $ | 1,077,500 | $ | 1,059,235 | ||||||||||
|
Investment securities |
188,808 | 206,258 | 209,629 | 180,831 | 189,285 | |||||||||||||||
|
Total earning assets |
1,724,381 | 1,702,917 | 1,699,227 | 1,294,619 | 1,294,523 | |||||||||||||||
|
Goodwill |
40,196 | 40,196 | 40,216 | 25,717 | 25,717 | |||||||||||||||
|
Core deposit intangible, net |
11,030 | 11,284 | 11,549 | 6,972 | 7,127 | |||||||||||||||
|
Total assets |
1,937,722 | 1,920,833 | 1,920,617 | 1,466,342 | 1,468,521 | |||||||||||||||
|
Noninterest-bearing deposits |
215,766 | 221,909 | 234,206 | 176,219 | 173,248 | |||||||||||||||
|
Interest-bearing deposits |
1,394,262 | 1,369,759 | 1,364,403 | 1,036,330 | 1,055,200 | |||||||||||||||
|
Total deposits |
1,610,028 | 1,591,668 | 1,598,609 | 1,212,549 | 1,228,448 | |||||||||||||||
|
Short term borrowings |
11,991 | 12,163 | 26,872 | 6,166 | 4,481 | |||||||||||||||
|
FHLB advances |
64,494 | 64,488 | 47,127 | 47,614 | 38,625 | |||||||||||||||
|
Other borrowings |
22,982 | 25,353 | 18,983 | 18,641 | 18,564 | |||||||||||||||
|
Total stockholders' equity |
226,587 | 224,416 | 223,083 | 177,824 | 175,025 | |||||||||||||||
| Statement of operations data for the three months ended: | ||||||||||||||||||||
|
Interest income |
$ | 18,535 | $ | 18,790 | $ | 19,468 | $ | 13,749 | $ | 13,523 | ||||||||||
|
Interest expense |
1,935 | 1,864 | 1,744 | 1,529 | 1,563 | |||||||||||||||
|
Net interest income |
16,660 | 16,926 | 17,724 | 12,220 | 11,960 | |||||||||||||||
|
Provision for loan losses |
533 | 489 | 866 | 331 | 300 | |||||||||||||||
|
Net interest income after provision for loan losses |
16,067 | 16,437 | 16,858 | 11,889 | 11,660 | |||||||||||||||
|
Noninterest income |
4,311 | 3,673 | 3,721 | 3,318 | 3,397 | |||||||||||||||
|
Noninterest expense |
14,989 | 15,331 | 17,044 | 10,465 | 11,273 | |||||||||||||||
|
Income before taxes |
5,389 | 4,779 | 3,535 | 4,742 | 3,784 | |||||||||||||||
|
Income tax provision (benefit) |
847 | 1,436 | 972 | 1,529 | 1,253 | |||||||||||||||
|
Net income |
$ | 4,542 | $ | 3,343 | $ | 2,563 | $ | 3,213 | $ | 2,531 | ||||||||||
|
BEAR STATE FINANCIAL, INC. |
|
SELECTED CONSOLIDATED FINANCIAL DATA - UNAUDITED |
|
June |
March |
December |
September |
June |
||||||||||||||||
|
2016 |
2016 |
2015 |
2015 |
2015 |
||||||||||||||||
|
Common stock data: |
||||||||||||||||||||
|
Net income per share, diluted |
$ | 0.12 | $ | 0.09 | $ | 0.07 | $ | 0.10 | $ | 0.08 | ||||||||||
|
Core earnings per share, diluted |
$ | 0.11 | $ | 0.10 | $ | 0.11 | $ | 0.10 | $ | 0.09 | ||||||||||
|
Book value per share |
$ | 6.08 | $ | 5.96 | $ | 5.87 | $ | 5.36 | $ | 5.24 | ||||||||||
|
Tangible book value per share |
$ | 4.72 | $ | 4.59 | $ | 4.52 | $ | 4.38 | $ | 4.26 | ||||||||||
|
Diluted weighted average shares outstanding |
37,772,959 | 37,918,188 | 38,173,234 | 33,497,298 | 33,521,490 | |||||||||||||||
|
End of period shares outstanding |
37,589,543 | 37,560,031 | 37,987,722 | 33,349,512 | 33,375,753 | |||||||||||||||
|
Profitability and performance ratios: |
||||||||||||||||||||
|
Return on average assets |
0.94 | % | 0.71 | % | 0.53 | % | 0.87 | % | 0.69 | % | ||||||||||
|
Core return on average assets |
0.84 | % | 0.77 | % | 0.86 | % | 0.90 | % | 0.79 | % | ||||||||||
|
Return on average equity |
8.04 | % | 6.04 | % | 4.56 | % | 7.17 | % | 5.80 | % | ||||||||||
|
Core return on average equity |
7.23 | % | 6.61 | % | 7.41 | % | 7.41 | % | 6.65 | % | ||||||||||
|
Core return on average tangible equity |
9.34 | % | 8.58 | % | 9.65 | % | 9.07 | % | 8.18 | % | ||||||||||
|
Net interest margin |
3.86 | % | 4.03 | % | 4.14 | % | 3.74 | % | 3.71 | % | ||||||||||
|
Noninterest income to total revenue |
20.62 | % | 17.83 | % | 17.35 | % | 21.35 | % | 22.12 | % | ||||||||||
|
Noninterest income to average assets |
0.89 | % | 0.78 | % | 0.77 | % | 0.90 | % | 0.93 | % | ||||||||||
|
Noninterest expense to average assets |
3.10 | % | 3.24 | % | 3.52 | % | 2.83 | % | 3.08 | % | ||||||||||
|
Efficiency ratio(1) |
68.29 | % | 71.96 | % | 67.66 | % | 66.24 | % | 69.51 | % | ||||||||||
|
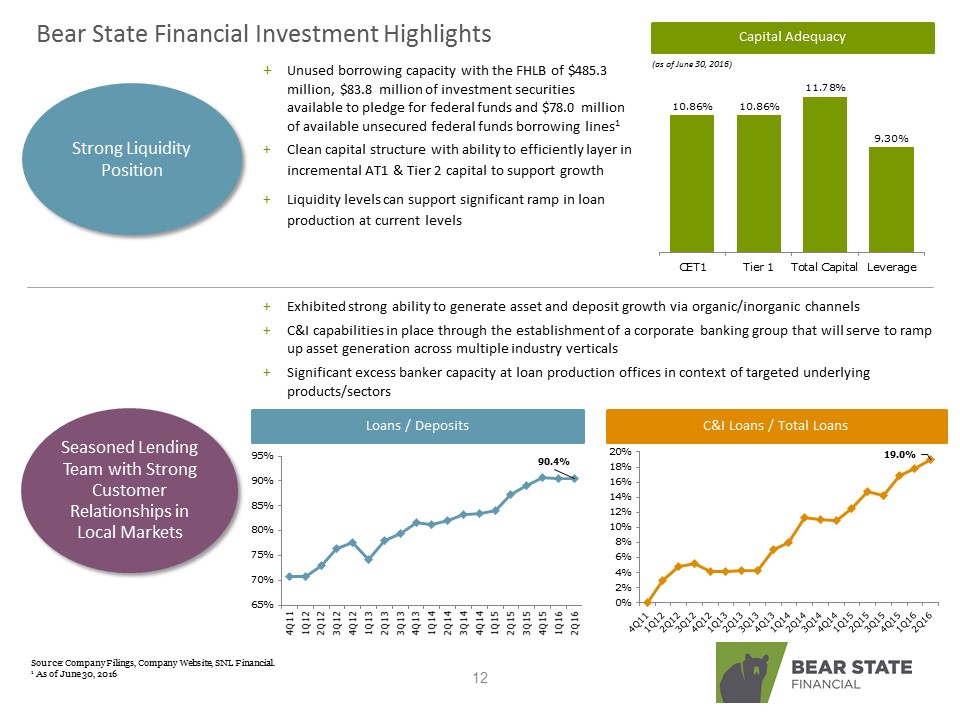
Average loans to average deposits |
92.70 | % | 91.80 | % | 90.41 | % | 88.86 | % | 86.23 | % | ||||||||||
|
Securities to total assets |
9.67 | % | 9.63 | % | 10.34 | % | 11.19 | % | 12.58 | % | ||||||||||
|
Asset quality ratios: |
||||||||||||||||||||
|
Allowance for loan losses to total loans |
0.99 | % | 1.02 | % | 1.00 | % | 1.30 | % | 1.31 | % | ||||||||||
|
Allowance for loan losses to non-performing loans |
76.42 | % | 72.84 | % | 75.23 | % | 83.18 | % | 134.94 | % | ||||||||||
|
Nonperforming loans to total loans |
1.30 | % | 1.40 | % | 1.36 | % | 1.56 | % | 0.97 | % | ||||||||||
|
Nonperforming assets to total assets |
1.08 | % | 1.23 | % | 1.22 | % | 1.30 | % | 0.94 | % | ||||||||||
|
Annualized net charge offs to average total loans |
0.03 | % | 0.04 | % | 0.08 | % | 0.08 | % | 0.08 | % | ||||||||||
|
Regulatory capital ratios: |
||||||||||||||||||||
|
Tier 1 leverage ratio |
9.30 | % | 9.15 | % | 9.15 | % | 9.83 | % | 9.54 | % | ||||||||||
|
Common equity tier 1 capital ratio |
10.86 | % | 10.63 | % | 10.62 | % | 11.77 | % | 11.59 | % | ||||||||||
|
Tier 1 capital to risk weighted assets |
10.86 | % | 10.63 | % | 10.62 | % | 11.77 | % | 11.59 | % | ||||||||||
|
Total capital to risk weighted assets |
11.78 | % | 11.55 | % | 11.52 | % | 12.94 | % | 12.77 | % | ||||||||||
|
(1) Efficiency ratio is a non-GAAP ratio that is calculated by dividing core noninterest expense by the sum of net interest income and core noninterest income. Other companies may define and calculate this data differently. |
|
BEAR STATE FINANCIAL, INC. | |||
|
CONDENSED CONSOLIDATED STATEMENTS OF FINANCIAL CONDITION | |||
|
(In thousands, except share data) | |||
|
(Unaudited) |
|
June 30, 2016 |
December 31, 2015 |
|||||||
|
ASSETS |
||||||||
|
Cash and cash equivalents |
$ | 99,872 | $ | 52,131 | ||||
|
Interest-bearing time deposits in banks |
6,211 | 10,930 | ||||||
|
Federal funds sold |
-- | 18 | ||||||
|
Investment securities held to maturity |
1,038 | -- | ||||||
|
Investment securities available for sale |
191,511 | 198,585 | ||||||
|
Other investment securities, at cost |
11,687 | 9,563 | ||||||
|
Loans receivable, net of allowance of $14,751 and $14,550, respectively |
1,468,638 | 1,444,102 | ||||||
|
Loans held for sale |
15,168 | 7,326 | ||||||
|
Accrued interest receivable |
6,166 | 6,157 | ||||||
|
Real estate owned - net |
2,190 | 3,642 | ||||||
|
Office properties and equipment - net |
62,810 | 63,641 | ||||||
|
Cash surrender value of life insurance |
56,435 | 52,602 | ||||||
|
Goodwill |
40,196 | 40,196 | ||||||
|
Core deposit intangible - net |
10,863 | 11,374 | ||||||
|
Deferred tax asset, net |
13,829 | 16,713 | ||||||
|
Prepaid expenses and other assets |
4,101 | 3,236 | ||||||
|
TOTAL |
$ | 1,990,715 | $ | 1,920,216 | ||||
|
LIABILITIES AND STOCKHOLDERS’ EQUITY |
||||||||
|
LIABILITIES: |
||||||||
|
Noninterest bearing deposits |
$ | 255,648 | $ | 234,879 | ||||
|
Interest bearing deposits |
1,385,602 | 1,372,804 | ||||||
|
Total deposits |
1,641,250 | 1,607,683 | ||||||
|
Short term borrowings |
14,964 | 12,075 | ||||||
|
Other borrowings |
98,182 | 72,380 | ||||||
|
Other liabilities |
7,785 | 4,921 | ||||||
|
Total liabilities |
1,762,181 | 1,697,059 | ||||||
|
STOCKHOLDERS’ EQUITY: |
||||||||
|
Preferred stock, $0.01 par value—5,000,000 shares authorized; none issued at June 30, 2016 or December 31, 2015 |
-- | -- | ||||||
|
Common stock, $0.01 par value—100,000,000 shares authorized; 37,589,543 and 37,987,722 shares issued and outstanding at June 30, 2016 and December 31, 2015, respectively |
376 | 380 | ||||||
|
Additional paid-in capital |
208,829 | 211,817 | ||||||
|
Accumulated other comprehensive income |
1,809 | 386 | ||||||
|
Retained earnings |
17,520 | 10,574 | ||||||
|
Total stockholders’ equity |
228,534 | 223,157 | ||||||
|
TOTAL |
$ | 1,990,715 | $ | 1,920,216 | ||||
|
BEAR STATE FINANCIAL, INC. | ||||||||
|
CONDENSED CONSOLIDATED STATEMENTS OF INCOME | ||||||||
|
(In thousands, except earnings per share) | ||||||||
|
(Unaudited) |
|
Three Months Ended |
Six Months Ended |
|||||||||||||||
|
June 30, |
June 30, |
June 30, |
June 30, |
|||||||||||||
|
2016 |
2015 |
2016 |
2015 |
|||||||||||||
|
INTEREST INCOME: |
||||||||||||||||
|
Loans receivable |
$ | 17,519 | $ | 12,576 | $ | 35,205 | $ | 25,780 | ||||||||
|
Investment securities: |
||||||||||||||||
|
Taxable |
474 | 345 | 1,010 | 643 | ||||||||||||
|
Nontaxable |
462 | 522 | 947 | 1,030 | ||||||||||||
|
Other |
80 | 80 | 164 | 176 | ||||||||||||
|
Total interest income |
18,535 | 13,523 | 37,326 | 27,629 | ||||||||||||
|
INTEREST EXPENSE: |
||||||||||||||||
|
Deposits |
1,608 | 1,284 | 3,123 | 2,588 | ||||||||||||
|
Other borrowings |
327 | 279 | 675 | 503 | ||||||||||||
|
Total interest expense |
1,935 | 1,563 | 3,798 | 3,091 | ||||||||||||
|
NET INTEREST INCOME |
16,600 | 11,960 | 33,528 | 24,538 | ||||||||||||
|
PROVISION FOR LOAN LOSSES |
533 | 300 | 1,022 | 600 | ||||||||||||
|
NET INTEREST INCOME AFTER PROVISION FOR LOAN LOSSES |
16,067 | 11,660 | 32,506 | 23,938 | ||||||||||||
|
NONINTEREST INCOME: |
||||||||||||||||
|
Net gain (loss) on sales of investment securities |
-- | -- | (2 | ) | 88 | |||||||||||
|
Deposit fee income |
2,236 | 1,904 | 4,387 | 3,643 | ||||||||||||
|
Earnings on life insurance policies |
421 | 372 | 833 | 738 | ||||||||||||
|
Gain on sale of loans |
1,291 | 890 | 2,086 | 1,527 | ||||||||||||
|
Other |
363 | 231 | 682 | 512 | ||||||||||||
|
Total noninterest income |
4,311 | 3,397 | 7,986 | 6,508 | ||||||||||||
|
NONINTEREST EXPENSES: |
||||||||||||||||
|
Salaries and employee benefits |
7,857 | 5,545 | 16,107 | 12,004 | ||||||||||||
|
Net occupancy expense |
1,898 | 1,363 | 3,825 | 2,798 | ||||||||||||
|
Real estate owned, net |
(27 | ) | (127 | ) | 2 | (90 | ) | |||||||||
|
Amortization of intangible assets |
255 | 156 | 511 | 312 | ||||||||||||
|
Data processing |
1,405 | 1,542 | 2,839 | 2,711 | ||||||||||||
|
Professional fees |
525 | 380 | 1,133 | 1,130 | ||||||||||||
|
FDIC insurance |
338 | 216 | 646 | 437 | ||||||||||||
|
Advertising and public relations |
369 | 574 | 865 | 1,253 | ||||||||||||
|
Postage and supplies |
325 | 331 | 616 | 566 | ||||||||||||
|
Other |
2,044 | 1,293 | 3,779 | 2,387 | ||||||||||||
|
Total noninterest expenses |
14,989 | 11,273 | 30,323 | 23,508 | ||||||||||||
|
INCOME BEFORE INCOME TAXES |
5,389 | 3,784 | 10,169 | 6,938 | ||||||||||||
|
INCOME TAX PROVISION |
847 | 1,253 | 2,284 | 2,138 | ||||||||||||
|
NET INCOME |
$ | 4,542 | $ | 2,531 | $ | 7,885 | $ | 4,800 | ||||||||
|
Basic earnings per common share |
$ | 0.12 | $ | 0.08 | $ | 0.21 | $ | 0.14 | ||||||||
|
Diluted earnings per common share |
$ | 0.12 | $ | 0.08 | $ | 0.21 | $ | 0.14 | ||||||||
|
BEAR STATE FINANCIAL, INC. |
|
AVERAGE CONSOLIDATED BALANCE SHEETS and NET INTEREST ANALYSIS - UNAUDITED |
|
(In thousands) |
|
Three Months Ended June 30, |
||||||||||||||||||||||||
|
2016 |
2015 |
|||||||||||||||||||||||
|
Average Balance |
Interest |
Average Yield/ Cost |
Average Balance |
Interest |
Average Yield/ Cost |
|||||||||||||||||||
|
(Dollars in Thousands) |
||||||||||||||||||||||||
|
Interest-earning assets: |
||||||||||||||||||||||||
|
Loans receivable(1) |
$ | 1,492,504 | $ | 17,519 | 4.71 | % | $ | 1,059,235 | $ | 12,576 | 4.76 | % | ||||||||||||
|
Investment securities(2) |
188,808 | 936 | 1.99 | 189,285 | 867 | 1.84 | ||||||||||||||||||
|
Other interest-earning assets |
43,069 | 80 | 0.75 | 46,003 | 80 | 0.70 | ||||||||||||||||||
|
Total interest-earning assets |
1,724,381 | 18,535 | 4.31 | 1,294,523 | 13,523 | 4.19 | ||||||||||||||||||
|
Noninterest-earning assets |
213,341 | 173,998 | ||||||||||||||||||||||
|
Total assets |
$ | 1,937,722 | $ | 1,468,521 | ||||||||||||||||||||
|
Interest-bearing liabilities: |
||||||||||||||||||||||||
|
Deposits |
$ | 1,394,262 | 1,608 | 0.46 | $ | 1,055,200 | 1,284 | 0.49 | ||||||||||||||||
|
Other borrowings |
99,467 | 327 | 1.32 | 61,670 | 279 | 1.81 | ||||||||||||||||||
|
Total interest-bearing liabilities |
1,493,729 | 1,935 | 0.52 | 1,116,870 | 1,563 | 0.56 | ||||||||||||||||||
|
Noninterest-bearing deposits |
215,766 | 173,248 | ||||||||||||||||||||||
|
Noninterest-bearing liabilities |
1,640 | 3,378 | ||||||||||||||||||||||
|
Total liabilities |
1,711,135 | 1,293,496 | ||||||||||||||||||||||
|
Stockholders' equity |
226,587 | 175,025 | ||||||||||||||||||||||
|
Total liabilities and stockholders' equity |
$ | 1,937,722 | $ | 1,468,521 | ||||||||||||||||||||
|
Net interest income |
$ | 16,600 | $ | 11,960 | ||||||||||||||||||||
|
Net earning assets |
$ | 230,652 | $ | 177,653 | ||||||||||||||||||||
|
Interest rate spread |
3.79 | % | 3.63 | % | ||||||||||||||||||||
|
Net interest margin |
3.86 | % | 3.71 | % | ||||||||||||||||||||
|
Ratio of interest-earning assets to Interest-bearing liabilities |
115.44 | % | 115.91 | % | ||||||||||||||||||||
|
Six Months Ended June 30, |
||||||||||||||||||||||||
|
2016 |
2015 |
|||||||||||||||||||||||
|
Average Balance |
Interest |
Average Yield/ Cost |
Average Balance |
Interest |
Average Yield/ Cost |
|||||||||||||||||||
|
(Dollars in Thousands) |
||||||||||||||||||||||||
|
Interest-earning assets: |
||||||||||||||||||||||||
|
Loans receivable(1) |
$ | 1,476,798 | $ | 35,205 | 4.81 | % | $ | 1,054,953 | $ | 25,780 | 4.93 | % | ||||||||||||
|
Investment securities(2) |
197,533 | 1,957 | 2.00 | 186,587 | 1,673 | 1.81 | ||||||||||||||||||
|
Other interest-earning assets |
39,319 | 164 | 0.84 | 70,527 | 176 | 0.50 | ||||||||||||||||||
|
Total interest-earning assets |
1,713,650 | 37,326 | 4.39 | 1,312,067 | 27,629 | 4.25 | ||||||||||||||||||
|
Noninterest-earning assets |
215,423 | 174,019 | ||||||||||||||||||||||
|
Total assets |
$ | 1,929,073 | $ | 1,486,086 | ||||||||||||||||||||
|
Interest-bearing liabilities: |
||||||||||||||||||||||||
|
Deposits |
$ | 1,382,011 | 3,123 | 0.46 | $ | 1,063,604 | 2,588 | 0.49 | ||||||||||||||||
|
Other borrowings |
100,736 | 675 | 1.35 | 71,077 | 503 | 1.43 | ||||||||||||||||||
|
Total interest-bearing liabilities |
1,482,747 | 3,798 | 0.52 | 1,134,681 | 3,091 | 0.55 | ||||||||||||||||||
|
Noninterest-bearing deposits |
218,837 | 174,423 | ||||||||||||||||||||||
|
Noninterest-bearing liabilities |
2,007 | 3,030 | ||||||||||||||||||||||
|
Total liabilities |
1,703,591 | 1,312,134 | ||||||||||||||||||||||
|
Stockholders' equity |
225,482 | 173,952 | ||||||||||||||||||||||
|
Total liabilities and stockholders' equity |
$ | 1,929,073 | $ | 1,486,086 | ||||||||||||||||||||
|
Net interest income |
$ | 33,528 | $ | 24,538 | ||||||||||||||||||||
|
Net earning assets |
$ | 230,903 | $ | 177,386 | ||||||||||||||||||||
|
Interest rate spread |
3.87 | % | 3.70 | % | ||||||||||||||||||||
|
Net interest margin |
3.95 | % | 3.77 | % | ||||||||||||||||||||
|
Ratio of interest-earning assets to Interest-bearing liabilities |
115.57 | % | 115.63 | % | ||||||||||||||||||||
(1) Includes nonaccrual loans.
(2) Includes FHLB and FRB stock.
|
BEAR STATE FINANCIAL, INC. |
|
ASSET QUALITY ANALYSIS - UNAUDITED |
|
(In thousands) |
|
June 30, 2016 |
December 31, 2015 |
|||||||||||||||||||
|
Net (2) |
% Total Assets |
Net (2) |
% Total Assets |
Increase (Decrease) |
||||||||||||||||
|
Nonaccrual Loans: |
||||||||||||||||||||
|
One- to four-family residential |
$ | 7,783 | 0.40 | % | $ | 6,455 | 0.34 | % | $ | 1,328 | ||||||||||
|
Multifamily |
149 | 0.01 | % | 230 | 0.01 | % | (81 | ) | ||||||||||||
|
Nonfarm nonresidential |
5,619 | 0.28 | % | 6,638 | 0.35 | % | (1,019 | ) | ||||||||||||
|
Farmland |
815 | 0.04 | % | 973 | 0.05 | % | (158 | ) | ||||||||||||
|
Construction and land development |
501 | 0.03 | % | 622 | 0.03 | % | (121 | ) | ||||||||||||
|
Commercial |
4,196 | 0.20 | % | 4,235 | 0.22 | % | (39 | ) | ||||||||||||
|
Consumer |
239 | 0.01 | % | 187 | 0.01 | % | 52 | |||||||||||||
|
Total nonaccrual loans |
19,302 | 0.97 | % | 19,340 | 1.01 | % | (38 | ) | ||||||||||||
|
Accruing loans 90 days or more past due |
-- | -- | 451 | 0.02 | % | (451 | ) | |||||||||||||
|
Real estate owned |
2,190 | 0.11 | % | 3,642 | 0.19 | % | (1,452 | ) | ||||||||||||
|
Total nonperforming assets |
21,492 | 1.08 | % | 23,433 | 1.22 | % | (1,941 | ) | ||||||||||||
|
Performing restructured loans |
279 | 0.01 | % | 284 | 0.01 | % | (5 | ) | ||||||||||||
|
Total nonperforming assets and performing restructured loans (1) |
$ | 21,771 | 1.09 | % | $ | 23,717 | 1.23 | % | $ | (1,946 | ) | |||||||||
|
(1) |
The table does not include substandard loans which were judged not to be impaired totaling $30.2 million at June 30, 2016 and December 31, 2015 or acquired ASC 310-30 purchased credit impaired loans which are considered performing at June 30, 2016. |
|
(2) |
Loan balances are presented net of undisbursed loan funds, partial charge-offs and interest payments recorded as reductions in principal balances for financial reporting purposes. |
|
BEAR STATE FINANCIAL, INC. |
|
CALCULATION OF RETURN ON AVERAGE TANGIBLE COMMON STOCKHOLDERS' EQUITY - UNAUDITED |
|
(In thousands) |
|
For the Quarter Ending |
||||||||||||||||||||
|
6/30/2016 |
3/31/2016 |
12/31/2015 |
9/30/2015 |
6/30/2015 |
||||||||||||||||
|
Net income available to common stockholders |
$ | 4,542 | $ | 3,343 | $ | 2,563 | $ | 3,213 | $ | 2,531 | ||||||||||
|
Average common stockholders' equity |
226,587 | 224,416 | 223,083 | 177,824 | 175,025 | |||||||||||||||
|
Less Average Intangible Assets: |
||||||||||||||||||||
|
Goodwill |
(40,196 | ) | (40,196 | ) | (40,216 | ) | (25,717 | ) | (25,717 | ) | ||||||||||
|
Core deposit intangible, net of accumulated amortization |
(11,030 | ) | (11,284 | ) | (11,549 | ) | (6,972 | ) | (7,127 | ) | ||||||||||
|
Average tangible common stockholders' equity |
$ | 175,361 | $ | 172,936 | $ | 171,318 | $ | 145,135 | $ | 142,181 | ||||||||||
|
Annualized return on average tangible common stockholders' equity |
10.4 | % | 7.8 | % | 5.9 | % | 8.8 | % | 7.1 | % | ||||||||||
|
BEAR STATE FINANCIAL, INC. |
|
CALCULATION OF TANGIBLE BOOK VALUE PER COMMON SHARE - UNAUDITED |
|
(In thousands, except per share data) |
|
For the Quarter Ending |
||||||||||||||||||||
|
6/30/2016 |
3/31/2016 |
12/31/2015 |
9/30/2015 |
6/30/2015 |
||||||||||||||||
|
Total common stockholder's equity |
$ | 228,534 | $ | 223,798 | $ | 223,157 | $ | 178,670 | $ | 174,831 | ||||||||||
|
Less intangible assets: |
||||||||||||||||||||
|
Goodwill |
(40,196 | ) | (40,196 | ) | (40,196 | ) | (25,717 | ) | (25,717 | ) | ||||||||||
|
Core deposit intangible, net of accumulated amortization |
(10,863 | ) | (11,119 | ) | (11,374 | ) | (6,869 | ) | (7,026 | ) | ||||||||||
|
Total intangible assets |
(51,059 | ) | (51,315 | ) | (51,570 | ) | (32,586 | ) | (32,743 | ) | ||||||||||
|
Total tangible common stockholder's equity |
$ | 177,475 | $ | 172,483 | $ | 171,587 | $ | 146,084 | $ | 142,088 | ||||||||||
|
Common Shares Outstanding |
37,590 | 37,560 | 37,988 | 33,350 | 33,376 | |||||||||||||||
|
Tangible book value per common share |
$ | 4.72 | $ | 4.59 | $ | 4.52 | $ | 4.38 | $ | 4.26 | ||||||||||
|
BEAR STATE FINANCIAL, INC. | |||||||||||
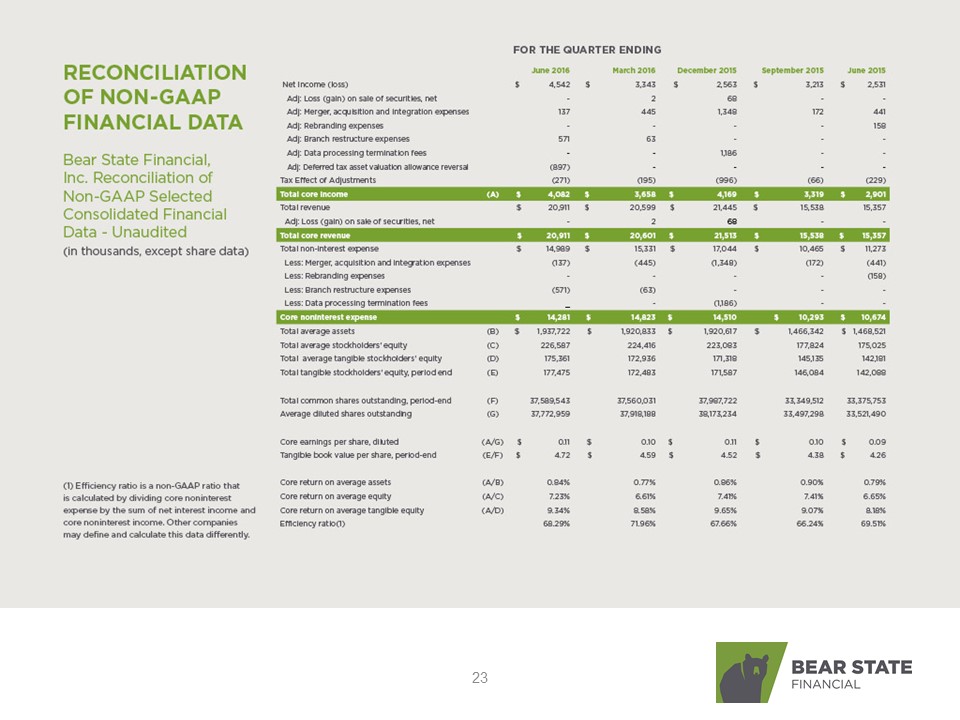
|
RECONCILIATION OF NON-GAAP SELECTED CONSOLIDATED FINANCIAL DATA - UNAUDITED | |||||||||||
|
(In thousands, except share data) |
|
For the Quarter Ending |
|||||||||||||||||||||
|
June |
March |
December |
September |
June |
|||||||||||||||||
|
2016 |
2016 |
2015 |
2015 |
2015 |
|||||||||||||||||
|
Net income |
$ | 4,542 | $ | 3,343 | $ | 2,563 | $ | 3,213 | $ | 2,531 | |||||||||||
|
Adj: Loss (gain) on sale of securities, net |
-- | 2 | 68 | -- | -- | ||||||||||||||||
|
Adj: Merger, acquisition and integration expenses |
137 | 445 | 1,348 | 172 | 441 | ||||||||||||||||
|
Adj: Rebranding expenses |
-- | -- | -- | -- | 158 | ||||||||||||||||
|
Adj: Branch restructure expenses |
571 | 63 | -- | -- | -- | ||||||||||||||||
|
Adj: Data processing termination fees |
-- | -- | 1,186 | -- | -- | ||||||||||||||||
|
Adj: Deferred tax asset valuation allowance reversal |
(897 | ) | -- | -- | -- | -- | |||||||||||||||
|
Tax effect of adjustments |
(271 | ) | (195 | ) | (996 | ) | (66 | ) | (229 | ) | |||||||||||
|
Total core income |
(A) |
$ | 4,082 | $ | 3,658 | $ | 4,169 | $ | 3,319 | $ | 2,901 | ||||||||||
|
Total revenue |
$ | 20,911 | $ | 20,599 | $ | 21,445 | $ | 15,538 | $ | 15,357 | |||||||||||
|
Adj: Loss (gain) on sale of securities, net |
-- | 2 | 68 | -- | -- | ||||||||||||||||
|
Total core revenue |
$ | 20,911 | $ | 20,601 | $ | 21,513 | $ | 15,538 | $ | 15,357 | |||||||||||
|
Total non-interest expense |
$ | 14,989 | $ | 15,331 | $ | 17,044 | $ | 10,465 | $ | 11,273 | |||||||||||
|
Adj: Merger, acquisition and integration expenses |
(137 | ) | (445 | ) | (1,348 | ) | (172 | ) | (441 | ) | |||||||||||
|
Adj: Rebranding expenses |
-- | -- | -- | -- | (158 | ) | |||||||||||||||
|
Adj: Branch restructure expenses |
(571 | ) | (63 | ) | -- | -- | -- | ||||||||||||||
|
Adj: Data processing termination fees |
-- | -- | (1,186 | ) | -- | -- | |||||||||||||||
|
Total core noninterest expense |
$ | 14,281 | $ | 14,823 | $ | 14,510 | $ | 10,293 | $ | 10,674 | |||||||||||
|
Total average assets |
(B) |
$ | 1,937,722 | $ | 1,920,833 | $ | 1,920,617 | $ | 1,466,342 | $ | 1,468,521 | ||||||||||
|
Total average stockholders' equity |
(C) |
226,587 | 224,416 | 223,083 | 177,824 | 175,025 | |||||||||||||||
|
Total average tangible stockholders' equity |
(D) |
175,361 | 172,936 | 171,318 | 145,135 | 142,181 | |||||||||||||||
|
Total tangible stockholders' equity, period end |
(E) |
177,475 | 172,483 | 171,587 | 146,084 | 142,088 | |||||||||||||||
|
Total common shares outstanding, period-end |
(F) |
37,589,543 | 37,560,031 | 37,987,722 | 33,349,512 | 33,375,753 | |||||||||||||||
|
Average diluted shares outstanding |
(G) |
37,772,959 | 37,918,188 | 38,173,234 | 33,497,298 | 33,521,490 | |||||||||||||||
|
Core earnings per share, diluted |
(A/G) |
$ | 0.11 | $ | 0.10 | $ | 0.11 | $ | 0.10 | $ | 0.09 | ||||||||||
|
Tangible book value per share, period-end |
(E/F) |
$ | 4.72 | $ | 4.59 | $ | 4.52 | $ | 4.38 | $ | 4.26 | ||||||||||
|
Core return on average assets |
(A/B) |
0.84 | % | 0.77 | % | 0.86 | % | 0.90 | % | 0.79 | % | ||||||||||
|
Core return on average equity |
(A/C) |
7.23 | % | 6.61 | % | 7.41 | % | 7.41 | % | 6.65 | % | ||||||||||
|
Core return on average tangible equity |
(A/D) |
9.34 | % | 8.58 | % | 9.65 | % | 9.07 | % | 8.18 | % | ||||||||||
|
Efficiency ratio(1) |
68.29 | % | 71.96 | % | 67.66 | % | 66.24 | % | 69.51 | % | |||||||||||
|
(1) Efficiency ratio is a non-GAAP ratio that is calculated by dividing core noninterest expense by the sum of net interest income and core noninterest income. Other companies may define and calculate this data differently. |
|||||||||||||||||||||
14