Attached files
| file | filename |
|---|---|
| EX-32.2 - EXHIBIT 32.2 - BEAR STATE FINANCIAL, INC. | ex_107536.htm |
| EX-32.1 - EXHIBIT 32.1 - BEAR STATE FINANCIAL, INC. | ex_107535.htm |
| EX-31.2 - EXHIBIT 31.2 - BEAR STATE FINANCIAL, INC. | ex_107534.htm |
| EX-31.1 - EXHIBIT 31.1 - BEAR STATE FINANCIAL, INC. | ex_107533.htm |
| EX-23.0 - EXHIBIT 23.0 - BEAR STATE FINANCIAL, INC. | ex_107532.htm |
| EX-21.0 - EXHIBIT 21.0 - BEAR STATE FINANCIAL, INC. | ex_107531.htm |
UNITED STATES
SECURITIES AND EXCHANGE COMMISSION
Washington, D.C. 20549
FORM 10-K
[X] ANNUAL REPORT PURSUANT TO SECTION 13 OR 15(d) OF THE SECURITIES EXCHANGE ACT OF 1934
For the fiscal year ended December 31, 2017
OR
[ ] TRANSITION REPORT PURSUANT TO SECTION 13 OR 15(d) OF THE SECURITIES EXCHANGE ACT OF 1934
For the transition period from __________ to _______________
Commission File No.: 0-28312
Bear State Financial, Inc.
(Exact name of registrant as specified in its charter)
| Arkansas | 71-0785261 | |||
| (State or other jurisdiction | (I.R.S. Employer | |||
| of incorporation or organization) | Identification Number) | |||
| 900 South Shackleford Rd, Suite 401 | ||||
| Little Rock, Arkansas | 72211 | |||
| (Address of principal executive offices) | (Zip Code) |
Registrant's telephone number, including area code: (501) 975-6033
Securities registered pursuant to Section 12(b) of the Act:
| Common Stock (par value $.01 per share) | The Nasdaq Stock Market LLC | |||
| (Title of Class) | (Exchange on which registered) |
Securities registered pursuant to Section 12(g) of the Act:
None
Indicate by check mark if the registrant is a well-known seasoned issuer, as defined in Rule 405 of the Securities Act. Yes ☐ No ☒
Indicate by check mark if the registrant is not required to file reports pursuant to Section 13 or Section 15(d) of the Act. Yes ☐ No ☒
Indicate by check mark whether the registrant (1) has filed all reports required to be filed by Section 13 or 15(d) of the Securities Exchange Act of 1934 during the preceding 12 months (or for such shorter period that the Registrant was required to file such reports), and (2) has been subject to such filing requirements for the past 90 days. Yes ☒ No ☐
Indicate by check mark whether the registrant has submitted electronically and posted on its corporate Web site, if any, every Interactive Data File required to be submitted and posted pursuant to Rule 405 of Regulation S-T (§232.405 of this chapter) during the preceding 12 months (or for such shorter period that the registrant was required to submit and post such files). Yes ☒ No ☐
Indicate by check mark if disclosure of delinquent filers pursuant to Item 405 of Regulation S-K (§ 229.405 of this chapter) is not contained herein, and will not be contained, to the best of Registrant’s knowledge, in definitive proxy or information statements incorporated by reference in Part III of this Form 10-K or any amendment to this Form 10-K. ☐
Indicate by check mark whether the registrant is a large accelerated filer, an accelerated filer, a non-accelerated filer, a smaller reporting company, or emerging growth company. See the definitions of “large accelerated filer,” “accelerated filer,” “smaller reporting company,” and “emerging growth company” in Rule 12b-2 of the Exchange Act. (Check one):
| Large Accelerated filer ☐ | Accelerated filer ☒ | Non-accelerated filer ☐ | Smaller reporting company ☐ | |
| Emerging growth company ☐ |
If an emerging growth company, indicate by check mark if the registrant has elected not to use the extended transition period for complying with any new or revised financial accounting standards provided pursuant to Section 13(a) of the Exchange Act. ☐
Indicate by check mark whether the registrant is a shell company (as defined in Rule 12b-2 of the Act). Yes ☐ No ☒
As of June 30, 2017, the aggregate value of the 20,542,518 shares of Common Stock of the Registrant issued and outstanding on such date, which excludes 17,170,653 shares held by affiliates of the Registrant, was approximately $194.3 million. This figure is based on the closing price of $9.46 per share of the Registrant’s Common Stock on June 30, 2017.
Number of shares of Common Stock outstanding as of March 1, 2018: 37,811,704
Form 10-K
For the Year Ended December 31, 2017
|
Item 1. |
2 |
|
|
Item 1A. |
15 |
|
|
Item 1B. |
24 |
|
|
Item 2. |
24 |
|
|
Item 3. |
24 |
|
|
Item 4. |
25 |
|
|
Item 5. |
25 |
|
|
Item 6. |
27 |
|
|
Item 7. |
Management’s Discussion and Analysis of Financial Condition and Results of Operations |
29 |
|
Item 7A. |
44 |
|
|
Item 8. |
46 |
|
|
Item 9. |
Changes in and Disagreements with Accountants on Accounting and Financial Disclosure |
96 |
|
Item 9A. |
96 |
|
|
Item 9B. |
96 |
|
|
Item 10. |
96 |
|
|
Item 11. |
102 |
|
|
Item 12. |
Security Ownership of Certain Beneficial Owners and Management and Related Stockholder Matters |
119 |
|
Item 13. |
Certain Relationships and Related Transactions, and Director Independence |
121 |
|
Item 14. |
122 |
|
|
Item 15. |
123 |
|
|
Item 16. |
124 |
GENERAL
Bear State Financial, Inc. Bear State Financial, Inc. (the "Company”, “we”, “us” or “our”) is an Arkansas corporation and bank holding company. The Company was originally incorporated in Texas in January 1996 under the name First Federal Bancshares of Arkansas, Inc. to serve as the unitary holding company of First Federal Bank (“First Federal”). The Company reincorporated from the State of Texas to the State of Arkansas on July 20, 2011. On June 3, 2014, the Company changed its name from First Federal Bancshares of Arkansas, Inc. to Bear State Financial, Inc. and adopted the new NASDAQ ticker symbol “BSF.” On June 13, 2014, the Company completed its acquisition of First National Security Company (“FNSC”), the parent company for First National Bank headquartered in Hot Springs, Arkansas (“First National”) and Heritage Bank, N.A. headquartered in Jonesboro, Arkansas (“Heritage Bank”). On February 13, 2015 First Federal, First National and Heritage Bank were consolidated into a single charter forming Bear State Bank, N.A (“Bear State Bank” or the “Bank”). On October 1, 2015, the Company completed its acquisition of Metropolitan National Bank (“Metropolitan”) headquartered in Springfield, Missouri.
On August 22, 2017, the Company and the Bank entered into an Agreement and Plan of Reorganization (the “Merger Agreement”) with Arvest Bank, an Arkansas banking corporation (“Arvest”), and Arvest Acquisition Sub, Inc., an Arkansas corporation and a wholly-owned subsidiary of Arvest (“Acquisition Sub”), pursuant to which Arvest will acquire the Company and Bear State Bank (the “Merger”).
Pursuant to the Merger Agreement, each share of the Company’s common stock issued and outstanding as of the effective time of the Merger will be converted into a right to receive $10.28 per share, payable in cash. The shareholders of the Company approved the Merger at a special meeting of shareholders held on November 15, 2017. The Merger is expected to close during late March or April of 2018, subject to satisfaction of customary closing conditions, including regulatory approval.
The primary asset of the Company is the capital stock of Bear State Bank. The business and management of the Company consists of the business and management of Bear State Bank. At December 31, 2017, the Company had $2.2 billion in total assets, $1.9 billion in total liabilities and $253.2 million in stockholders' equity. The Company's principal executive office is located at 900 South Shackleford Road, Suite 401, Little Rock, Arkansas 72211, and its telephone number is (501) 975-6033.
Bear State Bank. Bear State Bank is a state chartered bank conducting business from 42 branches, three personalized technology centers equipped with interactive teller machines (“ITMs”) and two loan production offices throughout Arkansas, Missouri and Southeast Oklahoma.
Effective June 28, 2016, the Bank converted from a national bank supervised by the Office of the Comptroller of the Currency (“OCC”) to a state chartered bank jointly supervised by the Arkansas State Bank Department (“ASBD”) and the Board of Governors of the Federal Reserve Bank (“FRB”). The Bank is also regulated by the Federal Deposit Insurance Corporation (“FDIC”), the administrator of the Deposit Insurance Fund ("DIF"). The Bank’s deposits are insured by the DIF to the maximum extent permitted by law. The Bank is a member of the Federal Home Loan Bank of Dallas (the “FHLB").
The Bank is a community-oriented financial institution offering a broad line of financial products to individuals and business customers. Retail and business deposit accounts include noninterest bearing and interest bearing checking accounts, savings and money market accounts, certificates of deposit, and individual retirement accounts. Loan products offered by the Bank include residential real estate, consumer, construction, lines of credit, commercial real estate and commercial business loans. Other financial services include ITMs; automated teller machines; 24-hour telephone banking; online banking, including account access, bill payment, and e-statements; mobile banking, including remote deposit capture and funds transfer; Bounce ProtectionTM overdraft service; debit cards; and safe deposit boxes.
Business Strategy
The Bank’s main goal is to be a high-performing community bank in offering the loan and deposit services described below. Management focuses on building high-quality and profitable banking relationships and providing exceptional service to attract and retain customers; building a performance-based culture; refining and expanding the delivery of commercial banking products; expanding market share in attractive markets; rehabilitating or closing underperforming branch locations; and pursuing opportunities to acquire other financial institutions or branches and to develop or acquire businesses that generate non-interest income.
Lending Activities
General. At December 31, 2017, the Bank’s portfolio of net loans receivable amounted to $1.7 billion or 77% of the Company's total assets. Loans collateralized by real estate comprised $1.3 billion or 77% of the Bank's total portfolio of loans receivable at December 31, 2017.
Origination, Purchase and Sale of Loans. The lending activities of the Bank are subject to the written, non-discriminatory underwriting standards and policies established by management and approved by the Bank’s Board of Directors. Loan originations are obtained from a variety of sources, including referrals, walk-in customers to the Bank’s branch locations, solicitation by loan officers, advertising and the Bank’s Internet website. From time to time, the Bank may also purchase loan participations from other financial institutions.
To minimize interest rate risk, fixed rate one- to four-family residential mortgage loans with terms of fifteen years or greater are typically sold to specific investors in the secondary mortgage market. The rights to service such loans are typically sold with the loans. This allows the Bank to provide its customers competitive long-term fixed rate mortgage products while not exposing the Bank to undue interest rate risk. These loans are originated in conformance with Fannie Mae, Freddie Mac and the specific investor’s underwriting guidelines. The Bank typically locks and confirms the purchase price of the loan on the day of the loan application, which protects the Bank from market price movements and establishes the price that the Bank will receive at the sale of the respective loan. For the years ended December 31, 2017, 2016 and 2015, the Bank’s secondary market loan sales amounted to $124.3 million, $162.1 million and $110.4 million, respectively. The Bank is not involved in loan hedging or other speculative mortgage loan origination activities.
In addition to sales of loans in the secondary market, the Bank periodically sells loans or loan participations to other banks in order to comply with the Bank’s loans to one borrower limit or for credit diversification purposes. In such situations, the loans are typically sold with servicing retained. At December 31, 2017 and 2016, the balances of loans sold with servicing retained were approximately $3.8 million and $14.7 million, respectively. Loan servicing fee income for the years ended December 31, 2017, 2016 and 2015 was not material.
One- to Four-Family Residential Real Estate Loans. At December 31, 2017, $391.2 million or 23.4% of the Bank’s total loan portfolio consisted of one- to four-family residential real estate loans. Of the $391.2 million of such loans at December 31, 2017, $121.8 million or 31.1% had adjustable rates of interest and $269.4 million or 68.9% had fixed rates of interest. At December 31, 2017, the Bank had $7.1 million of nonaccrual one- to four-family residential real estate loans. See “Nonperforming Assets” in Item 7, Management’s Discussion and Analysis of Financial Condition and Results of Operations.
The Bank currently originates both fixed rate and adjustable rate one- to four-family residential mortgage loans to be sold into the secondary market. Loans originated to be held in the Bank’s loan portfolio are typically originated as fixed or adjustable rate simple interest loans with a maturity of up to fifteen years and an amortization period generally not more than fifteen years. The Bank's residential loans typically include "due on sale" clauses.
As of December 31, 2017, the Bank had a loan portfolio of adjustable rate mortgage loans (“ARMs”) totaling $121.8 million as described above. These ARMs provide for an interest rate that adjusts periodically in accordance with a designated index plus a margin. The Bank's adjustable rate loans are assumable (generally without release of the initial borrower), do not contain prepayment penalties and do not provide for negative amortization and typically contain "due on sale" clauses. Adjustable rate loans decrease the risks associated with changes in interest rates but involve other risks, primarily because as interest rates rise, the payment by the borrower rises to the extent permitted by the terms of the loan, thereby increasing the potential for default. At the same time, the marketability of the underlying property may be adversely affected by higher interest rates.
The Bank’s residential mortgage loans generally do not exceed 80% of the lesser of purchase price or appraised value of the collateral. However, pursuant to the underwriting guidelines adopted by the Board of Directors, the Bank may lend up to 100% of the value of the property securing a one- to four-family residential loan with private mortgage insurance or other similar protection to support the portion of the loan that exceeds 80% of the value. The Bank may, on occasion, extend a loan up to 90% of the value of the secured property without private mortgage insurance coverage. However, these exceptions are minimal and are only approved on loans with exceptional credit scores, sizeable asset reserves, or other compensating factors.
The Bank’s home equity and second mortgage loans are fixed rate loans with fully amortized terms generally of up to fifteen years, variable rate interest only loans with terms up to three years, or home equity lines of credit. The variable rate loans are typically tied to the Wall Street Journal Prime Rate (“Prime Rate”), plus a margin commensurate with the risk as determined by the borrower’s credit score. The Bank originates both fixed and variable rate home equity lines of credit with terms up to five years. The Bank generally limits the total loan-to-value on these mortgages to 85% of the value of the secured property if the Bank holds the first mortgage and 80% if the first mortgage is held by another party.
The Bank originates residential construction loans to individual homeowners, local builders and developers for the purpose of constructing one- to four-family residences. At December 31, 2017, these loans totaled $28.7 million with undisbursed funds totaling $13.7 million. The Bank typically requires that permanent financing with the Bank or some other lender be in place prior to closing any non-speculative construction loan. At such time, the loan will convert to a permanent loan at the interest rate established at the initial closing of the construction/permanent loan or be paid off by another permanent lender.
The Bank has made residential construction loans to local builders for the purpose of construction of speculative and pre-sold one- to four-family residential properties, and for the construction of pre-sold one- to four-family homes. These loans are subject to credit review, analysis of personal and, if applicable, corporate financial statements, and an appraisal of the property. Loan proceeds are disbursed during the construction term after a satisfactory inspection of the project has been made. Interest on these construction loans is due monthly. The Bank may extend the term of a construction loan if the property has not been sold by the maturity date.
Multifamily Residential Real Estate Loans. At December 31, 2017, $89.1 million or 5.3% of the Bank's total loan portfolio consisted of loans collateralized by multifamily residential real estate properties. At December 31, 2017, the Bank did not have any nonaccrual multifamily real estate loans. See “Nonperforming Assets” in Item 7, Management’s Discussion and Analysis of Financial Condition and Results of Operations.
The Bank has originated both fixed rate and adjustable rate multifamily loans. Fixed rate loans are generally originated with amortization periods not to exceed 25 years, and typically have balloon periods no longer than ten years. Adjustable rate loans are typically amortized over terms up to 25 years, with interest rate adjustments periodically. The Bank’s loan policy limits loan-to-value percentages on multifamily real estate loans to 85%. It is also the Bank's general policy to obtain loan guarantees on its multifamily residential real estate loans from the principals of the borrower; however, the Bank may waive this requirement in certain circumstances.
The success of such projects is sensitive to changes in supply and demand conditions in the market for multifamily real estate as well as regional and economic conditions generally.
Nonfarm Nonresidential Loans. At December 31, 2017, $557.2 million or 33.3% of the Bank's total loan portfolio consisted of loans collateralized by nonfarm nonresidential properties. At December 31, 2017, the Bank had nonaccrual nonfarm nonresidential loans of $7.4 million. See “Nonperforming Assets” in Item 7, Management’s Discussion and Analysis of Financial Condition and Results of Operations.
Many of the Bank’s nonfarm nonresidential loans are collateralized by properties such as office buildings, strip and small shopping centers, churches, convenience stores and mini-storage facilities. Loans to borrowers that are corporations, limited liability companies or other such legal entities are also typically personally guaranteed by the principals of the borrowing entity. The financial strength of the guarantors of the loan is a primary underwriting factor.
Regulatory guidelines and the Bank’s policies require that properties securing nonfarm nonresidential loans over $250,000 be appraised by licensed real estate appraisers pursuant to state licensing requirements and federal regulations. The Bank underwrites nonfarm nonresidential loans specifically in relation to the type of property being collateralized. Primary underwriting considerations for these loans include the creditworthiness of the borrower, the quality and location of the real estate, the sustainable cash flows of the project, projected occupancy rates, the quality of management involved with the project and the financial strength of the guarantor, if applicable. As part of the underwriting of these loans, the Bank prepares a cash flow analysis that includes a vacancy rate projection, expenses for taxes, insurance, maintenance and repair reserves as well as debt coverage ratios. The Bank’s nonfarm nonresidential loans are generally originated with amortization periods not to exceed 25 years and are structured with three to ten year balloon terms. The Bank attempts to keep maturities of these loans as short as possible in order to enable the Bank to better manage its interest rate risk profile.
Nonfarm nonresidential lending entails additional risks as compared to the Bank’s one- to four-family residential property loans. The repayment on such loans is typically dependent on the successful operation of the real estate project, which is sensitive to changes in supply and demand conditions in the market for commercial real estate, and on regional economic conditions.
Farmland Loans. At December 31, 2017, farmland loans amounted to $96.8 million or 5.8% of the Bank’s total loan portfolio. At December 31, 2017, the Bank had $657,000 of nonaccrual farmland loans. See “Nonperforming Assets” in Item 7, Management’s Discussion and Analysis of Financial Condition and Results of Operations.
The types of credits in this category include loans secured by real estate employed for row crop and livestock production, pasture and grazing, forestry and timber purposes and other similar uses. The terms for these loans are generally ten years or less with fixed or floating rates of interest and amortization periods typically not to exceed 25 years. The underwriting of these loans is based primarily on the cash flow generated by the intended productive use of the property and the financial strength of the borrowing entity and the guarantors of the loan, if any.
The risks associated with these loans tend to be directly related to the economics of the underlying property use. There are certain macro-level factors, including environmental and weather patterns, national and global supply and demand for the product and the national political environment, that affect the strength of the agricultural, livestock and timber sectors. The experience and success of the borrower in the market segment, the Bank’s history with the borrower and the financial strength of any guarantors are all considered when extending loans in this category. Advance rates on these types of loans generally do not exceed 75% of the value of the real estate.
Construction and Land Development Loans. At December 31, 2017, construction loans amounted to $157.5 million or 9.4% of the Bank’s total loan portfolio. Of the $157.5 million of such loans at December 31, 2017, $107.9 million consisted of construction loans with $32.9 million of unadvanced construction funds and $49.6 million consisted of land loans with available balances totaling $1.9 million. At December 31, 2017, the Bank had $188,000 of nonaccrual construction and land loans. See “Nonperforming Assets” in Item 7, Management’s Discussion and Analysis of Financial Condition and Results of Operations.
The Bank’s commercial construction loans generally have fixed interest rates or variable rates that float with the Prime Rate and have typically been issued for terms of twelve to twenty-four months. However, the Bank has originated construction loans with longer terms, although this practice has generally been limited to larger projects that could not be completed in the typical twelve to twenty-four month period. Construction loans are typically made with a maximum loan-to-value percentage of 80% of the appraised value of the proposed project.
The Bank has made commercial construction loans to property developers and investors for the purpose of constructing multifamily residential housing units, stand-alone and multi-tenant retail projects and office buildings. These loans are subject to an assessment of the feasibility of the proposed project based on anticipated cash flows, vacancy and interest rates, an analysis of the forecasted economics of the particular sub-market where the project will be located, a complete credit underwriting of the guarantors of the proposed loan and an appraisal of the project. Loan proceeds are disbursed during the construction term after a review of the status of completion of the project.
Construction lending is generally considered to involve a higher level of risk as compared to other loans. This is due, in part, to the concentration of principal in a limited number of loans and borrowers, and the effects of general economic conditions on developers and builders. In addition, construction loans made on a speculative basis pose a greater potential risk to the Bank than those with a repayment source identified at origination. The Bank analyzes each borrower involved in speculative building and limits the principal amount and/or number of unsold speculative projects at any one time with such borrower.
Commercial Loans. The Bank also offers secured and unsecured commercial loans. Secured commercial loans are primarily collateralized by equipment, inventory, accounts receivable and other assets. At December 31, 2017, commercial loans amounted to $345.1 million or 20.6% of the total loan portfolio. Within the commercial loan portfolio, the Bank also maintains a portfolio of syndicated credit facilities. At December 31, 2017, syndicated loans accounted for $178.8 million of the commercial loan portfolio or 10.7% of the total loan portfolio and had $38.7 million in available funds. At December 31, 2017, the Bank had nonaccrual commercial loans of $1.7 million. See “Nonperforming Assets” in Item 7, Management’s Discussion and Analysis of Financial Condition and Results of Operations.
This portfolio includes loans with funds used for commercial purposes including loans to finance working capital needs, including agricultural; purchase equipment; support accounts receivable and inventory and other similar business needs. Other common uses of funds include leveraged buyouts, dividends, acquisitions and expansions.
Primary underwriting considerations for these loans include a review of the historical and prospective cash flows of the borrower and the sustainability of these cash flows, the expected long term viability of the business, the quality and marketability of the collateral (if any) and the financial support offered by any guarantors to the transaction. The Bank's commercial loans are originated with fixed and variable interest rates and maturities generally range between one and five years. These loans are typically based on a maximum fifteen year amortization schedule.
Consumer Loans. The consumer loans offered by the Bank primarily consist of automobile loans, deposit account secured loans, and unsecured loans. Consumer loans amounted to $36.0 million or 2.2% of the total loan portfolio at December 31, 2017, of which $12.8 million consisted of automobile loans and $23.2 million consisted of other consumer loans. At December 31, 2017, the Bank had nonaccrual consumer loans of $212,000. See “Nonperforming Assets” in Item 7, Management’s Discussion and Analysis of Financial Condition and Results of Operations.
The Bank's vehicle loans are typically originated for the purchase of new and used cars and trucks. Such loans are generally originated with a maximum term of six years. The Bank may offer extended terms on automobile loans to some customers based upon their creditworthiness.
Other consumer loans consist primarily of deposit account loans and unsecured loans. Loans secured by deposit accounts are generally originated for up to 95% of the deposit account balance, with a hold placed on the account restricting the withdrawal of the deposit account balance.
Consumer loans entail greater risk than do residential mortgage loans, particularly in the case of consumer loans that are unsecured or secured by rapidly depreciating assets such as automobiles. In such cases, any repossessed collateral for a defaulted consumer loan may not provide an adequate source of repayment of the outstanding loan balance as a result of the greater likelihood of depreciation, damage or loss. In addition, consumer loan collections are dependent on the borrower's continuing financial stability, and thus are more likely to be adversely affected by job loss, divorce, illness or personal bankruptcy. Furthermore, the application of various federal and state laws, including federal and state bankruptcy laws, may limit the amount which can be recovered on such loans.
Sources of Funds
General. Deposits are the primary source of the Bank's funds for lending and other investment purposes. In addition to deposits, the Bank derives funds from loan principal repayments and prepayments and interest payments, maturities, sales and calls of investment securities, and advances from the FHLB. Loan repayments are a relatively stable source of funds, while deposit inflows and outflows are significantly influenced by general interest rates and money market conditions. Borrowings are used when funds from loan and deposit sources are insufficient to meet funding needs or for asset/liability management purposes. FHLB advances are the primary source of borrowings.
Deposits. The Bank's deposit products include a broad selection of deposit instruments, including checking accounts, money market accounts, savings accounts and term certificate accounts. Deposit account terms vary, with the principal differences being the minimum balance required, the time period the funds must remain on deposit, early withdrawal penalties and the interest rate.
The Bank considers its primary market area to be Arkansas, Missouri and Southeast Oklahoma. The Bank utilizes traditional marketing methods to attract new customers and deposits. The Bank does not advertise for retail deposits outside of its primary market area. The Bank uses brokered deposits and non-brokered institutional internet certificates of deposit as additional sources of funds to augment the retail CD market. At December 31, 2017, internet certificates of deposit represented approximately 1.9% of deposits and brokered deposits represented approximately 1.2% of deposits.
The Bank has been competitive in the types of accounts and in interest rates it has offered on its deposit products but does not necessarily seek to match the highest rates paid by competing institutions. Although market demand generally dictates which deposit maturities and rates will be accepted by the public, the Bank intends to continue to offer longer-term deposits to the extent possible and consistent with its asset and liability management goals. In addition, the Bank may use brokered deposits when this alternative funding source provides more cost effective deposits with terms that are consistent with its asset and liability management goals.
Borrowed funds. The Bank utilizes FHLB advances in its normal operating and investing activities when this funding source offers cost effective funds that are consistent with the Bank’s asset and liability management goals. The Bank pledges substantially all of its loans under a blanket lien and through certain loans held in custody at FHLB. The Bank’s borrowing capacity with the FHLB is directly tied to the amount of the Bank’s qualifying loans pledged. FHLB advances are subject to prepayment penalties if repaid prior to the maturity date.
At December 31, 2017, the Bank’s unused borrowing availability primarily consisted of (1) $230.0 million of available borrowing capacity with the FHLB, (2) $116.9 million of investment securities available to pledge for federal funds or other borrowings and (3) $103.0 million of available unsecured federal funds borrowing lines. In addition, at December 31, 2017, the Company had available borrowing capacity of $12.4 million.
Competition
The Bank conducts business through 42 branches in the market areas listed below in Arkansas, Missouri and Oklahoma. The following table presents the Bank’s respective market share percentages for total deposits at June 30, 2017, in each county where we have operations. The table also indicates the ranking by deposit size in each market. All information in the table was obtained from SNL Financial, which compiles deposit data published by the FDIC as of June 30, 2017 and updates the information for any bank mergers and acquisitions completed subsequent to the reporting date.
|
June 30, 2017 |
||||||
|
County |
|
Market Share (%) |
|
Market Rank |
Number of Branches |
|
|
Bear State Bank |
||||||
|
Barton, MO |
15.66 |
2 |
2 |
|||
|
Baxter, AR |
10.09 |
4 |
3 |
|||
|
Benton, AR |
|
0.93 |
|
16 |
|
2 |
|
Boone, AR |
21.39 |
2 |
2 |
|||
|
Christian, MO |
1.89 |
11 |
1 |
|||
|
Craighead, AR |
|
6.16 |
|
6 |
|
4 |
|
Faulkner, AR |
0.96 |
11 |
1 |
|||
|
Garland, AR |
7.22 |
6 |
3 |
|||
|
Greene, MO |
|
1.30 |
|
17 |
|
3 |
|
Howard, AR |
|
16.53 |
|
3 |
|
2 |
|
Little River, AR |
34.40 |
1 |
1 |
|||
|
Marion, AR |
|
8.53 |
|
5 |
|
1 |
|
McCurtain, OK |
10.28 |
4 |
2 |
|||
|
Mississippi, AR |
4.05 |
6 |
1 |
|||
|
Montgomery, AR |
|
66.05 |
|
1 |
|
2 |
|
Pike, AR |
11.73 |
4 |
1 |
|||
|
Polk, AR |
|
18.21 |
|
2 |
|
2 |
|
Pulaski, AR |
1.36 |
12 |
1 |
|||
|
Scott, AR |
37.48 |
1 |
1 |
|||
|
Sevier, AR |
|
13.88 |
|
3 |
|
1 |
|
Stone, MO |
|
22.35 |
|
1 |
|
2 |
|
Taney, MO |
|
1.84 |
|
12 |
|
1 |
|
Washington, AR |
1.21 |
14 |
2 |
|||
|
Webster, MO |
20.36 |
2 |
1 |
|||
The Bank faces strong competition in its market areas both in attracting deposits and making loans. The most direct competition for deposits has historically come from commercial banks, savings associations and credit unions. In addition, the Bank has faced additional significant competition for investors' funds from short-term money market securities, mutual funds and other corporate and government securities. The ability of the Bank to attract and retain savings and certificates of deposit depends on its ability to generally provide a rate of return, liquidity and risk comparable to that offered by competing investment opportunities. The Bank’s ability to increase checking deposits depends on offering competitive checking accounts and promoting these products through effective channels. Additionally, the Bank offers convenient hours, locations and online services to maintain and attract customers.
The Bank experiences strong competition for loans principally from commercial banks and mortgage companies. The Bank competes for loans through interest rates, loan terms, and fees charged and the efficiency and quality of services provided.
Employees
The Company and the Bank had 380 full-time employees and 27 part-time employees at December 31, 2017, compared to 466 full-time employees and 36 part-time employees at December 31, 2016. The decrease in the number of employees is primarily related to branch consolidations and efficiencies gained in the integration of Metropolitan. None of our employees are represented by any union or similar group, and the Bank believes that it enjoys good relations with its personnel.
Subsidiaries
The Bank is permitted to invest up to 2% of its assets in the capital stock of, or secured or unsecured loans to, subsidiary service corporations, with an additional investment of 1% of assets when such additional investment is utilized primarily for community development purposes. In addition to investments in service corporations, the Bank is permitted to invest an unlimited amount in operating subsidiaries engaged solely in activities in which the Bank may engage directly. As of December 31, 2017, the Bank does not have any operating subsidiaries.
Available Information
The Company makes available free of charge its annual report on Form 10-K, quarterly reports on Form 10-Q, current reports on Form 8-K, and all amendments to such reports filed pursuant to Sections 13(a) or 15(d) of the Securities Exchange Act of 1934, as soon as reasonably practicable on or through its website located at www.bearstatefinancial.com after filing with the United States Securities and Exchange Commission (“SEC”). Information on, or accessible through, the Company’s website is not a part of and is not incorporated into this Annual Report on Form 10-K and the inclusion of the Company’s website address in this report is an inactive textual reference.
REGULATION
Set forth below is a brief description of those laws and regulations which, together with the descriptions of laws and regulations contained elsewhere herein, are deemed material to an investor's understanding of the extent to which the Company and the Bank are regulated. The description of the laws and regulations hereunder, as well as descriptions of laws and regulations contained elsewhere herein, does not purport to be complete and is qualified in its entirety by reference to applicable laws and regulations.
The Company
General. The Company, as a bank holding company within the meaning of the Bank Holding Company Act ("BHCA"), is subject to FRB regulations, examinations, supervision and reporting requirements. The most recent regulatory examination of the Company by the FRB was conducted during November 2017. As a subsidiary of a bank holding company, the Bank is also subject to certain restrictions in its dealings with the Company and affiliates thereof.
The BHCA limits the activities of the Company and any entities controlled by the Company to the activities of banking, managing and controlling banks, furnishing or performing services for its subsidiaries, and any other activity that the FRB determines to be incidental to or clearly and closely related to banking.
Acquisitions. Under the BHCA, a bank holding company must obtain prior FRB approval before engaging in acquisitions of banks or bank holding companies. In particular, the FRB must generally approve:
|
● |
the acquisition of direct or indirect ownership or control of any voting securities of a bank or bank holding company if the acquisition results in the company’s control of more than 5% of the outstanding shares of any class of voting securities of the bank or bank holding company, |
|
● |
the acquisition by a bank holding company or by a subsidiary thereof, other than a bank, of all or substantially all of the assets of a bank, and |
|
● |
the merger or consolidation of bank holding companies. |
Restrictions on Transactions with Affiliates. Transactions between an insured depository institution and its "affiliates" are subject to quantitative and qualitative restrictions under Sections 23A and 23B of the Federal Reserve Act. Affiliates generally include, among other entities, the institution’s holding company and companies that are controlled by or under common control with the institution. Generally, Section 23A (i) limits the extent to which the insured depository institution or its subsidiaries may engage in “covered transactions” with any one affiliate to an amount equal to 10% of such association’s capital stock and surplus, and contains an aggregate limit on all such transactions with all affiliates to an amount equal to 20% of such capital stock and surplus. Section 23B applies to “covered transactions” as well as certain other transactions and requires that all transactions be on terms substantially the same, or at least favorable, to the association or subsidiary as those provided to a non-affiliate. The term “covered transaction” includes the making of loans to, purchase of assets from, issuance of a guarantee to an affiliate and similar transactions. Section 23B transactions also apply to the provision of services and the sale of assets by an insured depository institution to an affiliate.
In addition, Sections 22(g) and (h) of the Federal Reserve Act place restrictions on loans to executive officers, directors and principal stockholders. Under Section 22(h), loans to a director, an executive officer and to a greater than 10% stockholder of an institution (“a principal stockholder”), and certain affiliated interests of either, may not exceed, together with all other outstanding loans to such person and affiliated interests, the institution’s loans to one borrower limit (generally equal to 15% of the institution’s unimpaired capital and surplus). Section 22(h) also requires that loans to directors, executive officers and principal stockholders be made on terms substantially the same as offered in comparable transactions to other persons unless the loans are made pursuant to a benefit or compensation program that (i) is widely available to employees of the institution and (ii) does not give preference to any director, executive officer or principal stockholder, or certain affiliated interests of either, over other employees of the institution. Section 22(h) also requires prior board approval for certain loans. In addition, the aggregate amount of extensions of credit by an institution to all insiders cannot exceed the institution’s unimpaired capital and surplus. Furthermore, Section 22(g) places additional restrictions on loans to executive officers. At December 31, 2017, the Bank was in compliance with the above restrictions.
Incentive Compensation. During the second quarter of 2016, the U.S. financial regulators, including the Federal Reserve Board and the SEC, proposed revised rules on incentive-based payment arrangements at specified regulated entities having at least $1 billion in total assets (including the Company and the Bank). The proposed revised rules would establish general qualitative requirements applicable to all covered entities, which would include (i) prohibiting incentive arrangements that encourage inappropriate risks by providing excessive compensation; (ii) prohibiting incentive arrangements that encourage inappropriate risks that could lead to a material financial loss; (iii) establishing requirements for performance measures to appropriately balance risk and reward; (iv) requiring board of director oversight of incentive arrangements; and (v) mandating appropriate record-keeping. Under the proposed rule, larger financial institutions with total consolidated assets of at least $50 billion would also be subject to additional requirements applicable to such institutions’ “senior executive officers” and “significant risk-takers.” These additional requirements would not be applicable to the Company or the Bank, each of which currently have less than $50 billion in total consolidated assets.
The Bank
General. The Bank is chartered as an Arkansas state bank and is a member of the Federal Reserve System, making it primarily subject to regulation and supervision by both the Federal Reserve Board and the Arkansas State Bank Department. In addition, the Bank is subject to various requirements and restrictions under federal and state law, including requirements to maintain reserves against deposits, restrictions on the types and amounts of loans that may be granted and the interest that may be charged, and limitations on the types of investments that may be made and on the types of services that may be offered. Various consumer laws and regulations also affect the operations of the bank.
State Regulation. The Bank is subject to examination and regulation by the Arkansas State Bank Department. The Arkansas State Bank Department may also examine the activities of the bank holding company in conjunction with its examination of the bank subsidiary or in conjunction with the FRB’s examination of the bank holding company. The extent of such examination will depend upon the complexity and level of debt owed by the bank holding company, and other various criteria as determined by the Arkansas State Bank Department. The Bank is also required to submit certain reports filed with the FRB to the Arkansas State Bank Department.
Under the Arkansas Banking Code of 1997, the acquisition of more than 25% of any class of the outstanding capital stock of any bank located in Arkansas requires approval of the Arkansas State Bank Commissioner (the “Bank Commissioner”). Additionally, a bank holding company may not acquire any bank if after such acquisition the holding company would control, directly or indirectly, banks having 25% of the total bank deposits (excluding deposits from other banks and public funds) in the State of Arkansas. A bank holding company also cannot own more than one bank subsidiary if any of its bank subsidiaries has been chartered for less than five years.
The Bank Commissioner has the authority, with the consent of the Governor of the State of Arkansas, to declare a state of emergency and temporarily modify or suspend banking laws and regulations in communities where such a state of emergency exists. The Bank Commissioner may also authorize a bank to close its offices and any day when such bank offices are closed will be treated as a legal holiday, and any director, officer or employee of such bank shall not incur any liability related to such emergency closing. To date no such state of emergency has been declared to exist by the Bank Commissioner.
Restrictions on Bank Subsidiary.
Lending Limits. The lending and investment authority of the Bank is derived from Arkansas law. The lending power is generally subject to certain restrictions, including the amount which may be lent to a single borrower. Under Arkansas law, the obligations of one borrower to a bank may not exceed 20% of the bank’s capital base.
Reserve Requirements. Arkansas law requires state chartered banks to maintain such reserves as are required by the applicable federal regulatory agency. Federal banking laws require all insured banks to maintain reserves against their checking and transaction accounts (primarily checking accounts, NOW and Super NOW checking accounts). Because reserves must generally be maintained in cash, non-interest bearing accounts or in accounts that earn only a nominal amount of interest, the effect of the reserve requirements is to increase our cost of funds.
Payment of Dividends. Regulations of the FRB and the Arkansas State Bank Department limit the ability of the Bank to pay dividends to the Company without the prior approval of such agencies. Pursuant to FRB regulations, the maximum dividend that the Bank may pay without prior approval from the FRB is the Bank’s year-to-date net profits plus retained net profits from the preceding two years. The Arkansas State Bank Department currently limits the amount of dividends that the Bank can pay the Company to 75% of its net profits after taxes for the current year plus 75% of its retained net profits after taxes for the immediately preceding year.
Insurance of Accounts. FDIC insurance covers all deposit accounts, including checking and savings accounts, money market deposit accounts and certificates of deposit. FDIC insurance does not cover other financial products and services that banks may offer, such as stocks, bonds, mutual fund shares, life insurance policies, annuities or securities. The standard insurance amount is $250,000 per depositor, per insured bank, for each account ownership category.
As insurer, the FDIC is authorized to conduct examinations of, and to require reporting by, FDIC-insured institutions. It also may prohibit any FDIC-insured institution from engaging in any activity the FDIC determines by regulation or order to pose a serious threat to the FDIC. The FDIC may terminate the deposit insurance of any insured depository institution, including the Bank, if it determines after a hearing that the institution has engaged or is engaging in unsafe or unsound practices, is in an unsafe or unsound condition to continue operations, or has violated any applicable law, regulation, order or any condition imposed by an agreement with the FDIC. It also may suspend deposit insurance temporarily during the hearing process for the permanent termination of insurance, if the institution has no tangible capital. If insurance of accounts is terminated, the accounts at the institution at the time of the termination, less subsequent withdrawals, shall continue to be insured for a period of six months to two years, as determined by the FDIC. Management is aware of no existing circumstances that would result in termination of the Bank's deposit insurance.
Substantially all of the deposits of the Bank are insured up to applicable limits by the DIF of the FDIC and are subject to deposit insurance assessments to maintain the DIF. The FDIC utilizes a risk-based assessment system that imposes insurance premiums based upon a risk matrix that takes into account a bank’s capital level and supervisory rating.
A bank’s assessment is calculated by multiplying its assessment rate by its assessment base. A bank’s assessment base and assessment rate are determined each quarter. The deposit insurance assessment base is defined as average consolidated total assets for the assessment period less average tangible equity capital with potential adjustments for unsecured debt, brokered deposits and depository institution debts. Beginning in the third quarter of 2016, the FDIC issued revised pricing models for assessment rate. Under the revised assessment system for small banks (defined by the FDIC as less than $10 billion in assets), the FDIC will determine assessment rates using financial measures and supervisory ratings derived from a statistical model estimating the probability of failure over three years. The new pricing system eliminates risk categories but established minimum and maximum assessment rates based on a bank’s CAMELs composite ratings.
FDIC insurance expense totaled $1.1 million for both the years ended December 31, 2017 and 2016 and $960,000 for the year ended December 31, 2015. FDIC insurance expense includes deposit insurance assessments and Financing Corporation (“FICO”) assessments related to outstanding FICO bonds.
Financial Regulatory Reform
On July 21, 2010, the Dodd-Frank Wall Street Reform and Consumer Protection Act (the “Dodd-Frank Act”) was signed into law. The Dodd-Frank Act represented a sweeping reform of the U.S. supervisory and regulatory framework applicable to financial institutions and capital markets in the wake of the global financial crisis, certain aspects of which are described below in more detail. In particular, and among other things, the Dodd-Frank Act: created the Consumer Financial Protection Bureau (the “CFPB”), which is authorized to regulate providers of consumer credit, savings, payment and other consumer financial products and services; narrowed the scope of federal preemption of state consumer laws enjoyed by national banks and federal savings associations and expanded the authority of state attorneys general to bring actions to enforce federal consumer protection legislation; imposed more stringent capital requirements on bank holding companies and subjected certain activities, including interstate mergers and acquisitions, to heightened capital conditions; with respect to mortgage lending, (i) significantly expanded requirements applicable to loans secured by one-to-four family residential real property, (ii) imposed strict rules on mortgage servicing, and (iii) required the originator of a securitized loan, or the sponsor of a securitization, to retain at least 5% of the credit risk of securitized exposures unless the underlying exposures are qualified residential mortgages or meet certain underwriting standards; repealed the prohibition on the payment of interest on business checking accounts; restricted the interchange fees payable on debit card transactions for issuers with $10 billion in assets or greater; in the so-called “Volcker Rule,” subject to numerous exceptions, prohibited depository institutions and affiliates from certain investments in, and sponsorship of, hedge funds and private equity funds and from engaging in proprietary trading; enhanced oversight of credit rating agencies; and prohibited banking agency requirements tied to credit ratings. These statutory changes shifted the regulatory framework for financial institutions, impacted the way in which they do business and have the potential to constrain revenues of financial institutions.
Numerous provisions of the Dodd-Frank Act were required to be implemented through rulemaking by the appropriate federal regulatory agencies. Many of the required regulations have been issued and others have been released for public comment, but are not yet final. Although the reforms primarily targeted systemically important financial service providers, their influence has and is expected to continue to filter down in varying degrees to smaller institutions over time. Our management will continue to evaluate the effect of the Dodd-Frank Act on the business and operations of the Company and the Bank.
Consumer Laws and Regulations. Banks are subject to certain laws and regulations that are designed to protect consumers. Among the more prominent of such laws and regulations are the Truth in Lending Act, the Truth in Savings Act, the Electronic Fund Transfer Act, the Expedited Funds Availability Act, the Equal Credit Opportunity Act, the Fair Credit Reporting Act, the Fair Housing Act, the Home Mortgage Disclosure Act, the Real Estate Settlement Procedures Act and consumer privacy protection provisions of the Gramm-Leach-Bliley Act and comparable state laws. These laws and regulations mandate certain disclosure requirements and regulate the manner in which financial institutions deal with consumers. With respect to consumer privacy, the Gramm-Leach-Bliley Act generally prohibits disclosure of customer information to non-affiliated third parties unless the customer has been given the opportunity to object and has not objected to such disclosure. Financial institutions are further required to disclose their privacy policies to customers annually.
The Dodd-Frank Act created the CFPB within the Federal Reserve System. The CFPB is tasked with establishing and implementing rules and regulations under certain federal consumer protection laws with respect to the conduct of providers of certain consumer financial products and services. The CFPB has rulemaking authority over many of the statutes governing products and services offered to bank consumers. In addition, the Dodd-Frank Act permits states to adopt consumer protection laws and regulations that are more stringent than those regulations promulgated by the CFPB and state attorneys general are permitted to enforce consumer protection rules adopted by the CFPB against state-chartered institutions. The CFPB has examination and primary enforcement authority with respect to consumer protection laws and regulations for depository institutions with $10 billion or more in assets. Depository institutions with less than $10 billion in assets are subject to rules promulgated by the CFPB, but continue to be examined and supervised by federal banking regulatory agencies for consumer compliance purposes.
During 2013, the CFPB issued a series of proposed and final rules related to mortgage loan origination and mortgage loan servicing. In particular, in January 2013, the CFPB issued its final rule, which was effective January 10, 2014, on ability to repay and qualified mortgage standards to implement various requirements of the Dodd-Frank Act amending the Truth in Lending Act. The final rule requires mortgage lenders to make a reasonable and good faith determination, based on verified and documented information, that a borrower will have the ability to repay a mortgage loan according to its terms before making the loan. The final rule also includes a definition of a “qualified mortgage,” which provides the lender with a presumption that the ability to repay requirements has been met. This presumption is conclusive (i.e. a safe harbor) if the loan is a “prime” loan and rebuttable if the loan is a higher-priced, or subprime, loan. The ability-to-repay rule has the potential to significantly affect our business, as a borrower can challenge a loan’s status as a qualified mortgage or that the lender otherwise established the borrower’s ability to repay in a direct cause of action for three years from the origination date, or as a defense to foreclosure at any time. In addition, the value and marketability of non-qualified mortgages may be adversely affected.
Interchange Fees. The Dodd-Frank Act also amended the Electronic Fund Transfer Act to require that the amount of any interchange fee charged for electronic debit transactions by debit card issuers having assets over $10 billion must be reasonable and proportional to the actual cost of a transaction to the issuer, commonly referred to as the “Durbin Amendment”. The FRB has adopted final rules which limit the maximum permissible interchange fees that such issuers can receive for an electronic debit transaction. Although the restrictions on interchange fees do not apply to institutions with less than $10 billion in assets, the price controls could negatively impact bankcard services income for smaller banks if the reductions that are required of larger banks cause industry-wide reduction of swipe fees.
Volcker Rule. The Dodd-Frank Act amended the BHCA to require the federal banking regulatory agencies to adopt rules that prohibit banks and their affiliates from engaging in proprietary trading and investing in and sponsoring a covered fund (such as a hedge fund and/or private equity fund), commonly referred to as the “Volcker Rule.” In December 2013, the federal banking regulatory agencies adopted a final rule construing the Volcker Rule, which became effective April 1, 2014. Banking entities had until July 21, 2017 to conform their activities to the requirements of the rule.
The Increasing Regulatory Emphasis on Capital
Regulatory capital represents the net assets of a financial institution available to absorb losses. Because of the risks attendant to their business, depository institutions are generally required to hold more capital than other businesses, which directly affects earnings capabilities. While capital has historically been one of the key measures of the financial health of both bank holding companies and banks, its role became fundamentally more important in the wake of the global financial crisis, as the banking regulators recognized that the amount and quality of capital held by banks prior to the crisis was insufficient to absorb losses during periods of severe stress. Certain provisions of the Dodd-Frank Act and Basel III, discussed below, establish strengthened capital standards for banks and bank holding companies, require more capital to be held in the form of common stock and disallow certain funds from being included in capital determinations. Once fully implemented, these standards will represent regulatory capital requirements that are significantly more stringent than those in place previously.
Required Capital Levels. In July of 2013, the U.S. federal banking agencies approved the implementation of the Basel III regulatory capital reforms in pertinent part, and, at the same time, promulgated rules effecting certain changes required by the Dodd-Frank Act (the “Basel III Rule”). In contrast to previous capital requirements, which were merely guidelines, Basel III was released in the form of regulations by each of the federal regulatory agencies. The Basel III Rule is applicable to all financial institutions that are subject to minimum capital requirements, including federal and state banks and savings and loan associations, as well as to bank and savings and loan holding companies other than “small bank holding companies” (generally bank holding companies with consolidated assets of less than $1 billion).
The minimum capital standards effective for the year ended December 31, 2017 were:
|
● |
A minimum ratio of Common Equity Tier 1 Capital to risk-weighted assets of 4.5%; |
|
● |
A minimum required amount of Tier 1 Capital to risk-weighted assets of 6%; |
|
● |
A minimum required amount of Total Capital (Tier 1 plus Tier 2) to risk-weighted assets of 8%; and |
|
● |
A minimum leverage ratio of Tier 1 Capital to total assets equal to 4% in all circumstances. |
For these purposes, “Common Equity Tier 1 Capital,” consists primarily of common stock, related surplus (net of treasury stock), retained earnings, and Common Equity Tier 1 minority interests, subject to certain regulatory adjustments. “Tier 1 Capital” consists primarily of common stock and related surplus less intangible assets (other than certain loan servicing rights and purchased credit card relationships). “Total Capital” consists primarily of Tier 1 Capital plus “Tier 2 Capital,” which includes other non-permanent capital items, such as certain other debt and equity instruments that do not qualify as Tier 1 Capital, and a portion of a bank’s allowance for loan and lease losses. Further, risk-weighted assets for the purpose of the risk-weighted ratio calculations consist of balance sheet assets and off-balance sheet exposures to which required risk weightings of 0% to 1250% are applied.
The Basel III Rules also established a fully-phased “capital conservation buffer” of 2.5% above the new regulatory minimum risk-based capital requirements. The conservation buffer, when added to the capital requirements, results in the following minimum ratios: (i) a common equity Tier 1 risk-based capital ratio of 7.0%, (ii) a Tier 1 risk-based capital ratio of 8.5%, and (iii) a total risk-based capital ratio of 10.5%. The new capital conservation buffer requirement was phased in beginning in January 2016 at 0.625% of risk-weighted assets and will increase by that amount each year until fully implemented in January 2019. An institution is subject to limitations on certain activities including payment of dividends, share repurchases and discretionary bonuses to executive officers if its capital level is below the buffer amount.
The capital standards described above are minimum requirements under Basel III. Bank regulatory agencies uniformly encourage banks and bank holding companies to be “well-capitalized” and, to that end, federal law and regulations provide various incentives for banking organizations to maintain regulatory capital at levels in excess of minimum regulatory requirements. For example, a banking organization that is “well-capitalized” may: (i) qualify for exemptions from prior notice or application requirements otherwise applicable to certain types of activities; (ii) qualify for expedited processing of other required notices or applications; and (iii) accept, roll-over or renew brokered deposits. Under the capital regulations of the FDIC and FRB, in order to be “well-capitalized,” a banking organization, for the year ended December 31, 2017, must have maintained:
|
● |
A ratio of Common Equity Tier 1 Capital to total risk-weighted assets of 6.5% or greater, |
|
● |
A ratio of Tier 1 Capital to total risk-weighted assets of 8% or greater, |
|
● |
A ratio of Total Capital to total risk-weighted assets of 10% or greater, and |
|
● |
A leverage ratio of Tier 1 Capital to total assets of 5% or greater. |
The FDIC and FRB guidelines also provide that banks and bank holding companies experiencing internal growth or making acquisitions would be expected to maintain capital positions substantially above the minimum supervisory levels without significant reliance on intangible assets. Furthermore, the guidelines indicate that the agencies will continue to consider a “tangible Tier 1 leverage ratio” (deducting all intangibles) in evaluating proposals for expansion or to engage in new activities.
Higher capital levels could also be required if warranted by the particular circumstances or risk profile of individual banking organizations. For example, the FRB’s capital guidelines contemplate that additional capital may be required to take adequate account of, among other things, interest rate risk, or the risks posed by concentrations of credit, nontraditional activities or securities trading activities. Further, any banking organization experiencing or anticipating significant growth would be expected to maintain capital ratios, including tangible capital positions (i.e., Tier 1 Capital less all intangible assets), well above the minimum levels.
Prompt Corrective Action. A banking organization’s capital plays an important role in connection with regulatory enforcement as well. Federal law provides the federal banking regulators with broad power to take prompt corrective action to resolve the problems of undercapitalized institutions. The extent of the regulators’ powers depends on whether the institution in question is “well capitalized,” “adequately capitalized,” “undercapitalized,” “significantly undercapitalized” or “critically undercapitalized,” in each case as defined by regulation. Depending upon the capital category to which an institution is assigned, the regulators’ corrective powers include: (i) requiring the institution to submit a capital restoration plan; (ii) limiting the institution’s asset growth and restricting its activities; (iii) requiring the institution to issue additional capital stock (including additional voting stock) or to sell itself; (iv) restricting transactions between the institution and its affiliates; (v) restricting the interest rate that the institution may pay on deposits; (vi) ordering a new election of directors of the institution; (vii) requiring that senior executive officers or directors be dismissed; (viii) prohibiting the institution from accepting deposits from correspondent banks; (ix) requiring the institution to divest certain subsidiaries; (x) prohibiting the payment of principal or interest on subordinated debt; and (xi) ultimately, appointing a receiver for the institution.
Other Financial Regulatory Matters
Federal Home Loan Bank System. The Bank is a member of the Federal Home Loan Bank of Dallas, which is one of 11 regional FHLBs. Each FHLB serves as a reserve or central bank for its members within its assigned region. It is funded primarily from proceeds derived from the sale of consolidated obligations of the FHLB System. It makes loans to members (i.e., advances) in accordance with policies and procedures established by the board of directors of the FHLB. At December 31, 2017, the Bank had $374.7 million of outstanding FHLB advances.
As a member, the Bank is required to purchase and maintain stock in the FHLB in an amount equal to the sum of 0.04% of total assets as of the previous December 31 and 4.10% of outstanding advances. At December 31, 2017, the Bank had $19.1 million in FHLB stock, which was in compliance with this requirement. No ready market exists for such stock and it has no quoted market value.
Federal Reserve System. The FRB requires all depository institutions to maintain reserves against their transaction accounts and non-personal time deposits (primarily NOW and regular checking accounts). For 2017: the first $15.5 million of otherwise reservable balances are exempt from the reserve requirements; for transaction accounts aggregating more than $15.5 million to $115.1 million, the reserve requirement is 3% of total transaction accounts; and for net transaction accounts in excess of $115.1 million, the reserve requirement is $3.0 million plus 10% of the aggregate amount of total transaction accounts in excess of $115.1 million. These reserve requirements are subject to annual adjustment by the FRB. Because required reserves must be maintained in the form of vault cash or a noninterest bearing account at an FRB, the effect of this reserve requirement is to reduce an institution's earning assets.
Additionally, each member bank is required to hold stock in its regional federal reserve bank. The stock cannot be sold, traded, or pledged as collateral for loans. At December 31, 2017, the Bank had $7.6 million in FRB stock. As specified by law, member banks receive a six percent annual dividend on their FRB stock.
Concentrated Commercial Real Estate Lending Regulations. Federal banking regulators promulgated guidance governing financial institutions with concentrations in commercial real estate lending, which guidance is applicable to both federal and state chartered financial institutions. The guidance provides that a bank has a concentration in commercial real estate lending if (i) total reported loans for construction, land development, and other land represent 100% or more of total capital or (ii) total reported loans secured by multifamily and non-farm nonresidential properties (excluding loans secured by owner-occupied properties) and loans for construction, land development, and other land represent 300% or more of total capital and the bank’s commercial real estate loan portfolio has increased 50% or more during the prior 36 months. If a concentration is present, management must employ heightened risk management practices that address the following key elements, including board and management oversight and strategic planning, portfolio management, development of underwriting standards, risk assessment and monitoring through market analysis and stress testing, and maintenance of increased capital levels as needed to support the level of commercial real estate lending. As of December 31, 2017, the Company did not exceed the levels to be considered to have a concentration in commercial real estate lending.
Community Reinvestment Act Requirements. The Community Reinvestment Act imposes a continuing and affirmative obligation on the Bank to, in a safe and sound manner, help meet the credit needs of its entire community, including low- and moderate-income neighborhoods. Federal regulators regularly assess the Bank’s record of meeting the credit needs of its communities. Applications for acquisitions are affected by the evaluation of a bank’s effectiveness in meeting its Community Reinvestment Act requirements.
Anti-Money Laundering. The Uniting and Strengthening America by Providing Appropriate Tools Required to Intercept and Obstruct Terrorism Act of 2001 (the “Patriot Act”) is designed to deny terrorists and criminals the ability to obtain access to the U.S. financial system and has significant implications for depository institutions, brokers, dealers and other businesses involved in the transfer of money. The Patriot Act mandates financial services companies to have policies and procedures with respect to measures designed to address any or all of the following matters: (i) customer identification programs; (ii) money laundering; (iii) terrorist financing; (iv) identifying and reporting suspicious activities and currency transactions; (v) currency crimes; and (vi) cooperation between financial institutions and law enforcement authorities.
CAUTIONARY NOTE ABOUT FORWARD-LOOKING STATEMENTS
This Annual Report on Form 10-K contains certain forward-looking statements and information relating to the Company and the Bank that are based on the beliefs of management as well as assumptions made by and information currently available to management. As used in this document, the words "anticipate," "believe," "estimate," "expect," "intend," "plan," "seek," "will," "should" and similar expressions, or the negative thereof, as they relate to the Company, the Bank or the management thereof, are intended to identify forward-looking statements.
The statements presented herein with respect to, among other things, the Company’s or the Bank’s plans, objectives, expectations and intentions, the Merger, anticipated changes in noninterest expenses in future periods, changes in earnings, impact of outstanding off-balance sheet commitments, sources of liquidity and that we have sufficient liquidity, the sufficiency of the allowance for loan losses, expected loan, asset, and earnings growth, growth in new and existing customer relationships, potential resolution of litigation or other disputes, our intentions with respect to our investment securities, the payment of dividends, and financial and other goals and plans are forward looking. These forward-looking statements include, without limitation, statements relating to the terms and closing of the proposed transaction between the Company and Arvest.
Forward-looking statements are neither historical facts nor assurances of future performance. Instead, they are based only on our current beliefs, expectations and assumptions regarding the future of our business, future plans and strategies, projections, anticipated events and trends, the economy and other future conditions. Because forward-looking statements relate to the future, they are subject to inherent uncertainties, risks and changes in circumstances that are difficult to predict and many of which are outside of our control. The Company does not undertake and specifically disclaims any obligation to revise any forward-looking statements to reflect the occurrence of anticipated or unanticipated events or circumstances after the date of such statements. Our actual results and financial condition may differ materially from those indicated in the forward-looking statements. Therefore, you should not rely on any of these forward-looking statements. Important factors that could cause our actual results and financial condition to differ materially from those indicated in the forward-looking statements include, among others, the following:
|
● |
the Company’s and Arvest’s ability to consummate the Merger or satisfy the conditions to the completion of the Merger on the terms expected or on the anticipated schedule; |
|
● |
the failure of the proposed Merger to close for any other reason; occurrence of any event, change or other circumstances that could give rise to the termination of the Merger Agreement; |
|
● |
the effect of the announcement of the Merger on customer relationships and operating results (including, without limitation, difficulties in maintaining relationships with employees or customers); |
|
● |
the diversion of management time on Merger related issues; |
|
● |
local, regional and national economic and financial conditions, including volatility in interest rates, equity prices and the value of financial assets; |
|
● |
volatility in the capital or credit markets; |
|
● |
the impact of conditions in the real estate market in the areas in which we do business; |
|
● |
the effects of competition from other commercial banks, thrifts, mortgage banking firms, consumer finance companies, credit unions, securities brokerage firms, insurance companies, money market and other mutual funds and other financial institutions operating in our market area and elsewhere, including institutions operating regionally, nationally and internationally, together with competitors offering banking products and services by mail, telephone and the Internet; |
|
● |
strategic actions, including mergers and acquisitions and our success in integrating acquired businesses; |
|
● |
the failure of assumptions underlying the establishment of our allowance for loan and lease losses; |
|
● |
the occurrence of hostilities, political instability or catastrophic events; |
|
● |
developments and changes in laws and regulations, revised rules and standards applied by the FRB, the FDIC and other federal and state banking regulators; |
|
● |
disruptions to our technology network including computer systems and software, as well as natural events such as severe weather, fires, floods and earthquakes or man-made or other disruptions of our operating systems, structures or equipment; and |
|
● |
such other factors as discussed in Part I, Item 1A. Risk Factors and in Part II, Item 7. Management’s Discussion and Analysis of Financial Condition and Results of Operations of this Annual Report on Form 10-K. |
You should carefully read and consider the risk factors described below as well as other information included in this Annual Report on Form 10-K and the information contained in other filings with the SEC. Any of these risks, if they actually occur, could materially and adversely affect the Company’s business, financial condition, liquidity, results of operations and prospects. Additional risks and uncertainties not presently known by us or that we currently deem to be immaterial may materially and adversely affect us.
Risks Related to Our Business:
Our profitability is dependent on our banking activities.
Because we are a bank holding company, our profitability is directly attributable to the success of our bank subsidiary. Our banking activities compete with other banking institutions on the basis of service, convenience and price. Due in part to regulatory changes and consumer demands, banks have experienced increased competition from other entities offering similar products and services. We rely on the profitability of our bank subsidiary and dividends received from our bank subsidiary for payment of our operating expenses and satisfaction of our obligations. As is the case with other similarly situated financial institutions, our profitability will be subject to the fluctuating cost and availability of funds, changes in the prime lending rate and other interest rates, changes in economic conditions in general and, because of the location of our banking offices, changes in economic conditions in Arkansas, Missouri and Oklahoma in particular.
Changes in interest rates could have a material adverse effect on the Bank’s profitability and asset values.
The operations of financial institutions such as the Bank are dependent to a large extent on net interest income, which is the difference between the interest income earned on interest earning assets such as loans and investment securities and the interest expense paid on interest bearing liabilities such as deposits and borrowings. Changes in the general level of interest rates can affect net interest income by affecting the difference between the weighted average yield earned on interest earning assets and the weighted average rate paid on interest bearing liabilities, or interest rate spread, and the average life of interest earning assets and interest bearing liabilities. Changes in interest rates also can affect our ability to originate loans; the value of our interest earning assets; our ability to obtain and retain deposits in competition with other available investment alternatives; and the ability of borrowers to repay adjustable or variable rate loans. Interest rates are highly sensitive to many factors, including governmental monetary policies, domestic and international economic and political conditions and other factors beyond our control. As of December 31, 2017, the Bank’s model simulations projected that 100, 200 and 300 basis point increases in interest rates would result in negative variances in net interest income ranging from 1% to 5% relative to the base case over the next twelve months and a decrease in interest rates of 100 basis points would result in a negative variance in net interest income of approximately 5% relative to the base case over the next twelve months. Based on these measures, the Bank estimates a limited impact on earnings for various interest rate change scenarios. Significant changes in the composition of our rate sensitive assets or liabilities could result in a more unbalanced position possibly causing interest rate changes to have a material impact on our earnings. In addition, earnings may be adversely affected during any period of changes in interest rates due to a number of factors including among other items, call features and interest rate caps and floors on various assets and liabilities, prepayments, the current interest rates on assets and liabilities to be repriced in each period, and the relative changes in interest rates on different types of assets and liabilities.
In addition, a significant and prolonged increase in interest rates could have a material adverse effect on the fair value of the investment securities portfolio classified as available for sale and, accordingly, stockholders’ equity. At December 31, 2017 the Bank had investment securities classified as available for sale with a fair value of $196.8 million with a net unrealized gain of $296,000. The impact on equity at December 31, 2017, net of tax, was an unrealized gain of $180,000.
The Company and the Bank face strong competition that may adversely affect profitability.
The Company and the Bank are subject to vigorous competition in all aspects and areas of our business from banks and other financial institutions, including commercial banks, savings and loan associations, savings banks, finance companies, credit unions and other providers of financial services, such as money market mutual funds, brokerage firms, consumer finance companies and insurance companies, and with non-financial institutions, including retail stores that maintain their own credit programs and governmental agencies that make available low cost or guaranteed loans to certain borrowers. Many of our competitors are larger financial institutions with substantially greater resources, lending limits, and larger branch systems. These competitors may be able to achieve economies of scale and, as a result, may offer a broader range of products and services as well as better pricing for those products and services. Competition from both bank and non-bank organizations will continue. Our inability to compete successfully could adversely affect profitability, which, in turn, could have a material adverse effect on our financial condition and results of operations.
We could experience deficiencies in our allowance for loan and lease losses.
Management maintains an allowance for loan and lease losses based upon, among other things:
• historical experience;
• repayment capacity of borrowers;
• an evaluation of local, regional and national economic conditions;
• regular reviews of delinquencies and loan portfolio quality;
• collateral evaluations;
• current trends regarding the volume and severity of problem loans;
• the existence and effect of concentrations of credit; and
• results of regulatory examinations.
Based on these factors, management makes various assumptions and judgments about the ultimate collectability of the loans in the portfolio. The determination of the appropriate level of the allowance for loan and lease losses inherently involves a high degree of subjectivity and management must make significant estimates of current credit risks and future trends, all of which may undergo material changes. In addition, the board of directors and the regulatory authorities periodically review the allowance for loan and lease losses and may require an increase in the provision for possible loan losses or the recognition of further loan charge-offs. Regulators’ judgments may differ from management. While management believes that the allowance for loan and lease losses is appropriate based on our evaluation, management may determine that an increase in the allowance for loan and lease losses is needed or regulators may require an increase in the allowance. Either of these occurrences could materially and adversely affect the Company’s financial condition and results of operations.
A new accounting standard may require us to increase our allowance for loan losses and may have a material adverse effect on our financial condition and results of operations.
The Financial Accounting Standards Board (“FASB”) has adopted a new accounting standard that will be effective for the Company and the Bank for our fiscal year beginning after December 15, 2019. This standard, referred to as Current Expected Credit Loss, or CECL, will require financial institutions to determine periodic estimates of lifetime expected credit losses on loans, and recognize the expected credit losses as allowances for loan losses. This will change the current method of providing allowances for loan losses that are probable, which may require us to increase our allowance for loan losses, and to greatly increase the types of data we would need to collect and review to determine the appropriate level of the allowance for loan losses. Any increase in our allowance for loan losses or expenses incurred to determine the appropriate level of the allowance for loan losses may have a material adverse effect on our financial condition and results of operations.
We depend on key personnel for our success.
Our operating results and ability to adequately manage our growth and minimize loan and lease losses are highly dependent on the services, managerial abilities and performance of our current executive officers and other key personnel. Losses of or changes in our current executive officers or other key personnel and their responsibilities may disrupt our business and could adversely affect our financial condition, results of operations and liquidity.
Our business depends on the condition of the local and regional economies where we operate.
All of our banking offices are located in Arkansas, Missouri and Southeast Oklahoma. As a result, our financial condition and results of operations may be significantly impacted by changes in the Arkansas, Missouri and Oklahoma economies. Slowdown in economic activity, deterioration in housing markets or increases in unemployment and under-employment in these areas may have a significant and disproportionate impact on consumer and business confidence and the demand for our products and services, result in an increase in non-payment of loans and leases and a decrease in collateral value, and significantly impact our deposit funding sources. Any of these events could have an adverse impact on our financial position, results of operations and liquidity.
A portion of the loan portfolio is related to commercial real estate and construction activities. Unexpected declines in real estate values and other market uncertainties may negatively impact these loans and could adversely impact results of operations.
As of December 31, 2017, approximately 49% of loans consisted of commercial real estate or construction project loans. Commercial real estate and construction lending are generally considered to involve a higher degree of risk due to a variety of factors, including generally larger loan balances, the dependency on successful completion or operation of the project for repayment, a need for a general stability of interest rates and loan terms that often do not require full amortization of the loan over its term and, instead, provide for a balloon payment at stated maturity. In recent years, commercial real estate markets have been experiencing substantial growth, and increased competitive pressures have contributed significantly to historically low capitalization rates and rising property values. Commercial real estate prices, according to many U.S. commercial real estate indices, are currently above the 2007 peak levels that contributed to the recent financial crisis. Accordingly, federal bank regulatory agencies have expressed concerns about weaknesses in the current commercial real estate market. Our failure to adequately implement and execute effective underwriting and risk management policies, procedures and controls with respect to commercial real estate lending could adversely affect our ability to increase this portfolio going forward and could result in an increased rate of delinquencies in, and increased losses, from this portfolio.
The Company and the Bank could be materially and adversely affected if any of our officers or directors fails to comply with bank and other laws and regulations.
Like any business, we are subject to risk arising from potential employee misconduct, including non-compliance with policies. Any interventions by regulatory authorities following such employee misconduct may result in adverse judgments, settlements, fines, penalties, injunctions, suspension or expulsion of our officers or directors from the banking industry. In addition to the monetary consequences, these measures could, for example, impact our ability to engage in, or impose limitations on, certain business activities. Significant regulatory action against the Company or the Bank or its officers or directors could materially and adversely affect the Company and the Bank’s business, financial condition or results of operations or cause significant reputational harm.
The Bank may incur increased employee benefit costs which could have a material adverse effect on its financial condition and results of operations.
The Company is a participant in the multiemployer Pentegra Defined Benefit Plan (the “Pentegra DB Plan”). Since the Pentegra DB Plan is a multiemployer plan, contributions of participating employers are commingled and invested on a pooled basis without allocation to specific employers or employees. Assets contributed to a multiemployer plan by one employer may be used to provide benefits to employees of other participating employers. In addition, if a participating employer stops contributing to the plan, the unfunded obligations of the multiemployer plan may be borne by the remaining participating employers.
Although the Pentegra DB Plan has been frozen since July 1, 2010, the Company has continued to incur costs consisting of administration and Pension Benefit Guaranty Corporation insurance expenses as well as amortization charges based on the funding level of the Pentegra DB Plan. The level of amortization charges is determined by the Pentegra DB Plan's funding shortfall, which is determined by comparing the Pentegra DB Plan’s liabilities to the Pentegra DB Plan’s assets. Net pension expense was approximately $162,000, $156,000 and $138,000 for the years ended December 31, 2017, 2016 and 2015, respectively, and contributions to the Pentegra DB Plan totaled $166,000, $162,000 and $148,000 for the years ended December 31, 2017, 2016 and 2015, respectively. In the second quarter of 2014, the Company elected to retire certain pension liabilities of the Pentegra DB Plan which resulted in a charge of $2.9 million. Although this election improved the funding status, material increases to the estimated amount of the Bank’s required contribution may occur. Additionally, if the Bank were to terminate its participation in the Pentegra DB Plan, the Bank could incur a significant withdrawal liability. Any of these events could have a material adverse effect on our financial condition, results of operations and liquidity.
An inability to make technological advances may reduce the Company and the Bank’s ability to successfully compete.
The banking industry is experiencing rapid changes in technology. In addition to improving customer services, effective use of technology increases efficiency and enables financial institutions to reduce costs. As a result, the Company and the Bank’s future success will depend in part on the ability to address customers’ needs by using technology. The Company and the Bank may be unable to effectively develop new technology-driven products and services and may be unsuccessful in marketing these products to our customers. Many competitors have greater resources to invest in technology. Any failure to keep pace with technological change affecting the financial services industry could have a material adverse impact on the Company and the Bank’s business, financial condition and results of operations.
Risks associated with cyber-security could negatively affect our earnings.
The financial services industry has experienced an increase in both the number and severity of reported cyber-attacks aimed at gaining unauthorized access to bank systems as a way to misappropriate assets and sensitive information, corrupt and destroy data, or cause operational disruptions.
We have established policies and procedures to prevent or limit the impact of security breaches, but such events may still occur or may not be adequately addressed if they do occur. Although we rely on security safeguards to secure our data, these safeguards may not fully protect our systems from compromises or breaches.
We also rely on the integrity and security of a variety of third party processors, payment, clearing and settlement systems, as well as the various participants involved in these systems, many of which have no direct relationship with us. Failure by these participants or their systems to protect our customers' transaction data may put us at risk for possible losses due to fraud or operational disruption.
Our customers are also the target of cyber-attacks and identity theft. Large scale identity theft could result in customers' accounts being compromised and fraudulent activities being performed in their name. We have implemented certain safeguards against these types of activities but they may not fully protect us from fraudulent financial losses.
The occurrence of a breach of security involving our customers' information, regardless of its origin, could damage our reputation and result in a loss of customers and business and subject us to additional regulatory scrutiny, and could expose us to litigation and possible financial liability. Any of these events could have a material adverse effect on our financial condition and results of operations.
We are subject to environmental liability risks.
A significant portion of our loan and lease portfolio is secured by real property. In the ordinary course of business, we may foreclose on and take title to real properties securing certain loans. In doing so, there is a risk that hazardous or toxic substances could be found on these properties. Additionally, we have acquired a number of retail banking facilities and other real properties as a result of the FNSC and Metropolitan acquisitions, any of which may contain hazardous or toxic substances. If hazardous or toxic substances are found, we may be liable for remediation costs, as well as for personal injury and property damage. Environmental laws may require us to incur substantial expenses and may materially reduce the affected property’s value or limit our ability to use or sell the affected property. In addition, future laws or more stringent interpretations or enforcement policies with respect to existing laws may increase our exposure to environmental liability. We have policies and procedures that require either formal or informal evaluation of environmental risks and liabilities on real property before originating any loan or foreclosure action, except for (a) loans originated for sale in the secondary market secured by one-to-four family residential properties and (b) certain loans where the real estate collateral is second lien collateral. These policies, procedures and evaluations may not be sufficient to detect all potential environmental hazards. The remediation costs and any other financial liabilities associated with an environmental hazard could have an adverse effect on our financial condition, results of operations and liquidity.
If we do not properly manage our credit risk, our business could be seriously harmed.
There are substantial risks inherent in making any loan or lease, including, but not limited to the following:
|
■ |
risks resulting from changes in economic and industry conditions; |
|
■ |
risks inherent in dealing with individual borrowers; |
|
■ |
risks inherent from uncertainties as to the future value of collateral; and |
|
■ |
the risk of non-payment of loans and leases. |
Although we attempt to minimize our credit risk through prudent loan and lease underwriting procedures and by monitoring concentrations of our loans and leases, there can be no assurance that these underwriting and monitoring procedures will reduce these risks. Moreover, as we expand into new markets, credit administration and loan and lease underwriting policies and procedures may need to be adapted to local conditions. The inability to properly manage our credit risk or appropriately adapt our credit administration and loan and lease underwriting policies and procedures to local market conditions or changing economic circumstances could have an adverse impact on our provision for loan and lease losses and our financial condition, results of operations and liquidity.
We rely on certain external vendors.
We are reliant upon certain external vendors to provide products and services necessary to maintain our day-to-day operations. Accordingly, our operations are exposed to risk that these vendors will not perform in accordance with applicable contractual arrangements or service level agreements. We maintain a system of policies and procedures designed to monitor vendor risks including, among other things, (i) changes in the vendor’s organizational structure, (ii) changes in the vendor’s financial condition and (iii) changes in the vendor’s support for existing products and services. While we believe these policies and procedures help to mitigate risk, the failure of an external vendor to perform in accordance with applicable contractual arrangements or the service level agreements could be disruptive to our operations, which could have a material adverse impact on our business and our financial condition and results of operations.
We may be adversely affected by risks associated with completed and potential acquisitions.
We have pursued acquisition opportunities that we believe support our business strategy and may enhance our profitability. Acquisitions involve numerous risks, including but not limited to the following:
|
● |
incurring time and expense associated with identifying and evaluating potential acquisitions and negotiating potential transactions, resulting in our attention being diverted from the operation of our existing business; |
|
● |
using inaccurate estimates and judgments to evaluate credit, operations, management and market risks with respect to the target institution or assets; |
|
● |
the risk that the acquired business will not perform to our expectations; |
|
● |
difficulties, inefficiencies or cost overruns in integrating and assimilating the organizational cultures, operations, technologies, services and products of the acquired business with ours; |
|
● |
the risk of key vendors not fulfilling our expectations or not accurately converting data; |
|
● |
entering geographic and product markets in which we have limited or no direct prior experience; |
|
● |
the potential loss of key employees, customers and deposits of acquired banks; |
|
● |
the potential for liabilities and claims arising out of the acquired businesses; and |
|
● |
the risk of not receiving required regulatory approvals or such approvals being restrictively conditional. |
Acquisitions of financial institutions also involve operational risks and uncertainties, and acquired companies may have unknown or contingent liabilities with no corresponding accounting allowance, exposure to unexpected asset quality problems that require writedowns or write-offs (as well as restructuring and impairment or other charges), difficulty retaining key employees and customers and other issues that could negatively affect our business. We may not be able to realize any projected cost savings, synergies or other benefits associated with any such acquisition we complete. Acquisitions may involve the payment of a premium over book and market values and, therefore, some dilution of our tangible book value and net income per common share may occur in connection with any future transaction. Failure to successfully integrate the entities we acquire into our existing operations could increase our operating costs significantly and have a material adverse effect on our business, financial condition and results of operations.
We must generally satisfy a number of meaningful conditions prior to completing any acquisition, including, in certain cases, federal and state regulatory approval. Bank regulators consider a number of factors when determining whether to approve a proposed transaction, including the effect of the transaction on financial stability and the ratings and compliance history of all institutions involved, including Community Reinvestment Act compliance, examination results and anti-money laundering and Bank Secrecy Act compliance records of all institutions involved. The process for obtaining required regulatory approvals has become substantially more difficult as a result of the recent financial crisis, which could affect our future business. We may fail to pursue, evaluate or complete strategic and competitively significant business opportunities as a result of our inability, or our perceived inability, to obtain any required regulatory approvals in a timely manner or at all.
In addition, we face significant competition from numerous other financial services institutions, many of which will have greater financial resources than we do, when considering acquisition opportunities. Accordingly, attractive acquisition opportunities may not be available to us. There can be no assurance that we will be successful in identifying or completing any future acquisitions.
The impact of changes to the Internal Revenue Code or federal, state or local taxes may adversely affect the Company’s financial results or business.
The Company is subject to changes in tax law that could impact the Company's effective tax rate. Tax law changes may or may not be retroactive to previous periods and could negatively affect the current and future financial performance of the Company. The full impact of the Tax Cuts and Jobs Act (the "Tax Act") which was enacted in 2017 will be subject to interpretations and assumptions made by the Company, further guidance or regulations that may be promulgated, and other actions that the Company may take as a result of the Tax Act.
Although the Company anticipates a significant decrease in its Federal income tax expense, there is no assurance that the Company will realize the benefits of the Tax Act in the amount that is currently anticipated or at all. The Company's customers are likely to experience varying effects from both the individual and business tax provisions of the Tax Act and those effects, whether positive or negative, may have a corresponding impact on the Company's business and the economy as a whole. Some customers may elect to use their additional cash flow from lower taxes to fund their existing levels of activity, decreasing borrowing needs. In addition, certain limitations on the federal income tax deductibility of business interest expense for certain customers could effectively increase the cost of borrowing and make equity or hybrid funding relatively more attractive, which could have a long-term negative impact on our lending volume. In addition, our tax benefit for certain tax advantaged assets, including obligations of state and political subdivisions held in our investment securities portfolio, could be negatively impacted as the tax benefit rate has been reduced from 35% to 21%, and the market value of such assets could be negatively impacted.
Risks Related to Our Industry:
The Company and the Bank operate in a heavily regulated environment, and that regulation could limit or restrict our activities and adversely affect the Company’s financial condition.
The financial services industry is highly regulated and we are subject to examination, supervision, and comprehensive regulation by various federal and state agencies, including the ASBD, the FRB and the FDIC. Compliance with these regulations is costly and may restrict some of our activities, including payment of dividends, mergers and acquisitions, investments, loans and interest rates and locations of offices. The regulators’ interpretation and application of relevant regulations are beyond our control and may change rapidly and unpredictably. Banking regulations are primarily intended to protect depositors and not shareholders.
In response to the financial crisis, the banking and financial services industry has been the subject of increased legislation and regulation. While recent trends may have shown a likelihood of continued expansion of financial services regulation, at this time, it is difficult to predict future legislative and regulatory changes that will result from the combination of a new President of the United States and the first year since 2010 in which both Houses of Congress have majority memberships from the same political party as the President. In recent years, however, both the new President and senior members of the House of Representatives have advocated for significant reduction of financial services regulation, to include amendments to the Dodd-Frank Act and structural changes to the CFPB. The new Administration and Congress also may cause broader economic changes due to changes in governing ideology and governing style. Future legislation, regulation, and government policy could affect the banking industry as a whole, including our business and results of operations, in ways that are difficult to predict. In addition, our results of operations also could be adversely affected by changes in the way in which existing statutes and regulations are interpreted or applied by courts and government agencies.
The fiscal and monetary policies of the federal government and its agencies could have a material adverse effect on our earnings.
The FRB regulates the supply of money and credit in the U.S. Its policies determine in large part the cost of funds for lending and investing and the return earned on those loans and investments, both of which may affect our net interest income and net interest margin. Changes in the supply of money and credit can also materially decrease the value of financial assets we hold, such as debt securities. The FRB’s policies can also adversely affect borrowers, potentially increasing the risk that they may fail to repay their loans and leases. Changes in such policies are beyond our control and difficult to predict; consequently, the impact of these changes on our activities and results of operations is difficult to predict.
Reductions in interchange fees would reduce our non-interest income.
An interchange fee is a fee merchants pay to the interchange network in exchange for the use of the network’s infrastructure and payment facilitation, and which is paid to debit, credit and prepaid card issuers to compensate them for the costs associated with card issuance and operation. In the case of credit cards, this includes the risk associated with lending money to customers. We earn interchange fees on these card transactions. Merchants, trying to decrease their operating expenses, have sought to, and have had some success at, lowering interchange rates. In particular, the Durbin Amendment to the Dodd-Frank Act limited the amount of interchange fees that may be charged for debit and prepaid card transactions for those card issuers with $10 billion or more in total assets. Several recent events and actions indicate a continuing focus on interchange fees by both regulators and merchants. Beyond pursuing litigation, legislation and regulation, merchants are also pursuing alternate payment platforms as a means to lower payment processing costs. To the extent interchange fees are further reduced, our non-interest income from those fees will be reduced, which could have a material adverse effect on our business and results of operations. In addition, the payment card industry is subject to the operating regulations and procedures set forth by payment card networks, and our failure to comply with these operating regulations, which may change from time to time, could subject us to various penalties or fees or the termination of our license to use the payment card networks, all of which could have a material adverse effect on our business, financial condition or results of operations.
Risks Related to Our Common Stock:
The trading volume of the Company’s common stock is lower than that of other financial services companies and the market price of our common stock may fluctuate significantly, which can make it difficult to sell shares of the Company’s common stock at times, volumes and prices attractive to our shareholders.
The Company’s common stock is listed on the NASDAQ Global Market under the symbol “BSF.” The average daily trading volume for shares of our common stock is lower than larger financial institutions. Because the trading volume of our common stock is lower, and thus has substantially less liquidity than the average trading market for many other publicly traded companies, sales of our common stock may place significant downward pressure on the market price of our common stock. In addition, market value of thinly traded stocks can be more volatile than stocks trading in an active public market.
The market price of our common stock has been volatile in the past and may fluctuate significantly as a result of a variety of factors, many of which are beyond our control. These factors include, in addition to those described elsewhere in this Annual Report on Form 10-K:
|
● |
actual or anticipated quarterly or annual fluctuations in our operating results, cash flows and financial condition; |
|
● |
changes in earnings estimates or publication of research reports and recommendations by financial analysts or actions taken by rating agencies with respect to us or other financial institutions; |
|
● |
speculation in the press or investment community generally or relating to our reputation or the financial services industry; |
|
● |
strategic actions by us or our competitors, such as acquisitions, restructurings, dispositions, financings or stock repurchases; |
|
● |
fluctuations in the stock price and operating results of our competitors; |
|
● |
abnormally high trading volumes in our common stock; |
|
● |
future issuances or re-sales of our equity or equity-related securities, or the perception that they may occur; |
|
● |
proposed or adopted regulatory changes or developments; |
|
● |
anticipated or pending investigations, proceedings, or litigation or accounting matters that involve or affect us; |
|
● |
domestic and international economic factors unrelated to our performance; and |
|
● |
general market conditions and, in particular, developments related to market conditions for the financial services industry. |
In addition, in recent years, the stock markets in general have experienced extreme price and volume fluctuations, and market prices for the stock of many companies, including those in the financial services sector, have experienced wide price fluctuations that have not necessarily been related to operating performance. This is due, in part, to investors’ shifting perceptions of the effect of changes and potential changes in the economy on various industry sectors. This volatility has had a significant effect on the market price of securities issued by many companies, including for reasons unrelated to their performance or prospects. These broad market fluctuations may adversely affect the market price of our common stock, notwithstanding our actual or anticipated operating results, cash flows and financial condition. The Company expects that the market price of our common stock will continue to fluctuate due to many factors, including prevailing interest rates, other economic conditions, our operating performance and investor perceptions of the outlook for the Company and the Bank specifically and the banking industry in general.
As a result of the lower trading volume of the Company’s common stock and its susceptibility to market price volatility, shareholders may not be able to resell their shares at times, volumes or prices they find attractive.
Bear State Financial Holdings, LLC holds a significant interest in the Company’s common stock and may have interests that differ from the interests of other shareholders.
Bear State Financial Holdings, LLC (“BSF Holdings”) currently owns approximately 40% of the outstanding shares of Company common stock. As a result, BSF Holdings is able to significantly influence corporate and management policies and the outcome of any corporate transaction or other matter submitted to Company shareholders for approval. Such transactions may include mergers and acquisitions, sales of all or some of the Company’s assets or purchases of assets, and other significant corporate transactions.
The interests of BSF Holdings may differ from those of the Company’s other shareholders, and it may take actions that advance its interests to the detriment of other shareholders.
This concentration of ownership could also have the effect of delaying, deferring or preventing a change in control or impeding a merger or consolidation, takeover or other business combination that could be favorable to the other holders of the Company’s common stock, and the market price of the Company’s common stock may be adversely affected by the absence or reduction of a takeover premium in the trading price.
Shares of Company common stock are not an insured deposit and are subject to substantial investment risk.
Investments in Company common stock are not a savings or deposit account or other obligation of the Bank and are not insured or guaranteed by the FDIC or any other governmental agency. Investment in Company common stock is inherently risky for the reasons described in this "RISK FACTORS" section, and is subject to the same market forces that affect the market price of the common stock of any company. As a result, you may lose some or all of your investment.
Future issuances of additional equity securities could result in dilution of existing shareholders’ equity ownership.
We may determine from time to time to issue additional equity securities to raise additional capital, support growth, or, as we have in recent years, to make acquisitions. Further, we may issue stock options, grant restricted stock awards or other equity awards to retain, compensate and/or motivate our employees and directors. These issuances of our securities could dilute the voting and economic interests of existing shareholders.
Risks Related to Our Pending Merger:
Business uncertainties while the Merger is pending may negatively impact our ability to attract and retain personnel and impact our customer relationships.
Uncertainty about the effect of the Merger on our employees and customers may have an adverse effect on us. These uncertainties may impair our ability to attract, retain and motivate key personnel until the Merger is completed and could cause customers and others that deal with us to seek to change their existing business relationships with us. Retention of certain employees may be challenging while the Merger is pending, as certain employees may experience uncertainty about their future roles with the combined company. If key employees depart because of issues relating to the uncertainty and difficulty of integration or a desire not to remain with the combined entity, our business could be harmed.
If the Merger is not completed, we will have incurred substantial expenses without realizing the expected benefits of the Merger.
We have incurred substantial expenses in connection with the negotiation and entry into the Merger Agreement and will incur additional expenses as we move toward completion of the transactions contemplated by the Merger Agreement. If the Merger is not completed, we would have to recognize the expenses we have incurred without realizing the expected benefits of the Merger, which could materially impact our earnings and results of operations.
Additionally, the closing price of our common stock on March 1, 2018 was $10.27 per share, which is 11.6% higher than the $9.20 closing price of our common stock on August 21, 2017, the day immediately prior to the announcement of the Merger. If the Merger is not completed, it is likely that the market price of our common stock will decline to the extent that the current market price reflects a market assumption that the Merger will be completed.
The Merger may distract our management from their other responsibilities and the Merger Agreement may limit our ability to pursue new opportunities.
The Merger could cause our management to focus their time and energies on matters related to the transaction that otherwise would be directed to our business and operations. Any such distraction on the part of our management could affect our ability to service existing business and develop new business and adversely affect our business and earnings before the completion of the Merger.
Additionally, the Merger Agreement contains operating covenants that limit certain of our operating activities or require the approval of Arvest before we may engage in such activities during the pendency of the Merger. These operating covenants may adversely affect our ability to develop or pursue new business opportunities.
The Merger Agreement limits our ability to pursue acquisition proposals and requires us to pay a termination fee under limited circumstances.
The Merger Agreement prohibits us from initiating, soliciting, knowingly encouraging or knowingly facilitating certain third party acquisition proposals. The Merger Agreement also provides that we must pay a termination fee in the amount of $14 million in the event the Merger Agreement is terminated under certain circumstances, including involving our failure to abide by certain obligations not to solicit acquisition proposals and our board of directors withdrawing or materially and adversely changing its recommendation that our shareholders approve the Merger proposal. These provisions might discourage a potential competing acquirer that might have an interest in acquiring all or a significant part of us from considering or proposing such an acquisition.
Our ability to complete the Merger is subject to the receipt of approval from the Federal Reserve Bank which may impose conditions that could adversely affect us or cause the Merger to be abandoned.
Before the Merger may be completed, Arvest must obtain the approval of the FRB. The FRB may impose conditions on the completion of the Merger, and any such conditions could have the effect of delaying completion of the Merger or causing a termination of the Merger Agreement. There can be no assurance as to whether the regulatory approval will be received, the timing of that approval, or whether any conditions will be imposed.
Shareholder litigation could prevent or delay the closing of the proposed Merger or otherwise negatively impact our business and operations.
We may incur additional costs in connection with the defense or settlement of the currently pending or any future shareholder lawsuits filed in connection with the proposed Merger. Such litigation could have an adverse effect on our financial condition and results of operations and could prevent or delay the consummation of the Merger.
Failure of the Merger to be completed and close could cause reputational harm and have a negative impact on our business, brand, operations, earnings, financial results and the trading and pricing of our common stock.
In the event that the Merger is not completed and does not ultimately close, such failure to complete and close the Merger could result in irreparable reputational harm as perceived by our customers, our employees, our investors, our shareholders, investor and securities analysts, our peers, others in the banking industry and any other third party whether presently known or unknown. A failure to complete and close the Merger could have a negative impact on our business, brand, operations, earnings, financial results and the trading and pricing of our common stock.
Item 1B. Unresolved Staff Comments.
None
The executive offices of the Company are located at 900 S Shackleford Road, Suite 401, Little Rock, Arkansas, and are leased from an unaffiliated third party. As of December 31, 2017, the Company conducted business through 42 branches, three personalized technology centers and three loan production offices which are owned or leased in various communities throughout Arkansas, Missouri and Southeast Oklahoma. Approximately 76% of the Company's banking locations are owned and 24% are leased.
The Company believes its facilities in the aggregate are suitable and adequate to operate its banking business. Additional information with respect to premises and lease commitments is presented in Note 8 of "Notes to the Consolidated Financial Statements" in Item 8 of this Form 10-K.
The Company is a defendant in certain claims and legal actions arising in the ordinary course of business. In the opinion of management, after consultation with legal counsel, the ultimate disposition of these matters is not expected to have a material adverse effect on the consolidated financial statements of the Company.
However, a shareholder lawsuit has been filed against the Company’s directors, to whom the Company owes indemnification and expense advancement obligations, in connection with the proposed Merger with Arvest. Owens and Hurliman v. Massey, et al., Case No. 60CV-17-5022, is a putative class action that was first filed on September 11, 2017 in the Circuit Court of Pulaski County, Arkansas. An amended complaint was filed on October 13, 2017, and the action was removed to the United States District Court for the Eastern District of Arkansas on November 1, 2017. The amended complaint names the individual members of the Company’s board of directors, as well as BSF Holdings, as defendants, and generally alleges, among other things, that members of the Company’s board of directors breached their fiduciary duties to the Company’s shareholders by agreeing to sell the Company for an inadequate price and agreeing to inappropriate deal protection provisions in the Merger Agreement that may preclude the Company from soliciting any potential acquirers and limit the ability of the Company’s board of directors to engage in discussions or negotiations for superior acquisition proposals. The amended complaint also alleges that the director defendants caused the Company to disseminate a proxy statement that is materially incomplete and misleading, and that Richard Massey and BSF Holdings, in their capacities as shareholders of the Company, breached fiduciary duties owed by them to the minority shareholders of the Company. The amended complaint seeks certification by the court as a shareholders’ class action, approval of the plaintiffs as proper plaintiff class representatives, injunctive relief enjoining the defendants from consummating the Merger unless and until the Company (a) adopts and implements a procedure or process to obtain a merger agreement providing the best possible terms for shareholders and (b) supplements its proxy disclosure (or, in the event the Merger is consummated, rescinding the Merger or awarding rescissory damages). The complaint also seeks to recover costs and disbursement from the defendants, including attorneys’ fees and experts’ fees.
The Company and its directors believe these allegations are without merit and intend to defend vigorously against these allegations. At this time, the Company is unable to state whether the likelihood of an unfavorable outcome of the lawsuit is probable or remote. The Company is also unable to provide an estimate of the range or amount of potential loss if the outcome should be unfavorable.
A second shareholder action, Reichert v. Bear State Financial, Inc., et al., Case No. 4:17-cv-654, was filed on October 11, 2017 in the United States District Court for the Eastern District of Arkansas. A third shareholder action, Parshall v. Bear State Financial, Inc., et al, Case No. 4:17-cv-669, is a putative class action filed on October 13, 2017 in the United States District Court for the Eastern District of Arkansas. The Reichert complaint named the Company and the individual members of the Company’s board of directors as defendants. The Parshall complaint named the Company, the Bank, the individual members of the Company’s board of directors and Arvest and Acquisition Sub as defendants. The Reichert and Parshall complaints generally alleged, among other things, that defendants violated Sections 14(a) and 20(a) of the Exchange Act by disseminating materially deficient and misleading disclosures in the proxy statement dated October 5, 2017 relating to the proposed Merger. The Reichert and Parshall complaints sought injunctive relief to enjoin the defendants from consummating the Merger unless and until the Company discloses the material information identified in the complaints. The complaints also sought to recover rescissory damages against the defendants and costs associated with bringing the actions, including attorneys’ fees and experts’ fees. The Company filed supplemental proxy materials prior to the November 15, 2017 special meeting of Company shareholders that mooted the claims of both plaintiffs. The Company then petitioned to have both cases dismissed on mootness grounds. Prior to a ruling on the Company’s motions, the plaintiffs voluntarily filed dismissal actions with the court on November 28, 2017. In Reichert, an order was entered on December 5, 2017 that dismissed the case without prejudice. In Parshall, an order was entered on January 4, 2018 that dismissed the case without prejudice.
Item 4. Mine Safety Disclosures.
Not applicable.
Item 5. Market for Registrant's Common Equity, Related Stockholder Matters, and Issuer Purchases of Equity Securities.
Shares of the Company's common stock are traded under the symbol "BSF" on the NASDAQ Global Market. At March 1, 2018, the Company had 37,811,704 shares of common stock outstanding and had approximately 584 holders of record.
The following table sets forth the reported high and low sales prices of a share of the Company's common stock and the cash dividends declared per share as reported by NASDAQ for the periods indicated.
|
Quarter Ended |
Year Ended December 31, 2017 |
Year Ended December 31, 2016 |
||||||||||||||||||||||
|
High |
Low |
Dividends |
High |
Low |
Dividends |
|||||||||||||||||||
|
March 31 |
$ | 10.45 | $ | 8.80 | $ | 0.03 | $ | 10.75 | $ | 7.61 | $ | -- | ||||||||||||
|
June 30 |
$ | 9.98 | $ | 8.66 | $ | 0.03 | $ | 10.90 | $ | 8.67 | $ | 0.025 | ||||||||||||
|
September 30 |
$ | 10.32 | $ | 8.84 | $ | 0.03 | $ | 10.22 | $ | 8.81 | $ | 0.025 | ||||||||||||
|
December 31 |
$ | 10.37 | $ | 10.19 | $ | 0.03 | $ | 10.95 | $ | 8.65 | $ | 0.025 | ||||||||||||
Our principal business operations are conducted through our bank subsidiary. Cash available to pay dividends to our common shareholders is derived primarily, if not entirely, from dividends paid by our bank subsidiary. The ability of our bank subsidiary to pay dividends, as well as our ability to pay dividends to our common shareholders, will continue to be subject to and limited by the results of operations of our bank subsidiary and by certain legal and regulatory restrictions. Further, any lenders making loans to us may impose financial covenants that may be more restrictive than regulatory requirements with respect to the payment of dividends to common shareholders. Accordingly, there can be no assurance that we will continue to pay dividends to our common shareholders in the future. See Note 21 to the Consolidated Financial Statements included in Item 8 of this Annual Report on Form 10-K and the Regulation discussion included in Item 1 of this Annual Report on Form 10-K for further discussion of dividend restrictions.
Issuer Purchases of Equity Securities
The Company did not purchase any of its equity securities during the fourth quarter of 2017.
Performance Graph
Below is a graph which summarizes the cumulative return earned by the Company’s shareholders since December 31, 2012, compared with the cumulative total return on the S&P 500 Index and SNL Small Cap Bank Index. This presentation assumes that the value of the investment in the Company’s common stock and each index was $100.00 on December 31, 2012 and that subsequent cash dividends were reinvested.
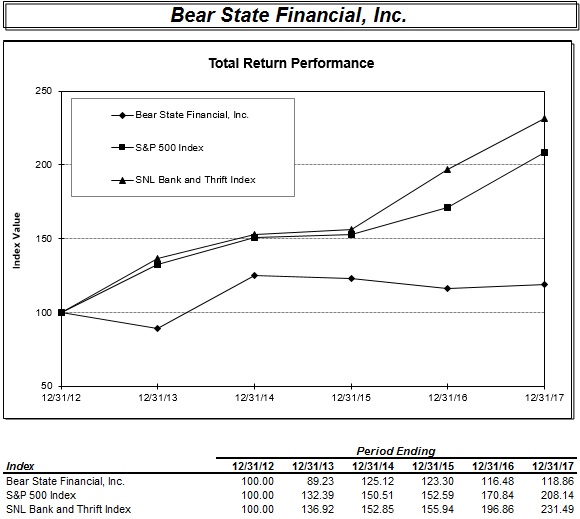
Item 6. Selected Financial Data.
The selected consolidated financial and other data of the Company set forth below and on the following page is not complete and should be read in conjunction with, and is qualified in its entirety by, the more detailed information, including the Consolidated Financial Statements and related Notes, appearing elsewhere herein and incorporated by reference herein.
|
At or For the Year Ended December 31, |
||||||||||||||||||||
|
2017 |
2016 |
2015 |
2014 |
2013 |
||||||||||||||||
|
(In Thousands, Except Per Share Data) |
||||||||||||||||||||
|
Selected Financial Condition Data: |
||||||||||||||||||||
|
Total assets |
$ | 2,160,963 | $ | 2,053,175 | $ | 1,920,216 | $ | 1,514,595 | $ | 548,872 | ||||||||||
|
Cash and cash equivalents |
53,568 | 78,789 | 52,131 | 113,086 | 23,970 | |||||||||||||||
|
Interest bearing time deposits in banks |
4,075 | 4,571 | 10,930 | 12,421 | 24,118 | |||||||||||||||
|
Investment securities–held to maturity at amortized cost |
42,775 | 26,977 | -- | -- | -- | |||||||||||||||
|
Investment securities–available for sale at fair value |
196,806 | 188,476 | 198,585 | 174,218 | 70,828 | |||||||||||||||
|
Loans receivable, net |
1,654,245 | 1,540,805 | 1,444,102 | 1,041,222 | 371,149 | |||||||||||||||
|
Loans held for sale |
3,815 | 8,954 | 7,326 | 6,409 | 4,205 | |||||||||||||||
|
Allowance for loan and lease losses |
18,992 | 15,584 | 14,550 | 13,660 | 12,711 | |||||||||||||||
|
Real estate owned, net |
1,648 | 1,945 | 3,642 | 4,792 | 8,627 | |||||||||||||||
|
Deposits |
1,499,444 | 1,644,080 | 1,607,683 | 1,263,797 | 469,725 | |||||||||||||||
|
Other borrowings |
386,811 | 152,004 | 72,380 | 61,258 | 5,941 | |||||||||||||||
|
Stockholders' equity |
253,157 | 233,427 | 223,157 | 170,454 | 71,187 | |||||||||||||||
|
Selected Operating Data: |
||||||||||||||||||||
|
Interest income |
$ | 86,267 | $ | 75,386 | $ | 60,846 | $ | 42,491 | $ | 18,365 | ||||||||||
|
Interest expense |
10,747 | 7,918 | 6,364 | 5,138 | 3,392 | |||||||||||||||
|
Net interest income |
75,520 | 67,468 | 54,482 | 37,353 | 14,973 | |||||||||||||||
|
Provision for loan losses |
4,498 | 2,516 | 1,797 | 1,588 | -- | |||||||||||||||
|
Net interest income after provision for loan losses |
71,022 | 64,952 | 52,685 | 35,765 | 14,973 | |||||||||||||||
|
Noninterest income |
17,739 | 16,711 | 13,547 | 10,039 | 5,426 | |||||||||||||||
|
Noninterest expense |
54,455 | 57,345 | 51,019 | 42,068 | 19,659 | |||||||||||||||
|
Income before income taxes |
34,306 | 24,318 | 15,213 | 3,736 | 740 | |||||||||||||||
|
Income tax provision (benefit) |
12,995 | 6,859 | 4,639 | (20,570 | ) | 11 | ||||||||||||||
|
Net income available to common stockholders |
$ | 21,311 | $ | 17,459 | $ | 10,574 | $ | 24,306 | $ | 729 | ||||||||||
|
Earnings per Common Share(1): |
||||||||||||||||||||
|
Basic |
$ | 0.57 | $ | 0.46 | $ | 0.31 | $ | 0.86 | $ | 0.03 | ||||||||||
|
Diluted |
0.56 | 0.46 | 0.30 | 0.84 | 0.03 | |||||||||||||||
|
Cash Dividends Declared per Common Share |
$ | 0.12 | $ | 0.075 | $ | -- | $ | -- | $ | -- | ||||||||||
(1) Per share amounts prior to 2015 have been adjusted to give effect to the 11% stock dividend paid in December 2014.
|
At or For the Year Ended December 31, |
|||||||||||||||||||||
| 2017 | 2016 | 2015 | 2014 | 2013 | |||||||||||||||||
| Selected Operating Ratios(1): | |||||||||||||||||||||
|
Return on average assets |
0.97 | % | 0.89 | % | 0.67 | % | 2.24 | % | 0.14 | % | |||||||||||
|
Return on average equity |
8.70 | 7.61 | 5.65 | 20.64 | 1.02 | ||||||||||||||||
|
Average equity to average assets |
11.18 | 11.67 | 11.77 | 10.86 | 13.32 | ||||||||||||||||
|
Interest rate spread(2) |
3.70 | 3.77 | 3.81 | 3.77 | 3.02 | ||||||||||||||||
|
Net interest margin(2) |
3.79 | 3.85 | 3.88 | 3.84 | 3.09 | ||||||||||||||||
|
Net interest income after provision for loan losses to noninterest expense |
130.42 | 113.27 | 103.27 | 85.02 | 76.16 | ||||||||||||||||
|
Noninterest expense to average assets |
2.49 | 2.92 | 3.21 | 3.88 | 3.68 | ||||||||||||||||
|
Average interest earning assets to average interest bearing liabilities |
115.91 | 116.36 | 116.19 | 113.61 | 110.21 | ||||||||||||||||
|
Operating efficiency(3) |
58.39 | 68.12 | 75.00 | 88.77 | 96.37 | ||||||||||||||||
|
Asset Quality Ratios(4): |
|||||||||||||||||||||
|
Nonaccrual loans to total assets |
0.79 | 0.85 | 1.01 | 0.65 | 2.18 | ||||||||||||||||
|
Nonperforming assets to total assets(5) |
0.87 | 0.94 | 1.22 | 0.98 | 3.75 | ||||||||||||||||
|
Allowance for loan and lease losses to classified loans(6) |
38.96 | 29.48 | 29.22 | 38.81 | 86.09 | ||||||||||||||||
|
Allowance for loan and lease losses to total loans |
1.14 | 1.00 | 1.00 | 1.29 | 3.31 | ||||||||||||||||
|
Capital Ratios(7): |
|||||||||||||||||||||
|
Tier 1 leverage ratio |
9.41 | 9.47 | 9.15 | 8.29 | 12.90 | ||||||||||||||||
|
Common equity tier 1 to risk-weighted assets |
11.34 | 11.04 | 10.62 | N/A | N/A | ||||||||||||||||
|
Tier 1 capital to risk-weighted assets |
11.34 | 11.04 | 10.62 | 10.89 | 17.40 | ||||||||||||||||
|
Total capital to risk-weighted assets |
12.39 | 11.96 | 11.52 | 12.11 | 18.68 | ||||||||||||||||
|
Other Data: |
|||||||||||||||||||||
|
Dividend payout ratio(8) |
21.23 | 16.15 | -- | (9) | -- | (9) | -- | (9) | |||||||||||||
|
(1) |
Ratios are based on average daily balances. |
|
(2) |
Interest rate spread represents the difference between the weighted average yield on average interest earning assets and the weighted average cost of average interest bearing liabilities, and net interest margin represents net interest income as a percentage of average interest earning assets. |
|
(3) |
Noninterest expense to net interest income plus noninterest income. |
|
(4) |
Asset quality ratios are end of period ratios. |
|
(5) |
Nonperforming assets consist of nonperforming loans and real estate owned. Nonperforming loans consist of nonaccrual loans and accruing loans 90 days or more past due. |
|
(6) |
Classified loans consist of loans graded substandard, doubtful or loss. |
|
(7) |
Capital ratios are end of period ratios for the Company at December 31, 2017, 2016, 2015 and 2014 and for First Federal Bank for December 31, 2013. |
|
(8) |
Dividend payout ratio is the total common stock cash dividends declared divided by net income available to common stockholders. |
|
(9) |
No cash dividends were paid in 2013, 2014 or 2015. However, in 2014 an 11% stock dividend was paid. |
Item 7. Management’s Discussion and Analysis of Financial Condition and Results of Operations.
Management's discussion and analysis of financial condition and results of operations (“MD&A”) is intended to assist a reader in understanding the consolidated financial condition and results of operations of the Company for the periods presented. The information contained in this section should be read in conjunction with the Consolidated Financial Statements and the accompanying Notes to the Consolidated Financial Statements and the other sections contained herein. Certain references to the Company and the Bank throughout MD&A are made using the first person notations of “we”, “us” or “our”.
2017 OVERVIEW
During 2017 the Company:
|
● |
Earned net income of $21.3 million, or $0.56 per diluted common share, compared to $17.5 million or $0.46 per diluted common share in 2016; |
|
● |
Improved its operating efficiency ratio to 58% for the year ended December 31, 2017 from 68% for the year ended December 31, 2016; |
|
● |
Improved efficiency and cost-effectiveness of our operations in 2017 by consolidating three retail branch locations and transitioning three branch locations to personalized technology centers equipped with ITMs during the year; and |
|
● |
Improved the ratio of nonperforming assets to total assets to 0.87% at December 31, 2017 compared to 0.94% at December 31, 2016. |
PENDING MERGER
On August 22, 2017, the Company and the Bank entered into the Merger Agreement with Arvest and Acquisition Sub, pursuant to which Arvest will acquire the Company and Bear State Bank.
Pursuant to the Merger Agreement, each share of the Company’s common stock issued and outstanding as of the effective time of the Merger will be converted into a right to receive $10.28 per share, payable in cash. The shareholders of the Company approved the Merger at a special meeting of shareholders held on November 15, 2017. The Merger is expected to close during late March or April of 2018, subject to satisfaction of customary closing conditions, including regulatory approval.
ACQUISITIONS
Metropolitan National Bank
On October 1, 2015, the Company completed its acquisition of Metropolitan from Marshfield Investment Company (“Marshfield”). On February 19, 2016, Metropolitan was merged with the charter of Bear State Bank, N.A. The benefits of these operational and organizational efficiencies began to be realized in the second quarter of 2016. The Company’s results of operations for the year ended December 31, 2016, includes the results of operations of Metropolitan for the entire year. The Company’s results of operations for the year ended December 31, 2015 includes the results of operations of Metropolitan after the acquisition date of October 1, 2015.
First National Security Company
The Company completed its merger with FNSC and its accompanying acquisition of FNSC’s subsidiaries, including First National and Heritage Bank, on June 13, 2014. On February 13, 2015, First Federal Bank, First National and Heritage Bank were consolidated into a single charter forming Bear State Bank, N.A. The Company has achieved significant operational and organizational improvements as a result of the charter consolidation and technology integration, the benefits of which the Company began to realize in the second quarter of 2015. The Company’s results of operations for the years ended December 31, 2016 and 2015, include the results of operations of First National and Heritage Bank for the entire year.
CRITICAL ACCOUNTING POLICIES
Various elements of our accounting policies, by their nature, are inherently subject to estimation techniques, valuation assumptions and other subjective assessments. These policies and the judgments, estimates and assumptions are described in greater detail in subsequent sections of this MD&A and in the Notes to the Consolidated Financial Statements included herein. In particular, Note 1 to the Consolidated Financial Statements – “Summary of Significant Accounting Policies” generally describes our accounting policies. We believe that the judgments, estimates and assumptions used in the preparation of our Consolidated Financial Statements are appropriate given the factual circumstances at the time. However, given the sensitivity of our Consolidated Financial Statements to these critical accounting policies, the use of other judgments, estimates and assumptions could result in material differences in our results of operations or financial condition.
Determination of the adequacy of the allowance for loan and lease losses (“ALLL”). In estimating the amount of credit losses inherent in our loan portfolio, various judgments and assumptions are made. For example, when assessing the condition of the overall economic environment, assumptions are made regarding market conditions and their impact on the loan portfolio. In the event the economy were to sustain a prolonged downturn, the loss factors applied to our portfolios may need to be revised, which may significantly impact the measurement of the ALLL. For impaired loans that are collateral dependent and for REO, the estimated fair value of the collateral may deviate significantly from the proceeds received when the collateral is sold.
Acquired loan amounts deemed uncollectible at acquisition date become part of the fair value calculation and are excluded from the ALLL. Quarterly reviews are completed on acquired loans to determine if changes in estimated cash flows have occurred. Subsequent decreases in the amount expected to be collected may result in a provision for loan and lease losses with a corresponding increase in the ALLL. Subsequent increases in the amount expected to be collected result in a reversal of any previously recorded provision for loan and lease losses and the related ALLL, if any, or prospective adjustment to the accretable yield if no provision for loan and lease losses had been recorded.
Acquired Loans. Acquired loans and leases are recorded at fair value at the date of acquisition. No allowance for loan and lease losses is recorded on the acquisition date as the fair value of the acquired assets incorporates assumptions regarding credit risk. The fair value adjustment on acquired loans without evidence of credit deterioration since origination will be accreted into earnings as a yield adjustment using the level yield method over the remaining life of the loan.
Acquired loans and leases with evidence of credit deterioration since origination such that it is probable at acquisition that the Bank will be unable to collect all contractually required payments are accounted for under the guidance in ASC Topic 310-30, Loans and Debt Securities Acquired with Deteriorated Credit Quality. As of the acquisition date, the difference between contractually required payments and the cash flows expected to be collected is the nonaccretable difference, which is included as a reduction of the carrying amount of acquired loans and leases. If the timing and amount of the future cash flows is reasonably estimable, any excess of cash flows expected at acquisition over the estimated fair value is the accretable yield and is recognized in interest income over the asset's remaining life using a level yield method.
Goodwill and other intangible assets. The Company accounts for acquisitions using the acquisition method of accounting. Under acquisition accounting, if the purchase price of an acquired company exceeds the fair value of its net assets, the excess is carried on the acquirer's balance sheet as goodwill. An intangible asset is recognized as an asset apart from goodwill if it arises from contractual or other legal rights or if it is capable of being separated or divided from the acquired entity and sold, transferred, licensed, rented or exchanged. Intangible assets are identifiable assets, such as core deposit intangibles, resulting from acquisitions which are amortized on a straight-line basis over an estimated useful life and evaluated for impairment whenever events or changes in circumstances indicate the carrying amount of the assets may not be recoverable.
Goodwill is not amortized but is evaluated at least annually for impairment or more frequently if events occur or circumstances change that may trigger a decline in the value of the reporting unit or otherwise indicate that a potential impairment exists. Potential impairment of goodwill exists when the carrying amount of a reporting unit exceeds its fair value. To the extent the reporting unit's carrying amount exceeds its fair value, an indication exists that the reporting unit's goodwill may be impaired, and implied fair value of the reporting unit's goodwill will be determined. If the implied fair value of the reporting unit's goodwill is lower than its carrying amount, goodwill is impaired and is written down to the implied fair value. The loss recognized is limited to the carrying amount of goodwill. Once an impairment loss is recognized, future increases in fair value will not result in the reversal of previously recognized losses.
Valuation of real estate owned. Fair value is estimated through current appraisals, real estate brokers’ opinions or listing prices. As these properties are actively marketed, estimated fair values may be adjusted by management to reflect current economic and market conditions. The estimated fair value of the collateral may deviate significantly from the proceeds received when the collateral is sold.
Valuation of investment securities. The Company’s investment securities available for sale are stated at estimated fair value in the consolidated financial statements with unrealized gains and losses, net of related income taxes, reported as a separate component of stockholders’ equity with any related changes included in accumulated other comprehensive income (loss). The Company utilizes independent third parties as its principal sources for determining fair value of its investment securities that are measured on a recurring basis. For investment securities traded in an active market, the fair values are based on quoted market prices if available. If quoted market prices are not available, fair values are based on market prices for comparable securities, broker quotes or comprehensive interest rate tables, pricing matrices or a combination thereof. For investment securities traded in a market that is not active, fair value is determined using unobservable inputs. The fair values of the Company’s investment securities traded in both active and inactive markets can be volatile and may be influenced by a number of factors including market interest rates, prepayment speeds, discount rates, credit quality of the issuer, general market conditions including market liquidity conditions and other factors. Factors and conditions are constantly changing and fair values could be subject to material variations that may significantly impact the Company’s financial condition, results of operations and liquidity.
Valuation of deferred tax assets. We recognize deferred tax assets and liabilities for the future tax consequences related to differences between the financial statement carrying amounts of existing assets and liabilities and their respective tax bases. We evaluate our deferred tax assets for recoverability using a consistent approach that considers the relative impact of negative and positive evidence, including our historical profitability and projections of future taxable income. We are required to establish a valuation allowance for deferred tax assets if we determine, based on available evidence at the time the determination is made, that it is more likely than not that some portion or all of the deferred tax assets will not be realized. In evaluating the need for a valuation allowance, we estimate future taxable income based on management-approved business plans and ongoing tax planning strategies. This process involves significant management judgment about assumptions that are subject to change from period to period based on changes in tax laws or variances between our projected operating performance, our actual results and other factors.
RESULTS OF OPERATIONS
Net Interest Income. The Company's results of operations depend primarily on its net interest income, which is the difference between interest income on interest earning assets, such as loans and investments, and interest expense on interest bearing liabilities, such as deposits and borrowings. Net interest income for 2017 was $75.5 million compared to $67.5 million in 2016 and $54.5 million in 2015. The increases in net interest income resulted from changes in interest income and interest expense discussed below.
Interest Income.
Interest income for 2017 was $86.3 million compared to $75.4 million in 2016. The increase in interest income in 2017 compared to 2016 was primarily due to increases in the average balances of and the yields earned on loans receivable and investment securities.
Interest income for 2016 was $75.4 million compared to $60.8 million in 2015. The increase in interest income in 2016 compared to 2015 was primarily due to increases in the average balances of loans receivable and investment securities and an increase in the yield earned on investment securities, partially offset by a decrease in the average yield earned on loans receivable. The increases in average interest earning asset balances were due to the Metropolitan acquisition as well as loan originations and investment purchases. The increase in the average yield earned on investment securities is primarily related to an increase in the average yield earned on municipal securities to 2.85% at December 31, 2016 compared to 2.70% at December 31, 2015. The decrease in the average yield on loans receivable is primarily due to loan repayments and prepayments at average yields higher than the average yield of the loan portfolio as well as a decrease in accretion income as a percentage of average loans.
Interest Expense.
Interest expense for 2017 was $10.7 million compared to $7.9 million in 2016. The increase in interest expense in 2017 compared to 2016 was primarily due to an increase in the average balance of other borrowings and an increase in the average rate paid on deposit accounts.
Interest expense for 2016 was $7.9 million compared to $6.4 million in 2015. The increase in interest expense in 2016 compared to 2015 was primarily due to an increase in the average balances of deposit accounts and borrowings, partially offset by decreases in the average rates paid on deposits and borrowings. The increase in average interest bearing liabilities was due to the Metropolitan acquisition as well as an increase in borrowings in 2016 related to the Company’s asset and liability management strategy.
Rate/Volume Analysis. The table below sets forth certain information regarding changes in interest income and interest expense of the Company for the periods indicated. For each category of interest earning assets and interest bearing liabilities, information is provided on changes attributable to (i) changes in volume (changes in average volume multiplied by prior rate); (ii) changes in rate (changes in rate multiplied by prior average volume); (iii) changes in rate-volume (changes in rate multiplied by the change in average volume); and (iv) the net change.
|
Year Ended December 31, |
||||||||||||||||
|
2017 vs. 2016 |
||||||||||||||||
|
Increase (Decrease) Due to |
||||||||||||||||
|
Volume |
Rate |
Rate/ Volume |
Total Increase (Decrease) |
|||||||||||||
|
(In Thousands) |
||||||||||||||||
|
Interest income: |
||||||||||||||||
|
Loans receivable |
$ | 7,773 | $ | 370 | $ | 41 | $ | 8,184 | ||||||||
|
Investment securities |
1,271 | 797 | 245 | 2,313 | ||||||||||||
|
Other interest earning assets |
91 | 227 | 66 | 384 | ||||||||||||
|
Total interest earning assets |
9,135 | 1,394 | 352 | 10,881 | ||||||||||||
|
Interest expense: |
||||||||||||||||
|
Deposits |
22 | 453 | 2 | 477 | ||||||||||||
|
Other borrowings |
2,623 | (94 | ) | (177 | ) | 2,352 | ||||||||||
|
Total interest bearing liabilities |
2,645 | 359 | (175 | ) | 2,829 | |||||||||||
|
Net change in net interest income |
$ | 6,490 | $ | 1,035 | $ | 527 | $ | 8,052 | ||||||||
|
Year Ended December 31, |
||||||||||||||||
|
2016 vs. 2015 |
||||||||||||||||
|
Increase (Decrease) Due to |
||||||||||||||||
|
Volume |
Rate |
Rate/ Volume |
Total Increase (Decrease) |
|||||||||||||
|
(In Thousands) |
||||||||||||||||
|
Interest income: |
||||||||||||||||
|
Loans receivable |
$ | 16,987 | $ | (2,381 | ) | $ | (709 | ) | $ | 13,897 | ||||||
|
Investment securities |
238 | 383 | 26 | 647 | ||||||||||||
|
Other interest earning assets |
(60 | ) | 69 | (13 | ) | (4 | ) | |||||||||
|
Total interest earning assets |
17,165 | (1,929 | ) | (696 | ) | 14,540 | ||||||||||
|
Interest expense: |
||||||||||||||||
|
Deposits |
1,237 | (50 | ) | (11 | ) | 1,176 | ||||||||||
|
Other borrowings |
461 | (57 | ) | (26 | ) | 378 | ||||||||||
|
Total interest bearing liabilities |
1,698 | (107 | ) | (37 | ) | 1,554 | ||||||||||
|
Net change in net interest income |
$ | 15,467 | $ | (1,822 | ) | $ | (659 | ) | $ | 12,986 | ||||||
Average Balance Sheets. The following table sets forth certain information relating to the Company's average balance sheets and reflects the average yield on assets and average cost of liabilities for the periods indicated. Such yields and costs are derived by dividing interest income or interest expense by the average balance of assets or liabilities, respectively, for the periods presented. Average balances are based on daily balances during the periods.
|
Year Ended December 31, |
||||||||||||||||||||||||||||||||||||
|
2017 |
2016 |
2015 |
||||||||||||||||||||||||||||||||||
|
Average Balance |
Interest |
Average Yield/ Cost |
Average Balance |
Interest |
Average Yield/ Cost |
Average Balance |
Interest |
Average Yield/ Cost |
||||||||||||||||||||||||||||
|
(Dollars in Thousands) |
||||||||||||||||||||||||||||||||||||
|
Interest earning assets: |
||||||||||||||||||||||||||||||||||||
|
Loans receivable(1) |
$ | 1,667,971 | $ | 79,120 | 4.74 | % | $ | 1,503,245 | $ | 70,936 | 4.72 | % | $ | 1,158,288 | $ | 57,039 | 4.92 | % | ||||||||||||||||||
|
Investment securities(2) |
266,530 | 6,450 | 2.42 | 203,899 | 4,137 | 2.03 | 190,870 | 3,490 | 1.83 | |||||||||||||||||||||||||||
|
Other interest earning assets |
57,803 | 697 | 1.21 | 44,814 | 313 | 0.70 | 55,258 | 317 | 0.57 | |||||||||||||||||||||||||||
|
Total interest earning assets |
1,992,304 | 86,267 | 4.33 | 1,751,958 | 75,386 | 4.30 | 1,404,416 | 60,846 | 4.33 | |||||||||||||||||||||||||||
|
Noninterest earning assets |
198,873 | 213,221 | 185,470 | |||||||||||||||||||||||||||||||||
|
Total assets |
$ | 2,191,177 | $ | 1,965,179 | $ | 1,589,886 | ||||||||||||||||||||||||||||||
|
Interest bearing liabilities: |
||||||||||||||||||||||||||||||||||||
|
Deposits |
$ | 1,398,840 | 6,992 | 0.50 | $ | 1,394,194 | 6,515 | 0.47 | $ | 1,131,870 | 5,339 | 0.47 | ||||||||||||||||||||||||
|
Other borrowings |
319,924 | 3,755 | 1.17 | 111,484 | 1,403 | 1.26 | 76,905 | 1,025 | 1.33 | |||||||||||||||||||||||||||
|
Total interest bearing liabilities |
1,718,764 | 10,747 | 0.63 | 1,505,678 | 7,918 | 0.53 | 1,208,775 | 6,364 | 0.53 | |||||||||||||||||||||||||||
|
Noninterest bearing deposits |
220,572 | 226,758 | 189,826 | |||||||||||||||||||||||||||||||||
|
Noninterest bearing liabilities |
6,822 | 3,447 | 4,096 | |||||||||||||||||||||||||||||||||
|
Total liabilities |
1,946,158 | 1,735,883 | 1,402,697 | |||||||||||||||||||||||||||||||||
|
Stockholders' equity |
245,019 | 229,296 | 187,189 | |||||||||||||||||||||||||||||||||
|
Total liabilities and stockholders' equity |
$ | 2,191,177 | $ | 1,965,179 | $ | 1,589,886 | ||||||||||||||||||||||||||||||
|
Net interest income |
$ | 75,520 | $ | 67,468 | $ | 54,482 | ||||||||||||||||||||||||||||||
|
Net earning assets |
$ | 273,540 | $ | 246,280 | $ | 195,641 | ||||||||||||||||||||||||||||||
|
Interest rate spread |
3.70 | % | 3.77 | % | 3.80 | % | ||||||||||||||||||||||||||||||
|
Net interest margin |
3.79 | % | 3.85 | % | 3.88 | % | ||||||||||||||||||||||||||||||
|
Ratio of interest earning assets to interest bearing liabilities |
115.91 | % | 116.36 | % | 116.19 | % | ||||||||||||||||||||||||||||||
(1) Includes nonaccrual loans.
(2) Includes FRB and FHLB stock.
Provision for Loan Losses. The provision for loan losses represents the amount added to the ALLL for the purpose of maintaining the ALLL at a level considered adequate to cover probable credit losses related to specifically identified loans as well as probable credit losses inherent in the remainder of the loan portfolio that have been incurred as of the balance sheet date. The adequacy of the ALLL is evaluated quarterly by management of the Bank based on the Bank’s past loan loss experience, known and inherent risks in the loan portfolio, adverse situations that may affect the borrower’s ability to repay, the estimated value of any underlying collateral and other qualitative factors.
Management determined that provisions for loan losses of $4.5 million and $2.5 million were required for the years ended December 31, 2017 and 2016, respectively, to maintain the ALLL at an adequate level. Management determined the necessity of the provision and the amount thereof taking into consideration (i) loans originated by the Bank during the period, (ii) changes in the overall portfolio of nonperforming and classified loans of the Bank, (iii) the credit quality of the Bank’s loan portfolio, (iv) ALLL coverage of classified loans and (v) discount balance of acquired loans. The increase in the provision was primarily attributable to loan originations and migration of acquired loans from the purchased loan portfolio to the originated loan portfolio. The ALLL as a percentage of loans receivable was 1.14% at December 31, 2017 compared to 1.00% at December 31, 2016. The ALLL as a percentage of nonaccrual loans was 110.7% at December 31, 2017 compared to 89.7% at December 31, 2016. The ALLL as a percentage of classified loans was 39.0% at December 31, 2017 compared to 29.5% at December 31, 2016. See “Allowance for Loan and Lease Losses” in the “Asset Quality” section. A quarterly review is completed on purchased credit impaired (“PCI”) loans to determine if changes in estimated cash flows have occurred. Subsequent decreases in the amount expected to be collected may result in a provision for loan and lease losses with a corresponding increase in the ALLL.
Noninterest Income. Noninterest income is generated primarily through deposit account fee income, profit on sale of loans, and earnings on life insurance policies. Total noninterest income increased $1.0 million to $17.7 million for 2017 compared to $16.7 million in 2016. The increase in 2017 was primarily due to increases in deposit fee income and earnings on bank owned life insurance, offset by a decrease in gain on sales of loans.
Total noninterest income increased $3.2 million to $16.7 million for 2016 compared to $13.5 million in 2015. The increase in 2016 was primarily due to increases in deposit fee income and gain on sales of loans. The increase in deposit fee income was primarily attributable to the acquisition of Metropolitan. The increase in gain on sales of loans was due to an increase in the volume of loans sold as well as an increase in the average net profit per loan.
Noninterest Expense. Noninterest expense consists primarily of employee compensation and benefits, office occupancy expense, data processing expense and other operating expense. Total noninterest expense decreased $2.9 million to $54.5 million in 2017 compared to $57.3 million in 2016 and increased $6.3 million to $57.3 million in 2016 compared to $51.0 million in 2015. The variances in certain noninterest expense items are further explained in the following paragraphs. The overall decrease in total noninterest expense for 2017 compared to 2016 was primarily related to the Company’s efforts to improve its operational efficiency as well as a decrease in the number of branches, partially offset by an increase in expenses associated with mergers and acquisitions and branch restructuring. The increase in overall total noninterest expense for 2016 compared to 2015 was primarily related to the increase in employee compensation expense, net occupancy expense and other expenses related to the acquisitions and integration of Metropolitan.
Salaries and Employee Benefits. Salaries and employee benefits decreased $2.7 million for the year ended December 31, 2017 compared to 2016 primarily due to a decrease in the average number of full time equivalent employees, partially offset by an increase in severance expense. Salaries expense for the year ended December 31, 2017 included $1.5 million of severance expense, primarily due to the severance of $0.8 million accrued upon the departure of our former CEO in January 2017. Salaries and employee benefits increased $5.4 million for the year ended December 31, 2016 compared to 2015 primarily due to an increase in personnel attributable to the acquisition of Metropolitan. The changes in the composition of this line item are presented below (in thousands):
| Years Ended December 31, | Change | ||||||||||||||||||||
|
2017 |
2016 |
2015 |
2017 vs 2016 |
2016 vs 2015 |
|||||||||||||||||
|
Salaries |
$ | 23,080 | $ | 24,978 | $ | 20,927 | $ | (1,898 | ) | $ | 4,051 | ||||||||||
|
Payroll taxes |
1,745 | 2,060 | 1,684 | (315 | ) | 376 | |||||||||||||||
|
Insurance |
1,967 | 2,264 | 1,845 | (297 | ) | 419 | |||||||||||||||
|
401(k) plan expenses |
422 | 416 | 316 | 6 | 100 | ||||||||||||||||
|
Other retirement plans |
187 | 179 | 166 | 8 | 13 | ||||||||||||||||
|
Stock compensation |
1,111 | 1,265 | 791 | (154 | ) | 474 | |||||||||||||||
|
Other |
7 | 6 | 13 | 1 | (7 | ) | |||||||||||||||
|
Total |
$ | 28,519 | $ | 31,168 | $ | 25,742 | $ | (2,649 | ) | $ | 5,426 | ||||||||||
Income Taxes. Income tax provision increased by $6.1 million for 2017 compared to 2016, primarily due to a $2.5 million revaluation of deferred tax assets and liabilities to account for the future impact of lower corporate tax rates as a result of the “Tax Cuts and Jobs Act” signed into law on December 22, 2017 as well as an increase in taxable income in 2017 partially offset by the recording of a valuation allowance reversal of $897,000 on deferred tax assets in the second quarter of 2016. The Company’s effective tax rate for the year ended December 31, 2017 (excluding the tax rate revaluation of the deferred tax asset) was 31.0% compared to 31.9% for the year ended December 31, 2016 (excluding the valuation allowance reversal).
The provision for income taxes was $6.9 million for the year ended December 31, 2016, compared to $4.6 million for 2015. Income tax provisions increased compared to 2015 as a result of increases in taxable income, which was partially offset by the reversal in the second quarter of 2016 of the valuation allowance on the deferred tax asset. The effective tax rate for 2016 was 31.9% (excluding the valuation allowance reversal) compared to 30.5% for 2015.
The difference in the effective tax rate compared to the statutory rate for each year presented is primarily due to interest income from non-taxable investments and earnings on life insurance policies. The differences in the adjusted effective tax rates of 31.0%, 31.9% and 30.5% for 2017, 2016 and 2015, respectively, are due to the relationship of the amount of the tax exempt items to the overall amount of pre-tax income in each of the years.
Lending Activities
Loan Composition. The following table sets forth certain data relating to the composition of the Bank’s loan portfolio by type of loan at the dates indicated.
|
December 31, |
||||||||||||||||||||||||||||||||||||||||
|
2017 |
2016 |
2015 |
2014 |
2013 |
||||||||||||||||||||||||||||||||||||
|
Amount |
Percentage |
Amount |
Percentage |
Amount |
Percentage |
Amount |
Percentage |
Amount |
Percentage |
|||||||||||||||||||||||||||||||
|
(Dollars in Thousands) |
||||||||||||||||||||||||||||||||||||||||
|
Mortgage loans: |
||||||||||||||||||||||||||||||||||||||||
|
One-to four-family residential |
$ | 391,225 | 23.39 | % | $ | 389,107 | 25.01 | % | $ | 401,036 | 27.50 | % | $ | 320,489 | 30.38 | % | $ | 129,308 | 33.68 | % | ||||||||||||||||||||
|
Multifamily residential |
89,087 | 5.32 | 92,460 | 5.94 | 74,226 | 5.09 | 45,181 | 4.28 | 25,773 | 6.71 | ||||||||||||||||||||||||||||||
|
Nonfarm nonresidential |
557,185 | 33.31 | 495,173 | 31.83 | 487,684 | 33.45 | 369,974 | 35.07 | 168,902 | 43.99 | ||||||||||||||||||||||||||||||
|
Farmland |
96,786 | 5.79 | 94,018 | 6.04 | 94,235 | 6.46 | 47,199 | 4.47 | 2,663 | 0.69 | ||||||||||||||||||||||||||||||
|
Construction and land development |
157,453 | 9.41 | 125,785 | 8.08 | 116,015 | 7.96 | 98,594 | 9.34 | 23,891 | 6.23 | ||||||||||||||||||||||||||||||
|
Total real estate loans |
1,291,736 | 77.22 | 1,196,543 | 76.90 | 1,173,196 | 80.46 | 881,437 | 83.54 | 350,537 | 91.30 | ||||||||||||||||||||||||||||||
|
Commercial loans |
345,087 | 20.63 | 323,096 | 20.77 | 246,304 | 16.89 | 139,871 | 13.26 | 29,033 | 7.56 | ||||||||||||||||||||||||||||||
|
Consumer loans |
36,036 | 2.15 | 36,265 | 2.33 | 38,594 | 2.65 | 33,809 | 3.20 | 4,368 | 1.14 | ||||||||||||||||||||||||||||||
|
Total loans receivable |
1,672,859 | 100.00 | % | 1,555,904 | 100.00 | % | 1,458,094 | 100.00 | % | 1,055,117 | 100.00 | % | 383,938 | 100.00 | % | |||||||||||||||||||||||||
|
Less: |
||||||||||||||||||||||||||||||||||||||||
|
Unearned discounts and net deferred loan costs (fees) |
378 | 485 | 558 | (235 | ) | (78 | ) | |||||||||||||||||||||||||||||||||
|
Allowance for loan and lease losses |
(18,992 | ) | (15,584 | ) | (14,550 | ) | (13,660 | ) | (12,711 | ) | ||||||||||||||||||||||||||||||
|
Total loans receivable, net |
$ | 1,654,245 | $ | 1,540,805 | $ | 1,444,102 | $ | 1,041,222 | $ | 371,149 | ||||||||||||||||||||||||||||||
Total loans receivable increased $117.0 million to $1.7 billion at December 31, 2017, compared to $1.6 billion at December 31, 2016. The change in the Bank’s loan portfolio was primarily due to increases in nonfarm nonresidential and commercial loans as a result of a greater emphasis on this line of business partially offset by loans paid off and principal payments made during the period.
Loan Concentrations. Loan concentrations are defined as loans to borrowers engaged in similar business-related activities, which would cause them to be similarly impacted by economic or other conditions. We regularly monitor these concentrations in order to consider adjustments in our lending practices. As of December 31, 2017 and 2016, there was no concentration of loans within any portfolio category to any group of borrowers engaged in similar activities or in a similar business that exceeded 10% of total loans.
Loan Maturity and Interest Rates. The following table sets forth certain information at December 31, 2017, regarding the dollar amount of loans maturing in the Bank’s loan portfolios based on their contractual terms to maturity. Demand loans and loans having no stated schedule of repayments and no stated maturity are reported as due in one year or less. All other loans are included in the period in which the final contractual repayment is due.
|
Within One Year |
After One Year Through Five Years |
After Five Years |
Total |
|||||||||||||
|
(In Thousands) |
||||||||||||||||
|
Real estate loans: |
||||||||||||||||
|
One- to four-family residential |
$ | 64,884 | $ | 156,566 | $ | 169,775 | $ | 391,225 | ||||||||
|
Multifamily residential |
3,137 | 68,106 | 17,844 | 89,087 | ||||||||||||
|
Nonfarm nonresidential |
72,127 | 272,368 | 212,690 | 557,185 | ||||||||||||
|
Farmland |
19,808 | 56,565 | 20,413 | 96,786 | ||||||||||||
|
Construction and land development |
36,477 | 83,757 | 37,219 | 157,453 | ||||||||||||
|
Commercial loans |
82,422 | 238,282 | 24,383 | 345,087 | ||||||||||||
|
Consumer loans |
6,000 | 27,196 | 2,840 | 36,036 | ||||||||||||
|
Total(1) |
$ | 284,855 | $ | 902,840 | $ | 485,164 | $ | 1,672,859 | ||||||||
(1) Gross of unearned discounts and net deferred loan costs and the ALLL.
The following table sets forth the dollar amount of the Bank’s loans at December 31, 2017, due after one year from such date which have fixed interest rates or which have floating or adjustable interest rates.
|
Fixed Rates |
Floating or Adjustable Rates |
Total |
||||||||||
|
(In Thousands) |
||||||||||||
|
Real estate loans: |
||||||||||||
|
One- to four-family residential |
$ | 208,354 | $ | 117,987 | $ | 326,341 | ||||||
|
Multifamily residential |
85,950 | -- | 85,950 | |||||||||
|
Nonfarm nonresidential |
384,051 | 101,007 | 485,058 | |||||||||
|
Farmland |
61,019 | 15,959 | 76,978 | |||||||||
|
Construction and land development |
101,603 | 19,373 | 120,976 | |||||||||
|
Commercial loans |
67,629 | 195,036 | 262,665 | |||||||||
|
Consumer loans |
29,851 | 185 | 30,036 | |||||||||
|
Total (1) |
$ | 938,457 | $ | 449,547 | $ | 1,388,004 | ||||||
|
(1) Gross of unearned discounts and net deferred loan costs and the ALLL. |
||||||||||||
Scheduled contractual maturities of loans do not necessarily reflect the actual term of the Bank’s loan portfolios. The average life of mortgage loans is substantially less than their average contractual terms because of loan prepayments.
ASSET QUALITY
Loans are generally placed on nonaccrual status when the loan is 90 days past due or, in the judgment of management, the probability of the full collection of principal and interest is deemed to be sufficiently uncertain to warrant further accrual. When a loan is placed on nonaccrual status, previously accrued but unpaid interest is deducted from interest income. Loans may be reinstated to accrual status when payments are made to bring the loan current and, in the opinion of management, full collection of the remaining principal and interest can be reasonably expected. The Bank may continue to accrue interest on certain loans that are 90 days past due or more if such loans are well secured and in the process of collection.
Real estate properties acquired through foreclosure are initially recorded at fair value less estimated selling costs. Fair value is typically determined based on the lower of a current appraised value or management’s estimate of the net realizable value based on the listing price of the property. Valuations of real estate owned are generally performed at least annually.
Nonperforming Assets. The following table sets forth the amounts and categories of the Company’s nonperforming assets at the dates indicated.
|
December 31, |
||||||||||||||||||||||||||||||||||||||||
|
2017 |
2016 |
2015 |
2014 |
2013 |
||||||||||||||||||||||||||||||||||||
|
Nonaccrual Loans: |
Net (2) |
% Assets |
Net (2) |
% Assets |
Net (2) |
% Assets |
Net (2) |
% Assets |
Net (2) |
% Assets |
||||||||||||||||||||||||||||||
|
One- to four-family residential |
$ | 7,061 | 0.32 | % | $ | 6,709 | 0.33 | % | $ | 6,455 | 0.34 | % | $ | 4,959 | 0.33 | % | $ | 4,258 | 0.77 | % | ||||||||||||||||||||
|
Multifamily residential |
-- | -- | -- | -- | 230 | 0.01 | % | -- | -- | -- | -- | |||||||||||||||||||||||||||||
|
Nonfarm nonresidential |
7,374 | 0.34 | % | 5,177 | 0.25 | % | 6,638 | 0.35 | % | 3,113 | 0.21 | % | 4,057 | 0.75 | % | |||||||||||||||||||||||||
|
Farmland |
657 | 0.03 | % | 783 | 0.04 | % | 973 | 0.05 | % | 734 | 0.05 | % | 782 | 0.15 | % | |||||||||||||||||||||||||
|
Construction and land development |
188 | 0.01 | % | 463 | 0.02 | % | 622 | 0.03 | % | 624 | 0.04 | % | 2,467 | 0.44 | % | |||||||||||||||||||||||||
|
Commercial |
1,669 | 0.08 | % | 4,071 | 0.20 | % | 4,235 | 0.22 | % | 306 | 0.02 | % | 350 | 0.06 | % | |||||||||||||||||||||||||
|
Consumer |
212 | 0.01 | % | 173 | 0.01 | % | 187 | 0.01 | % | 34 | -- | 24 | 0.01 | % | ||||||||||||||||||||||||||
|
Total nonaccrual loans |
17,161 | 0.79 | % | 17,376 | 0.85 | % | 19,340 | 1.01 | % | 9,770 | 0.65 | % | 11,938 | 2.18 | % | |||||||||||||||||||||||||
|
Accruing loans 90 days or more past due |
-- | -- | -- | -- | 451 | 0.02 | % | 353 | 0.02 | % | -- | -- | ||||||||||||||||||||||||||||
|
Real estate owned |
1,648 | 0.08 | % | 1,945 | 0.09 | % | 3,642 | 0.19 | % | 4,792 | 0.31 | % | 8,627 | 1.57 | % | |||||||||||||||||||||||||
|
Total nonperforming assets |
18,809 | 0.87 | % | 19,321 | 0.94 | % | 23,433 | 1.22 | % | 14,915 | 0.98 | % | 20,565 | 3.75 | % | |||||||||||||||||||||||||
|
Performing restructured loans |
882 | 0.04 | % | 4,804 | 0.23 | % | 284 | 0.01 | % | 566 | 0.04 | % | 494 | 0.09 | % | |||||||||||||||||||||||||
|
Total nonperforming assets and performing restructured loans (1) |
$ | 19,691 | 0.91 | % | $ | 24,125 | 1.17 | % | $ | 23,717 | 1.23 | % | $ | 15,481 | 1.02 | % | $ | 21,059 | 3.84 | % | ||||||||||||||||||||
|
(1) |
The table above does not include substandard loans which were judged not to be impaired totaling $30.7 million, $30.7 million, $30.2 million, $24.9 million and $2.9 million at December 31, 2017, 2016, 2015, 2014 and 2013, respectively, or ASC 310-30 purchased credit impaired loans which are considered to be performing at December 31, 2017, 2016, 2015 and 2014. |
|
(2) |
Loan balances are presented net of undisbursed loan funds, partial charge-offs, and interest payments recorded as reductions of principal for financial reporting purposes. |
Interest income recorded during the years ended December 31, 2017, 2016, 2015, 2014 and 2013 for loans in the above table was $48,000, $13,000, $14,000, $29,000 and $21,000, respectively. Under their original terms, these loans would have reported approximately $1.1 million, $1.4 million, $1.2 million, $745,000 and $873,000 of interest income for the years ended December 31, 2017, 2016, 2015, 2014 and 2013, respectively.
Nonaccrual Loans. The composition of nonaccrual loans by status was as follows as of the dates indicated (dollars in thousands):
|
December 31, 2017 |
December 31, 2016 |
Increase (Decrease) |
||||||||||||||||||||||
|
Balance |
Percentage of Total |
Balance |
Percentage of Total |
Balance |
Percentage of Total |
|||||||||||||||||||
|
Bankruptcy or foreclosure |
$ | 3,369 | 19.6 | % | $ | 1,442 | 8.3 | % | $ | 1,927 | 11.3 | % | ||||||||||||
|
Over 90 days past due |
7,777 | 45.3 | 5,784 | 33.3 | 1,993 | 12.0 | ||||||||||||||||||
|
30-89 days past due |
786 | 4.6 | 1,027 | 5.9 | (241 | ) | (1.3 | ) | ||||||||||||||||
|
Not past due |
5,229 | 30.5 | 9,123 | 52.5 | (3,894 | ) | (22.0 | ) | ||||||||||||||||
| $ | 17,161 | 100.0 | % | $ | 17,376 | 100.0 | % | $ | (215 | ) | -- | |||||||||||||
The following table presents nonaccrual loan activity for the year ended December 31, 2017 (in thousands):
|
Balance of nonaccrual loans—January 1, 2017 |
$ | 17,376 | ||
|
Loans added to nonaccrual status |
12,824 | |||
|
Net cash payments |
(6,584 | ) | ||
|
Loans returned to accrual status |
(4,059 | ) | ||
|
Charge-offs to the ALLL |
(352 | ) | ||
|
Transfers to REO and repossessed assets, net |
(2,044 | ) | ||
|
Balance of nonaccrual loans—December 31, 2017 |
$ | 17,161 |
Real Estate Owned. Changes in the composition of real estate owned during the year ended December 31, 2017 are presented in the following table (dollars in thousands).
|
January 1, 2017 |
Additions |
Fair Value Adjustments |
Net Sales Proceeds(1) |
Net Gain |
December 31, 2017 |
|||||||||||||||||||
|
One- to four-family residential |
$ | 904 | $ | 1,941 | $ | (34 | ) | $ | (1,763 | ) | $ | 156 | $ | 1,204 | ||||||||||
|
Land |
368 | 207 | (86 | ) | (307 | ) | 56 | 238 | ||||||||||||||||
|
Nonfarm nonresidential |
673 | -- | (2 | ) | (561 | ) | 96 | 206 | ||||||||||||||||
|
Total |
$ | 1,945 | $ | 2,148 | $ | (122 | ) | $ | (2,631 | ) | $ | 308 | $ | 1,648 | ||||||||||
|
(1) |
Net sales proceeds include $24,000 of loans made by the Bank to facilitate the sale of real estate owned. |
Classified Assets. Federal regulations require that each financial institution risk rate their classified assets into three classification categories - substandard, doubtful and loss. Substandard assets have one or more defined weaknesses and are characterized by the distinct possibility that some loss will be sustained if the deficiencies are not corrected. Doubtful assets have the weaknesses of substandard assets with the additional characteristic that the weaknesses make collection or liquidation in full on the basis of currently existing facts, conditions and values questionable, and there is a high possibility of loss. An asset classified loss is generally considered uncollectible and of such little value that continuance as an asset is not warranted. As of December 31, 2017 and 2016, the Bank did not have any assets classified as doubtful or loss.
The table below summarizes the Bank’s classified assets as of the dates indicated (dollars in thousands):
|
December 31, |
||||||||
|
2017 |
2016 |
|||||||
|
Nonaccrual loans |
$ | 17,161 | $ | 17,376 | ||||
|
Accruing classified loans |
31,587 | 35,495 | ||||||
|
Classified loans |
48,748 | 52,871 | ||||||
|
Real estate owned |
1,648 | 1,945 | ||||||
|
Total classified assets |
$ | 50,396 | $ | 54,816 | ||||
|
Texas Ratio (1) |
8.0 | % | 8.8 | % | ||||
|
Classified Assets Ratio (2) |
21.5 | % | 24.9 | % | ||||
|
(1) |
Defined as the ratio of nonperforming loans and real estate owned to the Bank’s Tier 1 capital plus the ALLL. |
|
(2) |
Defined as the ratio of classified assets to the Bank’s Tier 1 capital plus the ALLL. |
Allowance for Loan and Lease Losses. The Bank maintains an allowance for loan and lease losses for known and inherent losses determined by ongoing quarterly assessments of the loan portfolio. The estimated appropriate level of the ALLL is maintained through a provision for loan losses charged to earnings. Charge-offs are recorded against the ALLL when management believes the estimated loss has been confirmed. Subsequent recoveries, if any, are credited to the ALLL.
The ALLL consists of general and allocated (also referred to as specific) loan loss components. For loans that are troubled debt restructurings (“TDRs”) and other impaired loans where the relationship totals $500,000 or more, a specific loan loss allowance is established when the discounted cash flows or collateral value of the impaired loan is lower than the carrying value of the loan. The general loan loss allowance applies to loans that are not impaired and those impaired relationships under $500,000 and is based on historical loss experience adjusted for qualitative factors.
The ALLL represents management’s estimate of incurred credit losses inherent in the Bank’s loan portfolio as of the balance sheet date. The estimation of the ALLL is based on a variety of factors, including past loan loss experience, the current credit profile of the Bank’s borrowers, adverse situations that have occurred that may affect the borrowers’ ability to repay, the estimated value of underlying collateral, and general economic conditions. Losses are recognized when available information indicates that it is probable that a loss has been incurred and the amount of the loss can be reasonably estimated. This evaluation is inherently subjective as it requires estimates that are susceptible to significant revision as more information becomes available or conditions change.
A loan is considered impaired when, based on current information and events, it is probable that the Bank will be unable to collect the scheduled payments of principal or interest when due according to the contractual terms of the note. Factors considered by management in determining impairment include payment status, collateral value, and the probability of collecting scheduled principal and interest payments when due. Loans that experience insignificant payment delays and payment shortfalls generally are not classified as impaired. Management determines the significance of payment delays and payment shortfalls on a case-by-case basis, taking into consideration all of the circumstances surrounding the loan and the borrower, including the length of the delay, the reasons for the delay, the borrower’s prior payment record, and the amount of the short fall in relation to the principal and interest owed. Each quarter, classified loans where the borrower’s total loan relationship exceeds $500,000 are evaluated for impairment on a loan-by-loan basis. Nonaccrual loans and TDRs are considered to be impaired loans. TDRs are restructurings in which the Bank, for economic or legal reasons related to the debtor’s financial difficulties, grants a concession to the debtor that the Bank would not otherwise consider. Impairment is measured quarterly on a loan-by-loan basis for all TDRs and impaired loans where the aggregate relationship balance exceeds $500,000 by either the present value of expected future cash flows discounted at the loan’s effective interest rate, the loan’s obtainable market price, or the fair value of the collateral, if the loan is collateral dependent. Impaired loans under this threshold are aggregated and included in loan pools with their ALLL calculated as described in the following paragraph.
Groups of smaller balance homogeneous loans are collectively evaluated for impairment. Homogeneous loans are those that are considered to have common characteristics that provide for evaluation on an aggregate or pool basis. The Bank considers the characteristics of (1) one- to four-family residential mortgage loans; (2) unsecured consumer loans; and (3) collateralized consumer loans to permit consideration of the appropriateness of the ALLL of each group of loans on a pool basis. The primary methodology used to determine the appropriateness of the ALLL includes segregating impaired loans from the pools of loans, valuing these loans, and then applying a loss factor to the remaining pool balance based on several factors including past loss experience, inherent risks, and economic conditions in the primary market areas.
Acquired loan amounts deemed uncollectible at acquisition date become part of the fair value calculation and are excluded from the ALLL. Quarterly reviews are completed on acquired loans to determine if changes in estimated cash flows have occurred. Subsequent decreases in the amount expected to be collected may result in a provision for loan and lease losses with a corresponding increase in the ALLL. Subsequent increases in the amount expected to be collected result in a reversal of any previously recorded provision for loan and lease losses and related increase in ALLL, if any, or prospective adjustment to the accretable yield if no provision for loan and lease losses had been recorded or if the provision is less than the subsequent increase.
In estimating the amount of credit losses inherent in the loan portfolio, various judgments and assumptions are made. For example, when assessing the condition of the overall economic environment, assumptions are made regarding market conditions and their impact on the loan portfolio. For impaired loans that are collateral dependent, the estimated fair value of the collateral may deviate significantly from the proceeds received when the collateral is sold in the event that the Bank has to foreclose or repossess the collateral.
The Company considers the ALLL totaling approximately $19.0 million to be appropriate based on evaluations of the management of the Bank of the loan portfolio and the losses inherent in the loan portfolio as of December 31, 2017. Actual losses may substantially differ from currently estimated losses. Adequacy of the ALLL is periodically evaluated, and the ALLL could be significantly decreased or increased, which could materially affect the Company’s financial condition and results of operations.
The following table summarizes changes in the ALLL and other selected statistics for the periods indicated.
|
Year Ended December 31, |
||||||||||||||||||||
|
2017 |
2016 |
2015 |
2014 |
2013 |
||||||||||||||||
|
(Dollars in Thousands) |
||||||||||||||||||||
|
Total loans outstanding at end of period |
$ | 1,672,859 | $ | 1,555,904 | $ | 1,458,094 | $ | 1,055,117 | $ | 383,938 | ||||||||||
|
Average loans outstanding |
$ | 1,667,971 | $ | 1,503,245 | $ | 1,158,288 | $ | 756,078 | $ | 361,094 | ||||||||||
|
Allowance at beginning of period |
$ | 15,584 | $ | 14,550 | $ | 13,660 | $ | 12,711 | $ | 15,676 | ||||||||||
|
Charge-offs: |
||||||||||||||||||||
|
One- to four-family residential |
(148 | ) | (455 | ) | (661 | ) | (116 | ) | (1,249 | ) | ||||||||||
|
Multifamily residential |
(45 | ) | (1 | ) | -- | -- | (876 | ) | ||||||||||||
|
Nonfarm nonresidential |
-- | -- | (17 | ) | (114 | ) | (1,177 | ) | ||||||||||||
|
Farmland |
(203 | ) | -- | -- | -- | -- | ||||||||||||||
|
Construction and land development |
-- | -- | (10 | ) | (444 | ) | (115 | ) | ||||||||||||
|
Commercial |
(289 | ) | (83 | ) | (32 | ) | (29 | ) | (386 | ) | ||||||||||
|
Consumer (1) |
(630 | ) | (447 | ) | (354 | ) | (186 | ) | (142 | ) | ||||||||||
|
Purchased credit impaired |
(85 | ) | (801 | ) | (319 | ) | -- | -- | ||||||||||||
|
Total charge-offs |
(1,400 | ) | (1,787 | ) | (1,393 | ) | (889 | ) | (3,945 | ) | ||||||||||
|
Recoveries: |
||||||||||||||||||||
|
One- to four-family residential |
25 | 38 | 120 | 90 | 221 | |||||||||||||||
|
Multifamily residential |
-- | -- | -- | -- | -- | |||||||||||||||
|
Nonfarm nonresidential |
-- | 11 | 61 | 14 | 500 | |||||||||||||||
|
Farmland |
48 | -- | -- | -- | -- | |||||||||||||||
|
Construction and land development |
22 | 62 | 164 | 76 | 123 | |||||||||||||||
|
Commercial |
25 | 11 | 23 | 4 | 81 | |||||||||||||||
|
Consumer (1) |
104 | 83 | 118 | 66 | 55 | |||||||||||||||
|
Purchased credit impaired |
86 | 100 | -- | -- | -- | |||||||||||||||
|
Total recoveries |
310 | 305 | 486 | 250 | 980 | |||||||||||||||
|
Net charge-offs |
(1,090 | ) | (1,482 | ) | (907 | ) | (639 | ) | (2,965 | ) | ||||||||||
|
Total provisions for losses |
4,498 | 2,516 | 1,797 | 1,588 | -- | |||||||||||||||
|
Allowance at end of period |
$ | 18,992 | $ | 15,584 | $ | 14,550 | $ | 13,660 | $ | 12,711 | ||||||||||
|
ALLL as a percentage of total loans outstanding at end of period |
1.14 | % | 1.00 | % | 1.00 | % | 1.29 | % | 3.31 | % | ||||||||||
|
Net loans charged-off as a percentage of average loans outstanding |
0.07 | % | 0.10 | % | 0.08 | % | 0.08 | % | 0.82 | % | ||||||||||
|
ALLL as a percentage of nonaccrual loans |
110.7 | % | 89.7 | % | 75.2 | % | 139.8 | % | 106.5 | % | ||||||||||
___________________________________________
|
(1) |
Consumer loan charge-offs include overdraft charge-offs of $448,000, $365,000, $316,000, $148,000 and $125,000, for the years ended December 31, 2017, 2016, 2015, 2014 and 2013, respectively. Consumer loan recoveries include recoveries of overdraft charge-offs of $99,000, $79,000, $75,000, $47,000 and $52,000, for the years ended December 31, 2017, 2016, 2015, 2014 and 2013, respectively. |
The following table presents, on a consolidated basis, the allocation of the Bank’s ALLL by the type of loan at each of the dates indicated as well as the percentage of loans in each category to total loans receivable. These allowance amounts have been computed using the Bank’s internal models. The amounts shown are not necessarily indicative of the actual future losses that may occur within a particular category.
|
December 31, |
||||||||||||||||||||||||||||||||||||||||
|
2017 |
2016 |
2015 |
2014 |
2013 |
||||||||||||||||||||||||||||||||||||
|
Amount |
Percentage |
Amount |
Percentage |
Amount |
Percentage |
Amount |
Percentage |
Amount |
Percentage |
|||||||||||||||||||||||||||||||
|
(Dollars in Thousands) |
||||||||||||||||||||||||||||||||||||||||
|
One- to four-family residential |
$ | 4,244 | 23.25 | % | $ | 3,896 | 24.83 | % | $ | 3,870 | 27.29 | % | $ | 4,488 | 29.96 | % | $ | 4,549 | 33.68 | % | ||||||||||||||||||||
|
Multifamily residential |
1,027 | 5.32 | 962 | 5.94 | 665 | 5.09 | 791 | 4.28 | 1,001 | 6.71 | ||||||||||||||||||||||||||||||
|
Nonfarm nonresidential |
4,426 | 33.19 | 3,210 | 31.34 | 3,599 | 32.77 | 4,243 | 34.15 | 4,271 | 43.99 | ||||||||||||||||||||||||||||||
|
Farmland |
1,106 | 5.79 | 863 | 6.04 | 714 | 6.46 | 342 | 4.47 | 158 | 0.69 | ||||||||||||||||||||||||||||||
|
Construction and land development |
2,315 | 9.33 | 1,791 | 7.99 | 1,456 | 7.81 | 1,023 | 9.03 | 1,383 | 6.23 | ||||||||||||||||||||||||||||||
|
Commercial |
4,881 | 20.60 | 3,909 | 20.73 | 2,565 | 16.82 | 2,315 | 13.14 | 1,268 | 7.56 | ||||||||||||||||||||||||||||||
|
Consumer |
556 | 2.15 | 360 | 2.33 | 166 | 2.64 | 101 | 3.19 | 81 | 1.14 | ||||||||||||||||||||||||||||||
|
Purchased credit impaired |
437 | 0.37 | 593 | 0.80 | 1,515 | 1.12 | 357 | 1.78 | -- | -- | ||||||||||||||||||||||||||||||
|
Total |
$ | 18,992 | 100.00 | % | $ | 15,584 | 100.00 | % | $ | 14,550 | 100.00 | % | $ | 13,660 | 100.00 | % | $ | 12,711 | 100.00 | % | ||||||||||||||||||||
Investment Securities
The investment portfolio of the Company is designed primarily to provide and maintain liquidity, to provide collateral for pledging requirements, to complement the Company’s interest rate risk strategy and to generate a favorable return. The Company’s investment policy, as established by the Board of Directors, is currently implemented within the parameters set by the asset/liability management committee. The Company is authorized to invest in obligations issued or fully guaranteed by the U.S. Government, certain federal agency obligations, certain time deposits, negotiable certificates of deposit issued by commercial banks and other insured financial institutions, municipal securities, corporate debt securities, and other specified investments.
Investment securities that management has the positive intent and ability to hold to maturity are classified as held to maturity and are reported at amortized cost. Investment securities classified as available for sale are reported at fair value, with unrealized gains and losses excluded from earnings and reported net of tax in other comprehensive income. At December 31, 2017, investment securities with a fair value of approximately $122.7 million were pledged as collateral for certain deposits in excess of $250,000 and for other purposes, including investment securities with carrying values of approximately $13.4 million at December 31, 2017, for securities sold under agreements to repurchase. At December 31, 2017, investments in the debt and/or equity securities of any one issuer did not exceed more than 10% of the Company's stockholders' equity.
The following table sets forth the amortized cost (in thousands) of investment securities that contractually mature during each of the periods indicated and the weighted average yields for each range of maturities at December 31, 2017. Weighted average yields for municipal obligations have not been adjusted to a tax-equivalent basis. Expected maturities may differ from contractual maturities because issuers may have the right to call or prepay the obligation without prepayment penalties.
|
One Year or Less |
After One Year Through Five Years |
After Five Years Through Ten Years |
After Ten Years |
Total |
||||||||||||||||||||||||||||||||||||
|
Amount |
Yield |
Amount |
Yield |
Amount |
Yield |
Amount |
Yield |
Amount |
Yield |
|||||||||||||||||||||||||||||||
|
Available for Sale |
||||||||||||||||||||||||||||||||||||||||
|
U.S. Treasuries and government agencies |
$ | 500 | 1.35 | % | $ | 2,500 | 1.24 | % | $ | -- | -- | $ | -- | -- | $ | 3,000 | 1.26 | % | ||||||||||||||||||||||
|
Municipal securities |
3,872 | 2.13 | % | 13,425 | 2.42 | % | 14,145 | 2.76 | % | 60,615 | 2.91 | % | 92,057 | 2.78 | % | |||||||||||||||||||||||||
|
Residential mortgage-backed securities |
-- | -- | 1 | 1.07 | % | -- | -- | 96,452 | 2.41 | % | 96,453 | 2.41 | % | |||||||||||||||||||||||||||
|
Corporate debt securities |
-- | -- | -- | -- | 5,000 | 5.63 | % | -- | -- | 5,000 | 5.63 | % | ||||||||||||||||||||||||||||
|
Total |
$ | 4,372 | 2.04 | % | $ | 15,926 | 2.23 | % | $ | 19,145 | 3.51 | % | $ | 157,067 | 2.60 | % | $ | 196,510 | 2.65 | % | ||||||||||||||||||||
|
Held to Maturity |
||||||||||||||||||||||||||||||||||||||||
|
Municipal securities |
$ | -- | -- | $ | -- | -- | $ | 6,506 | 2.20 | % | $ | 36,269 | 2.80 | % | $ | 42,775 | 2.71 | % | ||||||||||||||||||||||
|
Total |
$ | -- | -- | $ | -- | -- | $ | 6,506 | 2.20 | % | $ | 36,269 | 2.80 | % | $ | 42,775 | 2.71 | % | ||||||||||||||||||||||
As of December 31, 2017, the Company held approximately $133.8 million of investment securities with issuer call options, of which approximately $24.9 million are callable within one year.
The following table sets forth the carrying value of the Company's investment securities as of the dates indicated.
|
December 31, |
||||||||||||
|
2017 |
2016 |
2015 |
||||||||||
| (In Thousands) | ||||||||||||
|
Available for Sale |
|
|||||||||||
|
U.S. Treasuries and government agencies |
$ | 2,963 | $ | 5,631 | $ | 49,500 | ||||||
|
Municipal securities |
92,945 | 87,050 | 63,933 | |||||||||
|
Residential mortgage-backed securities |
95,678 | 95,795 | 85,152 | |||||||||
|
Corporate debt securities |
5,220 | -- | -- | |||||||||
|
Total |
$ | 196,806 | $ | 188,476 | $ | 198,585 | ||||||
|
Held to Maturity |
||||||||||||
|
Municipal securities |
$ | 42,775 | $ | 26,977 | $ | -- | ||||||
|
Total |
$ | 42,775 | $ | 26,977 | $ | -- | ||||||
The decreases in U.S. Treasury and government agency securities were primarily due to calls and maturities during the years ended December 31, 2017 and 2016. The increases in municipal securities and residential mortgage backed securities during the years ended December 31, 2017 and 2016 were due to reinvestment of proceeds from sales, calls and maturities of investment securities to provide a better risk adjusted return. The overall yield of the available for sale investment portfolio improved to 2.65% at December 2017 compared to 2.52% at December 31, 2016 and 2.06% at December 31, 2015.
DEPOSITS AND BORROWINGS
Deposits. Changes in the composition of deposits between December 31, 2017 and 2016 are presented in the following table (dollars in thousands).
|
December 31, |
December 31, |
Increase |
|
|||||||||||||
|
2017 |
2016 |
(Decrease) | % Change | |||||||||||||
|
Checking accounts |
$ | 717,869 | $ | 724,137 | $ | (6,268 | ) | (0.87 | )% | |||||||
|
Money market accounts |
184,788 | 206,388 | (21,600 | ) | (10.47 | ) | ||||||||||
|
Savings accounts |
162,448 | 164,653 | (2,205 | ) | (1.34 | ) | ||||||||||
|
Certificates of deposit |
434,339 | 548,902 | (114,563 | ) | (20.87 | ) | ||||||||||
|
Total deposits |
$ | 1,499,444 | $ | 1,644,080 | $ | (144,636 | ) | (8.80 | )% | |||||||
The following table presents the average balance of each type of deposit and the average rate paid on each type of deposit and/or total deposits for the periods indicated.
|
Year Ended December 31, |
||||||||||||||||||||||||
|
2017 |
2016 |
2015 |
||||||||||||||||||||||
|
Average Balance |
Average Rate Paid |
Average Balance |
Average Rate Paid |
Average Balance |
Average Rate Paid |
|||||||||||||||||||
|
(Dollars in Thousands) |
||||||||||||||||||||||||
|
Savings accounts |
$ | 165,069 | 0.11 | % | $ | 164,773 | 0.12 | % | $ | 129,556 | 0.13 | % | ||||||||||||
|
Money market accounts |
205,761 | 0.40 | 213,780 | 0.37 | 134,606 | 0.33 | ||||||||||||||||||
|
Checking accounts – interest |
496,406 | 0.17 | 480,206 | 0.18 | 401,156 | 0.19 | ||||||||||||||||||
|
Checking accounts - noninterest |
220,572 | -- | 226,758 | -- | 189,827 | -- | ||||||||||||||||||
|
Certificates of deposit |
531,604 | 0.98 | 535,435 | 0.89 | 466,551 | 0.87 | ||||||||||||||||||
|
Total deposits |
$ | 1,619,412 | 0.43 | % | $ | 1,620,952 | 0.40 | % | $ | 1,321,696 | 0.40 | % | ||||||||||||
The following table sets forth maturities of the Bank’s certificates of deposit of $100,000 or more at December 31, 2017 by time remaining to maturity.
|
Amount |
||||
|
|
(In Thousands) |
|||
| Quarter Ending: | ||||
|
March 31, 2018 |
$ | 46,490 | ||
|
June 30, 2018 |
41,952 | |||
|
September 30, 2018 |
36,125 | |||
|
December 31, 2018 |
21,815 | |||
|
After December 31, 2018 |
69,581 | |||
|
Total certificates of deposit with balances of $100,000 or more |
$ | 215,963 | ||
Short Term and Other Borrowings. Other borrowings increased in 2017 by $234.8 million primarily due to an increase in FHLB advances of $244.7 million due to an increase in short term advances, offset by repayments of longer term advances and repayments of $12.3 million on the Company’s line of credit and notes payable, both with an unaffiliated bank.
The following table sets forth information with respect to the Company’s consolidated borrowings at and during the periods indicated. Borrowings include securities sold under agreement to repurchase and other borrowings as reflected on the consolidated statements of financial condition.
|
At or For the Year Ended December 31, |
||||||||||||
|
2017 |
2016 |
2015 |
||||||||||
|
(Dollars in Thousands) |
||||||||||||
|
Maximum month end balance |
$ | 400,256 | $ | 171,118 | $ | 91,586 | ||||||
|
Average balance |
319,924 | 111,484 | 76,905 | |||||||||
|
Year end balance |
400,256 | 171,118 | 84,455 | |||||||||
|
Weighted average interest rate: |
||||||||||||
|
At end of year |
1.46 | % | 1.00 | % | 1.26 | % | ||||||
|
During the year |
1.17 | % | 1.26 | % | 1.33 | % | ||||||
LIQUIDITY AND CAPITAL RESOURCES
The primary source of funds for the Company is the receipt of dividends from the Bank, the receipt of management fees from the Bank, cash balances maintained, and borrowings from an unaffiliated bank. Payment of dividends by the Bank is subject to certain regulatory restrictions as set forth in banking laws and regulations. See “Regulation” included in Item 1 Business.
The Company’s primary uses of cash include injecting capital into subsidiaries, stock repurchases, debt service requirements, the payment of dividends, and paying for general operating expenses.
The Company's liquidity objective is to ensure that the Bank has funding and access to sources of funding to ensure that cash flow requirements for deposit withdrawals and credit demands are met in an orderly and timely manner without unduly penalizing profitability. A major component of our overall asset/liability management efforts surrounds pricing of the liability side to ensure adequate liquidity and proper spread and interest margin management. Reliance on any one funding source is kept to a minimum by prioritizing those sources in terms of both availability and time to activation.
In order to maintain proper levels of liquidity, the Bank has several sources of funds available. Generally, the Bank relies on cash on hand and due from banks, federal funds sold, cash flow generated by the repayment of principal and interest on and/or the sale of loans and securities, and deposits as its primary sources of funds for continuing operations, to fund loans and leases, and to acquire investment securities and other assets. Commercial, consumer and public funds customers in our local markets are the principal deposit sources utilized. The bank utilizes FHLB advances and brokered deposits as part of its asset and liability management strategy primarily when funds from the primary sources are insufficient to meet funding needs and/or when the pricing and terms from these secondary sources are more favorable to our strategy.
At December 31, 2017, the Bank’s unused borrowing availability primarily consisted of (1) $230.0 million of available borrowing capacity with the FHLB, (2) $116.9 million of investment securities available to pledge for federal funds or other borrowings and (3) $103.0 million of available unsecured federal funds borrowing lines. In addition, at December 31, 2017, the Company had available borrowing capacity of $12.4 million with an unaffiliated bank.
At December 31, 2017, the Company’s consolidated liquidity ratio was approximately 9.33% which represents liquid assets as a percentage of deposits and short-term borrowings. As of the same date, the Company’s overall adjusted liquidity ratio was 23.81%, which represents liquid assets plus borrowing capacity with the FHLB and correspondent banks as a percentage of deposits and short-term borrowings. The Company anticipates it will continue to rely primarily on principal and interest repayments on loans and securities and deposits to provide liquidity, as well as other funding sources as appropriate. Additionally, where appropriate, the secondary sources of borrowed funds and brokered deposits described above will be used to augment the Company’s primary funding sources. We believe that we have sufficient liquidity to satisfy the current and projected operations of the Company and the Bank.
At December 31, 2017, the Company’s leverage, common equity tier 1, tier 1 risk-based and total risk-based capital ratios were 9.41%, 11.34%, 11.34% and 12.39%, respectively, compared to capital adequacy requirements of 4%, 4.5%, 6% and 8%, respectively. See Note 21 to the Consolidated Financial Statements – “Regulatory Matters” for more information about the Company’s and the Bank’s capital requirements and ratios.
The loan agreement governing the line of credit and notes payable to an unaffiliated bank contains affirmative and negative covenants addressing the ability of the Company and its subsidiaries to, among other things, incur additional indebtedness, maintain property and insurance coverage, pledge assets and incur liens, engage in mergers and acquisitions, redeem capital stock and engage in transactions with affiliates. The agreement also contains financial covenants, including a minimum fixed charge coverage ratio of 2.0 to 1.0, a maximum loan to value ratio of 50%, a maximum classified asset ratio of 50% and a minimum Tier 1 leverage ratio of 8% for the Bank. At December 31, 2017, the Company was in compliance with the applicable covenants imposed by the loan agreement.
OFF-BALANCE SHEET ARRANGEMENTS and CONTRACTUAL OBLIGATIONS
At December 31, 2017, the Bank was contractually obligated to make future minimum payments as follows (in thousands):
|
Less Than |
More Than |
|||||||||||||||||||
|
1 Year |
1-3 Years |
3 - 5 Years |
5 Years |
Total |
||||||||||||||||
|
Certificates of deposit maturities |
$ | 285,203 | $ | 110,412 | $ | 32,114 | $ | 6,610 | $ | 434,339 | ||||||||||
|
Other borrowings |
361,977 | 17,545 | 1,890 | 5,399 | 386,811 | |||||||||||||||
|
Lease obligations |
768 | 653 | 435 | 2,841 | 4,697 | |||||||||||||||
At December 31, 2017, the Bank was contractually obligated to fund future obligations as follows (in thousands):
|
Less Than |
More Than |
|||||||||||||||||||
|
1 Year |
1-3 Years |
3 - 5 Years |
5 Years |
Total |
||||||||||||||||
|
Unused lines of credit |
$ | 59,154 | $ | 44,580 | $ | 28,604 | $ | 2,443 | $ | 134,781 | ||||||||||
|
Unadvanced portion of construction loans |
14,097 | 11,418 | 16,394 | 6,550 | 48,459 | |||||||||||||||
|
Standby letters of credit |
1,389 | 594 | 104 | 1,572 | 3,659 | |||||||||||||||
|
Loan origination commitments |
40,410 | -- | -- | -- | 40,410 | |||||||||||||||
The Bank’s primary off-balance sheet commitments include unused lines of credit, the unadvanced portion of construction loans, and commercial and standby letters of credit, which have maturity dates rather than payment due dates. These commitments are not required to be recorded on the Company’s balance sheet. Since commitments associated with letters of credit and lending and financing arrangements may expire unused, the amounts shown do not necessarily reflect the actual future cash funding requirements. See Note 17 to the Consolidated Financial Statements-“Off-Balance Sheet Arrangements and Commitments” for further discussion on these arrangements.
DIVIDENDS
During the years ended December 31, 2017 and 2016, the Company distributed cash dividends of $0.12 per share and $0.075 per share, respectively. No dividends were distributed during the year ended December 31, 2015. The Company may not declare or pay cash dividends on its shares of common stock if the effect thereof would cause the Company’s stockholders’ equity to be reduced below applicable regulatory capital maintenance requirements for insured institutions. In addition, the Bank is subject to limitations on dividends that can be paid to the parent company without prior approval of the applicable regulatory agencies. ASBD regulations specify that the maximum dividend state banks may pay to the parent company in any calendar year without prior approval is 75% of the current year earnings plus 75% of the retained net earnings of the preceding year. Since the Bank is also under supervision of the FRB, the maximum dividend that may be paid without prior approval by the FRB is the Bank’s net profits to date for that year combined with its retained net profits for the preceding two years. At December 31, 2017, the Bank had approximately $18.6 million available for payment of dividends to the Company without prior regulatory approval from the ASBD and approximately $24.5 million available for payment of dividends to the Company without prior regulatory approval from the FRB.
IMPACT OF INFLATION AND CHANGING PRICES
The financial statements and related financial data presented herein have been prepared in accordance with accounting principles generally accepted in the United States of America, which require the measurement of financial position and operating results in terms of historical dollars, without considering changes in relative purchasing power over time due to inflation.
Unlike most industrial companies, virtually all of the Company’s assets and liabilities are monetary in nature. As a result, interest rates generally have a more significant impact on a financial institution's performance than does the effect of inflation.
Impact of new accounting standards
See Note 1 to the Consolidated Financial Statements - “Summary of Significant Accounting Policies.”
Item 7A. Quantitative and Qualitative Disclosures about Market Risk.
INTEREST RATE SENSITIVITY
Interest rate risk represents the potential impact of interest rate changes on net income and capital resulting from mismatches in repricing opportunities of assets and liabilities over a period of time. A number of tools are used to monitor and manage interest rate risk and interest rate sensitivity, including an earnings simulation model and interest sensitivity gap analysis.
Management recommends and the Board of Directors sets the asset and liability policies which are implemented by the Asset and Liability Management Committee (ALCO). The purpose of the ALCO is to communicate, coordinate and control asset/liability management consistent with the Company’s business plan and board-approved policies. The ALCO establishes and monitors the volume and mix of assets and funding sources taking into account relative costs and spreads, interest rate sensitivity and liquidity needs. The objectives are to manage assets and funding sources to produce results that are consistent with liquidity, capital adequacy, growth, risk and profitability goals. At times, depending on the level of general interest rates, the relationship between long- and short-term interest rates, market conditions and competitive factors, we may determine to increase our interest rate risk position somewhat in order to maintain or increase our net interest margin.
The ALCO meets at least quarterly to review, among other things, economic conditions and interest rate outlook, current and projected liquidity needs and capital positions and anticipated changes in the volume and mix of assets and liabilities. At each meeting, the ALCO recommends appropriate strategy changes based on this review. The Chief Financial Officer is responsible for reviewing and reporting on the effects of the policy implementations and strategies to the Board of Directors on a quarterly basis. ALCO regularly reviews interest rate risk by forecasting the impact of alternative interest rate environments on net interest income and market value of portfolio equity, which is defined as the net present value of an institution's existing assets, liabilities and off-balance sheet instruments, and evaluating such impacts against the maximum potential changes in net interest income and market value of portfolio equity that are authorized by the Board of Directors.
The earnings simulation modeling process, management’s primary analytical tool, projects a baseline net interest income (assuming no changes in interest rate levels) and estimates changes in that baseline net interest income resulting from changes in interest rate levels. The model assumes the balance sheet remains static and that its structure does not change over the course of the year. This model incorporates assumptions regarding the level of interest rates or balance changes for indeterminate maturity deposits for a given level of market rate changes. These assumptions have been developed through anticipated pricing behavior. Key assumptions in the simulation models include the relative timing of prepayments, cash flows and maturities. These assumptions are inherently uncertain and, as a result, the model cannot precisely estimate net interest income or precisely predict the impact of a change in interest rates on net interest income. Actual results will differ from simulated results due to the timing, magnitude and frequency of interest rate changes and changes in market conditions and management strategies, among other factors.
The following table presents the earnings simulation model’s projected impact of a change in interest rates on the projected baseline net interest income for the twelve month periods commencing January 1, 2018 and 2017, respectively. These are good faith estimates and assume that the composition of our interest sensitive assets and liabilities existing at year-end will remain constant over the relevant twelve month measurement period and changes in market interest rates are instantaneous, parallel and sustained across the yield curve regardless of duration of pricing characteristics of specific assets or liabilities.
|
|
% Change in Projected Baseline Net Interest Income |
|
|
Changes in Interest Rates (in bps) |
Twelve Months Commencing January 1, 2018 |
Twelve Months Commencing January 1, 2017 |
| +400 | -6.8% | 1.7% |
| +300 | -4.9% | 1.7% |
| +200 | -3.0% | 1.6% |
| +100 | -1.1% | 1.3% |
| -100 | -4.7% | -6.7% |
|
-200 |
Not meaningful |
Not meaningful |
| -300 | Not meaningful | Not meaningful |
| -400 | Not meaningful | Not meaningful |
This earnings simulation analysis does not contemplate any actions that we might undertake in response to changes in market interest rates. We believe these estimates are not necessarily indicative of what actually could occur in the event of immediate interest rate increases or decreases of this magnitude. As interest-bearing assets and liabilities reprice in different time frames and proportions to market interest rate movements, various assumptions must be made based on historical relationships of these variables in reaching any conclusion. Since these correlations are based on competitive and market conditions, we anticipate that our future results will likely be different from the foregoing estimates, and such differences could be material.
Item 8. Financial Statements and Supplementary Data.
Report of Independent Registered Public Accounting Firm
Audit Committee, Board of Directors and Stockholders
Bear State Financial, Inc.
Little Rock, Arkansas
Opinion on the Financial Statements
We have audited the accompanying consolidated statements of financial condition of Bear State Financial, Inc. (the "Company") as of December 31, 2017 and 2016, the related consolidated statements of income, comprehensive income, stockholders' equity and cash flows for each of the years in the three-year period ended December 31, 2017, and the related notes (collectively referred to as the "financial statements"). In our opinion, the consolidated financial statements referred to above present fairly, in all material respects, the financial position of the Company as of December 31, 2017 and 2016, and the results of its operations and its cash flows for each of the years in the three-year period ended December 31, 2017, in conformity with accounting principles generally accepted in the United States of America.
We also have audited, in accordance with the standards of the Public Company Accounting Oversight Board (United States) ("PCAOB"), the Company's internal control over financial reporting as of December 31, 2017, based on criteria established in Internal Control-Integrated Framework (2013) issued by the Committee of Sponsoring Organizations of the Treadway Commission (COSO) and our report dated March 16, 2018, expressed an unqualified opinion on the effectiveness of the Company’s internal control over financial reporting.
Basis for Opinion
These financial statements are the responsibility of the Company's management. Our responsibility is to express an opinion on the Company's financial statements based on our audits.
We are a public accounting firm registered with the PCAOB and are required to be independent with respect to the Company in accordance with the U.S. federal securities laws and the applicable rules and regulations of the Securities and Exchange Commission and the PCAOB.
We conducted our audits in accordance with the standards of the PCAOB. Those standards require that we plan and perform the audits to obtain reasonable assurance about whether the financial statements are free of material misstatement, whether due to error or fraud. Our audits included performing procedures to assess the risks of material misstatement of the financial statements, whether due to error or fraud, and performing procedures that respond to those risks. Such procedures include examining, on a test basis, evidence regarding the amounts and disclosures in the financial statements. Our audits also included evaluating the accounting principles used and significant estimates made by management, as well as evaluating the overall presentation of the financial statements. We believe that our audits provide a reasonable basis for our opinion.
/s/ BKD, LLP
We have served as the Company’s auditor since 2010.
Little Rock, Arkansas
March 16, 2018
REPORT OF INDEPENDENT REGISTERED PUBLIC ACCOUNTING FIRM ON INTERNAL CONTROL OVER FINANCIAL REPORTING
Audit Committee, Board of Directors and Stockholders
Bear State Financial, Inc.
Little Rock, Arkansas
Opinion on the Internal Control over Financial Reporting
We have audited Bear State Financial Inc.'s (the "Company") internal control over financial reporting as of December 31, 2017, based on criteria established in Internal Control – Integrated Framework (2013) issued by the Committee of Sponsoring Organizations of the Treadway Commission (COSO).
In our opinion, the Company maintained, in all material respects, effective internal control over financial reporting as of December 31, 2017, based on criteria established in Internal Control – Integrated Framework (2013) issued by the Committee of Sponsoring Organizations of the Treadway Commission (COSO).
We also have audited, in accordance with the standards of the Public Company Accounting Oversight Board (United States) ("PCAOB"), the consolidated financial statements of the Company and our report dated March 16, 2018, expressed an unqualified opinion thereon.
Basis for Opinion
The Company's management is responsible for maintaining effective internal control over financial reporting and for its assessment of the effectiveness of internal control over financial reporting, included in the accompanying Management’s Report on Internal Control over Financial Reporting. Our responsibility is to express an opinion on the Company's internal control over financial reporting based on our audit.
We are a public accounting firm registered with the PCAOB and are required to be independent with respect to the Company in accordance with the U.S. federal securities laws and the applicable rules and regulations of the Securities and Exchange Commission and the PCAOB.
We conducted our audit in accordance with the standards of the PCAOB. Those standards require that we plan and perform the audit to obtain reasonable assurance about whether effective internal control over financial reporting was maintained in all material respects.
Our audit included obtaining an understanding of internal control over financial reporting, assessing the risk that a material weakness exists and testing and evaluating the design and operating effectiveness of internal control based on the assessed risk. Our audit also included performing such other procedures as we considered necessary in the circumstances. We believe that our audit provides a reasonable basis for our opinion.
Definitions and Limitations of Internal Control over Financial Reporting
A company's internal control over financial reporting is a process designed to provide reasonable assurance regarding the reliability of financial reporting and the preparation of reliable financial statements in accordance with accounting principles generally accepted in the United States of America. Because management's assessment and our audit also were conducted to meet the reporting requirements of Section 112 of the Federal Deposit Insurance Corporation Improvement Act (FDICIA), our examination of the Company's internal control over financial reporting included controls over the preparation of financial statements in accordance with accounting principles generally accepted in the United States of America and with the instructions to the Consolidated Financial Statements for Bank Holding Companies (Form FR Y-9C). A company's internal control over financial reporting includes those policies and procedures that (1) pertain to the maintenance of records that, in reasonable detail, accurately and fairly reflect the transactions and dispositions of the assets of the company; (2) provide reasonable assurance that transactions are recorded as necessary to permit preparation of financial statements in accordance with accounting principles generally accepted in the United States of America, and that receipts and expenditures of the company are being made only in accordance with authorizations of management and directors of the company; and (3) provide reasonable assurance regarding prevention, or timely detection and correction of unauthorized acquisition, use, or disposition of the company's assets that could have a material effect on the financial statements.
Because of its inherent limitations, internal control over financial reporting may not prevent or detect misstatements. Also, projections of any evaluation of effectiveness to future periods are subject to the risk that controls may become inadequate because of changes in conditions or that the degree of compliance with the policies or procedures may deteriorate.
/s/ BKD, LLP
Little Rock, Arkansas
March 16, 2018
MANAGEMENT REPORT ON INTERNAL CONTROL OVER FINANCIAL REPORTING
The management of Bear State Financial, Inc. and its subsidiary Bear State Bank, (collectively referred to as the “Company”) is responsible for the preparation, integrity, and fair presentation of its published financial statements and all other information presented in this annual report. The financial statements have been prepared in accordance with accounting principles generally accepted in the United States of America (“GAAP”) and, as such, include amounts based on informed judgments and estimates made by management.
Management is responsible for establishing and maintaining adequate internal control over financial reporting as defined in Rule 13a-15(f) under the Securities Exchange Act of 1934. The Company’s internal control over financial reporting is a process designed to provide reasonable assurance regarding the reliability of financial reporting and the preparation and fair presentation of the Company’s financial statements for external purposes in accordance with GAAP and includes those policies and procedures that:
Pertain to the maintenance of records that in reasonable detail accurately and fairly reflect the transactions and dispositions of the assets of the Company;
Provide reasonable assurance that transactions are recorded as necessary to permit preparation of financial statements in accordance with GAAP, and that receipts and expenditures of the Company are being made only in accordance with authorizations of management and directors of the Company; and
Provide reasonable assurance regarding prevention or timely detection of unauthorized acquisition, use or disposition of the Company’s assets that could have a material effect on the financial statements.
Because of its inherent limitations, internal control over financial reporting may not prevent or detect misstatements. Also, projections of any evaluations of effectiveness to future periods are subject to the risk that controls may become inadequate because of changes in conditions, or that the degree of compliance with the policies or procedures may deteriorate.
Management has evaluated the effectiveness of its internal control over financial reporting for financial presentations in conformity with GAAP as of December 31, 2017 based on the control criteria established in a report entitled Internal Control—Integrated Framework (2013 edition), issued by the Committee of Sponsoring Organizations of the Treadway Commission. Based on its assessment and the application of the specified criteria, management has concluded that the Company’s internal control over financial reporting is effective as of December 31, 2017.
BKD, LLP, the independent registered public accounting firm that audited our Consolidated Financial Statements included in this Annual Report on Form 10-K, has issued an attestation report on the effectiveness of our internal control over financial reporting as of December 31, 2017 which is included in Item 8. Financial Statements and Supplementary Data.
|
/s/ Matt Machen |
/s/ Sherri Billings |
|||
|
Matt Machen Chief Executive Officer |
|
|
|
Sherri Billings Chief Financial Officer |
|
BEAR STATE FINANCIAL, INC. |
||||||
|
CONSOLIDATED STATEMENTS OF FINANCIAL CONDITION DECEMBER 31, 2017 AND 2016 |
||||||
|
(In thousands, except share data) |
|
2017 |
2016 |
|||||||
|
ASSETS |
||||||||
|
Cash and cash equivalents |
$ | 53,568 | $ | 78,789 | ||||
|
Interest-bearing time deposits in banks |
4,075 | 4,571 | ||||||
|
Investment securities: |
||||||||
|
Available for sale securities, at fair value |
196,806 | 188,476 | ||||||
|
Held to maturity securities, at amortized cost (fair value of $42,849 and $25,090, respectively) |
42,775 | 26,977 | ||||||
|
Other investment securities, at cost |
27,077 | 13,759 | ||||||
|
Loans receivable, net of allowance of $18,992 and $15,584, respectively |
1,654,245 | 1,540,805 | ||||||
|
Loans held for sale |
3,815 | 8,954 | ||||||
|
Accrued interest receivable |
7,677 | 7,006 | ||||||
|
Real estate owned, net |
1,648 | 1,945 | ||||||
|
Office properties and equipment, net |
50,546 | 54,049 | ||||||
|
Office properties and equipment held for sale |
2,201 | 5,337 | ||||||
|
Cash surrender value of life insurance |
58,200 | 57,267 | ||||||
|
Goodwill |
40,196 | 40,196 | ||||||
|
Core deposit intangibles, net |
9,332 | 10,353 | ||||||
|
Deferred tax asset, net |
4,611 | 11,619 | ||||||
|
Prepaid expenses and other assets |
4,191 | 3,072 | ||||||
|
TOTAL |
$ | 2,160,963 | $ | 2,053,175 | ||||
|
LIABILITIES AND STOCKHOLDERS’ EQUITY |
||||||||
|
LIABILITIES: |
||||||||
|
Noninterest bearing deposits |
$ | 217,582 | $ | 223,038 | ||||
|
Interest bearing deposits |
1,281,862 | 1,421,042 | ||||||
|
Total deposits |
1,499,444 | 1,644,080 | ||||||
|
Securities sold under agreement to repurchase |
13,445 | 19,114 | ||||||
|
Other borrowings |
386,811 | 152,004 | ||||||
|
Other liabilities |
8,106 | 4,550 | ||||||
|
Total liabilities |
1,907,806 | 1,819,748 | ||||||
|
STOCKHOLDERS’ EQUITY: |
||||||||
|
Preferred stock, $0.01 par value—5,000,000 shares authorized; none issued at December 31, 2017 or 2016 |
-- | -- | ||||||
|
Common stock, $0.01 par value—100,000,000 shares authorized; 37,767,613 and 37,618,597 shares issued and outstanding at December 31, 2017 and 2016, respectively |
378 | 376 | ||||||
|
Additional paid-in capital |
210,599 | 209,274 | ||||||
|
Accumulated other comprehensive income (loss) |
180 | (1,436 | ) | |||||
|
Retained earnings |
42,000 | 25,213 | ||||||
|
Total stockholders’ equity |
253,157 | 233,427 | ||||||
|
TOTAL |
$ | 2,160,963 | $ | 2,053,175 | ||||
|
See notes to consolidated financial statements. |
|
BEAR STATE FINANCIAL, INC. |
|
CONSOLIDATED STATEMENTS OF INCOME |
|
YEARS ENDED DECEMBER 31, 2017, 2016 AND 2015 |
|
(In thousands, except earnings per share data) |
|
2017 |
2016 |
2015 |
||||||||||
|
INTEREST INCOME: |
||||||||||||
|
Loans receivable |
$ | 79,120 | $ | 70,936 | $ | 57,039 | ||||||
|
Investment securities: |
||||||||||||
|
Taxable |
2,750 | 1,952 | 1,535 | |||||||||
|
Nontaxable |
3,700 | 2,185 | 1,955 | |||||||||
|
Other |
697 | 313 | 317 | |||||||||
|
Total interest income |
86,267 | 75,386 | 60,846 | |||||||||
|
INTEREST EXPENSE: |
||||||||||||
|
Deposits |
6,992 | 6,515 | 5,339 | |||||||||
|
Other borrowings |
3,755 | 1,403 | 1,025 | |||||||||
|
Total interest expense |
10,747 | 7,918 | 6,364 | |||||||||
|
NET INTEREST INCOME |
75,520 | 67,468 | 54,482 | |||||||||
|
PROVISION FOR LOAN LOSSES |
4,498 | 2,516 | 1,797 | |||||||||
|
NET INTEREST INCOME AFTER PROVISION FOR LOAN LOSSES |
71,022 | 64,952 | 52,685 | |||||||||
|
NONINTEREST INCOME: |
||||||||||||
|
Net gain on sales of investment securities |
48 | 19 | 20 | |||||||||
|
Deposit fee income |
9,970 | 8,994 | 7,907 | |||||||||
|
Earnings on life insurance policies |
2,940 | 1,665 | 1,510 | |||||||||
|
Gain on sales of loans |
3,773 | 4,796 | 3,084 | |||||||||
|
Other |
1,008 | 1,237 | 1,026 | |||||||||
|
Total noninterest income |
17,739 | 16,711 | 13,547 | |||||||||
|
NONINTEREST EXPENSES: |
||||||||||||
|
Salaries and employee benefits |
28,519 | 31,168 | 25,742 | |||||||||
|
Net occupancy expense |
6,987 | 7,414 | 6,411 | |||||||||
|
Real estate owned, net |
(2 | ) | (377 | ) | (369 | ) | ||||||
|
FDIC insurance |
1,078 | 1,099 | 960 | |||||||||
|
Amortization of intangible assets |
1,021 | 1,021 | 724 | |||||||||
|
Data processing |
5,769 | 5,520 | 6,411 | |||||||||
|
Professional fees |
1,860 | 2,212 | 1,923 | |||||||||
|
Advertising and public relations |
1,148 | 1,600 | 2,520 | |||||||||
|
Postage and supplies |
836 | 1,121 | 1,113 | |||||||||
|
Other |
7,239 | 6,567 | 5,584 | |||||||||
|
Total noninterest expenses |
54,455 | 57,345 | 51,019 | |||||||||
|
INCOME BEFORE INCOME TAXES |
34,306 | 24,318 | 15,213 | |||||||||
|
INCOME TAX PROVISION |
12,995 | 6,859 | 4,639 | |||||||||
|
NET INCOME |
$ | 21,311 | $ | 17,459 | $ | 10,574 | ||||||
|
Basic earnings per common share |
$ | 0.57 | $ | 0.46 | $ | 0.31 | ||||||
|
Diluted earnings per common share |
$ | 0.56 | $ | 0.46 | $ | 0.30 | ||||||
|
See notes to consolidated financial statements. |
|
BEAR STATE FINANCIAL, INC. |
|
CONSOLIDATED STATEMENTS OF COMPREHENSIVE INCOME |
|
YEARS ENDED DECEMBER 31, 2017, 2016 AND 2015 |
|
(In thousands) |
|
2017 |
2016 |
2015 |
||||||||||
|
Net income |
$ | 21,311 | $ | 17,459 | $ | 10,574 | ||||||
|
Other comprehensive income (loss): |
||||||||||||
|
Unrealized holding gains (losses) on investment securities AFS |
2,671 | (2,933 | ) | (290 | ) | |||||||
|
Less: reclassification adjustments for realized gain included in net income |
(48 | ) | (19 | ) | (20 | ) | ||||||
|
Other comprehensive income (loss), before tax effect |
2,623 | (2,952 | ) | (310 | ) | |||||||
|
Tax effect |
(1,007 | ) | 1,130 | 119 | ||||||||
|
Other comprehensive income (loss) |
1,616 | (1,822 | ) | (191 | ) | |||||||
|
COMPREHENSIVE INCOME |
$ | 22,927 | $ | 15,637 | $ | 10,383 | ||||||
See notes to consolidated financial statements.
|
BEAR STATE FINANCIAL, INC. |
|||||||||||||||||
|
CONSOLIDATED STATEMENT OF STOCKHOLDERS’ EQUITY |
|||||||||||||||||
|
FOR THE YEARS ENDED DECEMBER 31, 2017, 2016 AND 2015 |
|||||||||||||||||
|
(In thousands, except share and per share data) |
| Issued | Accumulated | Accumulated | ||||||||||||||||||||||
| Common Stock | Additional | Other | Deficit/ | Total | ||||||||||||||||||||
| Paid-In | Comprehensive |
Retained |
Stockholders’ |
|||||||||||||||||||||
|
Shares |
Amount |
Capital | Income (Loss) | Earnings | Equity | |||||||||||||||||||
|
BALANCE – January 1, 2015 |
33,365,845 | 334 | 169,543 | 577 | -- | 170,454 | ||||||||||||||||||
|
Net income |
-- | -- | -- | -- | 10,574 | 10,574 | ||||||||||||||||||
|
Other comprehensive loss |
-- | -- | -- | (191 | ) | -- | (191 | ) | ||||||||||||||||
|
Shares issued – acquisition of Metropolitan |
4,610,317 | 46 | 41,954 | -- | -- | 42,000 | ||||||||||||||||||
|
Shares issued – stock option exercises |
6,200 | -- | 37 | -- | -- | 37 | ||||||||||||||||||
|
Shares issued – restricted stock unit vesting |
34,038 | -- | (185 | ) | -- | -- | (185 | ) | ||||||||||||||||
|
Stock compensation |
-- | -- | 724 | -- | -- | 724 | ||||||||||||||||||
|
Repurchase of common stock |
(28,678 | ) | -- | (256 | ) | -- | -- | (256 | ) | |||||||||||||||
|
BALANCE – December 31, 2015 |
37,987,722 | 380 | 211,817 | 386 | 10,574 | 223,157 | ||||||||||||||||||
|
Net income |
-- | -- | -- | -- | 17,459 | 17,459 | ||||||||||||||||||
|
Other comprehensive loss |
-- | -- | -- | (1,822 | ) | -- | (1,822 | ) | ||||||||||||||||
|
Shares issued – stock option exercises |
21,664 | -- | 141 | -- | -- | 141 | ||||||||||||||||||
|
Shares issued – restricted stock unit vesting |
62,393 | -- | (255 | ) | -- | -- | (255 | ) | ||||||||||||||||
|
Stock compensation |
-- | -- | 1,239 | -- | -- | 1,239 | ||||||||||||||||||
|
Dividends distributed - $0.075 per common share |
-- | -- | -- | -- | (2,820 | ) | (2,820 | ) | ||||||||||||||||
|
Repurchase of common stock |
(453,182 | ) | (4 | ) | (3,668 | ) | -- | -- | (3,672 | ) | ||||||||||||||
|
BALANCE – December 31, 2016 |
37,618,597 | $ | 376 | $ | 209,274 | $ | (1,436 | ) | $ | 25,213 | $ | 233,427 | ||||||||||||
|
Net income |
-- | -- | -- | -- | 21,311 | 21,311 | ||||||||||||||||||
|
Other comprehensive income |
-- | -- | -- | 1,616 | -- | 1,616 | ||||||||||||||||||
|
Shares issued – stock option exercises |
93,218 | 1 | 642 | -- | -- | 643 | ||||||||||||||||||
|
Shares issued – restricted stock unit vesting |
55,798 | 1 | (276 | ) | -- | -- | (275 | ) | ||||||||||||||||
|
Stock compensation |
-- | -- | 959 | -- | -- | 959 | ||||||||||||||||||
|
Dividends distributed - $0.12 per common share |
-- | -- | -- | -- | (4,524 | ) | (4,524 | ) | ||||||||||||||||
|
BALANCE – December 31, 2017 |
37,767,613 | $ | 378 | $ | 210,599 | $ | 180 | $ | 42,000 | $ | 253,157 | |||||||||||||
See notes to consolidated financial statements.
|
BEAR STATE FINANCIAL, INC. |
|
CONSOLIDATED STATEMENTS OF CASH FLOWS |
|
YEARS ENDED DECEMBER 31, 2017, 2016 AND 2015 |
|
(In thousands) |
|
2017 |
2016 |
2015 |
||||||||||
|
OPERATING ACTIVITIES: |
||||||||||||
|
Net income |
$ | 21,311 | $ | 17,459 | $ | 10,574 | ||||||
|
Adjustments to reconcile net income to net cash provided by operating activities: |
||||||||||||
|
Provision for loan losses |
4,498 | 2,516 | 1,797 | |||||||||
|
Provision for real estate losses |
137 | 311 | 47 | |||||||||
|
Deferred tax provision |
6,001 | 7,116 | 4,371 | |||||||||
|
Deferred tax valuation allowance |
-- | (897 | ) | (120 | ) | |||||||
|
Net amortization of premiums on investment securities |
1,889 | 1,309 | 626 | |||||||||
|
Federal Home Loan Bank stock dividends |
(196 | ) | (39 | ) | (8 | ) | ||||||
|
Loss (gain) on dispositions of fixed assets, net |
8 | (1,019 | ) | (85 | ) | |||||||
|
Impairment on office properties held for sale |
634 | 1,076 | -- | |||||||||
|
Gain on sales of real estate owned and repossessed assets, net |
(291 | ) | (943 | ) | (587 | ) | ||||||
|
Gain on sales of investment securities, net |
(48 | ) | (19 | ) | (20 | ) | ||||||
|
Originations of loans held for sale |
(119,158 | ) | (163,727 | ) | (109,239 | ) | ||||||
|
Proceeds from sales of loans originated for sale |
128,070 | 166,895 | 113,454 | |||||||||
|
Gain on sales of loans originated to sell |
(3,773 | ) | (4,796 | ) | (3,084 | ) | ||||||
|
Depreciation |
3,365 | 3,706 | 3,293 | |||||||||
|
Amortization of deferred loan costs, net |
662 | 1,138 | 254 | |||||||||
|
Accretion of purchased loans, net |
(4,419 | ) | (4,972 | ) | (4,764 | ) | ||||||
|
Amortization of other intangible assets |
1,021 | 1,021 | 724 | |||||||||
|
Stock compensation |
959 | 1,239 | 724 | |||||||||
|
Earnings on life insurance policies |
(2,031 | ) | (1,665 | ) | (1,498 | ) | ||||||
|
Changes in operating assets and liabilities: |
||||||||||||
|
Accrued interest receivable |
(671 | ) | (849 | ) | (188 | ) | ||||||
|
Prepaid expenses and other assets |
(1,113 | ) | 218 | 1,276 | ||||||||
|
Other liabilities |
3,556 | (371 | ) | (3,621 | ) | |||||||
|
Net cash provided by operating activities |
40,411 | 24,707 | 13,926 | |||||||||
|
INVESTING ACTIVITIES: |
||||||||||||
|
Cash paid for acquisition, net of cash received |
-- | -- | (13,931 | ) | ||||||||
|
Net decrease in federal funds sold |
-- | 18 | 33 | |||||||||
|
Purchases of interest bearing time deposits in banks |
(1,485 | ) | (2,590 | ) | -- | |||||||
|
Redemptions of interest bearing time deposits in banks |
1,981 | 8,949 | 1,491 | |||||||||
|
Purchases of held to maturity (“HTM”) securities |
(16,093 | ) | (26,992 | ) | -- | |||||||
|
Proceeds from maturities/calls/paydowns of HTM securities |
30 | -- | -- | |||||||||
|
Purchases of available for sale (“AFS”) securities |
(41,575 | ) | (99,001 | ) | (55,951 | ) | ||||||
|
Proceeds from sales of AFS securities |
2,069 | 30,386 | 21,099 | |||||||||
|
Proceeds from maturities/calls/paydowns of AFS securities |
32,223 | 74,497 | 50,724 | |||||||||
|
Purchases in other investments |
(13,122 | ) | (6,152 | ) | (5,205 | ) | ||||||
|
Redemptions of other investments |
-- | 1,995 | 3,515 | |||||||||
|
Loan disbursements, net of repayments |
(105,774 | ) | (78,047 | ) | 934 | |||||||
|
Loan participations purchased |
(12,640 | ) | (29,094 | ) | (40,937 | ) | ||||||
|
Loan participations sold |
2,245 | 9,721 | 640 | |||||||||
|
Proceeds from sales of real estate owned and repossessed assets |
2,640 | 4,340 | 4,370 | |||||||||
|
Proceeds from sales of office properties held for sale |
3,750 | 2,530 | -- | |||||||||
|
Proceeds from sales of office properties and equipment |
3 | 6 | 951 | |||||||||
|
Purchases of office properties and equipment |
(1,328 | ) | (2,069 | ) | (4,652 | ) | ||||||
|
Purchases of bank owned life insurance |
-- | (3,000 | ) | (772 | ) | |||||||
|
Proceeds from settlement of bank owned life insurance |
1,098 | -- | -- | |||||||||
|
Net cash used in investing activities |
(145,978 | ) | (114,503 | ) | (37,691 | ) | ||||||
|
(Continued) |
|
BEAR STATE FINANCIAL, INC. |
|
CONSOLIDATED STATEMENTS OF CASH FLOWS |
|
YEARS ENDED DECEMBER 31, 2017, 2016 AND 2015 |
|
(In thousands) |
| 2017 | 2016 | 2015 | ||||||||||
|
FINANCING ACTIVITIES: |
||||||||||||
|
Net increase (decrease) in deposits |
$ | (144,636 | ) | $ | 36,397 | $ | (26,763 | ) | ||||
|
Proceeds from long term advances from Federal Home Loan Bank |
85,223 | 40,245 | 20,551 | |||||||||
|
Repayments of long term advances from Federal Home Loan Bank |
(85,554 | ) | (25,571 | ) | (14,328 | ) | ||||||
|
Net change in short term advances from Federal Home Loan Bank |
245,000 | 61,800 | 4,200 | |||||||||
|
Proceeds from other borrowings |
2,400 | 4,800 | 1,850 | |||||||||
|
Repayments of other borrowings |
(12,262 | ) | (1,650 | ) | (1,151 | ) | ||||||
|
Net increase (decrease) in short term borrowings |
(5,669 | ) | 7,039 | (21,145 | ) | |||||||
|
Proceeds from exercise of stock options |
643 | 141 | 37 | |||||||||
|
Shares withheld for payment of employee payroll taxes |
(275 | ) | (255 | ) | (185 | ) | ||||||
|
Repurchase of common stock |
-- | (3,672 | ) | (256 | ) | |||||||
|
Dividends distributed |
(4,524 | ) | (2,820 | ) | -- | |||||||
|
Net cash provided by (used in) financing activities |
80,346 | 116,454 | (37,190 | ) | ||||||||
|
NET INCREASE (DECREASE) IN CASH AND CASH EQUIVALENTS |
(25,221 | ) | 26,658 | (60,955 | ) | |||||||
|
CASH AND CASH EQUIVALENTS: |
||||||||||||
|
Beginning of period |
78,789 | 52,131 | 113,086 | |||||||||
|
End of period |
$ | 53,568 | $ | 78,789 | $ | 52,131 | ||||||
|
SUPPLEMENTAL DISCLOSURES OF CASH FLOW INFORMATION: |
||||||||||||
|
Cash paid for interest |
$ | 10,611 | $ | 7,896 | $ | 6,438 | ||||||
|
Cash received for income tax refunds |
$ | -- | $ | -- | $ | 2,135 | ||||||
|
Cash paid for income tax |
$ | 3,136 | $ | 892 | $ | -- | ||||||
|
SUPPLEMENTAL SCHEDULE OF NONCASH INVESTING AND FINANCING ACTIVITIES: |
||||||||||||
|
Real estate and other assets acquired in settlement of loans |
$ | 2,012 | $ | 2,240 | $ | 2,384 | ||||||
|
Sales of real estate owned financed by the Bank |
$ | 24 | $ | 146 | $ | 282 | ||||||
|
Common stock issued for acquisitions |
$ | -- | $ | -- | $ | 42,000 | ||||||
|
Office properties transferred to real estate owned |
$ | 207 | $ | -- | $ | 464 | ||||||
|
Office properties transferred to office properties held for sale |
$ | 1,428 | $ | 7,925 | $ | -- | ||||||
|
(Concluded) |
|
See notes to consolidated financial statements. |
BEAR STATE FINANCIAL, INC.
NOTES TO CONSOLIDATED FINANCIAL STATEMENTS
YEARS ENDED DECEMBER 31, 2017, 2016 AND 2015
|
1. |
SUMMARY OF SIGNIFICANT ACCOUNTING POLICIES |
Nature of Operations — Bear State Financial, Inc. (the “Company”) is a bank holding company headquartered in Little Rock, Arkansas. Its subsidiary bank, Bear State Bank (the “Bank”), is a community oriented bank providing a broad line of financial products to individuals and business customers. As of December 31, 2017, the Bank operates 42 branches, three personalized technology centers equipped with interactive teller machines (“ITMs”) and three loan production offices throughout Arkansas, Missouri and Southeast Oklahoma. On June 28, 2016, the Bank converted from a national bank to an Arkansas state-chartered bank.
On August 22, 2017, the Company and the Bank entered into an Agreement and Plan of Reorganization (the “Merger Agreement”) with Arvest Bank, an Arkansas banking corporation (“Arvest”), and Arvest Acquisition Sub, Inc., an Arkansas corporation and a wholly-owned subsidiary of Arvest (“Acquisition Sub”), pursuant to which Arvest will acquire the Company and the Bank (the “Merger”).
Pursuant to the Merger Agreement, each share of the Company’s common stock issued and outstanding as of the effective time of the Merger will be converted into a right to receive $10.28 per share, payable in cash. The shareholders of the Company approved the Merger at a special meeting of shareholders held November 15, 2017. The Merger is expected to close in late March or April 2018 and is pending federal regulatory approval.
Principles of Consolidation—The accompanying consolidated financial statements include the accounts of the Company and its subsidiary described above. Intercompany transactions and balances have been eliminated in consolidation.
Operating Segments— The Company’s operations are organized on a regional basis. While the chief decision-makers monitor revenue streams of various products and services, operations are managed and financial performance is evaluated on a Company-wide basis. Each region provides a group of similar community banking products and services, including loans, time deposits, and checking and savings accounts. The individual regions have similar operating and economic characteristics and are reported as one aggregated operating segment.
Use of Estimates—The preparation of financial statements in conformity with accounting principles generally accepted in the United States of America (“U.S. GAAP”) requires management to make estimates and assumptions that affect the reported amounts of assets and liabilities and disclosure of contingent assets and liabilities at the date of the financial statements and the reported amounts of revenues and expenses during the reporting period. Actual results could differ from those estimates and such differences could be significant. Valuation of assets acquired and liabilities assumed in business combinations, valuation of real estate owned, fair value of financial instruments, valuation of deferred tax assets and the allowance for loan and lease losses are material estimates that are particularly susceptible to significant change in the near term.
Cash Flow Reporting—For the purpose of presentation in the consolidated statements of cash flows, cash and cash equivalents includes cash on hand and amounts due from depository institutions, which includes interest bearing amounts available upon demand. Net cash flows are reported for customer loan and deposit transactions and short term borrowings with original maturities of three months or less.
Investment Securities—The Company classifies investment securities into one of two categories: held to maturity or available for sale. The Company does not engage in trading activities. Debt securities that the Company has the positive intent and ability to hold to maturity are classified as held to maturity and recorded at cost, adjusted for the amortization of premiums and the accretion of discounts.
Investment securities that the Company intends to hold for indefinite periods of time are classified as available for sale and are recorded at fair value. Unrealized holding gains and losses are excluded from earnings and reported net of tax in other comprehensive income. Investment securities in the available for sale portfolio may be used as part of the Company’s asset and liability management practices and may be sold in response to changes in interest rate risk, prepayment risk, or other economic factors.
Premiums are amortized into interest income using the interest method to the earlier of maturity or call date, or in the case of mortgage-backed securities, over the estimated life of the security. Discounts are accreted into interest income using the interest method over the period to maturity. The specific identification method of accounting is used to compute gains or losses on the sales of investment securities.
Management evaluates securities for other-than-temporary impairment (“OTTI”) on at least a quarterly basis. In evaluating whether impairment is other than temporary, management primarily considers the length of time and the extent to which the fair value has been less than the amortized cost basis, the nature of the investment, the cause of the impairment, whether any periodic coupon payments have been missed, whether the security has been downgraded by rating agencies, and whether the Company intends to sell the security or it is more likely than not that the Company will be required to sell the security before recovery of its amortized cost basis. The assessment of whether OTTI exists involves a high degree of subjectivity and judgment and is based on information available to management at a point in time. Management has determined that no OTTI charges were necessary during the years ended December 31, 2017, 2016 or 2015.
Other Investments—The Bank is a member of the Federal Home Loan Bank (“FHLB”) system. Members are required to own a certain amount of stock based on the level of borrowings and other factors, and may invest in additional amounts. The Bank is a member of and owns stock in the Federal Reserve Bank (“FRB”) as well as First National Bankers Bank and Midwest Independent Bank, both institutions that provide correspondent banking services to community banks. Stock in these institutions is classified as other investments and is recorded at redemption value which approximates fair value. The Bank periodically evaluates the restricted stock for impairment based on ultimate recovery of par value. Both cash and stock dividends are reported as income.
Loans Receivable—The Bank originates and maintains loans receivable that are substantially concentrated in its lending markets of Arkansas, Missouri and Southeast Oklahoma. The majority of the Bank’s loans are residential mortgage loans, nonfarm nonresidential loans, and commercial and industrial loans. The Bank’s policies generally call for collateral or other forms of security to be received from the borrower at the time of loan origination. Such collateral or other form of security is subject to changes in economic value due to various factors beyond the control of the Bank.
Loans receivable that management has the intent and ability to hold for the foreseeable future or until maturity or pay-off are stated at unpaid principal balances, net of purchase premiums and discounts, charge-offs, the allowance for loan and lease losses, and deferred loan fees or costs. Interest income is accrued on the unpaid principal balance. Deferred loan fees or costs on loans are amortized or accreted to income using the level-yield method over the remaining period to contractual maturity without anticipating prepayments.
Mortgage loans originated and committed for sale in the secondary market are carried at the lower of cost or estimated market value in the aggregate. Such loans are generally carried at cost due to the short period of time between funding and sale, generally within thirty days.
Loans are considered past due when the contractual amounts due with respect to principal and/or interest are not received within 30 days of the contractual due date. The accrual of interest on loans is generally discontinued when the loan becomes 90 days past due, or, in management’s opinion, the borrower is judged to be unable to meet payments as they become due. Nonaccrual loans and loans past due 90 days and still accruing include both smaller balance homogeneous loans that are collectively evaluated for impairment and individually classified impaired loans.
When interest accrual is discontinued, all unpaid accrued interest is reversed against interest income. The interest on these loans is accounted for on the cash basis or cost recovery method until qualifying for return to accrual, except when doubt exists as to ultimate collectability of principal and interest. Under the cost recovery method, interest income is not recognized until the loan balance is reduced to zero. Under the cash basis method, interest income is recorded when the payment is received in cash. A loan is generally returned to accrual status when the loan is no longer past due and, in the opinion of management, collection of the remaining balance can be reasonably expected. The Company may continue to accrue interest on certain loans that are 90 days past due or more if such loans are well-secured and in the process of collection.
Acquisition Accounting and Acquired Loans— The Company accounts for its acquisitions under ASC Topic 805, Business Combinations, which requires the use of the purchase method of accounting. All identifiable assets acquired, including loans, are recorded at fair value. Acquired loans and leases are recorded at fair value at the date of acquisition. No allowance for loan and lease losses (“ALLL”) is recorded on the acquisition date as the fair value of the acquired assets incorporates assumptions regarding credit risk. The fair value adjustment on acquired loans without evidence of credit deterioration since origination are accreted into earnings as a yield adjustment using the effective yield method over the remaining life of the loan.
Purchased Credit Impaired Loans – Acquired loans and leases with evidence of credit deterioration since origination such that it is probable at acquisition that the Bank will be unable to collect all contractually required payments are accounted for under the guidance in ASC Topic 310-30, Loans and Debt Securities Acquired with Deteriorated Credit Quality. As of the acquisition date, the difference between contractually required payments and the cash flows expected to be collected is the nonaccretable difference, which is included as a reduction of the carrying amount of acquired loans and leases. If the timing and amount of the future cash flows is reasonably estimable, any excess of cash flows expected at acquisition over the estimated fair value is the accretable yield and is recognized in interest income over the asset's remaining life using the level yield method.
Acquired loan amounts deemed uncollectible at acquisition date become part of the fair value calculation and are excluded from the ALLL. Following acquisition, a regular review is completed on acquired loans to determine if changes in estimated cash flows have occurred. Subsequent decreases in the amount expected to be collected may result in a provision for loan and lease losses with a corresponding increase in the ALLL. Subsequent increases in the amount expected to be collected result in a reversal of any previously recorded provision for loan and lease losses and related increase to ALLL, if any, or prospective adjustment to the accretable yield if no provision for loan and lease losses had been recorded or if the provision is less than the subsequent increase.
Allowance for Loan and Lease Losses— The ALLL is a valuation allowance for probable incurred credit losses. The ALLL is established as losses are estimated to have occurred through a provision for loan losses charged to earnings. Loan losses are charged against the ALLL when management believes it is likely that a loan balance is uncollectible. Subsequent recoveries, if any, are credited to the ALLL.
The ALLL represents management’s estimate of incurred credit losses inherent in the Company’s loan portfolio as of the balance sheet date. The estimation of the ALLL is based on a variety of factors, including past loan loss experience, the current credit profiles of the Company’s borrowers, adverse situations that have occurred that may affect borrowers’ ability to repay, the estimated value of underlying collateral, and general economic conditions. Losses are recognized when available information indicates that it is probable that a loss has been incurred and the amount of the loss can be reasonably estimated. This evaluation is inherently subjective as it requires estimates that are susceptible to significant revision as more information becomes available or conditions change.
The ALLL consists of (1) an allocated allowance on identified impaired loans and leases (sometimes referred to as a specific allowance) and (2) a general allowance on the remainder of the loan and lease portfolio. Although the Bank determines the amount of each component of the ALLL separately, the entire allowance is available to absorb losses in the loan portfolio.
Allocated (Specific) Allowance
Allocated, or specific, allowances represent impairment measurements on certain impaired loans as further described below. A loan is considered impaired when, based on current information and events, it is probable that the Bank will be unable to collect the scheduled payments of principal or interest when due according to the contractual terms of the note. Factors considered by management in determining impairment include payment status, collateral value, and the probability of collecting scheduled principal and interest payments when due. Loans that experience insignificant payment delays and payment shortfalls generally are not classified as impaired. Management determines the significance of payment delays and payment shortfalls on a case-by-case basis, taking into consideration all of the circumstances surrounding the loan and the borrower, including the length of the delay, the reasons for the delay, the borrower’s prior payment record, and the amount of the shortfall in relation to the principal and interest owed. Each quarter, classified loans where the borrower’s total loan relationship exceeds $500,000 are evaluated for impairment on a loan-by-loan basis. Nonaccrual loans and TDRs are considered to be impaired loans. TDRs are restructurings in which the Bank, for economic or legal reasons related to the debtor’s financial difficulties, grants a concession to the debtor that the Bank would not otherwise consider. Impairment is measured quarterly on a loan-by-loan basis for all TDRs and impaired loans where the aggregate relationship balance exceeds $500,000 by either the present value of expected future cash flows discounted at the loan’s effective interest rate, the loan’s obtainable market price, or the fair value of the collateral, if the loan is collateral dependent. Impaired loans under this threshold are aggregated and included in loan pools with their ALLL calculated as described in the following paragraph.
Groups of smaller balance homogeneous loans are collectively evaluated for impairment. Homogeneous loans are those that are considered to have common characteristics that provide for evaluation on an aggregate or pool basis. The Bank considers the characteristics of (1) one- to four-family residential mortgage loans; (2) unsecured consumer loans; and (3) collateralized consumer loans to permit consideration of the appropriateness of the ALLL of each group of loans on a pool basis. The primary methodology used to determine the appropriateness of the ALLL includes segregating impaired loans from the pools of loans, valuing these loans, and then applying a loss factor to the remaining pool balance based on several factors including past loss experience, inherent risks, and economic conditions in the primary market areas.
General Allowance
The general component covers loans that are collectively evaluated for impairment and is based on historical loss experience adjusted for current qualitative environmental factors. The Company maintains a loss migration analysis that tracks loan losses and recoveries based on loan class as well as the loan risk grade assignment. At December 31, 2017, an average of four quarterly migration periods of eight quarters each was generally used to calculate historical loss experience. These historical loss percentages are adjusted (both upwards and downwards) for certain qualitative environmental factors, including economic trends, credit quality trends, valuation trends, concentration risk, quality of loan review, changes in personnel, competition, increasing interest rates, external factors and other considerations. The general component also includes impaired loans that are not individually measured for impairment based on the Bank’s threshold described above as well as loans that are individually evaluated but not considered impaired.
Rate Lock Commitments—The Bank enters into commitments to originate loans whereby the interest rate on the loan is determined prior to funding (rate lock commitments) as well as corresponding commitments to sell such loans to investors. Rate lock commitments as well as the related sales commitments on mortgage loans that are intended to be sold are considered to be derivatives. Accordingly, such commitments, along with any related fees received from potential borrowers, are recorded at fair value in derivative assets or liabilities, with changes in fair value recorded in the net gain or loss on sale of mortgage loans. Fair value is based on fees currently charged to enter into similar agreements, and for fixed rate commitments also considers the difference between current levels of interest rates and the committed rates.
Real Estate Owned, Net—Real estate owned represents foreclosed assets held for sale and is initially recorded at estimated fair value less estimated costs to sell, establishing a new cost basis. Subsequent to foreclosure, management periodically performs valuations and the assets are carried at the lower of carrying amount or fair value less costs to sell. If fair value declines subsequent to foreclosure, a valuation allowance is recorded through expense. Costs and expenses related to major additions and improvements are capitalized while maintenance and repairs that do not extend the lives of the respective assets are expensed. At December 31, 2017, the Bank had approximately $1.0 million one- to four-family loans in the process of foreclosure.
Office Properties and Equipment, Net—Land is carried at cost. Buildings and equipment are stated at cost less accumulated depreciation and amortization. The Company computes depreciation using the straight-line method over the estimated useful lives of the individual assets, which range from 3 to 40 years. Leasehold improvements are amortized on the straight-line method over the terms of the related leases, including expected renewals, or over the useful lives of the improvements, whichever is shorter. Maintenance and repairs are expensed as incurred while major additions and improvements are capitalized.
Cash Surrender Value of Life Insurance—Cash surrender value of life insurance represents life insurance purchased by the Bank on a qualifying group of officers with the Bank designated as owner and beneficiary of the policies. The yield on these policies is used to offset a portion of employment benefit costs. The policies are recorded on the consolidated statements of financial condition at their cash surrender values with changes in cash surrender values reported in noninterest income. Death benefits in excess of the cash surrender value are recorded in noninterest income at the time of death.
Long-Lived Assets – Premises and equipment and other long-lived assets are reviewed for impairment when events indicate their carrying amount may not be recoverable from future undiscounted cash flows. If impaired, the assets are recorded at fair value.
Goodwill and Other Intangible Assets - The Company accounts for business combinations using the acquisition method of accounting. Accordingly, the identifiable assets acquired, the liabilities assumed, and any non-controlling interest of an acquired business are recorded at their estimated fair values as of the date of acquisition with any excess of the cost of the acquisition over the fair value recorded as goodwill. Other intangible assets represent purchased assets that lack physical substance but can be distinguished from goodwill because of contractual or other legal rights or because the asset is capable of being sold or exchanged either on its own or in combination with a related contract, asset, or liability.
Goodwill is not amortized but is evaluated for impairment annually, or more often if events or circumstances indicate it may be impaired. Finite-lived intangible assets, which consist primarily of core deposit intangibles (long-term customer-relationship intangible assets) are amortized on a straight-line basis over their weighted-average estimated useful lives, ranging from twelve to thirteen years, and are tested for impairment whenever events or circumstances indicate that their carrying amount may not be recoverable. An impairment loss is recognized when the carrying amount of an intangible asset with a finite useful life is not recoverable from its undiscounted cash flows and is measured as the difference between the carrying amount and the fair value of the asset.
Goodwill is evaluated for impairment by comparing the estimated fair value of each reporting unit to its carrying value, including goodwill. If the estimated fair value of a reporting unit exceeds its carrying amount, the goodwill of that reporting unit is not considered impaired, and no impairment loss is recognized. However, if the carrying amount of the reporting unit exceeds its fair value, step two, which involves comparing the implied fair value of goodwill to its carrying value, is completed and to the extent that the carrying value of goodwill exceeds its implied fair value, an impairment loss is recognized.
Loan Commitments and Related Financial Instruments – Financial instruments include off-balance sheet credit instruments, such as commitments to originate loans and letters of credit, issued to meet customer financing needs. The face amount of these items represents the exposure to loss, before considering customer collateral or ability to repay. Such financial instruments are recorded when they are funded.
Stock Based Compensation—Compensation cost for stock based compensation is recognized based on the fair value of these awards at the date of grant over the requisite service period. In most cases the requisite service period is the same as the vesting period. For awards with graded vesting, compensation cost is recognized on a straight-line basis over the requisite service period for the entire award.
Income Taxes— The Company estimates its income taxes payable based on the amounts it expects to owe to the various taxing authorities (i.e. federal, state and local). In estimating income taxes, management assesses the relative merits and risks of the tax treatment of transactions, taking into account statutory, judicial and regulatory guidance in the context of the Company’s tax position. Management also relies on tax opinions, recent audits, and historical experience.
Deferred income tax assets and liabilities are determined using the liability (or balance sheet) method. Under this method, the net deferred tax asset or liability is determined based on the tax effects of the temporary differences between the book and tax bases of the various statement of financial condition assets and liabilities and gives current recognition to changes in tax rates and laws. Deferred tax assets and liabilities are recognized for the future tax consequences related to differences between the financial statement carrying amounts of existing assets and liabilities and their respective tax bases, and for tax credits. Deferred tax assets are evaluated for recoverability using a consistent approach that considers the relative impact of negative and positive evidence, including our historical profitability and projections of future taxable income. A valuation allowance for deferred tax assets is established if, based on available evidence at the time the determination is made, that it is more likely than not that some portion or all of the deferred tax assets will not be realized. In evaluating the need for a valuation allowance, future taxable income is estimated based on management-approved business plans and ongoing tax planning strategies. This process involves significant management judgment about assumptions that are subject to change from period to period based on changes in tax laws or variances between projected operating performance, actual results and other factors.
The Company recognizes a tax position as a benefit only if it is “more likely than not” that the tax position would be sustained in a tax examination, with a tax examination being presumed to occur. The amount recognized is the largest amount of tax benefit that has a greater than 50% likelihood of being realized upon examination. For tax positions not meeting the “more likely than not” test, no tax benefit is recorded. The Company has no uncertain tax positions.
Penalties and interest are classified as income tax expense when incurred.
Interest Rate Risk—The Company’s asset base is exposed to risk including the risk resulting from changes in interest rates and changes in the timing of cash flows. The Company monitors the effect of such risks by considering the mismatch of the maturities of its assets and liabilities in the current interest rate environment and the sensitivity of assets and liabilities to changes in interest rates. The Company’s management has considered the effect of significant increases and decreases in interest rates and believes such changes, if they occurred, would be manageable and would not affect the ability of the Company to hold its assets as planned.
Earnings Per Common Share—Basic earnings per share represents income available to common stockholders divided by the weighted-average number of common shares outstanding during the period. Diluted earnings per share reflects additional common shares that would have been outstanding if dilutive potential common shares had been issued, as well as any adjustment to income that would result from the assumed issuance. Potential common shares that may be issued by the Company include shares underlying outstanding stock options, restricted stock units and warrants and are determined using the treasury stock method.
Loss Contingencies – Loss contingencies, including claims and legal actions arising in the ordinary course of business, are recorded as liabilities when the likelihood of loss is probable and an amount or range of loss can be reasonably estimated.
Recently Adopted Accounting Standards—
In March 2016, the Financial Accounting Standards Board (“FASB”) issued Accounting Standards Update (“ASU”) 2016-09, Compensation – Stock Compensation (Topic 718). This ASU simplifies several aspects of the accounting for share-based payment transactions, including the income tax consequences, classification of awards as either equity or liabilities, and classification on the statement of cash flows. This ASU requires all excess income tax benefits and tax deficiencies on share based payment awards to be recognized in the income statement when the awards vest or are settled and likewise changes the calculation of assumed proceeds in applying the treasury stock method for calculating diluted earnings per share. It also allows an employer to make a policy election to account for forfeitures as they occur. The ASU also eliminates the guidance in Topic 718 that was indefinitely deferred. The Company adopted the amendments beginning January 1, 2017. The Company’s adoption of the ASU primarily resulted in a change in presentation in the statement of cash flows of employee taxes withheld in shares of Company stock from operating activities to financing activities. The other provisions either were not applicable or did not have a material impact on the Company’s financial statements. The Company’s stock based compensation plan has not historically generated material amounts of excess tax benefits or deficiencies. However, the magnitude of any income tax benefits or deficiencies in the future will depend on the Company’s stock price at the dates awards vest or are settled.
In August 2016, the FASB issued ASU 2016-15, Statement of Cash Flows (Topic 230): Classification of Certain Cash Receipts and Cash Payments. This ASU adds or clarifies guidance on the classification of certain cash receipts and cash payments in the statement of cash flows in an attempt to reduce the diversity of financial reporting. For public entities, ASU 2016-15 is effective for interim and annual periods beginning after December 15, 2017 with early adoption permitted. The Company adopted the guidance as of January 1, 2017 and there was no impact on the Company’s financial statements at the date of adoption.
In January 2017, the FASB issued ASU 2017-04, Intangibles - Goodwill and Other (Topic 350), Simplifying the Test for Goodwill Impairment. The objective of the ASU is to expand the simplification of the subsequent measurement of goodwill to include public business entities and not-for-profit entities. The simplification eliminates Step 2 from the goodwill impairment test, which measures a goodwill impairment loss by comparing the implied fair value of the reporting unit's goodwill with the carrying amount of that goodwill. For public companies that are SEC filers, the ASU is effective for fiscal years beginning after December 15, 2019, including interim periods, and should be applied on a prospective basis. Early adoption is permitted for interim or annual goodwill impairment tests performed on testing dates after January 1, 2017. The Company elected to adopt this ASU effective with its September 30, 2017 annual impairment testing. The Company concluded that its goodwill is not impaired as of September 30, 2017. The adoption of this ASU did not have an impact on the Company’s financial position or results of operations.
In March 2017, the FASB issued ASU 2017-08, Receivables – Nonrefundable Fees and Other Costs. This amendment updates the amortization period for certain callable debt securities held at a premium. Specifically, the amendments require the premium to be amortized to the earliest call date. The amendments do not require an accounting change for securities held at a discount and can continue to be amortized to maturity. ASU 2017-08 will be effective for the Company in the fiscal year beginning after December 15, 2019 and interim periods within fiscal years beginning after December 15, 2020. Early adoption is permitted, including interim periods within those years. The Company has elected to early adopt ASU 2017-08 and the effect was not material.
New Accounting Standards Not Yet Effective—
In May 2014, the FASB issued ASU 2014-09, creating FASB Topic 606, Revenue from Contracts with Customers. The guidance in ASU 2014-09 affects any entity that either enters into contracts with customers to transfer goods or services or enters into contracts for the transfer of nonfinancial assets unless those contracts are within the scope of other standards (for example, insurance contracts or lease contracts). The FASB also issued the following amendments to ASU No. 2014-09 to provide clarification on the guidance: ASU No. 2015-14, Revenue from Contracts with Customers (Topic 606) – Deferral of the Effective Date, ASU No. 2016-08, Revenue from Contracts with Customers (Topic 606) – Principal versus Agent Considerations (Reporting Revenue Gross Versus Net), ASU No. 2016-10, Revenue from Contracts with Customers (Topic 606) – Identifying Performance Obligations and Licensing, and ASU No. 2016-12, Revenue from Contracts with Customers (Topic 606) – Narrow-Scope Improvements and Practical Expedients. The core principle of the guidance is that an entity should recognize revenue to depict the transfer of promised goods or services to customers in an amount that reflects the consideration to which the entity expects to be entitled in exchange for those goods or services. The guidance provides steps to follow to achieve the core principle. An entity should disclose sufficient information to enable users of financial statements to understand the nature, amount, timing and uncertainty of revenue and cash flows arising from contracts with customers. The amendments in this ASU become effective for annual periods and interim periods within those annual periods beginning after December 15, 2017.
In February 2017, the FASB issued ASU 2017-05 to clarify the scope of Subtopic 610-20, Other Income—Gains and Losses from the Derecognition of Nonfinancial Assets, and to add guidance for partial sales of nonfinancial assets. Subtopic 610-20, which was issued in May 2014 as a part of ASU No. 2014-09, Revenue from Contracts with Customers (Topic 606), provides guidance for recognizing gains and losses from the transfer of nonfinancial assets in contracts with noncustomers. Sales and partial sales of real estate assets will now be accounted for similar to all other sales of nonfinancial and in substance nonfinancial assets. The amendments in this ASU are effective at the same time as the amendments in ASU 2014-09. This ASU is to be adopted concurrently with ASU 2014-09.
The Company’s adoption of these ASUs on January 1, 2018 did not have a material impact on the Company’s financial position or results of operations.
In January 2016, the FASB issued ASU 2016-01, Recognition and Measurement of Financial Assets and Financial Liabilities (Subtopic 825-10). This ASU requires certain equity investments to be measured at fair value with changes in fair value recognized in net income and simplifies the impairment assessment of such investments; eliminates the requirement for public entities to disclose the methods and significant assumptions used to estimate fair value that is required to be disclosed for financial instruments measured at amortized cost; requires public entities to use the exit price notion when measuring the fair value of financial instruments for disclosure purposes; clarifies that an entity should evaluate the need for a valuation allowance on a deferred tax asset related to available-for-sale securities in combination with the entity’s other deferred tax assets and requires separate presentation of financial assets and financial liabilities by measurement category and form of financial asset on the balance sheet or in the accompanying notes to the financial statements. For public entities, ASU 2016-01 is effective for fiscal years beginning after December 15, 2017, including interim periods within those fiscal years. The adoption of this ASU on January 1, 2018 did not have a material impact on the Company’s financial statements since it does not have any marketable equity securities and there are no indications that its nonmarketable equity securities are impaired.
In February 2016, the FASB issued ASU 2016-02, Leases (Topic 842). This ASU applies to all leases and is intended to increase transparency and comparability among organizations by recognizing lease assets and liabilities on the balance sheet and disclosing key information about leasing arrangements. The previous standards did not require lessees to recognize operating leases on the balance sheet. This ASU provides for accounting requirements so that lessees will be required to recognize the rights and obligations associated with operating leases. The guidance on lessor accounting was not fundamentally changed with this ASU. For public entities, ASU 2016-02 is effective for interim and annual periods beginning after December 15, 2018, however, early adoption is permitted. The Company has formed a committee and is in the process of collecting data and evaluating the impact this ASU will have on its financial statements and will subsequently implement new processes and update current accounting policies to comply with the amendments of this ASU.
In June 2016, the FASB issued ASU 2016-13, Financial Instruments – Credit Losses (Topic 326): Measurement of Credit Losses on Financial Instruments. This ASU requires a financial asset measured at amortized cost basis to be presented at the net amount expected to be collected. Current U.S. GAAP requires an incurred loss methodology for recognizing credit losses that delays loss recognition until it is probable that a loss has been incurred. The amendments in this ASU replace the current incurred loss impairment methodology with a methodology that reflects expected credit losses and requires consideration of a broader range of reasonable and supportable information to inform credit loss estimates. The amendments affect entities holding financial assets and net investment in leases that are not accounted for at fair value through net income. Existing purchased credit impaired assets will be grandfathered and classified as purchased credit deteriorated (“PCD”) assets at the date of adoption. The asset will be grossed up for the allowance for expected credit losses for all PCD assets at the date of adoption and will continue to recognize the noncredit discount in interest income based on the yield of such assets as of the adoption date. Subsequent changes in expected credit losses will be recorded through the allowance. ASU 2016-13 will be effective for the Company in the fiscal year beginning after December 15, 2019, including interim periods within that fiscal year. Early adoption is permitted for fiscal years beginning after December 15, 2018, including interim periods within those years. An entity will apply the amendments in this ASU through a cumulative effect adjustment to retained earnings as of the beginning of the first reporting period in which the guidance is effective. The Company has formed a committee to evaluate the impact this ASU will have on its financial statements and to begin developing and implementing processes and procedures during the next two years to ensure the Company is compliant with the amendments by the adoption date.
In May 2017, the FASB issued ASU 2017-09, Compensation – Stock Compensation (Topic 718): Scope of Modification Accounting. The ASU gives clarity and reduces diversity in practice by providing guidance about which changes to terms or conditions of a shared-based payment award require an entity to apply modification accounting in Topic 718. For public entities, ASU 2017-09 is effective for interim and annual periods beginning after December 15, 2017; however, early adoption is permitted. The adoption of this ASU on January 1, 2018 did not to have an impact on the Company’s financial statements as the Company has not historically changed the terms or conditions of share-based payment awards.
In July 2017, the FASB issued ASU 2017-11—Earnings Per Share (Topic 260): Distinguishing Liabilities from Equity (Topic 480); Derivatives and Hedging (Topic 815): (Part I) Accounting for Certain Financial Instruments with Down Round Features, (Part II) Replacement of the Indefinite Deferral for Mandatorily Redeemable Financial Instruments of Certain Nonpublic Entities and Certain Mandatorily Redeemable Noncontrolling Interests with a Scope Exception. The amendments in the ASU change the classification of certain equity-linked financial instruments (or embedded features) with down round features. The amendments also clarify existing disclosure requirements for equity-classified instruments. The amendments in Part II of this ASU recharacterize the indefinite deferral of certain provisions of Topic 480, Distinguishing Liabilities from Equity, that now are presented as pending content in the Codification, to a scope exception. Those amendments do not have an accounting effect. For public entities, ASU 2017-11 Part I is effective for interim and annual periods beginning after December 15, 2018; however, early adoption is permitted. The amendments in Part II of this ASU do not require any transition guidance because those amendments do not have an accounting effect. The adoption of this ASU is not expected to have an impact on the Company’s financial statements as the Company has not historically issued financial instruments that include down round features.
In August 2017, the FASB issued ASU 2017-12—Derivatives and Hedging (Topic 815): Targeted Improvements to Accounting for Hedging Activities. The amendments in this ASU better align an entity’s risk management activities and financial reporting for hedging relationships through changes to both the designation and measurement guidance for qualifying hedging relationships and the presentation of hedge results. To meet that objective, the amendments expand and refine hedge accounting for both nonfinancial and financial risk components and align the recognition and presentation of the effects of the hedging instrument and the hedged item in the financial statements. The amendments in this ASU also make certain targeted improvements to simplify the application of hedge accounting guidance and ease the administrative burden of hedge documentation requirements and assessing hedge effectiveness. For public entities, ASU 2017-12 is effective for interim and annual periods beginning after December 15, 2018; however, early adoption is permitted. The adoption of this ASU is not expected to have an impact on the Company’s financial statements as the Company does not currently have any hedging relationships.
In February 2018, the FASB issued ASU 2018-02—Income Statement – Reporting Comprehensive Income (Topic 220): Reclassification of Certain Tax Effects from Accumulated Other Comprehensive Income. The amendment provides for the reclassification of the effect of remeasuring deferred tax balances related to items within accumulated other comprehensive income (AOCI) to retained earnings resulting from the Tax Cuts and Jobs Act of 2017. For all entities, ASU 2018-02 is effective for annual periods beginning after December 15, 2018 and interim periods with those fiscal years; however, early adoption is permitted. The Company adopted this ASU as of January 1, 2018, which resulted in a net reclassification of $39,000 between AOCI and retained earnings. The Company’s policy is to release material stranded tax effects on a specific identification basis.
Reclassifications— Various items within the accompanying consolidated financial statements for the previous years have been reclassified to conform to the classifications used for reporting in 2017. These reclassifications had no effect on net earnings.
|
2. |
ACQUISITIONS |
Metropolitan National Bank
On October 1, 2015, the Company completed its acquisition of Metropolitan National Bank (“Metropolitan”) of Springfield, Missouri from Marshfield Investment Company (“Marshfield”). Under the terms of the purchase agreement, the Company acquired 100% of the outstanding common stock of Metropolitan and Marshfield received proceeds of approximately $70 million, consisting of 4,610,317 shares of Company common stock valued at approximately $42 million and $28 million in cash. The Company paid $10.1 million of the total cash consideration and Metropolitan paid $17.9 million of the total cash consideration in conjunction with the closing of the acquisition. Metropolitan conducted business from twelve full service locations throughout Southwest Missouri and one loan production office in Joplin, Missouri. The acquisition expanded the Company’s market into Southern Missouri and further diversified the Company’s loan, customer and deposit base.
The following table provides a summary of the assets acquired and liabilities assumed as recorded by Metropolitan, the fair value adjustments necessary to adjust those acquired assets and assumed liabilities to estimated fair value, and the resultant fair values of those assets and liabilities as recorded by the Company. Goodwill of $14.5 million, which is the excess of the merger consideration over the estimated fair value of net assets acquired, was recorded in the Metropolitan acquisition and is the result of expected operational synergies, expansion of banking services in Southern Missouri, and other factors. The goodwill recognized by the Company is deductible for income tax purposes.
|
October 1, 2015 |
||||||||||||
|
As Recorded by Metropolitan |
Fair Value |
As Recorded |
||||||||||
|
(Dollars in thousands) |
||||||||||||
|
Assets acquired: |
||||||||||||
|
Cash and cash equivalents |
$ | 14,069 | $ | -- | $ | 14,069 | ||||||
|
Federal funds sold |
51 | -- | 51 | |||||||||
|
Investment securities available for sale |
42,677 | 88 | 42,765 | |||||||||
|
Other investment securities, at cost |
2,001 | -- | 2,001 | |||||||||
|
Loans receivable |
375,521 | (10,517 | ) | 365,004 | ||||||||
|
Allowance for loan losses |
(5,839 | ) | 5,839 | -- | ||||||||
|
Loans receivable, net |
369,682 | (4,678 | ) | 365,004 | ||||||||
|
Accrued interest receivable |
1,484 | -- | 1,484 | |||||||||
|
Real estate owned - net |
97 | -- | 97 | |||||||||
|
Office properties and equipment, net |
11,484 | 1,796 | 13,280 | |||||||||
|
Cash surrender value of life insurance |
6,202 | -- | 6,202 | |||||||||
|
Core deposit intangible |
-- | 4,760 | 4,760 | |||||||||
|
Deferred tax asset, net |
-- | 144 | 144 | |||||||||
|
Prepaid expenses and other assets |
597 | -- | 597 | |||||||||
|
Total assets acquired |
448,344 | 2,110 | 450,454 | |||||||||
|
Liabilities assumed: |
||||||||||||
|
Deposits – noninterest bearing |
56,187 | -- | 56,187 | |||||||||
|
Deposits – interest bearing |
314,275 | 187 | 314,462 | |||||||||
|
Total deposits |
370,462 | 187 | 370,649 | |||||||||
|
Short term borrowings |
21,137 | -- | 21,137 | |||||||||
|
Other borrowings |
-- | -- | -- | |||||||||
|
Other liabilities |
20,190 | 857 | 21,047 | |||||||||
|
Total liabilities assumed |
411,789 | 1,044 | 412,833 | |||||||||
|
Net assets acquired |
$ | 36,555 | $ | 1,066 | 37,621 | |||||||
|
Consideration paid: |
||||||||||||
|
Cash |
10,100 | |||||||||||
|
Common stock |
42,000 | |||||||||||
|
Total consideration paid |
52,100 | |||||||||||
|
Goodwill |
$ | 14,479 | ||||||||||
The following is a description of the fair value adjustments used to determine the fair values of assets and liabilities presented above:
Loans – Fair values for loans were based on a discounted cash flow methodology that considered factors including the type of loan and related collateral, classification status, fixed or variable interest rate, term of loan and whether or not the loan was amortizing, and current discount rates. The discount rates used for loans are based on current market rates for new originations of comparable loans and include adjustments for liquidity concerns. The fair value adjustment reflects the elimination of the recorded allowance for loan and lease losses.
Office properties and equipment – Office properties and equipment were acquired from Metropolitan with a $1.8 million adjustment to market value. This represents the difference between current appraisal value completed in connection with the acquisition and Metropolitan’s book value at the time of acquisition.
Deferred tax asset – Deferred income tax assets are recorded to reflect the differences in the carrying values of the assumed liabilities for financial reporting purposes and the cost basis for federal income tax purposes, at the Company’s statutory federal and state income tax rate of 38.29%.
Core deposit intangible – This intangible asset represents the value of the relationships that Metropolitan had with its deposit customers. The fair value of this intangible asset was estimated based on a discounted cash flow methodology that gave appropriate consideration to expected customer attrition rates, cost of the deposit base, and the net maintenance cost attributable to customer deposits. The Company recorded a $4.8 million core deposit intangible with a weighted average life of 12 years.
Deposits – The weighted average interest rate of Metropolitan’s time deposits was estimated to be slightly above the current market rates, resulting in a fair value adjustment for time deposits of $187,000.
Other liabilities – The adjustment to other liabilities primarily represents the accrual of change in control agreements and an unfavorable lease liability.
Beginning October 1, 2015, the operations of Metropolitan are included in the Company’s consolidated results of operations and contributed $5.6 million of net interest income and $1.0 million of net income for the year ended December 31, 2015. The following pro-forma combined consolidated financial information presents how the combined financial information of the Company and Metropolitan might have appeared had the businesses actually been combined as of the beginning of the reporting period. The following schedule represents the pro-forma combined financial information as of the year ended December 31, 2015, assuming the acquisition was completed as of January 1, 2015, (in thousands, except per share data):
|
2015 |
||||
|
Net interest income |
$ | 67,834 | ||
|
Total noninterest income |
15,698 | |||
|
Net income |
13,466 | |||
|
Basic earnings per common share |
$ | 0.34 | ||
|
Diluted earnings per common share |
$ | 0.34 | ||
The pro-forma consolidated financial information is presented for illustrative purposes only and does not indicate the financial results of the combined company had the companies actually been combined at the beginning of the period presented and had the impact of possible revenue enhancements and expense efficiencies, among other factors, been considered and, accordingly, does not attempt to predict or suggest future results. It also does not necessarily reflect what the historical results of the combined company would have been had the companies been combined during this period.
|
3. |
INTEREST BEARING TIME DEPOSITS IN BANKS |
Interest bearing time deposits in banks mature within two to five years and are carried at cost. The scheduled maturities of these deposits at December 31, 2017, by contractual maturity are shown below (in thousands):
|
Weighted |
||||||||
|
Years ending December 31: |
Average Rate |
Amount |
||||||
|
2019 |
0.48 | % | $ | 100 | ||||
|
2021 |
1.84 | 2,490 | ||||||
|
2022 |
2.32 | 1,485 | ||||||
|
Total |
1.98 | % | $ | 4,075 | ||||
|
4. |
INVESTMENT SECURITIES |
Investment securities consisted of the following at December 31 (in thousands):
|
2017 |
||||||||||||||||
|
Gross |
Gross |
|||||||||||||||
|
Amortized |
Unrealized |
Unrealized |
Fair |
|||||||||||||
|
Cost |
Gains |
Losses |
Value |
|||||||||||||
|
Available for sale |
||||||||||||||||
|
U.S. Treasuries and government agencies |
$ | 3,000 | $ | -- | $ | (37 | ) | $ | 2,963 | |||||||
|
Municipal securities |
92,057 | 1,013 | (125 | ) | 92,945 | |||||||||||
|
Residential mortgage-backed securities |
96,453 | 338 | (1,113 | ) | 95,678 | |||||||||||
|
Corporate debt securities |
5,000 | 220 | -- | 5,220 | ||||||||||||
|
Total available for sale |
$ | 196,510 | $ | 1,571 | $ | (1,275 | ) | $ | 196,806 | |||||||
|
Held to maturity |
||||||||||||||||
|
Municipal securities |
$ | 42,775 | $ | 388 | $ | (314 | ) | $ | 42,849 | |||||||
|
Total held to maturity |
$ | 42,775 | $ | 388 | $ | (314 | ) | $ | 42,849 | |||||||
|
2016 |
||||||||||||||||
|
Gross |
Gross |
|||||||||||||||
|
Amortized |
Unrealized |
Unrealized |
Fair |
|||||||||||||
|
Cost |
Gains |
Losses |
Value |
|||||||||||||
|
Available for sale |
||||||||||||||||
|
U.S. Treasuries and government agencies |
$ | 5,657 | $ | 5 | $ | (31 | ) | $ | 5,631 | |||||||
|
Municipal securities |
88,276 | 343 | (1,569 | ) | 87,050 | |||||||||||
|
Residential mortgage-backed securities |
96,870 | 348 | (1,423 | ) | 95,795 | |||||||||||
|
Total available for sale |
$ | 190,803 | $ | 696 | $ | (3,023 | ) | $ | 188,476 | |||||||
|
Held to maturity |
||||||||||||||||
|
Municipal securities |
$ | 26,977 | $ | 16 | $ | (1,903 | ) | $ | 25,090 | |||||||
|
Total held to maturity |
$ | 26,977 | $ | 16 | $ | (1,903 | ) | $ | 25,090 | |||||||
The mortgage-backed portfolios at December 31, 2017 and 2016 were composed entirely of residential mortgage-backed securities issued or guaranteed by GNMA, FNMA or FHLMC.
The following tables summarize the gross unrealized losses and fair value of the Company's investments classified as available for sale and held to maturity with unrealized losses that are not deemed to be other-than-temporarily impaired (“OTTI”), aggregated by investment category and length of time that individual securities have been in a continuous unrealized loss position at December 31 (in thousands):
|
2017 |
||||||||||||||||||||||||
|
Less than 12 Months |
12 Months or More |
Total |
||||||||||||||||||||||
|
Fair |
Unrealized |
Fair |
Unrealized |
Fair |
Unrealized |
|||||||||||||||||||
|
Value |
Losses |
Value |
Losses |
Value |
Losses |
|||||||||||||||||||
|
U.S. Treasuries and government agencies |
$ | 494 | $ | 6 | $ | 1,969 | $ | 31 | $ | 2,463 | $ | 37 | ||||||||||||
|
Municipal securities |
14,335 | 55 | 20,633 | 384 | 34,968 | 439 | ||||||||||||||||||
|
Residential mortgage-backed securities |
31,115 | 167 | 40,947 | 946 | 72,062 | 1,113 | ||||||||||||||||||
|
Total |
$ | 45,944 | $ | 228 | $ | 63,549 | $ | 1,361 | $ | 109,493 | $ | 1,589 | ||||||||||||
| 2016 | ||||||||||||||||||||||||
|
Less than 12 Months |
12 Months or More |
Total |
||||||||||||||||||||||
|
Fair |
Unrealized |
Fair |
Unrealized |
Fair |
Unrealized |
|||||||||||||||||||
|
Value |
Losses |
Value |
Losses |
Value |
Losses |
|||||||||||||||||||
|
U.S. Treasuries and government agencies |
$ | 1,969 | $ | 31 | $ | -- | $ | -- | $ | 1,969 | $ | 31 | ||||||||||||
|
Municipal securities |
73,194 | 3,472 | -- | -- | 73,194 | 3,472 | ||||||||||||||||||
|
Residential mortgage-backed securities |
78,725 | 1,423 | -- | -- | 78,725 | 1,423 | ||||||||||||||||||
|
Total |
$ | 153,888 | $ | 4,926 | $ | -- | $ | -- | $ | 153,888 | $ | 4,926 | ||||||||||||
On a quarterly basis, management conducts a formal review of securities for the presence of OTTI. Management assesses whether an OTTI is present when the fair value of a security is less than its amortized cost basis at the balance sheet date. For such securities, OTTI is considered to have occurred if the Company intends to sell the security, if it is more likely than not the Company will be required to sell the security before recovery of its amortized cost basis or if the present values of expected cash flows is not sufficient to recover the entire amortized cost.
The unrealized losses are primarily a result of increases in market yields from the time of purchase. In general, as market yields rise, the fair value of securities will decrease; as market yields fall, the fair value of securities will increase. Management generally views changes in fair value caused by changes in interest rates as temporary; therefore, these securities have not been classified as other-than-temporarily impaired. Additionally, the unrealized losses are also considered temporary because scheduled coupon payments have been made, it is anticipated that the entire principal balance will be collected as scheduled, and management neither intends to sell the securities nor is it more likely than not that the Company will be required to sell the securities before the recovery of the remaining amortized cost amount.
The Company has pledged investment securities with fair values of approximately $122.7 million at December 31, 2017 and $140.6 million at December 31, 2016, as collateral for certain deposits in excess of $250,000 and for other purposes, including investment securities with fair values of approximately $13.4 million at December 31, 2017 and $19.1 million at December 31, 2016, for securities sold under agreements to repurchase.
The following table sets forth the amount (dollars in thousands) of investment securities that contractually mature during each of the periods indicated and the weighted average yields for each range of maturities at December 31, 2017. Weighted average yields for municipal obligations have not been adjusted to a tax-equivalent basis. Expected maturities may differ from contractual maturities because issuers may have the right to call or prepay the obligation without prepayment penalties.
|
December 31, 2017 |
||||||||||||||||||||||||
|
Available for Sale |
Held to Maturity |
|||||||||||||||||||||||
|
|
|
Weighted |
|
|
Weighted |
|||||||||||||||||||
|
Amortized Cost |
Fair Value |
Average Rate |
Amortized Cost |
Fair Value |
Average Rate |
|||||||||||||||||||
|
Within one year |
$ | 4,371 | $ | 4,372 | 2.04 | % | $ | -- | $ | -- | -- | |||||||||||||
|
Due from one year to five years |
15,925 | 15,911 | 2.23 | % | -- | -- | -- | |||||||||||||||||
|
Due from five years to ten years |
19,145 | 19,517 | 3.51 | % | 6,506 | 6,548 | 2.20 | % | ||||||||||||||||
|
Due after ten years |
60,616 | 61,328 | 2.91 | % | 36,269 | 36,301 | 2.80 | % | ||||||||||||||||
| 100,057 | 101,128 | 2.88 | % | 42,775 | 42,849 | 2.71 | % | |||||||||||||||||
|
Residential mortgage-backed securities |
96,453 | 95,678 | 2.41 | % | -- | -- | -- | |||||||||||||||||
|
Total |
$ | 196,510 | $ | 196,806 | 2.65 | % | $ | 42,775 | $ | 42,849 | 2.71 | % | ||||||||||||
As of December 31, 2017 and 2016, investment securities with an amortized cost totaling approximately $133.8 million and $93.8 million, respectively, have call options held by the issuer, of which approximately $24.9 million and $27.4 million, respectively, are or were callable within one year.
Information regarding sales of the Company’s investment securities available for sale for the years ended December 31 is summarized below (in thousands):
|
2017 |
2016 |
2015 |
||||||||||
|
Sales proceeds |
$ | 2,069 | $ | 30,386 | $ | 21,099 | ||||||
|
Gross realized gains |
$ | 48 | $ | 195 | $ | 92 | ||||||
|
Gross realized losses |
-- | (176 | ) | (72 | ) | |||||||
|
Net gains on sales of investment securities |
$ | 48 | $ | 19 | $ | 20 | ||||||
At December 31, 2017 and 2016, the Company included the following securities in other investments, at cost, in the accompanying consolidated balance sheets (in thousands):
|
2017 |
2016 |
|||||||
|
FHLB Stock |
$ | 19,136 | $ | 5,927 | ||||
|
FRB Stock |
7,610 | 7,501 | ||||||
|
Other investments |
331 | 331 | ||||||
|
Total |
$ | 27,077 | $ | 13,759 | ||||
|
5. |
LOANS RECEIVABLE |
Loans receivable consisted of the following at December 31 (in thousands):
|
2017 |
2016 |
|||||||
|
Real estate: |
||||||||
|
One- to four-family residential |
$ | 391,225 | $ | 389,107 | ||||
|
Multifamily residential |
89,087 | 92,460 | ||||||
|
Nonfarm nonresidential |
557,185 | 495,173 | ||||||
|
Farmland |
96,786 | 94,018 | ||||||
|
Construction and land development |
157,453 | 125,785 | ||||||
|
Commercial |
345,087 | 323,096 | ||||||
|
Consumer |
36,036 | 36,265 | ||||||
|
Total loans receivable |
1,672,859 | 1,555,904 | ||||||
|
Unearned discounts and net deferred loan costs |
378 | 485 | ||||||
|
Allowance for loan and lease losses |
(18,992 | ) | (15,584 | ) | ||||
|
Loans receivable—net |
$ | 1,654,245 | $ | 1,540,805 | ||||
Loan Origination and Underwriting – The Bank employs several tools to manage risk in its loan portfolio. Prior to origination, a borrower’s ability to repay is analyzed by reviewing financial information with a comparison of the sustainability of these cash flows to the proposed loan terms, with consideration given to possible changes in underlying business and economic conditions. The financial strength and support offered by any guarantors to the loan is evaluated and any collateral offered is assessed using internal and external valuation resources. Finally, the credit request is compared against the Bank’s board-approved written lending policies and standards. The ongoing risk in the loan portfolio is managed through regularly reviewing loans to assess key credit elements, providing for an adequate allowance for loan losses and diversifying the portfolio based on certain metrics including industry and collateral types, loan purpose and underlying source of repayment.
Real Estate Loans – The real estate loan portfolio consists primarily of single family residential, commercial real estate and construction loans. Loans in this category are differentiated by whether the property owner or parties unrelated to the borrower occupy the property. This difference can directly affect the sensitivity of the source of loan repayment to changes in interest rates and market conditions, which can impact the underlying collateral value. Therefore, the analysis of these credits focuses on current and forecasted economic trends in certain sub-markets, including residential, industrial, retail, office and multi-family segments. Changes in these segments are influenced by both local and national cycles, which may fluctuate in both similar and opposing directions and sustain for varying durations. These differences provide the Bank with opportunities for diversification of loans by property type, geography and other factors.
Commercial Loans – This portfolio includes loans with funds used for commercial purposes including loans to finance enterprise, including agricultural, working capital needs; equipment purchases; accounts receivable and inventory and other similar business needs. The risk of loans in this category is driven by the cash flow and creditworthiness of the borrowers, the monitoring of which occurs through the ongoing analysis of interim financial information. Also, the terms of these loans are generally shorter than credits secured by real estate, helping to reduce the impact of changes in interest rates on the Bank’s interest rate sensitivity position.
Consumer Loans – Our portfolio of consumer loans generally includes loans to individuals for household, family and other personal expenditures. Proceeds from such loans are used to, among other things, fund the purchase of automobiles, recreational vehicles, boats, mobile homes and for other similar purposes. Consumer loans generally have higher interest rates. However, such loans pose additional risks of collectability and loss when compared to certain other types of loans. The borrower’s ability to repay is of primary importance in the underwriting of consumer loans.
Loans sold with servicing retained are not included in the accompanying consolidated statements of financial condition. The unpaid principal balances of such loans at December 31, 2017 and December 31, 2016 were $3.8 million and $14.7 million, respectively. Servicing loans for others generally consists of collecting payments and disbursing payments to investors. Servicing income for the periods ended December 31, 2017 and 2016 was not significant.
As of December 31, 2017 and December 31, 2016, qualifying loans collateralized by first lien one- to four-family mortgages with balances totaling approximately $21.7 million and $26.4 million, respectively, were held in custody by the Federal Home Loan Bank of Dallas and were pledged for outstanding advances or available for future advances. The Bank also pledged a significant portion of its remaining loans at December 31, 2017 under a blanket lien with the FHLB.
Purchased Loans – The Company evaluated $583.6 million of net loans ($595.1 million gross loans less $11.5 million discount) purchased in conjunction with the acquisition of First National Security Company (“FNSC”) in 2014 in accordance with the provisions of FASB ASC Topic 310-20, Nonrefundable Fees and Other Costs. The fair value discount is being accreted into interest income over the weighted average life of the loans using a constant yield method.
The Company evaluated $364.5 million of net loans ($375.0 million gross loans less $10.5 million discount) purchased in conjunction with the acquisition of Metropolitan in 2015 in accordance with the provisions of FASB ASC Topic 310-20, Nonrefundable Fees and Other Costs. The fair value discount is being accreted into interest income over the weighted average life of the loans using a constant yield method.
The Company evaluated $21.1 million of net loans ($26.9 million gross loans less $5.8 million discount) purchased in conjunction with the acquisition of FNSC in 2014 in accordance with the provisions of FASB ASC Topic 310-30, Loans and Debt Securities Acquired with Deteriorated Credit Quality. The following table reflects the carrying amount of purchased credit impaired (“PCI”) loans, which are included in the loan categories above (in thousands):
|
December 31, 2017 |
December 31, 2016 |
June 13, 2014 |
||||||||||
|
One- to four-family residential |
$ | 2,210 | $ | 2,714 | $ | 4,728 | ||||||
|
Nonfarm nonresidential |
1,987 | 7,576 | 10,790 | |||||||||
|
Farmland |
26 | 53 | 95 | |||||||||
|
Construction and land development |
1,442 | 1,432 | 3,432 | |||||||||
|
Commercial |
514 | 556 | 1,882 | |||||||||
|
Consumer |
41 | 53 | 178 | |||||||||
|
Total carrying value of PCI loans |
$ | 6,220 | $ | 12,384 | $ | 21,105 | ||||||
|
Outstanding principal balance of PCI loans |
$ | 8,529 | $ | 15,468 | $ | 26,942 | ||||||
The following table reflects the carrying amount of the fair value adjustments for purchased loans with evidence of credit deterioration as of June 13, 2014 (in thousands).
|
Contractually required principal and interest |
$ | 29,704 | ||
|
Nonaccretable differences |
(6,293 | ) | ||
|
Cash flows expected to be collected |
23,411 | |||
|
Accretable differences |
(2,306 | ) | ||
|
Day 1 Fair Value |
$ | 21,105 |
The following table documents changes as of December 31, 2017, 2016 and 2015 to the amount of accretable yield on loans evaluated in accordance with the provisions of FASB ASC Topic 310-30 (in thousands).
|
2017 |
2016 |
2015 |
||||||||||
|
Balance at January 1 |
$ | 890 | $ | 1,370 | $ | 2,165 | ||||||
|
Accretable yield acquired |
-- | -- | -- | |||||||||
|
Accretion |
(1,259 | ) | (848 | ) | (1,062 | ) | ||||||
|
Adjustments to accretable differences due to: |
||||||||||||
|
Reclassification from nonaccretable difference |
2,207 | 1,462 | 317 | |||||||||
|
Changes in expected cash flows that do not affect nonaccretable differences |
(695 | ) | (1,140 | ) | (60 | ) | ||||||
|
Transfers to real estate owned |
11 | 46 | 10 | |||||||||
|
Balance at December 31 |
$ | 1,154 | $ | 890 | $ | 1,370 | ||||||
Age Analysis – Age analyses of loans as of the dates indicated, including both accruing and nonaccrual loans, are presented below (in thousands):
|
December 31, 2017 |
30-89 Days Past Due |
90 Days or More Past Due |
Current |
Total |
||||||||||||
|
One- to four-family residential |
$ | 4,742 | $ | 3,560 | $ | 382,923 | $ | 391,225 | ||||||||
|
Multifamily residential |
-- | -- | 89,087 | 89,087 | ||||||||||||
|
Nonfarm nonresidential |
174 | 6,098 | 550,913 | 557,185 | ||||||||||||
|
Farmland |
404 | 88 | 96,294 | 96,786 | ||||||||||||
|
Construction and land development |
60 | 173 | 157,220 | 157,453 | ||||||||||||
|
Commercial |
766 | 1,353 | 342,968 | 345,087 | ||||||||||||
|
Consumer |
561 | 209 | 35,266 | 36,036 | ||||||||||||
|
Total |
$ | 6,707 | $ | 11,481 | $ | 1,654,671 | $ | 1,672,859 | ||||||||
|
December 31, 2016 |
30-89 Days Past Due |
90 Days or More Past Due |
Current |
Total |
||||||||||||
|
One- to four-family residential |
$ | 4,472 | $ | 2,750 | $ | 381,885 | $ | 389,107 | ||||||||
|
Multifamily residential |
119 | -- | 92,341 | 92,460 | ||||||||||||
|
Nonfarm nonresidential |
1,651 | 1,317 | 492,205 | 495,173 | ||||||||||||
|
Farmland |
131 | 649 | 93,238 | 94,018 | ||||||||||||
|
Construction and land development |
20 | 522 | 125,243 | 125,785 | ||||||||||||
|
Commercial |
413 | 503 | 322,180 | 323,096 | ||||||||||||
|
Consumer |
422 | 81 | 35,762 | 36,265 | ||||||||||||
|
Total |
$ | 7,228 | $ | 5,822 | $ | 1,542,854 | $ | 1,555,904 | ||||||||
As of December 31, 2017 and December 31, 2016, there were $0.5 million and $0.8 million, respectively, of PCI loans acquired in the merger with FNSC that were 90 days or more past due and accruing. Restructured loans totaled $5.6 million as of December 31, 2017 and $6.0 million as of December 31, 2016, with $4.7 million and $1.2 million of such restructured loans on nonaccrual status at December 31, 2017 and December 31, 2016, respectively.
The following tables present age analyses of nonaccrual loans as of December 31, 2017 and 2016 (in thousands):
|
December 31, 2017 |
30-89 Days Past Due |
90 Days or More Past Due |
Current |
Total |
||||||||||||
|
One- to four-family residential |
$ | 778 | $ | 3,326 | $ | 2,957 | $ | 7,061 | ||||||||
|
Nonfarm nonresidential |
76 | 5,954 | 1,344 | 7,374 | ||||||||||||
|
Farmland |
223 | 88 | 346 | 657 | ||||||||||||
|
Construction and land development |
11 | 103 | 74 | 188 | ||||||||||||
|
Commercial |
76 | 1,238 | 355 | 1,669 | ||||||||||||
|
Consumer |
7 | 172 | 33 | 212 | ||||||||||||
|
Total |
$ | 1,171 | $ | 10,881 | $ | 5,109 | $ | 17,161 | ||||||||
|
December 31, 2016 |
30-89 Days Past Due |
90 Days or More Past Due |
Current |
Total |
||||||||||||
|
One- to four-family residential |
$ | 1,194 | $ | 2,332 | $ | 3,183 | $ | 6,709 | ||||||||
|
Nonfarm nonresidential |
94 | 1,156 | 3,927 | 5,177 | ||||||||||||
|
Farmland |
41 | 650 | 92 | 783 | ||||||||||||
|
Construction and land development |
13 | 450 | -- | 463 | ||||||||||||
|
Commercial |
229 | 386 | 3,456 | 4,071 | ||||||||||||
|
Consumer |
39 | 78 | 56 | 173 | ||||||||||||
|
Total |
$ | 1,610 | $ | 5,052 | $ | 10,714 | $ | 17,376 | ||||||||
As of December 31, 2017 and 2016, there were $2.6 million and $1.0 million, respectively, of loans in the process of foreclosure, of which $1.0 million and $0.5 million, respectively, were one- to four-family residential mortgage loans.
Impaired Loans – The following tables summarize information pertaining to impaired loans as of December 31, 2017, 2016 and 2015 and for the years then ended (in thousands). The tables below do not include ASC 310-30 purchased credit impaired loans which are disclosed separately in the loans receivable footnote.
|
As of or For the Year Ended December 31, 2017 |
||||||||||||||||||||
|
Unpaid Principal Balance |
Recorded Investment |
Valuation Allowance |
Average Recorded Investment |
Interest Income Recognized |
||||||||||||||||
|
Impaired loans with a valuation allowance: |
||||||||||||||||||||
|
One- to four-family residential |
$ | 240 | $ | 215 | $ | 64 | $ | 223 | $ | 7 | ||||||||||
|
Nonfarm nonresidential |
305 | 305 | 9 | 61 | -- | |||||||||||||||
|
Farmland |
-- | -- | -- | 76 | -- | |||||||||||||||
|
Commercial |
678 | 676 | 431 | 933 | -- | |||||||||||||||
|
Consumer |
5 | 5 | 5 | 5 | -- | |||||||||||||||
| 1,228 | 1,201 | 509 | 1,298 | 7 | ||||||||||||||||
|
Impaired loans without a valuation allowance: |
||||||||||||||||||||
|
One- to four-family residential |
9,277 | 7,035 | -- | 6,828 | -- | |||||||||||||||
|
Multifamily |
-- | -- | -- | 48 | -- | |||||||||||||||
|
Nonfarm nonresidential |
9,110 | 7,692 | -- | 8,627 | 36 | |||||||||||||||
|
Farmland |
704 | 657 | -- | 908 | -- | |||||||||||||||
|
Construction and land development |
353 | 258 | -- | 375 | 5 | |||||||||||||||
|
Commercial |
1,254 | 993 | -- | 1,641 | -- | |||||||||||||||
|
Consumer |
220 | 207 | -- | 186 | -- | |||||||||||||||
| 20,918 | 16,842 | -- | 18,613 | 41 | ||||||||||||||||
|
Total impaired loans |
$ | 22,146 | $ | 18,043 | $ | 509 | $ | 19,911 | $ | 48 | ||||||||||
|
Interest based on original terms |
$ | 1,145 | ||||||||||||||||||
|
Interest income recognized on a cash basis on impaired loans |
$ | -- | ||||||||||||||||||
|
As of or For the Year Ended December 31, 2016 |
||||||||||||||||||||
|
Unpaid Principal Balance |
Recorded Investment |
Valuation Allowance |
Average Recorded Investment |
Interest Income Recognized |
||||||||||||||||
|
Impaired loans with a valuation allowance: |
||||||||||||||||||||
|
One- to four-family residential |
$ | 244 | $ | 229 | $ | 74 | $ | 332 | $ | 7 | ||||||||||
|
Nonfarm nonresidential |
-- | -- | -- | 903 | -- | |||||||||||||||
|
Farmland |
-- | -- | -- | 95 | -- | |||||||||||||||
|
Construction and land development |
-- | -- | -- | 75 | -- | |||||||||||||||
|
Commercial |
1,865 | 1,788 | 488 | 2,523 | -- | |||||||||||||||
|
Consumer |
5 | 5 | 5 | 5 | -- | |||||||||||||||
| 2,114 | 2,022 | 567 | 3,933 | 7 | ||||||||||||||||
|
Impaired loans without a valuation allowance: |
||||||||||||||||||||
|
One- to four-family residential |
8,704 | 6,677 | -- | 7,074 | -- | |||||||||||||||
|
Multifamily |
-- | -- | -- | 107 | -- | |||||||||||||||
|
Nonfarm nonresidential |
11,022 | 9,421 | -- | 5,656 | -- | |||||||||||||||
|
Farmland |
1,226 | 783 | -- | 740 | -- | |||||||||||||||
|
Construction and land development |
728 | 539 | -- | 593 | 6 | |||||||||||||||
|
Commercial |
2,893 | 2,570 | -- | 1,664 | -- | |||||||||||||||
|
Consumer |
184 | 168 | -- | 200 | -- | |||||||||||||||
| 24,757 | 20,158 | -- | 16,034 | 6 | ||||||||||||||||
|
Total impaired loans |
$ | 26,871 | $ | 22,180 | $ | 567 | $ | 19,967 | $ | 13 | ||||||||||
|
Interest based on original terms |
$ | 1,360 | ||||||||||||||||||
|
Interest income recognized on a cash basis on impaired loans |
$ | -- | ||||||||||||||||||
|
As of or For the Year Ended December 31, 2015 |
||||||||||||||||||||
|
Unpaid Principal Balance |
Recorded Investment |
Valuation Allowance |
Average Recorded Investment |
Interest Income Recognized |
||||||||||||||||
|
Impaired loans with a valuation allowance: |
||||||||||||||||||||
|
One- to four-family residential |
$ | 430 | $ | 312 | $ | 83 | $ | 833 | $ | 7 | ||||||||||
|
Nonfarm nonresidential |
2,728 | 2,395 | 522 | 2,651 | -- | |||||||||||||||
|
Farmland |
616 | 473 | 112 | 479 | -- | |||||||||||||||
|
Construction and land development |
215 | 211 | 89 | 152 | -- | |||||||||||||||
|
Commercial |
1,153 | 1,150 | 250 | 461 | -- | |||||||||||||||
|
Consumer |
5 | 5 | 5 | 13 | -- | |||||||||||||||
| 5,147 | 4,546 | 1,061 | 4,589 | 7 | ||||||||||||||||
|
Impaired loans without a valuation allowance: |
||||||||||||||||||||
|
One- to four-family residential |
7,605 | 6,348 | -- | 4,902 | 1 | |||||||||||||||
|
Multifamily |
282 | 230 | -- | 50 | -- | |||||||||||||||
|
Nonfarm nonresidential |
5,352 | 4,243 | -- | 1,759 | -- | |||||||||||||||
|
Farmland |
796 | 499 | -- | 303 | -- | |||||||||||||||
|
Construction and land development |
686 | 490 | -- | 535 | 6 | |||||||||||||||
|
Commercial |
3,293 | 3,085 | -- | 1,399 | -- | |||||||||||||||
|
Consumer |
188 | 183 | -- | 108 | -- | |||||||||||||||
| 18,202 | 15,078 | -- | 9,056 | 7 | ||||||||||||||||
|
Total impaired loans |
$ | 23,349 | $ | 19,624 | $ | 1,061 | $ | 13,645 | $ | 14 | ||||||||||
|
Interest based on original terms |
$ | 1,179 | ||||||||||||||||||
|
Interest income recognized on a cash basis on impaired loans |
$ | -- | ||||||||||||||||||
Credit Quality Indicators. As part of the on-going monitoring of the credit quality of the Bank’s loan portfolio, the Bank categorizes loans into risk categories based on available and relevant information about the ability of borrowers to service their debt such as: current financial information, historical payment experience, credit documentation, public information, and current economic trends, among other factors. The Bank analyzes loans individually by assigning a credit risk rating to loans on at least an annual basis for non-homogeneous loans over $1.0 million. The Bank uses the following definitions for risk ratings:
Pass. Loans rated as pass generally meet or exceed normal credit standards. Factors influencing the level of pass grade include repayment source and strength, collateral, borrower cash flows, existence of and strength of guarantors, industry/business sector, financial trends, performance history, etc.
Special Mention. Loans rated as special mention, while still adequately protected by the borrower’s repayment capability, exhibit distinct weakening trends. If left unchecked or uncorrected, these potential weaknesses may result in deteriorated prospects of repayment. These exposures require management’s close attention so as to avoid becoming adversely classified credits.
Substandard. Loans rated as substandard are inadequately protected by the current sound net worth and paying capacity of the borrower or the collateral pledged, if any. These assets must have a well-defined weakness based on objective evidence and be characterized by the distinct possibility that the Bank will sustain some loss if the deficiencies are not corrected.
Doubtful. Loans rated as doubtful have all the weaknesses inherent in a substandard asset. In addition, these weaknesses make collection or liquidation in full highly questionable and improbable, based on existing circumstances.
Loss. Loans rated as a loss are considered uncollectible and of such little value that continuance as an asset is not warranted. A loss classification does not mean that an asset has no recovery or salvage value, but that it is not practical or desirable to defer writing off or reserving all or a portion of the asset, even though partial recovery may be effected in the future.
Based on analyses performed at December 31, 2017 and 2016, the risk categories of loans were as follows (in thousands):
|
December 31, 2017 |
||||||||||||||||
|
Pass |
Special Mention |
Substandard |
Total |
|||||||||||||
|
One- to four-family residential |
$ | 379,407 | $ | 150 | $ | 11,668 | $ | 391,225 | ||||||||
|
Multifamily residential |
89,087 | -- | -- | 89,087 | ||||||||||||
|
Nonfarm nonresidential |
543,427 | 287 | 13,471 | 557,185 | ||||||||||||
|
Farmland |
95,114 | -- | 1,672 | 96,786 | ||||||||||||
|
Construction and land development |
148,927 | -- | 8,526 | 157,453 | ||||||||||||
|
Commercial |
314,028 | 18,040 | 13,019 | 345,087 | ||||||||||||
|
Consumer |
35,644 | -- | 392 | 36,036 | ||||||||||||
|
Total |
$ | 1,605,634 | $ | 18,477 | $ | 48,748 | $ | 1,672,859 | ||||||||
|
December 31, 2016 |
||||||||||||||||
|
Pass |
Special Mention |
Substandard |
Total |
|||||||||||||
|
One- to four-family residential |
$ | 375,287 | $ | 206 | $ | 13,614 | $ | 389,107 | ||||||||
|
Multifamily residential |
92,460 | -- | -- | 92,460 | ||||||||||||
|
Nonfarm nonresidential |
473,343 | 314 | 21,516 | 495,173 | ||||||||||||
|
Farmland |
92,131 | -- | 1,887 | 94,018 | ||||||||||||
|
Construction and land development |
116,269 | -- | 9,516 | 125,785 | ||||||||||||
|
Commercial |
317,069 | -- | 6,027 | 323,096 | ||||||||||||
|
Consumer |
35,953 | 1 | 311 | 36,265 | ||||||||||||
|
Total |
$ | 1,502,512 | $ | 521 | $ | 52,871 | $ | 1,555,904 | ||||||||
As of December 31, 2017 and 2016, the Bank did not have any loans classified as doubtful or loss.
Troubled Debt Restructurings. Troubled debt restructurings (“TDRs”) are loans where the contractual terms on the loan have been modified and both of the following conditions exist: (i) the borrower is experiencing financial difficulty and (ii) the restructuring constitutes a concession that the Bank would not otherwise make. The Bank assesses all loan modifications to determine if the modifications constitute a TDR. Restructurings resulting in an insignificant delay in payment are not considered to be TDRs. Management determines the significance of payment delays and payment shortfalls on a case-by-case basis, taking into consideration all of the circumstances surrounding the loan and the borrower, including the length and the reasons for the delay, the borrower’s prior payment record, and the amount of the shortfall in relation to the principal and interest owed. All TDRs are considered impaired loans. Impairment is measured on a loan-by-loan basis by either the present value of expected future cash flows discounted at the loan’s effective interest rate, the loan’s obtainable market price, or the fair value of the collateral if the loan is collateral dependent.
The following tables summarize TDRs as of December 31, 2017 and 2016: (dollars in thousands)
|
December 31, 2017 |
Number of Accruing TDR Loans |
Balance |
Number of Nonaccrual TDR Loans |
Balance |
Total Number of TDR Loans |
Total Balance |
||||||||||||||||||
|
One- to four-family residential |
2 | $ | 189 | 3 | $ | 90 | 5 | $ | 279 | |||||||||||||||
|
Nonfarm nonresidential |
1 | 623 | 2 | 4,321 | 3 | 4,944 | ||||||||||||||||||
|
Construction and land development |
1 | 70 | 1 | -- | 2 | 70 | ||||||||||||||||||
|
Commercial |
-- | -- | 1 | 282 | 1 | 282 | ||||||||||||||||||
|
Consumer |
-- | -- | 1 | 5 | 1 | 5 | ||||||||||||||||||
|
Total |
4 | $ | 882 | 8 | $ | 4,698 | 12 | $ | 5,580 | |||||||||||||||
|
December 31, 2016 |
Number of Accruing TDR Loans |
Balance |
Number of Nonaccrual TDR Loans |
Balance |
Total Number of TDR Loans |
Total Balance |
||||||||||||||||||
|
One- to four-family residential |
2 | $ | 197 | 6 | $ | 315 | 8 | $ | 512 | |||||||||||||||
|
Nonfarm nonresidential |
1 | 4,244 | 3 | 410 | 4 | 4,654 | ||||||||||||||||||
|
Farmland |
-- | -- | 1 | 250 | 1 | 250 | ||||||||||||||||||
|
Construction and land development |
1 | 76 | 2 | 215 | 3 | 291 | ||||||||||||||||||
|
Commercial |
1 | 287 | -- | -- | 1 | 287 | ||||||||||||||||||
|
Consumer |
-- | -- | 1 | 5 | 1 | 5 | ||||||||||||||||||
|
Total |
5 | $ | 4,804 | 13 | $ | 1,195 | 18 | $ | 5,999 | |||||||||||||||
Loans receivable that were restructured as TDRs during the years ended December 31, 2017 and 2016 were as follows. No loans receivable were restructured as TDRs during the year ended December 31, 2015. (dollars in thousands)
|
Year Ended December 31, 2017 |
||||||||||||||||
|
Number of Loans |
Balance Prior to TDR |
Balance at December 31, 2017 |
Nature of Modification Payment Term (1) |
|||||||||||||
|
Nonfarm nonresidential |
1 | 642 | 623 | 642 | ||||||||||||
|
Total |
1 | $ | 642 | $ | 623 | $ | 642 | |||||||||
______________________
|
(1) |
The borrower’s payment was lowered for the remainder of the term resulting in an extended amortization term. |
|
Year Ended December 31, 2016 |
||||||||||||||||
|
Number of Loans |
Balance Prior to TDR |
Balance at December 31, 2016 |
Nature of Modification Payment Term (2) |
|||||||||||||
|
One- to four-family residential |
1 | $ | 5 | $ | 2 | $ | 5 | |||||||||
|
Nonfarm nonresidential |
1 | 4,244 | 4,244 | 4,244 | ||||||||||||
|
Commercial |
2 | 323 | 288 | 323 | ||||||||||||
|
Total |
4 | $ | 4,572 | $ | 4,534 | $ | 4,572 | |||||||||
______________________
|
(2) |
Concessions represent skipped payments/maturity date extensions, amortization term extensions. |
The Bank had one loan relationship consisting of two loans totaling $4.5 million for which a payment default occurred during the year ended December 31, 2017 that had been modified as a TDR within 12 months or less of the payment default. There were no loans receivable for which a payment default occurred during the years ended December 31, 2016 or 2015 that had been modified as a TDR within 12 months or less of the payment default.
As of December 31, 2017 and 2016, the Bank was not committed to lend additional funds to any customer whose loan was classified as a TDR.
|
6. |
ALLOWANCES FOR LOAN AND LEASE LOSSES AND REAL ESTATE LOSSES |
The tables below provide a rollforward of the allowance for loan and lease losses ("ALLL") by portfolio segment for the years ended December 31, 2017, 2016 and 2015 (in thousands):
|
January 1, 2017 |
Provision (Reversals) |
Charge-offs |
Recoveries |
December 31, 2017 |
||||||||||||||||
|
One- to four-family residential |
$ | 3,896 | $ | 471 | $ | (148 | ) | $ | 25 | $ | 4,244 | |||||||||
|
Multifamily residential |
962 | 110 | (45 | ) | -- | 1,027 | ||||||||||||||
|
Nonfarm nonresidential |
3,210 | 1,216 | -- | -- | 4,426 | |||||||||||||||
|
Farmland |
863 | 398 | (203 | ) | 48 | 1,106 | ||||||||||||||
|
Construction and land development |
1,791 | 502 | -- | 22 | 2,315 | |||||||||||||||
|
Commercial |
3,909 | 1,236 | (289 | ) | 25 | 4,881 | ||||||||||||||
|
Consumer |
360 | 722 | (630 | ) | 104 | 556 | ||||||||||||||
|
Purchased credit impaired |
593 | (157 | ) | (85 | ) | 86 | 437 | |||||||||||||
|
Total |
$ | 15,584 | $ | 4,498 | $ | (1,400 | ) | $ | 310 | $ | 18,992 | |||||||||
|
January 1, 2016 |
Provision (Reversals) |
Charge-offs |
Recoveries |
December 31, 2016 |
||||||||||||||||
|
One- to four-family residential |
$ | 3,870 | $ | 443 | $ | (455 | ) | $ | 38 | $ | 3,896 | |||||||||
|
Multifamily residential |
665 | 298 | (1 | ) | -- | 962 | ||||||||||||||
|
Nonfarm nonresidential |
3,599 | (400 | ) | -- | 11 | 3,210 | ||||||||||||||
|
Farmland |
714 | 149 | -- | -- | 863 | |||||||||||||||
|
Construction and land development |
1,456 | 273 | -- | 62 | 1,791 | |||||||||||||||
|
Commercial |
2,565 | 1,416 | (83 | ) | 11 | 3,909 | ||||||||||||||
|
Consumer |
166 | 558 | (447 | ) | 83 | 360 | ||||||||||||||
|
Purchased credit impaired |
1,515 | (221 | ) | (801 | ) | 100 | 593 | |||||||||||||
|
Total |
$ | 14,550 | $ | 2,516 | $ | (1,787 | ) | $ | 305 | $ | 15,584 | |||||||||
|
January 1, 2015 |
Provision (Reversals) |
Charge-offs |
Recoveries |
December 31, 2015 |
||||||||||||||||
|
One- to four-family residential |
$ | 4,488 | $ | (77 | ) | $ | (661 | ) | $ | 120 | $ | 3,870 | ||||||||
|
Multifamily residential |
791 | (126 | ) | -- | -- | 665 | ||||||||||||||
|
Nonfarm nonresidential |
4,243 | (688 | ) | (17 | ) | 61 | 3,599 | |||||||||||||
|
Farmland |
342 | 372 | -- | -- | 714 | |||||||||||||||
|
Construction and land development |
1,023 | 279 | (10 | ) | 164 | 1,456 | ||||||||||||||
|
Commercial |
2,315 | 259 | (32 | ) | 23 | 2,565 | ||||||||||||||
|
Consumer |
101 | 301 | (354 | ) | 118 | 166 | ||||||||||||||
|
Purchased credit impaired |
357 | 1,477 | (319 | ) | -- | 1,515 | ||||||||||||||
|
Total |
$ | 13,660 | $ | 1,797 | $ | (1,393 | ) | $ | 486 | $ | 14,550 | |||||||||
The tables below present the allocation of the ALLL and the related loans receivable balances disaggregated on the basis of impairment method by portfolio segment as of December 31, 2017 and 2016 (in thousands):
|
Allowance for Loan and Lease Losses |
Loan Balances |
|||||||||||||||||||||||
|
December 31, 2017 |
Individually Evaluated for Impairment |
Collectively Evaluated for Impairment |
Purchased Credit Impaired |
Individually Evaluated for Impairment |
Collectively Evaluated for Impairment |
Purchased Credit Impaired |
||||||||||||||||||
|
One- to four-family residential |
$ | 64 | $ | 4,180 | $ | 220 | $ | 7,250 | $ | 381,765 | $ | 2,210 | ||||||||||||
|
Multifamily residential |
-- | 1,027 | -- | -- | 89,087 | -- | ||||||||||||||||||
|
Nonfarm nonresidential |
9 | 4,417 | 11 | 7,997 | 547,201 | 1,987 | ||||||||||||||||||
|
Farmland |
-- | 1,106 | -- | 657 | 96,103 | 26 | ||||||||||||||||||
|
Construction and land development |
-- | 2,315 | -- | 258 | 155,753 | 1,442 | ||||||||||||||||||
|
Commercial |
431 | 4,450 | 206 | 1,669 | 342,904 | 514 | ||||||||||||||||||
|
Consumer |
5 | 551 | -- | 212 | 35,783 | 41 | ||||||||||||||||||
|
Total |
$ | 509 | $ | 18,046 | $ | 437 | $ | 18,043 | $ | 1,648,596 | $ | 6,220 | ||||||||||||
|
Allowance for Loan and Lease Losses |
Loan Balances |
|||||||||||||||||||||||
|
December 31, 2016 |
Individually Evaluated for Impairment |
Collectively Evaluated for Impairment |
Purchased Credit Impaired |
Individually Evaluated for Impairment |
Collectively Evaluated for Impairment |
Purchased Credit Impaired |
||||||||||||||||||
|
One- to four-family residential |
$ | 74 | $ | 3,822 | $ | 277 | $ | 6,906 | $ | 379,487 | $ | 2,714 | ||||||||||||
|
Multifamily residential |
-- | 962 | -- | -- | 92,460 | -- | ||||||||||||||||||
|
Nonfarm nonresidential |
-- | 3,210 | 89 | 9,421 | 478,176 | 7,576 | ||||||||||||||||||
|
Farmland |
-- | 863 | -- | 783 | 93,182 | 53 | ||||||||||||||||||
|
Construction and land development |
-- | 1,791 | -- | 539 | 123,814 | 1,432 | ||||||||||||||||||
|
Commercial |
488 | 3,421 | 227 | 4,358 | 318,182 | 556 | ||||||||||||||||||
|
Consumer |
5 | 355 | -- | 173 | 36,039 | 53 | ||||||||||||||||||
|
Total |
$ | 567 | $ | 14,424 | $ | 593 | $ | 22,180 | $ | 1,521,340 | $ | 12,384 | ||||||||||||
Activity in the allowance for real estate losses was as follows for the years ended December 31 (in thousands):
|
2017 |
2016 |
2015 |
||||||||||
|
Balance—beginning of year |
$ | 459 | $ | 4,268 | $ | 6,575 | ||||||
|
Provisions for estimated losses |
137 | 311 | 47 | |||||||||
|
Losses charged off |
(455 | ) | (4,120 | ) | (2,354 | ) | ||||||
|
Balance—end of year |
$ | 141 | $ | 459 | $ | 4,268 | ||||||
|
7. |
ACCRUED INTEREST RECEIVABLE |
Accrued interest receivable consisted of the following at December 31 (in thousands):
|
2017 |
2016 |
|||||||
|
Loans |
$ | 6,053 | $ | 5,846 | ||||
|
Investment securities |
1,619 | 1,148 | ||||||
|
Deposits in banks |
5 | 12 | ||||||
|
Total |
$ | 7,677 | $ | 7,006 | ||||
|
8. |
OFFICE PROPERTIES AND EQUIPMENT |
Office properties and equipment consisted of the following at December 31 (in thousands):
|
2017 |
2016 |
|||||||
|
Land and land improvements |
$ | 10,583 | $ | 10,896 | ||||
|
Buildings and improvements |
46,945 | 48,059 | ||||||
|
Furniture and equipment |
13,256 | 13,126 | ||||||
|
Automobiles and other |
222 | 222 | ||||||
|
Total |
71,006 | 72,303 | ||||||
|
Accumulated depreciation |
(20,460 | ) | (18,254 | ) | ||||
|
Office properties and equipment—net |
$ | 50,546 | $ | 54,049 | ||||
Depreciation expense for each of the years ended December 31, 2017, 2016 and 2015 was approximately $3.4 million, $3.7 million and $3.3 million, respectively.
At December 31, 2017, office properties held for sale included five properties with an aggregate carrying value totaling $2.2 million. Office properties held for sale are carried at the lower of carrying amount or fair value less estimated costs to sell. During the year ended December 31, 2017, six properties were sold at a net gain of $27,000. During the year ended December 31, 2016, three properties were sold resulting in a net gain of $1.0 million. Impairment charges of $634,000 and $1.1 million were recognized for the years ended December 31, 2017 and 2016, respectively. Impairment charges and realized gains and losses on office properties held for sale are recorded in other noninterest expense in the consolidated statements of income.
Pursuant to the terms of noncancelable lease agreements in effect at December 31, 2017, pertaining to banking premises and equipment, future minimum rent commitments (in thousands) under various operating leases are as follows:
|
Years Ending December 31 |
Amount |
|||
|
2018 |
$ | 768 | ||
|
2019 |
366 | |||
|
2020 |
287 | |||
|
2021 |
232 | |||
|
2022 |
203 | |||
|
2023 and thereafter |
2,841 | |||
|
Total |
$ | 4,697 | ||
The leases contain options to extend for periods from one to twenty years. The cost of rentals in the renewal periods are not included above except for one lease where there is a loan outstanding between the Bank and the lessor. Total future minimum lease payments for the initial term of this lease and applicable renewal periods reflected in the table total approximately $3.6 million. Total rent expense for the years ended December 31, 2017, 2016 and 2015 amounted to $839,000, $874,000 and $721,000, respectively.
The Company also leases certain of its banking premises to third parties under operating lease agreements. The following is a schedule by years of minimum future rentals receivable on noncancelable operating leases (in thousands):
|
Years Ending December 31 |
Amount |
|||
|
2018 |
$ | 152 | ||
|
2019 |
71 | |||
|
2020 |
27 | |||
|
2021 |
11 | |||
|
2022 |
4 | |||
|
Total |
$ | 265 | ||
The leases contain options to extend for periods up to five years. Such rentals are not included above. Total rental income for the years ended December 31, 2017, 2016 and 2015 amounted to $437,000, $441,000 and $435,000, respectively.
|
9. |
GOODWILL AND CORE DEPOSIT INTANGIBLE - NET |
Goodwill represents the excess of the cost over the fair value of net assets acquired in a business combination. At December 31, 2017, goodwill consisted of $25.7 million related to the FNSC acquisition which is not deductible for tax purposes and $14.5 million related to the Metropolitan acquisition which is deductible for tax purposes. Goodwill is not amortized but is tested for impairment at least annually and updated quarterly if necessary. The Company performed its annual impairment test of goodwill as of September 30, 2017 and no impairment of the Company’s goodwill was indicated. The Company’s core deposit intangible is related to the core deposit premiums of First National, Heritage Bank and Metropolitan. These core deposit intangibles are amortized on a straight line basis over their estimated lives ranging from 12 to 13 years.
Changes in the carrying amount and accumulated amortization of the Company’s core deposit intangible for the years ended December 31 were as follows (in thousands):
|
2017 |
2016 |
2015 |
||||||||||
|
Balance—beginning of period |
$ | 10,353 | $ | 11,374 | $ | 7,338 | ||||||
|
Metropolitan acquisition |
-- | -- | 4,760 | |||||||||
|
Amortization expense |
(1,021 | ) | (1,021 | ) | (724 | ) | ||||||
|
Balance—end of period |
$ | 9,332 | $ | 10,353 | $ | 11,374 | ||||||
The Company’s projected amortization expense is approximately $1.0 million in each of the years ending December 31, 2018 through 2022, and $4.3 million thereafter.
|
10. |
DEPOSITS |
Deposits are summarized as follows at December 31 (in thousands):
|
2017 |
2016 |
|||||||
|
Checking accounts |
$ | 717,869 | $ | 724,137 | ||||
|
Money market accounts |
184,788 | 206,388 | ||||||
|
Savings accounts |
162,448 | 164,653 | ||||||
|
Certificates of deposit |
434,339 | 548,902 | ||||||
|
Total |
$ | 1,499,444 | $ | 1,644,080 | ||||
Overdrafts of checking accounts of $379,000 and $389,000 at December 31, 2017 and 2016, respectively, have been reclassified for financial reporting and are reflected in net loans receivable on the consolidated statements of financial condition.
As of December 31, 2017 and 2016, the Bank had $17.7 million and $37.1 million of brokered deposits, respectively.
The aggregate amount of time deposits in denominations of $100 thousand or more was approximately $216.0 million and $298.3 million at December 31, 2017 and 2016, respectively. The aggregate amount of time deposits in denominations of $250 thousand or more was approximately $77.3 million and $120.4 million at December 31, 2017 and 2016, respectively.
At December 31, 2017, scheduled maturities of certificates of deposit were as follows (in thousands):
|
Years Ending December 31 |
Amount |
|||
|
2018 |
$ | 285,203 | ||
|
2019 |
77,707 | |||
|
2020 |
32,705 | |||
|
2021 |
17,743 | |||
|
2022 |
14,371 | |||
|
2023 and thereafter |
6,610 | |||
|
Total |
$ | 434,339 | ||
Interest expense on deposits consisted of the following (in thousands):
|
Year Ended December 31 |
||||||||||||
|
2017 |
2016 |
2015 |
||||||||||
|
Interest bearing checking accounts |
$ | 846 | $ | 856 | $ | 743 | ||||||
|
Money market accounts |
821 | 790 | 449 | |||||||||
|
Savings and certificate accounts |
5,393 | 4,966 | 4,217 | |||||||||
|
Early withdrawal penalties |
(68 | ) | (97 | ) | (70 | ) | ||||||
|
Total |
$ | 6,992 | $ | 6,515 | $ | 5,339 | ||||||
|
11. |
SECURITIES SOLD UNDER AGREEMENT TO REPURCHASE |
Securities sold under agreements to repurchase totaled $13.4 million and $19.1 million at December 31, 2017 and 2016, respectively. Securities sold under repurchase agreements generally have maturities of one day and are recorded based on the amount of cash received in connection with the borrowing. Securities pledged as collateral under repurchase agreements are included in investment securities on the consolidated statements of financial condition and are disclosed in Note 4. The fair value of the collateral pledged to a third party is monitored and additional collateral is pledged or returned, as deemed appropriate.
The remaining contractual maturity of securities sold under agreements to repurchase as of December 31, 2017 and 2016 consisted of the following (in thousands):
|
December 31, 2017 |
||||||||||||||||||||
|
Overnight and Continuous |
Up to 30 Days |
30-90 Days |
Greater than 90 days |
Total |
||||||||||||||||
| Securities sold under agreements to repurchase: | ||||||||||||||||||||
|
U.S. Treasuries and government agencies |
$ | 82 | $ | -- | $ | -- | $ | -- | $ | 82 | ||||||||||
|
Residential mortgage-backed securities |
13,363 | -- | -- | -- | 13,363 | |||||||||||||||
|
Total |
$ | 13,445 | $ | -- | $ | -- | $ | -- | $ | 13,445 | ||||||||||
|
December 31, 2016 |
||||||||||||||||||||
|
Overnight and Continuous |
Up to 30 Days |
30-90 Days |
Greater than 90 days |
Total |
||||||||||||||||
| Securities sold under agreements to repurchase: | ||||||||||||||||||||
|
U.S. Treasuries and government agencies |
$ | 3,318 | $ | -- | $ | -- | $ | -- | $ | 3,318 | ||||||||||
|
Residential mortgage-backed securities |
15,796 | -- | -- | -- | 15,796 | |||||||||||||||
|
Total |
$ | 19,114 | $ | -- | $ | -- | $ | -- | $ | 19,114 | ||||||||||
At December 31, 2017, the Company and the Bank had unused credit lines allowing contingent access to overnight borrowings of up to $103.0 million on an unsecured basis.
|
12. |
OTHER BORROWINGS |
Other borrowings are summarized as follows at December 31 (in thousands):
|
2017 |
2016 |
|||||||
|
Federal Home Loan Bank advances with rates ranging from 1.30% to 5.57% maturing through July 1, 2027 |
$ | 374,661 | $ | 129,992 | ||||
|
Line of credit with a bank, $14.75 million total credit line, floating rate of 1.95% above the three-month London Interbank Offered Rate (“LIBOR”), reset quarterly, interest payments due quarterly, maturing May 30, 2019 |
2,400 | 4,950 | ||||||
|
Term notes payable to a bank, floating rate of 1.95% above the three-month LIBOR rate, reset quarterly, principal and interest payments due quarterly, maturing May 30, 2019 |
9,750 | 17,062 | ||||||
|
Total |
$ | 386,811 | $ | 152,004 | ||||
Federal Home Loan Bank. At December 31, 2017 and 2016, FHLB advances included $315.0 million and $70.0 million, respectively, of advances with original maturities of one year or less. The Bank currently pledges as collateral for FHLB advances certain qualifying one- to four-family residential mortgage loans and a blanket lien on substantially all remaining loans. Additionally, as of December 31, 2017, the Bank has FHLB letters of credit totaling $60.0 million, of which $25.0 million matures in the first quarter of 2018 and $35.0 million matures in the first quarter of 2019. The letters of credit were used to secure public deposits and certain other deposits as of December 31, 2017 and 2016.
Notes Payable. The line of credit and notes payable to an unaffiliated bank are collateralized by 100% of the stock of the Bank. The loan agreement governing the line of credit and notes payable contains affirmative and negative covenants addressing the ability of the Company and its subsidiaries to, among other things, incur additional indebtedness, maintain property and insurance coverage, pledge assets and incur liens, engage in mergers and acquisitions, redeem capital stock and engage in transactions with affiliates. The agreement also contains financial covenants, including a minimum fixed charge coverage ratio of 2.0 to 1.0, a maximum loan to value ratio of 50%, a maximum classified asset ratio of 50% and Tier 1 Leverage ratio of 8%. At December 31, 2017, the Company was in compliance with the applicable covenants imposed by the loan agreement.
At December 31, 2017, scheduled maturities of other borrowings were as follows (dollars in thousands):
|
Weighted |
|||||||||
|
Average |
|||||||||
|
Years Ending December 31 |
Rate |
Amount |
|||||||
|
2018 |
1.42 | % | $ | 361,977 | |||||
|
2019 |
2.72 | 17,092 | |||||||
|
2020 |
2.37 | 453 | |||||||
|
2021 |
2.12 | 631 | |||||||
|
2022 |
2.54 | 1,259 | |||||||
|
2023 and thereafter |
2.71 | 5,399 | |||||||
|
Total |
1.50 | % | $ | 386,811 | |||||
|
13. |
INCOME TAXES |
The provisions (benefits) for income taxes are summarized as follows at December 31 (in thousands):
|
2017 |
2016 |
2015 |
||||||||||
|
Income tax provision (benefit): |
||||||||||||
|
Current: |
||||||||||||
|
Federal |
$ | 6,319 | $ | 403 | $ | 252 | ||||||
|
State |
675 | 237 | 136 | |||||||||
|
Total current |
6,994 | 640 | 388 | |||||||||
|
Deferred: |
||||||||||||
|
Federal |
4,906 | 6,064 | 3,551 | |||||||||
|
State |
1,095 | 1,052 | 820 | |||||||||
|
Valuation allowance |
-- | (897 | ) | (120 | ) | |||||||
|
Total deferred |
6,001 | 6,219 | 4,251 | |||||||||
|
Total |
$ | 12,995 | $ | 6,859 | $ | 4,639 | ||||||
The reasons for the differences between the statutory federal income tax rates and the effective tax rates are summarized as follows at December 31 (dollars in thousands):
|
2017 |
2016 |
2015 |
||||||||||||||||||||||
|
Taxes at statutory federal income tax rate |
$ | 12,007 | 35.0 | % | $ | 8,504 | 35.0 | % | $ | 5,324 | 35.0 | % | ||||||||||||
|
Increase (decrease) resulting from: |
||||||||||||||||||||||||
|
Graduated tax rates |
-- | -- | (243 | ) | (1.0 | ) | (94 | ) | (0.6 | ) | ||||||||||||||
|
State income tax—net of federal benefits |
1,142 | 3.3 | 865 | 3.6 | 484 | 3.2 | ||||||||||||||||||
|
Valuation allowance—net |
-- | -- | (897 | ) | (3.7 | ) | -- | -- | ||||||||||||||||
|
Earnings on life insurance policies |
(994 | ) | (2.9 | ) | (549 | ) | (2.3 | ) | (515 | ) | (3.4 | ) | ||||||||||||
|
Nontaxable investments |
(1,260 | ) | (3.7 | ) | (677 | ) | (2.8 | ) | (619 | ) | (4.1 | ) | ||||||||||||
|
Change in deferred tax asset related to tax reform |
2,355 | 6.9 | -- | -- | -- | -- | ||||||||||||||||||
|
Other—net |
(255 | ) | (0.7 | ) | (144 | ) | (0.6 | ) | 59 | 0.4 | ||||||||||||||
|
Total |
$ | 12,995 | 37.9 | % | $ | 6,859 | 28.2 | % | $ | 4,639 | 30.5 | % | ||||||||||||
The Company accounts for income taxes under the asset and liability method, which requires the recognition of deferred tax assets and liabilities for expected future tax consequences of events that have been included in the financial statements. Under this method, deferred tax assets and liabilities are determined on the basis of the differences between the financial statement and tax basis of assets and liabilities using enacted tax rates in effect for the year in which the differences are expected to reverse. As per ASC 740-10-30-2 the remaining deferred tax assets and liabilities have been adjusted for the effect of the change in tax rates in the Tax Cuts and Jobs Act (the “Act”) signed into law by President Trump on December 22, 2017. The Act reduces the corporate tax rate to 21 percent, effective January 1, 2018. The charge to deferred income tax provision due to the reduction of the net deferred tax assets as a result of the change in tax rates for the year ended December 31, 2017 amounted to $2.4 million.
At December 31, 2017 and 2016, current income taxes payable of $2.5 million and $11,000, respectively, was included in other liabilities in the consolidated statements of financial condition.
The Company’s net deferred tax asset account was comprised of the following at December 31 (in thousands):
|
2017 |
2016 |
|||||||
|
Deferred tax assets: |
||||||||
|
Allowance for loan and lease losses |
$ | 4,964 | $ | 8,278 | ||||
|
Discount on purchased loans |
839 | 2,044 | ||||||
|
Real estate owned |
165 | 263 | ||||||
|
Section 382 net operating loss carryforward |
1,135 | 1,976 | ||||||
|
Net operating loss carryforward |
-- | 1,346 | ||||||
|
Nonaccrual loan interest |
969 | 1,471 | ||||||
|
Unrealized loss on securities available for sale |
-- | 891 | ||||||
|
Other |
1,245 | 1,923 | ||||||
|
Total deferred tax assets |
9,317 | 18,192 | ||||||
|
Deferred tax liabilities: |
||||||||
|
Office properties |
(2,046 | ) | (2,964 | ) | ||||
|
Core deposit intangible |
(1,382 | ) | (2,293 | ) | ||||
|
Unrealized gain on securities available for sale |
(77 | ) | -- | |||||
|
Prepaid expenses and other |
(1,201 | ) | (1,316 | ) | ||||
|
Total deferred tax liabilities |
(4,706 | ) | (6,573 | ) | ||||
|
Net deferred tax asset |
$ | 4,611 | $ | 11,619 | ||||
A financial institution may, for federal income tax purposes, carryback net operating losses (“NOL”) to the preceding two taxable years and forward to the succeeding 20 taxable years. At December 31, 2017, the Company had a $5.4 million NOL for federal income tax purposes that will be carried forward, comprised of Internal Revenue Code (“IRC” or the “Code”) Section 382 NOL carryforwards that have an annual limit of $405,000 that can be utilized to offset taxable income. The Company does not have any remaining non-Section 382 federal NOL carryforwards. At December 31, 2017, the Company does not have any remaining unused NOL for Arkansas state income tax purposes.
Specifically exempted from deferred tax recognition requirements are bad debt reserves for tax purposes of U.S. savings and loans in the institution’s base year, as defined under Code Section 593(g)(2)(A)(ii). Base year reserves totaled approximately $4.2 million. Consequently, a deferred tax liability of approximately $1.1 million and $1.6 million related to such reserves was not provided for in the consolidated statements of financial condition at December 31, 2017 and December 31, 2016, respectively. Payment of dividends to stockholders out of retained earnings deemed to have been made out of earnings previously set aside as bad debt reserves may create taxable income to the Bank. No provision has been made for income tax on such a distribution as the Bank does not anticipate making such distributions.
Prior to the quarter ended June 30, 2016, the Company had certain deferred tax assets related to net unrealized built-in losses (“NUBILs”) established under Code Section 382 on May 3, 2011, the date of the Company’s ownership change related to the initial investment by Bear State Financial Holdings, LLC (“BSF Holdings”). If these losses had been realized before May 3, 2016 (five years after the ownership change date), then they would not be allowed to be taken as a deduction and would have been permanently lost. If these losses were to be realized after May 3, 2016, then the future deduction for the losses is no longer limited. As a result of passing the five year anniversary date of the ownership change, during the second quarter of 2016 the Bank reversed the valuation allowance of $0.9 million for the remaining NUBILs.
The Company recognizes interest and penalties related to income tax matters as additional income taxes in the consolidated statements of income. The Company had $66,000 of interest or penalties related to income tax matters during the year ended December 31, 2017 and none in the years ended December 31, 2016 or 2015. The Company files consolidated income tax returns in the U.S. federal jurisdiction and the states of Arkansas and Missouri while the Bank files in the state of Oklahoma. The Company is subject to U.S. federal and state income tax examinations by tax authorities for tax years ended December 31, 2014 and forward.
|
14. |
STOCK BASED COMPENSATION |
2011 Omnibus Incentive Plan— The Company’s 2011 Omnibus Incentive Plan (the “2011 Plan”) was approved by the Company’s stockholders on April 29, 2011 and became effective May 3, 2011. An amendment of the 2011 Plan was approved by the Company’s stockholders on May 25, 2016. The objectives of the 2011 Plan are to optimize the profitability and growth of the Company through incentives that are consistent with the Company’s goals and that align the personal interests of participants with those of the Company’s stockholders. The 2011 Plan provides for a committee of the Company’s Board of Directors to award nonqualified stock options, incentive stock options, stock appreciation rights, restricted stock, restricted stock units, performance shares, performance units, and other awards representing up to 2,144,743 shares of Company stock. Awards may be granted under the 2011 Plan up to ten years following the effective date of the plan. Each award under the 2011 Plan is governed by the terms of the individual award agreement, which specifies pricing, term, vesting, and other pertinent provisions. Shares issued in connection with stock compensation awards are issued from available authorized shares.
Option awards are generally granted with an exercise price equal to the fair market value of the Company’s stock at the date of grant, generally vest based on five years of continuous service and have seven year contractual terms. The fair value of each option award is estimated on the date of grant using the Black-Scholes option valuation model. Expected volatilities are based on implied volatilities from historical volatility of the Company’s stock and other factors. The Company uses historical data to estimate option exercise, employee termination, and expected term of the options within the valuation model. The risk-free rate for periods within the contractual life of the option is based on the U.S. Treasury yield curve in effect at the time of grant.
A summary of the stock option activity in the Company’s 2011 Plan for the year ended December 31, 2017 is presented below. No options have been granted since 2012.
|
Shares Underlying Awards |
Weighted Average Exercise Price |
|||||||
|
Outstanding— January 1, 2017 |
198,563 | $ | 6.73 | |||||
|
Granted |
-- | $ | -- | |||||
|
Exercised |
(93,218 | ) | $ | 6.90 | ||||
|
Forfeited |
-- | $ | -- | |||||
|
Expired |
-- | $ | -- | |||||
|
Outstanding—December 31, 2017 |
105,345 | $ | 6.58 | |||||
|
Exercisable—December 31, 2017 |
105,345 | $ | 6.58 | |||||
The weighted average remaining contractual life of the outstanding and exercisable options was 0.8 years and the aggregate intrinsic value of the options was approximately $387,000 at December 31, 2017.
As of December 31, 2017, there was no unrecognized compensation costs related to nonvested stock options under the 2011 Plan. Compensation expense attributable to option awards totaled approximately $33,000, $108,000 and $148,000 for the years ended December 31, 2017, 2016 and 2015, respectively.
Restricted Stock Units. The fair value of each restricted stock unit (“RSU”) award is determined based on the closing market price of the Company’s stock on the grant date and amortized to compensation expense on a straight-line basis over the vesting period. The vesting periods range from three to five years.
A summary of the restricted stock unit activity in the Company’s 2011 Plan for the year ended December 31, 2017 is presented below:
|
Restricted Stock Units |
Weighted Average Grant Date Fair Value |
|||||||
|
Outstanding— January 1, 2017 |
262,669 | $ | 8.41 | |||||
|
Granted |
47,766 | $ | 10.09 | |||||
|
Vested |
(83,470 | ) | $ | 8.20 | ||||
|
Forfeited |
(6,440 | ) | $ | 8.75 | ||||
|
Outstanding—December 31, 2017 |
220,525 | $ | 8.85 | |||||
As of December 31, 2017, there was $0.8 million of total unrecognized compensation costs related to nonvested RSUs under the 2011 Plan. The cost is expected to be recognized over a weighted-average period of 1.2 years. Compensation expense attributable to awards of RSUs totaled approximately $926,000, $1.1 million and $642,000 for the years ended December 31, 2017, 2016 and 2015, respectively.
Change in Control. Pursuant to the 2011 Plan, all unvested stock options and restricted stock units will vest in full upon the occurrence of a change in control transaction. In accordance with the terms of the Merger Agreement, all equity awards outstanding under the 2011 Plan at the effective time of the Merger, whether or not vested, will be cancelled and automatically converted into the right to receive a cash amount equal to (i) in the case of options, the aggregate number of shares of Company common stock subject to such option multiplied by the difference of $10.28 and the exercise price of such option and (ii) in the case of restricted stock units, $10.28 per unit.
Performance Awards. In January 2017, the Company’s Board of Directors approved the grant of performance-based restricted stock units (“PSUs”) to certain members of executive and operational management under the 2011 Plan for performance year 2017. PSUs are subject to the Company’s achievement of specified performance criteria for the year ended December 31, 2017. The value of the incentive can range from zero to 40% of the grantee’s base pay and will be paid 25% in cash and 75% in RSUs after the Compensation Committee or the Board has determined whether the performance goals have been achieved. The number of RSUs to be granted will be determined based on the dollar value of the award divided by the closing stock price on the date of grant following the performance period. The RSUs will vest 1/3 on the grant date and 1/3 on each of the next two anniversaries of the grant date. RSUs which have been granted pursuant to past performance awards are reflected in the RSU table above. The Company began accruing estimated compensation cost for performance awards as of the date of the Board’s action, which was determined to be the service inception date. Compensation expense recognized on the stock portion of performance awards totaled approximately $152,000 and $25,000 for the years ended December 31, 2017 and 2016, respectively.
|
15. |
EMPLOYEE BENEFIT PLANS |
401(k) Plan — The Company has established a 401(k) Plan whereby substantially all employees may participate in the Plan. Employees may contribute up to 75% of their salary subject to certain limits based on federal tax laws. The Company matches the first 2% of employee contributions. Compensation expense attributable to matching contributions totaled approximately $368,000, $398,000 and $309,000 for the years ended December 31, 2017, 2016 and 2015, respectively.
Other Postretirement Benefits—The Bank participates in the Pentegra Defined Benefit Plan for Financial Institutions ("The Pentegra DB Plan"), a noncontributory tax-qualified defined-benefit pension plan. The Pentegra DB Plan's Employer Identification Number is 13-5645888 and the Plan Number is 333. The Pentegra DB Plan operates as a multiemployer plan for accounting purposes and as a multiple-employer plan under the Employee Retirement Income Security Act of 1974 and the Internal Revenue Code. There are no collective bargaining agreements in place that require contributions to the Pentegra DB Plan. No funding improvement plan or rehabilitation plan has been implemented or is pending and the Bank has not paid a surcharge to the Pentegra DB Plan.
The risks of participating in a multiemployer plan are different from single-employer plans in the following aspects:
|
a. |
Assets contributed to the multiemployer plan by one employer may be used to provide benefits to employees of other participating employers. |
|
b. |
If a participating employer stops contributing to the plan, the unfunded obligations of the plan may be borne by the remaining participating employers. |
The following table presents the funded status (market value of plan assets divided by funding target) as of July 1 for the respective years:
| 2017(1) | 2016(1) | |||||||
|
Plan Funded Status per valuation report |
109.55 | % | 109.34 | % |
|
(1) |
Market value of plan assets reflects any contributions received through June 30, 2017. |
Total contributions made to the Pentegra DB Plan by all participating employers, as reported on Form 5500, equal $153.2 million and $163.1 million for the plan years ending June 30, 2016 and June 30, 2015, respectively. The Bank’s contributions to the Pentegra DB Plan are not more than 5% of the total contributions to the Pentegra DB Plan.
The Pentegra DB Plan provides a retirement benefit and a death benefit. Retirement benefits are payable in monthly installments for life and must begin not later than the first day of the month coincident with or the next month following the seventieth birthday or the participant may elect a lump-sum distribution. Death benefits are paid in a lump-sum distribution, the amount of which depends on years of service. Depending on the Pentegra DB Plan’s funded status, lump-sum distributions may have limitations. The Pentegra DB Plan was frozen effective July 1, 2010, eliminating all future benefit accruals for participants in the Pentegra DB Plan and closing the Pentegra DB Plan to new participants as of that date. The Bank will continue to incur costs consisting of administration and Pension Benefit Guaranty Corporation insurance expenses as well as amortization charges based on the funding level of the Pentegra DB Plan annually. Net pension expense was approximately $162,000, $156,000 and $138,000 for the years ended December 31, 2017, 2016 and 2015, respectively, and contributions to the Pentegra DB Plan totaled $166,000, $162,000 and $148,000 for the years ended December 31, 2017, 2016 and 2015, respectively. If the Bank chooses to withdraw from the Pentegra DB Plan, the Bank may be required to pay a significant withdrawal liability.
|
16. |
EARNINGS PER SHARE |
Basic earnings per share is computed by dividing reported earnings available to common stockholders by the weighted average number of common shares outstanding. Diluted earnings per share is computed by dividing reported earnings available to common stockholders by the weighted average number of common shares outstanding after consideration of the dilutive effect, if any, of the Company’s outstanding common stock options and warrants using the treasury stock method. The following table reflects the calculation of weighted average shares outstanding for the basic and diluted earnings per share calculations for the years ended December 31:
|
2017 |
2016 |
2015 |
||||||||||
|
Basic weighted average shares outstanding |
37,706,312 | 37,629,975 | 34,526,622 | |||||||||
|
Effect of dilutive securities |
211,945 | 202,761 | 169,140 | |||||||||
|
Diluted weighted average shares outstanding |
37,918,257 | 37,832,736 | 34,695,762 | |||||||||
There were no antidilutive securities for the years ended December 31, 2017, 2016 or 2015.
|
17. |
OFF-BALANCE SHEET ARRANGEMENTS AND COMMITMENTS |
In the normal course of business and to meet the needs of its customers, the Bank is a party to financial instruments with off-balance sheet risk. These financial instruments include commitments to extend credit and standby letters of credit. Those instruments could involve, to varying degrees, elements of credit risk in excess of the amount recognized in the Company’s consolidated statements of financial condition.
The Bank does not use financial instruments with off-balance sheet risk as part of its asset/liability management program or for trading purposes. The Bank’s exposure to credit loss in the event of nonperformance by the counterparty to the financial instrument for commitments to extend credit and standby letters of credit is represented by the contractual amounts of those instruments. The Bank uses the same credit policies in making commitments and conditional obligations as it does for on-balance sheet instruments.
Commitments to extend credit are agreements to lend to a customer as long as there is no violation of any condition established in the contract. Commitments generally have fixed expiration dates or other termination clauses. The Bank evaluates each customer’s creditworthiness on a case-by-case basis. The amount of collateral obtained, if deemed necessary by the Bank upon extension of credit, is based on management’s credit evaluation of the counterparty. Standby letters of credit are conditional commitments issued by the Bank to guarantee the performance of a customer to a third party. The credit risk involved in issuing letters of credit is essentially the same as that involved in extending loan facilities to customers.
The funding period for construction loans is generally six to twenty-four months and commitments to originate mortgage loans held for sale are generally outstanding for no more than 60 days.
In the normal course of business, the Bank makes commitments to buy or sell assets or to incur or fund liabilities. Commitments include, but are not limited to:
|
■ |
the origination, purchase or sale of loans; and |
|
■ |
the fulfillment of commitments under letters of credit, extensions of credit on lines of credit, construction loans, and under predetermined overdraft protection limits. |
At December 31, 2017 and 2016, the Bank’s off-balance sheet arrangements principally included lending commitments, which are described below (in thousands).
|
2017 |
2016 |
|||||||
|
Commitments to extend or originate loans |
$ | 40,410 | $ | 80,265 | ||||
|
Rate lock agreements with customers |
6,627 | 14,079 | ||||||
|
Funded mortgage loans committed to sell |
3,815 | 8,954 | ||||||
|
Unadvanced portion of construction loans |
48,459 | 75,365 | ||||||
|
Unused lines of credit |
134,781 | 132,796 | ||||||
|
Standby letters of credit |
3,659 | 2,870 | ||||||
|
Overdraft protection limits |
15,886 | 16,585 | ||||||
Total unfunded commitments to originate loans for sale and the related commitments to sell of $1.0 million meet the definition of a derivative financial instrument. The related asset and liability are considered immaterial at December 31, 2017.
Historically, a very small percentage of predetermined overdraft limits have been used. At December 31, 2017, overdrafts of accounts with Bounce ProtectionTM represented usage of 2.4% of the limit.
At December 31, 2017, the Company had no interests in non-consolidated special purpose entities.
|
18. |
FAIR VALUE MEASUREMENTS |
ASC 820, Fair Value Measurement, provides a framework for measuring fair value and defines fair value as the exchange price that would be received for an asset or paid to transfer a liability (an exit price) in the principal or most advantageous market for the asset or liability in an orderly transaction between market participants on the measurement date. ASC 820 also establishes a fair value hierarchy which requires an entity to maximize the use of observable inputs and minimize the use of unobservable inputs when measuring fair value. ASC 820 describes three levels of inputs that may be used to measure fair value:
|
Level 1 |
Unadjusted, quoted prices in active markets for identical assets or liabilities at the measurement date. |
|
Level 2 |
Observable inputs other than Level 1 prices, such as quoted prices for similar assets or liabilities; quoted prices in markets that are not active; or other inputs that are observable or can be corroborated by observable market data at the measurement date for substantially the full term of the assets or liabilities. |
|
Level 3 |
Unobservable inputs that reflect management’s best estimate of what market participants would use in pricing the asset or liability at the measurement date. |
Financial instruments are broken down by recurring or nonrecurring measurement status. Recurring assets are initially measured at fair value and are required to be remeasured at fair value in the financial statements at each reporting date. Assets measured on a nonrecurring basis are assets that, due to an event or circumstance, were required to be remeasured at fair value after initial recognition in the financial statements at some time during the reporting period.
The following is a description of inputs and valuation methodologies used for assets recorded at fair value on a recurring basis and recognized in the accompanying statements of financial condition at December 31, 2017 and December 31, 2016, as well as the general classification of such assets pursuant to the valuation hierarchy.
Securities Available for Sale
Investment securities available for sale are recorded at fair value on a recurring basis. The fair values used by the Company are obtained from an independent pricing service, which represent either quoted market prices for the identical asset or fair values determined by pricing models, or other model-based valuation techniques, that consider observable market data, such as interest rate volatilities, LIBOR yield curve, credit spreads and prices from market makers and live trading systems. Recurring Level 2 securities include U.S. Treasury securities, U.S. government agency securities, residential mortgage-backed securities, municipal bonds and corporate debt securities. Inputs used for valuing Level 2 securities include observable data that may include dealer quotes, benchmark yields, market spreads, live trading levels and market consensus prepayment speeds, among other things. Additional inputs include indicative values derived from the independent pricing service’s proprietary computerized models. No securities were included in the Recurring Level 3 category at or for the periods ended December 31, 2017 or 2016.
The following table presents major categories of assets measured at fair value on a recurring basis as of December 31, 2017 and 2016 (in thousands):
|
Fair Value |
Quoted Prices in Active Markets for Identical Assets (Level 1) |
Significant Other Observable Inputs (Level 2) |
Significant Unobservable Inputs (Level 3) |
|||||||||||||
|
December 31, 2017 |
||||||||||||||||
|
Available for sale investment securities: |
||||||||||||||||
|
U.S. Treasuries and government agencies |
$ | 2,963 | $ | -- | $ | 2,963 | $ | -- | ||||||||
|
Municipal securities |
92,945 | -- | 92,945 | -- | ||||||||||||
|
Residential mortgage-backed securities |
95,678 | -- | 95,678 | -- | ||||||||||||
|
Corporate debt securities |
5,220 | -- | 5,220 | -- | ||||||||||||
|
Total |
$ | 196,806 | $ | -- | $ | 196,806 | $ | -- | ||||||||
|
December 31, 2016 |
||||||||||||||||
|
Available for sale investment securities: |
||||||||||||||||
|
U.S. Treasuries and government agencies |
$ | 5,631 | $ | -- | $ | 5,631 | $ | -- | ||||||||
|
Municipal securities |
87,050 | -- | 87,050 | -- | ||||||||||||
|
Residential mortgage-backed securities |
95,795 | -- | 95,795 | -- | ||||||||||||
|
Total |
$ | 188,476 | $ | -- | $ | 188,476 | $ | -- | ||||||||
The following is a description of valuation methodologies used for significant assets measured at fair value on a nonrecurring basis.
Impaired Loans Receivable
Loans which meet certain criteria are evaluated individually for impairment. A loan is considered impaired when, based upon current information and events, it is probable the Bank will be unable to collect all amounts due, including principal and interest, according to the contractual terms of the loan agreement. The majority of the Bank’s impaired loans at December 31, 2017 and 2016 are secured by real estate. Impaired loans are individually measured for impairment by comparing the carrying value of the loan to the discounted cash flows or the fair value of the collateral, less estimated selling costs, as appropriate. Fair value is estimated through current appraisals, real estate brokers’ opinions or listing prices. Fair values may be adjusted by management to reflect current economic and market conditions and, as such, are classified as Level 3. During the reported periods, selling costs were estimated at 8%. Fair value adjustments are made by partial charge-offs or adjustments to the ALLL.
Real Estate Owned, net
Real Estate Owned (“REO”) represents real estate acquired as a result of foreclosure or by deed in lieu of foreclosure and is carried at the lower of cost or fair value less estimated selling costs. Fair value is estimated through current appraisals, real estate brokers’ opinions or listing prices. As these properties are actively marketed, estimated fair values may be adjusted by management to reflect current economic and market conditions and, as such, are classified as Level 3. During the reported periods, collateral discounts ranged from 0% to 25% and selling costs were typically estimated at 8%. Fair value adjustments are recorded in earnings during the period such adjustments are made. REO loss provisions recorded during the years ended December 31, 2017, 2016 and 2015 were $137,000, $311,000 and $47,000, respectively.
The following table presents major categories of assets measured at fair value on a nonrecurring basis for the years ended December 31, 2017 and 2016 (in thousands). The assets disclosed in the following table represent REO properties or collateral-dependent impaired loans that were remeasured at fair value during the year with a resulting valuation adjustment or fair value write-down.
|
Fair Value |
Quoted Prices in Active Markets for Identical Assets (Level 1) |
Significant Other Observable Inputs (Level 2) |
Significant Unobservable Inputs (Level 3) |
|||||||||||||
|
December 31, 2017 |
||||||||||||||||
|
Impaired loans |
$ | 3,388 | $ | -- | $ | -- | $ | 3,388 | ||||||||
|
REO, net |
694 | -- | -- | 694 | ||||||||||||
|
December 31, 2016 |
||||||||||||||||
|
Impaired loans |
$ | 7,105 | $ | -- | $ | -- | $ | 7,105 | ||||||||
|
REO, net |
963 | -- | -- | 963 | ||||||||||||
|
19. |
FAIR VALUE OF FINANCIAL INSTRUMENTS |
The estimated fair value of financial instruments has been determined by the Company using available market information and appropriate valuation methodologies. However, considerable judgment is required to interpret market data to develop the estimates of fair value. Accordingly, the estimates presented herein are not necessarily indicative of the amounts the Company could realize in a current market exchange. The use of different market assumptions and/or estimation methodologies may have a material effect on the estimated fair value amounts.
The estimated fair values of financial instruments that are reported at amortized cost in the Company’s statement of financial condition, segregated by the level of valuation inputs within the fair value hierarchy used to measure fair value, are as follows (in thousands):
|
December 31, 2017 |
December 31, 2016 |
|||||||||||||||
|
Estimated |
Estimated |
|||||||||||||||
|
Carrying |
Fair |
Carrying |
Fair |
|||||||||||||
|
Value |
Value |
Value |
Value |
|||||||||||||
|
FINANCIAL ASSETS: |
||||||||||||||||
|
Level 1 inputs: |
||||||||||||||||
|
Cash and cash equivalents |
$ | 53,568 | $ | 53,568 | $ | 78,789 | $ | 78,789 | ||||||||
|
Level 2 inputs: |
||||||||||||||||
|
Held to maturity securities |
42,775 | 42,849 | 26,977 | 25,090 | ||||||||||||
|
Interest-bearing time deposits in banks |
4,075 | 4,057 | 4,571 | 4,572 | ||||||||||||
|
Other investment securities |
27,077 | 27,077 | 13,759 | 13,759 | ||||||||||||
|
Loans held for sale |
3,815 | 3,815 | 8,954 | 8,954 | ||||||||||||
|
Cash surrender value of life insurance |
58,200 | 58,200 | 57,267 | 57,267 | ||||||||||||
|
Accrued interest receivable |
7,677 | 7,677 | 7,006 | 7,006 | ||||||||||||
|
Level 3 inputs: |
||||||||||||||||
|
Loans receivable—net |
1,654,245 | 1,650,550 | 1,540,805 | 1,551,099 | ||||||||||||
|
FINANCIAL LIABILITIES: |
||||||||||||||||
|
Level 1 inputs: |
||||||||||||||||
|
Securities sold under agreements to repurchase |
13,445 | 13,445 | 19,114 | 19,114 | ||||||||||||
|
Level 2 inputs: |
||||||||||||||||
|
Checking, money market and savings accounts |
1,065,105 | 1,065,105 | 1,095,178 | 1,095,178 | ||||||||||||
|
Accrued interest payable |
450 | 450 | 314 | 314 | ||||||||||||
|
Level 3 inputs: |
||||||||||||||||
|
Other borrowings |
386,811 | 386,475 | 152,004 | 151,605 | ||||||||||||
|
Certificates of deposit |
434,339 | 431,556 | 548,902 | 548,520 | ||||||||||||
For cash and cash equivalents, the carrying amount approximates fair value (level 1). For investments held to maturity, the fair values are obtained from an independent pricing service, which represent either quoted market prices for the identical asset or fair values determined by pricing models, or other model-based valuation techniques, that consider observable market data, such as interest rate volatilities, LIBOR yield curve, credit spreads and prices from market makers and live trading systems. For other investment securities, loans held for sale, cash surrender value of life insurance and accrued interest receivable, the carrying value is a reasonable estimate of fair value, primarily because of the short-term nature of the instruments or, as to other investment securities, the ability to sell the stock back to the issuer at cost (level 2). Interest bearing time deposits in banks were valued using discounted cash flows based on current rates for similar types of deposits (level 2). Fair values of impaired loans are estimated as described in Note 14. Non-impaired loans were valued using estimated future cash flows discounted at market rates for loans with comparable terms and remaining maturities (level 3).
For securities sold under agreements to repurchase, the carrying amount approximates fair value (level 1). The fair value of checking accounts, savings accounts and money market deposits is the amount payable on demand at the reporting date (level 2). Certificates of deposit originated by the institution are valued using a replacement cost of funds approach. A cash flow is generated to represent the functional cost of maintaining such accounts and this ‘cash flow’ is then discounted to an 11 district FHLB average curve, in conjunction with the other cash flows associated with each account. Brokered time deposits not originated by the institution are also valued using a replacement cost of funds approach and the cash flows are discounted to the brokered CD curve (level 3). Borrowings are valued using a replacement cost of funds approach and are discounted to an 11 district FHLB average curve (level 3). For accrued interest payable, the carrying value is a reasonable estimate of fair value, primarily because of the short-term nature of the instruments (level 2).
The fair value estimates presented herein are based on pertinent information available to management as of December 31, 2017 and 2016. Although management is not aware of any factors that would significantly affect the estimated fair value amounts, such amounts have not been comprehensively revalued for purposes of these financial statements since the reporting date and, therefore, current estimates of fair value may differ significantly from the amounts presented herein.
|
20. |
CONTINGENCIES |
The Company is a defendant in certain claims and legal actions arising in the ordinary course of business. In the opinion of management, after consultation with legal counsel, the ultimate disposition of these matters is not expected to have a material adverse effect on the consolidated financial statements of the Company.
However, a shareholder lawsuit has been filed against the Company’s directors, to whom the Company owes indemnification and expense advancement obligations, in connection with the proposed Merger with Arvest. Owens and Hurliman v. Massey, et al., Case No. 60CV-17-5022, is a putative class action that was first filed on September 11, 2017 in the Circuit Court of Pulaski County, Arkansas. An amended complaint was filed on October 13, 2017, and the action was removed to the United States District Court for the Eastern District of Arkansas on November 1, 2017. The amended complaint names the individual members of the Company’s board of directors, as well as BSF Holdings, as defendants, and generally alleges, among other things, that members of the Company’s board of directors breached their fiduciary duties to the Company’s shareholders by agreeing to sell the Company for an inadequate price and agreeing to inappropriate deal protection provisions in the Merger Agreement that may preclude the Company from soliciting any potential acquirers and limit the ability of the Company’s board of directors to engage in discussions or negotiations for superior acquisition proposals. The amended complaint also alleges that the director defendants caused the Company to disseminate a proxy statement that is materially incomplete and misleading, and that Richard Massey and BSF Holdings, in their capacities as shareholders of the Company, breached fiduciary duties owed by them to the minority shareholders of the Company. The amended complaint seeks certification by the court as a shareholders’ class action, approval of the plaintiffs as proper plaintiff class representatives, injunctive relief enjoining the defendants from consummating the Merger unless and until the Company (a) adopts and implements a procedure or process to obtain a merger agreement providing the best possible terms for shareholders and (b) supplements its proxy disclosure (or, in the event the Merger is consummated, rescinding the Merger or awarding rescissory damages). The complaint also seeks to recover costs and disbursement from the defendants, including attorneys’ fees and experts’ fees.
The Company and its directors believe these allegations are without merit and intend to defend vigorously against these allegations. At this time, the Company is unable to state whether the likelihood of an unfavorable outcome of the lawsuit is probable or remote. The Company is also unable to provide an estimate of the range or amount of potential loss if the outcome should be unfavorable.
A second shareholder action, Reichert v. Bear State Financial, Inc., et al., Case No. 4:17-cv-654, was filed on October 11, 2017 in the United States District Court for the Eastern District of Arkansas. A third shareholder action, Parshall v. Bear State Financial, Inc., et al, Case No. 4:17-cv-669, is a putative class action filed on October 13, 2017 in the United States District Court for the Eastern District of Arkansas. The Reichert complaint named the Company and the individual members of the Company’s board of directors as defendants. The Parshall complaint named the Company, the Bank, the individual members of the Company’s board of directors and Arvest and Acquisition Sub as defendants. The Reichert and Parshall complaints generally alleged, among other things, that defendants violated Sections 14(a) and 20(a) of the Exchange Act by disseminating materially deficient and misleading disclosures in the proxy statement dated October 5, 2017 relating to the proposed Merger. The Reichert and Parshall complaints sought injunctive relief to enjoin the defendants from consummating the Merger unless and until the Company discloses the material information identified in the complaints. The complaints also sought to recover rescissory damages against the defendants and costs associated with bringing the actions, including attorneys’ fees and experts’ fees. The Company filed supplemental proxy materials prior to the November 15, 2017 special meeting of Company shareholders that mooted the claims of both plaintiffs. The Company then petitioned to have both cases dismissed on mootness grounds. Prior to a ruling on the Company’s motions, the plaintiffs voluntarily filed dismissal actions with the court on November 28, 2017. In Reichert, an order was entered on December 5, 2017 that dismissed the case without prejudice. In Parshall, an order was entered on January 4, 2018 that dismissed the case without prejudice.
|
21. |
REGULATORY MATTERS |
The Company and the Bank are subject to various regulatory capital requirements administered by federal and state banking regulators. The Bank is a state chartered bank jointly supervised by the Arkansas State Bank Department (“ASBD”) and the Board of Governors of the Federal Reserve System (“FRB”). The FRB is the primary regulator for the Company. Failure to meet minimum regulatory capital requirements can result in certain mandatory—and possible additional discretionary—actions by regulators that, if undertaken, could have a direct and material effect on the Company’s or the Bank’s financial statements. Under capital adequacy guidelines and the regulatory framework for prompt corrective action, the Company and the Bank must meet specific capital guidelines that involve quantitative measures of the Company’s and the Bank’s assets, liabilities, and certain off-balance sheet items as calculated under regulatory accounting practices. The Company’s and the Bank’s capital amounts and classification are also subject to qualitative judgments by the regulators about components, risk weightings, and other factors.
Quantitative measures established by regulation to ensure capital adequacy require the Company and the Bank to maintain minimum amounts and ratios (set forth in the following table) of tier 1 capital (as defined by regulation) to average assets (as defined by regulation) and common equity tier 1 capital, tier 1 capital and total capital (as defined by regulation) to risk-weighted assets (as defined by regulation). Management believes that the Company and the Bank meet all capital adequacy requirements to which they are subject.
As of the most recent notification from regulatory authorities, the Bank was categorized as well capitalized under the regulatory framework for prompt corrective action. To be categorized as well capitalized, the Bank must maintain minimum ratios as set forth in the table below. There are no conditions or events since that notification that management believes have changed any of the Bank’s categorizations.
The actual and required capital amounts (in thousands) and ratios of the Company (Consolidated) and the Bank as of December 31, 2017 and 2016 are presented in the following tables:
|
To be Categorized |
||||||||||||||||||||||||
|
as Well |
||||||||||||||||||||||||
|
Capitalized Under |
||||||||||||||||||||||||
|
For Capital |
Prompt Corrective |
|||||||||||||||||||||||
|
Actual |
Adequacy Purposes* |
Action Provisions |
||||||||||||||||||||||
|
December 31, 2017 |
Amount |
Ratio |
Amount |
Ratio |
Amount |
Ratio |
||||||||||||||||||
|
Tier 1 Capital to Adjusted Average Assets |
||||||||||||||||||||||||
|
Consolidated |
$ | 205,643 | 9.41 | % | $ | 87,459 | 4.00 | % | N/A | N/A | ||||||||||||||
|
Bear State Bank |
215,259 | 9.85 | % | 87,418 | 4.00 | % | $ | 109,272 | 5.00 | % | ||||||||||||||
|
Common Equity Tier 1 to Risk-Weighted Assets |
||||||||||||||||||||||||
|
Consolidated |
$ | 205,643 | 11.34 | % | $ | 81,574 | 4.50 | % | N/A | N/A | ||||||||||||||
|
Bear State Bank |
215,259 | 11.88 | % | 81,524 | 4.50 | % | $ | 117,756 | 6.50 | % | ||||||||||||||
|
Tier I Capital to Risk-Weighted Assets |
||||||||||||||||||||||||
|
Consolidated |
$ | 205,643 | 11.34 | % | $ | 108,766 | 6.00 | % | N/A | N/A | ||||||||||||||
|
Bear State Bank |
215,259 | 11.88 | % | 108,698 | 6.00 | % | $ | 144,931 | 8.00 | % | ||||||||||||||
|
Total Capital to Risk-Weighted Assets |
||||||||||||||||||||||||
|
Consolidated |
$ | 224,635 | 12.39 | % | $ | 145,021 | 8.00 | % | N/A | N/A | ||||||||||||||
|
Bear State Bank |
234,251 | 12.93 | % | 144,931 | 8.00 | % | $ | 181,163 | 10.00 | % | ||||||||||||||
|
December 31, 2016 |
||||||||||||||||||||||||
|
Tier 1 Capital to Adjusted Average Assets |
||||||||||||||||||||||||
|
Consolidated |
$ | 186,604 | 9.47 | % | $ | 78,840 | 4.00 | % | N/A | N/A | ||||||||||||||
|
Bear State Bank |
204,319 | 10.38 | % | 78,710 | 4.00 | % | $ | 98,388 | 5.00 | % | ||||||||||||||
|
Common Equity Tier 1 to Risk-Weighted Assets |
||||||||||||||||||||||||
|
Consolidated |
$ | 186,604 | 11.04 | % | $ | 76,084 | 4.50 | % | N/A | N/A | ||||||||||||||
|
Bear State Bank |
204,319 | 12.10 | % | 76,017 | 4.50 | % | $ | 109,802 | 6.50 | % | ||||||||||||||
|
Tier I Capital to Risk-Weighted Assets |
||||||||||||||||||||||||
|
Consolidated |
$ | 186,604 | 11.04 | % | $ | 101,445 | 6.00 | % | N/A | N/A | ||||||||||||||
|
Bear State Bank |
204,319 | 12.10 | % | 101,355 | 6.00 | % | $ | 135,141 | 8.00 | % | ||||||||||||||
|
Total Capital to Risk-Weighted Assets |
||||||||||||||||||||||||
|
Consolidated |
$ | 202,188 | 11.96 | % | $ | 135,261 | 8.00 | % | N/A | N/A | ||||||||||||||
|
Bear State Bank |
219,903 | 13.02 | % | 135,141 | 8.00 | % | $ | 168,926 | 10.00 | % | ||||||||||||||
|
* |
Beginning in 2016, a Capital Conservation Buffer (“CCB”) requirement became effective for banking organizations. The Basel III Rules limit capital distributions and certain discretionary bonus payments if the banking organization does not hold a “capital conservation buffer” consisting of 2.5% of common equity tier 1 capital, tier 1 capital and total capital to risk-weighted assets in addition to the amount necessary to meet minimum risk-based capital requirements. The capital conservation buffer began to be phased in on January 1, 2016, at 0.625% of risk-weighted assets, and will continue to be increased each year by that amount until fully implemented at 2.5% on January 1, 2019. When fully phased in on January 1, 2019, the Basel III Rules will require the Company and Bank to maintain (i) a minimum ratio of common equity tier 1 capital to risk-weighted assets of at least 4.5%, plus a 2.5% capital conservation buffer, which effectively results in a minimum ratio of 7.0% upon full implementation, (ii) a minimum ratio of tier 1 capital to risk-weighted assets of at least 6.0%, plus a 2.5% capital conservation buffer, which effectively results in a minimum ratio of 8.50% upon full implementation, (iii) a minimum ratio of total capital to risk-weighted assets of at least 8.0%, plus a 2.5% capital conservation buffer, which effectively results in a minimum ratio of 10.5% upon full implementation and (iv) a minimum leverage ratio of at least 4.0%. |
Dividends. The Company may not declare or pay cash dividends on its shares of common stock if the effect thereof would cause its stockholders’ equity to be reduced below applicable regulatory capital maintenance requirements for insured institutions. In addition, the Bank is subject to limitations on dividends that can be paid to the parent company without prior approval of the applicable regulatory agencies. ASBD regulations specify that the maximum dividend state banks may pay to the parent company in any calendar year without prior approval is 75% of the current year earnings plus 75% of the retained net earnings of the preceding year. Since the Bank is also under supervision of the FRB, the maximum dividend that may be paid without prior approval by the FRB is the Bank’s net profits to date for that year combined with its retained net profits for the preceding two years. At December 31, 2017, the Bank had approximately $18.6 million available for payment of dividends to the Company without prior regulatory approval from the ASBD and approximately $24.5 million available for payment of dividends to the Company without prior regulatory approval from the FRB.
The principal source of the Company’s revenues is dividends from the Bank. Our ability to pay dividends to our stockholders depends to a large extent upon the dividends we receive from the Bank.
Repurchase Program. During the year ended December 31, 2017, the Company did not repurchase any shares of its common stock. The Company’s share repurchase program was initially approved by the Board of Directors on March 13, 2015 and amended on April 20, 2016, whereby the Company is authorized to repurchase up to $2 million of its common stock (the “Repurchase Program”). As of December 31, 2017, the Company had $2 million remaining under the Repurchase Program.
|
22. |
RELATED PARTY TRANSACTIONS |
In the normal course of business, the Bank has made loans to its directors and officers, including their immediate families, and their related business interests. In accordance with the Bank’s policies, related party loans are made on substantially the same terms, including interest rates and collateral, as those prevailing at the time for comparable transactions with unrelated persons and do not involve more than the normal risk of collectability. The aggregate dollar amount of loans outstanding to directors and officers, their immediate families, and their related business interests was approximately $8.2 million and $6.8 million for the years ended December 31, 2017 and 2016, respectively, and unused lines of credit available to such persons totaled $220,000 and $241,000 at December 31, 2017 and 2016, respectively. Deposits from related parties held by the Bank at December 31, 2017 and 2016 amounted to $6.7 million and $16.9 million, respectively.
For the years ended December 31, 2017 and 2016, the Company paid $21,000 and $160,000, respectively, to related parties under the terms of an aircraft time-sharing agreement and service agreements.
In 2014, the Company and its Chairman entered into an aircraft purchase agreement whereby the Company acquired a 75% undivided interest and Mr. Massey acquired a 25% undivided interest in an airplane acquired at a cost of $775,000. The Company and Mr. Massey also entered into an agreement pursuant to which the parties agreed to apportion the fixed costs of the aircraft on a pro rata basis with each party agreeing to pay its own variable costs associated with the use of the aircraft. Variable costs attributable to Mr. Massey's use of the aircraft in connection with Company business, and not in connection with his personal use of the aircraft, were paid by the Company. The aircraft was sold in February 2017 for $575,000 resulting in a loss to the Company of $28,000.
|
23. |
SUBSEQUENT EVENTS |
On January 17, 2018, the Company announced that its Board of Directors authorized a $0.03 per share cash dividend to shareholders of record at the close of business on February 1, 2018 payable on February 15, 2018.
|
24. |
PARENT COMPANY ONLY FINANCIAL INFORMATION |
The following condensed statements of financial condition, as of December 31, 2017 and 2016, and condensed statements of income and comprehensive income and of cash flows for each of the three years in the period ended December 31, 2017, for Bear State Financial, Inc. should be read in conjunction with the consolidated financial statements and the notes herein.
|
BEAR STATE FINANCIAL, INC. |
|
(Parent Company Only) |
|
CONDENSED STATEMENTS OF FINANCIAL CONDITION |
|
DECEMBER 31, 2017 AND 2016 |
|
(In thousands) |
|
ASSETS |
2017 |
2016 |
||||||
|
Cash and cash equivalents (deposits in subsidiary Bank) |
$ | 1,976 | $ | 175 | ||||
|
Office properties and equipment, net |
91 | 581 | ||||||
|
Deferred tax asset, net |
770 | 1,552 | ||||||
|
Investment in Bank |
262,752 | 250,211 | ||||||
|
Due from Bank |
2,906 | 3,169 | ||||||
|
Other assets |
285 | 289 | ||||||
|
TOTAL |
$ | 268,780 | $ | 255,977 | ||||
|
LIABILITIES AND STOCKHOLDERS’ EQUITY |
||||||||
|
Other borrowings |
$ | 12,150 | $ | 22,012 | ||||
|
Accrued expenses and other liabilities |
3,473 | 538 | ||||||
|
Stockholders’ equity |
253,157 | 233,427 | ||||||
|
TOTAL |
$ | 268,780 | $ | 255,977 | ||||
|
BEAR STATE FINANCIAL, INC. |
|
(Parent Company Only) |
|
CONDENSED STATEMENTS OF INCOME AND COMPREHENSIVE INCOME |
|
YEARS ENDED DECEMBER 31, 2017, 2016 AND 2015 |
|
(In thousands) |
|
2017 |
2016 |
2015 |
||||||||||
|
INCOME: |
||||||||||||
|
Dividend from the Bank |
$ | 14,000 | $ | 5,000 | $ | 12,100 | ||||||
|
Other income |
1 | 73 | -- | |||||||||
|
Management fees |
2,117 | 2,965 | 3,451 | |||||||||
|
Total income |
16,118 | 8,038 | 15,551 | |||||||||
|
EXPENSES: |
||||||||||||
|
Interest expense |
460 | 649 | 407 | |||||||||
|
Salaries and employee benefits |
3,354 | 3,320 | 2,383 | |||||||||
|
Net occupancy expense |
211 | 226 | 198 | |||||||||
|
Data processing |
1 | 9 | 1,291 | |||||||||
|
Professional fees |
614 | 785 | 627 | |||||||||
|
Advertising |
74 | 47 | 359 | |||||||||
|
Other operating expenses |
2,194 | 941 | 1,585 | |||||||||
|
Total expenses |
6,908 | 5,977 | 6,850 | |||||||||
|
INCOME BEFORE INCOME TAXES AND EQUITY IN UNDISTRIBUTED INCOME OF BANK SUBSIDIARY |
9,210 | 2,061 | 8,701 | |||||||||
|
INCOME TAX BENEFIT |
(1,573 | ) | (1,133 | ) | (1,174 | ) | ||||||
|
INCOME BEFORE EQUITY IN UNDISTRIBUTED INCOME OF BANK SUBSIDIARY |
10,783 | 3,194 | 9,875 | |||||||||
|
EQUITY IN UNDISTRIBUTED INCOME OF BANK SUBSIDIARY |
10,528 | 14,265 | 699 | |||||||||
|
NET INCOME |
$ | 21,311 | $ | 17,459 | $ | 10,574 | ||||||
|
OTHER COMPREHENSIVE INCOME (LOSS) |
||||||||||||
|
Unrealized holding gains (losses) arising during the period |
2,671 | (2,933 | ) | (290 | ) | |||||||
|
Less: reclassification adjustments for realized gain included in net income |
(48 | ) | (19 | ) | (20 | ) | ||||||
|
Other comprehensive income (loss), before tax effect |
2,623 | (2,952 | ) | (310 | ) | |||||||
|
Tax effect |
(1,007 | ) | 1,130 | 119 | ||||||||
|
Other comprehensive income (loss) |
1,616 | (1,822 | ) | (191 | ) | |||||||
|
COMPREHENSIVE INCOME |
$ | 22,927 | $ | 15,637 | $ | 10,383 | ||||||
|
BEAR STATE FINANCIAL, INC. |
|
(Parent Company Only) |
|
CONDENSED STATEMENTS OF CASH FLOWS |
|
YEARS ENDED DECEMBER 31, 2017, 2016 AND 2015 |
|
(In thousands) |
|
2017 |
2016 |
2015 |
||||||||||
|
OPERATING ACTIVITIES: |
||||||||||||
|
Net income |
$ | 21,311 | $ | 17,459 | $ | 10,574 | ||||||
|
Adjustments to reconcile net income to net cash provided by operating activities: |
||||||||||||
|
Equity in undistributed net income of Bank |
(10,528 | ) | (14,265 | ) | (699 | ) | ||||||
|
Deferred tax provision (benefit) |
782 | (164 | ) | (1,174 | ) | |||||||
|
Depreciation |
31 | 95 | 118 | |||||||||
|
Loss on sales of fixed assets, net |
28 | -- | -- | |||||||||
|
Stock compensation expense |
562 | 639 | 539 | |||||||||
|
Changes in operating assets and liabilities: |
||||||||||||
|
Other assets |
267 | (543 | ) | 247 | ||||||||
|
Accrued expenses and other liabilities |
2,935 | 45 | 87 | |||||||||
|
Net cash provided by operating activities |
15,388 | 3,266 | 9,692 | |||||||||
|
INVESTING ACTIVITIES: |
||||||||||||
|
Purchases of office properties and equipment |
-- | (8 | ) | (48 | ) | |||||||
|
Proceeds from sales of office properties and equipment |
431 | -- | -- | |||||||||
|
Merger consideration paid |
-- | -- | (10,100 | ) | ||||||||
|
Net cash provided by (used in) investing activities |
431 | (8 | ) | (10,148 | ) | |||||||
|
FINANCING ACTIVITIES: |
||||||||||||
|
Proceeds from other borrowings |
2,400 | 4,800 | 1,850 | |||||||||
|
Repayments of other borrowings |
(12,262 | ) | (1,650 | ) | (1,151 | ) | ||||||
|
Proceeds from exercise of stock options |
643 | 141 | 37 | |||||||||
|
Repurchase of common stock |
-- | (3,672 | ) | (256 | ) | |||||||
|
Shares withheld for payment of employee payroll taxes |
(275 | ) | -- | -- | ||||||||
|
Dividends distributed |
(4,524 | ) | (2,820 | ) | -- | |||||||
|
Net cash provided by (used in) financing activities |
(14,018 | ) | (3,201 | ) | 480 | |||||||
|
NET INCREASE IN CASH AND CASH EQUIVALENTS |
1,801 | 57 | 24 | |||||||||
|
CASH AND CASH EQUIVALENTS: |
||||||||||||
|
Beginning of period |
175 | 118 | 94 | |||||||||
|
End of period |
$ | 1,976 | $ | 175 | $ | 118 | ||||||
******
BEAR STATE FINANCIAL, INC.
SELECTED QUARTERLY OPERATING RESULTS (UNAUDITED)
(IN THOUSANDS, EXCEPT SHARE AND PER SHARE DATA)
|
YEAR ENDED DECEMBER 31, 2017 |
Fourth Quarter |
Third Quarter |
Second Quarter |
First Quarter |
||||||||||||
|
Interest income |
$ | 21,972 | $ | 22,094 | $ | 21,153 | $ | 21,048 | ||||||||
|
Interest expense |
3,079 | 2,958 | 2,496 | 2,214 | ||||||||||||
|
Net interest income |
18,893 | 19,136 | 18,657 | 18,834 | ||||||||||||
|
Provision for loan losses |
464 | 1,863 | 821 | 1,349 | ||||||||||||
|
Net interest income after provision for loan losses |
18,429 | 17,273 | 17,836 | 17,485 | ||||||||||||
|
Net gain on sales and calls of investment securities |
-- | -- | 37 | 11 | ||||||||||||
|
Noninterest income |
4,678 | 4,191 | 4,657 | 4,165 | ||||||||||||
|
Noninterest expense |
12,958 | 14,260 | 12,795 | 14,444 | ||||||||||||
|
Income before income taxes |
10,149 | 7,204 | 9,735 | 7,217 | ||||||||||||
|
Income tax provision |
5,544 | 2,072 | 3,078 | 2,300 | ||||||||||||
|
Net income |
$ | 4,605 | $ | 5,132 | $ | 6,657 | $ | 4,917 | ||||||||
|
Earnings per share: |
||||||||||||||||
|
Basic |
$ | 0.12 | $ | 0.14 | $ | 0.18 | $ | 0.13 | ||||||||
|
Diluted |
$ | 0.12 | $ | 0.14 | $ | 0.18 | $ | 0.13 | ||||||||
|
Selected Ratios (Annualized): |
||||||||||||||||
|
Net interest margin |
3.67 | % | 3.70 | % | 3.76 | % | 4.05 | % | ||||||||
|
Return on average assets |
0.82 | 0.91 | 1.22 | 0.95 | ||||||||||||
|
Return on average equity |
7.23 | 8.19 | 11.02 | 8.44 | ||||||||||||
|
YEAR ENDED DECEMBER 31, 2016 |
Fourth Quarter |
Third Quarter |
Second Quarter |
First Quarter |
||||||||||||
|
Interest income |
$ | 19,212 | $ | 18,849 | $ | 18,535 | $ | 18,790 | ||||||||
|
Interest expense |
2,105 | 2,014 | 1,935 | 1,864 | ||||||||||||
|
Net interest income |
17,107 | 16,835 | 16,600 | 16,926 | ||||||||||||
|
Provision for loan losses |
851 | 643 | 533 | 489 | ||||||||||||
|
Net interest income after provision for loan losses |
16,256 | 16,192 | 16,067 | 16,437 | ||||||||||||
|
Net gain on sales and calls of investment securities |
-- | 21 | -- | (2 | ) | |||||||||||
|
Noninterest income |
4,394 | 4,312 | 4,311 | 3,675 | ||||||||||||
|
Noninterest expense |
13,625 | 13,400 | 14,989 | 15,331 | ||||||||||||
|
Income before income taxes |
7,025 | 7,125 | 5,389 | 4,779 | ||||||||||||
|
Income tax provision |
2,192 | 2,384 | 847 | 1,436 | ||||||||||||
|
Net income |
$ | 4,833 | $ | 4,741 | $ | 4,542 | $ | 3,343 | ||||||||
|
Earnings per share(1): |
||||||||||||||||
|
Basic |
$ | 0.13 | $ | 0.13 | $ | 0.12 | $ | 0.09 | ||||||||
|
Diluted |
$ | 0.13 | $ | 0.13 | $ | 0.12 | $ | 0.09 | ||||||||
|
Selected Ratios (Annualized): |
||||||||||||||||
|
Net interest margin |
3.75 | % | 3.78 | % | 3.86 | % | 4.03 | % | ||||||||
|
Return on average assets |
0.95 | 0.95 | 0.94 | 0.71 | ||||||||||||
|
Return on average equity |
8.18 | 8.12 | 8.04 | 6.04 | ||||||||||||
|
Fourth Quarter |
Third Quarter |
Second Quarter |
First Quarter |
|||||||||||||
|
YEAR ENDED DECEMBER 31, 2017 |
||||||||||||||||
|
Basic weighted - average shares |
37,745,784 | 37,718,303 | 37,691,358 | 37,668,822 | ||||||||||||
|
Effect of dilutive securities |
236,977 | 202,713 | 191,906 | 211,200 | ||||||||||||
|
Diluted weighted - average shares |
37,982,761 | 37,921,016 | 37,883,264 | 37,880,022 | ||||||||||||
|
YEAR ENDED DECEMBER 31, 2016 |
||||||||||||||||
|
Basic weighted - average shares |
37,615,991 | 37,595,454 | 37,568,274 | 37,740,714 | ||||||||||||
|
Effect of dilutive securities |
217,133 | 211,965 | 204,685 | 174,789 | ||||||||||||
|
Diluted weighted - average shares |
37,833,124 | 37,807,419 | 37,772,959 | 37,915,503 | ||||||||||||
Item 9. Changes in and Disagreements with Accountants on Accounting and Financial Disclosure.
Not applicable.
Item 9A. Controls and Procedures.
Our management evaluated, with the participation of our Principal Executive Officer and Principal Financial Officer, the effectiveness of our disclosure controls and procedures (as defined in Rules 13a-15(e) and 15d-15(e) under the Securities Exchange Act of 1934 (the “Exchange Act”)) as of the end of the period covered by this report. Based on such evaluation, our Principal Executive Officer and Principal Financial Officer have concluded that our disclosure controls and procedures are operating effectively.
The Company’s management, including the Company’s Principal Executive Officer and the Principal Financial Officer, regularly review our controls and procedures and make changes intended to ensure the quality of our financial reporting. No change in the Company’s internal control over financial reporting (as defined in Rules 13a-15(f) and 15d-15(f) under the Exchange Act) occurred during the fiscal quarter ended December 31, 2017 that has materially affected, or is reasonably likely to materially affect, the Company’s internal control over financial reporting.
Not Applicable.
Item 10. Directors, Executive Officers and Corporate Governance.
The number of directors that serve on the Board is currently set at twelve and may be fixed from time to time by the Board in the manner provided in the Company’s Bylaws. In accordance with the Company’s Bylaws, directors are elected for a term of one year or until their successors are duly elected and qualified or until their earlier removal, resignation or death. Each of the below directors was elected to the Board at the 2017 annual meeting of shareholders. There are no arrangements or understandings between the Company and any person pursuant to which such person was elected a director.
Directors of the Company and the Bank were as follows as of December 31, 2017:
|
Name |
|
Age |
|
Positions Held with the Company |
|
Director of the |
||
|
W. Dabbs Cavin |
|
|
53 |
|
Director, Vice Chairman of the Board |
|
|
2011 |
|
William Changose |
57 |
Director |
2017 |
|||||
|
K. Aaron Clark |
|
36 |
|
Director |
|
|
2011 |
|
|
Frank Conner |
|
|
68 |
|
Director |
|
|
2003 |
|
Scott T. Ford |
|
55 |
|
Director |
|
|
2011 |
|
|
G. Brock Gearhart |
|
|
35 |
|
Director |
|
|
2012 |
|
John J. Ghirardelli |
|
60 |
|
Director |
|
|
2015 |
|
|
O. Fitzgerald Hill |
|
53 |
|
Director |
|
|
2011 |
|
|
Daniel C. Horton |
|
|
76 |
|
Director |
|
|
2014 |
|
J. Matthew Machen |
36 |
Director, President and Chief Executive Officer |
2017 |
|||||
|
Richard N. Massey |
|
|
61 |
|
Director, Chairman of the Board |
|
|
2011 |
|
Ian R. Vaughan |
|
|
41 |
|
Director |
|
|
2014 |
Set forth below is biographical information for each director. The following descriptions also outline the specific experience, qualifications, attributes and skills that qualify each person to serve on the Company’s Board of Directors.
W. Dabbs Cavin. Mr. Cavin serves as Chief Financial Officer of Mountaire Corporation and is a member of its board of directors, and he also serves as a Vice Chairman of the Board of Directors of the Company. From 2011 until June 30, 2013, Mr. Cavin served as Chief Executive Officer of the Company and First Federal Bank (predecessor to the Bank). He has been active in commercial banking in a variety of executive positions for over 20 years. In 1996, Mr. Cavin was a co-founder and organizer of Pinnacle Bancshares and Pinnacle Bank in Little Rock, Arkansas where he served as executive vice president and chief lending officer while also serving as a member of that bank’s and its holding company’s board of directors. After the 2002 sale of Pinnacle to BancorpSouth, Mr. Cavin became president of the Little Rock market for BancorpSouth until joining Summit Bank as executive vice president. At Summit, Mr. Cavin was responsible for leading its entrance into the Little Rock market as well as working with executive management on corporate strategic initiatives, market expansion, marketing, and business development. From 2008 until 2011, Mr. Cavin was employed by Mountaire Corporation in a position similar to his present capacity, while also consulting with Summit Bank on strategic issues. Mr. Cavin is also a former regulatory examiner with the Federal Home Loan Bank of Dallas which was the precursor to the Office of Thrift Supervision.
Mr. Cavin has over 20 years of community and commercial banking experience, much of which he acquired as an executive officer or director of various Arkansas-based financial institutions. His understanding of the community banking needs of Arkansas makes him an invaluable asset as a director of the Company. His long and successful career as a bank executive and his intimate knowledge of community banking in Arkansas led the Board to conclude that Mr. Cavin is qualified to serve as a director of the Company.
William Changose. Mr. Changose currently serves as the Chief Operating Officer of both Westrock Capital Partners, LLC and Westrock Group, LLC and serves as President of Westrock Coffee Roasting, LLC. In addition, he serves as Chief Operating Officer of BSF Holdings, the Company’s largest shareholder. Mr. Changose originally joined Westrock Capital Partners in 2009, BSF Holdings in 2011 and Westrock Group and Westrock Coffee in 2014. Prior to his corporate experience, Mr. Changose served as an officer and pilot in the United States Air Force for 23 years, retiring with the rank of Colonel. Mr. Changose holds a B.S. in economics from the United States Air Force Academy, an M.B.A. from Golden Gate University and a J.D. from the University of Arkansas at Little Rock Bowen School of Law.
Mr. Changose brings to the Board valuable leadership experience gained through his distinguished military career in the United States Air Force and through his senior management experience since retiring from the military. In addition, Mr. Changose, through his affiliation with BSF Holdings, has great familiarity with the operations and management of the Company and the Bank and has a personal interest in the Company that aligns his interests with those of the Company’s shareholder base. For these reasons, the Board concluded that Mr. Changose is qualified to serve as a director of the Company.
K. Aaron Clark. Mr. Clark currently serves as a Managing Director of The Stephens Group, LLC, a private, family-owned investment firm, which he joined in 2006. In addition to helping analyze, coordinate and execute The Stephens Group’s investment transactions, Mr. Clark devotes a considerable amount of his time to supporting the firm’s partner companies’ efforts to grow the long-term value of their businesses. Prior to joining The Stephens Group, Mr. Clark was a corporate financial analyst at Stephens, Inc., where he gained experience in detailed financial analysis, modeling and diligence.
Mr. Clark provides a unique perspective to the Board. In addition to his investment banking experience, he brings to the Board a keen understanding and knowledge of partnering with management teams of a wide-range of companies across various industries to assist them in growing the long-term value of their businesses and accomplishing their strategic goals. His professional experience and strong community ties led the Board to conclude that Mr. Clark is qualified to serve as a director of the Company.
Frank Conner. Mr. Conner served as Vice President, Finance and Accounting and Chief Financial Officer of FedEx Freight East (formerly American Freightways, Inc.) from February 2001 through June 2010. Mr. Conner previously served as a director of American Freightways from 1989 to February 2001 and held various positions with American Freightways, including serving as Executive Vice President-Finance and Accounting and Chief Financial Officer from November 1995 to February 2001. Mr. Conner previously served thirteen years with McKesson Service Merchandise in various positions including General Manager and Chief Financial Officer. Mr. Conner served seven years in public accounting with Peat, Marwick & Mitchell prior to joining McKesson. Mr. Conner also served on the board of directors of P.A.M. Transportation Services, Inc. (NASDAQ: PTSI), based in Tontitown, Arkansas.
Mr. Conner brings to the Board of Directors extensive management and business experience including over 26 years of service in senior financial management positions for both private and publicly-traded companies. He has served on the Board of Directors of the Company and the Bank (and its predecessor) since 2003. He is the Chairman of the Company’s audit committee, qualifies as an audit committee financial expert (as defined by the rules of the SEC) and is a member of the Company’s compensation committee. He has extensive experience in performing audits of banking and non-banking publicly-traded companies and has served on the audit and compensation committees of American Freightways Corp. and P.A.M. Transportation Services, Inc. Additionally, Mr. Conner’s extensive ties to the community, strength of character, mature judgment, familiarity with our business and industry, independence of thought and ability to work collegially with others led the Board to conclude that Mr. Conner is qualified to serve as a director of the Company.
Scott T. Ford. Mr. Ford is a member and chief executive officer of Westrock Group, LLC, a private, family-owned commodities trading firm he founded in 2013. Westrock Group operates Westrock Coffee Company, LLC, a coffee exporter, trader, importer and roaster, and Westrock Asset Management, LLC, a global asset management firm. He founded Westrock Coffee Company in 2009 and Westrock Asset Management in 2014. He previously served as President and Chief Executive Officer of Alltel Corporation (a provider of wireless voice and data communications services) from 2002 to 2009, and prior to that, he served as its President and Chief Operating Officer from 1998 to 2002. During Mr. Ford’s tenure with Alltel Corporation, he led the company through several major business transformations, culminating with the sale of the company to Verizon Wireless in 2009. Mr. Ford currently serves on the board of directors of AT&T, Inc. (NYSE: T).
Mr. Ford’s corporate management experience makes him an invaluable member of the Company’s Board. His proven track record as CEO of a Fortune 200 company, in addition to his expansive experience as a director of public and private companies and charitable organizations, provides him the ability to understand and address the challenges and issues facing the Company. In addition, Mr. Ford, through his affiliation with BSF Holdings, has a substantial personal interest in the Company that aligns his interests with those of the Company’s shareholder base. The Board believes that Mr. Ford’s extensive management experience, proven leadership capabilities and his personal stake in the success of the Company qualify him to serve on the Board.
G. Brock Gearhart. Mr. Gearhart is President of Greenwood Gearhart Inc., a registered investment advisor located in Fayetteville, Arkansas. Prior to assuming his current role in September 2008, he was a Vice President with Merrill Lynch’s Private Banking and Investment Group in New York City. He is a graduate of the University of Arkansas where he earned a B.S.B.A in Financial Management and Investments and was named Outstanding Student in Finance. He holds the Chartered Financial Analyst (CFA®) designation.
Mr. Gearhart’s financial expertise and ties to the community led the Board to conclude that he is qualified to serve as a director of the Company.
John J. Ghirardelli. Mr. Ghirardelli currently serves as chairman of, and as a member of the audit committee, executive committee and nomination and compensation committee of the board of directors of Paul Mueller Co., a Springfield, Missouri-based stainless steel equipment manufacturer. Beginning in 2015, Mr. Ghirardelli became managing partner of Burrito Concepts, LLC, a Qdoba franchise. From 2013 to 2015 he served as a director and member of the audit committee of Metropolitan National Bank. Since February 2012, Mr. Ghirardelli has also served as Trustee and Chief Executive Officer of Missouri Insulation. In addition, Mr. Ghirardelli serves as CEO of Keystone Digital, an audio-visual technology firm he founded in 2007. Mr. Ghirardelli previously served as President and CEO of The Killian Group, a construction firm, from 2007 to 2012; and has been the Chairman of Tech Spa Inc., a systems integration software firm, since 2009. Since 1995, Mr. Ghirardelli has served as Secretary/Treasurer of ICP Inc., a mini storage rental and tobacco resale company.
Mr. Ghirardelli’s significant experience as a director and/or executive officer for various business enterprises, including his service as a director and member of the audit committee of Metropolitan National Bank and his experience in mergers and acquisitions, as well as his ties to the community led the Board to conclude that he is qualified to serve as a director of the Company.
O. Fitzgerald Hill. Dr. Hill serves as Executive Director of the Foundation at Arkansas Baptist College, a position he has held since 2016. From 2006 to 2016, Dr. Hill served as President of Arkansas Baptist College in Little Rock, Arkansas. During his tenure as President, Arkansas Baptist College grew from fewer than 200 to more than 1,100 students and raised more than $23 million to update the institution’s facilities. From 2010 to 2011, Dr. Hill served on the advisory board of Summit Bank. From 2005 to 2006, Dr. Hill led the Ouachita Baptist Opportunity Fund in Arkadelphia, Arkansas, as its Executive Director. From 2001 to 2005, he served as head football coach of the San Jose State Spartans. Dr. Hill earned a Doctorate of Education degree from the University of Arkansas and has received numerous awards recognizing his leadership on educational and community-development issues at the local, state and national levels. He is also the recipient of the Bronze Star for his service in the United States Armed Forces during Operation Desert Shield and Desert Storm.
Dr. Hill brings a wealth of leadership experience and skills to the Board. This depth of experience, proven success as a leader, and his strong community ties led the Board to conclude that Dr. Hill is qualified to serve as a director of the Company.
Daniel C. Horton. From 2005 through the closing of the Company’s merger with First National Security Company (“FNSC”), Mr. Horton served as Chief Executive Officer and a director of FNSC. Additionally, from 2005 to December 31, 2012, he served as Chief Executive Officer of First National Bank, a subsidiary bank of FNSC. From 2000 until 2005, when First Community Banking Corporation (“FCBC”) was acquired by FNSC, Mr. Horton served as the President and Chief Executive Officer of FCBC and its subsidiary banks. From 1983 until 2000, he was the principal of Horton & Associates, Inc., where he acted as a consultant to community banks on various matters. Mr. Horton’s banking career began in 1973 with First Arkansas Bancstock Corporation (“FABC”), where he served for ten years in various capacities, including as executive vice president, chief financial officer and as a member of FABC’s board of directors.
Mr. Horton has over 30 years of community and commercial banking experience, much of which he acquired as an executive officer, director or consultant of various Arkansas-based financial institutions. The Board of Directors believes that Mr. Horton’s community banking experience combined with his intimate knowledge of the markets in which the Bank operates makes him an integral part of the Company’s Board of Directors. For these reasons, the Board has concluded that Mr. Horton is qualified to serve as a director of the Company.
J. Matthew Machen. Mr. Machen is President and Chief Executive Officer of the Company and the Bank. Mr. Machen was appointed as a director of the Company in connection with his promotion on January 18, 2017. Mr. Machen originally joined the Bank in 2011 as a Senior Vice President. Thereafter, he served as Regional President of the Bank from May 2012 to June 2014, as Executive Vice President and Chief Financial Officer of the Company from June 2014 to April 2016 and as President of the Bank beginning in May 2016. Before joining the Company and the Bank, Mr. Machen served as Vice President and Commercial Lender for First Security Bank from 2003 to 2011. Mr. Machen holds a Finance degree from the University of Arkansas and is a board member of the Dean's Alumni Advisory Council at the University of Arkansas's Walton College of Business.
The Board determined that Mr. Machen should serve as a director due to his experience in community banking. Additionally, the Board believes that as President and Chief Executive Officer of the Company, Mr. Machen can provide the Board with in-depth knowledge and real time information concerning the day-to-day operation of the Company and the Bank.
Richard N. Massey. Mr. Massey is Chairman of the Board of Directors of the Company and previously served as its interim President and Chief Executive Officer. He has been a member of Westrock Capital Partners, LLC, a private investment partnership (“Westrock”), since January 2009, and is the managing member of BSF Holdings, the Company’s largest shareholder. From 2006 to 2009, Mr. Massey was Executive Vice President, Chief Strategy Officer and General Counsel of Alltel Corporation, then the fifth largest provider of wireless services in the United States. Prior to joining Alltel, Mr. Massey acted as Managing Director of Stephens Inc., a private investment bank, for 6 years.
Mr. Massey is a licensed attorney in the state of Arkansas and has over 30 years of experience as a corporate and securities attorney. Since 2006, Mr. Massey has been a director of Fidelity National Financial, Inc. (“FNF”), a title insurance, mortgage services, specialty insurance and information services company. From 2006 to 2017 he was a director of Fidelity National Information Systems, Inc. (“FIS”), a global provider of technology and services to the financial services industry. He served as a member of the compensation committee of FNF, and served as chairman of the compensation committee and a member of both the executive and the corporate governance and nominating committees of FIS. Since 2014, he has also been a director of Black Knight Inc. (“BKI”) and serves on its audit committee and compensation committee. He is also a director of FGL Holdings and serves on its nominating and corporate governance and compensation committee.
Mr. Massey has an extensive understanding of corporate law, finance and investment banking that he gained through years of experience as a financial and legal advisor to public and private companies. In addition, Mr. Massey, through his affiliation with BSF Holdings, has a substantial personal interest in the Company that aligns his interests with those of the Company’s shareholder base. His professional experience combined with his personal stake in the success of the Company led the Board to determine that Mr. Massey is qualified to serve as a director of the Company and as Chairman of the Board.
Ian R. Vaughan. Since 2008, Mr. Vaughan has served as the Ranch Operations Manager for John H. Hendrix Corp., managing a 5,000-acre ranch in northern Texas engaged in cattle and hay production. Mr. Vaughan is also a licensed real estate professional affiliated with David Norman Realty Advisors, focusing on the marketing, purchase and sale of farming, ranching and recreational properties in northern Texas and southern Oklahoma.
Through his prior service as a director of First National Bank, a subsidiary bank of FNSC, Mr. Vaughan gained substantial experience in the leadership and management of a community bank, as well as a deep understanding of that bank’s operations and the markets in which it operates. The Company’s Board of Directors believes that Mr. Vaughan provides a unique perspective to the Board through his past affiliation with First National Bank, his real estate expertise and his experience as the manager of a major agricultural operation, all of which led the Board to conclude that Mr. Vaughan is qualified to serve as a director of the Company.
EXECUTIVE OFFICERS WHO ARE NOT DIRECTORS
Set forth below is biographical information with respect to each current executive officer of the Company and the Bank. In addition to the executive officers listed below, Mr. Machen, who also serves as a director of the Company, is an executive officer of the Company and the Bank. Biographical information regarding Mr. Machen is available above. All executive officers of the Company and the Bank are elected annually by the Board and serve at the discretion of the Board. There are no arrangements or understandings between any person on the one hand and the Company or the Bank on the other hand pursuant to which such person has been selected as an executive officer of either the Company or the Bank.
Sherri R. Billings, age 60. Ms. Billings is Senior Executive Vice President and Chief Financial Officer of the Company and the Bank. From 2014 until 2016, she served as Executive Vice President and Chief Accounting Officer of the Company and the Bank. From 2002 until 2014, she served as Executive President and Chief Financial Officer of the Company and First Federal Bank. From 1993 to 2002 she served as a Senior Vice President of First Federal Bank and from 1986 to 1993 she served as Treasurer of First Federal Bank. Ms. Billings initially was employed by the Bank in 1979. Ms. Billings is a certified public accountant licensed to practice in the state of Arkansas, a member of the American Institute of Certified Public Accountants and the Arkansas Society of Certified Public Accountants, and has attained the designation Chartered Global Management Accountant.
R. Thomas Fritsche, Jr. age 57. Since January 2017, Mr. Fritsche has served as Executive Vice President and Chief Risk Officer of the Company and the Bank. Mr. Fritsche originally joined the Company and the Bank in 2011 and has served in various credit and risk management capacities since that time. Mr. Fritsche has over twenty-five years of commercial banking experience in executive and managerial positions with banks in Arkansas. Prior to joining the Company and the Bank, Mr. Fritsche worked at Southwest Power Pool, a regional utility transmission organization, as Director of Treasury and Risk Management from 2007 to 2011. He previously served as Chief Administrative Officer and Commercial Banking Executive from 2004 to 2007, and as Senior Vice President and Commercial Real Estate Lending Manager from 2000 to 2002, at Regions Financial Corp.; as Executive Vice President and Lending Manager at Arvest Banking Company from 2002 to 2004; as Vice President and Commercial Lender at Mercantile Bank; as Vice President, Mergers & Acquisitions, at First Commercial Corp.; and as Director of Mergers & Acquisitions and Director of Asset/Liability Management for Worthen Banking Corp. Mr. Fritsche began his career in banking as a National Bank Examiner with the Office of the Comptroller of the Currency.
Shelly Loftin, age 35. Ms. Loftin serves as Executive Vice President and Chief Administrative Officer of the Company, a position she has held since January 2017. She previously served as Executive Vice President and Chief Marketing Officer from January 2015 to January 2017. Ms. Loftin joined First Federal Bank in October of 2011 as Vice President of Marketing and Retail. Prior to joining the Company and the Bank, Ms. Loftin worked in marketing at Bank of the Ozarks and Summit Bank. She has over 15 years of banking experience and holds an M.B.A. from the University of Arkansas at Little Rock. Her day to day responsibilities include marketing, advertising, branding, culture, employee relations, the customer experience, human resources, mortgage and third party investments.
Paul Lowe, age 38. Mr. Lowe serves as President of the Company’s Corporate Banking Division, a position he has held since 2016. Mr. Lowe joined First Federal Bank in 2012 as a Regional President, presiding over Little Rock and surrounding markets. Prior to joining the Company he served as Senior Vice President and Commercial Lender for Summit Bank from 2008 to 2012, Vice President of Regions Bank’s Corporate Banking Group from 2004 to 2008, and Vice President of US Bank’s Real Estate Banking Group from 2001 to 2004. Mr. Lowe holds a Finance degree from Ouachita Baptist University, where he serves on the Alumni Advisory Board of the Hickingbotham School of Business. Mr. Lowe is also a graduate of the Southwestern Graduate School of Banking at Southern Methodist University.
Donna Merriweather, age 58. Ms. Merriweather, SPHR, SHRM-SCP, serves as Executive Vice President and Chief Human Resources Officer of the Company. Ms. Merriweather joined the Company in June 2014 bringing over 30 years of human resources management experience, 15 years in the financial services industry and 18 years in manufacturing. She received her Senior Professional in Human Resources certification in 2001 and her SHRM-SCP (Senior Certified Professional) credentials in 2016. Ms. Merriweather currently serves as State-Director Elect for the Arkansas Society for Human Resource Management State Council, an affiliate of the national Society for Human Resource Management association. Her responsibilities include compensation and benefit administration, policy and regulatory administration, recruitment and retention, employee relations, and performance management.
Yurik Paroubek, age 33. Mr. Paroubek serves as Executive Vice President and Chief Technology Officer of the Company and the Bank. Mr. Paroubek joined First Federal Bank in October of 2011 as a financial analyst. In June 2012, Mr. Paroubek was promoted to Operations Manager of the Bank, a position he held until June 2013 when he was promoted to Director of Operations. Mr. Paroubek was promoted to Chief Technology Officer in 2016. Prior to joining the Bank, Mr. Paroubek worked as a financial analyst at Summit Bank. His day to day responsibilities include overseeing deposit, information security, and information technology operations in conjunction with a focus in project management.
Jeri Pritchett, age 50. Ms. Pritchett serves as Executive Vice President and Chief Accounting Officer of the Company and the Bank, a position she has held since January 2017. Ms. Pritchett previously served as Senior Vice President and Controller of the Company from 2006 to January 2017. Ms. Pritchett joined First Federal Bank in December 2002 as Vice President of Accounting and Financial Reporting. Prior to joining First Federal Bank, Ms. Pritchett was a senior manager with Deloitte & Touche LLP where she started her career in 1989. Ms. Pritchett is a certified public accountant licensed to practice in the state of Arkansas, a member of the American Institute of Certified Public Accountants and the Arkansas Society of Certified Public Accountants, and has attained the designation of Chartered Global Management Accountant. Ms. Pritchett received her B.A. in Economics and Business from Hendrix College.
Chad Rawls, age 43. Mr. Rawls serves as Executive Vice President and Chief Credit Officer of the Company and the Bank. Mr. Rawls joined First Federal Bank in 2011 as a Senior Vice President of Commercial Lending, overseeing the Central Arkansas region. From April 2013 to June 2014 he served as Executive Vice President of Commercial and Industrial Lending of First Federal Bank, from June 2014 to January 2017 he served as Executive Vice President and Regional Credit Officer of the Bank. He was promoted to his current position in January 2017. Mr. Rawls began his banking career as a Commercial Loan Officer for US Bank in Little Rock, Arkansas. While at US Bank, he also served as Conway Market President from 2010 to 2011.
CODE OF ETHICS FOR EXECUTIVE OFFICERS AND FINANCIAL PROFESSIONALS
The Board of Directors has adopted a code of ethics for the Company’s executive officers, including the Chief Executive Officer and the Chief Financial Officer, and other financial professionals. These officers are expected to adhere at all times to this code of ethics. Failure to comply with this code of ethics is a serious offense and will result in appropriate disciplinary action. We have posted this code of ethics in the Governance Documents section of our website at www.bearstatefinancial.com.
We will disclose on our website at www.bearstatefinancial.com, to the extent and in the manner permitted by Item 5.05 of Form 8-K under Section 13 of the Exchange Act, the nature of any amendment to this code of ethics (other than technical, administrative, or other non-substantive amendments), our approval of any material departure from a provision of this code of ethics, and our failure to take action within a reasonable period of time regarding any material departure from a provision of this code of ethics that has been made known to any of the executive officers noted above.
SECTION 16(a) BENEFICIAL OWNERSHIP REPORTING COMPLIANCE
Section 16(a) of the Exchange Act requires the Company’s officers and directors, and persons who own more than 10% of the Company’s common stock, to file reports of ownership and changes in ownership with the SEC. Officers, directors and greater than 10% shareholders are required by regulation to furnish the Company with copies of all Section 16(a) forms they file. The Company currently knows of no person, other than BSF Holdings, who owns 10% or more of the Company’s common stock.
Based solely on a review of the copies of such forms furnished to the Company, or written representations from its officers and directors, the Company believes that during, and with respect to, the year ended December 31, 2017, the Company’s officers, directors and BSF Holdings, the sole beneficial owner of more than 10% of the Company’s common stock, satisfied the reporting requirements promulgated under Section 16(a) of the Exchange Act, with the exception of the following: (i) late Form 4s were filed for officers Chad Rawls and Jeri Pritchett on January 30, 2017 pertaining to one transaction each, (ii) a late Form 4 was filed for officer Paul Lowe on January 30, 2017 pertaining to two transactions; (iii) a late Form 4 was filed for officer Paul Lowe on March 2, 2017 pertaining to one transaction and (iv) a late Form 4 was filed for BSF Holdings on January 23, 2018 pertaining to one transaction from the prior year.
Composition and Independence of Audit Committee
The audit committee consists of Frank Conner (Chairman), Brock Gearhart and John Ghirardelli. The Board has determined that each member of the audit committee qualifies as an “independent” director under the Sarbanes-Oxley Act, related SEC rules and NASDAQ listing standards related to audit committees, and that each satisfies all other applicable standards for service on the audit committee. In addition, the Board has determined that Mr. Conner, the Chairman of the audit committee, meets the requirements adopted by the SEC for qualification as an audit committee financial expert. The identification of a person as an audit committee financial expert does not impose on such person any duties, obligations or liability that are greater than those that are imposed on such person as a member of the audit committee and the Board in the absence of such identification. Moreover, the identification of a person as an audit committee financial expert for purposes of the regulations of the SEC does not affect the duties, obligations or liability of any other member of the audit committee or the Board. Finally, a person who is determined to be an audit committee financial expert will not be deemed an “expert” for purposes of Section 11 of the Securities Act of 1933, as amended.
Item 11. Executive Compensation.
COMPENSATION DISCUSSION AND ANALYSIS
This Compensation Discussion and Analysis (“CD&A”) describes our fiscal year 2017 executive compensation program. It provides information about the objectives and key elements of the program and explains the reasons behind the Board’s and the compensation committee’s executive compensation decisions.
The Company’s named executive officers for 2017 are:
|
● |
Matt Machen, President and Chief Executive Officer |
|
● |
Sherri Billings, Senior Executive Vice President and Chief Financial Officer |
|
● |
Paul Lowe, Corporate Banking President |
|
● |
Shelly Loftin, Executive Vice President and Chief Administrative Officer |
|
● |
Chad Rawls, Executive Vice President and Chief Credit Officer |
|
● |
Mark McFatridge, former President and Chief Executive Officer1 |
|
(1) |
Mr. McFatridge resigned from the Company and the Bank effective January 14, 2017. |
Overview of Compensation Philosophy and Program
Our compensation philosophy is to provide compensation to our executive officers that is competitive in the marketplace and provides elements of both reward and retention in order to attract and retain qualified and experienced officers. Further, through our compensation program, the Company desires to motivate and reward executives by paying for performance in a manner that takes into account the Company’s performance goals and desires to provide compensation that strikes a proper balance between short-term and long-term compensation, and between cash and equity compensation.
The compensation of our executive officers, including the various components of such compensation, is determined by our Board based on recommendations from the compensation committee. The compensation committee consists solely of non-employee directors who meet all applicable requirements to be independent of management. The compensation committee operates under a written charter (accessible on the investor relations page of the Company’s website at www.bearstatefinancial.com).
Changes in Management
On January 14, 2017, Mr. McFatridge, former President and Chief Executive Officer of the Company, notified the Company of his resignation as an officer and director of the Company effective immediately. In connection with Mr. McFatridge’s resignation, the Company and Mr. McFatridge entered into a separation agreement. The separation agreement provided for the equivalent of two years base salary payable in equal installments beginning on the Bank’s first payroll date following his resignation and ending on or before March 15, 2018. In connection with his resignation and entry into the separation agreement, Mr. McFatridge forfeited all unearned equity and non-equity incentive awards issued in connection with the Company’s 2016 incentive plans.
Effective January 18, 2017, Matt Machen was promoted to President and Chief Executive Officer of the Company and was appointed as a director of the Company. In connection with Mr. Machen’s promotion, senior management of the Company and the Bank was reorganized as follows:
|
Name |
Former Position |
Current Position |
|||||
|
Sherri Billings† |
Senior Executive Vice President, Chief Financial Officer and Chief Accounting Officer |
Senior Executive Vice President and Chief Financial Officer |
|||||
|
Tom Fritsche |
Senior Executive Vice President and Chief Operating Officer |
Executive Vice President and Chief Risk Officer |
|||||
|
Shelly Loftin† |
Executive Vice President and Chief Marketing Officer |
Executive Vice President and Chief Administrative Officer |
|||||
|
Yurik Paroubek |
Executive Vice President and Chief Technology Officer |
No Change |
|||||
|
Donna Merriweather |
Executive Vice President and Director of Human Resources |
Executive Vice President and Chief Human Resources Officer |
|||||
|
Jeri Pritchett |
Senior Vice President and Controller |
Executive Vice President and Chief Accounting Officer |
|||||
|
Chad Rawls† |
Executive Vice President of Commercial Lending (Bear State Bank) |
Executive Vice President and Chief Credit Officer |
|||||
|
Paul Lowe† |
Corporate Banking President (Bear State Bank) |
No Change |
† 2017 named executive officer
The Summary Compensation Table and related tables below refer to the current principal positions held by Mses. Billings and Loftin and Messrs. Machen, Lowe and Rawls. Although Mr. McFatridge no longer serves as an executive officer of the Company, he appears in the Summary Compensation Table and related tables below.
2016 Say-on-Pay Vote
At our 2016 annual meeting of shareholders, we provided shareholders the opportunity to approve in an advisory, non-binding vote the compensation of the Company’s named executive officers. Over 99% of the votes cast on the proposal were in favor of our executive compensation. The Board believes this strongly affirms shareholders’ support of the Company’s approach to executive compensation and, in light of such strong support, decided to maintain the core design of our compensation program. The Board appreciates and values the views of our shareholders and invites our shareholders to communicate any concerns or opinions on executive pay directly to the compensation committee or the Board.
2011 Omnibus Incentive Plan
Shareholders originally approved the Company’s 2011 Omnibus Incentive Plan (the “2011 Incentive Plan”) on April 29, 2011 and amended it on May 25, 2016 to expand the list of performance measures that may be used in awarding performance-based compensation under the plan. The objectives of the 2011 Incentive Plan are to optimize the profitability and growth of the Company through incentives that are consistent with the Company’s goals and that align the interests of the award participants with those of the Company’s shareholders. Additionally, the 2011 Incentive Plan is intended to provide flexibility to the Company in motivating, attracting and retaining officers, directors and employees. The 2011 Incentive Plan, which is administered by the compensation committee, allows for both cash and equity incentive awards.
The Company is authorized to issue up to 2,144,743 shares of common stock under the 2011 Incentive Plan, no more than 1,072,371 of which may be in the form of “full value” awards (i.e. awards other than stock options, stock appreciation rights or other awards for which the recipient pays the exercise price). If an award under the 2011 Incentive Plan is canceled, forfeited, terminates or is settled in cash, the shares related to that award will not be treated as having been delivered under the 2011 Incentive Plan. As of March 1, 2018, 683,255 shares of the Company’s common stock had been issued under the 2011 Incentive Plan or were reserved for issuance upon exercise or settlement of outstanding awards and 1,461,488 shares of the Company’s common stock remained available for issuance by the Company under the 2011 Incentive Plan.
Role of Management in Determining Executive Compensation
Management participates in the process of determining executive compensation by assisting the compensation committee in gathering information needed for their review of compensation programs. In addition, the Chief Executive Officer makes recommendations to the compensation committee and the full Board, as requested, regarding base salary adjustments, cash and equity incentive plan awards, and other compensation components for senior executives. It is the ultimate responsibility of the Board, with advice from the compensation committee, to set compensation for the executive officers of the Company and the Bank.
Role of Compensation Consultants
Consultants Engaged by the Compensation Committee
The compensation committee has authority under its charter to retain and oversee the work of outside compensation consultants, legal counsel and other advisers in connection with discharging its responsibilities, including the authority to determine such consultants’ or advisers’ fees and other retention terms. The Company provides such funding as the compensation committee determines to be necessary or appropriate for payment of compensation to consultants and advisers retained by the Committee. During 2017, the compensation committee did not engage any outside compensation consultants, but did consider the results of a market analysis prepared by a consultant engaged by management, as described below.
Consultants Engaged by Management
In August 2016, management, at the direction of the compensation committee, engaged Blanchard Consulting Group (“Blanchard”), a compensation consultant, to provide a market analysis for the compensation packages offered to our then President and Chief Executive Officer (Mark McFatridge), Senior Executive Vice President and Chief Operating Officer (Tom Fritsche), Bank President (Matt Machen) and Senior Executive Vice President and Chief Financial Officer (Sherri Billings). The analysis included a review of the compensation of the above-referenced named executive officers to similarly-situated officers of a select group of peer companies using compensation data from fiscal year 2015 as reported in 2016. Blanchard also provided advice and information on other executive compensation matters, including executive pay components, prevailing market practices, relevant legal and regulatory requirements, and shareholder advisory trends.
Prior to preparation of the August 2016 market analysis, management and Blanchard developed a peer group. In selecting the peer group used for the August 2016 market analysis, management and Blanchard considered many factors, focusing primarily on comparably sized, publicly-traded financial institutions (based on total assets) located primarily in the Midwest and Mid-south regions of the country, as of December 31, 2015, limited to financial institutions that experienced three-year asset growth of more than 10%. Applying these criteria, management and Blanchard included the following financial institutions within the peer group for the August 2016 market analysis:
|
Allegiance Bancshares, Inc. Equity Bancshares, Inc. First Mid-Illinois Bancshares, Inc. Franklin Financial Network, Inc. Home Bancorp, Inc. |
Horizon Bancorp Midland States Bancorp, Inc. MidWestOne Financial Group, Inc. National Commerce Corporation Stock Yards Bancorp, Inc. |
QCR Holdings, Inc. Southwest Bancorp, Inc. Triumph Bancorp, Inc. Wilson Bank Holding Co. Your Community Bancshares, Inc. |
The Company paid Blanchard aggregate fees of $29,400 in 2016. The Company did not engage any compensation consultants in 2017, but did consider the results of the August 2016 market analysis prepared by Blanchard in determining 2017 compensation.
Compensation Components
We believe our executive compensation program (i) is competitive among companies in similar growth and development stages which is necessary to attract and retain talented management, (ii) provides incentives that focus on the critical needs of the business on an annual and continuing basis and (iii) rewards management commensurate with the creation of shareholder and market value.
In setting 2017 executive compensation, the compensation committee reviewed each compensation element and aggregate total direct compensation (the sum of base salary, cash incentives and long-term equity incentives) for each of our named executive officers compared to similarly situated employees of companies in the peer group in the August 2016 Blanchard report (see “—Role of Compensation Consultants” above), but did not target compensation to a specific percentile of the market data. In determining actual pay levels, the compensation committee considered the peer group data as well as other factors in its collective judgment including: the executive’s experience, performance, internal pay equity, scope of responsibilities and specific skills, together with his or her ability to impact business results, or other business conditions.
The compensation committee regularly reviews the Company’s compensation program to ensure that the components of the program are consistent with the Company’s compensation philosophy and will allow the Company to achieve its long- and short-term objectives and goals. The table below identifies the principal elements of our 2017 executive compensation program. The details regarding the amounts paid for each element in 2017 is described under “—2017 Executive Compensation” below. The compensation committee believes the components of our executive compensation program balance the mix of cash and equity compensation and current and longer-term compensation in a way that furthers the compensation objectives discussed above.
|
Reward Element |
Form of Compensation |
Performance Criteria |
|||||
|
Fixed |
Base Salary |
Cash |
Not applicable |
||||
|
|
Cash incentive compensation |
Cash |
Company performance: | ||||
|
|
● |
Core earnings per share
|
|||||
| At-Risk | Long-term equity incentive |
Performance award consisting of common stock and time- based restricted stock units |
Company performance: |
||||
|
compensation |
vesting ratably over a two year period (granted after the performance period)
|
● Core earnings per share | |||||
|
Benefits |
Retirement and welfare benefits |
401(k) plan with Company contributions
|
Not applicable |
||||
2017 Executive Compensation
Each year management and the compensation committee review the Company’s existing executive compensation program. The Company seeks to confirm that each of its compensation elements, as well as its compensation structure, is appropriate in light of the Company’s performance and strategy.
Base Salary
Base salary levels for the named executive officers and other executive officers were subjectively determined by the compensation committee and the Board, with consideration given to the following factors: (i) the executive’s then current salary, (ii) the executive’s performance and contributions during the previous fiscal year, (iii) the executive’s qualifications and responsibilities, (iv) the executive’s tenure with the Company and the position held by the executive, (v) the compensation committee’s perception and understanding of the appropriate salary levels that are necessary to remain competitive within the markets in which the Company operates, (vi) the Company’s budgetary parameters established for the full year, and (vii) the recommendation of the Chief Executive Officer, in the case of all executive officers other than himself.
|
Base Salary At Year End |
Percentage Increase |
||||||||||
|
Named Executive Officer |
2017 |
2016 |
|||||||||
|
Matt Machen |
$ | 325,000 | $ | 250,000 | 30% | ||||||
|
Sherri Billings |
$ | 250,000 | $ | 225,000 | 11% | ||||||
|
Paul Lowe |
$ | 275,000 | $ | 225,000 | 22% | ||||||
|
Shelly Loftin |
$ | 225,000 | $ | 180,000 | 25% | ||||||
|
Chad Rawls |
$ | 215,000 | $ | 157,331 | 37% | ||||||
As described above, Mr. McFatridge’s last date of employment with the Company was January 14, 2017.
Cash Incentive Compensation
In January 2017, the Company approved annual cash incentive awards under the Company’s 2011 Incentive Plan, which we refer to as the 2017 Cash Incentive Awards, for certain members of senior management. The purpose of the 2017 Cash Incentive Awards was to subject a portion of the executive officers’ cash compensation to achievement of pre-established performance targets to ensure the continued alignment of executive compensation, Company performance and strategic goal attainment. Each of the named executive officers other than Mr. McFatridge received 2017 Cash Incentive Awards. The cash awards were based on the Company’s financial results for the period beginning on January 1, 2017 and ending on December 31, 2017 with respect to the performance metric set forth in the table below. In each case, the Company selected the performance metric because it aligns with the Company’s strategy and therefore enhance the alignment of our annual cash bonuses with the interests of the Company’s shareholders.
The table below sets forth the performance metric, weighting and targets for the 2017 Cash Incentive Awards granted to Mses. Billings and Loftin and Messrs. Machen, Lowe and Rawls, as well as actual results for the metric:
|
Performance Metric |
Weight |
Threshold |
Target |
Maximum |
2017 Actual Results |
|||||
|
Core earnings per share(1) |
100% |
$0.53 |
$0.55 |
$0.59 |
$0.65 |
|
(1) |
See Reconciliation of Non-GAAP to GAAP Financial Measures table below for the reconciliation of the most directly comparable GAAP (accounting principles generally accepted in the United States of America) measures. |
|
Reconciliation of Non-GAAP to GAAP Financial Measures |
Year Ended December 31, 2017 |
||||
|
(dollars in thousands except share data) |
|||||
|
Net income |
(A) |
$ | 21,311 | ||
|
Adj: Gain on sale of securities, net |
(48 | ) | |||
|
Adj: Claim on bank owned life insurance |
(1,304 | ) | |||
|
Adj: Merger, acquisition and integration expenses |
1,930 | ||||
|
Adj: Branch restructure expense |
1,835 | ||||
|
Adj: Deferred tax asset tax rate adjustment |
2,355 | ||||
|
Tax effect of adjustments |
(1,455 | ) | |||
|
Total core earnings |
(B) |
$ | 24,624 | ||
|
Diluted average weighted shares outstanding |
(C) |
37,918,257 | |||
|
Earnings per share, diluted |
(A/C) |
$ | 0.56 | ||
|
Core earnings per share, diluted |
(B/C) |
$ | 0.65 | ||
The performance metric includes a threshold performance goal that must be achieved before payout, and performance between threshold, target and maximum levels results in prorated payouts. Following the performance period, the Board determines, with respect to the performance metric, whether the Company’s performance meets or exceeds the threshold, target or maximum performance level and determines the final amount of the cash incentive award to be granted.
For the 2017 performance period, the Company’s core earnings per share was $0.65 per share, which exceeded the maximum goal of $0.59 per share.
The table below discloses the threshold, target and maximum incentive opportunity for each of the named executive officers under the 2017 Cash Incentive Awards and the actual cash incentive award paid to such officer based on the level of achievement of the Company’s performance metric during 2017. Based on the Company’s performance results in 2017 for the metric as described above, in January 2018 the Board approved cash incentive payments to each of the named executive officers as set forth in the table below.
|
Cash Incentive Opportunity Based Upon: |
Actual Cash |
|||||||||||||||
|
Participant |
Threshold(1) |
Target(2) |
Maximum(3) |
Incentive Paid Based on 2017 Performance |
||||||||||||
|
Matt Machen |
$ | 16,250 | $ | 24,375 | $ | 32,500 | $ | 32,500 | ||||||||
|
Sherri Billings |
$ | 12,500 | $ | 18,750 | $ | 25,000 | $ | 25,000 | ||||||||
|
Paul Lowe |
$ | 13,750 | $ | 20,625 | $ | 27,500 | $ | 27,500 | ||||||||
|
Shelly Loftin |
$ | 11,250 | $ | 16,875 | $ | 22,500 | $ | 22,500 | ||||||||
|
Chad Rawls |
$ | 10,750 | $ | 16,125 | $ | 21,500 | $ | 21,500 | ||||||||
|
(1) |
Equal to 66.7% of target award. |
|
(2) |
The target award opportunity is an amount equal to 7.5% of base salary for each of the named executive officers. |
|
(3) |
Equal to 133.3% of target award. |
Long-Term Equity Incentive Compensation
The Board and the compensation committee believe that performance-based equity awards provide an appropriate incentive to encourage management, particularly senior management, to maximize long-term shareholder returns. Equity grants under the 2011 Incentive Plan have the effect of more closely aligning the interests of management with the interests of shareholders, while at the same time providing a valuable tool for attracting, rewarding and retaining key employees.
In January 2017 the Company approved grants of performance-based equity incentive awards under the 2011 Incentive Plan, which we refer to as the 2017 Equity Awards. The purpose of the 2017 Equity Awards is to subject the executive officers’ equity compensation to achievement of a pre-established performance target followed by a ratable two year vesting period for 2/3 of the award (1/3 of the award vests upon certification of the performance results) to ensure the continued alignment of executive compensation, Company performance and strategic goal attainment. Each of the named executive officers other than Mr. McFatridge received 2017 Equity Awards.
The 2017 Equity Awards were based on the Company’s financial results for the period beginning on January 1, 2017 and ending on December 31, 2017 with respect to the same performance metric used in connection with the 2017 Cash Incentive Awards. As with the 2017 Cash Incentive Awards, each performance metric includes a threshold performance goal that must be achieved before payout.
In addition, for each participant, 2017 Equity Awards include a threshold, target and maximum incentive opportunity (denominated in dollars) that may be awarded upon the achievement of the threshold, target and maximum performance level for the particular performance metric. In establishing the incentive opportunities for each participant, the compensation committee reviewed the number of equity awards granted to participants in prior years and reviewed pro forma 2017 summary compensation information to evaluate the expected compensation of each of the Company’s named executive officers for 2017, both in terms of total compensation and each individual compensation element.
Following the performance period, the Board determines whether the Company’s performance meets or exceeds the threshold, target or maximum performance for the metric and determines the final value of the 2017 Equity Awards. One-third of the award will be granted in shares of unrestricted common stock and two-thirds of the award will be granted in restricted stock units that vest ratably over a two year vesting period. The number of shares of common stock and restricted stock units to be awarded is determined using the closing price of the Company’s common stock as reported on the NASDAQ Global Market on the date that the Board certifies the Company’s performance.
For the 2017 performance period, the Company’s core earnings per share was $0.65 per share, which exceeded the maximum goal of $0.59 per share.
The table below discloses the threshold, target and maximum incentive opportunity for each of the named executive officers under the 2017 Equity Awards. Based on the Company’s performance results in 2017 for each metric as described above, in January 2018 the Board approved and granted unrestricted common stock (representing 1/3 of the award value) and restricted stock units (representing 2/3 of the award value) to each of the named executive officers as set forth in the table below.
|
Dollar Value of 2017 Equity Award Opportunity Based Upon: |
Actual Equity Award Based on 2017 Performance: |
|||||||||||||||||||
|
Participant |
Threshold (1) |
Target (2) |
Maximum (3) |
Dollar Value (4) |
Number of Shares (5) |
|||||||||||||||
|
Matt Machen |
$ | 48,750 | $ | 73,125 | $ | 97,500 | $ | 97,491 | 9,502 | |||||||||||
|
Sherri Billings |
$ | 37,500 | $ | 56,250 | $ | 75,000 | $ | 74,990 | 7,309 | |||||||||||
|
Paul Lowe |
$ | 41,250 | $ | 61,875 | $ | 82,500 | $ | 82,490 | 8,040 | |||||||||||
|
Shelly Loftin |
$ | 33,750 | $ | 50,625 | $ | 67,500 | $ | 67,490 | 6,578 | |||||||||||
|
Chad Rawls |
$ | 32,250 | $ | 48,375 | $ | 64,500 | $ | 64,494 | 6,286 | |||||||||||
|
(1) |
Equal to 66.7% of target award. |
|
(2) |
The target award opportunity is an amount equal to 22.5% of base salary for each of the named executive officers. |
|
(3) |
Equal to 133.3% of target award. |
|
(4) |
Based on the grant date fair value of $10.26 per share for unrestricted common stock and restricted stock units granted under the 2017 Equity Awards utilizing the provisions of ASC Topic 718. No fractional shares were awarded in connection with the settlement of the 2017 Equity Awards. |
|
(5) |
The total number of shares awarded was based on the fair market value of the Company’s shares of $10.26, which was the closing price of the Company’s common stock as reported on the NASDAQ Global Market on the date that the Board certified 2017 performance results. One-third of the award is granted in shares of unrestricted common stock and two-thirds of the award is granted in restricted stock units. The portion of the award consisting of restricted stock units will vest in two equal installments on the first and second anniversary of the grant date, assuming continuous employment by the executive officer during the period and subject to acceleration upon a change in control of the Company. |
Retirement and Welfare Benefits
The Company maintains a qualified retirement 401(k) plan which is made available to substantially all employees of the Company and the Bank, including the named executive officers. The Company’s 401(k) plan includes a salary deferral feature designed to qualify under Section 401 of the Code. Employees, including each of the Company’s named executive officers, are eligible to make salary deferrals into the 401(k) plan and receive employer contributions including matching contributions. Contributions by highly compensated employees, including the named executive officers, are limited by provisions of the Average Deferral Percentage test described in Code Section 401(k)(3) and the Average Contribution Percentage test described in Code Section 401(m)(2) as well as other applicable limits under the Code. The Company presently matches the first 2% of employee contributions.
Other Benefits and Perquisites
The named executive officers and other executive officers and personnel receive life, health, dental and long-term disability insurance coverage in amounts the Company believes to be competitive with comparable financial institutions. Benefits under these plans are made available to all employees of the Company on comparable terms as those provided to the named executive officers.
The compensation committee periodically reviews the personal benefits provided to the executive officers. These benefits and perquisites for the named executive officers are described in the “All Other Compensation” column of the Summary Compensation Table for Fiscal Year 2017 under the “Executive Compensation” section below.
2017 Compensation Mix
In setting compensation for the named executive officers, the Company seeks to find an appropriate balance between fixed and performance-based compensation and between short-term and long-term compensation. The chart below illustrates the mix of total compensation in 2017 for our Chief Executive Officer (Mr. Machen), individually, and all other named executive officers as a group (Mses. Billings and Loftin and Messrs. Lowe and Rawls).
|
2017 Compensation Mix (1) |
|||||||||
|
Compensation Element |
CEO |
All Other NEOs |
|||||||
|
Fixed |
Base Salary |
70.19 | % | 69.99 | % | ||||
|
Performance-Based/ Variable |
Cash incentive compensation |
7.15 | % | 7.10 | % | ||||
| Long-term equity incentive | 21.44 | % | 21.30 | % | |||||
|
Benefits |
Retirement, welfare benefits and perquisites |
1.23 | % | 1.61 | % | ||||
|
(1) |
Percentages are calculated based on (i) the actual cash payout value received by each participant under the 2017 Cash Incentive Awards and (ii) the grant date fair value of the common stock and restricted stock units granted to each officer under the 2017 Equity Awards on January 17, 2018 as described above. |
Risk Considerations in our Overall Compensation Program
The compensation committee has assessed the risks that could arise from our compensation policies for all employees, including employees who are not officers, and has concluded that such policies are not reasonably likely to have a material adverse effect on us. To the extent that our compensation programs create a potential misalignment of risk incentives, the compensation committee believes that it has adequate compensating controls to mitigate against the potential impact of any such misalignment. These compensating controls include capped incentive award opportunities, a three-year vesting cycle for equity-based compensation and oversight by the compensation committee.
CEO Pay Ratio
In 2017, the SEC adopted rules (as required by the Dodd-Frank Act) requiring disclosure of (i) the annual total compensation of our median employee (excluding our President and Chief Executive Officer (or CEO)), (ii) the annual total compensation of our CEO, and (iii) the ratio of the annual total compensation of our median employee to the annual total compensation of our CEO. In 2017, the total compensation of our CEO was $430,464 (as reported in the Summary Compensation Table), and the total compensation of our median employee was $32,972. The total compensation of our CEO was approximately 13 times that of the median employee.
We identified the median employee using the annual base salary of all employees who were employed as of December 31, 2017, including full-time, part-time, seasonal and temporary employees (other than our CEO). Our total number of employees as of December 31, 2017 was 406. After identifying the median employee, we calculated the annual total compensation for the median employee using the same methodology we used for calculating our CEO’s compensation as reported in the Summary Compensation Table.
COMPENSATION COMMITTEE REPORT
The compensation committee has reviewed and discussed the Compensation Discussion and Analysis required by Item 402(b) of SEC Regulation S-K with management and, based on such review and discussion, the compensation committee recommended to the Board that the Compensation Discussion and Analysis be included in this Annual Report on Form 10-K.
Members of the compensation committee
Scott Ford, Chairman
Frank Conner
Brock Gearhart
Ian Vaughan
COMPENSATION COMMITTEE INTERLOCKS AND INSIDER PARTICIPATION
During 2017 the compensation committee consisted of Messrs. Ford, as Chairman, Conner, Gearhart and Vaughan. No member of the compensation committee is a former or current officer or employee of the Company or the Bank, and the Board has determined that each member of the compensation committee qualifies as “independent” under NASDAQ listing standards and the applicable SEC standards. No member of the compensation committee serving during 2017 was a party to a transaction, relationship or arrangement requiring disclosure under Item 404 of Regulation S-K. During 2017, none of our executive officers served on the compensation committee (or its equivalent) or board of directors of another entity whose executive officer served on the Company’s Board or compensation committee.
EXECUTIVE COMPENSATION
Summary Compensation Table
The following table sets forth a summary of certain information concerning the compensation awarded or paid to our named executive officers for services rendered in all capacities during the last three fiscal years.
|
Name and Principal Position |
Year |
Salary |
Bonus |
Stock Awards(1) |
Non-Equity Incentive Plan Compensation |
Change in Pension Value and Nonqualified Deferred Compensation Earnings(2) |
All Other Compensation |
Total |
|||||||||||||||||||||
|
Matt Machen |
2017 |
$ | 319,231 | $ | - | $ | 73,125 | (5) | $ | 32,500 | $ | - | $ | 5,608 | $ | 430,464 | |||||||||||||
|
President and Chief Executive |
2016 |
$ | 250,000 | $ | - | $ | 50,000 | (5) | $ | 42,188 | $ | - | $ | 5,350 | $ | 347,538 | |||||||||||||
|
Officer |
2015 |
$ | 219,615 | $ | - | $ | 268,748 | (6) | $ | 6,250 | $ | - | $ | 4,348 | $ | 498,961 | |||||||||||||
|
Sherri Billings |
2017 |
$ | 248,077 | $ | - | $ | 56,250 | (7) | $ | 25,000 | $ | 80,000 | $ | 6,923 | $ | 416,250 | |||||||||||||
|
Senior Executive Vice |
2016 |
$ | 216,018 | $ | - | $ | 94,993 | (7) | $ | 37,969 | $ | 46,000 | $ | 5,541 | $ | 400,521 | |||||||||||||
|
President and Chief Financial Officer |
2015 |
$ | 201,994 | $ | - | $ | 7,294 | $ | 7,294 | $ | - | $ | 4,748 | $ | 221,330 | ||||||||||||||
|
Paul Lowe |
2017 |
$ | 271,154 | $ | - | $ | 61,875 | (8) | $ | 27,500 | $ | - | $ | 5,608 | $ | 366,137 | |||||||||||||
|
Corporate Banking President |
|||||||||||||||||||||||||||||
|
Shelly Loftin |
2017 |
$ | 221,539 | $ | - | $ | 50,625 | (9) | $ | 22,500 | $ | - | $ | 4,877 | $ | 299,541 | |||||||||||||
|
Executive Vice President and |
2016 |
$ | 180,000 | $ | - | $ | 22,500 | (9) | $ | 11,913 | $ | - | $ | 3,890 | $ | 218,303 | |||||||||||||
|
Chief Administrative Officer |
|||||||||||||||||||||||||||||
|
Chad Rawls |
2017 |
$ | 210,564 | $ | - | $ | 48,375 | (10) | $ | 21,500 | $ | - | $ | 4,442 | $ | 284,881 | |||||||||||||
|
Executive Vice President and |
|||||||||||||||||||||||||||||
|
Chief Credit Officer |
|||||||||||||||||||||||||||||
|
Mark McFatridge |
2017 |
$ | 16,346 | $ | - | $ | -- | $ | - | $ | - | $ | 703,128 | (4) | $ | 719,474 | |||||||||||||
|
Former President and Chief |
2016 |
$ | 425,000 | $ | - | $ | 106,250 | (3) | $ | - | $ | - | $ | 30,319 | $ | 561,569 | |||||||||||||
|
Executive Officer |
2015 |
$ | 109,423 | $ | - | $ | 425,345 | $ | - | $ | - | $ | 84,819 | $ | 619,587 | ||||||||||||||
|
(1) |
Stock awards represent grants of performance-based awards and time-based RSUs. With regard to the performance-based awards, the table reflects fair value assuming target level performance at the service inception date. RSUs are valued based on the closing stock price of a share of the Company’s common stock on the grant date. |
|
(2) |
Represents the actuarial change in pension value in Ms. Billings’ account from January 1 to December 31 of the applicable year under the Pentegra defined benefit pension plan. For fiscal year 2015, Ms. Billings had a decrease in pension value of $19,000. |
|
(3) |
Assuming satisfaction of the maximum level of performance conditions, the fair value of the award at the service inception date would have been $212,500. In connection with Mr. McFatridge’s resignation in January 2017 and in accordance with the terms of his Separation Agreement, the actual payout value of the award was $0. |
|
(4) |
This amount is comprised of severance and payment for accrued vacation. The remainder of Mr. McFatridge’s severance of $140,305 will be paid in five installments in 2018. |
|
(5) |
Consists of a performance-based incentive award. Assuming satisfaction of the maximum level of performance conditions, the fair value of the award at the service inception date would have been $97,500 and $93,750 in 2017 and 2016, respectively. |
|
(6) |
Consists of a grant of 28,506 RSUs awarded on October 1, 2015 with a grant date fair value of $249,998 and a performance-based incentive award. Assuming satisfaction of the maximum level of performance conditions, the fair value of the performance-based incentive award at the service inception date, as subsequently modified to give effect to an increase in the executive’s base salary during the year, would have been $28,125. |
|
(7) |
In 2016, consists of a grant of 5,854 RSUs awarded on January 26, 2016 with a grant date fair value of $49,993 and a performance-based incentive award. In 2017, consists solely of a performance-based incentive award. Assuming satisfaction of the maximum level of performance conditions, the fair value of the performance-based incentive award at the service inception date would have been $75,000 and $84,375 in 2017 and 2016, respectively. |
|
(8) |
Consists of a performance-based incentive award. Assuming satisfaction of the maximum level of performance conditions, the fair value of the award at the service inception date would have been $82,500. |
|
(9) |
Consists of a performance-based incentive award. Assuming satisfaction of the maximum level of performance conditions, the fair value of the award at the service inception date would have been $67,500 and $45,000 in 2017 and 2016, respectively. |
|
(10) |
Consists of a performance-based incentive award. Assuming satisfaction of the maximum level of performance conditions, the fair value of the award at the service inception date would have been $64,500. |
Grants of Plan-Based Awards
The following table shows information regarding grants of plan-based awards, including equity and non-equity incentive plans, made by the Company during 2017 to the named executive officers.
|
|
|
Estimated Possible Payouts Under Non-Equity Incentive Plan Awards(1) |
Estimated Future Payouts Under Equity Incentive Plan Awards(2) |
All Other Stock Awards: Number of Shares of |
Grant Date Fair Value of Stock |
|||||
| Name |
Grant Date |
Threshold ($) |
Target ($) |
Maximum ($) |
Threshold ($) |
Target ($) |
Maximum ($) |
Stock or Units (#) |
and Option Awards ($) (3) |
|
|
Matt Machen |
1/26/17 |
$16,250 |
$24,375 |
$32,500 |
$48,750 |
$73,125 |
$97,500 |
— |
$73,125 |
|
|
Sherri Billings |
1/26/17 |
$12,500 |
$18,750 |
$25,000 |
$37,500 |
$56,250 |
$75,000 |
— |
$56,250 |
|
|
Paul Lowe |
1/26/17 |
$13,750 |
$20,625 |
$27,500 |
$41,250 |
$61,875 |
$82,500 |
— |
$61,875 |
|
|
Shelly Loftin |
1/26/17 |
$11,250 |
$16,875 |
$22,500 |
$33,750 |
$50,625 |
$67,500 |
— |
$50,625 |
|
|
Chad Rawls |
1/26/17 |
$10,750 |
$16,125 |
$21,500 |
$32,250 |
$48,375 |
$64,500 |
— |
$48,375 |
|
|
(1) |
The amounts reported in these columns represent potential performance-based cash awards that our NEOs could have earned based upon the Company’s achievement of certain quantitative performance criteria included within the 2017 Cash Incentive Awards. For further discussion regarding these quantitative metrics, see “2017 Executive Compensation – Cash Incentive Compensation.” Actual payout amounts for each of the named executive officers under the 2017 Cash Incentive Awards are included in the “Non-Equity Incentive Plan Compensation” column of the Summary Compensation Table above. |
|
(2) |
2017 Equity Award opportunities were denominated in dollars but payable in a combination of unrestricted shares of common stock (1/3) and RSUs (2/3). The number of shares of common stock and restricted stock units to be awarded is determined using the closing price of the Company’s common stock as reported on the NASDAQ Global Market on the date that the Board certifies the Company’s performance. |
|
(3) |
Stock awards represent grants of performance-based awards RSUs. The table reflects fair value assuming target level performance at the service inception date. |
Outstanding Equity Awards At Fiscal Year-End
The following table sets forth outstanding equity awards of the named executive officers as of December 31, 2017.
|
|
Option Awards |
Stock Awards |
|||||||
|
Name |
Number of Securities Underlying Unexercised Options Exercisable (#)(1) |
Number of Securities Underlying Unexercised Options Unexercisable (#) |
Equity Awards: Securities Underlying Unexercised Unearned Options (#) |
Option Exercise Price ($) |
Option Expiration Date |
Number Shares of Stock That Have Not Vested (#)(1) |
Market Shares or Stock That Have Not Vested ($)(2) |
Equity Incentive Plan Awards: Shares, Other Rights That Have Not Vested (#) |
Equity Incentive Plan Awards: Market or Payout Shares, Other Rights That Have Not Vested ($) |
|
Matt Machen |
5,555 5,555 |
— |
— |
$6.57 $5.35 |
7/12/2018 10/26/2018 |
3,111(3) 9,502(4) 28,506(5) 732(6) 2,796(7) |
$31,826 $97,205 $291,616 $7,488 $28,603 |
— |
— |
|
Sherri Billings |
16,666 |
— |
— |
$6.57 |
7/12/2018 |
7,309(4) 285(6) 3,903(8) 2,516(7) |
$74,771 $2,916 $39,928 $25,739 |
— |
— |
|
Paul Lowe |
16,666 |
— |
— |
$6.71 |
3/28/2019 |
8,040(4) 500(9) 5,701(5) 659(6) 1,491(7) |
$82,249 $5,115 $58,321 $6,742 $15,253 |
— |
— |
|
Shelly Loftin |
5,555 |
— |
— |
$5.27 |
11/11/2018 |
889(3) 6,578(4) 10,262(5) 527(6) 790(7) |
$9,094 $67,293 $104,980 $5,391 $8,082 |
— |
— |
|
Chad Rawls |
6,111 |
— |
— |
$6.57 |
7/12/2018 |
6,286(4) 224(6) 3,903(8) |
$64,306 $2,292 $39,928 |
— |
— |
|
(1) |
In connection with the Company’s 11% stock dividend paid in December 2014, the compensation committee adjusted all outstanding stock option awards and RSUs to give effect to the stock dividend, in accordance with the provisions of the 2011 Incentive Plan. Amounts shown in the above table reflect the outstanding awards of the named executive officers after giving effect to the adjustments made by the compensation committee. |
|
(2) |
Market value of restricted stock units is based on the December 29, 2017 closing price of $10.23 for the Company’s common stock. |
|
(3) |
Granted June 16, 2014, with 60% of the award vested on June 16, 2017. Assuming continued employment, the remainder will vest 20% on June 16, 2018 and 2019, respectively (subject to accelerated vesting upon a change in control of the Company). |
|
(4) |
Represents the earned portion of the 2017 Equity Awards. Upon certification of actual 2017 performance results by the Board on January 17, 2018, one-third of the award vested and was paid in unrestricted common stock and the remaining two-thirds of the award was paid in restricted stock units that will vest ratably on January 17, 2019 and January 17, 2020, assuming continued employment (subject to accelerated vesting upon a change in control of the Company). The number of shares awarded was determined using the closing price of the Company’s common stock on January 17, 2018. |
|
(5) |
Granted on October 1, 2015, and assuming continued employment, 100% will vest on October 1, 2018 (subject to accelerated vesting upon a change in control of the Company). |
|
(6) |
Granted on January 26, 2016. One half of the award vested on January 22, 2017 and the remaining units vested on January 22, 2018. |
|
(7) |
Granted on January 18, 2017. One-third of the award vested upon grant and was paid in unrestricted common stock, one-third of the award was paid in restricted stock units that vested on January 18, 2018 and the remaining one-third of the award was paid in restricted stock units that will vest on January 18, 2019, assuming continued employment (subject to accelerated vesting upon a change in control of the Company). The number shares awarded was determined using the closing price of the Company’s common stock on January 18, 2017. |
|
(8) |
Granted on January 26, 2016. One-third of the award vested on January 26, 2017, one-third of the award vested on January 26, 2018 and assuming continued employment, the remaining one-third of the award will vest on January 26, 2019 (subject to accelerated vesting upon a change in control of the Company). |
|
(9) |
Granted on February 23, 2015. The remaining unvested portion of the award fully vested on February 23, 2018. |
Option Exercises and Stock Vested in 2017 Fiscal Year
The following table sets forth information concerning stock awards that vested for the named executive officers during the fiscal year ended December 31, 2017:
|
|
Stock Awards |
|
| Name |
Number of Shares Acquired on Vesting (#) |
Value Realized on Vesting ($) |
|
Matt Machen |
7,351 |
$70,982 |
|
Sherri R. Billings |
4,050 |
$41,005 |
|
Paul Lowe |
2,459 |
$24,659 |
|
Shelly Loftin |
2,625 |
$25,622 |
|
Chad Rawls |
2,730 |
$27,722 |
Pension Benefits for 2017 Fiscal Year
The Bank has a defined benefit pension plan (“Pentegra Plan”) for all full time employees of the Bank who had attained the age of 21 years and had completed one year of service with the Bank prior to July 1, 2010. On April 30, 2010, the board of directors of the Bank elected to freeze the Pentegra Plan effective July 1, 2010, eliminating all future benefit accruals for participants in the Pentegra Plan and closing the Pentegra Plan to new participants as of that date. After July 1, 2010, the Bank continues to incur costs consisting of administration and Pension Benefit Guaranty Corporation insurance expenses as well as amortization charges based on the funding level of the Pentegra Plan. The level of amortization charges is determined by the Pentegra Plan’s funding shortfall, which is determined by comparing plan liabilities to plan assets.
In general, prior to July 1, 2010, the Pentegra Plan provided for annual benefits payable upon retirement at age 65 (i) monthly, (ii) in a lump sum, or (iii) in a partial lump sum with a monthly payment. The formula for determining the normal annual retirement benefit is a benefit accrual multiple times the number of years of credited service times the career average salary. The benefit accrual multiple was amended at various times through the life of the Pentegra Plan, and was set at 0.5% at the time that the Pentegra Plan was frozen. At the time a participating employee retires an actuarial calculation is prepared by the retirement plan company (Pentegra). This calculation is based on the benefits accrued through the Pentegra Plan during the team member’s employment with the Bank as well as market interest rates to determine the value of the retirement benefit.
Under the Pentegra Plan, an employee’s benefits are fully vested after five years of service. A year of service is any year in which an employee works a minimum of 1,000 hours. Participating employees who have reached age 65 are automatically 100% vested once they have completed one year of employment as defined under the Pentegra Plan. The Pentegra Plan also provides for an early retirement option with reduced benefits. Payment may begin at age 45, in which case the allowance otherwise payable at age 65 is reduced by applying an early retirement factor based on the age and years of service when payments begin. The early retirement factor is calculated by subtracting 6% for each year between age 60 and 65, 4% for each year between age 55 and 60 and 3% for each year between age 45 and 55. The factor for age 60 is 70%. The Pentegra Plan also provides for death benefits depending on the age of the participant and the years of service. Death benefits are paid in a lump sum distribution.
Ms. Billings is the only named executive officer who is a participant in the Pentegra Plan. The table below shows the present value of accumulated benefits payable to Ms. Billings, including her number of years of credited service, under the Pentegra Plan determined (i) assuming a retirement age of 65, (ii) using the RP-2014 mortality table for white collar workers, with mortality improvement scale MP-2017 (weighted 55%) and the RP-2000 static mortality table for lump sums projected to 2017 (weighted 45%), and (iii) using an assumed interest rate of 3.60%.
|
Name |
Plan Name |
|
Number of Years Credited Service |
|
|
Present Value of Accumulated Benefit(2) |
|
|
Payments During Last Fiscal Year |
|
|||
|
Sherri R. Billings |
Pentegra Defined Benefit Plan(1) |
|
|
28.33(3) |
|
|
$ |
741,000 |
|
|
$ |
- |
|
|
(1) |
A multiple employer tax-qualified defined benefit plan as defined by ERISA. |
|
(2) |
Reflects value as of December 31, 2017. |
|
(3) |
Effective July 1, 2010, the Pentegra Plan was frozen and as a result existing participants receive no further service benefit credit. |
Potential Payments upon a Termination or Change-in-Control
Change in Control Severance Agreements
The Company is party to change in control agreements (each a “Change in Control Agreement”) with each of Mses. Billings and Loftin and Messrs. Machen, Lowe and Rawls (each individually an “Employee”). The Change in Control Agreement provides for an initial term ending on December 31, 2018. After the end of the initial term, the Change in Control Agreement will automatically be renewed for additional one (1) year periods unless otherwise terminated by either party upon 180 days written notice prior to the expiration of the applicable term.
The Change in Control Agreement generally provides that, if the Employee’s employment is terminated by the Company for reasons other than “Cause,” disability or death or in the event the Employee terminates his or her employment for “Good Reason” within one (1) year following a Change in Control (as defined in the Change in Control Agreement), the Employee will be entitled to receive the following severance benefits: (i) payment, in cash, of an amount equal to two (2) times the Employee’s then current annualized base salary (one (1) times current annualized base salary in the case of Messrs. Lowe and Rawls); and (ii) accelerated vesting of all unvested equity awards previously granted to the Employee. Notwithstanding the foregoing, under the Change in Control Agreement, the amount of severance benefits are subject to reduction to the extent that the payments would be classified as “excess parachute payments” under Section 280G of the Code.
The Change in Control Agreement restricts the Employee from (i) disclosing, disseminating or using for his or her personal benefit or for the benefit of others, confidential or proprietary information belonging to the Company or the Bank, (ii) soliciting certain customers of the Company or the Bank for a period of twelve (12) months following the Employee’s termination of employment, and (iii) competing with the Company or the Bank for a period of twelve (12) months following the Employee’s termination of employment.
Termination for “Cause” under the Change in Control Agreement generally means termination of the Employee by the Company for: (i) an act or failure to act constituting willful misconduct or gross negligence, personal dishonesty, or breach of fiduciary duty involving personal profit; (ii) willful and material failure to perform the duties of his or her employment and the failure to correct such failure within ten (10) business days after receiving notice from the Company’s Chief Executive Officer specifying such failure in detail; (iii) willful and material violation of the Company’s or the Bank’s code of ethics or written harassment policies; (iv) reasons specified by a federal or state regulatory agency having jurisdiction over the Company or the Bank which direct that his or her employment be terminated; (v) his or her arrest, indictment, or conviction for (a) a felony or (b) a lesser criminal offense involving dishonesty, breach of trust, or moral turpitude, or willful violation of any law, rule or regulation (other than traffic violations and similar offenses); (vi) material breach of a term, condition, or covenant of the Change in Control Agreement and the failure to correct such violation within ten (10) business days after receipt of written notice from the Company’s Chief Executive Officer specifying such breach in detail; or (vii) incompetence.
Termination for “Good Reason” under the Change in Control Agreement generally means termination by the Employee for: (i) a material reduction in duties, responsibilities, or status with the Company or Bank; (ii) a material diminution in authority, duties or responsibilities or a change in position; (iii) a material reduction in base salary; (iv) a change in the primary location at which he or she is required to perform the duties of employment to a location that is more than fifty miles from the location at which his or her office is located on the date of the Change in Control; or (v) the commission of a material breach of the Change in Control Agreement by the Company or the Bank.
The following tables describe estimated amounts of compensation and benefits that could be payable to each named executive officer upon certain terminations or a change in control. All amounts assume the named executive officers terminated employment as of December 31, 2017. The actual amounts that would be paid to each named executive officer upon termination of employment or a change in control can only be determined at the time the actual triggering event occurs.
Matt Machen
The following table shows the potential payments upon a hypothetical termination or change in control of the Company effective as of December 31, 2017 for Matt Machen, our President and Chief Executive Officer using a price per share value of $10.28, which is the price per share established in the Merger Agreement.
|
Type of |
Voluntary Termination without Good Reason or Retirement |
Termination |
|
Change in |
Termination |
Death or |
||||||||||||
|
Severance |
- | - | - | - | $650,000 | - | ||||||||||||
|
Accelerated Vesting of Equity Awards(1) |
- | - | - | - | $409,286 | - | ||||||||||||
|
Total |
- | - | - | - | $1,059,286 | - |
___________________________
|
(1) |
The value of the accelerated vesting of restricted stock units is based on per share merger consideration as defined in the Merger Agreement of $10.28. The value of the accelerated vesting of stock options is equal to the difference between the per share merger consideration as defined in the Merger Agreement of $10.28 minus the exercise price of the stock option. |
Sherri Billings
The following table shows the potential payments upon a hypothetical termination or change in control of the Company effective as of December 31, 2017 for Sherri Billings, our Senior Executive Vice President and Chief Financial Officer, using a price per share value of $10.28, which is the price per share established in the Merger Agreement. In addition to the amounts below, Ms. Billings is entitled to payments under the Pentegra Plan following her departure from the Company, as described above under “Pension Benefits for 2017 Fiscal Year.”
|
Type of |
Voluntary Termination without Good Reason or Retirement |
Termination |
|
Change in |
Termination |
Death or |
||||||||||||
|
Severance |
- | - | - | - | $500,000 | - | ||||||||||||
|
Accelerated Vesting of Equity Awards(1) |
- | - | - | - | $130,748 | - | ||||||||||||
|
Total |
- | - | - | - | $630,748 | - |
____________________________
|
(1) |
The value of the accelerated vesting of restricted stock units is based on per share merger consideration as defined in the Merger Agreement of $10.28. The value of the accelerated vesting of stock options is equal to the difference between the per share merger consideration as defined in the Merger Agreement of $10.28 minus the exercise price of the stock option. |
Paul Lowe
The following table shows the potential payments upon a hypothetical termination or change in control of the Company effective as of December 31, 2017 for Paul Lowe, our Corporate Banking President, using a price per share value of $10.28, which is the price per share established in the Merger Agreement.
|
Type of |
Voluntary Termination without Good Reason or Retirement |
Termination |
|
Change in |
Termination |
Death or |
||||||||||||
|
Severance |
- | - | - | - | $275,000 | - | ||||||||||||
|
Accelerated Vesting of Equity Awards(1) |
- | - | - | - | $145,346 | - | ||||||||||||
|
Total |
- | - | - | - | $420,346 | - |
_____________________________
|
(1) |
The value of the accelerated vesting of restricted stock units is based on per share merger consideration as defined in the Merger Agreement of $10.28. The value of the accelerated vesting of stock options is equal to the difference between the per share merger consideration as defined in the Merger Agreement of $10.28 minus the exercise price of the stock option. |
Shelly Loftin
The following table shows the potential payments upon a hypothetical termination or change in control of the Company effective as of December 31, 2017 for Shelly Loftin, our Executive Vice President and Chief Administrative Officer, using a price per share value of $10.28, which is the price per share established in the Merger Agreement. Effective February 15, 2017, the Board amended Ms. Loftin’s Change in Control Agreement to increase the severance payment from one (1) times annualized base salary to two (2) times annualized base salary. The table below assumes retroactive effect of the amendment to December 31, 2017.
|
Type of |
Voluntary Termination without Good Reason or Retirement |
Termination |
|
Change in |
Termination |
Death or |
||||||||||||
|
Severance |
- | - | - | - | $450,000 | - | ||||||||||||
|
Accelerated Vesting of Equity Awards(1) |
- | - | - | - | $156,002 | - | ||||||||||||
|
Total |
- | - | - | - | $606,002 | - |
____________________________
|
(1) |
The value of the accelerated vesting of restricted stock units is based on per share merger consideration as defined in the Merger Agreement of $10.28. The value of the accelerated vesting of stock options is equal to the difference between the per share merger consideration as defined in the Merger Agreement of $10.28 minus the exercise price of the stock option. |
Chad Rawls
The following table shows the potential payments upon a hypothetical termination or change in control of the Company effective as of December 31, 2017 for Chad Rawls, our Executive Vice President and Chief Credit Officer, using a price per share value of $10.28, which is the price per share established in the Merger Agreement.
|
Type of |
Voluntary Termination without Good Reason or Retirement |
Termination |
|
Change in |
Termination |
Death or |
||||||||||||
|
Severance |
- | - | - | - | $215,000 | - | ||||||||||||
|
Accelerated Vesting of Equity Awards(1) |
- | - | - | - | $65,097 | - | ||||||||||||
|
Total |
- | - | - | - | $280,097 | - |
____________________________
|
(1) |
The value of the accelerated vesting of restricted stock units is based on per share merger consideration as defined in the Merger Agreement of $10.28. The value of the accelerated vesting of stock options is equal to the difference between the per share merger consideration as defined in the Merger Agreement of $10.28 minus the exercise price of the stock option. |
Director Compensation
In consideration for their service on the Board, all directors, other than directors that also serve as officers of the Company or the Bank, receive $540 per month for their service on the Board of Directors of the Company and $1,440 per month for their service on the board of directors of the Bank. Members of the respective board of the Company or the Bank serving on a committee of such board did not receive any additional compensation for serving on such committee.
The following table sets forth information concerning compensation paid or accrued by the Company and the Bank to each member of the board of directors during the year ended December 31, 2017.
|
Name |
|
Fees |
|
Stock |
|
Option |
|
All Other |
|
Total |
|
|||||
|
W. Dabbs Cavin |
|
$ |
15,840 |
|
$ |
— |
|
$ |
— |
|
$ |
— |
|
$ |
15,840 |
|
|
William J. Changose |
$ |
13,860 |
$ |
— |
$ |
— |
$ |
— |
$ |
13,860 |
||||||
|
K. Aaron Clark |
|
$ |
15,840 |
|
$ |
— |
|
$ |
— |
|
$ |
— |
|
$ |
15,840 |
|
|
Frank Conner |
|
$ |
15,840 |
|
$ |
— |
|
$ |
— |
|
$ |
— |
|
$ |
15,840 |
|
|
Scott T. Ford |
|
$ |
15,840 |
|
$ |
— |
|
$ |
— |
|
$ |
— |
|
$ |
15,840 |
|
|
G. Brock Gearhart |
|
$ |
15,840 |
|
$ |
— |
|
$ |
— |
|
$ |
— |
|
$ |
15,840 |
|
|
John J. Ghirardelli |
|
$ |
15,840 |
|
$ |
— |
|
$ |
— |
|
$ |
— |
|
$ |
15,840 |
|
|
O. Fitzgerald Hill |
|
$ |
15,840 |
|
$ |
— |
|
$ |
— |
|
$ |
— |
|
$ |
15,840 |
|
|
Daniel C. Horton |
|
$ |
15,840 |
|
$ |
— |
|
$ |
— |
|
$ |
— |
|
$ |
15,840 |
|
|
Richard N. Massey |
|
$ |
15,840 |
|
$ |
— |
|
$ |
— |
|
$ |
— |
|
$ |
15,840 |
|
|
Ian R. Vaughan |
|
$ |
15,840 |
|
$ |
— |
|
$ |
— |
|
$ |
— |
|
$ |
15,840 |
|
Item 12. Security Ownership of Certain Beneficial Owners and Management and Related Stockholder Matters.
BENEFICIAL OWNERSHIP OF COMMON STOCK BY CERTAIN
BENEFICIAL OWNERS AND MANAGEMENT AND RELATED
SHAREHOLDER MATTERS
The following table sets forth, as of March 1, 2018, certain information as to the common stock beneficially owned by (i) each person or entity, including any “group” as that term is used in Section 13(d)(3) of the Exchange Act, who or which was known to the Company to be the beneficial owner of more than 5% of the issued and outstanding common stock, (ii) the directors above of the Company, (iii) the executive officers of the Company named in the Summary Compensation Table below, and (iv) all directors and executive officers of the Company as a group.
|
|
|
Common Stock |
|
||||
|
Name of Beneficial Owner |
|
Number |
|
% |
|
||
|
Bear State Financial Holdings, LLC |
|
|
15,095,785 |
|
|
39.92 |
% |
|
|
|
|
|
|
|
|
|
|
Directors: |
|
|
|
|
|
|
|
|
Richard N. Massey |
|
|
15,696,829 |
(2)(3) |
|
41.47 |
% (4) |
|
J. Matthew Machen |
|
|
33,833 |
(5) |
|
* |
|
|
W. Dabbs Cavin |
|
|
142,550 |
(6) |
|
* |
|
|
William Changose |
96,586 |
* |
|||||
|
K. Aaron Clark |
|
|
1,772 |
|
|
* |
|
|
Frank Conner |
|
|
19,244 |
(7) |
|
* |
|
|
Scott T. Ford |
|
|
818,183 |
(3) |
|
2.16 |
% (4) |
|
G. Brock Gearhart |
|
|
1,772 |
|
|
* |
|
|
John J. Ghirardelli |
|
|
1,018 |
|
|
* |
|
|
O. Fitzgerald Hill |
|
|
1,855 |
|
|
* |
|
|
Daniel C. Horton |
|
|
3,029 |
|
|
* |
|
|
Ian R. Vaughan |
|
|
12,497 |
|
|
* |
|
| Other named executive officers: | |||||||
|
Mark McFatridge |
|
|
-- |
|
|
* |
|
|
Sherri R. Billings |
78,875 |
(8) |
* |
|
|||
|
J. Paul Lowe |
|
|
27,182 |
(9) |
|
* |
|
|
Shelly Loftin |
14,176 |
(10) |
* |
||||
|
Chad Rawls |
14,006 |
(11) |
* |
||||
|
All directors and executive officers of the Company as a group (20 persons) |
|
17,018,331 |
(2)(12) |
|
44.84 |
% (13) |
|
___________________________
|
* |
Represents less than 1% of the outstanding common stock. |
|
(1) |
Based upon information contained in a Schedule 13D filed by Ms. Hendrix on March 6, 2017 with the SEC. Ms. Hendrix has shared voting and dispositive power with respect to 681,064 reported shares and sole voting and dispositive power with respect to 1,862,893 reported shares. |
|
(2) |
As managing member of BSF Holdings with sole voting and dispositive power over the shares of common stock owned by BSF Holdings, Mr. Massey is deemed to be the beneficial owner of all shares of common stock owned by BSF Holdings, for purposes of SEC rules. |
|
(3) |
Includes 39,381 shares issuable upon exercise of warrants within 60 days of March 1, 2018. |
|
(4) |
Based upon 37,811,704 shares of common stock of the Company issued and outstanding as of March 1, 2018 and 39,381 shares of common stock issuable upon exercise of warrants within 60 days of March 1, 2018. |
|
(5) |
Includes 11,110 shares which may be acquired pursuant to the exercise of stock options exercisable within 60 days of March 1, 2018. |
|
(6) |
Includes 10,461 shares held by Mr. Cavin’s spouse. |
|
(7) |
Includes 430 shares held jointly with Mr. Conner’s child and 17,792 shares held jointly by Mr. Conner and his spouse as co-trustees for a trust for their benefit. |
|
(8) |
Includes 16,666 shares which may be acquired pursuant to the exercise of stock options exercisable within 60 days of March 1, 2018, 17,522 shares held jointly with Ms. Billings’ spouse, 7,659 shares held individually by Ms. Billings’ spouse, and 30,951 shares held in Ms. Billings’ account in the Company’s 401(k) Plan. |
|
(9) |
Includes 16,666 shares which may be acquired pursuant to the exercise of stock options exercisable within 60 days of March 1, 2018 and 1,418 shares held in Mr. Lowe’s account in the Bear State 401(k) Plan. |
|
(10) |
Includes 5,555 shares which may be acquired pursuant to the exercise of stock options exercisable within 60 days of March 1, 2018 and 2,003 shares held in Ms. Loftin’s account in the Company’s 401(k) Plan. |
|
(11) |
Includes 6,111 shares which may be acquired pursuant to the exercise of stock options exercisable within 60 days of March 1, 2018 and 3 shares held in Mr. Rawls’ account in the Company’s 401(k) Plan. |
|
(12) |
Includes 40,016 shares allocated to the accounts of executive officers as a group in the Company’s 401(k) Plan, 64,996 shares which may be acquired pursuant to the exercise of stock options exercisable within 60 days of March 1, 2018, and warrants to purchase 78,762 shares of common stock exercisable within 60 days of March 1, 2018. |
|
(13) |
Based upon 37,811,704 shares of common stock of the Company issued and outstanding as of March 1, 2018, 64,996 shares which may be acquired pursuant to the exercise of stock options exercisable within 60 days March 1, 2018, and warrants to purchase 78,762 shares of common stock exercisable within 60 days of March 1, 2018. |
Equity-Based Compensation Plans
The following table contains information regarding shares of our common stock that may be issued upon the exercise of stock awards under our existing equity compensation plans as of December 31, 2017:
|
Number of securities to be issued upon exercise of outstanding options, warrants and rights |
Weighted average exercise price of outstanding options, warrants and rights |
Number of securities remaining available for future issuance |
||||||||||
|
Equity Compensation Plans Approved by Stockholders |
325,870 | (1) | $ | 6.58 | 1,461,488 | |||||||
|
Equity Compensation Plans Not Approved by Stockholders |
— | — | — | |||||||||
|
Total |
325,870 | $ | 6.58 | 1,461,488 | ||||||||
|
(1) |
As of December 31, 2017, there were 105,345 shares of our common stock issuable upon the exercise of options granted under the 2011 Incentive Plan. The weighted average exercise price of those outstanding options was $6.58. At December 31, 2017, there were 220,525 shares of our common stock issuable upon vesting of restricted stock units. |
Item 13. Certain Relationships and Related Transactions, and Director Independence.
Director Independence
After reviewing all relevant relationships and considering NASDAQ’s requirements for independence, the Board concluded that Messrs. Cavin, Changose, Clark, Conner, Ford, Gearhart, Ghirardelli, Hill, Horton and Vaughan are independent under applicable listing rules. No director or executive officer of the Company is related to any other director or executive officer of the Company by blood, marriage or adoption. In making its independence determination, the Board considered all relevant transactions, relationships, or arrangements disclosed below under the section titled “Transactions with Certain Related Persons” and the following:
|
● |
Each of Messrs. Cavin, Changose, Clark and Ford is associated with BSF Holdings. Mr. Changose serves as Chief Operating Officer of BSF Holdings and each of Messrs. Cavin, Changose and Ford is an investor in BSF Holdings. Mr. Clark and Mr. Ford originally joined the Board pursuant to an agreement between the Company and BSF Holdings. The Board does not believe these relationships affect the independence of Messrs. Cavin, Changose, Clark or Ford. |
Transactions with Certain Related Persons
The audit committee of the Board, pursuant to its written charter, is charged with reviewing and approving all related-party transactions, defined as those required to be disclosed under Item 404(a) of Regulation S-K (a “Related Party Transaction”). From time to time, the full Board, in lieu of the audit committee, will review and approve Related Party Transactions.
Except as described below concerning loans made to insiders, proposed Related Party Transactions are initially referred to an executive officer for consideration to determine whether the Related Party Transaction should be permitted. If such executive officer determines that the transaction is permissible, he or she then refers the matter to the audit committee or the full Board for final approval. The audit committee, or the full Board, as applicable, then reviews the matter and makes a determination as to whether the Related Party Transaction is commercially reasonable and in, or not inconsistent with, the best interests of the Company.
The Bank’s Lending Policy requires that all loans made by the Bank to any of the directors or executive officers of the Company or the Bank, or their immediate families or related business interests, be made in the ordinary course of business, on substantially the same terms, including interest rates and collateral, as those prevailing at the time for comparable transactions with other persons. In addition, such loans may not involve more than the normal risk of collectability or present other unfavorable features. Pursuant to the Bank’s Lending Policy, loans made to any of the directors or executive officers of the Company or the Bank, or their immediate families or related business interests must be approved in the same manner as are loans for all employees, which require an initial approval by the Regional President in addition to any other committee approvals required for a loan of that type and size. All such loans outstanding have been made by the Bank in accordance with the aforementioned policy.
Other than loans made pursuant to the above-described Lending Policy, there were no transactions occurring since the beginning of fiscal year 2017, or that are currently proposed, (i) in which the Company was or is to be a participant, (ii) where the amount involved exceeds $120,000, and (iii) in which the Company’s executive officers, directors, nominees, principal shareholders and other related parties had a direct or indirect material interest.
Item 14. Principal Accounting Fees and Services.
The following table sets forth the aggregate fees billed to us by BKD LLP for professional services rendered in connection with the audit of the Company’s consolidated financial statements for 2017 and 2016.
|
BKD, LLP |
||||||||
|
2017 |
2016 |
|||||||
|
Audit fees (1) |
$ | 340,000 | $ | 324,000 | ||||
|
Audit-related fees (2) |
7,110 | 15,547 | ||||||
|
Tax Fees |
— |
— |
||||||
|
All other fees |
— | — | ||||||
|
Total |
$ | 347,110 | $ | 339,547 | ||||
|
(1) |
Audit fees consist of fees incurred in connection with the audit of our annual financial statements, the review of the interim financial statements included in our quarterly reports filed with the SEC and the audit of our internal controls over financial reporting. |
|
(2) |
Audit-related fees in 2017 and 2016 were primarily related to the review of SEC filings and consultations. |
In accordance with the audit committee’s charter and pre-approval policies, each new engagement of an independent registered public accounting firm is approved in advance by the audit committee in accordance with SEC rules. The audit committee selects the Company’s independent registered public accounting firm and separately pre-approves all audit services to be provided by it to the Company. The audit committee also reviews and separately pre-approves all audit-related, tax and all other services rendered by our independent registered public accounting firm in accordance with its charter and pre-approval policies. In its review of these services and related fees and terms, the audit committee considers, among other things, the possible effect of the performance of such services on the independence of our independent registered public accounting firm.
During 2017, with respect to $7,110 of fees included above under the description “Audit-related fees,” such amount representing approximately 2.1% of the total fees, the Company relied on the de minimis exception provided in Rule 2-01(c)(7)(i)(C) of Regulation S-X promulgated by the SEC.
Item 15. Exhibits, Financial Statement Schedules.
(a) Documents Filed as Part of this Report
(1) Consolidated financial statements of the Company have been included in Part II, Item 8 of this Annual Report on Form 10-K.
(2) All schedules for which provision is made in the applicable accounting regulations of the SEC are omitted because of the absence of conditions under which they are required or because the required information is included in the consolidated financial statements of the Company and related notes thereto.
(3) See Item 15(b) of this Annual Report on Form 10-K.
(b) Exhibit Index.
|
2.1 |
|
2.2 |
|
2.3 |
|
2.4 |
|
3.1 |
||
| 3.2 | Amended and Restated Bylaws of the Company (incorporated herein by reference to Exhibit 3.1 to the Company's Current Report on Form 8-K filed with the SEC on June 19, 2014). |
|
10.1 |
|
10.2 |
|
10.3† |
|
10.4† |
|
10.5† |
|
10.6† |
|
10.7† |
|
10.8† |
|
10.9 |
|
10.10 |
|
10.11 |
|
10.12† |
|
10.13† |
|
10.14† |
|
10.15† |
|
10.16† |
|
10.17† |
|
10.18† |
|
10.19† |
|
10.20† |
|
10.21† |
|
21.0* |
|
23.0* |
|
31.1* |
|
31.2* |
|
32.1** |
||
| 32.2** | Section 906 Certification of the PFO | |
| 101.INS | XBRL Instance Document | |
| 101.SCH | XBRL Taxonomy Extension Schema | |
| 101.CAL | XBRL Taxonomy Extension Calculation Linkbase | |
| 101.LAB | XBRL Taxonomy Extension Label Linkbase | |
| 101.PRE | XBRL Taxonomy Extension Presentation Linkbase | |
| 101.DEF | XBRL Taxonomy Extension Definition Linkbase | |
† Management contract or compensatory plan or arrangement
* Filed herewith
** Furnished herewith
None.
SIGNATURES
Pursuant to the requirements of Section 13 or 15(d) of the Securities Exchange Act of 1934, the Registrant has duly caused this report to be signed on its behalf by the undersigned, thereunto duly authorized.
| BEAR STATE FINANCIAL, INC. | |
|
By: |
/s/ Matt Machen |
|
Matt Machen |
|
|
President and Chief Executive Officer |
|
|
March 16, 2018 |
|
Pursuant to the requirements of the Securities Exchange Act of 1934, this report has been signed below by the following persons on behalf of the Registrant and in the capacities and on the dates indicated.
|
/s/ Matt Machen |
March 16, 2018 |
|
|
Matt Machen President, Chief Executive Officer and Director |
|
|
|
/s/ Sherri Billings |
March 16, 2018 |
|
|
Sherri Billings Senior Executive Vice President and Chief Financial Officer |
|
|
|
/s/ Jeri Pritchett |
March 16, 2018 |
|
|
Jeri Pritchett Executive Vice President and Chief Accounting Officer |
|
|
|
/s/ Richard N Massey |
March 16, 2018 |
|
|
Richard N. Massey Chairman |
|
|
|
/s/ W. Dabbs Cavin |
March 16, 2018 |
|
|
W. Dabbs Cavin Vice Chairman |
|
|
|
/s/ William Changose |
March 16, 2018 |
|
|
William Changose Director |
|
|
|
/s/ K. Aaron Clark |
March 16, 2018 |
|
|
K. Aaron Clark Director |
|
|
|
/s/ Frank Conner |
March 16, 2018 |
|
|
Frank Conner Director |
|
|
|
/s/ Brock Gearhart |
March 16, 2018 |
|
|
Brock Gearhart Director |
||
|
/s/ John J. Ghirardelli |
March 16, 2018 |
|
|
John J. Ghirardelli Director |
|
|
|
/s/ O. Fitzgerald Hill |
March 16, 2018 |
|
|
O. Fitzgerald Hill Director |
|
|
|
/s/ Daniel C. Horton |
March 16, 2018 |
|
|
Daniel C. Horton Director |
|
|
|
/s/ Ian Vaughan |
March 16, 2018 |
|
|
Ian Vaughan Director |
|
125