Attached files
| file | filename |
|---|---|
| 8-K - FORM 8-K - BAY BANKS OF VIRGINIA INC | v449022_8k.htm |
Exhibit 99.1
Exhibit 99.1

FIG Partners Bank CEO Forum
September 19-20, 2016
Ticker: BAYK
www.baybanks.com
Forward-Looking Statements
Certain statements in this report may constitute “forward-looking statements” within the meaning of the Private Securities Litigation Reform Act of 1995. Forward-looking statements are statements that include projections, predictions, expectations, or beliefs about future events or results or otherwise and are not statements of historical fact. Such statements are often characterized by the use of qualified words (and their derivatives) such as “expect,” “believe,” “estimate,” “plan,” “project,” “anticipate,” “intend,” “will,” or words of similar meaning or other statements concerning opinions or judgment of the Company and its management about future events. Although the Company believes that its expectations with respect to forward-looking statements are based upon reasonable assumptions within the bounds of its existing knowledge of its business and operations, there can be no assurance that actual results, performance, or achievements of the Company will not differ materially from any future results, performance, or achievements expressed or implied by such forward-looking statements. Actual future results and trends may differ materially from historical results or those anticipated depending on a variety of factors, including, but not limited to, the effects of and changes in: general economic and bank industry conditions, the interest rate environment, legislative and regulatory requirements, competitive pressures, new products and delivery systems, inflation, changes in the stock and bond markets, accounting standards or interpretations of existing standards, mergers and acquisitions, technology, and consumer spending and savings habits. More information is available on the Company’s website, http://www.baybanks.com and on the Securities and Exchange Commission’s website, www.sec.gov.
The information on the Company’s website is not a part of this presentation. The Company does not intend or assume any obligation to update or revise any forward-looking statements that may be made from time to time by or on behalf of the Company.

Corporate Profile
ÜBay Banks of Virginia, Inc. is the bank holding company for Bank of Lancaster, established in 1930, and Bay Trust Company.
ÜSince a capital raise in December of 2012, assets have grown by $134 million or 40%, to $468.3 million, we have expanded into a neighboring high growth market and significantly improved the Company’s profitability.
ÜIn 2014, a strategic decision was made by management and the Board to expand outside of the Northern Neck region into Metro Richmond.
§At the end of 1Q’15, there were three fully operating branches in the Richmond Market
§Total Richmond deposits are $73.7 million, 20% of the bank’s total deposits.
§Total Richmond loans are $51.1 million, 15% of the bank’s total loans.
§The Richmond franchise is making a positive contribution to 2016 earnings. Bank of Lancaster serves businesses, professionals and consumers with a wide variety of financial services, including retail and commercial banking, investment services and mortgage banking. Bay Trust Company provides management services for personal and corporate trusts, including estate planning, estate settlement and trust administration.
All data as of 6/30/16
Franchise Footprint
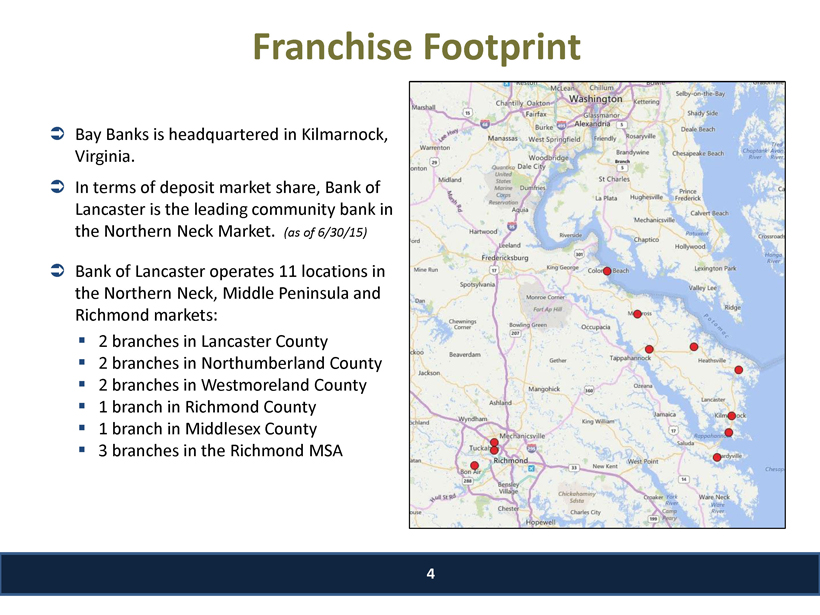
ÜBay Banks is headquartered in Kilmarnock, Virginia.
ÜIn terms of deposit market share, Bank of Lancaster is the leading community bank in the Northern Neck Market. (as of 6/30/15)
ÜBank of Lancaster operates 11 locations in the Northern Neck, Middle Peninsula and Richmond markets:
§2 branches in Lancaster County
§2 branches in Northumberland County
§2 branches in Westmoreland County
§1 branch in Richmond County
§1 branch in Middlesex County
§3 branches in the Richmond MSA

Growth Strategy
5
ÜDIVERSIFICATION into a growth market
ÜOpened Richmond LPO April 2014
ÜOpened first Richmond retail branch November 2014
ÜOpened second Richmond retail branch March 2015
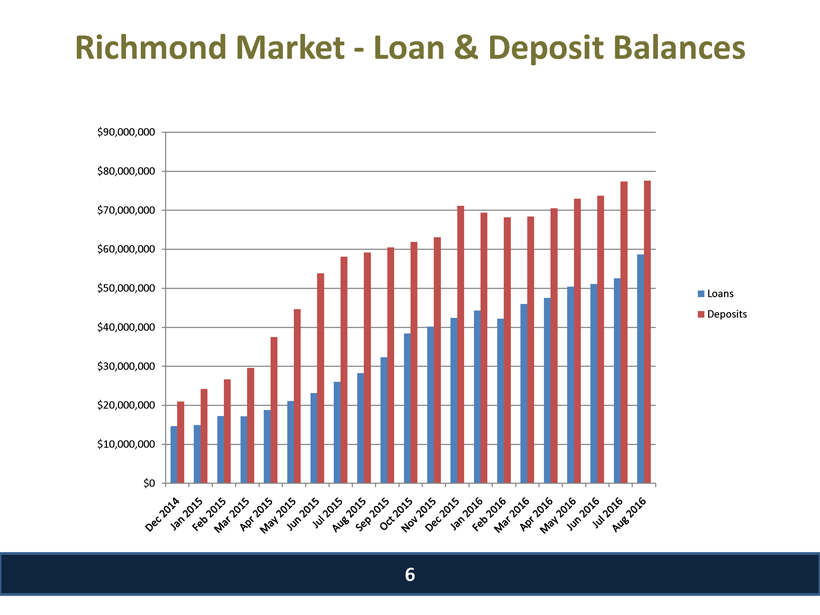
Richmond Market - Loan & Deposit Balances
$90,000,000 $80,000,000 $70,000,000 $60,000,000 $50,000,000 $40,000,000 $30,000,000 $20,000,000 $10,000,000 $0 Loans Deposits Dec 2014 Jan 2015 Feb 2015 Mar 2015 Apr 2015 May 2015 Jun2015 Jul 2015 Aug 2015 Sep 2015 Oct 2015 Nov 2015 Dec 2015 Jan 2016 Feb 2016 Mar 2016 Apr 2016 May 2016 Jun 2016 Jul 2016 Aug 2016

Richmond Market - Income Statement Elements
(pre-tax, pre-provision)
-$150 $200 $150 $100 $50 $0 -$100 -$50
(42) (47) (39) (43) (42) (29) (45) (40) (53) (72) (113) (89) (87) (71) (61) (37) (40) (21) (15) (22) 4 2 16 (7) 10 20 5 9 12 21 39 66 57 60 65 67 74 78 87 95 102 130 138 145 151 140 148 150 161 166 172 183 1 1 1 1 7 22 27 26 31 36 46 52 61 63 61 65 64 69 67 62 63 63 67 66 69 68
Net Loss/Income Interest income Interest expense Jul 2014 Aug 2014 Sep 2014 Oct 2014 Nov 2014 Dec 2014 Jan 2015 Feb 2015 Mar 2015 Apr 2015 May 2015 Jun2015 Jul 2015 Aug 2015 Sep 2015 Oct 2015 Nov 2015 Dec 2015 Jan 2016 Feb 2016 Mar 2016 Apr 2016 May 2016 Jun 2016 Jul 2016 Aug 2016

Bay Banks Financial Highlights
| ($000's) except per share data | 12/31/11 | 12/31/12 | 12/31/13 | 12/31/14 | 12/31/15 | 6/30/16 | |
| Balance Sheet | |||||||
| Total Assets | $315,212 | $334,798 | $331,135 | $390,486 | $456,296 | $468,339 | |
| Gross Loans | $236,690 | $239,238 | $250,837 | $298,447 | $347,546 | $351,302 | |
| Deposits | $265,132 | $275,175 | $268,347 | $307,485 | $359,858 | $379,029 | |
| Loans/Deposits | 89.14% | 86.94% | 93.50% | 97.06% | 97.00% | 93.00% | |
| CapitalCommon Equity | $28,015 | $36,585 | $37,136 | $39,238 | $39,569 | $41,212 | |
| TARP / Preferred | $0 | $0 | $0 | $0 | $0 | $0 | |
| Total Equity/Assets | 8.89% | 10.93% | 11.21% | 10.05% | 8.70% | 8.80% | |
| Tang. Common Equity/Tang. Assets | 8.07% | 10.17% | 10.46% | 9.56% | 8.30% | 8.50% | |
| Leverage Ratio (bank) | 7.97% | 10.93% | 10.93% | 10.37% | 9.11% | 9.08% | |
| Profitability MeasuresNet Interest Margin (FTE) | 3.46% | 3.61% | 3.53% | 3.85% | 3.48% | 3.37% | |
| Earnings Per Share | $0.13 | $0.27 | $0.25 | $0.38 | $0.08 | $0.23 | |
| Efficiency Ratio | 88.96% | 81.72% | 81.27% | 78.70% | 86.40% | 81.00% | |
| ROAA | 0.11% | 0.22% | 0.37% | 0.53% | 0.09% | 0.49% | |
| ROAE | 1.25% | 2.43% | 3.34% | 4.76% | 0.92% | 5.54% | |
| Net Income (YTD)$350 | $698 | $1,222 | $1,830 | $366 | $1,110 | ||
| Assets Per Employee (bank) $2,712 | $3,291 | $3,397 | $3,556 | $3,661 | $3,921 |

Loan Snapshot
ÜTotal balances: $351.3 Million
ÜPortfolio composition:
–C&I: 8.4% or $29.7 million
–CRE: 34.1% or $120.3 million
–Consumer RE: 54.5% or $192 million
–Consumer & Other: 3.0% or $9.3 million
ÜAverage yield on loans: 4.59%
ÜLoan growth since YE of $4.9 million or 1.4%
ÜYTD net interest income of $7.2 million - $600,000 higher than prior year
ÜALLL of $3.54 million:
–1.01% of total loans
–68.9% of non performing loans, excluding TDRs

Loan Growth ($000’s)
17,811 17,509 22,189 26,427 29,694 66,365 68,136 70,515 93,498 109,240 141,300 139,359 158,774 187,328 203,104 $0 $50,000 $100,000 $150,000 $200,000 $250,000 $300,000 $350,000 $400,000 Other Consumer Residential CRE C&I 239,454 232,936 258,093 315,702 351,302 6/31/2012 6/31/2013 6/31/2014 6/31/2015 6/31/2016

Deposit Growth ($000’s)
114,369 102,063 93,626 112,761 127,549 21,803 27,458 28,223 70,625 83,563 47,689 46,395 43,315 41,042 42,804 38,498 40,458 41,865 41,126 40,701 46,081 59,362 62,323 61,906 74,512 0 50,000 100,000 150,000 200,000 250,000 300,000 350,000 400,000 Non-int-brg DDA Int-brg DDA Savings Money Market Time Wholesale 268,441 275,737 270,596 334,433 379,385 6/31/2012 6/31/2013 6/31/2014 6/31/2015 6/31/2016

Asset Quality
| 2009 | 2010 | 2011 | 2012 | 2013 | 2014 | 2015 | 1Q2016 | 2Q2016 | |||||||||||||||||||||||||||
| Nonperforming Assets ($000) | |||||||||||||||||||||||||||||||||||
| Nonaccrual Loans | $ | 5,257 | $ | 5,574 | $ | 5,417 | $ | 5,730 | $ | 2,754 | $ | 1,955 | $ | 6,431 | $ | 5,123 | $5,147 | ||||||||||||||||||
| Restructured Loans | $ | - | $ | 178 | $ | 452 | $ | 1,622 | $ | 1,837 | $ | 1,849 | $ | 1,765 | $ | 1,766 | $2,003 | ||||||||||||||||||
| OREO & Repossessed Assets | $ | 2,193 | $ | 4,086 | $ | 2,280 | $ | 3,152 | $ | 3,964 | $ | 2,791 | $ | 1,870 | $ | 2,694 | $2,641 | ||||||||||||||||||
| Total Nonperforming Assets | $ | 7,450 | $ | 9,838 | $ | 8,149 | $ | 10,504 | $ | 8,555 | $ | 6,595 | $ | 10,066 | $ | 9,582 | $9,791 | ||||||||||||||||||
| SC Student Loan Corporation Bond | $ | - | $ | - | $ | - | $ | - | $ | 1,032 | $ | - | $ | - | $ | - | $- | ||||||||||||||||||
| Classified Assets | $ | 19,886 | $ | 16,537 | $ | 15,208 | $ | 14,306 | $ | 11,667 | $ | 9,003 | $ | 11,017 | $ | 13,192 | $12,666 | ||||||||||||||||||
| Tier 1 + LLR | $ | 28,397 | $ | 28,319 | $ | 28,735 | $ | 38,123 | $ | 40,132 | $ | 43,313 | $ | 45,824 | $ | 46,000 | $45,425 | ||||||||||||||||||
| % of (Tier 1 + LLR) | 70% | 58% | 53% | 38% | 29% | 21% | 24% | 29% | 28% | ||||||||||||||||||||||||||
| NPA's | $7,450 | $9,660 | $7,697 | $8,882 | $6,718 | $4,746 | $8,301 | $7,817 | $7,788 | ||||||||||||||||||||||||||
| total Assets | $330,272 | $327,086 | $315,414 | $334,798 | $331,135 | $390,486 | $449,692 | $442,022 | $462,610 | ||||||||||||||||||||||||||
| % of total Assets | 2.26% | 2.95% | 2.44% | 2.65% | 2.03% | 1.22% | 1.85% | 1.77% | 1.68% | ||||||||||||||||||||||||||
| Loans 90+ Days Past Due | $ | 153 | $ | 202 | $ | 60 | $ | 126 | $ | - | $ | 21 | $ | 11 | $ | 0 | $265 | ||||||||||||||||||
| Loans 30-89 Days Past Due | $ | 2,918 | $ | 3,843 | $ | 956 | $ | 1,155 | $ | 1,009 | $ | 1,599 | $ | 2,217 | $ | 2,651 | $1,534 | ||||||||||||||||||

Non-Performing Assets/Total Assets 13
3.50%3.00%2.50%2.00%1.50%1.00%0.50%0.00%
2009 2010 2011 2012 2013 2014 2015 1Q2016 2Q2016
2.262.95%2.44%2.65%2.03%1.22%1.85%1.77% 1.68%
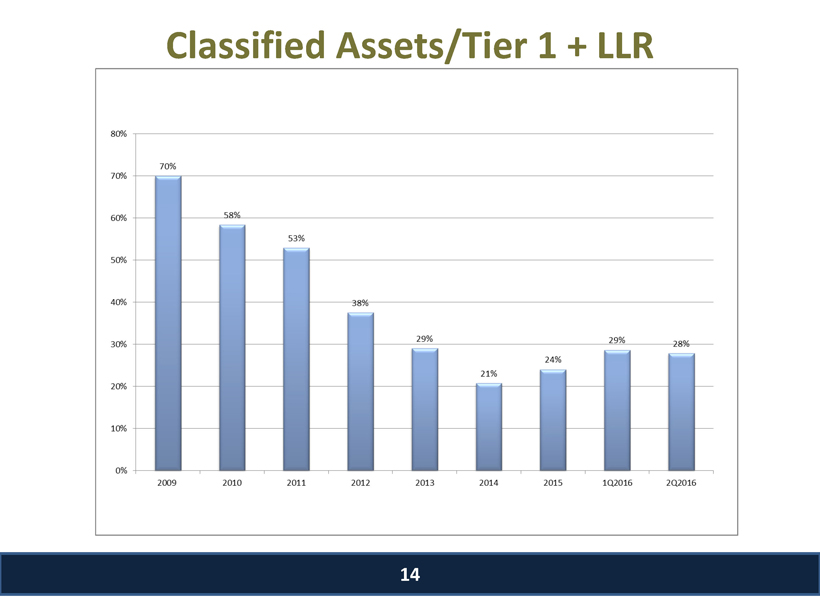
Classified Assets/Tier 1 + LLR
80% 70% 60% 50% 40% 30% 20% 10% 0% 2009 2010 2011 2012 2013 2014 2015 1Q2016 21Q2016 70% 58% 53% 38% 29% 21% 24% 29% 28%

Interest Rate Sensitivity
Base Simulation as of 6/30/2015 Base Simulation as of 6/30/2016
Year 1 Year 2 Year 3 Year 4 Year 5 Year 1 Year 2 Year 3 Year 4 Year 5
| Nil SUMMARY | Nil SUMMARY | |||||||||||||||
| Down 100BP | Base | Up 200BP | Flat Up 2006P | Up 400BP 24M | Down 100BP | Base | Up 200BP | Flat Up 200BP | Up 400BP 24M | |||||||
| Year-1 Nil | 12,611 | 12.788 | 12,450 | 12.397 | 12.466 | Year-1 Nil | 13.956 | 14.216 | 14,151 | 14.149 | 14.174 | |||||
| Year-2 Nil | 11,571 | 12,393 | 12,255 | 12.019 | 12.017 | Year-2 Nil | 12.855 | 13.895 | 14,384 | 14.355 | 14.089 | |||||
| Year-3 Nil | 10,788 | 12.200 | 12,677 | 12.094 | 12.714 | Year-3 Nil | 12.258 | 13,844 | 14,769 | 14.835 | 14.454 | |||||
| Year-4 Nil | 10.219 | 12,079 | 13,240 | 12.275 | 13.642 | Year-4 Nil | 11,811 | 13.822 | 15,284 | 15.448 | 15.161 | |||||
| Year-5 Nil | 9.877 | 12.071 | 13,764 | 12.526 | 14,317 | Year-5 Nil | 11,549 | 13,876 | 15,631 | 16.012 | 15,531 | |||||
| CHANGE / DIFFERENCE IN RESULTS | |||||||||||||||
| Down 100BP | Base | Up 200BP | Flat Up 200BP | Up 400BP 24M | |||||||||||
| Year-1 Nil | 1.346 | 1,428 | 1.700 | 1.752 | 1.708 | ||||||||||
| Year-2 Nil | 1.283 | 1.502 | 2.128 | 2.336 | 2.072 | ||||||||||
| Year-3 Nil | 1.470 | 1.644 | 2.091 | 2.740 | 1.741 | ||||||||||
| Year-4 Nil | 1.592 | 1.744 | 2.044 | 3.173 | 1,519 | ||||||||||
| Year-6 Nil | 1.672 | 1.805 | 1,867 | 3,486 | 1.214 | ||||||||||

What’s Next?
ÜContinued fill-in and expansion in the Richmond MSA
ÜContinued focus on earnings and improved ROA
ÜEvaluate strategic alternatives which are accretive to EPS and book value
ABOVE ALL,
we will strive to generate earnings
sufficient to support a stock price equivalent to
tangible book value per share.

Executive Management
Randal R. Greene
Randal “Randy” Greene is president and chief executive officer of Bay Banks of Virginia (the “Company”) and Bank of Lancaster (the “Bank”), the Company’s wholly-owned, community bank subsidiary. He is a member of both the Bay Banks of Virginia Board of Directors and the Bank of Lancaster Board of Directors, and serves as vice chairman of the board for Bay Trust Company, a wholly-owned subsidiary of the Company.
Greene joined the Company and Bank in the fall 2011, and since that time has led the Company’s efforts in developing and initiating a turnaround strategy. The strategy, implemented in 2012, included 12 revenue-enhancing and cost-cutting initiatives exceeding $2.5 million in value for the Company. Asset quality improvements, a branch consolidation and a workforce reduction improved the Company’s earnings, allowing it to complete a $9.4 million private placement of its common stock—a significant achievement in light of a continued challenging economy and difficult banking industry environment.
In 2014, Greene lead an initiative to expand into the Richmond, Virginia and by the first quarter of 2015, there were three fully operating branches in that area. In May of 2015, the Company completed a $7 million subordinate debt offering to help fund this growth. The Richmond franchise achieved break even in the first quarter of 2016 and by the second quarter, was making a positive contribution to earnings.
Greene received his bachelor of Business Administration from East Tennessee State University, Johnson City, Tenn., in 1982. He began his banking career in 1984 and brings nearly thirty years of community banking and management experience to his role with the Company. Prior to joining the Company, he was a regional president of State of Franklin Bank, a division of Jefferson Federal Bank in Johnson City, Tennessee. From 1996 to 2008, he was president, chief executive officer, director and founder of State of Franklin Savings Bank and chairman of its executive committee. He was president of State of Franklin Real Estate from 1997 to 2008, growing the company to 100 agents and to number 2 in market share. In addition, he served as president of State of Franklin Leasing Company.
Greene serves on the Board of Directors of the Virginia Community Banker’s Association. Active in his community, Greene has a lifetime of involvement with Boy Scouts of America and has served as president of the Sequoyah Council, which serves 17 counties in East Tennessee and Southwest Virginia. In honor of his service to the Council, Greene received the Silver Beaver Award. He has also served as chairman of the Silver Eagle Dinner and currently serves on the Board of the Heart of Virginia BSA Council. In 2015, Greene received the Lifetime Achievement Award from the College of Business and Technology of East Tennessee State University.

Douglas F. Jenkins, Jr.
Doug is Executive Vice President of Bay Banks and Executive Vice President/Chief Banking Officer of Bank of Lancaster. As second in command, his responsibilities include oversight of Commercial and Residential Lending, Retail Delivery, Operations and Credit Administration.
Doug joined the Bank in April 2006 as Vice President/Business Development Officer. In May 2008, he was promoted to Senior Lending Officer, responsible for supervising all lending areas of the Bank – residential, consumer and commercial. In December 2009, Doug was promoted to Senior Vice President. He assumed responsibility for Retail Delivery in June 2011 and in December 2011 was elected by the Bank’s Board to the position of Executive Vice President. In September 2015, Doug was named Chief Banking Officer.
Doug began his banking career in 1985, as a Financial Accountant with United Virginia Bank, which subsequently became Crestar Bank. In 1987, he joined Crestar’s Investment Banking Division as an Assistant Vice President, providing analytical support and investment counseling to Crestar’s correspondent banks. Later, he joined Crestar’s internal Mergers and Acquisitions Department, where he was promoted to Vice President and worked on a number of transactions for Crestar. In 1994, Doug joined Crestar’s Correspondent Banking Division, where he was responsible for managing relationships of Crestar’s correspondent banks. Crestar was acquired by SunTrust Bank in 1998, at which time the Correspondent Banking Department was renamed the Financial Institutions Group and became a part of SunTrust’s Corporate and Investment Banking Group. Doug continued with the Financial Institutions Group of SunTrust until April of 2006.
He received his BS in Finance from the University of Virginia’s McIntire School of Commerce in May of 1982. Doug recently completed a term serving as a Director of the Virginia Association of Community Banks

Deborah M. Evans
Deb is the Chief Financial Officer and Treasurer for Bay Banks of Virginia, Inc. She also holds the position of Chief Financial Officer for Bank of Lancaster and Treasurer for Bay Trust Company. Deb joined the Company in September 1999 as the Bank’s Regulatory Accountant and by 2005, had assumed responsibility as Chief Financial Officer for the Bank and Treasurer and Principal Financial and Accounting Officer for Bay Banks. In 2011, she became Chief Financial Officer for Bay Banks.
She is responsible for financial reporting, accounting, asset liability management, investments, compliance, planning and controls. She develops and oversees related policies, programs and procedures and provides strategic counsel to the President and CEO and Boards of Directors regarding financial performance, external reporting to banking regulators and to investors and the public via the Securities and Exchange Commission. Prior to joining the Company, Deb’s career path included manufacturing engineering for the Chevrolet V8 Engine Plant in Flint, Michigan, financial analysis for IBM then Lexmark in Lexington, Kentucky, and supplier relations and cost accounting for Rodel, Inc., in Newark, Delaware.
Deb holds a Bachelor’s of Science degree in Mechanical Engineering from General Motors Institute, now Kettering University, and a Masters in Business Administration from Yale University’s School of Organization and Management. She holds a certificate in Bank Management from the Graduate School of Banking at the University of Colorado and was part of the inaugural class of the Virginia Bankers Leadership Institute program. She is a member of the Virginia Bankers Association’s CFO Committee. She is also a member of the American Bankers Association’s Accounting Administrative Committee, which advocates for banking industry accounting practices to the U.S. Congress, banking regulators, the Public Company Accounting Oversight Board, and the Financial Accounting Standards Board. She is also a member of the American Bankers’ Association CFO Conference Advisory Committee.