Attached files
| file | filename |
|---|---|
| 8-K - FORM 8-K - HOME BANCORP, INC. | v448388_8k.htm |
Exhibit 99.1

September 2016 Raymond James U.S. Bank Conference
Forward Looking Statements Certain comments in this presentation contain certain forward looking statements (as defined in the Securities Exchange Act o f 1 934 and the regulations thereunder ). Forward looking statements are not historical facts but instead represent only the beliefs, expectations or opinions of Ho me Bancorp, Inc. and its management regarding future events, many of which, by their nature, are inherently uncertain. Forward l ook ing statements may be identified by the use of such words as: “believe”, “expect”, “anticipate”, “intend”, “plan”, “estimate”, or words of simil ar meaning, or future or conditional terms such as “will”, “would”, “should”, “could”, “may”, “likely”, “probably”, or “possibly.” Forward looking sta tem ents include, but are not limited to, financial projections and estimates and their underlying assumptions; statements regarding plans, objectives and exp ectations with respect to future operations, products and services; and statements regarding future performance. Such statements are subject to cert ain risks, uncertainties and assumption, many of which are difficult to predict and generally are beyond the control of Home Bancorp, Inc. and its man age ment, that could cause actual results to differ materially from those expressed in, or implied or projected by, forward looking statements. Th e f ollowing factors, among others, could cause actual results to differ materially from the anticipated results or other expectations expressed in the f orw ard looking statements : (1) economic and competitive conditions which could affect the volume of loan originations, deposit flows and real estate values; (2 ) the levels of noninterest income and expense and the amount of loan losses; (3) competitive pressure among depository institutions increasi ng significantly; (4) the low interest rate environment causing reduced interest margins; (5) general economic conditions, either nationally or in the mar kets in which Home Bancorp, Inc. is or will be doing business, being less favorable than expected ; ( 6) political and social unrest, including acts of war or terrorism; (7) we may not fully realize all the benefits we anticipated in connection with our acquisitions of other institutions or our assump tio ns made in connection therewith may prove to be inaccurate; or (8) legislation or changes in regulatory requirements adversely affecting the busine ss of Home Bancorp, Inc. Home Bancorp, Inc. undertakes no obligation to update these forward looking statements to reflect events or circumstances tha t o ccur after the date on which such statements were made. As used in this report, unless the context otherwise requires, the terms “we,” “our,” “us,” or the “Company” refer to Home Ba nco rp, Inc. and the term the “Bank” refers to Home Bank , N.A., a national bank and wholly owned subsidiary of the Company. In addition, unless the context otherwise requires, references to the operations of the Company include the operations of the Bank. For a more detailed description of the factors that may affect Home Bancorp’s operating results or the outcomes described in the se forward - looking statements, we refer you to our filings with the Securities and Exchange Commission, including our annual report on Form 10 - K fo r the year ended December 31, 2015. Home Bancorp assumes no obligation to update the forward - looking statements made during this presentation. For more information, please visit our website www.home24bank.com. Non - GAAP Information This presentation contains financial information determined by methods other than in accordance with generally accepted accou nti ng principles (“GAAP”). The Company's management uses this non - GAAP financial information in its analysis of the Company's performance. In thi s news release, information is included which excludes acquired loans, intangible assets, impact of the gain on the sale of a banking center and the impact of merger - related expenses. Management believes the presentation of this non - GAAP financial information provides useful information that is helpful to a full understanding of the Company’s financial position and core operating results. This non - GAAP financial information should not be viewed as a substitute for financial information determined in accordance with GAAP, nor are they necessarily comparable to non - GAAP financi al information presented by other companies. 2
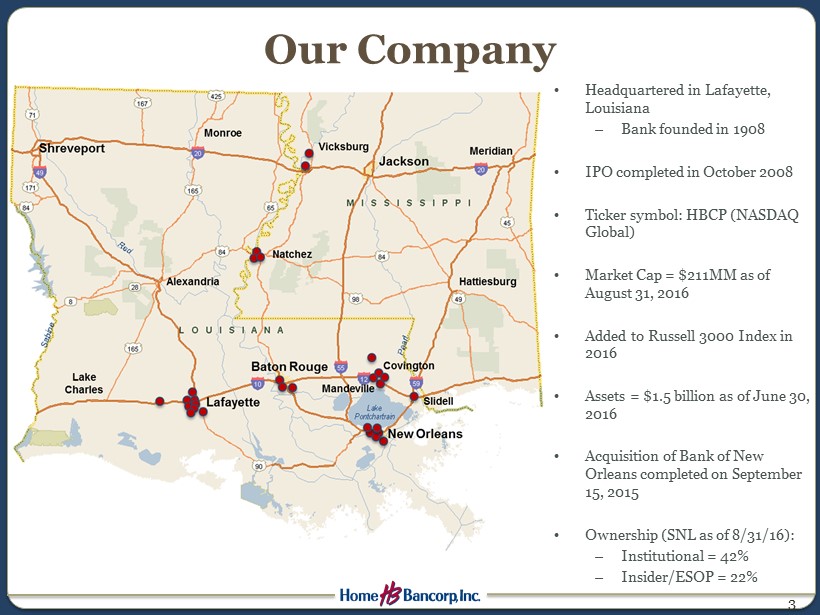
Our Company 3 • Headquartered in Lafayette, Louisiana – Bank founded in 1908 • IPO completed in October 2008 • Ticker symbol: HBCP (NASDAQ Global) • Market Cap = $211MM as of August 31, 2016 • Added to Russell 3000 Index in 2016 • Assets = $ 1.5 billion as of June 30, 2016 • Acquisition of Bank of New Orleans completed on September 15, 2015 • Ownership (SNL as of 8/31/16): – Institutional = 42% – Insider/ESOP = 22%
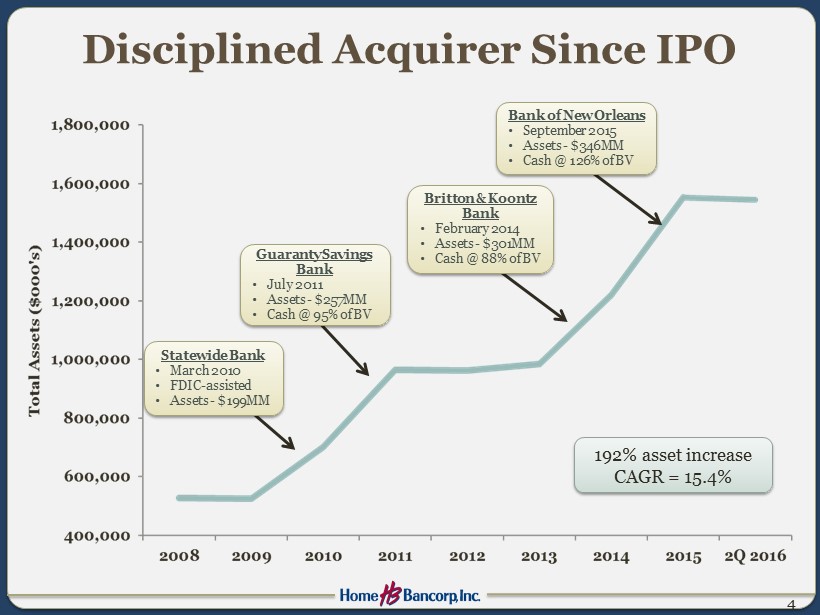
Disciplined Acquirer Since IPO 4 192% asset increase CAGR = 15.4% Statewide Bank • March 2010 • FDIC - a ssisted • Assets - $199MM Britton & Koontz Bank • February 2014 • Assets - $301MM • Cash @ 88% of BV Guaranty Savings Bank • July 2011 • Assets - $257MM • Cash @ 95% of BV Bank of New Orleans • September 2015 • Assets - $346MM • Cash @ 126% of BV
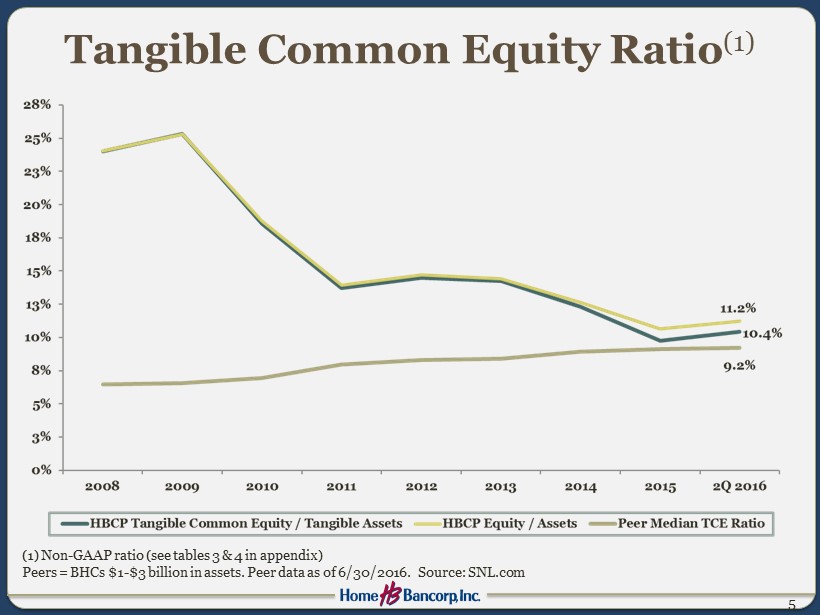
Tangible Common Equity Ratio (1) 5 Peers = BHCs $1 - $3 billion in assets. Peer data as of 6/30/2016. Source: SNL.com (1) Non - GAAP ratio (see tables 3 & 4 in appendix)
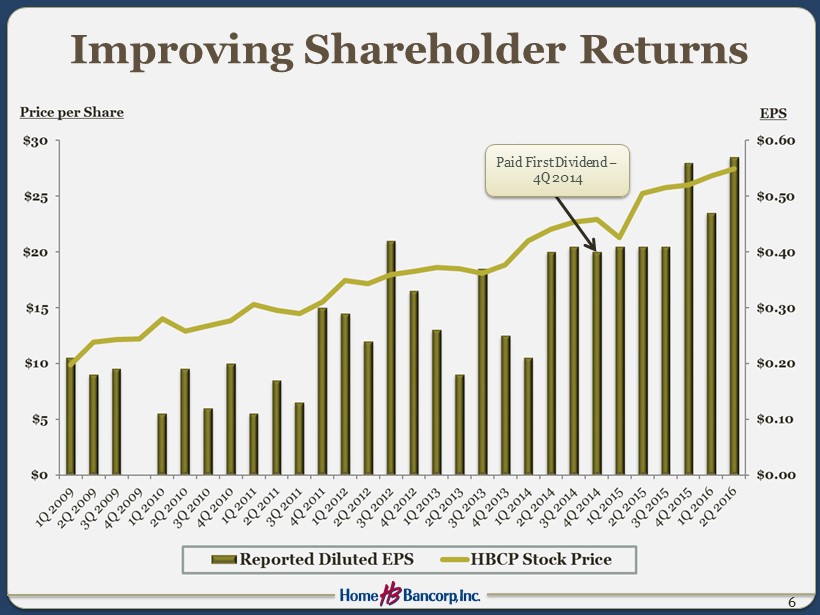
Improving Shareholder Returns 6 Paid First Dividend – 4Q 2014
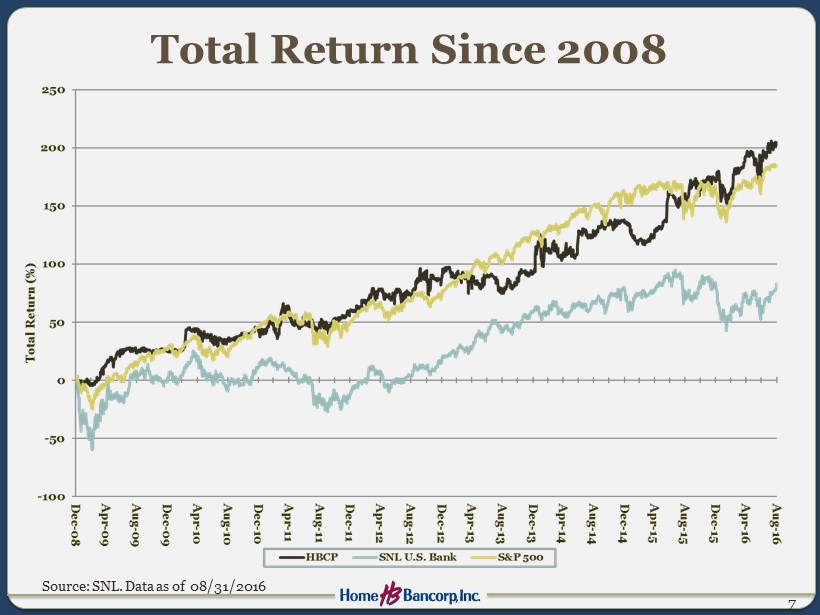
Total Return Since 2008 7 Source: SNL. Data as of 08/31/2016
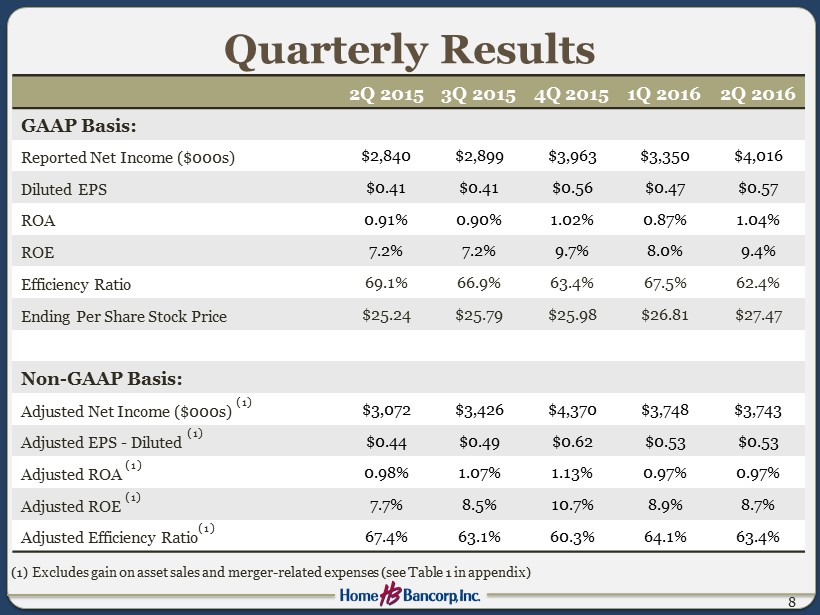
Quarterly Results 8 2Q 2015 3Q 2015 4Q 2015 1Q 2016 2Q 2016 GAAP Basis: Reported Net Income ($000s) $2,840 $2,899 $3,963 $3,350 $4,016 Diluted EPS $0.41 $0.41 $0.56 $0.47 $0.57 ROA 0.91% 0.90% 1.02% 0.87% 1.04% ROE 7.2% 7.2% 9.7% 8.0% 9.4% Efficiency Ratio 69.1% 66.9% 63.4% 67.5% 62.4% Ending Per Share Stock Price $25.24 $25.79 $25.98 $26.81 $27.47 Non - GAAP Basis: Adjusted Net Income ($000s) (1) $3,072 $3,426 $4,370 $3,748 $3,743 Adjusted EPS - Diluted (1) $0.44 $0.49 $0.62 $0.53 $0.53 Adjusted ROA (1) 0.98% 1.07% 1.13% 0.97% 0.97% Adjusted ROE (1) 7.7% 8.5% 10.7% 8.9% 8.7% Adjusted Efficiency Ratio (1) 67.4% 63.1% 60.3% 64.1% 63.4% (1) Excludes gain on asset sales and merger - related expenses (see Table 1 in appendix)
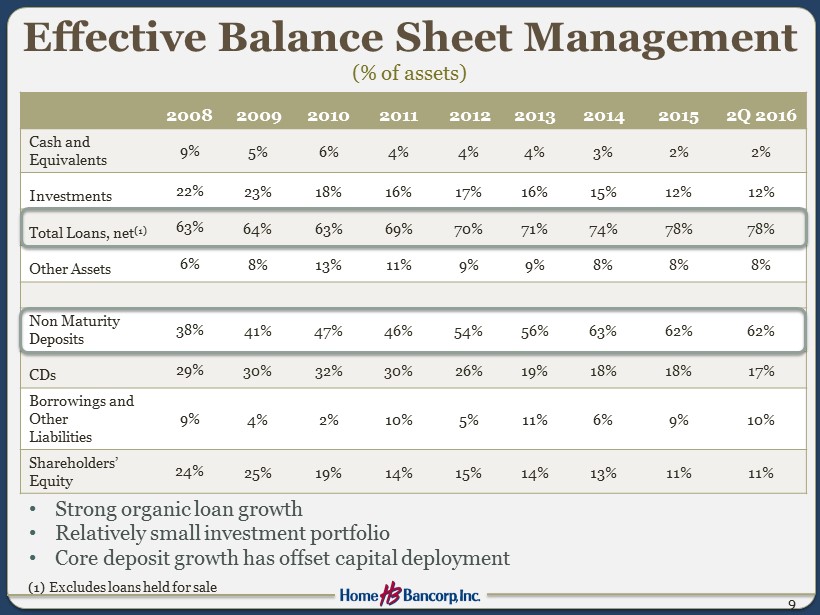
Effective Balance Sheet Management (% of assets) 9 2008 2009 2010 2011 2012 2013 2014 2015 2Q 2016 Cash and Equivalents 9% 5% 6% 4% 4% 4% 3 % 2% 2% Investments 22% 23% 18% 16% 17% 16% 15% 12% 12% Total Loans, net (1) 63% 64% 63% 69% 70% 71% 74% 78% 78% Other Assets 6% 8% 13% 11% 9% 9% 8% 8% 8% Non Maturity Deposits 38% 41% 47% 46% 54% 56% 63% 62% 62% CDs 29% 30% 32% 30% 26% 19% 18% 18% 17% Borrowings and Other Liabilities 9% 4% 2% 10% 5% 11% 6% 9% 10% Shareholders’ Equity 24% 25% 19% 14% 15% 14% 13% 11% 11% • Strong organic loan growth • Relatively small investment portfolio • Core deposit growth has offset capital deployment (1) Excludes loans held for sale
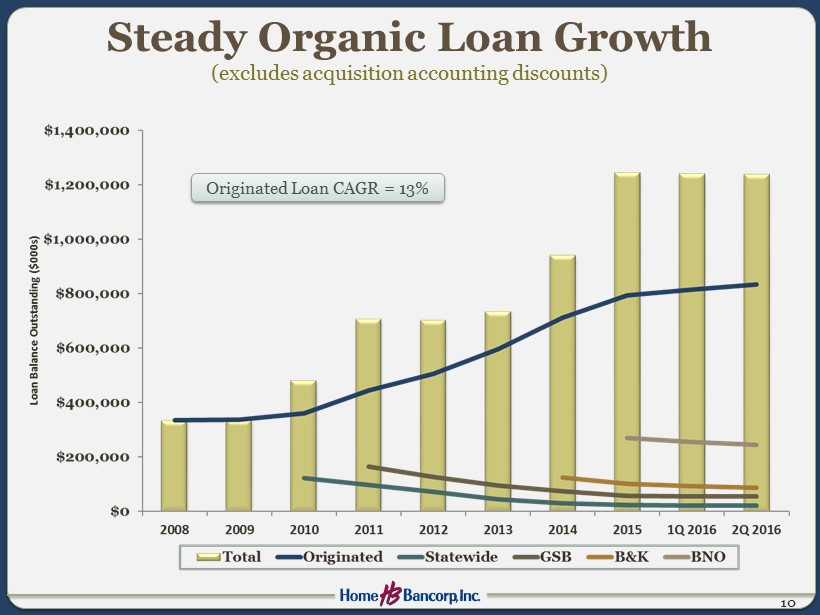
Steady Organic Loan Growth (excludes acquisition accounting discounts ) 10 Originated Loan CAGR = 13%
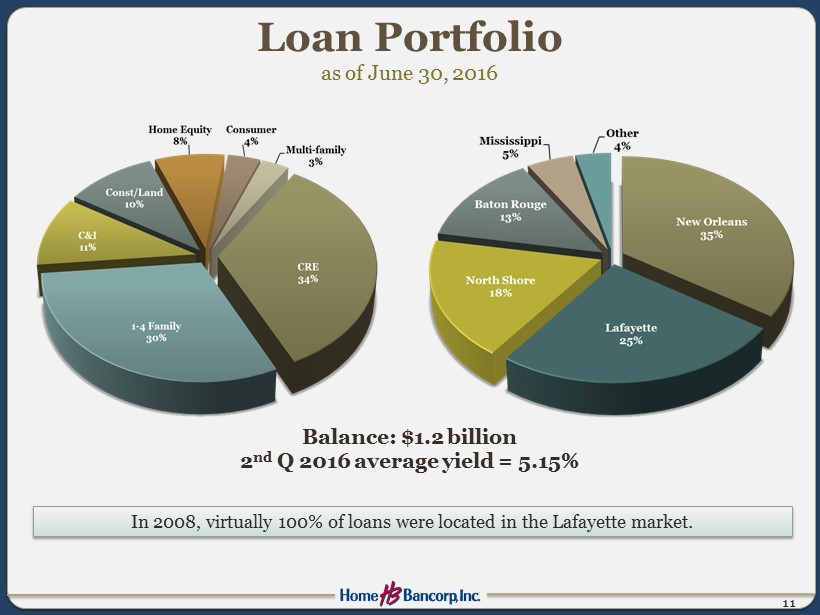
11 In 2008, virtually 100% of loans were located in the Lafayette market. Loan Portfolio as of June 30, 2016 B alance: $1.2 billion 2 nd Q 2016 average yield = 5.15%
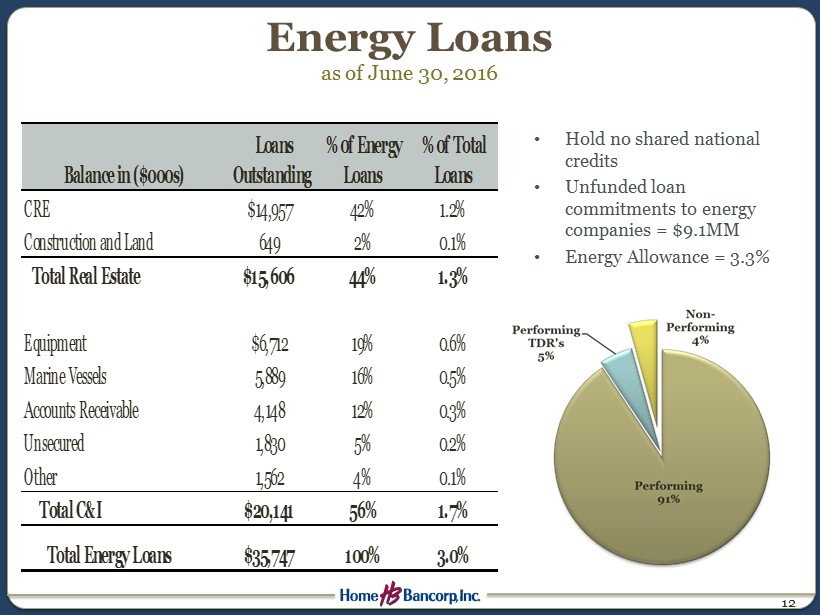
Energy Loans as of June 30, 2016 12 • Hold no shared n ational credits • Unfunded loan commitments to energy companies = $9.1MM • Energy Allowance = 3.3% CRE $14,957 42% 1.2% Construction and Land 649 2% 0.1% Total Real Estate $15,606 44% 1.3% Equipment $6,712 19% 0.6% Marine Vessels 5,889 16% 0.5% Accounts Receivable 4,148 12% 0.3% Unsecured 1,830 5% 0.2% Other 1,562 4% 0.1% Total C&I $20,141 56% 1.7% Total Energy Loans $35,747 100% 3.0% Balance in ($000s) % 0f Energy Loans % 0f Total Loans Loans Outstanding
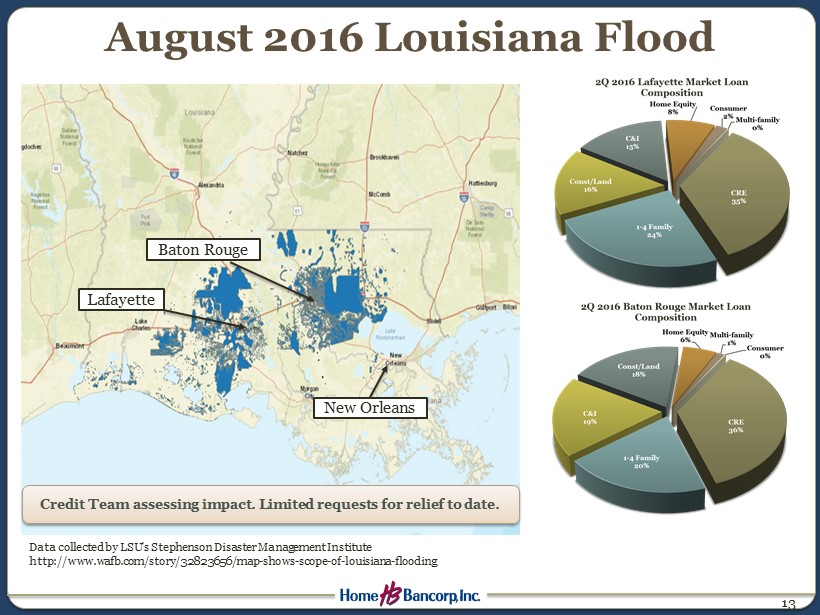
August 2016 Louisiana Flood 13 D ata collected by LSU's Stephenson Disaster Management Institute http://www.wafb.com/story/32823656/map - shows - scope - of - louisiana - flooding Lafayette Baton Rouge New Orleans Credit Team assessing impact. Limited requests for relief to date.
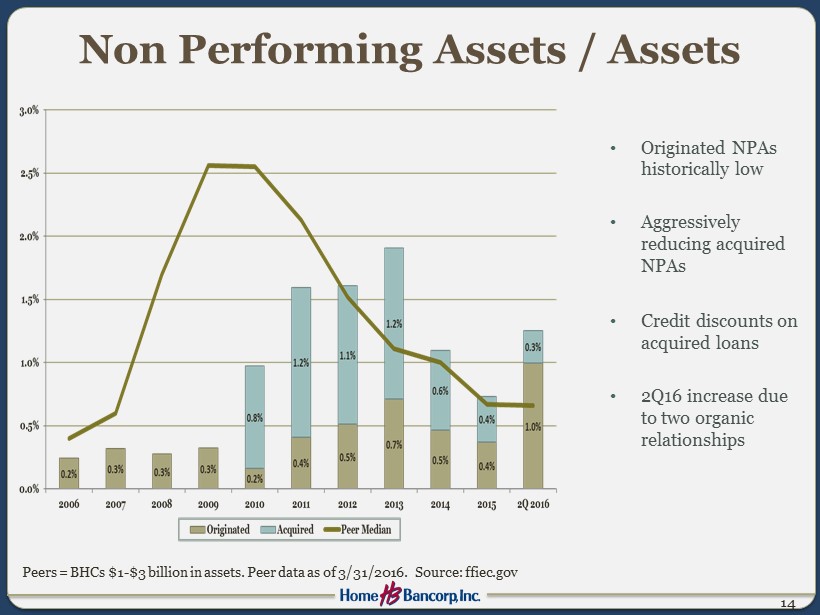
Non Performing Assets / Assets • Originated NPAs historically low • Aggressively reducing acquired NPAs • Credit discounts on acquired loans • 2Q16 increase due to two organic relationships 14 Peers = BHCs $1 - $3 billion in assets. Peer data as of 3/31/2016. Source: ffiec.gov
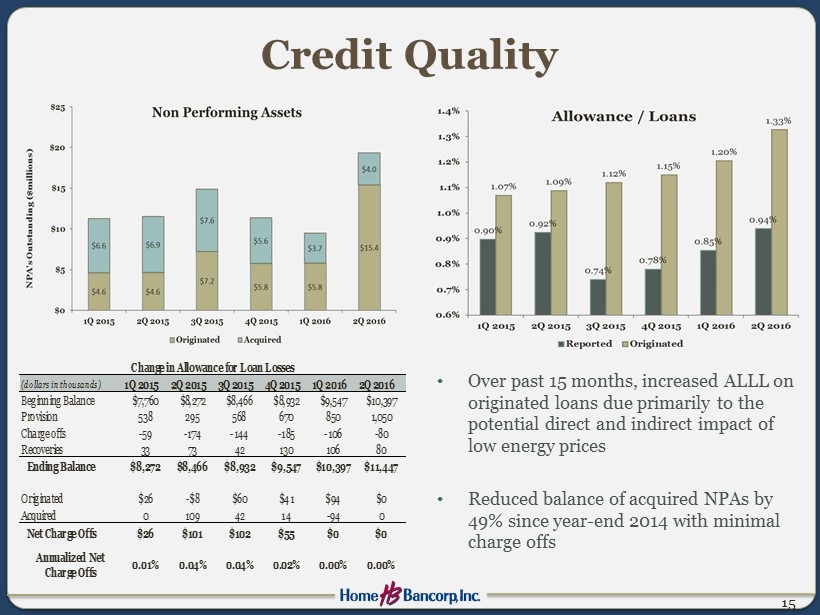
15 Credit Quality • Over past 15 months, increased ALLL on originated loans due primarily to the potential direct and indirect impact of low energy prices • Reduced balance of acquired NPAs by 49% since year - end 2014 with minimal charge offs (dollars in thousands) 1Q 2015 2Q 2015 3Q 2015 4Q 2015 1Q 2016 2Q 2016 Beginning Balance $7,760 $8,272 $8,466 $8,932 $9,547 $10,397 Provision 538 295 568 670 850 1,050 Charge offs -59 -174 -144 -185 -106 -80 Recoveries 33 73 42 130 106 80 Ending Balance $8,272 $8,466 $8,932 $9,547 $10,397 $11,447 Originated $26 -$8 $60 $41 $94 $0 Acquired 0 109 42 14 -94 0 Net Charge Offs $26 $101 $102 $55 $0 $0 0.00% Change in Allowance for Loan Losses Annualized Net Charge Offs 0.01% 0.04% 0.04% 0.02% 0.00%
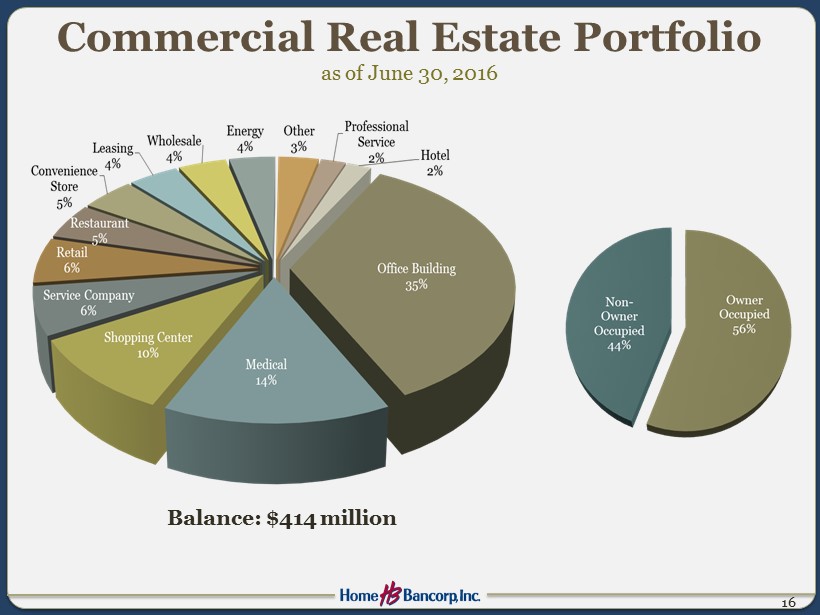
Commercial Real Estate Portfolio as of June 30, 2016 16 Balance: $ 414 million
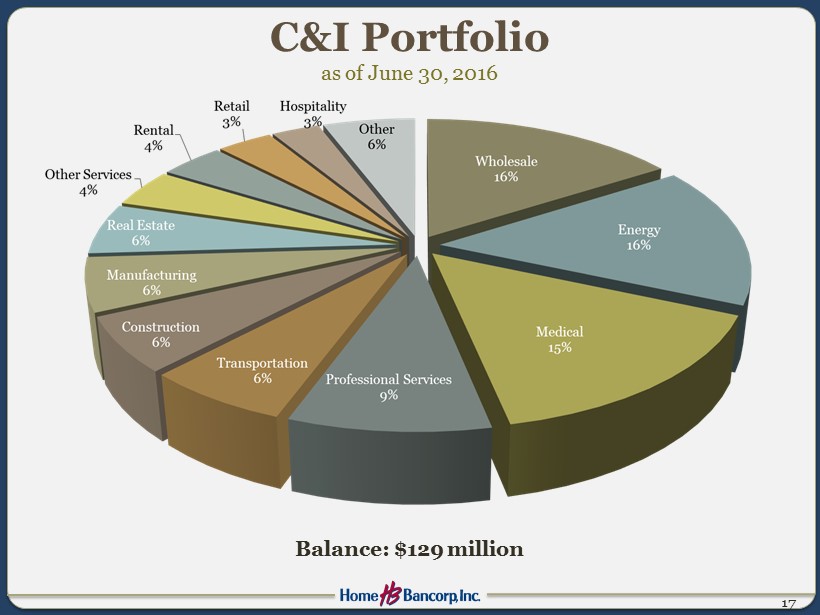
C&I Portfolio as of June 30, 2016 17 Balance: $129 million
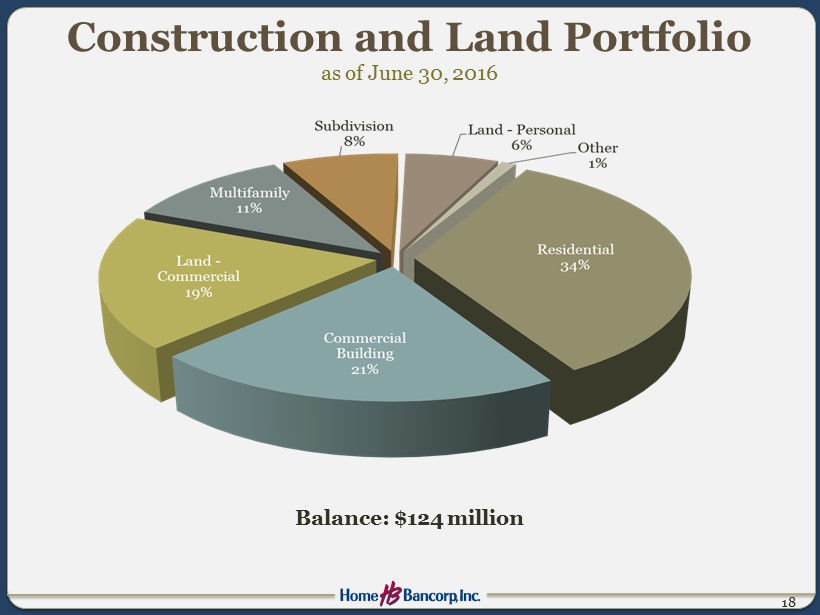
Construction and Land Portfolio as of June 30, 2016 18 Balance: $124 million
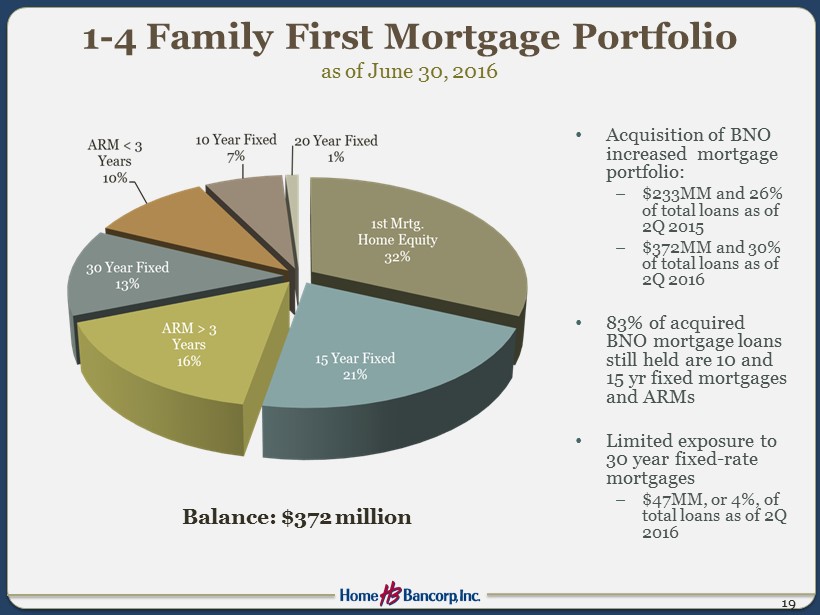
1 - 4 Family First Mortgage Portfolio as of June 30, 2016 • Acquisition of BNO increased mortgage portfolio: – $233MM and 26% of total loans as of 2Q 2015 – $372MM and 30% of total loans as of 2Q 2016 • 83% of acquired BNO mortgage loans still held are 10 and 15 yr fixed mortgages and ARMs • Limited exposure to 30 year fixed - rate mortgages – $47MM, or 4%, of total loans as of 2Q 2016 19 B alance: $372 million
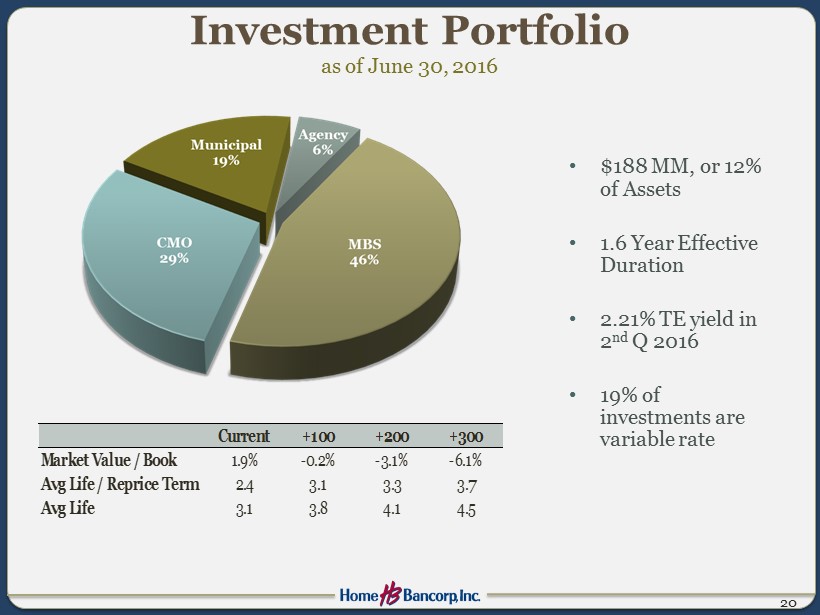
• $188 MM, or 12% of Assets • 1.6 Year Effective Duration • 2.21% TE yield in 2 nd Q 2016 • 19% of investments are variable rate 20 Investment Portfolio as of June 30, 2016 Current +100 +200 +300 Market Value / Book 1.9% -0.2% -3.1% -6.1% Avg Life / Reprice Term 2.4 3.1 3.3 3.7 Avg Life 3.1 3.8 4.1 4.5
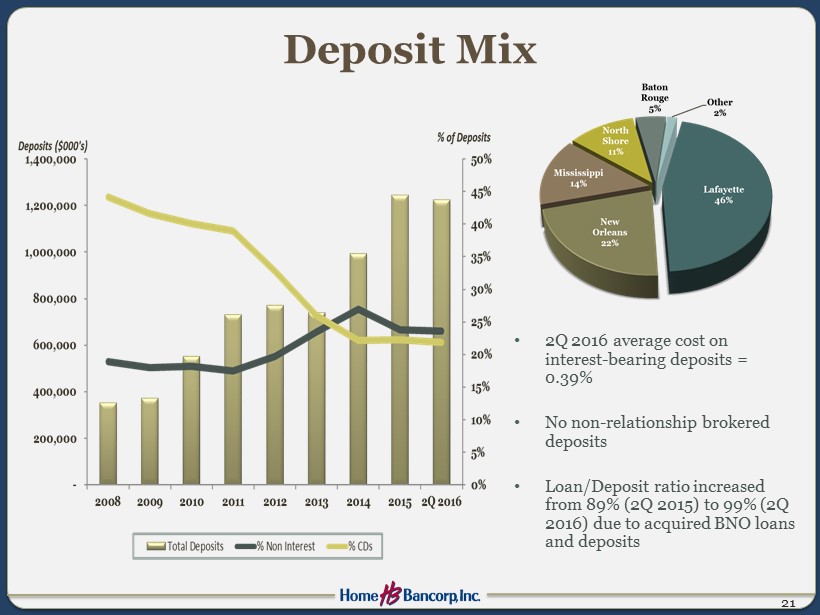
Deposit Mix 21 • 2 Q 2016 average cost on interest - bearing deposits = 0.39% • No non - relationship brokered deposits • Loan/Deposit ratio increased from 89% (2Q 2015) to 99% (2Q 2016) due to acquired BNO loans and deposits
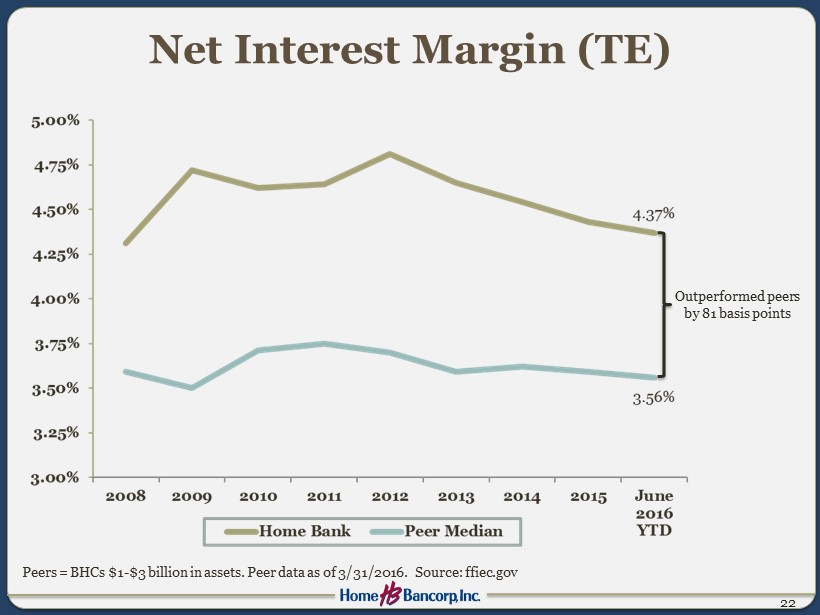
Net Interest Margin (TE) 22 Outperformed peers by 81 basis points Peers = BHCs $1 - $3 billion in assets. Peer data as of 3/31/2016. Source: ffiec.gov
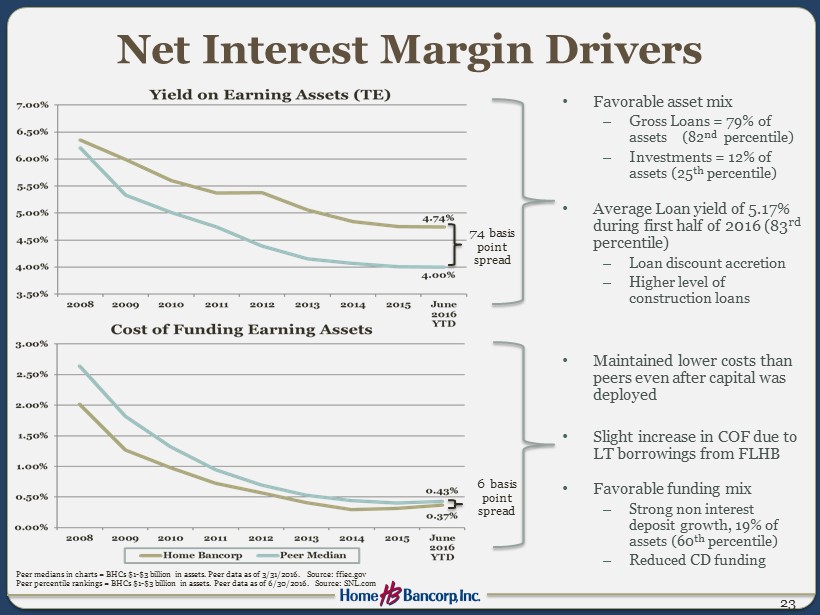
Net Interest Margin Drivers • Favorable asset mix – Gross Loans = 79% of assets (82 nd percentile) – Investments = 12% of assets (25 th percentile) • Average Loan yield of 5.17% during first half of 2016 (83 rd percentile) – Loan discount accretion – Higher level of construction loans 23 • Maintained lower costs than peers even after capital was deployed • Slight increase in COF due to LT borrowings from FLHB • Favorable funding mix – Strong non interest deposit growth, 19% of assets (60 th percentile) – Reduced CD funding 74 basis point spread 6 basis point spread Peer medians in charts = BHCs $1 - $3 billion in assets. Peer data as of 3/31/2016. Source: ffiec.gov Peer percentile rankings = BHCs $1 - $3 billion in assets. Peer data as of 6/30/2016. Source: SNL.com
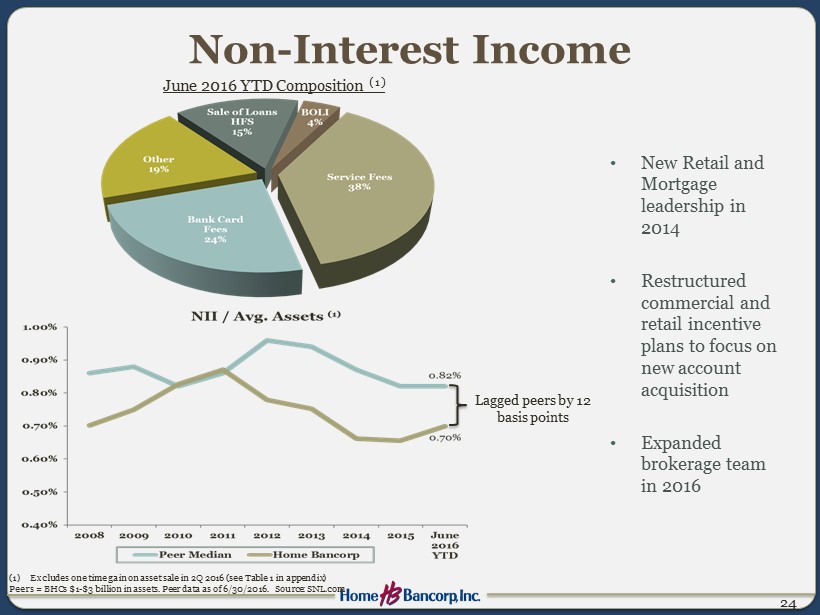
Non - Interest Income • New Retail and Mortgage leadership in 2014 • Restructured commercial and retail incentive plans to focus on new account acquisition • Expanded brokerage team in 2016 24 June 2016 YTD Composition (1) Lagged peers by 12 basis points (1) Excludes one time gain on asset sale in 2Q 2016 (see Table 1 in appendix) Peers = BHCs $1 - $3 billion in assets. Peer data as of 6/30/2016. Source: SNL.com
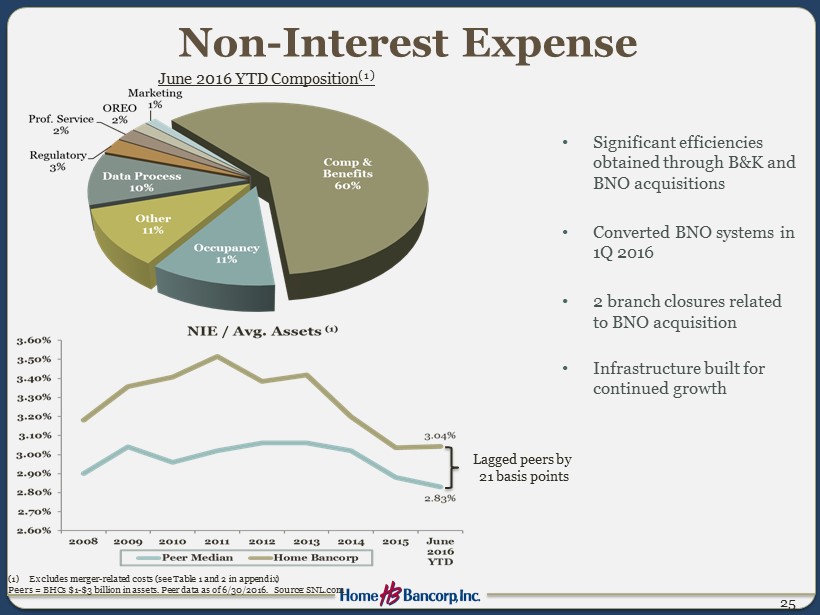
Non - Interest Expense • Significant efficiencies obtained through B&K and BNO acquisitions • Converted BNO systems in 1Q 2016 • 2 branch closures related to BNO acquisition • Infrastructure built for continued growth 25 June 2016 YTD Composition (1) Lagged peers by 21 basis points (1) Excludes merger - related costs (see Table 1 and 2 in appendix) Peers = BHCs $1 - $3 billion in assets. Peer data as of 6/30/2016. Source: SNL.com
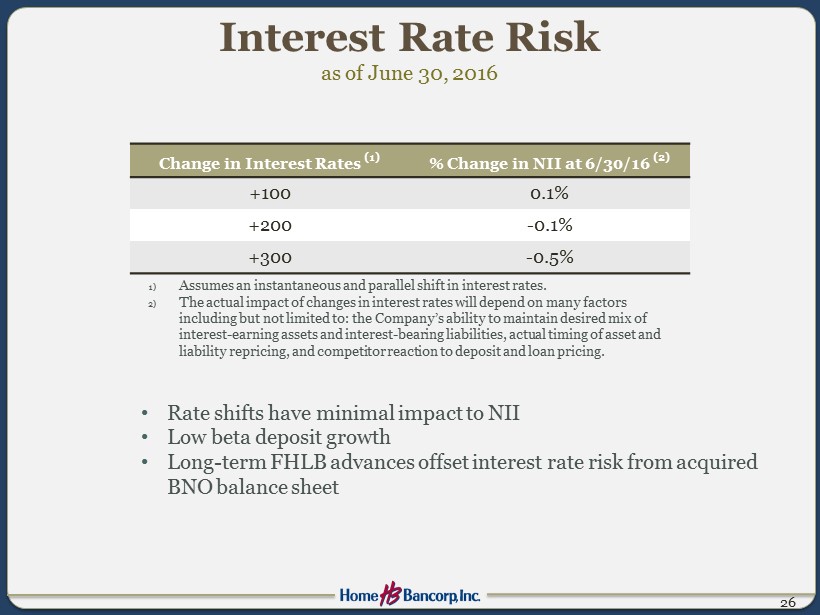
Interest Rate Risk as of June 30, 2016 Change in Interest Rates (1) % Change in NII at 6/30/16 (2) +100 0.1% +200 - 0.1% +300 - 0.5% 26 1) Assumes an instantaneous and parallel shift in interest rates. 2) The actual impact of changes in interest rates will depend on many factors including but not limited to: the Company’s ability to maintain desired mix of interest - earning assets and interest - bearing liabilities, actual timing of asset and liability repricing , and competitor reaction to deposit and loan pricing. • Rate shifts have minimal impact to NII • Low beta deposit growth • Long - term FHLB advances offset interest rate risk from acquired BNO balance sheet
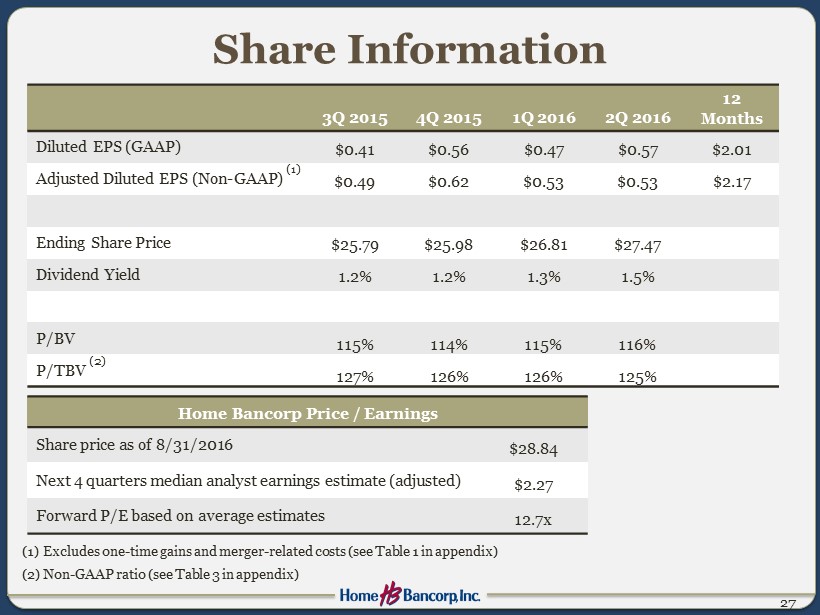
Share Information 27 3Q 2015 4Q 2015 1Q 2016 2Q 2016 12 Months Diluted EPS (GAAP) $0.41 $0.56 $0.47 $0.57 $2.01 Adjusted Diluted EPS (Non - GAAP) (1) $0.49 $0.62 $0.53 $0.53 $2.17 Ending Share Price $25.79 $25.98 $26.81 $27.47 Dividend Yield 1.2% 1.2% 1.3% 1.5% P/ BV 115% 114% 115% 116% P/TBV (2) 127% 126% 126% 125% Home Bancorp Price / Earnings Share price as of 8/31/2016 $28.84 Next 4 quarters median analyst earnings estimate (adjusted) $2.27 Forward P/E based on average estimates 12.7x (1) Excludes one - time gains and merger - related costs (see Table 1 in appendix) (2) Non - GAAP ratio (see Table 3 in appendix)
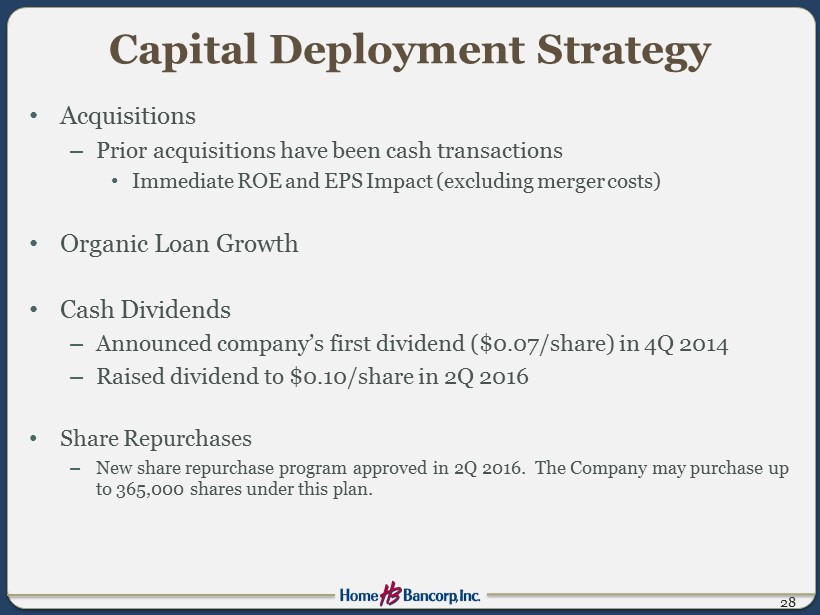
Capital Deployment Strategy • Acquisitions – Prior acquisitions have been cash transactions • Immediate ROE and EPS Impact (excluding merger costs) • Organic Loan Growth • Cash Dividends – Announced company’s first dividend ($0.07/share) in 4Q 2014 – Raised dividend to $0.10/share in 2Q 2016 • Share Repurchases – New share repurchase program approved in 2Q 2016. The Company may purchase up to 365,000 shares under this plan. 28
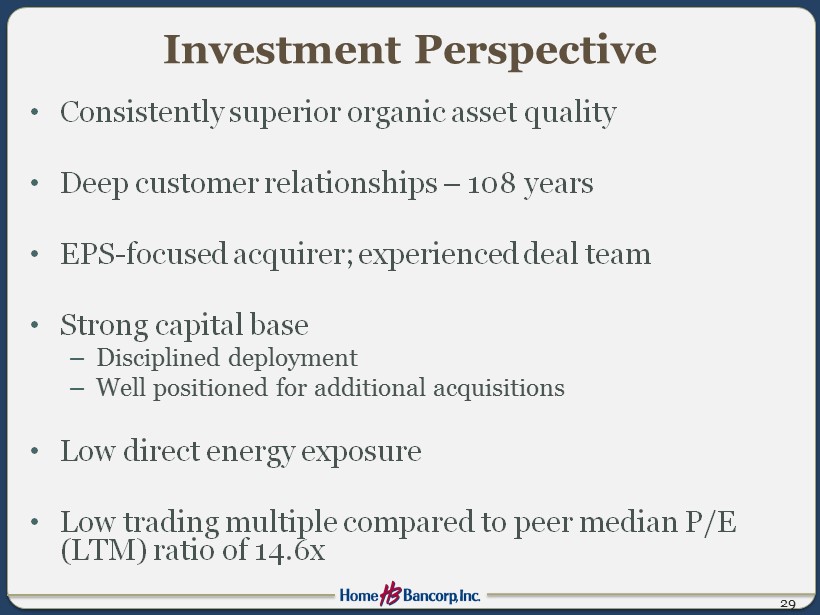
Investment Perspective • Consistently superior organic asset quality • Deep customer relationships – 108 years • EPS - focused acquirer; experienced deal team • Strong capital base – Disciplined deployment – Well positioned for additional acquisitions • Low direct energy exposure • Low trading multiple compared to peer median P/E (LTM) ratio of 14.6x 29

Executive Leadership 30 Jason Freyou, Chief Operations Officer Joined Home Bank in 2015. Previously served as Chief Operations Officer for Teche Federal Bank. Darren Guidry, Chief Credit Officer Joined Home Bank in 1993. Previously served as Chief Lending Officer. Scott Ridley, Chief Banking Officer Joined Home Bank in 2013. Previously served as Group Executive for Louisiana Business Banking for Capital One Bank. Joseph Zanco, Chief Financial Officer Joined Home Bank in 2008. Previously served as Corporate Controller and Principal Accounting Officer for Iberiabank . John Bordelon, President and Chief Executive Officer Has led Home Bank since 1993. Previously served in various management and other positions since joining the Bank in 1981 . Former Chairman of the following organizations: Greater Lafayette Chamber of Commerce , University of Louisiana Alumni Association, Community Bankers of Louisiana, and Ragin Cajun Athletic Foundation
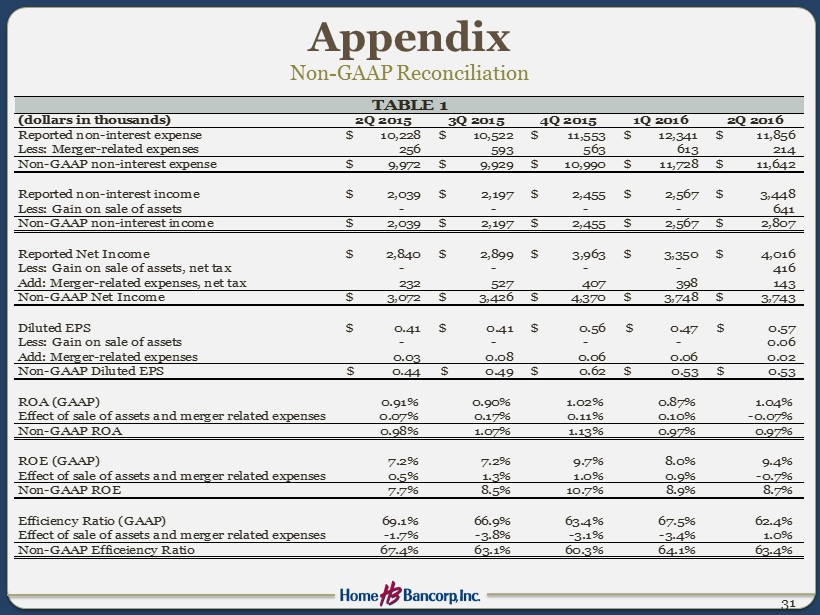
Appendix Non - GAAP Reconciliation 31 (dollars in thousands) 2Q 2015 3Q 2015 4Q 2015 1Q 2016 2Q 2016 Reported non-interest expense 10,228$ 10,522$ 11,553$ 12,341$ 11,856$ Less: Merger-related expenses 256 593 563 613 214 Non-GAAP non-interest expense 9,972$ 9,929$ 10,990$ 11,728$ 11,642$ Reported non-interest income 2,039$ 2,197$ 2,455$ 2,567$ 3,448$ Less: Gain on sale of assets - - - - 641 Non-GAAP non-interest income 2,039$ 2,197$ 2,455$ 2,567$ 2,807$ Reported Net Income 2,840$ 2,899$ 3,963$ 3,350$ 4,016$ Less: Gain on sale of assets, net tax - - - - 416 Add: Merger-related expenses, net tax 232 527 407 398 143 Non-GAAP Net Income 3,072$ 3,426$ 4,370$ 3,748$ 3,743$ Diluted EPS 0.41$ 0.41$ 0.56$ 0.47$ 0.57$ Less: Gain on sale of assets - - - - 0.06 Add: Merger-related expenses 0.03 0.08 0.06 0.06 0.02 Non-GAAP Diluted EPS 0.44$ 0.49$ 0.62$ 0.53$ 0.53$ ROA (GAAP) 0.91% 0.90% 1.02% 0.87% 1.04% Effect of sale of assets and merger related expenses 0.07% 0.17% 0.11% 0.10% -0.07% Non-GAAP ROA 0.98% 1.07% 1.13% 0.97% 0.97% ROE (GAAP) 7.2% 7.2% 9.7% 8.0% 9.4% Effect of sale of assets and merger related expenses 0.5% 1.3% 1.0% 0.9% -0.7% Non-GAAP ROE 7.7% 8.5% 10.7% 8.9% 8.7% Efficiency Ratio (GAAP) 69.1% 66.9% 63.4% 67.5% 62.4% Effect of sale of assets and merger related expenses -1.7% -3.8% -3.1% -3.4% 1.0% Non-GAAP Efficeiency Ratio 67.4% 63.1% 60.3% 64.1% 63.4% TABLE 1
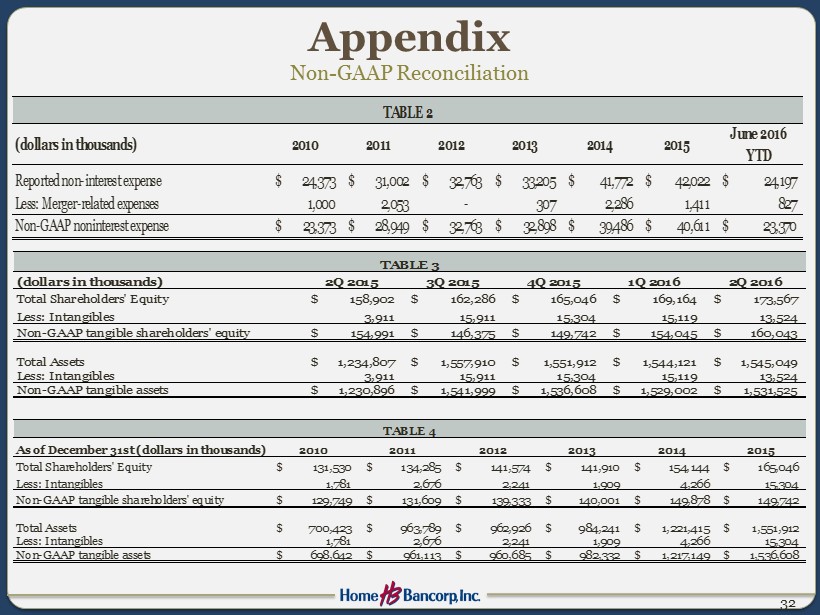
Appendix Non - GAAP Reconciliation 32 (dollars in thousands) 2Q 2015 3Q 2015 4Q 2015 1Q 2016 2Q 2016 Total Shareholders' Equity 158,902$ 162,286$ 165,046$ 169,164$ 173,567$ Less: Intangibles 3,911 15,911 15,304 15,119 13,524 Non-GAAP tangible shareholders' equity 154,991$ 146,375$ 149,742$ 154,045$ 160,043$ Total Assets 1,234,807$ 1,557,910$ 1,551,912$ 1,544,121$ 1,545,049$ Less: Intangibles 3,911 15,911 15,304 15,119 13,524 Non-GAAP tangible assets 1,230,896$ 1,541,999$ 1,536,608$ 1,529,002$ 1,531,525$ TABLE 3 (dollars in thousands) 2010 2011 2012 2013 2014 2015 June 2016 YTD Reported non-interest expense 24,373$ 31,002$ 32,763$ 33,205$ 41,772$ 42,022$ 24,197$ Less: Merger-related expenses 1,000 2,053 - 307 2,286 1,411 827 Non-GAAP noninterest expense 23,373$ 28,949$ 32,763$ 32,898$ 39,486$ 40,611$ 23,370$ TABLE 2 As of December 31st (dollars in thousands) 2010 2011 2012 2013 2014 2015 Total Shareholders' Equity 131,530$ 134,285$ 141,574$ 141,910$ 154,144$ 165,046$ Less: Intangibles 1,781 2,676 2,241 1,909 4,266 15,304 Non-GAAP tangible shareholders' equity 129,749$ 131,609$ 139,333$ 140,001$ 149,878$ 149,742$ Total Assets 700,423$ 963,789$ 962,926$ 984,241$ 1,221,415$ 1,551,912$ Less: Intangibles 1,781 2,676 2,241 1,909 4,266 15,304 Non-GAAP tangible assets 698,642$ 961,113$ 960,685$ 982,332$ 1,217,149$ 1,536,608$ TABLE 4