Attached files
| file | filename |
|---|---|
| EX-23.1 - EXHIBIT 23.1 CONSENT OF INDEPENDANT ACCOUNTANTS - TRC COMPANIES INC /DE/ | exhibit231consentofindepen.htm |
| EX-32.2 - EXHIBIT 32.2 CERTIFICATION OF CFO - TRC COMPANIES INC /DE/ | ex322_20160630-q4x2016xtrr.htm |
| EX-32.1 - EXHIBIT 32.1 CERTIFICATION OF CEO - TRC COMPANIES INC /DE/ | ex321_20160630-q4x2016xtrr.htm |
| EX-31.2 - EXHIBIT 31.2 CERTIFICATION OF CFO - TRC COMPANIES INC /DE/ | ex312_20160630-q4x2016xtrr.htm |
| EX-31.1 - EXHIBIT 31.1 CERTIFICATION OF CEO - TRC COMPANIES INC /DE/ | ex311_20160630-q4x2016xtrr.htm |
| EX-21 - EXHIBIT 21 SUBSIDIARIES - TRC COMPANIES INC /DE/ | exhibit21subsidiariesoftrc.htm |
Use these links to rapidly review the document
UNITED STATES
SECURITIES AND EXCHANGE COMMISSION
Washington, D.C. 20549
FORM 10-K
ý | Annual Report Pursuant to Section 13 or 15(d) of the Securities Exchange Act of 1934 | |
For the fiscal year ended June 30, 2016
or
o | Transition Report Pursuant to Section 13 or 15(d) of the Securities Exchange Act of 1934 | |
For the transition period from to
Commission file number 1-9947
TRC COMPANIES, INC.
(Exact name of registrant as specified in its charter)
Delaware (State or other jurisdiction of incorporation or organization) | 06-0853807 (I.R.S. Employer Identification No.) |
21 Griffin Road North Windsor, Connecticut (Address of principal executive offices) | 06095 (Zip Code) |
Registrant's telephone number, including area code: (860) 298-9692
Securities registered pursuant to Section 12(b) of the Act:
Title of each class | Name of each exchange on which registered | |
Common Stock, $0.10 par value | New York Stock Exchange | |
Securities registered pursuant to Section 12(g) of the Act: None
Indicate by check mark if the registrant is a well-known seasoned issuer, as defined in Rule 405 of the Securities Act. Yes o No ý.
Indicate by check mark if the registrant is not required to file reports pursuant to Section 13 or Section 15(d) of the Exchange Act. Yes o No ý.
Indicate by check mark whether the registrant (1) has filed all reports required to be filed by Section 13 or 15 (d) of the Securities Exchange Act of 1934 during the preceding 12 months (or for such shorter period that the registrant was required to file such reports), and (2) has been subject to such filing requirements for the past 90 days. Yes ý No o
Indicate by check mark whether the registrant has submitted electronically and posted on its corporate Web site, if any, every Interactive Data File required to be submitted and posted pursuant to Rule 405 of Regulation S-T (§232.405 of this chapter) during the preceding 12 months (or for such shorter period that the registrant was required to submit and post such files). YES ý NO o
Indicate by check mark if disclosure of delinquent filers pursuant to Item 405 of Regulation S-K (§229.405 of this chapter) is not contained herein, and will not be contained, to the best of registrant's knowledge, in definitive proxy or information statements incorporated by reference in Part III of this Form 10-K or any amendment to this Form 10-K. ý
Indicate by check mark whether the registrant is a large accelerated filer, an accelerated filer, a non-accelerated filer, or a smaller reporting company. See the definitions of "large accelerated filer," "accelerated filer" and "smaller reporting company" in Rule 12b-2 of the Exchange Act. (Check one):
Large accelerated filer o | Accelerated filer ý | Non-accelerated filer o | Smaller reporting company o |
(Do not check if a smaller reporting company) | |||
Indicate by check mark whether the registrant is a shell company (as defined in Rule 12b-2 of the Exchange Act). Yes o No ý.
The aggregate market value of the registrant's common stock held by non-affiliates on December 25, 2015 was approximately $184,000,000.
On August 21, 2016, there were 31,101,510 shares of common stock of the registrant outstanding.
Use these links to rapidly review the document
DOCUMENTS INCORPORATED BY REFERENCE
Portions of our proxy statement for the annual meeting of shareholders to be held on November 17, 2016 are incorporated by reference in PART III hereof.
Use these links to rapidly review the document
TRC Companies, Inc.
Index to Annual Report on Form 10-K
Fiscal Year Ended June 30, 2016
Page | ||
2
Forward-Looking Statements
Certain information included in this report, or in other materials we have filed or will file with the Securities and Exchange Commission (the "SEC") (as well as information included in oral statements or other written statements made or to be made by us), contains or may contain forward-looking statements within the meaning of the Private Securities Litigation Reform Act of 1995 (the "1995 Act"). Such statements are being made pursuant to the 1995 Act and with the intention of obtaining the benefit of the "Safe Harbor" provisions of the 1995 Act. Forward-looking statements are based on information available to us and our perception of such information as of the date of this report and our current expectations, estimates, forecasts and projections about the markets in which we operate and the beliefs and assumptions of our management. You can identify these statements by the fact that they do not relate strictly to historical or current facts. They contain words such as "anticipate," "estimate," "expect," "project," "intend," "plan," "believe," "may," "can," "could," "might," or variations of such wording, and other words or phrases of similar meaning in connection with a discussion of our future operating or financial performance and other aspects of our business, including growth, trends in our business and other characterizations of future events or circumstances. From time to time, forward-looking statements are also included in our other periodic reports on Forms 10-Q and 8-K, in press releases, in our presentations, on our website and in other material released to the public. Any or all of the forward-looking statements included in this report and in any other reports or public statements made by us are only predictions and are subject to risks, uncertainties and assumptions, including those identified below in the "Risk Factors" section, the "Management's Discussion and Analysis of Financial Condition and Results of Operations" section, and other sections of this report. Such risks, uncertainties and assumptions are difficult to predict and beyond our control and may cause actual results to differ materially from those that might be anticipated from our forward-looking statements. We undertake no obligation to publicly update any forward-looking statements, whether as a result of new information, future events or otherwise. However, any further disclosures made on related subjects in our subsequent reports on Forms 10-K, 10-Q, and 8-K should be consulted.
PART I
Item 1. Business
General Description
TRC Companies, Inc. (hereinafter collectively referred to as "we" "our" or "us"), was incorporated in 1969. We are a national engineering, consulting and construction management firm that provides integrated engineering, consulting and construction management services. Our multidisciplinary project teams help our clients implement environmental, power, infrastructure and pipeline projects from initial concept to delivery and operation. We provide our services almost entirely in the United States.
We are headquartered in Windsor, Connecticut, and our corporate website is www.trcsolutions.com (information on our website has not been incorporated by reference into this Form 10-K). Through a link on the investor center section of our website, we make available the following filings as soon as reasonably practicable after they are electronically filed with or furnished to the SEC: our Annual Report on Form 10-K, Quarterly Reports on Form 10-Q, Current Reports on Form 8-K and any amendments to those reports filed or furnished pursuant to Section 13(d) or 15(d) of the Securities and Exchange Act of 1934 (the "Exchange Act") as well as reports filed pursuant to Section 16 of the Exchange Act. All such filings are available free of charge.
Financial Highlights
We reported a net income applicable to TRC Companies, Inc. of $41 thousand, $19.4 million, and $12.1 million for fiscal years 2016, 2015 and 2014, respectively. The net income applicable to TRC Companies, Inc. for fiscal year 2016 included a $22.0 million goodwill impairment charge. We generated cash from operations of $48.1 million, $32.1 million, and $21.4 million in fiscal years 2016, 2015 and 2014, respectively. Net service revenue ("NSR") for fiscal year 2016 increased $57.1 million, or 14.0%, to $465.1 million from $408.0 million during the prior year. Approximately 8.5% of the NSR growth for fiscal year 2016 was from organic activities with the remainder coming from acquisitions.
3
Business Strategy
We understand our clients' goals and embrace them as our own, applying creativity, experience, integrity and dedication to deliver superior solutions to our client's challenges. We operate on a national basis through our operating segments, national sales and marketing organization, and industry verticals giving us the ability to respond to customer needs and dynamic market conditions. We are committed to safety, quality, client satisfaction, excellence in project management, sustainability and financial performance.
Our objectives for fiscal year 2017 are:
• | Continue profitable growth in our operating segments. Our profitable growth objectives incorporate elements of geographic expansion, increased technical capabilities and strategic market development, focusing on the needs of our clients in a multi-disciplinary fashion and directing resources to evolving markets where our success rate is highest. We have created programs that emphasize our capabilities and offer our entire service portfolio to our clients. |
• | Continue focus on improving operating margins and increasing positive operating cash flow. We will continue our focus on controlling and reducing operating costs. In the past several years, we have taken steps to consolidate and control our general and administrative expenses as well as improve productivity and execution. We have created a disciplined approach to project and risk management that starts with an internally developed project management training program which addresses risk and execution across the entire project spectrum. |
• | Attract and retain top talent. We continue to add top performers to expand our expertise and depth. Our objective is to maintain a workplace where the best people in our industry will want to work for us and be challenged by meaningful projects, rewarded for successful performance, and motivated to develop their entrepreneurial and project management skills. Acquisitions over the past three years have added approximately 1,200 professional and support staff, expanding our resource base, technical expertise, and geographic reach. |
• | Focus our business development activity on our key accounts and markets. We focus our business on key clients and markets. In addition to a key account program, we have created verticals and selling teams that serve our principal industry markets, such as electric generation, transmission and distribution; oil and gas; and transportation. Our selling strategies focus on new and existing clients and markets. As part of our strategy, we will rename our Energy segment to be called Power and rename our Pipeline Services segment to be called Oil and Gas. This will align their names with the key clients and markets those segments serve. |
Services
We manage our business under four operating segments: Energy, Environmental, Infrastructure and Pipeline Services.
In the course of performing our work, we routinely subcontract services. Generally, these subcontractor costs are passed through to our clients and, in accordance with accounting principles generally accepted in the United States of America ("U.S. GAAP") and consistent with industry practice, are included in gross revenue. Because subcontractor services can change significantly from project to project, changes in gross revenue may not be indicative of business trends. Accordingly, we also report net service revenue ("NSR"), which is gross revenue less subcontractor costs and other direct reimbursable charges, and our discussion and analysis of financial condition and results of operations uses NSR as a primary point of reference. For additional information regarding our reportable operating segments see Note 15 "Operating Segments" of the Notes to Consolidated Financial Statements (Part II, Item 8 of this Form 10-K).
Energy
The Energy operating segment serves key areas within the energy market which is currently investing in modernization, expansion, enhancement and replacement of outdated facilities. According to the Department of Energy, currently within the United States, 70% of transmission lines and larger transformers are more than 25 years old, and 60% of circuit breakers are more than 30 years old. The Edison Electric Institute reported in its March 2014 Update on Transmission that the industry is forecasted to spend over $60 billion on transmission projects in the next several years. These projects will enhance reliability, facilitate interstate transmission and support renewable development. We participate throughout the full cycle of services of transmission line and substation projects. We continue to increase our presence in the energy market by acquisition as well as organic growth.
The country continues to see shifts in public policy intended to stimulate energy development and the development of a smarter and more robust power grid, improve the distribution of electricity, better manage end-user demand and reduce greenhouse gas emissions and other environmental impacts. We are one of the leading firms supporting the significant investment associated with the development of new sources of energy and the infrastructure required to deliver new and existing energy sources to consumers. This market, like all other markets dependent upon large capital investment, is influenced by cost and access to capital. Access to private sources of credit and capital for project development appears generally favorable for most of the customers we serve.
4
Our energy service offerings include support in the licensing and engineering design of new sources of power generation and electric transmission and distribution system upgrades. Approximately 26% of our total employee base is dedicated to providing services to our energy customers. As major investor-owned utilities continue to consolidate and downsize their engineering and environmental staffs, we expect to continue to see long-term growth in these service areas. In addition, we expect to see continued expansion of the energy efficiency and demand management markets.
Key markets for our Energy operating segment are:
• | Electric Transmission and Distribution. Investment in electric transmission and distribution infrastructure represents one of the largest financial commitments facing utilities over the next decade. The age of the transmission and distribution network combined with continuing electric load growth and the development of renewable generating sources has resulted in heightened concern over the reliability and efficiency of the nation's transmission grid. The evolving security environment requires solutions that meet today's challenging demands combined with a clear vision of newly emerging technologies and threats. Many of our customers have begun to invest in improved physical and cyber security programs intended to assure better system performance during extreme weather or other catastrophic events. |
We are one of the leading engineering and environmental licensing service providers supporting the current extensive upgrade to the nation's electric transmission grid. We provide full scope engineering design, material procurement and construction management services. We also provide essential operations and management support to utilities as the trend towards outsourcing engineering functions continues. Our ability to provide integrated energy and environmental services is a key factor to our success on these projects.
• | Energy Efficiency. An integral part of the nation's energy plan is to more effectively manage the use of finite resources through efficiency, conservation, load management and shifting to renewable energy sources. |
We develop and manage state supported energy efficiency programs in New York, New Hampshire, Maine, California and New Jersey that reduce energy use and cost-effectively manage demand. We provide comprehensive services including program design, program management, quality control, engineering, and financial tracking and reporting. In addition to our statewide programs, we also design and manage portfolio energy efficiency programs, including a broad range of services from program management to engineering, quality control and construction inspection for a spectrum of end users such as commercial office buildings, hospitality chains, educational facilities, residential complexes and military installations.
We are also engaged in green building design and the development of codes, standards and policy. In addition, energy conservation measures can reduce carbon footprints, and we are assisting a number of clients in "greening" their operations against quantifiable objectives.
Environmental
The Environmental operating segment is our largest operating segment. We are a national market leader in the areas of air quality modeling, air emissions testing and monitoring, cultural and natural resource management, permitting of energy and energy related facilities and remediation of contaminated sites. The demand for environmental services originally arose in response to the major environmental legislation of the 1970's. While regulatory compliance has been a significant market driver since that time, mergers and acquisitions, and infrastructure and real estate development have created economic drivers as well. We also see a trend for clients to adopt environmental management strategies as part of evolving corporate philosophies which embrace sustainability and environmental accountability. These strategies can involve voluntary assessment, remediation and compliance which meet societal and stakeholder expectations for better stewardship.
The markets for our environmental services are dynamic and include:
• | Assessment, Remediation, and Compliance of Contaminated Sites. The number of contaminated properties across the United States which require environmental assessment and remediation remains significant. The primary demand for these assessment and remediation services is driven by regulatory obligations as well as economic considerations related to the transfer and redevelopment of environmentally distressed real estate. While the market for these types of services has been somewhat reinvigorated due to economic trends, the demand for cleanup at affected sites in support of economic redevelopment continues to lag. |
• | Natural Gas Related Energy Strategies. Natural gas has become a preferred fuel source for energy initiatives. While investment in development of new gas supplies, transmission pipelines and storage facilities is a function of price and economic conditions, we believe gas will become increasingly important in the energy mix. The development of domestic shale reserves in particular should increase demand for environmental activities associated with the |
5
permitting, production, transportation, and consumption of natural gas, natural gas liquids and oil. As an example, we are an industry leader in Federal Energy Regulatory Commission ("FERC") licensing, federal and state media specific environmental permitting, electrical supply interconnection engineering, and construction management and oversight for natural gas transmission. With one of the most experienced national teams of environmental scientists, we have been responsible for the licensing and construction oversight of several of the largest multi-state gas transmission pipeline projects in development. We also provide a range of services to midstream companies in the development of shale based oil, liquids, and natural gas projects. In addition, we provide services for the permitting of both land-based and offshore Liquefied Natural Gas ("LNG") terminals.
• | Electric Generation Licensing and Permitting. The demand for licensing services and interconnection for new electric generation sources continues to increase. In load congested areas such as the Mid-Atlantic, Northeast, and California, utilities are pursuing development of new sources of electricity supply. The amount of electricity generated from coal will be substantially reduced, with natural gas and renewable energy capturing this lost share. |
A significant portion of U.S. coal-fired power plants could ultimately be retired under Environmental Protection Agency ("EPA") rules. Cross state air pollution issues are also likely to put pressure on power plant retrofit or closure activity. These regulatory drivers, in conjunction with the economic attractiveness of natural gas, could help support a wave of future projects associated with power generation licensing, fuel supply, power transmission and distribution, and retirement of obsolete facilities.
Over half of the states are implementing renewable portfolio standards, and we are providing licensing and engineering support to a number of wind and solar power projects. The extension of federal incentives for renewable generation as well as ongoing state incentives have supported this market.
We also provide due diligence and consulting support with respect to energy assets to a number of leading financial institutions, private equity firms and diversified energy companies.
• | Air Quality Regulatory Compliance. EPA rule-making has led to a series of new maximum achievable control technology ("MACT") standards and new source performance standards ("NSPS") for a range of industries and emission sources including power generation, commercial and industrial boilers, solid waste incinerators, diesel engines, petroleum refineries, cement kilns, iron and steel foundries, gold mining operations, polyvinyl chloride production, and others. These regulations require air quality emission assessments, permitting evaluations, installation of new control technologies, performance demonstration testing and long-term monitoring. Additionally, new national ambient air quality standards ("NAAQS") are increasing demand for air quality modeling, monitoring and consulting to meet those stricter standards. |
• | Water Quality and Water Resource Management. Evolving regulations coupled with the need to protect and manage the nation's water resources create demand for our water resource experts. We offer services in the areas of supply, protection, conservation, restoration, treatment and permitting for both surface and groundwater resources. |
• | Solid Waste Management. We offer a full spectrum of solid waste and landfill management services including, siting and permitting, site investigations, planning, alternatives analysis, design, construction, operation, closure and post-closure. According to the EPA, the United States generates approximately 250 million tons of solid waste annually, and all current facilities have finite capacity. |
• | Transaction Support. Our ability to evaluate environmental and regulatory risk in real property and business transfers continues to be one of our core strengths. We support investors, financial institutions, regulatory agencies and property owners with due diligence and compliance counseling services as properties and businesses change ownership. |
• | Environmental, Health and Safety ("EHS") Compliance. Industrial and commercial projects must comply with regulations covering, among other things, air quality, water quality, solid and hazardous waste requirements, land use, wildlife, wetlands, cultural resources, natural resource conservation, and health and safety. Many of these requirements are independent of economic circumstances. |
• | Strategic EHS Management. We help our clients optimize their environmental and health and safety management programs. Through a comprehensive approach to addressing EHS matters, we assist our clients in realizing improved business performance from the sharing of best practices across facilities, developing standardized procedures and expectations for facilities, designing and implementing auditing programs, and leveraging interconnections between the various EHS requirements. |
• | Sustainability Advisory Services. We work with our clients to customize sustainability solutions to meet their strategic business objectives. Our services include: sustainability strategy development; public report design, development, and validation (Global Reporting Initiative, Carbon Disclosure Project); life cycle inventory analysis; carbon/ |
6
greenhouse gas management strategies and reporting; eco-efficiency audits, inventories, and strategies; stakeholder mapping and engagement strategies; pollution prevention/waste minimization; and beneficial reuse.
• | Infrastructure Modernization. Modernizing our national transportation and energy delivery systems continues to be a focus of both the public and the private sectors. Investment in these areas will require the assessment of related environmental impacts and the planning, permitting and engineering to allow such development. |
• | Climate Change. The market for climate change related services is being driven domestically from many fronts, most of which are not regulatory in nature. We have seen demand for services emerge in the areas of carbon emission assessment and verification, renewable energy development, business process optimization, and public and private sector programs which are designed around energy conservation and other green initiatives. We believe our expertise in air modeling and measurement, renewable energy project licensing, project environmental impact assessment and project engineering, energy efficiency, as well as program design and management provides us an advantage in this market. |
• | Building Sciences. We help our clients manage risks associated with hazardous and regulated materials in buildings on a routine and emergency basis. This can include remediation, abatement, testing and monitoring of PCBs, asbestos, lead-based paint, mold and other substances of concern. |
• | Exit Strategy®. We pioneered and remain the market leader in structuring environmental risk transfers for contaminated properties. We help resolve our clients' environmental cleanup risk and uncertainty through options which include insurance-backed remediation, guaranteed fixed-price contracts, risk sharing and performance based contracting. Our services are especially applicable to situations where our clients are seeking certainty with respect to environmental remediation liabilities such as: mergers, acquisitions and divestitures; discontinued operations; asset transfers in bankruptcy and otherwise; real estate transactions involving single sites or portfolios of properties; multi-party Superfund sites; and brownfield real estate development. |
• | RE Power®. RE Power is a program where we, in conjunction with a decommissioning and demolition company, provide comprehensive design, oversight, dismantling, cleanup, and asset optimization solutions to power and utility companies that elect to decommission or reposition their aging power plant assets. The goal of RE Power is to provide energy companies with a one-stop resource to gain maximum value for power plant assets at the end of their useful life. This can include safely removing plants from service through demolition and environmental cleanup and potentially transitioning them into a redevelopment phase, or preparing the existing power plant for re-powering with more viable fuel sources or more efficient generating equipment. |
Infrastructure
We offer a variety of services to our infrastructure clients related to: (1) rehabilitation of overburdened and deteriorating infrastructure systems; and (2) design, construction engineering inspection and construction management associated with new infrastructure projects. We serve customers in the Northeast corridor of the United States as well as Pennsylvania, Texas, West Virginia, Tennessee, Ohio, South Carolina, Louisiana and California. Infrastructure services we offer include:
• | Transportation. We provide planning, civil and structural design, construction engineering inspections and construction management services in support of work on roads, highways, bridges and aviation facilities. In addition to performing basic design engineering, we also incorporate activities associated with completing environmental studies, marine engineering, seismic analysis, and traffic engineering. |
• | General Civil Engineering Services. We provide civil engineering services for municipal and commercial real estate development projects which include master planning, traffic studies, storm water and water/waste water design and management, utility design, and site engineering. Our civil engineering expertise is utilized on projects such as the planning, design and construction management of potable water and wastewater treatment systems; master drainage planning; street, roadway and site drainage; and dam analysis and design. |
• | Structural Engineering and Inspections. We provide structural engineering design and condition assessment services for bridges, embankments and certain building structures. |
• | Geotechnical and Materials Engineering. We provide subsurface exploration, laboratory testing, geotechnical engineering, and seismic engineering and quality assurance testing. |
• | Hydraulics and Hydrological Studies. We provide aquifer tests, ground water modeling and yield analysis, scour and erosion studies, design and analysis of storage and distribution systems, Federal Emergency Management Agency studies and watershed modeling. |
7
• | Geographic Information Systems, Surveying & Mapping. We provide data modeling, terrain analysis, shoreline management analysis, total station and resource mapping and similar services. |
Long-term prospects for this segment should be favorable and our backlog is up significantly as demand for infrastructure services has generally been on the rise. The overall infrastructure construction markets are expected to benefit from the federal funding certainty provided by the new $305 billion highway bill known as the Fixing America’s Surface Transportation (FAST) Act. The bill calls for the spending of approximately $205 billion on highways and $48 billion on transit projects.
Pipeline Services
We provide engineering; procurement; engineer, procure, and construct ("EPC") services; project management; integrity and field services to the oil and gas and electric utility industries. Our history of managing and executing complex projects has positioned us as a full service provider in the emerging integrity market.
• | Engineering Services. We specialize in providing engineering services to assist clients in designing, engineering and constructing or expanding pipeline systems, compressor stations, pump stations, fuel storage facilities and field gathering and production facilities. Our expertise also extends to the engineering of a wide range of project peripherals, including various types of support buildings and utility systems, power generation and electrical transmission, communications systems, fire protection, water and sewage treatment, water transmission, roads and railroad sidings. |
• | Integrity Services. In addition to capital projects, we are a leader in providing pipeline integrity services including program management, engineering and field services. We provide full-service integrity management program offerings including program development, data services, risk analysis, corrosion evaluation, integrity engineering and integrity construction services. |
• | Field Services. We provide a variety of value added services related to routing and compliance of pipelines, transmission lines, renewable generation and similar projects, including project management, construction support, title review and analysis, right of way acquisition, survey, mapping, design validation, permitting and regulatory compliance. |
• | Government Services. Our Government Services group performs engineer, procure, construct and management ("EPCm") services, and builds and operates fueling facilities for governmental customers including the Department of Defense, Defense Logistics Agency, Department of Energy and others. |
• | Integra Link™. We are partnered with Google to provide a cloud-based pipeline lifecycle integrity management solution, Integra Link™, which utilizes Google’s geospatial technology platform to help oil and gas pipeline companies visualize and utilize their data and information. |
• | EPC Services. The benefits from performing EPC projects include the incremental income associated with project management and the income associated with the procurement component of the contract. In performing EPC contracts, we participate in numerous aspects of a project and are able to improve the efficiency of the design, permitting, procurement and construction sequence for a project in connection with making engineering and constructibility decisions. EPC contracts enable us to deploy our resources more efficiently and, at the same time, optimize the overall project solution and execution for the client. |
8
Clients
We have a highly diversified client base, and no single client accounted for 10% or more of our NSR during fiscal years 2016, 2015 and 2014.
Representative clients during the past five years include:
AES Enterprises | Eversource | PSE&G | ||
AIMCO, Inc. | Exide Technologies | Public Service of New Hampshire | ||
American Electric Power | ExxonMobil | Sempra Energy | ||
Baker Hughes | First Energy Corporation | Southern Company | ||
Bangor Hydro Electric Company | First Solar | Spectra Energy | ||
Beacon Properties | Goodyear Tire and Rubber Company | SPX Corporation | ||
BNSF | Hawaiian Electric Company, Inc. | Talisman Energy USA | ||
British Petroleum | Hoffman La Roche, Inc. | Waste Management | ||
Canadian Northern Railway | Iberdrola USA | Xcel Energy | ||
CenterPoint Energy | J-Power | State Transportation/Power Authorities: | ||
Chevron | Kinder Morgan | • California | ||
Circle K | LS Power | • Connecticut | ||
Columbia Pipeline | Lower Manhattan Development Corporation | • Louisiana | ||
Competitive Power Ventures | Magellan Midstream Partners | • Massachusetts | ||
Connecticut Resources Recovery | Marathon Oil | • New Hampshire | ||
Authority | National Grid | • New Jersey | ||
ConocoPhillips | New York State Energy Research and | • New York | ||
Consolidated Edison | Development Authority | • Pennsylvania | ||
Constellation Energy | Nexterra | • Texas | ||
Covanta | NRG | • West Virginia | ||
CPS San Antonio | Orange County Transportation Authority | • Wisconsin | ||
Domtar | PEPCO | U.S. Government: | ||
Dominion | PG&E Corporation | • Department of Defense | ||
DCP Midstream | Phillips 66 | • Environmental Protection Agency | ||
El Paso Electric | PolyOne | • Federal Aviation Administration | ||
Enbridge Inc. | PPL | • General Services Administration | ||
Competition
We provide a broad spectrum of consulting, engineering and technical services across our operating segments. There are a number of engineering and consulting firms and other organizations that offer many of the same services offered by us. Competitive factors include reputation, performance, expertise, price, geographic location and technical capability. As a mid-size firm, we compete with both the large international firms that have substantially greater resources than we do and small niche or geographically focused firms.
The majority of our work comes from repeat orders from long-term clients, especially where we are one of the leading service providers in the markets we address. For example, we believe that we are one of the top providers of licensing services for large energy projects. By continuing to stay in front of emerging trends in our markets, we believe our competitive position will remain strong.
Backlog
As of June 30, 2016, our contract backlog based on gross revenue was $599 million, compared to $526 million as of June 30, 2015. Our contract backlog based on NSR was $367 million as of June 30, 2016, compared to $317 million as of June 30, 2015. Typically, about 60% of backlog is completed in one year. In addition to this contract backlog, we hold open-order contracts from various commercial clients and government agencies. As work under these contracts is authorized and funded, we include this portion in our contract backlog. While most contracts contain cancellation provisions, we are unaware of any material work included in backlog that will be canceled or delayed.
9
The following table sets forth the gross revenue and NSR contract backlog amounts of our operating segments at June 30, 2016 and June 30, 2015 (in millions):
Gross Revenue Backlog | NSR Backlog | ||||||||||||||||||||||||||||
June 30, | June 30, | Change | June 30, | June 30, | Change | ||||||||||||||||||||||||
(Dollars in millions) | 2016 | 2015 | $ | % | 2016 | 2015 | $ | % | |||||||||||||||||||||
Energy | $ | 155 | $ | 161 | $ | (6 | ) | (3.7 | )% | $ | 87 | $ | 96 | $ | (9 | ) | (9.4 | )% | |||||||||||
Environmental | 256 | 232 | 24 | 10.3 | % | 141 | 131 | 10 | 7.6 | % | |||||||||||||||||||
Infrastructure | 127 | 133 | (6 | ) | (4.5 | )% | 91 | 90 | 1 | 1.1 | % | ||||||||||||||||||
Pipeline Services | $ | 61 | $ | — | $ | 61 | N/A | $ | 48 | $ | — | $ | 48 | N/A | |||||||||||||||
Total | $ | 599 | $ | 526 | $ | 73 | 13.9 | % | $ | 367 | $ | 317 | $ | 50 | 15.8 | % | |||||||||||||
Seasonality
We experience seasonal trends in our business. Our revenue is typically lower in the second and third fiscal quarters, as our business is, to some extent, dependent on field work and construction scheduling and is also affected by holidays. Our revenue is lower during these times of the year because many of our clients' employees, as well as our own employees, do not work during those holidays, resulting in fewer billable hours charged to projects and thus, lower revenue recognized. In addition to holidays, harsher weather conditions that occur in the fall and winter can cause some of our offices to close and can significantly affect our project field work. Conversely, our business generally benefits from milder weather conditions in our first and fourth fiscal quarters which allow for more productivity from our field employees.
Employees
As of June 30, 2016, we had approximately 4,800 full- and part-time employees. Approximately 92% of these employees are engaged in performing professional services for clients. Many of these employees have advanced degrees. Our professional staff includes program managers, project managers, professional engineers and scientists, construction specialists, computer programmers, systems analysts, attorneys and others with degrees and experience that enable us to provide a diverse range of services. Other employees are engaged in executive, administrative and support activities. We consider the relationships with our unionized and non-unionized employees to be favorable.
Contracts with the United States Government and Agencies of State and Local Governments
We have contracts with agencies of the United States government and various state agencies that are subject to examination and renegotiation. We believe that adjustments resulting from such examination or renegotiation proceedings, if any, will not have a material impact on our business, financial condition, results of operations or cash flows.
Regulatory Matters
Our businesses are subject to various rules and regulations at the federal, state and local government levels. We believe that we are in substantial compliance with these rules and regulations. We have the appropriate licenses to bid and perform work in the locations in which we operate. We have not experienced any significant limitations on our business as a result of regulatory requirements. We do not believe any currently proposed changes in law or anticipated changes in regulatory practices would limit bidding on future projects.
Trademarks, Patents and Licenses
We have a number of trademarks, patents, copyrights and licenses. None of these are considered material to our business as a whole.
Environmental and Other Considerations
See Note 17, Commitments and Contingencies, in the Notes to Consolidated Financial Statements, included in Item 8, Financial Statements and Supplementary Data, of this Annual Report on Form 10-K for further discussion of our environmental matters.
10
With respect to matters that may currently be pending, in the opinion of management, based on our analysis of relevant facts and circumstances, compliance with relevant laws and regulations pertaining to environmental protection is not likely to have a material adverse effect upon our capital expenditures, earnings or competitive position. In arriving at this conclusion, we have taken into consideration available site-specific information regarding total costs of any work to be performed, and the extent of work previously performed. If the party from which we assumed responsibility is identified as a “potentially responsible party” ("PRP") by environmental authorities at a particular site, we will also review and consider a number of other factors, including: (i) the responsibility of other PRPs for contamination at the site; (ii) the financial resources of other PRPs involved in each site, and their proportionate share of the total volume of waste at the site; and (iii) the existence of insurance, if any, and the financial viability of the insurers.
Item 1A. Risk Factors
The risk factors listed below, in addition to those described elsewhere in this report, could materially and adversely affect our business, financial condition, results of operations or cash flows.
Risks Related to Our Company
Our business and operating results could be adversely affected by our inability to accurately estimate the overall risks, revenue or costs on a contract.
We generally enter into three principal types of contracts with our clients: fixed-price, time-and-materials, and cost-plus. Under our fixed-price contracts, we receive a fixed price irrespective of the actual costs we incur in performing the work, and, consequently, we are exposed to a number of risks. These risks include: underestimation of costs, problems with new technologies, unforeseen costs or difficulties, delays, price increases for materials, poor project management or quality problems, and economic and other changes that may occur during the contract period. Under our time-and-materials contracts, we are paid for labor at negotiated hourly billing rates and for other expenses. Profitability on these contracts is driven by billable headcount and cost control. Many of our time-and-materials contracts are subject to maximum contract values, and, consequently, expose us to the same risks as fixed price contracts. Under our cost-plus contracts, some of which are subject to contract ceiling amounts, we are reimbursed for allowable costs and fees which may be fixed or performance-based. If our costs exceed the contract ceiling or are not allowable, we may not be able to obtain reimbursement for all such costs. Accounting for a fixed-price contract requires judgments relative to assessing the contract's estimated risks, revenue and costs as well as technical issues. The uncertainties inherent in the estimating process make it possible for actual costs to vary from estimates, or estimates to change, resulting in reductions or reversals of previously recorded revenue and profit. Such variances could be material.
Our engagements involve a variety of projects, some of which are large-scale and complex. Our performance on projects depends in large part upon our ability to manage the relationship with our clients and to effectively manage the project and deploy appropriate resources, including third-party contractors and our own personnel, in a timely manner. If we miscalculate, or fail to properly manage, the resources or time we need to complete a project with capped or fixed fees, or the resources or time we need to meet contractual obligations, our operating results could be adversely affected. Furthermore, any defects, errors or failures to meet our clients' expectations could result in rework or claims against us.
Exit Strategy projects typically involve complex multi-year environmental remediation which must be approved by regulators both as to remedial approach as well as the achievement of the final result. Exit Strategy projects were typically funded by a deposit by the client of most of the contract price into a restricted account with an insurer as well as an insurance policy paid for by the client to cover costs above the amount in the restricted account up to the policy limit. The insurance policies expire after their stated policy term. To the extent the costs to complete a project exceed the amount in the restricted account or policy limit or the project is not completed within the policy term, we could incur an uncovered loss on such a project.
If we miss a required performance standard, fail to timely complete, or otherwise fail to adequately perform on a project, we may incur a loss on that project which may reduce or eliminate our overall profitability.
We may commit to a client that we will complete a project by a scheduled date. We may also commit that a project, when completed, will achieve specified performance standards. If the project is not completed by the scheduled date or fails to meet required performance standards, we may incur additional costs or be held responsible for damages due to late completion or failure to achieve the required performance standards. The uncertainty of the timing of a project can present difficulties in planning the amount of personnel and resources needed for the project. If the project is delayed or canceled, we may bear the cost of an underutilized workforce. In addition, performance on projects can be affected by a number of factors beyond our control, including unavoidable delays from weather conditions, changes in the project scope, unanticipated site conditions or other disruptions. In some cases, should we fail to meet the required schedule or performance standards, we may also be subject to agreed-upon financial damages which are determined by the contract. To the extent that these events occur, the total costs of the project could exceed our estimates or, in some cases, cause a loss which may reduce or eliminate our overall profitability or cause a financial loss.
11
Our dependence on subcontractor, supplier, and equipment manufacturers including their performance and pricing could result in losses, reduced profits or lower margins.
We often hire subcontractors for our projects. On certain projects we also rely on manufacturers and suppliers to provide materials and equipment. The success of these projects depends, in varying degrees, on the satisfactory performance of those subcontractors, suppliers and manufacturers and our ability to successfully manage their costs and pass them through to our customers. If our subcontractors, suppliers, or manufacturers do not meet their obligations, including quality, quantity, pricing and on-time delivery, or we are unable to manage or pass through their costs to our clients, we may be unable to profitably perform and deliver our contracted services. Under these circumstances we may be required to make additional investments and expend additional resources to ensure the adequate performance and delivery of the contracted services or products. These additional obligations could result in reduced profits or significant losses. In addition, the inability of our subcontractors, suppliers and manufacturers to adequately perform could hurt our competitive reputation and ability to obtain future projects.
Work that is subcontracted generally yields lower margins. An increase in subcontract work in a particular time frame may contribute to a decrease in margins and an increase in our working capital requirements. In addition, subcontracting can require the deployment of large amounts of working capital and our level of gross revenue reflects the level of subcontracting and potential working capital needs.
If we must write off a significant amount of intangible assets or long-lived assets, our earnings will be negatively impacted.
Goodwill was approximately $75.3 million as of June 30, 2016. We also had other identifiable intangible assets of $46.0 million, net of accumulated amortization, as of June 30, 2016. Goodwill and identifiable intangible assets are assessed for impairment at least annually or whenever events or changes in circumstances indicate that the carrying value of the assets may not be recoverable. We recorded a goodwill impairment charge of $22.0 million in fiscal year 2016 and have incurred goodwill impairments in past years. A decline in the estimated future cash flows of our reporting units, declines in market multiples of comparable companies and other factors could result in impairments of goodwill or other assets which would negatively impact our earnings or result in a net loss.
We are and will continue to be involved in litigation. Legal defense and settlement expenses or unfavorable outcomes can have a material adverse impact on our operating results.
We have been, and likely will be, named as a defendant in legal actions claiming damages and other relief in connection with engineering and construction projects and other matters. These are typically actions that arise in the normal course of business, including employment-related claims, contractual disputes, professional liability, or claims for personal injury or property damage. We have substantial deductibles on several of our insurance policies, and not all claims are insured. In addition, we have also incurred legal defense and settlement expenses related to prior acquisitions. Accordingly, defense costs, settlements and potential damage awards may have a material adverse effect on our business, financial condition, results of operations or cash flows in future periods.
Our operations could require us to utilize large sums of working capital, sometimes on short notice and sometimes without the ability to recover the expenditures.
Circumstances or events which could create large cash outflows include losses resulting from fixed-price contracts, remediation of environmental liabilities, legal expenses and settlements, project completion delays, failure of clients to pay, failure of subcontractors to perform, income tax assessments and professional liability claims, among others. We cannot provide assurance that we will have sufficient liquidity or the credit capacity to meet all of our cash needs if we encounter significant working capital requirements as a result of these or other factors.
Our services expose us to significant risks of liability, and it may be difficult or more costly to obtain or maintain adequate insurance coverage.
Our services involve significant risks that may substantially exceed the fees we derive from our services. Our business activities expose us to potential liability for professional negligence, personal injury and property damage among other things. We cannot always predict the magnitude of such potential liabilities. In addition, our ability to perform certain services is dependent on the availability of adequate insurance.
We obtain insurance from insurance companies to cover a portion of our potential risks and liabilities subject to specified policy limits, deductibles or coinsurance. It is possible that we may not be able to obtain adequate insurance to meet our needs or may have to pay an excessive amount for the insurance coverage we want. In addition, we may not be able to acquire any insurance for certain types of business risks. Almost all of the cost cap and related insurance purchased by Exit Strategy clients has been underwritten by AIG. The Exit Strategy related policies all tend to be long term; many are ten years or more. Some policies also serve to satisfy state and federal financial assurance requirements for certain projects, and without these policies, alternative
12
financial assurance arrangements would need to be arranged. Additionally, most of our Exit Strategy projects require us to perform the work in the event insurance limits are exhausted or the insurer will not pay, directly exposing us to financial risks.
We are self-insured or carry deductibles for a significant portion of our claims exposure, which could materially and adversely affect our operating income and profitability.
We carry large deductibles for a portion of our business and professional insurance and are self-insured for our employee benefit claims exposure. Because of these deductibles and self-insured amounts, we are exposed to fluctuations in the number and severity of claims. As a result, our insurance and claims expense could increase in the future. If any claim exceeds our insurance coverage, we would bear the excess expense in addition to applicable deductibles on self-insured. If the frequency or severity of claims or our expenses increase, our operating income and profitability could be materially adversely affected.
Our profitability could suffer if we are not able to maintain adequate utilization of our workforce.
As a service organization, the percentage of our employees' time that is chargeable to clients (utilization) is a key factor. The rate at which we utilize our workforce is affected by a number of factors, including:
• | Our ability to transition employees from completed projects to new assignments and to hire and assimilate new employees; |
• | Our ability to forecast demand for our services and thereby maintain an appropriate headcount in each of our geographies and workforces; |
• | Our ability to manage attrition; |
• | Our need to devote time and resources to training, business development, professional development and other non-chargeable activities; and |
• | Our ability to match the skill sets of our employees to the needs of the marketplace. |
Our backlog is subject to cancellation and unexpected adjustments and is an uncertain indicator of future operating results.
Our contract backlog based on NSR as of June 30, 2016 was $367 million. We cannot guarantee that the NSR projected in our backlog will be realized or, if realized, will result in profits. In addition, project cancellations or scope adjustments may occur from time to time with respect to contracts reflected in our backlog. Backlog reductions could adversely affect our revenue and margins. Accordingly, our backlog as of any particular date is an uncertain indicator of our future revenue or earnings.
Acquisitions, joint ventures and strategic alliances may not be successful.
We expect to continue making acquisitions or entering into joint ventures and strategic alliances as part of our long-term business strategy. These transactions involve challenges and risks including that the transaction does not advance our business strategy; that we don't realize a satisfactory return on our investment; that we experience difficulty integrating new employees, business systems, technology, and cultures; or that management's attention is diverted from our other businesses. It may take longer than expected to realize the full benefits of acquisitions, such as increased revenue, enhanced efficiencies, or market share, or those benefits may ultimately be smaller than anticipated, or may not be realized. These events could harm our operating results or financial condition.
If we are not able to successfully manage our growth strategy, our business and results of operations may be adversely affected.
Our expected future growth presents numerous managerial, administrative, operational and other challenges. Managing the growth of our operations will require us to increase the capacity of our management information systems and maintain strong internal systems and controls. In addition, our growth will increase our need to attract, develop, motivate and retain management and professional employees. Our inability to effectively manage growth or the inability of our employees to achieve anticipated performance could have a material adverse effect on our business.
Our operating results may be adversely impacted by worldwide political and economic uncertainties and conditions in the markets we address.
Economic conditions may affect businesses such as ours in a number of ways. While management cannot directly measure or predict it, variability in the economy and any corollary impact on the availability of credit could affect our customers and vendors and could result in a decrease in their business with us which could adversely affect our ability to generate profits and cash flows.
General economic uncertainty, including fluctuations in key commodity prices, may impact the ability of our clients and our vendors to accurately forecast and plan future business activities and could cause businesses to slow spending on services. These conditions can also make it difficult for us to estimate the short-term and long-term impacts on our business. We cannot predict
13
overall economic conditions. If the economy or markets in which we operate deteriorate, our business, financial condition and results of operations may be materially and adversely affected.
Risks Related to Our Industry
Changes in existing laws, regulations and programs or reductions in the level of regulatory enforcement could reduce demand for our environmental services which could cause our revenue to decline.
While we pursue markets for our services that are economically driven, our business is also materially dependent on the continued enforcement by federal, state and local governments of various laws, regulations or programs related to environmental protection, health and safety, system integrity and related matters. A significant amount of our business is generated either directly or indirectly as a result of existing federal and state laws, regulations and programs related to environmental protection. Accordingly, a relaxation or repeal of these laws and regulations, or changes in governmental policies regarding the funding, implementation or enforcement of these and similar programs, could result in a decline in demand for services that may have a material adverse effect on our revenue and business prospects.
We operate in highly competitive industries.
The markets for many of our services are highly competitive. There are numerous professional architectural, engineering and consulting firms and other organizations which offer many of the services offered by us. We compete with many companies, some of which have greater resources. Competitive factors include reputation, performance, price, geographic location and technical capabilities. In addition, many clients also use in-house staff to perform the same types of services we do.
We are dependent upon the level of capital expenditures by oil and gas and electric power companies on infrastructure. Market conditions, including continued low oil and natural gas prices, may adversely impact our customers' future spending.
Our revenue and cash flow are dependent upon major construction projects. The availability of these types of projects is dependent upon the economic condition of the oil and gas and electric power industries, and specifically, the level of capital expenditures of oil and gas and electric power companies on infrastructure. Our failure to obtain projects, the delay in awards of projects, the cancellation of projects or delays in completion of projects are factors that could have adverse impact on our revenue and cash flow. Numerous factors beyond our control influence the level of these capital expenditures, including:
• | Oil and gas and electric power prices; |
• | The demand for oil and gas products and electricity; |
• | The abilities of oil and gas and electric power companies to generate, access and deploy capital; |
• | Available pipeline, storage and other transportation capacity |
• | Regulatory constraints on the rates that electric power companies may charge their customers; |
• | Local and international political and economic conditions; |
• | Seasonal limitations on access to work locations; and |
• | Technological advances. |
In particular, a large number of midstream companies have recently announced reductions in their capital expenditure budgets due to the recent and prolonged decline in crude oil and natural gas prices. Additional delays or cancellations of projects are likely to occur especially in those areas where the costs of production may exceed current commodity prices.
We are materially dependent on contracts with federal, state and local governments. Our inability to continue to win or renew government contracts could result in material reductions in our revenues and profits.
We have increased our business with the federal, state and local governments in recent years and are materially dependent on such contracts. We estimate that contracts with agencies of the United States government and various state and local governments represented approximately 15% of our NSR in fiscal year 2016. Companies engaged in government contracting are subject to certain unique business risks. Among these risks are dependence on appropriations and administrative allotment of funds as well as changing policies and regulations. These contracts may also be subject to renegotiation of profits or termination at the option of the government. The stability and continuity of that portion of our business depends on the periodic exercise by the government of contract renewal options, our continued ability to negotiate favorable terms and the continued awarding of task orders to us.
We are subject to procurement laws and regulations associated with our government contracts. If we do not comply with these laws and regulations we may be prohibited from completing our existing government contracts or suspended from government contracting and subcontracting for some period of time or debarred.
14
Our compliance with the laws and regulations relating to the procurement, administration, and performance of government contracts is dependent on our ability to properly design and execute appropriate procedures. Our termination from any of our larger government contracts or suspension from future government contracts for any reason would result in material declines in expected revenue. Because government agencies have the ability to terminate a contract for convenience, the agencies could terminate or decide not to renew our contracts with little prior notice.
Our government contracts are subject to audit. These audits may result in the determination that certain costs claimed as reimbursable are not allowable or have not been properly allocated. We are subject to audits for several years after payment for services has been received. Based on these audits, government entities may adjust or seek reimbursement for previously paid amounts. None of the audits performed to date on our government contracts have resulted in any significant adjustments to our financial statements. It is possible, however, that an audit in the future could have an adverse effect on our business, financial condition, results of operations or cash flows.
Reductions in state and local government budgets could negatively impact their capital spending and adversely affect our business, financial condition and results of operations.
Our state and local government clients may face budget challenges that prohibit them from funding new or existing projects. In addition, existing and potential clients may either postpone entering into new contracts or request price concessions. If we are not able to respond to the revenue decline from these clients that may occur, our operating results could be adversely affected.
Other Risks
We are highly dependent on key personnel.
The success of our business depends on our ability to attract and retain qualified employees, and personal client relationships are critical to our success. We need talented and experienced personnel to support our business activities. An inability to attract and retain the right people would harm our business. Turnover among certain critical staff could have a material adverse effect on our ability to implement our strategies and our results of operations.
Safety related issues could result in significant losses.
We often work on large-scale and complex projects, sometimes in geographically remote locations which can place our employees and others in challenging environments and near large equipment, dangerous processes or highly regulated materials. Many of our clients require that we meet certain safety criteria to be eligible to bid on contracts, and some of our contract fees or profits are subject to satisfying safety criteria. Unsafe work conditions can also increase employee turnover and project and operating costs. The safety of our employees is our paramount value, and we are responsible for the safety of our employees at work, and, on occasion on certain projects, we take on expanded site safety responsibilities. If our employees or others become injured, or if we fail to implement appropriate health and safety procedures, we could be subject to claims and liability. In addition, if our overall safety performance falls below certain levels we may be foreclosed from bidding on work with certain clients.
We rely on third-party, internal and web-based software to run our critical accounting, project management and financial information systems. As a result, any sudden failure, unavailability, disruption or unexpected costs to maintain these systems could significantly increase our operational expense and disrupt the management of our business operations.
We rely on third-party software to run our critical accounting, project management and financial information systems. We also depend on our software vendors to provide long-term software maintenance support for our information systems. Software vendors could decide to discontinue further development, integration or long-term software maintenance support for our information systems in which case we might need to abandon one or more of our current information systems and migrate some or all of our accounting, project management and financial information to other systems, which could increase our operational expense and disrupt the management of our business operations.
Our information technology systems, processes, and sites may suffer interruptions, failures, or attacks which could affect our ability to conduct business.
Our information technology systems provide critical data connectivity, information and services for internal and external users. These include, among other things, processing transactions, summarizing and reporting results of operations, complying with regulatory, legal or tax requirements, storing project information and other processes necessary to manage the business. Our systems and technologies, or those of third parties on which we rely, could fail or become unreliable due to equipment failures, software viruses, cyber threats, terrorist acts, natural disasters, power failures or other causes. Cybersecurity threats are evolving and include, but are not limited to, malicious software, cyber espionage, attempts to gain unauthorized access to our sensitive information, including that of our customers, suppliers, and subcontractors, and other electronic security breaches that could lead
15
to disruptions in mission critical systems, unauthorized release of confidential or otherwise protected information, and corruption of data. Although we utilize various procedures and controls to monitor and mitigate these threats, there can be no assurance that these procedures and controls will be sufficient to prevent security threats from materializing. If any of these events were to materialize, the costs related to cyber or other security threats or disruptions may not be fully insured or indemnified and could have a material adverse effect on our reputation, operating results, and financial condition.
The value of our equity securities could continue to be volatile.
Our stock is thinly traded, and over time has experienced substantial price volatility. In addition, the stock market has experienced price and volume fluctuations that have affected the market price of many companies that have often been unrelated to the operating performance of these companies. The overall market and the price characteristics of our common stock may continue to fluctuate. Additionally, volatility or a lack of positive performance in our stock price may adversely affect our ability to retain or attract key employees. Many of these key employees are granted stock options and restricted stock (the value of which is dependent on our stock price) as an element of compensation.
Extraordinary events, including natural disasters and terrorist actions could negatively impact the economies in which we operate or disrupt our operations which may affect our business, financial condition, results of operations or cash flows.
Extraordinary events beyond our control, such as natural and man-made disasters, as well as terrorist actions, could negatively impact us by causing the closure of offices, interrupting projects and forcing the relocation of employees. If we are not able to react quickly to these sorts of events, our operations may be affected, which could have a negative impact on our business, financial condition, results of operations or cash flows.
Item 1B. Unresolved Staff Comments
None.
Item 2. Properties
We provide our services through a network of approximately 130 offices located nationwide. We lease approximately 1,050,000 square feet of office and commercial space to support these operations. Our significant lease agreements expire at various dates through fiscal year 2026. We also have some month-to-month leases. In addition, a subsidiary of ours owns a 26,000 square foot office/warehouse building in Austin, Texas. All properties are adequately maintained and are suitable and adequate for the business activities conducted therein. In connection with the performance of certain Exit Strategy or real estate projects, some of our subsidiaries have taken title to sites on which environmental remediation activities are being performed. The following table summarizes our ten most significant leased properties by location based on annual rental expenses:
Property Location | Operating Segment | |
Irvine, CA | Corporate, Energy, Environmental, and Infrastructure | |
Lowell, MA | Corporate, Environmental, and Infrastructure | |
New Providence, NJ | Environmental | |
New York, NY | Corporate, Energy, Environmental, and Infrastructure | |
Windsor, CT | Corporate and Environmental | |
Augusta, ME | Corporate, Energy, and Environmental | |
Madison, WI | Corporate and Environmental | |
Greenville, SC | Corporate and Environmental | |
Tulsa, OK | Environmental, and Pipeline Services | |
San Francisco, CA | Energy and Environmental | |
Item 3. Legal Proceedings
See Note 17 "Commitments and Contingencies - Legal Matters" of the Notes to Consolidated Financial Statements (Part II, Item 8 of this Form 10-K) for information regarding legal proceedings in which we are involved.
Item 4. Mine Safety Disclosures
Not Applicable.
16
PART II
Item 5. Market for Registrant's Common Equity, Related Stockholder Matters and Issuer Purchases of Equity Securities
Our common stock is traded on the New York Stock Exchange ("NYSE") under the symbol "TRR." The following table sets forth the high and low sales prices per share for the common stock for fiscal years 2016 and 2015 as reported on the NYSE:
Fiscal 2016 | Fiscal 2015 | ||||||||||||||
High | Low | High | Low | ||||||||||||
First Quarter | $ | 12.19 | $ | 8.74 | $ | 6.73 | $ | 4.83 | |||||||
Second Quarter | 12.15 | 9.35 | 7.30 | 6.15 | |||||||||||
Third Quarter | 9.58 | 6.13 | 8.89 | 6.28 | |||||||||||
Fourth Quarter | 8.58 | 5.80 | 11.49 | 7.42 | |||||||||||
As of June 30, 2016, there were 243 shareholders of record, and, as of that date, we estimate there were approximately 2,000 beneficial owners holding our common stock in nominee or "street" name.
To date, we have not paid any cash dividends on our common stock, and the payment of dividends in the future will be subject to our financial condition, capital requirements and earnings. Our credit agreement also limits the payment of cash dividends to $10.0 million during its term. Future earnings are expected to be used for expansion of our operations, and cash dividends are not currently anticipated.
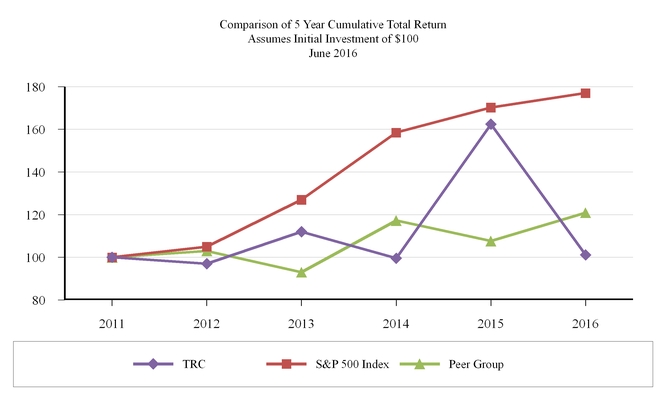
Stock Performance Graph
Comparison of Five-Year Cumulative Total Return Among TRC, S&P 500 Total Return Index and Peer Companies
The annual changes for the five-year period shown in the graph below are based upon the assumption (as required by SEC rules) that $100 had been invested on June 30, 2011 in (1) our Common Stock, (2) the S&P 500 Index and (3) a peer group index that consists of several peer companies (referred to as the "Peer Group") as defined below. The figures presented assume that all dividends, if any, paid over the performance periods were reinvested. The comparison in the graph below is based on historical data and is not intended to forecast the possible future performance of our Common Stock.
17
Data and graph provided by Zacks Investment Research, Inc. Copyright© 2016, Standard & Poor's, a division of The McGraw-Hill Companies, Inc. All rights reserved.
Year Ended June 30, | |||||||||||||||||||||||
2011 | 2012 | 2013 | 2014 | 2015 | 2016 | ||||||||||||||||||
TRC | $ | 100.00 | $ | 97.28 | $ | 112.00 | $ | 99.52 | $ | 162.40 | $ | 101.12 | |||||||||||
S&P 500 Index | 100.00 | 105.45 | 127.17 | 158.46 | 170.22 | 177.00 | |||||||||||||||||
Peer Group | 100.00 | 103.33 | 93.34 | 117.22 | 107.60 | 120.88 | |||||||||||||||||
The companies included in our Peer Group are: Ecology & Environment, Inc.; ENGlobal Corp.; Hill International, Inc.; Tetra Tech, Inc.; and Versar, Inc.
18
Item 6. Selected Financial Data
The following selected financial data was derived from our consolidated financial statements and provides summarized information with respect to our operations and financial position. The data set forth below should be read in conjunction with the information contained in Item 7, "Management's Discussion and Analysis of Financial Condition and Results of Operations," and our consolidated financial statements and the notes thereto contained in Item 8, "Financial Statements and Supplementary Data," of this report.
Statements of Operations Data, for the fiscal years ended June 30, | 2016 (1) | 2015 | 2014 | 2013 | 2012 | ||||||||||||||
(in thousands, except per share data) | |||||||||||||||||||
Gross revenue | $ | 620,864 | $ | 546,117 | $ | 475,677 | $ | 441,517 | $ | 419,959 | |||||||||
Less subcontractor costs and other direct reimbursable charges | 155,735 | 138,099 | 120,721 | 121,114 | 118,179 | ||||||||||||||
Net service revenue | 465,129 | 408,018 | 354,956 | 320,403 | 301,780 | ||||||||||||||
Interest income from contractual arrangements | 122 | 97 | 52 | 239 | 295 | ||||||||||||||
Insurance recoverables and other income | 16,048 | 6,533 | 17,874 | 4,514 | 614 | ||||||||||||||
Operating costs and expenses: | |||||||||||||||||||
Cost of services (exclusive of costs shown separately below) | 402,317 | 337,291 | 312,108 | 268,545 | 246,506 | ||||||||||||||
General and administrative expenses | 34,375 | 37,331 | 31,053 | 31,147 | 31,780 | ||||||||||||||
Acquisition and integration expense | 6,571 | — | — | — | — | ||||||||||||||
Goodwill impairment (2) | 21,981 | — | — | — | — | ||||||||||||||
Depreciation | 6,890 | 5,814 | 5,932 | 5,309 | 4,818 | ||||||||||||||
Amortization | 7,835 | 3,502 | 2,868 | 1,594 | 690 | ||||||||||||||
Arena Towers litigation reversal (3) | — | — | — | — | (11,061 | ) | |||||||||||||
Total operating costs and expenses | 479,969 | 383,938 | 351,961 | 306,595 | 272,733 | ||||||||||||||
Operating income | 1,330 | 30,710 | 20,921 | 18,561 | 29,956 | ||||||||||||||
Interest income | 840 | — | — | — | — | ||||||||||||||
Interest expense | (2,707 | ) | (134 | ) | (169 | ) | (337 | ) | (668 | ) | |||||||||
(Loss) income from operations before taxes and equity in earnings | (537 | ) | 30,576 | 20,752 | 18,224 | 29,288 | |||||||||||||
Federal and state income tax benefit (provision) (4) | 670 | (11,180 | ) | (8,742 | ) | 17,986 | 3,930 | ||||||||||||
Income from operations before equity in earnings | 133 | 19,396 | 12,010 | 36,210 | 33,218 | ||||||||||||||
Equity in earnings from unconsolidated affiliates, net of taxes | — | — | — | — | 270 | ||||||||||||||
Net income | 133 | 19,396 | 12,010 | 36,210 | 33,488 | ||||||||||||||
Net (income) loss applicable to noncontrolling interest | (92 | ) | 19 | 41 | 65 | 87 | |||||||||||||
Net income applicable to TRC Companies, Inc. | 41 | 19,415 | 12,051 | 36,275 | 33,575 | ||||||||||||||
Basic earnings per common share | $ | — | $ | 0.64 | $ | 0.41 | $ | 1.26 | $ | 1.21 | |||||||||
Diluted earnings per common share | $ | — | $ | 0.63 | $ | 0.40 | $ | 1.23 | $ | 1.16 | |||||||||
Weighted-average common shares outstanding: | |||||||||||||||||||
Basic | 30,936 | 30,291 | 29,594 | 28,843 | 27,781 | ||||||||||||||
Diluted | 31,359 | 30,724 | 30,140 | 29,601 | 28,822 | ||||||||||||||
Balance Sheet Data at June 30: | |||||||||||||||||||
Total assets | $ | 478,478 | $ | 362,881 | $ | 335,585 | $ | 307,764 | $ | 275,128 | |||||||||
Long-term debt and capital lease obligations, including current portion | 97,582 | 271 | 1,297 | 6,670 | 5,904 | ||||||||||||||
Preferred stock | — | — | — | — | — | ||||||||||||||
Total equity | 152,815 | 147,915 | 124,883 | 106,897 | 68,048 | ||||||||||||||
_________________________________
(1) | On November 30, 2015, we acquired the Professional Services business ("Pipeline Services") of Willbros Group ("Willbros"). The operating results of Pipeline Services are included in our consolidated financial statements under the Pipeline Services operating segment from the date of acquisition. |
(2) | During fiscal year 2016, we recorded a goodwill impairment charge of $22.0 million related to the Pipeline Services operating segment. |
(3) | During fiscal year 2011, the jury in the Arena Towers case returned a verdict against us in the amount of $15.4 million plus $2.9 million for pre-judgment interest. We incurred $17.3 million of litigation reserve expenses relating to this case in fiscal |
19
year 2011. During fiscal year 2012, we filed a post-trial motion to disregard the late fee portion of the verdict, resulting in an $11.1 million partial reversal of the previously recorded expense. A judgment was entered in the case on October 10, 2011, and on January 3, 2012 we paid $8.7 million in full satisfaction of the judgment and interest.
(4) | During the fiscal year 2013, we determined that it was more likely than not that our deferred tax assets would be realized. Accordingly, a deferred tax valuation allowance release of $25.6 million was recorded as a deferred income tax benefit, reducing the valuation allowance to zero. During fiscal year 2012, we recorded a tax benefit of $3.9 million primarily related to the remeasurement of uncertain tax positions as a result of a settlement with the IRS for fiscal years 2003 through 2008. |
20
Item 7. Management's Discussion and Analysis of Financial Condition and Results of Operations
You should read the following discussion of our results of operations and financial condition in conjunction with our consolidated financial statements and related notes included elsewhere in this Annual Report on Form 10-K. This discussion contains forward-looking statements that are based upon current expectations and assumptions that are subject to risks and uncertainties. Actual results and the timing of certain events may differ materially from those projected in such forward-looking statements due to a number of factors, including those discussed in Item 1A. "Risk Factors" beginning on page 11 and in the section entitled "Forward-Looking Statements" on page 3.
OVERVIEW
We are a firm that provides integrated engineering, consulting, and construction management services. Our project teams help our commercial and governmental clients implement environmental, energy, infrastructure, and pipeline projects from initial concept to delivery and operation. We provide our services almost entirely in the United States of America.
We generate revenue and cash flows from fees for professional and technical services. As a service company, we are more labor-intensive than capital-intensive. Our revenue and cash flow is driven by our ability to attract and retain qualified and productive employees, identify business opportunities, secure new and renew existing client contracts, provide outstanding service to our clients and execute projects successfully. Our income from operations is derived from our ability to generate revenue under our contracts in excess of our direct costs, subcontractor costs, other contract costs, and general and administrative ("G&A") expenses.
In the course of providing our services, we routinely subcontract services. Generally, these subcontractor costs are passed through to our clients and, in accordance with accounting principles generally accepted in the United States of America ("U.S. GAAP") and consistent with industry practice, are included in gross revenue. Because subcontractor services can change significantly from project to project, changes in gross revenue may not be indicative of business trends. Accordingly, we also report net service revenue ("NSR"), which is gross revenue less subcontractor costs and other direct reimbursable charges, and our discussion and analysis of financial condition and results of operations uses NSR as a primary point of reference.
The following table presents the approximate percentage of NSR by contract type:
Fiscal Year | ||||||||
2016 | 2015 | 2014 | ||||||
Time-and-materials | 69 | % | 66 | % | 60 | % | ||
Fixed-price | 29 | % | 32 | % | 37 | % | ||
Cost-plus | 2 | % | 2 | % | 3 | % | ||
100 | % | 100 | % | 100 | % | |||
Our cost of services ("COS") includes professional compensation and related benefits together with certain direct and indirect costs such as rents, utilities and travel. Professional compensation represents the majority of these costs. Our G&A expenses are comprised primarily of our corporate headquarters costs related to corporate executive management, finance, accounting, information technology, administration and legal. These costs are generally unrelated to specific client projects and can vary as expenses are incurred to support corporate activities and initiatives.
Our revenue, expenses and operating results may fluctuate significantly from year to year as a result of numerous factors, including:
• | Unanticipated changes in contract performance that may affect profitability, particularly with contracts that are fixed-price or have funding limits; |
• | Seasonality of the spending cycle, notably for state and local government entities, and the spending patterns of our commercial sector clients; |
• | Budget constraints experienced by our federal, state and local government clients; |
• | Divestitures or discontinuance of operating units; |
• | The timing and impact of acquisitions; |
• | Employee hiring, utilization and turnover rates; |
• | The number and significance of client contracts commenced and completed during the period; |
21
• | Creditworthiness and solvency of clients; |
• | The ability of our clients to terminate contracts without penalties; |
• | Delays incurred in connection with contracts; |
• | The size, scope and payment terms of contracts; |
• | Contract negotiations on change orders and collection of related accounts receivable; |
• | The timing of expenses incurred for corporate initiatives; |
• | Competition; |
• | Litigation; |
• | Changes in accounting rules; |
• | The credit markets and their effect on our customers; |
• | General economic or political conditions; and |
• | Employee expenses such as medical and other benefits. |
Acquisitions and Divestitures
Acquisitions. We continuously evaluate the marketplace for strategic acquisition opportunities. A fundamental component of our profitable growth strategy is to pursue acquisitions that will expand our platform in key U.S. markets. Where the impact of acquisitions is noted in discussing results, it refers to acquisitions effected within the last twelve months of the end of the relevant period.
Fiscal Year 2016 Acquisition
On November 30, 2015, we acquired the Professional Services business ("Pipeline Services") of Willbros Group ("Willbros") in an all cash transaction. The $124.5 million purchase price consisted of (i) an initial cash payment of $120.0 million paid at closing, and, (ii) a second cash payment due of $7.5 million payable at the earlier of certain Willbros contract novations (or written approval of a subcontract) and Willbros obtaining certain consents, or March 15, 2016, net of a preliminary estimate working capital adjustment due from Willbros. The second cash payment was made in two tranches, with $2.4 million paid in March 2016 and the remaining balance paid in July 2016 in conjunction with the final net working capital settlement. Goodwill of $60.3 million was initially recorded prior to impairment, all of which is expected to be tax deductible, and other intangible assets of $44.5 million were recorded as a result of this acquisition. The goodwill recognized is attributable to the future strategic growth opportunities arising from the acquisition, Pipeline Service's highly skilled assembled workforce, which does not qualify for separate recognition, and the expected cost synergies of the combined operations. The Pipeline Services operating segment has contributed $60.7 million in gross revenue, $48.4 million in net service revenue, and an operating loss of $(7.5) million to our results for the period from November 30, 2015 through June 30, 2016.
Fiscal Year 2015 Acquisition
On September 29, 2014, we acquired all of the outstanding stock of NOVA Training Inc. and all of the outstanding membership interests of NOVA Earthworks, LLC (collectively "NOVA") based in Midland, Texas. NOVA provides safety training and environmental services as well as oil spill response, remediation and general oil field construction services to customers in the oil and gas industry. The initial purchase price consisted of (i) a cash payment of $7.2 million payable at closing, (ii) a second cash payment of $2.6 million placed into escrow, of which $0.5 million was paid in six months and the remaining $2.1 million was paid in 18 months, (iii) 50 thousand shares of our common stock valued at $0.3 million on the closing date, and (iv) a $0.6 million net working capital adjustment. The sellers are also entitled to up to $1.5 million in contingent cash consideration through an earn-out provision based on the NSR performance of the acquired firm over the 24 month period following closing. We estimated the fair value of the remaining contingent earn-out liability to be $0.3 million based on the projections and probabilities of reaching the performance goals through September 2016. Goodwill of $3.7 million, none of which is expected to be tax deductible, and other intangible assets of $3.6 million were recorded as a result of this acquisition. The goodwill is primarily attributable to the synergies and ancillary growth opportunities expected to arise after the acquisition. The fair values of assets and liabilities of the NOVA acquisition have been recorded in the Environmental operating segment. The impact of this acquisition was not material to our condensed consolidated balance sheets and results of operations.
22
Fiscal Year 2014 Acquisitions
On January 2, 2014, we acquired all of the outstanding stock of EMCOR Energy Services, Inc. ("EES"), a subsidiary of EMCOR Group, Inc., headquartered in San Francisco, California. EES provides engineering and related consulting services to utilities to support their energy programs in California. Services include engineering, technical review, verification, and administration of utilities’ energy efficiency programs. The purchase price of $1.6 million consisted of a cash payment of $1.4 million, and a $0.2 million net working capital adjustment. Goodwill of $0.2 million, none of which is expected to be tax deductible, and other intangible assets of $0.9 million were recorded as a result of this acquisition. The EES acquisition has been recorded in the Energy operating segment. The impact of this acquisition was not material to our consolidated balance sheets and results of operations.
On July 22, 2013, we acquired all of the outstanding stock of Utility Support Systems, Inc. ("USS"), headquartered in Douglasville, Georgia. USS provides engineering and related services primarily supporting the power/utility market. The purchase price of $5.0 million consisted of: (i) cash of $2.5 million payable at closing, (ii) a second cash payment of $1.8 million payable on the one-year anniversary of the closing date subject to withholding for various contractual issues, and (iii) 34 thousand shares of our common stock valued at $0.3 million on the closing date. The selling shareholders were also entitled to contingent cash consideration through an earn-out provision based on NSR performance of the acquired firm over the twelve month period following closing. We estimated the fair value of the contingent earn-out liability to be $0.5 million based on the projections and probabilities of reaching the performance goals through July 2014. The earnout goals were not achieved, and the liability was subsequently reversed in fiscal year 2014. Goodwill of $2.2 million, none of which is expected to be tax deductible, and other intangible assets of $2.1 million were recorded as a result of this acquisition. The USS acquisition has been recorded in the Energy operating segment. The impact of this acquisition was not material to our consolidated balance sheets and results of operations.
Operating Segments
We manage our business under the following four operating segments:
Energy: The Energy operating segment provides services to a range of clients including energy companies, power utilities, other commercial entities, and state and federal government entities. Our services include program management, engineer/procure/construct projects, design, and consulting. Our typical projects involve upgrades, design and new construction for electric transmission and distribution systems and substations; energy efficiency program design and management; and renewable energy development and power generation.
Environmental: The Environmental operating segment provides services to a wide range of clients including industrial, transportation, energy and natural resource companies, as well as federal, state and municipal agencies. The Environmental operating segment is organized to focus on key areas of demand including: environmental management of buildings and facilities; air quality measurements and modeling of potential air pollution impacts; water quality and water resource management; assessment and remediation of contaminated sites and buildings; hazardous waste management; construction monitoring, inspection and management; environmental, health and safety management and sustainability advisory services; compliance auditing and strategic due diligence; environmental licensing and permitting of a wide variety of projects; and natural and cultural resource assessment, protection and management.
Infrastructure: The Infrastructure operating segment provides services related to the expansion of infrastructure capacity, and the rehabilitation of overburdened and deteriorating infrastructure systems. Our client base is predominantly state and municipal governments as well as select commercial developers. In addition, we provide infrastructure services on projects originating in our Energy and Environmental operating segments. Primary services include: roadway, bridge and related surface transportation design; structural design and inspection of bridges; program management; construction engineering inspection and construction management for roads and bridges; civil engineering for municipalities and public works departments; geotechnical engineering services; and security assessments, design and construction management.
Pipeline Services: The Pipeline Services operating segment provides pipeline and facilities engineering, EPC/EPCM, field services and integrity services to the oil and gas transmission and midstream markets, as well as at government facilities. We specialize in providing engineering services to assist clients in designing, engineering and constructing or expanding pipeline systems, compressor stations, pump stations, fuel storage facilities, terminals, and field gathering and production facilities. Our expertise extends to the engineering of a wide range of project peripherals, including various types of support buildings and utility systems, power generation and electrical transmission systems, communications systems, fire protection, water and sewage treatment, water transmission, roads and railroad sidings. We also provide project management, engineering and material procurement services to the refining industry and government agencies, including mechanical, civil, structural, electrical instrumentation/controls and environmental engineering. We provide
23
full-service integrity management program offerings including program development, data services, risk analysis, corrosion evaluation, integrity engineering and integrity construction services. We are partnered with Google to provide a cloud-based pipeline life-cycle integrity management solution, Integra Link™, which utilizes Google’s geospatial technology platform to help oil and gas pipeline companies visualize and utilize their data and information.
Our chief operating decision maker is our Chief Executive Officer ("CEO"). Our CEO manages the business by evaluating the financial results of the four operating segments, focusing primarily on segment revenue and segment profit. We utilize segment revenue and segment profit because we believe they provide useful information for effectively allocating resources among operating segments; evaluating the health of our operating segments based on metrics that management can actively influence; and gauging our investments and our ability to service, incur or pay down debt. Specifically, our CEO evaluates segment revenue and segment profit and assesses the performance of each operating segment based on these measures, as well as, among other things, the prospects of each of the operating segments and how they fit into our overall strategy. Our CEO then decides how resources should be allocated among our operating segments. We do not track our assets by operating segment, and consequently, it is not practical to show assets by operating segment. Segment profit includes all operating expenses except the following: costs associated with providing corporate shared services (including certain depreciation and amortization), goodwill and intangible asset write-offs, stock-based compensation expense and amortization of intangible assets. Depreciation expense is primarily allocated to operating segments based upon their respective use of total operating segment office space. Assets solely used by Corporate are not allocated to the operating segments. Inter-segment balances and transactions are not material. The accounting policies of the operating segments are the same as those for us as a whole except as discussed herein.
The following table presents the approximate percentage of our NSR by operating segment:
Fiscal Year | ||||||||
2016 | 2015 | 2014 | ||||||
Energy | 33 | % | 36 | % | 38 | % | ||
Environmental | 45 | % | 52 | % | 49 | % | ||
Infrastructure | 12 | % | 12 | % | 13 | % | ||
Pipeline | 10 | % | — | % | — | % | ||
100 | % | 100 | % | 100 | % | |||
Business Trend Analysis
Energy: The utilities in the United States are in the midst of a multi-year upgrade of the electric transmission grid to improve capacity, reliability and distribution of sources of generation. Years of underinvestment coupled with a favorable regulatory environment have provided a good business opportunity for those serving this market. According to the Edison Electric Institute, electric utilities throughout the United States will be investing over $60 billion in the performance of this work over the next several years. Economic impacts have slowed the pace of this investment, yet they do not appear to have affected the long term plan of investment. Demand for energy efficiency services continues to be supported by increasing state and federal funds targeted at energy efficiency. The Regional Green House Gas Initiative and system benefit charges at the state or utility level have expanded the marketplace for energy efficiency program management services. Investment within the renewable portfolios also remains strong. We are well established in the Northeast and Mid-Atlantic regions and are growing our presence in the Southeast and in Texas and California where demand for services is the highest.
Environmental: Although there had been signs of growth in this market following a slowdown caused by general economic conditions, market demand for environmental services continues to be mixed. The last decade saw growth in nearly all aspects of this market. The fundamental market drivers remain in place, and this market also benefits from evolving regulatory developments particularly with respect to air quality, and the continuing need to enhance our aging transportation and energy infrastructure. While we expect oil and gas activity and major capital projects to be constrained in the near term, the outlook for services related to other areas of the market, such as environmental remediation, construction, transaction support, the retirement of coal plants and the need to transport natural gas remains favorable. Renewables and other energy source initiatives present important market opportunities but are linked to federal and state policy changes which will be required for the markets to commit long-term capital to projects such as pipelines and related infrastructure.
Infrastructure: Long-term prospects should be favorable and our backlog is up significantly. The overall infrastructure construction markets are expected to benefit from the federal funding certainty provided by the new $305 billion highway bill known as the Fixing America’s Surface Transportation (FAST) Act. The bill calls for the spending of approximately $205 billion on highways and $48 billion on transit projects.
24
Pipeline Services: Our Pipeline Services segment is currently in the midst of a market downturn due to low oil and gas prices and uncertainty in the oil and gas markets. Nevertheless, long-term opportunities include mid-stream oil and natural gas liquid pipelines which are necessary to match takeaway capacity with levels of production, some of which is stranded due to inadequate pipeline infrastructure, primarily in the Marcellus and Utica shales. Additional future opportunities are presented by natural gas pipelines to take gas to LNG export facilities as well as Mexico and Latin America. Furthermore natural gas pipelines will be required as coal plants are retired and replaced with cleaner gas-burning plants. New regulatory requirements proposed by the Department of Transportation will lead to data and integrity requirements for pipeline operators where our technologies and services can be utilized.
Critical Accounting Policies
Our financial statements have been prepared in accordance with U.S. GAAP. These principles require the use of estimates and assumptions that affect amounts reported and disclosed in the financial statements and related notes. Actual results could differ from these estimates and assumptions. We use our best judgment in the assumptions used to compile these estimates, which are based on current facts and circumstances, prior experience and other assumptions that are believed to be reasonable. Our significant accounting policies are described in Note 2 to the consolidated financial statements contained in Item 8 of this report. We believe the following critical accounting policies reflect the more significant judgments and estimates used in preparation of our consolidated financial statements and are the policies which are most critical in the portrayal of our financial position and results of operations:
Revenue Recognition—We recognize contract revenue in accordance with Accounting Standards Codification ("ASC") Topic 605, Revenue Recognition. Specifically, we follow the guidance in ASC Subtopic 605-35, Revenue Recognition—Construction-Type and Production-Type Contracts.
Fixed-Price Contracts
We recognize revenue on fixed-price contracts using the percentage-of-completion method. Under this method of revenue recognition, we estimate the progress towards completion to determine the amount of revenue and profit to recognize on all significant contracts. We generally utilize an efforts-expended, cost-to-cost approach in applying the percentage-of-completion method under which revenue is earned in proportion to total costs incurred divided by total costs expected to be incurred.
Under the percentage-of-completion method, recognition of profit is dependent upon the accuracy of a variety of estimates including engineering progress, materials quantities, achievement of milestones and other incentives, liquidated-damages provisions, labor productivity and cost estimates. Such estimates are based on various judgments we make with respect to those factors and can be difficult to accurately determine until the project is significantly underway. Due to uncertainties inherent in the estimation process, actual completion costs often vary from estimates. If estimated total costs on any contract indicate a loss, we charge the entire estimated loss to operations in the period the loss first becomes known. If actual costs exceed the original fixed contract price, recognition of any additional revenue will be pursuant to a change order, contract modification, or claim.
We have entered into fixed-price Exit Strategy contracts to remediate environmental conditions at contaminated sites. Under most Exit Strategy contracts, the majority of the contract price was deposited by the client into a restricted account with an insurer. The funds in the restricted account are held by the insurer and used to pay us as work is performed. The arrangement with the insurer provides for the deposited funds to earn interest at the one-year constant maturity United States Treasury Bill rate. The interest is recorded when earned and reported as interest income from contractual arrangements on the consolidated statements of operations. On certain Exit Strategy projects, we have taken title to the underlying properties in order to facilitate access, remedial construction, performance of operations monitoring and maintenance activities, and the overall execution of the cleanup. As these properties are distressed, they have no value.
The Exit Strategy funds held by the insurer, including any interest thereon, are recorded as an asset (current and long-term restricted investment) on our consolidated balance sheets, with a corresponding liability (current and long-term deferred revenue) related to the funds. Consistent with our other fixed-price contracts, we recognize revenue on Exit Strategy contracts using the percentage-of-completion method. When determining the extent of progress towards completion on Exit Strategy contracts, prepaid insurance premiums and fees are amortized, on a straight-line basis, to cost incurred over the life of the related insurance policy. Certain Exit Strategy contracts were classified as pertaining to either remediation or operation, maintenance and monitoring. In addition, certain Exit Strategy contracts were segmented such that the remediation and operation portion of the contract is separately accounted for from the maintenance and monitoring portion.
Under most Exit Strategy contracts, additional payments were made by the client to the insurer, typically through an insurance broker, for insurance premiums and fees for a policy to cover potential costs in excess of the original estimates and other factors
25
such as third party liability. For Exit Strategy contracts where we establish that (1) costs exceed the contract value and interest growth thereon and (2) such costs are covered by insurance, we record an estimated insurance recovery up to the amount of insured costs. An insurance gain, that is, an amount to be recovered in excess of our recorded costs, is not recognized until the receipt of insurance proceeds. Insurance recoveries are reported as insurance recoverables and other income on our consolidated statements of operations. If estimated total costs on any contract indicate a loss, we charge the entire estimated loss to operations in the period the loss first becomes known.
Unit price contracts are a subset of fixed-price contracts. Under unit price contracts, our clients pay a set fee for each unit of service or production. We recognize revenue under unit price contracts as we complete the related service transaction for our clients. If our costs per service transaction exceed original estimates, our profit margins will decrease, and we may realize a loss on the project unless we can receive payment for the additional costs.
Time-and-Materials Contracts
Under time-and-materials contracts, we negotiate hourly billing rates and charge our clients based on the actual time that we expend on a project. In addition, clients reimburse us for actual out-of-pocket costs of materials and other direct reimbursable expenses that we incur in connection with our performance under the contract. Our profit margins on time-and-materials contracts fluctuate based on actual labor and overhead costs that we directly charge or allocate to contracts compared to negotiated billing rates. Revenue on time-and-materials contracts is recognized based on the actual number of hours we spend on the projects plus any actual out-of-pocket costs of materials and other direct reimbursable expenses that we incur on the projects.
Cost-Plus Contracts
Cost-Plus Fixed Fee Contracts. Under our cost-plus fixed fee contracts, we charge clients for our costs, including both direct and indirect costs, plus a fixed negotiated fee. In negotiating a cost-plus fixed fee contract, we estimate all recoverable direct and indirect costs and then add a fixed profit component. The total estimated cost plus the negotiated fee represents the total contract value. We recognize revenue based on the actual labor and non-labor costs we incur plus the portion of the fixed fee we have earned to date.
Cost-Plus Fixed Rate Contracts. Under our cost-plus fixed rate contracts, we charge clients for our costs plus negotiated rates based on our indirect costs. In negotiating a cost-plus fixed rate contract, we estimate all recoverable direct and indirect costs and then add a profit component, which is a percentage of total recoverable costs, to arrive at a total dollar estimate for the project. We recognize revenue based on the actual total costs we have expended plus the applicable fixed rate. If the actual total costs are lower than the total costs we have estimated, our revenue from that project will be lower than originally estimated.
Change Orders/Claims
Change orders are modifications to an original contract that change the provisions of the contract. Change orders typically result from changes in scope, specifications or design, manner of performance, facilities, equipment, materials, sites, or period of completion of the work. Claims are amounts in excess of the agreed contract price that we seek to collect from our clients or others for delays, errors in specifications and designs, contract terminations, change orders that are either in dispute or are unapproved as to both scope and price, or other causes.
Costs related to change orders and claims are recognized when they are incurred. Change orders are included in total estimated contract revenue when it is probable that the change order will result in a bona fide addition to contract value and can be reliably estimated. Claims are included in total estimated contract revenues only to the extent that contract costs related to the claims have been incurred and when it is probable that the claim will result in a bona fide addition to contract value which can be reliably estimated. No profit is recognized on claims until final settlement occurs. For the fiscal years ended June 30, 2016, 2015 and 2014, we did not recognize any revenue related to claims.
Other Contract Matters
Federal Acquisition Regulations ("FAR"), which are applicable to our federal government contracts and may be incorporated in many local and state agency contracts, limit the recovery of certain specified indirect costs on contracts. Cost-plus contracts covered by FAR or with certain state and local agencies also require an audit of actual costs and provide for upward or downward adjustments if actual recoverable costs differ from billed recoverable costs. Most of our federal government contracts are subject to termination at the discretion of the client. Contracts typically provide for reimbursement of costs incurred and payment of fees earned through the date of such termination.
Contracts with the federal government are subject to audit, primarily by the Defense Contract Audit Agency ("DCAA"), which reviews our overhead rates, operating systems and cost proposals. During the course of its audits, the DCAA may disallow costs if it determines that we have accounted for such costs in a manner inconsistent with Cost Accounting Standards or FAR. Our last incurred cost audit was for fiscal year 2004 and resulted in an immaterial adjustment. DCAA determined that an audit of incurred
26
cost proposals submitted to DCAA for fiscal years 2005 through 2013 was not required. Historically, we have not had any material cost disallowances by the DCAA as a result of audit, however there can be no assurance that DCAA audits will not result in material cost disallowances in the future.
Allowance for Doubtful Accounts—An allowance for doubtful accounts is maintained for estimated losses resulting from the failure of our clients to make required payments. The allowance for doubtful accounts has been determined through reviews of specific amounts deemed to be uncollectible and estimated write-offs as a result of clients who have filed for bankruptcy protection plus an allowance for other amounts for which some loss is determined to be probable based on current circumstances. If the financial condition of clients or our assessment as to collectability were to change, adjustments to the allowances may be required.
Income Taxes—We are required to estimate the provision for income taxes, including the current tax expense together with assessing temporary differences resulting from differing treatments of assets and liabilities for tax and financial accounting purposes. These differences between the financial statement and tax bases of assets and liabilities, together with net operating loss ("NOL") carryforwards and tax credits are recorded as deferred tax assets or liabilities on the consolidated balance sheets. An assessment is required to be made of the likelihood that the deferred tax assets will be recovered from future taxable income. To the extent that we determine that it is more likely than not that the deferred asset will not be utilized, a valuation allowance is established. Taxable income in future periods significantly above or below that projected will cause adjustments to the valuation allowance that could materially decrease or increase future income tax expense.
We recognize the tax benefit from an uncertain tax position only if it is more likely than not that the tax position will be sustained on examination by the taxing authorities based on the technical merits of the position. The tax benefits recognized in the financial statements from such a position are measured based on the largest benefit that has a greater than 50% likelihood of being realized upon ultimate settlement. Accounting literature also provides guidance on derecognition of income tax assets and liabilities, classification of current and deferred income tax assets and liabilities, accounting for interest and penalties associated with tax positions, and income tax disclosures. Judgment is required in assessing the future tax consequences of events that have been recognized in our financial statements or tax returns. Variations in the actual outcome of these future tax consequences could materially impact our financial statements.
Acquisitions—We account for acquisitions using the acquisition method of accounting, which requires that assets acquired and liabilities assumed be recognized at fair value as of the acquisition date. The purchase price of acquisitions is allocated to the tangible and identifiable intangible assets acquired and liabilities assumed based on estimated fair values, and any excess purchase price over the identifiable assets acquired and liabilities assumed is recorded as goodwill. Goodwill typically represents the value paid for the assembled workforce and enhancement of our service offerings. We may use independent valuation specialists to assist in determining the estimated fair values of assets acquired and liabilities assumed, which could require certain significant management assumptions and estimates. Transaction costs associated with acquisitions are expensed as they are incurred.
Goodwill and Other Intangible Assets—In accordance with ASC Topic 350, Intangibles—Goodwill and Other, goodwill and intangible assets deemed to have indefinite lives are not amortized but are subject to impairment testing at least annually, or more frequently if events or changes in circumstances indicate that goodwill might be impaired. We perform impairment tests for our reporting units with recorded goodwill utilizing valuation methods, including the discounted cash flow method, the guideline company approach, and the guideline transaction approach, as the best evidence of fair value. The valuation methodology used to estimate the fair value of the total Company and our reporting units requires inputs and assumptions (i.e. revenue growth, operating profit margins and discount rates) that reflect current market conditions. The estimated fair value of each reporting unit is compared to the carrying amount of the reporting unit, including goodwill. If the carrying value of the reporting unit exceeds its fair value, the goodwill of the reporting unit is potentially impaired, and we then determine the implied fair value of goodwill and compare it to the carrying value of goodwill to determine if impairment exists.
We performed our most recent annual goodwill impairment test as of April 29, 2016, and determined that the fair value of each of our reporting units with goodwill exceeded its carrying value, and therefore no further analysis was required. As of June 30, 2016, we had $75.3 million of goodwill. We do not believe there were any events or changes in circumstances since our April 2016 annual assessment that would indicate the fair value of goodwill was more likely than not reduced to below its carrying value. In making this assessment we relied on a number of factors including operating results, business plans, anticipated future cash flows, transactions and market data.
Other intangible assets are included in other assets on the consolidated balance sheets and consist primarily of purchased customer relationships and other intangible assets acquired in acquisitions. The costs of intangible assets with determinable useful lives are amortized on a basis approximating the economic value derived from those assets. We review the economic lives of our intangible assets annually.
27
Management judgment and assumptions are required in performing the impairment tests for all reporting units with goodwill and in measuring the fair value of goodwill, indefinite-lived intangibles and long-lived assets. While we believe our judgments and assumptions are reasonable, different assumptions could change the estimated fair values or the amount of recognized impairment losses. An adjustment to the carrying value of goodwill and/or identifiable intangible assets could materially impact our consolidated results of operations
Insurance Matters, Litigation and Contingencies—In the normal course of business, we are subject to certain contractual guarantees and litigation. Generally, such guarantees relate to project schedules and performance. Most of the litigation involves us as a defendant in contractual disputes, professional liability, personal injury and other similar lawsuits. We maintain insurance coverage for various aspects of our business and operations, however we have elected to retain a portion of losses that may occur through the use of substantial deductibles, exclusions and retentions under our insurance programs. This may subject us to future liability for which we are only partially insured or are completely uninsured. In accordance with ASC Topic 450, Contingencies, we record in our consolidated balance sheets amounts representing our estimated losses from claims and settlements when such losses are deemed probable and estimable. Otherwise, these losses are expensed as incurred. Costs of defense are expensed as incurred. We undertake an overall assessment of risk, and if the estimate of a probable loss is a range, and no amount within the range is a more reasonable estimate, we accrue the lower limit of the range. As additional information about current or future litigation or other contingencies becomes available, management will assess whether such information warrants the recording of changes in the expenses relating to those contingencies. Additional expenses could potentially have a material impact on our business, financial condition, results of operations or cash flows.
28
Results of Operations
Fiscal Year 2016 Compared to Fiscal Year 2015
Consolidated Results of Operations
The following table presents the dollar and percentage changes in certain items in the consolidated statements of operations for fiscal years 2016 and 2015:
Years Ended June 30, | Change | |||||||||||||
(Dollars in thousands) | 2016 | 2015 | $ | % | ||||||||||
Gross revenue | $ | 620,864 | $ | 546,117 | $ | 74,747 | 13.7 | % | ||||||
Less subcontractor costs and other direct reimbursable charges | 155,735 | 138,099 | 17,636 | 12.8 | ||||||||||
Net service revenue | 465,129 | 408,018 | 57,111 | 14.0 | ||||||||||
Interest income from contractual arrangements | 122 | 97 | 25 | 25.8 | ||||||||||
Insurance recoverables and other income | 16,048 | 6,533 | 9,515 | 145.6 | ||||||||||
Cost of services (exclusive of costs shown separately below) | 402,317 | 337,291 | 65,026 | 19.3 | ||||||||||
General and administrative expenses | 34,375 | 37,331 | (2,956 | ) | (7.9 | ) | ||||||||
Acquisition and integration expense | 6,571 | — | 6,571 | 100.0 | ||||||||||
Goodwill impairment | 21,981 | — | 21,981 | 100.0 | ||||||||||
Depreciation | 6,890 | 5,814 | 1,076 | 18.5 | ||||||||||
Amortization | 7,835 | 3,502 | 4,333 | 123.7 | ||||||||||
Operating income | 1,330 | 30,710 | (29,380 | ) | (95.7 | ) | ||||||||
Interest income | 840 | — | 840 | 100.0 | ||||||||||
Interest expense | (2,707 | ) | (134 | ) | (2,573 | ) | 1,920.1 | |||||||
(Loss) income from operations before taxes | (537 | ) | 30,576 | (31,113 | ) | (101.8 | ) | |||||||
Federal and state income tax benefit (provision) | 670 | (11,180 | ) | 11,850 | (106.0 | ) | ||||||||
Net income | 133 | 19,396 | (19,263 | ) | (99.3 | ) | ||||||||
Net (income) loss applicable to noncontrolling interest | (92 | ) | 19 | (111 | ) | (584.2 | ) | |||||||
Net income applicable to TRC Companies, Inc. | $ | 41 | $ | 19,415 | $ | (19,374 | ) | (99.8 | )% | |||||
Gross revenue increased $74.7 million, or 13.7%, to $620.9 million for fiscal year 2016 from $546.1 million for fiscal year 2015. Organic activities accounted for $9.2 million, or 12.3%, of the increase, and acquisitions accounted for $65.5 million, or 87.7%, of the growth in gross revenue. The growth in organic gross revenue was driven by our Infrastructure operating segment where organic gross revenue increased $13.2 million primarily driven by increased transportation-related spending by our state and commercial clients. In addition, organic gross revenue increased $12.1 million in our Energy operating segment due to increased demand for electric transmission and distribution services. This organic growth was offset, in part, by a $16.4 million decline in the Environmental operating segment organic gross revenue where we experienced decreased demand from our oil and gas clients for services primarily related to midstream activities.
NSR increased $57.1 million, or 14.0%, to $465.1 million for fiscal year 2016 from $408.0 million for fiscal year 2015. Organic activities accounted for $4.9 million, or 8.5%, of the growth in NSR, and acquisitions accounted for the remaining $52.2 million, or 91.5%, of the increase. The increase in organic NSR was primarily attributable to our Infrastructure and Energy operating segments where organic NSR increased $8.1 million and $3.3 million respectively. These organic NSR increases are due to the same factors that led to the increases in gross revenue. This organic growth was offset, in part, by a $5.8 million decline in the Environmental operating segment organic NSR that was due to the same factors that led to the decrease in organic gross revenue.
Insurance recoverables and other income increased $9.5 million, or 145.6%, to $16.0 million for fiscal year 2016 from $6.5 million for fiscal year 2015. During fiscal year 2016, certain Exit Strategy projects had estimated cost increases which are not expected to be funded by the project-specific restricted investments and, therefore, are projected to be funded by the project-specific insurance policy procured at project inception to cover, among other things, costs in excess of the original estimates. In particular, we increased insurance recoverables by $13.1 million in the fourth quarter on one project to account for the projected recoveries of the increased cost estimates. We did not experience the same level of estimated cost increases in the prior year.
29
COS increased $65.0 million, or 19.3%, to $402.3 million for fiscal year 2016 from $337.3 million for fiscal year 2015. Organic activities accounted for $15.1 million, or 23.3%, of the increase in COS, and acquisitions accounted for the remaining $49.9 million, or 76.7%, of the increase. Organic COS increased $5.2 million and $1.9 million in our Infrastructure and Energy operating segments, respectively. These increases were primarily attributable to costs incurred to support the current demand from our Infrastructure and Energy operating segment clients. Organic COS increased $6.5 million in our Environmental operating segment primarily due to the aforementioned estimated cost increases on the Exit Strategy contract which increased COS by $9.6 million in fiscal 2016. We did not experience the same level of estimated cost increases in the prior period. The increases on the Exit Strategy contract were partially offset within our Environmental operating segment by decreases due to the aforementioned lower volumes of work in the current year. As a percentage of NSR, COS was 86.4% and 82.7% for fiscal years 2016 and 2015, respectively. This increase in COS as a percentage of NSR was largely attributable to the current year cost increases on the noted Exit Strategy project as well as lower utilization within our Environmental operating segment.
G&A expenses decreased $3.0 million, or 7.9%, to $34.4 million for fiscal year 2016 from $37.3 million for fiscal year 2015. The decrease was largely attributable to lower litigation related costs in the current year. As a percentage of NSR, G&A expenses were 7.4% and 9.1% for fiscal years 2016 and 2015, respectively.
Acquisition and integration expenses for fiscal year 2016 are comprised of:
(Dollars in thousands) | ||||
Severance and personnel costs | $ | 1,508 | ||
Professional services and other | 2,824 | |||
Lease abandonment | $ | 2,239 | ||
Total | $ | 6,571 | ||
Goodwill impairment was $22.0 million for fiscal year 2016. Due to the current economic conditions in the oil and gas markets and actual operating performance, we assessed the recoverability of goodwill within our Pipeline Services operating segment during the three months ended March 25, 2016. In performing the goodwill assessment, we performed an impairment analysis that involved the use of discounted cash flow models as the best evidence of fair value. The aggregate fair value of our Pipeline Services operating segment declined from its initial November 2015 valuation primarily due to a reduction in the projected future cash flows. This reduction was primarily driven by a challenging commodity price environment and continued market uncertainty, which has had an adverse impact on capital spending. While the fundamentals for midstream infrastructure investment remain positive in the long term, the near term outlook remains uncertain, causing delays of large, midstream infrastructure projects. We do not expect activity to meaningfully increase in the near-term and, therefore, have adjusted our cash flows and sized our Pipeline Services operating segment accordingly. Because of this reduction in our near term cash flow estimates, the fair value of the two Pipeline Services reporting units with goodwill did not exceed their carrying value, resulting in a goodwill impairment charge of $22.0 million during fiscal year 2016. Further, the measurement period for purchase price allocation related to the Pipeline Services acquisition remains open, as the initial purchase price allocation remains preliminary. Any future adjustments to the purchase price allocation could materially impact the final charge for goodwill impairment.
Significant assumptions underlying the discounted cash flows included: a weighted average cost of capital; profit margins and a terminal growth rate. Changes in these assumptions could have a significant impact on the valuation model. As an example, a hypothetical 1% change in weighted average cost of capital would increase/decrease the fair value by approximately $10.0 million. A hypothetical 1% change in the profit margin percentages in all periods would increase/decrease the fair value by approximately $5.0 million. Finally, a hypothetical 1% change in the terminal growth rate would increase/decrease the fair value by approximately $6.0 million. Changes in fair value from changes in these assumptions would increase/decrease the goodwill impairment charge. Additionally, if we experience sustained periods of constrained capital spending beyond the periods already contemplated in our model, it could adversely impact our valuation. These assumptions are highly judgmental and subject to change. Such changes, if material, may require us to incur additional impairment charges for goodwill and/or other indefinite-lived intangible assets in future periods.
Depreciation expense increased $1.1 million, or 18.5%, to $6.9 million for fiscal year 2016 from $5.8 million for fiscal year 2015. The increase in depreciation expense is primarily the result of additional depreciation being incurred on assets acquired in connection with businesses acquired.
Amortization expense increased $4.3 million, or 123.7%, to $7.8 million for fiscal year 2016 from $3.5 million for fiscal year 2015. The increase in amortization expense is primarily the result of additional amortization being incurred on intangible assets acquired in connection with businesses acquired.
30
The federal, state and foreign income tax benefit was $0.7 million for fiscal year 2016 compared to an income tax provision of $11.2 million for the same period in the prior fiscal year. The net federal, state and foreign income tax benefit of $0.7 million for fiscal year 2016 was comprised of a current provision of $6.5 million and a deferred benefit of $7.2 million. The net federal, state and foreign income tax provision of $11.2 million for fiscal year 2015 was comprised of a current provision of $14.8 million and a deferred benefit of $3.6 million. Our effective tax rate was approximately 106.5% for fiscal year 2016, compared to approximately 36.5% for fiscal year 2015. Our effective tax rate excluding the Goodwill impairment was approximately 36.7% for the fiscal year 2016. The primary reconciling items between the federal statutory rate of 35.0% and our overall effective tax rate were the effect of state income taxes offset by discrete tax benefits related to the U.S. Research and Development credit and U.S. Domestic Production Activities deduction in the current period, and the effect of state income taxes offset by discrete tax benefits related to research and development tax credits for the prior year period.
Operating Segment Results of Operations
Energy Operating Segment Results
Fiscal Year | ||||||||||||||
(Dollars in thousands) | 2016 | 2015 | Change | |||||||||||
Gross revenue | $ | 182,586 | $ | 168,564 | $ | 14,022 | 8.3 | % | ||||||
Net service revenue | $ | 150,636 | $ | 145,690 | $ | 4,946 | 3.4 | % | ||||||
Segment profit | $ | 33,666 | $ | 32,124 | $ | 1,542 | 4.8 | % | ||||||
Gross revenue increased $14.0 million, or 8.3%, to $182.6 million for fiscal year 2016 from $168.6 million for fiscal year 2015. $12.1 million, or 86.4%, of the growth came from organic activities, while acquisitions provided the remaining $1.9 million, or 13.6%, of the overall growth in gross revenue. The growth in organic gross revenue was primarily attributable to increased demand for services from existing clients due to their continued investment in electric transmission and distribution.
NSR increased $4.9 million, or 3.4%, to $150.6 million for fiscal year 2016 from $145.7 million for fiscal year 2015. $3.3 million, or 66.7%, of the growth came from organic activities, while acquisitions provided the remaining $1.6 million, or 33.3%, of the NSR growth. The increase in organic NSR was due to the same factors that led to the increase in gross revenue. Additionally, in the current year, we had a larger number of projects in the construction phase, resulting in higher levels of sub-contractor utilization which generates higher gross revenue yet lower NSR.
The Energy operating segment's profit increased $1.5 million or 4.8%, to $33.7 million for fiscal year 2016 from $32.1 million for fiscal year 2015. Organic activities accounted for $1.6 million of the increase and acquisitions accounted for a $0.1 million loss. Organic segment profit increased, primarily due to the same factors that led to the increase in NSR. For fiscal year 2016, the Energy operating segment's profit, as a percentage of NSR, increased to 22.3% from 22.0% in the prior year.
Environmental Operating Segment Results
Fiscal Year | ||||||||||||||
(Dollars in thousands) | 2016 | 2015 | Change | |||||||||||
Gross revenue | $ | 289,564 | $ | 303,126 | $ | (13,562 | ) | (4.5 | )% | |||||
Net service revenue | $ | 206,126 | $ | 209,792 | $ | (3,666 | ) | (1.7 | )% | |||||
Segment profit | $ | 41,669 | $ | 44,071 | $ | (2,402 | ) | (5.5 | )% | |||||
Gross revenue decreased $13.6 million, or 4.5%, to $289.6 million for fiscal year 2016 from $303.1 million for fiscal year 2015. Organic activities led to a $16.4 million decrease, while acquisitions provided a positive $2.9 million change in revenue. The decrease in organic gross revenue for fiscal year 2016 was primarily due to the decline in oil and gas prices, which led to a reduction of activity on midstream capital projects. In addition, we completed a large pipeline permitting project that had generated significant revenue in the comparable period of the prior year. We also recorded estimated cost increases on an Exit Strategy contract which reduced gross revenue by $3.3 million. We did not have a similar Exit Strategy related adjustment in the prior year.
NSR decreased $3.7 million, or 1.7%, to $206.1 million for fiscal year 2016 from $209.8 million for fiscal year 2015. $5.8 million, of the decrease came from organic activities, while acquisitions provided a positive $2.2 million. The decrease in organic NSR was primarily due to the same factors that led to the decrease in gross revenue.
31
The Environmental operating segment's profit decreased $2.4 million, or 5.5%, to $41.7 million for fiscal year 2016 from $44.1 million for fiscal year 2015. Organic activities accounted for a decrease of $2.5 million, and acquisitions accounted for an increase of $0.1 million of segment profit during fiscal year 2016. The decrease in organic segment profit was primarily attributable to a decrease in employee utilization, unfavorable cost estimate adjustments on several large fixed price projects, and employee termination costs incurred in the current year associated with efforts to improve employee utilization. For fiscal year 2016, the Environmental operating segment's profit, as a percentage of NSR, decreased to 20.2% from 21.0% in the prior year.
Infrastructure Operating Segment Results
Fiscal Year | ||||||||||||||
(Dollars in thousands) | 2016 | 2015 | Change | |||||||||||
Gross revenue | $ | 83,430 | $ | 70,242 | $ | 13,188 | 18.8 | % | ||||||
Net service revenue | $ | 57,218 | $ | 49,110 | $ | 8,108 | 16.5 | % | ||||||
Segment profit | $ | 12,048 | $ | 9,193 | $ | 2,855 | 31.1 | % | ||||||
Gross revenue increased $13.2 million, or 18.8%, to $83.4 million for fiscal year 2016 from $70.2 million for fiscal year 2015. The increase in gross revenue was primarily driven by increased demand from state transportation and commercial clients for the upgrade of existing infrastructure.
NSR increased $8.1 million, or 16.5%, to $57.2 million for fiscal year 2016 from $49.1 million for fiscal year 2015. The NSR growth was primarily the result of the same factors driving gross revenue growth as noted above. The increases in gross revenue and NSR were all due to organic activities.
The Infrastructure operating segment's profit increased $2.9 million, or 31.1%, to $12.0 million for fiscal year 2016 from $9.2 million for fiscal year 2015. The increased profit performance was due to the growth in revenue in addition to improvements in our cost structure. For fiscal year 2016 the Infrastructure operating segment's profit, as a percentage of NSR, increased to 21.1% from 18.7% in the prior year.
Pipeline Services Operating Segment Results
Fiscal Year | |||||||||||||
(Dollars in thousands) | 2016 | 2015 | Change | ||||||||||
Gross revenue | $ | 60,712 | $ | — | $ | 60,712 | N/A | ||||||
Net service revenue | $ | 48,379 | $ | — | $ | 48,379 | N/A | ||||||
Segment profit | $ | (7,476 | ) | $ | — | $ | (7,476 | ) | N/A | ||||
Pipeline Services operating results for fiscal year 2016 are for the post-acquisition period from November 30, 2015 to June 30, 2016. During this seven month period, Pipeline Services contributed $60.7 million in gross revenue, $48.4 million in NSR, and had a segment loss of $7.5 million. Continued uncertainty surrounding the oil and gas markets, including depressed commodity prices also impacted current period operating results. Specifically, the uncertain market outlook has constrained capital spending, resulting in lower demand for our services and increased competition for new contracts. These operating results were also impacted by $3.4 million of integration related expenses as well as $4.8 million of amortization expense.
32
Fiscal Year 2015 Compared to Fiscal Year 2014
Consolidated Results of Operations
The following table presents the dollar and percentage changes in certain items in the consolidated statements of operations for fiscal years 2015 and 2014:
Years Ended June 30, | Change | |||||||||||||
(Dollars in thousands) | 2015 | 2014 | $ | % | ||||||||||
Gross revenue | $ | 546,117 | $ | 475,677 | $ | 70,440 | 14.8 | % | ||||||
Less subcontractor costs and other direct reimbursable charges | 138,099 | 120,721 | 17,378 | 14.4 | ||||||||||
Net service revenue | 408,018 | 354,956 | 53,062 | 14.9 | ||||||||||
Interest income from contractual arrangements | 97 | 52 | 45 | 86.5 | ||||||||||
Insurance recoverables and other income | 6,533 | 17,874 | (11,341 | ) | (63.4 | ) | ||||||||
Cost of services (exclusive of costs shown separately below) | 337,291 | 312,108 | 25,183 | 8.1 | ||||||||||
General and administrative expenses | 37,331 | 31,053 | 6,278 | 20.2 | ||||||||||
Depreciation | 5,814 | 5,932 | (118 | ) | (2.0 | ) | ||||||||
Amortization | 3,502 | 2,868 | 634 | 22.1 | ||||||||||
Operating income | 30,710 | 20,921 | 9,789 | 46.8 | ||||||||||
Interest expense | (134 | ) | (169 | ) | 35 | (20.7 | ) | |||||||
Income from operations before taxes | 30,576 | 20,752 | 9,824 | 47.3 | ||||||||||
Federal and state income tax provision | (11,180 | ) | (8,742 | ) | (2,438 | ) | 27.9 | |||||||
Net income | 19,396 | 12,010 | 7,386 | 61.5 | ||||||||||
Net loss applicable to noncontrolling interest | 19 | 41 | (22 | ) | (53.7 | ) | ||||||||
Net income applicable to TRC Companies, Inc. | $ | 19,415 | $ | 12,051 | $ | 7,364 | 61.1 | % | ||||||
Gross revenue increased $70.4 million, or 14.8%, to $546.1 million for fiscal year 2015 from $475.7 million for fiscal year 2014. Acquisitions accounted for $18.8 million, or 26.7%, of the growth in gross revenue, and organic activities accounted for the remaining $51.6 million, or 73.3%, of the increase. The growth in organic gross revenue was largely driven by our Environmental operating segment, where organic gross revenue increased $41.5 million primarily due to increased demand from our oil and gas clients for services related to midstream activities. Organic gross revenue increased $7.0 million in our Infrastructure operating segment due to increased demand from state transportation and commercial clients. Organic gross revenue increased $5.0 million in our Energy operating segment due to increased demand for services associated with investments in electric transmission and distribution, as well as better performance on fixed price contracts. For comparative purposes, during fiscal 2014, we recorded estimated cost increases on two Exit Strategy contracts which reduced gross revenue by $6.9 million. We did not have similar adjustments in fiscal 2015.
NSR increased $53.1 million, or 14.9%, to $408.0 million for fiscal year 2015 from $355.0 million for fiscal year 2014. Organic activities accounted for $38.3 million, or 72.0%, of the growth in NSR, and acquisitions accounted for the remaining $14.8 million, or 28.0%, of the increase. The increase in organic NSR was primarily attributable to our Environmental operating segment where organic NSR increased $27.3 million due to the same factors that led to the increase in gross revenue. The balance of the organic NSR growth was primarily attributable to our Energy operating segment, which increased due to the same factors that led to the increase in gross revenue, as well as the mix of projects which required higher levels of self-performance. As noted above, during fiscal 2014, we recorded estimated cost increases on two Exit Strategy contracts which reduced NSR by $6.9 million. We did not experience the same level of estimated cost increases in fiscal 2015.
Insurance recoverables and other income decreased $11.3 million, or 63.4%, to $6.5 million for fiscal year 2015 from $17.9 million for fiscal year 2014. During fiscal year 2014, certain Exit Strategy projects had estimated cost increases which are not expected to be funded by the project-specific restricted investments and, therefore, are projected to be funded by the project-specific insurance policy procured at project inception to cover, among other things, costs in excess of the original estimates. In particular, we increased insurance recoverables by $12.4 million in the first quarter on one project, and increased insurance recoverables by $4.9 million in the third quarter on another project to account for the projected recoveries of the increased cost estimates. We did not experience the same level of estimated cost increases in fiscal 2015.
COS increased $25.2 million, or 8.1%, to $337.3 million for fiscal year 2015 from $312.1 million for fiscal year 2014. Organic activities accounted for $13.9 million, or 55.4%, of the increase in COS, and acquisitions accounted for the remaining $11.3
33
million, or 44.6%, of the increase. The increase in organic COS was primarily attributable to costs incurred to support current and projected demand from our Environmental operating segment clients. For comparative purposes, however, the aforementioned estimated cost increases on two Exit Strategy contracts increased COS by $10.4 million in fiscal 2014. We did not experience the same level of estimated cost increases in fiscal 2015. As a percentage of NSR, COS was 82.7% and 87.9% for fiscal years 2015 and 2014, respectively. This decrease in COS as a percentage of NSR was largely attributable to the prior year cost increases on Exit Strategy projects.
G&A expenses increased $6.2 million, or 20.2%, to $37.3 million for fiscal year 2015 from $31.1 million for fiscal year 2014. As a percentage of NSR, G&A expenses were 9.1% and 8.7% for fiscal years 2015 and 2014, respectively. This increase in G&A expenses as a percentage of NSR was primarily attributable to increased legal and litigation related costs as well as increased headcount to support our current and expected growth.
Amortization increased $0.6 million, or 22.1%, to $3.5 million for fiscal year 2015 from $2.9 million for fiscal year 2014. The increase in amortization expense is primarily the result of additional amortization being incurred on tangible and intangible assets in connection with businesses acquired.
The federal, state and foreign income tax provision was $11.2 million for fiscal year 2015 compared to an income tax provision of $8.7 million for the same period in the prior fiscal year. The net federal, state and foreign income tax provision of $11.2 million for fiscal year 2015 was comprised of a current provision of $14.8 million and a deferred benefit of $3.6 million. The net federal, state and foreign income tax provision of $8.7 million for fiscal year 2014 was comprised of a current provision of $6.2 million and a deferred provision of $2.5 million. Our effective tax rate was approximately 36.5% for fiscal year 2015, compared to approximately 42.0% for fiscal year 2014. The primary reconciling items between the federal statutory rate of 35.0% and our overall effective tax rate for fiscal year 2015 were the effect of state income taxes offset by discrete tax benefits related to the U.S. Research and Development credit. The discrete impact of research and development credits was the result of a change in estimate resulting from the finalization of a new research and development credit study during fiscal year 2015. A tax benefit for the change in estimate was reflected in its entirety in fiscal year 2015. For fiscal year 2014, the primary reconciling item between the federal statutory rate of 35.0% and our overall effective tax rate was the effect of state income taxes.
Operating Segment Results of Operations
Energy Operating Segment Results
Fiscal Year | ||||||||||||||
(Dollars in thousands) | 2015 | 2014 | Change | |||||||||||
Gross revenue | $ | 168,564 | $ | 160,651 | $ | 7,913 | 4.9 | % | ||||||
Net service revenue | $ | 145,690 | $ | 132,795 | $ | 12,895 | 9.7 | % | ||||||
Segment profit | $ | 32,124 | $ | 26,468 | $ | 5,656 | 21.4 | % | ||||||
Gross revenue increased $7.9 million, or 4.9%, to $168.6 million for fiscal year 2015 from $160.7 million for fiscal year 2014. Organic gross revenue increased $5.0 million, or 63.5%, while acquisitions provided the remaining $2.9 million, or 36.5%, of the overall growth in gross revenue. The growth in organic gross revenue was primarily attributable to increased demand for transmission and distribution services from our utility clients as well as better performance on fixed price projects.
NSR increased $12.9 million, or 9.7%, to $145.7 million for fiscal year 2015 from $132.8 million for fiscal year 2014. Organic activities contributed $10.2 million, or 78.8%, of the growth, while acquisitions provided the remaining $2.7 million, or 21.2%, of the NSR growth. The increase in organic NSR was due to the same factors that led to the increase in gross revenue. Additionally, in the current year, we had a larger number of projects in the engineering phase, resulting in higher levels of self-performance which generates lower gross revenue yet higher NSR.
The Energy operating segment's profit increased $5.7 million or 21.4%, to $32.1 million for fiscal year 2015 from $26.5 million for fiscal year 2014. Organic activities accounted for $5.6 million, or 98.2%, and acquisitions accounted for $0.1 million, or 1.8%, of the increase in segment profit during fiscal year 2015. Organic segment profit increased, primarily due to the same factors that led to the increase in NSR. For fiscal year 2015, the Energy operating segment's profit, as a percentage of NSR, increased to 22.0% from 19.9% in the prior year. This increase was primarily attributable to the aforementioned improved labor utilization and improved performance on fixed price projects.
34
Environmental Operating Segment Results
Fiscal Year | ||||||||||||||
(Dollars in thousands) | 2015 | 2014 | Change | |||||||||||
Gross revenue | $ | 303,126 | $ | 245,944 | $ | 57,182 | 23.3 | % | ||||||
Net service revenue | $ | 209,792 | $ | 170,506 | $ | 39,286 | 23.0 | % | ||||||
Segment profit | $ | 44,071 | $ | 35,324 | $ | 8,747 | 24.8 | % | ||||||
Gross revenue increased $57.2 million, or 23.3%, to $303.1 million for fiscal year 2015 from $245.9 million for fiscal year 2014. Organic activities contributed $41.5 million, or 72.6%, and acquisitions provided the remaining $15.7 million, or 27.4%, of the overall growth in gross revenue. The increase in organic gross revenue for fiscal year 2015 was due to increased demand from our oil and gas clients for services primarily related to midstream activities, and, in particular, pipeline permitting services. For comparative purposes, during fiscal 2014 we recorded adjustments to the estimate at completion on two Exit Strategy contracts which reduced gross revenue by $6.9 million, but we did not have similar adjustments in fiscal 2015.
NSR increased $39.3 million, or 23.0%, to $209.8 million for fiscal year 2015 from $170.5 million for fiscal year 2014. Organic activities contributed $27.3 million, or 69.6%, and acquisitions provided the remaining $12.0 million, or 30.4%, of the overall growth in NSR. The increase in organic NSR was primarily due to the same factors that led to the increase in gross revenue.
The Environmental operating segment's profit increased $8.7 million, or 24.8%, to $44.1 million for fiscal year 2015 from $35.3 million for fiscal year 2014. Organic activities accounted for $6.8 million, or 78.3%, and acquisitions accounted for $1.9 million, or 21.7%, of the increase in segment profit during fiscal year 2015. The increase in organic segment profit was primarily attributable to the same factors that led to the increase in NSR as well as improved performance on fixed priced projects in fiscal year 2015. For fiscal year 2015, the Environmental operating segment's profit, as a percentage of NSR, increased to 21.0% from 20.7% in the prior year.
Infrastructure Operating Segment Results
Fiscal Year | ||||||||||||||
(Dollars in thousands) | 2015 | 2014 | Change | |||||||||||
Gross revenue | $ | 70,242 | $ | 63,251 | $ | 6,991 | 11.1 | % | ||||||
Net service revenue | $ | 49,110 | $ | 46,975 | $ | 2,135 | 4.5 | % | ||||||
Segment profit | $ | 9,193 | $ | 8,754 | $ | 439 | 5.0 | % | ||||||
Gross revenue increased $6.9 million, or 11.1%, to $70.2 million for fiscal year 2015 from $63.3 million for fiscal year 2014. The increase in gross revenue was primarily driven by increased demand from state transportation and commercial clients.
NSR increased $2.1 million, or 4.5%, to $49.1 million for fiscal year 2015 from $47.0 million for fiscal year 2014. The NSR growth was primarily the result of the same factors driving gross revenue growth as noted above. The increases in gross revenue and NSR were all due to organic activities.
The Infrastructure operating segment's profit increased $0.4 million, or 5.0%, to $9.2 million for fiscal year 2015 from $8.8 million for fiscal year 2014. For fiscal year 2015 the Infrastructure operating segment's profit, as a percentage of NSR, increased to 18.7% from 18.6% in the prior year.
35
Costs and Expenses as a Percentage of NSR
The following table presents the percentage relationships of items in the consolidated statements of operations to NSR for fiscal years 2016, 2015 and 2014:
2016 | 2015 | 2014 | ||||||
Net service revenue | 100.0 | % | 100.0 | % | 100.0 | % | ||
Interest income from contractual arrangements | — | — | — | |||||
Insurance recoverables and other income | 3.5 | 1.6 | 5.0 | |||||
Operating costs and expenses: | ||||||||
Cost of services (exclusive of costs shown separately below) | 86.4 | 82.7 | 87.9 | |||||
General and administrative expenses | 7.4 | 9.1 | 8.7 | |||||
Acquisition and integration expense | 1.4 | — | — | |||||
Goodwill impairment | 4.7 | — | — | |||||
Depreciation | 1.5 | 1.4 | 1.7 | |||||
Amortization | 1.7 | 0.9 | 0.8 | |||||
Total operating costs and expenses | 103.1 | 94.1 | 99.2 | |||||
Operating income | 0.4 | 7.5 | 5.9 | |||||
Interest income | 0.2 | — | — | |||||
Interest expense | (0.6 | ) | — | — | ||||
(Loss) income from operations before taxes | — | 7.5 | 5.8 | |||||
Income tax benefit (provision) | — | (2.7 | ) | (2.5 | ) | |||
Net income | — | 4.8 | 3.4 | |||||
Net (income) loss applicable to noncontrolling interest | — | — | — | |||||
Net income applicable to TRC Companies, Inc. | — | % | 4.8 | % | 3.4 | % | ||
Revisions in Estimates
We have numerous contracts in progress at any time, all of which are at various stages of completion. Our recognition of profit is dependent upon the accuracy of a variety of estimates including engineering progress, materials quantities, achievement of milestones and other incentives, liquidated-damages provisions, labor productivity and cost estimates. Such estimates are based on various judgments we make with respect to those factors and can be difficult to accurately determine until the project is significantly underway. Due to uncertainties inherent in the estimation process, actual completion costs often vary from estimates. If estimated total costs on any contract indicate a loss, we charge the entire estimated loss to operations in the period the loss first becomes known. If actual costs exceed the original fixed contract price, recognition of any additional revenue will be pursuant to a change order, contract modification, or claim.
The following table summarizes the number of projects that experienced estimated contract profit revisions relating to the revaluation of work performed in prior periods:
Fiscal Year | ||||||||||||||
(Dollars in thousands) | 2016 | 2015 | 2014 | |||||||||||
Number of projects | 1,801 | 1,834 | 1,814 | |||||||||||
Net increase (reduction) in project profitability | $ | (1,696 | ) | $ | 1,653 | $ | (707 | ) | ||||||
Net increase (reduction) in project profitability by operating segment: | ||||||||||||||
Energy | $ | (702 | ) | $ | (245 | ) | $ | (3,548 | ) | |||||
Environmental | (624 | ) | 1,512 | 2,438 | ||||||||||
Infrastructure | (370 | ) | 386 | 403 | ||||||||||
Pipeline Services | — | — | — | |||||||||||
Total | $ | (1,696 | ) | $ | 1,653 | $ | (707 | ) | ||||||
36
Impact of Inflation
Our operations have not been materially affected by inflation or changing prices because most contracts of a longer term are subject to adjustment or have been priced to cover anticipated increases in labor and other costs, and the remaining contracts are short term in nature.
Liquidity and Capital Resources
Overview
We primarily rely on cash from operations and financing activities, including borrowings under our revolving credit facility, to fund our operations. Our liquidity is assessed in terms of our overall ability to generate cash to fund our operating and investing activities and to service debt. We believe that our available cash, cash flows from operations and available borrowing under our revolving credit facility, discussed under "Revolving Credit Facility" below, will be sufficient to fund our operations for at least the next twelve months.
The following table provides summarized information with respect to our cash balances and cash flows as of and for the fiscal years ended June 30, 2016, 2015 and 2014 (in thousands):
June 30, 2016 | June 30, 2015 | June 30, 2014 | ||||||||||
Cash provided by operating activities | $ | 48,140 | $ | 32,115 | $ | 21,386 | ||||||
Cash used in investing activities | (126,685 | ) | (17,719 | ) | (6,771 | ) | ||||||
Cash provided by (used in) financing activities | 60,053 | (4,697 | ) | (5,154 | ) | |||||||
Cash and cash equivalents as of the end of the fiscal year | 18,804 | 37,296 | 27,597 | |||||||||
Fiscal Year 2016 Compared to Fiscal Year 2015
As of June 30, 2016, cash and cash equivalents decreased by $(18.5) million, or (49.6)%, to $18.8 million compared to $37.3 million as of June 30, 2015. This decline is primarily the result of cash utilized for the acquisition of Pipeline Services on November 30, 2015.
Net cash provided by operating activities increased by $16.0 million, or 49.9%, to $48.1 million for the fiscal year ended June 30, 2016, compared to $32.1 million of cash provided in the prior year. The increase was attributable to the favorable timing of collections activity with respect to accounts receivable in the fiscal year ended June 30, 2016 compared to the same period of the prior year. These favorable results were offset by higher cash payments made primarily with respect to accounts payable and employee related compensation in the fiscal year ended June 30, 2016 compared to the same period of the prior year.
Accounts receivable include both: (1) billed receivables associated with invoices submitted for work performed and (2) unbilled receivables (work in progress). The unbilled receivables are primarily related to work performed in the last month of the year. The efficiency of the billing and collection process is commonly evaluated as days sales outstanding ("DSO"), which we calculate by dividing accounts receivable by the most recent three-month average of daily gross revenue. DSO, which measures the collections turnover of both billed and unbilled receivables, declined to 79 days as of June 30, 2016 from 83 days as of June 30, 2015.
Net cash used in investing activities increased by $109.0 million, or 615.0%, to $126.7 million for the fiscal year ended June 30, 2016, compared to $17.7 million of cash used in the prior year. The increase was primarily due to $107.4 million in additional cash payments for the acquisitions of businesses including earnout and net working capital payments in the fiscal year ended June 30, 2016, as well as $1.7 million of additional payments for property and equipment. Both of these aforementioned increases were primarily attributable to the acquisition of Pipeline Services.
Net cash provided by financing activities increased by $64.8 million, or 1,378.5%, to $60.1 million for the fiscal year ended June 30, 2016, compared to $4.7 million of cash used in the prior year. The increase was directly attributable to the proceeds received on debt incurred, net of issuance costs paid, for the acquisition of Pipeline Services.
37
Fiscal Year 2015 Compared to Fiscal Year 2014
As of June 30, 2015, cash and cash equivalents increased by $9.7 million, or 35.1%, to $37.3 million compared to $27.6 million as of June 30, 2014.
Net cash provided by operating activities increased by $10.7 million, or 50.2%, to $32.1 million for the fiscal year ended June 30, 2015, compared to $21.4 million of cash provided in the prior fiscal year. The increase was due to higher income, adjusted for non-cash charges, for the fiscal year ended June 30, 2015 compared to the same period of the prior year, as well as the favorable impact in fiscal 2015 from changes in our working capital accounts.
Net cash used in investing activities increased by $10.9 million, or 161.7%, to $17.7 million for the fiscal year ended June 30, 2015, compared to $6.8 million of cash used in the prior year. The increase was primarily due to $8.2 million in additional cash payments for the acquisitions of businesses including earnout and net working capital payments in the fiscal year ended June 30, 2015, as well as $1.5 million of additional payments for property and equipment.
Net cash used in financing activities decreased by $0.5 million, or 8.9%, to $4.7 million for the fiscal year ended June 30, 2015, compared to $5.2 million of cash used in the prior year. The decrease was primarily due to $4.0 million of additional payments made on long-term debt and capital lease obligations in fiscal 2014, which were partially offset by a $3.0 million reduction of excess tax benefits from stock-based awards in fiscal 2015.
Long-Term Debt and Capital Lease Obligations
Long-term debt and capital lease obligations as of June 30, 2016 and 2015 were comprised of the following (in thousands):
2016 | 2015 | ||||||
Term loan | $ | 72,187 | $ | — | |||
Revolving facility | — | — | |||||
Contractor-owned, contractor-operated facility debt | 21,344 | — | |||||
Subordinated debt: | |||||||
Subordinated debt - note payable | 5,146 | — | |||||
Lease financing obligations | 55 | 105 | |||||
Capital lease obligations | — | 166 | |||||
Less deferred debt issuance costs | (1,150 | ) | — | ||||
97,582 | 271 | ||||||
Less current portion | (18,339 | ) | (216 | ) | |||
Long-term debt and capital lease obligations | $ | 79,243 | $ | 55 | |||
Revolving Credit Facility
Previously, we and substantially all of our subsidiaries, were party to a secured credit agreement (the "Prior Credit Agreement") and related security documentation with Citizens Commercial Banking as lender, administrative agent, sole lead arranger, and sole book runner and JP Morgan Chase Bank, N.A. as lender and syndication agent. The Prior Credit Agreement provided us with a $75.0 million five-year secured revolving credit facility with a sublimit of $15.0 million available for the issuance of letters of credit. Pursuant to the terms of the Prior Credit Agreement, we could request an increase in the amount of the credit facility up to $95.0 million. The expiration date of the Prior Credit Agreement was April 16, 2018.
Amounts outstanding under the Prior Credit Agreement bore interest at the Base Rate (as defined, generally the prime rate) plus a margin of 1.00% to 1.50% or at LIBOR plus a margin of 2.00% to 2.50%, based on the ratio (measured over a trailing four-quarter period) of consolidated total debt to earnings before interest, taxes, depreciation and amortization ("EBITDA"), as defined. Our obligations under the Prior Credit Agreement were secured by a pledge of substantially all of our assets and guaranteed by our principal operating subsidiaries. The Prior Credit Agreement also contained cross-default provisions which became effective if we defaulted on other indebtedness.
Under the Prior Credit Agreement we were required to maintain a fixed charge coverage ratio of no less than 1.25 to 1.00 and to not permit our leverage ratio to exceed 2.00 to 1.00. The Prior Credit Agreement also required us to achieve minimum levels
38
of Consolidated Adjusted EBITDA of $20.0 million for the twelve-month periods ending June 30, 2015 and thereafter. The Prior Credit Agreement also limited the payment of cash dividends to $10.0 million in aggregate during its term. We were in compliance with the financial covenants under the Prior Credit Agreement through its termination date.
On November 30, 2015, we entered into a five-year credit agreement (the “New Credit Agreement”) with Citizens Bank, N.A. as lender, LC issuer, administrative agent, sole lead arranger, and sole book runner; BMO Harris Bank, N.A. as lender, LC issuer and syndication agent; KeyBank, N.A. as lender and document agent, and five other banks as lenders . The New Credit Agreement provides us with an aggregate borrowing capacity of $175.0 million, consisting of a $100.0 million five-year secured revolving credit facility (“Revolving Facility”) with a sub-limit of $15.0 million available for the issuance of letters of credit, as well as a five-year secured $75.0 million term loan (“Term Loan”). The New Credit Agreement replaced our Prior Credit Agreement.
The proceeds of the Term Loan, together with cash on hand and proceeds from borrowing under the Revolving Facility, were used to pay the purchase price for Willbros Professional Services and to fund transaction costs incurred in connection with the Willbros Professional Services acquisition. The Revolving Facility will also be available for working capital and general corporate purposes. The Revolving Facility includes borrowing capacity for letters of credit and for borrowings on same-day notice, referred to as “swingline loans.” Borrowings under the Revolving Facility are subject to the satisfaction of customary conditions, including absence of defaults and accuracy of representations and warranties. We may request an increase in the amount of the Credit Agreement up to an additional $75.0 million, which may be through additional term or revolving loans.
Borrowings outstanding under the Revolving Facility will mature on November 30, 2020. The Term Loan amortizes in quarterly installments payable on the last day of each March, June, September, and December, commencing on March 31, 2016 in amounts equal to 1.875% of the term loan made or outstanding, with the balance payable on November 30, 2020 (the "Term Loan Maturity Date.") In addition, we are required, subject to certain exceptions, to make payments on the Term Loan: (a) based on a stated percentage of Excess Cash Flow, either 50% or 0% depending on whether our consolidated leverage ratio is above or below 2 times adjusted EBITDA as defined in the New Credit Agreement; (b) in an amount of 100% of net cash proceeds from asset sales subject to certain reinvestment rights; (c) in an amount of 100% of net cash proceeds of any issuance of debt other than debt permitted to be incurred under the New Credit Agreement; and, (d) in an amount of 100% of net cash proceeds from events of loss subject to certain reinvestment rights. The borrowings under the New Credit Agreement may be reduced, in whole or in part, without premium or penalty.
Amounts outstanding under the New Credit Agreement bear interest at the Base Rate (as defined, generally the prime rate) plus a margin of 0.50% to 1.25%, or at the Eurodollar Rate (as defined, generally the LIBOR rate) plus a margin of 1.50% to 2.25%, based on the Company's Leverage Ratio (as defined). In addition to these borrowing rates, there is a commitment fee which ranges from 0.20% to 0.375% on any unused commitments. The applicable fees for issuance of letters of credit under the Revolving Facility range from 1.50% to 2.25%.
Our obligations under the New Credit Agreement are secured by a pledge of substantially all of our assets and guaranteed by our principal operating subsidiaries. The New Credit Agreement also contains cross-default provisions which become effective if we default on other indebtedness.
The New Credit Agreement contains various customary restrictive covenants that limit our ability to, among other things: incur additional indebtedness including guarantees; enter into sale/leaseback transactions; make investments, loans or acquisitions; grant or incur liens on our assets; sell our assets; engage in mergers, consolidations, liquidations or dissolutions; engage in transactions with affiliates; and make restricted payments. Under the New Credit Agreement we are required to maintain a fixed charge coverage ratio of no less than 1.25 to 1.00 and to not permit our leverage ratio to exceed 3.00 to 1.00. Additionally, the New Credit Agreement also limits the payment of cash dividends to $10.0 million in aggregate during its term.
The actual covenant results as compared to the covenant requirements under the Credit Agreement as of June 30, 2016 for the measurement periods described below are as follows:
Measurement Period | Actual | Required | |||||
Maximum leverage ratio | Trailing 12 months | 1.41 to 1.00 | Not to exceed | 3.00 to 1.00 | |||
Minimum fixed charge coverage ratio | Trailing 12 months | 3.44 to 1.00 | Must exceed | 1.25 to 1.00 | |||
On November 30, 2015 we borrowed $102.0 million under the New Credit Agreement to partially fund the Willbros Professional Services acquisition. The borrowing was comprised of a full borrowing of the $75.0 million term loan and a $27.0 million borrowing under the Revolving Facility. Borrowings under the Term Loan bear interest at a stated rate of 2.32% and have
39
an effective interest rate of 2.74% at June 30, 2016. As of June 30, 2016 we had no borrowings outstanding under the Revolving Facility and $72.2 million outstanding under the Term Loan. Funds available to borrow under the New Credit Agreement, after consideration of the letters of credit outstanding, were $97.2 million at June 30, 2016. As of June 30, 2016, the Company was in compliance with all covenants under the New Credit Agreement.
As of June 30, 2015, we had no borrowings outstanding under the Prior Credit Agreement. Letters of credit outstanding were $2.0 million as of June 30, 2015. Based upon the leverage covenant, the maximum availability under the Prior Credit Agreement was $75.0 million as of June 30, 2015. Funds available to borrow under the Prior Credit Agreement, after consideration of the letters of credit outstanding and other indebtedness outstanding of $0.2 million, were $72.8 million at June 30, 2015.
Contractor-owned, contractor-operated facility debt
As of June 30, 2016, we recorded approximately $21.3 million of debt obligations assumed in the Pipeline Services acquisition, of which $7.6 million was current. A third party finance company had provided financing to Pipeline Services in conjunction with the construction of fueling facilities for the federal government. Upon acceptance of the constructed facilities, the federal government pays Pipeline Services in equal monthly installments over the subsequent five years pursuant to a contract. Therefore, as of June 30, 2016, we also recorded approximately $22.4 million of receivables which were acquired in the transaction, of which $7.6 million was current. These amounts were recorded within other assets and represent the amount due from the federal government for the construction of the fueling facilities.
As of June 30, 2016, the government has provided acceptance on all three of these contracts and final funding has been received on two contracts.
Other Notes Payable
In July 2015, we financed $5.6 million of insurance premiums payable in eleven equal monthly installments of $0.5 million each, including a finance charge of 1.99%. In December 2015, an additional $0.9 million was financed in conjunction with the Willbros Professional Services acquisition, resulting in six remaining payments of $0.7 million. As of June 30, 2016, the balance was paid in full.
In conjunction with the Pipeline Services acquisition, we were required to remit a second cash payment of $7.5 million payable at the earlier of certain Willbros contract novations (or written approval of a subcontract) and Willbros obtaining certain consents, or March 15, 2016. The second cash payment was made in two tranches, with $2.4 million paid in March 2016 and the remaining balance paid in July 2016 in conjunction with the final net working capital settlement.
Capital Lease Obligations
During fiscal years 2013 and 2012, we financed $1.2 million and $0.8 million, respectively, of furniture, office equipment, and computer equipment under capital lease agreements which expired in fiscal years 2015 and 2016. The assets and liabilities under capital lease agreements were recorded at the lower of the present value of the minimum lease payments or the fair value of the asset. The assets were amortized over the shorter of their related lease terms or their estimated useful lives. Amortization of assets under capital leases was included in depreciation and amortization in the consolidated statements of operations. The final lease payments were made in the fiscal quarter ended March 25, 2016, with no future capital lease obligation remaining, and the underlying assets having been fully depreciated.
40
Future Minimum Long-Term Debt and Capital Lease Obligation Payments
Future minimum long-term debt and capital lease obligation payments (exclusive of unamortized deferred debt issuance costs) as of June 30, 2016 were as follows (in thousands):
Fiscal Year | Debt | Lease Financing Obligations | Other Notes Payable | Total | ||||||||||||
2017 | $ | 13,176 | $ | 17 | $ | 5,146 | $ | 18,339 | ||||||||
2018 | 11,359 | 17 | — | 11,376 | ||||||||||||
2019 | 9,342 | 18 | — | 9,360 | ||||||||||||
2020 | 9,437 | 3 | — | 9,440 | ||||||||||||
2021 | 50,217 | — | — | 50,217 | ||||||||||||
Thereafter | — | — | — | — | ||||||||||||
$ | 93,531 | $ | 55 | $ | 5,146 | $ | 98,732 | |||||||||
Based on our current operating plans, we believe that existing cash resources as well as cash forecast to be generated from operations and availability under our revolving credit facility are adequate to meet our requirements for the foreseeable future. In addition, we expect to remain in full compliance with the covenant requirements under the Credit Agreement over the next twelve months.
Contractual Obligations
The following table sets forth, as of June 30, 2016, certain information concerning our obligations to make future contractual payments. Variable interest components used interest rates for estimating future interest payment obligations between 1.96% to 6.94% under contracts, such as debt (in thousands).
Payments due by period (1) | |||||||||||||||||||
Contractual Obligations | Total | Year 1 | Years 2 - 3 | Years 4 - 5 | Beyond | ||||||||||||||
Term loan | $ | 72,187 | $ | 5,625 | $ | 11,250 | $ | 55,312 | $ | — | |||||||||
Subordinated debt: | |||||||||||||||||||
Other notes payable | 5,146 | 5,146 | — | — | — | ||||||||||||||
Contractor-owned, contractor-operated facility debt | 21,344 | 7,551 | 9,451 | 4,342 | — | ||||||||||||||
Operating leases (2) | 80,504 | 18,699 | 29,209 | 18,960 | 13,636 | ||||||||||||||
Contractual commitments (3) | 4,419 | 4,419 | — | — | — | ||||||||||||||
Purchase obligations (4) | 3,105 | 2,598 | 507 | — | — | ||||||||||||||
Lease financing obligations | 55 | 17 | 35 | 3 | — | ||||||||||||||
Unrecognized tax benefits (5) | 2,204 | — | — | — | 2,204 | ||||||||||||||
Total contractual obligations | $ | 188,964 | $ | 44,055 | $ | 50,452 | $ | 78,617 | $ | 15,840 | |||||||||
______________________________
(1)Includes estimated interest as of June 30, 2016, excludes deferred debt issuance costs.
(2)Operating leases are primarily real estate leases.
(3)Represents amounts financed for our fiscal year 2017 insurance premiums.
(4) | Purchase obligations consists primarily of non-cancellable service provider contracts with a remaining term in excess of 1 year. |
(5) | Represents liabilities for unrecognized tax benefits related to uncertain tax positions. We are unable to reasonably predict the timing of tax settlements, as tax audits can involve complex issues and the resolution of those issues may span multiple years, particularly if subject to negotiation or litigation. |
We also have entered into long-term contracts pursuant to our Exit Strategy program under which we are obligated to complete the remediation of environmental conditions at sites.
41
Off-Balance Sheet Arrangements
As of June 30, 2016, our "Off-Balance Sheet" arrangements, as that term is defined by the Securities and Exchange Commission, included $2.8 million of standby letters of credit issued primarily for outstanding performance or payment bonds. The letters of credit were issued by our bank and renew annually. We also have operating leases for most of our office facilities and certain equipment. Rental expense for operating leases was $20.3 million in fiscal year 2016, $16.0 million in fiscal year 2015, and $14.9 million in fiscal year 2014. Minimum operating lease obligations payable in future years (i.e., primarily base rent) are included above in "Contractual Obligations".
Item 7A. Quantitative and Qualitative Disclosures About Market Risk
We do not currently utilize derivative financial instruments. We are exposed to interest rate risk under our New Credit Agreement. Amounts outstanding under the New Credit Agreement bear interest at the Base Rate (as defined, generally the prime rate) plus a margin of 0.50% to 1.25%, or at the Eurodollar Rate (as defined, generally the Libor rate) plus a margin of 1.50% to 2.25%, based on the Company's Leverage Ratio (as defined).
Borrowings at these rates under the Revolving Facility have no designated term and may be repaid without penalty any time prior to the maturity date. Borrowings outstanding under the Revolving Facility will mature on November 30, 2020. The Term Loan amortizes in quarterly installments payable on the last day of each March, June, September, and December, commencing on March 31, 2016 in amounts equal to 1.875% of the term loan made or outstanding, with the balance payable on the November 30, 2020 Term Loan Maturity Date.
42
Item 8. Financial Statements and Supplementary Data
REPORT OF INDEPENDENT REGISTERED PUBLIC ACCOUNTING FIRM
To the Board of Directors and Stockholders of
TRC Companies, Inc.
Windsor, Connecticut
We have audited the accompanying consolidated balance sheets of TRC Companies, Inc. and subsidiaries (the "Company") as of June 30, 2016 and 2015, and the related consolidated statements of operations, comprehensive income, changes in equity, and cash flows for each of the three years in the period ended June 30, 2016. These financial statements are the responsibility of the Company's management. Our responsibility is to express an opinion on the financial statements based on our audits.
We conducted our audits in accordance with the standards of the Public Company Accounting Oversight Board (United States). Those standards require that we plan and perform the audit to obtain reasonable assurance about whether the financial statements are free of material misstatement. An audit includes examining, on a test basis, evidence supporting the amounts and disclosures in the financial statements. An audit also includes assessing the accounting principles used and significant estimates made by management, as well as evaluating the overall financial statement presentation. We believe that our audits provide a reasonable basis for our opinion.
In our opinion, such consolidated financial statements present fairly, in all material respects, the financial position of TRC Companies, Inc. and subsidiaries as of June 30, 2016 and 2015, and the results of their operations and their cash flows for each of the three years in the period ended June 30, 2016, in conformity with accounting principles generally accepted in the United States of America.
We have also audited, in accordance with the standards of the Public Company Accounting Oversight Board (United States), the Company's internal control over financial reporting as of June 30, 2016, based on the criteria established in Internal Control - Integrated Framework (2013) issued by the Committee of Sponsoring Organizations of the Treadway Commission and our report dated August 31, 2016 expressed an unqualified opinion on the Company's internal control over financial reporting.
/s/ DELOITTE & TOUCHE LLP
Boston, Massachusetts
August 31, 2016
43
TRC Companies, Inc.
CONSOLIDATED STATEMENTS OF OPERATIONS
In thousands, except per share data
Fiscal Year Ended | |||||||||||
June 30, 2016 | June 30, 2015 | June 30, 2014 | |||||||||
Gross revenue | $ | 620,864 | $ | 546,117 | $ | 475,677 | |||||
Less subcontractor costs and other direct reimbursable charges | 155,735 | 138,099 | 120,721 | ||||||||
Net service revenue | 465,129 | 408,018 | 354,956 | ||||||||
Interest income from contractual arrangements | 122 | 97 | 52 | ||||||||
Insurance recoverables and other income | 16,048 | 6,533 | 17,874 | ||||||||
Operating costs and expenses: | |||||||||||
Cost of services (exclusive of costs shown separately below) | 402,317 | 337,291 | 312,108 | ||||||||
General and administrative expenses | 34,375 | 37,331 | 31,053 | ||||||||
Acquisition and integration expense | 6,571 | — | — | ||||||||
Goodwill impairment | 21,981 | — | — | ||||||||
Depreciation | 6,890 | 5,814 | 5,932 | ||||||||
Amortization | 7,835 | 3,502 | 2,868 | ||||||||
Total operating costs and expenses | 479,969 | 383,938 | 351,961 | ||||||||
Operating income | 1,330 | 30,710 | 20,921 | ||||||||
Interest income | 840 | — | — | ||||||||
Interest expense | (2,707 | ) | (134 | ) | (169 | ) | |||||
(Loss) income from operations before taxes | (537 | ) | 30,576 | 20,752 | |||||||
Income tax benefit (provision) | 670 | (11,180 | ) | (8,742 | ) | ||||||
Net income | 133 | 19,396 | 12,010 | ||||||||
Net (income) loss applicable to noncontrolling interest | (92 | ) | 19 | 41 | |||||||
Net income applicable to TRC Companies, Inc. | $ | 41 | $ | 19,415 | $ | 12,051 | |||||
Basic earnings per common share | $ | 0.00 | $ | 0.64 | $ | 0.41 | |||||
Diluted earnings per common share | $ | 0.00 | $ | 0.63 | $ | 0.40 | |||||
Weighted-average common shares outstanding: | |||||||||||
Basic | 30,936 | 30,291 | 29,594 | ||||||||
Diluted | 31,359 | 30,724 | 30,140 | ||||||||
See accompanying notes to consolidated financial statements.
44
TRC Companies, Inc.
CONSOLIDATED STATEMENTS OF COMPREHENSIVE INCOME
(in thousands)
Fiscal Year Ended | |||||||||||||
June 30, 2016 | June 30, 2015 | June 30, 2014 | |||||||||||
Net income | $ | 133 | $ | 19,396 | $ | 12,010 | |||||||
Other comprehensive income (loss) | |||||||||||||
Unrealized (loss) gain on available-for-sale securities | (5 | ) | (21 | ) | 151 | ||||||||
Tax effect on unrealized gain (loss) on available-for-sale securities | 3 | 8 | (60 | ) | |||||||||
Reclassification for loss (gain) included in net income | 32 | 4 | (100 | ) | |||||||||
Tax effect on realized (gain) loss on available-for-sale securities | (13 | ) | (2 | ) | 41 | ||||||||
Total other comprehensive income (loss) | 17 | (11 | ) | 32 | |||||||||
Comprehensive income | 150 | 19,385 | 12,042 | ||||||||||
Comprehensive (income) loss attributable to noncontrolling interests | (92 | ) | 19 | 41 | |||||||||
Comprehensive income attributable to TRC Companies, Inc. | $ | 58 | $ | 19,404 | $ | 12,083 | |||||||
See accompanying notes to consolidated financial statements.
45
TRC Companies, Inc.
CONSOLIDATED BALANCE SHEETS
In thousands, except share data
June 30, 2016 | June 30, 2015 | ||||||
ASSETS | |||||||
Current assets: | |||||||
Cash and cash equivalents | $ | 18,804 | $ | 37,296 | |||
Restricted cash | 71 | 122 | |||||
Accounts receivable, less allowance for doubtful accounts | 149,280 | 138,346 | |||||
Insurance recoverable - environmental remediation | 49,934 | 40,927 | |||||
Restricted investments | 5,959 | 6,701 | |||||
Income taxes refundable | 75 | 412 | |||||
Prepaid expenses and other current assets | 24,122 | 10,499 | |||||
Total current assets | 248,245 | 234,303 | |||||
Property and equipment | |||||||
Land and building | 4,824 | 480 | |||||
Equipment, furniture and fixtures | 63,105 | 58,734 | |||||
Leasehold improvements | 6,124 | 5,380 | |||||
74,053 | 64,594 | ||||||
Less accumulated depreciation and amortization | (51,593 | ) | (50,885 | ) | |||
Property and equipment, net | 22,460 | 13,709 | |||||
Goodwill | 75,337 | 37,024 | |||||
Intangible assets, net | 45,969 | 9,304 | |||||
Deferred income tax assets | 26,239 | 18,924 | |||||
Long-term restricted investments | 18,420 | 18,385 | |||||
Long-term prepaid insurance | 23,425 | 25,929 | |||||
Other assets | 18,383 | 5,303 | |||||
Total assets | $ | 478,478 | $ | 362,881 | |||
LIABILITIES AND EQUITY | |||||||
Current liabilities: | |||||||
Current portion of long-term debt | $ | 18,339 | $ | 50 | |||
Current portion of capital lease obligations | — | 166 | |||||
Accounts payable | 29,311 | 31,999 | |||||
Accrued compensation and benefits | 48,485 | 47,233 | |||||
Deferred revenue | 15,363 | 10,612 | |||||
Environmental remediation liabilities | 8,654 | 8,695 | |||||
Income taxes payable | 265 | 3,271 | |||||
Other accrued liabilities | 58,026 | 42,170 | |||||
Total current liabilities | 178,443 | 144,196 | |||||
Non-current liabilities: | |||||||
Long-term debt, net of current portion | 79,243 | 55 | |||||
Long-term income taxes payable | 2,204 | 1,647 | |||||
Deferred revenue | 65,340 | 68,579 | |||||
Environmental remediation liabilities | 433 | 489 | |||||
Total liabilities | 325,663 | 214,966 | |||||
Commitments and contingencies | |||||||
Equity: | |||||||
Common stock, $.10 par value; 40,000,000 shares authorized, 31,087,084 and 31,083,602 shares issued and outstanding, respectively, at June 30, 2016, and 30,485,510 and 30,482,028 shares issued and outstanding, respectively, at June 30, 2015 | 3,109 | 3,049 | |||||
Additional paid-in capital | 195,156 | 191,321 | |||||
Accumulated deficit | (45,898 | ) | (45,939 | ) | |||
Accumulated other comprehensive loss | (71 | ) | (88 | ) | |||
Treasury stock, at cost | (33 | ) | (33 | ) | |||
Total stockholders' equity applicable to TRC Companies, Inc. | 152,263 | 148,310 | |||||
Noncontrolling interest | 552 | (395 | ) | ||||
Total equity | 152,815 | 147,915 | |||||
Total liabilities and equity | $ | 478,478 | $ | 362,881 | |||
See accompanying notes to consolidated financial statements.
46
TRC Companies, Inc.
CONSOLIDATED STATEMENTS OF CASH FLOWS
In thousands
Fiscal Year Ended | |||||||||||
June 30, 2016 | June 30, 2015 | June 30, 2014 | |||||||||
Cash flows from operating activities: | |||||||||||
Net income | $ | 133 | $ | 19,396 | $ | 12,010 | |||||
Adjustments to reconcile net income to net cash provided by operating activities: | |||||||||||
Non-cash items: | |||||||||||
Depreciation and amortization | 14,725 | 9,316 | 8,800 | ||||||||
Amortization of debt issuance costs | 483 | — | — | ||||||||
Stock-based compensation expense | 5,554 | 5,149 | 4,658 | ||||||||
Provision for doubtful accounts | — | 349 | — | ||||||||
Deferred income taxes | (7,190 | ) | (3,599 | ) | 2,512 | ||||||
Goodwill impairment | 21,981 | — | — | ||||||||
Other non-cash items | 697 | 181 | (1,034 | ) | |||||||
Changes in operating assets and liabilities: | |||||||||||
Accounts receivable | 17,327 | (16,301 | ) | (5,916 | ) | ||||||
Insurance recoverable - environmental remediation | (9,007 | ) | 1,135 | (15,757 | ) | ||||||
Income taxes | (2,125 | ) | 3,795 | 864 | |||||||
Restricted investments | (427 | ) | 320 | 4,603 | |||||||
Prepaid expenses and other current assets | (2,895 | ) | (142 | ) | 1,676 | ||||||
Long-term prepaid insurance | 2,504 | 2,592 | 2,976 | ||||||||
Other assets | 5,098 | (103 | ) | 667 | |||||||
Accounts payable | (4,955 | ) | (1,019 | ) | 352 | ||||||
Accrued compensation and benefits | (5,949 | ) | 10,231 | 2,003 | |||||||
Deferred revenue | 1,512 | (5,710 | ) | (3,707 | ) | ||||||
Environmental remediation liabilities | (97 | ) | 2,778 | (858 | ) | ||||||
Other accrued liabilities | 10,771 | 3,747 | 7,537 | ||||||||
Net cash provided by operating activities | 48,140 | 32,115 | 21,386 | ||||||||
Cash flows from investing activities: | |||||||||||
Additions to property and equipment | (8,328 | ) | (6,606 | ) | (5,065 | ) | |||||
Withdrawals from restricted investments | 1,131 | 1,030 | 2,241 | ||||||||
Acquisition of businesses, net of cash acquired | (119,600 | ) | (12,213 | ) | (3,788 | ) | |||||
Earnout and net working capital payments on acquisitions | — | — | (252 | ) | |||||||
Proceeds from sale of fixed assets | 112 | 70 | 110 | ||||||||
Investments in and advances to unconsolidated affiliates | — | — | (17 | ) | |||||||
Net cash used in investing activities | (126,685 | ) | (17,719 | ) | (6,771 | ) | |||||
Cash flows from financing activities: | |||||||||||
Payments on long-term debt and other | (13,220 | ) | (5,595 | ) | (9,535 | ) | |||||
Payments on capital lease obligations | (166 | ) | (563 | ) | (628 | ) | |||||
Proceeds from long-term debt and other | 7,177 | 5,247 | 4,904 | ||||||||
Proceeds from term loan | 75,000 | — | — | ||||||||
Repayments of term loan debt | (2,812 | ) | — | — | |||||||
Net working capital and additional cash payments on acquisitions | (1,161 | ) | (2,644 | ) | (872 | ) | |||||
Shares repurchased to settle tax withholding obligations | (2,965 | ) | (1,666 | ) | (2,209 | ) | |||||
Payments of issuance costs on revolving credit facility | (3,248 | ) | — | — | |||||||
Acquisition of non-controlling interest | (90 | ) | — | — | |||||||
Payments to noncontrolling interest | (40 | ) | — | — | |||||||
Excess tax benefit from stock-based awards | 1,357 | 155 | 3,115 | ||||||||
Proceeds from exercise of stock options | 221 | 369 | 71 | ||||||||
Net cash provided by (used) in financing activities | 60,053 | (4,697 | ) | (5,154 | ) | ||||||
(Decrease) increase in cash and cash equivalents | (18,492 | ) | 9,699 | 9,461 | |||||||
Cash and cash equivalents, beginning of period | 37,296 | 27,597 | 18,136 | ||||||||
Cash and cash equivalents, end of period | $ | 18,804 | $ | 37,296 | $ | 27,597 | |||||
Supplemental cash flow information: | |||||||||||
Income taxes paid | $ | 10,128 | $ | 10,994 | $ | 2,205 | |||||
Non-cash consideration for assets acquired | 5,146 | 996 | 1,627 | ||||||||
Issuance of common stock in connection with businesses acquired | — | 323 | 295 | ||||||||
Capital expenditures included in accounts payable | 198 | 475 | 490 | ||||||||
Interest paid | 2,707 | 134 | 192 | ||||||||
See accompanying notes to consolidated financial statements.
47
TRC Companies, Inc.
CONSOLIDATED STATEMENTS OF CHANGES IN EQUITY
In thousands, except share data
Common Stock | Additional Paid-in Capital | Accumulated Deficit | Accumulated Other Comprehensive Income (Loss) | Treasury Stock | Total TRC Shareholders' Equity | Non- Controlling Interest | |||||||||||||||||||||||||||||||
Number of Shares | Amount | Number of Shares | Amount | Total Equity | |||||||||||||||||||||||||||||||||
Balance, June 30, 2013 | 29,053,301 | $ | 2,905 | $ | 181,874 | $ | (77,405 | ) | $ | (109 | ) | 3,482 | $ | (33 | ) | $ | 107,232 | $ | (335 | ) | $ | 106,897 | |||||||||||||||
Net income (loss) | — | — | — | 12,051 | — | — | — | 12,051 | (41 | ) | 12,010 | ||||||||||||||||||||||||||
Other comprehensive income | — | — | — | — | 32 | — | — | 32 | — | 32 | |||||||||||||||||||||||||||
Issuance of common stock | 4,360 | 1 | 29 | — | — | — | — | 30 | — | 30 | |||||||||||||||||||||||||||
Issuance of common stock in connection with business acquired | 34,066 | 3 | 292 | — | — | — | — | 295 | — | 295 | |||||||||||||||||||||||||||
Exercise of stock options | 16,500 | 2 | 69 | — | — | — | — | 71 | — | 71 | |||||||||||||||||||||||||||
Stock-based compensation | 943,999 | 94 | 4,564 | — | — | — | — | 4,658 | — | 4,658 | |||||||||||||||||||||||||||
Shares repurchased to settle tax withholding obligations | (305,642 | ) | (31 | ) | (2,239 | ) | — | — | — | — | (2,270 | ) | — | (2,270 | ) | ||||||||||||||||||||||
Directors' deferred compensation | 6,350 | 1 | 44 | — | — | — | — | 45 | — | 45 | |||||||||||||||||||||||||||
Tax benefit from stock-based awards | — | — | 3,115 | — | — | — | — | 3,115 | — | 3,115 | |||||||||||||||||||||||||||
Balance, June 30, 2014 | 29,752,934 | 2,975 | 187,748 | (65,354 | ) | (77 | ) | 3,482 | (33 | ) | 125,259 | (376 | ) | 124,883 | |||||||||||||||||||||||
Net income (loss) | — | — | — | 19,415 | — | — | — | 19,415 | (19 | ) | 19,396 | ||||||||||||||||||||||||||
Other comprehensive income | — | — | — | — | (11 | ) | — | — | (11 | ) | — | (11 | ) | ||||||||||||||||||||||||
Issuance of common stock in connection with business acquired | 49,641 | 5 | 318 | — | — | — | — | 323 | — | 323 | |||||||||||||||||||||||||||
Exercise of stock options | 76,626 | 8 | 361 | — | — | — | — | 369 | — | 369 | |||||||||||||||||||||||||||
Stock-based compensation | 903,382 | 90 | 5,059 | — | — | — | — | 5,149 | — | 5,149 | |||||||||||||||||||||||||||
Shares repurchased to settle tax withholding obligations | (304,450 | ) | (30 | ) | (1,682 | ) | — | — | — | — | (1,712 | ) | — | (1,712 | ) | ||||||||||||||||||||||
Directors' deferred compensation | 7,377 | 1 | 49 | — | — | — | — | 50 | — | 50 | |||||||||||||||||||||||||||
Tax deficiencies from stock-based awards | — | — | (532 | ) | — | — | — | — | (532 | ) | — | (532 | ) | ||||||||||||||||||||||||
Balance, June 30, 2015 | 30,485,510 | 3,049 | 191,321 | (45,939 | ) | (88 | ) | 3,482 | (33 | ) | 148,310 | (395 | ) | 147,915 | |||||||||||||||||||||||
Net income (loss) | — | — | — | 41 | — | — | — | 41 | 92 | 133 | |||||||||||||||||||||||||||
Other comprehensive income | — | — | — | — | 17 | — | — | 17 | — | 17 | |||||||||||||||||||||||||||
Exercise of stock options | 34,500 | 3 | 218 | — | — | — | — | 221 | — | 221 | |||||||||||||||||||||||||||
Stock-based compensation | 855,808 | 86 | 5,468 | — | — | — | — | 5,554 | — | 5,554 | |||||||||||||||||||||||||||
Shares repurchased to settle tax withholding obligations | (298,234 | ) | (30 | ) | (2,935 | ) | — | — | — | — | (2,965 | ) | — | (2,965 | ) | ||||||||||||||||||||||
Directors' deferred compensation | 9,500 | 1 | 87 | — | — | — | — | 88 | — | 88 | |||||||||||||||||||||||||||
Acquisition of minority interest | — | — | (183 | ) | — | — | — | — | (183 | ) | 895 | 712 | |||||||||||||||||||||||||
Payments to minority interest holder | — | — | — | — | — | — | — | — | (40 | ) | (40 | ) | |||||||||||||||||||||||||
Tax benefit from stock-based awards | — | — | 1,180 | — | — | — | — | 1,180 | — | 1,180 | |||||||||||||||||||||||||||
Balance, June 30, 2016 | 31,087,084 | $ | 3,109 | $ | 195,156 | $ | (45,898 | ) | $ | (71 | ) | 3,482 | $ | (33 | ) | $ | 152,263 | $ | 552 | $ | 152,815 | ||||||||||||||||
See accompanying notes to consolidated financial statements.
48
TRC COMPANIES, INC.
NOTES TO CONSOLIDATED FINANCIAL STATEMENTS
In thousands, except per share data
Note 1. Company Background and Basis of Presentation
TRC Companies, Inc., through its subsidiaries (collectively, the "Company"), provides integrated engineering, consulting, and construction management services. Its project teams help its commercial and governmental clients implement environmental, energy, infrastructure and pipeline projects from initial concept to delivery and operation. The Company provides its services almost entirely in the United States of America.
The consolidated financial statements include all the accounts of TRC Companies, Inc., its wholly-owned subsidiaries and subsidiaries in which it holds, directly or indirectly, more than 50% of the voting rights or where it exercises control (see Note 11). All intercompany balances and transactions have been eliminated in consolidation.
Certain prior year amounts have been reclassified for consistency with the current period presentation. These reclassifications had no effect on the reported results of operations. In the second quarter of fiscal 2016, the Company concluded that it was appropriate to separately present intangible assets and intangible asset amortization on its consolidated balance sheets and consolidated statements of operations, respectively. Previously, intangible assets were classified as other assets on the consolidated balance sheets whereas intangible asset amortization was classified as depreciation and amortization on the consolidated statements of operations. Additionally, as further described below the Company has reclassified its presentation of deferred tax assets in accordance with an Accounting Standards Update.
Note 2. Summary of Significant Accounting Policies and New Accounting Pronouncements
Revenue Recognition: The Company recognizes contract revenue in accordance with Accounting Standards Codification ("ASC") Topic 605, Revenue Recognition ("ASC Topic 605"). Specifically, the Company follows the guidance in ASC Subtopic 605-35, Revenue Recognition—Construction-Type and Production-Type Contracts.
Fixed-Price Contracts
The Company recognizes revenue on fixed-price contracts using the percentage-of-completion method. Under this method of revenue recognition, the Company estimates the progress towards completion to determine the amount of revenue and profit to recognize on all significant contracts. The Company generally utilizes an efforts-expended, cost-to-cost approach in applying the percentage-of-completion method under which revenue is earned in proportion to total costs incurred divided by total costs expected to be incurred.
Under the percentage-of-completion method, recognition of profit is dependent upon the accuracy of a variety of estimates including engineering progress, materials quantities, achievement of milestones and other incentives, liquidated-damages provisions, labor productivity and cost estimates. Such estimates are based on various judgments the Company makes with respect to those factors and can be difficult to accurately determine until the project is significantly underway. Due to uncertainties inherent in the estimation process, actual completion costs often vary from estimates. If estimated total costs on any contract indicate a loss, the Company charges the entire estimated loss to operations in the period the loss first becomes known. If actual costs exceed the original fixed contract price, recognition of any additional revenue will be pursuant to a change order, contract modification, or claim.
The Company has entered into fixed-price Exit Strategy contracts to remediate environmental conditions at contaminated sites. Under most Exit Strategy contracts, the majority of the contract price was deposited by the client into a restricted account with an insurer. The funds in the restricted account are held by the insurer and used to pay the Company as work is performed. The arrangement with the insurer provides for the deposited funds to earn interest at the one-year constant maturity U.S. Treasury Bill rate. The interest is recorded when earned and reported as interest income from contractual arrangements on the Company's consolidated statements of operations. On certain Exit Strategy projects, the Company has taken title to the underlying properties in order to facilitate access, remedial construction, performance of operations monitoring and maintenance activities, and the overall execution of the cleanup. As these properties are distressed, they have no value.
The Exit Strategy funds held by the insurer, including any interest earned thereon, are recorded as an asset (current and long-term restricted investment) on the Company's consolidated balance sheets, with a corresponding liability (current and long-term
49
TRC COMPANIES, INC.
NOTES TO CONSOLIDATED FINANCIAL STATEMENTS (Continued)
In thousands, except per share data
Note 2. Summary of Significant Accounting Policies and New Accounting Pronouncements (Continued)
deferred revenue) related to the funds. Consistent with the Company's other fixed-price contracts, the Company recognizes revenue on Exit Strategy contracts using the percentage-of-completion method. When determining the extent of progress towards completion on Exit Strategy contracts, prepaid insurance premiums and fees are amortized, on a straight-line basis, to cost incurred over the life of the related insurance policy. Certain Exit Strategy contracts were classified as pertaining to either remediation or operation, maintenance and monitoring. In addition, certain Exit Strategy contracts were segmented such that the remediation and operation portion of the contract is separately accounted for from the maintenance and monitoring portion.
Under most Exit Strategy contracts, additional payments were made by the client to the insurer, typically through an insurance broker, for insurance premiums and fees for a policy to cover potential costs in excess of the original estimates and other factors such as third party liability. For Exit Strategy contracts where the Company establishes that (1) costs exceed the contract value and interest growth thereon and (2) such costs are covered by insurance, the Company will record an estimated insurance recovery up to the amount of insured costs. An insurance gain, that is, an amount to be recovered in excess of the Company's recorded costs, is not recognized until the receipt of insurance proceeds. Insurance recoveries are reported as insurance recoverables and other income on the Company's consolidated statements of operations. If estimated total costs on any contract indicate a loss, the Company charges the entire estimated loss to operations in the period the loss first becomes known.
Unit price contracts are a subset of fixed-price contracts. Under unit price contracts, the Company's clients pay a set fee for each unit of service or production. The Company recognizes revenue under unit price contracts as it completes the related service transaction for its clients. If the Company's costs per service transaction exceed original estimates, its profit margins will decrease, and it may realize a loss on the project unless it can receive payment for the additional costs.
Time-and-Materials Contracts
Under time-and-materials contracts, the Company negotiates hourly billing rates and charges its clients based on the actual time that it expends on a project. In addition, clients reimburse the Company for actual out-of-pocket costs of materials and other direct reimbursable expenses that it incurs in connection with its performance under the contract. The Company's profit margins on time-and-materials contracts fluctuate based on actual labor and overhead costs that it directly charges or allocates to contracts compared to negotiated billing rates. Revenue on time-and-materials contracts is recognized based on the actual number of hours the Company spends on the projects plus any actual out-of-pocket costs of materials and other direct reimbursable expenses that it incurs on the projects.
Cost-Plus Contracts
Cost-Plus Fixed Fee Contracts. Under the Company's cost-plus fixed fee contracts, it charges clients for its costs, including both direct and indirect costs, plus a fixed negotiated fee. In negotiating a cost-plus fixed fee contract, the Company estimates all recoverable direct and indirect costs and then adds a fixed profit component. The total estimated cost plus the negotiated fee represents the total contract value. The Company recognizes revenue based on the actual labor and non-labor costs it incurs plus the portion of the fixed fee it has earned to date.
Cost-Plus Fixed Rate Contracts. Under the Company's cost-plus fixed rate contracts, it charges clients for its costs plus negotiated rates based on its indirect costs. In negotiating a cost-plus fixed rate contract, the Company estimates all recoverable direct and indirect costs and then adds a profit component, which is a percentage of total recoverable costs, to arrive at a total dollar estimate for the project. The Company recognizes revenue based on the actual total costs it has expended plus the applicable fixed rate. If the actual total costs are lower than the total costs the Company has estimated, its revenue from that project will be lower than originally estimated.
Change Orders/Claims
Change orders are modifications to an original contract that change the provisions of the contract. Change orders typically result from changes in scope, specifications or design, manner of performance, facilities, equipment, materials, sites, or period of completion of the work. Claims are amounts in excess of the agreed contract price that the Company seeks to collect from its clients or others for client-caused delays, errors in specifications and designs, contract terminations, change orders that are either in dispute or are unapproved as to both scope and price, or other causes.
Costs related to change orders and claims are recognized when they are incurred. Change orders are included in total estimated contract revenue when it is probable that the change order will result in a bona fide addition to contract value and can be reliably
50
TRC COMPANIES, INC.
NOTES TO CONSOLIDATED FINANCIAL STATEMENTS (Continued)
In thousands, except per share data
Note 2. Summary of Significant Accounting Policies and New Accounting Pronouncements (Continued)
estimated. Claims are included in total estimated contract revenues only to the extent that contract costs related to the claims have been incurred and when it is probable that the claim will result in a bona fide addition to contract value which can be reliably estimated. No profit is recognized on claims until final settlement occurs. For the fiscal years ended June 30, 2016, 2015 and 2014, no revenue related to claims was recognized by the Company.
Other Contract Matters
Federal Acquisition Regulations ("FAR"), which are applicable to the Company's federal government contracts and may be incorporated in many local and state agency contracts, limit the recovery of certain specified indirect costs on contracts. Cost-plus contracts covered by FAR or with certain state and local agencies also require an audit of actual costs and provide for upward or downward adjustments if actual recoverable costs differ from billed recoverable costs. Most of the Company's federal government contracts are subject to termination at the discretion of the client. Contracts typically provide for reimbursement of costs incurred and payment of fees earned through the date of such termination.
Contracts with the federal government are subject to audit, primarily by the Defense Contract Audit Agency ("DCAA"), which reviews the Company's overhead rates, operating systems and cost proposals. During the course of its audits, the DCAA may disallow costs if it determines that the Company has accounted for such costs in a manner inconsistent with Cost Accounting Standards or FAR. The Company's last incurred cost audit was for fiscal year 2004 and resulted in an immaterial adjustment. DCAA determined that an audit of incurred cost proposals submitted to DCAA for fiscal years 2005 through 2013 was not required. Historically, the Company has not had any material cost disallowances by the DCAA as a result of audit, however there can be no assurance that DCAA audits will not result in material cost disallowances in the future.
Allowance for Doubtful Accounts—An allowance for doubtful accounts is maintained for estimated losses resulting from the failure of the Company's clients to make required payments. The allowance for doubtful accounts has been determined through reviews of specific amounts deemed to be uncollectible and estimated write-offs as a result of clients who have filed for bankruptcy protection plus an allowance for other amounts for which some loss is determined to be probable based on current circumstances. If the financial condition of clients or the Company's assessment as to collectability were to change, adjustments to the allowances may be required.
Stock-Based Compensation—The Company accounts for stock-based awards in accordance with ASC Topic 718, Compensation—Stock Compensation ("ASC Topic 718"), which requires the measurement and recognition of compensation expense for all stock-based awards made to the Company's employees and directors including stock options, restricted stock, and other stock-based awards based on estimated fair values.
The Company measures stock-based compensation cost at the grant date based on the fair value of the award. The value of the portion of the award that is ultimately expected to vest is recognized as expense over the requisite service periods in the Company's consolidated statements of operations. Stock-based compensation expense includes the estimated effects of forfeitures, and estimates of forfeitures will be adjusted over the requisite service period to the extent actual forfeitures differ, or are expected to differ, from such estimates. Changes in estimated forfeitures will be recognized in the period of change and will also impact the amount of expense to be recognized in future periods.
Income Taxes—The Company is required to estimate the provision for income taxes, including the current tax expense together with an assessment of temporary differences resulting from differing treatments of assets and liabilities for tax and financial accounting purposes. These differences between the financial statement and tax bases of assets and liabilities, together with net operating loss ("NOL") carryforwards and tax credits are recorded as deferred tax assets or liabilities on the consolidated balance sheets. An assessment is required to be made of the likelihood that the deferred tax assets will be recovered from future taxable income. To the extent that the Company determines that it is more likely than not that the deferred asset will not be utilized, a valuation allowance is established. Taxable income in future periods significantly above or below that projected will cause adjustments to the valuation allowance that could materially decrease or increase future income tax expense.
The Company recognizes the tax benefit from an uncertain tax position only if it is more likely than not that the tax position will be sustained on examination by the taxing authorities based on the technical merits of the position. The tax benefits recognized in the financial statements from such a position are measured based on the largest benefit that has a greater than 50% likelihood of being realized upon ultimate settlement. Accounting literature also provides guidance on derecognition of income tax assets and liabilities, classification of current and deferred income tax assets and liabilities, accounting for interest and penalties associated
51
TRC COMPANIES, INC.
NOTES TO CONSOLIDATED FINANCIAL STATEMENTS (Continued)
In thousands, except per share data
Note 2. Summary of Significant Accounting Policies and New Accounting Pronouncements (Continued)
with tax positions, and income tax disclosures. Judgment is required in assessing the future tax consequences of events that have been recognized in the Company's financial statements or tax returns. Variations in the actual outcome of these future tax consequences could materially impact the Company's financial statements.
Acquisitions—The Company accounts for acquisitions using the acquisition method of accounting, which requires that assets acquired and liabilities assumed be recognized at fair value as of the acquisition date. The purchase price of acquisitions is allocated to the tangible and identifiable intangible assets acquired and liabilities assumed based on estimated fair values, and any excess purchase price over the identifiable assets acquired and liabilities assumed is recorded as goodwill. Goodwill typically represents the value paid for the assembled workforce and enhancement of our service offerings. The Company may use independent valuation specialists to assist in determining the estimated fair values of assets acquired and liabilities assumed, which could require certain significant management assumptions and estimates. Transaction costs associated with acquisitions are expensed as they are incurred.
Goodwill and Other Intangible Assets—In accordance with ASC Topic 350, Intangibles—Goodwill and Other, goodwill and intangible assets deemed to have indefinite lives are not amortized but are subject to impairment testing at least annually, or more frequently if events or changes in circumstances indicate that goodwill might be impaired. The Company performs impairment tests for its reporting units with recorded goodwill utilizing valuation methods, including the discounted cash flow method, the guideline company approach, and the guideline transaction approach, as the best evidence of fair value. The valuation methodology used to estimate the fair value of the total Company and its reporting units requires inputs and assumptions (i.e. revenue growth, operating profit margins and discount rates) that reflect current market conditions. The estimated fair value of each reporting unit is compared to the carrying amount of the reporting unit, including goodwill. If the carrying value of the reporting unit exceeds its fair value, the goodwill of the reporting unit is potentially impaired, and the Company then determines the implied fair value of goodwill and compares it to the carrying value of goodwill to determine if impairment exists.
The Company performed its most recent annual goodwill impairment test as of April 29, 2016, and determined that the fair value of each of the Company's reporting units with goodwill exceeded its carrying value, and therefore, no further analysis was required. As of June 30, 2016, the Company had $75,337 of goodwill. The Company does not believe there were any events or changes in circumstances since its April 2016 annual assessment that would indicate the fair value of goodwill was more likely than not reduced to below its carrying value. In making this assessment, the Company relied on a number of factors, including operating results, business plans, anticipated future cash flows, transactions and market data.
Other intangible assets are included in other assets on the consolidated balance sheets and consist primarily of purchased customer relationships and other intangible assets acquired in acquisitions. The costs of intangible assets with determinable useful lives are amortized on a basis approximating the economic value derived from those assets. The Company reviews the economic lives of its intangible assets annually.
Management judgment and assumptions are required in performing the impairment tests for all reporting units with goodwill and in measuring the fair value of goodwill, indefinite-lived intangibles and long-lived assets. While the Company believes its judgments and assumptions are reasonable, different assumptions could change the estimated fair values or the amount of recognized impairment losses. An adjustment to the carrying value of goodwill and/or identifiable intangible assets could materially impact the Company's consolidated results of operations
Property and Equipment—Property and equipment are recorded at cost, including costs to bring the equipment into operation. Major improvements to and betterments that extend the useful life of existing equipment are capitalized. Maintenance and repairs are charged to expense as incurred. The Company provides for depreciation of property and equipment using the straight-line method over estimated useful lives of the assets as follows:
Asset Category | Estimated Useful Life | |
Building | 30 years | |
Equipment, furniture and fixtures | 3 - 10 years | |
Leasehold improvements and assets under capital leases | Lesser of the estimated useful life or the term of the lease | |
In accordance with ASC Topic 360, Property, Plant and Equipment, the Company periodically evaluates whether events or circumstances have occurred that indicate that long-lived assets may not be recoverable or that the remaining useful life may
52
TRC COMPANIES, INC.
NOTES TO CONSOLIDATED FINANCIAL STATEMENTS (Continued)
In thousands, except per share data
Note 2. Summary of Significant Accounting Policies and New Accounting Pronouncements (Continued)
warrant revision. When such events or circumstances are present, the Company assesses the recoverability of long-lived assets by determining whether the carrying value will be recovered through the expected undiscounted future cash flows resulting from the use of the asset. In the event the sum of the expected undiscounted future cash flows is less than the carrying value of the asset, an impairment loss equal to the excess of the asset's carrying value over its fair value is recorded. The long-term nature of these assets requires the estimation of cash inflows and outflows several years into the future.
Consolidation—The consolidated financial statements include the Company and its wholly-owned subsidiaries after elimination of intercompany accounts and transactions. The Company determines whether it has a controlling financial interest in an entity by first evaluating whether the entity is a voting interest entity or a variable interest entity ("VIE") under generally accepted accounting principles.
Voting Interest Entities. Voting interest entities are entities in which the total equity investment at risk is sufficient to enable the entity to finance itself independently and which provide the equity holders with the obligation to absorb losses, the right to receive residual returns and the right or power to make decisions about or direct the entity's activities that most significantly impact the entity's economic performance. Voting interest entities, where the Company has a majority interest, are consolidated in accordance with ASC Topic 810, Consolidations ("ASC Topic 810"). ASC Topic 810 states that the usual condition for a controlling financial interest in an entity is ownership of a majority voting interest. Accordingly, the Company consolidates voting interest entities in which it has all, or a majority of, the voting interests.
Variable Interest Entities ("VIE's"). VIE's are entities that lack one or more of the characteristics of a voting interest entity. A controlling financial interest in a VIE is present when an enterprise has a variable interest, or a combination of variable interests, that will absorb a majority of the VIE's expected losses, receive a majority of the VIE's expected residual returns, or both. The enterprise with a controlling financial interest, known as the primary beneficiary, consolidates the VIE.
The Company determines whether it is the primary beneficiary of a VIE by performing a qualitative analysis of the VIE that includes, among other factors, a review of its capital structure, contractual terms, which interests create or absorb variability, related party relationships and the design of the VIE.
Insurance Matters, Litigation and Contingencies—In the normal course of business, the Company is subject to certain contractual guarantees and litigation. Generally, such guarantees relate to project schedules and performance. Most of the litigation involves the Company as a defendant in contractual disputes, professional liability, personal injury and other similar lawsuits. The Company maintains insurance coverage for various aspects of its business and operations, however the Company has elected to retain a portion of losses that may occur through the use of substantial deductibles, exclusions and retentions under its insurance programs. This may subject the Company to future liability for which it is only partially insured or is completely uninsured. In accordance with ASC Topic 450, Contingencies, ("ASC Topic 450"), the Company records in its consolidated balance sheets amounts representing its estimated losses from claims and settlements when such losses are deemed probable and estimable. Otherwise, these losses are expensed as incurred. Costs of defense are expensed as incurred. The Company undertakes an overall assessment of risk, and if the estimate of a probable loss is a range, and no amount within the range is a more likely estimate, the Company accrues the lower limit of the range. As additional information about current or future litigation or other contingencies becomes available, management will assess whether such information warrants the recording of changes in the expenses relating to those contingencies. Additional expenses could potentially have a material impact on the Company's business, financial condition, results of operations or cash flows.
Restricted Cash—In conjunction with the Company’s administration of various State and Public Utility energy efficiency programs, the Company receives energy efficiency rebate funds that are designated for the respective efficiency program participants. The efficiency program funds are sourced from Federal and State grants, such as the American Recovery and Reinvestment Act of 2009, which require the Company to keep the funds segregated from the Company's general assets.
Restricted Investments—Current and long-term restricted investments relate primarily to the Company's Exit Strategy contracts. Under the terms of the majority of Exit Strategy contracts, the contract proceeds were paid by the client to an insurer at inception. A portion of these proceeds, generally five to ten percent, were remitted to the Company. The balance of contract proceeds, less any insurance premiums and fees for a policy to cover potential cost overruns and other factors, were deposited into a restricted investment account with the insurer and are used to pay the Company as services are performed. Upon expiration of the related insurance policies, any remaining funds are remitted to the Company or other parties as provided in the policy. The deposited funds are recorded as restricted investments with a corresponding amount shown as deferred revenue on the Company's
53
TRC COMPANIES, INC.
NOTES TO CONSOLIDATED FINANCIAL STATEMENTS (Continued)
In thousands, except per share data
Note 2. Summary of Significant Accounting Policies and New Accounting Pronouncements (Continued)
consolidated balance sheets. The current portion of the restricted investments represents the amount the Company estimates it will collect from the insurer over the next year.
As of June 30, 2016 and 2015, $14,511 and $18,992, respectively, of the restricted investments represent deposits which earn interest at the one-year constant maturity U.S. Treasury Bill rate, which rate is reset on the anniversary of each policy. As of June 30, 2016 and 2015 the one-year constant maturity U.S. Treasury Bill rate for such deposits ranged from 0.10% to 0.28% and from 0.10% to 0.28%, respectively.
Properties Available for Sale—Included in other assets are certain properties acquired in connection with certain Exit Strategy contracts that are available for sale in the amounts of $4,344 as of June 30, 2015. The properties were recorded at fair value upon acquisition. In fiscal 2016 Company management made the determination to no longer market the land for sale, reclassifying the properties into land and building within property and equipment on the consolidated balance sheet.
In cases where the Company does not expect to recover its carrying costs on properties available for sale, the Company reduces its carrying value to the fair value less costs to sell. During fiscal years 2015 and 2014, no impairment losses were recognized.
Capitalized Software—Internally used software, whether purchased or developed, is capitalized and amortized using the straight-line method over its estimated useful life. In accordance with ASC Subtopic 350-40, Internal-Use Software, the Company capitalizes certain costs associated with software such as costs of employees devoting time to the projects and external direct costs for materials and services. Costs associated with internally developed software to be used internally are expensed until the point at which the project has reached the development stage. Subsequent additions, modifications or upgrades to internal-use software are capitalized only to the extent that they allow the software to perform a task it previously did not perform. Software maintenance and training costs are expensed in the period in which they are incurred. The capitalization of software requires judgment in determining when a project has reached the development stage and the period over which the Company expects to benefit from the use of that software. The Company reviews the economic lives of its capitalized software annually. During fiscal years 2016, 2015 and 2014, capitalized software was amortized over three to five years.
Leases and Lease Financing Obligations—The Company accounts for leases in accordance with ASC Topic 840, Leases. For lease agreements that provide for escalating rent payments and rent holidays, the Company recognizes rent expense on a straight-line basis over the non-cancellable lease term and option renewal periods where failure to exercise such options would result in an economic penalty such that renewal appears, at the inception of the lease, to be reasonably assured. The lease term commences when the Company becomes obligated under the terms of the lease agreement.
Self-Insurance Reserves—The Company has been self-insured for certain losses related to workers' compensation and employee medical benefits. Costs for self-insurance claims are accrued based on known claims and historical experience. Management believes that it has adequately reserved for its self-insurance liability, which is capped through the use of stop-loss contracts with insurance companies. However, any significant variation of future claims from historical trends could cause actual results to differ from the amount recorded. Once the stop-loss limit is reached for a given loss, the Company records a recoverable based on the terms of the self-insured plans.
Environmental Remediation Liabilities—The Company records environmental remediation liabilities for properties available for sale. The environmental remediation liabilities are initially recorded at fair value. The liability is reduced for actual costs incurred in connection with the clean-up activities for each property. In accordance with ASC Topic 405, Liabilities, upon completion of the capital phase of the clean-up, the environmental remediation liability is adjusted to equal the fair value of the remaining operation, maintenance and monitoring activities to be performed for the properties. The reduction in the liability resulting from the completion of the capital phase is included in insurance recoverables and other income. During fiscal years 2016, 2015 and 2014, no such income was recorded.
If it is determined that the expected costs of the clean-up activities are greater than the remaining environmental remediation liability for a specific property, the environmental remediation liability is adjusted pursuant to ASC Topic 410 Asset Retirement and Environmental Obligations ("ASC Topic 410"). Environmental remediation liabilities recorded pursuant to ASC Topic 410 are discounted when the amount and timing of the clean-up activities can be reliably determined. As of June 30, 2016 and 2015, the environmental liability for one project was discounted as the amount and timing of the remaining monitoring activities could be reliably determined. A discount of $353 and $358 was calculated using a risk-free discount rate of 2.9% and 3.1% as of June 30, 2016 and 2015, respectively. Estimated remediation costs for clean-up activities are based on experience, site conditions and the
54
TRC COMPANIES, INC.
NOTES TO CONSOLIDATED FINANCIAL STATEMENTS (Continued)
In thousands, except per share data
Note 2. Summary of Significant Accounting Policies and New Accounting Pronouncements (Continued)
remedy selected. The liability is regularly adjusted as estimates are revised and as cleanup proceeds. Actual results could differ materially from those estimates. The undiscounted environmental liability as of June 30, 2016 and 2015 was $9,438 and $9,537, respectively.
Employee Benefit Plan—The Company has a 401(k) savings plan covering substantially all employees. The Company's matching formula previously had two components. The prior basic match was up to 50% of each Participant's first 4% of contributed compensation, and the discretionary match of up to another 2% of contributed compensation is based on the Company's performance for the previous fiscal year. In fiscal 2016 the Company began providing a basic match of 50% of a participant's first 6% of contributed compensation and discontinued the discretionary match. In fiscal years 2016, 2015 and 2014, the Company's contributions to the plan were $7,423, $6,163 and $4,005, respectively. The Company does not provide post-employment or other post-retirement benefits.
Comprehensive Income (Loss)—The Company reports comprehensive income (loss) in accordance with ASC Topic 220, Comprehensive Income. Comprehensive income (loss) consists of net income (loss) and other gains and losses affecting equity that are not the result of transactions with owners.
Earnings per Share—Basic earnings per share ("EPS") is computed based on the weighted-average number of shares of common stock outstanding during the period. Diluted EPS is computed using the treasury stock method for stock options, warrants, non-vested restricted stock awards and units, and non-vested performance stock units. The treasury stock method assumes conversion of all potentially dilutive shares of common stock with the proceeds from assumed exercises used to hypothetically repurchase stock at the average market price for the period. Diluted EPS is computed by dividing net income applicable to the Company by the weighted-average common shares and potentially dilutive common shares that were outstanding during the period.
The following table sets forth the computations of basic and diluted EPS for the indicated fiscal years ended June 30:
2016 | 2015 | 2014 | |||||||||
Net income applicable to TRC Companies, Inc. | $ | 41 | $ | 19,415 | $ | 12,051 | |||||
Basic weighted-average common shares outstanding | 30,936 | 30,291 | 29,594 | ||||||||
Effect of dilutive stock options, RSA's, RSU's and PSU's | 423 | 433 | 546 | ||||||||
Diluted weighted-average common shares outstanding | 31,359 | 30,724 | 30,140 | ||||||||
Earnings per common share applicable to TRC Companies, Inc.'s common shareholders: | |||||||||||
Basic earnings per common share | $ | 0.00 | $ | 0.64 | $ | 0.41 | |||||
Diluted earnings per common share | $ | 0.00 | $ | 0.63 | $ | 0.40 | |||||
Anti-dilutive stock options, RSA's, RSU's and PSU's, excluded from the calculation | 1,463 | 1,610 | 2,004 | ||||||||
Credit Risks—Financial instruments which subject the Company to credit risk consist primarily of cash, accounts receivable, restricted investments, insurance recoverables, and investments in and advances to unconsolidated affiliates and construction joint ventures. The Company performs credit evaluations of its clients as required and maintains an allowance for estimated credit losses.
Fair Value of Financial Instruments—Cash and cash equivalents, restricted cash, accounts receivable, accounts payable, and accrued liabilities as reflected in the consolidated financial statements, approximate their fair values because of the short-term maturity of those instruments. The Company considers all highly liquid investments with original maturities of three months or less to be cash equivalents. The carrying amounts of the Company's subordinated notes payable as of June 30, 2016 and 2015, approximate fair value because the interest rates on the instruments change with market interest rates or because of the short term nature of their maturities. The carrying amount of the Company's remaining notes payable as of June 30, 2016 and 2015 approximate fair value as either the fixed interest rates approximate current rates for these obligations or the remaining term is not significant.
55
TRC COMPANIES, INC.
NOTES TO CONSOLIDATED FINANCIAL STATEMENTS (Continued)
In thousands, except per share data
Note 2. Summary of Significant Accounting Policies and New Accounting Pronouncements (Continued)
Use of Estimates—The preparation of consolidated financial statements in conformity with generally accepted accounting principles in the United States ("US GAAP") necessarily requires management to make estimates and assumptions that affect the reported amounts of assets and liabilities, disclosure of contingent assets and liabilities at the date of the financial statements, and the reported amounts of revenues and expenses during the reporting periods. Actual results could differ materially from those estimates.
New Accounting Pronouncements—In March 2016, the Financial Accounting Standards Board ("FASB") issued an accounting standards update which simplifies employee share-based payment accounting. This standard will simplify the income tax consequences, accounting for forfeitures and classification on the statement of cash flows. This standard is effective for fiscal years, and interim periods within those fiscal years, beginning after December 15, 2016, with early adoption permitted. This standard will be effective for the Company's fiscal year beginning July 1, 2017. The Company is currently in the process of evaluating the effects of this standard on its condensed consolidated financial statements, including potential early adoption.
In February 2016, the FASB issued an accounting standards update which will replace most existing lease accounting guidance. This standard establishes a right-of-use model that requires a lessee to record a right-of-use asset and a lease liability on the balance sheet for all leases with terms longer than twelve months. Leases will be classified as either finance or operating, with classification affecting the pattern of expense recognition in the income statement. This standard is effective for fiscal years beginning after December 15, 2018, including interim periods within that reporting period. This standard will be effective for the Company's fiscal year beginning July 1, 2019. Early adoption is permitted and should be applied using a modified retrospective approach. The Company is in the process of evaluating the potential impacts of this standard on its condensed consolidated financial statements and related disclosures, including potential early adoption.
In November 2015, the FASB issued an accounting standards update which simplifies the balance sheet classification of deferred taxes. This standard requires that all deferred tax assets and liabilities be classified as non-current in the classified balance sheet, rather than separating such deferred taxes into current and non-current amounts, as is required under current guidance. The standard is effective for annual reporting periods beginning after December 15, 2016, including interim periods within that reporting period with early application permitted. The Company adopted this standard retrospectively at June 30, 2016. Adoption of this standard resulted in a reclassification of the Company's net current deferred tax assets as of June 30, 2015 to net non-current deferred tax assets and by presenting all net deferred tax assets as of June 30, 2016 as non-current in the Company's Consolidated Balance Sheets. Refer to the Reclassification section below for a summary of the impact of this adoption.
In September 2015, the FASB issued an accounting standards update simplifying the accounting for measurement-period adjustments in business combinations. This standard eliminates the requirement to restate prior period financial statements for measurement period adjustments. The new guidance requires that the cumulative impact of a measurement period adjustment (including the impact on prior periods) be recognized in the reporting period in which the adjustment is identified. The standard is effective for annual reporting periods beginning after December 15, 2015, including interim periods within that reporting period with early application permitted. The standard is to be applied prospectively to adjustments to provisional amounts that occur after the effective date of the standard. The Company adopted this standard effective for its first quarter of fiscal 2016. The adoption of this standard resulted in the Company recognizing measurement period adjustments in the periods in which they became known and not restating prior period balance sheets for such adjustments.
In April 2015, the FASB issued an accounting standards update requiring that debt issuance costs related to a recognized debt liability be reported in the balance sheet as a direct deduction from the carrying amount of that debt liability. The standard is effective for annual reporting periods beginning after December 15, 2015, including interim periods within that reporting period with early application permitted for financial statements that have not been previously issued. In August 2015, the FASB issued an accounting standards update which provides additional guidance related to the presentation or subsequent measurement of debt issuance costs related to line-of-credit arrangements. An entity may present debt issuance costs as an asset and subsequently amortize the deferred debt issuance costs ratably over the term of the line-of-credit arrangement, regardless of whether there are any outstanding borrowings. The Company adopted these standards effective for its first quarter of fiscal 2016. The adoption of these standards did not have a material impact on the Company's consolidated financial statements.
In May 2014, the FASB issued an accounting standards update that replaces existing revenue recognition guidance. The updated guidance requires companies to recognize revenue in a way that depicts the transfer of promised goods or services to customers in an amount that reflects the consideration to which the entity expects to be entitled in exchange for those goods or
56
TRC COMPANIES, INC.
NOTES TO CONSOLIDATED FINANCIAL STATEMENTS (Continued)
In thousands, except per share data
Note 2. Summary of Significant Accounting Policies and New Accounting Pronouncements (Continued)
services. In addition, the new standard requires that reporting companies disclose the nature, amount, timing and uncertainty of revenue and cash flows arising from contracts with customers. In March 2016, the FASB further clarified the implementation guidance on principal versus agent considerations. The new standard will be effective for the Company's fiscal year beginning July 1, 2018. No early adoption is permitted under this standard, and it is to be applied retrospectively to each prior reporting period presented or retrospectively with the cumulative effect of initially applying it recognized at the date of initial application. The Company has not yet selected a transition method and is currently evaluating the effect the standard will have on its consolidated financial statements.
Reclassifications—The following table summarizes the impact of the new accounting standard described above on the Company's Consolidated Balance Sheet as of June 30, 2015:
As Previously Reported | Impact of Deferred Tax ASU | As Retrospectively Reclassified | |||||||||
Deferred income tax assets | $ | 16,057 | $ | (16,057 | ) | $ | — | ||||
Total current assets | 250,360 | (16,057 | ) | 234,303 | |||||||
Long-term deferred income tax assets | 2,867 | 16,057 | 18,924 | ||||||||
Note 3. Fair Value Measurements
The Company's financial assets or liabilities are measured using inputs from the three levels of the fair value hierarchy. The classification of a financial asset or liability within the hierarchy is determined based on the lowest level input that is significant to the fair value measurement. The three levels are as follows:
Level 1 Inputs—Unadjusted quoted prices in active markets that are accessible at the measurement date for identical, unrestricted assets or liabilities. Generally, this includes debt and equity securities and derivative contracts that are traded on an active exchange market (e.g. the New York Stock Exchange) as well as certain U.S. Treasury and U.S. Government and agency mortgage-backed securities that are highly liquid and are actively traded in over-the-counter markets.
Level 2 Inputs—Quoted prices for similar assets or liabilities in active markets; quoted prices for identical or similar assets or liabilities in inactive markets; or valuations based on models where the significant inputs are observable (e.g., interest rates, yield curves, credit risks) or can be corroborated by observable market data.
Level 3 Inputs—Valuations based on models where significant inputs are not observable. The unobservable inputs reflect the Company's own assumptions about the assumptions that market participants would use.
The following tables present the level within the fair value hierarchy at which the Company's financial assets and certain liabilities were measured on a recurring basis as of June 30, 2016 and 2015.
57
TRC COMPANIES, INC.
NOTES TO CONSOLIDATED FINANCIAL STATEMENTS (Continued)
In thousands, except per share data
Note 3. Fair Value Measurements (Continued)
Assets and Liabilities Measured at Fair Value on a Recurring Basis as of June 30, 2016:
Level 1 | Level 2 | Level 3 | Total | ||||||||||||
Restricted investments: | |||||||||||||||
Mutual funds | $ | 71 | $ | — | $ | — | $ | 71 | |||||||
Certificates of deposit | — | 107 | — | 107 | |||||||||||
Municipal bonds | — | 547 | — | 547 | |||||||||||
Corporate bonds | — | 439 | — | 439 | |||||||||||
U.S. Government bonds | — | 219 | — | 219 | |||||||||||
U.S. Treasury Notes | 2,009 | — | — | 2,009 | |||||||||||
Money market accounts and cash deposits | 6,476 | — | — | 6,476 | |||||||||||
Total assets | $ | 8,556 | $ | 1,312 | $ | — | $ | 9,868 | |||||||
Contingent consideration | $ | — | $ | — | $ | 233 | $ | 233 | |||||||
Total liabilities | $ | — | $ | — | $ | 233 | $ | 233 | |||||||
Assets and Liabilities Measured at Fair Value on a Recurring Basis as of June 30, 2015:
Level 1 | Level 2 | Level 3 | Total | ||||||||||||
Restricted investments: | |||||||||||||||
Mutual funds | $ | 100 | $ | — | $ | — | $ | 100 | |||||||
Certificates of deposit | — | 106 | — | 106 | |||||||||||
Municipal bonds | — | 548 | — | 548 | |||||||||||
Corporate bonds | — | 228 | — | 228 | |||||||||||
U.S. Government bonds | — | 216 | — | 216 | |||||||||||
Money market accounts and cash deposits | 4,896 | — | — | 4,896 | |||||||||||
Total assets | $ | 4,996 | $ | 1,098 | $ | — | $ | 6,094 | |||||||
Contingent consideration | $ | — | $ | — | $ | 693 | $ | 693 | |||||||
Total liabilities | $ | — | $ | — | $ | 693 | $ | 693 | |||||||
A majority of the Company's investments are priced by pricing vendors and are generally Level 1 or Level 2 investments as these vendors either provide a quoted market price in an active market or use observable input for their pricing without applying significant adjustments. Broker pricing is used mainly when a quoted price is not available, the investment is not priced by the pricing vendors, or when a broker price is more reflective of fair value in the market in which the investment trades. The Company's broker priced investments are classified as Level 2 investments because the broker prices the investment based on similar assets without applying significant adjustments. The Company's restricted investment financial assets as of June 30, 2016 and 2015 are included within current and long-term restricted investments on the consolidated balance sheets.
The Company's long-term debt is not measured at fair value in the consolidated balance sheets. The fair value of debt is the estimated amount the Company would have to pay to transfer its debt, including any premium or discount attributable to the difference between the stated interest rate and market rate of interest at the balance sheet date. Fair values are based on valuations of similar debt at the balance sheet date and supported by observable market transactions when available: level 2 of the fair value hierarchy. At June 30, 2016 and 2015, the fair value of the Company's debt was not materially different than its carrying value.
Reclassification adjustments for realized gains or losses from available for sale restricted investment securities out of accumulated other comprehensive income were included in the consolidated statement of operations within the insurance recoverables and other income line item.
58
TRC COMPANIES, INC.
NOTES TO CONSOLIDATED FINANCIAL STATEMENTS (Continued)
In thousands, except per share data
Note 3. Fair Value Measurements (Continued)
As of June 30, 2016 and 2015, $6,476 and $4,896, respectively, of the restricted investments represented deposits in money market accounts and U.S. Treasury Notes under escrow arrangements. Also included in restricted investments are mutual funds, bonds, certificates of deposit, asset backed securities and U.S. Treasury Notes under escrow arrangements with a cost of $1,304 and a fair value of $1,312, as of June 30, 2016, and a cost of $1,103 and a fair value of $1,098, as of June 30, 2015, respectively. These investments are recorded at fair value with changes in unrealized appreciation reported as a separate component of equity. During fiscal years 2016, 2015 and 2014, realized (losses)/gains of $(23), $(4) and $100 were reported, respectively. If the Company determines that any unrealized losses are other than temporary, they will be charged to earnings. Total losses for securities with net losses in accumulated other comprehensive income were $17, $38 and $102 in fiscal years 2016, 2015 and 2014, respectively. Total gains for securities with net gains in accumulated other comprehensive income were $44, $20 and $153 in fiscal years 2016, 2015 and 2014, respectively.
The restricted investments under escrow arrangements earned dividends and interest of $71, $62 and $98 during fiscal years 2016, 2015 and 2014, respectively, which are recorded as income and reflected as an operating activity in the consolidated statements of cash flows.
The Company's contingent consideration liabilities, included in other accrued liabilities on the consolidated balance sheets, are associated with the acquisitions made in the fiscal year ended June 30, 2015. The liabilities are measured at fair value using a probability weighted average of the potential payment outcomes that would occur should certain contract metrics be reached. There is no market data available to use in valuing the contingent consideration; therefore, the Company developed its own assumptions related to the achievement of the metrics to evaluate the fair value of these liabilities. As such, the contingent consideration is classified within Level 3 as described below.
Items classified as Level 3 within the valuation hierarchy, consisting of contingent consideration liabilities related to recent acquisitions, were valued based on various estimates, including probability of success, discount rates and amount of time until the conditions of the contingent payments are achieved. The table below presents a rollforward of the contingent consideration liabilities valued using Level 3 inputs:
2016 | 2015 | 2014 | ||||||||
Contingent consideration, beginning of year | $ | 693 | $ | 352 | $ | 1,365 | ||||
Additions for acquisitions | — | 662 | 504 | |||||||
Reduction of liability for payments made | (835 | ) | (346 | ) | (567 | ) | ||||
Increase (reduction) of liability related to re-measurement of fair value | 375 | 25 | (950 | ) | ||||||
Contingent consideration, end of year | $ | 233 | $ | 693 | $ | 352 | ||||
Note 4. Accounts Receivable
The current portion of accounts receivable as of June 30, 2016 and 2015 were comprised of the following:
2016 | 2015 | ||||||
Billed | $ | 90,194 | $ | 80,932 | |||
Unbilled | 64,954 | 62,528 | |||||
Retainage | 2,429 | 3,478 | |||||
157,577 | 146,938 | ||||||
Less allowance for doubtful accounts | (8,297 | ) | (8,592 | ) | |||
$ | 149,280 | $ | 138,346 | ||||
A substantial portion of unbilled receivables represents billable amounts recognized as revenue in the last month of the fiscal period. Management expects that substantially all unbilled amounts will be billed and collected within one year. Retainage represents amounts billed but not paid by the client which, pursuant to contract terms, are due at completion.
59
TRC COMPANIES, INC.
NOTES TO CONSOLIDATED FINANCIAL STATEMENTS (Continued)
In thousands, except per share data
Note 4. Accounts Receivable (Continued)
Rollforward of allowance for doubtful accounts reserves is as follows:
Additions | ||||||||||||||||||
Fiscal Year | Description | Balance at beginning of period | Charged to costs and expenses | Other (1) | Deductions (2) | Balance at end of period | ||||||||||||
2016 | Allowance for doubtful accounts | $ | (8,592 | ) | — | (67 | ) | 362 | $ | (8,297 | ) | |||||||
2015 | Allowance for doubtful accounts | $ | (8,720 | ) | (349 | ) | — | 477 | $ | (8,592 | ) | |||||||
2014 | Allowance for doubtful accounts | $ | (11,173 | ) | — | — | 2,453 | $ | (8,720 | ) | ||||||||
______________________________
(1) | Allowance for acquired businesses. |
(2) | Uncollectible accounts written off, net of recoveries. |
Note 5. Long-Term Prepaid Insurance
Long-term prepaid insurance relates to insurance premiums and other fees paid by the client to the insurer, typically through an insurance broker, for environmental remediation cost cap and pollution legal liability insurance policies related to the Company's Exit Strategy contracts. The insurance premiums and fees are amortized over the life of the policies which have terms, at policy inception, ranging from five to thirty-two years. The portion of the premiums and fees paid for the insurance policies that will be amortized over the next year are included in prepaid expenses and other current assets in the Company's consolidated balance sheets.
Note 6. Other Accrued Liabilities
As of June 30, 2016 and 2015, other accrued liabilities were comprised of the following:
2016 | 2015 | ||||||
Contract costs | $ | 40,343 | $ | 27,980 | |||
Legal accruals | 5,232 | 5,224 | |||||
Lease obligations | 5,564 | 3,354 | |||||
Other | 6,887 | 5,612 | |||||
$ | 58,026 | $ | 42,170 | ||||
Note 7. Deferred Revenue
Deferred revenue represents amounts billed or collected in accordance with contractual terms in advance of when the work is performed. These advance payments primarily relate to the Company's Exit Strategy program. The current portion of deferred revenue represents the balance the Company estimates will be earned as revenue during the next fiscal year.
60
TRC COMPANIES, INC.
NOTES TO CONSOLIDATED FINANCIAL STATEMENTS (Continued)
In thousands, except per share data
Note 8. Acquisitions
Fiscal 2016 Acquisition
On November 30, 2015, the Company acquired the Professional Services business ("Pipeline Services") of Willbros Group ("Willbros") in an all cash transaction. The $124,498 purchase price consisted of (i) an initial cash payment of $119,955 paid at closing, and, (ii) a second cash payment due of $7,500 payable at the earlier of certain Willbros contract novations (or written approval of a subcontract) and Willbros obtaining certain consents, or March 15, 2016, net of an estimate working capital adjustment due from Willbros of $2,957. The second cash payment was made in two tranches, with $2,354 paid in March 2016 and the remaining balance paid in July 2016 in conjunction with the net working capital settlement. Goodwill of $60,294, all of which is expected to be tax deductible, and other intangible assets of $44,500 were recorded as a result of this acquisition.
The following summarizes the estimated fair values of the Pipeline Services assets acquired and liabilities assumed at the acquisition date, as well as measurement period adjustments:
November 30, 2015 (As Initially Reported) | Measurement Period Adjustments | November 30, 2015 (As Adjusted) | ||||||||||||
Cash and cash equivalents | $ | 355 | $ | — | $ | 355 | ||||||||
Accounts receivable | 26,406 | 1,857 | 28,263 | |||||||||||
Prepaid expenses and other current assets | 7,276 | (48 | ) | 7,228 | ||||||||||
Property and equipment | 3,552 | — | 3,552 | |||||||||||
Identifiable intangible assets: | ||||||||||||||
Customer relationships and backlog | 43,500 | — | 43,500 | |||||||||||
Internally developed software | 1,000 | — | 1,000 | |||||||||||
Total identifiable intangible assets | 44,500 | — | 44,500 | |||||||||||
Goodwill | 64,673 | (4,379 | ) | 60,294 | ||||||||||
Other non-current assets | 20,683 | — | 20,683 | |||||||||||
Accounts payable | (2,587 | ) | 43 | (2,544 | ) | |||||||||
Accrued compensation and benefits | (7,199 | ) | (2 | ) | (7,201 | ) | ||||||||
Other accrued liabilities | (5,210 | ) | 100 | (5,110 | ) | |||||||||
Current portion of long-term debt | (6,447 | ) | (38 | ) | (6,485 | ) | ||||||||
Long-term debt, net of current portion | (18,547 | ) | — | (18,547 | ) | |||||||||
Non-controlling interest | — | (490 | ) | (490 | ) | |||||||||
Net assets acquired | $ | 127,455 | $ | (2,957 | ) | $ | 124,498 | |||||||
Customer relationships and backlog represent the fair value of existing contracts and the underlying customer relationships. The backlog has a 1 year life and customer relationships have lives ranging from 12 to 15 years (weighted average lives of 6 years). The internally developed software has a life of approximately 5 years (weighted average life of 5 years).
The purchase price allocation is based upon preliminary information and is subject to change when additional information becomes available. The goodwill recognized is attributable to the future strategic growth opportunities arising from the acquisition, Pipeline Service's highly skilled assembled workforce, which does not qualify for separate recognition, and the expected cost synergies of the combined operations. The Company has not completed its final assessment of the fair values of purchased receivables, contingent liabilities, or acquired contracts. The final fair value of the net assets acquired may result in adjustments to certain assets and liabilities, including goodwill.
61
TRC COMPANIES, INC.
NOTES TO CONSOLIDATED FINANCIAL STATEMENTS (Continued)
In thousands, except per share data
Note 8. Acquisitions (Continued)
The unaudited pro forma financial information summarized in the following table gives effect to the Pipeline Services acquisition assuming it occurred on July 1, 2014. These unaudited pro forma operating results do not assume any impact from revenue, cost or other operating synergies that are expected as a result of the acquisition. Pro forma adjustments have been made to reflect amortization of the identified intangible assets for the related periods, as well as the amortization of deferred debt issuance costs incurred. Identifiable intangible assets are being amortized on a basis approximating the economic value derived from those assets. These unaudited pro forma operating results are presented for illustrative purposes only and are not indicative of the operating results that would have been achieved had the acquisition occurred on July 1, 2014, nor does the information project results for any future period.
Twelve Months Ended | |||||||
June 30, 2016 | June 30, 2015 | ||||||
Gross revenue | $ | 695,916 | $ | 772,628 | |||
Net service revenue | 515,705 | 562,441 | |||||
Net (loss) income applicable to TRC Companies, Inc. | (2,378 | ) | 12,890 | ||||
Basic (loss) earnings per common share | $ | (0.08 | ) | $ | 0.43 | ||
Diluted (loss) earnings per common share | $ | (0.08 | ) | $ | 0.42 | ||
Since the acquisition date, the Pipeline Services operating segment has contributed $60,712 in gross revenue, $48,379 in net service revenue, and an operating loss of $(7,476) for the period from November 30, 2015 through June 30, 2016, which includes a portion of the acquisition and integration expenses described below.
Acquisition and integration expenses in the accompanying consolidated statements of operations were comprised of the following:
Twelve Months Ended | ||||
June 30, 2016 | ||||
Severance and personnel costs | $ | 1,508 | ||
Professional services and other expenses | 2,824 | |||
Lease abandonments | 2,239 | |||
Total | $ | 6,571 | ||
Fiscal Year 2015 Acquisition
On September 29, 2014, the Company acquired all of the outstanding stock of NOVA Training Inc. and all of the outstanding membership interests of NOVA Earthworks, LLC (collectively "NOVA") based in Midland, Texas. NOVA provides safety training and environmental services as well as oil spill response, remediation and general oil field construction services to customers in the oil and gas industry. The initial purchase price consisted of (i) a cash payment of $7,198 payable at closing, (ii) a second cash payment of $2,600 placed into escrow, of which $508 was paid in six months and the remaining $2,092 was paid in 18 months, (iii) 50 shares of the Company's common stock valued at $323 on the closing date, and (iv) a $560 net working capital adjustment. The sellers are also entitled to up to $1,500 in contingent cash consideration through an earn-out provision based on the NSR performance of the acquired firm over the 24 month period following closing. The Company estimated the fair value of the remaining contingent earn-out liability to be $287 based on the projections and probabilities of reaching the performance goals through September 2016. Goodwill of $3,683, none of which is expected to be tax deductible, and other intangible assets of $3,622 were recorded as a result of this acquisition. The goodwill is primarily attributable to the synergies and ancillary growth opportunities expected to arise after the acquisition. The fair values of assets and liabilities of the NOVA acquisition have been recorded in the Environmental operating segment. The impact of this acquisition was not material to the Company's condensed consolidated balance sheets and results of operations.
62
TRC COMPANIES, INC.
NOTES TO CONSOLIDATED FINANCIAL STATEMENTS (Continued)
In thousands, except per share data
Note 8. Acquisitions (Continued)
Fiscal Year 2014 Acquisitions
On January 2, 2014, the Company acquired all of the outstanding stock of EMCOR Energy Services, Inc. ("EES"), a subsidiary of EMCOR Group, Inc., headquartered in San Francisco, California. EES provides engineering and related consulting services to utilities to support their energy programs in California. Services include engineering, technical review, verification, and administration of utilities’ energy efficiency programs. The purchase price of $1,644 consisted of a cash payment of $1,400, and a $244 net working capital adjustment. Goodwill of $247, none of which is expected to be tax deductible, and other intangible assets of $861 were recorded as a result of this acquisition. The goodwill is primarily attributable to the synergies and ancillary growth opportunities expected to arise after the acquisition. The EES acquisition has been recorded in the Energy operating segment. The impact of this acquisition was not material to the Company's consolidated balance sheets and results of operations.
On July 22, 2013, the Company acquired all of the outstanding stock of Utility Support Systems, Inc. ("USS"), headquartered in Douglasville, Georgia. USS provides engineering and related services primarily supporting the power/utility market. The purchase price of $5,027 consisted of: (i) cash of $2,500 payable at closing, (ii) a second cash payment of $1,803 payable on the one-year anniversary of the closing date subject to withholding for various contractual issues, and (iii) 34 shares of the Company's common stock valued at $295 on the closing date. The selling shareholders were also entitled to contingent cash consideration through an earn-out provision based on net service revenue ("NSR") performance of the acquired firm over the twelve month period following closing. The Company estimated the fair value of the contingent earn-out liability to be $504 based on the projections and probabilities of reaching the performance goals through July 2014. The earnout goals were not achieved, and the liability was subsequently reversed in fiscal year 2014. Goodwill of $2,180, none of which is expected to be tax deductible, and other intangible assets of $2,056 were recorded as a result of this acquisition. The goodwill is primarily attributable to the synergies and ancillary growth opportunities expected to arise after the acquisition. The USS acquisition has been recorded in the Energy operating segment. The impact of this acquisition was not material to the Company's consolidated balance sheets and results of operations.
During fiscal years 2016, 2015 and 2014, the Company made additional purchase price cash payments of $1,161, $2,644 and $1,124, respectively, related to acquisitions completed in the current and prior years. The additional purchase price payments were earned as a result of the final determination of working capital adjustments and the acquired entities achieving financial objectives pursuant to contingent consideration arrangements.
Note 9. Goodwill and Other Intangible Assets
The Company performed its most recent annual goodwill impairment test as of April 29, 2016, and noted the fair value of each of the Company's reporting units with goodwill exceeded its carrying value, and therefore, no further analysis was required.
As of June 30, 2016, the Company had $75,337 of goodwill. The Company does not believe there were any events or changes in circumstances since its April 2016 annual assessment that would indicate the fair value of goodwill was more likely than not reduced to below its carrying value. In making this assessment, the Company relied on a number of factors including operating results, business plans, anticipated future cash flows, transactions and market data.
In performing the fiscal year 2016 and 2015 goodwill assessments, the Company utilized valuation methods, including the discounted cash flow method, the guideline company approach, and the guideline transaction approach as the best evidence of fair value. The weighting of the valuation methods used by the Company in both fiscal 2016 and 2015 was 50% discounted cash flows, 40% guideline company approach and 10% guideline transaction approach.
The key estimates and factors used in the income approach include, but are not limited to, revenue growth rates and profit margins based on internal forecasts, terminal value and the weighted-average cost of capital used to discount future cash flows. The key uncertainty in the revenue growth assumption used in the estimation of the fair value of the Energy operating segment reporting units is the level of investment electric utilities will make to modernize, expand, and enhance the electric transmission grid over the next several years. The key uncertainty in the revenue growth assumption used in the estimation of the fair value of the Environmental operating segment reporting units is the projected increase in capital spending on oil and gas pipelines, energy exploration and distribution projects, new power and generation sources, and increased environmental management strategies to
63
TRC COMPANIES, INC.
NOTES TO CONSOLIDATED FINANCIAL STATEMENTS (Continued)
In thousands, except per share data
Note 9. Goodwill and Other Intangible Assets (Continued)
comply with recent regulatory rule-making. The key uncertainty in the revenue growth assumption used in the estimation of the fair value of the Pipeline Services operating segment reporting units is the projected increase in capital spending tied to commodity pricing on oil and gas pipelines and related facilities, and timing of regulatory rule-making impacting the oil and gas market.
Virtually all of the assumptions used in the Company's models are susceptible to change due to national and regional economic conditions as well as competitive factors in the industry in which the Company operates. The forecasted cash flows the Company uses are derived from the annual long-range planning process that it performs and presents to its Board of Directors. In this process, each reporting unit is required to develop reasonable revenue, earnings and cash flow forecasts for the next five years based on current and forecasted economic conditions. For purposes of testing for impairment, the cash flow forecasts are adjusted as needed to reflect information that becomes available concerning changes in business levels and general economic trends. The discount rates used for determining discounted future cash flows are generally based on our weighted-average cost of capital and are then adjusted for "plan risk" (the risk that a business will fail to achieve its forecasted results). Finally, a growth factor beyond the five year period for which cash flows are planned is selected based on expectations of future economic conditions. While the Company believes the estimates and assumptions it uses are reasonable, various economic factors could cause the results of its goodwill testing to vary significantly.
As further discussed below, due to the economic conditions in the oil and gas commodity markets, current actual operating performance, and revised projected financial performance, we assessed the recoverability of goodwill within the two reporting units within the Pipeline Services operating segment during the three months ended March 25, 2016.
The impairment test for goodwill is a two-step process involving the comparison of the estimated fair value of each reporting unit to the reporting unit’s carrying value, including goodwill. The Company estimates the fair value of reporting units based on a comparison and weighting of the income approach, specifically the discounted cash flow method, and the guideline company approach. If the fair value of a reporting unit exceeds its carrying amount, the goodwill of the reporting unit is not considered impaired; therefore, the second step of the impairment test is unnecessary. If the carrying amount of a reporting unit exceeds its fair value, the Company performs the second step of the goodwill impairment test to measure the amount of impairment loss to be recorded. If goodwill is impaired, the Company is required to record a non-cash charge to reduce the carrying value of goodwill to its implied fair value.
The Company performed the first step of the impairment test for the two reporting units within the Pipeline Services operating segment, and in each case determined that the carrying value of the reporting unit exceeded its fair value indicating potential goodwill impairment. The significant change to the assumptions used in the interim impairment test during the three months ended March 25, 2016 compared to the assumptions utilized in the Pipeline Services operating segments initial November 2015 valuation were the projected net service revenue, operating income, and cash flows for each reporting unit tested, which were impacted by the continued market uncertainty in the oil and gas markets and current actual operating performance compared to the originally projected results.
The Company performed the second step of the goodwill impairment test to measure the amount of the impairment loss, if any, of the applicable reporting units. The second step of the test requires the allocation of the reporting unit’s fair value to its assets and liabilities, including any unrecognized intangible assets, in a hypothetical analysis that calculates the implied fair value of goodwill as if the reporting unit was being acquired in a business combination. If the implied fair value of goodwill is less than the carrying value, the difference is recorded as an impairment loss. Based on the results of the step two analysis, the Company recorded a preliminary goodwill impairment charge of $24,465 during the three months ended March 25, 2016. In the fourth quarter of fiscal 2016 the Company adjusted its preliminary purchase price allocation and the second step of the goodwill impairment test. These adjustments resulted in a $2,484 reduction of the initial impairment charge to an aggregate $21,981 for the fiscal year ended June 30, 2016.
Significant management judgments are necessary to evaluate the impact of operating and macroeconomic changes. Critical assumptions include projected net service revenue growth, profit margins, general and administrative expenses, working capital fluctuations, capital expenditures, discount rates and terminal growth rates. As of June 30, 2016 the second step of the analysis remains open, as the initial Pipeline Services purchase price allocation remains preliminary. Any future adjustments to the Pipeline Services purchase price allocation could materially impact the final charge for goodwill impairment.
64
TRC COMPANIES, INC.
NOTES TO CONSOLIDATED FINANCIAL STATEMENTS (Continued)
In thousands, except per share data
Note 9. Goodwill and Other Intangible Assets (Continued)
The changes in the carrying amount of goodwill for fiscal year 2016 by operating segment are as follows:
Gross | Gross | |||||||||||||||||||||
Balance, | Accumulated | Balance, | Balance, | Accumulated | Balance, | |||||||||||||||||
July 1, | Impairment | July 1, | June 30, | Impairment | June 30, | |||||||||||||||||
Operating Segment | 2015 | Losses | 2015 | Additions | 2016 | Losses | 2016 | |||||||||||||||
Energy | $ | 28,506 | $ | (14,506 | ) | $ | 14,000 | $ | — | $ | 28,506 | $ | (14,506 | ) | $ | 14,000 | ||||||
Environmental | 40,889 | (17,865 | ) | 23,024 | — | 40,889 | (17,865 | ) | 23,024 | |||||||||||||
Infrastructure | 7,224 | (7,224 | ) | — | — | 7,224 | (7,224 | ) | — | |||||||||||||
Pipeline Services | — | — | — | 60,294 | 60,294 | (21,981 | ) | 38,313 | ||||||||||||||
$ | 76,619 | $ | (39,595 | ) | $ | 37,024 | $ | 60,294 | $ | 136,913 | $ | (61,576 | ) | $ | 75,337 | |||||||
The changes in the carrying amount of goodwill for fiscal year 2015 by operating segment are as follows:
Gross | Gross | |||||||||||||||||||||
Balance, | Accumulated | Balance, | Balance, | Accumulated | Balance, | |||||||||||||||||
July 1, | Impairment | July 1, | June 30, | Impairment | June 30, | |||||||||||||||||
Operating Segment | 2014 | Losses | 2014 | Additions | 2015 | Losses | 2015 | |||||||||||||||
Energy | $ | 27,836 | $ | (14,506 | ) | $ | 13,330 | $ | 670 | $ | 28,506 | $ | (14,506 | ) | $ | 14,000 | ||||||
Environmental | 36,214 | (17,865 | ) | 18,349 | 4,675 | 40,889 | (17,865 | ) | 23,024 | |||||||||||||
Infrastructure | 7,224 | (7,224 | ) | — | — | 7,224 | (7,224 | ) | — | |||||||||||||
$ | 71,274 | $ | (39,595 | ) | $ | 31,679 | $ | 5,345 | $ | 76,619 | $ | (39,595 | ) | $ | 37,024 | |||||||
Identifiable intangible assets as of June 30, 2016 and 2015 were comprised of:
June 30, 2016 | June 30, 2015 | |||||||||||||||||||||||
Gross | Net | Gross | Net | |||||||||||||||||||||
Carrying | Accumulated | Carrying | Carrying | Accumulated | Carrying | |||||||||||||||||||
Identifiable intangible assets | Amount | Amortization | Amount | Amount | Amortization | Amount | ||||||||||||||||||
With determinable lives: | ||||||||||||||||||||||||
Customer relationships | $ | 59,218 | $ | (14,933 | ) | $ | 44,285 | $ | 16,618 | $ | (7,740 | ) | $ | 8,878 | ||||||||||
Contract backlog | 900 | (525 | ) | 375 | — | — | — | |||||||||||||||||
Technology | 1,000 | (117 | ) | 883 | — | — | — | |||||||||||||||||
61,118 | (15,575 | ) | 45,543 | 16,618 | (7,740 | ) | 8,878 | |||||||||||||||||
With indefinite lives: | ||||||||||||||||||||||||
Engineering licenses | 426 | — | 426 | 426 | — | 426 | ||||||||||||||||||
$ | 61,544 | $ | (15,575 | ) | $ | 45,969 | $ | 17,044 | $ | (7,740 | ) | $ | 9,304 | |||||||||||
Identifiable intangible assets with determinable lives are amortized over their estimated useful lives and are also reviewed for impairment if events or changes in circumstances indicate that their carrying amount may not be realizable.
The weighted-average periods of amortization by intangible asset class for those with determinable lives is approximately 7 years for customer relationship assets, 1 year for contract backlog and 5 years for technology. The amortization of intangible assets for fiscal years 2016, 2015 and 2014 was $7,835, $3,502 and $2,868, respectively.
65
TRC COMPANIES, INC.
NOTES TO CONSOLIDATED FINANCIAL STATEMENTS (Continued)
In thousands, except per share data
Note 9. Goodwill and Other Intangible Assets (Continued)
Estimated amortization expense of intangible assets for future periods is as follows:
Fiscal Year | Amount | ||||
2017 | $ | 10,159 | |||
2018 | 9,183 | ||||
2019 | 8,367 | ||||
2020 | 7,821 | ||||
2021 | 7,274 | ||||
2022 and thereafter | 2,739 | ||||
Total | $ | 45,543 | |||
On an annual basis, or more frequently if events or changes in circumstances indicate that the asset might be impaired, the fair value of the indefinite-lived intangible assets is evaluated by the Company to determine if an impairment charge is required. The Company performed its most recent annual impairment review as of April 29, 2016. As of the assessment date there was no impairment of the indefinite-lived intangible assets. There were no events or changes in circumstances that would indicate the fair value of indefinite-lived intangible assets was reduced to below its carrying value since the assessment date.
Note 10. Long-Term Debt and Capital Lease Obligations
Long-term debt and capital lease obligations as of June 30, 2016 and 2015 were comprised of the following:
2016 | 2015 | ||||||
Term loan | $ | 72,187 | $ | — | |||
Revolving facility | — | — | |||||
Contractor-owned, contractor-operated facility debt | 21,344 | — | |||||
Subordinated debt - note payable | 5,146 | — | |||||
Lease financing obligations | 55 | 105 | |||||
Capital lease obligations | — | 166 | |||||
Less deferred debt issuance costs | (1,150 | ) | — | ||||
97,582 | 271 | ||||||
Less current portion | (18,339 | ) | (216 | ) | |||
Long-term debt and capital lease obligations | $ | 79,243 | $ | 55 | |||
Revolving Credit Facility
Previously, the Company and substantially all of its subsidiaries, were party to a secured credit agreement (the "Prior Credit Agreement") and related security documentation with Citizens Commercial Banking as lender, administrative agent, sole lead arranger, and sole book runner and JP Morgan Chase Bank, N.A. as lender and syndication agent. The Prior Credit Agreement provided the Company with a $75,000 five-year secured revolving credit facility with a sublimit of $15,000 available for the issuance of letters of credit. Pursuant to the terms of the Prior Credit Agreement, the Company could request an increase in the amount of the credit facility up to $95,000. The expiration date of the Prior Credit Agreement was April 16, 2018.
Amounts outstanding under the Prior Credit Agreement bore interest at the Base Rate (as defined, generally the prime rate) plus a margin of 1.00% to 1.50% or at LIBOR plus a margin of 2.00% to 2.50%, based on the ratio (measured over a trailing four-quarter period) of consolidated total debt to earnings before interest, taxes, depreciation and amortization ("EBITDA"), as defined. The Company's obligations under the Prior Credit Agreement were secured by a pledge of substantially all of its assets and
66
TRC COMPANIES, INC.
NOTES TO CONSOLIDATED FINANCIAL STATEMENTS (Continued)
In thousands, except per share data
Note 10. Long-Term Debt and Capital Lease Obligations (Continued)
guaranteed by its principal operating subsidiaries. The Prior Credit Agreement also contained cross-default provisions which became effective if the Company defaulted on other indebtedness.
Under the Prior Credit Agreement the Company was required to maintain a fixed charge coverage ratio of no less than 1.25 to 1.00 and to not permit its leverage ratio to exceed 2.00 to 1.00. The Prior Credit Agreement also required the Company to achieve minimum levels of Consolidated Adjusted EBITDA of $20,000 for the twelve-month periods ending June 30, 2015 and thereafter. The Prior Credit Agreement also limited the payment of cash dividends to $10,000 in aggregate during its term. The Company was in compliance with the financial covenants under the Prior Credit Agreement through its termination date.
As of June 30, 2015, the Company had no borrowings outstanding under the Prior Credit Agreement. Letters of credit outstanding were $2,048 as of June 30, 2015. Based upon the leverage covenant, the maximum availability under the Prior Credit Agreement was $75,000 as of June 30, 2015. Funds available to borrow under the Prior Credit Agreement, after consideration of the letters of credit outstanding and other indebtedness outstanding of $166, were $72,786 at June 30, 2015.
On November 30, 2015, the Company entered into a five-year credit agreement (the “New Credit Agreement”) with Citizens Bank, N.A. as lender, LC issuer, administrative agent, sole lead arranger, and sole book runner; BMO Harris Bank, N.A. as lender, LC issuer and syndication agent; KeyBank, N.A. as lender and document agent, and five other banks as lenders . The New Credit Agreement provides the Company with an aggregate borrowing capacity of $175,000, consisting of a $100,000 five-year secured revolving credit facility (“Revolving Facility”) with a sub-limit of $15,000 available for the issuance of letters of credit, as well as a five-year secured $75,000 term loan (“Term Loan”). The New Credit Agreement replaced the Prior Credit Agreement.
The proceeds of the Term Loan, together with cash on hand and proceeds from borrowing under the Revolving Facility, were used to pay the purchase price for Willbros Professional Services and to fund transaction costs incurred in connection with the Willbros Professional Services acquisition. The Revolving Facility will also be available for working capital and general corporate purposes. The Revolving Facility includes borrowing capacity for letters of credit and for borrowings on same-day notice, referred to as “swingline loans.” Borrowings under the Revolving Facility are subject to the satisfaction of customary conditions, including absence of defaults and accuracy of representations and warranties. The Company may request an increase in the amount of the New Credit Agreement up to an additional $75,000, which may be through additional term or revolving loans.
Borrowings outstanding under the Revolving Facility will mature on November 30, 2020. The Term Loan amortizes in quarterly installments payable on the last day of each March, June, September, and December, commencing on March 31, 2016 in amounts equal to 1.875% of the term loan made or outstanding, with the balance payable on November 30, 2020 (the "Term Loan Maturity Date.") In addition, the Company is required, subject to certain exceptions, to make payments on the Term Loan: (a) based on a stated percentage of Excess Cash Flow, either 50% or 0% depending on whether the Company's consolidated leverage ratio is above or below 2 times adjusted EBITDA as defined in the New Credit Agreement; (b) in an amount of 100% of net cash proceeds from asset sales subject to certain reinvestment rights; (c) in an amount of 100% of net cash proceeds of any issuance of debt other than debt permitted to be incurred under the New Credit Agreement; and, (d) in an amount of 100% of net cash proceeds from events of loss subject to certain reinvestment rights. The borrowings under the New Credit Agreement may be reduced, in whole or in part, without premium or penalty.
Amounts outstanding under the New Credit Agreement bear interest at the Base Rate (as defined, generally the prime rate) plus a margin of 0.50% to 1.25%, or at the Eurodollar Rate (as defined, generally the LIBOR rate) plus a margin of 1.50% to 2.25%, based on the Company's Leverage Ratio (as defined). In addition to these borrowing rates, there is a commitment fee which ranges from 0.20% to 0.375% on any unused commitments. The applicable fees for issuance of letters of credit under the Revolving Facility is a range from 1.50% to 2.25%.
The Company’s obligations under the New Credit Agreement are secured by a pledge of substantially all of its assets and guaranteed by its principal operating subsidiaries. The New Credit Agreement also contains cross-default provisions which become effective if the Company defaults on other indebtedness.
The New Credit Agreement contains various customary restrictive covenants that limit our ability to, among other things: incur additional indebtedness including guarantees; enter into sale/leaseback transactions; make investments, loans or acquisitions;
67
TRC COMPANIES, INC.
NOTES TO CONSOLIDATED FINANCIAL STATEMENTS (Continued)
In thousands, except per share data
Note 10. Long-Term Debt and Capital Lease Obligations (Continued)
grant or incur liens on our assets; sell our assets; engage in mergers, consolidations, liquidations or dissolutions; engage in transactions with affiliates; and make restricted payments. Under the New Credit Agreement the Company is required to maintain a fixed charge coverage ratio of no less than 1.25 to 1.00 and to not permit its leverage ratio to exceed 3.00 to 1.00. Additionally, the New Credit Agreement also limits the payment of cash dividends to $10,000 in aggregate during its term.
On November 30, 2015 the Company borrowed $102,000 under the New Credit Agreement to partially fund the aforementioned Willbros Professional Services acquisition. The borrowing was comprised of a full borrowing of the $75,000 term loan and a $27,000 borrowing under the Revolving Facility. Borrowings under the Term Loan bear interest at a stated rate of 2.32% and have an effective interest rate of 2.74% at June 30, 2016. As of June 30, 2016 the Company had no borrowings outstanding under the New Credit Agreement's Revolving Facility and $72,187 outstanding under the Term Loan. During fiscal 2016 the Company had borrowings and repayments of $66,000 under the New Credit Agreement's Revolving Facility. Funds available to borrow under the New Credit Agreement, after consideration of the letters of credit outstanding, were $97,221 at June 30, 2016. As of June 30, 2016, the Company was in compliance with all covenants under the New Credit Agreement.
In accounting for the transaction costs incurred in conjunction with the New Credit Agreement, the Company allocated the total costs incurred based on the relative fair values of the Revolving Facility and Term Loan. A total of $1,916 and $1,332 were allocated to the Revolving Facility and Term Loan, respectively.
As of June 30, 2016, the Term Loan consisted of the following:
Current portion of Term Loan | $ | 5,625 | ||
Long-term portion of Term Loan | $ | 66,562 | ||
Less: Debt issuance costs | (1,150 | ) | ||
Net carrying amount | $ | 65,412 | ||
Contractor-Owned, Contractor-Operated facility debt
As of June 30, 2016, the Company recorded approximately $21,344 of debt obligations assumed in the Pipeline Services acquisition, of which $7,551 was current. A third party finance company had provided financing to Pipeline Services in conjunction with the construction of fueling facilities for the federal government. Upon acceptance of the constructed facilities, the federal government pays Pipeline Services in equal monthly installments over the subsequent five years pursuant to a contract. Therefore, as of June 30, 2016, the Company also recorded approximately $22,435 of receivables which were acquired in the transaction, of which $7,551 was current. These amounts were recorded within other assets and represent the amount due from the federal government for the construction of the fueling facilities.
As of June 30, 2016, the government has provided acceptance on all three of these contracts and final funding has been received on two contracts.
Other Notes Payable
In July 2015, the Company financed $5,632 of insurance premiums payable in eleven equal monthly installments of $517 each, including a finance charge of 1.99%. In December 2015, an additional $891 was financed in conjunction with the Pipeline Services acquisition, resulting in six remaining payments of $667. As of June 30, 2016, the balance outstanding under this agreement was $0.
68
TRC COMPANIES, INC.
NOTES TO CONSOLIDATED FINANCIAL STATEMENTS (Continued)
In thousands, except per share data
Note 10. Long-Term Debt and Capital Lease Obligations (Continued)
In conjunction with the Pipeline Services acquisition, the Company was required to remit a second cash payment of $7,500 payable at the earlier of certain Willbros contract novations (or written approval of a subcontract) and Willbros obtaining certain consents, or March 15, 2016. The second cash payment was made in two tranches, with $2,354 paid in March 2016 and the remaining balance paid in July 2016 in conjunction with the final net working capital settlement.
Capital Lease Obligations
During fiscal years 2013 and 2012, the Company financed $1,160 and $756, respectively, of furniture, office equipment, and computer equipment under capital lease agreements which expired in fiscal years 2015 and 2016. The assets and liabilities under capital lease agreements were recorded at the lower of the present value of the minimum lease payments or the fair value of the asset. The assets were amortized over the shorter of their related lease terms or their estimated useful lives. Amortization of assets under capital leases was included in depreciation and amortization in the consolidated statements of operations. The final lease payments were made in the fiscal year ended June 30, 2016, with no future capital lease obligation remaining, and the underlying assets having been fully depreciated.
Future Minimum Long-Term Debt and Capital Lease Obligation Payments
Future minimum long-term debt payments (exclusive of unamortized deferred debt issuance costs) as of June 30, 2016 is as follows:
Fiscal Year | Debt | Lease Financing Obligations | Other Notes Payable | Total | ||||||||||||
2017 | $ | 13,176 | $ | 17 | $ | 5,146 | $ | 18,339 | ||||||||
2018 | 11,359 | 17 | — | 11,376 | ||||||||||||
2019 | 9,342 | 18 | — | 9,360 | ||||||||||||
2020 | 9,437 | 3 | — | 9,440 | ||||||||||||
2021 | 50,217 | — | — | 50,217 | ||||||||||||
Thereafter | — | — | — | — | ||||||||||||
$ | 93,531 | $ | 55 | $ | 5,146 | $ | 98,732 | |||||||||
Note 11. Variable Interest Entity
In determining whether the Company is the primary beneficiary of an entity, it considers a number of factors, including its ability to direct the activities that most significantly affect the entity's economic success, the Company's contractual rights and responsibilities under the arrangement and the significance of the arrangement to each party. These considerations impact the way the Company accounts for its existing collaborative and joint venture relationships and determines the consolidation of companies or entities with which the Company has collaborative or other arrangements.
CAH
The Company acquired the non-controlling interest in Center Avenue Holdings ("CAH") a limited liability company, in its third fiscal quarter of 2016 for $90. Prior to CAH becoming a wholly owned subsidiary, the Company previously consolidated the operations of CAH as a variable interest entity because it retained the contractual power to direct the activities of CAH which most significantly and directly impacted its economic performance. The activity of CAH was not significant to the overall performance of the Company. Prior to CAH becoming a wholly owned subsidiary, its assets were restricted, from the standpoint of the Company, in that they were not available for the Company's general business use outside the context of CAH.
69
TRC COMPANIES, INC.
NOTES TO CONSOLIDATED FINANCIAL STATEMENTS (Continued)
In thousands, except per share data
Note 11. Variable Interest Entity (Continued)
The following table sets forth the assets and liabilities of CAH included in the condensed consolidated balance sheets of the Company:
June 30, 2015 | ||||
Current assets: | ||||
Restricted investments | $ | 63 | ||
Total current assets | 63 | |||
Property and equipment | — | |||
Other assets | 4,344 | |||
Total assets | $ | 4,407 | ||
Long-term environmental remediation liabilities | 21 | |||
Total liabilities | $ | 21 | ||
Prior to CAH becoming a wholly owned subsidiary, the Company did not generally have an obligation to make additional capital contributions to CAH. However, prior becoming wholly owned, the Company had provided $4,070 of support it was not contractually obligated to provide. The additional support was primarily for debt service payments on a note payable. CAH repaid this loan balance in the amount of $2,448 in full on October 1, 2013.
WBA
Willbros Engineers LLC, which the Company acquired in fiscal 2016, was party to an option and service arrangement with the equity owners of WBA, a limited liability company. WBA is considered a VIE due to the lack of decision-making rights by its equity holders. The Company consolidates the operations of WBA, as it retains the contractual power to direct the activities of WBA which most significantly and directly impact its economic performance. The Company also has the obligation to absorb losses and the right to receive residual returns of WBA. The activity of WBA is not significant to the overall performance of the Company. The assets of WBA are available for the Company's general business use outside the context of WBA. In consolidation, as of June 30, 2016, $306 of cash and cash equivalents, $739 of accounts receivables and $6 of other current liabilities were attributable to WBA
While the Company is currently in the process of winding down the operations of WBA, it has an obligation to fund operating activities not covered by WBA’s available cash and cash flow from operations. During fiscal year 2016, the Company provided $98 of financial support to WBA. The Company does not expect ongoing funding obligations to be material.
70
TRC COMPANIES, INC.
NOTES TO CONSOLIDATED FINANCIAL STATEMENTS (Continued)
In thousands, except per share data
Note 12. Federal and State Income Taxes
The federal and state income tax (provision) benefit for fiscal years 2016, 2015 and 2014 consists of the following:
2016 | 2015 | 2014 | |||||||||
Current: | |||||||||||
Federal | $ | (4,967 | ) | $ | (12,604 | ) | $ | (4,198 | ) | ||
State | (1,483 | ) | (2,049 | ) | (2,010 | ) | |||||
Foreign | (70 | ) | (126 | ) | (22 | ) | |||||
Total current | (6,520 | ) | (14,779 | ) | (6,230 | ) | |||||
Deferred: | |||||||||||
Federal | 6,172 | 3,369 | (2,781 | ) | |||||||
State | 957 | 254 | 192 | ||||||||
Foreign | 61 | (24 | ) | 77 | |||||||
Total deferred | 7,190 | 3,599 | (2,512 | ) | |||||||
Total benefit (provision) | $ | 670 | $ | (11,180 | ) | $ | (8,742 | ) | |||
Deferred income taxes represent the tax effect of transactions that are reported in different periods for financial and tax reporting purposes. Temporary differences and carryforwards that give rise to a significant portion of the deferred income tax benefits and liabilities are as follows at June 30, 2016 and 2015:
2016 | 2015 | ||||||
Deferred income tax assets: | |||||||
Allowance for doubtful accounts | $ | 3,169 | $ | 3,295 | |||
Vacation pay accrual | 4,827 | 4,228 | |||||
Bonus accrual | 4,141 | 5,661 | |||||
Contract loss reserves | 2,189 | 1,832 | |||||
Goodwill and intangible asset amortization | 6,430 | — | |||||
Other accruals | 4,855 | 3,468 | |||||
Loss carryforwards | 917 | 925 | |||||
Legal reserve | 834 | 1,414 | |||||
Stock-based compensation expense | 2,553 | 2,886 | |||||
Total deferred income tax assets | 29,915 | 23,709 | |||||
Unearned revenue | (893 | ) | (1,333 | ) | |||
Depreciation | (2,075 | ) | (1,421 | ) | |||
Goodwill and intangible asset amortization | — | (1,473 | ) | ||||
Revenue recognition on long-term contracts | (670 | ) | (488 | ) | |||
Other long-term liabilities | (38 | ) | (70 | ) | |||
Total deferred income tax liabilities | (3,676 | ) | (4,785 | ) | |||
Net deferred income tax assets | $ | 26,239 | $ | 18,924 | |||
The Company elected to early adopt ASU 2015-17 in the fourth quarter of fiscal 2016 using the retrospective method and therefore, the Consolidated Balance Sheet as of June 30, 2015 has been retrospectively reclassified. The adoption of ASU 2015-17 therefore resulted in the reclassification of $16,057 net current deferred income tax assets into net long-term deferred income tax assets at June 30, 2015.
71
TRC COMPANIES, INC.
NOTES TO CONSOLIDATED FINANCIAL STATEMENTS (Continued)
In thousands, except per share data
Note 12. Federal and State Income Taxes (Continued)
Based upon an assessment of available positive and negative evidence, the Company concluded its deferred tax assets would more likely than not be realized. As such, a valuation allowance was not established at the period ended June 30, 2016 and June 30, 2015.
As of June 30, 2016, prior to the consideration of the Company's uncertain tax positions, the Company had no federal loss carryforwards and approximately $14,429 of state loss carryforwards expiring at various dates through fiscal year 2035. As of June 30, 2015, prior to the consideration of the Company's uncertain tax positions, the Company had no federal loss carryforwards and approximately $10,318 of state loss carryforwards expiring at various dates through fiscal year 2034.
The Company has a tax benefit of $3,965 related to excess tax benefits from stock compensation. Pursuant to ASC Topic 718, a benefit of $1,357 was recorded to additional paid in capital as it reduced income taxes payable in the current year. In addition, a tax deficiency of $178 related to the expiration of vested stock options was recorded to decrease additional paid in capital as it reduced deferred tax assets.
A reconciliation of the U.S. federal statutory income tax rate to the Company's consolidated effective income tax rate for the fiscal years ended June 30, 2016, 2015 and 2014 is as follows:
2016 | 2015 | 2014 | |||||||||||||||
Amount | Percent | Amount | Percent | Amount | Percent | ||||||||||||
U.S. federal statutory income tax | $ | (220 | ) | 35.0 | % | $ | 10,708 | 35.0 | % | $ | 7,278 | 35.0 | % | ||||
State income taxes, net of federal benefit | 396 | (63.0 | ) | 1,123 | 3.7 | 1,066 | 5.1 | ||||||||||
Foreign income taxes | (26 | ) | 4.2 | 93 | 0.3 | (50 | ) | (0.2 | ) | ||||||||
Recognition of uncertain tax positions | 319 | (50.7 | ) | 220 | 0.7 | (24 | ) | (0.1 | ) | ||||||||
Federal R&D | (1,237 | ) | 196.7 | (1,009 | ) | (3.3 | ) | (45 | ) | (0.2 | ) | ||||||
Domestic production activities deduction | (569 | ) | 90.4 | — | — | — | — | ||||||||||
Non-deductible expenses | 667 | (106.1 | ) | 45 | 0.1 | 517 | 2.4 | ||||||||||
Effective income tax | $ | (670 | ) | 106.5 | % | $ | 11,180 | 36.5 | % | $ | 8,742 | 42.0 | % | ||||
The following represents a summary of the Company's uncertain tax positions:
2016 | 2015 | 2014 | |||||||||
Unrecognized tax benefits, beginning of year | $ | 1,450 | $ | 1,432 | $ | 1,131 | |||||
Increases (decreases) for tax positions related to prior years | 63 | 99 | (130 | ) | |||||||
Increases (decreases) for tax positions taken during the year | 409 | (81 | ) | 431 | |||||||
Unrecognized tax benefits, end of year | $ | 1,922 | $ | 1,450 | $ | 1,432 | |||||
ASC Topic 740, Income Taxes, requires a company to show the liability associated with the unrecognized tax benefit on a gross basis. As such, the ending balance of the unrecognized tax benefits will not agree to the liability recorded on the consolidated balance sheets.
As of June 30, 2016, the total amount of gross unrecognized tax benefits was $1,922, of which $872 if recognized, would impact the Company's effective tax rate. As of June 30, 2015, the total amount of gross unrecognized tax benefits was $1,450, of which $618 if recognized, would impact the Company's effective tax rate.
The Company does not expect significant changes in the unrecognized tax benefit balance in the next twelve months.
The Company recognizes interest and penalties related to unrecognized tax benefits within income tax expense. The total amount of interest and penalties recognized in the consolidated statements of operations was an expense of $85 and $89 for fiscal years 2016 and 2015, respectively. As of June 30, 2016 and 2015, the total accrued interest and penalties recognized on the consolidated balance sheets are $281 and $197, respectively.
72
TRC COMPANIES, INC.
NOTES TO CONSOLIDATED FINANCIAL STATEMENTS (Continued)
In thousands, except per share data
Note 12. Federal and State Income Taxes (Continued)
The Company is subject to U.S. Federal Income Tax as well as income tax of certain state and foreign jurisdictions. The periods from June 30, 2013 to June 30, 2015 remain open to examination by the U.S. Internal Revenue Service and state authorities. In addition, for state purposes, the tax authorities can generally reduce a net operating loss (but not create taxable income) for a period outside the statute of limitations in order to determine the correct amount of net operating loss which may be allowed as a deduction against income for a period within the statute of limitations.
The Company is currently under Federal tax audit for the tax year ending June 30, 2014. No adjustments were proposed as of June 30, 2016.
Note 13. Lease Commitments
The Company had commitments as of June 30, 2016 under non-cancellable operating leases for office facilities and equipment. The Company recognizes escalating rental payments on a straight-line basis over the terms of the related leases in order to provide level recognition of rental expense in accordance with ASC Subtopic 840-20, Operating Leases. Such rental expense in excess of the cash paid is recognized as deferred rent as of June 30, 2016. Rental expense, net of sublease income, charged to operations in fiscal years 2016, 2015 and 2014 was $20,336, $16,019 and $14,864, (including rent expense associated with related party lease agreements of $1,181, $1,151 and $1,275) respectively. Also included in fiscal year 2016 rent expense is $2,199 relating to restructuring lease expense.
Minimum operating lease obligations payable in future fiscal years are as follows:
2017 | $ | 18,699 | |
2018 | 15,902 | ||
2019 | 13,306 | ||
2020 | 10,909 | ||
2021 | 8,051 | ||
2022 and thereafter | 13,637 | ||
$ | 80,504 | ||
Included in future minimum lease payments are non-cancellable payments due to related parties of $874 in 2017, $843 in 2018, $843 in 2019, $397 in 2020 and $0 thereafter.
Note 14. Equity
The Company has two plans under which stock-based awards have been issued: the TRC Companies, Inc. Restated Stock Option Plan (the "Restated Plan"), and the Amended and Restated 2007 Equity Incentive Plan (the "2007 Plan"), (collectively "the Plans"). The Company issues new shares or utilizes treasury shares, when available, to satisfy awards under the Plans. Awards are made by the Compensation Committee of the Board of Directors; however, the Compensation Committee has delegated to the Chief Executive Officer ("CEO") the authority to grant awards for up to 10 shares to employees subject to a limitation of 100 shares in any 12 month period.
Stock-based awards under the Plans consist of stock options, restricted stock awards ("RSA's"), restricted stock units ("RSU's") and performance stock units ("PSU's").
The Restated Plan: Pursuant to amendments approved by the Company's shareholders on July 20, 2009, shares available or that become available for grant under the Restated Plan are available for grant under the 2007 Plan, and no new grants will be made under the Restated Plan. As such, there were no shares available for grants under the Restated Plan as of June 30, 2016.
The 2007 Plan: The 2007 Plan was originally approved by the Company's shareholders in May 2007 and amended and restated as of July 20, 2009 and further amended as of December 4, 2012 and December 3, 2014. As of June 30, 2016, the Company had
73
TRC COMPANIES, INC.
NOTES TO CONSOLIDATED FINANCIAL STATEMENTS (Continued)
In thousands, except per share data
Note 14. Equity (Continued)
reserved a total of 6,500 shares of common stock for issuance under the 2007 Plan. In addition, any shares subject to outstanding awards that expire unexercised or any shares that are forfeited under the Restated Plan (for tax withholding or otherwise) will be available for reissuance under the 2007 Plan, which amount was 2,327 in total through fiscal year 2016. The Company may generally grant six types of awards under the 2007 Plan: restricted stock awards and restricted stock units, stock options (including both incentive stock options, within the meaning of Section 422 of the Internal Revenue Code and non-qualified options), phantom stock, stock bonus awards, other awards (including stock appreciation rights) and performance based awards. In addition, the Compensation Committee of the Board of Directors may, in its discretion, make other awards. The 2007 Plan provides that the exercise price for each stock option shall not be less than the fair market value (or par value) of the common stock of the Company at the time the stock option is granted. The maximum number of shares of common stock that may be the subject of awards to a participant in any Company tax year is 600. Stock options granted under the 2007 Plan generally vest ratably over four years and expire seven years from the date of grant. As of June 30, 2016, 2,772 shares remained available for grants under the 2007 Plan.
Stock-Based Compensation
The Company measures stock-based compensation cost at the grant date based on the fair value of the award. The value of the portion of the award that is ultimately expected to vest is recognized as expense over the requisite service periods in the Company's consolidated statements of operations. Stock-based compensation expense includes the estimated effects of forfeitures, and estimates of forfeitures will be adjusted over the requisite service period to the extent actual forfeitures differ, or are expected to differ, from such estimates. Changes in estimated forfeitures will be recognized in the period of change and will also impact the amount of expense to be recognized in future periods. During fiscal years 2016, 2015 and 2014, the Company recognized stock-based compensation expense in cost of services and general and administrative expenses within the consolidated statements of operations as follows:
2016 | 2015 | 2014 | |||||||||
Cost of services | $ | 2,926 | $ | 2,461 | $ | 2,137 | |||||
General and administrative expenses | 2,628 | 2,688 | 2,521 | ||||||||
Total stock-based compensation expense | $ | 5,554 | $ | 5,149 | $ | 4,658 | |||||
The benefits associated with the tax deductions in excess of recognized compensation cost are required to be reported as financing activities in the consolidated statements of cash flows. This reduces reported operating cash flows and increases reported financing cash flows. As a result, net financing cash flows included $1,357, $155 and $3,115 in fiscal year 2016, 2015 and 2014, respectively, from the benefits of tax deductions in excess of recognized compensation cost. The tax benefit of any resulting excess tax deduction increases the additional paid-in capital ("APIC") pool. Any resulting tax deficiency is deducted from the APIC pool.
74
TRC COMPANIES, INC.
NOTES TO CONSOLIDATED FINANCIAL STATEMENTS (Continued)
In thousands, except per share data
Note 14. Equity (Continued)
Stock Options
A summary of stock option activity for fiscal years ended 2016, 2015 and 2014 under the Plans is as follows:
Options | Weighted Average Exercise Price | Weighted Average Remaining Contractual Term (in years) | Aggregate Intrinsic Value | |||||||||
Outstanding options as of June 30, 2013 (695 exercisable) | 707 | $ | 9.69 | |||||||||
Options exercised | (17 | ) | 4.29 | |||||||||
Options forfeited | (1 | ) | 6.03 | |||||||||
Options expired | (35 | ) | 13.58 | |||||||||
Outstanding options as of June 30, 2014 (649 exercisable) | 654 | 9.62 | ||||||||||
Options exercised | (77 | ) | 4.82 | |||||||||
Options forfeited | — | — | ||||||||||
Options expired | (362 | ) | 11.32 | |||||||||
Outstanding options as of June 30, 2015 (214 exercisable) | 215 | 8.46 | ||||||||||
Options exercised | (34 | ) | 6.41 | |||||||||
Options expired | (96 | ) | 9.34 | |||||||||
Outstanding options as of June 30, 2016 | 85 | $ | 8.28 | 0.8 | $ | 29 | ||||||
Options exercisable as of June 30, 2016 | 85 | $ | 8.28 | 0.8 | $ | 29 | ||||||
Options vested and expected to vest as of June 30, 2016 | 85 | $ | 8.28 | 0.8 | $ | 29 | ||||||
The aggregate intrinsic value is measured using the fair market value at the date of exercise (for options exercised) or as of June 30, 2016 (for outstanding options), less the applicable exercise price. The closing price of the Company's common stock on the New York Stock Exchange was $6.32 as of June 30, 2016. The total intrinsic value of options exercised in fiscal year 2016, 2015 and 2014 were $136, $248 and $43, respectively. The total proceeds received from option exercises was $221, $369 and $71 in fiscal years 2016, 2015 and 2014, respectively.
As of June 30, 2016, there was no unrecognized compensation expense related to unvested stock option grants under the Plans.
The following table summarizes additional information about stock options outstanding as of June 30, 2016:
Options Outstanding | Options Exercisable | Options Vested and Expected to Vest | ||||||||||||||||||||||||||||
Range of Exercise Prices | Shares | Weighted Average Exercise Price | Weighted Average Remaining Contractual Term in Years | Shares | Weighted Average Exercise Price | Weighted Average Remaining Contractual Term in Years | Shares | Weighted Average Exercise Price | Weighted Average Remaining Contractual Term in Years | |||||||||||||||||||||
$ 3.52 - $ 6.03 | 14 | $ | 4.14 | 2.0 | 14 | $ | 4.14 | 2.0 | 14 | $ | 4.14 | 2.0 | ||||||||||||||||||
9.01 - 9.80 | 71 | 9.07 | 0.5 | 71 | 9.07 | 0.5 | 71 | 9.07 | 0.5 | |||||||||||||||||||||
$ 3.52 - $9.80 | 85 | $ | 8.28 | 0.8 | 85 | $ | 8.28 | 0.8 | 85 | $ | 8.28 | 0.8 | ||||||||||||||||||
Restricted Stock Awards
Compensation expense for RSA's is recognized ratably over the vesting term, which is generally four years. The fair value of the RSA's is determined based on the closing market price of the Company's common stock on the grant date. There were 2, 6 and 11 non-vested RSA's as of June 30, 2016, 2015 and 2014, respectively. There were no RSA's granted during fiscal years 2016, 2015, and 2014. The total fair value of RSA's vested during fiscal years 2016, 2015 and 2014 was $43, $33 and $39, respectively.
75
TRC COMPANIES, INC.
NOTES TO CONSOLIDATED FINANCIAL STATEMENTS (Continued)
In thousands, except per share data
Note 14. Equity (Continued)
As of June 30, 2016, there was $4 of total unrecognized compensation expense related to unvested RSA's, and this expense is expected to be recognized over a weighted-average period of 0.3 years.
Restricted Stock Units
Compensation expense for RSU's is recognized ratably over the vesting term, which is generally four years. The fair value of RSU's is determined based on the closing market price of the Company's common stock on the grant date.
A summary of non-vested RSU activity for fiscal years 2016, 2015 and 2014 is as follows:
Restricted Stock Units | Weighted Average Grant Date Fair Value | |||||
Non-vested units as of June 30, 2013 | 1,306 | $ | 4.87 | |||
Units granted | 343 | 7.76 | ||||
Units vested | (626 | ) | 4.51 | |||
Units forfeited | (16 | ) | 6.13 | |||
Non-vested units as of June 30, 2014 | 1,007 | 6.06 | ||||
Units granted | 420 | 6.99 | ||||
Units vested | (524 | ) | 5.32 | |||
Units forfeited | (13 | ) | 6.97 | |||
Non-vested units as of June 30, 2015 | 890 | 6.92 | ||||
Units granted | 474 | 9.25 | ||||
Units vested | (445 | ) | 6.69 | |||
Units forfeited | (15 | ) | 7.91 | |||
Non-vested units as of June 30, 2016 | 904 | $ | 8.24 | |||
RSU grants totaled 474, 420, and 343 shares at a weighted-average grant date fair value of $4,381, $2,935 and $2,661 during fiscal years 2016, 2015 and 2014, respectively. The total fair value of RSU's vesting during fiscal years 2016, 2015 and 2014, was $4,268, $3,135 and $4,618, respectively.
As of June 30, 2016, there was $5,681 of total unrecognized compensation expense related to unvested RSU's, and this expense is expected to be recognized over a weighted-average period of 2.7 years.
Effective July 1, 2011, the Company entered into a Third Amended and Restated Employment Agreement (the "Employment Agreement") with Christopher P. Vincze, pursuant to which Mr. Vincze will remain in his current position as Chairman of the Board of Directors and Chief Executive Officer of the Company. In connection with the Employment Agreement, 300 RSU's were granted on July 1, 2011 (the "2012 Award") and 300 RSU's were granted on July 1, 2012 (the "2013 Award"), all of which were deemed effective July 1, 2011 for compensation expense recognition. Forty percent of the shares of common stock subject to the RSU's contain time-based vesting restrictions and the remaining sixty percent were subject to performance-based vesting restrictions. The time-based vesting component of the 2012 Award vested in equal one-fourth increments on July 1 of 2012, 2013, 2014, and 2015; and the time-based vesting component of the 2013 Award vested in equal one-third increments on July 1 of 2013, 2014, and 2015. The performance-based vesting components of both RSU's would vest in their entirety based on earnings per share ("EPS") for the Company's fiscal year ended June 30, 2014 (or an earlier trailing four-quarter period) (the "FY 2014 Target"). The Compensation Committee of the Company's Board of Directors determined that as of June 30, 2012 the performance condition of the 2012 and 2013 Awards had been achieved based on fiscal year 2012 financial performance, and therefore the performance vesting components of the 2012 Award and the 2013 Award vested on June 30, 2012 and July 1, 2012, respectively. Compensation expense of $2,347 was recorded relating to these awards during fiscal year 2012.
Performance Stock Units
76
TRC COMPANIES, INC.
NOTES TO CONSOLIDATED FINANCIAL STATEMENTS (Continued)
In thousands, except per share data
Note 14. Equity (Continued)
Compensation expense for PSU's is recognized ratably over the vesting term, which is generally four years, if and when the Company concludes that it is probable that the performance condition will be achieved. The Company reassesses the probability of vesting at each reporting period for awards with performance conditions and adjusts compensation expense based on its probability assessment. The fair value of the PSU's is determined based on the closing market price of the Company's common stock on the grant date.
The number of PSU's earned is determined based on the Company's performance against predefined targets. The range of payout is zero to 150% of the number of granted PSU's. The number of PSU's earned is determined based on actual performance at the end of the performance period. As of June 30, 2016, the performance condition of the PSU's granted during fiscal year 2016, as determined by the Compensation Committee of the Company's Board of Directors, had been achieved at 55% of target value. Compensation expense relating to PSU's of $2,694 was recorded during fiscal year 2016.
PSU grants totaled 328, 433 and 355 shares with a weighted-average grant date fair value of $3,697, $2,986 and $2,827 during fiscal years 2016, 2015 and 2014, respectively. The total fair value of PSU's vested during fiscal years 2016, 2015 and 2014, was $4,097, $2,027 and $2,299, respectively.
As of June 30, 2016, there was $5,054 of total unrecognized compensation expense related to non-vested PSU's, and this expense is expected to be recognized over a weighted-average period of 2.1 years.
A summary of non-vested PSU activity for fiscal years 2016, 2015 and 2014 is as follows:
Weighted- | ||||||||||||
PSU | Total | Average | ||||||||||
Original | PSU | PSU | Grant Date | |||||||||
Awards | Adjustments (1) | Awards | Fair Value | |||||||||
Non-vested units as of June 30, 2013 | 853 | — | 853 | $ | 5.18 | |||||||
Units granted | 355 | 34 | 389 | $ | 7.96 | |||||||
Units vested | (278 | ) | (34 | ) | (312 | ) | $ | 4.17 | ||||
Units forfeited | (51 | ) | — | (51 | ) | $ | 7.15 | |||||
Non-vested units as of June 30, 2014 | 879 | — | 879 | $ | 6.50 | |||||||
Units granted | 433 | 32 | 465 | $ | 6.90 | |||||||
Units vested | (342 | ) | (32 | ) | (374 | ) | $ | 5.17 | ||||
Units forfeited | (38 | ) | — | (38 | ) | $ | 7.37 | |||||
Non-vested units as of June 30, 2015 | 932 | — | 932 | $ | 7.10 | |||||||
Units granted | 328 | 86 | 414 | $ | 11.28 | |||||||
Units vested | (322 | ) | (86 | ) | (408 | ) | $ | 6.54 | ||||
Units forfeited | (43 | ) | — | (43 | ) | $ | 7.54 | |||||
Non-vested units as of June 30, 2016 | 895 | — | 895 | $ | 8.74 | |||||||
(1) | Represents the adjusted number of PSU's issued based on the final performance condition achieved at the end of the performance period. |
Directors' Deferred Compensation
In fiscal year 2016, each non-employee director of the Company received an annual retainer of $50 payable at each director's election in cash or common stock subject to deferral under the Directors' Deferred Compensation Plan. The Company issued 9, 7 and 6 shares of common stock in fiscal years 2016, 2015 and 2014, respectively, to its non-employee directors under the Directors' Deferred Compensation Plan. The Company recognized $88, $50, and $45 in expense based on the fair value of the shares issued in fiscal years 2016, 2015 and 2014, respectively.
77
TRC COMPANIES, INC.
NOTES TO CONSOLIDATED FINANCIAL STATEMENTS (Continued)
In thousands, except per share data
Note 15. Operating Segments (Continued)
Note 15. Operating Segments
In connection with the acquisition of Pipeline Services, the Company's reportable segments increased from three to four to reflect how the Company currently manages its business. The Company manages its business under the following four operating segments:
Energy: The Energy operating segment provides services to a range of clients including energy companies, power utilities, other commercial entities, and state and federal government entities. The Company's services include program management, engineer/procure/construct projects, design, and consulting. The Company's typical projects involve upgrades, design and new construction for electric transmission and distribution systems and substations; energy efficiency program design and management; and renewable energy development and power generation.
Environmental: The Environmental operating segment provides services to a wide range of clients including industrial, transportation, energy and natural resource companies, as well as federal, state and municipal agencies. The Environmental operating segment is organized to focus on key areas of demand including: environmental management of buildings and facilities; air quality measurements and modeling of potential air pollution impacts; water quality and water resource management; assessment and remediation of contaminated sites and buildings; hazardous waste management; construction monitoring, inspection and management; environmental, health and safety management and sustainability advisory services; compliance auditing and strategic due diligence; environmental licensing and permitting of a wide variety of projects; and natural and cultural resource assessment, protection and management.
Infrastructure: The Infrastructure operating segment provides services related to the expansion of infrastructure capacity, and the rehabilitation of overburdened and deteriorating infrastructure systems. The Company's client base is predominantly state and municipal governments as well as select commercial developers. In addition, the Company provides infrastructure services on projects originating in its Energy and Environmental operating segments. Primary services include: roadway, bridge and related surface transportation design; structural design and inspection of bridges; program management; construction engineering inspection and construction management for roads and bridges; civil engineering for municipalities and public works departments; geotechnical engineering services; and security assessments, design and construction management.
Pipeline Services: The Pipeline Services operating segment provides pipeline and facilities engineering, EPC/EPCM, field services and integrity services to the oil and gas transmission and midstream markets as well as at government facilities. The Company specializes in providing engineering services to assist clients in designing, engineering and constructing or expanding pipeline systems, compressor stations, pump stations, fuel storage facilities, terminals, and field gathering and production facilities. The Company's expertise extends to the engineering of a wide range of project peripherals, including various types of support buildings and utility systems, power generation and electrical transmission systems, communications systems, fire protection, water and sewage treatment, water transmission, roads and railroad sidings. The Company also provides project management, engineering and material procurement services to the refining industry and government agencies, including mechanical, civil, structural, electrical instrumentation/controls and environmental engineering. The Company provides full-service integrity management program offerings including program development, data services, risk analysis, corrosion evaluation, integrity engineering and integrity construction services. The Company is partnered with Google to provide a cloud-based pipeline life-cycle integrity management solution, Integra Link™, which utilizes Google’s geospatial technology platform to help oil and gas pipeline companies visualize and utilize their data and information.
The Company's chief operating decision maker ("CODM") is its Chief Executive Officer ("CEO"). The Company's CEO manages the business by evaluating the financial results of the four operating segments focusing primarily on segment revenue and segment profit. The Company utilizes segment revenue and segment profit because it believes they provide useful information for effectively allocating resources among operating segments; evaluating the health of its operating segments based on metrics that management can actively influence; and gauging its investments and its ability to service, incur or pay down debt. Specifically, the Company's CEO evaluates segment revenue and segment profit and assesses the performance of each operating segment based on these measures, as well as, among other things, the prospects of each of the operating segments and how they fit into the
78
TRC COMPANIES, INC.
NOTES TO CONSOLIDATED FINANCIAL STATEMENTS (Continued)
In thousands, except per share data
Note 15. Operating Segments (Continued)
Company's overall strategy. The Company's CEO then decides how resources should be allocated among its operating segments. The Company does not track its assets by operating segment, and consequently, it is not practical to show assets by operating segment. Segment profit includes all operating expenses except the following: costs associated with providing corporate shared services (including certain depreciation and amortization), goodwill and intangible asset write-offs, stock-based compensation expense and amortization of intangible assets. Depreciation expense is primarily allocated to operating segments based upon their respective use of total operating segment office space. Assets solely used by Corporate are not allocated to the operating segments. Inter-segment balances and transactions are not material. The accounting policies of the operating segments are the same as those for the Company as a whole, except as discussed herein.
On July 1, 2015 the Company made certain changes to its management reporting structure which resulted in a change to the composition of its Energy and Infrastructure operating segments. In addition, certain corporate employees were transferred to the Energy operating segment. As a result, beginning in fiscal year 2016 the Company reports its financial performance based on the current reporting structure. The Company has recast certain prior period amounts to conform to the way it internally manages and monitors segment performance. These changes had no impact on consolidated net income or cash flows and were not material to the segment measurements presented.
The following tables present summarized financial information for the Company's operating segments (as of and for the periods noted below).
Energy | Environmental | Infrastructure | Pipeline Services | Total | |||||||||||||||
Year ended June 30, 2016: | |||||||||||||||||||
Gross revenue | $ | 182,586 | $ | 289,564 | $ | 83,430 | $ | 60,712 | $ | 616,292 | |||||||||
Net service revenue | 150,636 | 206,126 | 57,218 | 48,379 | 462,359 | ||||||||||||||
Segment profit (loss) | 33,666 | 41,669 | 12,048 | (7,476 | ) | 79,907 | |||||||||||||
Acquisition and integration expenses | — | — | — | 3,444 | 3,444 | ||||||||||||||
Depreciation | 1,916 | 2,463 | 470 | 1,229 | 6,078 | ||||||||||||||
Amortization | 1,116 | 1,224 | — | 4,823 | 7,163 | ||||||||||||||
Year ended June 30, 2015: | |||||||||||||||||||
Gross revenue | $ | 168,564 | $ | 303,126 | $ | 70,242 | $ | — | $ | 541,932 | |||||||||
Net service revenue | 145,690 | 209,792 | 49,110 | — | 404,592 | ||||||||||||||
Segment profit (loss) | 32,124 | 44,071 | 9,193 | — | 85,388 | ||||||||||||||
Acquisition and integration expenses | — | — | — | — | — | ||||||||||||||
Depreciation | 1,938 | 2,296 | 417 | — | 4,651 | ||||||||||||||
Amortization | 1,204 | 1,401 | — | — | 2,605 | ||||||||||||||
Year ended June 30, 2014: | |||||||||||||||||||
Gross revenue | $ | 160,651 | $ | 245,944 | $ | 63,251 | $ | — | $ | 469,846 | |||||||||
Net service revenue | 132,795 | 170,506 | 46,975 | — | 350,276 | ||||||||||||||
Segment profit (loss) | 26,468 | 35,324 | 8,754 | — | 70,546 | ||||||||||||||
Acquisition and integration expenses | — | — | — | — | — | ||||||||||||||
Depreciation | 1,844 | 2,243 | 426 | — | 4,513 | ||||||||||||||
Amortization | 1,409 | 460 | — | 1,869 | |||||||||||||||
79
TRC COMPANIES, INC.
NOTES TO CONSOLIDATED FINANCIAL STATEMENTS (Continued)
In thousands, except per share data
Note 15. Operating Segments (Continued)
Years Ended | |||||||||||
June 30, 2016 | June 30, 2015 | June 30, 2014 | |||||||||
Gross revenue | |||||||||||
Gross revenue from reportable operating segments | $ | 616,292 | $ | 541,932 | $ | 469,846 | |||||
Reconciling items(1) | 4,572 | 4,185 | 5,831 | ||||||||
Total consolidated gross revenue | $ | 620,864 | $ | 546,117 | $ | 475,677 | |||||
Net service revenue | |||||||||||
Net service revenue from reportable operating segments | $ | 462,359 | $ | 404,592 | $ | 350,276 | |||||
Reconciling items(1) | 2,770 | 3,426 | 4,680 | ||||||||
Total consolidated net service revenue | $ | 465,129 | $ | 408,018 | $ | 354,956 | |||||
Income from operations before taxes | |||||||||||
Segment profit from reportable operating segments | $ | 79,907 | $ | 85,388 | $ | 70,546 | |||||
Corporate shared services(2) | (46,431 | ) | (47,469 | ) | (42,549 | ) | |||||
Goodwill impairments | (21,981 | ) | — | — | |||||||
Stock-based compensation expense | (5,554 | ) | (5,149 | ) | (4,658 | ) | |||||
Unallocated acquisition and integration expenses | (3,127 | ) | — | — | |||||||
Unallocated depreciation and amortization | (1,484 | ) | (2,060 | ) | (2,418 | ) | |||||
Interest income | 840 | — | — | ||||||||
Interest expense | (2,707 | ) | (134 | ) | (169 | ) | |||||
Total consolidated (loss) income from operations before taxes | $ | (537 | ) | $ | 30,576 | $ | 20,752 | ||||
Acquisition and integration expenses | |||||||||||
Acquisition and integration expenses from reportable operating segments | $ | 3,444 | $ | — | $ | — | |||||
Unallocated acquisition and integration expenses | 3,127 | — | — | ||||||||
Total consolidated acquisition and integration expenses | $ | 6,571 | $ | — | $ | — | |||||
Depreciation and amortization | |||||||||||
Depreciation and amortization from reportable operating segments | $ | 13,241 | $ | 7,256 | $ | 6,382 | |||||
Unallocated depreciation and amortization | 1,484 | 2,060 | 2,418 | ||||||||
Total consolidated depreciation and amortization | $ | 14,725 | $ | 9,316 | $ | 8,800 | |||||
_________________________________________________
(1) Amounts represent certain unallocated corporate amounts not considered in the CODM's evaluation of operating segment performance.
(2) Corporate shared services consists of centrally managed functions in the following areas: accounting, treasury, information technology, legal, human resources, marketing, internal audit and executive management such as the CEO and various executives. These costs and other items of a general corporate nature are not allocated to the Company's four operating segments.
80
TRC COMPANIES, INC.
NOTES TO CONSOLIDATED FINANCIAL STATEMENTS (Continued)
In thousands, except per share data
Note 16. Change in Estimate
In October 2013, the regulatory agency charged with oversight of one of the Company’s Exit Strategy projects issued a letter requiring the Company to evaluate modifications to its current site remedy. While it was premature to predict the outcome of this evaluation, the Company’s best estimate of such modifications was $12,439. As a result, the Company updated its estimate to complete for this project during the three months ended September 27, 2013. This adjustment resulted in a reduction of gross revenue and NSR of $5,093 and a $7,346 charge to cost of services as a provision for future losses during the fiscal year ended June 30, 2014. Because these additional costs are covered by insurance, the Company also recorded an insurance recoverable of $12,439 during the fiscal year ended June 30, 2014. Therefore, this change in estimate had no impact on operating income or EPS.
In February 2014, the regulatory agency charged with oversight of another one of the Company’s Exit Strategy projects requested the addition of a significant alternative remedy with respect to a supplemental feasibility study. While the Company cannot predict which alternative will ultimately be chosen by the regulatory agency, the Company’s best estimate of potential modifications was $4,877. As a result, the Company updated its estimate to complete for this project during the three months ended March 28, 2014. There were no other significant changes to the estimate to complete for this project since that time. This adjustment resulted in a reduction of gross revenue and NSR of $1,855 and a $3,022 charge to cost of services as a provision for future losses during the fiscal year ended June 30, 2014. Because these additional costs were expected to be covered by insurance, the Company also recorded an insurance recoverable of $4,877 during the fiscal year ended June 30, 2014. Therefore, this change in estimate had no impact on operating income or EPS.
In June 2016, the Company submitted a feasibility study report to the regulatory agency with oversight of one of the Company’s Exit Strategy projects which evaluated various modifications including the installation of an extensive barrier wall system. While the Company is still awaiting final approval from the regulatory agency as to the selected remedy, the Company’s best estimate of the cost of installing and implementing this modified remedy, if selected, is an additional $12,927. As a result, the Company updated its estimate to complete for this project during the three months that ended June 30, 2016. This adjustment resulted in a reduction of gross revenue and NSR of $3,330 and a $9,597 charge to cost of services as a provision for future losses during the fiscal year ended June 30, 2016. Because these additional costs are all covered by insurance, the Company also recorded a corresponding insurance recoverable of $12,927 during the fiscal year ended June 30, 2016. Therefore, this change in estimate had no impact on operating income or EPS.
During the course of fiscal 2016, the Company realized unexpected cost increases on another of its Exit Strategy projects related to inclement weather, significant rainfall and localized flooding that resulted in significant remedial construction delays and productivity losses. The cumulative effect of these delays was a $3,983 increase to the estimate at completion for the project. Because a portion of the additional costs are covered by insurance, the Company also recorded an insurance recoverable of $957 during the fiscal year ended June 30, 2016. Therefore, this change in estimate decreased 2016 operating income and EPS by $3,026 and $0.06, respectively.
Note 17. Commitments and Contingencies
Exit Strategy Contracts
The Company has entered into a number of long-term contracts pursuant to its Exit Strategy program under which it is obligated to complete the remediation of environmental conditions at covered sites. The Company assumes the risk for remediation costs for pre-existing environmental conditions and believes that through in-depth technical analysis, comprehensive cost estimation and creative remedial approaches it is able to execute strategies which protect the Company's return on these projects. The Company's client pays a fixed price and, as additional protection, for a majority of the contracts the client also pays for a cleanup cost cap insurance policy. The policy, which includes the Company as a named or additional insured party, provides coverage for cost increases from unknown or changed conditions up to a specified maximum amount significantly in excess of the estimated cost of remediation. The Company believes that it is adequately protected from risk on these projects and that it is not likely that it will incur material losses in excess of applicable insurance. However, because several projects are near the term or financial limits of the insurance, the Company believes it is reasonably possible that events could occur under certain circumstances which could be material to the Company's consolidated financial statements. With respect to these projects, there is a wide range of potential
81
TRC COMPANIES, INC.
NOTES TO CONSOLIDATED FINANCIAL STATEMENTS (Continued)
In thousands, except per share data
Note 17. Commitments and Contingencies (Continued)
outcomes that may result in costs being incurred beyond the limits or term of insurance, such as: (i) greater than expected volumes of contaminants requiring remediation; (ii) treatment systems requiring operation beyond the insurance term; and (iii) greater than expected allocable share of the ultimate remedy. The Company does not believe these outcomes are likely, and the exact nature, impact and duration of any such occurrence could vary due to a number of factors. Accordingly, the Company is unable to provide an estimate of potential loss with a reasonable degree of accuracy. Nevertheless, if these events were to occur, the Company believes that it is reasonably possible that the amount of costs currently accrued, which represents the Company's best estimate, could increase by as much as $25,500, of which $4,400 would be covered by insurance.
With respect to one of the projects noted above, the regulatory agency charged with oversight of the project approved a remedial plan that is more expensive than the remedy that had been proposed by the Company. A cost allocation among the potentially responsible parties has not been finalized. However, the Company (and the party from whom it assumed site responsibility) did not contribute in any way to the site contamination, and the Company believes that it has meritorious defenses to liability and that it will not ultimately be responsible for any material remedial costs attributable to the more costly selected remedy. Nevertheless, due to uncertainty over the cost allocation process, it is reasonably possible that the Company's recorded estimate could change. With respect to another one of these projects, the regulatory agency charged with oversight of the project selected a remedy that appears to be consistent with regulatory guidance and the Company’s estimates. However, until the final remedy is formally adopted following a public notice period, it remains reasonably possible that the selected remedial alternative could change and the related costs could increase. The Company's share of the potential remedial costs changes related to these two projects range from $0 to $18,700.
The Company adjusts all of its recorded liabilities as further information develops or circumstances change. The Company is unable to accurately project the time period over which these amounts would ultimately be paid out, however the Company estimates that any potential payments could be made over a 1 to 5 year period.
Contract Damages
The Company has entered into contracts which, among other things, require completion of the specified scope of work within a defined period of time or a defined budget. Certain of those contracts provide for the assessment of liquidated or other damages if certain project objectives are not met pursuant to the terms of the contract. At present, the Company does not believe a material assessment of such damages is reasonably possible.
Government Contracts
The Company's indirect cost rates applied to contracts with the U.S. Government and various state agencies are subject to examination and renegotiation. Contracts and other records of the Company with respect to federal contracts have been examined through June 30, 2008. The Company believes that adjustments resulting from such examination or renegotiation proceedings, if any, will not likely have a material impact on the Company's business, operating results, financial position and cash flows.
Legal Matters
The Company and its subsidiaries are subject to claims and lawsuits typical of those filed against engineering and consulting companies. The Company carries liability insurance, including professional liability insurance, against such claims subject to certain deductibles and policy limits. Except as described herein, management is of the opinion that the resolution of these claims and lawsuits will not likely have a material effect on the Company's operating results, financial position and cash flows.
TRC Environmental Corporation v. LVI Group Services, Inc., United States District Court for the Western District of Texas, Austin Division 2014. TRC was the prime contractor on a project to demolish and decommission a power plant in Austin, Texas. LVI was a subcontractor on that project, and TRC sued LVI for $3,000 for breaches in connection with LVI’s work. LVI filed a number of responsive pleadings in this lawsuit including a counterclaim for $9,900. TRC believes that its claims against LVI are meritorious and that LVI’s counterclaim is without merit. Nevertheless, an adverse determination on LVI’s counterclaim could have a material adverse effect on the Company’s business, operating results, financial position and cash flows.
The Company records actual or potential litigation-related losses in accordance with ASC Topic 450. As of June 30, 2016 and June 30, 2015, the Company had recorded accrued liabilities of $4,869 and $4,479, respectively. The Company also has insurance recovery receivables related to the aforementioned litigation-related liabilities of $2,661 and $1,918 as of June 30, 2016 and June 30, 2015, respectively.
82
TRC COMPANIES, INC.
NOTES TO CONSOLIDATED FINANCIAL STATEMENTS (Continued)
In thousands, except per share data
Note 17. Commitments and Contingencies (Continued)
The Company periodically adjusts the amount of such liabilities when such actual or potential liabilities are paid or otherwise discharged, new claims arise, or additional relevant information about existing or potential claims becomes available. The Company believes that it is reasonably possible that the amount of potential litigation related liabilities could increase by as much as $14,700, of which $5,400 would be covered by insurance.
The Company indemnifies its directors and officers to the maximum extent permitted under the laws of the State of Delaware.
Related Party Transactions
In the normal course of business, we enter into transactions from time to time with related parties. Our significant related party transactions typically take the form of facility leases with prior owners of certain acquired companies, see Note 13 "Lease Commitments."
In addition, during the fourth quarter of fiscal 2016, the Company entered into a consulting agreement with a member of its Board of Directors to provide business development support for an $8.5 monthly retainer fee to be paid for a period of 12 months. Total aggregate compensation would be $102, plus reimbursement of incurred business expenses.
Note 18. Quarterly Financial Information (Unaudited)
Management believes the following unaudited quarterly financial information for fiscal years 2016 and 2015, which is derived from the Company's unaudited interim financial statements, reflects all adjustments necessary for a fair statement of results of operations.
Year Ended June 30, 2016 | First Quarter | Second Quarter | Third Quarter | Fourth Quarter | |||||||||||
Gross revenue | $ | 135,459 | $ | 157,743 | $ | 158,130 | $ | 169,532 | |||||||
Net service revenue | 100,163 | 111,382 | 121,253 | 132,331 | |||||||||||
Operating income (loss) | 7,673 | 6,698 | (23,302 | ) | 10,261 | ||||||||||
Income (loss) from operations before taxes | 7,645 | 6,374 | (24,186 | ) | 9,630 | ||||||||||
Net income (loss) | 4,488 | 3,935 | (14,232 | ) | 5,942 | ||||||||||
Net income (loss) applicable to TRC Companies, Inc. | 4,492 | 3,937 | (14,297 | ) | 5,909 | ||||||||||
Basic earnings (loss) per common share | $ | 0.15 | $ | 0.13 | $ | (0.46 | ) | $ | 0.19 | ||||||
Diluted earnings (loss) per common share | $ | 0.14 | $ | 0.13 | $ | (0.46 | ) | $ | 0.19 | ||||||
_________________________________
Year Ended June 30, 2015 | First Quarter | Second Quarter | Third Quarter | Fourth Quarter | |||||||||||
Gross revenue | $ | 123,025 | $ | 143,228 | $ | 130,777 | $ | 149,087 | |||||||
Net service revenue | 92,619 | 99,838 | 100,994 | 114,567 | |||||||||||
Operating income | 5,992 | 6,866 | 7,149 | 10,703 | |||||||||||
Income from operations before taxes | 5,961 | 6,845 | 7,076 | 10,694 | |||||||||||
Net income | 3,481 | 3,997 | 5,160 | 6,758 | |||||||||||
Net income applicable to TRC Companies, Inc. | 3,485 | 4,002 | 5,165 | 6,763 | |||||||||||
Basic earnings per common share | $ | 0.12 | $ | 0.13 | $ | 0.17 | $ | 0.22 | |||||||
Diluted earnings per common share | $ | 0.11 | $ | 0.13 | $ | 0.17 | $ | 0.22 | |||||||
_________________________________
83
Item 9. Changes in and Disagreements with Accountants on Accounting and Financial Disclosure
None.
Item 9A. Controls and Procedures
Disclosure Controls and Procedures
The Company maintains disclosure controls and procedures that are designed to provide reasonable assurance that information required to be disclosed in the reports that it files or submits under the Securities Exchange Act of 1934 (the "Exchange Act") is recorded, processed, summarized and reported within the time periods specified in the SEC's rules and forms. Disclosure controls and procedures include, without limitation, controls and procedures designed to ensure that information required to be disclosed by the Company in the reports that it files or submits under the Exchange Act is accumulated and communicated to management, including the Chief Executive Officer and Chief Financial Officer, as appropriate, to allow timely decisions regarding required disclosure.
The Company has evaluated, under the supervision and with the participation of management, including the Chief Executive Officer and Chief Financial Officer, the effectiveness of its disclosure controls and procedures, as defined in Rules 13a-15(e) and 15d-15(e) of the Exchange Act, as of June 30, 2016. Based on that evaluation, the Chief Executive Officer and Chief Financial Officer have concluded that the Company's disclosure controls and procedures were effective as of June 30, 2016.
Management's Annual Report on Internal Control over Financial Reporting
The Company's management is responsible for establishing and maintaining adequate internal control over financial reporting as that term is defined in Exchange Act Rule 13a-15(f). Under the supervision and with the participation of the Company's management, including the Chief Executive Officer and Chief Financial Officer, the Company conducted an evaluation of the effectiveness of its internal control over financial reporting based on the framework in Internal Control - Integrated Framework (2013) issued by the Committee of Sponsoring Organizations of the Treadway Commission ("COSO").
Based on their evaluation, the Company's management concluded that the Company maintained effective internal control over financial reporting as of June 30, 2016.
Management's evaluation excluded Pipeline Services which was acquired on November 30, 2015. At June 30, 2016 Pipeline Services had $50.3 million of total assets. For the year ended June 30, 2016, the Company's consolidated statement of operations included total gross revenue associated with Pipeline Services of $60.7 million. In accordance with guidance issued by the SEC, companies are allowed to exclude acquisitions from their assessment of internal control over financial reporting during the first year subsequent to the acquisition while integrating the acquired operations.
Deloitte & Touche LLP, the independent registered public accounting firm that audited the Company's consolidated financial statements, has issued an attestation report on the Company's internal control over financial reporting as of June 30, 2016, which is included below in this Item 9A of this Annual Report on Form 10-K.
Changes in Internal Control over Financial Reporting
There has been no change in the Company's internal control over financial reporting during its most recently completed fiscal quarter that has materially affected, or is reasonably likely to materially affect, the Company's internal control over financial reporting.
Inherent Limitations on Effectiveness of Controls
The Company's management, including the Chief Executive Officer and Chief Financial Officer, has designed the Company's disclosure controls and procedures and its internal control over financial reporting to provide reasonable assurances that the controls' objectives will be met. However, management does not expect that disclosure controls and procedures or the Company's internal control over financial reporting will prevent or detect all error and all fraud. A control system, no matter how well designed and operated, can provide only reasonable, not absolute, assurance that the control system's objectives will be met. The design of a control system must reflect the fact that there are resource constraints, and the benefits of controls must be considered relative to their costs. Further, because of the inherent limitations in all control systems, no evaluation of controls can provide absolute assurance that misstatements due to error or fraud will not occur or that all control issues and instances of fraud, if any, within the Company have been detected. These inherent limitations include the realities that judgments in decision-making can be faulty and that breakdowns can occur because of a simple error or mistake. Controls can also be circumvented by the individual acts of some persons, by collusion of two or more people, or by management override of the controls. The design of any system of controls is
84
based in part on certain assumptions about the likelihood of future events, and there can be no assurance that any system's design will succeed in achieving its stated goals under all potential future conditions. Projections of any evaluation of a system's control effectiveness into future periods are subject to risks. Over time, controls may become inadequate because of changes in conditions or deterioration in the degree of compliance with policies or procedures.
85
REPORT OF INDEPENDENT REGISTERED PUBLIC ACCOUNTING FIRM
To the Board of Directors and Stockholders of
TRC Companies, Inc.
Windsor, Connecticut
We have audited the internal control over financial reporting of TRC Companies, Inc. and subsidiaries (the "Company") as of June 30, 2016, based on criteria established in Internal Control - Integrated Framework (2013) issued by the Committee of Sponsoring Organizations of the Treadway Commission. As described in Management’s Annual Report on Internal Control over Financial Reporting, management excluded from its assessment the internal control over financial reporting at its Pipeline Services segment, which was acquired on November 30, 2016 and whose financial statements constitute 10.5% of total assets and 9.8% of revenues, of the consolidated financial statement amounts as of and for the year ended June 30, 2016. Accordingly, our audit did not include the internal control over financial reporting at the Pipeline Services segment. The Company's management is responsible for maintaining effective internal control over financial reporting and for its assessment of the effectiveness of internal control over financial reporting, included in the accompanying Management’s Annual Report on Internal Control over Financial Reporting. Our responsibility is to express an opinion on the Company's internal control over financial reporting based on our audit.
We conducted our audit in accordance with the standards of the Public Company Accounting Oversight Board (United States). Those standards require that we plan and perform the audit to obtain reasonable assurance about whether effective internal control over financial reporting was maintained in all material respects. Our audit included obtaining an understanding of internal control over financial reporting, assessing the risk that a material weakness exists, testing and evaluating the design and operating effectiveness of internal control based on the assessed risk, and performing such other procedures as we considered necessary in the circumstances. We believe that our audit provides a reasonable basis for our opinion.
A company's internal control over financial reporting is a process designed by, or under the supervision of, the company's principal executive and principal financial officers, or persons performing similar functions, and effected by the company's board of directors, management, and other personnel to provide reasonable assurance regarding the reliability of financial reporting and the preparation of financial statements for external purposes in accordance with generally accepted accounting principles. A company's internal control over financial reporting includes those policies and procedures that (1) pertain to the maintenance of records that, in reasonable detail, accurately and fairly reflect the transactions and dispositions of the assets of the company; (2) provide reasonable assurance that transactions are recorded as necessary to permit preparation of financial statements in accordance with generally accepted accounting principles, and that receipts and expenditures of the company are being made only in accordance with authorizations of management and directors of the company; and (3) provide reasonable assurance regarding prevention or timely detection of unauthorized acquisition, use, or disposition of the company's assets that could have a material effect on the financial statements.
Because of the inherent limitations of internal control over financial reporting, including the possibility of collusion or improper management override of controls, material misstatements due to error or fraud may not be prevented or detected on a timely basis. Also, projections of any evaluation of the effectiveness of the internal control over financial reporting to future periods are subject to the risk that the controls may become inadequate because of changes in conditions, or that the degree of compliance with the policies or procedures may deteriorate.
In our opinion, the Company maintained, in all material respects, effective internal control over financial reporting as of June 30, 2016, based on the criteria established in Internal Control - Integrated Framework (2013) issued by the Committee of Sponsoring Organizations of the Treadway Commission.
We have also audited, in accordance with the standards of the Public Company Accounting Oversight Board (United States), the consolidated financial statements as of and for the year ended June 30, 2016 of the Company and our report dated August 31, 2016 expressed an unqualified opinion on those financial statements.
/s/ DELOITTE & TOUCHE LLP
Boston, Massachusetts
August 31, 2016
86
Item 9B. Other Information
None.
PART III
Item 10. Directors, Executive Officers and Corporate Governance
Executive Officers
The following table presents the name and age of each of the Company's executive officers as of June 30, 2016, their present positions with the Company and date of appointment thereto, and other positions held during the past five years, including positions held with other companies and with subsidiaries of the Company:
Name and Age | Present Position and Date of Appointment | Other Positions Held During Last Five Years | |||
Christopher P. Vincze | 54 | Chairman of the Board, President and Chief Executive Officer (January 2006) | |||
Thomas W. Bennet, Jr. | 56 | Senior Vice President and Chief Financial Officer (June 2008) | |||
John W. Cowdery | 57 | Senior Vice President and Environmental Sector Lead (April 2013) | President, Callard & Cowdery (2010 - 2013); Senior Vice President, Environment, Planning & Infrastructure ICF International (2008 - 2010) | ||
Martin H. Dodd | 62 | Senior Vice President, General Counsel and Secretary (February 1997) | |||
James Mayer | 64 | Senior Vice President and Energy Sector Lead (November 2009) | Senior Vice President Power Delivery | ||
Other information required by this item will be contained under the captions "Election of Directors", "Section 16(a) Beneficial Ownership Reporting Compliance" and "Board Meetings and Committees" in the Company's Proxy Statement for its 2016 Annual Meeting of Shareholders to be held November 17, 2016, and such information is incorporated herein by reference.
Item 11. Executive Compensation
Information required by this item will be contained under the captions "Compensation of Executive Officers" and "Director Compensation" in the Company's Proxy Statement for its 2016 Annual Meeting of Shareholders to be held November 17, 2016, and such information is incorporated herein by reference.
Item 12. Security Ownership of Certain Beneficial Owners and Management and Related Stockholder Matters
Information required by this item will be contained under the captions "Principal Shareholders", "Stock Ownership of Directors and Executive Officers" and "Equity Compensation Plan Information" in the Company's Proxy Statement for its 2016 Annual Meeting of Shareholders to be held November 17, 2016, and such information is incorporated herein by reference.
Item 13. Certain Relationships and Related Transactions, and Director Independence
Information required by this item will be contained under the captions "Certain Relationships and Related Transactions" and "Election of Directors" in the Company's Proxy Statement for its 2016 Annual Meeting of Shareholders to be held November 17, 2016, and such information is incorporated herein by reference.
87
Item 14. Principal Accountant Fees and Services
Information required by this item will be contained under the caption "Appointment of Independent Auditors" in the Company's Proxy Statement for its 2016 Annual Meeting of Shareholders to be held November 17, 2016, and such information is incorporated herein by reference.
PART IV
Item 15. Exhibits, Financial Statement Schedules
(a) (1) Consolidated Financial Statements
The financial statements are set forth under Item 8 of this Form 10-K, as indexed below.
Index to Consolidated Financial Statements | Page |
(a) (2) Financial Statement Schedules
Schedules are omitted because they are not applicable, not required or because the required information is included in the Consolidated Financial Statements or Notes thereto.
(a) (3) Exhibits
3.1 | Restated Certificate of Incorporation, dated November 18, 1994, incorporated by reference to the Company's Form 10-K for the fiscal year ended June 30, 1995. | |
3.1.1 | Certificate of Amendment of Restated Certificate of Incorporation, dated July 23 2009, incorporated by reference to the Company's Form 8-K filed on July 23, 2009. | |
3.2 | Bylaws of the Company, as amended, incorporated by reference to the Company's Form S-1 filed on April 16, 1986, Registration No. 33-4896. | |
*10.1 | Restated Stock Option Plan, dated November 22, 2002, incorporated by reference to the Company's Form 10-K for the fiscal year ended June 30, 2003. | |
10.2 | Amended and Restated 2007 Equity Incentive Plan, incorporated by reference to the Company's Proxy Statement filed on October 22, 2014. | |
*10.3 | Third Amended and Restated Employment Agreement, dated as of June 28, 2011, by and between the Company and Christopher P. Vincze, incorporated by reference to the Company's Form 8-K filed on July 1, 2011. | |
10.15 | Credit Agreement, dated as of November 30, 2015, by and among TRC Companies, Inc., certain of its subsidiaries and Citizens Bank N.A, incorporated by reference to the Company's Form 8-K filed on December 4, 2015. | |
21 | Subsidiaries of the Registrant. | |
23.1 | Consent of Independent Registered Public Accounting Firm. | |
31.1 | Certification of Chief Executive Officer Pursuant to Section 302 of the Sarbanes-Oxley Act of 2002. | |
31.2 | Certification of Chief Financial Officer Pursuant to Section 302 of the Sarbanes-Oxley Act of 2002. | |
32.1 | Certification of Chief Executive Officer Pursuant to Section 906 of the Sarbanes-Oxley Act of 2002. | |
32.2 | Certification of Chief Financial Officer Pursuant to Section 906 of the Sarbanes-Oxley Act of 2002. | |
101 | Interactive Data Files Pursuant to Rule 405 of Regulation S-T. | |
_________________________________
* This exhibit is a management contract or compensatory plan.
88
Signatures
Pursuant to the requirements of Section 13 or 15(d) of the Securities Exchange Act of 1934, the Registrant has duly caused this report to be signed on its behalf by the undersigned, thereunto duly authorized.
TRC COMPANIES, INC. | ||||
Dated: | August 31, 2016 | By: | /s/ CHRISTOPHER P. VINCZE | |
Christopher P. Vincze Chief Executive Officer and Chairman of the Board | ||||
Pursuant to the requirements of the Securities Exchange Act of 1934, this report has been signed below by the following persons on behalf of the Registrant and in the capacities and on the dates indicated.
/s/ CHRISTOPHER P. VINCZE | Chief Executive Officer and Chairman of the Board (Principal Executive Officer) | August 31, 2016 | ||
Christopher P. Vincze | ||||
/s/ JOHN A. CARRIG | Director | August 31, 2016 | ||
John A. Carrig | ||||
/s/ F. THOMAS CASEY | Director | August 31, 2016 | ||
F. Thomas Casey | ||||
/s/ STEPHEN M. DUFF | Director | August 31, 2016 | ||
Stephen M. Duff | ||||
/s/ RICHARD H. GROGAN | Director | August 31, 2016 | ||
Richard H. Grogan | ||||
/s/ STEPHANIE C. HILDEBRANDT | Director | August 31, 2016 | ||
Stephanie C. Hildebrandt | ||||
/s/ KATHLEEN M. SHANAHAN | Director | August 31, 2016 | ||
Kathleen M. Shanahan | ||||
/s/ B. KEITH TRENT | Director | August 31, 2016 | ||
B. Keith Trent | ||||
/s/ DENNIS E. WELCH | Director | August 31, 2016 | ||
Dennis E. Welch | ||||
/s/ THOMAS W. BENNET, JR. | Senior Vice President and Chief Financial Officer (Principal Financial Officer and Principal Accounting Officer) | August 31, 2016 | ||
Thomas W. Bennet, Jr. | ||||
89
TRC Companies, Inc.
Form 10-K Exhibit Index
Fiscal Year Ended June 30, 2016
Exhibit Number | Description | |
21 | Subsidiaries of the Registrant. | |
23.1 | Consent of Independent Registered Public Accounting Firm. | |
31.1 | Certification of Chief Executive Officer Pursuant to Section 302 of the Sarbanes-Oxley Act of 2002. | |
31.2 | Certification of Chief Financial Officer Pursuant to Section 302 of the Sarbanes-Oxley Act of 2002. | |
32.1 | Certification of Chief Executive Officer Pursuant to 18 U.S.C. Section 1350, As Adopted Pursuant To Section 906 of the Sarbanes-Oxley Act of 2002. | |
32.2 | Certification of Chief Financial Officer Pursuant to 18 U.S.C. Section 1350, As Adopted Pursuant To Section 906 of the Sarbanes-Oxley Act of 2002. | |
101 | Interactive Data Files Pursuant to Rule 405 of Regulation S-T. | |
90