Attached files
| file | filename |
|---|---|
| EX-99.1 - EXHIBIT 99.1 - SCANSOURCE, INC. | a2016-q4exhibit99106302016.htm |
| 8-K - 8-K - SCANSOURCE, INC. | a2016-q4form8xk06302016.htm |
Q4 AND FY16 FINANCIAL RESULTS
CONFERENCE CALL
August 29, 2016 at 5:00 pm ET
Exhibit 99.2
SAFE HARBOR AND NON-GAAP
Safe Harbor Statement
This presentation contains certain comments that are
“forward-looking” statements, including sales, GAAP diluted
EPS, and non-GAAP diluted EPS, that involve plans,
strategies, economic performance and trends, projections,
expectations, costs or beliefs about future events and other
statements that are not descriptions of historical facts.
Forward-looking information is inherently subject to risks and
uncertainties.
Any number of factors could cause actual results to differ
materially from anticipated results, including declines in sales
and margins, currency fluctuations, difficulties in integrating
acquisitions and general economic factors. For more
information concerning factors that could cause actual results
to differ from anticipated results, see the “Risk Factors”
included in the Company’s annual report on Form 10-K for
the fiscal year ended June 30, 2016, filed with the Securities
and Exchange Commission (“SEC”).
Although ScanSource believes the expectations in its
forward-looking statements are reasonable, it cannot
guarantee future results, levels of activity, performance or
achievement. ScanSource disclaims any obligation to
update or revise any forward-looking statements, whether as
a result of new information, future events, or otherwise,
except as may be required by law.
Non-GAAP Financial Information
In addition to disclosing results that are determined in
accordance with United States Generally Accepted
Accounting Principles (“GAAP”), the Company also discloses
certain non-GAAP measures, including non-GAAP operating
income, non-GAAP operating margin, non-GAAP net income,
non-GAAP diluted earnings per share, return on invested
capital (“ROIC”) and the percentage change in net sales
excluding the impact of foreign currency exchange rates. A
reconciliation of the Company's non-GAAP financial
information to GAAP financial information is provided in the
Appendix and in the Company’s Form 8-K, filed with the
SEC, with the quarterly earnings press release for the period
indicated.
2
HIGHLIGHTS
3
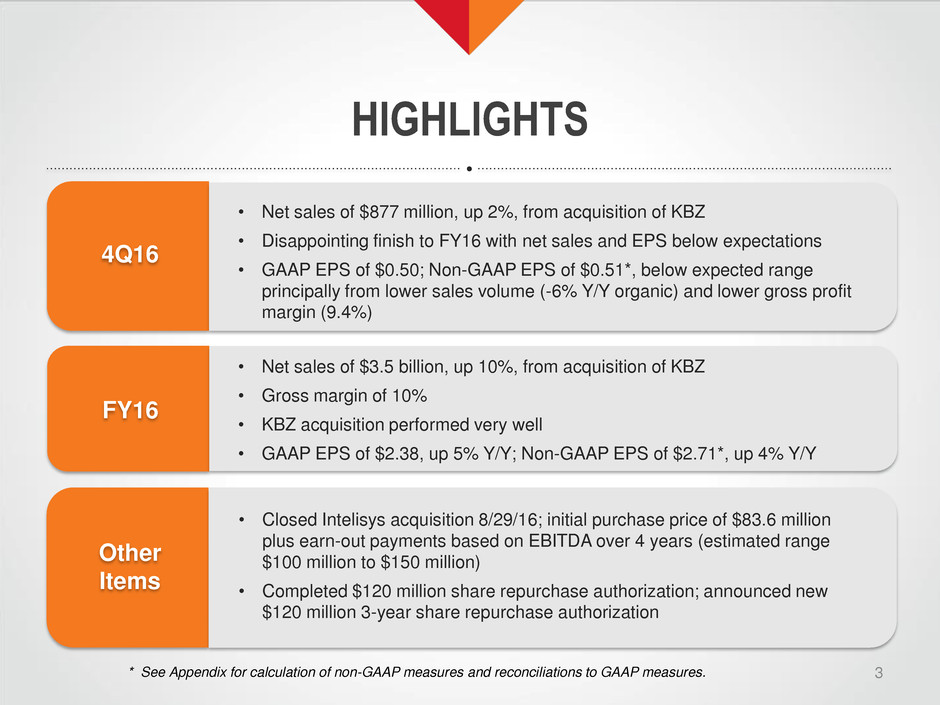
• Net sales of $877 million, up 2%, from acquisition of KBZ
• Disappointing finish to FY16 with net sales and EPS below expectations
• GAAP EPS of $0.50; Non-GAAP EPS of $0.51*, below expected range
principally from lower sales volume (-6% Y/Y organic) and lower gross profit
margin (9.4%)
4Q16
FY16
Other
Items
• Net sales of $3.5 billion, up 10%, from acquisition of KBZ
• Gross margin of 10%
• KBZ acquisition performed very well
• GAAP EPS of $2.38, up 5% Y/Y; Non-GAAP EPS of $2.71*, up 4% Y/Y
• Closed Intelisys acquisition 8/29/16; initial purchase price of $83.6 million
plus earn-out payments based on EBITDA over 4 years (estimated range
$100 million to $150 million)
• Completed $120 million share repurchase authorization; announced new
$120 million 3-year share repurchase authorization
* See Appendix for calculation of non-GAAP measures and reconciliations to GAAP measures.
ACQUISITION OF INTELISYS
TRANSACTION
4
ABOUT INTELISYS
SMB Spend on
Telecom Services
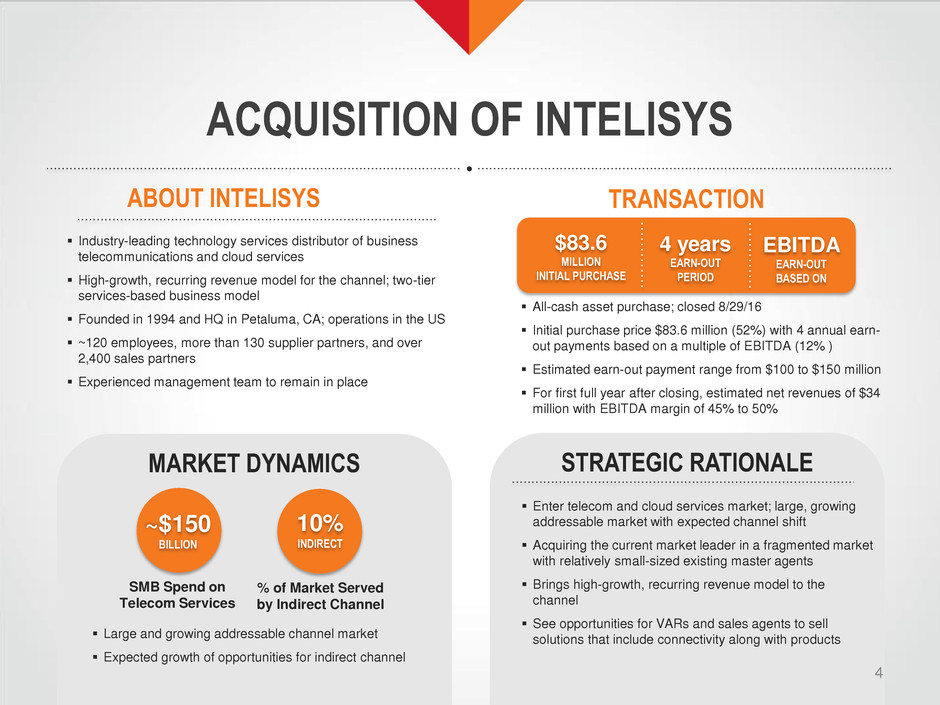
Industry-leading technology services distributor of business
telecommunications and cloud services
High-growth, recurring revenue model for the channel; two-tier
services-based business model
Founded in 1994 and HQ in Petaluma, CA; operations in the US
~120 employees, more than 130 supplier partners, and over
2,400 sales partners
Experienced management team to remain in place
MARKET DYNAMICS STRATEGIC RATIONALE
~$150
BILLION
10%
INDIRECT
% of Market Served
by Indirect Channel
Large and growing addressable channel market
Expected growth of opportunities for indirect channel
$83.6
MILLION
INITIAL PURCHASE
4 years
EARN-OUT
PERIOD
EBITDA
EARN-OUT
BASED ON
All-cash asset purchase; closed 8/29/16
Initial purchase price $83.6 million (52%) with 4 annual earn-
out payments based on a multiple of EBITDA (12% )
Estimated earn-out payment range from $100 to $150 million
For first full year after closing, estimated net revenues of $34
million with EBITDA margin of 45% to 50%
Enter telecom and cloud services market; large, growing
addressable market with expected channel shift
Acquiring the current market leader in a fragmented market
with relatively small-sized existing master agents
Brings high-growth, recurring revenue model to the
channel
See opportunities for VARs and sales agents to sell
solutions that include connectivity along with products
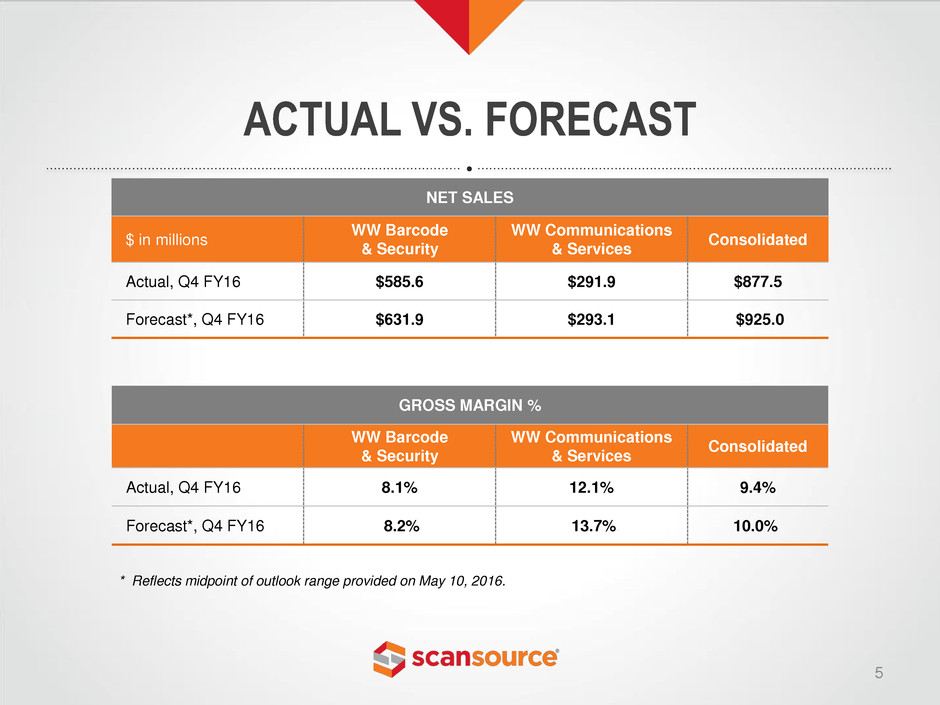
NET SALES
$ in millions
WW Barcode
& Security
WW Communications
& Services
Consolidated
Actual, Q4 FY16 $585.6 $291.9 $877.5
Forecast*, Q4 FY16 $631.9 $293.1 $925.0
ACTUAL VS. FORECAST
5
GROSS MARGIN %
WW Barcode
& Security
WW Communications
& Services
Consolidated
Actual, Q4 FY16 8.1% 12.1% 9.4%
Forecast*, Q4 FY16 8.2% 13.7%. 10.0%
* Reflects midpoint of outlook range provided on May 10, 2016.
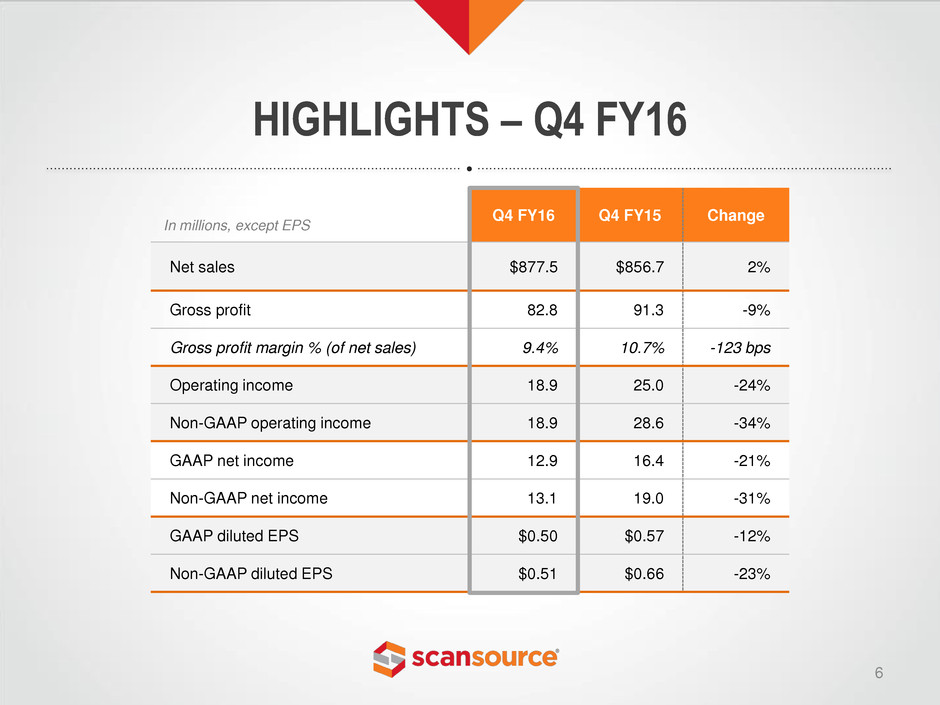
Q4 FY16 Q4 FY15 Change
Net sales $877.5 $856.7 2%
Gross profit 82.8 91.3 -9%
Gross profit margin % (of net sales) 9.4% 10.7% -123 bps
Operating income 18.9 25.0 -24%
Non-GAAP operating income 18.9 28.6 -34%
GAAP net income 12.9 16.4 -21%
Non-GAAP net income 13.1 19.0 -31%
GAAP diluted EPS $0.50 $0.57 -12%
Non-GAAP diluted EPS $0.51 $0.66 -23%
HIGHLIGHTS – Q4 FY16
6
In millions, except EPS
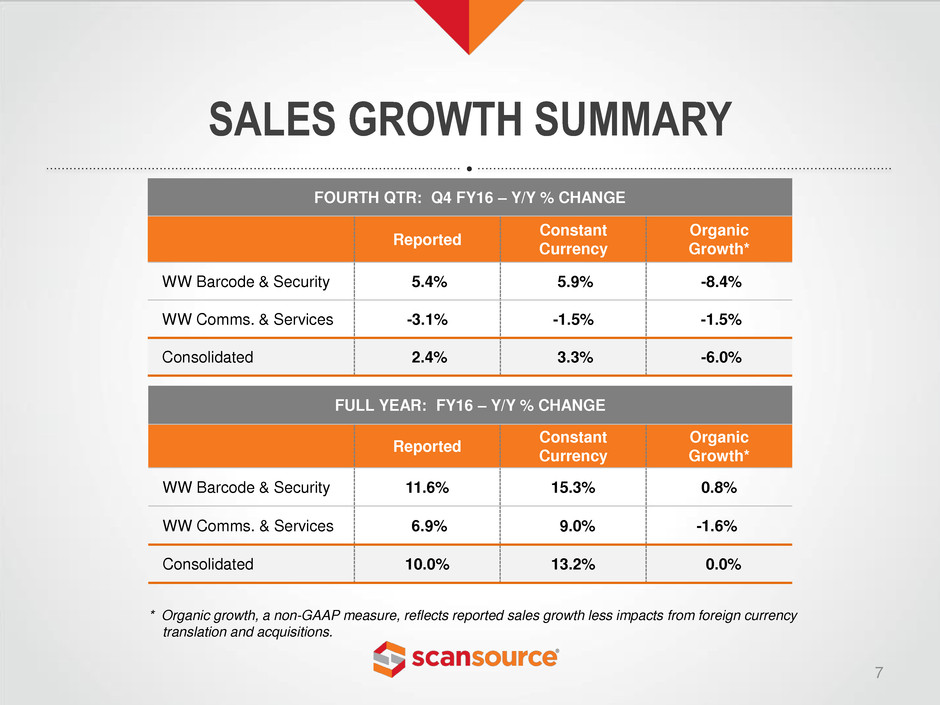
FOURTH QTR: Q4 FY16 – Y/Y % CHANGE
Reported
Constant
Currency
Organic
Growth*
WW Barcode & Security 5.4% 5.9% -8.4%
WW Comms. & Services -3.1% -1.5% -1.5%
Consolidated 2.4% 3.3% -6.0%
SALES GROWTH SUMMARY
7
FULL YEAR: FY16 – Y/Y % CHANGE
Reported
Constant
Currency
Organic
Growth*
WW Barcode & Security 11.6% 15.3% 0.8%
WW Comms. & Services 6.9% 9.0% -1.6%
Consolidated 10.0% 13.2% 0.0%
* Organic growth, a non-GAAP measure, reflects reported sales growth less impacts from foreign currency
translation and acquisitions.
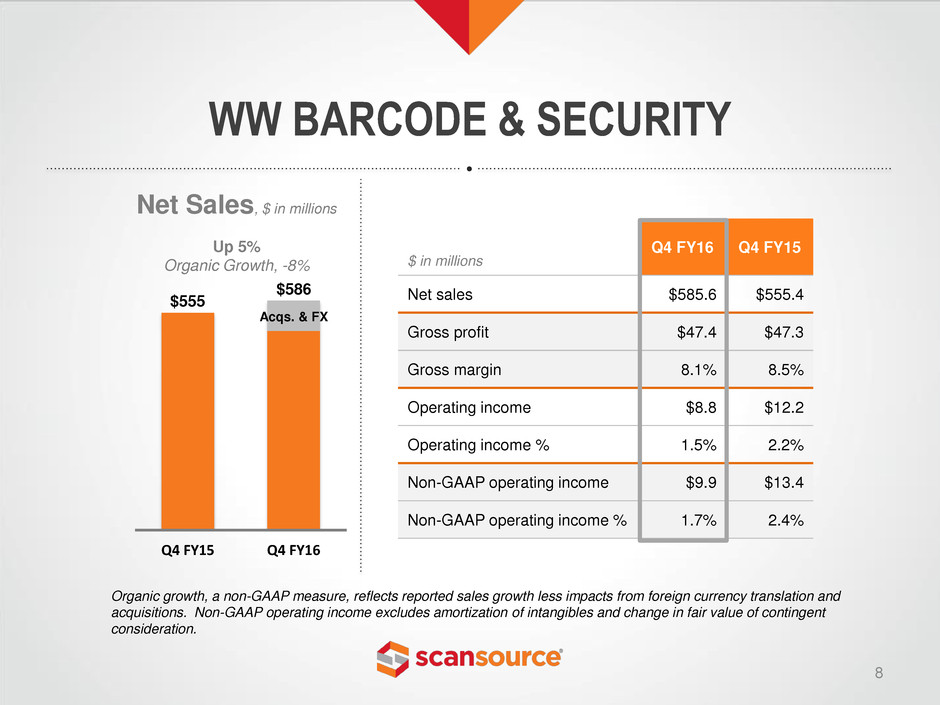
Q4 FY16 Q4 FY15
Net sales $585.6 $555.4
Gross profit $47.4 $47.3
Gross margin 8.1% 8.5%
Operating income $8.8 $12.2
Operating income % 1.5% 2.2%
Non-GAAP operating income $9.9 $13.4
Non-GAAP operating income % 1.7% 2.4%
Q4 FY15 Q4 FY16
Net Sales, $ in millions
Up 5%
Organic Growth, -8%
WW BARCODE & SECURITY
8
$ in millions
Organic growth, a non-GAAP measure, reflects reported sales growth less impacts from foreign currency translation and
acquisitions. Non-GAAP operating income excludes amortization of intangibles and change in fair value of contingent
consideration.
$555
$586
Acqs. & FX
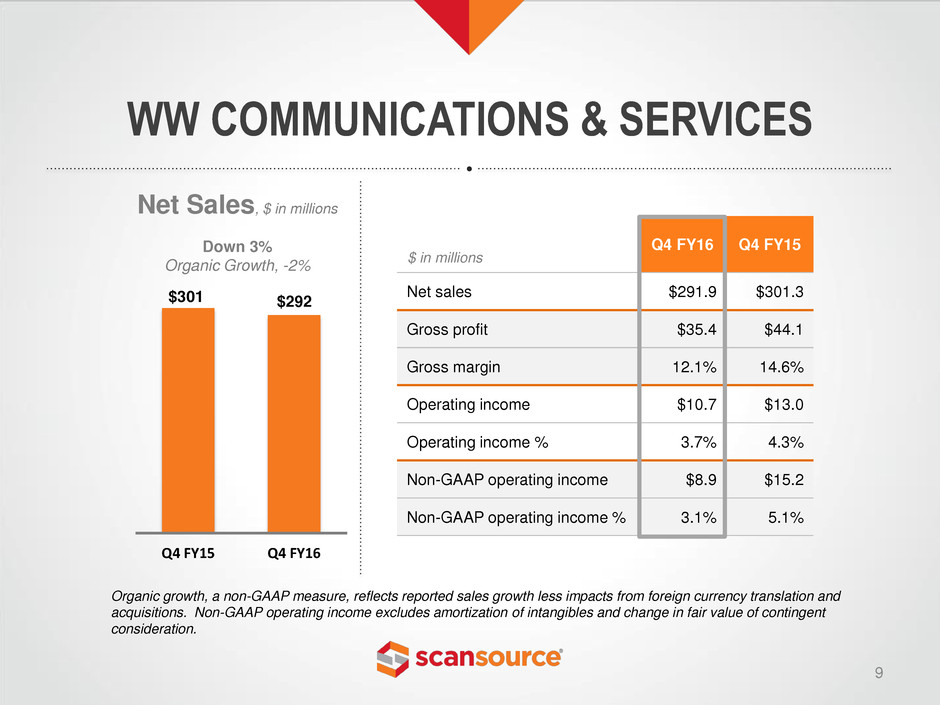
Q4 FY16 Q4 FY15
Net sales $291.9 $301.3
Gross profit $35.4 $44.1
Gross margin 12.1% 14.6%
Operating income $10.7 $13.0
Operating income % 3.7% 4.3%
Non-GAAP operating income $8.9 $15.2
Non-GAAP operating income % 3.1% 5.1%
WW COMMUNICATIONS & SERVICES
9
Q4 FY15 Q4 FY16
Net Sales, $ in millions
Down 3%
Organic Growth, -2%
$ in millions
$292 $301
Organic growth, a non-GAAP measure, reflects reported sales growth less impacts from foreign currency translation and
acquisitions. Non-GAAP operating income excludes amortization of intangibles and change in fair value of contingent
consideration.
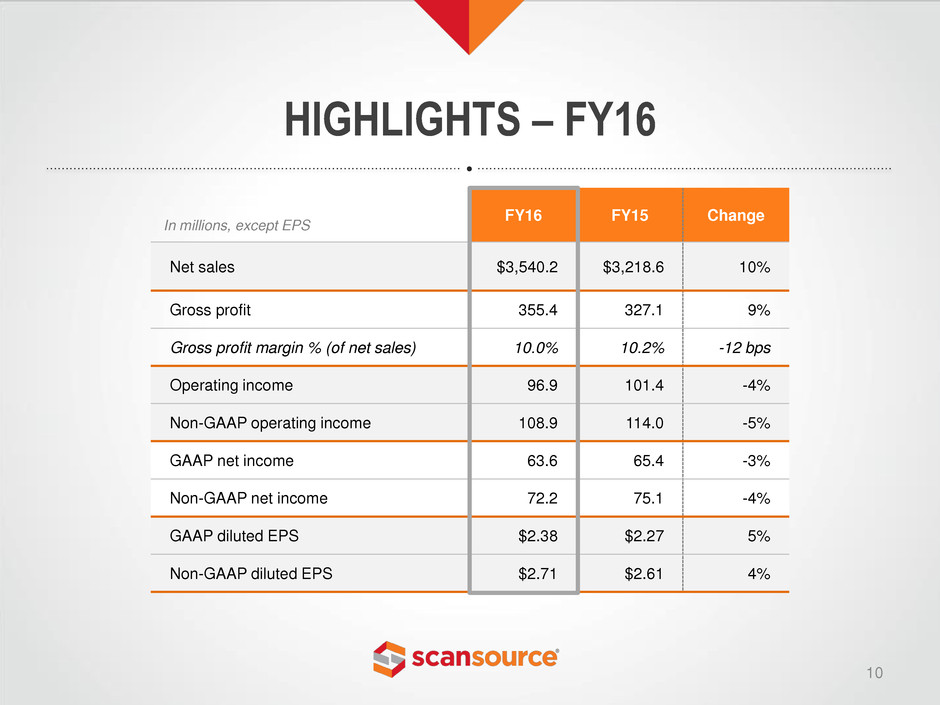
FY16 FY15 Change
Net sales $3,540.2 $3,218.6 10%
Gross profit 355.4 327.1 9%
Gross profit margin % (of net sales) 10.0% 10.2% -12 bps
Operating income 96.9 101.4 -4%
Non-GAAP operating income 108.9 114.0 -5%
GAAP net income 63.6 65.4 -3%
Non-GAAP net income 72.2 75.1 -4%
GAAP diluted EPS $2.38 $2.27 5%
Non-GAAP diluted EPS $2.71 $2.61 4%
HIGHLIGHTS – FY16
10
In millions, except EPS
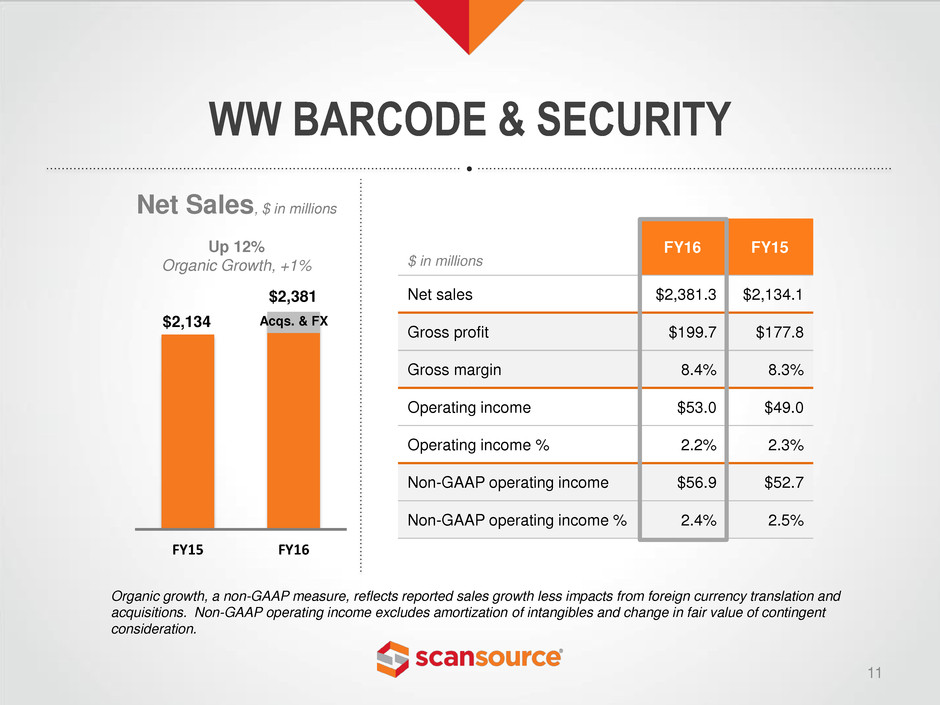
FY16 FY15
Net sales $2,381.3 $2,134.1
Gross profit $199.7 $177.8
Gross margin 8.4% 8.3%
Operating income $53.0 $49.0
Operating income % 2.2% 2.3%
Non-GAAP operating income $56.9 $52.7
Non-GAAP operating income % 2.4% 2.5%
FY15 FY16
Net Sales, $ in millions
Up 12%
Organic Growth, +1%
WW BARCODE & SECURITY
11
$ in millions
Organic growth, a non-GAAP measure, reflects reported sales growth less impacts from foreign currency translation and
acquisitions. Non-GAAP operating income excludes amortization of intangibles and change in fair value of contingent
consideration.
$2,134
$2,381
Acqs. & FX
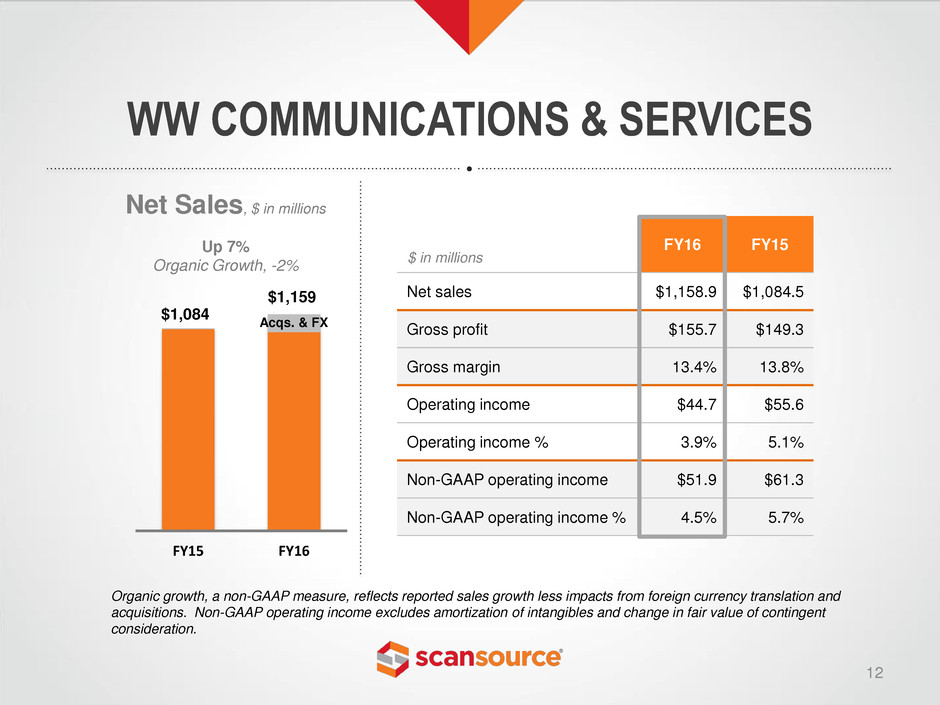
FY16 FY15
Net sales $1,158.9 $1,084.5
Gross profit $155.7 $149.3
Gross margin 13.4% 13.8%
Operating income $44.7 $55.6
Operating income % 3.9% 5.1%
Non-GAAP operating income $51.9 $61.3
Non-GAAP operating income % 4.5% 5.7%
WW COMMUNICATIONS & SERVICES
12
FY15 FY16
Net Sales, $ in millions
Up 7%
Organic Growth, -2%
$ in millions
$1,159
$1,084
Organic growth, a non-GAAP measure, reflects reported sales growth less impacts from foreign currency translation and
acquisitions. Non-GAAP operating income excludes amortization of intangibles and change in fair value of contingent
consideration.
Acqs. & FX
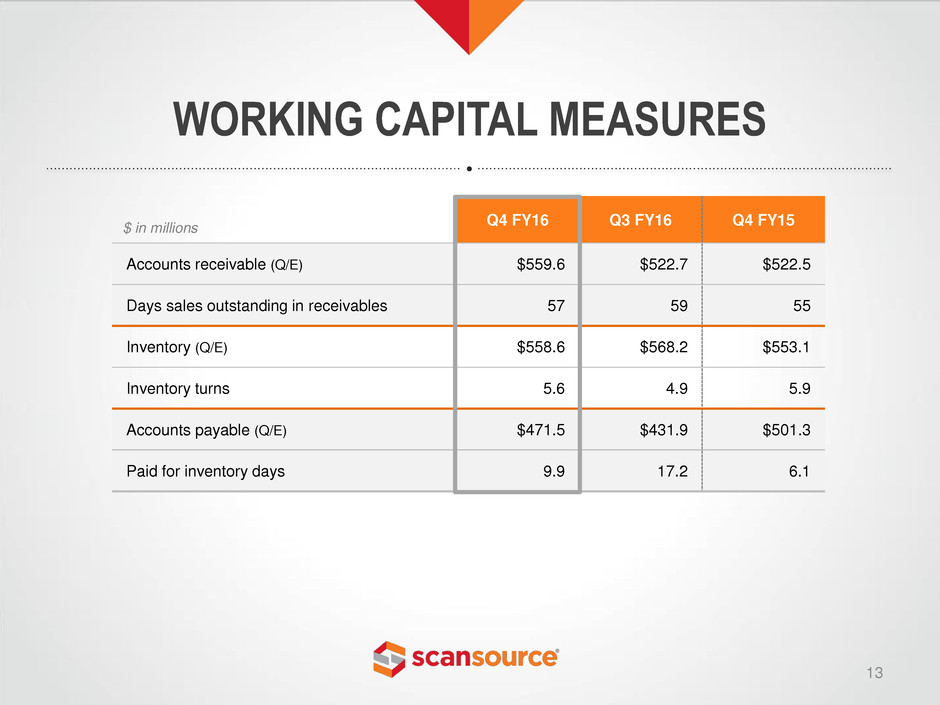
Q4 FY16 Q3 FY16 Q4 FY15
Accounts receivable (Q/E) $559.6 $522.7 $522.5
Days sales outstanding in receivables 57 59 55
Inventory (Q/E) $558.6 $568.2 $553.1
Inventory turns 5.6 4.9 5.9
Accounts payable (Q/E) $471.5 $431.9 $501.3
Paid for inventory days 9.9 17.2 6.1
WORKING CAPITAL MEASURES
$ in millions
13
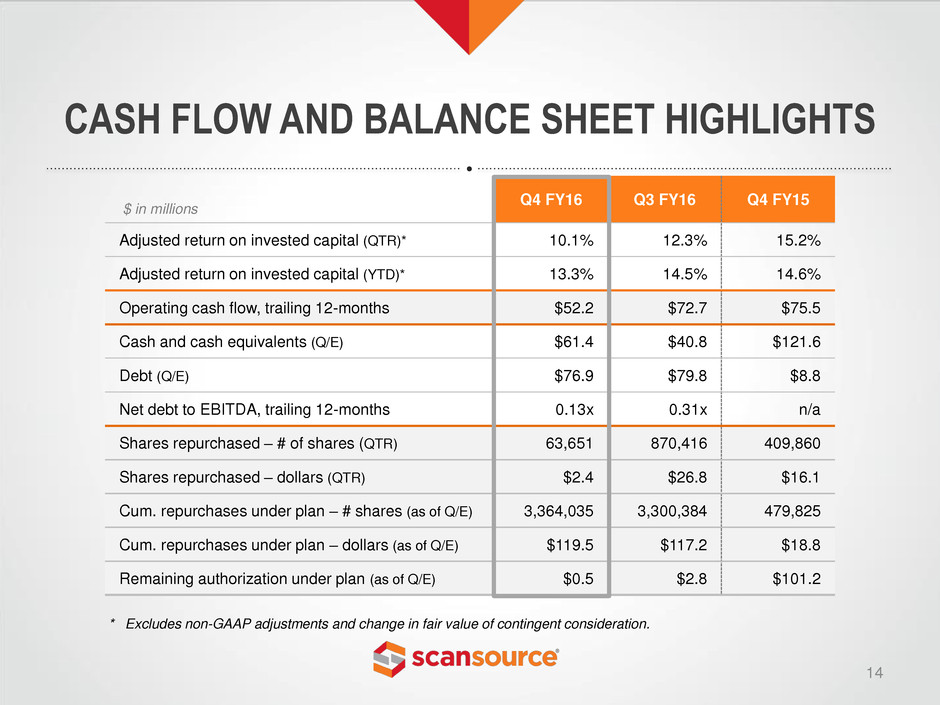
Q4 FY16 Q3 FY16 Q4 FY15
Adjusted return on invested capital (QTR)* 10.1% 12.3% 15.2%
Adjusted return on invested capital (YTD)* 13.3% 14.5% 14.6%
Operating cash flow, trailing 12-months $52.2 $72.7 $75.5
Cash and cash equivalents (Q/E) $61.4 $40.8 $121.6
Debt (Q/E) $76.9 $79.8 $8.8
Net debt to EBITDA, trailing 12-months 0.13x 0.31x n/a
Shares repurchased – # of shares (QTR) 63,651 870,416 409,860
Shares repurchased – dollars (QTR) $2.4 $26.8 $16.1
Cum. repurchases under plan – # shares (as of Q/E) 3,364,035 3,300,384 479,825
Cum. repurchases under plan – dollars (as of Q/E) $119.5 $117.2 $18.8
Remaining authorization under plan (as of Q/E) $0.5 $2.8 $101.2
CASH FLOW AND BALANCE SHEET HIGHLIGHTS
$ in millions
14
* Excludes non-GAAP adjustments and change in fair value of contingent consideration.
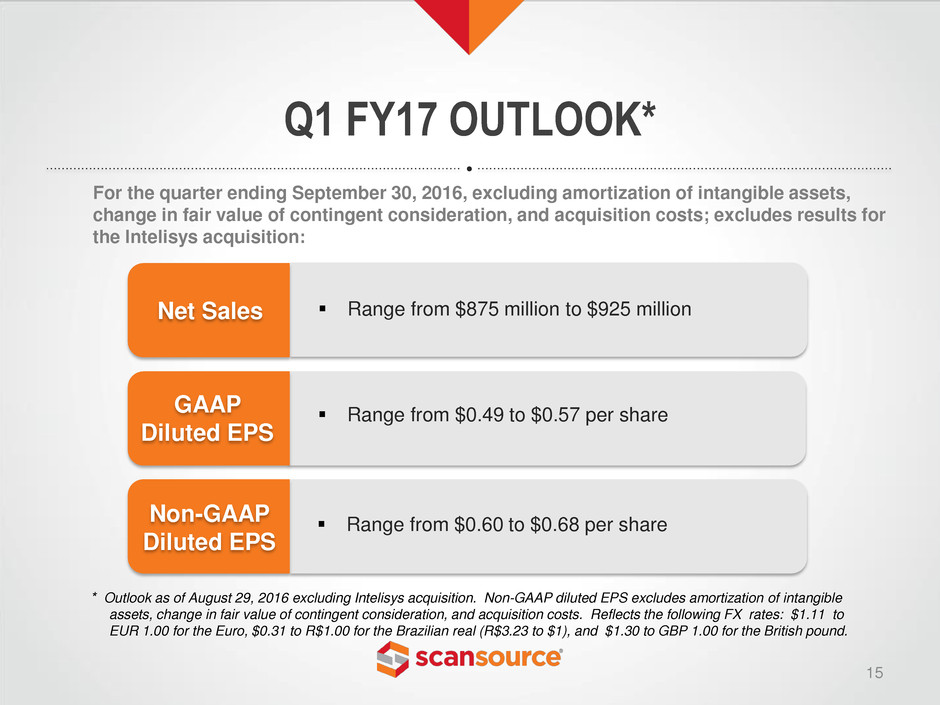
Q1 FY17 OUTLOOK*
15
* Outlook as of August 29, 2016 excluding Intelisys acquisition. Non-GAAP diluted EPS excludes amortization of intangible
assets, change in fair value of contingent consideration, and acquisition costs. Reflects the following FX rates: $1.11 to
EUR 1.00 for the Euro, $0.31 to R$1.00 for the Brazilian real (R$3.23 to $1), and $1.30 to GBP 1.00 for the British pound.
For the quarter ending September 30, 2016, excluding amortization of intangible assets,
change in fair value of contingent consideration, and acquisition costs; excludes results for
the Intelisys acquisition:
Range from $875 million to $925 million
Range from $0.49 to $0.57 per share
Net Sales
GAAP
Diluted EPS
Range from $0.60 to $0.68 per share
Non-GAAP
Diluted EPS
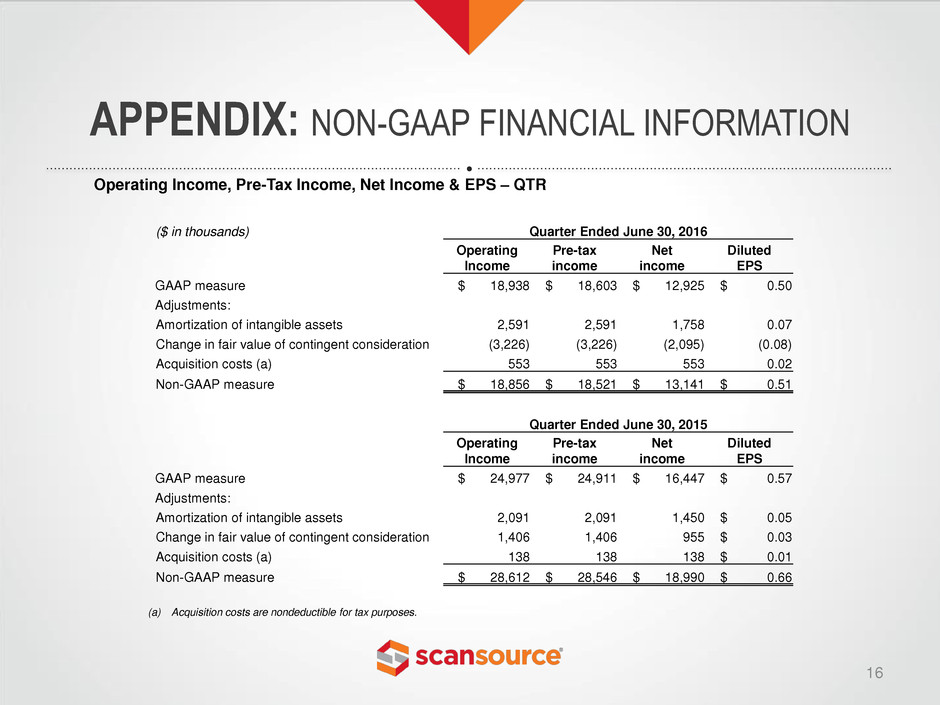
APPENDIX: NON-GAAP FINANCIAL INFORMATION
16
Operating Income, Pre-Tax Income, Net Income & EPS – QTR
($ in thousands) Quarter Ended June 30, 2016
Operating
Income
Pre-tax
income
Net
income
Diluted
EPS
GAAP measure $ 18,938 $ 18,603 $ 12,925 $ 0.50
Adjustments:
Amortization of intangible assets 2,591 2,591 1,758 0.07
Change in fair value of contingent consideration (3,226) (3,226) (2,095) (0.08)
Acquisition costs (a) 553 553 553 0.02
Non-GAAP measure $ 18,856 $ 18,521 $ 13,141 $ 0.51
Quarter Ended June 30, 2015
Operating
Income
Pre-tax
income
Net
income
Diluted
EPS
GAAP measure $ 24,977 $ 24,911 $ 16,447 $ 0.57
Adjustments:
Amortization of intangible assets 2,091 2,091 1,450 $ 0.05
Change in fair value of contingent consideration 1,406 1,406 955 $ 0.03
Acquisition costs (a) 138 138 138 $ 0.01
Non-GAAP measure $ 28,612 $ 28,546 $ 18,990 $ 0.66
(a) Acquisition costs are nondeductible for tax purposes.
APPENDIX: NON-GAAP FINANCIAL INFORMATION
17
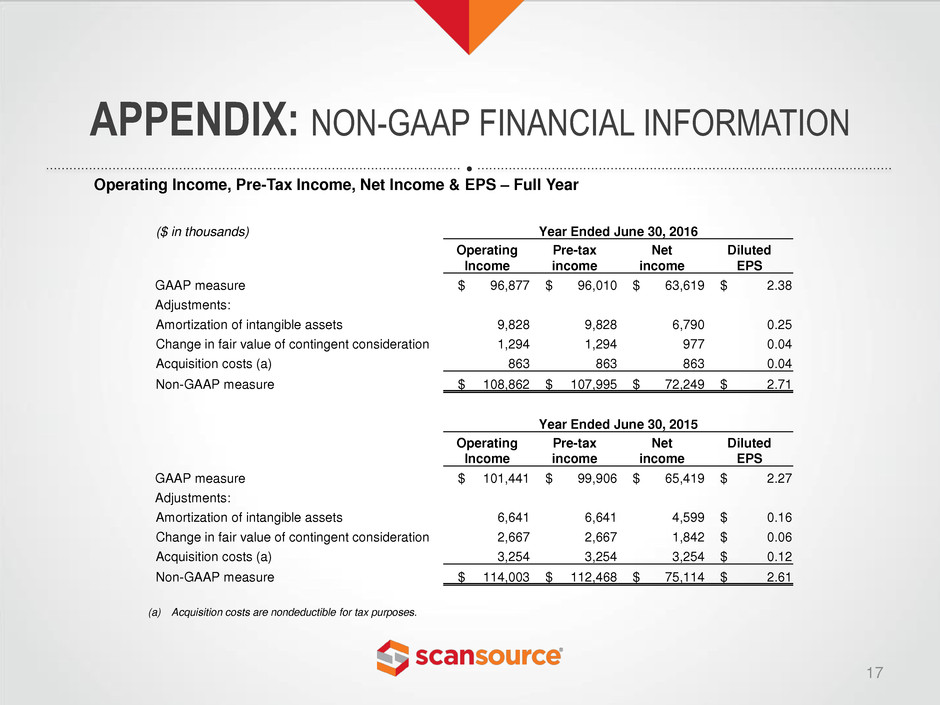
Operating Income, Pre-Tax Income, Net Income & EPS – Full Year
($ in thousands) Year Ended June 30, 2016
Operating
Income
Pre-tax
income
Net
income
Diluted
EPS
GAAP measure $ 96,877 $ 96,010 $ 63,619 $ 2.38
Adjustments:
Amortization of intangible assets 9,828 9,828 6,790 0.25
Change in fair value of contingent consideration 1,294 1,294 977 0.04
Acquisition costs (a) 863 863 863 0.04
Non-GAAP measure $ 108,862 $ 107,995 $ 72,249 $ 2.71
Year Ended June 30, 2015
Operating
Income
Pre-tax
income
Net
income
Diluted
EPS
GAAP measure $ 101,441 $ 99,906 $ 65,419 $ 2.27
Adjustments:
Amortization of intangible assets 6,641 6,641 4,599 $ 0.16
Change in fair value of contingent consideration 2,667 2,667 1,842 $ 0.06
Acquisition costs (a) 3,254 3,254 3,254 $ 0.12
Non-GAAP measure $ 114,003 $ 112,468 $ 75,114 $ 2.61
(a) Acquisition costs are nondeductible for tax purposes.
APPENDIX: NON-GAAP FINANCIAL INFORMATION
18
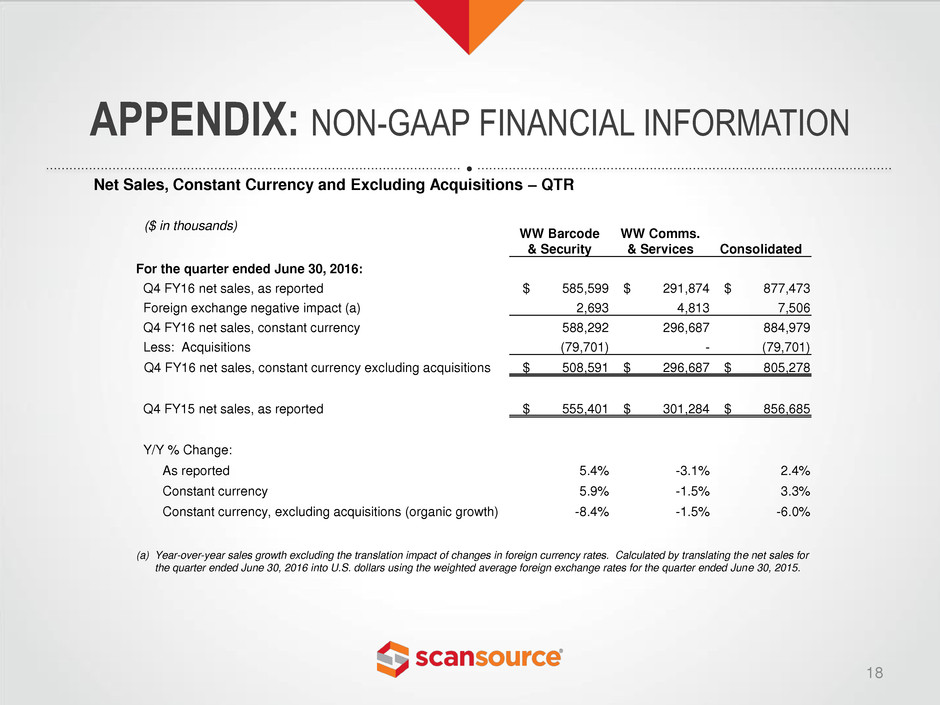
Net Sales, Constant Currency and Excluding Acquisitions – QTR
($ in thousands)
WW Barcode
& Security
WW Comms.
& Services Consolidated
For the quarter ended June 30, 2016:
Q4 FY16 net sales, as reported $ 585,599 $ 291,874 $ 877,473
Foreign exchange negative impact (a) 2,693 4,813 7,506
Q4 FY16 net sales, constant currency 588,292 296,687 884,979
Less: Acquisitions (79,701) - (79,701)
Q4 FY16 net sales, constant currency excluding acquisitions $ 508,591 $ 296,687 $ 805,278
Q4 FY15 net sales, as reported $ 555,401 $ 301,284 $ 856,685
Y/Y % Change:
As reported 5.4% -3.1% 2.4%
Constant currency 5.9% -1.5% 3.3%
Constant currency, excluding acquisitions (organic growth) -8.4% -1.5% -6.0%
(a) Year-over-year sales growth excluding the translation impact of changes in foreign currency rates. Calculated by translating the net sales for
the quarter ended June 30, 2016 into U.S. dollars using the weighted average foreign exchange rates for the quarter ended June 30, 2015.
APPENDIX: NON-GAAP FINANCIAL INFORMATION
19
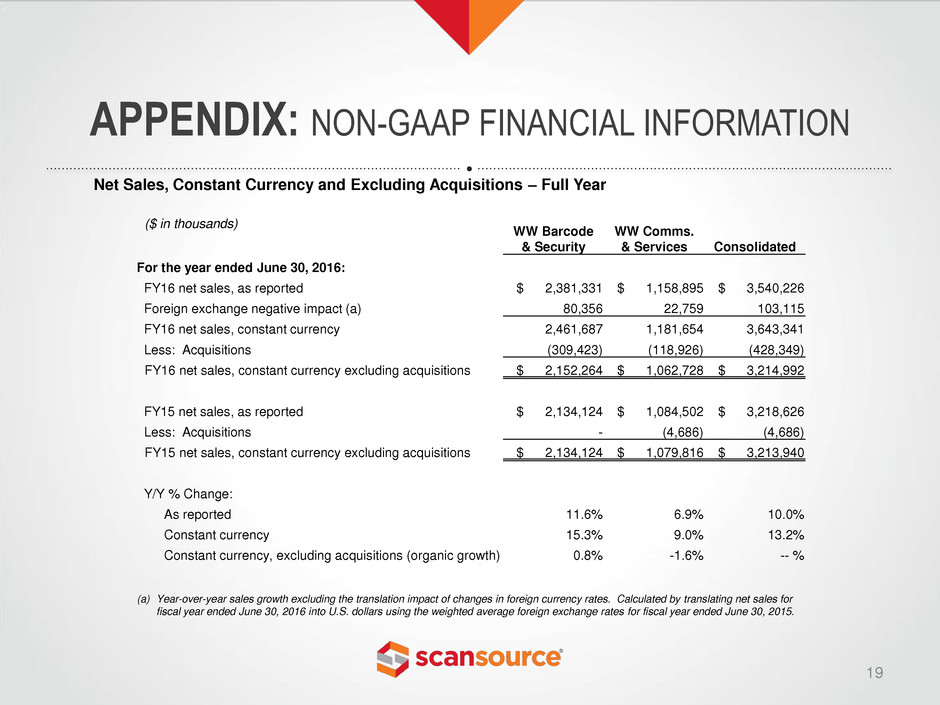
Net Sales, Constant Currency and Excluding Acquisitions – Full Year
($ in thousands)
WW Barcode
& Security
WW Comms.
& Services Consolidated
For the year ended June 30, 2016:
FY16 net sales, as reported $ 2,381,331 $ 1,158,895 $ 3,540,226
Foreign exchange negative impact (a) 80,356 22,759 103,115
FY16 net sales, constant currency 2,461,687 1,181,654 3,643,341
Less: Acquisitions (309,423) (118,926) (428,349)
FY16 net sales, constant currency excluding acquisitions $ 2,152,264 $ 1,062,728 $ 3,214,992
FY15 net sales, as reported $ 2,134,124 $ 1,084,502 $ 3,218,626
Less: Acquisitions - (4,686) (4,686)
FY15 net sales, constant currency excluding acquisitions $ 2,134,124 $ 1,079,816 $ 3,213,940
Y/Y % Change:
As reported 11.6% 6.9% 10.0%
Constant currency 15.3% 9.0% 13.2%
Constant currency, excluding acquisitions (organic growth) 0.8% -1.6% -- %
(a) Year-over-year sales growth excluding the translation impact of changes in foreign currency rates. Calculated by translating net sales for
fiscal year ended June 30, 2016 into U.S. dollars using the weighted average foreign exchange rates for fiscal year ended June 30, 2015.
APPENDIX: NON-GAAP FINANCIAL INFORMATION
20
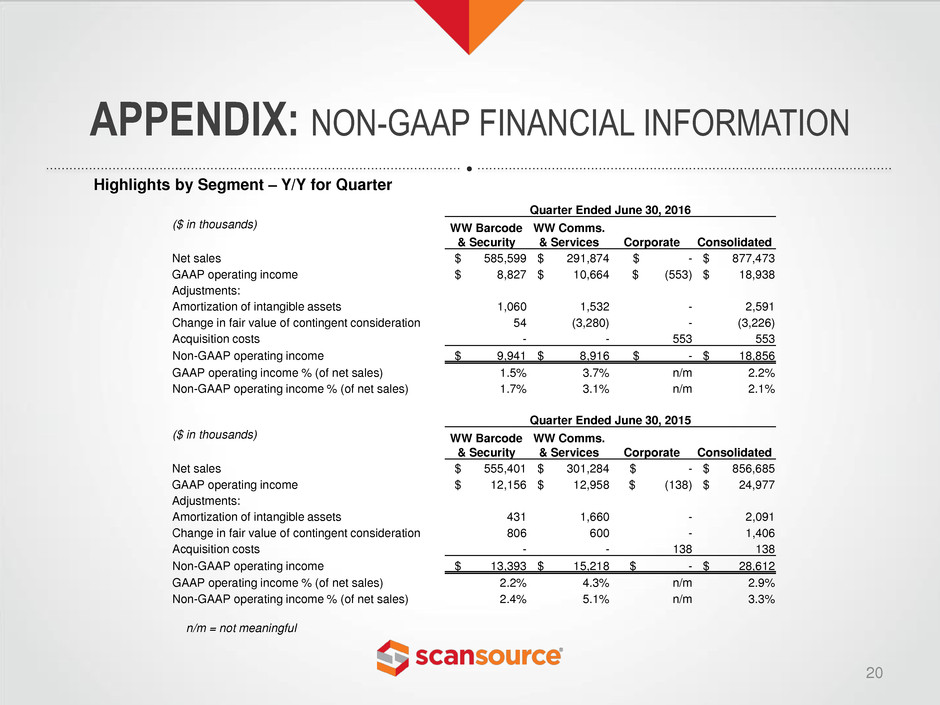
Highlights by Segment – Y/Y for Quarter
Quarter Ended June 30, 2016
($ in thousands) WW Barcode
& Security
WW Comms.
& Services Corporate Consolidated
Net sales $ 585,599 $ 291,874 $ - $ 877,473
GAAP operating income $ 8,827 $ 10,664 $ (553) $ 18,938
Adjustments:
Amortization of intangible assets 1,060 1,532 - 2,591
Change in fair value of contingent consideration 54 (3,280) - (3,226)
Acquisition costs - - 553 553
Non-GAAP operating income $ 9,941 $ 8,916 $ - $ 18,856
GAAP operating income % (of net sales) 1.5% 3.7% n/m 2.2%
Non-GAAP operating income % (of net sales) 1.7% 3.1% n/m 2.1%
Quarter Ended June 30, 2015
($ in thousands) WW Barcode
& Security
WW Comms.
& Services Corporate Consolidated
Net sales $ 555,401 $ 301,284 $ - $ 856,685
GAAP operating income $ 12,156 $ 12,958 $ (138) $ 24,977
Adjustments:
Amortization of intangible assets 431 1,660 - 2,091
Change in fair value of contingent consideration 806 600 - 1,406
Acquisition costs - - 138 138
Non-GAAP operating income $ 13,393 $ 15,218 $ - $ 28,612
GAAP operating income % (of net sales) 2.2% 4.3% n/m 2.9%
Non-GAAP operating income % (of net sales) 2.4% 5.1% n/m 3.3%
n/m = not meaningful
APPENDIX: NON-GAAP FINANCIAL INFORMATION
21
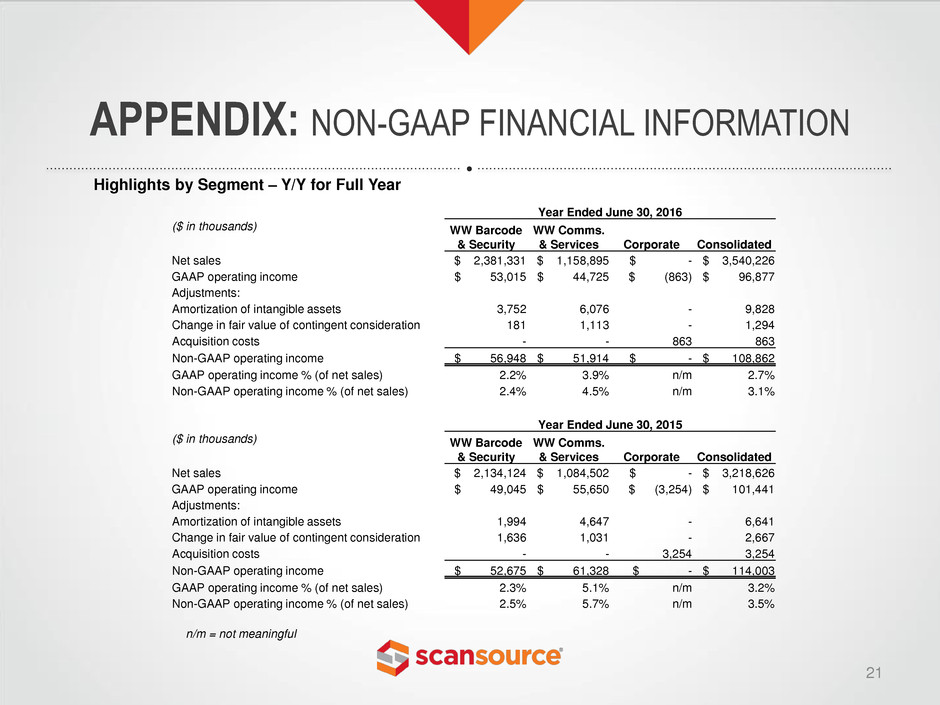
Highlights by Segment – Y/Y for Full Year
Year Ended June 30, 2016
($ in thousands) WW Barcode
& Security
WW Comms.
& Services Corporate Consolidated
Net sales $ 2,381,331 $ 1,158,895 $ - $ 3,540,226
GAAP operating income $ 53,015 $ 44,725 $ (863) $ 96,877
Adjustments:
Amortization of intangible assets 3,752 6,076 - 9,828
Change in fair value of contingent consideration 181 1,113 - 1,294
Acquisition costs - - 863 863
Non-GAAP operating income $ 56,948 $ 51,914 $ - $ 108,862
GAAP operating income % (of net sales) 2.2% 3.9% n/m 2.7%
Non-GAAP operating income % (of net sales) 2.4% 4.5% n/m 3.1%
Year Ended June 30, 2015
($ in thousands) WW Barcode
& Security
WW Comms.
& Services Corporate Consolidated
Net sales $ 2,134,124 $ 1,084,502 $ - $ 3,218,626
GAAP operating income $ 49,045 $ 55,650 $ (3,254) $ 101,441
Adjustments:
Amortization of intangible assets 1,994 4,647 - 6,641
Change in fair value of contingent consideration 1,636 1,031 - 2,667
Acquisition costs - - 3,254 3,254
Non-GAAP operating income $ 52,675 $ 61,328 $ - $ 114,003
GAAP operating income % (of net sales) 2.3% 5.1% n/m 3.2%
Non-GAAP operating income % (of net sales) 2.5% 5.7% n/m 3.5%
n/m = not meaningful
APPENDIX: NON-GAAP FINANCIAL INFORMATION
22
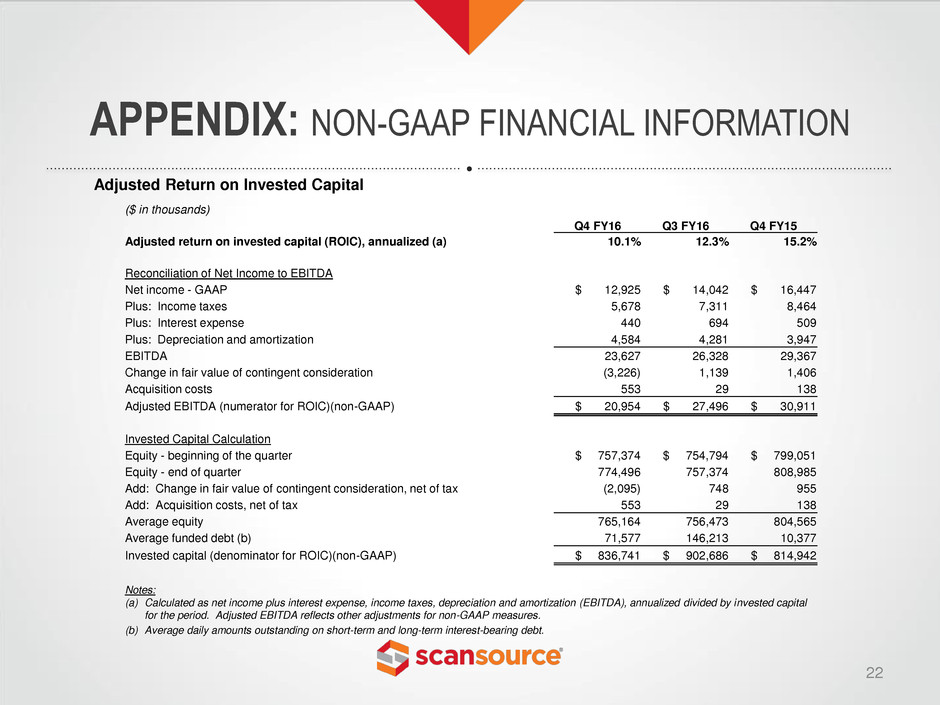
Adjusted Return on Invested Capital
($ in thousands)
Q4 FY16 Q3 FY16 Q4 FY15
Adjusted return on invested capital (ROIC), annualized (a) 10.1% 12.3% 15.2%
Reconciliation of Net Income to EBITDA
Net income - GAAP $ 12,925 $ 14,042 $ 16,447
Plus: Income taxes 5,678 7,311 8,464
Plus: Interest expense 440 694 509
Plus: Depreciation and amortization 4,584 4,281 3,947
EBITDA 23,627 26,328 29,367
Change in fair value of contingent consideration (3,226) 1,139 1,406
Acquisition costs 553 29 138
Adjusted EBITDA (numerator for ROIC)(non-GAAP) $ 20,954 $ 27,496 $ 30,911
Invested Capital Calculation
Equity - beginning of the quarter $ 757,374 $ 754,794 $ 799,051
Equity - end of quarter 774,496 757,374 808,985
Add: Change in fair value of contingent consideration, net of tax (2,095) 748 955
Add: Acquisition costs, net of tax 553 29 138
Average equity 765,164 756,473 804,565
Average funded debt (b) 71,577 146,213 10,377
Invested capital (denominator for ROIC)(non-GAAP) $ 836,741 $ 902,686 $ 814,942
Notes:
(a) Calculated as net income plus interest expense, income taxes, depreciation and amortization (EBITDA), annualized divided by invested capital
for the period. Adjusted EBITDA reflects other adjustments for non-GAAP measures.
(b) Average daily amounts outstanding on short-term and long-term interest-bearing debt.
APPENDIX: NON-GAAP FINANCIAL INFORMATION
23
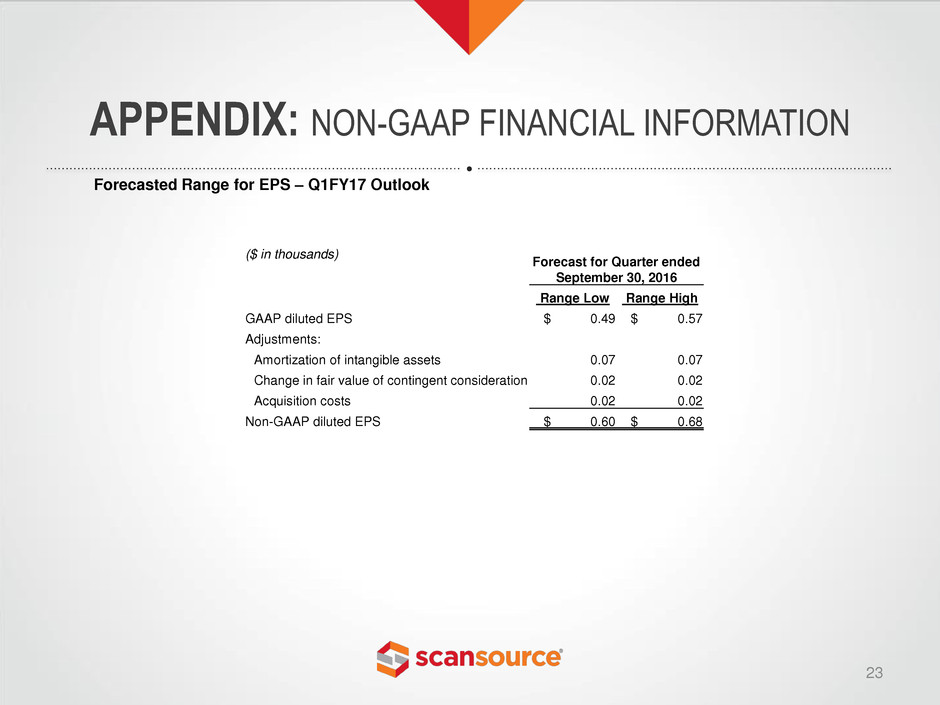
Forecasted Range for EPS – Q1FY17 Outlook
($ in thousands)
Forecast for Quarter ended
September 30, 2016
Range Low Range High
GAAP diluted EPS $ 0.49 $ 0.57
Adjustments:
Amortization of intangible assets 0.07 0.07
Change in fair value of contingent consideration 0.02 0.02
Acquisition costs 0.02 0.02
Non-GAAP diluted EPS $ 0.60 $ 0.68
