Attached files
| file | filename |
|---|---|
| 8-K - 8-K - CNB FINANCIAL CORP/PA | d233071d8k.htm |
Exhibit 99.1

Forward-Looking Statements This presentation includes forward-looking statements within the meaning of Section 27A of the Securities Act of 1933, as amended, and Section 21E of the Securities Exchange Act of 1934, as amended, with respect to the financial condition, liquidity, results of operations, future performance and business of CNB Financial Corporation. These forward-looking statements are intended to be covered by the safe harbor for “forward-looking statements” provided by the Private Securities Litigation Reform Act of 1995. Forward-looking statements are those that are not historical facts. Forward-looking statements include statements with respect to beliefs, plans, objectives, goals, expectations, anticipations, estimates and intentions that are subject to significant risks and uncertainties and are subject to change based on various factors (some of which are beyond our control). Forward-looking statements often include the words “believes,” “expects,” “anticipates,” “estimates,” “forecasts,” “intends,” “plans,” “targets,” “potentially,” “probably,” “projects,” “outlook” or similar expressions or future conditional verbs such as “may,” “will,” “should,” “would” and “could.” Such known and unknown risks, uncertainties and other factors that could cause the actual results to differ materially from the statements, include, but are not limited to: (i) changes in general business, industry or economic conditions or competition; (ii) changes in any applicable law, rule, regulation, policy, guideline or practice governing or affecting financial holding companies and their subsidiaries or with respect to tax or accounting principles or otherwise; (iii) adverse changes or conditions in capital and financial markets; (iv) changes in interest rates; (v) higher than expected costs or other difficulties related to integration of combined or merged businesses; (vi) the inability to realize expected cost savings or achieve other anticipated benefits in connection with business combinations and other acquisitions; (vii) changes in the quality or composition of our loan and investment portfolios; (viii) adequacy of loan loss reserves; (ix) increased competition; (x) loss of certain key officers; (xi) continued relationships with major customers; (xii) deposit attrition; (xiii) rapidly changing technology; (xiv) unanticipated regulatory or judicial proceedings and liabilities and other costs; (xv) changes in the cost of funds, demand for loan products or demand for financial services; (xvi) other economic, competitive, governmental or technological factors affecting our operations, markets, products, services and prices; and (xvii) our success at managing the foregoing items. Such developments could have an adverse impact on our financial position and our results of operations. The forward-looking statements are based upon management’s beliefs and assumptions. Any forward-looking statement made herein speaks only as of the date of this presentation. Factors or events that could cause our actual results to differ may emerge from time to time, and it is not possible for us to predict all of them. We undertake no obligation to publicly update any forward-looking statement, whether as a result of new information, future developments or otherwise, except as may be required by law. 2
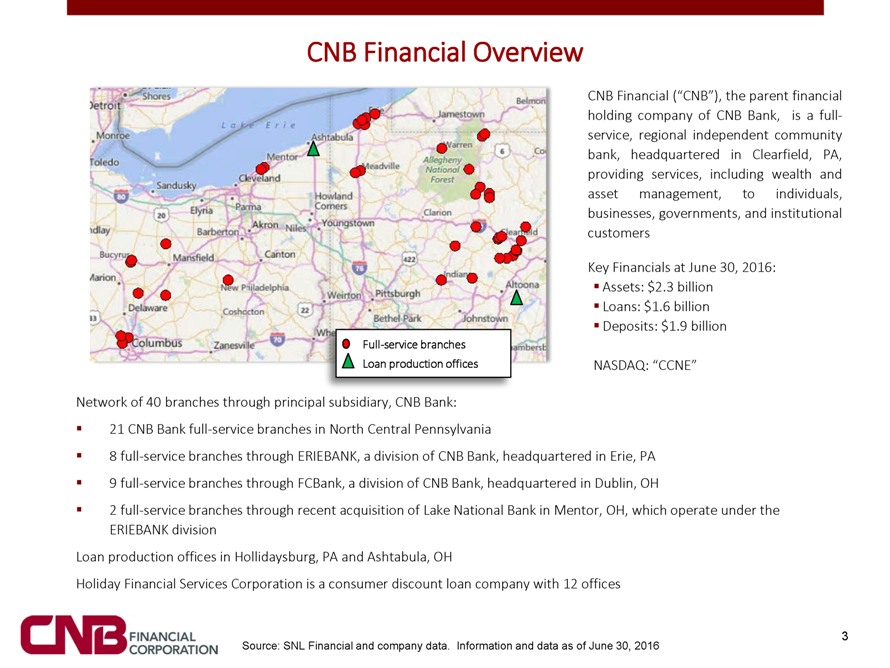
CNB Financial Overview CNB Financial (“CNB”), the parent financial holding company of CNB Bank, is a full-service, regional independent community bank, headquartered in Clearfield, PA, providing services, including wealth and asset management, to individuals, businesses, governments, and institutional customers Key Financials at June 30, 2016: Assets: $2.3 billion Loans: $1.6 billion Deposits: $1.9 billion Full-service branches Loan production offices NASDAQ: “CCNE” Network of 40 branches through principal subsidiary, CNB Bank: 21 CNB Bank full-service branches in North Central Pennsylvania 8 full-service branches through ERIEBANK, a division of CNB Bank, headquartered in Erie, PA 9 full-service branches through FCBank, a division of CNB Bank, headquartered in Dublin, OH 2 full-service branches through recent acquisition of Lake National Bank in Mentor, OH, which operate under the ERIEBANK division Loan production offices in Hollidaysburg, PA and Ashtabula, OH Holiday Financial Services Corporation is a consumer discount loan company with 12 offices 3 Source: SNL Financial and company data. Information and data as of June 30, 2016
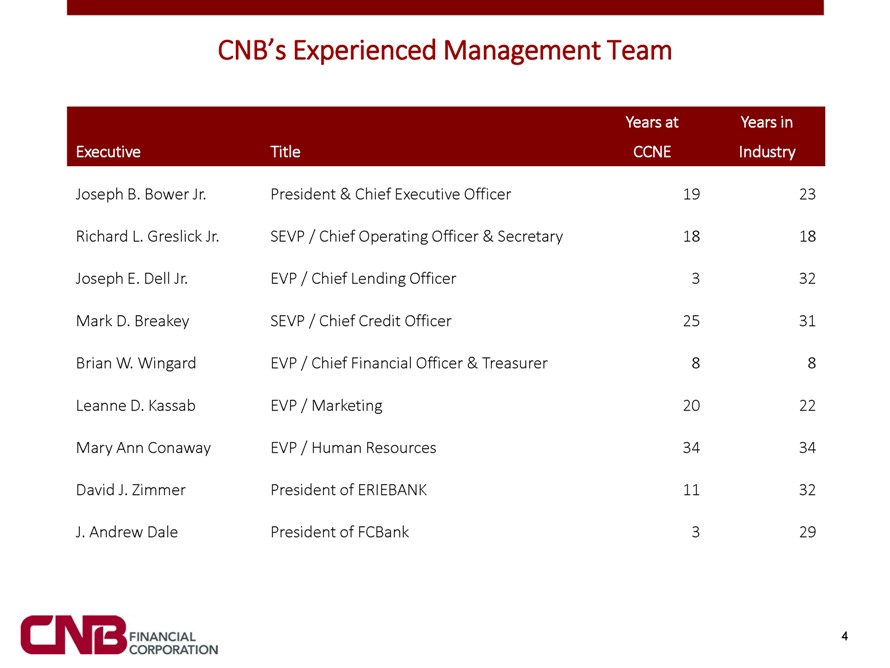
CNB’s Experienced Management Team Years at Years in Executive Title CCNE Industry Joseph B. Bower Jr. President & Chief Executive Officer 19 23 Richard L. Greslick Jr. SEVP / Chief Operating Officer & Secretary 18 18 Joseph E. Dell Jr. EVP / Chief Lending Officer 3 32 Mark D. Breakey SEVP / Chief Credit Officer 25 31 Brian W. Wingard EVP / Chief Financial Officer & Treasurer 8 8 Leanne D. Kassab EVP / Marketing 20 22 Mary Ann Conaway EVP / Human Resources 34 34 David J. Zimmer President of ERIEBANK 11 32 J. Andrew Dale President of FCBank 3 29 4
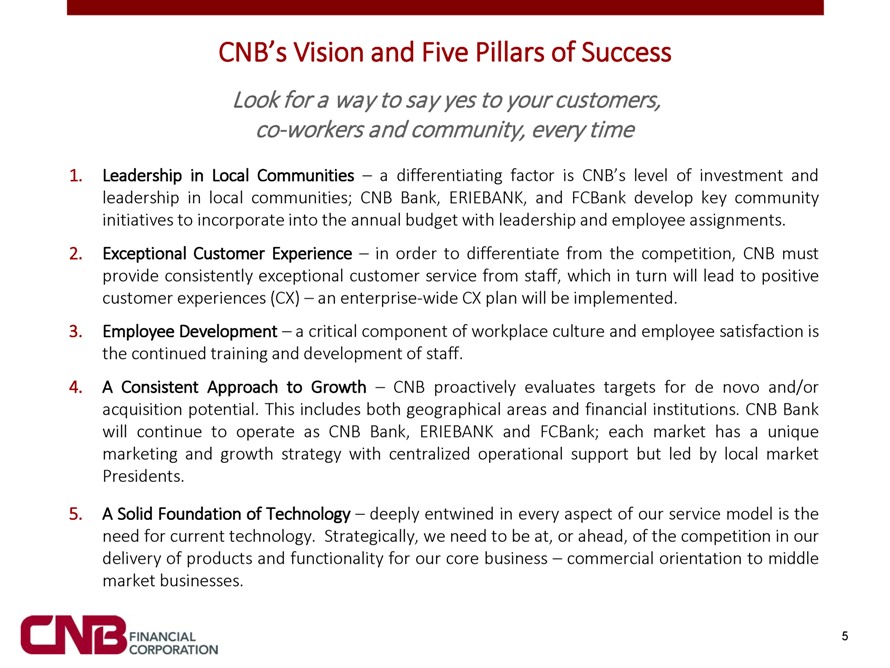
CNB’s Vision and Five Pillars of Success Look for a way to say yes to your customers, co-workers and community, every time 1. Leadership in Local Communities – a differentiating factor is CNB’s level of investment and leadership in local communities; CNB Bank, ERIEBANK, and FCBank develop key community initiatives to incorporate into the annual budget with leadership and employee assignments. 2. Exceptional Customer Experience – in order to differentiate from the competition, CNB must provide consistently exceptional customer service from staff, which in turn will lead to positive customer experiences (CX) – an enterprise-wide CX plan will be implemented. 3. Employee Development – a critical component of workplace culture and employee satisfaction is the continued training and development of staff. 4. A Consistent Approach to Growth – CNB proactively evaluates targets for de novo and/or acquisition potential. This includes both geographical areas and financial institutions. CNB Bank will continue to operate as CNB Bank, ERIEBANK and FCBank; each market has a unique marketing and growth strategy with centralized operational support but led by local market Presidents. 5. A Solid Foundation of Technology – deeply entwined in every aspect of our service model is the need for current technology. Strategically, we need to be at, or ahead, of the competition in our delivery of products and functionality for our core business – commercial orientation to middle market businesses.
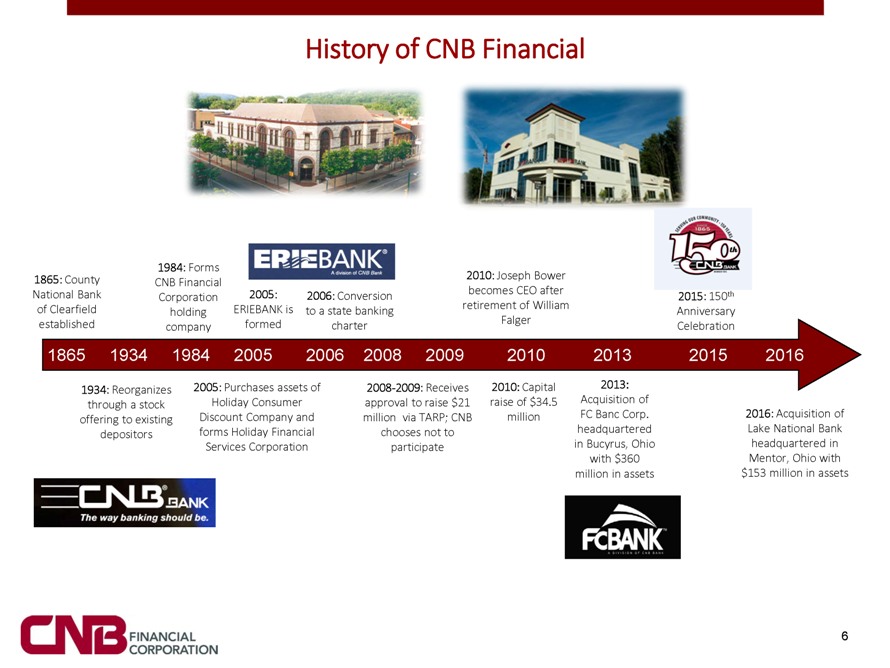
History of CNB Financial 1984: Forms 1865: County 2010: Joseph Bower CNB Financial National Bank 2005: 2006: Conversion becomes CEO after th Corporation 2015: 150 of Clearfield ERIEBANK is to a state banking retirement of William holding Anniversary established formed charter Falger company Celebration 1865 1934 1984 2005 2006 2008 2009 2010 2013 2015 2016 1934: Reorganizes 2005: Purchases assets of 2008-2009: Receives 2010: Capital 2013: through a stock Holiday Consumer approval to raise $21 raise of $34.5 Acquisition of Discount Company and million via TARP; CNB million FC Banc Corp. 2016: Acquisition of offering to existing forms Holiday Financial chooses not to headquartered Lake National Bank depositors Services Corporation participate in Bucyrus, Ohio headquartered in with $360 Mentor, Ohio with million in assets $153 million in assets 6
CNB’s Growth Model CNB’s strong growth, both organic and by M&A, has been a result of its business model which involves identifying the right market in which to operate based on market demographics that fit CNB’s lending expertise (small and mid sized commercial and industrial lending) and then finding the right local person with market experience to deliver the CNB product set and sophistication of services to grow organically in the market CNB built its ERIEBANK franchise de novo using this model to over $500 million in loans in ten years In Ohio, CNB entered the greater Columbus market through its acquisition of FCBank but has since executed this same strategy to grow organically in the FCBank market through new offices and additional lenders The same opportunity exists in the greater Cleveland market with CNB’s recent acquisition of Lake National Bank CNB has recently hired a local banker to oversee its entree into Buffalo, New York M&A is not a priority in CNB’s growth strategy; however, it will remain opportunistic and would consider transactions that would meet its financial criteria and also expand its presence into new markets that fit its business model (e.g. FCBank, Lake National); bring significant talent; and/or fill in existing markets
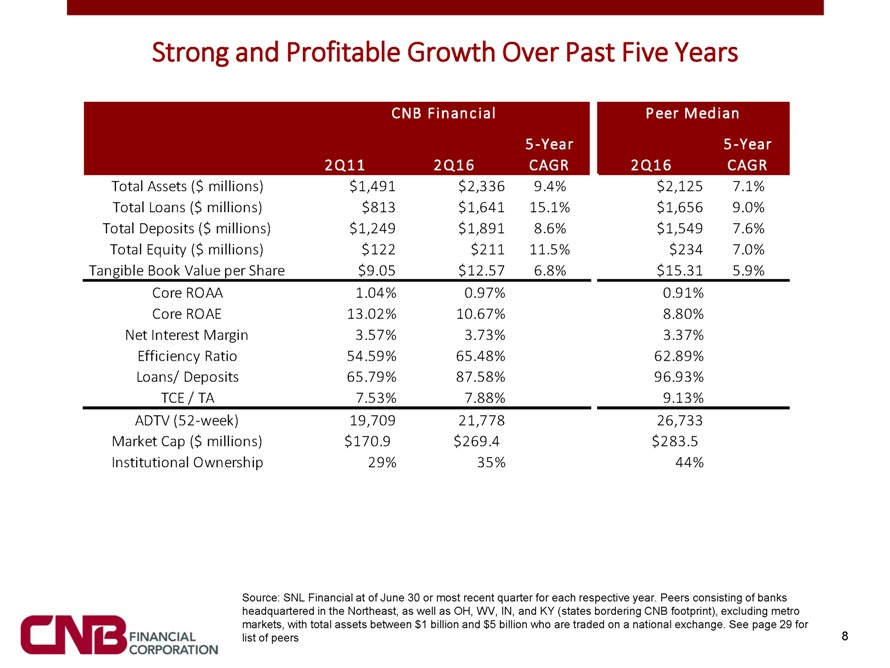
Strong and Profitable Growth Over Past Five Years CNB Financial Peer Median 5-Year 5-Year 2Q11 2Q16 CAGR 2Q16 CAGR Total Assets ($ millions) $1,491 $2,336 9.4% $2,125 7.1% Total Loans ($ millions) $813 $1,641 15.1% $1,656 9.0% Total Deposits ($ millions) $1,249 $1,891 8.6% $1,549 7.6% Total Equity ($ millions) $122 $211 11.5% $234 7.0% Tangible Book Value per Share $9.05 $12.57 6.8% $15.31 5.9% Core ROAA 1.04% 0.97% 0.91% Core ROAE 13.02% 10.67% 8.80% Net Interest Margin 3.57% 3.73% 3.37% Efficiency Ratio 54.59% 65.48% 62.89% Loans/ Deposits 65.79% 87.58% 96.93% TCE / TA 7.53% 7.88% 9.13% ADTV (52-week) 19,709 21,778 26,733 Market Cap ($ millions) $170.9 $269.4 $283.5 Institutional Ownership 29% 35% 44% Source: SNL Financial at of June 30 or most recent quarter for each respective year. Peers consisting of banks headquartered in the Northeast, as well as OH, WV, IN, and KY (states bordering CNB footprint), excluding metro markets, with total assets between $1 billion and $5 billion who are traded on a national exchange. See page 29 for 8 list of peers
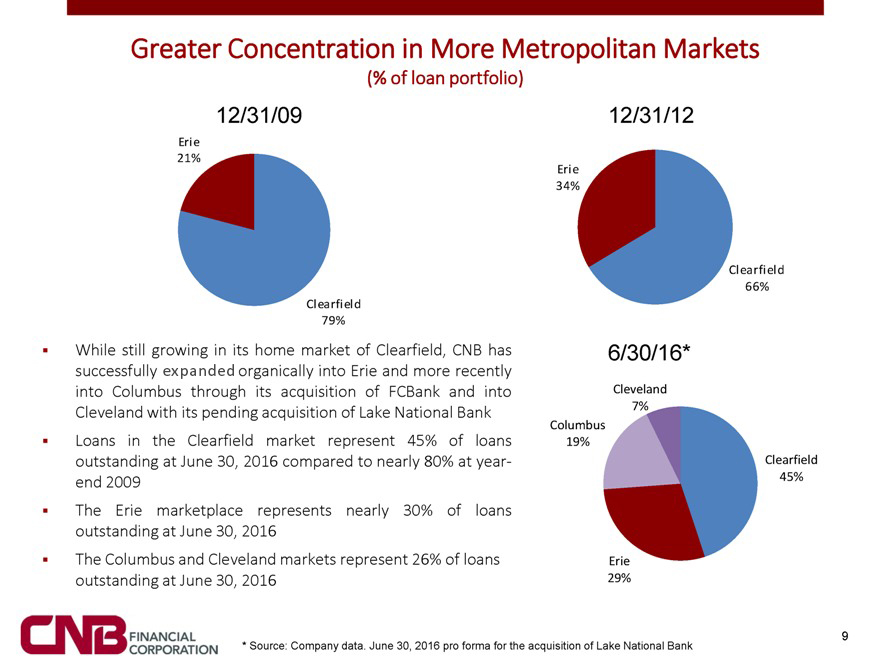
Greater Concentration in More Metropolitan Markets (% of loan portfolio) 12/31/09 12/31/12 Erie 21% Erie 34% Clearfield 66% Clearfield 79% While still growing in its home market of Clearfield, CNB has 6/30/16* successfully expanded organically into Erie and more recently into Columbus through its acquisition of FCBank and into Cleveland Cleveland with its pending acquisition of Lake National Bank 7% Columbus Loans in the Clearfield market represent 45% of loans 19% outstanding at June 30, 2016 compared to nearly 80% at year- Clearfield end 2009 45% The Erie marketplace represents nearly 30% of loans outstanding at June 30, 2016 The Columbus and Cleveland markets represent 26% of loans Erie outstanding at June 30, 2016 29% 9 * Source: Company data. June 30, 2016 pro forma for the acquisition of Lake National Bank
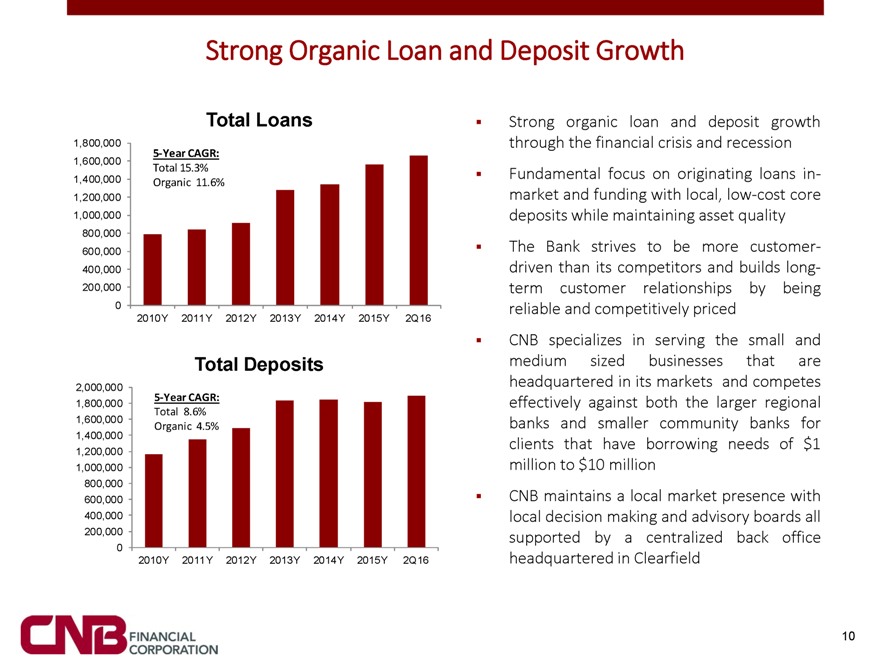
Strong Organic Loan and Deposit Growth 0 0 Total Loans Strong organic loan and deposit growth 1,800,000 through the financial crisis and recession 5-Year CAGR: 1,600,000 Total 15.3% 1,400,000 Fundamental focus on originating loans in- Organic 11.6% 1,200,000 market and funding with local, low-cost core 1,000,000 deposits while maintaining asset quality 800,000 600,000 The Bank strives to be more customer-400,000 driven than its competitors and builds long-200,000 term customer relationships by being 0 reliable and competitively priced 2010Y 2011Y 2012Y 2013Y 2014Y 2015Y 2Q16 0 CNB specializes in serving the small and 0 0 Total Deposits medium sized businesses that are 2,000,000 headquartered in its markets and competes 5-Year CAGR: 1,800,000 effectively against both the larger regional Total 8.6% 1,600,000 banks and smaller community banks for Organic 4.5% 1,400,000 clients that have borrowing needs of $1 1,200,000 1,000,000 million to $10 million 800,000 600,000 CNB maintains a local market presence with 400,000 local decision making and advisory boards all 200,000 supported by a centralized back office 0 2010Y 2011Y 2012Y 2013Y 2014Y 2015Y 2Q16 headquartered in Clearfield 0 10
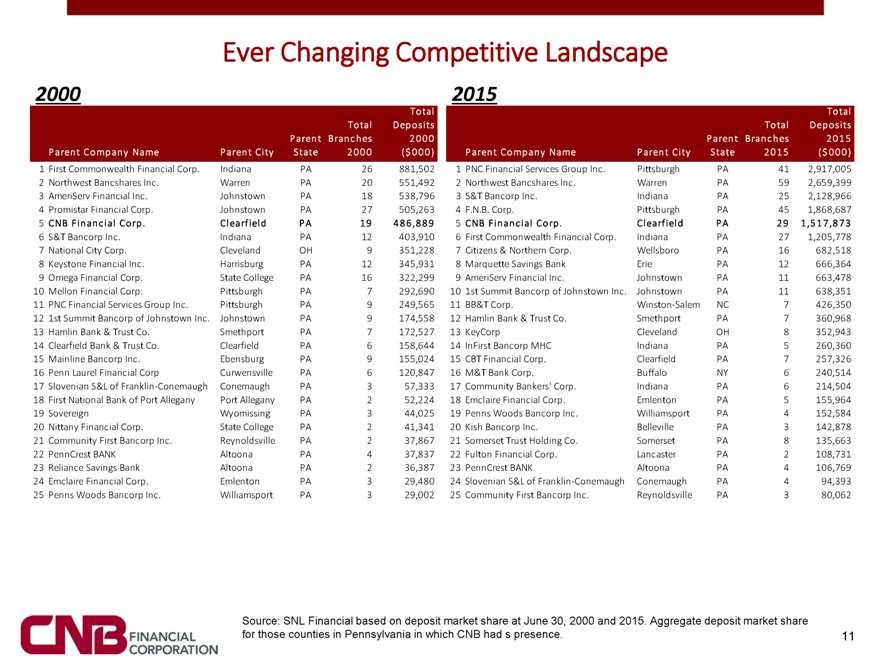
Ever Changing Competitive Landscape 2000 2015 Total Total Total Deposits Total Deposits Parent Branches 2000 Parent Branches 2015 Parent Company Name Parent City State 2000 ($000) Parent Company Name Parent City State 2015 ($000) 1 First Commonwealth Financial Corp. Indiana PA 26 881,502 1 PNC Financial Services Group Inc. Pittsburgh PA 41 2,917,005 2 Northwest Bancshares Inc. Warren PA 20 551,492 2 Northwest Bancshares Inc. Warren PA 59 2,659,399 3 AmeriServ Financial Inc. Johnstown PA 18 538,796 3 S&T Bancorp Inc. Indiana PA 25 2,128,966 4 Promistar Financial Corp. Johnstown PA 27 505,263 4 F.N.B. Corp. Pittsburgh PA 45 1,868,687 5 CNB Financial Corp. Clearfield PA 19 486,889 5 CNB Financial Corp. Clearfield PA 29 1,517,873 6 S&T Bancorp Inc. Indiana PA 12 403,910 6 First Commonwealth Financial Corp. Indiana PA 27 1,205,778 7 National City Corp. Cleveland OH 9 351,228 7 Citizens & Northern Corp. Wellsboro PA 16 682,518 8 Keystone Financial Inc. Harrisburg PA 12 345,931 8 Marquette Savings Bank Erie PA 12 666,364 9 Omega Financial Corp. State College PA 16 322,299 9 AmeriServ Financial Inc. Johnstown PA 11 663,478 10 Mellon Financial Corp. Pittsburgh PA 7 292,690 10 1st Summit Bancorp of Johnstown Inc. Johnstown PA 11 638,351 11 PNC Financial Services Group Inc. Pittsburgh PA 9 249,565 11 BB&T Corp. Winston-Salem NC 7 426,350 12 1st Summit Bancorp of Johnstown Inc. Johnstown PA 9 174,558 12 Hamlin Bank & Trust Co. Smethport PA 7 360,968 13 Hamlin Bank & Trust Co. Smethport PA 7 172,527 13 KeyCorp Cleveland OH 8 352,943 14 Clearfield Bank & Trust Co. Clearfield PA 6 158,644 14 InFirst Bancorp MHC Indiana PA 5 260,360 15 Mainline Bancorp Inc. Ebensburg PA 9 155,024 15 CBT Financial Corp. Clearfield PA 7 257,326 16 Penn Laurel Financial Corp Curwensville PA 6 120,847 16 M&T Bank Corp. Buffalo NY 6 240,514 17 Slovenian S&L of Franklin-Conemaugh Conemaugh PA 3 57,333 17 Community Bankers’ Corp. Indiana PA 6 214,504 18 First National Bank of Port Allegany Port Allegany PA 2 52,224 18 Emclaire Financial Corp. Emlenton PA 5 155,964 19 Sovereign Wyomissing PA 3 44,025 19 Penns Woods Bancorp Inc. Williamsport PA 4 152,584 20 Nittany Financial Corp. State College PA 2 41,341 20 Kish Bancorp Inc. Belleville PA 3 142,878 21 Community First Bancorp Inc. Reynoldsville PA 2 37,867 21 Somerset Trust Holding Co. Somerset PA 8 135,663 22 PennCrest BANK Altoona PA 4 37,837 22 Fulton Financial Corp. Lancaster PA 2 108,731 23 Reliance Savings Bank Altoona PA 2 36,387 23 PennCrest BANK Altoona PA 4 106,769 24 Emclaire Financial Corp. Emlenton PA 3 29,480 24 Slovenian S&L of Franklin-Conemaugh Conemaugh PA 4 94,393 25 Penns Woods Bancorp Inc. Williamsport PA 3 29,002 25 Community First Bancorp Inc. Reynoldsville PA 3 80,062 Source: SNL Financial based on deposit market share at June 30, 2000 and 2015. Aggregate deposit market share for those counties in Pennsylvania in which CNB had s presence. 11
Market Overview Erie is the 4th largest city in Pennsylvania. Erie’s vibrant business community is growing increasingly more diverse. The region’s strong manufacturing history has helped encourage recent growth in smaller-scale steel and plastics manufacturers, as well as healthcare, insurance, tourism and education industries. The Erie region’s largest employer, GE Transportation, maintains its world headquarters facility in Erie, Pennsylvania and employs approximately 5,300 individuals. Lord Corporation was founded in Erie, Pennsylvania and maintains major operations in the region. Diesel-electric locomotive building remains the largest manufacturer sector in Erie. More than 10% of American plastics are manufactured or completed in Erie-based plastics plants. Columbus’ diversified economy is balanced among the services, trade, government, and manufacturing sectors. In the Columbus Region, manufacturing is thriving with more than 1,700 manufacturers employing more than 85,000 people. Hundreds of thousands of goods roll off production lines every day—from automobile and fertilizer to beer and baby formula. Mentor is one of Northeast Ohio’s largest communities and the largest city in Lake County with a population of over 45,000. There are approximately 2,570 businesses located in Mentor and more than 34,000 employees working in a diverse range of businesses including major corporations, manufacturers, retailers, specialty shops and small businesses. Mentor, which serves as a retail hub for many of the eastern suburbs of Cleveland, ranks seventh in Ohio for total retail sales with approximately 600 stores and approximately 3.3 million square feet of prime retail space. Buffalo is the second largest city in the state of New York with a population of 1.13 million in the greater Buffalo region. Economic sectors include industrial, light manufacturing, high technology and service industries. In 2016, the U.S. Bureau of Economic Analysis valued the Buffalo area economy at $54.9 billion. 12 Source: eriepa.com; city-data.com; columbusregion.com; The City of Mentor; bea.gov
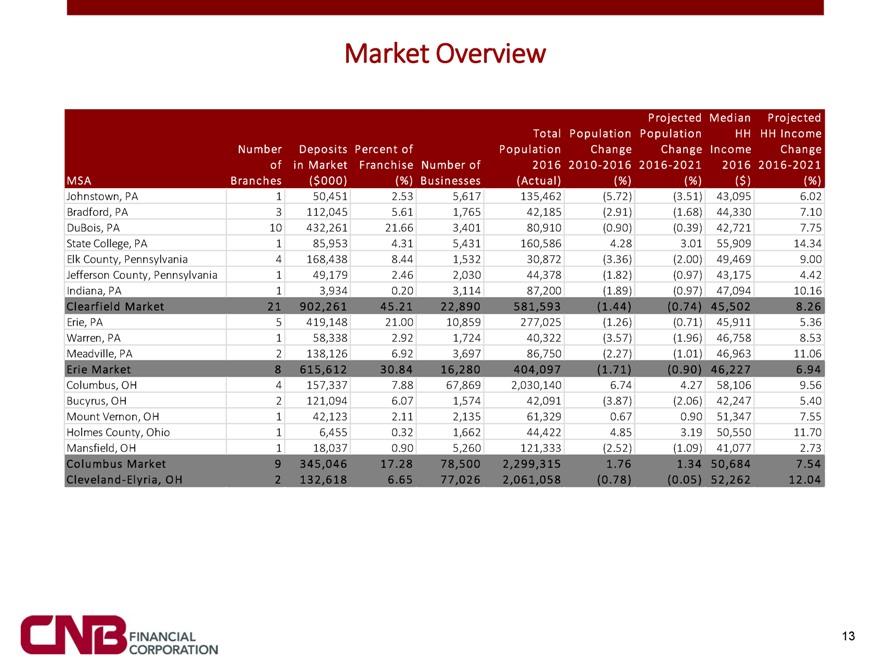
Market Overview Projected Median Projected Total Population Population HH HH Income Number Deposits Percent of Population Change Change Income Change of in Market Franchise Number of 2016 2010-2016 2016-2021 2016 2016-2021 MSA Branches ($000) (%) Businesses (Actual) (%) (%) ($) (%) Johnstown, PA 1 50,451 2.53 5,617 135,462 (5.72) (3.51) 43,095 6.02 Bradford, PA 3 112,045 5.61 1,765 42,185 (2.91) (1.68) 44,330 7.10 DuBois, PA 10 432,261 21.66 3,401 80,910 (0.90) (0.39) 42,721 7.75 State College, PA 1 85,953 4.31 5,431 160,586 4.28 3.01 55,909 14.34 Elk County, Pennsylvania 4 168,438 8.44 1,532 30,872 (3.36) (2.00) 49,469 9.00 Jefferson County, Pennsylvania 1 49,179 2.46 2,030 44,378 (1.82) (0.97) 43,175 4.42 Indiana, PA 1 3,934 0.20 3,114 87,200 (1.89) (0.97) 47,094 10.16 Clearfield Market 21 902,261 45.21 22,890 581,593 (1.44) (0.74) 45,502 8.26 Erie, PA 5 419,148 21.00 10,859 277,025 (1.26) (0.71) 45,911 5.36 Warren, PA 1 58,338 2.92 1,724 40,322 (3.57) (1.96) 46,758 8.53 Meadville, PA 2 138,126 6.92 3,697 86,750 (2.27) (1.01) 46,963 11.06 Erie Market 8 615,612 30.84 16,280 404,097 (1.71) (0.90) 46,227 6.94 Columbus, OH 4 157,337 7.88 67,869 2,030,140 6.74 4.27 58,106 9.56 Bucyrus, OH 2 121,094 6.07 1,574 42,091 (3.87) (2.06) 42,247 5.40 Mount Vernon, OH 1 42,123 2.11 2,135 61,329 0.67 0.90 51,347 7.55 Holmes County, Ohio 1 6,455 0.32 1,662 44,422 4.85 3.19 50,550 11.70 Mansfield, OH 1 18,037 0.90 5,260 121,333 (2.52) (1.09) 41,077 2.73 Columbus Market 9 345,046 17.28 78,500 2,299,315 1.76 1.34 50,684 7.54 Cleveland-Elyria, OH 2 132,618 6.65 77,026 2,061,058 (0.78) (0.05) 52,262 12.04 13
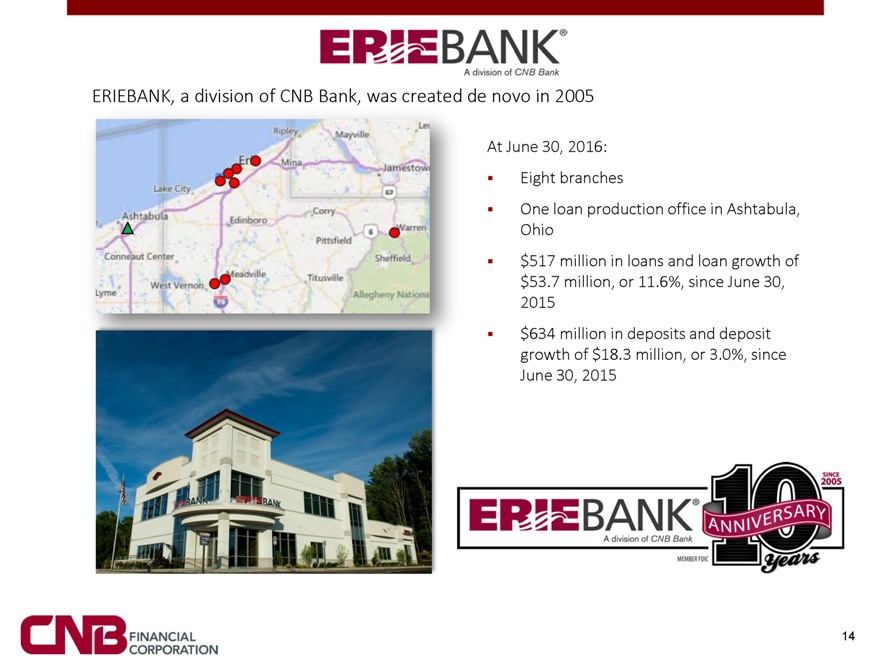
ERIEBANK, a division of CNB Bank, was created de novo in 2005 At June 30, 2016: Eight branches One loan production office in Ashtabula, Ohio $517 million in loans and loan growth of $53.7 million, or 11.6%, since June 30, 2015 $634 million in deposits and deposit growth of $18.3 million, or 3.0%, since June 30, 2015 14
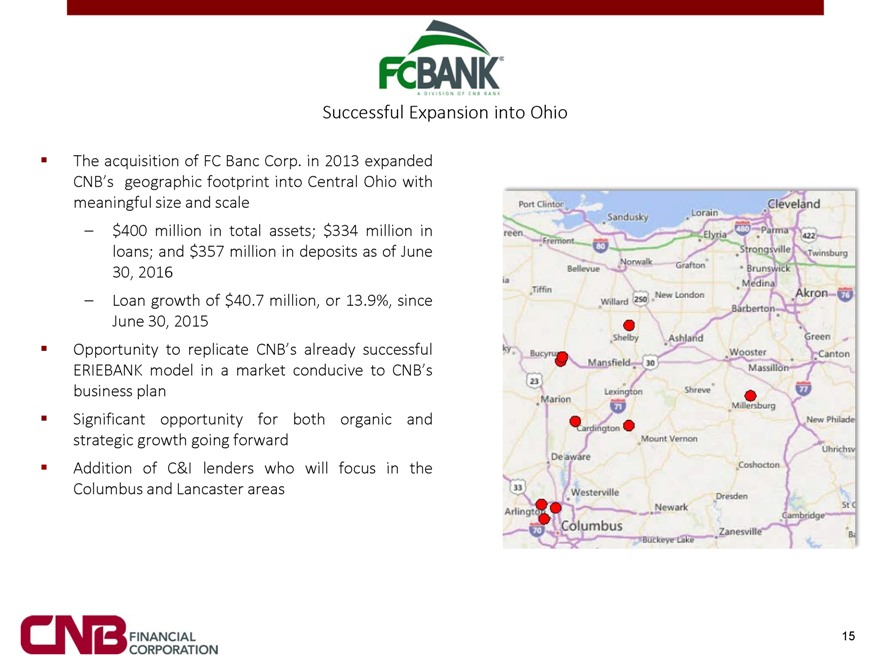
Successful Expansion into Ohio The acquisition of FC Banc Corp. in 2013 expanded CNB’s geographic footprint into Central Ohio with meaningful size and scale – $400 million in total assets; $334 million in loans; and $357 million in deposits as of June 30, 2016 – Loan growth of $40.7 million, or 13.9%, since June 30, 2015 Opportunity to replicate CNB’s already successful ERIEBANK model in a market conducive to CNB’s business plan Significant opportunity for both organic and strategic growth going forward Addition of C&I lenders who will focus in the Columbus and Lancaster areas 15
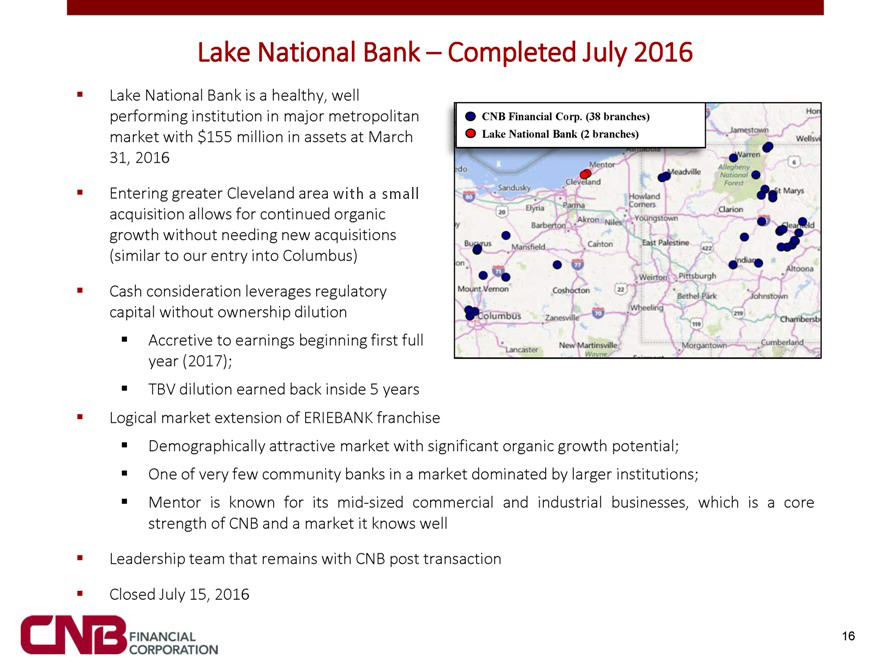
Lake National Bank – Completed July 2016 Lake National Bank is a healthy, well performing institution in major metropolitan CNB Financial Corp. (38 branches) market with $155 million in assets at March Lake National Bank (2 branches) 31, 2016 Entering greater Cleveland area with a small acquisition allows for continued organic growth without needing new acquisitions (similar to our entry into Columbus) Cash consideration leverages regulatory capital without ownership dilution Accretive to earnings beginning first full year (2017); TBV dilution earned back inside 5 years Logical market extension of ERIEBANK franchise Demographically attractive market with significant organic growth potential; One of very few community banks in a market dominated by larger institutions; Mentor is known for its mid-sized commercial and industrial businesses, which is a core strength of CNB and a market it knows well Leadership team that remains with CNB post transaction Closed July 15, 2016
Building Infrastructure to Support Future Growth CNB has experienced significant growth, almost doubling its size since December 2009, assets have grown to $2.3 billion at June 30, 2016 from $1.2 billion at December 31, 2009 The rapid increase in assets through the growth in number of customers led management to analyze its infrastructure to determine how much it could continue to grow with the people and systems that it had As a result, CNB made numerous infrastructure, personnel, and other investments during 2015 and early 2016 to facilitate its continued growth: – A building project was completed which added approximately 15,000 square feet of space to our existing headquarters to better leverage our facilities, technology, and personnel. This new modern facility allows us to house our back-office staff to operate well into the foreseeable future; – CNB added 27 full-time equivalent staff, which included both customer-facing personnel such as business development and wealth management officers, as well as support department personnel; – Upgraded its core processing system which involved some non-recurring costs in 2015 ($108 thousand) and 2016 ($1.6 million). With these investments, CNB now has the infrastructure in place to support its continued growth over the next several years
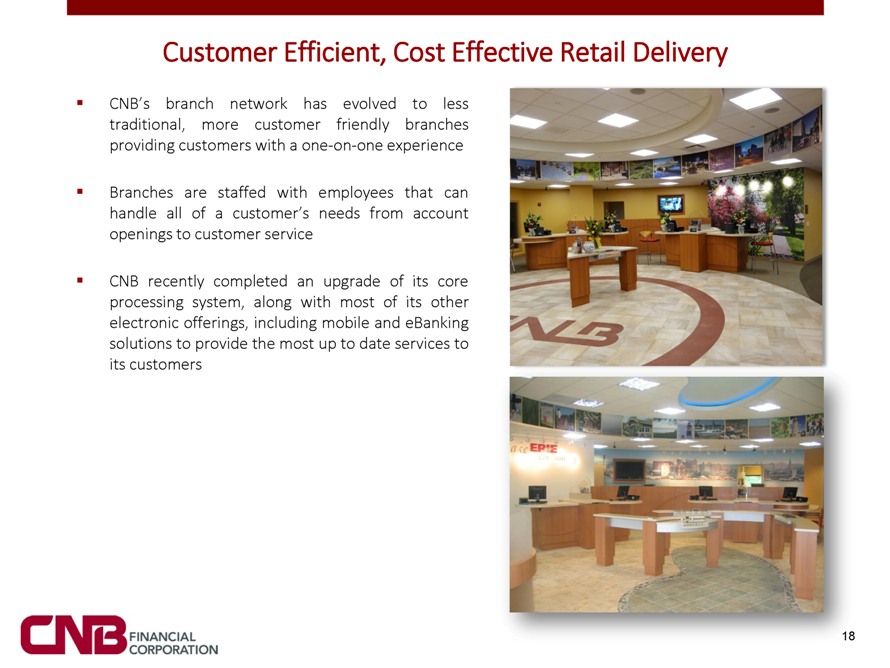
Customer Efficient, Cost Effective Retail Delivery CNB’s branch network has evolved to less traditional, more customer friendly branches providing customers with a one-on-one experience Branches are staffed with employees that can handle all of a customer’s needs from account openings to customer service CNB recently completed an upgrade of its core processing system, along with most of its other electronic offerings, including mobile and eBanking solutions to provide the most up to date services to its customers

Financial Information 19
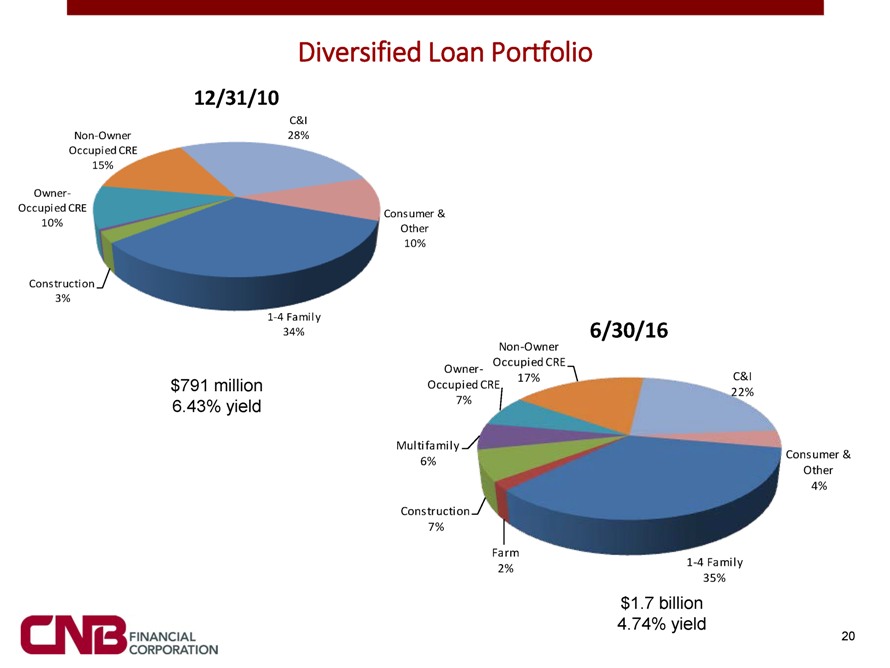
Diversified Loan Portfolio 12/31/10 C&I Non-Owner 28% Occupied CRE 15% Owner- Occupied CRE Consumer & 10% Other 10% Construction 3% 1-4 Family 34% 6/30/16 Non-Owner Occupied CRE Owner- 17% C&I $791 million Occupied CRE 22% 6.43% yield 7% Multifamily Consumer & 6% Other 4% Construction 7% Farm 2% 1-4 Family 35% $1.7 billion 4.74% yield 20
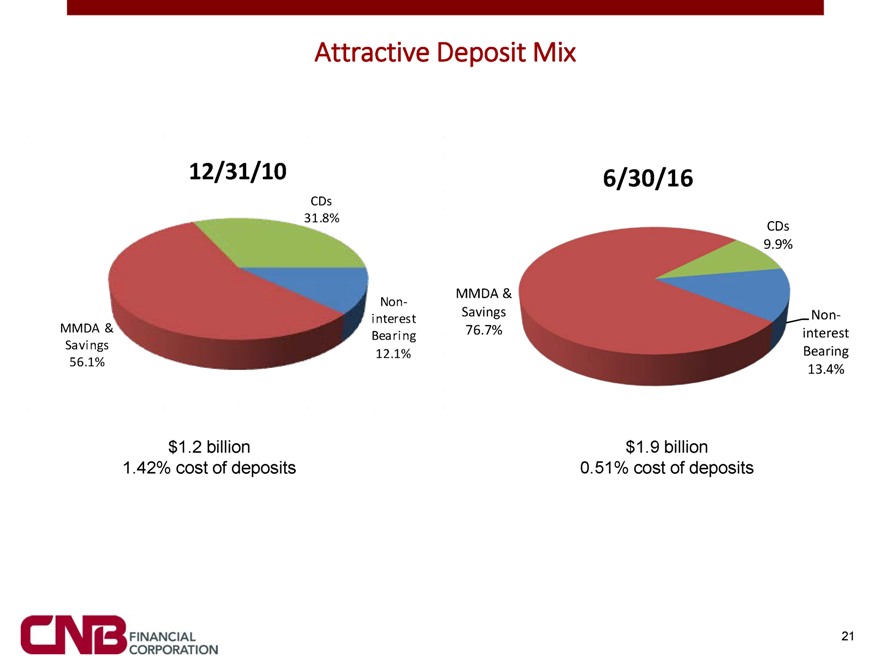
Attractive Deposit Mix 12/31/10 6/30/16 CDs 31.8% CDs 9.9% MMDA & Non-interest Savings Non-MMDA & 76.7% interest Bearing Savings Bearing 12.1% 56.1% 13.4% $1.2 billion $1.9 billion 1.42% cost of deposits 0.51% cost of deposits 21
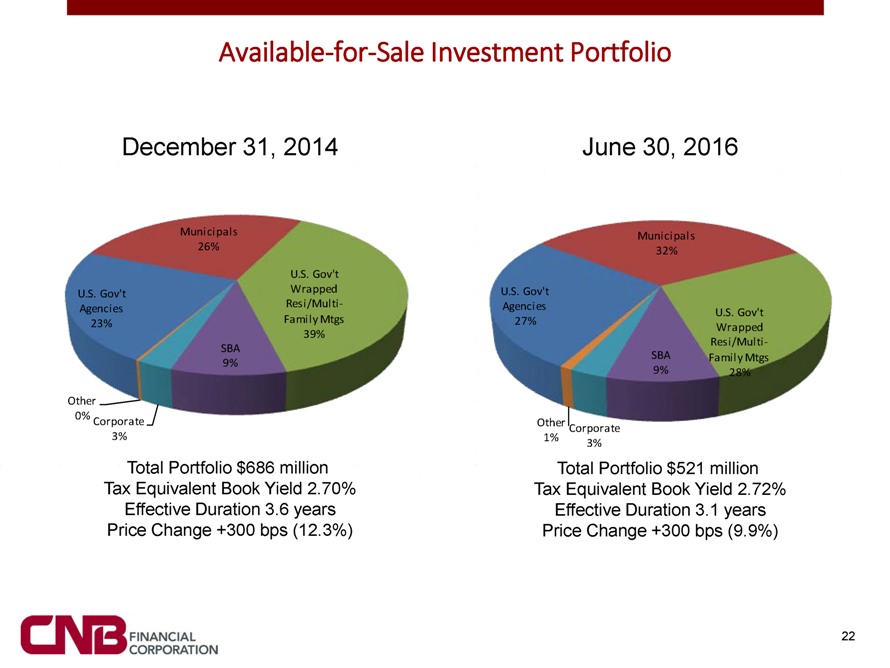
Available-for-Sale Investment Portfolio December 31, 2014 June 30, 2016 Municipals Municipals 26% 32% U.S. Gov’t U.S. Gov’t Wrapped U.S. Gov’t Agencies Resi/Multi- Agencies U.S. Gov’t 23% Family Mtgs 27% Wrapped 39% Resi/Multi-SBA SBA Family Mtgs 9% 9% 28% Other 0% Corporate Other Corporate 3% 1% 3% Total Portfolio $686 million Total Portfolio $521 million Tax Equivalent Book Yield 2.70% Tax Equivalent Book Yield 2.72% Effective Duration 3.6 years Effective Duration 3.1 years Price Change +300 bps (12.3%) Price Change +300 bps (9.9%)
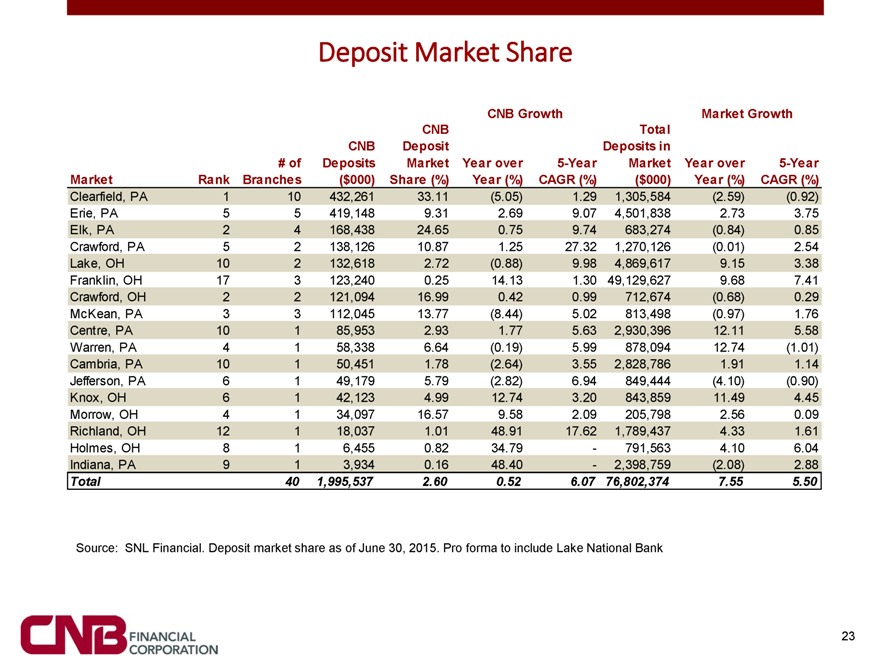
Deposit Market Share CNB Growth Market Growth CNB Total CNB Deposit Deposits in # of Deposits Market Year over 5-Year Market Year over 5-Year Market Rank Branches ($000) Share (%) Year (%) CAGR (%) ($000) Year (%) CAGR (%) Clearfield, PA 1 10 432,261 33.11 (5.05) 1.29 1,305,584 (2.59) (0.92) Erie, PA 5 5 419,148 9.31 2.69 9.07 4,501,838 2.73 3.75 Elk, PA 2 4 168,438 24.65 0.75 9.74 683,274 (0.84) 0.85 Crawford, PA 5 2 138,126 10.87 1.25 27.32 1,270,126 (0.01) 2.54 Lake, OH 10 2 132,618 2.72 (0.88) 9.98 4,869,617 9.15 3.38 Franklin, OH 17 3 123,240 0.25 14.13 1.30 49,129,627 9.68 7.41 Crawford, OH 2 2 121,094 16.99 0.42 0.99 712,674 (0.68) 0.29 McKean, PA 3 3 112,045 13.77 (8.44) 5.02 813,498 (0.97) 1.76 Centre, PA 10 1 85,953 2.93 1.77 5.63 2,930,396 12.11 5.58 Warren, PA 4 1 58,338 6.64 (0.19) 5.99 878,094 12.74 (1.01) Cambria, PA 10 1 50,451 1.78 (2.64) 3.55 2,828,786 1.91 1.14 Jefferson, PA 6 1 49,179 5.79 (2.82) 6.94 849,444 (4.10) (0.90) Knox, OH 6 1 42,123 4.99 12.74 3.20 843,859 11.49 4.45 Morrow, OH 4 1 34,097 16.57 9.58 2.09 205,798 2.56 0.09 Richland, OH 12 1 18,037 1.01 48.91 17.62 1,789,437 4.33 1.61 Holmes, OH 8 1 6,455 0.82 34.79—791,563 4.10 6.04 Indiana, PA 9 1 3,934 0.16 48.40—2,398,759 (2.08) 2.88 Total 40 1,995,537 2.60 0.52 6.07 76,802,374 7.55 5.50 Source: SNL Financial. Deposit market share as of June 30, 2015. Pro forma to include Lake National Bank 23
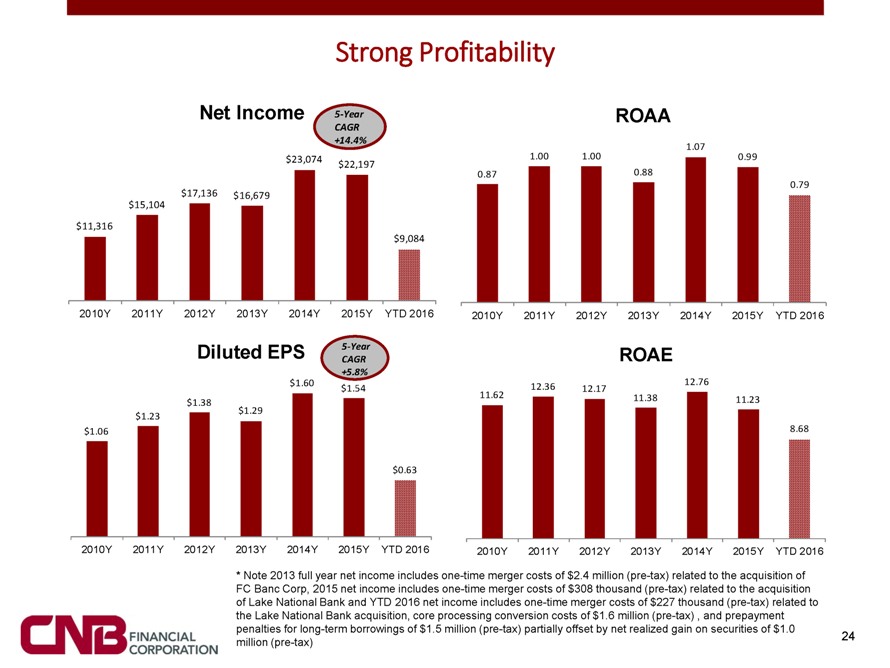
Strong Profitability 0 0 0 Net Income 5-Year ROAA CAGR +14.4% 1.07 $23,074 1.00 1.00 0.99 $22,197 0.87 0.88 0.79 $17,136 $16,679 $15,104 $11,316 $9,084 2010Y 2011Y 2012Y 2013Y 2014Y 2015Y YTD 2016 2010Y 2011Y 2012Y 2013Y 2014Y 2015Y YTD 2016 0 0 0 0 0 Diluted EPS 5-Year ROAE CAGR +5.8% 12.76 $1.60 12.36 $1.54 12.17 11.62 11.38 11.23 $1.38 $1.29 $1.23 $1.06 8.68 $0.63 2010Y 2011Y 2012Y 2013Y 2014Y 2015Y YTD 2016 2010Y 2011Y 2012Y 2013Y 2014Y 2015Y YTD 2016 0 0 * Note 2013 full year net income includes one-time merger costs of $2.4 million (pre-tax) related to the acquisition of FC Banc Corp, 2015 net income includes one-time merger costs of $308 thousand (pre-tax) related to the acquisition of Lake National Bank and YTD 2016 net income includes one-time merger costs of $227 thousand (pre-tax) related to the Lake National Bank acquisition, core processing conversion costs of $1.6 million (pre-tax) , and prepayment penalties for long-term borrowings of $1.5 million (pre-tax) partially offset by net realized gain on securities of $1.0 24 million (pre-tax)
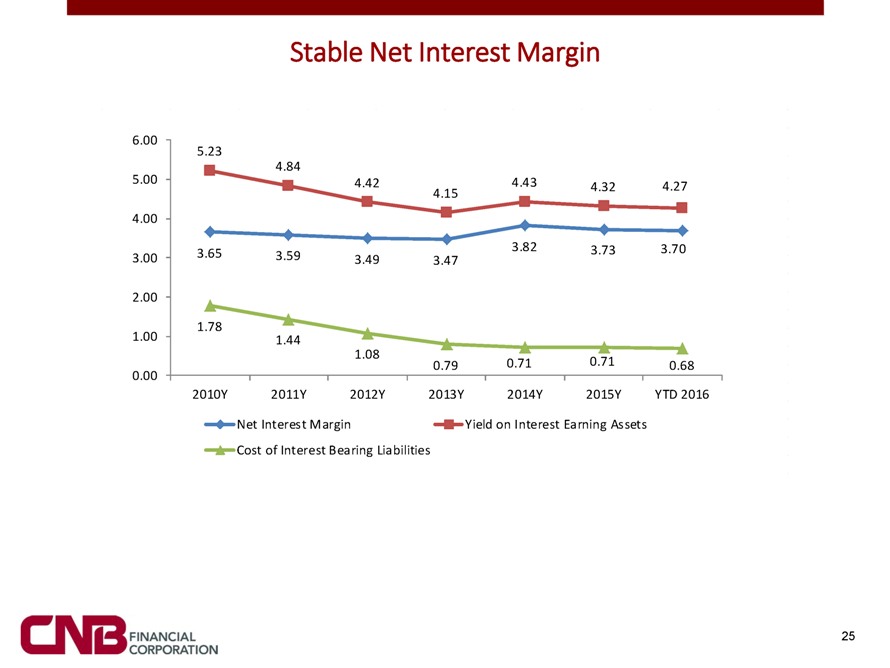
Stable Net Interest Margin 6.00 5.23 5.00 4.84 4.42 4.43 4.32 4.27 4.15 4.00 3.65 3.82 3.73 3.70 3.00 3.59 3.49 3.47 2.00 1.78 1.00 1.44 1.08 0.79 0.71 0.71 0.68 0.00 2010Y 2011Y 2012Y 2013Y 2014Y 2015Y YTD 2016 Net Interest Margin Yield on Interest Earning Assets Cost of Interest Bearing Liabilities 25
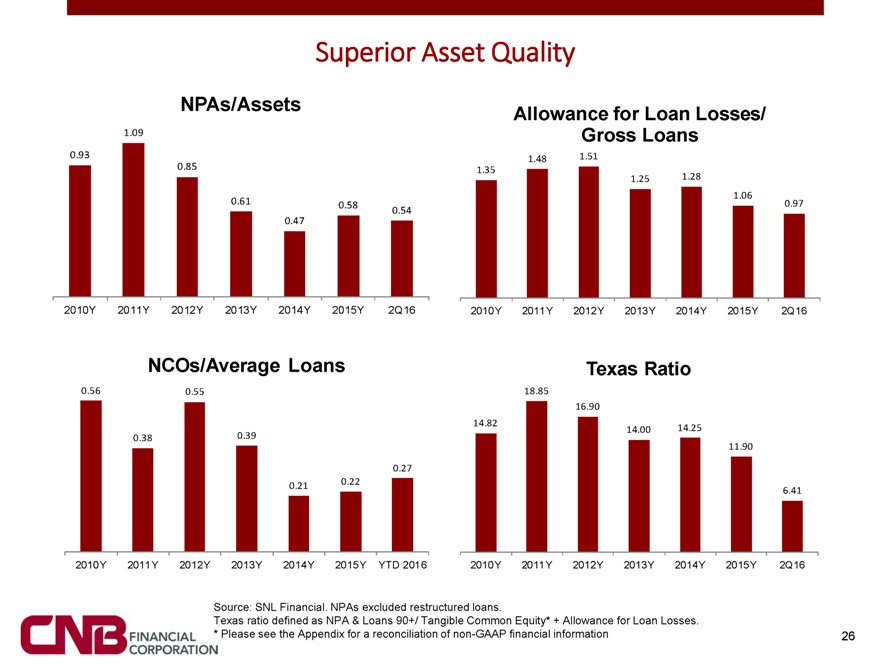
Superior Asset Quality 0 0 0 0 NPAs/Assets Allowance for Loan Losses/ 1.09 Gross Loans 0.93 1.48 1.51 0.85 1.35 1.28 1.25 1.06 0.61 0.58 0.97 0.47 0.54 2010Y 2011Y 2012Y 2013Y 2014Y 2015Y 2Q16 2010Y 2011Y 2012Y 2013Y 2014Y 2015Y 2Q16 0 0 0 0 NCOs/Average Loans Texas Ratio 0.56 0.55 18.85 16.90 14.82 14.25 14.00 0.38 0.39 11.90 0.27 0.21 0.22 6.41 2010Y 2011Y 2012Y 2013Y 2014Y 2015Y YTD 2016 2010Y 2011Y 2012Y 2013Y 2014Y 2015Y 2Q16 0 Source: SNL Financial. NPAs excluded restructured loans. Texas ratio defined as NPA & Loans 90+/ Tangible Common Equity* + Allowance for Loan Losses. * Please see the Appendix for a reconciliation of non-GAAP financial information 26
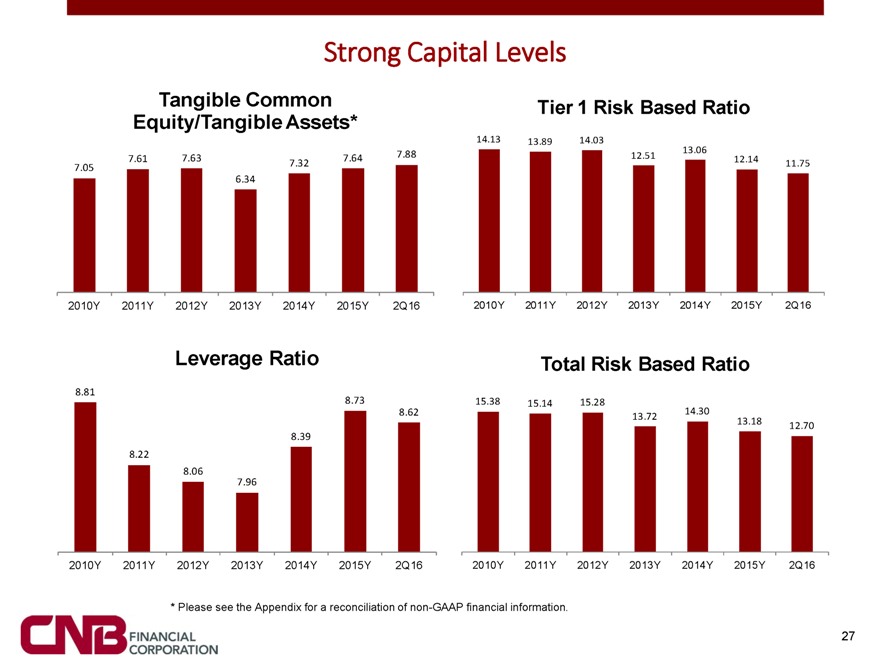
Strong Capital Levels 0 0 0 0 Tangible Common Tier 1 Risk Based Ratio Equity/Tangible Assets* 14.13 13.89 14.03 7.88 13.06 7.61 7.63 7.64 12.51 12.14 7.05 7.32 11.75 6.34 2010Y 2011Y 2012Y 2013Y 2014Y 2015Y 2Q16 2010Y 2011Y 2012Y 2013Y 2014Y 2015Y 2Q16 0 0 0 0 0 Leverage Ratio Total Risk Based Ratio 8.81 8.73 15.38 15.14 15.28 14.30 8.62 13.72 13.18 12.70 8.39 8.22 8.06 7.96 2010Y 2011Y 2012Y 2013Y 2014Y 2015Y 2Q16 2010Y 2011Y 2012Y 2013Y 2014Y 2015Y 2Q16 0 * Please see the Appendix for a reconciliation of non-GAAP financial information. 27
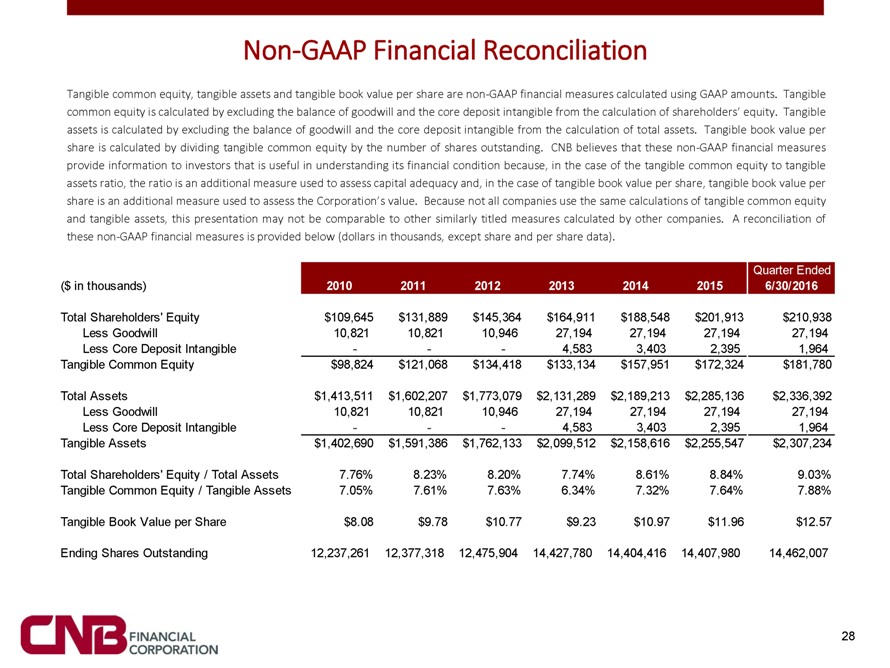
Non-GAAP Financial Reconciliation Tangible common equity, tangible assets and tangible book value per share are non-GAAP financial measures calculated using GAAP amounts. Tangible common equity is calculated by excluding the balance of goodwill and the core deposit intangible from the calculation of shareholders’ equity. Tangible assets is calculated by excluding the balance of goodwill and the core deposit intangible from the calculation of total assets. Tangible book value per share is calculated by dividing tangible common equity by the number of shares outstanding. CNB believes that these non-GAAP financial measures provide information to investors that is useful in understanding its financial condition because, in the case of the tangible common equity to tangible assets ratio, the ratio is an additional measure used to assess capital adequacy and, in the case of tangible book value per share, tangible book value per share is an additional measure used to assess the Corporation’s value. Because not all companies use the same calculations of tangible common equity and tangible assets, this presentation may not be comparable to other similarly titled measures calculated by other companies. A reconciliation of these non-GAAP financial measures is provided below (dollars in thousands, except share and per share data). Quarter Ended ($ in thousands) 2010 2011 2012 2013 2014 2015 6/30/2016 Total Shareholders’ Equity $109,645 $131,889 $145,364 $164,911 $188,548 $201,913 $210,938 Less Goodwill 10,821 10,821 10,946 27,194 27,194 27,194 27,194 Less Core Deposit Intangible ——4,583 3,403 2,395 1,964 Tangible Common Equity $98,824 $121,068 $134,418 $133,134 $157,951 $172,324 $181,780 Total Assets $1,413,511 $1,602,207 $1,773,079 $2,131,289 $2,189,213 $2,285,136 $2,336,392 Less Goodwill 10,821 10,821 10,946 27,194 27,194 27,194 27,194 Less Core Deposit Intangible ——4,583 3,403 2,395 1,964 Tangible Assets $1,402,690 $1,591,386 $1,762,133 $2,099,512 $2,158,616 $2,255,547 $2,307,234 Total Shareholders’ Equity / Total Assets 7.76% 8.23% 8.20% 7.74% 8.61% 8.84% 9.03% Tangible Common Equity / Tangible Assets 7.05% 7.61% 7.63% 6.34% 7.32% 7.64% 7.88% Tangible Book Value per Share $8.08 $9.78 $10.77 $9.23 $10.97 $11.96 $12.57 Ending Shares Outstanding 12,237,261 12,377,318 12,475,904 14,427,780 14,404,416 14,407,980 14,462,007 28
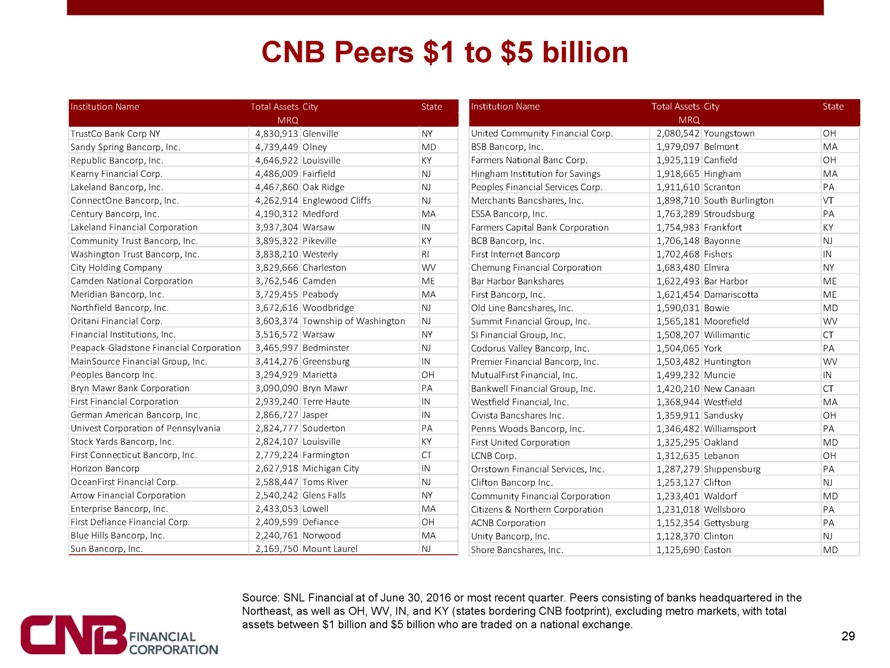
CNB Peers $1 to $5 billion Institution Name Total Assets City State Institution Name Total Assets City State MRQ MRQ TrustCo Bank Corp NY 4,830,913 Glenville NY United Community Financial Corp. 2,080,542 Youngstown OH Sandy Spring Bancorp, Inc. 4,739,449 Olney MD BSB Bancorp, Inc. 1,979,097 Belmont MA Republic Bancorp, Inc. 4,646,922 Louisville KY Farmers National Banc Corp. 1,925,119 Canfield OH Kearny Financial Corp. 4,486,009 Fairfield NJ Hingham Institution for Savings 1,918,665 Hingham MA Lakeland Bancorp, Inc. 4,467,860 Oak Ridge NJ Peoples Financial Services Corp. 1,911,610 Scranton PA ConnectOne Bancorp, Inc. 4,262,914 Englewood Cliffs NJ Merchants Bancshares, Inc. 1,898,710 South Burlington VT Century Bancorp, Inc. 4,190,312 Medford MA ESSA Bancorp, Inc. 1,763,289 Stroudsburg PA Lakeland Financial Corporation 3,937,304 Warsaw IN Farmers Capital Bank Corporation 1,754,983 Frankfort KY Community Trust Bancorp, Inc. 3,895,322 Pikeville KY BCB Bancorp, Inc. 1,706,148 Bayonne NJ Washington Trust Bancorp, Inc. 3,838,210 Westerly RI First Internet Bancorp 1,702,468 Fishers IN City Holding Company 3,829,666 Charleston WV Chemung Financial Corporation 1,683,480 Elmira NY Camden National Corporation 3,762,546 Camden ME Bar Harbor Bankshares 1,622,493 Bar Harbor ME Meridian Bancorp, Inc. 3,729,455 Peabody MA First Bancorp, Inc. 1,621,454 Damariscotta ME Northfield Bancorp, Inc. 3,672,616 Woodbridge NJ Old Line Bancshares, Inc. 1,590,031 Bowie MD Oritani Financial Corp. 3,603,374 Township of Washington NJ Summit Financial Group, Inc. 1,565,181 Moorefield WV Financial Institutions, Inc. 3,516,572 Warsaw NY SI Financial Group, Inc. 1,508,207 Willimantic CT Peapack-Gladstone Financial Corporation 3,465,997 Bedminster NJ Codorus Valley Bancorp, Inc. 1,504,065 York PA MainSource Financial Group, Inc. 3,414,276 Greensburg IN Premier Financial Bancorp, Inc. 1,503,482 Huntington WV Peoples Bancorp Inc. 3,294,929 Marietta OH MutualFirst Financial, Inc. 1,499,232 Muncie IN Bryn Mawr Bank Corporation 3,090,090 Bryn Mawr PA Bankwell Financial Group, Inc. 1,420,210 New Canaan CT First Financial Corporation 2,939,240 Terre Haute IN Westfield Financial, Inc. 1,368,944 Westfield MA German American Bancorp, Inc. 2,866,727 Jasper IN Civista Bancshares Inc. 1,359,911 Sandusky OH Univest Corporation of Pennsylvania 2,824,777 Souderton PA Penns Woods Bancorp, Inc. 1,346,482 Williamsport PA Stock Yards Bancorp, Inc. 2,824,107 Louisville KY First United Corporation 1,325,295 Oakland MD First Connecticut Bancorp, Inc. 2,779,224 Farmington CT LCNB Corp. 1,312,635 Lebanon OH Horizon Bancorp 2,627,918 Michigan City IN Orrstown Financial Services, Inc. 1,287,279 Shippensburg PA OceanFirst Financial Corp. 2,588,447 Toms River NJ Clifton Bancorp Inc. 1,253,127 Clifton NJ Arrow Financial Corporation 2,540,242 Glens Falls NY Community Financial Corporation 1,233,401 Waldorf MD Enterprise Bancorp, Inc. 2,433,053 Lowell MA Citizens & Northern Corporation 1,231,018 Wellsboro PA First Defiance Financial Corp. 2,409,599 Defiance OH ACNB Corporation 1,152,354 Gettysburg PA Blue Hills Bancorp, Inc. 2,240,761 Norwood MA Unity Bancorp, Inc. 1,128,370 Clinton NJ Sun Bancorp, Inc. 2,169,750 Mount Laurel NJ Shore Bancshares, Inc. 1,125,690 Easton MD Source: SNL Financial at of June 30, 2016 or most recent quarter. Peers consisting of banks headquartered in the Northeast, as well as OH, WV, IN, and KY (states bordering CNB footprint), excluding metro markets, with total assets between $1 billion and $5 billion who are traded on a national exchange. 29