Attached files
| file | filename |
|---|---|
| EX-99.1 - EX-99.1 - CNB FINANCIAL CORP/PA | d506004dex991.htm |
| EX-23.1 - EX-23.1 - CNB FINANCIAL CORP/PA | d506004dex231.htm |
| EX-32.2 - EX-32.2 - CNB FINANCIAL CORP/PA | d506004dex322.htm |
| EX-32.1 - EX-32.1 - CNB FINANCIAL CORP/PA | d506004dex321.htm |
| EX-31.2 - EX-31.2 - CNB FINANCIAL CORP/PA | d506004dex312.htm |
| EX-31.1 - EX-31.1 - CNB FINANCIAL CORP/PA | d506004dex311.htm |
| EX-21 - EX-21 - CNB FINANCIAL CORP/PA | d506004dex21.htm |
Table of Contents
UNITED STATES
SECURITIES AND EXCHANGE COMMISSION
Washington, D.C. 20549
F O R M 1 0 – K
ANNUAL REPORT PURSUANT TO SECTION 13 OR 15(d) OF
THE SECURITIES EXCHANGE ACT OF 1934
| For the fiscal year ended December 31, 2017 |
Commission File Number 0-13396 |
CNB FINANCIAL CORPORATION
(Exact name of registrant as specified in its charter)
| Pennsylvania | 25-1450605 | |||
| (State or other jurisdiction of | (I.R.S. Employer Identification No.) | |||
| incorporation or organization) |
1 South Second Street
P.O. Box 42
Clearfield, Pennsylvania 16830
(Address of principal executive office)
Registrant’s telephone number, including area code (814) 765-9621
Securities registered pursuant to Section 12(b) of the Act:
| Title of each class |
Name of each exchange on which registered | |
| Common Stock, no par value per share |
The NASDAQ Stock Market LLC | |
| (NASDAQ Global Select Market) |
Securities registered pursuant to Section 12 (g) of the Act:
None
Indicate by check mark if the registrant is a well-known seasoned issuer, as defined in Rule 405 of the Securities Act.
☐ Yes ☒ No
Indicate by check mark if the registrant is not required to file reports pursuant to Section 13 or Section 15(d) of the Act.
☐ Yes ☒ No
Indicate by check mark whether the registrant (1) has filed all reports required to be filed by Section 13 or 15(d) of the Securities Exchange Act of 1934 during the preceding 12 months (or for such shorter period that the registrant was required to file such reports), and (2) has been subject to such filing requirements for the past 90 days. ☒ Yes ☐ No
Indicate by check mark whether the registrant has submitted electronically and posted on its corporate Web site, if any, every Interactive Data File required to be submitted and posted pursuant to Rule 405 of Regulation S-T during the preceding 12 months (or for such shorter period that the registrant was required to submit and post such files). ☒ Yes ☐ No
Indicate by check mark if disclosure of delinquent filers pursuant to Item 405 of Regulation S-K is not contained herein, and will not be contained, to the best of registrant’s knowledge, in definitive proxy or information statements incorporated by reference in Part III of this Form 10-K or any amendment to this Form 10-K. ☒
Indicate by check mark whether the registrant is a large accelerated filer, an accelerated filer, a non-accelerated filer, a smaller reporting company, or an emerging growth company. See the definitions of “large accelerated filer,” “accelerated filer”, “smaller reporting company”, and “emerging growth company” in Rule 12b-2 of the Exchange Act. (Check one):
| Large accelerated filer ☐ | Accelerated filer ☒ | Non-accelerated filer ☐ | Smaller reporting company ☐ |
| Emerging growth company ☐ |
If an emerging growth company, indicate by check mark if the registrant has elected not to use the extended transition period for complying with any new or revised financial accounting standards provided pursuant to Section 13(a) of the Exchange Act. ☐
Indicate by check mark whether the registrant is a shell company (as defined in Rule 12b-2 of the Act). ☐ Yes ☒ No
Aggregate market value of the common stock held by nonaffiliates of the registrant as of June 30, 2017:
$344,353,260
The number of shares outstanding of the registrant’s common stock as of March 5, 2018:
15,284,339 shares
DOCUMENTS INCORPORATED BY REFERENCE
Portions of the proxy statement for the annual shareholders’ meeting to be held on April 17, 2018 are incorporated by reference into Part III.
Table of Contents
Table of Contents
PART I.
CNB Financial Corporation (the “Corporation”) is a financial holding company registered under the Bank Holding Company Act of 1956, as amended (the “BHC Act”). It was incorporated under the laws of the Commonwealth of Pennsylvania in 1983 for the purpose of engaging in the business of a financial holding company. On April 26, 1984, the Corporation acquired all of the outstanding capital stock of County National Bank, a national banking chartered institution. In December 2006, County National Bank changed its name to CNB Bank, referred to herein as the Bank, and became a state bank chartered in Pennsylvania and subject to regulation by the Pennsylvania Department of Banking and the Federal Deposit Insurance Corporation. In October 2013, the Corporation acquired FC Banc Corp. and its subsidiary, The Farmers Citizens Bank. In July 2016, the Corporation acquired Lake National Bank.
In addition to the Bank, the Corporation has three other subsidiaries. CNB Securities Corporation is incorporated in Delaware and currently maintains investments in debt and equity securities. CNB Insurance Agency, incorporated in Pennsylvania, provides for the sale of nonproprietary annuities and other insurance products. Holiday Financial Services Corporation, incorporated in Pennsylvania, offers small balance unsecured loans and secured loans, primarily collateralized by automobiles and equipment, to borrowers with higher risk characteristics.
CNB Bank
CNB Bank (the “Bank”) was originally chartered as a national bank in 1934 and is now a a Pennsylvania-chartered bank. In February 2017, the Bank completed construction of a full service branch location in Duncansville, Pennsylvania and concurrently closed its loan production office in Hollidaysburg, Pennsylvania. The full service branch is being operated as part of the CNB Bank franchise.
ERIEBANK, a division of CNB Bank, began operations in 2005. In July 2016, the Corporation acquired Lake National Bank, which operated two full service branches in Mentor, Ohio, approximately 20 miles east of Cleveland, Ohio. The Bank is continuing to operate these 2 branch locations within its ERIEBANK franchise. In February 2017, the Corporation completed construction of a full service branch location in Ashtabula, Ohio, which is also operating within the ERIEBANK franchise.
In October 2013, the Corporation acquired FC Banc Corp. and its subsidiary, Farmers Citizens Bank. In 2017, the Bank sold its Mount Hope branch of FCBank to First Federal Community Bank of Dover, Ohio. The Bank currently operates seven branch locations and one loan production office as FCBank, a division of CNB Bank, with its headquarters in Worthington, Ohio.
In 2016, the Bank received regulatory approval to conduct business in the state of New York as BankOnBuffalo, a division of CNB Bank. The Bank opened a loan production office in Buffalo, New York in May 2016, which was closed in February 2017 with the concurrent opening of a full service location in downtown Buffalo in February 2017. Full service locations in Williamsville, New York and Orchard Park, New York were opened in the fourth quarter of 2017.
The Bank has 41 full service branch offices and one loan production offices located in various communities in its market area. CNB Bank’s primary market area includes the Pennsylvania counties
1
Table of Contents
of Blair, Cambria, Cameron, Centre, Clearfield, Crawford, Elk, Indiana, Jefferson, and McKean. As ERIEBANK, a division of CNB Bank, the Bank operates in the Pennsylvania counties of Crawford, Erie, and Warren and the Ohio counties of Ashtabula and Lake. As FCBank, a division of CNB Bank, the Bank operates in the Ohio counties of Crawford, Richland, Ashland, Wayne, Marion, Morrow, Knox, Delaware, and Franklin. As BankOnBuffalo, a division of CNB Bank, the Bank operates in Erie and Niagara counties, New York.
The Bank is a full service bank engaging in a full range of banking activities and services for individual, business, governmental and institutional customers. These activities and services principally include checking, savings, and time deposit accounts; real estate, commercial, industrial, residential and consumer loans; and a variety of other specialized financial services. The Bank’s Private Client Solutions division offers a full range of client services, including private banking and wealth and asset management.
Holiday Financial Services Corporation
In 2005, the Corporation entered the consumer discount loan and finance business, which is conducted through a wholly owned subsidiary, Holiday Financial Services Corporation. Holiday currently has ten offices within the Corporation’s footprint.
Competition
The financial services industry in the Corporation’s service area continues to be extremely competitive, both among commercial banks and with other financial service providers such as consumer finance companies, thrifts, investment firms, mutual funds and credit unions. The increased competition has resulted from changes in the legal and regulatory guidelines as well as from economic conditions. Mortgage banking firms, leasing companies, financial affiliates of industrial companies, brokerage firms, retirement fund management firms, and even government agencies provide additional competition for loans and other financial services. Some of the financial service providers operating in the Corporation’s market area operate on a large-scale regional or national basis and possess resources greater than those of the Corporation. The Corporation is generally competitive with all competing financial institutions in its service area with respect to interest rates paid on time and savings deposits, service charges on deposit accounts and interest rates charged on loans.
Supervision and Regulation
The Corporation is a bank holding company that has elected financial holding company status, and the Bank is a Pennsylvania state-chartered bank that is not a member of the Federal Reserve System. Accordingly, the Corporation is subject to the oversight of the Board of Governors of the Federal Reserve System (Federal Reserve Board) and the Pennsylvania Department of Banking and is regulated under the Bank Holding Company Act of 1956, as amended (the “BHC Act”), and the Bank is subject to the oversight of the Pennsylvania Department of Banking and Federal Deposit Insurance Corporation (“FDIC”), as its primary federal regulator. The Corporation and Bank are also subject to various requirements and restrictions under federal and state law, such as requirements to maintain reserves against deposits, restrictions on the types, amounts and terms and conditions of loans that may be granted, and limitations on the types of investments that may be made and the types of services that may be offered. Various consumer financial protection laws and regulations also affect the operation of the Bank and, pursuant to the Dodd-Frank Wall Street Reform and Consumer Protection Act (the
2
Table of Contents
“Dodd-Frank Act”), the Consumer Financial Protection Bureau (“CFPB”) is authorized to write rules on consumer financial products and services which could affect the operations of the Bank and Holiday Financial Services Corporation. In addition to the impact of regulation, commercial banks are significantly affected by the actions of the Federal Reserve Board, including actions taken with respect to interest rates, as the Federal Reserve Board attempts to control the money supply and credit availability in the U.S. in order to influence the economy.
The following summary sets forth certain of the material elements of the regulatory framework applicable to bank holding companies and their subsidiaries and provides certain specific information about us and our subsidiaries. It does not describe all of the provisions of the statutes, regulations and policies that are identified. To the extent that the following information describes statutory and regulatory provisions, it is qualified in its entirety by express reference to each of the particular statutory and regulatory provisions. A change in applicable statutes, regulations or regulatory policy may have a material effect on our business.
Bank Holding Company Regulation
As a bank holding company that controls a Pennsylvania state-chartered bank, the Corporation is subject to regulation and examination by the Pennsylvania Department of Banking and the Federal Reserve Board. We are required to file with the Federal Reserve Board an annual report and such additional information as the Federal Reserve Board may require pursuant to the BHC Act, and applicable regulations. For instance, the BHC Act requires each bank holding company to obtain the approval of the Federal Reserve Board before it may acquire substantially all the assets of any bank, or before it may acquire ownership or control of any voting shares of any bank if, after such acquisition, it would own or control, directly or indirectly, more than five percent of any class of voting shares of such bank. Such a transaction may also require approval of the Pennsylvania Department of Banking.
Pursuant to provisions of the BHC Act and regulations promulgated by the Federal Reserve Board thereunder, the Corporation may only engage in, or own companies that engage in, activities deemed by the Federal Reserve Board to be permissible for bank holding companies or financial holding companies. Activities permissible for bank holding companies are those that are so closely related to the business of banking or managing or controlling banks as to be a proper incident thereto. Permissible activities for financial holding companies include those “so closely related to banking as to be a proper incident thereto” as well as certain additional activities deemed “financial in nature or incidental to such financial activity” or complementary to a financial activity and that does not pose a substantial risk to the safety and soundness of the depository institution or the financial system. The Corporation must obtain permission from or provide notice to the Federal Reserve Board prior to engaging in most new business activities.
Regulation of CNB Bank
CNB Bank is a Pennsylvania-chartered bank and is subject to regulation, supervision and regular examination by the Pennsylvania Department of Banking and the FDIC, as its primary federal regulator. Federal and state banking laws and regulations govern, among other things, the scope of a bank’s business, the investments a bank may make, the reserves against deposits a bank must maintain, the loans a bank makes and collateral it takes, the activities of a bank with respect to mergers and acquisitions, the establishment of branches, management practices, and numerous other aspects of banking operations.
3
Table of Contents
Source of Strength Doctrine
Under Section 616 of the Dodd-Frank Act, a bank holding company is required to serve as a source of financial strength to its subsidiary banks and may not conduct its operations in an unsafe or unsound manner. In addition, it is the Federal Reserve Board’s policy that in serving as a source of financial and managerial strength to its subsidiary banks, a bank holding company should stand ready to use available resources to provide adequate capital funds to its subsidiary banks during periods of financial stress or adversity and should maintain the financial flexibility and capital-raising capacity to obtain additional resources for assisting its subsidiary banks. A bank holding company’s failure to meet its obligations to serve as a source of strength to its subsidiary banks will generally be considered by the Federal Reserve Board to be an unsafe and unsound banking practice or a violation of the Federal Reserve Board regulations or both. This doctrine is commonly known as the “source of strength” doctrine.
Identity Theft
The Securities and Exchange Commission and the Commodity Futures Trading Commission (together, the “Commissions”) jointly issued final rules and guidelines to require certain regulated entities to establish programs to address risks of identity theft. The rules and guidelines implement provisions of the Dodd-Frank Act. These provisions amend Section 615(e) of the Fair Credit Reporting Act and directed the Commissions to adopt rules requiring entities that are subject to the Commissions’ jurisdiction to address identity theft in two ways. First, the rules require financial institutions and creditors to develop and implement a written identity theft prevention program that is designed to detect, prevent, and mitigate identity theft in connection with certain existing accounts or the opening of new accounts. The rules include guidelines to assist entities in the formulation and maintenance of programs that would satisfy the requirements of the rules. Second, the rules establish special requirements for any credit and debit card issuers that are subject to the Commissions’ jurisdiction, to assess the validity of notifications of changes of address under certain circumstances.
Capital Adequacy
The Capital Rules of the Federal Reserve Board, the FDIC, and the Office of the Comptroller of the Currency, generally implement the Basel Committee on Banking Supervision’s capital framework, referred to as Basel III, for strengthening international capital standards. The Capital Rules revise the definitions and components of regulatory capital, increase risk-based capital requirements, and make selected changes to the calculation of risk-weighted assets.
The Capital Rules, among other things:
| • | revise minimum capital requirements and adjust prompt corrective action thresholds; |
| • | revise the components of regulatory capital, add a new minimum common equity Tier 1 capital ratio of 4.5% of risk-weighted assets, increase the minimum Tier 1 capital ratio requirement from 4% to 6%; |
| • | retain the existing risk-based capital treatment for 1-4 family residential mortgage exposures; |
| • | permit most banking organizations to retain, through a one-time permanent election, the existing capital treatment for accumulated other comprehensive income; |
| • | implement the capital conservation buffer beginning January 1, 2016 at the 0.625% level and will increase by 0.625% on each subsequent January 1, until it reaches 2.5% on January 1, |
4
Table of Contents
| 2019. The risk-weighting categories in the Capital Rules are standardized and include a risk-sensitive number of categories, depending on the nature of the assets, generally ranging from 0% for U.S. government and agency securities, to 600% for certain equity exposures, and resulting in higher risk weights for a variety of assets. |
| • | require a minimum leverage ratio of 4%; |
| • | require a total capital ratio of 8%; |
| • | increase capital requirements for past-due loans, high volatility commercial real estate exposures, and certain short-term loan commitments; |
| • | require the deduction of mortgage servicing assets and deferred tax assets that exceed 10% of common equity Tier 1 capital in each category and 15% of common equity Tier 1 capital in the aggregate; and |
| • | remove references to credit ratings consistent with the Dodd-Frank Act and establish due diligence requirements for securitization exposures. |
Compliance with the Capital Rules was required beginning January 1, 2015, for most banking organizations including the Corporation, subject to a transition period for several aspects of the final rules, including the new minimum capital ratio requirements, the capital conservation buffer, and the regulatory capital adjustments and deductions. The Corporation implemented the Capital Rules on January 1, 2015, and continues to exceed all estimated well-capitalized regulatory requirements on a fully phased-in basis.
In November 2017, the FRB finalized a rule extending the currently applicable capital rules for non-advanced approaches institutions, including the treatment of mortgage servicing assets. This rule is in effect pending the comment period and review of the general proposal to simplify the Capital Rules for non-advanced approaches institutions.
Dividend Restrictions
The Corporation is a legal entity separate and distinct from the Bank. Declaration and payment of cash dividends depends upon cash dividend payments to the Corporation by the Bank, which is our primary source of revenue and cash flow. Accordingly, the right of the Corporation, and consequently the right of our creditors and shareholders, to participate in any distribution of the assets or earnings of any subsidiary is necessarily subject to the prior claims of creditors of the Bank, except to the extent that claims of the Corporation in its capacity as a creditor may be recognized.
As a Pennsylvania state-chartered bank, the Bank is subject to regulatory restrictions on the payment and amounts of dividends under the Pennsylvania Banking Code. Further, the ability of banking subsidiaries to pay dividends is also subject to their profitability, financial condition, capital expenditures and other cash flow requirements.
The payment of dividends by the Bank and the Corporation may also be affected by other factors, such as the requirement to maintain adequate capital above regulatory requirements. The federal banking agencies have indicated that paying dividends that deplete a depository institution’s capital base to an inadequate level would be an unsafe and unsound banking practice. A depository institution may not pay any dividend if payment would cause it to become undercapitalized or if it already is undercapitalized. Moreover, the federal banking agencies have issued policy statements that provide
5
Table of Contents
that bank holding companies and insured banks should generally only pay dividends out of current operating earnings. Federal banking regulators have the authority to prohibit banks and bank holding companies from paying a dividend if the regulators deem such payment to be an unsafe or unsound practice.
Prompt Corrective Action and Safety and Soundness
Under applicable “prompt corrective action” (“PCA”) statutes and regulations, depository institutions are placed into one of five capital categories, ranging from “well capitalized” to “critically undercapitalized.” The PCA statute and regulations provide for progressively more stringent supervisory measures as an insured depository institution’s capital category declines. An institution that is not well capitalized is generally prohibited from accepting brokered deposits and offering interest rates on deposits higher than the prevailing rate in its market. An undercapitalized depository institution must submit an acceptable restoration plan to the appropriate federal banking agency. One requisite element of such a plan is that the institution’s parent holding company must guarantee compliance by the institution with the plan, subject to certain limitations.
At December 31, 2017, the Bank qualified as “well capitalized” under applicable regulatory capital standards.
Bank holding companies and insured depository institutions may also be subject to potential enforcement actions of varying levels of severity by the federal banking agencies for unsafe or unsound practices in conducting their business, or for violation of any law, rule, regulation, condition imposed in writing by the agency or term of a written agreement with the agency. In more serious cases, enforcement actions may include the issuance of directives to increase capital; the issuance of formal and informal agreements; the imposition of civil monetary penalties; the issuance of a cease and desist order that can be judicially enforced; the issuance of removal and prohibition orders against officers, directors, and other institution affiliated parties; the termination of the insured depository institution’s deposit insurance; the appointment of a conservator or receiver for the insured depository institution; and the enforcement of such actions through injunctions or restraining orders based upon a judicial determination that the FDIC, as receiver, would be harmed if such equitable relief was not granted.
Community Reinvestment Act
Under the Community Reinvestment Act of 1977 (“CRA”), the FDIC is required to assess the record of all financial institutions it supervises to determine if these institutions are meeting the credit needs of the community (including low and moderate income neighborhoods) which they serve. CRA performance evaluations are based on a four-tiered rating system: Outstanding, Satisfactory, Needs to Improve and Substantial Noncompliance. CRA performance evaluations are considered in evaluating applications for such things as mergers, acquisitions and applications to open branches. The Bank received a CRA rating of “Satisfactory” at its most recent CRA exam.
Restrictions on Transactions with Affiliates and Insiders
The Bank and Corporation are subject to the restrictions of Sections 23A and 23B of the Federal Reserve Act and their implementing Regulation W. Section 23A requires that loans or extensions of credit by the Bank to an affiliate, purchases by the Bank of securities issued by an affiliate, purchases by the Bank of assets from an affiliate (except as may be exempted by order or regulation), the Bank’s
6
Table of Contents
acceptance of securities issued by an affiliate as collateral and the Bank’s acceptance of a guarantee, the Bank’s acceptance of letters of credit on behalf of an affiliate (collectively, “Covered Transactions”) be on terms and conditions consistent with safe and sound banking practices. Section 23A also imposes quantitative restrictions on the amount of and collateralization requirements on such transactions. Section 23B requires that all Covered Transactions and certain other transactions, including the sale of securities or other assets by the Bank to an affiliate and the payment of money or the furnishing of services by the Bank to an affiliate, be on terms comparable to those prevailing for similar transactions with nonaffiliates.
The Bank is also subject to Sections 22(g) and 22(h) of the Federal Reserve Act, and their implementing Regulation O issued by the Federal Reserve Board. These provisions impose limitations on loans and extensions of credit by the Bank to its executive officers, directors and principal shareholders and their related interests as well as to the Corporation and any subsidiary of the Corporation. The limitations restrict the terms and aggregate amount of such transactions. Regulation O also imposes certain recordkeeping and reporting requirements.
Deposit Insurance and Premiums
The deposits of the Bank are insured up to applicable limits per insured depositor by the FDIC. The standard maximum deposit insurance amount is $250,000 per depositor per insured depository institution.
The FDIC uses a risk-based assessment system that imposes insurance premiums based on a risk matrix that takes into account the bank’s capital level and supervisory rating. The base for insurance assessments is the average consolidated total assets less tangible equity capital of a financial institution. Assessment rates are calculated using formulas that take into account the risk of the institution being assessed. FDIC deposit insurance expense also includes deposit insurance assessments and FICO assessments related to outstanding FICO bonds.
Financial Privacy and Data Security
The Corporation is subject to federal laws, including the Gramm-Leach-Bliley Act and certain state laws containing consumer privacy protection provisions. These provisions limit the ability of banks and other financial institutions to disclose nonpublic information about consumers to affiliated and non-affiliated third parties and limit the reuse of certain consumer information received from non-affiliated financial institutions. These provisions require notice of privacy policies to consumers and, in some circumstances, allow consumers to prevent disclosure of certain nonpublic personal information to affiliates or non-affiliated third parties by means of opt-out or opt-in authorizations.
The Gramm-Leach-Bliley Act requires that financial institutions implement comprehensive written information security programs that include administrative, technical, and physical safeguards to protect consumer information. Federal banking agencies have also adopted guidelines for establishing information security standards and programs to protect such information. Further, pursuant to interpretive guidance issued under the Gramm-Leach-Bliley Act and certain state laws, financial institutions are required to notify customers of security breaches that result in unauthorized access to their nonpublic personal information.
7
Table of Contents
Incentive Compensation
The Dodd-Frank Act requires the federal banking agencies and the SEC to establish joint regulations or guidelines prohibiting incentive-based payment arrangements at specified regulated entities, including the Corporation and the Bank, with at least $1 billion in total consolidated assets that encourage inappropriate risks by providing an executive officer, employee, director or principal shareholder with excessive compensation, fees, or benefits that could lead to material financial loss to the entity. The federal banking agencies and the SEC most recently proposed such regulations in 2016, but the regulations have not yet been finalized. If the regulations are adopted in the form initially proposed, they will restrict the manner in which executive compensation is structured.
The Dodd-Frank Act also requires publicly traded companies to give stockholders a non-binding vote on executive compensation at their first annual meeting taking place six months after the date of enactment and at least every three years thereafter and on so-called “golden parachute” payments in connection with approvals of mergers and acquisitions.
USA PATRIOT Act
Under Title III of the USA PATRIOT Act, all financial institutions are required to take certain measures to identify their customers, prevent money laundering, monitor customer transactions, and report suspicious activity to U.S. law enforcement agencies. Financial institutions also are required to respond to requests for information from federal banking agencies and law enforcement agencies. Information sharing among financial institutions for the above purposes is encouraged by an exemption granted to complying financial institutions from the privacy provisions of the Gramm-Leach-Bliley Act and other privacy laws. Financial institutions that hold correspondent accounts for foreign banks or provide private banking services to foreign individuals are required to take measures to avoid dealing with certain foreign individuals or entities, including foreign banks with profiles that raise money laundering concerns, and are prohibited from dealing with foreign “shell banks” and persons from jurisdictions of particular concern. The primary federal banking agencies and the Secretary of the Treasury have adopted regulations to implement several of these provisions. All financial institutions also are required to establish internal anti-money laundering programs. The effectiveness of a financial institution in combating money laundering activities is a factor to be considered in any application submitted by the financial institution under the Bank Merger Act. The Bank has in place a Bank Secrecy Act and USA PATRIOT Act compliance program and engages in very few transactions of any kind with foreign financial institutions or foreign persons.
Office of Foreign Assets Control Regulation
The United States government has imposed economic sanctions that affect transactions with designated foreign countries, nationals, and others. These are typically known as the “OFAC” rules based on their administration by the U.S. Treasury Department Office of Foreign Assets Control. The Office of Foreign Assets Control-administered sanctions targeting countries take many different forms. Generally, they contain one or more of the following elements: (i) restrictions on trade with or investment in a sanctioned country, including prohibitions against direct or indirect imports from and exports to a sanctioned country and prohibitions on U.S. persons engaging in financial transactions relating to making investments in, or providing investment-related advice or assistance to, a sanctioned country; and (ii) a blocking of assets in which the government or specially designated nationals of the sanctioned country have an interest, by prohibiting transfers of property subject to U.S. jurisdiction
8
Table of Contents
(including property in the possession or control of U.S. persons). Blocked assets (property and bank deposits) cannot be paid out, withdrawn, set off, or transferred in any manner without a license from the Office of Foreign Assets Control. Failure to comply with these sanctions could have serious legal and reputational consequences.
Other Federal Laws and Regulations
State usury and other credit laws limit the amount of interest and various other charges collected or contracted by a bank on loans. The Bank is also subject to lending limits on loans to one borrower and regulatory guidance on concentrations of credit. The Bank’s loans and other products and services are also subject to numerous federal and state consumer financial protection laws, including, but not limited to, the following:
| • | Truth-In-Lending Act, which governs disclosures of credit terms to consumer borrowers; |
| • | Truth-in-Savings Act, which governs disclosures of the terms of deposit accounts to consumers; |
| • | Home Mortgage Disclosure Act, requiring financial institutions to provide information to regulators to enable determinations as to whether financial institutions are fulfilling their obligations to meet the home lending needs of the communities they serve and not discriminating in their lending practices; |
| • | Equal Credit Opportunity Act, prohibiting discrimination on the basis of race, sex or other prohibited factors in extending credit; |
| • | Real Estate Settlement Procedures Act, which imposes requirements relating to real estate settlements, including requiring lenders to disclose certain information regarding the nature and cost of real estate settlement services; |
| • | Fair Credit Reporting Act, covering numerous areas relating to certain types of consumer information and identity theft; |
| • | Privacy provisions of the Gramm-Leach-Bliley Act and related regulations, which require that financial institutions provide privacy policies to consumers, to allow customers to “opt out” of certain sharing of their nonpublic personal information, and to safeguard sensitive and confidential customer information. |
| • | Electronic Funds Transfer Act, which is a consumer protection law regarding electronic fund transfers; and |
| • | Numerous other federal and state laws and regulations, including those related to consumer protection and bank operations. |
Sarbanes-Oxley Act of 2002
The Sarbanes-Oxley Act is applicable to all companies with equity securities registered or that file reports under the Securities Exchange Act of 1934, as amended, including publicly-held financial holding companies such as the Corporation. In particular, the Sarbanes-Oxley Act establishes: (i) requirements for audit committees, including independence, expertise, and responsibilities; (ii) additional responsibilities regarding financial statements for the Chief Executive Officer and Chief Financial Officer of the reporting company; (iii) standards for auditors and regulation of audits; (iv) increased disclosure and reporting obligations for the reporting company and its directors and executive officers; and (v) new and increased civil and criminal penalties for violations of the securities laws.
9
Table of Contents
Governmental Policies
Our earnings are significantly affected by the monetary and fiscal policies of governmental authorities, including the Federal Reserve Board. Among the instruments of monetary policy used by the Federal Reserve Board to implement these objectives are open-market operations in U.S. Government securities and federal funds, changes in the discount rate on member bank borrowings and changes in reserve requirements against member bank deposits. These instruments of monetary policy are used in varying combinations to influence the overall level of bank loans, investments and deposits, and the interest rates charged on loans and paid for deposits. The Federal Reserve Board frequently uses these instruments of monetary policy, especially its open-market operations and the discount rate, to influence the level of interest rates and to affect the strength of the economy, the level of inflation or the price of the dollar in foreign exchange markets. The monetary policies of the Federal Reserve Board have had a significant effect on the operating results of banking institutions in the past and are expected to continue to do so in the future. It is not possible to predict the nature of future changes in monetary and fiscal policies, or the effect which they may have on our business and earnings.
Other Legislative Initiatives
Proposals may be introduced in the United States Congress, in the Pennsylvania Legislature, and/or by various bank regulatory authorities that could alter the powers of, and restrictions on, different types of banking organizations and which could restructure part or all of the existing regulatory framework for banks, bank and financial holding companies and other providers of financial services. Moreover, other bills may be introduced in Congress which would further regulate, deregulate or restructure the financial services industry, including proposals to substantially reform the regulatory framework. It is not possible to predict whether any such proposals will be enacted into law or, even if enacted, what effect such action may have on our business and earnings.
Employees
As of December 31, 2017, the Corporation had a total of 528 employees of which 481 were full time and 47 were part time.
10
Table of Contents
Executive Officers
The Corporation’s named executive officers, their ages, and their principal occupations are as follows:
| Name |
Age |
Principal Occupation | ||
| Joseph B. Bower, Jr. |
54 |
President and Chief Executive Officer, CNB Bank and CNB Financial Corporation, since January 1, 2010; and previously, Secretary, CNB Financial Corporation and Executive Vice President and Chief Operating Officer, CNB Bank. | ||
| Richard L. Greslick, Jr. |
41 |
Senior Executive Vice President/Chief Operating Officer, CNB Bank since December 2012 and Secretary, CNB Financial Corporation, since July 2010; previously, Senior Vice President/Administration since July 2010; Vice President/Operations since 2007; and previously Controller, CNB Bank and CNB Financial Corporation. | ||
| Mark D. Breakey |
59 |
Senior Executive Vice President and Chief Credit Officer, CNB Bank since 2003. | ||
| Joseph E. Dell, Jr. |
61 |
Senior Executive Vice President and Chief Commercial Banking Officer, CNB Bank since December 31, 2013; previously, Senior Vice President and Senior Commercial Lending Officer since February 2013; previously, Chief Lending Officer and Commercial Line of Business Manager for First Security Group, Inc. and FSG Bank, N.A. from 2011 to February 2013; and previously served in various executive level positions with First Commonwealth Bank, including Chief Lending Officer and Commercial Line of Business Leader since 2008. | ||
| Brian W. Wingard |
43 |
Treasurer, Principal Financial Officer and Principal Accounting Officer, CNB Financial Corporation, since March 2012; Executive Vice President/Chief Financial Officer, CNB Bank, since March 2012; previously Controller, CNB Bank and CNB Financial Corporation, since 2007; and previously a Certified Public Accountant in public practice. | ||
Officers are elected annually at the reorganization meeting of the Board of Directors. There are no arrangements or understandings between any officer and any other persons pursuant to which he was selected as an officer.
11
Table of Contents
Available Information
The Corporation makes available free of charge on its website (www.cnbbank.bank) its Annual Report on Form 10-K, its quarterly reports on Form 10-Q, current reports on Form 8-K, and amendments to those reports filed or furnished pursuant to Section 13(a) or 15(d) of the Securities Exchange Act of 1934, as amended, as soon as practicable after it electronically files such material with, or furnishes it to, the Securities and Exchange Commission, the SEC. Information on the Corporation’s website is not incorporated by reference into this report.
Shareholders may obtain a copy of the Corporation’s Annual Report on Form 10-K free of charge by writing to: CNB Financial Corporation, 1 South Second Street, PO Box 42, Clearfield, PA 16830, Attn: Shareholder Relations.
Interested persons may also read and copy materials the Corporation files with, or furnishes to, the SEC at the SEC’s Public Reference Room at 100 F Street, NE Washington, DC 20549. Information concerning the operation of the Public Reference Room may be obtained by calling the SEC at 1-800-SEC-0330. The SEC also maintains an internet site that contains reports, proxy statements and other information about electronic filers such as the Corporation. The site is available at http://www.sec.gov.
Statistical Disclosure
The following tables set forth statistical information relating to the Corporation and its wholly owned subsidiaries. The tables should be read in conjunction with the consolidated financial statements of the Corporation.
12
Table of Contents
Average Balances and Net Interest Margin
(Dollars in thousands)
| December 31, 2017 | December 31, 2016 | December 31, 2015 | ||||||||||||||||||||||||||||||||||||||
| Average Balance |
Annual Rate |
Interest Inc./ |
Average Balance |
Annual Rate |
Interest Inc./ |
Average Balance |
Annual Rate |
Interest Inc./ |
||||||||||||||||||||||||||||||||
| Assets |
||||||||||||||||||||||||||||||||||||||||
| Securities: |
||||||||||||||||||||||||||||||||||||||||
| Taxable (1) |
$ | 318,481 | 2.58 | % | $ | 8,165 | $ | 380,534 | 2.44 | % | $ | 9,134 | $ | 485,792 | 2.29 | % | $ | 10,977 | ||||||||||||||||||||||
| Tax-Exempt (1, 2) |
109,630 | 4.18 | % | 4,493 | 124,360 | 4.24 | % | 5,103 | 133,789 | 4.32 | % | 5,680 | ||||||||||||||||||||||||||||
| Equity Securities (1, 2) |
26,270 | 3.72 | % | 976 | 19,277 | 4.09 | % | 788 | 14,108 | 5.84 | % | 824 | ||||||||||||||||||||||||||||
|
|
|
|
|
|
|
|
|
|
|
|
|
|||||||||||||||||||||||||||||
| Total Securities |
454,381 | 3.02 | % | 13,634 | 524,171 | 2.93 | % | 15,025 | 633,689 | 2.80 | % | 17,481 | ||||||||||||||||||||||||||||
|
|
|
|
|
|
|
|
|
|
|
|
|
|||||||||||||||||||||||||||||
| Loans |
||||||||||||||||||||||||||||||||||||||||
| Commercial (2) |
645,357 | 4.93 | % | 31,844 | 522,345 | 4.63 | % | 24,201 | 449,970 | 4.78 | % | 21,507 | ||||||||||||||||||||||||||||
| Mortgage (2) |
1,296,548 | 4.54 | % | 58,899 | 1,110,287 | 4.54 | % | 50,437 | 937,978 | 4.62 | % | 43,341 | ||||||||||||||||||||||||||||
| Consumer |
81,383 | 9.42 | % | 7,668 | 84,592 | 9.14 | % | 7,730 | 72,215 | 10.68 | % | 7,714 | ||||||||||||||||||||||||||||
|
|
|
|
|
|
|
|
|
|
|
|
|
|||||||||||||||||||||||||||||
| Total Loans (3) |
2,023,288 | 4.86 | % | 98,411 | 1,717,224 | 4.80 | % | 82,368 | 1,460,163 | 4.97 | % | 72,562 | ||||||||||||||||||||||||||||
|
|
|
|
|
|
|
|
|
|
|
|
|
|||||||||||||||||||||||||||||
| Total earning assets |
2,477,669 | 4.53 | % | $ | 112,045 | 2,241,395 | 4.37 | % | $ | 97,393 | 2,093,852 | 4.32 | % | $ | 90,043 | |||||||||||||||||||||||||
|
|
|
|
|
|
|
|
|
|
|
|
|
|||||||||||||||||||||||||||||
| Non-Interest Earning Assets |
||||||||||||||||||||||||||||||||||||||||
| Cash & Due From Banks |
28,204 | 29,869 | 26,787 | |||||||||||||||||||||||||||||||||||||
| Premises & Equipment |
50,377 | 43,758 | 37,683 | |||||||||||||||||||||||||||||||||||||
| Other Assets |
138,754 | 121,554 | 91,046 | |||||||||||||||||||||||||||||||||||||
| Allowance for Loan Losses |
(17,473 | ) | (16,336 | ) | (17,487 | ) | ||||||||||||||||||||||||||||||||||
|
|
|
|
|
|
|
|||||||||||||||||||||||||||||||||||
| Total Non-Interest Earning Assets |
199,862 | 178,845 | 138,029 | |||||||||||||||||||||||||||||||||||||
|
|
|
|
|
|
|
|||||||||||||||||||||||||||||||||||
| Total Assets |
$ | 2,677,531 | $ | 2,420,240 | $ | 2,231,881 | ||||||||||||||||||||||||||||||||||
|
|
|
|
|
|
|
|||||||||||||||||||||||||||||||||||
| Liabilities and Shareholders’ Equity |
||||||||||||||||||||||||||||||||||||||||
| Interest Bearing Deposits |
||||||||||||||||||||||||||||||||||||||||
| Demand – interest bearing |
$ | 550,922 | 0.36 | % | $ | 1,976 | $ | 513,445 | 0.35 | % | $ | 1,801 | $ | 451,784 | 0.35 | % | $ | 1,602 | ||||||||||||||||||||||
| Savings |
953,960 | 0.49 | % | 4,643 | 954,010 | 0.46 | % | 4,429 | 942,916 | 0.50 | % | 4,734 | ||||||||||||||||||||||||||||
| Time |
252,176 | 1.07 | % | 2,693 | 214,684 | 1.04 | % | 2,240 | 196,661 | 1.10 | % | 2,162 | ||||||||||||||||||||||||||||
|
|
|
|
|
|
|
|
|
|
|
|
|
|||||||||||||||||||||||||||||
| Total interest bearing deposits |
1,757,058 | 0.53 | % | 9,312 | 1,682,139 | 0.50 | % | 8,470 | 1,591,361 | 0.53 | % | 8,498 | ||||||||||||||||||||||||||||
| Short-term borrowings |
122,758 | 1.09 | % | 1,344 | 99,075 | 0.57 | % | 565 | 62,136 | 0.26 | % | 161 | ||||||||||||||||||||||||||||
| Long-term borrowings |
158,782 | 1.69 | % | 2,677 | 81,937 | 2.95 | % | 2,416 | 77,874 | 3.93 | % | 3,061 | ||||||||||||||||||||||||||||
| Subordinated Debentures |
70,620 | 5.71 | % | 4,032 | 33,120 | 4.76 | % | 1,577 | 20,620 | 3.64 | % | 751 | ||||||||||||||||||||||||||||
|
|
|
|
|
|
|
|
|
|
|
|
|
|||||||||||||||||||||||||||||
| Total interest bearing liabilities |
2,109,218 | 0.82 | % | $ | 17,365 | 1,896,271 | 0.69 | % | $ | 13,028 | 1,751,991 | 0.71 | % | $ | 12,471 | |||||||||||||||||||||||||
|
|
|
|
|
|
|
|||||||||||||||||||||||||||||||||||
| Demand – non-interest bearing |
300,942 | 267,876 | 257,842 | |||||||||||||||||||||||||||||||||||||
| Other liabilities |
28,148 | 44,035 | 24,361 | |||||||||||||||||||||||||||||||||||||
|
|
|
|
|
|
|
|||||||||||||||||||||||||||||||||||
| Total Liabilities |
2,438,308 | 2,208,182 | 2,034,194 | |||||||||||||||||||||||||||||||||||||
| Shareholders’ Equity |
239,223 | 212,058 | 197,687 | |||||||||||||||||||||||||||||||||||||
|
|
|
|
|
|
|
|||||||||||||||||||||||||||||||||||
| Total Liabilities and Shareholders’ Equity |
$ | 2,677,531 | $ | 2,420,240 | $ | 2,231,881 | ||||||||||||||||||||||||||||||||||
|
|
|
|
|
|
|
|||||||||||||||||||||||||||||||||||
| Interest Income/Earning Assets |
4.53 | % | $ | 112,045 | 4.37 | % | $ | 97,393 | 4.32 | % | $ | 90,043 | ||||||||||||||||||||||||||||
| Interest Expense/Interest Bearing Liabilities |
0.82 | % | 17,365 | 0.69 | % | 13,028 | 0.71 | % | 12,471 | |||||||||||||||||||||||||||||||
|
|
|
|
|
|
|
|||||||||||||||||||||||||||||||||||
| Net Interest Spread |
3.71 | % | $ | 94,680 | 3.68 | % | $ | 84,365 | 3.61 | % | $ | 77,572 | ||||||||||||||||||||||||||||
|
|
|
|
|
|
|
|||||||||||||||||||||||||||||||||||
| Interest Income/Earning Assets |
4.53 | % | $ | 112,045 | 4.37 | % | $ | 97,393 | 4.32 | % | $ | 90,043 | ||||||||||||||||||||||||||||
| Interest Expense/Earning Assets |
0.71 | % | 17,365 | 0.59 | % | 13,028 | 0.59 | % | 12,471 | |||||||||||||||||||||||||||||||
|
|
|
|
|
|
|
|||||||||||||||||||||||||||||||||||
| Net Interest Margin |
3.82 | % | $ | 94,680 | 3.78 | % | $ | 84,365 | 3.73 | % | $ | 77,572 | ||||||||||||||||||||||||||||
|
|
|
|
|
|
|
|||||||||||||||||||||||||||||||||||
| 1. | Includes unamortized discounts and premiums. Average balance is computed using the amortized cost of securities. The average yield has been computed using the historical amortized cost average balance for available for sale securities. |
| 2. | Average yields and interest income are stated on a fully taxable equivalent basis using the Corporation’s marginal federal income tax rate of 35%. Interest income has been increased by $3,488, $3,078, and $2,865 for the years ended December 31, 2017, 2016, and 2015, respectively, as a result of the effect of tax-exempt interest and dividends earned by the Corporation. |
| 3. | Average outstanding includes the average balance outstanding of all nonaccrual loans. Loans consist of the average of total loans less average unearned income. Included in loan interest income is loan fees of $3,001, $3,170, and $2,447 for the years ended December 31, 2017, 2016, and 2015, respectively. |
13
Table of Contents
| Net Interest Income Rate-Volume Variance (Dollars in thousands) |
For Twelve Months Ended Due to Change In (1) |
For Twelve Months Ended Due to Change In (1) |
||||||||||||||||||||||
| Volume | Rate | Net | Volume | Rate | Net | |||||||||||||||||||
| Assets |
||||||||||||||||||||||||
| Securities: |
||||||||||||||||||||||||
| Taxable |
$ | (1,392 | ) | $ | 423 | $ | (969 | ) | $ | (2,404 | ) | $ | 561 | $ | (1,843 | ) | ||||||||
| Tax-Exempt (2) |
(541 | ) | (69 | ) | (610 | ) | (472 | ) | (105 | ) | (577 | ) | ||||||||||||
| Equity Securities (2) |
286 | (98 | ) | 188 | 302 | (338 | ) | (36 | ) | |||||||||||||||
|
|
|
|||||||||||||||||||||||
| Total Securities |
(1,647 | ) | 256 | (1,391 | ) | (2,574 | ) | 118 | (2,456 | ) | ||||||||||||||
| Loans |
||||||||||||||||||||||||
| Commercial (2) |
5,699 | 1,944 | 7,643 | 3,459 | (765 | ) | 2,694 | |||||||||||||||||
| Mortgage (2) |
8,461 | 1 | 8,462 | 7,962 | (866 | ) | 7,096 | |||||||||||||||||
| Consumer |
(293 | ) | 231 | (62 | ) | 1,322 | (1,306 | ) | 16 | |||||||||||||||
|
|
|
|||||||||||||||||||||||
| Total Loans |
13,867 | 2,176 | 16,043 | 12,743 | (2,937 | ) | 9,806 | |||||||||||||||||
|
|
|
|||||||||||||||||||||||
| Total Earning Assets |
$ | 12,220 | $ | 2,432 | $ | 14,652 | $ | 10,169 | $ | (2,819 | ) | $ | 7,350 | |||||||||||
|
|
|
|||||||||||||||||||||||
| Liabilities and Shareholders’ Equity |
||||||||||||||||||||||||
| Interest Bearing Deposits |
||||||||||||||||||||||||
| Demand – Interest Bearing |
$ | 131 | $ | 44 | $ | 175 | $ | 219 | $ | (20 | ) | $ | 199 | |||||||||||
| Savings |
0 | 214 | 214 | 56 | (361 | ) | (305 | ) | ||||||||||||||||
| Time |
391 | 62 | 453 | 198 | (120 | ) | 78 | |||||||||||||||||
|
|
|
|||||||||||||||||||||||
| Total Interest Bearing Deposits |
522 | 320 | 842 | 473 | (501 | ) | (28 | ) | ||||||||||||||||
| Short-Term Borrowings |
135 | 644 | 779 | 96 | 308 | 404 | ||||||||||||||||||
| Long-Term Borrowings |
2,266 | (2,005 | ) | 261 | 160 | (805 | ) | (645 | ) | |||||||||||||||
| Subordinated Debentures |
1,786 | 669 | 2,455 | 455 | 371 | 826 | ||||||||||||||||||
|
|
|
|||||||||||||||||||||||
| Total Interest Bearing Liabilities |
$ | 4,709 | $ | (372 | ) | $ | 4,337 | $ | 1,184 | $ | (627 | ) | $ | 557 | ||||||||||
|
|
|
|||||||||||||||||||||||
|
|
|
|||||||||||||||||||||||
| Change in Net Interest Income |
$ | 7,511 | $ | 2,804 | $ | 10,315 | $ | 8,985 | $ | (2,192 | ) | $ | 6,793 | |||||||||||
|
|
|
|||||||||||||||||||||||
| 1. | The change in interest due to both volume and rate have been allocated entirely to volume changes. |
| 2. | Changes in interest income on tax-exempt securities and loans are presented on a fully taxable-equivalent basis, using the Corporation’s marginal federal income tax rate of 35%. |
14
Table of Contents
Securities
| (Dollars In Thousands) |
December 31, 2017 | December 31, 2016 | December 31, 2015 | |||||||||||||||||||||||||||||||||||||||||||||
| Amortized Cost |
Unrealized | Market Value |
Amortized Cost |
Unrealized | Market Value |
Amortized Cost |
Unrealized | Market Value |
||||||||||||||||||||||||||||||||||||||||
| Gains | Losses | Gains | Losses | Gains | Losses | |||||||||||||||||||||||||||||||||||||||||||
| Securities Available for Sale |
||||||||||||||||||||||||||||||||||||||||||||||||
| U.S. Government Sponsored Entities |
$108,578 | $478 | $(908) | $108,148 | $139,823 | $1,107 | $(579) | $140,351 | $141,300 | $1,579 | $(1,128) | $141,751 | ||||||||||||||||||||||||||||||||||||
| State and Political Subdivisions |
134,428 | 3,609 | (314) | 137,723 | 153,492 | 4,194 | (649) | 157,037 | 165,828 | 6,234 | (243) | 171,819 | ||||||||||||||||||||||||||||||||||||
| Residential and multi-family mortgage |
111,214 | 304 | (1,882) | 109,636 | 136,807 | 551 | (2,382) | 134,976 | 160,316 | 1,060 | (3,394) | 157,982 | ||||||||||||||||||||||||||||||||||||
| Corporate notes and bonds |
17,610 | 52 | (462) | 17,200 | 18,299 | 77 | (962) | 17,414 | 19,794 | 165 | (1,271) | 18,688 | ||||||||||||||||||||||||||||||||||||
| Pooled trust preferred |
0 | 0 | 0 | 0 | 800 | 1,249 | 0 | 2,049 | 800 | 2,613 | 0 | 3,413 | ||||||||||||||||||||||||||||||||||||
| Pooled SBA |
36,260 | 355 | (575) | 36,040 | 43,450 | 505 | (918) | 43,037 | 51,556 | 760 | (907) | 51,409 | ||||||||||||||||||||||||||||||||||||
| Other securities |
1,020 | 0 | (58) | 962 | 1,020 | 0 | (49) | 971 | 1,020 | 0 | (39) | 981 | ||||||||||||||||||||||||||||||||||||
|
|
|
|||||||||||||||||||||||||||||||||||||||||||||||
| $409,110 | $4,798 | $(4,199) | $409,709 | $493,691 | $7,683 | $(5,539) | $495,835 | $540,614 | $12,411 | $(6,982) | $546,043 | |||||||||||||||||||||||||||||||||||||
|
|
|
|||||||||||||||||||||||||||||||||||||||||||||||
Maturity Distribution of Investment Securities
(Dollars In Thousands)
December 31, 2017
| Within One Year |
After One But Within Five Years |
After Five But Within Ten Years |
After Ten Years |
Pooled SBA, Residential and Multi- Family Mortgage and Commercial Mortgage |
||||||||||||||||||||||||||||||||||||
| $ Amt. | Yield (1) | $ Amt. | Yield (1) | $ Amt. | Yield (1) | $ Amt. | Yield (1) | $ Amt. | Yield (1) | |||||||||||||||||||||||||||||||
| Securities Available for Sale (2) |
||||||||||||||||||||||||||||||||||||||||
| U.S. Government Sponsored Entities |
$24,063 | 1.30% | $72,131 | 2.07% | $11,954 | 2.14% | ||||||||||||||||||||||||||||||||||
| State and Political Subdivisions |
18,617 | 4.23% | 75,914 | 4.33% | 38,028 | 4.56% | $5,164 | 4.83% | ||||||||||||||||||||||||||||||||
| Corporate notes and bonds |
7,459 | 2.73% | 7,030 | 2.45% | 1,771 | 2.68% | 940 | 2.60% | ||||||||||||||||||||||||||||||||
| Pooled SBA |
$36,040 | 2.67% | ||||||||||||||||||||||||||||||||||||||
| Residential and multi-family mortgage |
109,636 | 2.26% | ||||||||||||||||||||||||||||||||||||||
|
|
|
|||||||||||||||||||||||||||||||||||||||
| TOTAL |
$50,139 | 2.60% | $155,075 | 3.19% | $51,753 | 3.94% | $6,104 | 4.49% | $145,676 | 2.36% | ||||||||||||||||||||||||||||||
|
|
|
|||||||||||||||||||||||||||||||||||||||
| (1) | The weighted average yields are based on market value and effective yields weighted for the scheduled maturity with tax-exempt securities adjusted to a taxable-equivalent basis using a tax rate of 35%. |
| (2) | The portfolio contains no holdings of a single issuer that exceeds 10% of shareholders’ equity other than the US Treasury and governmental sponsored entities. |
15
Table of Contents
LOAN PORTFOLIO
(Dollars in thousands)
A. TYPE OF LOAN
| 2017 | 2016 | 2015 | 2014 | 2013 | ||||||||||||||||||||||||||||||||
| Commercial, industrial and agricultural |
$ | 749,138 | $ | 567,800 | $ | 475,364 | $ | 428,458 | $ | 427,715 | ||||||||||||||||||||||||||
| Commercial mortgages |
600,065 | 574,826 | 448,179 | 352,752 | 343,465 | |||||||||||||||||||||||||||||||
| Residential real estate |
713,347 | 652,883 | 574,225 | 502,317 | 459,114 | |||||||||||||||||||||||||||||||
| Consumer |
80,193 | 74,816 | 78,345 | 69,648 | 63,491 | |||||||||||||||||||||||||||||||
| Credit cards |
6,753 | 6,046 | 5,201 | 5,233 | 5,065 | |||||||||||||||||||||||||||||||
| Overdrafts |
352 | 595 | 1,040 | 1,188 | 409 | |||||||||||||||||||||||||||||||
|
|
|
|
|
|
|
|
|
|
|
|||||||||||||||||||||||||||
| Gross loans |
2,149,848 | 1,876,966 | 1,582,354 | 1,359,596 | 1,299,259 | |||||||||||||||||||||||||||||||
| Less: unearned income |
3,889 | 3,430 | 4,556 | 4,307 | 3,896 | |||||||||||||||||||||||||||||||
|
|
|
|
|
|
|
|
|
|
|
|||||||||||||||||||||||||||
| Total loans net of unearned |
$ | 2,145,959 | $ | 1,873,536 | $ | 1,577,798 | $ | 1,355,289 | $ | 1,295,363 | ||||||||||||||||||||||||||
|
|
|
|
|
|
|
|
|
|
|
|||||||||||||||||||||||||||
B. LOAN MATURITIES AND INTEREST SENSITIVITY
| December 31, 2017 | ||||||||||||||||||||||||||||
| One Year or Less |
One Through Five Years |
Over Five Years |
Total Gross Loans |
|||||||||||||||||||||||||
| Commercial, industrial and agricultural |
||||||||||||||||||||||||||||
| Loans With Fixed Interest Rate |
$ | 9,310 | $ | 70,215 | $ | 70,972 | $ | 150,497 | ||||||||||||||||||||
| Loans With Floating Interest Rate |
27,018 | 70,207 | 501,416 | 598,641 | ||||||||||||||||||||||||
|
|
|
|
|
|
|
|
|
|||||||||||||||||||||
| $ | 36,328 | $ | 140,422 | $ | 572,388 | $ | 749,138 | |||||||||||||||||||||
|
|
|
|
|
|
|
|
|
|||||||||||||||||||||
C. RISK ELEMENTS
| 2017 | 2016 | 2015 | 2014 | 2013 | ||||||||||||||||||||||||||||||||
| Loans on nonaccrual basis |
$ | 19,232 | $ | 15,329 | $ | 12,159 | $ | 9,190 | $ | 11,573 | ||||||||||||||||||||||||||
| Accruing loans which are contractually past due 90 days or more as to interest or principal payment |
477 | 10 | 105 | 213 | 344 | |||||||||||||||||||||||||||||||
| Performing troubled debt restructurings |
8,344 | 8,710 | 9,304 | 14,771 | 8,006 | |||||||||||||||||||||||||||||||
|
|
|
|
|
|
|
|
|
|
|
|||||||||||||||||||||||||||
| $ | 28,053 | $ | 24,049 | $ | 21,568 | $ | 24,174 | $ | 19,923 | |||||||||||||||||||||||||||
|
|
|
|
|
|
|
|
|
|
|
|||||||||||||||||||||||||||
Interest income recorded on the nonaccrual loans for the year ended December 31, 2017 was $660. Additional interest income which would have been recorded on nonaccrual loans had they been on accrual status was $198 for the year ended December 31, 2017.
Loans are placed in nonaccrual status when the interest or principal is 90 days past due, unless the loan is in collection, well secured and it is believed that there will be no loss of interest or principal.
16
Table of Contents
At December 31, 2017, there were $20,795 in special mention loans, $33,325 in substandard loans, and $0 in doubtful loans which are considered problem loans. These loans are not included in the table above. In the opinion of management, these loans are adequately secured and losses are believed to be minimal.
SUMMARY OF LOAN LOSS EXPERIENCE
(Dollars in Thousands)
| Analysis of the Allowance for Loan Losses |
||||||||||||||||||||||||||||||||||||
| Years Ended December 31, | 2017 | 2016 | 2015 | 2014 | 2013 | |||||||||||||||||||||||||||||||
| Balance at beginning of Period |
$ | 16,330 | $ | 16,737 | $ | 17,373 | $ | 16,234 | $ | 14,060 | ||||||||||||||||||||||||||
| Charge-Offs: |
||||||||||||||||||||||||||||||||||||
| Commercial, industrial and agricultural |
544 | 601 | 307 | 618 | 958 | |||||||||||||||||||||||||||||||
| Commercial mortgages |
116 | 201 | 486 | 50 | 1,931 | |||||||||||||||||||||||||||||||
| Residential real estate |
466 | 499 | 632 | 436 | 467 | |||||||||||||||||||||||||||||||
| Consumer |
2,555 | 3,324 | 1,956 | 1,744 | 1,919 | |||||||||||||||||||||||||||||||
| Credit cards |
144 | 96 | 116 | 78 | 97 | |||||||||||||||||||||||||||||||
| Overdrafts |
252 | 240 | 221 | 256 | 258 | |||||||||||||||||||||||||||||||
|
|
|
|
|
|
|
|
|
|
|
|||||||||||||||||||||||||||
| 4,077 | 4,961 | 3,718 | 3,182 | 5,630 | ||||||||||||||||||||||||||||||||
| Recoveries: |
||||||||||||||||||||||||||||||||||||
| Commercial, industrial and agricultural |
235 | 89 | 267 | 1 | 7 | |||||||||||||||||||||||||||||||
| Commercial mortgages |
197 | 8 | 52 | 210 | 1,430 | |||||||||||||||||||||||||||||||
| Residential real estate |
78 | 93 | 8 | 41 | 5 | |||||||||||||||||||||||||||||||
| Consumer |
161 | 122 | 96 | 93 | 114 | |||||||||||||||||||||||||||||||
| Credit cards |
27 | 22 | 14 | 25 | 16 | |||||||||||||||||||||||||||||||
| Overdrafts |
87 | 71 | 85 | 111 | 94 | |||||||||||||||||||||||||||||||
|
|
|
|
|
|
|
|
|
|
|
|||||||||||||||||||||||||||
| 785 | 405 | 522 | 481 | 1,666 | ||||||||||||||||||||||||||||||||
|
|
|
|
|
|
|
|
|
|
|
|||||||||||||||||||||||||||
| Net charge-offs |
(3,292 | ) | (4,556 | ) | (3,196 | ) | (2,701 | ) | (3,964 | ) | ||||||||||||||||||||||||||
| Provision for loan losses |
6,655 | 4,149 | 2,560 | 3,840 | 6,138 | |||||||||||||||||||||||||||||||
|
|
|
|
|
|
|
|
|
|
|
|||||||||||||||||||||||||||
| Balance at end of period |
$ | 19,693 | $ | 16,330 | $ | 16,737 | $ | 17,373 | $ | 16,234 | ||||||||||||||||||||||||||
|
|
|
|
|
|
|
|
|
|
|
|||||||||||||||||||||||||||
| Percentage of net charge-offs during the period to average loans outstanding | 0.16 | % | 0.27 | % | 0.22 | % | 0.21 | % | 0.38 | % | ||||||||||||||||||||||||||
The provision for loan losses reflects the amount deemed appropriate by management to establish an adequate reserve for probable incurred losses. Management’s judgment is based on the evaluation of individual loans, the overall risk characteristics of various portfolio segments, past experience with losses, the impact of economic conditions on borrowers, and other relevant factors.
ALLOCATION OF THE ALLOWANCE FOR LOAN LOSSES
(Dollars In Thousands)
| 2017 | 2016 | 2015 | 2014 | 2013 | ||||||||||||||||||||||||||||||||||||
| Amount | % of Loans in each Category |
Amount | % of Loans in each Category |
Amount | % of Loans in each Category |
Amount | % of Loans in each Category |
Amount | % of Loans in each Category |
|||||||||||||||||||||||||||||||
| Commercial, industrial, and agricultural |
$ | 6,160 | 34.85 | % | $ | 5,428 | 30.25 | % | $ | 6,035 | 30.25 | % | $ | 7,114 | 30.04 | % | $ | 8,212 | 32.92 | % | ||||||||||||||||||||
| Commercial mortgages |
9,007 | 27.91 | % | 6,753 | 30.63 | % | 5,605 | 30.63 | % | 5,310 | 28.32 | % | 3,536 | 26.44 | % | |||||||||||||||||||||||||
| Residential real estate |
2,033 | 33.18 | % | 1,653 | 34.78 | % | 2,475 | 34.78 | % | 2,479 | 36.29 | % | 2,450 | 35.34 | % | |||||||||||||||||||||||||
| Consumer |
2,179 | 3.73 | % | 2,215 | 3.99 | % | 2,371 | 3.99 | % | 2,205 | 4.95 | % | 1,763 | 4.89 | % | |||||||||||||||||||||||||
| Credit Cards |
120 | 0.31 | % | 93 | 0.32 | % | 90 | 0.32 | % | 71 | 0.33 | % | 66 | 0.38 | % | |||||||||||||||||||||||||
| Overdrafts |
194 | 0.02 | % | 188 | 0.03 | % | 161 | 0.03 | % | 194 | 0.07 | % | 207 | 0.03 | % | |||||||||||||||||||||||||
|
|
|
|
|
|
|
|
|
|
|
|
|
|
|
|
|
|
|
|
|
|||||||||||||||||||||
| Total |
$ | 19,693 | 100.00 | % | $ | 16,330 | 100.00 | % | $ | 16,737 | 100.00 | % | $ | 17,373 | 100.00 | % | $ | 16,234 | 100.00 | % | ||||||||||||||||||||
|
|
|
|
|
|
|
|
|
|
|
|
|
|
|
|
|
|
|
|
|
|||||||||||||||||||||
17
Table of Contents
In determining the allocation of the allowance for loan losses, the Corporation considers economic trends, historical patterns and specific credit reviews.
With regard to the credit reviews, a “watchlist” is evaluated on a monthly basis to determine potential commercial losses. Consumer and mortgage loans are allocated using historical loss experience.
DEPOSITS
(Dollars In Thousands)
| Year Ended December 31, | ||||||||||||||||||||||||
| 2017 | 2016 | 2015 | ||||||||||||||||||||||
| Average Amount |
Annual Rate |
Average Amount |
Annual Rate |
Average Amount |
Annual Rate |
|||||||||||||||||||
| Demand – Non-Interest Bearing |
$ | 300,942 | $ | 267,876 | $ | 257,842 | ||||||||||||||||||
| Demand – Interest Bearing |
550,922 | 0.36 | % | 513,445 | 0.35 | % | 451,784 | 0.35 | % | |||||||||||||||
| Savings Deposits |
953,960 | 0.49 | % | 954,010 | 0.46 | % | 942,916 | 0.50 | % | |||||||||||||||
| Time Deposits |
252,176 | 1.07 | % | 214,684 | 1.04 | % | 196,661 | 1.10 | % | |||||||||||||||
|
|
|
|
|
|
|
|||||||||||||||||||
| TOTAL |
$ | 2,058,000 | $ | 1,950,015 | $ | 1,849,203 | ||||||||||||||||||
|
|
|
|
|
|
|
|||||||||||||||||||
| The maturity of certificates of deposits and other time deposits in denominations of $100,000 or more as of December 31, 2017 is as follows: |
||||
| Three months or less |
$ | 26,435 | ||
| Greater than three months and through twelve months |
36,617 | |||
| Greater than one year and through three years |
152,186 | |||
| Greater than three years |
2,083 | |||
|
|
|
|||
| $ | 217,321 | |||
|
|
|
RETURN ON EQUITY AND ASSETS
| Year Ended December 31, | ||||||||||||
| 2017 | 2016 | 2015 | ||||||||||
| Return on average assets |
0.89 | % | 0.85 | % | 0.99 | % | ||||||
| Return on average equity |
9.97 | % | 9.69 | % | 11.23 | % | ||||||
| Dividend payout ratio |
42.31 | % | 46.48 | % | 42.86 | % | ||||||
| Average equity to average assets ratio |
8.93 | % | 8.76 | % | 8.86 | % | ||||||
18
Table of Contents
The Corporation’s financial condition and results of operations are subject to various risks inherent in its business. The material risks and uncertainties that management believes affect the Corporation are described below. If any of these risks actually occur, the Corporation’s business, financial condition, liquidity, results of operations and prospects could be materially and adversely affected. The following risks together with all of the other information in this Annual Report on Form 10-K should be considered.
The possibility of the economy’s return to recessionary conditions and the possibility of further turmoil or volatility in the financial markets would likely have an adverse effect on the Corporation’s business, financial position and results of operations.
The Corporation continues to face risks resulting from the aftermath of the severe recession generally and the moderate pace of the current recovery. A slowing or failure of the economic recovery would likely aggravate the adverse effects of these difficult economic and market conditions on the Corporation and on others in the financial services industry. In particular, the Corporation may face the following risks in connection with the economic or market environment:
| ● | The Corporation’s and the Bank’s ability to borrow from other financial institutions or to access the debt or equity capital markets on favorable terms or at all could be adversely affected by further disruptions in the capital markets or other events, including actions by rating agencies and deteriorating investor expectations. |
| ● | The Corporation faces increased regulation of the banking and financial services industry. Compliance with such regulation may increase its costs and limit its ability to pursue business opportunities. |
| ● | Market developments may affect customer confidence levels and may cause increases in loan delinquencies and default rates, which management expects would adversely impact the Bank’s charge-offs and provision for loan losses. |
| ● | Market developments may adversely affect the Bank’s securities portfolio by causing other-than-temporary-impairments, prompting write-downs and securities losses. |
| ● | Competition in banking and financial services industry could intensify as a result of the consolidation of financial services companies in connection with current market conditions. |
The Bank’s allowance for loan losses may not be adequate to cover loan losses which could have a material adverse effect on the Corporation’s business, financial condition and results of operations.
A significant source of risk for the Corporation arises from the possibility that losses will be sustained because borrowers, guarantors and related parties may fail to perform in accordance with the terms of their loan agreements. Most loans originated by the Bank are secured, but some loans are unsecured based upon management’s evaluation of the creditworthiness of the borrowers. With respect to secured loans, the collateral securing the repayment of these loans principally includes a wide variety of real estate, and to a lesser extent personal property, either of which may be insufficient to cover the obligations owed under such loans.
Collateral values and the financial performance of borrowers may be adversely affected by changes in prevailing economic, environmental and other conditions, including declines in the value of real estate, changes in interest rates and debt service levels, changes in oil and gas prices, changes in monetary and fiscal policies of the federal government, widespread disease, terrorist activity, environmental
19
Table of Contents
contamination and other external events, which are beyond the control of the Bank. In addition, collateral appraisals that are out of date or that do not meet industry recognized standards might create the impression that a loan is adequately collateralized when in fact it is not. Although the Bank may acquire any real estate or other assets that secure defaulted loans through foreclosures or other similar remedies, the amounts owed under the defaulted loans may exceed the value of the assets acquired.
The allowance for loan losses is subject to a formal analysis by the Credit Administration and Finance Departments of the Corporation using a methodology whereby loan pools are segregated into special mention, substandard, doubtful and unclassified categories and the pools are evaluated based on historical loss factors. The Bank monitors delinquencies and losses on a monthly basis. The Bank has adopted underwriting and credit monitoring policies and procedures, including the review of borrower financial statements and collateral appraisals, which management believes are appropriate to mitigate the risk of loss by assessing the likelihood of borrower nonperformance and the value of available collateral. The Bank also manages credit risk by diversifying its loan portfolio. An ongoing independent review, subsequent to management’s review, of individual credits is performed by an independent loan review function, which reports to the Loan Committee of the Corporation’s Board of Directors. However, such policies and procedures have limitations, including judgment errors in management’s risk analysis, and may not prevent unexpected losses that could have a material adverse effect on the Corporation’s business, financial condition and results of operations.
Interest rate volatility could significantly reduce the Corporation’s profitability.
The Corporation’s earnings largely depend on the relationship between the yield on its earning assets, primarily loans and investment securities, and the cost of funds, primarily deposits and borrowings. This relationship, commonly known as the net interest margin, is susceptible to significant fluctuation and is affected by economic and competitive factors that influence the yields and rates, and the volume and mix of the Bank’s interest earning assets and interest bearing liabilities.
Interest rate risk can be defined as the sensitivity of net interest income and of the market value of financial instruments to the direction and frequency of changes in interest rates. Interest rate risk arises from the imbalance in the re-pricing, maturity and/or cash flow characteristics of assets and liabilities. The Corporation is subject to interest rate risk to the degree that its interest bearing liabilities re-price or mature more slowly or more rapidly or on a different basis than its interest earning assets. Changes in interest rates, including those due to federal monetary policy, will affect the levels of income and expense recorded on a large portion of the Bank’s assets and liabilities, and fluctuations in interest rates will impact the market value of all interest sensitive assets. Significant fluctuations in interest rates could have a material adverse impact on the Corporation’s business, financial condition, results of operations, or liquidity.
The Bank’s interest rate risk measurement and management techniques incorporate the re-pricing and cash flow attributes of its balance sheet and off-balance sheet instruments as they relate to current and potential changes in interest rates. The level of interest rate risk, measured in terms of the potential future effect on earnings, is determined through the use of static gap analysis and earnings simulation modeling under multiple interest rate scenarios. Management’s objectives are to measure, monitor and develop strategies in response to the interest rate risk profile inherent in the Bank’s balance sheet in order to preserve the sensitivity of net interest income to actual or potential changes in interest rates. At December 31, 2017, the interest rate sensitivity position was asset sensitive in the short-term. For further information on risk relating to interest rates, refer to Part I, Item 7a, “Quantitative and Qualitative Disclosures about Market Risk,” herein.
20
Table of Contents
The Bank’s loans are principally concentrated in certain areas of Pennsylvania and Ohio, and adverse economic conditions in those markets could adversely affect the Corporation’s business, financial condition and results of operations.
The Corporation’s success is dependent to a significant extent upon general economic conditions in the United States and, in particular, the local economies in central and northwest Pennsylvania, central and northeast Ohio, and western New York the primary markets served by the Bank. The Bank is particularly exposed to real estate and economic factors in these geographic areas, as most of its loan portfolio is concentrated among borrowers in these markets. Furthermore, because a substantial portion of the Bank’s loan portfolio is secured by real estate in these areas, the value of the associated collateral is also subject to regional real estate market conditions.
The Bank is not immune to negative consequences arising from overall economic weakness and, in particular, a sharp downturn in the local real estate markets served by the Bank. While the Bank’s loan portfolio has not shown significant signs of credit quality deterioration despite continued challenges in the U.S. economy, we cannot assure you that no deterioration will occur. An economic recession in the markets served by the Bank, and the nation as a whole, could negatively impact household and corporate incomes. This impact could lead to decreased loan demand and increase the number of borrowers who fail to pay the Bank interest or principal on their loans, and accordingly, could have a material adverse effect on the Corporation’s business, financial condition, results of operations, or liquidity.
The Corporation’s investment securities portfolio is subject to credit risk, market risk, and liquidity risk, and declines in value in its investment securities portfolio may require it to record other-than-temporary impairment charges that could have a material adverse effect on its results of operations and financial condition.
The Corporation’s investment securities portfolio has risks beyond its control that can significantly influence the portfolio’s fair value. These factors include, but are not limited to, rating agency downgrades of the securities, defaults of the issuers of the securities, lack of market pricing of the securities, and continued instability in the credit markets. Recent lack of market activity with respect to certain of the securities has, in certain circumstances, required the Corporation to base its fair market valuation on unobservable inputs. The Corporation has engaged valuation experts to price these certain securities using proprietary models, which incorporate assumptions that market participants would use in pricing the securities, including bid/ask spreads and liquidity and credit premiums. Any change in current accounting principles or interpretations of these principles could impact the Corporation’s assessment of fair value and thus its determination of other-than-temporary impairment of the securities in its investment securities portfolio.
The Bank may be required to record other-than-temporary impairment charges on its investment securities if they suffer declines in value that are considered other-than-temporary. Numerous factors, including collateral deterioration underlying certain private label mortgage-backed securities, lack of liquidity for re-sales of certain investment securities, absence of reliable pricing information for certain investment securities, adverse changes in business climate, adverse actions by regulators, or unanticipated changes in the competitive environment could negatively effect the Bank’s securities portfolio in future periods. An other-than-temporary impairment charge could have a material adverse effect on the Corporation’s results of operations and financial condition.
21
Table of Contents
The Corporation is subject to extensive government regulation and supervision, which may interfere with its ability to conduct its business and may negatively impact its financial results.
The Corporation, primarily through the Bank and its non-bank subsidiary, is subject to extensive federal and state regulation and supervision. Banking regulations are primarily intended to protect depositors’ funds, the Federal Deposit Insurance Fund and the safety and soundness of the banking system as a whole, not stockholders. These regulations affect the Corporation’s lending practices, capital structure, investment practices, dividend policy and growth, among other things. Congress and federal regulatory agencies continually review banking laws, regulations and policies for possible changes. Changes to statutes, regulations or regulatory policies, including changes in interpretation or implementation of statutes, regulations or policies, could affect the Corporation in substantial and unpredictable ways. Such changes could subject it to additional costs, limit the types of financial services and products the Corporation may offer, and/or limit the pricing it may charge on certain banking services, among other things. Additionally, the Dodd-Frank Act has and will continue to change the current bank regulatory structure and affect the lending, investment, trading and operating activities of financial institutions and their holding companies. In addition to the self-implementing provisions of the statute, the Dodd-Frank Act calls for many administrative rulemakings by various federal agencies to implement various parts of the legislation, some of which have yet to be implemented. The Corporation cannot be certain when final rules affecting it will be issued through such rulemakings and what the specific content of such rules will be. The financial reform legislation and any implementing rules that are ultimately issued could have adverse implications on the financial industry, the competitive environment, and the Corporation’s ability to conduct business. The Corporation will have to apply resources to ensure that it is in compliance with all applicable provisions of the Dodd-Frank Act and any implementing rules, which may increase its costs of operations and adversely impact its earnings. Additionally, revised capital adequacy guidelines and prompt corrective action rules applicable to it became effective January 1, 2015. Compliance with these rules have imposed additional costs on the Corporation.
Failure to comply with laws, including the Bank Secrecy Act and USA Patriot Act, regulations or policies could result in sanctions by regulatory agencies, restrictions, civil money penalties and/or reputation damage, which could have a material adverse effect on the Corporation’s business, financial condition and results of operations and/or cause the Corporation to lose its financial holding company status. While the Corporation has policies and procedures designed to prevent any such violations, there can be no assurance that such violations will not occur. See the section captioned “Supervision and Regulation” in Part I, Item 1 of this report for further information.
The Corporation relies on its management and other key personnel, and the loss of any of them may adversely affect its operations.
The Corporation is and will continue to be dependent upon the services of its executive management team. In addition, it will continue to depend on its ability to retain and recruit key client relationship managers. The unexpected loss of services of any key management personnel, or the inability to recruit and retain qualified personnel in the future, could have an adverse effect on its business and financial condition.
Strong competition within the Corporation’s markets and technological change may have a material adverse impact on its profitability.
The Corporation competes with an ever-increasing array of financial service providers. As noted above, as a financial holding company and state-chartered financial institution, respectively, the
22
Table of Contents
Corporation and the Bank are subject to extensive regulation and supervision, including, in many cases, regulations that limit the type and scope of activities. The non-bank financial service providers that compete with the Corporation and the Bank may not be subject to such extensive regulation, supervision, and tax burden. Competition from nationwide banks, as well as local institutions, is strong in the Corporation’s markets.
The financial services industry is undergoing rapid technological change and technological advances are likely to intensify competition. In addition to improving customer services, effective use of technology increases efficiency and enables financial institutions to reduce costs. Accordingly, the Corporation’s future success will depend in part on its ability to address customer needs by using technology. The Corporation cannot assure you that it will be able to successfully take advantage of technological changes or advances or develop and market new technology driven products and services to its customers.
Many regional, national and international competitors have far greater assets and capitalization than the Corporation has and greater resources to invest in technology and access to capital markets and can consequently offer a broader array of financial services than it can. We cannot assure you that we will continue to be able to compete effectively with other financial institutions in the future. Furthermore, developments increasing the nature or level of competition could have a material adverse effect on the Corporation’s business, financial condition, results of operations, or liquidity. For further information on competition, refer to Part I, Item 1, “Competition” herein.
A failure in or breach of the Corporation’s or any of its subsidiaries’ operational or security systems or infrastructure, or those of third party vendors and other service providers, including as a result of cyber attacks, could disrupt the Corporation’s or any of its subsidiaries’ businesses, result in the disclosure or misuse of confidential or proprietary information, damage its reputation, increase its costs and cause losses.
The Corporation, primarily through the Bank, depends on its ability to continuously process, record and monitor a large number of customer transactions and customer, public and regulatory expectations regarding operational and information security have increased over time. Accordingly, its and its subsidiaries’ operational systems and infrastructure must continue to be safeguarded and monitored for potential failures, disruptions and breakdowns. Although the Corporation has business continuity plans and other safeguards in place, disruptions or failures in the physical infrastructure or operating systems that support its businesses and customers, or cyber attacks or security breaches of the networks, systems or devices on which customers’ personal information is stored and that customers use to access the Corporation’s and its subsidiaries products and services could result in customer attrition, regulatory fines, penalties or intervention, reputational damage, reimbursement or other compensation costs, and/or additional compliance costs, any of which could materially adversely affect the Corporation’s results of operations or financial condition.
Although to date the Corporation has not experienced any material losses relating to cyber attacks or other information security breaches, there can be no assurance that it or its subsidiaries will not suffer such losses in the future. The Corporation’s risk and exposure to these matters remains heightened because of, among other things, the evolving nature of these threats, our plans to continue to implement our Internet banking and mobile banking channel strategies and develop additional remote connectivity solutions to serve our customers when and how they want to be served. As a result, cybersecurity and the continued development and enhancement of the Corporation’s controls, processes and practices designed to protect its and its subsidiaries systems, computers, software, data and networks from attack, damage or unauthorized access remain a priority for the Corporation. As
23
Table of Contents
cyber threats continue to evolve, the Corporation may be required to expend significant additional resources to continue to modify or enhance its protective measures or to investigate and remediate any information security vulnerabilities.
The Corporation may not be able to meet its cash flow needs on a timely basis at a reasonable cost, and the Corporation’s cost of funds for banking operations may significantly increase as a result of general economic conditions, interest rates and competitive pressures.
Liquidity is the ability to meet cash flow obligations as they come due and cash flow needs on a timely basis and at a reasonable cost. The liquidity of the Bank is used to make loans and to repay deposit and borrowing liabilities as they become due, or are demanded by customers and creditors. Many factors affect the Bank’s ability to meet liquidity needs, including variations in the markets served by its network of offices, its mix of assets and liabilities, reputation and standing in the marketplace, and general economic conditions.
The Bank’s primary source of funding is retail deposits, gathered throughout its network of banking offices. Periodically, the Corporation utilizes term borrowings from the Federal Home Loan Bank of Pittsburgh, or FHLB, of which the Bank is a member, and other lenders to meet funding obligations. The Bank’s securities and loan portfolios provide a source of contingent liquidity that could be accessed in a reasonable time period through sales.
Significant changes in general economic conditions, market interest rates, competitive pressures or otherwise, could cause the Bank’s deposits to decrease relative to overall banking operations, and it would have to rely more heavily on brokered funds and borrowings in the future, which are typically more expensive than deposits.
Management and the Board of Directors of the Corporation, through its Asset/Liability Committee, or the ALCO, monitor liquidity and the ALCO establishes and monitors acceptable liquidity ranges. The Bank actively manages its liquidity position through target ratios. Continual monitoring of these ratios, both historical and through forecasts under multiple rate scenarios, allows the Bank to employ strategies necessary to maintain adequate liquidity.
Changes in economic conditions, including consumer savings habits and availability of or access to capital, could potentially have a significant impact on the Bank’s liquidity position, which in turn could materially impact the Corporation’s financial condition, results of operations and cash flows.
A substantial decline in the value of the Bank’s FHLB common stock may adversely affect the Corporation’s results of operations, liquidity and financial condition.
As a requirement of membership in the FHLB of Pittsburgh, the Bank must own a minimum required amount of FHLB stock, calculated periodically based primarily on its level of borrowings from the FHLB. Borrowings from the FHLB represent the Bank’s primary source of short-term and long-term wholesale funding.
In an extreme situation, it is possible that the capitalization of an FHLB, including the FHLB of Pittsburgh, could be substantially diminished or reduced to zero. Consequently, given that there is no trading market for the Bank’s FHLB common stock, the Corporation’s management believes that there is a risk that the Corporation’s investment could be deemed impaired at some time in the future. If this occurs, it may adversely affect the Corporation’s results of operations and financial condition.
24
Table of Contents
In addition, if the capitalization of the FHLB of Pittsburgh is substantially diminished, the Bank’s liquidity may be adversely impacted if it is not able to obtain alternative sources of funding.
There are 12 banks of the FHLB, including Pittsburgh. The 12 FHLB banks are jointly liable for the consolidated obligations of the FHLB system. To the extent that one FHLB bank cannot meet its obligations to pay its share of the system’s debt, other FHLB banks can be called upon to make the payment. The Corporation cannot assure you, however, that the FHLB system will be able to meet these obligations.
The Bank could be held responsible for environmental liabilities relating to properties acquired through foreclosure, resulting in significant financial loss.
In the event the Bank forecloses on a defaulted commercial or residential mortgage loan to recover its investment, it may be subject to environmental liabilities in connection with the underlying real property, which could significantly exceed the value of the real property. Although the Bank exercises due diligence to discover potential environmental liabilities prior to acquiring any property through foreclosure, hazardous substances or wastes, contaminants, pollutants, or their sources may be discovered on properties during its ownership or after a sale to a third party. The Corporation cannot assure you that the Bank would not incur full recourse liability for the entire cost of any removal and cleanup on an acquired property, that the cost of removal and cleanup would not exceed the value of the property, or that the Bank could recover any of the costs from any third party. Losses arising from environmental liabilities could have a material adverse impact on the Corporation’s business, financial condition, results of operations, or liquidity.
Federal and state governments could pass legislation responsive to current credit conditions which could cause the Corporation to experience higher credit losses.
The Corporation could experience higher credit losses because of federal or state legislation or regulatory action that reduces the amount the Bank’s borrowers are otherwise contractually required to pay under existing loan contracts. Also, the Corporation could experience higher credit losses because of federal or state legislation or regulatory action that limits the Bank’s ability to foreclose on property or other collateral or makes foreclosure less economically feasible. The Corporation cannot assure you that future legislation will not significantly and adversely impact its ability to collect on its current loans or foreclose on collateral.
The preparation of the Corporation’s financial statements requires the use of estimates that could significantly vary from actual results, which could have a material adverse effect on the Corporation’s business, financial condition, results of operations or liquidity.
The preparation of the consolidated financial statements in conformity with accounting principles generally accepted in the U.S. requires management to make significant estimates that affect the financial statements. For example, one of these significant estimates is the allowance for loan losses. Due to the inherent nature of estimates, the Corporation cannot provide absolute assurance that it will not significantly increase the allowance for loan losses and/or sustain credit losses that are significantly higher than the provided allowance, which could have a material adverse effect on the Corporation’s business, financial condition, results of operations or liquidity.
The Corporation’s financial results may be subject to the impact of changes in accounting standards or interpretation in new or existing standards.
From time to time the Financial Accounting Standards Board, or FASB, and the SEC change accounting regulations and reporting standards that govern the preparation of the Corporation’s
25
Table of Contents
financial statements. In addition, the FASB, SEC, and bank regulators may revise their previous interpretations regarding existing accounting regulations and the application of these accounting standards. These revisions in their interpretations are out of the Corporation’s control and may have a material impact on its financial statements.
The unsoundness of other financial institutions with which the Corporation does business could adversely affect the Corporation’s business, financial condition or results of operations.
Our ability to engage in routine funding transactions could be adversely affected by the actions and commercial soundness of other financial institutions. Financial institutions are interrelated as a result of trading, clearing, counterparty, investment or other relationships. The Corporation routinely executes transactions with counterparties in the financial services industry such as commercial banks, brokers and dealers, investment banks and other institutional clients for a range of transactions including loan participations, derivatives and hedging transactions. In addition, the Corporation invests in securities or loans originated or issued by financial institutions or supported by the loans they originate. As a result, defaults by, or even rumors or questions about, one or more financial institutions, or the financial industry generally, have led to market-wide liquidity problems and could lead to losses or defaults by us or other institutions. Many of these transactions expose the Corporation to credit or investment risk in the event of default by the Corporation’s counterparty. In addition, the Corporation’s credit risk may be exacerbated if the collateral it holds cannot be realized or is liquidated at prices not sufficient to recover the full amount of the loan or other exposure to the Corporation. The Corporation could incur losses to its securities portfolio as a result of these issues. These types of losses may have a material adverse effect on the Corporation’s business, financial condition or results of operation.
Some provisions contained in the Corporation’s articles of incorporation and its bylaws and under Pennsylvania law could deter a takeover attempt or delay changes in control or management of the Corporation.
Certain anti-takeover provisions of the Pennsylvania Business Corporation Law of 1988, as amended, apply to Pennsylvania registered corporations (e.g., publicly traded companies) including, but not limited to, those relating to (1) control share acquisitions, (2) disgorgement of profits by certain controlling persons, (3) business combination transactions with interested shareholders, and (4) the rights of shareholders to demand fair value for their stock following a control transaction. Pennsylvania law permits corporations to opt-out of these anti-takeover provisions, but the Corporation has not done so. Such provisions could have the effect of deterring takeovers or delaying changes in control or management of the Corporation. Additionally, such provisions could limit the price that some investors might be willing to pay in the future for shares of the Corporation’s common stock.
For example, the Corporation’s amended and restated articles of incorporation require the affirmative vote of 66% of the outstanding shares entitled to vote to effect a business combination. In addition, the
Corporation’s amended and restated articles of incorporation, subject to the limitations prescribed in such articles and subject to limitations prescribed by Pennsylvania law, authorize the Corporation’s board of directors, from time to time by resolution and without further shareholder action, to provide for the issuance of shares of preferred stock, in one or more series, and to fix the designation, powers, preferences and other rights of the shares and to fix the qualifications, limitations and restrictions thereof. As a result of its broad discretion with respect to the creation and issuance of preferred stock without shareholder approval, the board of directors could adversely affect the voting power and other rights of the holders of common stock and, by issuing shares of preferred stock with certain voting, conversion and/or redemption rights, could discourage any attempt to obtain control of the Corporation.
26
Table of Contents
The Corporation’s bylaws, as amended and restated, provide for the division of the Corporation’s board of directors into three classes of directors, with each serving staggered terms. In addition, any amendment to the Corporation’s bylaws must be approved by the affirmative vote of a majority of the votes cast by all shareholders entitled to vote thereon and, if any shareholders are entitled to vote thereon as a class, upon receiving the affirmative vote of a majority of the votes cast by the shareholders entitled to vote as a class.
Any of the foregoing provisions may have the effect of deterring takeovers or delaying changes in control or management of the Corporation.
The price of the Corporation’s common stock may fluctuate significantly, and this may make it difficult for you to resell shares of common stock owned by you at times or at prices you find attractive.
The price of the Corporation’s common stock on the NASDAQ constantly changes. The Corporation expects that the market price of its common stock will continue to fluctuate, and the Corporation cannot give you any assurances regarding any trends in the market prices for its common stock.
The Corporation’s stock price may fluctuate as a result of a variety of factors, many of which are beyond its control. These factors include the Corporation’s:
| • | past and future dividend practice; |
| • | financial condition, performance, creditworthiness and prospects; |
| • | quarterly variations in the Corporation’s operating results or the quality of the Corporation’s assets; |
| • | operating results that vary from the expectations of management, securities analysts and investors; |
| • | changes in expectations as to the Corporation’s future financial performance; |
| • | announcements of innovations, new products, strategic developments, significant contracts, acquisitions and other material events by the Corporation or its competitors; |
| • | the operating and securities price performance of other companies that investors believe are comparable to the Corporation; |
| • | future sales of the Corporation’s equity or equity-related securities; |
| • | the credit, mortgage and housing markets, the markets for securities relating to mortgages or housing, and developments with respect to financial institutions generally; and |
| • | instability in global financial markets and global economies and general market conditions, such as interest or foreign exchange rates, stock, commodity or real estate valuations or volatility, budget deficits or sovereign debt level concerns and other geopolitical, regulatory or judicial events. |
The Corporation’s ability to pay dividends is limited by law and regulations.
The future declaration of dividends by the Corporation’s Board of Directors will depend on a number of factors, including capital requirements, regulatory limitations, the Corporation’s operating results and financial condition and general economic conditions. The Corporation’s ability to pay dividends depends primarily on the receipt of dividends from the Bank. Dividend payments from the Bank are subject to legal and regulatory limitations, generally based on retained earnings, imposed by bank regulatory agencies. The ability of the Bank to pay dividends is also subject to financial condition, regulatory capital requirements, capital expenditures and other cash flow requirements. The Corporation cannot assure you that the Bank will be able to pay dividends to the Corporation in the
27
Table of Contents
future. The Corporation may decide to limit the payment of dividends to its stockholders even when the Corporation has the legal ability to pay them in order to retain earnings for use in the Corporation’s business.
The risks presented by acquisitions could adversely affect our financial condition and results of operations.
Any acquisitions will be accompanied by the risks commonly encountered in acquisitions including, among other things: our ability to realize anticipated cost savings and avoid unanticipated costs relating to the merger, the difficulty of integrating operations and personnel, the potential disruption of our or the acquired company’s ongoing business, the inability of our management to maximize our financial and strategic position, the inability to maintain uniform standards, controls, procedures and policies, and the impairment of relationships with the acquired company’s employees and customers as a result of changes in ownership and management. These risks may prevent the Corporation from fully realizing the anticipated benefits of an acquisition or cause the realization of such benefits to take longer than expected.
ITEM 1B. UNRESOLVED STAFF COMMENTS
None
The headquarters of the Corporation and the Bank are located at 1 South Second Street, Clearfield, Pennsylvania, in a building owned by the Corporation. The Bank operates 41 full-service offices and one loan production office. Of these 42 offices, 24 are owned and 18 are leased from independent owners. Holiday Financial Services Corporation has ten full-service offices which nine are leased from independent owners and one is leased from the Bank. There are no encumbrances on the offices owned and the rental expense on the leased property is immaterial in relation to operating expenses. The initial lease terms range from one to twenty years.
There are no material pending legal proceedings to which the Corporation or any of its subsidiaries is a party, or of which any of their property is the subject, except ordinary routine proceedings which are incidental to the business.
ITEM 4. MINE SAFETY DISCLOSURES
None
28
Table of Contents
PART II.
ITEM 5. MARKET FOR REGISTRANT’S COMMON EQUITY, RELATED STOCKHOLDER MATTERS AND ISSUER PURCHASES OF EQUITY SECURITIES
Quarterly Share Data; Holders
Our common stock is traded on the Global Select Market of The NASDAQ Stock Market LLC under the symbol CCNE. The following tables set forth, for the periods indicated, the quarterly high and low sales price of the Corporation’s common stock as reported by the NASDAQ Global Select Market and actual cash dividends paid per share. As of December 31, 2017, the approximate number of shareholders of record of the Corporation’s common stock was 4,087.
Price Range of Common Stock
| 2017 | 2016 | |||||||||||||||
| High | Low | High | Low | |||||||||||||
| First quarter |
$ | 27.00 | $ | 22.55 | $ | 18.49 | $ | 16.51 | ||||||||
| Second quarter |
26.07 | 20.90 | 18.41 | 17.05 | ||||||||||||
| Third quarter |
27.68 | 23.50 | 21.70 | 17.33 | ||||||||||||
| Fourth quarter |
29.76 | 25.92 | 28.43 | 18.01 | ||||||||||||
Cash Dividends Paid
| 2017 | 2016 | |||||||
| First quarter |
$ | 0.165 | $ | 0.165 | ||||
| Second quarter |
0.165 | 0.165 | ||||||
| Third quarter |
0.165 | 0.165 | ||||||
| Fourth quarter |
0.165 | 0.165 | ||||||
See Note 18 to the consolidated financial statements in Item 8 and “Supervision and Regulation—Dividend Restrictions” in Part I, Item 1 for a discussion of dividend restrictions.
Issuer Purchases of Equity Securities
The following table provides information with respect to any purchase of shares of the Corporation’s common stock made by or on behalf of the Corporation for the quarter ended December 31, 2017.
| Period |
Total Number of Shares Purchased |
Average Price Paid per Share |
Total Number of Shares Purchased as Part of Publicly Announced Plans or Programs |
Maximum Number (or approximate dollar value) of Shares that May Yet Be Purchased Under the Plans or Programs |
||||||||||||
| October 1 – 31, 2017 |
- | - | - | 400,026 | (1) | |||||||||||
| November 1 – 31, 2017 |
- | - | - | 400,026 | (1) | |||||||||||
| December 1 – 31, 2017 |
19,397 | $ | 26.31 | 19,397 | 380,629 | (1) | ||||||||||
29
Table of Contents
| (1) | The Corporation’s new stock repurchase program, which was announced on November 12, 2014, authorizes the repurchase of up to 500,000 shares of common stock. The program will remain in effect until fully utilized or until modified, suspended or terminated. As of December 31, 2017, there were 380,629 shares remaining in the program. |
Performance Graph
Set forth below is a chart comparing the Corporation’s cumulative return to stockholders against the cumulative return of the NASDAQ Composite Index and a Peer Group Index of banking organizations for the five-year period commencing December 31, 2012 and ending December 31, 2017.
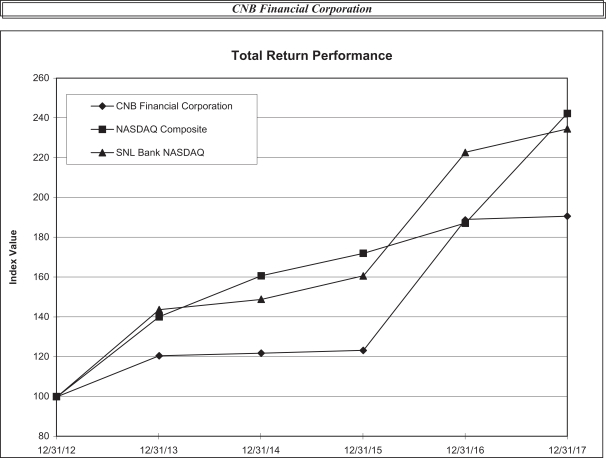
| Period Ending | ||||||||||||||||||||||||
| Index |
12/31/12 | 12/31/13 | 12/31/14 | 12/31/15 | 12/31/16 | 12/31/17 | ||||||||||||||||||
| CNB Financial Corporation |
100.00 | 120.46 | 121.79 | 123.27 | 189.10 | 190.60 | ||||||||||||||||||
| NASDAQ Composite |
100.00 | 140.12 | 160.78 | 171.97 | 187.22 | 242.71 | ||||||||||||||||||
| SNL Bank NASDAQ |
100.00 | 143.73 | 148.86 | 160.70 | 222.81 | 234.58 | ||||||||||||||||||
| Source : S&P Global Market Intelligence | ||
| © 2017 |
||
30
Table of Contents
ITEM 6. SELECTED FINANCIAL DATA
| Year ended December 31, |
||||||||||||||||||||
| (Dollars in thousands, except per share data) | 2017 | 2016 | 2015 | 2014 | 2013 | |||||||||||||||
|
|
||||||||||||||||||||
| INTEREST AND DIVIDEND INCOME: |
||||||||||||||||||||
| Loans including fees |
$ | 97,005 | $ | 81,209 | $ | 71,814 | $ | 69,512 | $ | 53,927 | ||||||||||
| Securities: |
||||||||||||||||||||
| Taxable |
8,165 | 9,134 | 10,977 | 13,257 | 13,456 | |||||||||||||||
| Tax-exempt |
2,983 | 3,390 | 3,778 | 3,713 | 3,828 | |||||||||||||||
| Dividends |
721 | 582 | 609 | 400 | 205 | |||||||||||||||
|
|
|
|
|
|
|
|
|
|
|
|||||||||||
| Total interest and dividend income |
108,874 | 94,315 | 87,178 | 86,882 | 71,416 | |||||||||||||||
|
|
|
|
|
|
|
|
|
|
|
|||||||||||
| INTEREST EXPENSE: |
||||||||||||||||||||
| Deposits |
9,312 | 8,470 | 8,498 | 8,300 | 7,995 | |||||||||||||||
| Borrowed funds |
4,021 | 2,981 | 3,222 | 3,241 | 3,447 | |||||||||||||||
| Subordinated debentures |
4,032 | 1,577 | 751 | 746 | 770 | |||||||||||||||
|
|
|
|
|
|
|
|
|
|
|
|||||||||||
| Total interest expense |
17,365 | 13,028 | 12,471 | 12,287 | 12,212 | |||||||||||||||
|
|
|
|
|
|
|
|
|
|
|
|||||||||||
| NET INTEREST INCOME |
91,509 | 81,287 | 74,707 | 74,595 | 59,204 | |||||||||||||||
| PROVISION FOR LOAN LOSSES |
6,655 | 4,149 | 2,560 | 3,840 | 6,138 | |||||||||||||||
|
|
|
|
|
|
|
|
|
|
|
|||||||||||
| Net interest income after provision for loan losses |
84,854 | 77,138 | 72,147 | 70,755 | 53,066 | |||||||||||||||
| NON-INTEREST INCOME |
21,435 | 17,691 | 14,799 | 14,321 | 13,766 | |||||||||||||||
| NON-INTEREST EXPENSES |
70,037 | 67,118 | 56,457 | 52,688 | 43,813 | |||||||||||||||
|
|
|
|
|
|
|
|
|
|
|
|||||||||||
| INCOME BEFORE INCOME TAXES |
36,252 | 27,711 | 30,489 | 32,388 | 23,019 | |||||||||||||||
| INCOME TAX EXPENSE |
12,392 | 7,171 | 8,292 | 9,314 | 6,340 | |||||||||||||||
|
|
|
|
|
|
|
|
|
|
|
|||||||||||
| NET INCOME |
$ | 23,860 | $ | 20,540 | $ | 22,197 | $ | 23,074 | $ | 16,679 | ||||||||||
|
|
|
|
|
|
|
|
|
|
|
|||||||||||
| PER SHARE DATA: |
||||||||||||||||||||
| Basic |
$ | 1.57 | $ | 1.42 | $ | 1.54 | $ | 1.60 | $ | 1.29 | ||||||||||
| Fully diluted |
1.57 | 1.42 | 1.54 | 1.60 | 1.29 | |||||||||||||||
| Dividends declared |
0.66 | 0.66 | 0.66 | 0.66 | 0.66 | |||||||||||||||
| Book value per share at year end |
15.98 | 14.64 | 13.87 | 13.09 | 11.43 | |||||||||||||||
| AT END OF PERIOD: |
||||||||||||||||||||
| Total assets |
$ | 2,768,773 | $ | 2,573,821 | $ | 2,285,136 | $ | 2,189,213 | $ | 2,131,289 | ||||||||||
| Securities |
416,859 | 500,693 | 550,619 | 690,225 | 690,118 | |||||||||||||||
| Loans, net of unearned discount |
2,145,959 | 1,873,536 | 1,577,798 | 1,355,289 | 1,295,363 | |||||||||||||||
| Allowance for loan losses |
19,693 | 16,330 | 16,737 | 17,373 | 16,234 | |||||||||||||||
| Deposits |
2,167,815 | 2,017,522 | 1,815,053 | 1,847,079 | 1,835,314 | |||||||||||||||
| FHLB and other borrowings |
222,943 | 102,926 | 104,243 | 75,715 | 75,000 | |||||||||||||||
| Subordinated debentures |
70,620 | 70,620 | 20,620 | 20,620 | 20,620 | |||||||||||||||
| Deposits held for sale |
0 | 6,456 | 0 | 0 | 0 | |||||||||||||||
| Shareholders’ equity |
243,910 | 211,784 | 201,913 | 188,548 | 164,911 | |||||||||||||||
| KEY RATIOS: |
||||||||||||||||||||
| Return on average assets |
0.89% | 0.85% | 0.99% | 1.07% | 0.88% | |||||||||||||||
| Return on average equity |
9.97% | 9.69% | 11.23% | 12.76% | 11.38% | |||||||||||||||
| Loan to deposit ratio |
98.99% | 92.86% | 86.93% | 73.37% | 70.58% | |||||||||||||||
| Dividend payout ratio |
42.31% | 46.48% | 42.86% | 41.26% | 51.40% | |||||||||||||||
| Average equity to average assets ratio |
8.93% | 8.76% | 8.86% | 8.37% | 7.73% | |||||||||||||||
31
Table of Contents
ITEM 7. MANAGEMENT’S DISCUSSION AND ANALYSIS OF FINANCIAL CONDITION AND RESULTS OF OPERATIONS
The following discussion and analysis of the consolidated financial statements of CNB Financial Corporation (the “Corporation”) is presented to provide insight into management’s assessment of financial results. The Corporation’s subsidiary, CNB Bank (the “Bank”), provides financial services to individuals and businesses primarily within its primary market area of the Pennsylvania counties of Blair, Cambria, Cameron, Centre, Clearfield, Crawford, Elk, Indiana, Jefferson, and McKean. As ERIEBANK, a division of CNB Bank, the Bank operates in the Pennsylvania counties of Crawford, Erie, and Warren and in the Ohio counties of Ashtabula and Lake. As FCBank, a division of CNB Bank, the Bank operates in the Ohio counties of Crawford, Richland, Ashland, Wayne, Marion, Morrow, Knox, Delaware, and Franklin. As BankOnBuffalo, a division of CNB Bank, the Bank operates in Erie and Niagara counties, New York. The Bank is subject to regulation, supervision and examination by the Pennsylvania State Department of Banking as well as the Federal Deposit Insurance Corporation.
CNB Securities Corporation is incorporated in Delaware and currently maintains investments in debt and equity securities. CNB Insurance Agency, incorporated in Pennsylvania, provides for the sale of nonproprietary annuities and other insurance products. Holiday Financial Services Corporation (“Holiday”), incorporated in Pennsylvania, offers small balance unsecured loans and secured loans, primarily collateralized by automobiles and equipment, to borrowers with higher risk characteristics.
The financial condition and results of operations of the Corporation and its consolidated subsidiaries are not necessarily indicative of future performance. Management’s discussion and analysis should be read in conjunction with the audited consolidated financial statements and related notes.
Risk identification and management are essential elements for the successful management of the Corporation. In the normal course of business, the Corporation is subject to various types of risk, including interest rate, credit, and liquidity risk. These risks are controlled through policies and procedures established by the Corporation.
Interest rate risk is the sensitivity of net interest income and the market value of financial instruments to the direction and frequency of changes in interest rates. Interest rate risk results from various repricing frequencies and the maturity structure of the financial instruments owned by the Corporation. The Corporation uses its asset/liability management policy and systems to control, monitor and manage interest rate risk.
Credit risk represents the possibility that a customer may not perform in accordance with contractual terms. Credit risk results from loans to customers and the purchase of securities. The Corporation manages credit risk by following an established credit policy and using a disciplined evaluation of the adequacy of the allowance for loan losses. Also, the investment policy limits the amount of credit risk that may be taken in the securities portfolio.
Liquidity risk represents the inability to generate or otherwise obtain funds at reasonable rates to satisfy commitments to borrowers and obligations to depositors. The Corporation has established guidelines within its asset-liability management policy to manage liquidity risk. These guidelines include contingent funding alternatives.
32
Table of Contents
Forward-Looking Statements
The information below includes forward-looking statements within the meaning of Section 27A of the Securities Act of 1933, as amended, and Section 21E of the Securities Exchange Act of 1934, as amended, with respect to the financial condition, liquidity, results of operations, future performance and our business. These forward-looking statements are intended to be covered by the safe harbor for “forward-looking statements” provided by the Private Securities Litigation Reform Act of 1995. Forward-looking statements are those that are not historical facts. Forward-looking statements include statements with respect to beliefs, plans, objectives, goals, expectations, anticipations, estimates and intentions that are subject to significant risks and uncertainties and are subject to change based on various factors (some of which are beyond our control). Forward-looking statements often include the words “believes,” “expects,” “anticipates,” “estimates,” “forecasts,” “intends,” “plans,” “targets,” “potentially,” “probably,” “projects,” “outlook” or similar expressions or future conditional verbs such as “may,” “will,” “should,” “would” and “could.” Such known and unknown risks, uncertainties and other factors that could cause the actual results to differ materially from the statements, include, but are not limited to, (i) changes in general business, industry or economic conditions or competition; (ii) changes in any applicable law, rule, regulation, policy, guideline or practice governing or affecting financial holding companies and their subsidiaries or with respect to tax or accounting principals or otherwise; (iii) adverse changes or conditions in capital and financial markets; (iv) changes in interest rates; (v) higher than expected costs or other difficulties related to integration of combined or merged businesses; (vi) the inability to realize expected cost savings or achieve other anticipated benefits in connection with business combinations and other acquisitions; (vii) changes in the quality or composition of our loan and investment portfolios; (viii) adequacy of loan loss reserves; (ix) increased competition; (x) loss of certain key officers; (xi) deposit attrition; (xii) rapidly changing technology; (xiii) unanticipated regulatory or judicial proceedings and liabilities and other costs; (xiv) changes in the cost of funds, demand for loan products or demand for financial services; and (xv) other economic, competitive, governmental or technological factors affecting our operations, markets, products, services and prices. Such developments could have an adverse impact on our financial position and our results of operations.
The forward-looking statements contained herein are based upon management’s beliefs and assumptions. Any forward-looking statement made herein speaks only as of the date on which it is made. Factors or events that could cause our actual results to differ may emerge from time to time, and it is not possible for us to predict all of them. We undertake no obligation to publicly update any forward-looking statement, whether as a result of new information, future developments or otherwise, except as may be required by law.
General Overview
Management concentrates on return on average equity, earnings per share, asset quality, and other metrics to measure the performance of the Corporation. The interest rate environment will continue to play an important role in the future earnings of the Corporation. During the past several years, in order to address the historic lows on interest rates that are primarily tied to short-term rates, such as the Prime Rate, the Corporation has taken a variety of measures including instituting rate floors on our commercial lines of credit and home equity lines.
Non-interest costs are expected to increase with the growth of the Corporation; however, management’s growth strategies are expected to also result in an increase in earning assets as well as
33
Table of Contents
enhanced non-interest income which is expected to more than offset increases in non-interest expenses in 2018 and beyond. While past results are not an indication of future earnings, management believes the Corporation is well positioned to sustain core earnings during 2018.
Financial Condition
The following table presents ending balances, growth, and the percentage change of certain measures of our financial condition for specified years (dollars in millions):
| 2017 Balance |
$ Change vs. prior year |
% Change vs. prior year |
2016 Balance |
$ Change vs. prior year |
% Change vs. prior year |
2015 Balance |
||||||||||||||||||||||
| Total assets |
$ | 2,768.8 | $ | 195.0 | 7.6 | % | $ | 2,573.8 | $ | 288.7 | 12.6 | % | $ | 2,285.1 | ||||||||||||||
| Total loans, net |
2,126.3 | 269.1 | 14.5 | 1,857.2 | 296.1 | 19.0 | 1,561.1 | |||||||||||||||||||||
| Total securities |
416.9 | (83.8 | ) | (16.7 | ) | 500.7 | (49.9 | ) | (9.1 | ) | 550.6 | |||||||||||||||||
| Total deposits |
2,167.8 | 150.3 | 7.4 | 2,017.5 | 202.4 | 11.2 | 1,815.1 | |||||||||||||||||||||
| Total shareholders’ equity |
243.9 | 32.1 | 15.2 | 211.8 | 9.9 | 4.9 | 201.9 | |||||||||||||||||||||
Cash and Cash Equivalents
Cash and cash equivalents totaled $35.3 million at December 31, 2017 compared to $29.2 million at December 31, 2016. Cash and cash equivalents fluctuate based on the timing and amount of liquidity events that occur in the normal course of business.
We believe the liquidity needs of the Corporation are satisfied by the current balance of cash and cash equivalents, readily available access to traditional funding sources, Federal Home Loan Bank financing, and the portion of the securities and loan portfolios that matures within one year. These sources of funds will enable the Corporation to meet cash obligations and off-balance sheet commitments as they come due.
Securities
Securities available for sale and trading securities totaled $416.9 million and $500.7 million at December 31, 2017 and 2016, respectively. Note 4 to the consolidated financial statements provides more detail concerning the composition of the Corporation’s securities portfolio, the process for evaluating securities for other-than-temporary impairment, and for valuation of structured pooled trust preferred securities.
The Corporation generally buys into the market over time and does not attempt to “time” its transactions. In doing this, the highs and lows of the market are averaged into the portfolio and the overall effect of different rate environments is minimized. The Corporation monitors the earnings performance and the effectiveness of the liquidity of the securities portfolio on a regular basis through meetings of the Asset/Liability Committee of the Corporation’s Board of Directors (“ALCO”). The ALCO also reviews and manages interest rate risk for the Corporation. Through active balance sheet management and analysis of the securities portfolio, we maintain a sufficient level of liquidity to satisfy depositor requirements and various credit needs of our customers.
34
Table of Contents
Loans
As detailed in the table below, at December 31, 2017, the Corporation had $2.1 billion in loans outstanding, net of unearned discount, an increase of $272.4 million, or 14.5%, since December 31, 2016.
| (dollars in thousands) | 2017 | 2016 | ||||||
| Commercial, industrial, and agricultural |
$ | 749,138 | $ | 567,800 | ||||
| Commercial mortgages |
600,065 | 574,826 | ||||||
| Residential real estate |
713,347 | 652,883 | ||||||
| Consumer |
80,193 | 74,816 | ||||||
| Credit cards |
6,753 | 6,046 | ||||||
| Overdrafts |
352 | 595 | ||||||
| Less: unearned discount |
(3,889 | ) | (3,430 | ) | ||||
|
|
|
|
|
|||||
| Total loans, net of unearned discount |
$ | 2,145,959 | $ | 1,873,536 | ||||
|
|
|
|
|
|||||
The Corporation has not underwritten any hybrid loans, payment option loans, or low documentation/no documentation loans. Variable rate loans are generally underwritten at the fully indexed rate. Loan underwriting policies and procedures have not changed materially between any periods presented.
The Corporation expects strong loan growth in 2018 as it expands within the Buffalo, New York market and expands commercial lending relationships in its Pennsylvania and Ohio markets.
Loan Concentration
The Corporation monitors loan concentrations by individual industries in order to track potential risk exposures resulting from industry related downturns. At December 31, 2017, no concentration existed within our commercial or real estate loan portfolio that exceeded 10% of the total loans.
Loan Quality
The Corporation has established written lending policies and procedures that require underwriting standards, loan documentation, and credit analysis standards to be met prior to funding a loan. Subsequent to the funding of a loan, ongoing review of credits is required. Credit reviews are performed annually on approximately 65% of the commercial loan portfolio by an outsourced loan review firm. In addition, classified assets, past due loans and nonaccrual loans are reviewed by the loan review partner semiannually by our credit administration staff.
35
Table of Contents
The following table presents information concerning loan delinquency and other nonperforming assets at December 31, 2017, 2016, and 2015 (dollars in thousands):
| 2017 | 2016 | 2015 | ||||||||||
| Nonaccrual loans |
$ | 19,232 | $ | 15,329 | $ | 12,159 | ||||||
| Accrual loans greater than 90 days past due |
485 | 10 | 105 | |||||||||
|
|
|
|
|
|
|
|||||||
| Total nonperforming loans |
19,717 | 15,339 | 12,264 | |||||||||
| Other real estate owned |
710 | 1,015 | 654 | |||||||||
|
|
|
|
|
|
|
|||||||
| Total nonperforming assets |
$ | 20,427 | $ | 16,354 | $ | 12,918 | ||||||
|
|
|
|
|
|
|
|||||||
| Loans modified in a troubled debt restructuring (TDR): |
||||||||||||
| Performing TDR loans |
$ | 8,344 | $ | 8,710 | $ | 9,304 | ||||||
| Nonperforming TDR loans * |
8,959 | 3,120 | 5,637 | |||||||||
|
|
|
|
|
|
|
|||||||
| Total TDR loans |
$ | 17,303 | $ | 11,830 | $ | 14,941 | ||||||
|
|
|
|
|
|
|
|||||||
| Total loans, net of unearned income |
$ | 2,145,959 | $ | 1,873,536 | $ | 1,577,798 | ||||||
| Nonperforming loans as a percentage of loans, net |
0.92% | 0.82% | 0.78% | |||||||||
| Total assets |
$ | 2,768,773 | $ | 2,573,821 | $ | 2,285,136 | ||||||
| Nonperforming assets as a percentage of total assets |
0.71% | 0.64% | 0.57% | |||||||||
* - Nonperforming TDR loans are also included in the balance of nonaccrual loans in the previous table.
Management continues to closely monitor nonperforming loans, and the Corporation’s nonperforming loans to total loans ratio continues to be favorable compared to peer institutions. See the “Allowance for Loan Losses” section for further discussion of credit review procedures and changes in nonperforming loans.
Allowance for Loan Losses
The allowance for loan losses is established by provisions for losses in the loan portfolio as well as overdrafts in deposit accounts. These provisions are charged against current income. Loans and overdrafts deemed not collectible are charged off against the allowance while any subsequent collections are recorded as recoveries and increase the allowance.
36
Table of Contents
The following table presents activity within the allowance for loan losses during the years ended December 31, 2017, 2016, and 2015 (dollars in thousands):
| 2017 | 2016 | 2015 | ||||||||||
| Balance at beginning of period |
$ | 16,330 | $ | 16,737 | $ | 17,373 | ||||||
|
|
|
|
|
|
|
|||||||
| Charge-offs: |
||||||||||||
| Commercial, industrial, and agricultural |
(544 | ) | (601 | ) | (307 | ) | ||||||
| Commercial mortgages |
(116 | ) | (201 | ) | (486 | ) | ||||||
| Residential real estate |
(466 | ) | (499 | ) | (632 | ) | ||||||
| Consumer |
(2,555 | ) | (3,324 | ) | (1,956 | ) | ||||||
| Credit cards |
(144 | ) | (96 | ) | (116 | ) | ||||||
| Overdrafts |
(252 | ) | (240 | ) | (221 | ) | ||||||
|
|
|
|
|
|
|
|||||||
| (4,077 | ) | (4,961 | ) | (3,718 | ) | |||||||
|
|
|
|
|
|
|
|||||||
| Recoveries: |
||||||||||||
| Commercial, industrial, and agricultural |
235 | 89 | 267 | |||||||||
| Commercial mortgages |
197 | 8 | 52 | |||||||||
| Residential real estate |
78 | 93 | 8 | |||||||||
| Consumer |
161 | 122 | 96 | |||||||||
| Credit cards |
27 | 22 | 14 | |||||||||
| Overdrafts |
87 | 71 | 85 | |||||||||
|
|
|
|
|
|
|
|||||||
| 785 | 405 | 522 | ||||||||||
|
|
|
|
|
|
|
|||||||
| Net charge-offs |
(3,292 | ) | (4,556 | ) | (3,196 | ) | ||||||
|
|
|
|
|
|
|
|||||||
| Provision for loan losses |
6,655 | 4,149 | 2,560 | |||||||||
|
|
|
|
|
|
|
|||||||
| Balance at end of period |
$ | 19,693 | $ | 16,330 | $ | 16,737 | ||||||
|
|
|
|
|
|
|
|||||||
| Loans, net of unearned income |
$ | 2,145,959 | $ | 1,873,536 | $ | 1,577,798 | ||||||
| Allowance to net loans |
0.92% | 0.87% | 1.06% | |||||||||
The adequacy of the allowance for loan losses is subject to a formal analysis by the Credit Administration and Finance Departments of the Corporation. As part of the formal analysis, delinquencies and losses are monitored monthly. The loan portfolio is divided into several categories in order to better analyze the entire pool. First, impaired loans are selected and that group of loans is given a specific reserve. The remaining loans are pooled, by category, into these segments:
Reviewed
| • | Commercial, industrial, and agricultural |
| • | Commercial mortgages |
Homogeneous
| • | Residential real estate |
| • | Consumer |
| • | Credit cards |
| • | Overdrafts |
The reviewed loan pools are further segregated into three categories: special mention, substandard, and doubtful. Historical loss factors are calculated for each reviewed pool, excluding overdrafts, based on the previous eight quarters of experience. The homogeneous pools are evaluated by analyzing the historical loss factors from the most previous quarter end and the two most recent year ends.
37
Table of Contents
The historical loss factors for both the reviewed and homogeneous pools are adjusted based on these six qualitative factors:
| • | Levels of and trends in delinquencies, nonaccrual loans, and classified loans; |
| • | Trends in volume and terms of loans; |
| • | Effects of any changes in lending policies and procedures; |
| • | Experience, ability and depth of management; |
| • | National and local economic trends and conditions; and |
| • | Concentrations of credit. |
The methodology described above was created using the experience of our Credit Administration and Finance Departments, guidance from the regulatory agencies, expertise of our third party loan review provider, and discussions with our peers. The resulting factors are applied to the pool balances in order to estimate the probable risk of loss within each pool.
As a result of the application of these procedures, the allocation of the allowance for loan losses was as follows at December 31, 2017, 2016, and 2015 (in thousands):
| 2017 | 2016 | 2015 | ||||||||||
| Commercial, industrial, and agricultural |
$ | 6,160 | $ | 5,428 | $ | 6,035 | ||||||
| Commercial mortgages |
9,007 | 6,753 | 5,605 | |||||||||
| Residential real estate |
2,003 | 1,653 | 2,475 | |||||||||
| Consumer |
2,179 | 2,215 | 2,371 | |||||||||
| Credit cards |
120 | 93 | 90 | |||||||||
| Overdrafts |
194 | 188 | 161 | |||||||||
|
|
|
|
|
|
|
|||||||
| Total |
$ | 19,693 | $ | 16,330 | $ | 16,737 | ||||||
|
|
|
|
|
|
|
|||||||
Throughout 2017, the Corporation evaluated its provision and allowance for loan losses in light of changes in reserves required for impaired loans, changes in nonperforming loans, and growth in loans outstanding. Note 5 to the consolidated financial statements provides further disclosure of loan balances by portfolio segment as of December 31, 2017 and 2016, as well as the nature and scope of loans modified in a troubled debt restructuring during 2017 and 2016 and the related effect on the provision and allowance for loan losses.
During the year ended December 31, 2017, the Corporation recorded a provision for loan losses of $6.7 million, as compared to a provision for loan losses of $4.1 million for the year ended December 31, 2016. Net chargeoffs during the year ended December 31, 2017 were $3.3 million, compared to net chargeoffs of $4.6 million during the year ended December 31, 2016, and the ratio of net chargeoffs to average loans was 0.16% and 0.27% for the years ended December 31, 2017 and 2016, respectively.
CNB Bank net chargeoffs totaled $2.2 million and $1.7 million during the years ended December 31, 2017 and 2016, or 0.06% and 0.10%, respectively, of average CNB Bank loans. Holiday Financial Services Corporation, CNB’s consumer discount company, recorded net chargeoffs totaling $1.1 million and $2.9 million during the years ended December 31, 2017 and 2016, respectively.
In 2017, one commercial real estate loan that was impaired at year end 2016 but still on accrual status was placed on nonaccrual status as a result of further deterioration in the financial condition of the
38
Table of Contents
borrower. The additional provision for loan losses recorded in 2017 related to this loan was $2.9 million, including $1.6 million in the fourth quarter of 2017, which was based on the most current financial information available from the borrower. In 2017, CNB also increased its provision for loan losses as a result of stronger organic loan growth compared to 2016.
Prudent business practices dictate that the level of the allowance, as well as corresponding charges to the provision for loan losses, should be commensurate with identified areas of risk within the loan portfolio and the attendant risks inherent therein. The quality of the credit risk management function and the overall administration of this vital segment of the Corporation’s assets are critical to the ongoing success of the Corporation.
The previously mentioned analysis considered numerous historical and other factors to analyze the adequacy of the allowance and charges against the provision for loan losses. Management paid special attention to a section of the analysis that compared and plotted the actual level of the allowance against the aggregate amount of loans adversely classified in order to compute the estimated probable losses associated with those loans. By noting the “spread” at that time, as well as prior periods, management can evaluate the current adequacy of the allowance as well as evaluate trends that may be developing. The volume and composition of the Corporation’s loan portfolio continue to reflect growth in commercial credits including commercial real estate loans.
As mentioned in the “Loans” section of this analysis, management continues to focus on commercial lending as part of its strategic growth initiatives. However, management must also consider the fact that the inherent risk is more pronounced in these types of credits and is also driven by the economic environment of its market areas.
Management believes that both its 2017 provision and allowance for loan losses were reasonable and adequate to absorb probable incurred losses in its portfolio at December 31, 2017.
Premises and Equipment
During the years ended December 31, 2017 and 2016, the Corporation invested $5.2 million and $10.1 million, respectively, in its physical infrastructure through the purchase of land, buildings, and equipment. The Corporation completed the construction of a full-service banking facility in Worthington, Ohio in 2016 that also houses the FCBank leadership and administrative teams. In addition, the construction of full-service branches in Altoona, Pennsylvania and Ashtabula, Ohio were substantially complete by December 31, 2016, and both locations opened for business in February 2017. Premises and equipment with a fair value of $3.2 million were recorded in 2016 in conjunction with the acquisition of Lake National Bank.
Bank Owned Life Insurance
The Corporation has periodically purchased Bank Owned Life Insurance (“BOLI”). The policies cover executive officers and a select group of other employees with the Bank being named as beneficiary. Earnings from BOLI assist the Corporation in offsetting its benefit costs. Additional BOLI of $10.0 million was purchased during the year ended December 31, 2017, no BOLI was purchased during the year ended December 31, 2016, and BOLI with a fair value of $2.2 million was acquired from Lake National Bank during the year ended December 31, 2016.
39
Table of Contents
Funding Sources
Although the Corporation considers short-term borrowings and long-term debt when evaluating funding sources, traditional deposits continue to be the main source for funding.
| (dollars in thousands) | Percentage change |
Percentage change |
2017 |
2016 |
2015 |
|||||||||||||||
| Demand, Non interest bearing |
11.0 | % | 10.0 | % | $ | 321,858 | $ | 289,922 | $ | 263,639 | ||||||||||
| Demand, Interest bearing |
4.1 | % | 23.4 | % | 565,399 | 543,388 | 440,174 | |||||||||||||
| Savings deposits |
(4.0 | %) | 2.8 | % | 915,587 | 953,438 | 927,074 | |||||||||||||
| Time deposits |
58.2 | % | 25.3 | % | 364,971 | 230,774 | 184,166 | |||||||||||||
|
|
|
|
|
|
|
|||||||||||||||
| Total |
7.4 | % | 11.2 | % | $ | 2,167,815 | $ | 2,017,522 | $ | 1,815,053 | ||||||||||
|
|
|
|
|
|
|
|||||||||||||||
During the year of 2017, the Corporation ran time deposit specials resulting in the both new deposit inflow and a transfer from savings balances. Organic deposit growth in 2016 was 3.2%, and the Corporation acquired deposits from Lake National Bank in 2016 totaling $139.8 million.
Periodically, the Corporation utilizes term borrowings from the Federal Home Loan Bank (FHLB) and other lenders to meet funding obligations or match fund certain loan assets. The terms of these borrowings are detailed in Note 11 to the consolidated financial statements.
During the year of 2016, the Corporation repaid FHLB long-term borrowings totaling $40.0 million which carried interest rates ranging from 3.97% to 4.60% and incurred an early repayment penalty of $1.5 million. Resulting interest expense savings for 2016 and 2017 totaled an aggregate of $1.9 million.
In September 2016, the Corporation completed a private placement of $50 million in aggregate principal amount of fixed-to-floating rate subordinated notes. The notes will mature in October 2026, and will initially bear interest at a fixed rate of 5.75% per annum, payable semi-annually in arrears, to, but excluding, October 15, 2021, and thereafter to, but excluding, the maturity date or earlier redemption, the interest rate shall reset quarterly to an interest rate per annum equal to the then current three-month LIBOR rate plus 455 basis points. These subordinated notes were designed to qualify as Tier 2 capital under the Federal Reserve’s capital guidelines and were given an investment grade rating of BBB- by Kroll Bond Rating Agency. The Corporation injected the net proceeds from the subordinated notes into its bank subsidiary, CNB Bank, and intends to use the capital for general corporate purposes, including loan growth, additional liquidity, and working capital.
Shareholders’ Equity and Capital Ratios and Metrics
The Corporation’s capital continues to provide a base for profitable growth. In 2017, the Corporation earned $23.9 million and declared dividends of $10.1 million, resulting in a dividend payout ratio of 42.3% of net income.
In February 2017, the Corporation completed an at-the-market common stock issuance. A total of 834,896 shares of the Corporation’s common stock were sold at a weighted average price of approximately $23.96, representing gross proceeds to the Corporation of $20.0 million. Net proceeds from the transaction, after the sales commission and other expenses, were $19.3 million, which will be used for general corporate purposes, including loan growth, additional liquidity, and working capital.
40
Table of Contents
The Corporation has complied with the standards of capital adequacy mandated by government regulations. Bank regulators have established “risk-based” capital requirements designed to measure capital adequacy. Risk-based capital ratios reflect the relative risks of various assets banks hold in their portfolios. A weight category of 0% (lowest risk assets), 20%, 50%, 100% or 150% (highest risk assets), is assigned to each asset on the balance sheet.
The Corporation’s capital ratios and book value per common share at December 31, 2017 and 2016 are as follows:
| 2017 | 2016 | |||||||
| Total risk-based capital ratio |
14.32 | % | 14.05 | % | ||||
| Tier 1 capital ratio |
10.97 | % | 10.49 | % | ||||
| Common equity tier 1 ratio |
10.00 | % | 9.41 | % | ||||
| Leverage ratio |
8.45 | % | 7.85 | % | ||||
| Tangible common equity/tangible assets (1) |
7.46 | % | 6.72 | % | ||||
| Book value per share |
$ | 15.98 | $ | 14.64 | ||||
| Tangible book value per share (1) |
$ | 13.33 | $ | 11.76 | ||||
| (1) | Tangible common equity, tangible assets and tangible book value per share are non-GAAP financial measures calculated using GAAP amounts. Tangible common equity is calculated by excluding the balance of goodwill and other intangible assets from the calculation of stockholders’ equity. Tangible assets is calculated by excluding the balance of goodwill and other intangible assets from the calculation of total assets. Tangible book value per share is calculated by dividing tangible common equity by the number of shares outstanding. The Corporation believes that these non-GAAP financial measures provide information to investors that is useful in understanding its financial condition. Because not all companies use the same calculation of tangible common equity and tangible assets, this presentation may not be comparable to other similarly titled measures calculated by other companies. A reconciliation of these non-GAAP financial measures is provided below (dollars in thousands, except per share data). |
| December 31, 2017 |
December 31, 2016 |
|||||||
| Shareholders’ equity |
$ | 243,910 | $ | 211,784 | ||||
| Less goodwill |
38,730 | 38,730 | ||||||
| Less core deposit intangible |
1,625 | 2,854 | ||||||
|
|
|
|
|
|||||
| Tangible common equity |
$ | 203,555 | $ | 170,200 | ||||
|
|
|
|
|
|||||
| Total assets |
$ | 2,768,773 | $ | 2,573,821 | ||||
| Less goodwill |
38,730 | 38,730 | ||||||
| Less core deposit intangible |
1,625 | 2,854 | ||||||
|
|
|
|
|
|||||
| Tangible assets |
$ | 2,728,418 | $ | 2,532,237 | ||||
|
|
|
|
|
|||||
| Ending shares outstanding |
15,264,740 | 14,467,815 | ||||||
| Tangible book value per share |
$ | 13.33 | $ | 11.76 | ||||
| Tangible common equity/tangible assets |
7.46% | 6.72% | ||||||
Liquidity
Liquidity measures an organization’s ability to meet its cash obligations as they come due. The consolidated statements of cash flows included in the accompanying financial statements provide
41
Table of Contents
analysis of the Corporation’s cash and cash equivalents and the sources and uses of cash. Additionally, the portion of the loan portfolio that matures within one year and securities with maturities within one year in the investment portfolio are considered part of the Corporation’s liquid assets. Liquidity is monitored by both management and the Board’s ALCO, which establishes and monitors ranges of acceptable liquidity. Also, the Bank is a member of FHLB which provides the Bank with a total borrowing line of approximately $790 million with approximately $533 million available at December 31, 2017. Management believes that the Corporation’s current liquidity position is acceptable.
Year Ended December 31, 2017 vs. Year Ended December 31, 2016
Overview of the Income Statement
The Corporation had net income of $23.9 million for 2017 compared to $20.5 million for 2016. Net interest income increased $10.2 million, or 12.6%, and non-interest income increased $3.7 million, or 21.2%. The provision for loan losses increased by $2.5 million, or 60.4%, and non-interest expenses increased by $2.9 million, or 4.3%. The earnings per diluted share were $1.57 in 2017 and $1.42 in 2016. The return on assets and the return on equity for 2017 were 0.89% and 9.97% as compared to 0.85% and 9.69% for 2016.
Interest Income and Expense
Net interest margin on a fully tax equivalent basis was 3.82% and 3.78% for the years ended December 31, 2017 and 2016, respectively.
As described in the Funding Sources section of Management’s Discussion and Analysis, the Corporation issued $50 million of subordinated debt on September 30, 2016. The interest expense on this subordinated debt was $3.2 million for the 2017 compared to $783 thousand for 2016.
Provision for Loan Losses
The Corporation recorded a provision for loan losses of $6.7 million in 2017 compared to $4.1 million in 2016. Net loan charge-offs were $3.3 million during the year ended December 31, 2017 compared to $4.6 million during the year ended December 31, 2016. As disclosed in the Allowance for Loan Losses section of Management’s Discussion and Analysis, the Corporation recorded the provision for loan losses based on management’s evaluation of impaired loans and consideration of trends in criticized and classified loans and historical loan losses.
Management believes the charges to the provision in 2017 are appropriate and the allowance for loan losses is adequate to absorb probable incurred losses in our portfolio as of December 31, 2017.
Non-Interest Income
Excluding the effects of securities transactions, non-interest income was $19.0 million for the year ended December 31, 2017, compared to $16.2 million for the year ended December 31, 2016. Net realized gains on available-for-sale securities were $1.5 million during the year ended December 31, 2017, compared to $1.0 million during the year ended December 31, 2016. Net realized and unrealized gains on trading securities were $881 thousand during the year ended December 31, 2017, compared to net realized and unrealized gains of $503 thousand during the year ended December 31, 2016.
42
Table of Contents
As a result of CNB’s continued focus on growing its Private Client Solutions division, wealth and asset management revenues were $3.7 million in 2017, an increase of 20.6% from $3.1 million in 2016. During 2017, CNB recorded $1.7 million in income from bank owned life insurance policies, including $387 thousand representing the death proceeds on life insurance policies in excess of the cash surrender value, compared to $1.1 million in 2016.
On May 19, 2017, CNB completed its previously announced sale of the Mt. Hope, Ohio branch to First Federal Community Bank. CNB transferred loans totaling $7,800, fixed assets totaling $100, and deposits totaling $7,400 in conjunction with the sale of the branch and realized a gain of $536 based on the 8% deposit premium paid by First Federal Community Bank.
Non-Interest Expense
Throughout 2017 and 2016, CNB made numerous infrastructure, personnel, and technology investments to facilitate its continued growth. Total non-interest expenses were $70.0 million during the year ended December 31, 2017, compared to $67.1 million during the year ended December 31, 2016. In order to better serve our customers and improve operational efficiencies, CNB completed a core processing system upgrade in May 2016. Included in non-interest expenses in 2016 are $3.7 million of non-recurring items, with costs associated with our core processing system upgrade of $1.7 million, merger related expenses of $486 thousand, and a prepayment penalty associated with the early payoff of long-term borrowings of $1.5 million.
Salaries and benefits expense increased $3.8 million, or 11.9%, during the year ended December 31, 2017 compared to the year ended December 31, 2016. As of December 31, 2017, the Corporation had 512 full-time equivalent staff, compared to 486 full-time equivalent staff as of December 31, 2016. The staff added during this period included both customer-facing personnel such as business development and wealth management officers, as well as support department personnel.
Year Ended December 31, 2016 vs. Year Ended December 31, 2015
Overview of the Income Statement
The Corporation had net income of $20.5 million for 2016 compared to $22.2 million for 2015. Net interest income increased $6.6 million, or 8.8%, and non-interest income increased $597 thousand, or 3.5%. The provision for loan losses increased by $1.6 million, or 62.1%, and non-interest expenses increased by $8.4 million, or 14.2%. The earnings per diluted share were $1.42 in 2016 and $1.54 in 2015. The return on assets and the return on equity for 2016 were 0.85% and 9.69% as compared to 0.99% and 11.23% for 2015. As described in Note 2 to the consolidated financial statements, Lake National Bank’s results of operations were included in the Corporation’s results beginning July 16, 2016.
Interest Income and Expense
Net interest margin on a fully tax equivalent basis was 3.78% and 3.73% for the years ended December 31, 2016 and 2015, respectively. Net accretion included in loan interest income in 2016 was $1.8 million, resulting in an increase in the net interest margin of 8 basis points. Net accretion included in loan interest income in 2015 was $2.2 million, resulting in an increase in the net interest margin of 11 basis points.
43
Table of Contents
As described in the Funding Sources section of Management’s Discussion and Analysis, the Corporation issued $50 million of subordinated debt on September 30, 2016. The interest expense on this subordinated debt was $783 thousand for the year ended December 31, 2016.
Changes in average earning assets, interest bearing liabilities, and resulting net interest income in 2016 compared to 2015 were a result of organic growth, the issuance of the subordinated debt described previously, and the acquisition of Lake National Bank in the third quarter of 2016.
Provision for Loan Losses
The Corporation recorded a provision for loan losses of $4.1 million in 2016 compared to $2.6 million in 2015. Net loan charge-offs were $4.6 million during the year ended December 31, 2016 compared to $3.2 million during the year ended December 31, 2015. As disclosed in the Allowance for Loan Losses section of Management’s Discussion and Analysis, the Corporation recorded the provision for loan losses based on management’s evaluation of impaired loans and consideration of trends in criticized and classified loans and historical loan losses.
Management believes the charges to the provision in 2016 are appropriate and the allowance for loan losses are adequate to absorb probable incurred losses in our portfolio as of December 31, 2016.
Non-Interest Income
Excluding the effects of securities transactions, non-interest income was $16.2 million for the year ended December 31, 2016, compared to $16.6 million for the year ended December 31, 2015. Net realized gains on available-for-sale securities were $1.0 million during the year ended December 31, 2016, compared to $666 thousand during the year ended December 31, 2015. Net realized and unrealized gains on trading securities were $503 thousand during the year ended December 31, 2016, compared to net realized and unrealized losses of $213 thousand during the year ended December 31, 2015.
Mortgage banking fees increased to $1.1 million for the year ended December 31, 2016, from $746 thousand during the year ended December 31, 2015 as the Corporation focused on selling an increased volume of mortgage loans in the secondary market, while retaining the servicing of the mortgages and resulting customer relationships.
Non-Interest Expense
Throughout 2016 and 2015, CNB made numerous infrastructure, personnel, and technology investments to facilitate its continued growth. Total non-interest expenses were $67.1 million during the year ended December 31, 2016, compared to $58.8 million during the year ended December 31, 2015. In order to better serve our customers and improve operational efficiencies, CNB completed a core processing system upgrade in May 2016. Included in non-interest expenses in 2016 are $3.7 million of non-recurring items, with costs associated with our core processing system upgrade of $1.7 million, merger related expenses of $486 thousand, and a prepayment penalty associated with the early payoff of long-term borrowings of $1.5 million. Costs for similar items in 2015 totaled $416 thousand in the aggregate.
Salaries and benefits expense increased $2.6 million, or 8.9%, during the year ended December 31, 2016 compared to the year ended December 31, 2015. As of December 31, 2016, the Corporation had 486 full-time equivalent staff, compared to 436 full-time equivalent staff as of December 31, 2015. The staff added during this period included both customer-facing personnel such as business development
44
Table of Contents
and wealth management officers, as well as support department personnel. In addition, the Corporation retained 20 employees in connection with its acquisition of Lake National Bank.
Income Tax Expense
Income taxes were $12.4 million in 2017, compared to $7.2 million in 2016 and $8.3 million in 2015. The effective tax rates were 34.2%, 25.9%, and 27.2% for 2017, 2016, and 2015, respectively. The effective tax rate for the periods differed from the federal statutory rate of 35.0% principally as a result of tax-exempt income from securities and loans as well as earnings from bank owned life insurance. In addition, the impact of the recent reduction in the federal corporate income tax rate to 21%, effective January 1, 2018, resulted in a $3.01 million income tax expense in 2017 related to the reduction in the carrying value of the net deferred tax asset.
Contractual Obligations and Commitments
The Corporation has various financial obligations, including contractual obligations and commitments that may require future cash payments. The following table presents, as of December 31, 2017, significant fixed and determinable contractual obligations to third parties by payment date.
Further discussion of the nature of each obligation is included in the referenced note to the consolidated financial statements.
| Payments Due In | ||||||||||||||||||||||||
| (dollars in thousands) | Note Reference |
One Year or Less |
One to Three Years |
Three to Five Years |
Over Five Years |
Total | ||||||||||||||||||
| Deposits without a stated maturity |
$ | 1,802,844 | $ | 0 | $ | 0 | $ | 0 | $ | 1,802,844 | ||||||||||||||
| Certificates of deposit |
10 | 125,809 | 220,401 | 14,835 | 3,926 | 364,971 | ||||||||||||||||||
| FHLB and other borrowings |
11 | 62,242 | 85,067 | 156,671 | 23,999 | 327,979 | ||||||||||||||||||
| Operating leases |
7 | 1,167 | 1,857 | 1,314 | 3,530 | 7,868 | ||||||||||||||||||
| Sale-leaseback |
7 | 105 | 210 | 210 | 420 | 945 | ||||||||||||||||||
| Subordinated debentures |
11 | 0 | 0 | 0 | 70,620 | 70,620 | ||||||||||||||||||
The Corporation’s operating lease obligations represent short and long-term lease and rental payment for facilities. The Corporation’s sale-leaseback obligation represents a long-term real estate lease associated with one of the Corporation’s branch office locations.
The Corporation also has obligations under its postretirement plan for health care and supplemental executive retirement plan as described in Note 14 to the consolidated financial statements. The postretirement benefit payments represent actuarially determined future benefit payments to eligible plan participants. The supplemental executive retirement plan allocates expenses over the participant’s service period. The Corporation reserves the right to terminate these plans at any time.
Off-Balance Sheet Arrangements
See Note 19 to the consolidated financial statements for information about our off-balance sheet arrangements.
Applications of Critical Accounting Policies
The Corporation’s consolidated financial statements are prepared in accordance with accounting principles generally accepted in the U.S. and follow general practices within the industries in which the
45
Table of Contents
Corporation operates. Application of these principles requires management to make estimates or judgments that affect the amounts reported in the financial statements and accompanying notes. These estimates are based on information available as of the date of the financial statements; accordingly, as this information changes, the financial statements could reflect different estimates or judgments. Certain policies inherently have a greater reliance on the use of estimates, and as such have a greater possibility of producing results that could be materially different than originally reported. Estimates or judgments are necessary when assets and liabilities are required to be recorded at fair value, when a decline in the value of an asset not carried on the financial statements at fair value warrants an impairment write-down or valuation reserve to be established, or when an asset or liability needs to be recorded contingent upon a future event. Carrying assets and liabilities at fair value inherently results in more financial statement volatility. The fair values and the information used to record valuation adjustments for certain assets and liabilities are based either on quoted market prices or are provided by other third party sources, when available. When third-party information is not available, valuation adjustments are estimated in good faith by management primarily through the use of internal cash flow modeling techniques.
The most significant accounting policies used by the Corporation are presented in Note 1 to the consolidated financial statements. These policies, along with the disclosures presented in the other financial statement notes and in this financial review, provide information on how significant assets and liabilities are valued in the financial statements and how those values are determined. Management views critical accounting policies to be those which are highly dependent on subjective or complex judgments, estimates and assumptions, and where changes in those estimates and assumptions could have a significant impact on the financial statements.
A material estimate that is susceptible to significant change is the determination of the allowance for loan losses. The Corporation’s methodology for determining the allowance for loan losses is described previously in Management’s Discussion and Analysis. Given the subjective nature of identifying and valuing loan losses, it is likely that well-informed individuals could make materially different assumptions and could therefore calculate a materially different allowance value. While management uses available information to recognize losses on loans, changes in economic conditions may necessitate revisions in future years. In addition, various regulatory agencies, as an integral part of their examination process, periodically review the Corporation’s allowance for loan losses. Such agencies may require the Corporation to recognize adjustments to the allowance based on their judgments of information available to them at the time of their examination.
Another material estimate is the calculation of fair values of the Corporation’s debt securities. For most of the Corporation’s debt securities, the Corporation receives estimated fair values from an independent valuation service or from brokers. In developing fair values, the valuation service and the brokers use estimates of cash flows, based on historical performance of similar instruments in similar interest rate environments. Based on experience, management is aware that estimated fair values of debt securities tend to vary among brokers and other valuation services.
Finally, the fair value of assets acquired and liabilities assumed in connection with the acquisition of FC Banc Corp. and Lake National Bank, including the associated goodwill that was recorded, required the use of material estimates. Specifically, the fair values of loans, the core deposit intangible asset, premises and equipment, and time deposits were susceptible to estimation and management’s judgment about real estate and equipment values, as well as the amount and timing of future cash flows associated with loans and deposits.
46
Table of Contents
| ITEM 7A | QUANTITATIVE AND QUALITATIVE DISCLOSURES ABOUT MARKET RISK |
As a financial institution, the Corporation’s primary source of market risk is interest rate risk, which is the exposure to fluctuations in the Corporation’s future earnings resulting from changes in interest rates. This exposure is correlated to the repricing characteristics of the Corporation’s portfolio of assets and liabilities. Each asset or liability reprices either at maturity or during the life of the instrument.
The principal purpose of asset/liability management is to maximize current and future net interest income within acceptable levels of interest rate risk while satisfying liquidity and capital requirements. Net interest income is enhanced by increasing the net interest margin and by the growth in earning assets. As a result, the primary goal of interest rate risk management is to maintain a balance between risk and reward such that net interest income is maximized while risk is maintained at an acceptable level.
The Corporation uses an asset-liability management model to measure the effect of interest rate changes on its net interest income. The Corporation’s management also reviews asset-liability maturity gap and repricing analyses regularly. The Corporation does not always attempt to achieve a precise match between interest sensitive assets and liabilities because it believes that an actively managed amount of interest rate risk is inherent and appropriate in the management of the Corporation’s profitability.
Asset-liability modeling techniques and simulation involve assumptions and estimates that inherently cannot be measured with precision. Key assumptions in these analyses include maturity and repricing characteristics of assets and liabilities, prepayments on amortizing assets, non-maturing deposit sensitivity, and loan and deposit pricing. These assumptions are inherently uncertain due to the timing, magnitude, and frequency of rate changes and changes in market conditions and management strategies, among other factors. However, the analyses are useful in quantifying risk and provide a relative gauge of the Corporation’s interest rate risk position over time.
Management reviews interest rate risk on a quarterly basis and reports to the ALCO. This review includes earnings shock scenarios whereby interest rates are immediately increased and decreased by 100, 300, and 400 basis points. These scenarios, detailed in the table below, indicate that there would not be a significant variance in net interest income over a one-year period due to interest rate changes; however, actual results could vary significantly. At December 31, 2017 and 2016, all interest rate risk levels according to the model were within the tolerance limits of ALCO approved policy. In addition, the table does not take into consideration changes that management would make to realign its assets and liabilities in the event of an unexpected changing interest rate environment. Due to the historically low interest rate environment, the 300 and 400 basis point declining interest rate scenarios have been excluded from the table.
| December 31, 2017 |
December 31, 2016 |
|||||||||||
| Change in Basis Points |
% Change in Net Interest Income |
Change in Basis Points |
% Change in Net Interest Income |
|||||||||
| 400 |
6.4 | % | 400 | (4.9 | %) | |||||||
| 300 |
5.1 | % | 300 | (2.9 | %) | |||||||
| 100 |
1.9 | % | 100 | 0.7 | % | |||||||
| (100) |
(2.4 | %) | (100 | ) | (1.4 | %) | ||||||
47
Table of Contents
ITEM 8. FINANCIAL STATEMENTS AND SUPPLEMENTARY DATA
CONSOLIDATED BALANCE SHEETS
Dollars in thousands, except share data
|
|
||||||||
| December 31, |
||||||||
| 2017 | 2016 | |||||||
| ASSETS |
| |||||||
| Cash and due from banks |
$ | 33,146 | $ | 26,937 | ||||
| Interest bearing deposits with other banks |
2,199 | 2,246 | ||||||
|
|
|
|
|
|||||
| Total cash and cash equivalents |
35,345 | 29,183 | ||||||
| Securities available for sale |
409,709 | 495,835 | ||||||
| Trading securities |
7,150 | 4,858 | ||||||
| Loans held for sale |
852 | 7,528 | ||||||
| Loans |
2,149,848 | 1,876,966 | ||||||
| Less: unearned discount |
(3,889 | ) | (3,430 | ) | ||||
| Less: allowance for loan losses |
(19,693 | ) | (16,330 | ) | ||||
|
|
|
|
|
|||||
| Net loans |
2,126,266 | 1,857,206 | ||||||
| FHLB and other equity interests |
21,517 | 19,186 | ||||||
| Premises and equipment, net |
50,715 | 49,522 | ||||||
| Bank owned life insurance |
55,035 | 44,273 | ||||||
| Mortgage servicing rights |
1,387 | 1,391 | ||||||
| Goodwill |
38,730 | 38,730 | ||||||
| Core deposit intangible |
1,625 | 2,854 | ||||||
| Accrued interest receivable and other assets |
20,442 | 23,255 | ||||||
|
|
|
|
|
|||||
| Total Assets |
$ | 2,768,773 | $ | 2,573,821 | ||||
|
|
|
|
|
|||||
| LIABILITIES AND SHAREHOLDERS’ EQUITY |
| |||||||
| Non-interest bearing deposits |
$ | 321,858 | $ | 289,922 | ||||
| Interest bearing deposits |
1,845,957 | 1,727,600 | ||||||
|
|
|
|
|
|||||
| Total deposits |
2,167,815 | 2,017,522 | ||||||
| Short-term borrowings |
34,416 | 103,969 | ||||||
| FHLB and other long-term borrowings |
222,943 | 133,035 | ||||||
| Subordinated debentures |
70,620 | 70,620 | ||||||
| Deposits held for sale |
0 | 6,456 | ||||||
| Accrued interest payable and other liabilities |
29,069 | 30,435 | ||||||
|
|
|
|
|
|||||
| Total liabilities |
2,524,863 | 2,362,037 | ||||||
|
|
|
|
|
|||||
| Commitments and contingent liabilities |
0 | 0 | ||||||
|
|
|
|
|
|||||
| Common stock, $0 par value; authorized 50,000,000 shares; issued 15,308,378 shares at December 31, 2017 and 14,473,482 shares at December 31, 2016 |
0 | 0 | ||||||
| Additional paid in capital |
97,042 | 77,737 | ||||||
| Retained earnings |
148,298 | 134,295 | ||||||
| Treasury stock, at cost (43,638 shares for 2017 and 5,667 for 2016) |
(1,087 | ) | (127 | ) | ||||
| Accumulated other comprehensive loss |
(343 | ) | (121 | ) | ||||
|
|
|
|
|
|||||
| Total shareholders’ equity |
243,910 | 211,784 | ||||||
|
|
|
|
|
|||||
| Total Liabilities and Shareholders’ Equity |
$ | 2,768,773 | $ | 2,573,821 | ||||
|
|
|
|
|
|||||
See Notes to Consolidated Financial Statements
48
Table of Contents
CONSOLIDATED STATEMENTS OF INCOME AND COMPREHENSIVE INCOME
Dollars in thousands, except per share data
|
|
||||||||||||
| Year ended December 31, |
||||||||||||
| 2017 | 2016 | 2015 | ||||||||||
| Interest and Dividend Income: |
||||||||||||
| Loans including fees |
$ | 97,005 | $ | 81,209 | $ | 71,814 | ||||||
| Securities: |
||||||||||||
| Taxable |
8,165 | 9,134 | 10,977 | |||||||||
| Tax-exempt |
2,983 | 3,390 | 3,778 | |||||||||
| Dividends |
721 | 582 | 609 | |||||||||
|
|
|
|
|
|
|
|||||||
| Total interest and dividend income |
108,874 | 94,315 | 87,178 | |||||||||
|
|
|
|
|
|
|
|||||||
| Interest Expense: |
||||||||||||
| Deposits |
9,312 | 8,470 | 8,498 | |||||||||
| Borrowed funds |
4,021 | 2,981 | 3,222 | |||||||||
| Subordinated debentures (includes $288, $340, and $378 accumulated other comprehensive income reclassification for change in fair value of interest rate swap agreements in 2017, 2016, and 2015) |
4,032 | 1,577 | 751 | |||||||||
|
|
|
|
|
|
|
|||||||
| Total interest expense |
17,365 | 13,028 | 12,471 | |||||||||
|
|
|
|
|
|
|
|||||||
| Net Interest Income |
91,509 | 81,287 | 74,707 | |||||||||
| Provision for Loan Losses |
6,655 | 4,149 | 2,560 | |||||||||
|
|
|
|
|
|
|
|||||||
| Net Interest Income After Provision for Loan Losses |
84,854 | 77,138 | 72,147 | |||||||||
|
|
|
|
|
|
|
|||||||
| Non-Interest Income: |
||||||||||||
| Service charges on deposit accounts |
4,809 | 4,297 | 4,442 | |||||||||
| Other service charges and fees |
2,454 | 2,539 | 3,089 | |||||||||
| Wealth and asset management fees |
3,724 | 3,087 | 2,977 | |||||||||
| Net realized gains on available-for-sale securities (includes $1,543, $1,005, and $666 accumulated other comprehensive income reclassifications for net realized gains on available-for-sale securities in 2017, 2016, and 2015) |
1,543 | 1,005 | 666 | |||||||||
| Net realized gains (losses) on trading securities |
93 | 70 | (211 | ) | ||||||||
| Net unrealized gains (losses) on trading securities |
788 | 433 | (2 | ) | ||||||||
| Mortgage banking |
906 | 1,095 | 746 | |||||||||
| Bank owned life insurance |
1,659 | 1,082 | 1,194 | |||||||||
| Card processing and interchange income |
3,763 | 3,396 | 3,417 | |||||||||
| Gain on sale of branch |
536 | 0 | 0 | |||||||||
| Other |
1,160 | 687 | 776 | |||||||||
|
|
|
|
|
|
|
|||||||
| Total non-interest income |
21,435 | 17,691 | 17,094 | |||||||||
|
|
|
|
|
|
|
|||||||
| Non-Interest Expenses: |
||||||||||||
| Salaries |
26,205 | 23,472 | 21,652 | |||||||||
| Employee benefits (includes $192, $184, and $173 accumulated other comprehensive income reclassifications for net amortization of actuarial losses in 2017, 2016, and 2015) |
9,821 | 8,722 | 7,911 | |||||||||
| Net occupancy expense |
9,546 | 8,064 | 7,000 | |||||||||
| Amortization of core deposit intangible |
1,229 | 1,125 | 1,008 | |||||||||
| Data processing |
3,944 | 4,447 | 4,297 | |||||||||
| State and local taxes |
2,815 | 2,171 | 1,868 | |||||||||
| Legal, professional and examination fees |
1,819 | 1,772 | 1,553 | |||||||||
| Advertising |
2,243 | 1,799 | 1,580 | |||||||||
| FDIC insurance |
1,182 | 1,229 | 1,278 | |||||||||
| Directors fees and benefits |
915 | 1,582 | 812 | |||||||||
| Prepayment penalties — long-term borrowings |
0 | 1,506 | 0 | |||||||||
| Core processing conversion costs |
0 | 1,693 | 108 | |||||||||
| Merger costs |
0 | 486 | 308 | |||||||||
| Card processing and interchange expenses |
2,116 | 1,889 | 2,295 | |||||||||
| Other |
8,202 | 7,161 | 7,082 | |||||||||
|
|
|
|
|
|
|
|||||||
| Total non-interest expenses |
70,037 | 67,118 | 58,752 | |||||||||
|
|
|
|
|
|
|
|||||||
| Income Before Income Taxes |
36,252 | 27,711 | 30,489 | |||||||||
| Income Tax Expense (includes $372, $168, and $40 income tax expense reclassification items in 2017, 2016, and 2015) |
12,392 | 7,171 | 8,292 | |||||||||
|
|
|
|
|
|
|
|||||||
| Net Income |
23,860 | 20,540 | 22,197 | |||||||||
|
|
|
|
|
|
|
|||||||
| Other Comprehensive Income (Loss): |
||||||||||||
| Net change in unrealized (losses) gains on available-for-sale securities, net of reclassification and tax |
(1,004 | ) | (2,136 | ) | 793 | |||||||
| Change in actuarial gain (loss), for post-employment health care plan, net of amortization and tax |
825 | (64 | ) | (90 | ) | |||||||
| Change in fair value of interest rate swap agreements designated as a cash flow hedge, net of interest and tax |
194 | 180 | 137 | |||||||||
|
|
|
|
|
|
|
|||||||
| Total other comprehensive (loss) income |
15 | (2,020 | ) | 840 | ||||||||
|
|
|
|
|
|
|
|||||||
| Comprehensive Income |
$ | 23,875 | $ | 18,520 | $ | 23,037 | ||||||
|
|
|
|
|
|
|
|||||||
| Earnings Per Share: |
||||||||||||
| Basic |
$ | 1.57 | $ | 1.42 | $ | 1.54 | ||||||
| Diluted |
1.57 | 1.42 | 1.54 | |||||||||
See Notes to Consolidated Financial Statements
49
Table of Contents
CONSOLIDATED STATEMENTS OF CASH FLOWS
Dollars in thousands
|
|
||||||||||||
| Year ended December 31, |
||||||||||||
| 2017 | 2016 | 2015 | ||||||||||
| Cash Flows From Operating Activities: |
||||||||||||
| Net income |
$ | 23,860 | $ | 20,540 | $ | 22,197 | ||||||
| Adjustments to reconcile net income to net cash provided by operations: |
||||||||||||
| Provision for loan losses |
6,655 | 4,149 | 2,560 | |||||||||
| Depreciation and amortization of premises and equipment, core deposit intangible, and mortgage servicing rights |
5,242 | 4,484 | 4,039 | |||||||||
| Amortization and accretion of securities premiums and discounts, deferred loan fees and costs, net yield and credit mark on acquired loans, and unearned income |
(1,202 | ) | (1,328 | ) | 993 | |||||||
| Deferred taxes |
3,385 | 1,023 | 376 | |||||||||
| Net realized gains on sales of available-for-sale securities |
(1,543 | ) | (1,005 | ) | (666 | ) | ||||||
| Net realized and unrealized losses (gains) on trading securities |
(881 | ) | (503 | ) | 213 | |||||||
| Proceeds from sale of trading securities |
1,091 | 540 | 2,129 | |||||||||
| Purchase of trading securities |
(2,502 | ) | (319 | ) | (2,413 | ) | ||||||
| Gain on sale of branch |
(536 | ) | 0 | 0 | ||||||||
| Gain on sale of loans |
(545 | ) | (818 | ) | (630 | ) | ||||||
| Net losses on dispositions of premises and equipment and foreclosed assets |
(107 | ) | 134 | 7 | ||||||||
| Proceeds from sale of loans |
24,285 | 33,045 | 14,927 | |||||||||
| Origination of loans held for sale |
(25,231 | ) | (31,255 | ) | (15,171 | ) | ||||||
| Income on bank owned life insurance, including death benefit of proceeds in excess of cash surrender value |
(1,659 | ) | (1,082 | ) | (1,194 | ) | ||||||
| Stock-based compensation expense |
928 | 820 | 621 | |||||||||
| Contribution of treasury stock |
0 | 150 | 120 | |||||||||
| Changes in: |
||||||||||||
| Accrued interest receivable and other assets |
(1,175 | ) | (3,906 | ) | 93 | |||||||
| Accrued interest payable and other liabilities |
698 | 2,095 | 5,435 | |||||||||
|
|
|
|
|
|
|
|||||||
| Net Cash Provided By Operating Activities |
30,763 | 26,764 | 33,636 | |||||||||
|
|
|
|
|
|
|
|||||||
| Cash Flows from Investing Activities: |
||||||||||||
| Net decrease in interest bearing time deposits with other banks |
0 | 0 | 225 | |||||||||
| Proceeds from maturities, prepayments and calls of available-for-sale securities |
92,302 | 63,837 | 78,707 | |||||||||
| Proceeds from sales of available-for-sale securities |
16,340 | 4,420 | 105,066 | |||||||||
| Purchase of available-for-sale securities |
(23,689 | ) | (21,513 | ) | (45,120 | ) | ||||||
| Loan origination and payments, net |
(273,972 | ) | (182,566 | ) | (224,470 | ) | ||||||
| Purchase of bank owned life insurance |
(10,000 | ) | 0 | 0 | ||||||||
| Proceeds from death benefit of BOLI policies |
897 | 0 | 0 | |||||||||
| Net cash received from sale of branch |
1,079 | 0 | 0 | |||||||||
| Net cash paid for Lake National Bank acquisition |
0 | (2,866 | ) | 0 | ||||||||
| Purchase of FHLB and other equity interests |
(2,331 | ) | (2,628 | ) | (9,226 | ) | ||||||
| Purchase of premises and equipment |
(5,215 | ) | (10,125 | ) | (6,751 | ) | ||||||
| Proceeds from the sale of premises and equipment and foreclosed assets |
938 | 558 | 855 | |||||||||
|
|
|
|
|
|
|
|||||||
| Net Cash Used In Investing Activities |
(203,651 | ) | (150,883 | ) | (100,714 | ) | ||||||
|
|
|
|
|
|
|
|||||||
| Cash Flows From Financing Activities: |
||||||||||||
| Net change in: |
||||||||||||
| Checking, money market and savings accounts |
16,096 | 79,745 | (39,285 | ) | ||||||||
| Certificates of deposit |
134,197 | (10,603 | ) | 7,259 | ||||||||
| Deposits held for sale |
1,079 | 0 | 0 | |||||||||
| Purchase of treasury stock |
(1,877 | ) | (44 | ) | (868 | ) | ||||||
| Proceeds from stock offering, net of issuance costs |
19,294 | 0 | 0 | |||||||||
| Cash dividends paid |
(10,094 | ) | (9,546 | ) | (9,515 | ) | ||||||
| Proceeds from long-term borrowings |
160,000 | 80,000 | 50,000 | |||||||||
| Repayments on long-term borrowings |
(70,092 | ) | (81,317 | ) | (21,472 | ) | ||||||
| Net change in short-term borrowings |
(69,553 | ) | 17,806 | 80,292 | ||||||||
| Proceeds from subordinated debentures |
0 | 50,000 | 0 | |||||||||
|
|
|
|
|
|
|
|||||||
| Net Cash Provided By Financing Activities |
179,050 | 126,041 | 66,411 | |||||||||
|
|
|
|
|
|
|
|||||||
| Net Increase (Decrease) in Cash and Cash Equivalents |
6,162 | 1,922 | (667 | ) | ||||||||
| Cash and Cash Equivalents, Beginning |
29,183 | 27,261 | 27,928 | |||||||||
|
|
|
|
|
|
|
|||||||
| Cash and Cash Equivalents, Ending |
$ | 35,345 | $ | 29,183 | $ | 27,261 | ||||||
|
|
|
|
|
|
|
|||||||
| Supplemental Disclosure of Cash Flow Information: |
||||||||||||
| Cash paid during the period for: |
||||||||||||
| Interest |
$ | 17,481 | $ | 13,284 | $ | 12,502 | ||||||
| Income taxes |
7,810 | 3,966 | 5,431 | |||||||||
| Supplemental Noncash Disclosures: |
||||||||||||
| Transfers to other real estate owned |
$ | 630 | $ | 120 | $ | 806 | ||||||
| Grant of restricted stock awards from treasury stock |
984 | 896 | 803 | |||||||||
| Net liabilities assumed from Lake National Bank, excluding cash and cash equivalents |
0 | 8,670 | 0 | |||||||||
| Net loans transferred to held for sale |
0 | 7,319 | 0 | |||||||||
| Net deposits transferred to held for sale |
0 | 6,456 | 0 | |||||||||
See Notes to Consolidated Financial Statements
50
Table of Contents
CONSOLIDATED STATEMENTS OF CHANGES IN SHAREHOLDERS’ EQUITY
FOR THE YEARS ENDED DECEMBER 31, 2017, 2016 AND 2015
Dollars in thousands, except share and per share data
| Additional Paid-In Capital |
Retained Earnings |
Treasury Stock |
Accumulated Other Comprehensive Income (Loss) |
Total Share- holders’ Equity |
||||||||||||||||
| Balance, January 1, 2015 |
$ | 78,022 | $ | 110,619 | $ | (1,152 | ) | $ | 1,059 | $ | 188,548 | |||||||||
| Net income |
22,197 | 22,197 | ||||||||||||||||||
| Other comprehensive income |
840 | 840 | ||||||||||||||||||
| Restricted stock award grants (48,300 shares) |
(803 | ) | 803 | |||||||||||||||||
| Stock based compensation expense |
621 | 621 | ||||||||||||||||||
| Purchase of treasury stock (51,052 shares) |
(868 | ) | (868 | ) | ||||||||||||||||
| Reissue of treasury stock (6,766 shares) |
(13 | ) | 103 | 90 | ||||||||||||||||
| Cash dividends declared ($0.66 per share) |
(9,515 | ) | (9,515 | ) | ||||||||||||||||
|
|
|
|
|
|
|
|
|
|
|
|||||||||||
| Balance, December 31, 2015 |
77,827 | 123,301 | (1,114 | ) | 1,899 | 201,913 | ||||||||||||||
| Net income |
20,540 | 20,540 | ||||||||||||||||||
| Other comprehensive loss |
(2,020 | ) | (2,020 | ) | ||||||||||||||||
| Restricted stock award grants (52,750 shares) |
(896 | ) | 896 | |||||||||||||||||
| Stock based compensation expense |
820 | 820 | ||||||||||||||||||
| Purchase of treasury stock (1,298 shares) |
(44 | ) | (44 | ) | ||||||||||||||||
| Reissue of treasury stock (7,933 shares) |
(14 | ) | 135 | 121 | ||||||||||||||||
| Cash dividends declared ($0.66 per share) |
(9,546 | ) | (9,546 | ) | ||||||||||||||||
|
|
|
|
|
|
|
|
|
|
|
|||||||||||
| Balance, December 31, 2016 |
77,737 | 134,295 | (127 | ) | (121 | ) | 211,784 | |||||||||||||
| Net income |
23,860 | 23,860 | ||||||||||||||||||
| Reclassification of certain tax effects from accumulated other comprehensive income to retained earnings |
237 | (237 | ) | |||||||||||||||||
| Other comprehensive income |
15 | 15 | ||||||||||||||||||
| Forfeiture of restricted stock award grants (2,482 shares) |
67 | (67 | ) | |||||||||||||||||
| Restricted stock award grants (39,673 shares) |
(984 | ) | 984 | |||||||||||||||||
| Stock based compensation expense |
928 | 928 | ||||||||||||||||||
| Issuance of common stock, net of issuance costs (834,896 shares) |
19,294 | 19,294 | ||||||||||||||||||
| Purchase of treasury stock (75,162 shares) |
(1,877 | ) | (1,877 | ) | ||||||||||||||||
| Cash dividends declared ($0.66 per share) |
(10,094 | ) | (10,094 | ) | ||||||||||||||||
|
|
|
|
|
|
|
|
|
|
|
|||||||||||
| Balance, December 31, 2017 |
$ | 97,042 | $ | 148,298 | $ | (1,087 | ) | $ | (343 | ) | $ | 243,910 | ||||||||
|
|
|
|
|
|
|
|
|
|
|
|||||||||||
See Notes to Consolidated Financial Statements
51
Table of Contents
Notes to Consolidated Financial Statements
(Dollars in thousands, except per share data)
1. Summary of Significant Accounting Policies
Unless otherwise indicated, dollar amounts are in thousands, except per share data.
Business and Organization
CNB Financial Corporation (the “Corporation”) is headquartered in Clearfield, Pennsylvania, and provides a full range of banking and related services through its wholly owned subsidiary, CNB Bank (the “Bank”). In addition, the Bank provides trust and asset management services, including the administration of trusts and estates, retirement plans, and other employee benefit plans as well as a full range of wealth management services. The Bank serves individual and corporate customers and is subject to competition from other financial institutions and intermediaries with respect to these services. In addition to the Bank, the Corporation also operates a consumer discount loan and finance business through its wholly owned subsidiary, Holiday Financial Services Corporation (“Holiday”). The Corporation and these and its other subsidiaries are subject to examination by federal and state regulators. The Corporation’s market area is primarily concentrated in the central and northwest regions of the Commonwealth of Pennsylvania, the central and northeast regions of the state of Ohio and western New York.
Basis of Financial Presentation
The financial statements are consolidated to include the accounts of the Corporation and the Bank, CNB Securities Corporation, Holiday, and CNB Insurance Agency. All significant intercompany accounts and transactions have been eliminated in the consolidated financial statements. Certain prior period amounts have been reclassified to conform to the current period presentation. Reclassifications had no effect on prior year net income or shareholders’ equity.
Use of Estimates
To prepare financial statements in conformity with accounting principles generally accepted in the U.S., management makes estimates and assumptions based on available information. These estimates and assumptions affect the amounts reported in the financial statements and the disclosures provided, and actual results could differ.
Operating Segments
While the chief decision-makers monitor the revenue streams of the various products and services, operations are managed and financial performance is evaluated on a Corporation-wide basis, and operating segments are aggregated into one as operating results for all segments are similar. Accordingly, all of the financial service operations are considered by management to be aggregated in one reportable operating segment.
Securities
When purchased, securities are classified as held to maturity, trading or available for sale. Debt securities are classified as held to maturity when the Corporation has the positive intent and ability to
52
Table of Contents
hold the securities to maturity. Held to maturity securities are carried at amortized cost. Debt or equity securities are classified as trading when purchased principally for the purpose of selling them in the near term, or when the fair value option has been elected. Trading securities are recorded at fair value with changes in fair value included in earnings in non-interest income. Available for sale securities are those securities not classified as held to maturity or trading and are carried at their fair value. Unrealized gains and losses, net of deferred tax, on securities classified as available for sale are recorded as other comprehensive income. Management has not classified any debt securities as held to maturity.
The amortized cost of debt securities classified as held to maturity or available for sale is adjusted for the amortization of premiums and the accretion of discounts over the period through contractual maturity or, in the case of mortgage-backed securities and collateralized mortgage obligations, over the estimated life of the security. Such amortization is included in interest income from securities. Gains and losses on securities sold are recorded on the trade date and based on the specific identification method.
Declines in the fair value of debt securities below their cost that are other-than-temporary and attributable to credit losses are reflected in earnings. Other-than-temporary impairment losses that are not attributable to credit losses are reported as a component of accumulated other comprehensive income. In estimating other-than-temporary losses, management considers: the length of time and extent that fair value has been less than cost, the financial condition and near term prospects of the issuer, and the Corporation’s intent to sell, or whether it is more likely than not that it will be required to sell a security in an unrealized loss position before recovery of its amortized cost basis. If the Corporation intends to sell a security or it is more likely than not it will be required to sell a security before recovery of its amortized cost basis, the entire difference between amortized cost and fair value is recognized as impairment through earnings.
Loans
Loans that management has the intent and ability to hold for the foreseeable future or until maturity or payoff are reported at the principal balance outstanding.
Interest income is reported on the interest method and includes amortization of net deferred loan fees and costs over the loan term. Interest income on commercial, industrial, and agricultural loans, commercial mortgage loans, and residential real estate loans is discontinued at the time the loan is 90 days delinquent unless the credit is well-secured and in process of collection. Consumer loans are typically charged off no later than 180 days past due. Past due status is based on the contractual terms of the loan. Loans, including loans modified in a troubled debt restructuring, are placed on nonaccrual or charged off at an earlier date if collection of principal or interest is considered doubtful. Nonaccrual loans and loans past due 90 days still on accrual include both smaller balance homogeneous loans that are collectively evaluated for impairment and individually classified impaired loans.
All interest accrued but not received on loans placed on nonaccrual is reversed against interest income. Interest received on such loans is accounted for on the cash-basis or cost-recovery method, until qualifying for return to accrual. Under the cost-recovery method, interest income is not recognized until the loan balance is reduced to zero. Under the cash-basis method, interest income is recorded when the payment is received in cash. For all portfolio segments, loans are returned to accrual status when all the principal and interest amounts contractually due are brought current and future payments are reasonably assured.
53
Table of Contents
Concentration of Credit Risk
Most of the Corporation’s business activity is with customers located within the Commonwealth of Pennsylvania and the states of Ohio and New York. Therefore, the Corporation’s exposure to credit risk is significantly affected by changes in the economies of Pennsylvania, Ohio, and New York.
Purchased Loans
The Corporation purchased loans in connection with its acquisition of FC Banc Corp. in 2013 and Lake National Bank in 2016, some of which had, at the acquisition date, shown evidence of credit deterioration since origination. These purchased credit impaired loans were recorded at the amount paid, such that there was no carryover of the seller’s allowance for loan losses.
Such purchased credit impaired loans are accounted for individually, and the Corporation estimates the amount and timing of expected cash flows for each loan. The expected cash flows in excess of the amount paid is recorded as interest income over the remaining life of the loan (accretable yield). The excess of the loan’s contractual principal and interest over expected cash flows is not recorded (nonaccretable difference).
Over the life of the loan, expected cash flows continue to be estimated. If the present value of expected cash flows is less than the carrying amount, a loss is recorded. If the present value of the expected cash flows is greater than the carrying amount, it is recognized as part of future interest income.
For loans purchased that did not show evidence of credit deterioration, the difference between the fair value of the loan at the acquisition date and the loan’s face value is being amortized as a yield adjustment over the estimated remaining life of the loan using the effective interest method.
Loans Held for Sale
Loans originated and intended for sale in the secondary market are carried at the lower of aggregate cost or fair value, as determined by outstanding commitments from investors. Net unrealized losses, if any, are recorded as a valuation allowance and charged to earnings.
Mortgage loans held for sale are generally sold with servicing rights retained. The carrying value of the mortgage loan sold is reduced by the amount allocated to the servicing right. Gains and losses on sales of mortgage loans are based on the difference between the selling price and the carrying value of the related loan sold.
Allowance for Loan Losses
The allowance for loan losses is a valuation allowance for probable incurred credit losses. Loan losses are charged against the allowance when management believes the uncollectibility of a loan balance is confirmed. Subsequent recoveries, if any, are credited to the allowance account.
Management determines the adequacy of the allowance based on historical patterns of charge-offs and recoveries, the nature and volume of the portfolio, information about specific borrower situations and estimated collateral values, industry experience, economic conditions, and other qualitative factors relevant to the collectability of the loan portfolio. While management believes that the allowance is adequate to absorb probable loan losses incurred at the balance sheet date, future adjustments may be necessary due to circumstances that differ substantially from the assumptions used in evaluating the adequacy of the allowance for loan losses.
54
Table of Contents
The allowance consists of specific and general components. The specific component relates to loans that are individually classified as impaired. A loan is impaired when, based on current information and events, it is probable that the Corporation will be unable to collect all amounts due according to the contractual terms of the loan agreement. Loans for which the terms have been modified, and for which the borrower is experiencing financial difficulties, are considered troubled debt restructurings and classified as impaired.
Commercial and commercial real estate loans are individually evaluated for impairment. If a loan is impaired, a portion of the allowance is allocated so that the loan is reported, net, at the present value of estimated future cash flows using the loan’s existing rate or at the fair value of collateral if repayment is expected solely from the collateral. Large groups of smaller balance homogeneous loans, such as consumer and residential real estate loans, are collectively evaluated for impairment, and accordingly, they are not separately identified for impairment disclosures. Troubled debt restructurings are measured at the present value of estimated future cash flows using the loan’s effective rate at inception. If a troubled debt restructuring is considered to be a collateral dependent loan, the loan is reported, net, at the fair value of the collateral. For troubled debt restructurings that subsequently default, the Corporation determines the amount of reserve in accordance with the accounting policy for the allowance for loan losses.
The general component of the allowance for loan losses covers non-impaired loans and loans collectively evaluated for impairment and is based on historical loss experience adjusted for current factors. The historical loss experience is determined by portfolio segment and is based on the migration analysis performed. This actual loss experience is supplemented with other factors based on the risks present for each portfolio segment. These historical loss factors include consideration of the following: levels of and trends in delinquencies, nonaccrual loans, and classified loans; trends in volume and terms of loans; effects of any changes in lending policies and procedures; experience, ability, and depth of management; national and local economic trends and conditions; and concentrations of credit.
The following portfolio segments, which are the same as the Corporation’s portfolio classifications and associated risk characteristics, have been identified:
| ● | Commercial, industrial, and agricultural – risk characteristics include below average economic and employment conditions in many of the markets served by the Corporation, which has limited consumer spending. |
| ● | Commercial mortgages – the most significant risk characteristic is the subjectivity involved in real estate valuations for properties located in areas with low growth economies. |
| ● | Residential real estate – risk characteristics include slightly higher than historical levels of delinquencies and less than robust housing markets. |
| ● | Consumer – risk characteristics include continuing weakness in industrial employment in many of the markets served by the Corporation and low wage growth. |
| ● | Credit cards – the most significant risk characteristic is the unsecured nature of credit card loans. |
| ● | Overdrafts – risk characteristics include the Corporation’s continued deposit growth and overall economic conditions which may lead to a greater likelihood of overdrawn deposit accounts. |
55
Table of Contents
Federal Home Loan Bank (FHLB) Stock
As a member of the Federal Home Loan Bank of Pittsburgh (“FHLB”), the Corporation is required to purchase and hold stock in the FHLB to satisfy membership and borrowing requirements. This stock is restricted in that it can only be sold to the FHLB or to another member institution, and all sales of FHLB stock must be at par. As a result of these restrictions, FHLB stock is unlike other investment securities insofar as there is no trading market for FHLB stock and the transfer price is determined by FHLB membership rules and not by market participants.
FHLB stock is held as a long-term investment, is valued at its cost basis and is analyzed for impairment based on the ultimate recoverability of the par value. The Company evaluates impairment quarterly. The decision of whether impairment exists is a matter of judgment that reflects our view of the FHLB’s long-term performance, which includes factors such as the following:
| ● | its operating performance; |
| ● | the severity and duration of declines in the fair value of its net assets related to its capital stock amount; |
| ● | its commitment to make payments required by law or regulation and the level of such payments in relation to its operating performance; |
| ● | the impact of legislative and regulatory changes on the FHLB, and accordingly, on the members of FHLB; and |
| ● | its liquidity and funding position. |
Premises and Equipment
Premises and equipment are stated at cost less accumulated depreciation. Depreciation of premises and equipment is computed principally by the straight line method. In general, useful lives range from 3 to 39 years with lives for furniture, fixtures and equipment ranging from 3 to 10 years and lives of buildings and building improvements ranging from 15 to 39 years. Amortization of leasehold improvements is computed using the straight-line method over useful lives of the leasehold improvements or the term of the lease, whichever is shorter. Maintenance, repairs and minor renewals are charged to expense as incurred.
Foreclosed Assets
Assets acquired through or in lieu of loan foreclosure are initially recorded at fair value less estimated selling costs when acquired, establishing a new cost basis. Physical possession of residential real estate property collateralizing a consumer mortgage loan occurs when legal title is obtained upon completion of foreclosure or when the borrower conveys all interest in the property to satisfy the loan through completion of a deed in lieu of foreclosure or through a similar legal agreement. These assets are subsequently accounted for at the lower of cost or fair value, less estimated costs to sell. If fair value declines, a valuation allowance is recorded through expense. Costs after acquisition are expensed.
Bank Owned Life Insurance
The Corporation has purchased life insurance policies on certain key employees. Bank owned life insurance is recorded at the amount that can be realized under the insurance contract at the balance sheet date, which is the cash surrender value adjusted for other charges or other amounts due that are probable at settlement.
56
Table of Contents
Goodwill and Other Intangible Assets
Goodwill resulting from business combinations prior to January 1, 2009 represents the excess of the purchase price over the fair value of the net assets of businesses acquired. Goodwill resulting from business combinations after January 1, 2009 is generally determined as the excess of the fair value of the consideration transferred, plus the fair value of any noncontrolling interest in the acquiree, over the fair value of the net assets acquired and liabilities assumed as of the acquisition date. Goodwill and intangible assets acquired in a purchase business combination and determined to have an indefinite useful life are not amortized, but tested for impairment at least annually or more frequently if events and circumstances exist that indicate an impairment test should be performed.
The Corporation has selected December 31 as the date to perform the annual impairment test. Intangible assets with definite useful lives are amortized over their estimated useful lives. Goodwill is the only intangible asset with an indefinite life on the Corporation’s balance sheet. Other intangible assets consist of core deposit intangible assets arising from the acquisition of FC Banc Corp. in 2013 and Lake National Bank in 2016. The core deposit intangible assets from these acquisitions are amortized using an accelerated method over their estimated useful lives of 7 years and 4 years, respectively.
Long-term Assets
Premises and equipment, goodwill and other intangible assets, and other long-term assets are reviewed for impairment when events indicate their carrying amount may not be recoverable from future undiscounted cash flows. If impaired, the assets are recorded at fair value.
Loan Commitments and Related Financial Instruments
Financial instruments include off-balance sheet credit instruments, such as commitments to make loans and commercial letters of credit, issued to meet customer financing needs. The face amount for these items represents the exposure to loss, before considering customer collateral or ability to repay. Such financial instruments are recorded when they are funded.
Derivatives
Derivative financial instruments are recognized as assets or liabilities at fair value. The Corporation has interest rate swap agreements which are used as part of its asset liability management to help manage interest rate risk. The Corporation does not use derivatives for trading purposes.
At the inception of a derivative contract, the Corporation designates the derivative as one of three types based on the purpose of the contract and belief as to its effectiveness as a hedge. These three types are (1) a hedge of the fair value of a recognized asset or liability or of an unrecognized firm commitment (“fair value hedge”), (2) a hedge of a forecasted transaction or the variability of cash flows to be received or paid related to a recognized asset or liability (“cash flow hedge”), or (3) an instrument with no hedging designation (“stand-alone derivative”). For a fair value hedge, the gain or loss on the derivative, as well as the offsetting loss or gain on the hedged item, are recognized in current earnings as fair values change. For a cash flow hedge, the gain or loss on the derivative is reported in other comprehensive income and is reclassified into earnings in the same periods during which the hedged transaction affects earnings. For both types of hedges, changes in the fair value of derivatives that are
57
Table of Contents
not highly effective in hedging the changes in fair value or expected cash flows of the hedged item are recognized immediately in current earnings. Changes in the fair value of derivatives that do not qualify for hedge accounting are reported currently in earnings, as non-interest income.
Net cash settlements on derivatives that qualify for hedge accounting are recorded in interest income or interest expense, based on the item being hedged. Net cash settlements on derivatives that do not qualify for hedge accounting are reported in non-interest income. Cash flows on hedges are classified in the cash flow statement the same as the cash flows of the items being hedged.
The Corporation formally documents the relationship between derivatives and hedged items, as well as the risk-management objective and the strategy for undertaking hedge transactions, at the inception of the hedging relationship. This documentation includes linking fair value or cash flow hedges to specific assets and liabilities on the balance sheet or to specific firm commitments or forecasted transactions. The Corporation also formally assesses, both at the hedge’s inception and on an ongoing basis, whether the derivative instruments that are used are highly effective in offsetting changes in fair values or cash flows of the hedged items. The Corporation discontinues hedge accounting when it determines that the derivative is no longer effective in offsetting changes in the fair value or cash flows of the hedged item, the derivative is settled or terminates, a hedged forecasted transaction is no longer probable, a hedged firm commitment is no longer firm, or treatment of the derivative as a hedge is no longer appropriate or intended.
When hedge accounting is discontinued, subsequent changes in fair value of the derivative are recorded as non-interest income. When a fair value hedge is discontinued, the hedged asset or liability is no longer adjusted for changes in fair value and the existing basis adjustment is amortized or accreted over the remaining life of the asset or liability. When a cash flow hedge is discontinued but the hedged cash flows or forecasted transactions are still expected to occur, gains or losses that were accumulated in other comprehensive income are amortized into earnings over the same periods which the hedged transactions will affect earnings.
Advertising Costs
Advertising costs are generally expensed as incurred and amounted to $2,243, $1,799 and $1,580, for 2017, 2016, and 2015, respectively.
Mortgage Servicing Rights
Servicing rights are recognized separately when they are acquired through sales of loans. Servicing rights are initially recorded at fair value with the income statement effect recorded in mortgage banking. Fair value is based on market prices for comparable mortgage servicing contracts, when available, or alternatively, is based on a valuation model that calculates the present value of estimated future net servicing income. The valuation model incorporates assumptions that market participants would use in estimating future net servicing income, such as the cost to service, the discount rate, the custodial earnings rate, an inflation rate, ancillary income, prepayment speeds and default rates and losses. The Corporation compares the valuation model inputs and results to published industry data in order to validate the model results and assumptions. All classes of servicing assets are subsequently measured using the amortization method which requires servicing rights to be amortized into non-interest income in proportion to, and over the period of, the estimated future net servicing income of the underlying loans.
58
Table of Contents
Servicing rights are evaluated for impairment based upon the fair value of the rights as compared to carrying amount. Impairment is determined by stratifying rights into groupings based on predominant risk characteristics, such as interest rate, loan type and investor type. Impairment is recognized through a valuation allowance for an individual grouping, to the extent that fair value is less than the carrying amount. If the Corporation later determines that all or a portion of the impairment no longer exists for a particular grouping, a reduction of the allowance may be recorded as an increase to income. Changes in valuation allowances are reported with mortgage banking income on the income statement. The fair values of servicing rights are subject to significant fluctuations as a result of changes in estimated and actual prepayment speeds and default rates and losses.
Servicing fee income, which is reported on the income statement as mortgage banking income, is recorded for fees earned for servicing loans. The fees are based on a contractual percentage of the outstanding principal or a fixed amount per loan and are recorded as income when earned. The amortization of mortgage servicing rights is netted against loan servicing fee income. Late fees and ancillary fees related to loan servicing are not material.
Treasury Stock
The purchase of the Corporation’s common stock is recorded at cost. Purchases of the stock are made in the open market based on market prices. At the date of subsequent reissue, the treasury stock account is reduced by the cost of such stock on a first-in-first-out basis.
Stock-Based Compensation
The Corporation has a stock incentive plan for key employees and independent directors. The Stock Incentive Plan, which is administered by a committee of the Board of Directors, provides for up to 500,000 shares of common stock to be awarded in the form of nonqualified options or restricted stock. For key employees, the plan vesting schedule is one-fourth of granted stock-based awards per year beginning one year after the grant date with 100% vested on the fourth anniversary. For independent directors, the vesting schedule is one-third of granted stock-based awards per year beginning one year after the grant date with 100% vested on the third anniversary.
At December 31, 2017 and 2016, there was no unrecognized compensation cost related to nonvested stock options granted under this plan, and no stock options were granted during the years ended December 31, 2017, 2016, and 2015.
During 2017, 2016, and 2015, the Executive Compensation and Personnel Committee of the Board of Directors granted a total of 39,673, 52,750 and 48,300 shares, respectively, of restricted common stock to certain key employees and all independent directors of the Corporation. Compensation expense for the restricted stock awards is recognized over the requisite service period based on the fair value of the shares at the date of grant on a straight-line basis. Compensation expense resulting from these restricted stock awards was $928, $820 and $621 for the years ended December 31, 2017, 2016, and 2015, respectively.
Comprehensive Income
The Corporation presents comprehensive income as part of the Consolidated Statement of Income and Comprehensive Income. Other comprehensive income (loss) consists of unrealized holding gains
59
Table of Contents
(losses) on the available for sale securities portfolio, changes in the unrecognized actuarial gain and transition obligation related to the Corporation’s post retirement benefits plans, and changes in the fair value of the Corporation’s interest rate swaps, net of tax.
Income Taxes
The Corporation files a consolidated U.S. income tax return that includes all subsidiaries. Income tax expense is the total of the current year income tax due or refundable and the change in deferred tax assets and liabilities. Deferred tax assets and liabilities are the expected future tax amounts for the temporary differences between carrying amounts and tax bases of assets and liabilities, computed using enacted tax rates. A valuation allowance, if needed, reduces deferred tax assets to the amount expected to be realized.
A tax position is recognized as a benefit only if it is “more likely than not” that the tax position would be sustained in a tax examination, with a tax examination being presumed to occur. The amount recognized is the largest amount of tax benefit that is greater than 50% likely of being realized on examination. For tax positions not meeting the “more likely than not” test, no tax benefit is recorded.
The Corporation recognizes interest and/or penalties related to income tax matters in income tax expense.
Retirement Plans
The Corporation’s expense associated with its 401(k) plan is determined under the provisions of the plan document and includes both matching and profit sharing components. Deferred compensation and supplemental retirement plan expenses allocate the benefits over years of service.
Earnings Per Share
Basic earnings per share is computed by dividing net income available to common shareholders by the weighted average number of shares outstanding during the applicable period, excluding outstanding participating securities. Diluted earnings per share is computed using the weighted average number of shares determined for the basic computation plus the dilutive effect of potential common shares issuable under certain stock compensation plans. Unvested share-based payment awards that contain nonforfeitable rights to dividends or dividend equivalents (whether paid or unpaid) are participating securities and are included in the computation of earnings per share pursuant to the two-class method. The Corporation has determined that its outstanding non-vested stock awards are participating securities.
Cash and Cash Equivalents
For purposes of the consolidated statement of cash flows, the Corporation defines cash and cash equivalents as cash and due from banks, interest bearing deposits with other banks, and Federal funds sold. Net cash flows are reported for customer loan and deposit transactions, interest bearing time deposits with other banks and borrowings with original maturities of 90 days or less.
Restrictions on Cash
The Bank is required to maintain average reserve balances with the Federal Reserve Bank or in vault cash. The average amount of these non-interest bearing reserve balances for the year ended
60
Table of Contents
December 31, 2017 and 2016 was $50, which was maintained in vault cash. Note 12 to the consolidated financial statements discloses the cash collateral balances required to be maintained in connection with the Corporation’s interest rate swaps.
Loss Contingencies
Loss contingencies, including claims and legal actions arising in the ordinary course of business, are recorded as liabilities when the likelihood of loss is probable and an amount or range of loss can be reasonably estimated. Management does not believe there are any such matters that will have a material effect on the financial statements.
Fair Value of Financial Instruments
Fair values of financial instruments are estimated using relevant market information and other assumptions, as more fully disclosed in a separate note. Fair value estimates involve uncertainties and matters of significant judgment regarding interest rates, credit risk, prepayments, and other factors, especially in the absence of broad markets for particular items. Changes in assumptions or in market conditions could significantly affect the estimates.
Adoption of New Accounting Standards
In March 2016, the FASB issued Accounting Standards Update 2016-09, “Compensation-Stock Compensation: Improvements to Employee Share-Based Payment Accounting.” ASU 2016-09 will require recognition of the income tax effects of share-based awards in the income statement when the awards vest or are settled (i.e., Additional Paid-in-Capital pools will be eliminated). The guidance was effective for interim and annual reporting periods beginning after December 15, 2016. The Corporation adopted ASU 2016-09 on January 1, 2017. The adoption did not have a material effect on the Corporation’s financial statements.
In August 2016, the FASB issued an update (ASU 2016-15, Statement of Cash Flows) which addresses eight specific cash flow issues with the objective of reducing the existing diversity in practice in how certain cash receipts and cash payments are presented and classified in the statement of cash flows. The amendments in this Update apply to all entities, including business entities and not-for-profit entities that are required to present a statement of cash flows, and are effective for public business entities for fiscal years beginning after December 15, 2017, and interim periods within those fiscal years. The Corporation adopted ASU 2016-15 on January 1, 2018. The adoption did not have a material effect on the Corporation’s financial statements.
On February 14, 2018, the Financial Accounting Standard Board issued Accounting Standards Update (ASU) No. 2018-02, Income Statement – Reporting Comprehensive Income (Topic 220): Reclassification of Certain Tax Effects from Accumulated Other Comprehensive Income. The amendments in this ASU allow, but do not require, entities to reclassify certain income tax effects in accumulated other comprehensive income (AOCI) to retained earnings that resulted from the Tax Cuts and Jobs Act (Act). The Corporation adopted this ASU and elected to reclassify the income tax effects of the Act from accumulated other comprehensive income to retained earnings at December 31, 2017. There were no other income tax effects related to the Act that were reclassified as a result of the adoption of the accounting standard.
Effect of Newly Issued But Not Yet Effective Accounting Standards
In June 2016, the FASB issued an update (ASU 2016-13, Financial Instruments – Credit Losses) which will require recognition of an entity’s current estimate of all expected credit losses for assets measured
61
Table of Contents
at amortized cost. The amendments in ASU 2016-13 eliminate the probable initial recognition threshold in current U.S. Generally Accepted Accounting Principles. In addition, the amendments in ASU 2016-13 broaden the information that an entity must consider in developing its expected credit loss estimate for assets measured either collectively or individually, such as loans. The update will be effective for interim and annual reporting periods beginning after December 15, 2019, with early adoption permitted for interim and annual reporting periods beginning after December 15, 2018. Management is currently in the developmental stages of evaluating the impact of the adoption of ASU 2016-13 on the Corporation’s financial statements and is collecting available historical information in order to assess the expected credit losses. However, the impact to the financial statements is yet to be determined.
In February 2016, the FASB issued Accounting Standards Update 2016-02, “Leases (Topic 842)”. ASU 2016-02 requires a lessee to recognize the following for all leases (with the exception of short-term leases) at the commencement date: (1) A lease liability, which is a lessee’s obligation to make lease payments arising from a lease, measured on a discounted basis; and (2) A right-of-use asset, which is an asset that represents the lessee’s right to use, or control the use of, a specified asset for the lease term. Under the new guidance, lessor accounting is largely unchanged. Certain targeted improvements were made to align, where necessary, lessor accounting with the lessee accounting model and Topic 606, Revenue from Contracts with Customers. The update will be effective for reporting periods beginning after December 15, 2018. Early adoption is permitted. Management is currently evaluating the impact of the adoption of ASU 2016-02 on the Corporation’s financial statements and anticipates an increase in the Corporation’s assets and liabilities. However, the amounts that will be adjusted are still to be determined.
In January 2016, the FASB issued Accounting Standards Update 2016-01, “Recognition and Measurement of Financial Assets and Financial Liabilities”. ASU 2016-01 provides updated accounting and reporting requirements for both public and non-public entities. The most significant provisions that will impact the Corporation are: 1) equity securities available for sale will be measured at fair value, with the changes in fair value recognized in the income statement; 2) eliminate the requirement to disclose the method(s) and significant assumptions used to estimate the fair value that is required to be disclosed for financial instruments at amortized cost on the balance sheet; 3) utilization of exit price notion when measuring the fair value of financial instruments for disclosure purposes; 4) require separate presentation of both financial assets and liabilities by measurement category and form of financial asset on the balance sheet or accompanying notes to the financial statements. The update will be effective for interim and annual reporting periods beginning after December 15, 2017, using a cumulative-effect adjustment to the balance sheet as of the beginning of the year adoption. The adoption of ASU 2016-01 did not have a material effect on the Corporation’s financial statements. The Corporation adopted ASU 2016-01 on January 1, 2018.
In May 2014, FASB issued Accounting Standards Update 2014-09, “Revenue from Contracts with Customers (Topic 606).” The ASU creates a new topic, Topic 606, to provide guidance on revenue recognition for entities that enter into contracts with customers to transfer goods or services or enter into contracts for the transfer of nonfinancial assets. The core principle of the guidance is that an entity should recognize revenue to depict the transfer of promised goods or services to customers in an amount that reflects the consideration to which the entity expects to be entitled in exchange for those goods or services. Additional disclosures are required to provide quantitative and qualitative information regarding the nature, amount, timing, and uncertainty of revenue and cash flows arising from contracts with customers. The new guidance is effective for annual reporting periods, and interim
62
Table of Contents
reporting periods within those annual periods, beginning after December 15, 2017. The adoption of ASU 2014-09 did not have a material effect on the Corporation’s financial statements as most of the revenue relates to loans and other financial instruments which are scoped out. However, management does expect expansion to disclosures. The Corporation adopted ASU 2014-09 on January 1, 2018.
2. Business Combination and Branch Sale
On December 30, 2015, the Corporation announced the signing of a definitive merger agreement to acquire Lake National Bank (LNB) of Mentor, Ohio for $22.50 per share in cash, or approximately $24.75 million in the aggregate. LNB served the northeastern Ohio market with two branches located in Mentor, Ohio. On July 15, 2016, the transaction closed and the Corporation began including LNB’s results of operations in its consolidated results. The two LNB offices now operate as part of the ERIEBANK division of CNB Bank.
As disclosed in the accompanying consolidated statements of income, the Corporation incurred merger costs of $486 thousand and $308 thousand for the twelve months ended December 31, 2016 and 2015, respectively. All merger costs have been expensed as incurred.
The following table summarizes the consideration paid for LNB and the amounts of the assets acquired and liabilities assumed that were recognized at the acquisition date:
| Consideration paid: |
||||
| Cash |
$ | 24,750 | ||
|
|
|
|||
| Recognized amounts of identifiable assets acquired and liabilities assumed: |
||||
| Cash and cash equivalents |
21,884 | |||
| Securities available for sale |
450 | |||
| Loans |
122,206 | |||
| FHLB and other equity interests |
637 | |||
| Premises and equipment |
3,242 | |||
| Bank owned life insurance |
2,152 | |||
| Mortgage servicing rights |
367 | |||
| Core deposit intangible |
1,583 | |||
| Accrued interest receivable and other assets |
3,110 | |||
|
|
|
|||
| Total assets acquired |
155,631 | |||
|
|
|
|||
| Demand deposits |
81,472 | |||
| Time deposits |
58,311 | |||
| Accrued interest payable and other liabilities |
2,634 | |||
|
|
|
|||
| Total liabilities assumed |
142,417 | |||
|
|
|
|||
| Total identifiable net assets |
13,214 | |||
|
|
|
|||
| Goodwill |
$ | 11,536 | ||
|
|
|
Included in accrued interest receivable and other assets is a deferred tax asset of $58 which represents the tax effect of temporary differences between the tax basis and fair values assigned to the assets and liabilities.
Acquired loans were recorded at fair value with no carryover of the related allowance for loan losses. Determining the fair value of loans involved estimating the amount and timing of principal and interest cash flows expected to be collected on the loans and discounting those cash flows at a market rate of
63
Table of Contents
interest. The Corporation acquired $126,134 of gross loans and recognized a net combined yield and credit mark of $3,928.
Goodwill of $11,536 arising from the acquisition consisted largely of synergies and the cost savings resulting from the combining of the operations of the Corporation and Lake National Bank. None of the goodwill is expected to be deductible for income tax purposes.
On May 19, 2017, CNB completed its previously announced sale of the Mt. Hope, Ohio branch to First Federal Community Bank. CNB transferred loans totaling $7,800, fixed assets totaling $100, and deposits totaling $7,400 in conjunction with the sale of the branch and realized a gain of $536 based on the 8% deposit premium paid by First Federal Community Bank.
3. Earnings Per Share
The computation of basic and diluted earnings per share is shown below (in thousands, except per share data). There were no anti-dilutive stock options for the years ended December 31, 2017, 2016, and 2015.
| Years Ended December 31 | ||||||||||||
| 2017 |
2016 |
2015 |
||||||||||
| Basic earnings per common share computation |
||||||||||||
| Net income per consolidated statements of income |
$ | 23,860 | $ | 20,540 | $ | 22,197 | ||||||
| Net earnings allocated to participating securities |
(135 | ) | (129 | ) | (117 | ) | ||||||
|
|
|
|
|
|
|
|||||||
| Net earnings allocated to common stock |
$ | 23,725 | $ | 20,411 | $ | 22,080 | ||||||
|
|
|
|
|
|
|
|||||||
| Distributed earnings allocated to common stock |
$ | 10,030 | $ | 9,480 | $ | 9,460 | ||||||
| Undistributed earnings allocated to common stock |
13,695 | 10,931 | 12,620 | |||||||||
|
|
|
|
|
|
|
|||||||
| Net earnings allocated to common stock |
$ | 23,725 | $ | 20,411 | $ | 22,080 | ||||||
|
|
|
|
|
|
|
|||||||
| Weighted average common shares outstanding, including shares considered participating securities |
15,212 | 14,457 | 14,408 | |||||||||
| Less: Average participating securities |
(80 | ) | (82 | ) | (70 | ) | ||||||
|
|
|
|
|
|
|
|||||||
| Weighted average shares |
15,132 | 14,375 | 14,338 | |||||||||
|
|
|
|
|
|
|
|||||||
| Basic earnings per common share |
$ | 1.57 | $ | 1.42 | $ | 1.54 | ||||||
|
|
|
|
|
|
|
|||||||
| Diluted earnings per common share computation |
||||||||||||
| Net earnings allocated to common stock |
$ | 23,725 | $ | 20,411 | $ | 22,080 | ||||||
|
|
|
|
|
|
|
|||||||
| Weighted average common shares outstanding for basic earnings per common share |
15,132 | 14,375 | 14,338 | |||||||||
| Add: Dilutive effects of assumed exercises of stock options |
0 | 0 | 0 | |||||||||
|
|
|
|
|
|
|
|||||||
| Weighted average shares and dilutive potential common shares |
15,132 | 14,375 | 14,338 | |||||||||
|
|
|
|
|
|
|
|||||||
| Diluted earnings per common share |
$ | 1.57 | $ | 1.42 | $ | 1.54 | ||||||
|
|
|
|
|
|
|
|||||||
64
Table of Contents
4. Securities
Securities available-for-sale at December 31, 2017 and 2016 are as follows:
| December 31, 2017 | December 31, 2016 | |||||||||||||||||||||||||||||||
| Amortized Cost |
Unrealized | Fair Value |
Amortized Cost |
Unrealized | Fair Value |
|||||||||||||||||||||||||||
| Gains |
Losses |
Gains |
Losses |
|||||||||||||||||||||||||||||
| U.S. Gov’t sponsored entities |
$108,578 | $ | 478 | $ | (908 | ) | $108,148 | $139,823 | $1,107 | $ | (579 | ) | $140,351 | |||||||||||||||||||
| State & political subdivisions |
134,428 | 3,609 | (314) | 137,723 | 153,492 | 4,194 | (649 | ) | 157,037 | |||||||||||||||||||||||
| Residential & multi-family mortgage |
111,214 | 304 | (1,882) | 109,636 | 136,807 | 551 | (2,382 | ) | 134,976 | |||||||||||||||||||||||
| Corporate notes & bonds |
17,610 | 52 | (462) | 17,200 | 18,299 | 77 | (962 | ) | 17,414 | |||||||||||||||||||||||
| Pooled trust preferred |
0 | 0 | 0 | 0 | 800 | 1,249 | 0 | 2,049 | ||||||||||||||||||||||||
| Pooled SBA |
36,260 | 355 | (575) | 36,040 | 43,450 | 505 | (918 | ) | 43,037 | |||||||||||||||||||||||
| Other equity securities |
1,020 | 0 | (58) | 962 | 1,020 | 0 | (49 | ) | 971 | |||||||||||||||||||||||
|
|
|
|
|
|
|
|
|
|
|
|
|
|
|
|
|
|||||||||||||||||
| Total |
$409,110 | $ | 4,798 | $ | (4,199 | ) | $409,709 | $493,691 | $7,683 | $(5,539) | $495,835 | |||||||||||||||||||||
|
|
|
|
|
|
|
|
|
|
|
|
|
|
|
|
|
|||||||||||||||||
At December 31, 2017 and 2016, there were no holdings of securities by any one issuer, other than U.S. Government sponsored entities, in an amount greater than 10% of shareholders’ equity. The Corporation’s residential and multi-family mortgage securities are issued by government sponsored entities, and the Corporation holds one commercial mortgage security that is private label.
Trading securities at December 31, 2017 and 2016 are as follows:
| 2017 | 2016 | |||||||
| Corporate equity securities |
$ | 5,125 | $ | 3,312 | ||||
| Mutual Funds |
1,499 | 1,037 | ||||||
| Certificates of deposit |
220 | 202 | ||||||
| Corporate notes and bonds |
254 | 254 | ||||||
| U.S. Government sponsored entities |
52 | 53 | ||||||
|
|
|
|
|
|||||
| Total |
$ | 7,150 | $ | 4,858 | ||||
|
|
|
|
|
|||||
Securities with unrealized losses at December 31, 2017 and 2016, aggregated by investment category and length of time that individual securities have been in a continuous unrealized loss position, are as follows:
| December 31, 2017 | Less than 12 Months | 12 Months or More | Total | |||||||||||||||||||||
| Description of Securities |
Fair Value |
Unrealized Loss |
Fair Value |
Unrealized Loss |
Fair Value |
Unrealized Loss |
||||||||||||||||||
| U.S. Gov’t sponsored entities |
$ | 55,696 | $ | (540 | ) | $ | 34,754 | $ | (368 | ) | $ | 90,450 | $ | (908 | ) | |||||||||
| State & political subdivisions |
15,890 | (69 | ) | 4,104 | (245 | ) | 19,994 | (314 | ) | |||||||||||||||
| Residential & multi-family mortgage |
30,144 | (153 | ) | 63,699 | (1,729 | ) | 93,843 | (1,882 | ) | |||||||||||||||
| Corporate notes & bonds |
5,005 | (9 | ) | 9,042 | (453 | ) | 14,047 | (462 | ) | |||||||||||||||
| Pooled SBA |
0 | (0 | ) | 22,270 | (575 | ) | 22,270 | (575 | ) | |||||||||||||||
| Other equity securities |
0 | (0 | ) | 962 | (58 | ) | 962 | (58 | ) | |||||||||||||||
|
|
|
|
|
|
|
|
|
|
|
|
|
|||||||||||||
| $ | 106,735 | $ | (771 | ) | $ | 134,831 | $ | (3,428 | ) | $ | 241,566 | $ | (4,199 | ) | ||||||||||
|
|
|
|
|
|
|
|
|
|
|
|
|
|||||||||||||
65
Table of Contents
| Less than 12 Months | 12 Months or More | Total | ||||||||||||||||||||||
| Fair Value |
Unrealized Loss |
Fair Value |
Unrealized Loss |
Fair Value |
Unrealized Loss |
|||||||||||||||||||
| December 31, 2016 |
||||||||||||||||||||||||
| U.S. Gov’t sponsored entities |
$ | 90,380 | $ | (579 | ) | $ | 0 | $ | (0 | ) | $ | 90,380 | $ | (579 | ) | |||||||||
| State & political subdivisions |
32,353 | (448 | ) | 264 | (201 | ) | 32,617 | (649 | ) | |||||||||||||||
| Residential and multi-family mortgage |
65,598 | (1,255 | ) | 34,611 | (1,127 | ) | 100,209 | (2,382 | ) | |||||||||||||||
| Corporate notes & bonds |
2,089 | (11 | ) | 8,476 | (951 | ) | 10,565 | (962 | ) | |||||||||||||||
| Pooled SBA |
6,481 | (126 | ) | 20,560 | (792 | ) | 27,041 | (918 | ) | |||||||||||||||
| Other equity securities |
0 | (0 | ) | 971 | (49 | ) | 971 | (49 | ) | |||||||||||||||
|
|
|
|
|
|
|
|
|
|
|
|
|
|||||||||||||
| $ | 196,901 | $ | (2,419 | ) | $ | 64,882 | $ | (3,120 | ) | $ | 261,783 | $ | (5,539 | ) | ||||||||||
|
|
|
|
|
|
|
|
|
|
|
|
|
|||||||||||||
The Corporation evaluates securities for other-than-temporary impairment on a quarterly basis, or more frequently when economic or market conditions warrant such an evaluation.
At December 31, 2016 the Corporation evaluated the pooled trust preferred securities for other-than-temporary impairment by estimating the cash flows expected to be received, taking into account future estimated levels of deferrals and defaults by the underlying issuers and discounting those cash flows at the appropriate accounting yield. During 2017, two structured pooled trust preferred securities with an adjusted amortized cost of $800 were sold, resulting in a gain of $1,383. During 2016, two structured pooled trust preferred securities with an adjusted amortized cost of $0 were sold, resulting in a gain of $922.
A roll-forward of the other-than-temporary impairment amount related to credit losses for the years ended December 31, 2017, 2016, and 2015 is as follows:
| 2017 | 2016 | 2015 | ||||||||||
| Balance of credit losses on debt securities for which a portion of other-than-temporary impairment was recognized in earnings, beginning of period |
$ | 2,071 | $ | 4,054 | $ | 4,054 | ||||||
| Credit losses previously recognized on securities sold during the period |
(2,071 | ) | (1,983 | ) | 0 | |||||||
| Additional credit loss for which other-than-temporary impairment was not previously recognized |
0 | 0 | 0 | |||||||||
| Additional credit loss for which other-than-temporary impairment was previously recognized |
0 | 0 | 0 | |||||||||
|
|
|
|
|
|
|
|||||||
| Balance of credit losses on debt securities for which a portion of other-than-temporary impairment was recognized in earnings, end of period |
$ | 0 | $ | 2,071 | $ | 4,054 | ||||||
|
|
|
|
|
|
|
|||||||
For the securities that comprise corporate notes and bonds and the securities that are issued by state and political subdivisions, management monitors publicly available financial information, such as filings with the Securities and Exchange Commission, in order to evaluate the securities for other-than-temporary impairment. For financial institution issuers, management monitors information from quarterly “call” report filings that are used to generate Uniform Bank Performance Reports. All other securities that were in an unrealized loss position at the balance sheet date were reviewed by management, and issuer-specific documents were reviewed, as appropriate given the following considerations. When reviewing securities for other-than-temporary impairment, management considers the financial condition and near-term prospects of the issuer and whether downgrades by bond rating agencies have occurred. Management also considers the length of time and extent to which fair value has been less than cost, and whether management does not have the intent to sell these
66
Table of Contents
securities and it is likely that it will not be required to sell the securities before their anticipated recovery.
As of December 31, 2017 and 2016, management concluded that the securities described in the previous paragraph were not other-than-temporarily impaired for the following reasons:
| ● | There is no indication of any significant deterioration of the creditworthiness of the institutions that issued the securities. |
| ● | All contractual interest payments on the securities have been received as scheduled, and no information has come to management’s attention through the processes previously described which would lead to a conclusion that future contractual payments will not be timely received. |
The Corporation does not intend to sell and it is not more likely than not that it will be required to sell the securities in an unrealized loss position before recovery of its amortized cost basis.
On December 31, 2017 and 2016, securities carried at $319,575 and $329,379, respectively, were pledged to secure public deposits and for other purposes as provided by law.
The following is a schedule of the contractual maturity of securities available for sale, excluding equity securities, at December 31, 2017:
| December 31, 2017 | ||||||||
| Amortized Cost | Fair Value | |||||||
| 1 year or less |
$ | 50,368 | $ | 50,139 | ||||
| 1 year – 5 years |
153,512 | 155,075 | ||||||
| 5 years – 10 years |
50,552 | 51,753 | ||||||
| After 10 years |
6,184 | 6,104 | ||||||
|
|
|
|
|
|||||
| 260,616 | 263,071 | |||||||
| Residential and multi-family mortgage |
111,214 | 109,636 | ||||||
| Pooled SBA |
36,260 | 36,040 | ||||||
|
|
|
|
|
|||||
| Total debt securities |
$ | 408,090 | $ | 408,747 | ||||
|
|
|
|
|
|||||
Mortgage securities and pooled SBA securities are not due at a single date; periodic payments are received based on the payment patterns of the underlying collateral.
Information pertaining to security sales is as follows:
| Year ended December 31 |
Proceeds | Gross Gains | Gross Losses | |||||||||
| 2017 |
$ | 16,340 | $ | 1,614 | $ | 71 | ||||||
| 2016 |
4,420 | 1,005 | 0 | |||||||||
| 2015 |
105,066 | 1,032 | 366 | |||||||||
The tax provision related to these net realized gains was $540, $352 and $233, respectively.
During 2017, 2016, and 2015, the Corporation sold trading securities. Proceeds were $1,091 in 2017, $540 in 2016 and $2,129 in 2015, resulting in net realized gains (losses) of $93 in 2017, $70 in 2016, and ($211) in 2015.
67
Table of Contents
5. Loans
Total net loans at December 31, 2017 and 2016 are summarized as follows:
| 2017 | 2016 | |||||||
| Commercial, industrial, and agricultural |
$ | 749,138 | $ | 567,800 | ||||
| Commercial mortgages |
600,065 | 574,826 | ||||||
| Residential real estate |
713,347 | 652,883 | ||||||
| Consumer |
80,193 | 74,816 | ||||||
| Credit cards |
6,753 | 6,046 | ||||||
| Overdrafts |
352 | 595 | ||||||
| Less: unearned discount |
(3,889 | ) | (3,430 | ) | ||||
| allowance for loan losses |
(19,693 | ) | (16,330 | ) | ||||
|
|
|
|
|
|||||
| Loans, net |
$ | 2,126,266 | $ | 1,857,206 | ||||
|
|
|
|
|
|||||
At December 31, 2017 and 2016 net unamortized loan (fees) costs of ($2,574) and ($1,507), respectively, have been included in the carrying value of loans.
The Corporation’s outstanding loans and related unfunded commitments are primarily concentrated within central and northwest Pennsylvania, central and northeast Ohio, and western New York. The Bank attempts to limit concentrations within specific industries by utilizing dollar limitations to single industries or customers, and by entering into participation agreements with third parties. Collateral requirements are established based on management’s assessment of the customer. The Corporation maintains lending policies to control the quality of the loan portfolio. These policies delegate the authority to extend loans under specific guidelines and underwriting standards. These policies are prepared by the Corporation’s management and reviewed and ratified annually by the Corporation’s Board of Directors.
Pursuant to the Corporation’s lending policies, management considers a variety of factors when determining whether to extend credit to a customer, including loan-to-value ratios, FICO scores, quality of the borrower’s financial statements, and the ability to obtain personal guarantees.
Commercial, industrial, and agricultural loans comprised 35% and 30% of the Corporation’s total loan portfolio at December 31, 2017 and 2016, respectively. Commercial mortgage loans comprised 28% and 31% of the Corporation’s total loan portfolio at December 31, 2017 and 2016, respectively. Management assigns a risk rating to all commercial loans at loan origination. The loan-to-value policy guidelines for commercial, industrial, and agricultural loans are generally a maximum of 80% of the value of business equipment, a maximum of 75% of the value of accounts receivable, and a maximum of 60% of the value of business inventory at loan origination. The loan-to-value policy guideline for commercial mortgage loans is generally a maximum of 85% of the appraised value of the real estate.
Residential real estate loans comprised 33% and 35% of the Corporation’s total loan portfolio at December 31, 2017 and 2016, respectively. The loan-to-value policy guidelines for residential real estate loans vary depending on the collateral position and the specific type of loan. Higher loan-to-value terms may be approved with the appropriate private mortgage insurance coverage. The Corporation also originates and prices loans for sale into the secondary market. Loans so originated are classified as loans held for sale and are excluded from residential real estate loans reported above. The
68
Table of Contents
rationale for these sales is to mitigate interest rate risk associated with holding lower rate, long-term residential mortgages in the loan portfolio and to generate fee revenue from sales and servicing the loan. The Corporation also offers a variety of unsecured and secured consumer loan and credit card products which represent less than 10% of the total loan portfolio at both December 31, 2017 and 2016. Terms and collateral requirements vary depending on the size and nature of the loan.
Transactions in the allowance for loan losses for the year ended December 31, 2017 were as follows:
| Commercial, Industrial, and Agricultural |
Commercial Mortgages |
Residential Real Estate |
Consumer | Credit Cards |
Overdrafts | Total | ||||||||||||||||||||||
| Allowance for loan losses, January 1, 2017 |
$ | 5,428 | $ | 6,753 | $ | 1,653 | $ | 2,215 | $ | 93 | $ | 188 | $ | 16,330 | ||||||||||||||
| Charge-offs |
(544 | ) | (116 | ) | (466 | ) | (2,555 | ) | (144 | ) | (252 | ) | (4,077 | ) | ||||||||||||||
| Recoveries |
235 | 197 | 78 | 161 | 27 | 87 | 785 | |||||||||||||||||||||
| Provision for loan losses |
1,041 | 2,173 | 768 | 2,358 | 144 | 171 | 6,655 | |||||||||||||||||||||
|
|
|
|
|
|
|
|
|
|
|
|
|
|
|
|||||||||||||||
| Allowance for loan losses, December 31, 2017 |
$ | 6,160 | $ | 9,007 | $ | 2,033 | $ | 2,179 | $ | 120 | $ | 194 | $ | 19,693 | ||||||||||||||
|
|
|
|
|
|
|
|
|
|
|
|
|
|
|
|||||||||||||||
Transactions in the allowance for loan losses for the year ended December 31, 2016 were as follows:
| Commercial, Industrial, and Agricultural |
Commercial Mortgages |
Residential Real Estate |
Consumer | Credit Cards |
Overdrafts | Total | ||||||||||||||||||||||
| Allowance for loan losses, January 1, 2016 |
$ | 6,035 | $ | 5,605 | $ | 2,475 | $ | 2,371 | $ | 90 | $ | 161 | $ | 16,737 | ||||||||||||||
| Charge-offs |
(601 | ) | (201 | ) | (499 | ) | (3,324 | ) | (96 | ) | (240 | ) | (4,961 | ) | ||||||||||||||
| Recoveries |
89 | 8 | 93 | 122 | 22 | 71 | 405 | |||||||||||||||||||||
| Provision for loan losses |
(95 | ) | 1,341 | (416 | ) | 3,046 | 77 | 196 | 4,149 | |||||||||||||||||||
|
|
|
|
|
|
|
|
|
|
|
|
|
|
|
|||||||||||||||
| Allowance for loan losses, December 31, 2016 |
$ | 5,428 | $ | 6,753 | $ | 1,653 | $ | 2,215 | $ | 93 | $ | 188 | $ | 16,330 | ||||||||||||||
|
|
|
|
|
|
|
|
|
|
|
|
|
|
|
|||||||||||||||
69
Table of Contents
Transactions in the allowance for loan losses for the year ended December 31, 2015 were as follows:
| Commercial, Industrial, and Agricultural |
Commercial Mortgages |
Residential Real Estate |
Consumer | Credit Cards |
Overdrafts | Total | ||||||||||||||||||||||
| Allowance for loan losses, January 1, 2015 |
$ | 7,114 | $ | 5,310 | $ | 2,479 | $ | 2,205 | $ | 71 | $ | 194 | $ | 17,373 | ||||||||||||||
| Charge-offs |
(307 | ) | (486 | ) | (632 | ) | (1,956 | ) | (116 | ) | (221 | ) | (3,718 | ) | ||||||||||||||
| Recoveries |
267 | 52 | 8 | 96 | 14 | 85 | 522 | |||||||||||||||||||||
| Provision for loan losses |
(1,039 | ) | 729 | 620 | 2,026 | 121 | 103 | 2,560 | ||||||||||||||||||||
|
|
|
|
|
|
|
|
|
|
|
|
|
|
|
|||||||||||||||
| Allowance for loan losses, December 31, 2015 |
$ | 6,035 | $ | 5,605 | $ | 2,475 | $ | 2,371 | $ | 90 | $ | 161 | $ | 16,737 | ||||||||||||||
|
|
|
|
|
|
|
|
|
|
|
|
|
|
|
|||||||||||||||
The following table presents the balance in the allowance for loan losses and the recorded investment in loans by portfolio segment and is based on the Corporation’s impairment method as of December 31, 2017 and 2016. The recorded investment in loans excludes accrued interest and unearned discounts due to their insignificance.
| December 31, 2017 | Commercial, Industrial, and Agricultural |
Commercial Mortgages |
Residential Real Estate |
Consumer | Credit Cards |
Overdrafts | Total | |||||||||||||||||||||
| Allowance for loan losses: |
||||||||||||||||||||||||||||
| Ending allowance balance attributable to loans: |
||||||||||||||||||||||||||||
| Individually evaluated for impairment |
$ | 47 | $ | 0 | $ | 0 | $ | 0 | $ | 0 | $ | 0 | $ | 47 | ||||||||||||||
| Collectively evaluated for impairment |
5,868 | 3,563 | 2,033 | 2,179 | 120 | 194 | 13,957 | |||||||||||||||||||||
| Acquired with deteriorated credit quality |
0 | 0 | 0 | 0 | 0 | 0 | 0 | |||||||||||||||||||||
| Modified in a troubled debt restructuring |
245 | 5,444 | 0 | 0 | 0 | 0 | 5,689 | |||||||||||||||||||||
|
|
|
|
|
|
|
|
|
|
|
|
|
|
|
|||||||||||||||
| Total ending allowance balance |
$ | 6,160 | $ | 9,007 | $ | 2,033 | $ | 2,179 | $ | 120 | $ | 194 | $ | 19,693 | ||||||||||||||
|
|
|
|
|
|
|
|
|
|
|
|
|
|
|
|||||||||||||||
| Loans: |
||||||||||||||||||||||||||||
| Individually evaluated for impairment |
$ | 1,187 | $ | 51 | $ | 0 | $ | 0 | $ | 0 | $ | 0 | $ | 1,238 | ||||||||||||||
| Collectively evaluated for impairment |
742,738 | 586,845 | 713,347 | 80,193 | 6,753 | 352 | 2,130,228 | |||||||||||||||||||||
| Acquired with deteriorated credit quality |
0 | 1,079 | 0 | 0 | 0 | 0 | 1,079 | |||||||||||||||||||||
| Modified in a troubled debt restructuring |
5,213 | 12,090 | 0 | 0 | 0 | 0 | 17,303 | |||||||||||||||||||||
|
|
|
|
|
|
|
|
|
|
|
|
|
|
|
|||||||||||||||
| Total ending loans balance |
$ | 749,138 | $ | 600,065 | $ | 713,347 | $ | 80,193 | $ | 6,753 | $ | 352 | $ | 2,149,848 | ||||||||||||||
|
|
|
|
|
|
|
|
|
|
|
|
|
|
|
|||||||||||||||
70
Table of Contents
| December 31, 2016 | Commercial, Industrial, and Agricultural |
Commercial Mortgages |
Residential Real Estate |
Consumer | Credit Cards |
Overdrafts | Total | |||||||||||||||||||||
| Allowance for loan losses: |
||||||||||||||||||||||||||||
| Ending allowance balance attributable to loans: |
||||||||||||||||||||||||||||
| Individually evaluated for impairment |
$ | 188 | $ | 996 | $ | 0 | $ | 0 | $ | 0 | $ | 0 | $ | 1,184 | ||||||||||||||
| Collectively evaluated for impairment |
5,115 | 3,543 | 1,653 | 2,215 | 93 | 188 | 12,807 | |||||||||||||||||||||
| Acquired with deteriorated credit quality |
0 | 0 | 0 | 0 | 0 | 0 | 0 | |||||||||||||||||||||
| Modified in a troubled debt restructuring |
125 | 2,214 | 0 | 0 | 0 | 0 | 2,339 | |||||||||||||||||||||
|
|
|
|
|
|
|
|
|
|
|
|
|
|
|
|||||||||||||||
| Total ending allowance balance |
$ | 5,428 | $ | 6,753 | $ | 1,653 | $ | 2,215 | $ | 93 | $ | 188 | $ | 16,330 | ||||||||||||||
|
|
|
|
|
|
|
|
|
|
|
|
|
|
|
|||||||||||||||
| Loans: |
||||||||||||||||||||||||||||
| Individually evaluated for impairment |
$ | 775 | $ | 6,176 | $ | 0 | $ | 0 | $ | 0 | $ | 0 | $ | 6,951 | ||||||||||||||
| Collectively evaluated for impairment |
564,180 | 557,932 | 652,883 | 74,816 | 6,046 | 595 | 1,856,452 | |||||||||||||||||||||
| Acquired with deteriorated credit quality |
205 | 1,527 | 0 | 0 | 0 | 0 | 1,732 | |||||||||||||||||||||
| Modified in a troubled debt restructuring |
2,640 | 9,191 | 0 | 0 | 0 | 0 | 11,831 | |||||||||||||||||||||
|
|
|
|
|
|
|
|
|
|
|
|
|
|
|
|||||||||||||||
| Total ending loans balance |
$ | 567,800 | $ | 574,826 | $ | 652,883 | $ | 74,816 | $ | 6,046 | $ | 595 | $ | 1,876,966 | ||||||||||||||
|
|
|
|
|
|
|
|
|
|
|
|
|
|
|
|||||||||||||||
The following tables present information related to loans individually evaluated for impairment, including loans modified in troubled debt restructurings, by portfolio segment as of December 31, 2017 and 2016 and for the years ended December 31, 2017, 2016, and 2015:
| December 31, 2017 | Unpaid Balance |
Recorded Investment |
Allowance Losses |
|||||||||
| With an allowance recorded: |
||||||||||||
| Commercial, industrial, and agricultural |
$ | 1,915 | $ | 1,915 | $ | 292 | ||||||
| Commercial mortgage |
9,940 | 9,731 | 5,444 | |||||||||
| Residential real estate |
0 | 0 | 0 | |||||||||
| With no related allowance recorded: |
||||||||||||
| Commercial, industrial, and agricultural |
5,264 | 4,485 | 0 | |||||||||
| Commercial mortgage |
3,211 | 2,410 | 0 | |||||||||
| Residential real estate |
0 | 0 | 0 | |||||||||
|
|
|
|
|
|
|
|||||||
| Total |
$ | 20,330 | $ | 18,541 | $ | 5,736 | ||||||
|
|
|
|
|
|
|
|||||||
71
Table of Contents
| December 31, 2016 | Unpaid Balance |
Recorded Investment |
Allowance Losses |
|||||||||
| With an allowance recorded: |
||||||||||||
| Commercial, industrial, and agricultural |
$ | 1,644 | $ | 1,644 | $ | 313 | ||||||
| Commercial mortgage |
16,200 | 15,367 | 3,210 | |||||||||
| Residential real estate |
0 | 0 | 0 | |||||||||
| With no related allowance recorded: |
||||||||||||
| Commercial, industrial, and agricultural |
2,669 | 1,771 | 0 | |||||||||
| Commercial mortgage |
0 | 0 | 0 | |||||||||
| Residential real estate |
0 | 0 | 0 | |||||||||
|
|
|
|
|
|
|
|||||||
| Total |
$ | 20,513 | $ | 18,782 | $ | 3,523 | ||||||
|
|
|
|
|
|
|
|||||||
The unpaid principal balance of impaired loans includes the Corporation’s recorded investment in the loan and amounts that have been charged off.
| Year Ended December 31, 2017 |
||||||||||||
| Average |
Interest |
Cash Basis |
||||||||||
| With an allowance recorded: |
||||||||||||
| Commercial, industrial, and agricultural |
$ | 1,513 | $ | 97 | $ | 97 | ||||||
| Commercial mortgage |
11,944 | 327 | 327 | |||||||||
| Residential real estate |
0 | 0 | 0 | |||||||||
| With no related allowance recorded: |
||||||||||||
| Commercial, industrial, and agricultural |
2,438 | 114 | 114 | |||||||||
| Commercial mortgage |
2,474 | 122 | 122 | |||||||||
| Residential real estate |
0 | 0 | 0 | |||||||||
|
|
|
|
|
|
|
|||||||
| Total |
$ | 18,369 | $ | 660 | $ | 660 | ||||||
|
|
|
|
|
|
|
|||||||
| Year Ended December 31, 2016 |
||||||||||||
| Average |
Interest |
Cash Basis |
||||||||||
| With an allowance recorded: |
||||||||||||
| Commercial, industrial, and agricultural |
$ | 2,616 | $ | 2 | $ | 2 | ||||||
| Commercial mortgage |
8,138 | 0 | 0 | |||||||||
| Residential real estate |
50 | 6 | 6 | |||||||||
| With no related allowance recorded: |
||||||||||||
| Commercial, industrial, and agricultural |
2,290 | 0 | 0 | |||||||||
| Commercial mortgage |
2,773 | 0 | 0 | |||||||||
| Residential real estate |
0 | 0 | 0 | |||||||||
|
|
|
|
|
|
|
|||||||
| Total |
$ | 15,867 | $ | 8 | $ | 8 | ||||||
|
|
|
|
|
|
|
|||||||
72
Table of Contents
| Year Ended December 31, 2015 |
||||||||||||
| Average |
Interest |
Cash Basis |
||||||||||
| With an allowance recorded: |
||||||||||||
| Commercial, industrial, and agricultural |
$ | 5,667 | $ | 44 | $ | 44 | ||||||
| Commercial mortgage |
8,154 | 0 | 0 | |||||||||
| Residential real estate |
370 | 21 | 21 | |||||||||
| With no related allowance recorded: |
||||||||||||
| Commercial, industrial, and agricultural |
1,831 | 14 | 14 | |||||||||
| Commercial mortgage |
4,806 | 0 | 0 | |||||||||
| Residential real estate |
103 | 6 | 6 | |||||||||
|
|
|
|
|
|
|
|||||||
| Total |
$ | 20,931 | $ | 85 | $ | 85 | ||||||
|
|
|
|
|
|
|
|||||||
The following table presents the recorded investment in nonaccrual loans and loans past due over 90 days still on accrual by class of loans as of December 31, 2017 and 2016:
| December 31, 2017 |
December 31, 2016 |
|||||||||||||||
| Nonaccrual | Past Due Over 90 Days Still on Accrual |
Nonaccrual | Past Due Over 90 Days Still on Accrual |
|||||||||||||
| Commercial, industrial, and agricultural |
$ | 1,869 | $ | 78 | $ | 2,734 | $ | 0 | ||||||||
| Commercial mortgages |
11,065 | 0 | 5,996 | 0 | ||||||||||||
| Residential real estate |
5,470 | 338 | 5,600 | 0 | ||||||||||||
| Consumer |
828 | 17 | 999 | 0 | ||||||||||||
| Credit cards |
0 | 44 | 0 | 10 | ||||||||||||
|
|
|
|
|
|
|
|
|
|||||||||
| Total |
$ | 19,232 | $ | 477 | $ | 15,329 | $ | 10 | ||||||||
|
|
|
|
|
|
|
|
|
|||||||||
Nonaccrual loans and loans past due over 90 days still on accrual include both smaller balance homogeneous loans that are collectively evaluated for impairment and individually classified impaired loans.
The following table presents the aging of the recorded investment in past due loans as of December 31, 2017 and 2016 by class of loans.
| December 31, 2017 | 30-59 Days Past Due |
60-89 Days Past Due |
Greater Than 89 Days Past Due |
Total Past Due |
Loans Not Past Due |
Total | ||||||||||||||||||
| Commercial, industrial, and agricultural |
$ | 2,745 | $ | 646 | $ | 748 | $ | 4,139 | $ | 744,999 | $ | 749,138 | ||||||||||||
| Commercial mortgages |
233 | 0 | 292 | 525 | 599,540 | 600,065 | ||||||||||||||||||
| Residential real estate |
2,290 | 1,494 | 4,655 | 8,439 | 704,908 | 713,347 | ||||||||||||||||||
| Consumer |
454 | 307 | 812 | 1,573 | 78,620 | 80,193 | ||||||||||||||||||
| Credit cards |
31 | 10 | 44 | 85 | 6,668 | 6,753 | ||||||||||||||||||
| Overdrafts |
0 | 0 | 0 | 0 | 352 | 352 | ||||||||||||||||||
|
|
|
|
|
|
|
|
|
|
|
|
|
|||||||||||||
| Total |
$ | 5,753 | $ | 2,457 | $ | 6,551 | $ | 14,761 | $ | 2,135,087 | $ | 2,149,848 | ||||||||||||
|
|
|
|
|
|
|
|
|
|
|
|
|
|||||||||||||
73
Table of Contents
| December 31, 2016 | 30-59 Days Past Due |
60-89 Days Past Due |
Greater Than 89 Days Past Due |
Total Past Due |
Loans Not Past Due |
Total | ||||||||||||||||||
| Commercial, industrial, and agricultural |
$ | 1,558 | $ | 299 | $ | 1,294 | $ | 3,151 | $ | 564,649 | $ | 567,800 | ||||||||||||
| Commercial mortgages |
559 | 0 | 1,516 | 2,075 | 572,751 | 574,826 | ||||||||||||||||||
| Residential real estate |
2,155 | 737 | 3,710 | 6,602 | 646,281 | 652,883 | ||||||||||||||||||
| Consumer |
648 | 890 | 974 | 2,512 | 72,304 | 74,816 | ||||||||||||||||||
| Credit cards |
105 | 0 | 10 | 115 | 5,931 | 6,046 | ||||||||||||||||||
| Overdrafts |
0 | 0 | 0 | 0 | 595 | 595 | ||||||||||||||||||
|
|
|
|
|
|
|
|
|
|
|
|
|
|||||||||||||
| Total |
$ | 5,025 | $ | 1,926 | $ | 7,504 | $ | 14,455 | $ | 1,862,511 | $ | 1,876,966 | ||||||||||||
|
|
|
|
|
|
|
|
|
|
|
|
|
|||||||||||||
Troubled Debt Restructurings
During the years ended December 31, 2017 and 2016, the terms of certain loans were modified as troubled debt restructurings. The modification of the terms of such loans included either or both of the following: a reduction of the stated interest rate of the loan; or an extension of the maturity date at a stated rate of interest lower than the current market rate for new debt with similar risk.
The following table presents the number of loans, loan balances, and specific reserves for loans that have been restructured in a troubled debt restructuring as of December 31, 2017 and December 31, 2016.
| December 31, 2017 |
December 31, 2016 |
|||||||||||||||||||||||
| Number of Loans |
Loan Balance |
Specific Reserve |
Number of Loans |
Loan Balance |
Specific Reserve |
|||||||||||||||||||
| Commercial, industrial, and agricultural |
10 | $ | 5,213 | $ | 245 | 7 | $ | 2,640 | $ | 125 | ||||||||||||||
| Commercial mortgages |
9 | 12,090 | 5,444 | 8 | 9,191 | 2,214 | ||||||||||||||||||
| Residential real estate |
0 | 0 | 0 | 0 | 0 | 0 | ||||||||||||||||||
| Consumer |
0 | 0 | 0 | 0 | 0 | 0 | ||||||||||||||||||
| Credit cards |
0 | 0 | 0 | 0 | 0 | 0 | ||||||||||||||||||
|
|
|
|
|
|
|
|
|
|
|
|
|
|||||||||||||
| Total |
19 | $ | 17,303 | $ | 5,689 | 15 | $ | 11,831 | $ | 2,339 | ||||||||||||||
|
|
|
|
|
|
|
|
|
|
|
|
|
|||||||||||||
The following table presents loans by class modified as troubled debt restructurings that occurred during the years ended December 31, 2017, 2016, and 2015:
| Year Ended December 31, 2017 |
||||||||||||
| Number of Loans |
Pre-Modification Outstanding Recorded Investment |
Post-Modification Outstanding Recorded Investment |
||||||||||
| Commercial, industrial, and agricultural |
4 | $ | 2,750 | $ | 2,750 | |||||||
| Commercial mortgages |
2 | 6,421 | 6,421 | |||||||||
| Residential real estate |
0 | 0 | 0 | |||||||||
| Consumer |
0 | 0 | 0 | |||||||||
| Credit cards |
0 | 0 | 0 | |||||||||
|
|
|
|
|
|
|
|||||||
| Total |
6 | $ | 9,171 | $ | 9,171 | |||||||
|
|
|
|
|
|
|
|||||||
74
Table of Contents
| Year Ended December 31, 2016 |
||||||||||||
| Number of Loans |
Pre-Modification Outstanding Recorded Investment |
Post-Modification Outstanding Recorded Investment |
||||||||||
| Commercial, industrial, and agricultural |
1 | $ | 109 | $ | 109 | |||||||
| Commercial mortgages |
0 | 0 | 0 | |||||||||
| Residential real estate |
0 | 0 | 0 | |||||||||
| Consumer |
0 | 0 | 0 | |||||||||
| Credit cards |
0 | 0 | 0 | |||||||||
|
|
|
|
|
|
|
|||||||
| Total |
1 | $ | 109 | $ | 109 | |||||||
|
|
|
|
|
|
|
|||||||
| Year Ended December 31, 2015 |
||||||||||||
| Number of Loans |
Pre-Modification Outstanding Recorded Investment |
Post-Modification Outstanding Recorded Investment |
||||||||||
| Commercial, industrial, and agricultural |
1 | $ | 1,327 | $ | 1,327 | |||||||
| Commercial mortgages |
0 | 0 | 0 | |||||||||
| Residential real estate |
0 | 0 | 0 | |||||||||
| Consumer |
0 | 0 | 0 | |||||||||
| Credit cards |
0 | 0 | 0 | |||||||||
|
|
|
|
|
|
|
|||||||
| Total |
1 | $ | 1,327 | $ | 1,327 | |||||||
|
|
|
|
|
|
|
|||||||
The troubled debt restructurings described above increased the allowance for loan losses by $4,024, $0 and $0 during the years ended December 31, 2017, 2016, and 2015, respectively.
Modifications involving a reduction of the stated interest rate of the loan were for periods ranging from 4-15 years. Modifications involving an extension of the maturity date were for periods ranging from 4-18 years.
A loan is considered to be in payment default once it is 90 days contractually past due under the modified terms. Except as discussed below, all loans modified in troubled debt restructurings are performing in accordance with their modified terms as of December 31, 2017 and 2016 and no principal balances were forgiven in connection with the loan restructurings.
During the year ended December 31, 2017 four impaired commercial industrial loans totaling $2,750 were modified in troubled debt restructurings. The Corporation recorded an additional provision for loan losses of $129 and there were no chargeoffs for these loans during the year ended December 31, 2017.
During the year ended December 31, 2017 two impaired commercial real estate loans totaling $6,421 were modified in troubled debt restructurings. The Corporation recorded an additional provision for loan losses of $3,895 and there were no chargeoffs for these loans during the year ended December 31, 2017.
During the year ended December 31, 2016 one impaired commercial industrial loan having a balance of $109 was modified in troubled debt restructurings. The Corporation did not record any additional provision for loan losses and there were no chargeoffs for this loan during the year ended December 31, 2016.
75
Table of Contents
During the year ended December 31, 2015 one impaired commercial industrial loan having a balance of $1,327 was modified in troubled debt restructurings. The Corporation did not record any additional provision for loan losses and there were no chargeoffs for this loan during the year ended December 31, 2015.
In order to determine whether a borrower is experiencing financial difficulty, an evaluation is performed of the probability that the borrower will be in payment default on any of its debt in the foreseeable future without a loan modification. This evaluation is performed using the Corporation’s internal underwriting policies. The Corporation has no further loan commitments to customers whose loans are classified as a troubled debt restructuring.
Generally, nonperforming troubled debt restructurings are restored to accrual status when the obligation is brought current, has performed in accordance with the contractual terms for a reasonable period of time (generally six months) and the ultimate collectability of the total contractual principal and interest is no longer in doubt.
Credit Quality Indicators
The Corporation classifies commercial, industrial, and agricultural loans and commercial mortgage loans into risk categories based on relevant information about the ability of borrowers to service their debt, such as current financial information, historical payment experience, credit documentation, public information, and current economic trends, among other factors. Loans with outstanding balances greater than $1 million are analyzed at least semiannually and loans with outstanding balances of less than $1 million are analyzed at least annually.
The Corporation uses the following definitions for risk ratings:
Special Mention: Loans classified as special mention have a potential weakness that deserves management’s close attention. If left uncorrected, these potential weaknesses may result in deterioration of the repayment prospects for the loan or of the Corporation’s credit position at some future date.
Substandard: Loans classified as substandard are inadequately protected by the current net worth and paying capacity of the obligor or of the collateral pledged, if any. Loans so classified have a well-defined weakness or weaknesses that jeopardize the liquidation of the debt. They are characterized by the distinct possibility that the Corporation will sustain some loss if the deficiencies are not corrected.
Doubtful: Loans classified as doubtful have all the weaknesses inherent in those classified as substandard, with the added characteristic that the weaknesses make collection or liquidation in full, on the basis of currently existing facts, conditions, and values, highly questionable and improbable.
76
Table of Contents
Loans not rated as special mention, substandard, or doubtful are considered to be pass rated loans. All loans included in the following tables have been assigned a risk rating within 12 months of the balance sheet date.
| December 31, 2017 | Pass | Special Mention |
Substandard | Doubtful | Total | |||||||||||||||
| Commercial, industrial, and agricultural |
$ | 713,102 | $ | 16,726 | $ | 19,310 | $ | 0 | $ | 749,138 | ||||||||||
| Commercial mortgages |
581,631 | 4,419 | 14,015 | 0 | 600,065 | |||||||||||||||
|
|
|
|
|
|
|
|
|
|
|
|||||||||||
| Total |
$ | 1,294,733 | $ | 21,145 | $ | 33,325 | $ | 0 | $ | 1,349,203 | ||||||||||
|
|
|
|
|
|
|
|
|
|
|
|||||||||||
| December 31, 2016 | Pass | Special Mention |
Substandard | Doubtful | Total | |||||||||||||||
| Commercial, industrial, and agricultural |
$ | 531,320 | $ | 14,638 | $ | 21,831 | $ | 11 | $ | 567,800 | ||||||||||
| Commercial mortgages |
551,474 | 1,809 | 21,543 | 0 | 574,826 | |||||||||||||||
|
|
|
|
|
|
|
|
|
|
|
|||||||||||
| Total |
$ | 1,082,794 | $ | 16,447 | $ | 43,374 | $ | 11 | $ | 1,142,626 | ||||||||||
|
|
|
|
|
|
|
|
|
|
|
|||||||||||
The Corporation considers the performance of the loan portfolio and its impact on the allowance for loan losses. For residential real estate, consumer, and credit card loan classes, the Corporation also evaluates credit quality based on the performance status of the loan, which was previously presented, and by payment activity. Nonperforming loans include loans on nonaccrual status and loans past due over 90 days and still accruing interest. The following table presents the recorded investment in residential, consumer, and credit card loans based on performance status as of December 31, 2017 and December 31, 2016:
| December 31, 2017 | December 31, 2016 | |||||||||||||||||||||||
| Residential Real Estate |
Consumer | Credit Cards |
Residential Real Estate |
Consumer | Credit Cards |
|||||||||||||||||||
| Performing |
$ | 707,539 | $ | 79,348 | $ | 6,709 | $ | 647,283 | $ | 73,817 | $ | 6,036 | ||||||||||||
| Nonperforming |
5,808 | 845 | 44 | 5,600 | 999 | 10 | ||||||||||||||||||
|
|
|
|
|
|
|
|
|
|
|
|
|
|||||||||||||
| Total |
$ | 713,347 | $ | 80,193 | $ | 6,753 | $ | 652,883 | $ | 74,816 | $ | 6,046 | ||||||||||||
|
|
|
|
|
|
|
|
|
|
|
|
|
|||||||||||||
The Corporation’s portfolio of residential real estate and consumer loans maintained within Holiday Financial Services Corporation (“Holiday”), a subsidiary that offers small balance unsecured and secured loans, primarily collateralized by automobiles and equipment, to borrowers with higher risk characteristics than are typical in the Bank’s consumer loan portfolio, are considered to be subprime loans.
Holiday’s loan portfolio, included in consumer and residential loans above, is summarized as follows at December 31, 2017 and 2016:
| 2017 | 2016 | |||||||
| Consumer |
$ | 23,428 | $ | 24,026 | ||||
| Residential real estate |
0 | 1,209 | ||||||
| Less: unearned discount |
(3,889 | ) | (3,430 | ) | ||||
|
|
|
|
|
|||||
| Total |
$ | 19,539 | $ | 21,805 | ||||
|
|
|
|
|
|||||
77
Table of Contents
6. Secondary Market Mortgage Activities
The following summarizes secondary market mortgage activities for the years ended December 31, 2017, 2016 and 2015:
| 2017 | 2016 | 2015 | ||||||||||
| Loans originated for resale |
$ | 25,231 | $ | 31,255 | $ | 15,171 | ||||||
| Proceeds from sales of loans held for sale |
24,285 | 33,045 | 14,927 | |||||||||
| Net gains on sales of loans held for sale |
545 | 818 | 630 | |||||||||
| Loan servicing fees |
563 | 421 | 390 | |||||||||
Total loans serviced for others were $159,208 and $157,073 December 31, 2017 and 2016, respectively.
The following summarizes activity for capitalized mortgage servicing rights for the years ended December 31, 2017, 2016, and 2015:
| 2017 | 2016 | 2015 | ||||||||||
| Balance, beginning of year |
$ | 1,391 | $ | 962 | $ | 856 | ||||||
| Additions |
198 | 200 | 380 | |||||||||
| Servicing rights acquired |
0 | 367 | 0 | |||||||||
| Amortization |
(202 | ) | (138 | ) | (274 | ) | ||||||
|
|
|
|
|
|
|
|||||||
| Balance, end of year |
$ | 1,387 | $ | 1,391 | $ | 962 | ||||||
|
|
|
|
|
|
|
|||||||
The fair value of mortgage servicing rights is based on market prices for comparable mortgage servicing contracts, when available, or alternatively based on a valuation model that calculates the present value of estimated future net servicing income. The fair value of mortgage servicing rights was not materially different than amortized cost at December 31, 2017 and 2016, respectively. No valuation allowance is deemed necessary at December 31, 2017, 2016, or 2015. The fair value of interest rate lock commitments and forward commitments to sell loans was not material at December 31, 2017 or 2016.
7. Premises and Equipment
The following summarizes premises and equipment at December 31, 2017 and 2016:
| 2017 | 2016 | |||||||
| Land |
$ | 8,147 | $ | 7,324 | ||||
| Premises and leasehold improvements |
53,903 | 48,563 | ||||||
| Furniture and equipment |
31,238 | 30,125 | ||||||
| Construction in process |
71 | 4,014 | ||||||
|
|
|
|
|
|||||
| 93,359 | 90,026 | |||||||
| Less: accumulated depreciation |
42,644 | 40,504 | ||||||
|
|
|
|
|
|||||
| Premises and equipment, net |
$ | 50,715 | $ | 49,522 | ||||
|
|
|
|
|
|||||
Depreciation on premises and equipment amounted to $3,811 in 2017, $3,215 in 2016 and $2,759 in 2015.
78
Table of Contents
The Corporation is committed under nineteen non-cancelable operating leases for facilities and eleven non-cancelable operating leases for vehicles with initial or remaining terms in excess of one year. The minimum annual rental commitments under these leases at December 31, 2017 are as follows:
| 2018 |
$ | 1,167 | ||
| 2019 |
1,021 | |||
| 2020 |
836 | |||
| 2021 |
736 | |||
| 2022 |
578 | |||
| Thereafter |
3,530 | |||
|
|
|
|||
| $ | 7,868 | |||
|
|
|
Rental expense, net of rental income, charged to occupancy expense for 2017, 2016, and 2015 was $870, $773 and $699, respectively.
In December 2009, the Corporation entered into a sale-leaseback transaction for real estate used in the operations of one of its branch office locations. The lease term is seventeen years, with two automatic renewal terms of five years each. The Corporation sold the property for $1,200 but financed the entire sales amount. Because the buyer/lessor did not make an initial investment on the purchase of the real estate that is adequate to transfer the risks and rewards of ownership, the Corporation deferred the entire gain of $489 associated with this transaction, which is included in accrued interest payable and other liabilities in the accompanying consolidated balance sheet. The gain is being recognized over the term of the loan under the installment method, and the gain recognized was included in other income in the accompanying consolidated statements of income and comprehensive income and totaled $25, $25 and $22 in 2017, 2016, and 2015, respectively.
The minimum annual rental commitments under this sale-leaseback transaction at December 31, 2017 are as follows:
| 2018 |
$ | 105 | ||
| 2019 |
105 | |||
| 2020 |
105 | |||
| 2021 |
105 | |||
| 2022 |
105 | |||
| Thereafter |
420 | |||
|
|
|
|||
| $ | 945 | |||
|
|
|
8. Foreclosed Assets
Foreclosed real estate is reported net of a valuation allowance and included in accrued interest receivable and other assets in the accompanying consolidated balance sheets. Activity for the years ended December 31, 2017, 2016, and 2015 is as follows:
| 2017 | 2016 | 2015 | ||||||||||
| Balance, beginning of year |
$ | 1,015 | $ | 654 | $ | 806 | ||||||
| Acquired from Lake National Bank |
0 | 665 | 0 | |||||||||
| Additions |
630 | 120 | 806 | |||||||||
| Sales (at carrying value) |
(935 | ) | (424 | ) | (958 | ) | ||||||
|
|
|
|
|
|
|
|||||||
| Balance, end of year |
$ | 710 | $ | 1,015 | $ | 654 | ||||||
|
|
|
|
|
|
|
|||||||
79
Table of Contents
Expenses related to foreclosed real estate include:
| 2017 | 2016 | 2015 | ||||||||||
| Net (gain) loss on sale |
$ | (208 | ) | $ | (134 | ) | $ | 3 | ||||
| Operating expenses, net of rental income |
366 | 223 | 169 | |||||||||
|
|
|
|
|
|
|
|||||||
| $ | 158 | $ | 89 | $ | 172 | |||||||
|
|
|
|
|
|
|
|||||||
9. Goodwill and Intangible Assets
Goodwill
The change in the carrying amount of goodwill for the years ended December 31, 2017 and 2016 is as follows:
| 2017 | 2016 | |||||||
| Balance, beginning of year |
$ | 38,730 | $ | 27,194 | ||||
| Acquired during the year |
0 | 11,536 | ||||||
|
|
|
|
|
|||||
| Balance, end of year |
$ | 38,730 | $ | 38,730 | ||||
|
|
|
|
|
|||||
Impairment exists when a reporting unit’s carrying value of goodwill exceeds its fair value, which is determined through a two-step impairment test. Step 1 includes the determination of the carrying value of our single reporting unit, including the existing goodwill and intangible assets, and estimating the fair value of the reporting unit. We determined the fair value of our reporting unit exceeded its carrying amount. If the carrying amount of the reporting unit exceeds its fair value, we are required to perform a second step to the impairment test. Our annual impairment analysis at December 31, 2017 and 2016 indicated that the Step 2 analysis was not necessary.
Intangible Assets
In connection with its acquisition of FC Banc Corp. in 2013, the Corporation recorded a core deposit intangible asset of $4,834. During the years ended December 31, 2017, 2016, and 2015, the Corporation recorded amortization expense of $662, $835 and $1,008, respectively. The net carrying values at December 31, 2017 and December 31, 2016 were $899 and $ 1,561, respectively. No other intangible assets were required to be recorded in connection with the acquisition of FC Banc Corp.
In connection with its acquisition of Lake National Bank in 2016, the Corporation recorded a core deposit intangible asset of $1,583. During the year ended December 31, 2017 and 2016, the Corporation recorded amortization expense of $567 and $290, respectively. The net carrying values at December 31, 2017 and 2016 were $726 and $1,293, respectively. No other intangible assets were required to be recorded in connection with the acquisition of Lake National Bank.
80
Table of Contents
Estimated amortization expense of core deposit intangible assets for each of the next five years is as follows:
| 2018 |
$ | 898 | ||
| 2019 |
567 | |||
| 2020 |
160 | |||
| 2021 |
0 | |||
| 2022 |
0 |
10. Deposits
The following table reflects time certificates of deposit accounts included in total deposits and their remaining maturities at December 31, 2017:
| Time deposits maturing: |
||||
| 2018 |
$ | 125,809 | ||
| 2019 |
128,602 | |||
| 2020 |
91,799 | |||
| 2021 |
7,954 | |||
| 2022 |
6,881 | |||
| Thereafter |
3,926 | |||
|
|
|
|||
| $ | 364,971 | |||
|
|
|
|||
Certificates of deposit of $250 thousand or more totaled $108,992 and $25,650 at December 31, 2017 and 2016, respectively. The Corporation had $3,500 and $0 in brokered deposits at December 31, 2017 and 2016.
11. Borrowings
At December 31, 2017 and 2016, the Corporation had available one $10 million unsecured line of credit with an unaffiliated institution, at a variable interest rate with a floor as defined in the agreement. There were no borrowings on the line of credit at December 31, 2017 and 2016.
81
Table of Contents
FHLB Borrowings
At December 31, 2017, the Bank had remaining borrowing capacity with the FHLB of $532,809. At December 31, 2017, borrowings with the FHLB are secured by a pledge of selected securities in the amount of $8,068 and certain loans with a balance of $1,085,644. Borrowings from the FHLB at December 31, 2017 and 2016 are as follows:
| Interest |
Maturity |
2017 |
2016 |
|||||||||
| (a) |
n/a | $ | 34,416 | $ | 103,969 | |||||||
| (b) |
09/06/17 | 0 | 15,016 | |||||||||
| (c) |
12/15/17 | 0 | 15,093 | |||||||||
| (d) |
09/06/18 | 7,550 | 17,523 | |||||||||
| (e) |
06/28/19 | 30,000 | 0 | |||||||||
| (f) |
09/06/19 | 11,752 | 18,360 | |||||||||
| (g) |
09/16/19 | 8,883 | 13,865 | |||||||||
| (h) |
06/29/20 | 30,000 | 0 | |||||||||
| (i) |
09/08/20 | 13,859 | 18,780 | |||||||||
| (j) |
06/28/21 | 30,000 | 0 | |||||||||
| (k) |
06/29/22 | 50,000 | 0 | |||||||||
| (l) |
09/06/22 | 15,976 | 19,201 | |||||||||
| (m) |
12/05/22 | 20,000 | 0 | |||||||||
| (n) |
07/03/23 | 700 | 700 | |||||||||
| (o) |
09/05/23 | 1,797 | 1,925 | |||||||||
| (p) |
03/11/24 | 814 | 852 | |||||||||
| (q) |
06/11/24 | 435 | 462 | |||||||||
| (r) |
05/04/26 | 217 | 240 | |||||||||
| (s) |
10/14/26 | 231 | 252 | |||||||||
| (t) |
02/11/33 | 729 | 766 | |||||||||
|
|
|
|
|
|||||||||
| $ | 257,359 | $ | 227,004 | |||||||||
|
|
|
|
|
|||||||||
(a) – Open Repo borrowing at an interest rate of 1.54% at December 31, 2017 and 0.74% at December 31, 2016. The maximum amount of the Open Repo borrowing available is $150,000.
(b) – Fixed rate borrowing at an interest rate of 0.83%, with monthly principal and interest payments.
(c) – Fixed rate borrowing at an interest rate of 1.25%, with monthly principal and interest payments.
(d) – Fixed rate borrowing at an interest rate of 1.05%, with monthly principal and interest payments.
(e) – Fixed rate borrowing at interest rate of 1.66%. Interest only payments with principal due at maturity.
(f) – Fixed rate borrowing at an interest rate of 1.17%, with monthly principal and interest payments.
(g) – Fixed rate borrowing at an interest rate of 1.35%, with monthly principal and interest payments.
(h) – Fixed rate borrowing at interest rate of 1.82%. Interest only payments with principal due at maturity.
82
Table of Contents
(i) – Fixed rate borrowing at an interest rate of 1.27%, with monthly principal and interest payments.
(j) – Fixed rate borrowing at interest rate of 1.97%. Interest only payments with principal due at maturity.
(k) – Fixed rate borrowing at interest rate of 1.97%. Interest only payments with principal due at maturity.
(l) – Fixed rate borrowing at an interest rate of 1.47%, with monthly principal and interest payments.
(m) – Fixed rate borrowing at interest rate of 2.39%. Interest only payments with principal due at maturity.
(n) – Fixed rate borrowing at interest rate of 4.72%. Interest only payments with principal due at maturity.
(o) – Fixed rate borrowing at an interest rate of 4.31%, with monthly principal and interest payments and a balloon payment due at maturity.
(p) – Fixed rate borrowing at an interest rate of 3.05%, with monthly principal and interest payments and a balloon payment due at maturity.
(q) – Fixed rate borrowing at an interest rate of 5.24%, with monthly principal and interest payments and a balloon payment due at maturity.
(r) – Fixed rate borrowing at an interest rate of 3.35%, with monthly principal and interest payments.
(s) – Fixed rate borrowing at an interest rate of 4.00%, with monthly principal and interest payments.
(t) – Fixed rate borrowing at an interest rate of 2.96%, with monthly principal and interest payments.
Each advance is payable at its maturity date, with a prepayment penalty for fixed rate advances.
Other Borrowings
At December 31, 2017 and 2016, the Bank had no outstanding borrowings from unaffiliated institutions under overnight borrowing agreements.
The Bank entered into a borrowing transaction with an unaffiliated institution in March 2007. The proceeds of this borrowing were $10,000 and, as part of this transaction, the Bank pledged certain securities which had a carrying amount of $11,416 at December 31, 2016. The borrowing matured March 20, 2017. The interest rate was fixed and was 5.25% at December 31, 2016.
Subordinated Debentures
In 2007, the Corporation issued two $10,000 floating rate trust preferred securities as part of a pooled offering of such securities. The interest rate on each offering is determined quarterly and floats based on the 3 month LIBOR plus 1.55% and was 3.14% at December 31, 2017 and 2.51% at December 31, 2016. The Corporation issued subordinated debentures to the trusts in exchange for the proceeds of the
83
Table of Contents
offerings, which debentures represent the sole assets of the trusts. The subordinated debentures must be redeemed no later than 2037. The Corporation may redeem the debentures, in whole or in part, at face value at any time. The Corporation has the option to defer interest payments from time to time for a period not to exceed five consecutive years. Although the trusts are variable interest entities, the Corporation is not the primary beneficiary. As a result, because the trusts are not consolidated with the Corporation, the Corporation does not report the securities issued by the trusts as liabilities. Instead, the Corporation reports as liabilities the subordinated debentures issued by the Corporation and held by the trusts, since the liabilities are not eliminated in consolidation.
In September 2016, the Corporation completed a private placement of $50,000 in aggregate principal amount of fixed-to-floating rate subordinated notes. The notes will mature in October 2026, and will initially bear interest at a fixed rate of 5.75% per annum, payable semi-annually in arrears, to, but excluding, October 15, 2021, and thereafter to, but excluding, the maturity date or earlier redemption, the interest rate shall reset quarterly to an interest rate per annum equal to the then current three-month LIBOR rate plus 4.55%. These subordinated notes were designed to qualify as Tier 2 capital under the Federal Reserve’s capital guidelines and were given an investment grade rating of BBB- by Kroll Bond Rating Agency.
Maturity Schedule of All Borrowed Funds
The following is a schedule of maturities of all borrowed funds as of December 31, 2017:
| 2018 |
$ | 62,242 | ||
| 2019 |
47,562 | |||
| 2020 |
37,505 | |||
| 2021 |
33,740 | |||
| 2022 |
72,931 | |||
| Thereafter |
73,999 | |||
|
|
|
|||
| Total borrowed funds |
$ | 327,979 | ||
|
|
|
|||
12. Interest Rate Swaps
On May 3, 2011, the Corporation executed an interest rate swap agreement with a 5 year term and an effective date of September 15, 2013 in order to hedge cash flows associated with $10 million of a subordinated note that was issued by the Corporation during 2007 and elected cash flow hedge accounting for the agreement. The Corporation’s objective in using this derivative is to add stability to interest expense and to manage its exposure to interest rate risk. The interest rate swap involves the receipt of variable-rate amounts in exchange for fixed-rate payments from September 15, 2013 to September 15, 2018 without exchange of the underlying notional amount. At December 31, 2017, the variable rate on the subordinated debt was 3.14% (LIBOR plus 155 basis points) and the Corporation was paying 5.57% (4.02% fixed rate plus 155 basis points).
As of December 31, 2017 and 2016, no derivatives were designated as fair value hedges or hedges of net investments in foreign operations. Additionally, the Corporation does not use derivatives for trading or speculative purposes and currently does not have any derivatives that are not designated as hedges.
84
Table of Contents
The following tables provide information about the amounts and locations of activity related to the interest rate swaps designated as cash flow hedges within the Corporation’s consolidated balance sheet and statement of income as of December 31, 2017 and 2016 and for the years ended December 31, 2017, 2016, and 2015:
| As of December 31 | Liability Derivative |
|||||||||||||||||
| Balance Sheet | Fair value |
|||||||||||||||||
| Location | 2017 | 2016 | ||||||||||||||||
| Interest rate contract | Accrued interest payable and other liabilities |
($161) | ($459) | |||||||||||||||
| For the Year Ended December 31, 2017 | (a) | (b) | (c) | (d) | (e) | |||||||||||||
| Interest rate contract |
$194 | Interest expense – subordinated debentures | ($288) | |
Other income |
|
$0 | |||||||||||
| For the Year Ended December 31, 2016 | ||||||||||||||||||
| Interest rate contract |
$180 | Interest expense – subordinated debentures |
($340) | |
Other income |
|
$0 | |||||||||||
| For the Year Ended December 31, 2015 | ||||||||||||||||||
| Interest rate contract |
$137 | Interest expense – subordinated debentures | ($378) | |
Other income |
|
$0 | |||||||||||
| (a) | Amount of Gain Recognized in Other Comprehensive Loss on Derivative (Effective Portion), net of tax |
| (b) | Location of Gain or (Loss) Reclassified from Accumulated Other Comprehensive Loss into Income (Effective Portion) |
| (c) | Amount of Loss Reclassified from Accumulated Other Comprehensive Loss into Income (Effective Portion) |
| (d) | Location of Gain or (Loss) Recognized in Income on Derivative (Ineffective Portion and Amount Excluded from Effectiveness Testing) |
| (e) | Amount of Gain or (Loss) Recognized in Income on Derivative (Ineffective Portion and Amount Excluded from Effectiveness Testing) |
Amounts reported in accumulated other comprehensive loss related to the interest rate swap will be reclassified to interest expense as interest payments are made on the subordinated debentures. Such amounts reclassified from accumulated other comprehensive loss to interest expense in the next twelve months are expected to be $270.
As of December 31, 2017 and 2016, a cash collateral balance of $1,400 was maintained with the counterparty to the interest rate swaps. These balances are included in interest bearing deposits with other banks on the consolidated balance sheets.
During 2016, the Corporation entered into certain interest rate swap contracts that are not designated as hedging instruments. These derivative contracts relate to transactions in which the Corporation enters into an interest rate swap with a customer while at the same time entering into an offsetting interest rate swap with another financial institution. In connection with each swap transaction, the Corporation
85
Table of Contents
agrees to pay interest to the customer on a notional amount at a variable interest rate and receive interest from the customer on a similar notional amount at a fixed interest rate. Concurrently, the Corporation agrees to pay another financial institution the same fixed interest rate on the same notional amount and receive the same variable interest rate on the same notional amount. The transaction allows the Corporation’s customers to effectively convert a variable rate loan to a fixed rate. Because the Corporation acts as an intermediary for its customer, changes in the fair value of the underlying derivative contracts offset each other and do not impact the Corporation’s results of operations.
The following table provides information about the amounts and locations of activity related to the back-to-back interest rate swaps within the Corporation’s consolidated balance sheet as of December 31, 2017 and 2016:
| Notional Amount |
Average Maturity (in years) |
Weighted Average Fixed Rate |
Weighted Average Variable Rate |
Fair Value |
||||||||||||||
| December 31, 2017 |
||||||||||||||||||
|
3rd Party interest rate swaps |
$ | 11,848 | 8.0 | 4.51 | % | 1 month LIBOR + 2.37% | $ | 149 (a) | ||||||||||
| Customer interest rate swaps |
(11,848 | ) | 8.0 | 4.51 | % | 1 month LIBOR + 2.37% | (149) (b) | |||||||||||
| December 31, 2016 |
||||||||||||||||||
|
3rd Party interest rate swaps |
$ | 14,814 | 9.7 | 4.43 | % | 1 month LIBOR + 2.35% | $ | 211 (a) | ||||||||||
| Customer interest rate swaps |
(14,814 | ) | 9.7 | 4.43 | % | 1 month LIBOR + 2.35% | (211) (b) | |||||||||||
| (a) | Reported in accrued interest receivable and other assets within the consolidated balance sheets |
| (b) | Reported in accrued interest payable and other liabilities within the consolidated balance sheets |
13. Income Taxes
The following is a summary of income tax expense for the years ended December 31, 2017, 2016, and 2015:
| 2017 |
2016 |
2015 |
||||||||||
| Current – federal |
$ | 8,978 | $ | 6,181 | $ | 7,777 | ||||||
| Current – state |
29 | (33 | ) | 139 | ||||||||
| Deferred – federal |
376 | 1,023 | 376 | |||||||||
| Deferred tax adjustment related to reduction in U.S. federal statutory income tax rate |
3,009 | 0 | 0 | |||||||||
|
|
|
|
|
|
|
|||||||
| Income tax expense |
$ | 12,392 | $ | 7,171 | $ | 8,292 | ||||||
|
|
|
|
|
|
|
|||||||
86
Table of Contents
The reconciliation of income tax attributable to pre-tax income at the federal statutory tax rates to income tax expense is as follows:
| 2017 | % | 2016 | % | 2015 | % | |||||||||||||||||||
| Tax at statutory rate |
$ | 12,688 | 35.0 | $ | 9,699 | 35.0 | $ | 10,671 | 35.0 | |||||||||||||||
| Tax exempt income, net |
(1,899 | ) | (5.2 | ) | (2,054 | ) | (7.4 | ) | (1,816 | ) | (6.0 | ) | ||||||||||||
| Deferred tax adjustment related to reduction in U.S. federal statutory income tax rate |
3,009 | 8.3 | 0 | 0.00 | 0 | 0.0 | ||||||||||||||||||
| Bank owned life insurance |
(581 | ) | (1.6 | ) | (379 | ) | (1.3 | ) | (418 | ) | (1.4 | ) | ||||||||||||
| Merger costs |
0 | 0.0 | 170 | 0.6 | 30 | 0.1 | ||||||||||||||||||
| Other |
(825 | ) | (2.3 | ) | (265 | ) | (1.0 | ) | (175 | ) | (0.5 | ) | ||||||||||||
|
|
|
|
|
|
|
|
|
|
|
|
|
|||||||||||||
| Income tax expense |
$ | 12,392 | 34.2 | $ | 7,171 | 25.9 | $ | 8,292 | 27.2 | |||||||||||||||
|
|
|
|
|
|
|
|
|
|
|
|
|
|||||||||||||
Income tax expense for 2017 was impacted by the adjustment of our deferred tax assets and liabilities related to the reduction in the U.S. federal statutory income tax rate to 21% under the Tax Cuts and Jobs Act, which was enacted on December 22, 2017. As a result of the new law, which is more fully discussed below, the Corporation recognized additional tax expense totaling $3,009, as detailed in the table above.
Year-end deferred taxes are presented in the table below. As a result of the Tax Cuts and Jobs Act enacted on December 22, 2017 (discussed below), deferred taxes as of December 31, 2017 are based on the newly enacted U.S. statutory federal income tax rate of 21%. Deferred taxes as of December 31, 2016 are based on the previously enacted U.S. statutory federal income tax rate of 35%.
| 2017 |
2016 |
|||||||
| Deferred tax assets: |
||||||||
| Allowance for loan losses |
$ | 2,840 | $ | 4,679 | ||||
| Fair value adjustments – business combination |
1,135 | 2,530 | ||||||
| Deferred compensation |
1,903 | 2,891 | ||||||
| Impaired security valuation |
0 | 379 | ||||||
| Net operating loss carryover |
71 | 627 | ||||||
| Post-retirement benefits |
892 | 1,688 | ||||||
| Unrealized loss on interest rate swap |
34 | 161 | ||||||
| Nonaccrual loan interest |
390 | 649 | ||||||
| Accrued expenses |
699 | 1,282 | ||||||
| Deferred fees and costs |
598 | 629 | ||||||
| Other |
344 | 465 | ||||||
|
|
|
|
|
|||||
| 8,906 | 15,980 | |||||||
|
|
|
|
|
|||||
| Deferred tax liabilities: |
||||||||
| Unrealized gain on securities available for sale |
126 | 750 | ||||||
| Premises and equipment |
1,413 | 2,258 | ||||||
| Unrealized gain on trading securities |
156 | 118 | ||||||
| Intangibles – section 197 |
2,593 | 4,735 | ||||||
| Mortgage servicing rights |
291 | 487 | ||||||
| Other |
78 | 23 | ||||||
|
|
|
|
|
|||||
| 4,657 | 8,371 | |||||||
|
|
|
|
|
|||||
| Net deferred tax asset |
$ | 4,249 | $ | 7,609 | ||||
|
|
|
|
|
|||||
87
Table of Contents
At December 31, 2017 and 2016, the Corporation has no unrecognized tax benefits. The Corporation does not expect the total amount of unrecognized tax benefits to significantly increase in the next twelve months.
The Corporation recognizes interest and/or penalties related to income tax matters as part of income tax expense. At December 31, 2017 and 2016, there were no amounts accrued for interest and/or penalties and no amounts recorded as expense for the years ending December 31, 2017, 2016, and 2015.
The Corporation and its subsidiaries are subject to U.S. federal income tax. The Corporation is no longer subject to examination by the taxing authorities for years prior to 2013. Tax years 2014 through 2016 remain open to federal examination.
In connection with its acquisition of FC Banc Corp., the Corporation assumed a federal net operating loss carryforward of $6,367, which expires in 2033. Under Section 382 of the Internal Revenue Code, the utilization of the loss carryforward in future years is limited based on the consideration paid and other factors. The annual limitation on the utilization of this loss carry forward is $1,455. As of December 31, 2017, the balance of the net operating loss carryforward is $338. Management believes that the net operating loss carryforward will be used in full before its expiration.
The Tax Cuts and Jobs Act was enacted on December 22, 2017. Among other things, the new law (i) establishes a new, flat corporate federal statutory income tax rate of 21%, (ii) eliminates the corporate alternative minimum tax and allows the use of any such carryforwards to offset regular tax liability for any taxable year, (iii) limits the deduction for net interest expense incurred by U.S. corporations, (iv) allows businesses to immediately expense, for tax purposes, the cost of new investments in certain qualified depreciable assets, (v) eliminates or reduces certain deductions related to meals and entertainment expenses, (vi) modifies the limitation on excessive employee remuneration to eliminate the exception for performance-based compensation and clarifies the definition of a covered employee and (vii) limits the deductibility of deposit insurance premiums. The Tax Cuts and Jobs Act also significantly changes U.S. tax law related to foreign operations, however, such changes do not currently impact us.
14. Employee Benefit Plans
The Corporation sponsors a contributory defined contribution Section 401(k) plan in which substantially all employees participate. The plan permits employees to make pre-tax contributions which are matched by the Corporation at 100% for every 1% contributed up to 3% then 50% for every 1% contributed up to the next 2% in total of the employee’s compensation. The Corporation’s matching contribution and related expenses were $802, $652 and $508 in 2017, 2016, and 2015, respectively. Profit sharing contributions to this plan, based on current year compensation, are 6.0% of total compensation plus 5.7% of the compensation in excess of $127. The Corporation recognized profit sharing expense of $1,755, $1,276 and $868 in 2017, 2016, and 2015 respectively.
The Corporation has adopted a non-qualified supplemental executive retirement plan (“SERP”) for certain executives to compensate those executive participants in the Corporation’s retirement plan whose benefits are limited by compensation limitations under current tax law. The SERP is considered an unfunded plan for tax and ERISA purposes and all obligations arising under the SERP are payable from the general assets of the Corporation. At December 31, 2017 and 2016, obligations of $5,349 and $4,958, respectively, were included in other liabilities for this plan. Expenses related to this plan were $648 in 2017, $550 in 2016 and $608 in 2015.
88
Table of Contents
The Corporation has established a Survivor Benefit Plan for the benefit of outside directors. The purpose of the plan is to provide life insurance benefits to beneficiaries of the Corporation’s directors who at the time of their death are participants in the plan. The plan is considered an unfunded plan for tax and ERISA purposes and all obligations arising under the plan are payable from the general assets of the Corporation. At December 31, 2017 and 2016, obligations of $1,264 and $1,175, respectively, were included in other liabilities for this plan. Expenses related to this plan were $89 in 2017, $33 in 2016 and $155 in 2015.
The Corporation has an unfunded post retirement benefits plan which provides certain health care benefits for retired employees who have reached the age of 60 and retired with 30 years of service. The plan was amended in 2013 to include only employees hired prior to January 1, 2000. Benefits are provided for these retired employees and their qualifying dependents from the age of 60 through the age of 65.
The following table sets forth the change in the benefit obligation of the plan as of and for the years ended December 31, 2017, 2016, and 2015:
| 2017 | 2016 | 2015 | ||||||||||
| Benefit obligation at beginning of year |
$ | 3,409 | $ | 3,066 | $ | 2,744 | ||||||
| Interest cost |
114 | 108 | 90 | |||||||||
| Service cost |
103 | 103 | 96 | |||||||||
| Actual claims |
(78 | ) | (151 | ) | (109 | ) | ||||||
| Actuarial (gain) loss |
(808 | ) | 283 | 245 | ||||||||
|
|
|
|
|
|
|
|||||||
| Benefit obligation at end of year |
$ | 2,740 | $ | 3,409 | $ | 3,066 | ||||||
|
|
|
|
|
|
|
|||||||
Amounts recognized in accumulated other comprehensive income at December 31, 2017 and 2016 consist of:
| 2017 | 2016 | |||||||
| Net actuarial loss |
$ | (871 | ) | $ | (1,871 | ) | ||
| Tax effect |
183 | 654 | ||||||
|
|
|
|
|
|||||
| $ | (688 | ) | $ | (1,217 | ) | |||
|
|
|
|
|
|||||
The accumulated benefit obligation was $2,740 and $3,409 at December 31, 2017 and 2016, respectively.
89
Table of Contents
The following table sets forth the components of net periodic benefit cost and other amounts recognized in other comprehensive income:
| 2017 | 2016 | 2015 | ||||||||||
| Service cost |
$ | 103 | $ | 103 | $ | 96 | ||||||
| Interest cost |
114 | 108 | 90 | |||||||||
| Net amortization of transition obligation and actuarial loss |
192 | 184 | 173 | |||||||||
|
|
|
|
|
|
|
|||||||
| Net periodic benefit cost |
409 | 395 | 359 | |||||||||
|
|
|
|
|
|
|
|||||||
| Net (gain) loss |
(808 | ) | 282 | 311 | ||||||||
| Amortization of loss |
(192 | ) | (184 | ) | (173 | ) | ||||||
|
|
|
|
|
|
|
|||||||
| Total recognized in other comprehensive income |
(1,000 | ) | 98 | 138 | ||||||||
|
|
|
|
|
|
|
|||||||
| Total recognized in net periodic benefit cost and other comprehensive income |
$ | (591 | ) | $ | 493 | $ | 497 | |||||
|
|
|
|
|
|
|
|||||||
The estimated net loss that will be amortized from accumulated other comprehensive income into net periodic benefit cost over the next fiscal year is $84.
The weighted average discount rate used to calculate net periodic benefit cost was 3.49% in 2017, 3.67% in 2016, and 3.42% in 2015. The weighted average rate used to calculate accrued benefit obligations was 3.13% in 2017, 3.49% in 2016, and 3.67% in 2015. The health care cost trend rate used to measure the expected costs of benefits is 5.0% for 2018 and thereafter. A one percent increase in the health care trend rates would result in an increase of $267 in the benefit obligation as of December 31, 2017, and would increase the service and interest costs by $19 in future periods. A similar one percent decrease in health care trend rates would result in a decrease of $218 and $15 in the benefit obligation and services and interest costs, respectively, at December 31, 2017.
15. Deferred Compensation Plans
Deferred compensation plans cover all directors and certain officers. Under the plans, the Corporation pays each participant, or their beneficiary, the value of the participant’s account over a maximum period of 10 years, beginning with the individual’s termination of service. A liability is accrued for the obligation under these plans.
A summary of changes in the deferred compensation plan liability follows:
| 2017 | 2016 | 2015 | ||||||||||
| Balance, beginning of year |
$ | 2,080 | $ | 1,226 | $ | 1,087 | ||||||
| Deferrals, dividends, and changes in fair value recorded as an expense |
444 | 936 | 209 | |||||||||
| Deferred compensation payments |
(21 | ) | (82 | ) | (70 | ) | ||||||
|
|
|
|
|
|
|
|||||||
| Balance, end of year |
$ | 2,503 | $ | 2,080 | $ | 1,226 | ||||||
|
|
|
|
|
|
|
|||||||
90
Table of Contents
16. Stock-Based Compensation
A summary of changes in nonvested restricted stock awards follows:
| Shares | Weighted-average Fair Value |
|||||||
| Nonvested at January 1, 2017 |
100,726 | $17.36 | ||||||
| Granted |
39,673 | 25.94 | ||||||
| Forfeited |
(2,482 | ) | 21.12 | |||||
| Vested |
(43,445 | ) | 17.54 | |||||
|
|
|
|
|
|||||
| Nonvested at December 31, 2017 |
94,472 | $20.79 | ||||||
|
|
|
|
|
|||||
As of December 31, 2017 and 2016, there was $1,243 and $1,190, respectively, of total unrecognized compensation cost related to nonvested shares granted under the restricted stock award plan. The fair value of shares vesting during 2017, 2016, and 2015 was $1,035, $624 and $530, respectively. Compensation expense for restricted stock awards was $928 in 2017, $820 in 2016 and $621 in 2015.
The number of authorized stock-based awards still available for grant as of December 31, 2017 was 219,800.
In addition to the time-based restricted stock disclosed above, the Corporation’s Board of Directors granted performance-based restricted stock awards (“PBRSAs”) with a maximum of 10,000 shares to an employee in 2017. The number of PBRSAs will depend on certain performance conditions and are also subject to service-based vesting.
17. Related Party Transactions
In the ordinary course of business, the Bank has transactions, including loans and credit cards, with its officers, directors, and their affiliated companies. The aggregate of such loans and credit cards totaled $5,331 on December 31, 2017 compared to $4,357 on December 31, 2016. During 2017, $1,816 in new loans were made, $25 were added for the net change in outstanding credit card balances, $200 were removed due to a change in the composition of related parties, and repayments totaled $667.
Deposits from principal officers, directors, and their affiliates were $11,982 and $14,434 at December 31, 2017 and 2016, respectively.
18. Capital Requirements and Restrictions on Retained Earnings
Banks and financial holding companies are subject to regulatory capital requirements administered by federal banking agencies. Capital adequacy guidelines and, for the Bank, prompt corrective action (PCA) regulations involve quantitative measures of assets, liabilities, and certain off-balance sheet items calculated under regulatory accounting practices. Capital amounts and classifications are also subject to qualitative judgments by regulators. Failure to meet capital requirements can result in regulatory enforcement actions. Under the Basel III rules, the Corporation and Bank must hold a capital conservation buffer above the adequately capitalized risk-based capital ratios. The capital conservation buffer is being phased in from 0.0% for 2015 to 2.50% by 2019. The capital conservation
91
Table of Contents
buffer for 2017 is 1.25% and for 2016 is 0.625%. The net unrealized gain or loss on available for sale securities are excluded from computing regulatory capital. Management believes as of December 31, 2017 the Corporation and Bank meet all capital adequacy requirements to which they are subject.
The PCA regulations provide five capital categories: well capitalized, adequately capitalized, undercapitalized, significantly undercapitalized, and critically undercapitalized, although these terms alone do not represent overall financial condition. If adequately capitalized, regulatory approval is required to accept brokered deposits. If undercapitalized, capital distributions are limited, as is asset growth and expansion; brokered deposits may not be accepted, renewed or rolled over; and capital restoration plans are required. As of December 31, 2017 and 2016, the most recent regulatory notifications categorized the Bank as well capitalized under the PCA regulatory framework. There are no events or conditions since this notification that management believes have changed the Bank’s capital category.
Actual and required capital amounts and ratios are presented below as of December 31, 2017 and 2016. The capital adequacy ratio includes the capital conservation buffer.
| Actual | For Capital Adequacy Purposes |
To Be Well Capitalized Under Prompt Corrective Action Provisions |
||||||||||||||||||||||
| Amount |
Ratio |
Amount |
Ratio |
Amount |
Ratio |
|||||||||||||||||||
| December 31, 2017 |
||||||||||||||||||||||||
| Total Capital to Risk Weighted Assets |
||||||||||||||||||||||||
| Consolidated |
$297,708 | 14.32 | % | $192,341 | 9.25% | N/A | ||||||||||||||||||
| Bank |
$279,704 | 13.58 | % | $190,513 | 9.25% | $205,960 | 10.00% | |||||||||||||||||
| Tier 1 (Core) Capital to Risk Weighted Assets |
||||||||||||||||||||||||
| Consolidated |
$228,015 | 10.97 | % | $150,754 | 7.25% | N/A | ||||||||||||||||||
| Bank |
$261,643 | 12.70 | % | $149,321 | 7.25% | $164,768 | 8.00% | |||||||||||||||||
| Common equity Tier 1 to Risk Weighted Assets |
||||||||||||||||||||||||
| Consolidated |
$208,015 | 10.00 | % | $119,563 | 5.75% | N/A | ||||||||||||||||||
| Bank |
$254,264 | 12.35 | % | $118,427 | 5.75% | $133,874 | 6.50% | |||||||||||||||||
| Tier 1 (Core) Capital to Average Assets |
||||||||||||||||||||||||
| Consolidated |
$228,015 | 8.45 | % | $107,969 | 4.00% | N/A | ||||||||||||||||||
| Bank |
$261,643 | 9.80 | % | $106,798 | 4.00% | $133,498 | 5.00% | |||||||||||||||||
| December 31, 2016 |
||||||||||||||||||||||||
| Total Capital to Risk Weighted Assets |
||||||||||||||||||||||||
| Consolidated |
$261,530 | 14.05 | % | $160,501 | 8.625% | N/A | ||||||||||||||||||
| Bank |
$242,592 | 13.19 | % | $158,590 | 8.625% | $183,873 | 10.00% | |||||||||||||||||
| Tier 1 (Core) Capital to Risk Weighted Assets |
||||||||||||||||||||||||
| Consolidated |
$195,200 | 10.49 | % | $123,283 | 6.625% | N/A | ||||||||||||||||||
| Bank |
$228,109 | 12.41 | % | $121,816 | 6.625% | $147,098 | 8.00% | |||||||||||||||||
| Common equity Tier 1 to Risk Weighted Assets |
||||||||||||||||||||||||
| Consolidated |
$175,200 | 9.41 | % | $95,370 | 5.125% | N/A | ||||||||||||||||||
| Bank |
$220,730 | 12.00 | % | $94,235 | 5.125% | $119,517 | 6.50% | |||||||||||||||||
| Tier 1 (Core) Capital to Average Assets |
||||||||||||||||||||||||
| Consolidated |
$195,200 | 7.85 | % | $99,430 | 4.00% | N/A | ||||||||||||||||||
| Bank |
$228,109 | 9.36 | % | $97,527 | 4.00% | $121,909 | 5.00% | |||||||||||||||||
The final rules implementing Basel Committee on Banking Supervision’s capital guidelines for U.S. banks (Basel III rules) became effective for the Company on January 1, 2015 with full compliance with
92
Table of Contents
all of the requirements being phased in over a multi-year schedule, and fully phased in by January 1, 2019. The net unrealized gain or loss on available for sales securities is included in computing regulatory capital.
Certain restrictions exist regarding the ability of the Bank to transfer funds to the Corporation in the form of cash dividends, loans or advances. During 2018, $30,615 of accumulated net earnings of the Bank included in consolidated stockholders’ equity, plus any 2018 net profits retained to the date of the dividend declared, is available for distribution to the Corporation as dividends without prior regulatory approval, subject to regulatory capital requirements described above.
19. Off-Balance Sheet Activities
Some financial instruments, such as loan commitments, credit lines, letters of credit, and overdraft protection, are issued to meet customer financing needs. These are agreements to provide credit or to support the credit of others, as long as conditions established in the contract are met, and usually have expiration dates. Commitments may expire without being used. Off-balance sheet risk to credit loss exists up to the face amount of these instruments, although material losses are not anticipated. The same credit policies are used to make such commitments as are used for loans, including obtaining collateral at exercise of the commitment.
The contractual amount of financial instruments with off-balance sheet risk was as follows at December 31, 2017 and 2016:
| 2017 | 2016 | |||||||||||||||
| Fixed Rate |
Variable Rate |
Fixed Rate |
Variable Rate |
|||||||||||||
| Commitments to make loans |
$64,799 | $210,987 | $57,283 | $202,883 | ||||||||||||
| Unused lines of credit |
0 | 118,348 | 0 | 105,779 | ||||||||||||
| Standby letters of credit |
0 | 14,985 | 0 | 4,618 | ||||||||||||
Commitments to make loans are generally made for periods of 60 days or less. The fixed rate loan commitments at December 31, 2017 have interest rates ranging from 1.00% to 18.00% and maturities ranging from 8 months to 30 years. The fixed rate loan commitments at December 31, 2016 have interest rates ranging from 1.19% to 18.00% and maturities ranging from 6 months to 30 years.
In October 2015, the Corporation entered into a subscription agreement with Oxer BCP Mezzanine Fund, LP (“Oxer”) and committed to invest $5,000 as a limited partner in the fund. In February 2017, the Corporation entered into a subscription agreement with Tecum Capital Partners II, LP (“Tecum”) and committed to invest $3,000 as a limited partner in the fund. Oxer and Tecum are both Small Business Investment Company (SBIC) that are licensed and regulated by the Office of Investment at the Small Business Administration (SBA). The SBIC license allows SBICs to employ private capital and funds borrowed at a low cost using SBA-guaranteed securities to make investments in qualifying small businesses and similar enterprises as defined by SBA regulations. As of December 31, 2017, the Bank has made $3,290 of capital contributions to Oxer and $1,167 of capital contributions to Tecum.
20. Fair Value
Fair Value Measurement
Fair value is defined as the exchange price that would be received for an asset or paid to transfer a liability (an exit price) in the principal or most advantageous market for the asset or liability in an
93
Table of Contents
orderly transaction between market participants on the measurement date. A fair value hierarchy has also been established which requires an entity to maximize the use of observable inputs and minimize the use of unobservable inputs when measuring fair value. The following three levels of inputs are used to measure fair value:
Level 1: Quoted prices (unadjusted) for identical assets or liabilities in active markets that the entity has the ability to access as of the measurement date.
Level 2: Significant other observable inputs other than Level 1 prices such as quoted prices for similar assets or liabilities; quoted prices in markets that are not active; or other inputs that are observable or can be corroborated by observable market data.
Level 3: Significant unobservable inputs that reflect a company’s own assumptions about the assumptions that market participants would use in pricing an asset or liability.
The fair values of most trading securities and securities available for sale are determined by obtaining quoted prices on nationally recognized securities exchanges (Level 1 inputs) or matrix pricing, which is a mathematical technique widely used in the industry to value debt securities without relying exclusively on quoted prices for the specific securities but rather relying on the securities’ relationship to other benchmark quoted securities (Level 2 inputs).
The Corporation’s structured pooled trust preferred securities are priced using Level 3 inputs. The decline in the level of observable inputs and market activity in this class of investments by the measurement date has been significant and resulted in unreliable external pricing. Broker pricing and bid/ask spreads, when available, vary widely, and the once-active market has become comparatively inactive. The Corporation engaged a third party consultant who has developed a model for pricing these securities. Information such as historical and current performance of the underlying collateral, deferral and default rates, collateral coverage ratios, break in yield calculations, cash flow projections, liquidity and credit premiums required by a market participant, and financial trend analysis with respect to the individual issuing financial institutions and insurance companies are utilized in determining the security valuation. Due to the current market conditions as well as the limited trading activity of these types of securities, the market value of the Corporation’s structured pooled trust preferred securities are highly sensitive to assumption changes and market volatility.
The Corporation’s derivative instruments are interest rate swaps that are similar to those that trade in liquid markets. As such, significant fair value inputs can generally be verified and do not typically involve significant management judgments (Level 2 inputs).
The fair value of impaired loans with specific allocations of the allowance for loan losses is generally based on recent real estate appraisals prepared by third-parties. These appraisals may utilize a single valuation approach or a combination of approaches including comparable sales and the income approach. Adjustments are routinely made in the appraisal process by the appraisers to adjust for differences between the comparable sales and income data available. Management also adjusts appraised values based on the length of time that has passed since the appraisal date and other factors. Such adjustments are usually significant and typically result in a Level 3 classification of the inputs for determining fair value.
94
Table of Contents
Assets and liabilities measured at fair value on a recurring basis are as follows at December 31, 2017 and 2016:
| Fair Value Measurements at December 31, 2017 Using | ||||||||||||||||
| Description |
Total | Quoted Prices in Active Markets for Identical Assets (Level 1) |
Significant Other Observable Inputs (Level 2) |
Significant Unobservable Inputs (Level 3) |
||||||||||||
| Assets: |
||||||||||||||||
| Securities Available For Sale: |
||||||||||||||||
| U.S. Government sponsored entities |
$ | 108,148 | $ | 0 | $ | 108,148 | $ | 0 | ||||||||
| States and political subdivisions |
137,723 | 0 | 137,723 | 0 | ||||||||||||
| Residential and multi-family mortgage |
109,636 | 0 | 109,636 | 0 | ||||||||||||
| Corporate notes and bonds |
17,200 | 0 | 17,200 | 0 | ||||||||||||
| Pooled SBA |
36,040 | 0 | 36,040 | 0 | ||||||||||||
| Other equity securities |
962 | 962 | 0 | 0 | ||||||||||||
|
|
|
|
|
|
|
|
|
|||||||||
| Total Securities Available For Sale |
$ | 409,709 | $ | 962 | $ | 408,747 | $ | 0 | ||||||||
|
|
|
|
|
|
|
|
|
|||||||||
| Interest Rate swaps: |
$ | 149 | $ | 0 | $ | 149 | $ | 0 | ||||||||
|
|
|
|
|
|
|
|
|
|||||||||
| Trading Securities: |
||||||||||||||||
| Corporate equity securities |
$ | 5,125 | $ | 5,125 | $ | 0 | $ | 0 | ||||||||
| Mutual funds |
1,499 | 1,499 | 0 | 0 | ||||||||||||
| Certificates of deposit |
220 | 220 | 0 | 0 | ||||||||||||
| Corporate notes and bonds |
254 | 254 | 0 | 0 | ||||||||||||
| U.S. Government sponsored entities |
52 | 0 | 52 | 0 | ||||||||||||
|
|
|
|
|
|
|
|
|
|||||||||
| Total Trading Securities |
$ | 7,150 | $ | 7,098 | $ | 52 | $ | 0 | ||||||||
|
|
|
|
|
|
|
|
|
|||||||||
| Liabilities |
||||||||||||||||
| Interest rate swaps |
$ | (310 | ) | $ | 0 | $ | (310 | ) | $ | 0 | ||||||
|
|
|
|
|
|
|
|
|
|||||||||
| Fair Value Measurements at December 31, 2016 Using | ||||||||||||||||
| Description |
Total | Quoted Prices in Active Markets for Identical Assets (Level 1) |
Significant Other Observable Inputs (Level 2) |
Significant Unobservable Inputs (Level 3) |
||||||||||||
| Assets: |
||||||||||||||||
| Securities Available For Sale: |
||||||||||||||||
| U.S. Government sponsored entities |
$ | 140,351 | $ | 0 | $ | 140,351 | $ | 0 | ||||||||
| States and political subdivisions |
157,037 | 0 | 157,037 | 0 | ||||||||||||
| Residential and multi-family mortgage |
134,976 | 0 | 134,976 | 0 | ||||||||||||
| Corporate notes and bonds |
17,414 | 0 | 17,414 | 0 | ||||||||||||
| Pooled trust preferred |
2,049 | 0 | 0 | 2,049 | ||||||||||||
| Pooled SBA |
43,037 | 0 | 43,037 | 0 | ||||||||||||
| Other equity securities |
971 | 971 | 0 | 0 | ||||||||||||
|
|
|
|
|
|
|
|
|
|||||||||
| Total Securities Available For Sale |
$ | 495,835 | $ | 971 | $ | 492,815 | $ | 2,049 | ||||||||
|
|
|
|
|
|
|
|
|
|||||||||
| Interest Rate swaps: |
$ | 211 | $ | 0 | $ | 211 | $ | 0 | ||||||||
|
|
|
|
|
|
|
|
|
|||||||||
| Trading Securities: |
||||||||||||||||
| Corporate equity securities |
$ | 3,312 | $ | 3,312 | $ | 0 | $ | 0 | ||||||||
| Mutual funds |
1,037 | 1,037 | 0 | 0 | ||||||||||||
| Certificates of deposit |
202 | 202 | 0 | 0 | ||||||||||||
| Corporate notes and bonds |
254 | 254 | 0 | 0 | ||||||||||||
| U.S. Government sponsored entities |
53 | 0 | 53 | 0 | ||||||||||||
|
|
|
|
|
|
|
|
|
|||||||||
| Total Trading Securities |
$ | 4,858 | $ | 4,805 | $ | 53 | $ | 0 | ||||||||
|
|
|
|
|
|
|
|
|
|||||||||
| Liabilities |
||||||||||||||||
| Interest rate swaps |
$ | (670 | ) | $ | 0 | $ | (670 | ) | $ | 0 | ||||||
|
|
|
|
|
|
|
|
|
|||||||||
95
Table of Contents
The table below presents a reconciliation and income statement classification of gains and losses for all securities available for sale measured at fair value on a recurring basis using significant unobservable inputs (Level 3) for the year ended December 31, 2017:
| Pooled trust preferred |
||||
| Balance, January 1, 2017 |
$ | 2,049 | ||
| Total gains or (losses): |
||||
| Included in other comprehensive income (loss) |
134 | |||
| Sale of available-for-sale securities |
(2,183 | ) | ||
|
|
|
|||
| Balance, December 31, 2017 |
$ | 0 | ||
|
|
|
|||
The table below presents a reconciliation and income statement classification of gains and losses for all securities available for sale measured at fair value on a recurring basis using significant unobservable inputs (Level 3) for the year ended December 31, 2016:
| Pooled trust preferred |
||||
| Balance, January 1, 2016 |
$ | 3,413 | ||
| Total gains or (losses): |
||||
| Included in other comprehensive income (loss) |
(442 | ) | ||
| Included in realized gains on available-for-sale securities |
0 | |||
| Sale of available-for-sale securities |
(922 | ) | ||
|
|
|
|||
| Balance, December 31, 2016 |
$ | 2,049 | ||
|
|
|
|||
There were no Level 3 financial instruments carried at fair value on a recurring basis at December 31, 2017.
The following table presents quantitative information about Level 3 fair value measurements at December 31, 2016:
| Fair value |
Valuation Technique |
Unobservable Inputs |
Input Utilized | |||||
| Pooled trust preferred |
$2,049 | Discounted cash flow |
Collateral default rate
Yield |
0.5% in 2016 and thereafter 10% | ||||
| Prepayment speed | 2.0% constant prepayment rate in 2016 and thereafter |
At December 31, 2016 the significant unobservable inputs used in the fair value measurement of the Corporation’s pooled trust preferred securities are collateral default rate, yield, and prepayment speed. Significant increases in specific-issuer default assumptions or decreases in specific-issuer recovery assumptions would result in a lower fair value measurement. Conversely, decreases in specific-issuer default assumptions or increases in specific-issuer recovery assumptions would result in a higher fair value measurement.
96
Table of Contents
Assets and liabilities measured at fair value on a non-recurring basis are as follows at December 31, 2017 and 2016:
| Fair Value Measurements at December 31, 2017 Using | ||||||||||||||||
| Description |
Total | Quoted Prices in Active Markets for Identical Assets (Level 1) |
Significant Other Observable Inputs (Level 2) |
Significant Unobservable Inputs (Level 3) |
||||||||||||
| Assets: |
||||||||||||||||
| Impaired loans: |
||||||||||||||||
| Commercial mortgages |
$ | 11 | 0 | 0 | $ | 11 | ||||||||||
| Fair Value Measurements at December 31, 2016 Using | ||||||||||||||||
| Description |
Total | Quoted Prices in Active Markets for Identical Assets (Level 1) |
Significant Other Observable Inputs (Level 2) |
Significant Unobservable Inputs (Level 3) |
||||||||||||
| Assets: |
||||||||||||||||
| Impaired loans: |
||||||||||||||||
| Commercial mortgages |
$ | 2,067 | 0 | 0 | $ | 2,067 | ||||||||||
Impaired loans measured for impairment using the fair value of collateral for collateral dependent loans had a recorded investment of $646, with a valuation allowance of $635 as of December 31, 2017, resulting in an additional provision for loan losses of ($418) for the year then ended. Impaired loans measured for impairment using the fair value of collateral for collateral dependent loans had a recorded investment of $3,120, with a valuation allowance of $1,053 as of December 31, 2016, resulting in an additional provision for loan losses of ($189) for the year then ended.
The estimated fair values of impaired collateral dependent loans such as commercial or residential mortgages are determined primarily through third-party appraisals. When a collateral dependent loan, such as a commercial or residential mortgage loan, becomes impaired, a decision is made regarding whether an updated certified appraisal of the real estate is necessary. This decision is based on various considerations, including the age of the most recent appraisal, the loan-to-value ratio based on the original appraisal, and the condition of the property. Appraised values are discounted to arrive at the estimated selling price of the collateral and a further reduction for estimated costs to sell the property is applied, which results in an amount that is considered to be the estimated fair value. If a loan becomes impaired and the appraisal of related loan collateral is outdated, management applies an appropriate adjustment factor based on its experience with current valuations of similar collateral in determining the loan’s estimated fair value and resulting allowance for loan losses. Third-party appraisals are not customarily obtained in respect of unimpaired loans, unless in management’s view changes in circumstances warrant obtaining an updated appraisal.
97
Table of Contents
The following table presents quantitative information about Level 3 fair value measurements for financial instruments measured at fair value on a non-recurring basis at December 31, 2017:
| Fair value |
Valuation |
Unobservable Inputs |
Range (Weighted Average) | |||||||
| Impaired loans – commercial mortgages |
$ | 11 | Discounted cash flow method | Discount used in discounted cash flow method | 10% (10%) | |||||
The following table presents quantitative information about Level 3 fair value measurements for financial instruments measured at fair value on a non-recurring basis at December 31, 2016:
| Fair value |
Valuation |
Unobservable Inputs |
Range (Weighted Average) | |||||||
| Impaired loans – commercial mortgages |
$ | 2,067 | Sales comparison approach and discounted cash flow method | Adjustment for differences between the comparable sales and discount used in discounted cash flows | 10% – 14% (13%) | |||||
Fair Value of Financial Instruments
The following table presents the carrying amount and fair value of financial instruments at December 31, 2017:
| Carrying Amount |
Fair Value Measurement Using: | Total Fair Value |
||||||||||||||||||
| Level 1 | Level 2 | Level 3 | ||||||||||||||||||
| ASSETS |
||||||||||||||||||||
| Cash and cash equivalents |
$ | 35,345 | $ | 35,345 | $ | 0 | $ | 0 | $ | 35,345 | ||||||||||
| Securities available for sale |
409,709 | 962 | 408,747 | 0 | 409,709 | |||||||||||||||
| Trading securities |
7,150 | 7,098 | 52 | 0 | 7,150 | |||||||||||||||
| Loans held for sale |
852 | 0 | 853 | 0 | 853 | |||||||||||||||
| Net loans |
2,126,266 | 0 | 0 | 2,126,824 | 2,126,824 | |||||||||||||||
| FHLB and other equity interests |
21,517 | n/a | n/a | n/a | n/a | |||||||||||||||
| Interest rate swaps |
149 | 0 | 149 | 0 | 149 | |||||||||||||||
| Accrued interest receivable |
9,254 | 6 | 2,651 | 6,597 | 9,254 | |||||||||||||||
| LIABILITIES |
||||||||||||||||||||
| Deposits |
$ | (2,167,815 | ) | $ | (1,802,844 | ) | $ | (362,756 | ) | $ | 0 | $ | (2,165,600 | ) | ||||||
| FHLB and other borrowings |
(257,359 | ) | 0 | (257,361 | ) | 0 | (257,361 | ) | ||||||||||||
| Subordinated debentures |
(70,620 | ) | 0 | (63,575 | ) | 0 | (63,575 | ) | ||||||||||||
| Deposits held for sale |
0 | 0 | 0 | 0 | 0 | |||||||||||||||
| Interest rate swaps |
(310 | ) | 0 | (310 | ) | 0 | (310 | ) | ||||||||||||
| Accrued interest payable |
(554 | ) | 0 | (554 | ) | (0 | ) | (554 | ) | |||||||||||
98
Table of Contents
The following table presents the carrying amount and fair value of financial instruments at December 31, 2016:
| Carrying Amount |
Fair Value Measurement Using: | Total Fair Value |
||||||||||||||||||
| Level 1 | Level 2 | Level 3 | ||||||||||||||||||
| ASSETS |
||||||||||||||||||||
| Cash and cash equivalents |
$ | 29,183 | $ | 29,183 | $ | 0 | $ | 0 | $ | 29,183 | ||||||||||
| Securities available for sale |
495,835 | 971 | 492,815 | 2,049 | 495,835 | |||||||||||||||
| Trading securities |
4,858 | 4,805 | 53 | 0 | 4,858 | |||||||||||||||
| Loans held for sale |
7,528 | 0 | 7,553 | 0 | 7,553 | |||||||||||||||
| Net loans |
1,857,206 | 0 | 0 | 1,817,341 | 1,817,341 | |||||||||||||||
| FHLB and other equity interests |
19,186 | n/a | n/a | n/a | n/a | |||||||||||||||
| Interest rate swaps |
211 | 0 | 211 | 0 | 211 | |||||||||||||||
| Accrued interest receivable |
8,264 | 6 | 3,014 | 5,244 | 8,264 | |||||||||||||||
| LIABILITIES |
||||||||||||||||||||
| Deposits |
$ | (2,017,522 | ) | $ | (1,785,649 | ) | $ | (219,765 | ) | $ | 0 | $ | (2,005,414 | ) | ||||||
| FHLB and other borrowings |
(237,004 | ) | 0 | (226,769 | ) | 0 | (226,769 | ) | ||||||||||||
| Subordinated debentures |
(70,620 | ) | 0 | (61,831 | ) | 0 | (61,831 | ) | ||||||||||||
| Deposits held for sale |
(6,456 | ) | 0 | (6,417 | ) | 0 | (6,417 | ) | ||||||||||||
| Interest rate swaps |
(670 | ) | 0 | (670 | ) | 0 | (670 | ) | ||||||||||||
| Accrued interest payable |
(510 | ) | 0 | (510 | ) | 0 | (510 | ) | ||||||||||||
The methods and assumptions, not otherwise presented, used to estimate fair values are described as follows:
Cash and cash equivalents: The carrying amounts of cash and cash equivalents approximate fair values and are classified as Level 1.
Loans held for sale: The fair value of loans held for sale is estimated based upon binding contracts and quotes from third party investors resulting in a Level 2 classification.
Loans: For variable rate loans that reprice frequently and with no significant change in credit risk, fair values are based on carrying values, resulting in a Level 3 classification. Fair values for other loans are estimated using discounted cash flow analyses, using interest rates currently being offered for loans with similar terms to borrowers of similar credit quality, resulting in a Level 3 classification. Impaired loans are valued at the lower of cost or fair value as described previously. The methods utilized to estimate the fair value of loans do not necessarily represent an exit price.
Deposits held for sale: The fair value of deposits held for sale is estimated based upon binding contracts and quotes from third party investors resulting in a Level 2 classification.
FHLB and other equity interests: It is not practical to determine the fair value of Federal Home Loan Bank stock and other equity interests due to restrictions placed on the transferability of these instruments.
Accrued interest receivable: The carrying amount of accrued interest receivable approximates fair value resulting in a classification that is consistent with the asset with which it is associated.
Deposits: The fair values disclosed for demand deposits are, by definition, equal to the amount payable on demand at the reporting date (i.e. their carrying amount), resulting in a Level 1 classification. Fair
99
Table of Contents
values for time deposits are estimated using a discounted cash flow calculation that applies interest rates currently being offered on certificates to a schedule of aggregated expected monthly maturities on time deposits, resulting in a Level 2 classification.
FHLB and other borrowings: The fair values of the Corporation’s FHLB and other borrowings are estimated using discounted cash flow analyses based on the current borrowing rates for similar types of borrowing arrangements, resulting in a Level 2 classification.
Subordinated debentures: The fair value of the Corporation’s subordinated debentures are estimated using discounted cash flow analyses based on the current borrowing rates for similar types of arrangements, resulting in a Level 3 classification.
Accrued interest payable: The carrying amount of accrued interest payable approximates fair value resulting in a classification that is consistent with the liability with which it is associated.
While estimates of fair value are based on management’s judgment of the most appropriate factors as of the balance sheet date, there is no assurance that the estimated fair values would have been realized if the assets had been disposed of or the liabilities settled at that date, since market values may differ depending on various circumstances. The estimated fair values would also not apply to subsequent dates.
In addition, other assets and liabilities that are not financial instruments, such as premises and equipment, are not included in the disclosures. Also, non-financial assets such as, among other things, the estimated earnings power of core deposits, the earnings potential of trust accounts, the trained workforce, and customer goodwill, which typically are not recognized on the balance sheet, may have value but are not included in the fair value disclosures.
21. Parent Company Only Financial Information
| CONDENSED BALANCE SHEETS | December 31, | |||||||
| 2017 | 2016 | |||||||
| Assets |
||||||||
| Cash |
$ | 1,556 | $ | 1,436 | ||||
| Trading securities |
580 | 529 | ||||||
| Investment in bank subsidiary |
290,156 | 257,476 | ||||||
| Investment in non-bank subsidiaries |
21,781 | 23,324 | ||||||
| Deferreds and Current Receivable |
2,055 | 1,066 | ||||||
| Other assets |
2,059 | 2,666 | ||||||
|
|
|
|
|
|||||
| Total assets |
$ | 318,187 | $ | 286,497 | ||||
|
|
|
|
|
|||||
| Liabilities |
||||||||
| Borrowings from subsidiary |
$ | 1,400 | $ | 1,400 | ||||
| Subordinated debentures |
70,620 | 70,620 | ||||||
| Other liabilities |
2,257 | 2,693 | ||||||
|
|
|
|
|
|||||
| Total liabilities |
74,277 | 74,713 | ||||||
| Total shareholders’ equity |
243,910 | 201,913 | ||||||
|
|
|
|
|
|||||
| Total liabilities and shareholders’ equity |
$ | 318,187 | $ | 286,497 | ||||
|
|
|
|
|
|||||
100
Table of Contents
| CONDENSED STATEMENTS OF INCOME | Year Ended December 31, | |||||||||||
| Income: |
2017 | 2016 | 2015 | |||||||||
| Dividends from: |
||||||||||||
| Bank subsidiary |
$ | 8,840 | $ | 8,700 | $ | 10,404 | ||||||
| Non-bank subsidiaries |
2,250 | 1,200 | 323 | |||||||||
| Other |
220 | 230 | 157 | |||||||||
|
|
|
|
|
|
|
|||||||
| Total income |
11,310 | 10,130 | 10,884 | |||||||||
| Expenses |
(4,957 | ) | (2,611 | ) | (1,708 | ) | ||||||
|
|
|
|
|
|
|
|||||||
| Income before income taxes and equity in undistributed net income of subsidiaries: |
6,353 | 7,519 | 9,176 | |||||||||
| Income tax benefit |
1,614 | 813 | 547 | |||||||||
| Equity in undistributed net income of bank subsidiary |
17,430 | 13,184 | 11,889 | |||||||||
| Distributions in excess of net income of non-bank subsidiaries |
(1,537 | ) | (976 | ) | 585 | |||||||
|
|
|
|
|
|
|
|||||||
| Net income |
$ | 23,860 | $ | 20,540 | $ | 22,197 | ||||||
|
|
|
|
|
|
|
|||||||
| CONDENSED STATEMENTS OF CASH FLOWS | Year Ended December 31, | |||||||||||
| 2017 |
2016 |
2015 |
||||||||||
| Net income |
||||||||||||
| Adjustments to reconcile net income to net cash provided by |
$ | 23,860 | $ | 20,540 | $ | 22,197 | ||||||
| operating activities: |
||||||||||||
| Equity in undistributed net income of bank subsidiary |
(17,430 | ) | (13,184 | ) | (11,889 | ) | ||||||
| Equity in undistributed net income (distributions in excess of net income) of non-bank subsidiaries |
1,537 | 976 | (585 | ) | ||||||||
| Net unrealized gains on trading securities |
(12 | ) | (58 | ) | (11 | ) | ||||||
| Decrease (increase) in other assets |
(549 | ) | (1,277 | ) | 9 | |||||||
| (Decrease) increase in other liabilities |
791 | 1,645 | 663 | |||||||||
|
|
|
|
|
|
|
|||||||
| Net cash provided by operating activities |
8,197 | 8,642 | 10,384 | |||||||||
|
|
|
|
|
|
|
|||||||
| Cash flows from investing activities |
||||||||||||
| Investment in bank subsidiaries |
(15,400 | ) | (49,223 | ) | 0 | |||||||
|
|
|
|
|
|
|
|||||||
| Net cash used in investing activities |
(15,400 | ) | (49,223 | ) | 0 | |||||||
|
|
|
|
|
|
|
|||||||
| Cash flows from financing activities: |
||||||||||||
| Dividends paid |
(10,094 | ) | (9,546 | ) | (9,515 | ) | ||||||
| Proceeds from issuance of long term debt |
0 | 50,000 | 0 | |||||||||
| Purchase of treasury stock |
(1,877 | ) | (44 | ) | (868 | ) | ||||||
| Net proceeds from issuance of common stock |
19,294 | 0 | 0 | |||||||||
| Net advance from subsidiary |
0 | 50 | 0 | |||||||||
|
|
|
|
|
|
|
|||||||
| Net cash provided by (used in) financing activities |
7,323 | 40,460 | (10,383 | ) | ||||||||
|
|
|
|
|
|
|
|||||||
| Net increase (decrease) in cash |
120 | (121 | ) | 1 | ||||||||
| Cash beginning of year |
1,436 | 1,557 | 1,556 | |||||||||
|
|
|
|
|
|
|
|||||||
| Cash end of year |
$ | 1,556 | $ | 1,436 | $ | 1,557 | ||||||
|
|
|
|
|
|
|
|||||||
101
Table of Contents
22. Other Comprehensive Income
Other comprehensive income components and related tax effects were as follows for the years ended December 31, 2017, 2016, and 2015:
| 2017 | 2016 | 2015 | ||||||||||
| Unrealized holding losses on available for sale securities |
$ | (136 | ) | $ | (1,838 | ) | $ | (623 | ) | |||
| Less reclassification adjustment for gains recognized in earnings |
(160 | ) | (83 | ) | (666 | ) | ||||||
|
|
|
|
|
|
|
|||||||
| Net unrealized losses |
(296 | ) | (1,921 | ) | (1,289 | ) | ||||||
| Tax effect |
104 | 672 | 452 | |||||||||
|
|
|
|
|
|
|
|||||||
| Net-of-tax amount |
(192 | ) | (1,249 | ) | (837 | ) | ||||||
|
|
|
|
|
|
|
|||||||
| Unrealized holding gains on available for sale securities for which a portion of an other-than-temporary impairment has been recognized in earnings |
134 | (442 | ) | 2,508 | ||||||||
| Less reclassification adjustment for gains recognized in earnings |
(1,383 | ) | (922 | ) | 0 | |||||||
|
|
|
|
|
|
|
|||||||
| Net unrealized gains |
(1,249 | ) | (1,364 | ) | 2,508 | |||||||
| Tax effect |
437 | 477 | (878 | ) | ||||||||
|
|
|
|
|
|
|
|||||||
| Net-of-tax amount |
(812 | ) | (887 | ) | 1,630 | |||||||
|
|
|
|
|
|
|
|||||||
| Actuarial gain (loss) on postemployment health care plan |
808 | (282 | ) | (311 | ) | |||||||
| Net amortization of transition obligation and actuarial gain |
192 | 184 | 173 | |||||||||
|
|
|
|
|
|
|
|||||||
| Net unrealized gain (loss) on postemployment health care plan |
1,000 | (98 | ) | (138 | ) | |||||||
| Tax effect |
(175 | ) | 34 | 48 | ||||||||
|
|
|
|
|
|
|
|||||||
| Net-of-tax amount |
825 | (64 | ) | (90 | ) | |||||||
|
|
|
|
|
|
|
|||||||
| Unrealized gain (loss) on interest rate swap |
10 | (63 | ) | (168 | ) | |||||||
| Less reclassification adjustment for losses recognized in earnings |
288 | 340 | 378 | |||||||||
|
|
|
|
|
|
|
|||||||
| Net unrealized gain |
298 | 277 | 210 | |||||||||
| Tax effect |
(104 | ) | (97 | ) | (73 | ) | ||||||
|
|
|
|
|
|
|
|||||||
| Net-of-tax amount |
194 | 180 | 137 | |||||||||
|
|
|
|
|
|
|
|||||||
| Other comprehensive income (loss) |
$ | 15 | $ | (2,020 | ) | $ | 840 | |||||
|
|
|
|
|
|
|
|||||||
The following is a summary of the change in the accumulated other comprehensive income (loss) balance, net of tax, for the years ended December 31, 2017, 2016, and 2015.
| Balance | Comprehensive | |
Reclassification of Disproportionate |
|
Balance | |||||||||||
| 12/31/16 | Income (Loss) | Tax Effect | 12/31/17 | |||||||||||||
| Unrealized gains (losses) on securities available for sale |
$ | 1,393 | $ | (1,004 | ) | $ | 84 | $ | 473 | |||||||
| Unrealized gain (loss) on postretirement benefits plan |
(1,217 | ) | 825 | (298 | ) | (690 | ) | |||||||||
| Unrealized loss on interest rate swap |
(297 | ) | 194 | (23 | ) | (126 | ) | |||||||||
|
|
|
|
|
|
|
|
|
|||||||||
| Total |
$ | (121 | ) | $ | 15 | $ | (237 | ) | $ | (343 | ) | |||||
|
|
|
|
|
|
|
|
|
102
Table of Contents
| Balance | Comprehensive | |
Reclassification of Disproportionate |
|
Balance | |||||||||||
| 12/31/15 | Income (Loss) | Tax Effect | 12/31/16 | |||||||||||||
| Unrealized gains (losses) on securities available for sale |
$ | 3,529 | $ | (2,136 | ) | $ | 0 | $ | 1,393 | |||||||
| Unrealized gain (loss) on postretirement benefits plan |
(1,153 | ) | (64 | ) | 0 | (1,217 | ) | |||||||||
| Unrealized loss on interest rate swap |
(477 | ) | 180 | 0 | (297 | ) | ||||||||||
|
|
|
|
|
|
|
|
|
|||||||||
| Total |
$ | 1,899 | $ | (2,020 | ) | $ | 0 | $ | (121 | ) | ||||||
|
|
|
|
|
|
|
|
|
| Balance | Comprehensive | |
Reclassification of Disproportionate |
|
Balance | |||||||||||
| 1/1/15 | Income (Loss) | Tax Effect | 12/31/15 | |||||||||||||
| Unrealized gains (losses) on securities available for sale |
$ | 2,736 | $ | 793 | $ | 0 | $ | 3,529 | ||||||||
| Unrealized gain (loss) on postretirement benefits plan |
(1,063 | ) | (90 | ) | 0 | (1,153 | ) | |||||||||
| Unrealized loss on interest rate swap |
(614 | ) | 137 | 0 | (477 | ) | ||||||||||
|
|
|
|
|
|
|
|
|
|||||||||
| Total |
$ | 1,059 | $ | 840 | $ | 0 | $ | 1,899 | ||||||||
|
|
|
|
|
|
|
|
|
23. Quarterly Financial Data (Unaudited)
The unaudited quarterly results of operations for the years ended December 31, 2017 and 2016 are as follows:
| Quarters Ended in 2017 | Quarters Ended in 2016 | |||||||||||||||||||||||||||||||
| Mar. 31 | June 30 | Sept. 30 | Dec. 31 | Mar. 31 | June 30 | Sept. 30 | Dec. 31 | |||||||||||||||||||||||||
| Total interest and dividend income |
$ | 25,104 | $ | 27,003 | $ | 28,069 | $ | 28,698 | $ | 22,066 | $ | 22,473 | $ | 24,958 | $ | 24,818 | ||||||||||||||||
| Net interest income |
21,202 | 22,989 | 23,517 | 23,801 | 18,942 | 19,403 | 21,933 | 21,009 | ||||||||||||||||||||||||
| Provision for loan losses |
1,016 | 1,134 | 1,400 | 3,105 | 1,196 | 220 | 622 | 2,111 | ||||||||||||||||||||||||
| Non-interest income |
5,773 | 5,089 | 5,032 | 5,541 | 3,777 | 4,819 | 4,473 | 4,622 | ||||||||||||||||||||||||
| Non-interest expense |
17,034 | 17,797 | 17,618 | 17,588 | 14,814 | 18,753 | 17,096 | 16,455 | ||||||||||||||||||||||||
| Net income |
6,480 | 6,683 | 7,246 | 3,451 | 5,019 | 4,065 | 6,416 | 5,040 | ||||||||||||||||||||||||
| Net income per share, basic |
0.43 | 0.44 | 0.47 | 0.23 | 0.35 | 0.28 | 0.44 | 0.35 | ||||||||||||||||||||||||
| Net income per share, diluted |
0.43 | 0.44 | 0.47 | 0.23 | 0.35 | 0.28 | 0.44 | 0.35 | ||||||||||||||||||||||||
103
Table of Contents
Report of Independent Registered Public Accounting Firm
|
|
||
| Crowe Horwath LLP Independent Member Crowe Horwath International |

Board of Directors and Shareholders
CNB Financial Corporation
Clearfield, Pennsylvania
Opinions on the Financial Statements and Internal Control over Financial Reporting
We have audited the accompanying consolidated balance sheets of CNB Financial Corporation (the “Corporation”) as of December 31, 2017 and 2016, the related consolidated statements of income and comprehensive income, cash flows and changes in shareholders’ equity for each of the years in the three-year period ended December 31, 2017 and the related notes (collectively referred to as the “financial statements”). We also have audited the Corporation’s internal control over financial reporting as of December 31, 2017, based on criteria established in Internal Control – Integrated Framework: (2013) issued by the Committee of Sponsoring Organizations of the Treadway Commission (COSO).
In our opinion, the financial statements referred to above present fairly, in all material respects, the financial position of the Corporation as of December 31, 2017 and 2016, and the results of its operations and its cash flows for each of the years in the three-year period ended December 31, 2017 in conformity with accounting principles generally accepted in the United States of America. Also in our opinion, the Corporation maintained, in all material respects, effective internal control over financial reporting as of December 31, 2017, based on criteria established in Internal Control – Integrated Framework: (2013) issued by COSO.
Basis for Opinions
The Corporation’s management is responsible for these financial statements, for maintaining effective internal control over financial reporting, and for its assessment of the effectiveness of internal control over financial reporting, included in the accompanying Management’s Report on Internal Control Over Financial Reporting. Our responsibility is to express an opinion on the Corporation’s financial statements and an opinion on the Corporation’s internal control over financial reporting based on our audits. We are a public accounting firm registered with the Public Corporation Accounting Oversight Board (United States) (“PCAOB”) and are required to be independent with respect to the Corporation in accordance with the U.S. federal securities laws and the applicable rules and regulations of the Securities and Exchange Commission and the PCAOB.
We conducted our audits in accordance with the standards of the PCAOB. Those standards require that we plan and perform the audits to obtain reasonable assurance about whether the financial statements are free of material misstatement, whether due to error or fraud, and whether effective internal control over financial reporting was maintained in all material respects.
Our audits of the financial statements included performing procedures to assess the risks of material misstatement of the financial statements, whether due to error or fraud, and performing procedures that respond to those risks. Such procedures included examining, on a test basis, evidence regarding the amounts and disclosures in the financial statements. Our audits also included evaluating the accounting principles used and significant estimates made by management, as well as evaluating the overall presentation of the financial statements. Our audit of internal control over financial reporting included obtaining an understanding of internal control over financial reporting, assessing the risk that a material
104
Table of Contents
weakness exists, and testing and evaluating the design and operating effectiveness of internal control based on the assessed risk. Our audits also included performing such other procedures as we considered necessary in the circumstances. We believe that our audits provide a reasonable basis for our opinions.
Definition and Limitations of Internal Control Over Financial Reporting
A corporation’s internal control over financial reporting is a process designed to provide reasonable assurance regarding the reliability of financial reporting and the preparation of financial statements for external purposes in accordance with generally accepted accounting principles. A corporation’s internal control over financial reporting includes those policies and procedures that (1) pertain to the maintenance of records that, in reasonable detail, accurately and fairly reflect the transactions and dispositions of the assets of the corporation; (2) provide reasonable assurance that transactions are recorded as necessary to permit preparation of financial statements in accordance with generally accepted accounting principles, and that receipts and expenditures of the corporation are being made only in accordance with authorizations of management and directors of the corporation; and (3) provide reasonable assurance regarding prevention or timely detection of unauthorized acquisition, use, or disposition of the corporation’s assets that could have a material effect on the financial statements.
Because of its inherent limitations, internal control over financial reporting may not prevent or detect misstatements. Also, projections of any evaluation of effectiveness to future periods are subject to the risk that controls may become inadequate because of changes in conditions, or that the degree of compliance with the policies or procedures may deteriorate.
/s/ Crowe Horwath LLP
Crowe Horwath LLP
We have served as the Corporation’s auditor since 2000.
Cleveland, Ohio
March 8, 2018
105
Table of Contents
ITEM 9. CHANGES IN AND DISAGREEMENTS WITH ACCOUNTANTS ON ACCOUNTING AND FINANCIAL DISCLOSURE
None
ITEM 9A. CONTROLS AND PROCEDURES
The Corporation’s management, under the supervision of and with the participation of the Corporation’s Principal Executive Officer and Principal Financial Officer, has carried out an evaluation of the design and effectiveness of the Corporation’s disclosure controls and procedures as defined in Rule 13a-15(e) and Rule 15d-15(e) of the Securities Exchange Act of 1934 as of the end of the period covered by this report. Based upon that evaluation, management, including the Principal Executive Officer and Principal Financial Officer, have concluded that, as of the end of such period, the Corporation’s disclosure controls and procedures are effective to provide reasonable assurance that all material information required to be disclosed in reports the Corporation files or submits under the Securities Exchange Act of 1934 is recorded, processed, summarized and reported, within the time periods specified in the Securities and Exchange Commission’s rules and forms.
There was no significant change in the Corporation’s internal control over financial reporting that occurred during the quarter ended December 31, 2017 that has materially affected, or that is reasonably likely to materially affect, our internal control over financial reporting.
Management’s Report on Internal Control Over Financial Reporting
The management of the Corporation is responsible for establishing and maintaining adequate internal control over financial reporting as defined in Rules 13a-15(f) and 15d-15(f) under the Securities Exchange Act of 1934. The Corporation’s internal control over financial reporting is designed to provide reasonable assurance regarding the reliability of financial reporting and the preparation of financial statements for external purposes in accordance with accounting principles generally accepted in the U.S.
The Corporation’s internal control over financial reporting includes those policies and procedures that: (i) pertain to the maintenance of records that, in reasonable detail, accurately and fairly reflect the transactions and dispositions of the assets of the Corporation; (ii) provide reasonable assurance that transactions are recorded as necessary to permit preparation of financial statements in accordance with generally accepted accounting principles, and that receipts and expenditures of the Corporation are being made only in accordance with authorizations of management and directors of the Corporation; and (iii) provide reasonable assurance regarding prevention or timely detection of unauthorized acquisition, use or disposition of the Corporation’s assets that could have a material effect on the financial statements.
Because of its inherent limitations, internal control over financial reporting may not prevent or detect misstatements. Also, projections of any evaluation of effectiveness to future periods are subject to the risk that controls may become inadequate because of changes in conditions, or that the degree of compliance with the policies or procedures may deteriorate.
Management assessed the effectiveness of the Corporation’s internal control over financial reporting as of December 31, 2017. In making this assessment, management used the criteria set forth by the Committee of Sponsoring Organizations of the Treadway Commission (COSO) in the 2013 Internal
106
Table of Contents
Control-Integrated Framework. Based on our assessment and those criteria, management concluded that the Corporation maintained effective internal control over financial reporting as of December 31, 2017. The effectiveness of our internal control over financial reporting as of December 31, 2017 has been audited by Crowe Horwath LLP, an independent registered public accounting firm that audited the Corporation’s financial statements, as stated in their report which is located in Item 8 of this Form 10-K.
|
|
| |
| Joseph B. Bower, Jr. |
Brian W. Wingard | |
| President and Chief Executive Officer |
Treasurer and Principal Financial Officer | |
| Date: March 8, 2018 |
Date: March 8, 2018 | |


107
Table of Contents
None
ITEM 10. DIRECTORS, EXECUTIVE OFFICERS AND CORPORATE GOVERNANCE
See “Part I — Item 1 — Executive Officers” for information about our executive officers, which is incorporated by reference in this Item 10. Other information required by this Item 10 is incorporated herein by reference from our definitive proxy statement for our 2018 annual meeting of stockholders (the “2018 proxy statement”), which we will file with the SEC on or before 120 days after our 2017 fiscal year-end, and which will appear in the 2018 proxy statement under the captions “Proposal 1. Election of Class 1 Directors,” “Corporate Governance – Meetings and Committees of the Board of Directors – Audit Committee” and “Section 16(a) Beneficial Ownership Reporting Compliance.”
The Corporation’s board of directors has approved a Code of Ethics for Officers and Directors. The Code of Ethics can be found at the Bank’s website, www.cnbbank.bank.
ITEM 11. EXECUTIVE COMPENSATION
Information required by this Item 11 is incorporated herein by reference from the 2018 proxy statement, including the information in the 2018 proxy statement appearing under the captions “Executive Compensation” and “Compensation of Directors.”
ITEM 12. SECURITY OWNERSHIP OF CERTAIN BENEFICIAL OWNERS AND MANAGEMENT AND RELATED STOCKHOLDER MATTERS
Information required by this Item 12 is incorporated herein by reference from the 2018 proxy statement, including the information in the 2018 proxy statement appearing under the captions “Stock Ownership” and “Equity Compensation Plan Information.”
ITEM 13. CERTAIN RELATIONSHIPS AND RELATED TRANSACTIONS, AND DIRECTOR INDEPENDENCE
Information required by this Item 13 is incorporated herein by reference from the 2018 proxy statement, including the information in the 2018 proxy statement appearing under the captions “Corporate Governance” and “Certain Transactions.”
ITEM 14. PRINCIPAL ACCOUNTANT FEES AND SERVICES
Information required by this Item 14 is incorporated herein by reference from the 2018 proxy statement, including the information in the 2018 proxy statement appearing under the captions “Corporate Governance—Meetings and Committees of the Board of Directors – Audit Committee” and “Concerning the Independent Registered Public Accountants.”
108
Table of Contents
PART IV.
ITEM 15. EXHIBITS AND FINANCIAL STATEMENT SCHEDULES
(a)(1) The following consolidated financial statements are set forth in Part II, Item 8:
Consolidated Balance Sheets as of December 31, 2017 and 2016
Consolidated Statements of Income and Comprehensive Income for the years ended December 31, 2017, 2016, and 2015
Consolidated Statements of Cash Flows for the years ended December 31, 2017, 2016, and 2015
Consolidated Statements of Changes in Shareholders’ Equity for the years ended December 31, 2017, 2016, and 2015
Notes to Consolidated Financial Statements
(a)(2)Financial statement schedules are not applicable or are included in the consolidated financial statements or related notes.
(a)(3)The following exhibits (asterisk denotes management contract or compensatory plan) are filed as a part of this report:
109
Table of Contents
| * | Denotes management contract or compensatory plan. |
None
110
Table of Contents
Pursuant to the requirements of Section 13 or 15(d) of the Securities Exchange Act of 1934, the registrant has duly caused this report to be signed on its behalf by the undersigned, thereunto duly authorized.
| CNB FINANCIAL CORPORATION | ||||||||
| (Registrant) | ||||||||
| Date: |
March 8, 2018 |
By: | /s/ Joseph B. Bower, Jr. | |||||
| JOSEPH B. BOWER, JR. | ||||||||
| President & Chief Executive Officer | ||||||||
Pursuant to the requirements of the Securities Exchange Act of 1934, this report has been signed below by the following persons on behalf of the registrant and in the capacities indicated on March 8, 2018.
| /s/ Joseph B. Bower, Jr. |
/s/ Peter F. Smith | |||
| JOSEPH B. BOWER, JR. |
PETER F. SMITH, Chairman | |||
| President and Director |
||||
| (Principal Executive Officer) |
||||
| /s/ Richard L. Greslick, Jr. |
/s/ Richard B. Seager | |||
| RICHARD L. GRESLICK, JR. |
RICHARD B. SEAGER, Director | |||
| Secretary and Director |
||||
| /s/ Brian W. Wingard |
/s/ Francis X. Straub, III | |||
| BRIAN W. WINGARD |
FRANCIS X. STRAUB, III, Director | |||
| Treasurer |
||||
| (Principal Financial and Accounting Officer) |
||||
| /s/ Dennis L. Merrey |
/s/ Peter C. Varischetti | |||
| DENNIS L. MERREY, Director |
PETER C. VARISCHETTI, Director | |||
| /s/ Robert W. Montler |
||||
| ROBERT W. MONTLER, Director |
||||
| /s/ Joel E. Peterson |
||||
| JOEL E. PETERSON, Director |
||||
| /s/ Deborah Dick Pontzer |
||||
| DEBORAH DICK PONTZER, Director |
||||
| /s/ Jeffrey S. Powell |
||||
| JEFFREY S. POWELL, Director |
||||
| /s/ Nicholas N. Scott |
||||
| NICHOLAS N. SCOTT, Director |
||||
111