Attached files
Table of Contents
UNITED STATES
SECURITIES AND EXCHANGE COMMISSION
Washington, D.C. 20549
F O R M 1 0 – K
ANNUAL REPORT PURSUANT TO SECTION 13 OR 15(d) OF
THE SECURITIES EXCHANGE ACT OF 1934
| For the fiscal year ended December 31, 2009 | Commission File Number 0-13396 |
CNB FINANCIAL CORPORATION
(Exact name of registrant as specified in its charter)
| Pennsylvania | 25-1450605 | |||
| (State or other jurisdiction of incorporation or organization) |
(I.R.S. Employer Identification No.) |
1 South Second Street
P.O. Box 42
Clearfield, Pennsylvania 16830
(Address of principal executive office)
Registrant’s telephone number, including area code, (814) 765-9621
Securities registered pursuant to Section 12 (b) of the Act: None
Securities registered pursuant to Section 12 (g) of the Act:
Common Stock, No Par Value
Indicate by check mark if the registrant is a well-known seasoned issuer, as defined in Rule 405 of the Securities Act.
¨ Yes x No
Indicate by check mark if the registrant is not required to file reports pursuant to Section 13 or Section 15(d) of the Act.
¨ Yes x No
Indicate by check mark whether the registrant (1) has filed all reports required to be filed by Section 13 or 15 (d) of the Securities Exchange Act of 1934 during the preceding 12 months (or for such shorter period that the registrant was required to file such reports), and (2) has been subject to such filing requirements for the past 90 days. x Yes ¨ No
Indicate by check mark if disclosure of delinquent filers pursuant to Item 405 of Regulation S-K is not contained herein, and will not be contained, to the best of registrant’s knowledge, in definitive proxy or information statements incorporated by reference in Part III of this Form 10-K or any amendment to this Form 10-K. x
Indicate by check mark whether the registrant is a large accelerated filer, an accelerated filer, a non-accelerated filer, or a smaller reporting company. See definitions of “large accelerated filer,” “accelerated filer” and “smaller reporting company” in Rule 12b-2 of the Exchange Act. (Check one):
| Large accelerated filer ¨ | Accelerated filer x | Non-accelerated filer ¨ | Smaller reporting company ¨ |
Indicate by check mark whether the registrant is a shell company (as defined in Rule 12b-2 of the Act).
¨ Yes x No
Aggregate market value of the common stock held by nonaffiliates of the registrant as of June 30, 2009:
$112,904,406
The number of shares outstanding of the registrant’s common stock as of March 9, 2010:
8,787,816 shares
DOCUMENTS INCORPORATED BY REFERENCE
Portions of the proxy statement for the annual shareholders’ meeting on April 20, 2010 are incorporated by reference into Part III. The incorporation by reference herein of portions of the proxy statement shall not be deemed to incorporate by reference the information referred to in Item 402(a)(8) of regulation S-K.
Table of Contents
| PART I. | ||||
| ITEM 1. |
1 | |||
| ITEM 1A. |
10 | |||
| ITEM 1B. |
11 | |||
| ITEM 2. |
11 | |||
| ITEM 3. |
11 | |||
| ITEM 4. |
11 | |||
| ITEM 4A. |
11 | |||
| PART II. |
||||
| ITEM 5. |
12 | |||
| ITEM 6. |
14 | |||
| ITEM 7. |
Management’s Discussion and Analysis of Financial Condition and Results of Operations |
15 | ||
| ITEM 7A. |
29 | |||
| ITEM 8. |
32 | |||
| ITEM 9. |
Changes in and Disagreements with Accountants on Accounting and Financial Disclosure |
76 | ||
| ITEM 9A. |
76 | |||
| ITEM 9B. |
78 | |||
| PART III. |
||||
| ITEM 10. |
78 | |||
| ITEM 11. |
78 | |||
| ITEM 12. |
Security Ownership of Certain Beneficial Owners and Management and Related Stockholder Matters |
78 | ||
| ITEM 13. |
Certain Relationships and Related Transactions, and Director Independence |
78 | ||
| ITEM 14. |
78 | |||
| PART IV. |
||||
| ITEM 15. |
79 | |||
| 81 | ||||
Table of Contents
PART I.
CNB Financial Corporation
CNB Financial Corporation (the Corporation) is a Financial Holding Company registered under the Bank Holding Company Act of 1956, as amended. It was incorporated under the laws of the Commonwealth of Pennsylvania in 1983 for the purpose of engaging in the business of a Financial Holding Company. On April 26, 1984, the Corporation acquired all of the outstanding capital stock of County National Bank, a national banking chartered institution. In December of 2006, County National Bank changed its name to CNB Bank (the Bank) and became a state bank chartered in Pennsylvania and subject to regulation by the Pennsylvania Department of Banking and the Federal Deposit Insurance Corporation.
The Corporation is subject to regulation, supervision and examination by the Board of Governors of the Federal Reserve System. In general, the Corporation is limited to owning or controlling banks and engaging in such other activities as are properly incident thereto. The Corporation is currently engaged in four non-banking activities through its wholly owned subsidiaries CNB Securities Corporation, County Reinsurance Company, CNB Insurance Agency, and Holiday Financial Services Corporation. CNB Securities Corporation was formed in 2005 to hold and manage investments that were previously owned by the Bank and the Corporation and to provide the Corporation with additional latitude to purchase other investments. County Reinsurance Company was formed in June of 2001 as a corporation in the state of Arizona. The company provides accidental death and disability and life insurance as a part of lending relationships of the Bank. CNB Insurance Agency was established in February of 2003. The company provides fixed annuity products to banking customers. The Corporation’s newest subsidiary, Holiday Financial Services Corporation, was formed in 2005 to facilitate the Corporation’s entry into the consumer discount loan and finance business. Finally, in addition to these operating subsidiaries, the Corporation has two wholly owned affiliates, CNB Capital Trust II and CNB Capital Trust III, which are accounted for using the equity method. These entities were formed in 2007 for the sole purpose of issuing and selling certain securities representing undivided beneficial interests in the assets of the trusts and investing the proceeds thereof in subordinated debentures.
The Corporation does not currently engage in any operating business activities, other than the ownership and management of CNB Bank, CNB Securities Corporation, County Reinsurance Company, CNB Insurance Agency, and Holiday Financial Services Corporation.
CNB Bank
The Bank was incorporated in 1934 and is chartered in the State of Pennsylvania. The Bank’s Main Office is located at 1 South Second Street, Clearfield, (Clearfield County) Pennsylvania. The primary marketing area consists of the Pennsylvania Counties of Clearfield, Elk (excluding the Townships of Millstone, Highland and Spring Creek), McKean, Cambria and Cameron. It also includes a portion of western Centre County including Philipsburg Borough, Rush Township and the western portions of Snow Shoe and Burnside Townships and a portion of Jefferson County, consisting of the boroughs of Brockway, Falls Creek, Punxsutawney, Reynoldsville and Sykesville, and the townships of Washington, Winslow and Henderson.
ERIEBANK, a division of CNB Bank, began operations in 2005 when the Bank established a loan production office in Erie, Pennsylvania and started offering commercial loan service to businesses
Table of Contents
located within Erie and Erie County. During 2006, management opened a full service branch in the Erie market at a temporary location and in 2007 opened its first two full service financial services stores. Two additional full service financial services stores were opened in the Erie community in 2008. In 2009, management opened a temporary ERIEBANK location in the city of Meadville, Crawford County, Pennsylvania. Construction has begun on a full service branch in Meadville, with opening expected in the spring of 2010. The primary market area for the ERIEBANK division is the north western Pennsylvania county of Erie including the city of Erie and the city of Meadville.
The approximate population of the general trade area is 670,000. The economy is diversified and includes manufacturing industries, wholesale and retail trade, services industries, family farms and the production of natural resources of coal, oil, gas and timber.
In addition to the Main Office, the Bank has 26 full-service branch offices and 1 loan production office located in various communities in its market area.
The Bank is a full-service bank engaging in a full range of banking activities and services for individual, business, governmental and institutional customers. These activities and services principally include checking, savings, and time deposit accounts; real estate, commercial, industrial, residential and consumer loans; and a variety of other specialized financial services. The Bank’s Wealth & Asset Management Services division offers a full range of client services.
The Bank’s customer base is such that loss of one customer relationship or a related group of depositors would not have a materially adverse effect on the business of the Bank.
The Bank’s loan portfolio is diversified so that one industry, group of related industries or changes in household economic conditions would not comprise a material portion of the loan portfolio.
The Bank’s business is not seasonal nor does it have any risks attendant to foreign sources.
Holiday Financial Services Corporation
In 2005, the Corporation formed Holiday Financial Services Corporation, a wholly owned subsidiary, and entered the consumer discount loan and finance business with one office located in Sidman, Pennsylvania. During 2006, three offices were opened in the communities of Hollidaysburg, Northern Cambria and Clearfield, Pennsylvania. In 2007, three additional offices in the communities of Bellefonte, Ridgway and Bradford, Pennsylvania were opened, and in 2008, one additional office was opened in Erie, Pennsylvania, bringing our total to eight. Management has made the necessary investments in experienced personnel and technology which has facilitated the growth of Holiday Financial Services into a successful and profitable subsidiary of the Corporation.
Competition
The financial services industry in the Corporation’s service area continues to be extremely competitive, both among commercial banks and with other financial service providers such as consumer finance companies, thrifts, investment firms, mutual funds and credit unions. The increased competition has resulted from changes in the legal and regulatory guidelines as well as from economic conditions. Mortgage banking firms, leasing companies, financial affiliates of industrial companies, brokerage firms, retirement fund management firms, and even government agencies provide additional
2
Table of Contents
competition for loans and other financial services. Some of the financial service providers operating in the Corporation’s market area operate on a large-scale regional or national basis and possess resources greater than those of the Corporation. The Corporation is generally competitive with all competing financial institutions in its service area with respect to interest rates paid on time and savings deposits, service charges on deposit accounts and interest rates charged on loans.
Supervision and Regulation
The Bank is subject to supervision and examination by applicable federal and state banking agencies, including the Pennsylvania State Department of Banking. The Bank is insured by and subject to some or all of the regulations of the Federal Deposit Insurance Corporation (“FDIC”). The Bank is also subject to various requirements and restrictions under federal and state law, including requirements to maintain reserves against deposits, restrictions on the types, amounts and terms and conditions of loans that may be granted, and limitation on the types of investments that may be made and the types of services that may be offered. Various consumer laws and regulations also affect the operation of the Bank. In addition to the impact of regulation, commercial banks are affected significantly by the actions of the Federal Reserve Board, including actions taken with respect to interest rates, as it attempts to control the money supply and credit availability in order to influence the economy.
Employees
The Corporation has no employees who are not employees of CNB Bank except for 21 individuals who are employees of Holiday Financial Services Corporation. As of December 31, 2009, the Corporation had a total of 295 employees of which 250 were full time and 45 were part time.
Monetary Policies
The earnings and growth of the banking industry are affected by the credit policies of monetary authorities, including the Federal Reserve System. An important function of the Federal Reserve System is to regulate the national supply of bank credit in order to control recessionary and inflationary pressures. Among the instruments of monetary policy used by the Federal Reserve to implement these objectives are open market activities in U.S. Government Securities, changes in the discount rate on member bank borrowings and changes in reserve requirements against member bank deposits. These operations are used in varying combinations to influence overall economic growth and indirectly, bank loans, securities, and deposits. These variables may also affect interest rates charged on loans or paid for deposits. The monetary policies of the Federal Reserve authorities have had a significant effect on the operating results of commercial banks in the past and are expected to continue to have such an effect in the future.
In view of the changing conditions in the national economy and in the money markets, as well as the effect of actions by monetary and fiscal authorities including the Federal Reserve System, no prediction can be made as to possible future changes in interest rates, deposit levels, loan demand or their effect on the business and earnings of the Corporation and the Bank.
Distribution of Assets, Liabilities, and Shareholders’ Equity;
Interest Rates and Interest Differential
The following tables set forth statistical information relating to the Corporation and its wholly-owned subsidiaries. The tables should be read in conjunction with the consolidated financial statements of the Corporation.
3
Table of Contents
Average Balances and Net Interest Margin
(Dollars in thousands)
| December 31, 2009 | December 31, 2008 | December 31, 2007 | ||||||||||||||||||||||||||||||
| Average Balance |
Annual Rate |
Interest Inc./Exp. |
Average Balance |
Annual Rate |
Interest Inc./Exp. |
Average Balance |
Annual Rate |
Interest Inc./Exp. | ||||||||||||||||||||||||
| Assets |
||||||||||||||||||||||||||||||||
| Interest-bearing deposits with banks |
$ 9,088 | 2.37 | % | $ 215 | $ 7,875 | 5.45 | % | $ 429 | $ 7,207 | 6.83 | % | $ 492 | ||||||||||||||||||||
| Federal funds sold and securities purchased under agreements to resell |
2 | 0.00 | % | 0 | 13,341 | 2.56 | % | 342 | 5,926 | 5.64 | % | 334 | ||||||||||||||||||||
| Securities: |
||||||||||||||||||||||||||||||||
| Taxable (1) |
223,814 | 3.29 | % | 7,687 | 157,185 | 4.53 | % | 7,419 | 126,254 | 5.27 | % | 6,669 | ||||||||||||||||||||
| Tax-Exempt (1, 2) |
55,642 | 5.60 | % | 3,057 | 31,809 | 6.54 | % | 2,053 | 31,589 | 6.76 | % | 2,091 | ||||||||||||||||||||
| Equity Securities (1, 2) |
1,502 | 2.89 | % | 44 | 5,732 | 6.24 | % | 296 | 10,470 | 5.63 | % | 550 | ||||||||||||||||||||
| Total Securities |
280,958 | 3.86 | % | 10,788 | 194,726 | 4.88 | % | 9,768 | 168,313 | 5.57 | % | 9,310 | ||||||||||||||||||||
| Loans |
||||||||||||||||||||||||||||||||
| Commercial (2) |
242,719 | 5.82 | % | 14,129 | 241,648 | 6.48 | % | 15,663 | 225,549 | 7.65 | % | 17,264 | ||||||||||||||||||||
| Mortgage (2) |
396,017 | 6.41 | % | 25,387 | 357,583 | 6.98 | % | 24,961 | 315,574 | 7.31 | % | 23,053 | ||||||||||||||||||||
| Consumer |
47,702 | 14.57 | % | 6,952 | 47,605 | 15.09 | % | 7,182 | 29,722 | 15.53 | % | 4,616 | ||||||||||||||||||||
| Total Loans (3) |
686,438 | 6.77 | % | 46,468 | 646,836 | 7.39 | % | 47,806 | 570,845 | 7.87 | % | 44,933 | ||||||||||||||||||||
| Total earning assets |
976,486 | 5.89 | % | 57,471 | 862,778 | 6.72 | % | 58,345 | 752,291 | 7.32 | % | 55,069 | ||||||||||||||||||||
| Non Interest Earning Assets |
||||||||||||||||||||||||||||||||
| Cash & Due From Banks |
33,237 | 29,815 | 16,389 | |||||||||||||||||||||||||||||
| Premises & Equipment |
23,004 | 22,425 | 17,414 | |||||||||||||||||||||||||||||
| Other Assets |
49,640 | 41,805 | 37,805 | |||||||||||||||||||||||||||||
| Allowance for Loan Losses |
(9,320 | ) | (7,508 | ) | (6,321 | ) | ||||||||||||||||||||||||||
| Total Non Interest Earning Assets |
96,561 | 86,537 | 65,287 | |||||||||||||||||||||||||||||
| Total Assets |
$ | 1,073,047 | $ | 949,315 | $ | 817,578 | ||||||||||||||||||||||||||
| Liabilities and Shareholders’ Equity |
||||||||||||||||||||||||||||||||
| Interest-Bearing Deposits |
||||||||||||||||||||||||||||||||
| Demand - interest-bearing |
$ | 241,505 | 0.79 | % | $ | 1,904 | $ | 207,293 | 1.42 | % | $ | 2,947 | $ | 151,854 | 1.81 | % | $ | 2,756 | ||||||||||||||
| Savings |
201,827 | 1.70 | % | 3,434 | 98,463 | 1.96 | % | 1,928 | 52,500 | 0.81 | % | 424 | ||||||||||||||||||||
| Time |
320,477 | 2.42 | % | 7,753 | 349,544 | 2.88 | % | 10,081 | 354,527 | 4.20 | % | 14,907 | ||||||||||||||||||||
| Total interest-bearing deposits |
763,809 | 1.71 | % | 13,091 | 655,300 | 2.28 | % | 14,956 | 558,881 | 3.24 | % | 18,087 | ||||||||||||||||||||
| Short-term borrowings |
1,961 | 0.20 | % | 4 | 961 | 1.25 | % | 12 | 4,864 | 4.09 | % | 199 | ||||||||||||||||||||
| Long-term borrowings |
104,107 | 4.34 | % | 4,523 | 101,613 | 4.52 | % | 4,597 | 71,332 | 4.64 | % | 3,311 | ||||||||||||||||||||
| Subordinated Debentures |
20,620 | 4.12 | % | 850 | 20,620 | 4.94 | % | 1,018 | 17,936 | 7.39 | % | 1,325 | ||||||||||||||||||||
| Total interest-bearing liabilities |
890,497 | 2.07 | % | 18,468 | 778,494 | 2.64 | % | 20,583 | 653,013 | 3.51 | % | 22,922 | ||||||||||||||||||||
| Demand - non-interest-bearing |
104,773 | 97,578 | 86,382 | |||||||||||||||||||||||||||||
| Other liabilities |
11,568 | 6,774 | 6,949 | |||||||||||||||||||||||||||||
| Total Liabilities |
1,006,838 | 882,846 | 746,344 | |||||||||||||||||||||||||||||
| Shareholders’ Equity |
66,209 | 66,469 | 71,234 | |||||||||||||||||||||||||||||
| Total Liabilities and Shareholders’ Equity |
$ | 1,073,047 | $ | 949,315 | $ | 817,578 | ||||||||||||||||||||||||||
| Interest Income/Earning Assets |
5.89 | % | $ | 57,471 | 6.72 | % | $ | 58,345 | 7.32 | % | $ | 55,069 | ||||||||||||||||||||
| Interest Expense/Interest Bearing Liabilities |
2.07 | % | 18,468 | 2.64 | % | 20,583 | 3.51 | % | 22,922 | |||||||||||||||||||||||
| Net Interest Spread |
3.82 | % | $ | 39,003 | 4.08 | % | $ | 37,762 | 3.81 | % | $ | 32,147 | ||||||||||||||||||||
| Interest Income/Earning Assets |
5.89 | % | $ | 57,471 | 6.72 | % | $ | 58,345 | 7.32 | % | $ | 55,069 | ||||||||||||||||||||
| Interest Expense/Earning Assets |
1.89 | % | 18,468 | 2.39 | % | 20,583 | 3.05 | % | 22,922 | |||||||||||||||||||||||
| Net Interest Margin |
4.00 | % | $ | 39,003 | 4.33 | % | $ | 37,762 | 4.27 | % | $ | 32,147 | ||||||||||||||||||||
| (1) | Includes unamortized discounts and premiums. Average balance is computed using the carrying value of securities. The average yield has been computed using the historical amortized cost average balance for available for sale securities. |
| (2) | Average yields are stated on a fully taxable equivalent basis. |
| (3) | Average outstanding includes the average balance outstanding of all non-accrual loans. Loans consist of the average of total loans less average unearned income. The amount of loan fees included in the interest income on loans is not material. |
4
Table of Contents
| Net Interest Income Rate-Volume Variance (Dollars in thousands) |
For Twelve Months Ended December 31, 2009 over (under) 2008 Due to Change In |
For Twelve Months Ended December 31, 2008 over (under) 2007 Due to Change In | ||||||||||||||||
| Volume | Rate | Net | Volume | Rate | Net | |||||||||||||
| Assets |
||||||||||||||||||
| Interest-Bearing Deposits with Banks |
$ | 66 | $ | (280) | $ | (214) | $ | 46 | $ | (109) | $ | (63) | ||||||
| Federal Funds Sold and securities purchased under agreements to resell |
(342) | (0) | (342) | 472 | (464) | 8 | ||||||||||||
| Securities: |
||||||||||||||||||
| Taxable |
4,700 | (4,432) | 268 | 1,913 | (1,163) | 750 | ||||||||||||
| Tax-Exempt |
1,649 | (645) | 1,004 | 32 | (70) | (38) | ||||||||||||
| Equity Securities |
(211) | (41) | (252) | (289) | 35 | (254) | ||||||||||||
| Total Securities |
6,138 | (5,118) | 1,020 | 1,656 | (1,198) | 458 | ||||||||||||
| Loans |
||||||||||||||||||
| Commercial |
69 | (1,603) | (1,534) | 1,232 | (2,833) | (1,601) | ||||||||||||
| Mortgage |
2,683 | (2,257) | 426 | 3,069 | (1,161) | 1,908 | ||||||||||||
| Consumer |
15 | (245) | (230) | 2,777 | (211) | 2,566 | ||||||||||||
| Total Loans |
2,767 | (4,105) | (1,338) | 7,078 | (4,205) | 2,873 | ||||||||||||
| Total Earning Assets |
$ | 8,629 | $ | (9,503) | $ | (874) | $ | 9,252 | $ | (5,976) | $ | 3,276 | ||||||
| Liabilities and Shareholders’ Equity |
||||||||||||||||||
| Interest-Bearing Deposits |
||||||||||||||||||
| Demand - Interest-Bearing |
$ | 486 | $ | (1,529) | $ | (1,043) | $ | 1,006 | $ | (815) | $ | 191 | ||||||
| Savings |
2,024 | (518) | 1,506 | 371 | 1,133 | 1,504 | ||||||||||||
| Time |
(838) | (1,490) | (2,328) | (210) | (4,616) | (4,826) | ||||||||||||
| Total Interest-Bearing Deposits |
1,672 | (3,537) | (1,865) | 1,167 | (4,298) | (3,131) | ||||||||||||
| Short-Term Borrowings |
12 | (20) | (8) | (160) | (27) | (187) | ||||||||||||
| Long-Term Borrowings |
113 | (187) | (74) | 1,406 | (120) | 1,286 | ||||||||||||
| Subordinated debentures |
0 | (168) | (168) | 198 | (505) | (307) | ||||||||||||
| Total Interest-Bearing Liabilities |
$ | 1,797 | $ | (3,912) | $ | (2,115) | $ | 2,611 | $ | (4,950) | $ | (2,339) | ||||||
| Change in Net Interest Income |
$ | 6,832 | $ | (5,591) | $ | 1,241 | $ | 6,641 | $ | (1,026) | $ | 5,615 | ||||||
| 1. | The change in interest due to both volume and rate had been allocated to volume and rate changes in proportion to the relationship of the absolute dollar amounts of the change in each. |
| 2. | Included in interest income is $1,774, $1,806 and $1,563 of fees for the years ending 2009, 2008 and 2007, respectively. |
5
Table of Contents
| Securities | ||||||||||||||||||||||||
| (Dollars In Thousands) | December 31, 2009 | December 31, 2008 | December 31, 2007 | |||||||||||||||||||||
| Amortized Cost |
Unrealized | Market Value |
Amortized Cost |
Unrealized | Market Value |
Amortized Cost |
Unrealized | Market Value | ||||||||||||||||
| Gains | Losses | Gains | Losses | Gains | Losses | |||||||||||||||||||
| Securities Available for Sale |
||||||||||||||||||||||||
| U.S. Treasury |
$10,288 | $5 | $ (24) | $10,269 | $10,059 | $257 | $ - | $10,316 | $10,955 | $125 | $ - | $11,080 | ||||||||||||
| U.S. Government Sponsored Entities |
107,615 | 94 | (748) | 106,961 | 40,779 | 486 | (1) | 41,264 | 26,261 | 112 | (28) | 26,345 | ||||||||||||
| State and Political Subdivisions |
55,710 | 991 | (140) | 56,561 | 54,467 | 667 | (719) | 54,415 | 27,300 | 664 | (46) | 27,918 | ||||||||||||
| Residential mortgage and asset backed |
144,878 | 1,188 | (666) | 145,400 | 104,664 | 580 | (1,357) | 103,887 | 51,064 | 266 | (186) | 51,144 | ||||||||||||
| Corporate notes and bonds |
18,713 | - | (5,082) | 13,631 | 28,694 | 31 | (6,032) | 22,693 | 31,599 | 215 | (1,208) | 30,606 | ||||||||||||
| Pooled trust preferred |
4,594 | - | (2,685) | 1,909 | 7,080 | 37 | (4,038) | 3,079 | 7,150 | - | (140) | 7,010 | ||||||||||||
| Pooled SBA |
8,894 | 102 | (7) | 8,989 | - | - | - | - | - | - | - | - | ||||||||||||
| Other securities |
1,670 | 28 | (3) | 1,695 | 1,670 | - | (35) | 1,635 | 9,480 | 69 | (860) | 8,689 | ||||||||||||
| $352,362 | $2,408 | $(9,355) | $345,415 | $247,413 | $2,058 | $(12,182) | $237,289 | $163,809 | $1,451 | $(2,468) | $162,792 | |||||||||||||
Maturity Distribution of Investment Securities
(Dollars In Thousands)
December 31, 2009
| Within One Year |
After One But Within Five Years |
After Five But Within Ten Years |
After Ten Years | Collaterialized Mortgage Obligations and Other Asset Backed Securities | ||||||||||||||||
| $ Amt. | Yield | $ Amt. | Yield | $ Amt. | Yield | $ Amt. | Yield | $ Amt. | Yield | |||||||||||
| Securities Available for Sale |
||||||||||||||||||||
| U.S. Treasury |
$2,005 | 0.40% | $8,264 | 1.10% | ||||||||||||||||
| U.S. Government Sponsored Entities |
23,304 | 2.38% | 50,979 | 2.14% | $25,059 | 3.60% | $7,619 | 4.42% | ||||||||||||
| State and Political Subdivisions |
1,866 | 3.38% | 12,410 | 5.01% | 25,008 | 5.49% | 17,277 | 6.04% | ||||||||||||
| Corporate notes and bonds |
4,976 | 4.36% | 8,655 | 3.28% | ||||||||||||||||
| Pooled trust preferred |
1,909 | 1.61% | ||||||||||||||||||
| Pooled SBA |
2,955 | 85.00% | 6,034 | 4.85% | ||||||||||||||||
| Residential mortgage and asset backed |
$145,400 | 3.45% | ||||||||||||||||||
| TOTAL |
$27,175 | 2.30% | $74,608 | 2.45% | $61,077 | 4.53% | $35,460 | 4.78% | $145,400 | 3.45% | ||||||||||
The weighted average yields are based on market value and effective yields weighted for the scheduled maturity with tax-exempt securities adjusted to a taxable-equivalent basis using a tax rate of 35%.
The portfolio contains no holdings of a single issuer that exceeds 10% of shareholders' equity other than the US Treasury and governmental sponsored entities.
6
Table of Contents
LOAN PORTFOLIO
(Dollars in thousands)
A. TYPE OF LOAN
| 2009 | 2008 | 2007 | 2006 | 2005 | |||||||||||||||||||
| Commercial, Financial and Agricultural |
$ | 240,357 | $ | 228,000 | $ | 218,839 | $ | 214,804 | $ | 194,044 | |||||||||||||
| Residential Mortgage |
225,845 | 210,080 | 176,470 | 160,159 | 153,130 | ||||||||||||||||||
| Commercial Mortgage |
194,718 | 179,420 | 160,585 | 143,453 | 135,417 | ||||||||||||||||||
| Consumer |
57,102 | 58,652 | 47,647 | 29,530 | 28,451 | ||||||||||||||||||
| GROSS LOANS |
718,022 | 676,152 | 603,541 | 547,946 | 511,042 | ||||||||||||||||||
| Less: Unearned Income |
2,880 | 4,596 | 3,853 | 926 | 429 | ||||||||||||||||||
| TOTAL LOANS NET OF UNEARNED |
$ | 715,142 | $ | 671,556 | $ | 599,688 | $ | 547,020 | $ | 510,613 | |||||||||||||
B. LOAN MATURITIES AND INTEREST SENSITIVITY
| December 31, 2009 | ||||||||||||||||||
| One Year or Less |
One Through Five Years |
Over Five Years |
Total Gross Loans | |||||||||||||||
| Commercial, Financial and Agricultural |
||||||||||||||||||
| Loans With Fixed Interest Rate |
$ | 70,015 | $ | 66,468 | $ | 20,351 | $ | 156,834 | ||||||||||
| Loans With Floating Interest Rate |
35,952 | 22,440 | 25,131 | 83,523 | ||||||||||||||
| $ | 105,967 | $ | 88,908 | $ | 45,482 | $ | 240,357 | |||||||||||
C. RISK ELEMENTS
| 2009 | 2008 | 2007 | 2006 | 2005 | |||||||||||||||||||
| Loans on non-accrual basis |
$ | 12,757 | $ | 3,046 | $ | 1,979 | $ | 1,619 | $ | 1,561 | |||||||||||||
| Accruing loans which are contractually past due 90 days or more as to interest or principal payment |
584 | 533 | 395 | 128 | 462 | ||||||||||||||||||
| Troubled Debt Restructurings |
269 | - | - | - | - | ||||||||||||||||||
| $ | 13,610 | $ | 3,579 | $ | 2,374 | $ | 1,747 | $ | 2,023 | ||||||||||||||
| 1. | Interest income recorded on the non-accrual loans for the year ended December 31, 2009 was $116. Interest income which would have been recorded on these loans had they been on accrual status was $1,152. |
| 2. | Loans are placed in non-accrual status when the interest or principal is 90 days past due, unless the loan is in collection, well secured and it is believed that there will be no loss of interest or principal. |
| 3. | At December 31, 2009, there were $18,299 in special mention loans, $20,790 in substandard loans, and $36 in doubtful loans which are considered problem loans. These loans are not included in the table above. In the opinion of management, these loans are adequately secured and losses are believed to be minimal. |
7
Table of Contents
SUMMARY OF LOAN LOSS EXPERIENCE
(Dollars in Thousands)
| Analysis of the Allowance for Loan Losses |
||||||||||||||||||||||||||||
| Years Ended December 31, | 2009 | 2008 | 2007 | 2006 | 2005 | |||||||||||||||||||||||
| Balance at beginning of Period |
$ | 8,719 | $ | 6,773 | $ | 6,086 | $ | 5,603 | $ | 5,585 | ||||||||||||||||||
| Charge-Offs: |
||||||||||||||||||||||||||||
| Commercial, Financial and Agricultural |
860 | 33 | 39 | 16 | ||||||||||||||||||||||||
| Commercial Mortgages |
381 | 178 | 28 | 144 | 135 | |||||||||||||||||||||||
| Residential Mortgages |
378 | 330 | 180 | 203 | 152 | |||||||||||||||||||||||
| Consumer |
1,723 | 1,169 | 417 | 472 | 372 | |||||||||||||||||||||||
| Overdraft Deposit Accounts |
269 | 334 | 346 | 272 | 300 | |||||||||||||||||||||||
| 3,611 | 2,044 | 1,010 | 1,091 | 975 | ||||||||||||||||||||||||
| Recoveries: |
||||||||||||||||||||||||||||
| Commercial, Financial and Agricultural |
2 | 2 | 3 | 1 | ||||||||||||||||||||||||
| Commercial Mortgages |
3 | 18 | ||||||||||||||||||||||||||
| Residential Mortgages |
1 | 6 | 12 | 4 | ||||||||||||||||||||||||
| Consumer |
75 | 84 | 91 | 100 | 100 | |||||||||||||||||||||||
| Overdraft Deposit Accounts |
144 | 111 | 82 | 93 | 91 | |||||||||||||||||||||||
| 222 | 203 | 185 | 203 | 210 | ||||||||||||||||||||||||
| Net Charge-Offs: |
(3,389 | ) | (1,841 | ) | (825 | ) | (888 | ) | (765 | ) | ||||||||||||||||||
| Provision for Loan Losses |
4,465 | 3,787 | 1,512 | 1,371 | 783 | |||||||||||||||||||||||
| Balance at End-of-Period |
$ | 9,795 | $ | 8,719 | $ | 6,773 | $ | 6,086 | $ | 5,603 | ||||||||||||||||||
| Percentage of net charge-offs during the period to average loans outstanding |
0.49 | 0.28 | 0.14 | 0.17 | 0.15 | |||||||||||||||||||||||
The provision for loan losses reflects the amount deemed appropriate by management to establish an adequate reserve to meet the present and foreseeable risk characteristics of the present loan portfolio. Management’s judgement is based on the evaluation of individual loans, the overall risk characteristics of various portfolio segments, past experience with losses, the impact of economic condition on borrowers, and other relevant factors.
ALLOCATION OF THE ALLOWANCE FOR LOAN LOSSES
(Dollars In Thousands)
| 2009 % of Loans in each Category |
2008 % of Loans in |
2007 % of Loans in |
2006 % of Loans in |
2005 % of Loans in |
||||||||||||||||||||||||||
| Domestic: |
||||||||||||||||||||||||||||||
| Real Estate Mortgages |
$ | 4,874 | 58.57 | % | $ | 4,109 | 57.61 | % | $ | 2,927 | 55.61 | % | $ | 2,712 | 55.98 | % | $ | 2,434 | 56.21 | % | ||||||||||
| Consumer |
1,836 | 7.95 | % | 1,671 | 8.67 | % | 1,287 | 7.94 | % | 617 | 5.24 | % | 502 | 5.54 | % | |||||||||||||||
| Commercial, Financial and Agricultural |
2,790 | 33.37 | % | 2,660 | 33.59 | % | 2,253 | 36.26 | % | 2,553 | 38.61 | % | 2,365 | 37.80 | % | |||||||||||||||
| Overdraft Deposit Accounts |
295 | 0.11 | % | 279 | 0.13 | % | 306 | 0.19 | % | 199 | 0.17 | % | 261 | 0.45 | % | |||||||||||||||
| Unallocated |
0.00 | % | 0.00 | % | 0.00 | % | 5 | 0.00 | % | 41 | 0.00 | % | ||||||||||||||||||
| TOTALS |
$ | 9,795 | 100.00 | % | $ | 8,719 | 100.00 | % | $ | 6,773 | 100.00 | % | $ | 6,086 | 100.00 | % | $ | 5,603 | 100.00 | % | ||||||||||
| 1. | In determining the allocation of the allowance for loan losses, the Corporation considers economic trends, historical patterns and specific credit reviews. |
| 2. | With regard to the credit reviews, a “watchlist” is evaluated on a monthly basis to determine potential commercial losses. Consumer loans and mortgage loans are allocated using historical loss experience. The total of these reserves is deemed “allocated”, while the remaining balance is “unallocated”. |
8
Table of Contents
Analysis of the Allowance for Loan Losses
The unallocated component of the allowance for loan losses has been eliminated beginning in 2007 as management has refined its methodology for monitoring and measuring credit risk. In 2009, 2008 and 2007, additional individual loans were subject to specific review, resulting in an increase in specific allowance allocations. In addition, consideration of current economic risk factors were applied to individual pools of homogeneous loans. In prior years, economic risk factors were applied to the portfolio of loans as a whole and were reflected as unallocated.
DEPOSITS
(Dollars In Thousands)
| December 31, | 2009 | 2008 | 2007 | |||||||||||||||
| Average Amount |
Annual Rate |
Average Amount |
Annual Rate |
Average Amount |
Annual Rate |
|||||||||||||
| Demand - Non Interest Bearing |
$ | 104,773 | $ | 97,578 | $ | 86,382 | ||||||||||||
| Demand - Interest Bearing |
241,505 | 0.79 | % | 207,293 | 1.42 | % | 151,854 | 1.81 | % | |||||||||
| Savings Deposits |
201,827 | 1.70 | % | 98,463 | 1.96 | % | 52,500 | 0.81 | % | |||||||||
| Time Deposits |
320,477 | 2.42 | % | 349,544 | 2.88 | % | 354,527 | 4.20 | % | |||||||||
| TOTAL |
$ | 868,582 | $ | 752,878 | $ | 645,263 | ||||||||||||
| The maturity of certificates of deposits and other time deposits in denomination of $100,000 or more as of December 31, 2009 (Dollars In Thousands) |
|||
| Maturing in: |
|||
| Three months or less |
$ | 4,094 | |
| Greater than three months and through twelve months |
7,574 | ||
| Greater than one year and through three years |
85,793 | ||
| Greater than three years |
14,309 | ||
| $ | 111,770 | ||
Shareholders may obtain a copy of the Annual Report to the Securities and Exchange Commission on Form 10-K by writing to: CNB Financial Corporation, 1 South Second Street, PO Box 42, Clearfield, PA 16830, Attn: Shareholder Relations.
9
Table of Contents
Investments in CNB Financial Corporation common stock involve risk. The market price of CNB Financial Corporation common stock may fluctuate significantly in response to a number of items which are mainly beyond the control of the Corporation and could include, but are not limited to, the following:
| — | Changes in the market valuations of similar corporations |
| — | Changes in interest rates |
| — | Volatility of stock market prices and volumes |
| — | Rumors or erroneous information |
| — | New developments in the financial services industry |
| — | Variations in quarterly or annual operating results |
| — | Litigation or regulatory actions |
| — | Changes in accounting policies or procedures as may be required by the Financial Accounting Standards Board or other regulatory agencies. |
| — | Business conditions in the communities we serve |
| — | Economic and political conditions |
| — | Credit standards |
| — | Additional capital for future |
| — | Competition |
| — | Allowance for loans losses |
If CNB Financial Corporation does not adjust to future changes in the financial services industry, its financial performance may suffer. As such, the Corporation’s ability to maintain its history of strong financial performance and return on investment to shareholders will depend in part on its ability to expand its scope of available financial services to its customers. In addition to other banks, competitors include securities dealers, brokers, mortgage bankers, investment advisors, and finance and insurance companies. The increasingly competitive environment is, in part, a result of changes in regulation, changes in technology and product delivery systems, and the accelerating pace of consolidation among financial service providers.
Future governmental regulation and legislation could limit growth. CNB Financial Corporation and its subsidiaries are subject to extensive regulation, supervision and legislation that govern nearly every aspect of its operations. Changes to these laws could affect CNB Financial Corporation’s ability to deliver or expand its services and diminish the value of its business.
Changes in interest rates could reduce income and cash flow. CNB Financial Corporation’s income and cash flow depends to a great extent on the difference between the interest earned on loans and investment securities, and the interest paid on deposits and other borrowings. Interest rates are beyond CNB Financial Corporation’s control, and they fluctuate in response to general economic conditions and the policies of various governmental and regulatory agencies, in particular, the Federal Reserve Board. Changes in monetary policy, including changes in interest rates, will influence the origination of loans, the purchase of investments, the generation of deposits and the rates received on loans and investment securities and paid on deposits.
Additional factors could have a negative effect on the financial performance of CNB Financial Corporation and CNB Financial Corporation common stock. Some of these factors are general economic and financial market conditions, competition, continuing consolidation in the financial services industry, litigation, regulatory actions, and losses.
10
Table of Contents
ITEM 1B. UNRESOLVED STAFF COMMENTS
None
The headquarters of the Corporation and the Bank are located at 1 South Second Street, Clearfield, Pennsylvania, in a building owned by the Corporation. The Bank operates 26 full-service offices and 1 loan production office. Of these 27 offices, 21 are owned and 6 are leased from independent owners. Holiday Financial Services Corporation has eight full-service offices of which seven are leased from independent owners and one is leased from the Bank. There are no encumbrances on the offices owned, and the rental expense on the leased property is immaterial in relation to operating expenses. The initial lease terms range from one to twenty years.
There are no material pending legal proceedings to which the Corporation or any of its subsidiaries is a party, or of which any of their property is the subject, except ordinary routine proceedings which are incidental to the business. In the opinion of management, pending legal proceedings will not have a material adverse effect on the consolidated financial position of the Corporation.
ITEM 4A. EXECUTIVE OFFICERS OF THE REGISTRANT
| Name |
Age |
Principal Occupation | ||
| Joseph B. Bower, Jr. | 46 | President and Chief Executive Officer, CNB Bank and CNB Financial Corporation, since January 1, 2010; previously, Secretary, CNB Financial Corporation, since 2003; Executive Vice President and Chief Operating Officer, CNB Bank, since 2003; and previously Chief Financial Officer, CNB Bank, since 1997. | ||
| Mark D. Breakey | 51 | Executive Vice President and Credit Risk Manager, CNB Bank, since 2004; and previously Senior Loan Officer, CNB Bank, since 1995. | ||
| Charles R. Guarino | 47 | Treasurer, Principal Financial Officer and Principal Accounting Officer, CNB Financial Corporation, since April 2006; Chief Financial Officer, CNB Bank, since 2004; and previously a Certified Public Accountant in public practice. | ||
| Richard L. Sloppy | 59 | Executive Vice President and Senior Loan Officer, CNB Bank, since 2004; and previously Vice President Commercial Banking, CNB Bank, since 1998. | ||
| Vincent C. Turiano | 59 | Senior Vice President/Operations, CNB Bank, since November 25, 2009; previously Financial Consultant for RBC Wealth Management (formerly Ferris, Baker Watts, Inc.) and Executive Vice President of Omega Bank and Omega Financial Corporation. | ||
Officers are elected annually at the reorganization meeting of the Board of Directors.
11
Table of Contents
PART II.
ITEM 5. MARKET FOR REGISTRANT’S COMMON EQUITY, RELATED STOCKHOLDER MATTERS AND ISSUER PURCHASES OF EQUITY SECURITIES
Quarterly Share Data
The following tables set forth, for the periods indicated, the quarterly high and low bid price of the Corporation’s common stock as reported through the National Quotation Bureau and actual cash dividends paid per share. The stock is traded on the NASDAQ Stock Market under the symbol CCNE. As of December 31, 2009, the approximate number of shareholders of record of the Corporation’s common stock was 2,780.
Price Range of Common Stock
| 2009 | 2008 | |||||||||||
| High | Low | High | Low | |||||||||
| First quarter |
$ | 11.48 | $ | 8.32 | $ | 14.20 | $ | 13.04 | ||||
| Second quarter |
15.82 | 9.51 | 14.25 | 13.23 | ||||||||
| Third quarter |
18.00 | 13.76 | 14.19 | 10.25 | ||||||||
| Fourth quarter |
18.74 | 14.51 | 12.80 | 8.60 | ||||||||
Cash Dividends Paid
| 2009 | 2008 | |||||
| First quarter |
$ | 0.165 | $ | 0.16 | ||
| Second quarter |
0.165 | 0.16 | ||||
| Third quarter |
0.165 | 0.16 | ||||
| Fourth quarter |
0.165 | 0.165 | ||||
Issuer Purchases of Equity Securities
There were no shares purchased as part of publicly announced plans or programs from October 1, 2009 to December 31, 2009. The maximum number of shares that may yet be purchased under publicly announced plans or programs is 168,386.
12
Table of Contents
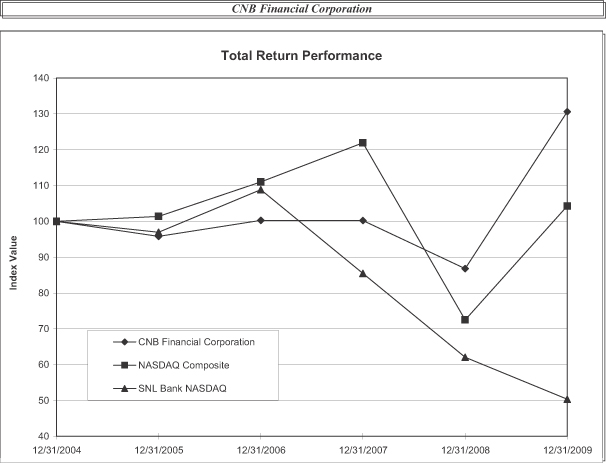
Performance Graph
Set forth below is a chart comparing the Corporation’s cumulative return to stockholders against the cumulative return of the NASDAQ Composite Index and a Peer Group Index of banking organizations for the five-year period commencing December 31, 2004 and ended December 31, 2009.
| Period Ending | ||||||||||||
| Index | 12/31/04 | 12/31/05 | 12/31/06 | 12/31/07 | 12/31/08 | 12/31/09 | ||||||
|
| ||||||||||||
| CNB Financial Corporation |
100.00 | 95.83 | 100.29 | 100.23 | 86.81 | 130.63 | ||||||
| NASDAQ Composite |
100.00 | 101.37 | 111.03 | 121.92 | 72.49 | 104.31 | ||||||
| SNL Bank NASDAQ |
100.00 | 96.95 | 108.85 | 85.45 | 62.06 | 50.34 | ||||||
| Source : SNL Financial LC, Charlottesville, VA | (434) 977-1600 | |
| © 2010 | www.snl.com |
13
Table of Contents
ITEM 6. SELECTED FINANCIAL DATA
| Year ended December 31, | |||||||||||||||
| 2009 | 2008 | 2007 | 2006 | 2005 | |||||||||||
|
| |||||||||||||||
| INTEREST AND DIVIDEND INCOME: |
|||||||||||||||
| Loans including fees |
$ | 45,839 | $ | 47,355 | $ | 44,559 | $ | 40,198 | $ | 33,931 | |||||
| Deposits with banks |
215 | 429 | 492 | 437 | 316 | ||||||||||
| Federal funds sold |
- | 342 | 334 | 293 | 394 | ||||||||||
| Securities: |
|||||||||||||||
| Taxable |
7,687 | 7,419 | 6,669 | 5,876 | 4,817 | ||||||||||
| Tax-exempt |
2,095 | 1,414 | 1,457 | 1,706 | 1,837 | ||||||||||
| Dividends |
34 | 224 | 422 | 362 | 327 | ||||||||||
| Total interest and dividend income |
55,870 | 57,183 | 53,933 | 48,872 | 41,622 | ||||||||||
| INTEREST EXPENSE: |
|||||||||||||||
| Deposits |
13,091 | 14,956 | 18,087 | 17,106 | 12,633 | ||||||||||
| Borrowed funds |
4,527 | 4,609 | 3,510 | 2,881 | 2,637 | ||||||||||
| Subordinated debentures |
850 | 1,018 | 1,325 | 866 | 685 | ||||||||||
| Total interest expense |
18,468 | 20,583 | 22,922 | 20,853 | 15,955 | ||||||||||
| NET INTEREST INCOME |
37,402 | 36,600 | 31,011 | 28,019 | 25,667 | ||||||||||
| PROVISION FOR LOAN LOSSES |
4,465 | 3,787 | 1,512 | 1,371 | 783 | ||||||||||
| Net interest income after provision for loan losses |
32,937 | 32,813 | 29,499 | 26,648 | 24,884 | ||||||||||
| NON-INTEREST INCOME |
7,720 | 2,490 | 8,189 | 8,435 | 7,407 | ||||||||||
| NON-INTEREST EXPENSES |
29,791 | 28,801 | 25,273 | 22,111 | 20,164 | ||||||||||
| INCOME BEFORE INCOME TAXES |
10,866 | 6,502 | 12,415 | 12,972 | 12,127 | ||||||||||
| INCOME TAX EXPENSE |
2,354 | 1,267 | 3,281 | 3,350 | 2,989 | ||||||||||
| NET INCOME |
$ | 8,512 | $ | 5,235 | $ | 9,134 | $ | 9,622 | $ | 9,138 | |||||
| PER SHARE DATA: |
|||||||||||||||
| Basic |
$ | 0.98 | $ | 0.61 | $ | 1.05 | $ | 1.08 | $ | 1.01 | |||||
| Fully diluted |
0.98 | 0.61 | 1.05 | 1.07 | 1.00 | ||||||||||
| Dividends declared |
0.66 | 0.645 | 0.62 | 0.57 | 0.55 | ||||||||||
| Book value per share at year end |
7.92 | 7.27 | 8.10 | 8.15 | 7.76 | ||||||||||
| AT END OF PERIOD: |
|||||||||||||||
| Total assets |
$ | 1,161,591 | $ | 1,016,518 | $ | 858,700 | $ | 780,850 | $ | 764,018 | |||||
| Securities |
346,370 | 238,181 | 162,792 | 156,696 | 161,897 | ||||||||||
| Loans, net of unearned discount |
715,142 | 671,556 | 599,688 | 547,020 | 510,613 | ||||||||||
| Allowance for loan losses |
9,795 | 8,719 | 6,773 | 6,086 | 5,603 | ||||||||||
| Deposits |
956,858 | 814,596 | 659,157 | 631,322 | 618,503 | ||||||||||
| Shareholders’ equity |
69,409 | 62,467 | 69,283 | 72,279 | 69,968 | ||||||||||
| KEY RATIOS: |
|||||||||||||||
| Return on average assets |
0.79% | 0.55% | 1.12% | 1.26% | 1.23% | ||||||||||
| Return on average equity |
12.86% | 7.88% | 12.82% | 13.51% | 13.42% | ||||||||||
| Loan to deposit ratio |
74.74% | 82.44% | 90.98% | 86.65% | 82.56% | ||||||||||
| Dividend payout ratio |
67.27% | 105.53% | 59.05% | 53.05% | 55.22% | ||||||||||
| Average equity to average assets ratio |
6.17% | 7.00% | 8.65% | 9.31% | 9.18% | ||||||||||
14
Table of Contents
ITEM 7. MANAGEMENT’S DISCUSSION AND ANALYSIS OF FINANCIAL CONDITION AND RESULTS OF OPERATIONS
The following discussion and analysis of the consolidated financial statements of CNB Financial Corporation (the “Corporation”) is presented to provide insight into management’s assessment of financial results. The Corporation’s subsidiary CNB Bank (the “Bank”) provides financial services to individuals and businesses primarily within the west central Pennsylvania counties of Cambria, Clearfield, Centre, Elk, Jefferson and McKean. ERIEBANK, a division of CNB Bank, provides financial services to individuals and business in the northwestern Pennsylvania counties of Erie and Crawford. The Bank is subject to regulation, supervision and examination by the Pennsylvania State Department of Banking as well as the Federal Deposit Insurance Corporation. The financial condition and results of operations are not necessarily indicative of future performance. One of the Corporation’s subsidiaries, CNB Securities Corporation, is incorporated in Delaware and currently maintains investments in debt and equity securities. County Reinsurance Company, also a subsidiary, is an Arizona Corporation, and provides credit life and disability insurance for customers of CNB Bank. CNB Insurance Agency, incorporated in Pennsylvania, provides for the sale of nonproprietary annuities and other insurance products. Holiday Financial Services Corporation (“Holiday”), incorporated in Pennsylvania, offers small balance unsecured loans and secured loans, primarily collateralized by automobiles and equipment, to borrowers with higher risk characteristics. Management’s discussion and analysis should be read in conjunction with the audited consolidated financial statements and related notes.
Risk identification and management are essential elements for the successful management of the Corporation. In the normal course of business, the Corporation is subject to various types of risk, including interest rate, credit, and liquidity risk. These risks are controlled through policies and procedures established throughout the Corporation.
Interest rate risk is the sensitivity of net interest income and the market value of financial instruments to the direction and frequency of changes in interest rates. Interest rate risk results from various repricing frequencies and the maturity structure of the financial instruments owned by the Corporation. The Corporation uses its asset/liability management policy and systems to control, monitor and manage interest rate risk.
Credit risk represents the possibility that a customer may not perform in accordance with contractual terms. Credit risk results from loans with customers and the purchase of securities. The Corporation manages credit risk by following an established credit policy and through a disciplined evaluation of the adequacy of the allowance for loan losses. Also, the investment policy limits the amount of credit risk that may be taken in the securities portfolio.
Liquidity risk represents the inability to generate or otherwise obtain funds at reasonable rates to satisfy commitments to borrowers and obligations to depositors. The Corporation has established guidelines within its asset liability management policy to manage liquidity risk. These guidelines include contingent funding alternatives.
General Overview
In September 2009, the Corporation expanded its ERIEBANK franchise by opening a temporary location in Meadville, Pennsylvania. Construction of a full service office is underway with opening
15
Table of Contents
expected in the second quarter of 2010. Management believes that our ERIEBANK division, along with our traditional CNB Bank market areas, should provide the Bank with moderate loan growth during 2010. Deposit growth was significant in both 2009 and 2008 as a result of the Corporation’s continued offering of competitive rates and growth of its ERIEBANK franchise, but is expected to moderate in 2010.
The Corporation had a total of eight offices within Holiday Financial Services Corporation throughout 2009. Although the consumer discount loan business is relatively new to the Corporation, management has made the necessary investments in experienced personnel and technology which has facilitated the growth of Holiday into a successful and profitable subsidiary of the Corporation.
While non-interest costs are expected to increase with the growth of the Corporation’s banking and consumer discount loan franchises, these new ventures will continue to provide growth in earning assets as well as growth in relationships and enhanced non-interest income which we believe will more than offset these costs in 2010 and beyond. In addition, during the latter part of 2008 and continuing into 2009, the Corporation began a cost management study covering all areas of non-interest expense. Cost savings as a result of this study have begun to be recognized in 2009 with benefits continuing into subsequent years.
The interest rate environment will continue to play an important role in the future earnings of the Corporation. We experienced some compression of our net interest margin in 2009 and some additional compression is expected in 2010 as a result of the current interest rate environment. However, management will continue to apply a disciplined approach to managing our balance sheet in these uncertain times. We have taken measures such as instituting rate floors on our commercial lines of credit and home equity lines as a result of the historic lows on various key interest rates such as the Prime Rate and 3-month LIBOR. In addition, we will implement strategies to effectively reduce our cost of funds. Due to our continued growth, non-interest income should be enhanced in several areas including trust income, service charges and other fees. While our business plan continues to focus on commercial lending, we also offer a full service approach to servicing the needs of high net worth individuals through our Private Banking groups in both our CNB Bank and ERIEBANK franchises.
Management concentrates on return on average equity and earnings per share evaluations, plus other methods to measure and direct the performance of the Corporation. While past results are not an indication of future earnings, we feel the Corporation is well positioned to sustain core earnings during 2010.
Financial Condition
The following table presents ending balances (dollars in millions), growth (reduction) and the percentage change during the years ended December 31, 2009 and 2008:
| 2009 Balance |
$ Change | % Change | 2008 Balance |
$ Change | % Change | 2007 Balance | |||||||||||||||
| Total assets |
$ | 1,161.6 | $ | 145.1 | 14.3 | $ | 1,016.5 | $ | 157.8 | 18.4 | $ | 858.7 | |||||||||
| Total loans, net |
705.3 | 42.5 | 6.4 | 662.8 | 69.9 | 11.8 | 592.9 | ||||||||||||||
| Total securities |
346.4 | 108.2 | 45.4 | 238.2 | 75.4 | 46.3 | 162.8 | ||||||||||||||
| Total deposits |
956.9 | 142.3 | 17.5 | 814.6 | 155.4 | 23.6 | 659.2 | ||||||||||||||
| Total shareholders’ equity |
69.4 | 6.9 | 11.1 | 62.5 | (6.8 | ) | (9.8 | ) | 69.3 | ||||||||||||
The above table is referenced for the discussion in this section of Form 10-K.
16
Table of Contents
Overview of Balance Sheet
The increase in assets of 14.3% during 2009 was primarily the result of continued deposit growth with corresponding investments in the loan and securities portfolios. The loan growth occurred in both the commercial and residential mortgage areas due to our focus on private banking and the historically low interest rates throughout 2009 which resulted in significant refinancing activity as well as new mortgage loans and home equity borrowings. Although the Corporation’s loan growth was notable at 6.4%, its deposit growth was even more significant as total deposits grew by $142.3 million, or 17.5%, during 2009. As such, the Corporation purchased additional available-for-sale securities. The specific effects to each area are described in the following sections.
Cash and Cash Equivalents
Cash and cash equivalents totaled $22.4 million at December 31, 2009 compared to $31.3 million at December 31, 2008. Cash and cash equivalents will fluctuate based on the timing and amount of liquidity events that occur in the normal course of business. The year end balance is considered reasonable to support the expected funding needs in the short term.
We believe the liquidity needs of the Corporation are satisfied by the current balance of cash and cash equivalents, readily available access to traditional funding sources, Federal Home Loan Bank financing, and the portion of the securities and loan portfolios that matures within one year. These sources of funds will enable the Corporation to meet cash obligations and off-balance sheet commitments as they come due.
Securities
Securities available for sale and trading securities have combined to increase $108.2 million, or 45.4%, since December 31, 2008. The increase is primarily due to purchases of securities issued by government sponsored entities, structured collateralized mortgage obligations, and mortgage-backed securities, and resulted from excess deposit growth not reinvested in loans. In addition, as more fully described below, the Corporation had a higher than normal volume of sales and purchases of securities available for sale during 2009.
The Corporation’s structured pooled trust preferred securities currently do not trade in an active, open market with readily observable prices and are therefore classified within Level 3 of the valuation hierarchy. The fair value of these securities has been calculated using a discounted cash flow model and market liquidity premium. With the current market conditions, the assumptions used to determine the fair value of Level 3 securities has greater subjectivity due to the lack of observable market transactions. The fair values of these securities have declined due to the fact that the subsequent offerings of similar securities pay a higher market rate of return. This higher rate of return reflects the increased credit and liquidity risks in the marketplace.
When the structured pooled trust preferred securities were purchased, they were considered to be investment grade based on ratings assigned by Moody’s. As a result of liquidity disruptions within the credit markets and the generally stressed conditions within the financial services industry, Moody’s has downgraded the rating of these securities since they were purchased by the Corporation. As of December 31, 2009, the Corporation held four structured pooled trust preferred securities rated Ca by Moody’s having an amortized cost of $3,439,000 and fair value of $754,000 and one structured pooled trust preferred security rated Baa2 by Moody’s having an amortized cost and fair value of $1,155,000.
17
Table of Contents
Based on our evaluation of certain structured pooled trust preferred securities, the present value of the projected cash flows was not sufficient for full repayment of the amortized cost for three of the securities resulting in total impairment charges realized during 2009 of $2.4 million. For the other two pooled trust preferred securities, the present value of the projected cash flows was sufficient for full repayment of amortized cost, and, therefore, it is believed the decline in fair value is temporary due to current market conditions. However, without recovery of these securities, other-than-temporary impairments may occur in future periods.
During the first quarter of 2009, management identified its corporate debt investments as a potential credit risk to the Corporation based upon the continued downturn in the economy and the resulting effect on the financial services industry. As a result of a thorough evaluation process which included risk profiling of individual issuers and comparisons of corporate debt exposure to peer institutions, management elected to liquidate a portion of its investments in “mid-tier” financial institution corporate debt. The decision to sell specific securities was based upon news and events that occurred in the first quarter of 2009 which were indicators of deterioration of the issuers’ creditworthiness, including earnings releases which were significantly less than expectations, declines in common stock prices, and decreases in the fair value of debt securities from December 31, 2008 through the date of sale.
The total reduction in corporate debt of approximately $2.0 million during the first quarter brought the Corporation’s exposure below the median of its peers based on data obtained from quarterly Uniform Bank Performance Reports. Proceeds from the sale of these corporate securities totaled $1,694,000 resulting in gross realized losses of $780,000. To offset this loss, the Corporation sold obligations of U.S. Government sponsored entities, state and political subdivisions, and mortgage-backed securities resulting in total proceeds of $30,318,000 and gross gains of $764,000.
Standard & Poors downgraded one of Corporation’s private label collateralized mortgage obligations from AAA to CCC during the third quarter of 2009 and, as a result, the Corporation evaluated this security for other-than-temporary impairment. The amount of other-than-temporary impairment recognized in income during the year ended December 31, 2009 was $28,000. Because of the continuing deterioration of fair value, as well as additional information about this security that was published in the fourth quarter of 2009, the security was sold in November 2009, resulting in a realized loss of $572,000.
During the remainder of 2009, management sold additional debt securities in an attempt to re-position a portion of its portfolio into lower risk-weighted assets. Proceeds from these sales of approximately $75 million as well as excess deposit growth were reinvested in other available-for-sale securities with overall lower regulatory risk weightings. As a result, the percentage of 0% risk-weighted available-for-sale securities as a percentage of total available-for-sale securities increased from 19.2% at December 31, 2008 to 33.7% at December 31, 2009.
The Corporation generally buys into the market over time and does not attempt to “time” its transactions. In doing this, the highs and lows of the market are averaged into the portfolio and minimize the overall effect of different rate environments. We monitor the earnings performance and the effectiveness of the liquidity of the securities portfolio on a regular basis through both management and the Board’s Asset/Liability Committee (“ALCO”) meetings. The ALCO also reviews and manages interest rate risk for the Corporation. Through active balance sheet management and analysis of the securities portfolio, we maintain a sufficient level of liquidity to satisfy depositor requirements and various credit needs of our customers.
18
Table of Contents
Loans
The Corporation’s lending is focused in the west central and northwest Pennsylvania markets and consists principally of commercial and retail lending, which includes single family residential mortgages and other consumer loans.
As detailed in the table below, at December 31, 2009, the Corporation had $715.1 million in loans outstanding, net of unearned discount, an increase of $43.6 million (or 6.5%) since December 31, 2008. The increase was primarily the result of two factors. The first factor was increasing demand for commercial, industrial, and agricultural loans, as well as commercial mortgage products. The Corporation views commercial lending as its competitive advantage and continues to focus on this area by hiring and retaining experienced loan officers and supporting them with quality credit analysis. The second factor was increasing demand for residential mortgage loan products due to historically low interest rates throughout 2009, resulting in both significant refinancing activity as well as new mortgage loans and home equity borrowings.
| {dollars in thousands} | 2009 |
2008 | ||||
| Commercial, industrial, and agricultural |
$ | 240,357 | $ | 228,000 | ||
| Residential mortgage |
225,845 | 210,080 | ||||
| Commercial mortgage |
194,718 | 179,420 | ||||
| Consumer and other |
54,222 | 54,056 | ||||
| $ | 715,142 | $ | 671,556 | |||
The Corporation expects moderately increasing loan demand throughout 2010 primarily as a result of the continued growth of our ERIEBANK division.
Loan Concentration
The Corporation monitors loan concentrations by individual industries in order to track potential risk exposures resulting from industry related downturns. At December 31, 2009, no concentration existed within our commercial or real estate loan portfolio that exceeded 10% of the total loans.
Loan Quality
The Corporation has established written lending policies and procedures that require underwriting standards, loan documentation, and credit analysis standards to be met prior to funding a loan. Subsequent to the funding of a loan, ongoing review of credits is required. Credit reviews are performed annually on a minimum of 60% of the commercial loan portfolio by an outsourced loan review partner. In addition, classified assets, past due loans and nonaccrual loans are reviewed by the loan review partner semiannually and monthly by our credit administration staff.
19
Table of Contents
The following table presents information concerning loan delinquency and other non-performing assets at December 31, 2009, 2008, and 2007 (dollars in thousands):
| 2009 |
2008 |
2007 | |||||||
| Non-accrual loans |
$ | 12,757 | $ | 3,046 | $ | 1,979 | |||
| Accrual loans greater than 89 days past due |
548 | 533 | 395 | ||||||
| Total nonperforming loans |
13,305 | 3,579 | 2,374 | ||||||
| Other real estate owned |
252 | 671 | 516 | ||||||
| Total nonperforming assets |
$ | 13,557 | $ | 4,250 | $ | 2,890 | |||
| Total loans, net of unearned income |
$ | 715,142 | $ | 671,556 | $ | 599,688 | |||
| Nonperforming loans as a percentage of loans, net |
1.86% | 0.53% | 0.40% | ||||||
| Total assets |
$ | 1,161,591 | $ | 1,016,518 | $ | 858,700 | |||
| Nonperforming assets as a percentage of total assets |
1.17% | 0.42% | 0.34% | ||||||
Management continues to closely monitor nonperforming loans. Although the ratio of nonperforming loans to total net loans increased from 0.53% in 2008 to 1.86% in 2009, management does not believe the increase to be a result of deterioration in underwriting or credit analysis processes, but more a result of overall economic conditions regionally as well as nationally. The Corporation’s nonperforming loans to total loans ratio continues to be favorable compared to peer institutions. See the “Allowance for Loan Losses” section for further discussion of credit review procedures and increases in nonperforming loans.
Allowance for Loan Losses
The allowance for loan losses is established by provisions for losses in the loan portfolio as well as overdrafts in deposit accounts. These provisions are charged against current income. Loans and overdrafts deemed not collectible are charged off against the allowance while any subsequent collections are recorded as recoveries and increase the allowance.
20
Table of Contents
The following table presents activity within the allowance for loan losses during the years ended December 31, 2009, 2008, and 2007 (dollars in thousands):
| 2009 | 2008 | 2007 | ||||||||||
| Balance at beginning of period |
$ | 8,719 | $ | 6,773 | $ | 6,086 | ||||||
| Charge-offs: |
||||||||||||
| Commercial, industrial, and agricultural |
860 | 33 | 39 | |||||||||
| Commercial mortgages |
381 | 178 | 28 | |||||||||
| Residential mortgages |
378 | 330 | 180 | |||||||||
| Consumer |
1,723 | 1,169 | 417 | |||||||||
| Overdraft deposit accounts |
269 | 334 | 346 | |||||||||
| 3,611 | 2,044 | 1,010 | ||||||||||
| Recoveries: |
||||||||||||
| Commercial, industrial, and agricultural |
2 | 2 | - | |||||||||
| Commercial mortgages |
- | - | - | |||||||||
| Residential mortgages |
1 | 6 | 12 | |||||||||
| Consumer |
75 | 84 | 91 | |||||||||
| Overdraft deposit accounts |
144 | 111 | 82 | |||||||||
| 222 | 203 | 185 | ||||||||||
| Net charge-offs |
(3,389 | ) | (1,841 | ) | (825 | ) | ||||||
| Provision for loan losses |
4,465 | 3,787 | 1,512 | |||||||||
| Balance at end of period |
$ | 9,795 | $ | 8,719 | $ | 6,773 | ||||||
| Loans, net of unearned |
$ | 715,142 | $ | 671,556 | $ | 599,688 | ||||||
| Allowance to net loans |
1.37% | 1.30% | 1.13% | |||||||||
The adequacy of the allowance for loan losses is subject to a formal analysis by the credit administrator of the Corporation. As part of the formal analysis, delinquencies and losses are monitored monthly. The loan portfolio is divided into several categories in order to better analyze the entire pool. First is a selection of classified loans that is given a specific reserve. The remaining loans are pooled, by category, into these segments:
Reviewed
| • | Commercial, industrial, and agricultural |
| • | Commercial mortgages |
Homogeneous
| • | Residential real estate |
| • | Consumer |
| • | Credit cards |
| • | Overdrafts |
The reviewed loan pools are further segregated into four categories: special mention, substandard, doubtful, and unclassified. Historical loss factors are calculated for each pool excluding overdrafts based on the previous eight quarters of experience. The homogeneous pools are evaluated by analyzing the historical loss factors from the most previous quarter end and the two most recent year ends. The historical loss factors for both the reviewed and homogeneous pools are adjusted based on these six qualitative factors:
| • | Levels of and trends in delinquencies, non-accrual loans, and classified loans |
| • | Trends in volume and terms of loans |
21
Table of Contents
| • | Effects of any changes in lending policies and procedures |
| • | Experience, ability and depth of management |
| • | National and local economic trends and conditions |
| • | Concentrations of credit |
The methodology described above was created using the experience of our credit administrator, guidance from the regulatory agencies, expertise of our loan review partner, and discussions with our peers. The resulting factors are applied to the pool balances in order to estimate the probable risk of loss within each pool. As a result of the application of these procedures, the allocation of the allowance for loan losses was as follows at December 31, 2009 and 2008 (in thousands):
| 2009 | 2008 | |||||
| Commercial mortgages |
$ | 3,291 | $ | 2,836 | ||
| Commercial, financial, and agricultural |
2,790 | 2,660 | ||||
| Consumer |
1,751 | 1,589 | ||||
| Residential mortgages |
1,583 | 1,273 | ||||
| Credit cards |
85 | 82 | ||||
| Overdraft deposit accounts |
295 | 279 | ||||
| Total |
$ | 9,795 | $ | 8,719 | ||
During 2009, the Corporation increased its provision for loan losses and allowance as compared to 2008. The increase was a result of increases in net charge-offs, primarily in the consumer discount portfolio and the commercial portfolio, as well as growth in loans outstanding and nonperforming loans from December 31, 2008 to December 31, 2009. Due to the addition of Holiday Financial Services in 2005, the Corporation has maintained a portfolio of consumer finance and discount loans with different risk characteristics than its consumer loan portfolio in its banking subsidiary. Holiday originates small balance unsecured loans and secured loans, primarily collateralized by automobiles and equipment, to borrowers with higher credit risk characteristics than are typical in its bank consumer loan portfolio. Although such loans only represented 2.3% of the Corporation’s total outstanding loans at December 31, 2009, the characteristics of this higher credit risk portfolio were considered, resulting in increases to our provision and allowance for the year ended December 31, 2009.
Nonperforming loans and net charge-offs increased during 2009, primarily as a result of the effect of rising costs and the overall challenging economic environment on certain borrowers. One large commercial relationship, including a shared national credit in which the Corporation participates, with a carrying value of $5.3 million was placed on nonaccrual status during 2009. Management has reviewed this loan to determine if a specific loss allocation was required and has determined that no significant allocation is warranted at this time.
As previously noted, both the level of nonperforming loans and nonperforming assets have increased since December 31, 2008. However, most of the loans on nonaccrual are also impaired and subject to the Corporation’s specific loss allocation process, including the large shared national credit previously described. The resulting specific losses identified have remained consistent. As such, over the same period, the allowance for loan losses as a percentage of net loans only increased by seven basis points from 1.30% at December 31, 2008 to 1.37% at December 31, 2009, primarily due to general reserves as a result of the current economic environment and higher loss experience in the consumer finance portfolio.
22
Table of Contents
Prudent business practices dictate that the level of the allowance, as well as corresponding charges to the provision for loan losses, should be commensurate with identified areas of risk within the loan portfolio and the attendant risks inherent therein. The quality of the credit risk management function and the overall administration of this vital segment of the Corporation’s assets are critical to the ongoing success of the Corporation.
The previously mentioned analysis considered numerous historical and other factors to analyze the adequacy of the allowance and charges against the provision for loan losses. Management paid special attention to a section of the analysis that compared and plotted the actual level of the allowance against the aggregate amount of loans adversely classified in order to compute the estimated probable losses associated with those loans. By noting the “spread” at that time, as well as prior periods, management can determine the current adequacy of the allowance as well as evaluate trends that may be developing. The volume and composition of the Corporation’s loan portfolio continue to reflect growth in commercial credits including commercial real estate loans.
As mentioned in the “Loans” section of this analysis, management considers commercial lending a competitive advantage and continues to focus on this area as part of its strategic growth initiatives. However, management must also consider the fact that the inherent risk is more pronounced in these types of credits and is also driven by the economic environment of its market areas.
Management believes that both its 2009 provision and allowance for loan losses were reasonable and adequate to absorb probable incurred losses in its portfolio at December 31, 2009.
Premises and Equipment
In order to improve the Bank’s capital position, in December 2009 the Corporation entered into a sale-leaseback transaction for real estate used in the operations of one of its branch office locations. The lease term is seventeen years, with two automatic renewal terms of five years each. In connection with this transaction, the Corporation received cash proceeds of $1,188,000, which was invested in the Bank in the form of additional paid-in capital. Because the buyer/lessor did not make an initial investment on the purchase of the real estate that is adequate to transfer the risks and rewards of ownership, the Corporation deferred the entire $500,000 gain associated with this transaction which is included in accrued interest payable and other liabilities in the accompanying consolidated balance sheet. The gain will be recognized over the term of the loan under the installment method. The Corporation’s annual lease payment is $112,000.
Bank Owned Life Insurance
The Corporation has periodically purchased Bank Owned Life Insurance (BOLI). The policies cover executive officers and a select group of other employees with the Bank being named as beneficiary. Earnings from the BOLI assist the Corporation in offsetting its benefit costs. The only change in balance from 2008 to 2009 was earnings on the policies.
23
Table of Contents
Funding Sources
Although the Corporation considers short-term borrowings and long-term debt when evaluating funding sources, traditional deposits continue to be the main source for funding. As noted in the following table, traditional deposits increased 17.5% during 2009 primarily as a result of growth in our savings accounts.
| Percentage change 2009 vs. 2008 |
2009 |
2008 |
2007 | |||||||||
| Demand, Non interest bearing |
18.7 | % | $ | 116,310 | $ | 97,999 | $ | 90,994 | ||||
| Demand, Interest bearing |
3.7 | % | 244,218 | 235,611 | 171,216 | |||||||
| Savings deposits |
98.8 | % | 273,096 | 137,344 | 54,339 | |||||||
| Time deposits |
(5.9 | %) | 323,234 | 343,642 | 342,608 | |||||||
| Total |
17.5 | % | $ | 956,858 | $ | 814,596 | $ | 659,157 | ||||
The increase in savings accounts occurred as a result of the Corporation’s continued offering of competitive rates and growth of its ERIEBANK franchise. During 2009, the Corporation continued to expand its business and consumer relationships in the ERIEBANK market by opening a temporary branch location in Meadville, Pennsylvania. A new full-service branch is scheduled to open in Meadville in the spring of 2010. In addition, a large regional bank that had been located in northeastern Pennsylvania merged with another financial institution, resulting in opportunities to market the Corporation’s deposit products to potential new customers. Savings deposits held by ERIEBANK grew from $67.4 million at December 31, 2008 to $179.6 million at December 31, 2009. Management expects this growth in ERIEBANK savings accounts to moderate in 2010.
Periodically, the Corporation utilizes term borrowings from the Federal Home Loan Bank (FHLB) and other lenders to meet funding obligations or match fund certain loan assets. The terms of these borrowings are detailed at Note 11 to the consolidated financial statements. During 2009, the Corporation entered into a $625,000 term borrowing with the FHLB at a fixed interest rate of 5.24%, with monthly principal and interest payments and a balloon payment due at maturity in June 2024.
Shareholders’ Equity
The Corporation’s capital continues to provide a base for profitable growth. Total shareholders’ equity increased $6.9 million or 11.1% during 2009 as the Corporation earned $8.5 million and declared dividends of $5.7 million, resulting in a dividend payout ratio of 67.3% of net income. In addition, shareholders’ equity increased as a result of an increase in the fair value of the Corporation’s investment portfolio.
The Corporation has complied with the standards of capital adequacy mandated by the banking industry. Bank regulators have established “risk-based” capital requirements designed to measure capital adequacy. Risk-based capital ratios reflect the relative risks of various assets banks hold in their portfolios. A weight category of either 0% (lowest risk assets), 20%, 50%, or 100% (highest risk assets), is assigned to each asset on the balance sheet. The Corporation’s total risk-based capital ratio of 11.95% as of December 31, 2009 was well above the minimum standard of 8%. The Tier 1 capital ratio of 10.70% also was above the regulatory minimum of 4%. The leverage ratio, 7.87%, was also
24
Table of Contents
above the minimum standard of 4%. The Bank’s total risk-based capital ratio of 11.56% as of December 31, 2009 was well above the minimum standard of 8%. The Bank’s Tier 1 capital ratio of 10.42% also was above the regulatory minimum of 4%. The Bank’s leverage ratio, 7.27%, was also above the minimum standard of 4%. The ratios provide quantitative data demonstrating the strength and future opportunities for use of the Corporation’s capital base. An evaluation of risk-based capital ratios and the capital position of the Corporation is a part of its budgeting and strategic planning process.
Liquidity
Liquidity measures an organization’s ability to meet cash obligations as they come due. The consolidated statements of cash flows included in the accompanying financial statements provide analysis of the Corporation’s cash and cash equivalents and the sources and uses of cash. Additionally, the portion of the loan portfolio that matures within one year and maturities within one year in the investment portfolio is considered part of the Corporation’s liquid assets. Liquidity is monitored by both management and the Board’s ALCO, which establishes and monitors ranges of acceptable liquidity. Also, the Bank is a member of FHLB which provides the Bank with a total borrowing line of approximately $394 million with approximately $315 million available at December 31, 2009. Management believes that the Corporation’s current liquidity position is acceptable.
Year Ended December 31, 2009
Overview of the Income Statement
The Corporation had net income of $8.5 million for 2009 compared to $5.2 million for 2008. The increase in net income is primarily attributable to lower other-than-temporary impairment losses and losses on securities for which the fair value option was elected, which was offset by increases in the Corporation’s provision for loan losses and FDIC insurance expense. The earnings per diluted share increased from $0.61 in 2008 to $0.98 in 2009. The return on assets and the return on equity for 2009 are 0.79% and 12.86% as compared to 0.55% and 7.88% for 2008.
Interest Income and Expense
Net interest income totaled $37.4 million in 2009, an increase of $802 thousand, or 2.2%, over 2008. Total interest and dividend income decreased by $1.3 million, or 2.3%, as compared to 2008. Although the Corporation’s earning assets continue to grow, these increases have been offset by decreases in the yield on earning assets as a result of the current interest rate environment. The Corporation’s average earning assets have grown by $113.7 million since December 31, 2008 while the yield has decreased by 83 basis points from 6.72% to 5.89%. Total interest expense, however, decreased $2.1 million, or 10.3%, as compared to 2008. The Corporation’s deposits continue to grow; however, interest expense has been positively impacted by decreases in rates paid on deposit accounts, primarily as a result of historically low short-term interest rates throughout 2009. As a result, the cost of interest bearing liabilities decreased by 57 basis points which more than offset the increase in average interest bearing liabilities of $112.0 million. The reduction in interest expense as a percentage of interest-bearing liabilities is expected to continue into 2010 as management implements various strategies to reduce the overall cost of the Corporation’s funding.
Provision for Loan Losses
The Corporation recorded a provision for loan losses of $4.5 million in 2009 compared to $3.8 million in 2008. As discussed in more detail in the Allowance for Loan Losses section of this analysis, the
25
Table of Contents
Corporation experienced an increased level of charge-offs over the prior year even though net charge-offs as a percentage of average loans remains at a modest level in comparison to our peer group. However, because of the increase in net charge-offs and the increasing level of nonperforming loans, as well as management’s detailed evaluation of problem loans, criticized assets, and the overall effects of the economy in our markets, an increase in the provision was deemed necessary. Management believes the charges to the provision in 2009 are appropriate and the allowance for loan losses is adequate to absorb probable incurred losses in our portfolio as of December 31, 2009.
Non-Interest Income
Non-interest income improved significantly during the year ended December 31, 2009. A substantial portion of the change is a result of small unrealized gains on securities for which the fair value option election was made, compared to total losses of $3,073,000 in 2008 and lower other-than-temporary impairment losses incurred during 2009 as compared to 2008. As a result, pretax charges for these previously mentioned items were $2.0 million in 2009 compared to $6.9 million in 2008.
Excluding the effects of securities transactions, the Corporation’s other income increased $296 thousand (or 3.1%) during 2009. The most significant increase of $611 thousand occurred in mortgage banking income, which is a result of the volume of refinancing transactions processed by the Corporation’s mortgage banking department in 2009 compared to 2008. The proceeds of mortgage loans sold to Freddie Mac increased from $12.5 million in 2008 to $50.5 million in 2009. This increase in mortgage banking income was offset by a decrease in trust and wealth management fees of $434 thousand.
Non-Interest Expense
Non-interest expense increased by $990 thousand, or 3.4%, to $29.8 million in 2009 compared to $28.8 million in 2008. The reason for the increase was that the Corporation’s insurance premiums due to the Federal Deposit Insurance Corporation (“FDIC”) increased by $1.3 million primarily as a result of increases in the deposits on which the premium assessment is based, higher assessment rates, and the 2009 special assessment described in the paragraph below.
As an institution insured by the Federal Deposit Insurance Corporation (FDIC), the Corporation is required to pay deposit insurance premiums to the FDIC. Because the FDIC’s deposit insurance fund fell below prescribed levels in 2008, the FDIC announced increased premiums for all insured depository institutions, including the Corporation, in order to begin recapitalizing the fund. In addition, in the second quarter of 2009, the FDIC imposed a 5 basis point emergency assessment on insured depository institutions which was paid on September 30, 2009, based on total assets less Tier 1 capital at June 30, 2009. The Corporation’s expense attributable to this special assessment is $475 thousand.
This increase in FDIC insurance expense was offset by a decrease in state and local income taxes of $205 thousand as a result of a one-time credit that the Corporation was able to apply on its Pennsylvania shares tax return in the amount of $246 thousand. The Commonwealth of Pennsylvania awarded the Corporation an Enterprise Zone Tax Credit in connection with the Corporation’s investment in a real estate limited partnership in the community of St. Marys, Pennsylvania.
During the latter part of 2008 and continuing into 2009, the Corporation began a cost management study covering all areas of non-interest expense. Cost savings as a result of this study began to be recognized in 2009 with benefits continuing into subsequent years.
26
Table of Contents
Year Ended December 31, 2008
Overview of the Income Statement
The Corporation’s net income decreased from $9.1 million in 2007 to $5.2 million in 2008, resulting in basic and diluted earnings per share of $0.61. The decrease in net income is attributable to losses on other-than-temporarily impaired securities, as well as realized and unrealized losses on securities for which fair value option was elected.
Interest Income and Expense
Net interest income totaled $36.6 million in 2008, an increase of $5.6 million, or 18.0%, over 2007. Total interest and dividend income increased by $3.3 million, or 6.0%, as compared to 2007 as a result of growth in average earning assets. Total interest expense decreased $2.3 million, or 10.2%, as compared to 2007, primarily as a result of decreases in short-term interest rates initiated by the Federal Reserve in the latter part of 2007 and continuing through 2008. The Corporation’s average earning assets increased $110.5 million from December 31, 2007 to December 31, 2008 while the yield decreased by 60 basis points from 7.32% to 6.72%. The growth in average earning assets more than offset the decline in yield. The cost of interest bearing liabilities decreased by 87 basis points during this period, which more than offset the increase in average interest bearing liabilities of $125.5 million.
Provision for Loan Losses
The Corporation recorded a provision for loan losses of 3.8 million in 2008 compared to $1.5 million in 2007 as a result of continued loan growth and an increased level of charge-offs and nonperforming loans.
Non-Interest Income
Other income decreased $5.7 million from $8.2 million in 2007 to $2.5 million in 2008. During 2008, the Corporation realized an other-than-temporary impairment charge of $1.96 million in connection with its holding of a subordinated corporate bond issued by Lehman Brothers Holdings and an impairment charge of $2.0 million in connection with its holding of a structured pooled trust preferred security. In addition, a substantial portion of the decrease is a result of the Corporation’s adoption of the fair value option for its equity portfolio as of January 1, 2008, which resulted in a pretax charge of $2.5 million for net unrealized losses and $0.6 million in realized losses on securities for which fair value was elected during the year ended December 31, 2008.
Excluding the effects of securities transactions, the Corporation’s other income increased $821 thousand (or 9.6%) in 2008 as a result of positive trends in other non-interest income line items such as wealth management fees and service charges on deposits. However, the most significant increase occurred in the other service charges and fees line item which increased by $360 thousand as a result of growth in insurance commissions generated by Holiday Financial Services Corporation.
Non-Interest Expense
Non-interest expense increased by 14.0% to $28.8 million in 2008 compared to $25.3 million in 2007. The majority (approximately 61%) of the increase was a result of the Corporation’s increasing costs for salaries, benefits, and occupancy related costs. Like many growing entities, the Corporation is faced
27
Table of Contents
with increasing employee related costs in order to support its growth. As of December 31, 2008, the Corporation had 286 full-time equivalent employees, compared to 272 full time equivalent employees at December 31, 2007, an increase of 5.1%. In addition, data processing expenses increased by $378 thousand, or 18.2%, as a result of the new ERIEBANK branches that were opened in 2008, as well as additional services that have been purchased from the Corporation’s core computer processor. In addition, the Corporation’s insurance premiums paid to the FDIC increased by $390 thousand as a result of the growth in the Corporation’s deposit base, increases in premium rates, and utilization of credits which offset FDIC insurance premiums through early 2008.
Income Tax Expense
Income taxes were $2.4 million in 2009, compared to $1.3 million in 2008 and $3.3 million in 2007. The effective tax rates were 21.7%, 19.5%, and 26.4% for 2009, 2008 and 2007, respectively. The effective tax rate for the periods differed from the federal statutory rate of 35.0% principally as a result of tax-exempt income from securities and loans as well as earnings from bank owned life insurance. The decrease in the effective tax rate from 2007 to 2008 is attributable to a higher percentage of tax-exempt income compared to pre-tax income. The subsequent increase in the effective tax rate from 2008 to 2009 is attributable to a slightly lower percentage of tax-exempt income compared to pre-tax income.
Contractual Obligations and Commitments
The Corporation has various financial obligations, including contractual obligations and commitments that may require future cash payments. The following table presents, as of December 31, 2009, significant fixed and determinable contractual obligations to third parties by payment date. Further discussion of the nature of each obligation is included in the referenced note to the consolidated financial statements.
| Payments Due In | ||||||||||||||
| Note Reference |
One Year or Less |
One to Three Years |
Three to Five Years |
Over Five Years |
Total | |||||||||
| Deposits without a stated maturity |
$ | 633,624 | - | - | - | $ | 633,624 | |||||||
| Certificates of deposit |
10 | 54,996 | 223,422 | 37,365 | 7,451 | 323,234 | ||||||||
| Treasury, tax and loan borrowings |
11 | 1,380 | - | - | - | 1,380 | ||||||||
| FHLB and other borrowings |
11 | 16,114 | 30,244 | 266 | 53,379 | 100,003 | ||||||||
| Operating leases |
7 | 333 | 565 | 337 | 1,505 | 2,740 | ||||||||
| Sale-leaseback |
7 | 112 | 224 | 224 | 1,341 | 1,901 | ||||||||
| Subordinated debentures |
11 | - | - | - | 20,620 | 20,620 | ||||||||
The Corporation’s operating lease obligations represent short and long-term lease and rental payment for facilities. The Corporation’s sale-leaseback obligation represents a long-term real estate lease associated with one of the Corporation’s branch office locations.
The Corporation also has obligations under its postretirement plan for health care and supplemental executive retirement plan as described in Note 14 to the consolidated financial statements. The postretirement benefit payments represent actuarially determined future benefit payments to eligible plan participants. The supplemental executive retirement plan allocates expenses over the participant’s service period. The Corporation reserves the right to terminate these plans at any time.
28
Table of Contents
Commitments to extend credit, including loan commitments, standby letters of credit, and commercial letters of credit do not necessarily represent future cash requirements since these commitments often expire without being drawn upon. Further discussion of these commitments is included in Note 19 to the consolidated financial statements.
Applications of Critical Accounting Policies
The Corporation’s consolidated financial statements are prepared in accordance with U.S. generally accepted accounting principles and follow general practices within the industries in which it operates. Application of these principles requires management to make estimates or judgments that affect the amounts reported in the financial statements and accompanying notes. These estimates are based on information available as of the date of the financial statements; accordingly, as this information changes, the financial statements could reflect different estimates or judgments. Certain policies inherently have a greater reliance on the use of estimates, and as such have a greater possibility of producing results that could be materially different than originally reported. Estimates or judgments are necessary when assets and liabilities are required to be recorded at fair value, when a decline in the value of an asset not carried on the financial statements at fair value warrants an impairment write-down or valuation reserve to be established, or when an asset or liability needs to be recorded contingent upon a future event. Carrying assets and liabilities at fair value inherently results in more financial statement volatility. The fair values and the information used to record valuation adjustments for certain assets and liabilities are based either on quoted market prices or are provided by other third party sources, when available. When third-party information is not available, valuation adjustments are estimated in good faith by management primarily through the use of internal cash flow modeling techniques.
The most significant accounting policies used by the Corporation are presented in Note 1 to the consolidated financial statements. These policies, along with the disclosures presented in the other financial statement notes and in this financial review, provide information on how significant assets and liabilities are valued in the financial statements and how those values are determined. Management views critical accounting policies to be those which are highly dependent on subjective or complex judgments, estimates and assumptions, and where changes in those estimates and assumptions could have a significant impact on the financial statements. Management currently views the determination of the allowance for loan losses and fair value of securities to be critical accounting policies.
“Safe Harbor” Statement Under the Private Securities Litigation Reform Act of 1995
The statements above which are not historical fact are forward looking statements that involve risks and uncertainties, including, but not limited to, the interest rate environment, the effect of federal and state banking and tax regulations, the effect of economic conditions, the impact of competitive products and pricing, and other risks detailed in the Corporation’s Securities and Exchange Commission filings.
ITEM 7A QUANTITATIVE AND QUALITATIVE DISCLOSURES ABOUT MARKET RISK
Market risk is the risk of loss arising from adverse changes in the fair value of financial instruments due to changes in interest rates, exchange rates, and equity prices. As a financial institution, the Corporation is primarily sensitive to the interest rate risk component. Changes in interest rates will
29
Table of Contents
affect the levels of income and expense recorded on a large portion of the Bank’s assets and liabilities. Additionally, such fluctuations in interest rates will impact the market value of all interest sensitive assets. The Asset/Liability Committee (ALCO) is responsible for reviewing the interest rate sensitivity position and establishing policies to control exposure to interest rate fluctuations. The primary goal established by this policy is to increase total income within acceptable risk limits.
The Corporation monitors interest rate risk through the use of two models: earnings simulation and static gap. Each model standing alone has limitations; however, taken together they represent a reasonable view of the Corporation’s interest rate risk position.
STATIC GAP: Gap analysis is intended to provide an approximation of projected repricing of assets and liabilities at a point in time on the basis of stated maturities, prepayments, and scheduled interest rate adjustments within selected time intervals. A gap is defined as the difference between the principal amount of assets and liabilities which reprice within those time intervals. The cumulative one year gap at December 31, 2009 was (0.60%) of total earning assets compared to policy guidelines of plus or minus 15.0%. The ratio was 1.42% at December 31, 2008.
Fixed rate securities, loans and CDs are included in the gap repricing based on time remaining until maturity. Mortgage prepayments are included in the time frame in which they are expected to be received.
Certain shortcomings are inherent in the method of analysis presented in Static Gap. For example, although certain assets and liabilities may have similar maturities or periods to repricing, they may not react correspondingly to changes in market interest rates. Also, the interest rates on certain types of assets and liabilities may fluctuate with changes in market interest rates, while interest rates on other types of assets may lag behind changes in market rates. Additionally, certain assets, such as adjustable-rate loans, have features, like annual and lifetime rate caps, which restrict changes in interest rates both on a short-term basis and over the life of the asset. Further, in the event of a change in interest rates, prepayment and early withdrawal levels would likely deviate from those assumed in the table. Finally, the ability of certain borrowers to make scheduled payments on their adjustable-rate loans may decrease in the event of an interest rate increase.
EARNINGS SIMULATION: This model forecasts the projected change in net income resulting from an increase or decrease in the level of interest rates. The model assumes a one time shock of plus or minus 200 basis points or 2%.
The model makes various assumptions about cash flows and reinvestments of these cash flows in the different rate environments. Generally, repayments, maturities and calls are assumed to be reinvested in like instruments and no significant change in the balance sheet mix is assumed. Actual results could differ significantly from these estimates which would produce significant differences in the calculated projected change in income. The limits stated above do not necessarily represent measures that would be taken by management in order to stabilize income results. The instruments on the balance sheet do react at different speeds to various changes in interest rates as discussed under Static Gap. In addition, there are strategies available to management that minimize the decline in income caused by a rapid rise in interest rates.
30
Table of Contents
The following table below summarizes the information from the interest rate risk measures reflecting rate sensitive assets to rate sensitive liabilities at December 31, 2009 and 2008:
| 2009 | 2008 | |||||
| Static 1-Yr. Cumulative Gap |
(0.60 | %) | 1.42 | % | ||
| Earnings Simulation: |
||||||
| -200 bps vs. Stable Rate |
14.43 | % | 6.28 | % | ||
| +200 bps vs. Stable Rate |
(6.57 | %) | (10.59 | %) | ||
The interest rate sensitivity position at December 31, 2009 was close to neutral but slightly liability sensitive in the short-term. Management measures the potential impact of significant changes in interest rates on both earnings and equity. By the use of computer generated models, the potential impact of these changes has been determined to be acceptable with modest effects on net income and equity given an interest rate shock of an increase or decrease in rates of 2.0%. We continue to monitor the interest rate sensitivity through the ALCO and use the data to make strategic decisions.
31
Table of Contents
ITEM 8. FINANCIAL STATEMENTS AND SUPPLEMENTARY DATA
CONSOLIDATED BALANCE SHEETS
Dollars in thousands
| December 31, |
||||||||
| 2009 | 2008 | |||||||
| ASSETS |
| |||||||
| Cash and due from banks |
$ | 19,959 | $ | 28,414 | ||||
| Interest bearing deposits with other banks |
2,399 | 2,783 | ||||||
| Federal funds sold |
- | 59 | ||||||
| Total cash and cash equivalents |
22,358 | 31,256 | ||||||
| Interest bearing time deposits with other banks |
6,388 | 6,515 | ||||||
| Securities available for sale |
345,415 | 237,289 | ||||||
| Trading securities |
955 | 892 | ||||||
| Loans held for sale |
1,218 | 3,332 | ||||||
| Loans |
718,022 | 676,152 | ||||||
| Less: unearned discount |
(2,880 | ) | (4,596 | ) | ||||
| Less: allowance for loan losses |
(9,795 | ) | (8,719 | ) | ||||
| Net loans |
705,347 | 662,837 | ||||||
| FHLB and other equity interests |
6,907 | 5,815 | ||||||
| Premises and equipment, net |
23,355 | 23,578 | ||||||
| Bank owned life insurance |
16,440 | 15,720 | ||||||
| Mortgage servicing rights |
876 | 552 | ||||||
| Goodwill |
10,821 | 10,821 | ||||||
| Other intangible assets |
85 | 185 | ||||||
| Accrued interest receivable and other assets |
21,426 | 17,726 | ||||||
| TOTAL ASSETS |
$ | 1,161,591 | $ | 1,016,518 | ||||
| LIABILITIES AND SHAREHOLDERS’ EQUITY |
| |||||||
| Non-interest bearing deposits |
$ | 116,310 | $ | 97,999 | ||||
| Interest bearing deposits |
840,548 | 716,597 | ||||||
| Total deposits |
956,858 | 814,596 | ||||||
| Treasury, tax and loan borrowings |
1,380 | 719 | ||||||
| FHLB and other borrowings |
100,003 | 107,478 | ||||||
| Subordinated debentures |
20,620 | 20,620 | ||||||
| Accrued interest payable and other liabilities |
13,321 | 10,638 | ||||||
| Total liabilities |
1,092,182 | 954,051 | ||||||
| Common stock, $0 par value; authorized 50,000,000 shares; issued 9,233,750 shares |
- | - | ||||||
| Additional paid in capital |
12,631 | 12,913 | ||||||
| Retained earnings |
68,676 | 65,890 | ||||||
| Treasury stock, at cost (472,477 shares for 2009 and 637,694 shares for 2008) |
(7,023 | ) | (9,332 | ) | ||||
| Accumulated other comprehensive loss |
(4,875 | ) | (7,004 | ) | ||||
| Total shareholders’ equity |
69,409 | 62,467 | ||||||
| TOTAL LIABILITIES AND SHAREHOLDERS’ EQUITY |
$ | 1,161,591 | $ | 1,016,518 | ||||
See Notes to Consolidated Financial Statements
32
Table of Contents
CONSOLIDATED STATEMENTS OF INCOME
Dollars in thousands, except per share data
| Year ended December 31, |
||||||||||||
| 2009 | 2008 | 2007 | ||||||||||
| INTEREST AND DIVIDEND INCOME: |
||||||||||||
| Loans including fees |
$ | 45,839 | $ | 47,355 | $ | 44,559 | ||||||
| Deposits with banks |
215 | 429 | 492 | |||||||||
| Federal funds sold |
- | 342 | 334 | |||||||||
| Securities: |
||||||||||||
| Taxable |
7,687 | 7,419 | 6,669 | |||||||||
| Tax-exempt |
2,095 | 1,414 | 1,457 | |||||||||
| Dividends |
34 | 224 | 422 | |||||||||
| Total interest and dividend income |
55,870 | 57,183 | 53,933 | |||||||||
| INTEREST EXPENSE: |
||||||||||||
| Deposits |
13,091 | 14,956 | 18,087 | |||||||||
| Borrowed funds |
4,527 | 4,609 | 3,510 | |||||||||
| Subordinated debentures |
850 | 1,018 | 1,325 | |||||||||
| Total interest expense |
18,468 | 20,583 | 22,922 | |||||||||
| NET INTEREST INCOME |
37,402 | 36,600 | 31,011 | |||||||||
| PROVISION FOR LOAN LOSSES |
4,465 | 3,787 | 1,512 | |||||||||
| NET INTEREST INCOME AFTER PROVISION FOR LOAN LOSSES |
32,937 | 32,813 | 29,499 | |||||||||
| NON-INTEREST INCOME: |
||||||||||||
| Trust and asset management fees |
905 | 1,161 | 1,128 | |||||||||
| Service charges on deposit accounts |
4,309 | 4,335 | 4,250 | |||||||||
| Other service charges and fees |
1,322 | 1,405 | 1,045 | |||||||||
| Net realized losses from sales of securities for which fair value was elected |
- | (602 | ) | - | ||||||||
| Net unrealized gains (losses) on securities for which fair value was elected |
63 | (2,471 | ) | - | ||||||||
| Mortgage banking |
1,058 | 447 | 347 | |||||||||
| Bank owned life insurance |
720 | 621 | 615 | |||||||||
| Wealth management |
546 | 724 | 622 | |||||||||
| Other |
845 | 716 | 581 | |||||||||
| 9,768 | 6,336 | 8,588 | ||||||||||
| Total other-than-temporary impairment losses on available-for-sale securities |
(610 | ) | (3,963 | ) | (900 | ) | ||||||
| Less portion of loss recognized in other comprehensive loss |
1,833 | - | - | |||||||||
| Net impairment losses recognized in earnings |
(2,443 | ) | (3,963 | ) | (900 | ) | ||||||
| Net realized gains on available-for-sale securities |
395 | 117 | 501 | |||||||||
| Net impairment losses recognized in earnings and realized gains on available-for-sale securities |
(2,048 | ) | (3,846 | ) | (399 | ) | ||||||
| Total non-interest income |
7,720 | 2,490 | 8,189 | |||||||||
| NON-INTEREST EXPENSES: |
||||||||||||
| Salaries |
10,403 | 10,376 | 9,207 | |||||||||
| Employee benefits |
4,257 | 4,404 | 3,987 | |||||||||
| Net occupancy expense |
4,071 | 3,856 | 3,271 | |||||||||
| Data processing |
2,488 | 2,453 | 2,075 | |||||||||
| State and local taxes |
908 | 1,113 | 1,019 | |||||||||
| Legal, professional and examination fees |
897 | 798 | 722 | |||||||||
| Advertising |
620 | 792 | 680 | |||||||||
| FDIC insurance |
1,747 | 465 | 75 | |||||||||
| Intangible asset amortization |
100 | 100 | 100 | |||||||||
| Directors fees and benefits |
502 | 683 | 381 | |||||||||
| Other |
3,798 | 3,761 | 3,756 | |||||||||
| Total non-interest expenses |
29,791 | 28,801 | 25,273 | |||||||||
| INCOME BEFORE INCOME TAXES |
10,866 | 6,502 | 12,415 | |||||||||
| INCOME TAX EXPENSE |
2,354 | 1,267 | 3,281 | |||||||||
| NET INCOME |
$ | 8,512 | $ | 5,235 | $ | 9,134 | ||||||
| EARNINGS PER SHARE: |
||||||||||||
| Basic |
$ | 0.98 | $ | 0.61 | $ | 1.05 | ||||||
| Diluted |
$ | 0.98 | $ | 0.61 | $ | 1.05 | ||||||
See Notes to Consolidated Financial Statements
33
Table of Contents
CONSOLIDATED STATEMENTS OF CASH FLOWS
Dollars in thousands
| December 31, |
||||||||||||
| 2009 | 2008 | 2007 | ||||||||||
| CASH FLOWS FROM OPERATING ACTIVITIES: |
||||||||||||
| Net income |
$ | 8,512 | $ | 5,235 | $9,134 | |||||||
| Adjustments to reconcile net income to net cash provided by operations: |
||||||||||||
| Provision for loan losses |
4,465 | 3,787 | 1,512 | |||||||||
| Depreciation and amortization |
1,997 | 1,881 | 1,721 | |||||||||
| Amortization, accretion and deferred loan fees and costs |
1,240 | 543 | (638 | ) | ||||||||
| Deferred taxes |
(1,746 | ) | (1,319 | ) | (272 | ) | ||||||
| Net impairment losses realized in earnings and gains on sales of available-for-sale securities |
2,048 | 3,846 | 399 | |||||||||
| Net realized and unrealized (gains) losses on securities for which fair value was elected |
(63 | ) | 3,073 | - | ||||||||
| Gain on sale of loans |
(931 | ) | (331 | ) | (242 | ) | ||||||
| Net gains on dispositions of premises and equipment and foreclosed assets |
(24 | ) | (66 | ) | (92 | ) | ||||||
| Proceeds from sale of loans |
50,507 | 12,532 | 11,518 | |||||||||
| Origination of loans held for sale |
(49,717 | ) | (14,057 | ) | (10,792 | ) | ||||||
| Increase in bank owned life insurance |
(720 | ) | (621 | ) | (615 | ) | ||||||
| Stock-based compensation expense |
122 | 147 | 94 | |||||||||
| Changes in: |
||||||||||||
| Accrued interest receivable and other assets |
(3,615 | ) | (1,178 | ) | (663 | ) | ||||||
| Accrued interest payable and other liabilities |
2,859 | 82 | 1,583 | |||||||||
| NET CASH PROVIDED BY OPERATING ACTIVITIES |
14,934 | 13,554 | 12,647 | |||||||||
| CASH FLOWS FROM INVESTING ACTIVITIES: |
||||||||||||
| Net decrease (increase) in interest bearing time deposits with other banks |
127 | (3,017 | ) | 799 | ||||||||
| Proceeds from maturities, prepayments and calls of securities |
89,371 | 64,092 | 49,848 | |||||||||
| Proceeds from sales of securities |
107,561 | 17,423 | 3,953 | |||||||||
| Purchase of securities |
(305,099 | ) | (166,057 | ) | (70,814 | ) | ||||||
| Loan origination and payments, net |
(45,544 | ) | (74,512 | ) | (53,515 | ) | ||||||
| Redemption (purchase) of FHLB and other equity interests |
(1,092 | ) | 19 | (513 | ) | |||||||
| Purchase of premises and equipment |
(1,479 | ) | (5,405 | ) | (4,984 | ) | ||||||
| Proceeds from the sale of premises and equipment and foreclosed assets |
696 | 287 | 328 | |||||||||
| NET CASH USED IN INVESTING ACTIVITIES |
(155,459 | ) | (167,170 | ) | (74,898 | ) | ||||||
| CASH FLOWS FROM FINANCING ACTIVITIES: |
||||||||||||
| Net change in: |
||||||||||||
| Checking, money market and savings accounts |
162,670 | 154,405 | 41,133 | |||||||||
| Certificates of deposit |
(20,408 | ) | 1,034 | (13,298 | ) | |||||||
| Treasury stock purchased |
- | (659 | ) | (6,115 | ) | |||||||
| Proceeds from sale of treasury stock |
1,144 | 982 | 1,074 | |||||||||
| Proceeds from exercise of stock options, including tax benefit |
761 | - | 79 | |||||||||
| Cash dividends paid |
(5,726 | ) | (5,525 | ) | (5,395 | ) | ||||||
| Proceeds from long-term borrowings |
625 | 8,500 | 65,000 | |||||||||
| Repayments on long-term borrowings |
(4,600 | ) | (4,022 | ) | (22,250 | ) | ||||||
| Issue of subordinated debentures |
- | - | 20,000 | |||||||||
| Repayment of subordinated debentures |
- | - | (10,000 | ) | ||||||||
| Net change in short-term borrowings |
(2,839 | ) | 3,719 | (2,635 | ) | |||||||
| NET CASH PROVIDED BY FINANCING ACTIVITIES |
131,627 | 158,434 | 67,593 | |||||||||
| NET (DECREASE) INCREASE IN CASH AND CASH EQUIVALENTS |
(8,898 | ) | 4,818 | 5,342 | ||||||||
| CASH AND CASH EQUIVALENTS, Beginning |
31,256 | 26,438 | 21,096 | |||||||||
| CASH AND CASH EQUIVALENTS, Ending |
$ | 22,358 | $ | 31,256 | $ | 26,438 | ||||||
| SUPPLEMENTAL DISCLOSURE OF CASH FLOW INFORMATION: |
||||||||||||
| Cash paid during the period for: |
||||||||||||
| Interest |
$ | 18,552 | $ | 20,679 | $ | 22,999 | ||||||
| Income taxes |
$ | 2,484 | $ | 3,968 | $ | 3,360 | ||||||
| SUPPLEMENTAL NONCASH DISCLOSURES: |
||||||||||||
| Transfers to other real estate owned |
$ | 253 | $ | 375 | $ | 571 | ||||||
| Sales of securities, proceeds not settled |
$ | - | $ | - | $ | 7,781 | ||||||
| Loans transferred from held for sale to held for investment |
$ | 1,736 | $ | - | $ | - | ||||||
| Grant of restricted stock awards from treasury stock |
$ | 198 | $ | 177 | $ | 179 | ||||||
| Adjustment to initially apply Fair Value Option, transfer of securities available for sale to trading securities |
$ | - | $ | 7,018 | $ | - | ||||||
See Notes to Consolidated Financial Statements
34
Table of Contents
CONSOLIDATED STATEMENTS OF CHANGES IN SHAREHOLDERS’ EQUITY
FOR THE YEARS ENDED DECEMBER 31, 2009, 2008, AND 2007
Dollars in thousands, except share data
| Additional Paid-In Capital |
Retained Earnings |
Treasury Stock |
Accumulated Other Comprehensive Income (Loss) |
Total Share- holders' Equity | |||||||||||
| Balance, January 1, 2007 |
$ | 13,250 | $ | 62,957 | $ | (5,271) | $ | 1,343 | $ | 72,279 | |||||
| Comprehensive income: |
|||||||||||||||
| Net income for 2007 |
9,134 | 9,134 | |||||||||||||
| Other comprehensive loss: |
|||||||||||||||
| Net change in unrealized gains on available for sale securities, net of reclassification and taxes of ($1,045) |
(1,940) | (1,940) | |||||||||||||
| Change in actuarial gain, net of amortization and tax effects for post-employment health care plan, net of tax of $39 |
73 | 73 | |||||||||||||
| Total other comprehensive loss |
(1,867) | ||||||||||||||
| Total comprehensive income |
7,267 | ||||||||||||||
| Restricted stock award grants (11,929 shares) |
(179) | 179 | |||||||||||||
| Exercise of stock options (8,750 shares) |
(52) | 131 | 79 | ||||||||||||
| Stock based compensation expense |
94 | 94 | |||||||||||||
| Treasury stock: |
|||||||||||||||
| Purchase (406,695 shares) |
(6,115) | (6,115) | |||||||||||||
| Reissue (75,613 shares) |
(55) | 1,129 | 1,074 | ||||||||||||
| Cash dividends declared ($0.62 per share) |
(5,395) | (5,395) | |||||||||||||
| Balance, December 31, 2007 |
13,058 | 66,696 | (9,947) | (524) | 69,283 | ||||||||||
| Adjustment to initially apply Fair Value Option, net of tax |
(516) | 516 | |||||||||||||
| Comprehensive income: |
|||||||||||||||
| Net income for 2008 |
5,235 | 5,235 | |||||||||||||
| Other comprehensive loss: |
|||||||||||||||
| Net change in unrealized losses on available for sale securities, net of reclassification and taxes of ($3,464) |
(6,434) | (6,434) | |||||||||||||
| Change in actuarial gain, net of amortization and tax effects for post-employment health care plan, net of tax of $53 |
98 | 98 | |||||||||||||
| Change in fair value of interest rate swap agreement designated as a cash flow hedge, net of tax of ($355) |
(660) | (660) | |||||||||||||
| Total other comprehensive loss |
(6,996) | ||||||||||||||
| Total comprehensive loss |
(1,761) | ||||||||||||||
| Restricted stock award grants (12,433 shares) |
(177) | 177 | |||||||||||||
| Stock based compensation expense |
147 | 147 | |||||||||||||
| Treasury stock: |
|||||||||||||||
| Purchase (47,469 shares) |
(659) | (659) | |||||||||||||
| Reissue (77,290 shares) |
(115) | 1,097 | 982 | ||||||||||||
| Cash dividends declared ($0.645 per share) |
(5,525) | (5,525) | |||||||||||||
| Balance, December 31, 2008 |
12,913 | 65,890 | (9,332) | (7,004) | 62,467 | ||||||||||
| Comprehensive income: |
|||||||||||||||
| Net income for 2009 |
8,512 | 8,512 | |||||||||||||
| Other comprehensive loss: |
|||||||||||||||
| Net change in unrealized losses on available for sale securities, net of reclassification and taxes of $1,111 |
2,063 | 2,063 | |||||||||||||
| Change in actuarial gain, net of amortization and tax effects for post-employment health care plan, net of tax of ($74) |
(138) | (138) | |||||||||||||
| Change in fair value of interest rate swap agreement designated as a cash flow hedge, net of tax of $110 |
204 | 204 | |||||||||||||
| Total other comprehensive loss |
2,129 | ||||||||||||||
| Total comprehensive income |
10,641 | ||||||||||||||
| Restricted stock award grants (14,159 shares) |
(198) | 198 | |||||||||||||
| Forfeiture of restricted stock award grants (1,701 shares) |
17 | (17) | |||||||||||||
| Exercise of stock options (63,712 shares), including tax benefit |
(125) | 886 | 761 | ||||||||||||
| Stock based compensation expense |
122 | 122 | |||||||||||||
| Reissue of treasury stock (89,047 shares) |
(98) | 1,242 | 1,144 | ||||||||||||
| Cash dividends declared ($0.66 per share) |
(5,726) | (5,726) | |||||||||||||
| Balance, December 31, 2009 |
$ | 12,631 | $ | 68,676 | $ | (7,023) | $ | (4,875) | $ | 69,409 | |||||
See Notes to Consolidated Financial Statements
35
Table of Contents
Notes to Consolidated Financial Statements
1. Summary of Significant Accounting Policies
Unless otherwise indicated, amounts are in thousands, except per share data.
Business and Organization
CNB Financial Corporation (the “Corporation”) is headquartered in Clearfield, Pennsylvania, and provides a full range of banking and related services through its wholly-owned subsidiary, CNB Bank (the “Bank”), which also began doing business as ERIEBANK during 2005 in the Erie, Pennsylvania market area. In addition, the Bank provides trust services, including the administration of trusts and estates, retirement plans, and other employee benefit plans as well as a full range of wealth management services. The Bank serves individual and corporate customers and is subject to competition from other financial institutions and intermediaries with respect to these services. In addition to the Bank, the Corporation also entered the consumer discount loan and finance business in 2005 with its wholly-owned subsidiary, Holiday Financial Services Corporation (“Holiday”). The Corporation and its subsidiaries are subject to examination by federal and state regulators. The Corporation’s market area is primarily concentrated in the central and northwest regions of the Commonwealth of Pennsylvania.
Basis of Financial Presentation
The financial statements are consolidated to include the account of the Corporation and its subsidiaries, CNB Bank, CNB Securities Corporation, Holiday Financial Services Corporation, County Reinsurance Company, and CNB Insurance Agency. All significant intercompany accounts and transactions have been eliminated in the consolidated financial statements.
Use of Estimates
To prepare financial statements in conformity with U.S. generally accepted accounting principles, management makes estimates and assumptions based on available information. These estimates and assumptions affect the amounts reported in the financial statements and the disclosures provided, and actual results could differ. The allowance for loan losses, mortgage servicing rights, and fair values of financial instruments are particularly subject to change.
Operating Segments
While the chief decision-makers monitor the revenue streams of the various products and services, operations are managed and financial performance is evaluated on a Corporation-wide basis. Operating segments are aggregated into one as operating results for all segments are similar. Accordingly, all of the financial service operations are considered by management to be aggregated in one reportable operating segment.
Interest Bearing Time Deposits with Other Banks
Interest-bearing deposits in other financial institutions mature within one year and are carried at cost.
Securities
When purchased, securities are classified as held to maturity, trading or available for sale. Debt securities are classified as held to maturity when the Corporation has the positive intent and ability to
36
Table of Contents
hold the securities to maturity. Held to maturity securities are carried at amortized cost. Debt or equity securities are classified as trading when purchased principally for the purpose of selling them in the near term, or when the fair value option has been elected. Trading securities are recorded at fair value with changes in fair value included in earnings in non-interest income. Available for sale securities are those securities not classified as held to maturity or trading and are carried at their fair market value. Unrealized gains and losses, net of deferred tax, on securities classified as available for sale are recorded as other comprehensive income. Management has not classified any debt securities as held to maturity.
The amortized cost of debt securities classified as held to maturity or available for sale is adjusted for the amortization of premiums and the accretion of discounts over the period through contractual maturity or, in the case of mortgage-backed securities and collateralized mortgage obligations, over the estimated life of the security. Such amortization is included in interest income from securities. Gains and losses on securities sold are recorded on the trade date and based on the specific identification method.
Declines in the fair value of debt securities below their cost that are other than temporary and attributable to credit losses are reflected in earnings. Other-than-temporary impairment losses that are not attributable to credit losses are reported as a component of accumulated other comprehensive income. In estimating other-than-temporary losses, management considers: the length of time and extent that fair value has been less than cost, the financial condition and near term prospects of the issuer, and the Corporation’s intent to sell, or that it is more likely than not that it will be required to sell a security in an unrealized loss position before recovery of its amortized cost basis. If the Corporation intends to sell a security or it is more likely than not it will be required to sell a security before recovery of its amortized cost basis, the entire difference between amortized cost and fair value is recognized as impairment through earnings.
Loans
Loans that management has the intent and ability to hold for the foreseeable future or until maturity or payoff are reported at the principal balance outstanding, net of purchase premiums and discounts, unearned interest, deferred loan fees and costs, and an allowance for loan losses.
Interest income is reported on the interest method and includes amortization of net deferred loan fees and costs over the loan term. Interest income on mortgage and commercial loans is discontinued at the time the loan is 90 days delinquent unless the credit is well-secured and in process of collection. Consumer loans are typically charged off no later than 180 days past due. Past due status is based on the contractual terms of the loan. In all cases, loans are placed on nonaccrual or charged-off at an earlier date if collection of principal or interest is considered doubtful. Nonaccrual loans and loans past due 90 days still on accrual include both smaller balance homogeneous loans that are collectively evaluated for impairment and individually classified impaired loans. A loan is moved to non-accrual status in accordance with the Corporation’s policy, typically after 90 days of non-payment.
All interest accrued but not received for loans placed on nonaccrual is reversed against interest income. Interest received on such loans is accounted for on the cash-basis or cost-recovery method, until qualifying for return to accrual. Loans are returned to accrual status when all the principal and interest amounts contractually due are brought current and future payments are reasonably assured.
37
Table of Contents
Concentration of Credit Risk
Most of the Corporation’s business activity is with customers located within the Commonwealth of Pennsylvania. Therefore, the Corporation’s exposure to credit risk is significantly affected by changes in Pennsylvania’s economy.
Loans Held for Sale
Loans originated and intended for sale in the secondary market are carried at the lower of aggregate cost or fair value, as determined by outstanding commitments from investors. Net unrealized losses, if any, are recorded as a valuation allowance and charged to earnings.
Mortgage loans held for sale are generally sold with servicing rights retained. The carrying value of the mortgage loan sold is reduced by the amount allocated to the servicing right. Gains and losses on sales of mortgage loans are based on the difference between the selling price and the carrying value of the related loan sold.
Allowance for Loan Losses
The allowance for loan losses is a valuation allowance for probable incurred credit losses. Loan losses are charged against the allowance when management believes the uncollectibility of a loan balance is confirmed. Subsequent recoveries, if any, are credited to the allowance account.
Management determines the adequacy of the allowance based on historical patterns of charge-offs and recoveries, the nature and volume of the portfolio, information about specific borrower situations and estimated collateral values, industry experience, economic conditions, and other qualitative factors relevant to the collectability of the loan portfolio. While management believes that the allowance is adequate to absorb probable loan losses incurred at the balance sheet date, future adjustments may be necessary due to circumstances that differ substantially from the assumptions used in evaluating the adequacy of the allowance for loan losses.
The allowance consists of specific and general components. The specific component relates to loans that are individually classified as impaired or loans otherwise classified as substandard or doubtful. The general component covers non-classified loans and is based on historical loss experience adjusted for current factors.
A loan is impaired when, based on current information and events, it is probable that the Corporation will be unable to collect all amounts due according to the contractual terms of the loan agreement. Loans for which the terms have been modified, and for which the borrower is experiencing financial difficulties, are considered troubled debt restructurings and classified as impaired.
Commercial and commercial real estate loans are individually evaluated for impairment. If a loan is impaired, a portion of the allowance is allocated so that the loan is reported, net, at the present value of estimated future cash flows using the loan’s existing rate or at the fair value of collateral if repayment is expected solely from the collateral. Large groups of smaller balance homogeneous loans, such as consumer and residential real estate loans, are collectively evaluated for impairment, and accordingly, they are not separately identified for impairment disclosures. Troubled debt restructurings are measured at the present value of estimated future cash flows using the loan’s effective rate at inception and were not significant for any period presented.
38
Table of Contents
Federal Home Loan Bank (FHLB) Stock
As a member of the Federal Home Loan Bank of Pittsburgh (“FHLB”), the Corporation is required to purchase and hold stock in the FHLB to satisfy membership and borrowing requirements. This stock is restricted in that it can only be sold to the FHLB or to another member institution, and all sales of FHLB stock must be at par. As a result of these restrictions, FHLB stock is unlike other investment securities insofar as there is no trading market for FHLB stock and the transfer price is determined by FHLB membership rules and not by market participants.
As of December 31, 2009, the Corporation holds $5,401 of stock in FHLB. In December 2008, the FHLB voluntarily suspended dividend payments on its stock, as well as the repurchase of excess stock from members. The FHLB cited a significant reduction in the level of core earnings resulting from lower short-term interest rates, the increased cost of liquidity, and constrained access to the debt markets at attractive rates and maturities as the main reasons for the decision to suspend dividends and the repurchase of excess capital stock. The FHLB last paid a dividend in the third quarter of 2008.
FHLB stock is held as a long-term investment and its value is determined based on the ultimate recoverability of the par value. The Company evaluates impairment quarterly. The decision of whether impairment exists is a matter of judgment that reflects our view of the FHLB’s long-term performance, which includes factors such as the following:
| — | its operating performance; |
| — | the severity and duration of declines in the fair value of its net assets related to its capital stock amount; |
| — | its commitment to make payments required by law or regulation and the level of such payments in relation to its operating performance; |
| — | the impact of legislative and regulatory changes on the FHLB, and accordingly, on the members of FHLB; and |
| — | its liquidity and funding position |
After evaluating all of these considerations, the Corporation concluded that the par value of its investment in FHLB stock will be recovered. Accordingly, no impairment charge was recorded on these securities in 2009. Our evaluation of the factors described above in future periods could result in the recognition of impairment charges on FHLB stock.
Premises and Equipment
Premises and equipment are stated at cost less accumulated depreciation. Depreciation of premises and equipment is computed principally by the straight line method. In general, useful lives range from 3 to 39 years with lives for furniture, fixtures and equipment ranging from 3 to 10 years and lives of buildings and building improvements ranging from 15 to 39 years. Amortization of leasehold improvements is computed using the straight-line method over useful lives of the leasehold improvements or the term of the lease, whichever is shorter. Maintenance, repairs and minor renewals are charged to expense as incurred.
Foreclosed Assets
Assets acquired through or in lieu of loan foreclosure are initially recorded at fair value less estimated selling costs when acquired, establishing a new cost basis. If fair value declines, a valuation allowance is recorded through expense. Costs after acquisition are expensed.
39
Table of Contents
Bank Owned Life Insurance
The Corporation has purchased life insurance policies on certain key executives. Bank owned life insurance is recorded at the amount that can be realized under the insurance contract at the balance sheet date, which is the cash surrender value adjusted for other charges or other amounts due that are probable at settlement.
Goodwill and Other Intangible Assets
Goodwill resulting from business combinations prior to January 1, 2009 represents the excess of the purchase price over the fair value of the net assets of businesses acquired. Goodwill resulting from business combinations after January 1, 2009 represents the future economic benefits arising from other assets acquired that are not individually identified and separately recognized. Goodwill and intangible assets acquired in a purchase business combination and determined to have an indefinite useful life are not amortized, but tested for impairment at least annually. The Corporation has selected December 31 as the date to perform the annual impairment test. Intangible assets with definite useful lives are amortized over their estimated useful lives. Goodwill is the only intangible asset with an indefinite life on the Corporation’s balance sheet.
Other intangible assets consist of a customer relationship intangible related to Holiday. It was initially measured at fair value and then amortized over its useful life of 5 years on a straight line basis.
Long-term Assets
Premises and equipment, goodwill and other intangible assets, and other long-term assets are reviewed for impairment when events indicate their carrying amount may not be recoverable from future undiscounted cash flows. If impaired, the assets are recorded at fair value.
Loan Commitments and Related Financial Instruments
Financial instruments include off-balance sheet credit instruments, such as commitments to make loans and commercial letters of credit, issued to meet customer financing needs. The face amount for these items represents the exposure to loss, before considering customer collateral or ability to repay. Such financial instruments are recorded when they are funded.
Derivatives
Derivative financial instruments are recognized as assets or liabilities at fair value. The Corporation has an interest rate swap agreement, which is used as part of its asset liability management to help manage interest rate risk. The Corporation does not use derivatives for trading purposes.
At the inception of a derivative contract, the Corporation designates the derivative as one of three types based on the Corporation’s intentions and belief as to likely effectiveness as a hedge. These three types are (1) a hedge of the fair value of a recognized asset or liability or of an unrecognized firm commitment (“fair value hedge”), (2) a hedge of a forecasted transaction or the variability of cash flows to be received or paid related to a recognized asset or liability (“cash flow hedge”), or (3) an instrument with no hedging designation (“stand-alone derivative”). For a fair value hedge, the gain or loss on the derivative, as well as the offsetting loss or gain on the hedged item, are recognized in
40
Table of Contents
current earnings as fair values change. For a cash flow hedge, the gain or loss on the derivative is reported in other comprehensive income and is reclassified into earnings in the same periods during which the hedged transaction affects earnings. For both types of hedges, changes in the fair value of derivatives that are not highly effective in hedging the changes in fair value or expected cash flows of the hedged item are recognized immediately in current earnings. Changes in the fair value of derivatives that do not qualify for hedge accounting are reported currently in earnings, as noninterest income.
Net cash settlements on derivatives that qualify for hedge accounting are recorded in interest income or interest expense, based on the item being hedged. Net cash settlements on derivatives that do not qualify for hedge accounting are reported in noninterest income. Cash flows on hedges are classified in the cash flow statement the same as the cash flows of the items being hedged.
The Corporation formally documents the relationship between derivatives and hedged items, as well as the risk-management objective and the strategy for undertaking hedge transactions, at the inception of the hedging relationship. This documentation includes linking fair value or cash flow hedges to specific assets and liabilities on the balance sheet or to specific firm commitments or forecasted transactions. The Corporation also formally assesses, both at the hedge’s inception and on an ongoing basis, whether the derivative instruments that are used are highly effective in offsetting changes in fair values or cash flows of the hedged items. The Corporation discontinues hedge accounting when it determines that the derivative is no longer effective in offsetting changes in the fair value or cash flows of the hedged item, the derivative is settled or terminates, a hedged forecasted transaction is no longer probable, a hedged firm commitment is no longer firm, or treatment of the derivative as a hedge is no longer appropriate or intended.
When hedge accounting is discontinued, subsequent changes in fair value of the derivative are recorded as noninterest income. When a fair value hedge is discontinued, the hedged asset or liability is no longer adjusted for changes in fair value and the existing basis adjustment is amortized or accreted over the remaining life of the asset or liability. When a cash flow hedge is discontinued but the hedged cash flows or forecasted transactions are still expected to occur, gains or losses that were accumulated in other comprehensive income are amortized into earnings over the same periods which the hedged transactions will affect earnings.
Advertising Costs
Advertising costs are generally expensed as incurred and amounted to $620, $792, and $680, for 2009, 2008 and 2007, respectively.
Mortgage Servicing Rights
Servicing rights are recognized separately when they are acquired through sales of loans. Servicing rights are initially recorded at fair value with the income statement effect recorded in gains on sales of loans. Fair value is based on market prices for comparable mortgage servicing contracts, when available, or alternatively, is based on a valuation model that calculates the present value of estimated future net servicing income. The valuation model incorporates assumptions that market participants would use in estimating future net servicing income, such as the cost to service, the discount rate, the custodial earnings rate, an inflation rate, ancillary income, prepayment speeds and default rates and losses. The Corporation compares the valuation model inputs and results to published industry data in
41
Table of Contents
order to validate the model results and assumptions. All classes of servicing assets are subsequently measured using the amortization method which requires servicing rights to be amortized into non-interest income in proportion to, and over the period of, the estimated future net servicing income of the underlying loans.
Servicing rights are evaluated for impairment based upon the fair value of the rights as compared to carrying amount. Impairment is determined by stratifying rights into groupings based on predominant risk characteristics, such as interest rate, loan type and investor type. Impairment is recognized through a valuation allowance for an individual grouping, to the extent that fair value is less than the carrying amount. If the Corporation later determines that all or a portion of the impairment no longer exists for a particular grouping, a reduction of the allowance may be recorded as an increase to income. Changes in valuation allowances are reported with mortgage banking income on the income statement. The fair values of servicing rights are subject to significant fluctuations as a result of changes in estimated and actual prepayment speeds and default rates and losses.
Servicing fee income, which is reported on the income statement as mortgage banking income, is recorded for fees earned for servicing loans. The fees are based on a contractual percentage of the outstanding principal or a fixed amount per loan and are recorded as income when earned. The amortization of mortgage servicing rights is netted against loan servicing fee income. Servicing fees totaled $321, $290, and $285 for the years ended December 31, 2009, 2008 and 2007. Late fees and ancillary fees related to loan servicing are not material.
Treasury Stock
The purchase of the Corporation’s common stock is recorded at cost. Purchases of the stock are made both in the open market and through negotiated private purchases based on market prices. At the date of subsequent reissue, the treasury stock account is reduced by the cost of such stock on a first-in-first-out basis.
Stock-Based Compensation
The Corporation has a stock incentive plan for key employees and independent directors. The Stock Incentive Plan, which is administered by a committee of the Board of Directors, provides for up to 500,000 shares of common stock in the form of nonqualified options or restricted stock. For key employees, the plan vesting schedule is one-fourth of granted stock-based awards per year beginning one year after the grant date with 100% vested on the fourth anniversary. For independent directors, the vesting schedule is one-third of granted stock-based awards per year beginning one year after the grant date with 100% vested on the third anniversary.
At December 31, 2009 and 2008, there was no unrecognized compensation cost related to nonvested stock options granted under this plan, and no stock options were granted during the years then ended.
During 2009, 2008 and 2007, the Executive Compensation and Personnel Committee of the Board of Directors granted a total of 14,159, 12,433 and 11,929 shares, respectively, of restricted common stock to certain key employees and all independent directors of the Corporation. Compensation expense for the restricted stock awards is recognized over the requisite service period based on the fair value of the shares at the date of grant on a straight-line basis. Unearned restricted stock awards are recorded as a reduction of shareholders’ equity until earned. Compensation expense resulting from these restricted stock awards was $122, $147 and $94 for the years ended December 31, 2009, 2008 and 2007, respectively.
42
Table of Contents
Comprehensive Income
The Corporation presents comprehensive income as part of the Statement of Changes in Shareholders’ Equity. Other comprehensive income (loss) consists of unrealized holding gains (losses) on the available for sale securities portfolio, changes in the unrecognized actuarial gain and transition obligation related to the Corporation’s post retirement benefits plan, and changes in the fair value of the Corporation’s interest rate swap.
Income Taxes
The Corporation files a consolidated U. S. income tax return that includes all subsidiaries except County Reinsurance Company which files a separate return. Income tax expense is the total of the current year income tax due or refundable and the change in deferred tax assets and liabilities. Deferred tax assets and liabilities are the expected future tax amounts for the temporary differences between carrying amounts and tax bases of assets and liabilities, computed using enacted tax rates. A valuation allowance, if needed, reduces deferred tax assets to the amount expected to be realized.
A tax position is recognized as a benefit only if it is “more likely than not” that the tax position would be sustained in a tax examination, with a tax examination being presumed to occur. The amount recognized is the largest amount of tax benefit that is greater than 50% likely of being realized on examination. For tax positions not meeting the “more likely than not” test, no tax benefit is recorded.
The Corporation recognizes interest and/or penalties related to income tax matters in income tax expense.
Retirement Plans
The Corporation’s expense associated with its 401(k) plan is determined under the provisions of the plan document and includes both matching and profit sharing components. Deferred compensation and supplemental retirement plan expenses allocate the benefits over years of service.
Earnings Per Share
Basic earnings per share is computed by dividing net income available to common shareholders by the weighted average number of shares outstanding during the applicable period, excluding outstanding participating securities. Diluted earnings per share is computed using the weighted average number of shares determined for the basic computation plus the dilutive effect of potential common shares issuable under certain stock compensation plans. Unvested share-based payment awards that contain nonforfeitable rights to dividends or dividend equivalents (whether paid or unpaid) are participating securities and are included in the computation of earnings per share pursuant to the two-class method. The Corporation has determined that its outstanding non-vested stock awards are participating securities.
Cash and Cash Equivalents
For purposes of the consolidated statement of cash flows, the Corporation defines cash and cash equivalents as cash and due from banks, interest bearing deposits with other banks, and Federal funds sold. Net cash flows are reported for customer loan and deposit transactions, interest bearing time deposits with other banks and borrowings with original maturities of 90 days or less.
43
Table of Contents
Restrictions on Cash
The Bank is required to maintain average reserve balances with the Federal Reserve Bank or in vault cash. The average amount of these non-interest bearing reserve balances for the year ended December 31, 2009 and 2008, was $50, which was maintained in vault cash.
Loss Contingencies
Loss contingencies, including claims and legal actions arising in the ordinary course of business, are recorded as liabilities when the likelihood of loss is probable and an amount or range of loss can be reasonably estimated. Management does not believe there are any such matters that will have a material effect on the financial statements.
Fair Value of Financial Instruments
Fair values of financial instruments are estimated using relevant market information and other assumptions, as more fully disclosed in a separate note. Fair value estimates involve uncertainties and matters of significant judgment regarding interest rates, credit risk, prepayments, and other factors, especially in the absence of broad markets for particular items. Changes in assumptions or in market conditions could significantly affect the estimates.
Adoption of New Accounting Standards
Effective January 1, 2009, the Corporation adopted Accounting Standards Codification (“ASC”) 260-10, Determining Whether Instruments Granted in Share-Based Payment Transactions Are Participating Securities.” This standard provides that unvested share-based payment awards that contain nonforfeitable rights to dividends or dividend equivalents (whether paid or unpaid) are participating securities and shall be included in the computation of earnings per share pursuant to the two-class method. The Corporation has determined that its outstanding non-vested stock awards are participating securities. Accordingly, effective January 1, 2009, earnings per share is computed using the two-class method. All previously reported earnings per share data has been retrospectively adjusted to conform to the new computation method.
In April 2009, the Financial Accounting Standards Board (“FASB”) issued three standards intended to provide additional application guidance and enhance disclosures regarding fair value measurements and impairments of securities. ASC 820-10, Determining Fair Value When the Volume and Level of Activity for the Asset or Liability Have Significantly Decreased and Identifying Transactions That Are Not Orderly, provides guidelines for making consistent fair value measurements. ASC 825-10, Interim Disclosures about Fair Value of Financial Instruments, enhances consistency in financial reporting by increasing the frequency of fair value disclosures. ASC 320-10-65, Recognition and Presentation of Other-Than-Temporary Impairments, provides additional guidance designed to create greater clarity and consistency in accounting for and presenting impairment losses on securities and requires impairment of debt securities to be separated into (a) the amount of the total impairment related to credit loss, which is recognized in earnings, and (b) the amount of the total impairment related to all other factors, which is recognized in comprehensive income.
The total other-than-temporary impairment is presented in the income statement with an offset for the amount of total other-than-temporary impairment recognized in other comprehensive income. These
44
Table of Contents
standards are effective for interim and annual periods ending after June 15, 2009, but entities may adopt them for the interim and annual periods ending after March 15, 2009. The Corporation adopted these standards for its quarter ended June 30, 2009. As a result of implementing ASC 320-10-65, the amount of other-than-temporary impairment recognized in income for the three months ended June 30, 2009 was $240,000. Had the standard not been issued, the amount of other-than-temporary impairment that would have been recognized in income for the period would have been $1,420,000.
In June 2009, the FASB issued ASC 105-10, The FASB Accounting Standards Codification and the Hierarchy of Generally Accepted Accounting Principles – A Replacement of FASB Statement No. 162. This pronouncement establishes the FASB Accounting Standards Codification as the source of authoritative accounting principles recognized by the FASB to be applied by nongovernmental entities in the preparation of financial statements in conformity with generally accepted accounting principles (GAAP). Rules and interpretive releases of the Securities and Exchange Commission (SEC) under authority of federal securities laws are also sources of GAAP for SEC registrants. This standard is effective for financial statements issued for interim and annual periods ending after September 15, 2009. The adoption of this standard did not have a material effect on the Corporation’s results of operations or financial position.
Effect of Newly Issued But Not Yet Effective Accounting Standards
In June 2009, the FASB amended previous guidance relating to transfers of financial assets and eliminates the concept of a qualifying special purpose entity. This guidance must be applied as of the beginning of each reporting entity’s first annual reporting period that begins after November 15, 2009, for interim periods within that first annual reporting period and for interim and annual reporting periods thereafter. This guidance must be applied to transfers occurring on or after the effective date. Additionally, on and after the effective date, the concept of a qualifying special-purpose entity is no longer relevant for accounting purposes. Therefore, formerly qualifying special-purpose entities should be evaluated for consolidation by reporting entities on and after the effective date in accordance with the applicable consolidation guidance. The disclosure provisions were also amended and apply to transfers that occurred both before and after the effective date of this guidance. The effect of adopting this new guidance is not expected to be material to the Corporation’s financial statements.
In June 2009, the FASB amended guidance for consolidation of variable interest entity guidance by replacing the quantitative-based risks and rewards calculation for determining which enterprise, if any, has a controlling financial interest in a variable interest entity with an approach focused on identifying which enterprise has the power to direct the activities of a variable interest entity that most significantly impact the entity’s economic performance and (1) the obligation to absorb losses of the entity or (2) the right to receive benefits from the entity. Additional disclosures about an enterprise’s involvement in variable interest entities are also required. This guidance is effective as of the beginning of each reporting entity’s first annual reporting period that begins after November 15, 2009, for interim periods within that first annual reporting period, and for interim and annual reporting periods thereafter. Early adoption is prohibited. The effect of adopting this new guidance is not expected to be material to the Corporation’s financial statements.
45
Table of Contents
2. Earnings Per Share
The computation of basic and diluted earnings per share is shown below (in thousands, except share data). For the years ended December 31, 2009, 2008, and 2007, options to purchase 86,750, 166,125, and 110,500 shares of common stock were not considered in computing diluted earnings per share because they were anti-dilutive.
| Years Ended December 31 | ||||||||||||
| 2009 |
2008 |
2007 |
||||||||||
| Net income per consolidated statements of income |
$ | 8,512 | $ | 5,235 | $ | 9,134 | ||||||
| Net earnings allocated to participating securities |
(23 | ) | (17 | ) | (22 | ) | ||||||
| Net earnings allocated to common stock |
$ | 8,489 | $ | 5,218 | $ | 9,112 | ||||||
| Basic earnings per common share computation |
||||||||||||
| Distributed earnings allocated to common stock |
$ | 5,704 | $ | 5,507 | $ | 5,381 | ||||||
| Undistributed earnings allocated to common stock |
2,785 | (289 | ) | 3,731 | ||||||||
| Net earnings allocated to common stock |
$ | 8,489 | $ | 5,218 | $ | 9,112 | ||||||
| Weighted average common shares outstanding, including |
8,668 | 8,570 | 8,693 | |||||||||
| Less: Average participating securities |
(13 | ) | (23 | ) | (18 | ) | ||||||
| Weighted average shares |
8,655 | 8,547 | 8,675 | |||||||||
| Basic earnings per common share |
$ | 0.98 | $ | 0.61 | $ | 1.05 | ||||||
| Diluted earnings per common share computation |
||||||||||||
| Net earnings allocated to common stock |
$ | 8,489 | $ | 5,218 | $ | 9,112 | ||||||
| Weighted average common shares outstanding for basic earnings per common share |
8,655 | 8,547 | 8,675 | |||||||||
| Add: Dilutive effects of assumed exercises of stock options |
17 | 19 | 23 | |||||||||
| Weighted average shares and dilutive potential common shares |
8,672 | 8,566 | 8,698 | |||||||||
| Diluted earnings per common share |
$ | 0.98 | $ | 0.61 | $ | 1.05 | ||||||
3. Securities
Securities available-for-sale at December 31, 2009 and 2008 are as follows:
| December 31, 2009 | December 31, 2008 | |||||||||||||||||||
| Amortized Cost |
Unrealized | Fair Value |
Amortized Cost |
Unrealized | Fair Value | |||||||||||||||
| Gains |
Losses |
Gains |
Losses |
|||||||||||||||||
| U.S. Treasury |
$ 10,288 | $ 5 | $ (24 | ) | $ 10,269 | $ 10,059 | $ 257 | $ - | $ 10,316 | |||||||||||
| U.S. Gov’t sponsored entities |
107,615 | 94 | (748 | ) | 106,961 | 40,779 | 486 | (1 | ) | 41,264 | ||||||||||
| State & political subdivisions |
55,710 | 991 | (140 | ) | 56,561 | 54,467 | 667 | (719 | ) | 54,415 | ||||||||||
| Residential mortgage & asset backed |
144,878 | 1,188 | (666 | ) | 145,400 | 104,664 | 580 | (1,357 | ) | 103,887 | ||||||||||
| Corporate notes & bonds |
18,713 | - | (5,082 | ) | 13,631 | 28,694 | 31 | (6,032 | ) | 22,693 | ||||||||||
| Pooled trust preferred |
4,594 | - | (2,685 | ) | 1,909 | 7,080 | 37 | (4,038 | ) | 3,079 | ||||||||||
| Pooled SBA |
8,894 | 102 | (7 | ) | 8,989 | - | - | - | - | |||||||||||
| Other securities |
1,670 | 28 | (3 | ) | 1,695 | 1,670 | - | (35 | ) | 1,635 | ||||||||||
| Total |
$352,362 | $2,408 | $(9,355 | ) | $345,415 | $247,413 | $2,058 | $(12,182 | ) | $237,289 | ||||||||||
At December 31, 2009 and 2008, there were no holdings of securities by any one issuer, other than U.S. Government sponsored entities, in an amount greater than 10% of shareholders’ equity.
46
Table of Contents
Trading securities accounted for under the fair value option at December 31, 2009 and 2008 are as follows:
| December 31, | ||||||
| 2009 | 2008 | |||||
| Federal National Mortgage Association preferred stock |
$ | 56 | $ | 21 | ||
| Federal Home Loan Mortgage Corporation preferred stock |
46 | 10 | ||||
| Corporate equity securities |
853 | 861 | ||||
| Total |
$ | 955 | $ | 892 | ||
For the year ended December 31, 2007, the Corporation recognized a $900 charge for other-than-temporary decline in the fair value of its Federal National Mortgage Association (“FNMA”) securities since management did not believe that the securities would recover in value within a reasonable amount of time as a result of additional preferred stock that FNMA introduced to the capital markets in the fourth quarter of 2007. This security is being carried at fair value under the fair value option effective January 1, 2008.
Securities with unrealized losses at December 31, 2009 and 2008, aggregated by investment category and length of time that individual securities have been in a continuous unrealized loss position, are as follows:
| December 31, 2009 | Less than 12 Months | 12 Months or More | Total | ||||||||||||
| Description of Securities |
Fair |
Unrealized |
Fair |
Unrealized |
Fair |
Unrealized |
|||||||||
| U.S. Treasury |
$ 6,201 | $ (24 | ) | $ - | $ - | $ 6,201 | $ (24 | ) | |||||||
| U.S. Gov’t sponsored entities |
49,420 | (748 | ) | - | - | 49,420 | (748 | ) | |||||||
| State & political subdivisions |
9,865 | (103 | ) | 3,710 | (37 | ) | 13,575 | (140 | ) | ||||||
| Residential mortgage & asset backed |
68,293 | (644 | ) | 3,198 | (22 | ) | 71,491 | (666 | ) | ||||||
| Corporate notes & bonds |
- | - | 13,631 | (5,082 | ) | 13,631 | (5,082 | ) | |||||||
| Pooled trust preferred |
- | - | 1,909 | (2,685 | ) | 1,909 | (2,685 | ) | |||||||
| Pooled SBA |
1,009 | (7 | ) | - | - | 1,009 | (7 | ) | |||||||
| Other securities |
- | - | 146 | (3 | ) | 146 | (3 | ) | |||||||
| $134,788 | $(1,526 | ) | $22,594 | $(7,829 | ) | $157,382 | $(9,355 | ) | |||||||
| Less than 12 Months | 12 Months or More | Total | |||||||||||||
| Fair |
Unrealized |
Fair |
Unrealized |
Fair |
Unrealized |
||||||||||
| December 31, 2008 |
|||||||||||||||
| U.S. Treasury |
$ - | $ - | $ - | $ - | $ - | $ - | |||||||||
| U.S. Gov’t sponsored entities |
468 | (1 | ) | - | - | 468 | (1 | ) | |||||||
| State & political subdivisions |
18,217 | (599 | ) | 3,894 | (120 | ) | 22,111 | (719 | ) | ||||||
| Residential mortgage & asset backed |
35,572 | (312 | ) | 9,164 | (1,045 | ) | 44,736 | (1,357 | ) | ||||||
| Corporate notes & bonds |
2,985 | (71 | ) | 17,685 | (5,961 | ) | 20,670 | (6,032 | ) | ||||||
| Pooled trust preferred |
849 | (2,008 | ) | 970 | (2,030 | ) | 1,819 | (4,038 | ) | ||||||
| Other securities |
1,134 | (35 | ) | - | - | 1,134 | (35 | ) | |||||||
| $59,225 | $(3,026 | ) | $31,713 | $(9,156 | ) | $90,938 | $(12,182 | ) | |||||||
The Corporation evaluates securities for other-than-temporary impairment on a quarterly basis, or more frequently when economic or market conditions warrant such an evaluation.
47
Table of Contents
At December 31, 2009, management evaluated the structured pooled trust preferred securities for other-than-temporary impairment by estimating the cash flows expected to be received from each security within the collateral pool, taking into account estimated levels of deferrals and defaults by the underlying issuers, and discounting those cash flows at the appropriate accounting yield. Management also assumed that all issuers in deferral will default prior to their next payment date. Trust preferred collateral is deeply subordinated within issuers’ capital structures, so large recoveries are unlikely. Accordingly, management assumed 10% recoveries on bank collateral and none on collateral issued by other companies. Due to the current crisis in the U.S. economy, management also added a baseline default rate of 2% annually for the next two years to our default projections for specific issuers. This percentage represents the peak, post-war bank default rate that occurred at the height of the savings and loan crisis, which we believe is an accurate proxy for the current environment. Within the next two years, management expects that credit markets will normalize and that banks with the financial strength to survive will default at a .36% average annual rate, which represents Moody’s idealized default probability for BBB corporate credits, and is in line with historical bank failure rates.
Using this methodology, three of the Corporation’s structured pooled trust preferred securities were deemed to become other-than-temporarily impaired during the year ended December 31, 2009, and one structured pooled trust preferred securities was deemed to become other-than-temporarily impaired during the year ended December 31, 2008. The Corporation separated the other-than-temporary impairment related to these structured pooled trust preferred securities into (a) the amount of the total impairment related to credit loss, which is recognized in the income statement, and (b) the amount of the total impairment related to all other factors, which is recognized in other comprehensive income. The Corporation measured the credit loss component of other-than-temporary impairment based on the difference between the cost basis and the present value of cash flows expected to be collected. The amount of other-than-temporary impairment recognized in income and in total comprehensive income for the year ended December 31, 2009 was $2,415 and $1,833, respectively. The amount of other-than-temporary impairment recognized in income and in total comprehensive income for the year ended December 31, 2008 was $2,000, and $2,000, respectively.
In addition, Standard & Poors downgraded one of Corporation’s private label collateralized mortgage obligations from AAA to CCC during the third quarter of 2009 and, as a result, the Corporation evaluated this security for other-than-temporary impairment. The amount of other-than-temporary impairment recognized in income during the year ended December 31, 2009 was $28. Because of the continuing deterioration of fair value, as well as additional information about this security that was published in the fourth quarter of 2009, the security was sold in November 2009, resulting in a realized loss of $572.
The following table provides detailed information related to the Corporation’s structured pooled trust preferred securities as of and for the year ended December 31, 2009:
| Adjusted Cost |
Fair |
Unrealized |
Credit Losses | ||||||||||
| ALESCO Preferred Funding V, Ltd. |
$ | 1,240 | $ | 380 | $ | (860 | ) | $ | 760 | ||||
| ALESCO Preferred Funding XII, Ltd. |
1,213 | 187 | (1,026 | ) | 655 | ||||||||
| ALESCO Preferred Funding XVII, Ltd. |
- | - | - | 1,000 | |||||||||
| Preferred Term Securities XVI, Ltd. |
986 | 187 | (799 | ) | - | ||||||||
| MM Community Funding II, Ltd. |
1,155 | 1,155 | - | - | |||||||||
| Total |
$ | 4,594 | $ | 1,909 | $ | (2,685 | ) | $ | 2,415 | ||||
48
Table of Contents
A roll-forward of the other-than-temporary impairment amount related to credit losses for the year ended December 31, 2009 is as follows:
| Balance of credit losses on debt securities for which a portion of other-than-temporary impairment was recognized in other comprehensive income, beginning of period (as measured effective April 1, 2009 upon adoption of ASC 320-10-65) |
$ | - | |
| Additional credit loss for which other-than-temporary impairment was not previously recognized |
2,443 | ||
| Balance of credit losses on debt securities for which a portion of other-than-temporary impairment was recognized in other comprehensive income, end of period |
$ | 2,443 | |
At December 31, 2009, approximately 29% of the total unrealized losses relate to structured pooled trust preferred securities, primarily from issuers in the financial services industry, which are not currently trading in an active, open market with readily observable prices. As a result, these securities were classified within Level 3 of the valuation hierarchy. The fair values of these securities have been calculated using a discounted cash flow model and market liquidity premium. With the current market conditions, the assumptions used to determine the fair value of Level 3 securities has greater subjectivity due to the lack of observable market transactions. The fair values of these securities have declined due to the fact that subsequent offerings of similar securities pay a higher market rate of return. This higher rate of return reflects the increased credit and liquidity risks in the marketplace. Except as described above, based on management’s evaluation of the structured pooled trust preferred securities, the present value of the projected cash flows is sufficient for full repayment of the amortized cost of the securities and, therefore, it is believed that the decline in fair value is temporary due to current market conditions. However, without recovery of these securities, other-than-temporary impairments may occur in future periods.
For all of the securities that comprise corporate notes and bonds, management monitors publicly available financial information such as filings with the Securities and Exchange Commission in order to evaluate the securities for other-than-temporary impairment. For financial institution issuers, management also monitors information from quarterly “call” report filings that are used to generate Uniform Bank Performance Reports. When reviewing this information, management considers the financial condition and near term prospects of the issuer and whether downgrades by bond rating agencies have occurred. Management also considers the length of time and extent to which fair value has been less than cost and the intent and ability of the Corporation to retain its investment in the issuer for a period of time sufficient to allow for any anticipated recovery in fair value.
As of December 31, 2009 and 2008, management concluded that the previously mentioned securities were not other-than-temporarily impaired for the following reasons:
| — | There is no indication of any significant deterioration of the creditworthiness of the institutions that issued the securities. |
| — | The unrealized losses are predominantly attributable to liquidity disruptions within the credit markets and the generally stressed condition of the financial services industry. |
| — | All contractual interest payments on the securities have been received as scheduled, and no information has come to management’s attention through the processes previously described which would lead to a conclusion that future contractual payments will not be received timely. |
The Corporation does not intend to sell and it is not more likely than not that it will be required to sell the securities in an unrealized loss position before recovery of its amortized cost basis.
49
Table of Contents
The Corporation holds a subordinated corporate bond issued by Lehman Brothers Holdings (“Lehman”). On September 15, 2008, Lehman declared bankruptcy resulting in a significant decline in the market value of the Lehman bond below cost. Management of the Corporation has deemed the decline to be other-than-temporary and, accordingly, recognized a charge to earnings for the full amortized cost basis of the security of $1,963 during the year ended December 31, 2008.
On December 31, 2009 and 2008, securities carried at $112,282 and $113,847, respectively, were pledged to secure public deposits and for other purposes as provided by law.
The following is a schedule of the contractual maturity of securities available for sale, excluding equity securities, at December 31, 2009 and 2008:
| December 31, 2009 |
December 31, 2008 | |||||||
| Amortized Cost |
Fair Value |
Amortized Cost |
Fair Value | |||||
| 1 year or less |
$ 27,183 | $ 27,175 | $ 17,609 | $ 17,791 | ||||
| 1 year – 5 years |
74,532 | 74,608 | 43,630 | 44,062 | ||||
| 5 years – 10 years |
61,617 | 61,077 | 32,721 | 31,971 | ||||
| After 10 years |
42,482 | 35,460 | 47,119 | 37,943 | ||||
| 205,814 | 198,320 | 141,079 | 131,767 | |||||
| Residential mortgage & asset backed securities |
144,878 | 145,400 | 104,664 | 103,887 | ||||
| Total debt securities |
$350,692 | $343,720 | $245,743 | $235,654 | ||||
Mortgage and asset backed securities are not due at a single date; periodic payments are received based on the payment patterns of the underlying collateral.
Information pertaining to security sales is as follows:
| Year ended December 31 |
Proceeds | Gross Gains | Gross Losses | |||||
| 2009 |
$107,561 | $2,042 | $1,647 | |||||
| 2008 |
6,495 | 135 | 18 | |||||
| 2007 |
11,734 | 538 | 37 | |||||
The tax provision related to these net realized gains was $138, $41, and $175, respectively.
During 2008, the Corporation sold securities carried at fair value under the fair value option. Proceeds were $3,147, resulting in gross losses of $602.
Proceeds from sale in 2007 include a $7,781 receivable from brokers for securities sold on December 28, 2007 that settled on January 3, 2008. Net gains related to this transaction were $259.
50
Table of Contents
4. Loans
Total loans at December 31, 2009 and 2008 are summarized as follows:
| 2009 |
2008 | |||||
| Commercial, industrial, and agricultural |
$ | 240,357 | $ | 228,000 | ||
| Residential mortgage |
225,845 | 210,080 | ||||
| Commercial mortgage |
194,718 | 179,420 | ||||
| Consumer and other |
57,102 | 58,652 | ||||
| $ | 718,022 | $ | 676,152 | |||
At December 31, 2009 and 2008, net unamortized loan costs and fees of ($417) and ($343), respectively, have been included in the carrying value of loans.
The Corporation’s outstanding loans and related unfunded commitments are primarily concentrated within Central and Western Pennsylvania. The Bank attempts to limit concentrations within specific industries by utilizing dollar limitations to single industries or customers, and by entering into participation agreements with third parties. Collateral requirements are established based on management’s assessment of the customer.
Deposit accounts that have overdrawn their current balance, known as overdrafts, are reclassified to loans. Overdrafts included in loans are $391 in 2009 and $859 in 2008.
Impaired loans are as follows:
| 2009 |
2008 | |||||
| Loans with no allocated allowance for loan losses |
$ | 3,182 | $ | - | ||
| Loans with allocated allowance for loan losses |
10,880 | 4,850 | ||||
| $ | 14,062 | $ | 4,850 | |||
| Amount of the allowance for loan losses allocated |
$ | 1,409 | $ | 1,628 | ||
Average impaired loans outstanding during the years ended December 31, 2009, 2008, and 2007 were $10,812, $5,086, and $3,680, respectively. Interest income recognized during impairment and cash basis interest income recognized was not material in any year presented.
Nonaccrual loans and loans past 90 days still on accrual are as follows:
| 2009 |
2008 | |||||
| Loans past due over 90 days still on accrual |
$ | 584 | $ | 533 | ||
| Nonaccrual loans |
12,757 | 3,046 | ||||
Nonaccrual loans and loans past 90 days still on accrual include impaired loans and smaller balance homogeneous loans, such as residential mortgage and consumer loans, that are collectively evaluated for impairment.
51
Table of Contents
5. Allowance for Loan Losses
Transactions in the allowance for loan losses for the three years ended December 31, 2009, 2008, and 2007 are as follows:
| 2009 |
2008 |
2007 |
|||||||
| Balance, beginning of year |
$8,719 | $6,773 | $6,086 | ||||||
| Charge-offs |
(3,611 | ) | (2,044 | ) | (1,010 | ) | |||
| Recoveries |
222 | 203 | 185 | ||||||
| Net charge-offs |
(3,389 | ) | (1,841 | ) | (825 | ) | |||
| Provision for loan losses |
4,465 | 3,787 | 1,512 | ||||||
| Balance, end of year |
$9,795 | $8,719 | $6,773 | ||||||
6. Secondary Market Mortgage Activities
The following summarizes secondary market mortgage activities for the years ended December 31, 2009, 2008, and 2007:
| 2009 |
2008 |
2007 | |||||||
| Loans originated for resale, net of principal pay downs |
$ | 49,717 | $ | 13,473 | $ | 8,066 | |||
| Proceeds from sales of loans held for sale |
50,507 | 12,532 | 9,115 | ||||||
| Net gains on sales of loans held for sale |
931 | 331 | 242 | ||||||
| Loan servicing fees |
321 | 290 | 285 | ||||||
Total loans serviced for others was $105,386, $80,014, and $77,201 at December 31, 2009, 2008, and 2007, respectively.
The following summarizes activity for capitalized mortgage servicing rights for the years ended December 31, 2009, 2008, and 2007:
| 2009 |
2008 |
2007 |
|||||||
| Balance, beginning of year |
$552 | $457 | $446 | ||||||
| Additions |
519 | 269 | 191 | ||||||
| Amortization |
(195 | ) | (174 | ) | (180 | ) | |||
| Balance, end of year |
$876 | $552 | $457 | ||||||
The fair value of mortgage servicing rights is based on market prices for comparable mortgage servicing contracts, when available, or alternatively based on a valuation model that calculates the present value of estimated future net servicing income. The fair value of mortgage servicing rights was $1,001, $800, and 790 at December 31, 2009, 2008, and 2007, respectively. No valuation allowance is deemed necessary at December 31, 2009, 2008, or 2007.
52
Table of Contents
7. Premises and Equipment
The following summarizes premises and equipment at December 31, 2009 and 2008:
| 2009 |
2008 | |||||
| Land |
$ | 3,944 | $ | 3,927 | ||
| Premises and leasehold improvements |
21,257 | 21,187 | ||||
| Furniture and equipment |
15,711 | 15,327 | ||||
| Construction in progress |
1,075 | 106 | ||||
| 41,987 | 40,547 | |||||
| Less: accumulated depreciation |
18,632 | 16,969 | ||||
| Premises and equipment, net |
$ | 23,355 | $ | 23,578 | ||
Depreciation on premises and equipment amounted to $1,702 in 2009, $1,607 in 2008, and $1,441 in 2007.
The Corporation is committed under eleven noncancelable operating leases for facilities with initial or remaining terms in excess of one year. The minimum annual rental commitments under these leases at December 31, 2009 are as follows:
| 2010 |
$ | 333 | |
| 2011 |
317 | ||
| 2012 |
248 | ||
| 2013 |
174 | ||
| 2014 |
163 | ||
| Thereafter |
1,505 | ||
| $ | 2,740 | ||
Rental expense, net of rental income, charged to occupancy expense for 2009, 2008, and 2007 was $338, $345, and $247, respectively.
In December 2009, the Corporation entered into a sale-leaseback transaction for real estate used in the operations of one of its branch office locations. The lease term is seventeen years, with two automatic renewal terms of five years each. The Corporation sold the property for $1,200 but financed the entire sales amount. Because the buyer/lessor did not make an initial investment on the purchase of the real estate that is adequate to transfer the risks and rewards of ownership, the Corporation deferred the entire gain associated with this transaction which is included in accrued interest payable and other liabilities in the accompanying consolidated balance sheet. The gain will be recognized over the term of the loan under the installment method.
The minimum annual rental commitments under this lease at December 31, 2009 are as follows:
| 2010 |
$ | 112 | |
| 2011 |
112 | ||
| 2012 |
112 | ||
| 2013 |
112 | ||
| 2014 |
112 | ||
| Thereafter |
1,341 | ||
| $ | 1,901 | ||
53
Table of Contents
8. Foreclosed Assets
Foreclosed real estate is reported net of a valuation allowance. Activity for the years ended December 31, 2009, 2008, and 2007 is as follows:
| 2009 |
2008 |
2007 |
|||||||
| Balance, beginning of year |
$671 | $516 | $181 | ||||||
| Additions |
253 | 375 | 571 | ||||||
| Sales |
(672 | ) | (220 | ) | (236 | ) | |||
| Balance, end of year |
$252 | $671 | $516 | ||||||
Expenses related to foreclosed real estate include:
| 2009 |
2008 |
2007 |
|||||||
| Net loss (gain) on sale |
$(24 | ) | $(66 | ) | $(74 | ) | |||
| Operating expenses, net of rental income |
103 | 90 | 155 | ||||||
| $79 | $24 | $81 | |||||||
9. Goodwill and Intangible Assets
The change in the carrying amount of goodwill for the years ended December 31, 2009 and 2008 is as follows:
| 2009 |
2008 | |||||
| Balance, beginning of year |
$ | 10,821 | $ | 10,821 | ||
| Acquired during the year |
- | - | ||||
| Balance, end of year |
$ | 10,821 | $ | 10,821 | ||
Impairment exists when a reporting unit’s carrying value of goodwill exceeds its fair value, which is determined through a two-step impairment test. Step 1 includes the determination of the carrying value of our single reporting unit, including the existing goodwill and intangible assets, and estimating the fair value of the reporting unit. We determined the fair value of our reporting unit exceeded its carrying amount. If the carrying amount of the reporting unit exceeds its fair value, we are required to perform a second step to the impairment test.
The change in the carrying amount of acquired intangible assets is as follows for the years ended December 31, 2009, 2008, and 2007:
| 2009 |
2008 |
2007 |
||||||||||
| Balance, beginning of year |
$ | 3,652 | $ | 3,652 | $ | 3,652 | ||||||
| Acquired during the year |
- | - | - | |||||||||
| Accumulated amortization |
(3,567 | ) | (3,467 | ) | (3,367 | ) | ||||||
| Balance, end of year |
$ | 85 | $ | 185 | $ | 285 | ||||||
Aggregate amortization expense was $100 in each of the three years ended December 31, 2009, 2008, and 2007.
54
Table of Contents
In 2005, the Corporation acquired certain assets of a consumer discount and finance company which the Corporation operates as Holiday Financial Services Corporation. The purchase price was $2,408 for the performing loans and customers of the business. The purchase price resulted in the Corporation recording a $500 customer relationship intangible which is being amortized using the straight-line method over five years. Estimated amortization expense for the year ended December 31, 2010 is $85.
10. Deposits
The following table reflects time certificates of deposit accounts included in total deposits and their remaining maturities at December 31, 2009:
| Time deposits maturing: |
|||
| 2010 |
$ | 54,996 | |
| 2011 |
152,104 | ||
| 2012 |
71,318 | ||
| 2013 |
26,322 | ||
| 2014 |
11,043 | ||
| Thereafter |
7,451 | ||
| $ | 323,234 | ||
Certificates of deposit of $100 thousand or more totaled $111,770 and $110,849 at December 31, 2009 and 2008, respectively.
11. Borrowings
Borrowings include $1,380 and $719 of demand notes payable to the U.S. Treasury Department at December 31, 2009 and 2008, respectively. These notes are issued under the U.S. Treasury Department’s program of investing the treasury tax and loan account balances in interest bearing demand notes insured by depository institutions. These notes bear interest at a rate of .25 percent less than the average Federal funds rate as computed by the Federal Reserve Bank.
The Corporation has available one $9 million line of credit with an unaffiliated institution, with a floating rate of 30 day LIBOR plus 180 basis points and a floor of 3.50%, which was in effect at December 31, 2009. The outstanding balance on the line was $3,500 at December 31, 2009 and $5,000 at December 31, 2008.
55
Table of Contents
FHLB Borrowings
At December 31, 2009, the Bank had remaining borrowing capacity with the FHLB of $315 million. Borrowings with the FHLB are secured by a blanket pledge of selected securities in the amount of $104,173 and certain loans with a balance of $569,730. Borrowings from the FHLB at December 31, 2009 and 2008 are as follows:
| Interest Rate |
Maturity |
2009 |
2008 | |||||
| (a) |
05/04/09 | $ | - | $ | 4,500 | |||
| (b) |
05/03/10 | 4,500 | 4,500 | |||||
| (c) |
01/24/12 | 20,000 | 20,000 | |||||
| (d) |
03/22/12 | 10,000 | 10,000 | |||||
| (e) |
06/01/17 | 10,000 | 10,000 | |||||
| (f) |
08/07/17 | 5,000 | 5,000 | |||||
| (g) |
08/07/17 | 5,000 | 5,000 | |||||
| (h) |
08/07/17 | 10,000 | 10,000 | |||||
| (i) |
10/10/17 | 10,000 | 10,000 | |||||
| (j) |
07/07/23 | 700 | 700 | |||||
| (k) |
09/05/23 | 2,687 | 2,778 | |||||
| (l) |
06/11/24 | 616 | - | |||||
| $ | 78,503 | $ | 82,478 | |||||
(a), (b), (d), (j) – Fixed rate borrowings at interest rates of 4.35%, 4.43%, 5.63%, and 4.72%, respectively.
(c) – Interest rate was fixed for two years after which FHLB converted to a floating interest rate based on the 3 month LIBOR + 0.18% if the 3 month LIBOR is equal to or greater than 8.0%. The interest rate was 4.52% at December 31, 2009 and 2008.
(e) - Interest rate was fixed at 4.60% until June 2009 after which time FHLB has the option to convert to floating interest rate based on the 3 month LIBOR + 0.16%. The interest rate was 4.60% at December 31, 2009.
(f) - Interest rate was fixed at 4.02% until February 2008 after which time FHLB has the option to convert to a floating interest rate based on the 3 month LIBOR + 0.11%. The interest rate was 4.02% at December 31, 2009 and 2008.
(g) - Interest rate was fixed at 4.10% until August 2008 after which time FHLB has the option to convert to a floating interest rate based on the 3 month LIBOR + 0.11%. The interest rate was 4.10% at December 31, 2009 and 2008.
(h) - Interest rate is fixed at 4.47% until August 2010 after which time FHLB has the option to convert to a floating interest rate based on the 3 month LIBOR + 0.11%.
(i) - Interest rate was fixed at 3.97% until October 2009 after which time FHLB has the option to convert to a floating interest rate based on the 3 month LIBOR + 0.10%. The interest rate was 3.97% at December 31, 2009.
(k) - Fixed rate borrowing at an interest rate of 4.31%, with monthly principal and interest payments and a balloon payment due at maturity.
(l) – Fixed rate borrowing at an interest rate of 5.24%, with monthly principal and interest payments and a balloon payment due at maturity.
The terms of borrowings (a) through (j) are interest only payments with principal due at maturity.
Each advance is payable at its maturity date, with a prepayment penalty for fixed rate advances.
56
Table of Contents
Other Borrowings
The Bank entered into a borrowing transaction with an unaffiliated institution. The proceeds of this borrowing were $10,000 and, as part of this transaction, the Bank pledged certain securities which had a carrying amount of $12,634 at December 31, 2009. The borrowing has a maturity date of March 20, 2017 and a variable interest rate of 3 month LIBOR minus 1.0% through March 20, 2008, at which time the interest rate became fixed as defined. The borrowing is callable by the issuer at the end of each quarter until maturity. The interest rate at December 31, 2008 was 4.50%. In March 2009, the interest rate increased to 4.65% until March 2010 when it increases to 5.25% through the term of the borrowing.
In July 2009, Holiday entered into an unsecured line of credit facility with an unaffiliated institution having a maximum borrowing capacity of $15,000. Each separate borrowing under the facility bears interest at a floating rate determined at the time of the borrowing, as defined in the agreement, and matures in July 2010. As of December 31, 2009, Holiday had three separate borrowings, two at $2,500 each and a $500 borrowing at an interest rate of 2.43% until June 2010 and one borrowing of $2,500 at an interest rate of 1.53% until January 2010. As of December 31, 2008, Holiday had three separate borrowings of $2,500 each at an interest rate of 5.08% until April 2009 and one borrowing of $2,500 at an interest rate of 2.29% until January 2009.
Subordinated Debentures
In 2007, the Corporation issued two $10,000 floating rate trust preferred securities as part of a pooled offering of such securities. The interest rate on each offering is determined quarterly and floats based on the 3 month LIBOR plus 1.55% and was 1.80% and 3.55% at December 31, 2009 and 2008, respectively. The Corporation issued subordinated debentures to the trusts in exchange for the proceeds of the offerings, which debentures represent the sole assets of the trusts. The subordinated debentures must be redeemed no later than 2037. The Corporation may redeem the debentures, in whole or in part, at face value after June 15, 2012 for the first offering and September 15, 2012 for the second offering. The Corporation has the option to defer interest payments from time to time for a period not to exceed five consecutive years.
Because the trusts are not consolidated with the Corporation, the Corporation does not report the securities issued by the trusts as liabilities. Instead, the Corporation reports as liabilities the subordinated debentures issued by the Corporation and held by the trusts, since the liabilities are not eliminated in consolidation.
Maturity Schedule of All Borrowed Funds
The following is a schedule of maturities of all borrowed funds as of December 31, 2009:
| 2010 |
$ | 17,494 | |
| 2011 |
119 | ||
| 2012 |
30,125 | ||
| 2013 |
130 | ||
| 2014 |
136 | ||
| Thereafter |
73,999 | ||
| Total borrowed funds |
$ | 122,003 | |
57
Table of Contents
12. Interest Rate Swap
On August 1, 2008, the Corporation executed an interest rate swap agreement with a 5 year term to hedge $10 million of a subordinated note that was entered into by the Corporation during 2007 and elected cash flow hedge accounting for the agreement. The Corporation’s objective in using this derivative is to add stability to interest expense and to manage its exposure to interest rate risk. The interest rate swap involves the receipt of variable-rate amounts in exchange for fixed-rate payments over the life of the agreement without exchange of the underlying notional amount. At December 31, 2009 and 2008, the variable rate on the subordinated debt was LIBOR plus 155 basis points (1.80% and 3.55% at December 31, 2009 and 2008, respectively) and the Corporation was paying 5.84% (4.29% fixed rate plus 155 basis points).
As of December 31, 2009 and 2008, no derivatives were designated as fair value hedges or hedges of net investments in foreign operations. Additionally, the Corporation does not use derivatives for trading or speculative purposes and currently does not have any derivatives that are not designated as hedges.
The following tables provide information about the amounts and locations of activity related to the interest rate swap designated as a cash flow hedge within the Corporation’s consolidated balance sheet and statement of income as of and for the years ended December 31, 2009 and 2008.
| As of December 31 | Liability Derivative |
|||||||||||
| Balance Sheet | Fair value |
|||||||||||
| Location |
2009 |
2008 |
||||||||||
| Interest rate contract |
Accrued interest and other liabilities |
($701) | ($1,015) | |||||||||
| For the Year Ended December 31, 2009 |
(a) | (b) | (c) | (d) | (e) | |||||||
| Interest rate contract |
$204 | Interest expense – subordinated debentures | ($335) | Other income |
$- | |||||||
| For the Year Ended December 31, 2008 |
||||||||||||
| Interest rate contract |
($660) | Interest expense – subordinated debentures | ($47) | Other income |
$- | |||||||
| (a) | Amount of Gain or (Loss) Recognized in Other Comprehensive Loss on Derivative (Effective Portion), net of tax |
| (b) | Location of Gain or (Loss) Reclassified from Accumulated Other Comprehensive Loss into Income (Effective Portion) |
| (c) | Amount of Gain or (Loss) Reclassified from Accumulated Other Comprehensive Loss into Income (Effective Portion) |
| (d) | Location of Gain or (Loss) Recognized in Income on Derivative (Ineffective Portion and Amount Excluded from Effectiveness Testing) |
| (e) | Amount of Gain or (Loss) Recognized in Income on Derivative (Ineffective Portion and Amount Excluded from Effectiveness Testing) |
58
Table of Contents
Amounts reported in accumulated other comprehensive loss related to the interest rate swap will be reclassified to interest expense as interest payments are made on the subordinated debentures. Such amounts reclassified from accumulated other comprehensive loss to interest expense in the next twelve months are expected to be $404.
13. Income Taxes
The following is a summary of income tax expense for the years ended December 31, 2009, 2008, and 2007:
| 2009 |
2008 |
2007 |
|||||||
| Current |
$4,100 | $2,586 | $3,553 | ||||||
| Deferred |
(1,746 | ) | (1,319 | ) | (272 | ) | |||
| Income tax expense |
$2,354 | $1,267 | $3,281 | ||||||
The components of the net deferred tax asset as of December 31, 2009 and 2008 are as follows:
| 2009 |
2008 | |||||
| Deferred tax assets: |
||||||
| Unrealized loss on securities available for sale |
$ | 2,431 | $ | 3,543 | ||
| Allowance for loan losses |
3,428 | 3,052 | ||||
| Deferred compensation |
1,459 | 1,123 | ||||
| Impaired security valuation |
2,880 | 2,058 | ||||
| Post-retirement benefits |
470 | 348 | ||||
| Unrealized loss on interest rate swap |
245 | 355 | ||||
| Deferred loan fees/costs |
146 | 120 | ||||
| Nonaccrual loan interest |
403 | - | ||||
| Other |
175 | 222 | ||||
| 11,637 | 10,821 | |||||
| Deferred tax liabilities: |
||||||
| Premises and equipment |
828 | 985 | ||||
| Intangibles – section 197 |
2,025 | 1,639 | ||||
| Intangibles – mortgage servicing rights |
307 | 193 | ||||
| Other |
30 | 156 | ||||
| 3,190 | 2,973 | |||||
| Net deferred tax asset |
$ | 8,447 | $ | 7,848 | ||
The Corporation determined that it was not required to establish a valuation allowance for deferred tax assets since management believes that the deferred tax assets are likely to be realized through a carry back to taxable income in prior years, future reversals of existing taxable temporary differences and future taxable income.
59
Table of Contents
The reconciliation of income tax attributable to pre-tax income at the federal statutory tax rates to income tax expense is as follows:
| 2009 |
% |
2008 |
% |
2007 |
% | |||||||
| Tax at statutory rate |
$3,803 | 35.0 | $2,276 | 35.0 | $4,345 | 35.0 | ||||||
| Tax exempt income, net |
(1,138) | (10.5) | (766) | (11.8) | (715) | (5.8) | ||||||
| Bank owned life insurance |
(252) | (2.3) | (218) | (3.4) | (215) | (1.7) | ||||||
| Other |
(59) | (0.5) | (25) | (0.3) | (134) | (1.1) | ||||||
| Income tax expense |
$2,354 | 21.7 | $1,267 | 19.5 | $3,281 | 26.4 | ||||||
At December 31, 2009 and 2008, the Corporation has no unrecognized tax benefits that, if recognized, would favorably affect the effective income tax rate in future periods. The Corporation does not expect the total amount of unrecognized tax benefits to significantly increase or decrease in the next twelve months.
The Corporation recognizes interest and/or penalties related to income tax matters as part of income tax expense. At December 31, 2009 and 2008, there were no amounts accrued for interest and/or penalties.
The Corporation and its subsidiaries are subject to U.S. federal income tax as well as income tax of the state of Pennsylvania. The Corporation is no longer subject to federal examination by taxing authorities for years before 2009. The Corporation’s 2006, 2007, and 2008 federal examinations have closed with no material impact to the Corporation’s financial position. The Corporation is no longer subject to state income tax examinations for years prior to 2006. Tax years 2006 through 2008 remain open to state examination.
14. Employee Benefit Plans
The Corporation provided a defined contribution retirement plan that covered all active officers and employees twenty-one years of age or older, employed by the Corporation for one year. Contributions to the plan for 2007, based on compensation as defined, are 6 percent of total compensation plus 5.7 percent of the compensation in excess of $94. The Corporation recognized expense of $460 in 2007. This plan was frozen in 2008 and rolled into the defined contribution 401(k) plan as described below.
In addition, the Corporation sponsors a contributory defined contribution Section 401(k) plan in which substantially all employees participate. The plan permits employees to make pre-tax contributions which are matched by the Corporation at 100% for every 1% contributed up to three percent then 50% for every 1% contributed up to the next four percent in total of the employee’s compensation. The Corporation’s contributions were $337, $314, and $273 in 2009, 2008, and 2007, respectively. In 2008, the Corporation added a profit sharing component to this plan. Profit sharing contributions, based on current year compensation, are 6 percent of total compensation plus 5.7 percent of the compensation in excess of $107. The Corporation recognized profit sharing expense of $612 in 2009 and $595 in 2008.
During 2003, the Corporation adopted a non-qualified supplemental executive retirement plan (“SERP”) for certain executives to compensate those executive participants in the Corporation’s retirement plan whose benefits are limited by compensation limitations under current tax law. The
60
Table of Contents
SERP is considered an unfunded plan for tax and ERISA purposes and all obligations arising under the SERP are payable from the general assets of the Corporation. At December 31, 2009 and 2008, obligations of $2,828 and $2,196, respectively, were included in other liabilities for this plan. Expenses related to this plan were $675 in 2009, $655 in 2008, and $229 in 2007.
During 2003, the Corporation established a Survivor Benefit Plan for the benefit of outside directors. The purpose of the plan is to provide life insurance benefits to beneficiaries of the Corporation’s directors who at the time of their death are participants in the plan. The plan is considered an unfunded plan for tax and ERISA purposes and all obligations arising under the plan are payable from the general assets of the Corporation. At December 31, 2009 and 2008, obligations of $560 and $538, respectively, were included in other liabilities for this plan. Expenses related to this plan were $22 in 2009, $47 in 2008, and $45 in 2007.
The Corporation has an unfunded post retirement benefits plan which provides certain health care benefits for retired employees who have reached the age of 60 and retired with 30 years of service. Benefits are provided for these retired employees and their qualifying dependents from the age of 60 through the age of 65. The Corporation uses a December 31 measurement date for this plan.
The following table sets forth the change in the benefit obligation of the plan as of and for the years ended December 31, 2009, 2008, and 2007:
| 2009 | 2008 | 2007 |
|||||||
| Benefit obligation at beginning of year |
$456 | $551 | $607 | ||||||
| Interest cost |
26 | 34 | 36 | ||||||
| Service cost |
26 | 31 | 34 | ||||||
| Actual claim expense |
(71 | ) | (8 | ) | (17 | ) | |||
| Cost of early retirement window |
140 | - | - | ||||||
| Actuarial (gain)/loss |
206 | (152 | ) | (109 | ) | ||||
| Benefit obligation at end of year |
$783 | $456 | $551 | ||||||
Amounts recognized in accumulated other comprehensive income at December 31, 2009 and 2008 consist of:
| 2009 | 2008 | |||||
| Net actuarial gain/(loss) |
$180 | $400 | ||||
| Transition obligation |
(29 | ) | (37 | ) | ||
| 151 | 363 | |||||
| Tax effect |
(53 | ) | (127 | ) | ||
| $98 | $236 | |||||
The accumulated benefit obligation was $783 and $456 at December 31, 2009 and 2008, respectively.
61
Table of Contents
The following table sets forth the components of net periodic benefit cost and other amounts recognized in other comprehensive income:
| 2009 | 2008 | 2007 | |||||||
| Service cost |
$26 | $31 | $34 | ||||||
| Interest cost |
26 | 34 | 36 | ||||||
| Cost of early retirement window |
140 | - | - | ||||||
| Net amortization of transition obligation and actuarial gain |
(6 | ) | (1 | ) | 3 | ||||
| Net periodic benefit cost |
186 | 64 | 73 | ||||||
| Net (gain) loss |
206 | (152 | ) | (109 | ) | ||||
| Amortization of gain |
14 | 8 | 4 | ||||||
| Amortization of transition obligation |
(8 | ) | (7 | ) | (7 | ) | |||
| Total recognized in other comprehensive income |
212 | (151 | ) | (112 | ) | ||||
| Total recognized in net periodic benefit cost and other comprehensive income |
$398 | $(87 | ) | $(39 | ) | ||||
The estimated net gain and transition obligation that will be amortized from accumulated other comprehensive income into net periodic benefit cost over the next fiscal year are ($4) and $7, respectively.
The weighted average discount rate used to calculate net periodic benefit cost was 5.75% in 2009, 6.25% in 2008, and 6.0% in 2007. The weighted average rate used to calculate accrued benefit obligations was 5.75% in 2009, 5.75% in 2008, and 6.25% in 2007. The health care cost trend rate used to measure the expected costs of benefits for 2010 is 6.0% and is 5.0% for 2011 and thereafter. A one percent increase in the health care trend rates would result in an increase of $86 in the benefit obligation as of December 31, 2009, and would increase the service and interest costs by $13 in future periods. A similar one percent decrease in health care trend rates would result in a decrease of $73 and $10 in the benefit obligation and services and interest costs, respectively, at December 31, 2009.
15. Deferred Compensation Plans
Deferred compensation plans cover all directors and certain officers. Under the plans, the Corporation pays each participant, or their beneficiary, the amount of fees or compensation deferred plus gains or net of losses over a maximum period of 10 years, beginning with the individual’s termination of service. A liability is accrued for the obligation under these plans.
A summary of changes in the deferred compensation plan liability follows:
| 2009 |
2008 |
2007 |
||||||||||
| Balance, beginning of year |
$ | 894 | $ | 986 | $ | 975 | ||||||
| Deferrals, dividends, and changes in fair value recorded as an expense (benefit) |
370 | (44 | ) | 59 | ||||||||
| Deferred compensation payments |
(64 | ) | (48 | ) | (48 | ) | ||||||
| Balance, end of year |
$ | 1,200 | $ | 894 | $ | 986 | ||||||
62
Table of Contents
16. Stock-Based Compensation
Stock Options
A summary of the status of the stock options, adjusted retroactively for the effects of stock splits, is presented below:
| Stock |
Weighted-average Exercise Price | |||||
| Outstanding at January 1, 2009 |
258,668 | $ | 13.28 | |||
| Granted |
- | - | ||||
| Exercised |
(63,712 | ) | 10.52 | |||
| Forfeited |
(35,937 | ) | 14.52 | |||
| Outstanding at December 31, 2009 |
159,019 | $ | 14.11 | |||
| Options exercisable at December 31, 2009 |
159,019 | |||||
| Fair value of options granted during 2009 |
- | |||||
| Number of authorized stock-based awards available for grant |
486,241 | |||||
Options outstanding and exercisable at December 31, 2009 are as follows:
| Exercise Price |
Number | Remaining Contractual Life | ||
| $ 7.40 |
4,375 | 0.6 years | ||
| 9.00 |
30,000 | 2.0 years | ||
| 9.50 |
4,769 | 0.1 years | ||
| 13.30 |
33,125 | 3.0 years | ||
| 16.04 |
44,250 | 5.0 years | ||
| 17.54 |
42,500 | 4.0 years | ||
| 159,019 | ||||
The aggregate intrinsic value of all options outstanding and exercisable at December 31, 2009 and 2008 was $367 and $198, respectively.
Additional information related to the stock option plan follows:
| 2009 | 2008 | 2007 | ||||||
| Intrinsic value of options exercised |
$ | 363 | - | $ | 41 | |||
| Cash received from option exercises |
671 | - | 79 | |||||
As of December 31, 2009, there was no unrecognized compensation cost related to nonvested stock options granted under the stock option plan.
63
Table of Contents
Restricted Stock Awards
A summary of changes in nonvested restricted stock awards follows:
| Shares | Weighted-average | ||||
| Nonvested at January 1, 2009 |
27,197 | $14.03 | |||
| Granted |
14,159 | 15.70 | |||
| Vested |
(9,511 | ) | 13.97 | ||
| Forfeited |
(1,701 | ) | 14.05 | ||
| Nonvested at December 31, 2009 |
30,144 | $14.83 | |||
As of December 31, 2009 and 2008, there was $340 and $264, respectively, of total unrecognized compensation cost related to nonvested shares granted under the restricted stock award plan. The fair value of shares vesting during 2009, 2008, and 2007 was $101, $112 and $56, respectively. Compensation expense for restricted stock awards was $122 in 2009, $147 in 2008, and $94 in 2007.
17. Related Party Transactions
The Bank has transactions, including loans, with its officers, directors, and their affiliated companies. The aggregate of such loans totaled $19,545 on December 31, 2009 compared to $18,425 at December 31, 2008. During 2009, $4,947 of new loans were made and repayments totaled $3,827.
Deposits from principal officers, directors, and their affiliates were $12,693 and $3,492 at December 31, 2009 and 2008, respectively.
18. Capital Requirements and Restrictions on Retained Earnings
Banks and bank holding companies are subject to regulatory capital requirements administered by federal banking agencies. Capital adequacy guidelines and, additionally for banks, prompt corrective action regulations involve quantitative measures of assets, liabilities, and certain off-balance-sheet items calculated under regulatory accounting practices. Capital amounts and classifications are also subject to qualitative judgments by regulators. Failure to meet capital requirements can initiate regulatory action. Management believes as of December 31, 2009, the Corporation and Bank meet all capital adequacy requirements to which it is subject.
Prompt corrective action regulations provide five classifications: well capitalized, adequately capitalized, undercapitalized, significantly undercapitalized, and critically undercapitalized, although these terms are not used to represent overall financial condition. If adequately capitalized, regulatory approval is required to accept brokered deposits. If undercapitalized, capital distributions are limited, as is asset growth and expansion, and capital restoration plans are required. As of December 31, 2009 and 2008, the most recent regulatory notifications categorized the Bank as well capitalized under the regulatory framework for prompt corrective action. There are no events or conditions since this notification that management believes have changed the Bank’s category.
64
Table of Contents
Actual and required capital amounts and ratios are presented below as of December 31, 2009 and 2008:
| Actual | For Capital Adequacy Purposes |
To Be Well Capitalized Under Prompt Corrective Action Provisions | ||||||||||
| Amount |
Ratio |
Amount |
Ratio |
Amount |
Ratio | |||||||
| December 31, 2009 |
||||||||||||
| Total Capital to Risk Weighted Assets |
||||||||||||
| Consolidated |
$93,337 | 11.95% | $62,492 | 8.0% | N/A | |||||||
| Bank |
$88,055 | 11.56% | $60,932 | 8.0% | $76,165 | 10.0% | ||||||
| Tier 1 (Core) Capital to Risk Weighted Assets |
||||||||||||
| Consolidated |
$83,561 | 10.70% | $31,246 | 4.0% | N/A | |||||||
| Bank |
$79,397 | 10.42% | $30,466 | 4.0% | $45,699 | 6.0% | ||||||
| Tier 1 (Core) Capital to Average Assets |
||||||||||||
| Consolidated |
$83,561 | 7.87% | $42,489 | 4.0% | N/A | |||||||
| Bank |
$79,397 | 7.27% | $43,706 | 4.0% | $54,633 | 5.0% | ||||||
| December 31, 2008 |
||||||||||||
| Total Capital to Risk Weighted Assets |
||||||||||||
| Consolidated |
$87,590 | 12.00% | $58,405 | 8.0% | N/A | |||||||
| Bank |
$77,326 | 11.06% | $55,916 | 8.0% | $69,895 | 10.0% | ||||||
| Tier 1 (Core) Capital to Risk Weighted Assets |
||||||||||||
| Consolidated |
$78,872 | 10.80% | $29,202 | 4.0% | N/A | |||||||
| Bank |
$69,555 | 9.95% | $27,958 | 4.0% | $41,937 | 6.0% | ||||||
| Tier 1 (Core) Capital to Average Assets |
||||||||||||
| Consolidated |
$78,872 | 8.40% | $37,540 | 4.0% | N/A | |||||||
| Bank |
$69,555 | 7.15% | $38,899 | 4.0% | $48,624 | 5.0% | ||||||
Certain restrictions exist regarding the ability of the Bank to transfer funds to the Corporation in the form of cash dividends, loans or advances. At December 31, 2009, approximately $11.9 million of accumulated net earnings of the Bank, included in the consolidated stockholders’ equity, was available for distribution to the Corporation as dividends without prior regulatory approval, subject to regulatory capital requirements above.
19. Off Balance Sheet Activities
Some financial instruments, such as loan commitments, credit lines, letters of credit, and overdraft protection, are issued to meet customer financing needs. These are agreements to provide credit or to support the credit of others, as long as conditions established in the contract are met, and usually have expiration dates. Commitments may expire without being used. Off balance sheet risk to credit loss exists up to the face amount of these instruments, although material losses are not anticipated. The same credit policies are used to make such commitments as are used for loans, including obtaining collateral at exercise of the commitment.
65
Table of Contents
The contractual amount of financial instruments with off balance sheet risk was as follows at December 31, 2009 and 2008:
| 2009 | 2008 | |||||||
| Fixed Rate |
Variable Rate |
Fixed Rate |
Variable Rate | |||||
| Commitments to make loans |
$15,007 | $120,324 | $19,631 | $139,820 | ||||
| Unused lines of credit |
- | 49,202 | - | 45,690 | ||||
| Standby letters of credit |
- | 16,652 | - | 11,260 | ||||
Commitments to make loans are generally made for periods of 60 days or less. The fixed rate loan commitments at December 31, 2009 have interest rates ranging from 2.50% to 16.00% and maturities ranging from 3 months to 20 years. The fixed rate loan commitments at December 31, 2008 have interest rates ranging from 3.57% to 16.00% and maturities ranging from 3 months to 20 years.
20. Fair Value
Fair Value Measurement
Fair value is defined as the exchange price that would be received for an asset or paid to transfer a liability (an exit price) in the principal or most advantageous market for the asset or liability in an orderly transaction between market participants on the measurement date. A fair value hierarchy has also been established which requires an entity to maximize the use of observable inputs and minimize the use of unobservable inputs when measuring fair value. The following three levels of inputs are used to measure fair value:
Level 1: Quoted prices (unadjusted) for identical assets or liabilities in active markets that the entity has the ability to access as of the measurement date.
Level 2: Significant other observable inputs other than Level 1 prices such as quoted prices for similar assets or liabilities; quoted prices in markets that are not active; or other inputs that are observable or can be corroborated by observable market data.
Level 3: Significant unobservable inputs that reflect a company’s own assumptions about the assumptions that market participants would use in pricing an asset or liability.
The fair values of most trading securities and securities available for sale are determined by obtaining quoted prices on nationally recognized securities exchanges (Level 1 inputs) or matrix pricing, which is a mathematical technique widely used in the industry to value debt securities without relying exclusively on quoted prices for the specific securities but rather relying on the securities’ relationship to other benchmark quoted securities (Level 2 inputs). The fair values of certain mortgage-backed securities classified as available for sale have been determined by using Level 3 inputs. The Corporation has engaged a valuation expert to price these securities using a proprietary model, which incorporates assumptions that market participants would use in pricing the securities, including bid/ask spreads and liquidity and credit premiums.
Trust preferred securities which are issued by financial institutions and insurance companies are priced using Level 3 inputs. The decline in the level of observable inputs and market activity in this class of investments by the measurement date has been significant and resulted in unreliable external pricing. Broker pricing and bid/ask spreads, when available, vary widely, and the once active market has become comparatively inactive.
66
Table of Contents
The Corporation engaged a third party consultant who has developed a model for pricing these securities. Information such as historical and current performance of the underlying collateral, deferral and default rates, collateral coverage ratios, break in yield calculations, cash flow projections, liquidity and credit premiums required by a market participant, and financial trend analysis with respect to the individual issuing financial institutions and insurance companies are utilized in determining individual security valuations. Due to the current market conditions as well as the limited trading activity of these securities, the market value of the securities is highly sensitive to assumption changes and market volatility.
The Corporation’s derivative instrument is an interest rate swap that trades in liquid markets. As such, significant fair value inputs can generally be verified and do not typically involve significant management judgments (Level 2 inputs).
The fair value of impaired loans with specific allocations of the allowance for loan losses is generally based on recent real estate appraisals. These appraisals may utilize a single valuation approach or a combination of approaches including comparable sales and the income approach. Adjustments are routinely made in the appraisal process by the appraisers to adjust for differences between the comparable sales and income data available. Such adjustments are usually significant and typically result in a Level 3 classification of the inputs for determining fair value.
Assets and liabilities measured at fair value on a recurring basis are as follows at December 31, 2009 and 2008:
| Fair Value Measurements at December 31, 2009 Using | |||||||||||
| Description |
Total |
Quoted Prices in Active Markets for Identical Assets (Level 1) |
Significant Other Observable Inputs |
Significant Unobservable Inputs (Level 3) | |||||||
| Assets: |
|||||||||||
| Securities Available For Sale: |
|||||||||||
| U.S. Treasury |
$ | 10,269 | $ 10,269 | ||||||||
| U.S. Government sponsored entities |
106,961 | $30,643 | 76,318 | ||||||||
| States and political subdivisions |
56,561 | 3,273 | 53,288 | ||||||||
| Residential mortgage and asset backed |
145,400 | 5,625 | 139,272 | $ 503 | |||||||
| Corporate notes and bonds |
13,631 | 13,631 | |||||||||
| Pooled trust preferred |
1,909 | 1,909 | |||||||||
| Pooled SBA |
8,989 | 5,017 | 3,972 | ||||||||
| Other securities |
1,695 | 1,695 | |||||||||
| Total Securities Available For Sale |
$ | 345,415 | $46,253 | $296,750 | $2,412 | ||||||
| Trading securities – equity securities |
$ | 955 | $ 955 | ||||||||
| Liabilities, |
|||||||||||
| Interest rate swap |
$ | (701) | $ (701) | ||||||||
67
Table of Contents
| Fair Value Measurements at December 31, 2008 Using | ||||||||||
| Description |
Total |
Quoted Prices in Active Markets for (Level 1) |
Significant Other Observable Inputs (Level 2) |
Significant Unobservable Inputs (Level 3) | ||||||
| Assets: |
||||||||||
| Securities Available For Sale: |
||||||||||
| U.S. Treasury |
$ | 10,316 | $ 10,316 | |||||||
| U.S. Government sponsored entities |
41,264 | $13,059 | 28,205 | |||||||
| States and political subdivisions |
54,415 | 7,295 | 47,120 | |||||||
| Residential mortgage and asset backed |
104,418 | 5,018 | 95,082 | $4,318 | ||||||
| Corporate notes and bonds |
22,162 | 22,162 | ||||||||
| Pooled trust preferred |
3,079 | 3,079 | ||||||||
| Other securities |
1,635 | 1,635 | ||||||||
| Total Securities Available For Sale |
$ | 237,289 | $27,007 | $202,885 | $7,397 | |||||
| Trading securities – equity securities |
$ | 892 | $ 892 | |||||||
| Liabilities, |
||||||||||
| Interest rate swap |
$ | (1,015 | ) | $ (1,015) | ||||||
The table below presents a reconciliation and income statement classification of gains and losses for all securities available for sale measured at fair value on a recurring basis using significant unobservable inputs (Level 3) for the years ended December 31, 2009 and 2008:
| 2009 |
2008 |
|||||||||||
| Residential |
Pooled |
Residential |
Pooled |
|||||||||
| Beginning balance |
$4,318 | $3,079 | $ 526 | $1,000 | ||||||||
| Total gains or losses (realized/unrealized): |
||||||||||||
| Included in earnings |
- | (2,415 | ) | - | (2,000 | ) | ||||||
| Included in other comprehensive loss |
- | 1,318 | (21 | ) | (2,749 | ) | ||||||
| Purchases, issuances, and settlements |
(2,400 | ) | (73 | ) | 3,505 | (10 | ) | |||||
| Transfers in and/or out of Level 3 |
(1,415 | ) | - | 308 | 6,838 | |||||||
| Ending balance |
$ 503 | $1,909 | $4,318 | $3,079 | ||||||||
The unrealized losses reported in earnings for the years ended December 31, 2009 and 2008 for Level 3 assets that are still held at December 31, 2009 and 2008 relate to pooled trust preferred securities deemed to be other-than-temporarily impaired.
68
Table of Contents
Assets and liabilities measured at fair value on a non-recurring basis are as follows at December 31, 2009 and 2008:
| Fair Value Measurements at December 31, 2009 Using | |||||||||
| Description |
Total |
Quoted Prices
in |
Significant Other |
Significant | |||||
| Assets, |
|||||||||
| Impaired loans |
$ | 9,471 | $9,471 | ||||||
| Fair Value Measurements at December 31, 2008 Using | |||||||||
| Description |
Total |
Quoted Prices
in |
Significant Other |
Significant | |||||
| Assets, |
|||||||||
| Impaired loans |
$ | 3,222 | $3,222 | ||||||
Impaired loans, which are measured for impairment using the fair value of collateral for collateral dependent loans, had a principal balance of $10,880, with a valuation allowance of $1,409 as of December 31, 2009, resulting in an additional provision for loan losses of $730 for the year then ended. Impaired loans had a principal balance of $4,850, with a valuation allowance of $1,628 as of December 31, 2008, resulting in an additional provision for loan losses of $1,292 for the year then ended.
Fair Value of Financial Instruments
Carrying amount is the estimated fair value for cash and cash equivalents, accrued interest receivable and payable, demand deposits, other borrowings, and variable rate loans, deposits or borrowings that reprice frequently and fully. For fixed rate loans or deposits and for variable rate loans or deposits with infrequent repricing or repricing limits, fair value is based on discounted cash flows using current market rates applied to the estimated life and credit risk. Fair value of loans held for sale is based on market quotes. Fair value of debt is based on current rates for similar financing. It is not practical to determine the fair value of FHLB stock and other equity interests due to restrictions placed on the transferability of these instruments. The fair value of off balance sheet items is based on the current fees or cost that would be charged to enter into or terminate such arrangements. The fair value of off balance sheet items is not material.
While these estimates of fair value are based on management’s judgment of the most appropriate factors as of the balance sheet date, there is no assurance that the estimated fair values would have been realized if the assets had been disposed of or the liabilities settled at that date, since market values may differ depending on various circumstances. The estimated fair values would also not apply to subsequent dates.
In addition, other assets and liabilities that are not financial instruments, such as premises and equipment, are not included in the disclosures. Also, non-financial instruments typically not recognized on the balance sheet may have value but are not included in the fair value disclosures. These include, among other items, the estimated earnings power of core deposits, the earnings potential of trust accounts, the trained workforce, customer goodwill, and similar items.
69
Table of Contents
The following table presents the carrying amount and fair value of financial instruments at December 31, 2009 and 2008:
| December 31, 2009 | December 31, 2008 | |||||||||||||||
| Carrying |
Fair |
Carrying |
Fair |
|||||||||||||
| ASSETS |
||||||||||||||||
| Cash and cash equivalents |
$ | 22,358 | $ | 22,358 | $ | 31,256 | $ | 31,256 | ||||||||
| Interest bearing time deposits with other banks |
6,388 | 6,565 | 6,515 | 6,658 | ||||||||||||
| Securities available for sale |
345,415 | 345,415 | 237,289 | 237,289 | ||||||||||||
| Trading securities |
955 | 955 | 892 | 892 | ||||||||||||
| Loans held for sale |
1,218 | 1,228 | 3,332 | 3,339 | ||||||||||||
| Net loans |
705,347 | 728,074 | 662,837 | 682,741 | ||||||||||||
| FHLB and other equity interests |
6,907 | N/A | 5,815 | N/A | ||||||||||||
| Accrued interest receivable |
4,728 | 4,728 | 4,470 | 4,470 | ||||||||||||
| LIABILITIES |
||||||||||||||||
| Deposits |
$ | (956,858 | ) | $ | (956,231 | ) | $ | (814,596 | ) | $ | (816,456 | ) | ||||
| FHLB, Treasury, tax and loan, and other borrowings |
(101,383 | ) | (109,753 | ) | (108,197 | ) | (115,098 | ) | ||||||||
| Subordinated debentures |
(20,620 | ) | (10,609 | ) | (20,620 | ) | (20,662 | ) | ||||||||
| Interest rate swap |
(701 | ) | (701 | ) | (1,015 | ) | (1,015 | ) | ||||||||
| Accrued interest payable |
(1,906 | ) | (1,906 | ) | (2,107 | ) | (2,107 | ) | ||||||||
21. Parent Company Only Financial Information
| CONDENSED BALANCE SHEETS | December 31, | |||||
| 2009 |
2008 | |||||
| Assets |
||||||
| Cash |
$ | 1,035 | $ | 1,003 | ||
| Trading securities |
65 | 100 | ||||
| Investment in bank subsidiary |
79,038 | 66,972 | ||||
| Investment in non-bank subsidiaries |
15,390 | 21,106 | ||||
| Deferred tax asset |
220 | 320 | ||||
| Other assets |
1,330 | 1,262 | ||||
| Total assets |
$ | 97,078 | $ | 90,763 | ||
| Liabilities |
||||||
| Other borrowings |
$ | 5,000 | $ | 6,500 | ||
| Subordinated debentures |
20,620 | 20,620 | ||||
| Other liabilities |
2,049 | 1,176 | ||||
| Total liabilities |
27,669 | 28,296 | ||||
| Total shareholders’ equity |
69,409 | 62,467 | ||||
| Total liabilities and shareholders’ equity |
$ | 97,078 | $ | 90,763 | ||
70
Table of Contents
| CONDENSED STATEMENTS OF INCOME | Year Ended December 31, | ||||||||
| Income | 2009 |
2008 |
2007 |
||||||
| Dividends from: |
|||||||||
| Bank subsidiary |
$2,808 | $1,027 | $6,229 | ||||||
| Non-bank subsidiaries |
5,850 | 1,800 | - | ||||||
| Other |
91 | 127 | 172 | ||||||
| Total income |
8,749 | 2,954 | 6,401 | ||||||
| Expenses |
(1,373 | ) | (1,391 | ) | (1,622 | ) | |||
| Income before income taxes and equity in undistributed net income of subsidiaries |
7,376 | 1,563 | 4,779 | ||||||
| Income tax benefit |
435 | 438 | 493 | ||||||
| Equity in undistributed net income of bank subsidiary |
6,008 | 5,719 | 2,865 | ||||||
| Equity in undistributed net income (loss) of non-bank subsidiaries |
(5,307 | ) | (2,485 | ) | 997 | ||||
| Net income |
$8,512 | $5,235 | $9,134 | ||||||
| CONDENSED STATEMENTS OF CASH FLOWS | Year Ended December 31, | ||||||||
| 2009 |
2008 |
2007 |
|||||||
| Net income |
|||||||||
| Adjustments to reconcile net income to net cash provided by |
$8,512 | $5,235 | $9,134 | ||||||
| operating activities: |
|||||||||
| Equity in undistributed net income of bank subsidiary |
(6,008 | ) | (5,719 | ) | (2,865 | ) | |||
| Equity in undistributed net income (loss) of non-bank subsidiaries |
5,307 | 2,485 | (997 | ) | |||||
| Net unrealized losses on securities for which fair value was elected |
35 | - | - | ||||||
| Decrease (increase) in other assets |
(79 | ) | 81 | (22 | ) | ||||
| Increase in other liabilities |
1,311 | 172 | 1 | ||||||
| Net cash provided by operating activities |
9,078 | 2,254 | 5,251 | ||||||
| Cash flows from investing activities: |
|||||||||
| Capital transfer to subsidiaries |
(3,725 | ) | (4,800 | ) | (2,020 | ) | |||
| Purchase of securities |
- | (100 | ) | - | |||||
| Return of capital from subsidiary |
- | - | 310 | ||||||
| Net cash used in investing activities |
(3,725 | ) | (4,900 | ) | (1,710 | ) | |||
| Cash flows from financing activities: |
|||||||||
| Dividends paid |
(5,726 | ) | (5,525 | ) | (5,395 | ) | |||
| Purchase of treasury stock |
- | (659 | ) | (6,115 | ) | ||||
| Proceeds from sale of treasury stock and option exercises, including tax benefit |
1,905 | 982 | 1,153 | ||||||
| Proceeds from long-term borrowing |
- | 5,000 | - | ||||||
| Repayment of long-term borrowing |
(1,500 | ) | |||||||
| Net advance from (to) subsidiary |
- | 1,500 | (1,200 | ) | |||||
| Issue of subordinated debentures |
- | - | 20,620 | ||||||
| Repayment of subordinated debentures |
- | - | (10,310 | ) | |||||
| Net cash (used in) provided by financing activities |
(5,321 | ) | 1,298 | (1,247 | ) | ||||
| Net increase (decrease) in cash |
32 | (1,348 | ) | 2,294 | |||||
| Cash beginning of year |
1,003 | 2,351 | 57 | ||||||
| Cash end of year |
$1,035 | $1,003 | $2,351 | ||||||
71
Table of Contents
22. Other Comprehensive Income (Loss)
Other comprehensive income (loss) components and related tax effects were as follows for the years ended December 31, 2009, 2008, and 2007:
| 2009 |
2008 |
2007 |
||||||||||
| Unrealized holding gains (losses) on available for sale securities |
$ | 1,736 | $ | (9,840 | ) | $ | (1,819 | ) | ||||
| Less reclassification adjustment for (gains) and losses recognized in earnings |
(395 | ) | (117 | ) | (501 | ) | ||||||
| Net unrealized gains (losses) |
1,341 | (9,957 | ) | (2,320 | ) | |||||||
| Tax effect |
(470 | ) | 3,486 | 812 | ||||||||
| Net-of-tax amount |
871 | (6,471 | ) | (1,508 | ) | |||||||
| Unrealized holding gains (losses) on available for sale securities for which a portion of an other-than-temporary impairment has been recognized in earnings |
(610 | ) | (3,906 | ) | (1,565 | ) | ||||||
| Less reclassification adjustment for impairment loss recognized in earnings |
2,443 | 3,963 | 900 | |||||||||
| Net unrealized gains (losses) |
1,833 | 57 | (665 | ) | ||||||||
| Tax effect |
(641 | ) | (20 | ) | 233 | |||||||
| Net-of-tax amount |
1,192 | 37 | (432 | ) | ||||||||
| Actuarial gain (loss) on postemployment health care plan |
(206 | ) | 152 | 109 | ||||||||
| Net amortization of transition obligation and actuarial gain |
(6 | ) | (1 | ) | 3 | |||||||
| Net unrealized gain on postemployment health care plan |
(212 | ) | 151 | 112 | ||||||||
| Tax effect |
74 | (53 | ) | (39 | ) | |||||||
| Net-of-tax amount |
(138 | ) | 98 | 73 | ||||||||
| Unrealized gain (loss) on interest rate swap |
314 | (1,015 | ) | - | ||||||||
| Tax effect |
(110 | ) | 355 | - | ||||||||
| Net-of-tax amount |
204 | (660 | ) | - | ||||||||
| Other comprehensive income (loss) |
$ | 2,129 | $ | (6,996 | ) | $ | (1,867 | ) | ||||
The following is a summary of the accumulated other comprehensive loss balance, net of tax, at December 31, 2009 and 2008:
| Balance at |
Current period |
Balance at |
||||||||||
| Unrealized gains (losses) on securities available for sale |
$ | (6,580 | ) | $ | 2,063 | $ | (4,517 | ) | ||||
| Unrealized gain on postretirement benefits plan |
236 | (138 | ) | 98 | ||||||||
| Unrealized gain (loss) on interest rate swap |
(660 | ) | 204 | (456 | ) | |||||||
| Total |
$ | (7,004 | ) | $ | 2,129 | $ | (4,875 | ) | ||||
72
Table of Contents
23. Quarterly Financial Data (Unaudited)
The unaudited quarterly results of operations for the years ended December 31, 2009 and 2008 are as follows (in thousands, except per share data):
| Quarters Ended in 2009 | Quarters Ended in 2008 | ||||||||||||||||||||||||
| Mar. 31 | June 30 | Sept. 30 | Dec. 31 | Mar. 31 | June 30 | Sept. 30 | Dec. 31 | ||||||||||||||||||
| Total interest and dividend income |
$ | 13,955 | $ | 13,833 | $ | 14,026 | $ | 14,056 | $ | 14,030 | $ | 13,923 | $ | 14,472 | $ | 14,758 | |||||||||
| Net interest income |
9,203 | 9,367 | 9,484 | 9,348 | 9,042 | 8,999 | 9,140 | 9,419 | |||||||||||||||||
| Provision for loan losses |
862 | 1,008 | 1,094 | 1,501 | 509 | 756 | 716 | 1,806 | |||||||||||||||||
| Non-interest income (loss) |
1,951 | 2,802 | 2,066 | 901 | 1,546 | 1,850 | (2,581 | ) | 1,675 | ||||||||||||||||
| Non-interest expense |
7,359 | 7,810 | 7,484 | 7,138 | 7,353 | 7,106 | 7,283 | 7,059 | |||||||||||||||||
| Net income (loss) |
2,226 | 2,488 | 2,249 | 1,549 | 2,002 | 2,176 | (744 | ) | 1,801 | ||||||||||||||||
| Net income (loss) per share, basic |
0.26 | 0.29 | 0.26 | 0.17 | 0.23 | 0.26 | (0.09 | ) | 0.21 | ||||||||||||||||
| Net income (loss) per share, diluted |
0.26 | 0.29 | 0.26 | 0.17 | 0.23 | 0.26 | (0.09 | ) | 0.21 | ||||||||||||||||
Subsequent to the filing of its Form 10-Q for the quarter ended September 30, 2008, the Corporation’s management determined that certain assumptions associated with one of its other-than-temporary impairment evaluations were in error. As a result, an other-than-temporary impairment loss should have been recognized on this security during the quarter ended September 30, 2008 in the amount of $1,717. Because an other-than-temporary charge was originally recorded in the fourth quarter of 2008 for 100% of the cost basis of this security, the Corporation’s net income for the fourth quarter of 2008 was understated by $1,116. However, the Corporation’s net income for the year ended December 31, 2008 was not misstated since the error only involved the timing of the recognition of the other-than-temporary impairment charge between the third and fourth quarters of 2008. Appropriate revisions in the table above were made to recognize the other-than-temporary impairment charge in the third quarter of 2008.
A provision for loan losses in the amount of $1,501 and $1,806 was recorded during the quarters ended December 31, 2009 and 2008, respectively, as a result of increases in net charge-offs specifically in the commercial and consumer discount areas as well as increases in nonperforming loans. The volatility from quarter to quarter for non-interest income primarily relates to other-than-temporary impairment of securities.
73
Table of Contents
Report of Independent Registered Public Accounting Firm

Board of Directors and Shareholders
CNB Financial Corporation
Clearfield, Pennsylvania
We have audited the accompanying consolidated balance sheets of CNB Financial Corporation as of December 31, 2009 and 2008, and the related consolidated statements of income, cash flows, and changes in shareholders’ equity for each of the years in the three-year period ended December 31, 2009. We also have audited CNB Financial Corporation’s internal control over financial reporting as of December 31, 2009, based on criteria established in Internal Control – Integrated Framework issued by the Committee of Sponsoring Organizations of the Treadway Commission (COSO). CNB Financial Corporation’s management is responsible for these financial statements, for maintaining effective internal control over financial reporting, and for its assessment of the effectiveness of internal control over financial reporting, included in the accompanying Management’s Report on Internal Control Over Financial Reporting located in Item 9A of Form 10-K. Our responsibility is to express an opinion on these financial statements and an opinion on the company’s internal control over financial reporting based on our audits.
We conducted our audits in accordance with the standards of the Public Company Accounting Oversight Board (United States). Those standards require that we plan and perform the audits to obtain reasonable assurance about whether the financial statements are free of material misstatement and whether effective internal control over financial reporting was maintained in all material respects. Our audits of the consolidated financial statements included examining, on a test basis, evidence supporting the amounts and disclosures in the financial statements, assessing the accounting principles used and significant estimates made by management, and evaluating the overall financial statement presentation. Our audit of internal control over financial reporting included obtaining an understanding of internal control over financial reporting, assessing the risk that a material weakness exists, and testing and evaluating the design and operating effectiveness of internal control based on the assessed risk. Our audits also included performing such other procedures as we considered necessary in the circumstances. We believe that our audits provide a reasonable basis for our opinions.
A company’s internal control over financial reporting is a process designed to provide reasonable assurance regarding the reliability of financial reporting and the preparation of financial statements for external purposes in accordance with generally accepted accounting principles. A company’s internal control over financial reporting includes those policies and procedures that (1) pertain to the maintenance of records that, in reasonable detail, accurately and fairly reflect the transactions and dispositions of the assets of the company; (2) provide reasonable assurance that transactions are recorded as necessary to permit preparation of financial statements in accordance with generally accepted accounting principles, and that receipts and expenditures of the company are being made only in accordance with authorizations of management and directors of the company; and (3) provide reasonable assurance regarding prevention or timely detection of unauthorized acquisition, use, or disposition of the company’s assets that could have a material effect on the financial statements.
Because of its inherent limitations, internal control over financial reporting may not prevent or detect misstatements. Also, projections of any evaluation of effectiveness to future periods are subject to the
74
Table of Contents
risk that controls may become inadequate because of changes in conditions, or that the degree of compliance with the policies or procedures may deteriorate.
In our opinion, the consolidated financial statements referred to above present fairly, in all material respects, the financial position of CNB Financial Corporation as of December 31, 2009 and 2008, and the results of its operations and its cash flows for each of the years in the three-year period ended December 31, 2009 in conformity with accounting principles generally accepted in the United States of America. Also in our opinion, CNB Financial Corporation maintained, in all material respects, effective internal control over financial reporting as of December 31, 2009, based on criteria established in Internal Control – Integrated Framework issued by the Committee of Sponsoring Organizations of the Treadway Commission (COSO).
/s/ Crowe Horwath LLP
Cleveland, Ohio
March 9, 2010
75
Table of Contents
ITEM 9. CHANGES IN AND DISAGREEMENTS WITH ACCOUNTANTS ON ACCOUNTING AND FINANCIAL DISCLOSURE
None
ITEM 9A. CONTROLS AND PROCEDURES
The Corporation’s management, under the supervision of and with the participation of the Corporation’s Principal Executive Officer and Principal Financial Officer, has carried out an evaluation of the design and effectiveness of the Corporation’s disclosure controls and procedures as defined in Rule 13a-15(e) and Rule 15d-15(e) of the Securities Exchange Act of 1934 as of the end of the period covered by this report. Based upon that evaluation, the Principal Executive Officer and Principal Financial Officer have concluded that, as of the end of such period, the Corporation’s disclosure controls and procedures are effective to provide reasonable assurance that all material information required to be disclosed in reports the Corporation files or submits under the Securities Exchange Act of 1934 is recorded, processed, summarized and reported, within the time periods specified in the Securities and Exchange Commission’s rules and forms.
There was no significant change in the Corporation’s internal control over financial reporting that occurred during the quarter ended December 31, 2009 that has materially affected, or that is reasonably likely to materially affect, our internal control over financial reporting.
Management’s Report on Internal Control Over Financial Reporting
The management of the Corporation is responsible for establishing and maintaining adequate internal control over financial reporting as defined in Rules 13a-15(f) and 15d-15(f) under the Securities and Exchange Act of 1934. The Corporation’s internal control over financial reporting is designed to provide reasonable assurance regarding the reliability of financial reporting and the preparation of financial statements for external purposes in accordance with U.S. Generally Accepted Accounting Principles.
The Corporation’s internal control over financial reporting includes those policies and procedures that: (i) pertain to the maintenance of records that, in reasonable detail, accurately and fairly reflect the transactions and dispositions of the assets of the Corporation; (ii) provide reasonable assurance that transactions are recorded as necessary to permit preparation of financial statements in accordance with generally accepted accounting principles, and that receipts and expenditures of the Corporation are being made only in accordance with authorizations of management and directors of the Corporation; and (iii) provide reasonable assurance regarding prevention or timely detection of unauthorized acquisition, use or disposition of the Corporation’s assets that could have a material effect on the financial statements.
Because of its inherent limitations, internal control over financial reporting may not prevent or detect misstatements. Also, projections of any evaluation of effectiveness to future periods are subject to the risk that controls may become inadequate because of changes in conditions, or that the degree of compliance with the policies or procedures may deteriorate.
Management assessed the effectiveness of the Corporation’s internal control over financial reporting as of December 31, 2009. In making this assessment, management used the criteria set forth by the Committee of Sponsoring Organizations of the Treadway Commission (COSO) in Internal Control-Integrated Framework. Based on our assessment and those criteria, management concluded that the
76
Table of Contents
Corporation maintained effective internal control over financial reporting as of December 31, 2009. The effectiveness of our internal control over financial reporting as of December 31, 2009 has been audited by Crowe Horwath LLP, an independent registered public accounting firm, as stated in their report which is located in Item 8 of Form 10-K.
|
|

| |
| Joseph B. Bower, Jr. |
Charles R. Guarino | |
| President and Chief Executive Officer
|
Treasurer and Principal Financial Officer
| |
| Date: March 9, 2010 |
Date: March 9, 2010 | |

77
Table of Contents
None
PART III.
ITEM 10. DIRECTORS, EXECUTIVE OFFICERS AND CORPORATE GOVERNANCE
Information relating to our directors is incorporated herein by reference to disclosure under the caption “Election of Class 2 Directors” of the Proxy Statement for our 2010 Annual Meeting. Information relating to executive officers and corporate governance is included in Item I.
The Corporation’s board of directors has approved a Code of Ethics for Officers and Directors. The Code of Ethics can be found at the Bank’s website, www.bankcnb.com, under the “About Us” heading.
ITEM 11. EXECUTIVE COMPENSATION
Information concerning executive compensation is incorporated herein by reference to disclosure under the caption “Executive Compensation” of the Proxy Statement for our 2010 Annual Meeting.
ITEM 12. SECURITY OWNERSHIP OF CERTAIN BENEFICIAL OWNERS AND MANAGEMENT AND RELATED STOCKHOLDER MATTERS
Information concerning security ownership of certain beneficial owners and management is incorporated herein by reference to disclosure under the caption “Election of Class 2 Directors” of the Proxy Statement for our 2010 Annual Meeting.
Information concerning stock-based compensation plans is provided in Notes 1 and 16 to the Consolidated Financial Statements, which is included in Part II, Item 8 of this Annual Report on Form 10-K.
ITEM 13. CERTAIN RELATIONSHIPS AND RELATED TRANSACTIONS, AND DIRECTOR INDEPENDENCE
Information concerning loans and deposits with directors and executive officers is provided in Note 17 to the Consolidated Financial Statements, which is included in Part II, Item 8 of this Annual Report on Form 10-K. Additional information, including information concerning director independence, is incorporated herein by reference to disclosure appearing under the caption “Certain Transactions” of the Proxy Statement for our 2010 Annual Meeting.
ITEM 14. PRINCIPAL ACCOUNTANT FEES AND SERVICES
Information concerning services provided by the Corporation’s independent auditors, Crowe Horwath LLP, the audit committee’s pre-approval policies and procedures for such services, and fees paid by the Corporation to that firm, is incorporated herein by reference to disclosure under the captions “Audit Committee” and “Concerning the Independent Public Accountants” of the Proxy Statement for our 2010 Annual Meeting.
78
Table of Contents
PART IV.
ITEM 15. EXHIBITS AND FINANCIAL STATEMENT SCHEDULES
(a)(1) The following consolidated financial statements are set forth in Part II, Item 8:
Consolidated Balance Sheets as of December 31, 2009 and 2008
Consolidated Statements of Income for the years ended December 31, 2009, 2008 and 2007
| Consolidated | Statements of Cash Flows for the years ended December 31, 2009, 2008 and 2007 |
| Consolidated | Statements of Changes in Shareholders’ Equity for the years ended December 31, 2009, 2008 and 2007 |
Notes to Consolidated Financial Statements
(a)(2)Financial statement schedules are not applicable or are included in the consolidated financial statements or related notes.
(a)(3)The following exhibits (asterisk denotes management contract or compensatory plan) are filed as a part of this report:
| EXHIBIT |
DESCRIPTION | |
| 3.1 | Articles of Incorporation, filed as Appendix B to the 2005 Proxy Statement and incorporated herein by reference. | |
| 3.2 | By-Laws, filed as Appendix C to the 2005 Proxy Statement and incorporated herein by reference. | |
| 10.1 | Employment contract with William F. Falger, filed as Exhibit 10(iii)-1to Form 10-K for 2005 and incorporated herein by reference.* | |
| 10.2 | Employment contract with Joseph B. Bower, Jr., filed as Exhibit 10 (iii)-2 to Form 10-K for 2005 and incorporated herein by reference.* | |
| 10.3 | 1999 Stock Incentive Plan filed as Appendix A to the 1999 Proxy Statement and incorporated herein by reference. * | |
| 10.4 | Employment contract with Richard L. Sloppy, filed as Exhibit 10.4 to Form 10-K for 2008 and incorporated herein by reference. * | |
| 10.5 | 2009 Stock Incentive Plan, filed as Exhibit 10(iii)-4 to Registration Statement No. 333-159941 and incorporated herein by reference. | |
| 21 | Subsidiaries of the Registrant, filed as Exhibit 21 to the Form 10-K for 2006 and incorporated herein by reference. | |
| 23.1 | Consent of Independent Registered Public Accounting Firm, filed herewith. |
79
Table of Contents
| 31.1 | Certification of Principal Executive Officer, filed herewith. | |
| 31.2 | Certification of Principal Financial Officer, filed herewith. | |
| 32.1 | Section 1350 Certifications (CEO and Chief Financial Officer), filed herewith. | |
| 99.1 | Additional information mailed to shareholders with proxy statement and Form 10-K. |
80
Table of Contents
Pursuant to the requirements of Section 13 or 15(d) of the Securities Exchange Act of 1934, the registrant has duly caused this report to be signed on its behalf by the undersigned, thereunto duly authorized.
| CNB FINANCIAL CORPORATION (Registrant) | ||||||||
| Date: | March 9, 2010 | By: | /s/ Joseph B. Bower, Jr. | |||||
| JOSEPH B. BOWER, JR. | ||||||||
| President & Chief Executive Officer | ||||||||
Pursuant to the requirements of the Securities Exchange Act of 1934, this report has been signed below by the following persons on behalf of the registrant and in the capacities indicated on March 9, 2010.
| /s/ Joseph B. Bower, Jr. JOSEPH B. BOWER, JR. President and Director (Principal Executive Officer) |
/s/ Dennis L. Merrey DENNIS L. MERREY, Chairman |
|||||
| /s/ Charles R. Guarino CHARLES R. GUARINO Treasurer (Principal Financial and Accounting Officer) |
/s/ Deborah Dick Pontzer DEBORAH DICK PONTZER, Director |
|||||
| /s/ Robert E. Brown ROBERT E. BROWN, Director |
/s/ Jeffrey S. Powell JEFFREY S. POWELL, Director |
|||||
| /s/ William F. Falger WILLIAM F. FALGER, Director |
/s/ Charles H. Reams CHARLES H. REAMS, Director |
|||||
| /s/ Michael F. Lezzer MICHAEL F. LEZZER, Director |
/s/ James B. Ryan JAMES B. RYAN, Director |
|||||
| /s/ Robert W. Montler ROBERT W. MONTLER, Director |
/s/ Peter F. Smith PETER F. SMITH, Director |
|||||
| /s/ William C. Polacek WILLIAM C. POLACEK, Director |
||||||
81