Attached files
| file | filename |
|---|---|
| 8-K - 8-K - United Financial Bancorp, Inc. | a8-kxkbwconference8316.htm |
Create Your Balance
NASDAQ: UBNK KBW 2016 Community Bank Investor Conference
2
Who is United?
NASDAQ: UBNK
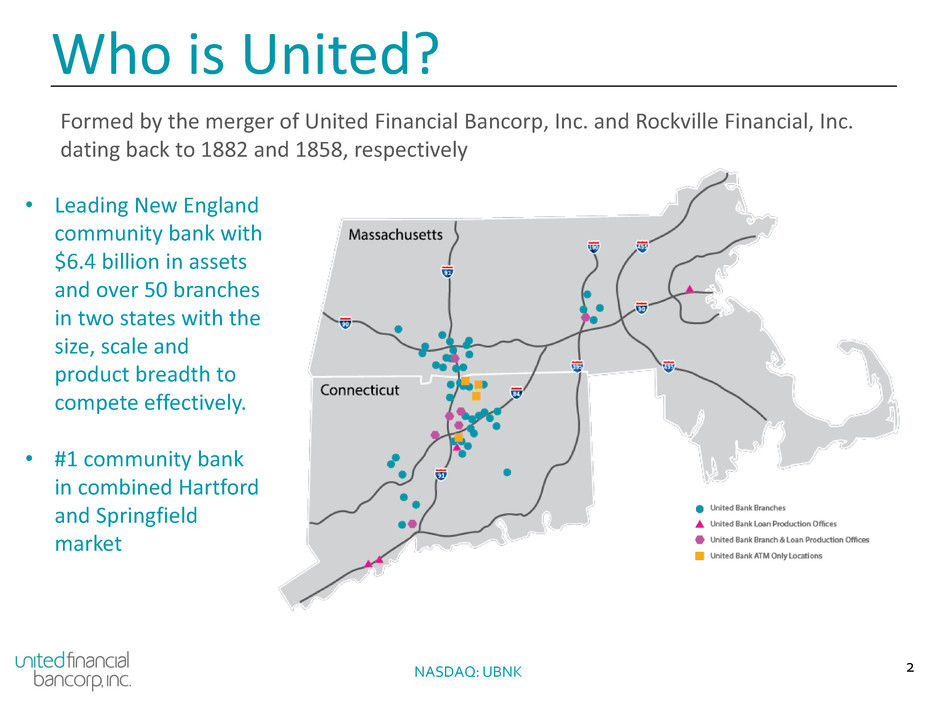
• Leading New England
community bank with
$6.4 billion in assets
and over 50 branches
in two states with the
size, scale and
product breadth to
compete effectively.
• #1 community bank
in combined Hartford
and Springfield
market
Formed by the merger of United Financial Bancorp, Inc. and Rockville Financial, Inc.
dating back to 1882 and 1858, respectively
3
Deposit Market Share
NASDAQ: UBNK
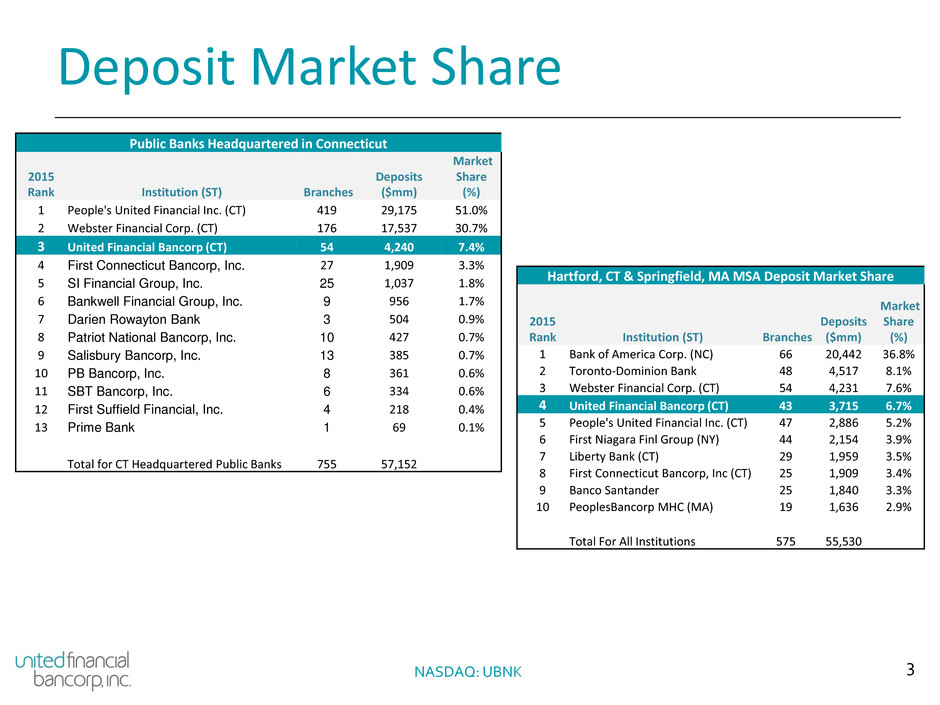
Hartford, CT & Springfield, MA MSA Deposit Market Share
2015
Rank Institution (ST) Branches
Deposits
($mm)
Market
Share
(%)
1 Bank of America Corp. (NC) 66 20,442 36.8%
2 Toronto-Dominion Bank 48 4,517 8.1%
3 Webster Financial Corp. (CT) 54 4,231 7.6%
4 United Financial Bancorp (CT) 43 3,715 6.7%
5 People's United Financial Inc. (CT) 47 2,886 5.2%
6 First Niagara Finl Group (NY) 44 2,154 3.9%
7 Liberty Bank (CT) 29 1,959 3.5%
8 First Connecticut Bancorp, Inc (CT) 25 1,909 3.4%
9 Banco Santander 25 1,840 3.3%
10 PeoplesBancorp MHC (MA) 19 1,636 2.9%
Total For All Institutions 575 55,530
Public Banks Headquartered in Connecticut
2015
Rank Institution (ST) Branches
Deposits
($mm)
Market
Share
(%)
1 People's United Financial Inc. (CT) 419 29,175 51.0%
2 Webster Financial Corp. (CT) 176 17,537 30.7%
3 United Financial Bancorp (CT) 54 4,240 7.4%
4 First Connecticut Bancorp, Inc. 27 1,909 3.3%
5 SI Financial Group, Inc. 25 1,037 1.8%
6 Bankwell Financial Group, Inc. 9 956 1.7%
7 Darien Rowayton Bank 3 504 0.9%
8 Patriot National Bancorp, Inc. 10 427 0.7%
9 Salisbury Bancorp, Inc. 13 385 0.7%
10 PB Bancorp, Inc. 8 361 0.6%
11 SBT Bancorp, Inc. 6 334 0.6%
12 First Suffield Financial, Inc. 4 218 0.4%
13 Prime Bank 1 69 0.1%
Total for CT Headquartered Public Banks 755 57,152
4
Core Markets Demographic Data
NASDAQ: UBNK
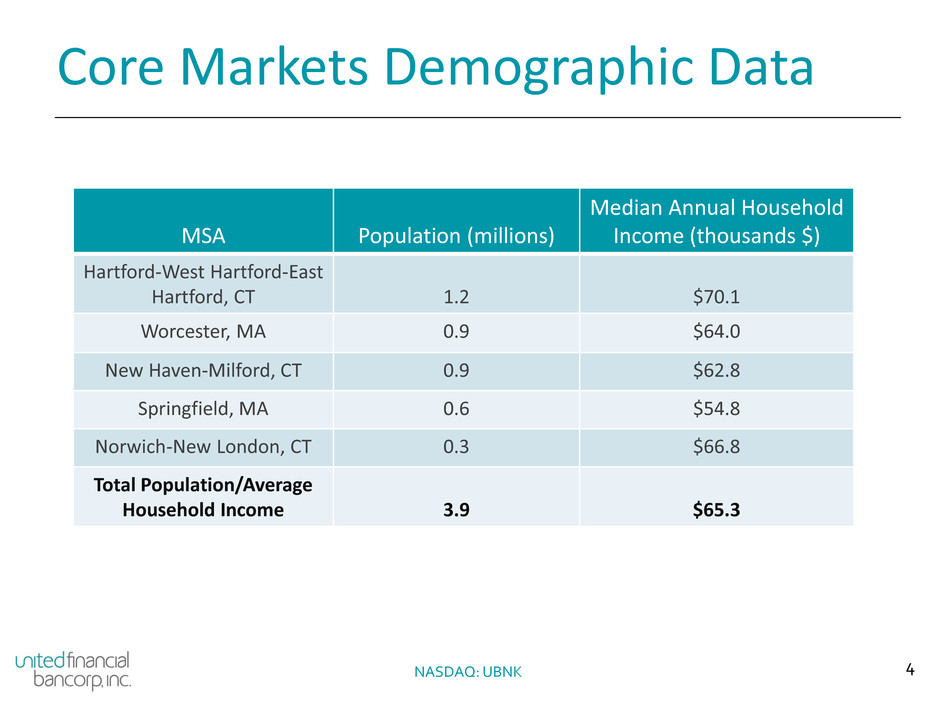
MSA
Population (millions)
Median Annual Household
Income (thousands $)
Hartford-West Hartford-East
Hartford, CT
1.2
$70.1
Worcester, MA 0.9 $64.0
New Haven-Milford, CT 0.9 $62.8
Springfield, MA 0.6 $54.8
Norwich-New London, CT 0.3 $66.8
Total Population/Average
Household Income
3.9
$65.3
5 NASDAQ: UBNK
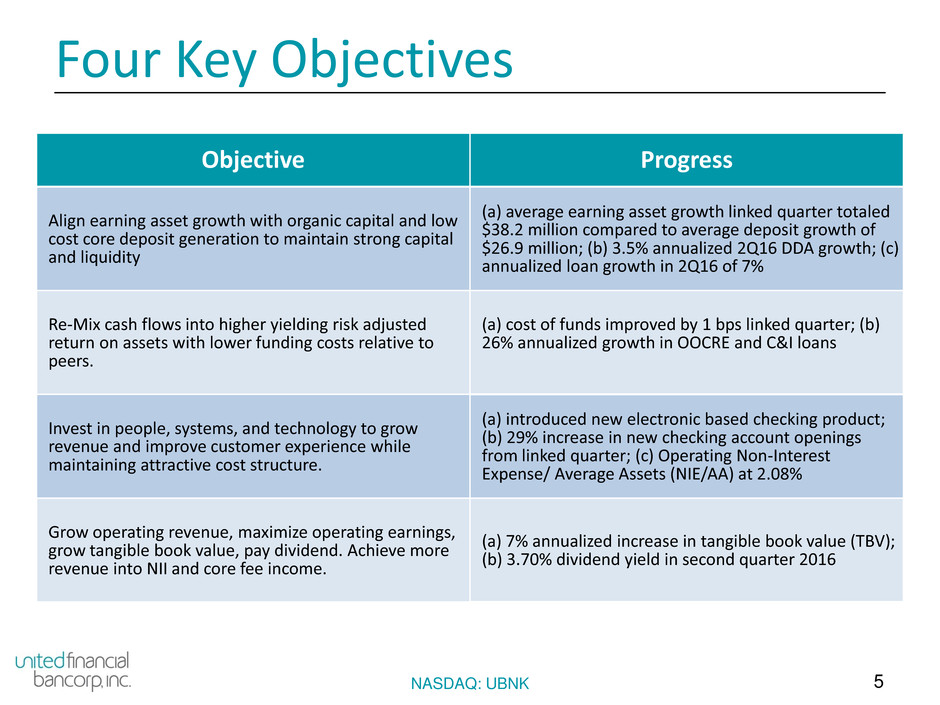
Four Key Objectives
Objective Progress
Align earning asset growth with organic capital and low
cost core deposit generation to maintain strong capital
and liquidity
(a) average earning asset growth linked quarter totaled
$38.2 million compared to average deposit growth of
$26.9 million; (b) 3.5% annualized 2Q16 DDA growth; (c)
annualized loan growth in 2Q16 of 7%
Re-Mix cash flows into higher yielding risk adjusted
return on assets with lower funding costs relative to
peers.
(a) cost of funds improved by 1 bps linked quarter; (b)
26% annualized growth in OOCRE and C&I loans
Invest in people, systems, and technology to grow
revenue and improve customer experience while
maintaining attractive cost structure.
(a) introduced new electronic based checking product;
(b) 29% increase in new checking account openings
from linked quarter; (c) Operating Non-Interest
Expense/ Average Assets (NIE/AA) at 2.08%
Grow operating revenue, maximize operating earnings,
grow tangible book value, pay dividend. Achieve more
revenue into NII and core fee income.
(a) 7% annualized increase in tangible book value (TBV);
(b) 3.70% dividend yield in second quarter 2016
6 NASDAQ: UBNK
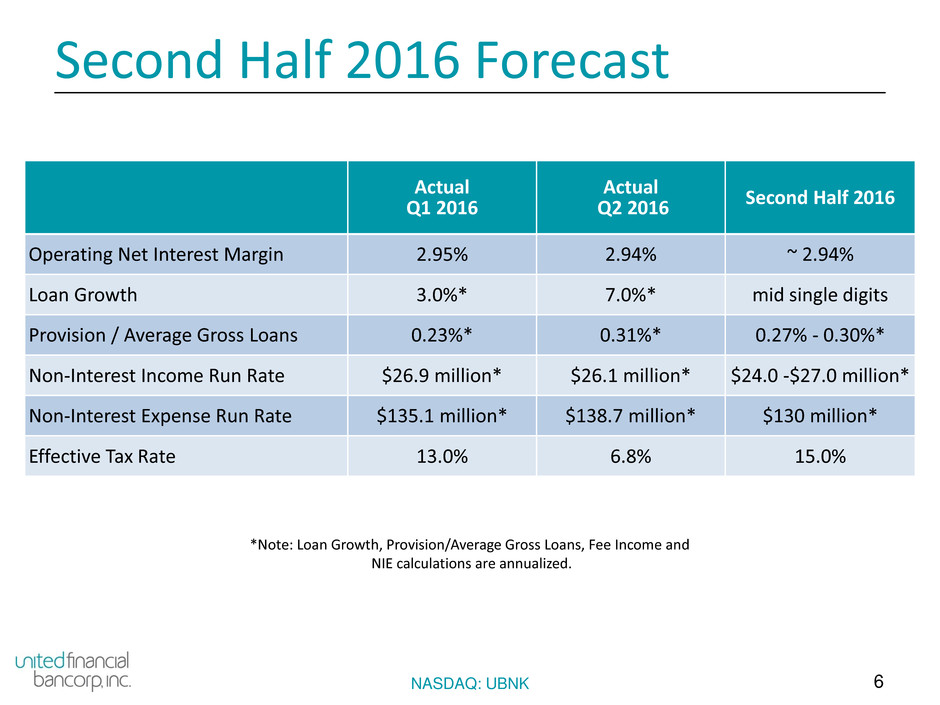
Second Half 2016 Forecast
Actual
Q1 2016
Actual
Q2 2016 Second Half 2016
Operating Net Interest Margin 2.95% 2.94% ~ 2.94%
Loan Growth 3.0%* 7.0%* mid single digits
Provision / Average Gross Loans 0.23%* 0.31%* 0.27% - 0.30%*
Non-Interest Income Run Rate $26.9 million* $26.1 million* $24.0 -$27.0 million*
Non-Interest Expense Run Rate $135.1 million* $138.7 million* $130 million*
Effective Tax Rate 13.0% 6.8% 15.0%
*Note: Loan Growth, Provision/Average Gross Loans, Fee Income and
NIE calculations are annualized.
7
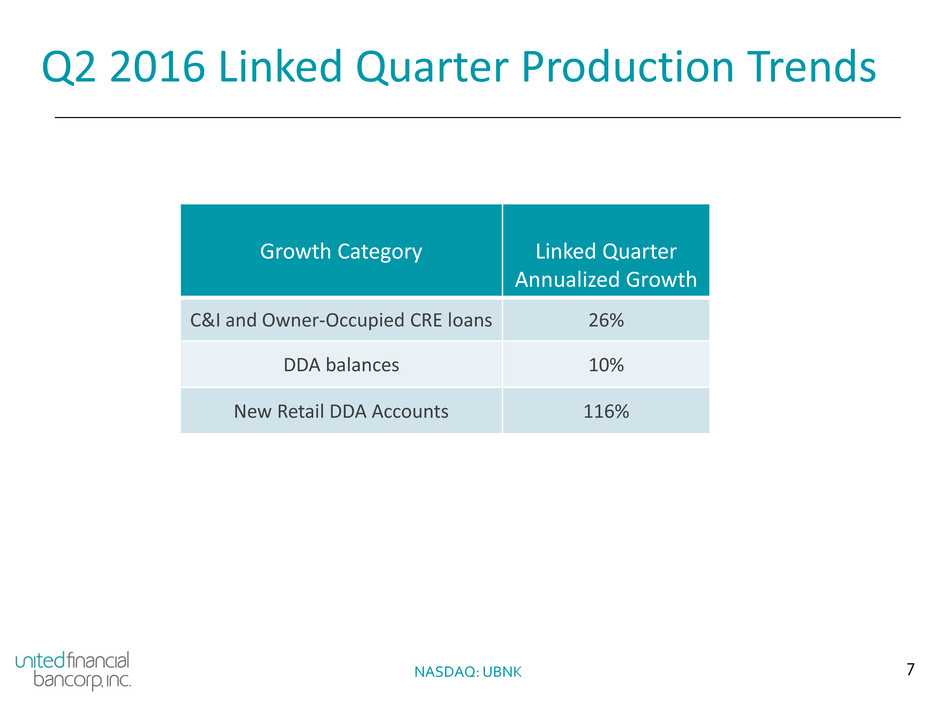
Q2 2016 Linked Quarter Production Trends
NASDAQ: UBNK
Growth Category
Linked Quarter
Annualized Growth
C&I and Owner-Occupied CRE loans 26%
DDA balances 10%
New Retail DDA Accounts 116%
8 NASDAQ: UBNK
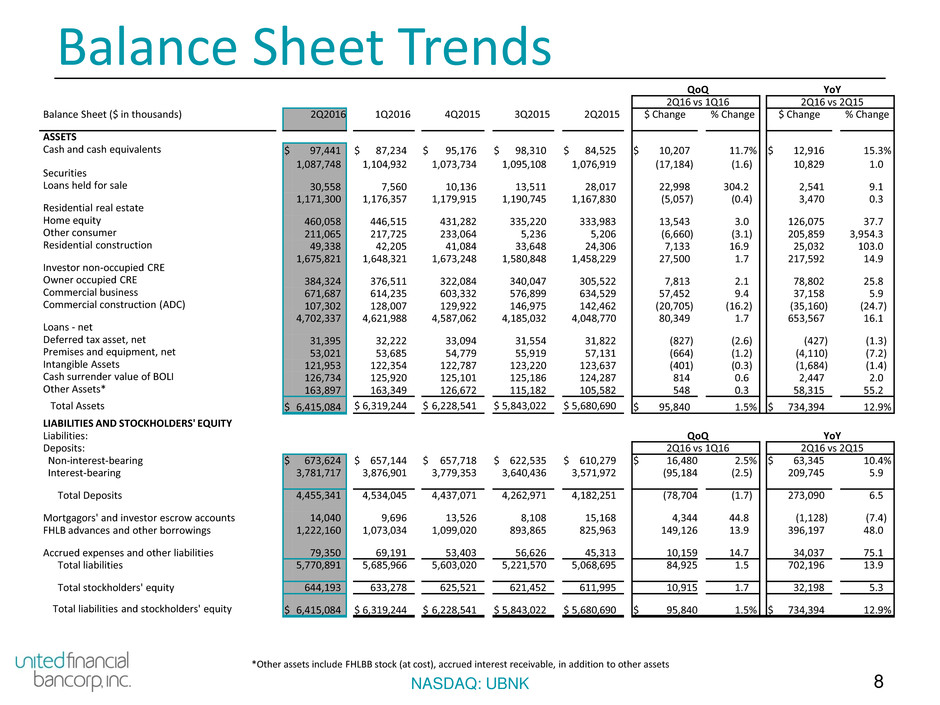
Balance Sheet Trends
QoQ YoY
2Q16 vs 1Q16 2Q16 vs 2Q15
Balance Sheet ($ in thousands) 2Q2016 1Q2016 4Q2015 3Q2015 2Q2015 $ Change % Change $ Change % Change
ASSETS
Cash and cash equivalents $ 97,441 $ 87,234 $ 95,176 $ 98,310 $ 84,525 $ 10,207 11.7 % $ 12,916 15.3 %
Securities
1,087,748 1,104,932 1,073,734 1,095,108 1,076,919 (17,184 ) (1.6 ) 10,829 1.0
Loans held for sale 30,558 7,560 10,136 13,511 28,017 22,998 304.2 2,541 9.1
Residential real estate
1,171,300 1,176,357 1,179,915 1,190,745 1,167,830 (5,057 ) (0.4 ) 3,470 0.3
Home equity 460,058 446,515 431,282 335,220 333,983 13,543 3.0 126,075 37.7
Other consumer 211,065 217,725 233,064 5,236 5,206 (6,660 ) (3.1 ) 205,859 3,954.3
Residential construction 49,338 42,205 41,084 33,648 24,306 7,133 16.9 25,032 103.0
Investor non-occupied CRE
1,675,821 1,648,321 1,673,248 1,580,848 1,458,229 27,500 1.7 217,592 14.9
Owner occupied CRE 384,324 376,511 322,084 340,047 305,522 7,813 2.1 78,802 25.8
Commercial business 671,687 614,235 603,332 576,899 634,529 57,452 9.4 37,158 5.9
Commercial construction (ADC) 107,302 128,007 129,922 146,975 142,462 (20,705 ) (16.2 ) (35,160 ) (24.7 )
Loans - net
4,702,337 4,621,988 4,587,062 4,185,032 4,048,770 80,349 1.7 653,567 16.1
Deferred tax asset, net 31,395 32,222 33,094 31,554 31,822 (827 ) (2.6 ) (427 ) (1.3 )
Premises and equipment, net 53,021 53,685 54,779 55,919 57,131 (664 ) (1.2 ) (4,110 ) (7.2 )
Intangible Assets 121,953 122,354 122,787 123,220 123,637 (401 ) (0.3 ) (1,684 ) (1.4 )
Cash surrender value of BOLI 126,734 125,920 125,101 125,186 124,287 814 0.6 2,447 2.0
Other Assets* 163,897 163,349 126,672 115,182 105,582 548 0.3 58,315 55.2
Total Assets $ 6,415,084 $ 6,319,244 $ 6,228,541 $ 5,843,022 $ 5,680,690 $ 95,840 1.5 % $ 734,394 12.9 %
LIABILITIES AND STOCKHOLDERS' EQUITY
Liabilities: QoQ YoY
Deposits: 2Q16 vs 1Q16 2Q16 vs 2Q15
Non-interest-bearing $ 673,624 $ 657,144 $ 657,718 $ 622,535 $ 610,279 $ 16,480 2.5 % $ 63,345 10.4 %
Interest-bearing 3,781,717 3,876,901 3,779,353 3,640,436 3,571,972 (95,184 (2.5 ) 209,745 5.9
Total Deposits 4,455,341 4,534,045 4,437,071 4,262,971 4,182,251 (78,704 (1.7 ) 273,090 6.5
Mortgagors' and investor escrow accounts 14,040 9,696 13,526 8,108 15,168 4,344 44.8 (1,128 ) (7.4 )
FHLB advances and other borrowings 1,222,160 1,073,034 1,099,020 893,865 825,963 149,126 13.9 396,197 48.0
Accrued expenses and other liabilities 79,350 69,191 53,403 56,626 45,313 10,159 14.7 34,037 75.1
Total liabilities 5,770,891 5,685,966 5,603,020 5,221,570 5,068,695 84,925 1.5 702,196 13.9
Total stockholders' equity 644,193 633,278 625,521 621,452 611,995 10,915 1.7 32,198 5.3
Total liabilities and stockholders' equity $ 6,415,084 $ 6,319,244 $ 6,228,541 $ 5,843,022 $ 5,680,690 $ 95,840 1.5 % $ 734,394 12.9 %
*Other assets include FHLBB stock (at cost), accrued interest receivable, in addition to other assets
9 NASDAQ: UBNK
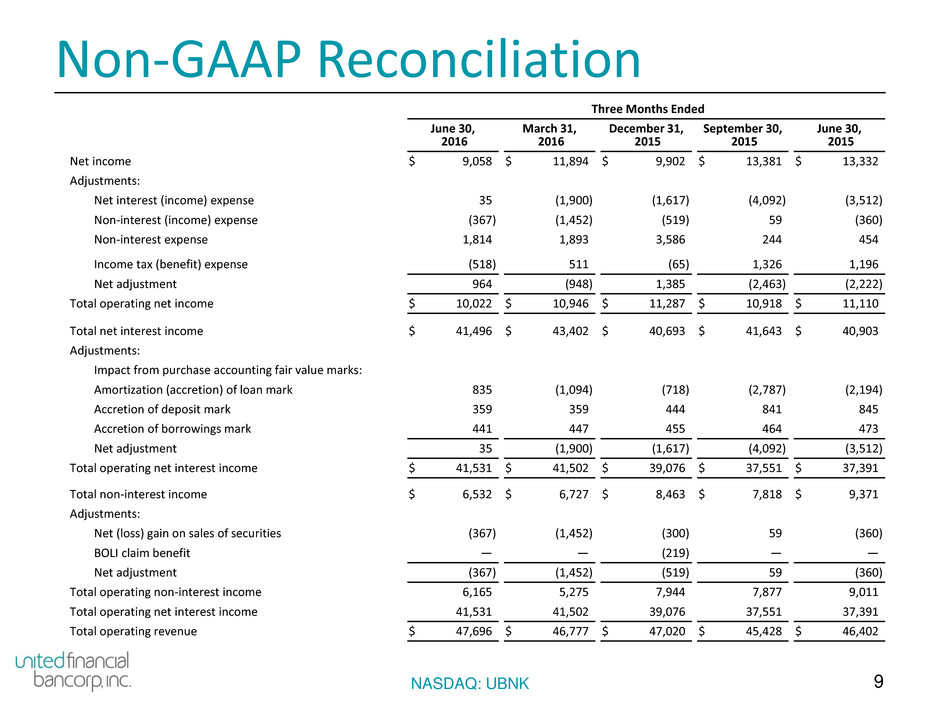
Non-GAAP Reconciliation
Three Months Ended
June 30,
2016
March 31,
2016
December 31,
2015
September 30,
2015
June 30,
2015
Net income $ 9,058 $ 11,894 $ 9,902 $ 13,381 $ 13,332
Adjustments:
Net interest (income) expense 35 (1,900 ) (1,617 ) (4,092 ) (3,512 )
Non-interest (income) expense (367 ) (1,452 ) (519 ) 59 (360 )
Non-interest expense 1,814 1,893 3,586 244 454
Income tax (benefit) expense (518 ) 511 (65 ) 1,326 1,196
Net adjustment 964 (948 ) 1,385 (2,463 ) (2,222 )
Total operating net income $ 10,022 $ 10,946 $ 11,287 $ 10,918 $ 11,110
Total net interest income $ 41,496 $ 43,402 $ 40,693 $ 41,643 $ 40,903
Adjustments:
Impact from purchase accounting fair value marks:
Amortization (accretion) of loan mark 835 (1,094 ) (718 ) (2,787 ) (2,194 )
Accretion of deposit mark 359 359 444 841 845
Accretion of borrowings mark 441 447 455 464 473
Net adjustment 35 (1,900 ) (1,617 ) (4,092 ) (3,512 )
Total operating net interest income $ 41,531 $ 41,502 $ 39,076 $ 37,551 $ 37,391
Total non-interest income $ 6,532 $ 6,727 $ 8,463 $ 7,818 $ 9,371
Adjustments:
Net (loss) gain on sales of securities (367 ) (1,452 ) (300 ) 59 (360 )
BOLI claim benefit — — (219 ) — —
Net adjustment (367 ) (1,452 ) (519 ) 59 (360 )
Total operating non-interest income 6,165 5,275 7,944 7,877 9,011
Total operating net interest income 41,531 41,502 39,076 37,551 37,391
Total operating revenue $ 47,696 $ 46,777 $ 47,020 $ 45,428 $ 46,402
10 NASDAQ: UBNK
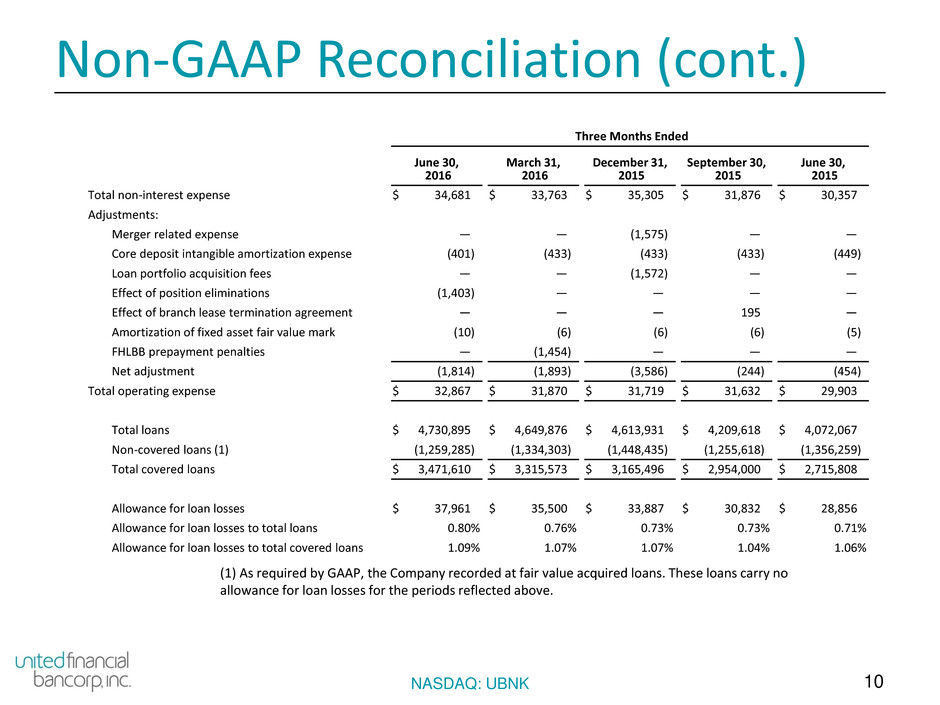
Non-GAAP Reconciliation (cont.)
Three Months Ended
June 30,
2016
March 31,
2016
December 31,
2015
September 30,
2015
June 30,
2015
Total non-interest expense $ 34,681 $ 33,763 $ 35,305 $ 31,876 $ 30,357
Adjustments:
Merger related expense — — (1,575 ) — —
Core deposit intangible amortization expense (401 ) (433 ) (433 ) (433 ) (449 )
Loan portfolio acquisition fees — — (1,572 ) — —
Effect of position eliminations (1,403 ) — — — —
Effect of branch lease termination agreement — — — 195 —
Amortization of fixed asset fair value mark (10 ) (6 ) (6 ) (6 ) (5 )
FHLBB prepayment penalties — (1,454 ) — — —
Net adjustment (1,814 ) (1,893 ) (3,586 ) (244 ) (454 )
Total operating expense $ 32,867 $ 31,870 $ 31,719 $ 31,632 $ 29,903
Total loans $ 4,730,895 $ 4,649,876 $ 4,613,931 $ 4,209,618 $ 4,072,067
Non-covered loans (1) (1,259,285 ) (1,334,303 ) (1,448,435 ) (1,255,618 ) (1,356,259 )
Total covered loans $ 3,471,610 $ 3,315,573 $ 3,165,496 $ 2,954,000 $ 2,715,808
Allowance for loan losses $ 37,961 $ 35,500 $ 33,887 $ 30,832 $ 28,856
Allowance for loan losses to total loans 0.80 % 0.76 % 0.73 % 0.73 % 0.71 %
Allowance for loan losses to total covered loans 1.09 % 1.07 % 1.07 % 1.04 % 1.06 %
(1) As required by GAAP, the Company recorded at fair value acquired loans. These loans carry no
allowance for loan losses for the periods reflected above.
11 NASDAQ: UBNK
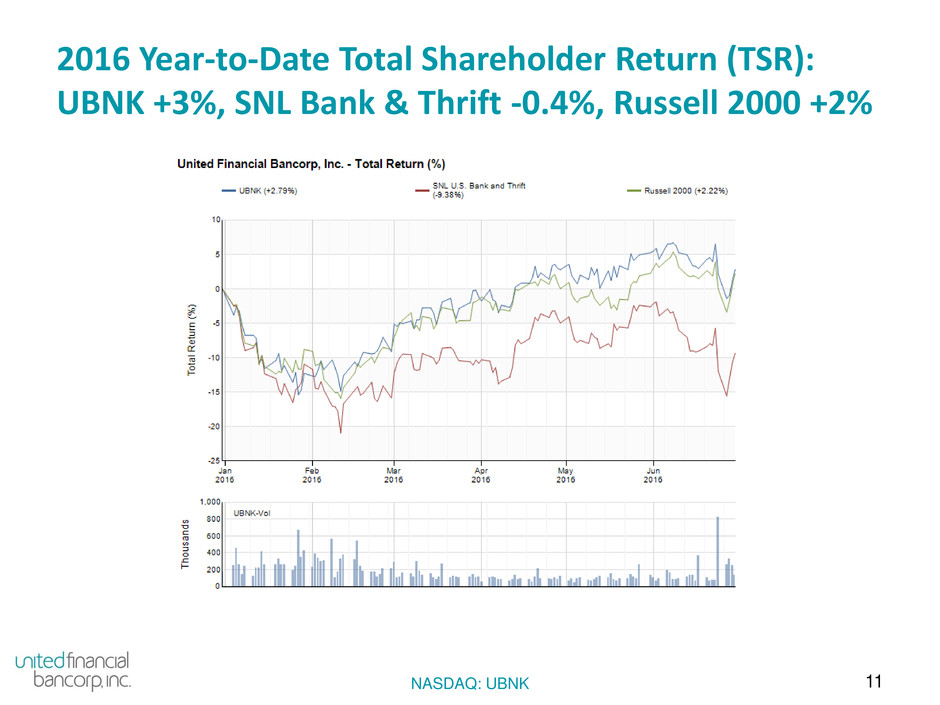
2016 Year-to-Date Total Shareholder Return (TSR):
UBNK +3%, SNL Bank & Thrift -0.4%, Russell 2000 +2%
12 NASDAQ: UBNK
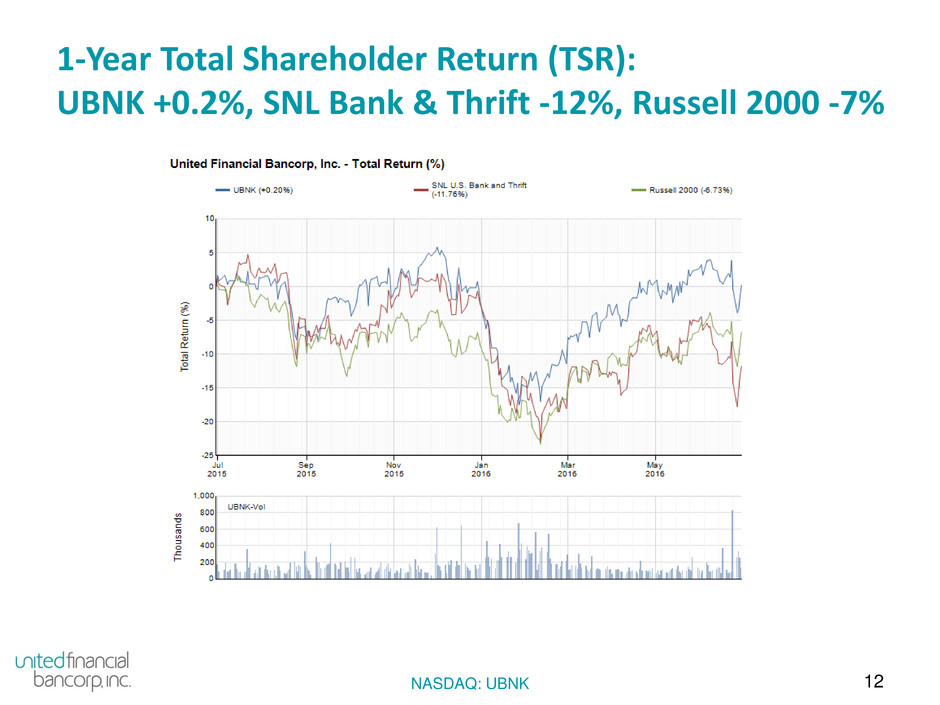
1-Year Total Shareholder Return (TSR):
UBNK +0.2%, SNL Bank & Thrift -12%, Russell 2000 -7%
13 NASDAQ: UBNK
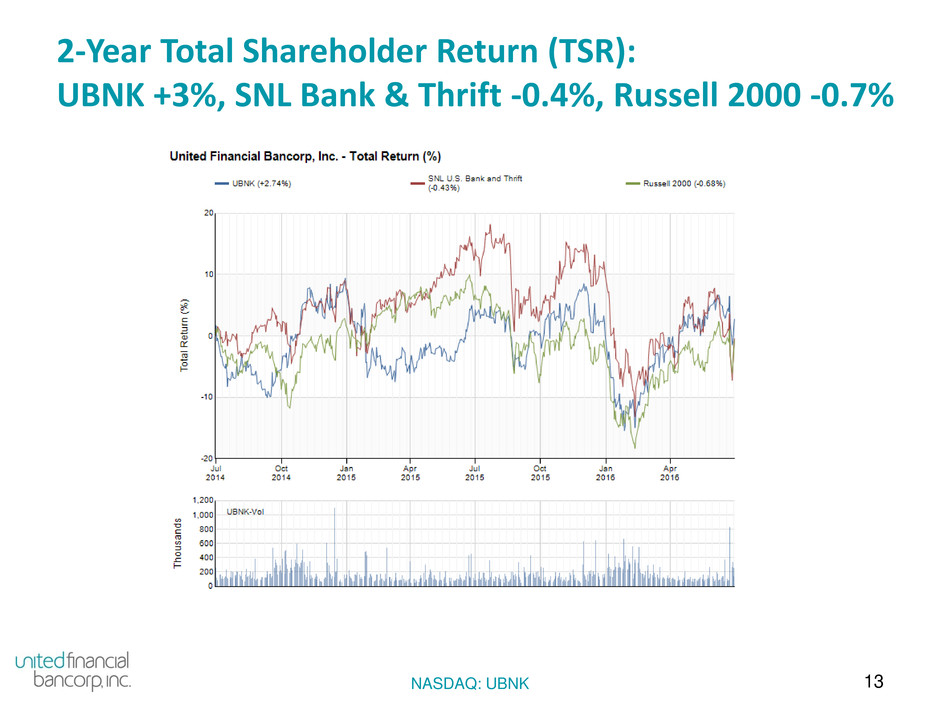
2-Year Total Shareholder Return (TSR):
UBNK +3%, SNL Bank & Thrift -0.4%, Russell 2000 -0.7%
14 NASDAQ: UBNK
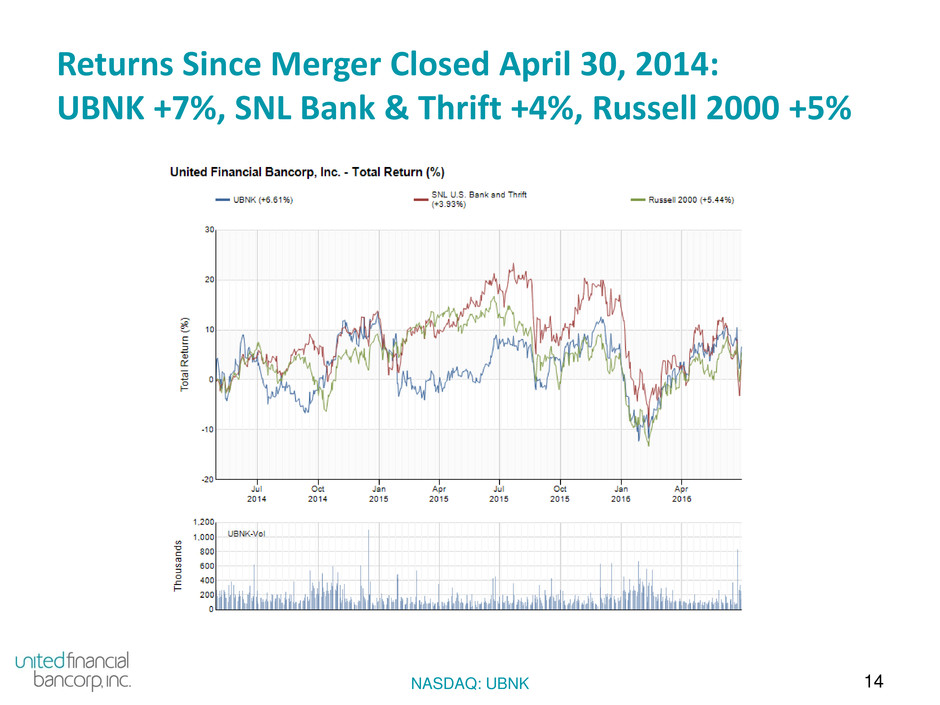
Returns Since Merger Closed April 30, 2014:
UBNK +7%, SNL Bank & Thrift +4%, Russell 2000 +5%
15 NASDAQ: UBNK
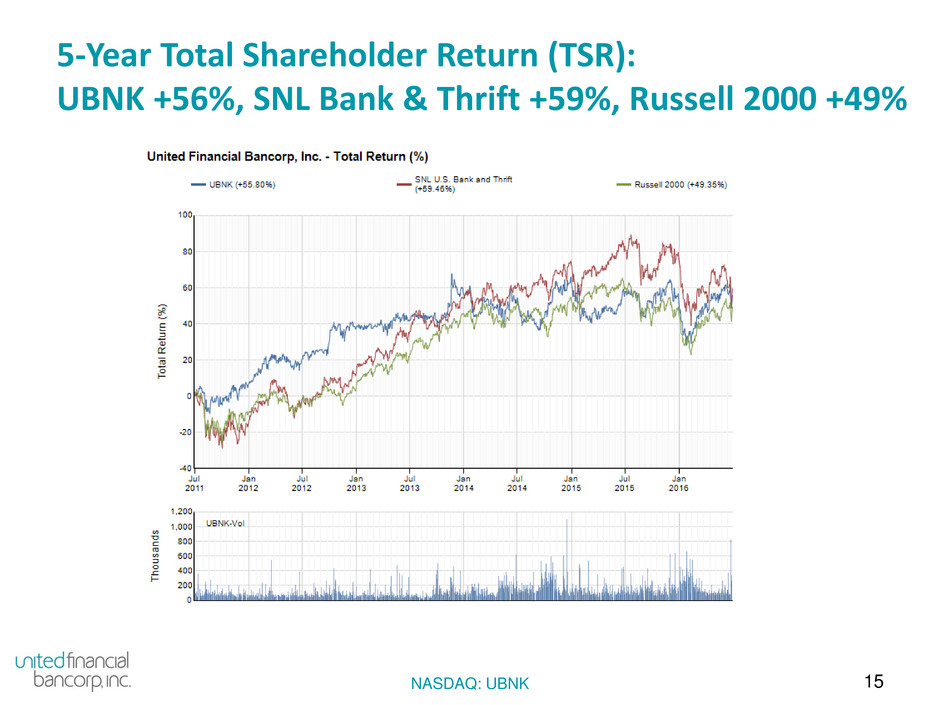
5-Year Total Shareholder Return (TSR):
UBNK +56%, SNL Bank & Thrift +59%, Russell 2000 +49%
16 NASDAQ: UBNK
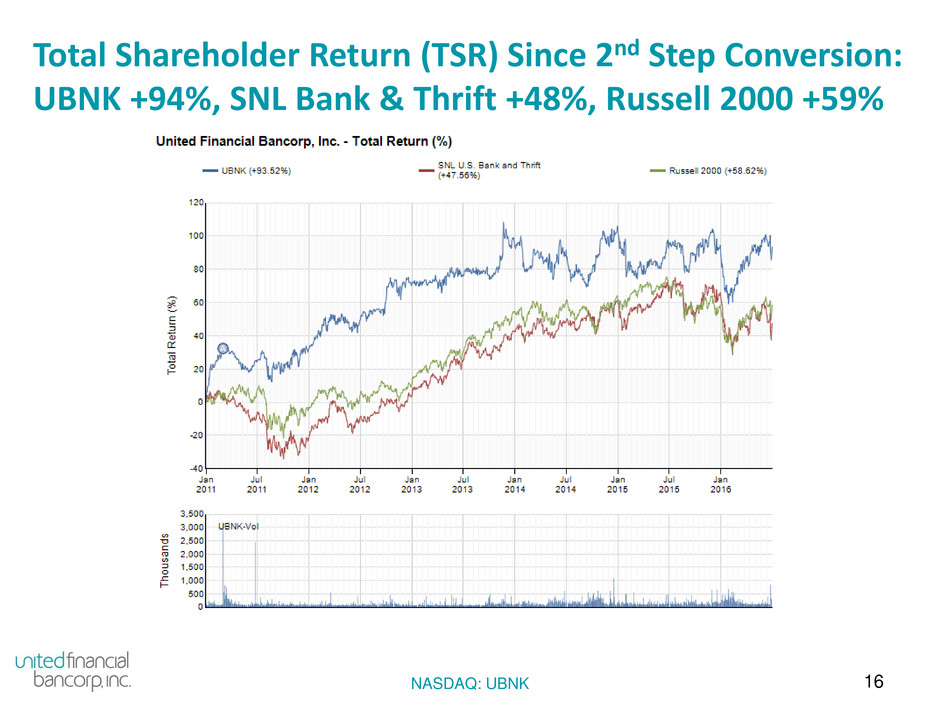
Total Shareholder Return (TSR) Since 2nd Step Conversion:
UBNK +94%, SNL Bank & Thrift +48%, Russell 2000 +59%
17 NASDAQ: UBNK
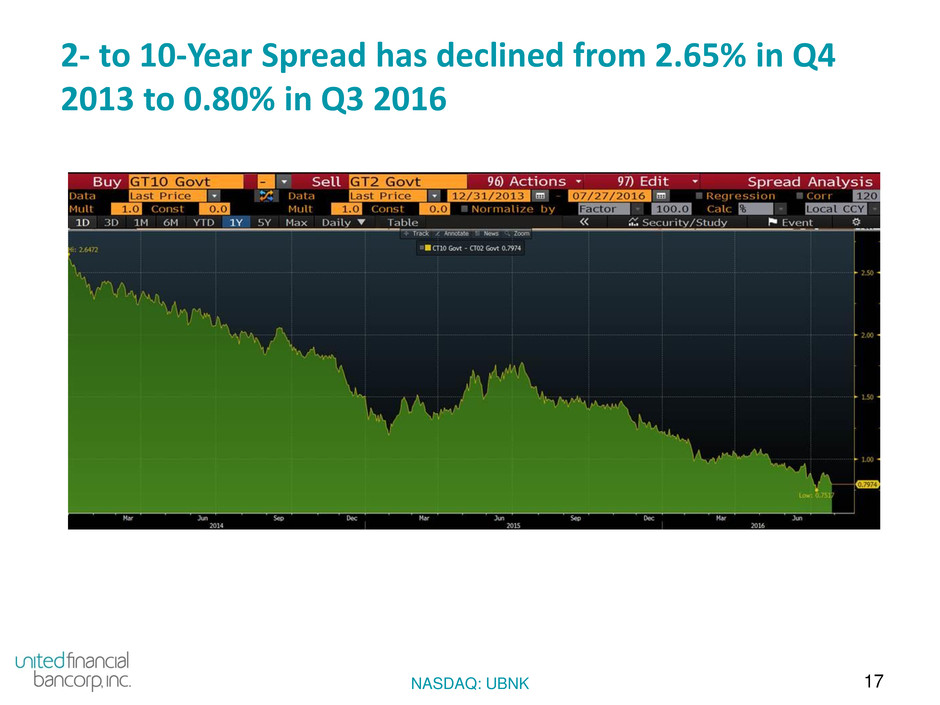
2- to 10-Year Spread has declined from 2.65% in Q4
2013 to 0.80% in Q3 2016
18
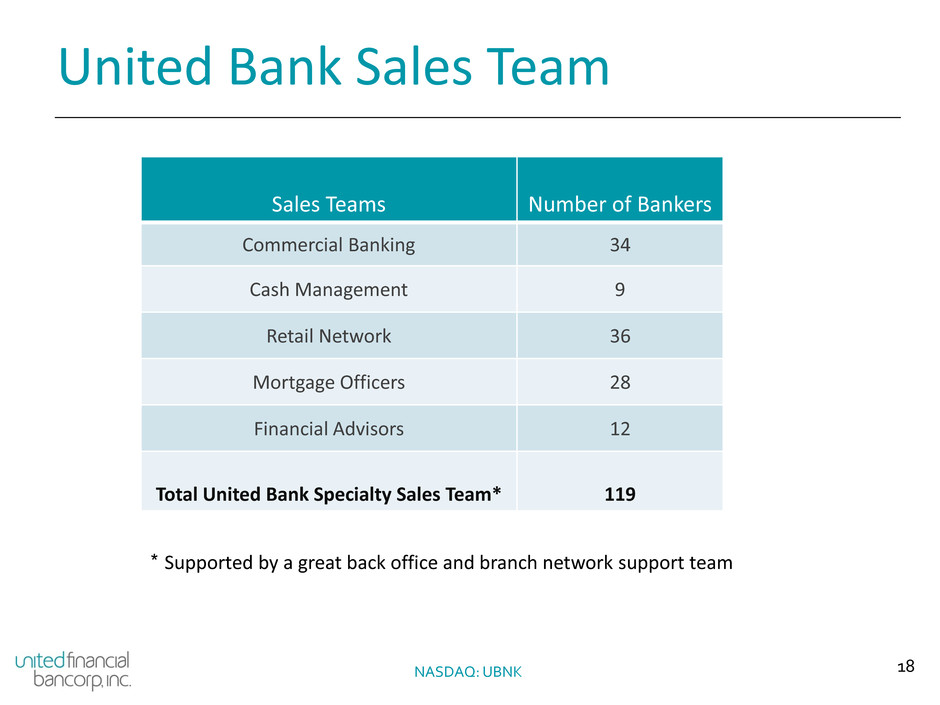
United Bank Sales Team
NASDAQ: UBNK
Sales Teams
Number of Bankers
Commercial Banking 34
Cash Management 9
Retail Network 36
Mortgage Officers 28
Financial Advisors 12
Total United Bank Specialty Sales Team*
119
* Supported by a great back office and branch network support team
19 NASDAQ: UBNK
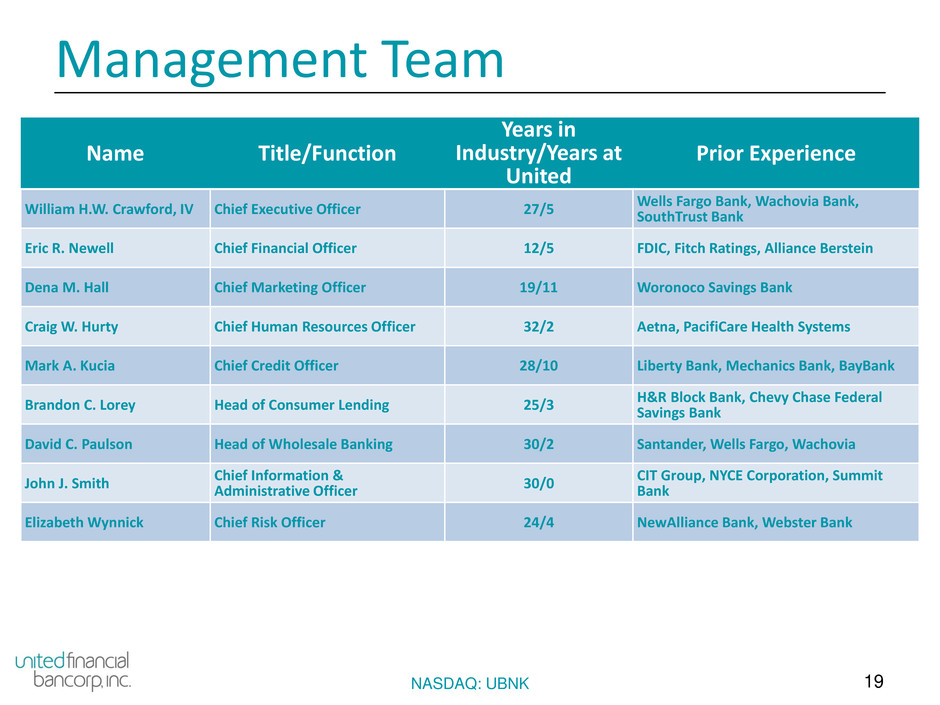
Management Team
Name Title/Function
Years in
Industry/Years at
United
Prior Experience
William H.W. Crawford, IV Chief Executive Officer 27/5 Wells Fargo Bank, Wachovia Bank, SouthTrust Bank
Eric R. Newell Chief Financial Officer 12/5 FDIC, Fitch Ratings, Alliance Berstein
Dena M. Hall Chief Marketing Officer 19/11 Woronoco Savings Bank
Craig W. Hurty Chief Human Resources Officer 32/2 Aetna, PacifiCare Health Systems
Mark A. Kucia Chief Credit Officer 28/10 Liberty Bank, Mechanics Bank, BayBank
Brandon C. Lorey Head of Consumer Lending 25/3 H&R Block Bank, Chevy Chase Federal Savings Bank
David C. Paulson Head of Wholesale Banking 30/2 Santander, Wells Fargo, Wachovia
John J. Smith Chief Information & Administrative Officer 30/0
CIT Group, NYCE Corporation, Summit
Bank
Elizabeth Wynnick Chief Risk Officer 24/4 NewAlliance Bank, Webster Bank
20
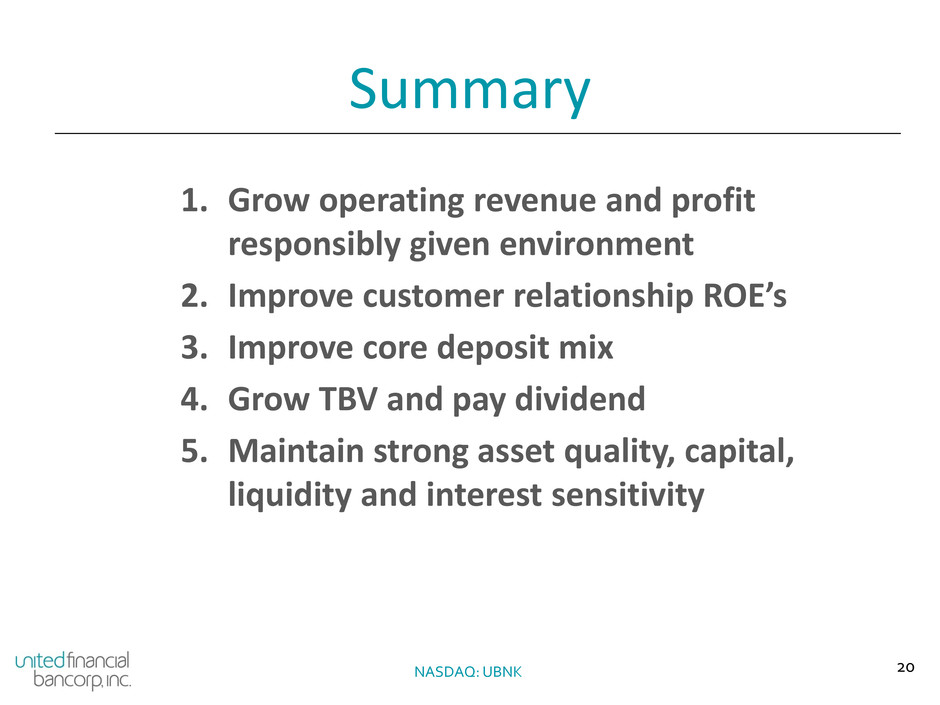
Summary
NASDAQ: UBNK
1. Grow operating revenue and profit
responsibly given environment
2. Improve customer relationship ROE’s
3. Improve core deposit mix
4. Grow TBV and pay dividend
5. Maintain strong asset quality, capital,
liquidity and interest sensitivity
