Attached files
| file | filename |
|---|---|
| 8-K - FORM 8-K - NN INC | d234186d8k.htm |
| EX-99.1 - EX-99.1 - NN INC | d234186dex991.htm |
| Exhibit 99.2
|

Second Quarter 2016 Earnings Release
August 4, 2016
|
|
Forward Looking Statements & Disclosures
Forward Looking Statement: With the exception of the historical information contained in this presentation, the matters described herein contain forward-looking statements that are made pursuant to the safe harbor provisions of the Private Securities Litigation Reform Act of 1995. Forward-looking statements involve a number of risks and uncertainties that may cause actual results to be materially different from such forward-looking statements. Such factors include, among others, general economic conditions and economic conditions in the industrial sector, competitive influences, risks that current customers will commence or increase captive production, risks of capacity underutilization, quality issues, availability of raw materials, currency and other risks associated with international trade, the Company’s dependence on certain major customers, and other risk factors and cautionary statements listed from time to time in the Company’s periodic reports filed with the Securities and Exchange Commission, including, but not limited to, the Company’s Annual Report on 10-K for the fiscal year ended December 31, 2015.
With respect to any non-GAAP financial measures included in the following presentation, the accompanying information required by SEC Regulation G can be found at the back of this presentation or in the “Investor Relations” section of the Company’s web site, www.nninc.com, under the heading “News & Events” and subheading “Presentations.”
Disclaimer: NN disclaims any obligation to update any such factors or to publicly announce the result of any revisions to any of the forward-looking statements included herein or therein to reflect future events or developments.
2
|
|

Second Quarter
|
|
Highlights of 2nd
Quarter 2016
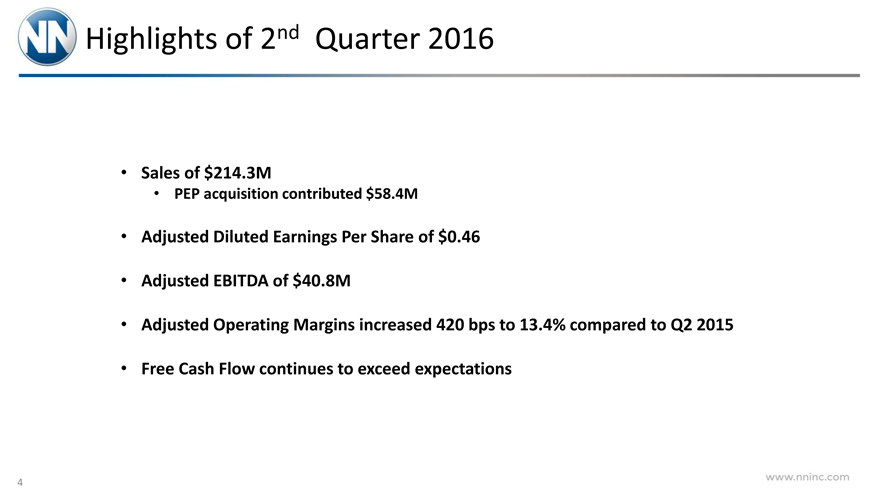
Sales of $214.3M
PEP acquisition contributed $58.4M
Adjusted Diluted Earnings Per Share of $0.46
Adjusted EBITDA of $40.8M
Adjusted Operating Margins increased 420 bps to 13.4% compared to Q2 2015
Free Cash Flow continues to exceed expectations
4
|
|
2nd Quarter 2016 Financial Summary
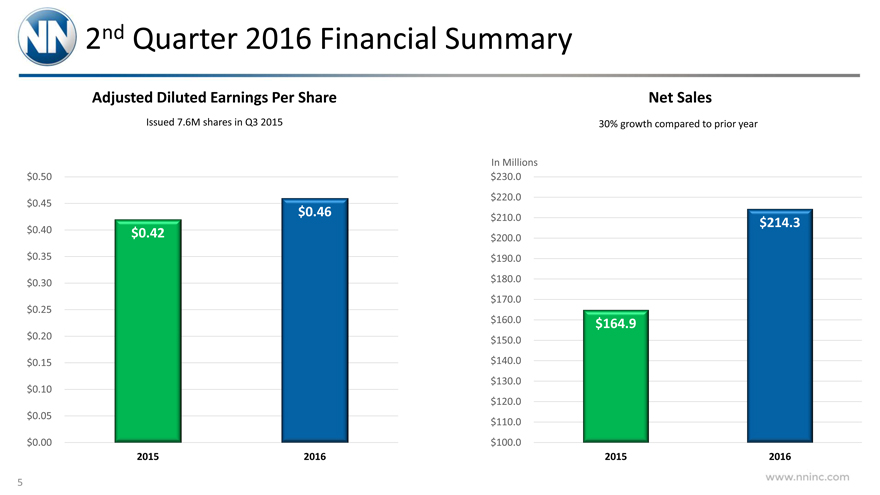
Adjusted Diluted Earnings Per Share Net Sales
Issued 7.6M shares in Q3 201530% growth compared to prior year
In Millions
$0.50 $230.0
$0.45 $220.0
$0.46
$210.0$214.3
$0.40 $0.42$200.0
$0.35 $190.0
$0.30 $180.0
$170.0
$0.25
$160.0$164.9
$0.20 $150.0
$0.15 $140.0
$130.0
$0.10
$120.0
$0.05 $110.0
$0.00 $100.0
2015 201620152016
5
|
|
2nd Quarter 2016 Financial Summary
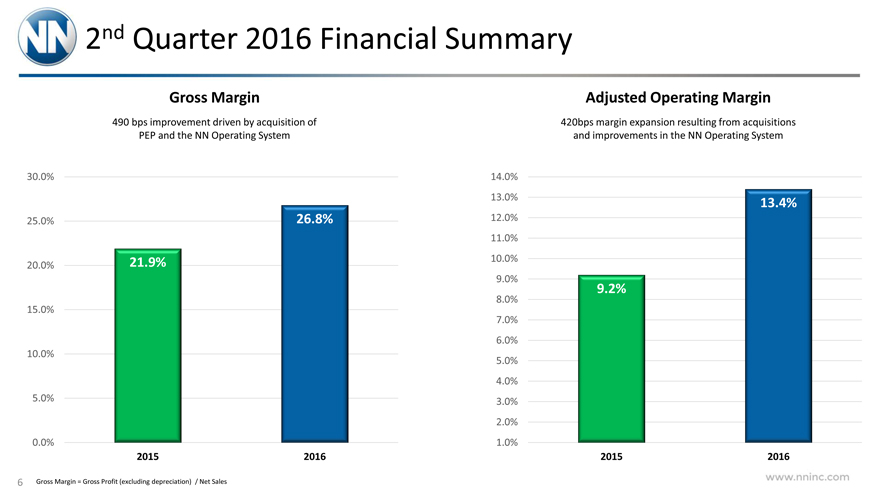
Gross Margin Adjusted Operating Margin
490 bps improvement driven by acquisition of 420bps margin expansion resulting from acquisitions
PEP and the NN Operating System and improvements in the NN Operating System
30.0% 14.0%
13.0%13.4%
25.0% 26.8%12.0%
11.0%
20.0% 21.9% 10.0%
9.0%
9.2%
8.0%
15.0%
7.0%
6.0%
10.0%
5.0%
4.0%
5.0% 3.0%
2.0%
0.0% 1.0%
2015 201620152016
6 Gross Margin = Gross Profit (excluding depreciation) / Net Sales
|
|
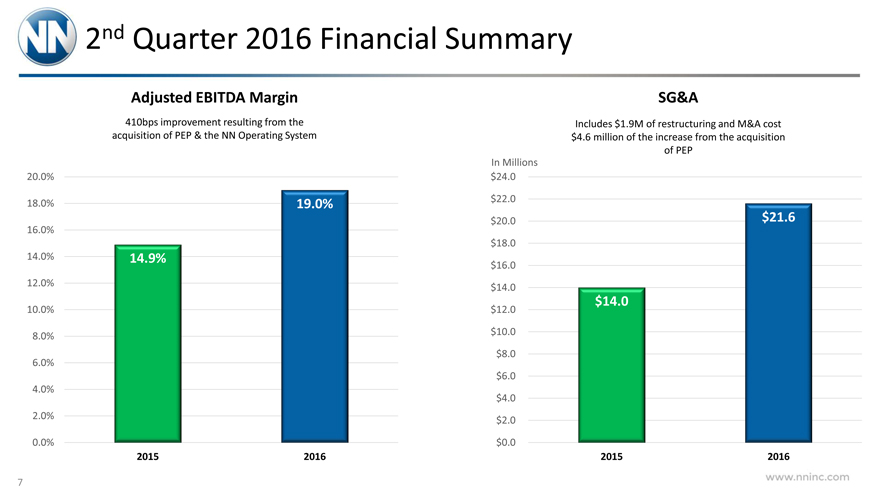
2nd Quarter 2016 Financial Summary
Adjusted EBITDA Margin SG&A
410bps improvement resulting from the Includes $1.9M of restructuring and M&A cost
acquisition of PEP & the NN Operating System $4.6 million of the increase from theacquisition
of PEP
In Millions
20.0% $24.0
18.0% 19.0% $22.0
$20.0$21.6
16.0%
$18.0
14.0% 14.9% $16.0
12.0% $14.0
$14.0
10.0% $12.0
8.0% $10.0
$8.0
6.0%
$6.0
4.0%
$4.0
2.0% $2.0
0.0% $0.0
2015 201620152016
7
|
|
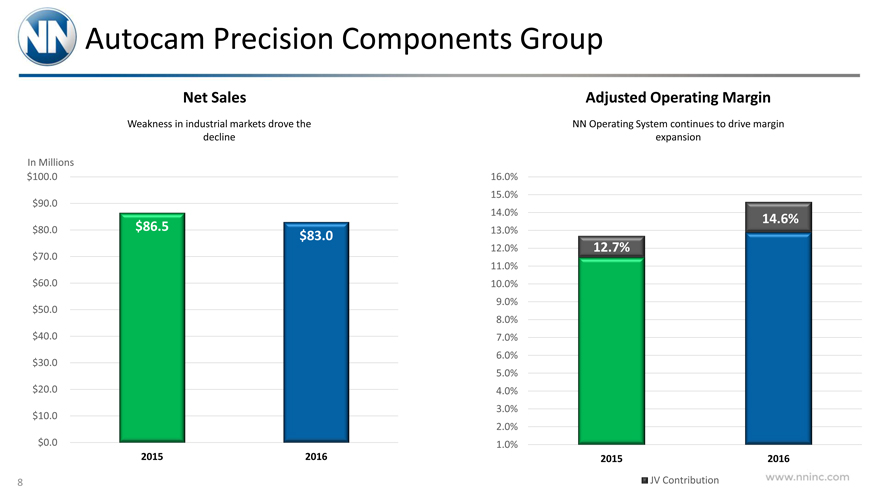
Autocam Precision Components Group
Net SalesAdjusted Operating Margin
Weakness in industrial markets drove the NN Operating System continues to drive margin
declineexpansion
In Millions
$100.0 16.0%
15.0%
$90.0
14.0%14.6%
$80.0 $86.5 13.0%
$83.0
12.0%12.7%
$70.0
11.0%
$60.0 10.0%
9.0%
$50.0
8.0%
$40.0 7.0%
6.0%
$30.0
5.0%
$20.0 4.0%
3.0%
$10.0
2.0%
$0.0 1.0%
2015 201620152016
8 JV Contribution
|
|
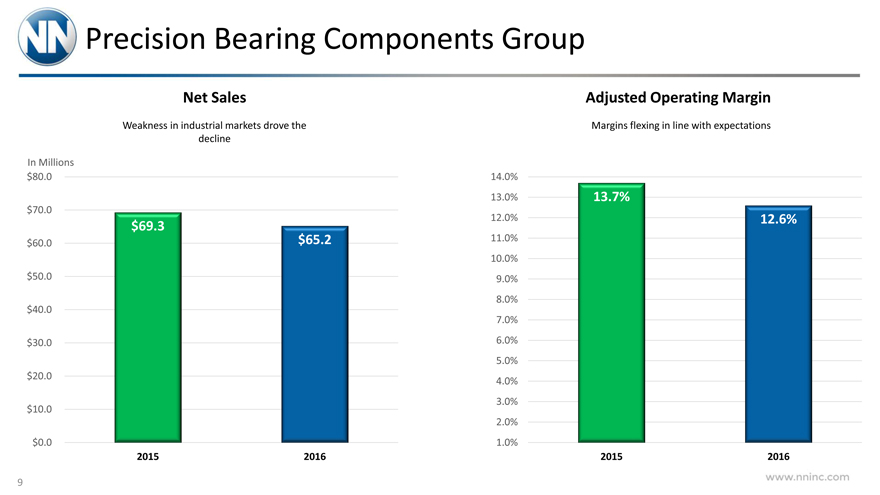
Precision Bearing Components Group
Net SalesAdjusted Operating Margin
Weakness in industrial markets drove the Margins flexing in line with expectations
decline
In Millions
$80.0 14.0%
13.0%13.7%
$70.0
$69.3 12.0%12.6%
$60.0 $65.211.0%
10.0%
$50.0 9.0%
8.0%
$40.0
7.0%
$30.0 6.0%
5.0%
$20.0 4.0%
3.0%
$10.0
2.0%
$0.0 1.0%
2015 201620152016
9
|
|
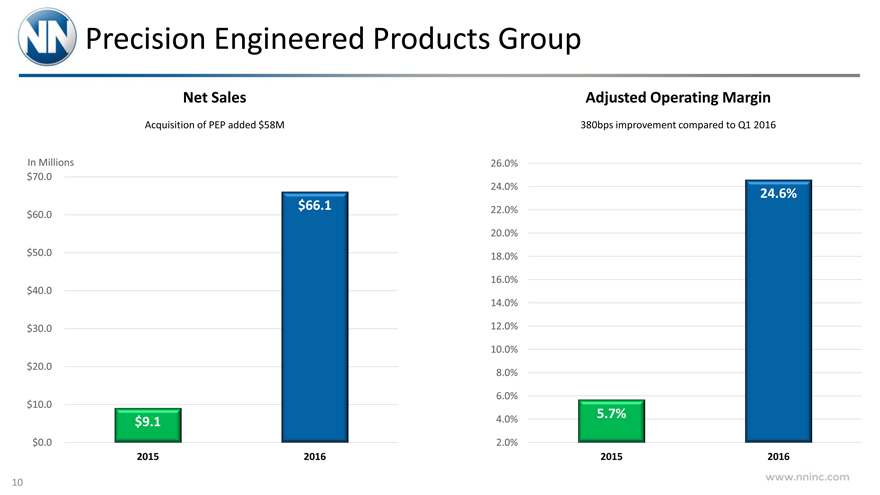
Precision Engineered Products Group
Net Sales Adjusted Operating Margin
Acquisition of PEP added $58M 380bps improvement compared to Q1 2016
In Millions 26.0%
$70.0
24.0%24.6%
$66.122.0%
$60.0
20.0%
$50.0 18.0%
16.0%
$40.0
14.0%
$30.0 12.0%
10.0%
$20.0 8.0%
6.0%
$10.0
$9.1 4.0%5.7%
$0.0 2.0%
2015 201620152016
10
|
|
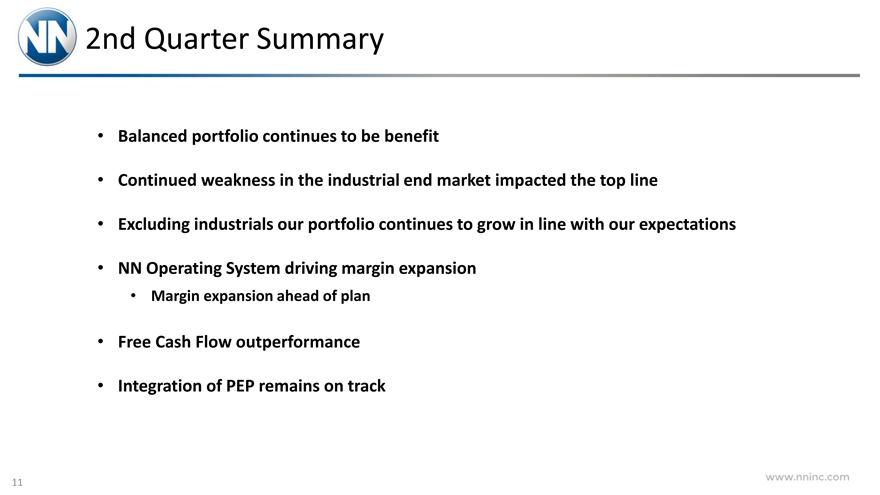
2nd Quarter Summary
Balanced portfolio continues to be benefit
Continued weakness in the industrial end market impacted the top line
Excluding industrials our portfolio continues to grow in line with our expectations
NN Operating System driving margin expansion
Margin expansion ahead of plan
Free Cash Flow outperformance
Integration of PEP remains on track
11
|
|

Guidance
|
|
2nd Quarter 2016 Guidance
Second Quarter Third Quarter
Commentary
Actual Guidance
Net Sales $214.3M $213M-$228MIndustrial markets remain tepid
Adj. Op Margin 13.4% 13.3%-14.5%Margin expansion driven by end market
diversification & operational improvements
Adj. EBITDA $40.1M $40.1M-$45.1M
Growth in non-industrial markets along
Adj. EPS $0.46 $0.40-$0.50with operational improvements drive
consistent performance
13
|
|
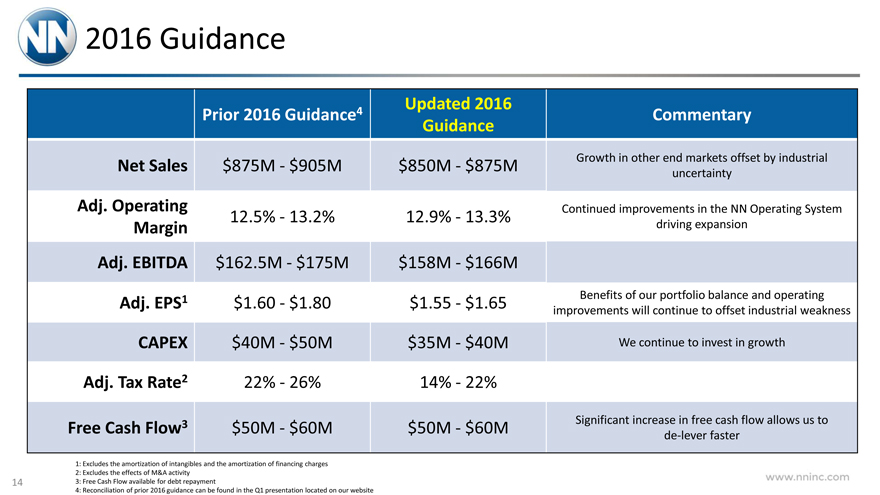
2016 Guidance
Updated 2016
Prior 2016 Guidance 4Commentary
Guidance
Net Sales $875M -$905M$850M -$875MGrowth in other end markets offset by industrial
uncertainty
Adj. Operating Continued improvements in the NN Operating System
12.5% -13.2%12.9% -13.3%
Margin driving expansion
Adj. EBITDA $162.5M—$175M$158M -$166M
Adj. EPS1 $1.60 -$1.80$1.55 -$1.65Benefits of our portfolio balance and operating
improvements will continue to offset industrial weakness
CAPEX $40M -$50M$35M -$40MWe continue to invest in growth
Adj. Tax Rate2 22% -26%14% -22%
Free Cash Flow3 $50M -$60M$50M -$60MSignificant increase in free cash flow allows us to
de-lever faster
1: Excludes the amortization of intangibles and the amortization of financing charges
2: Excludes the effects of M&A activity
14 3: Free Cash Flow available for debt repayment
4: Reconciliation of prior 2016 guidance can be found in the Q1 presentation located on our website
|
|

Reconciliation Tables
|
|
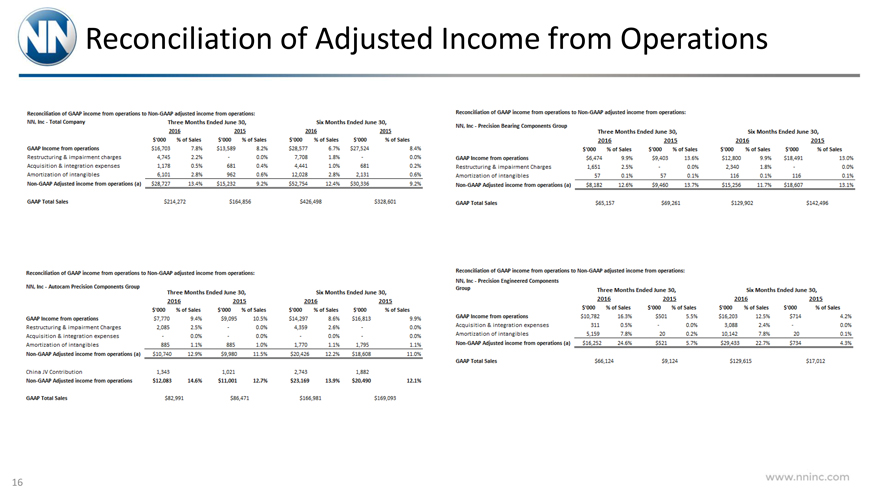
Reconciliation of Adjusted Income from Operations
16
|
|
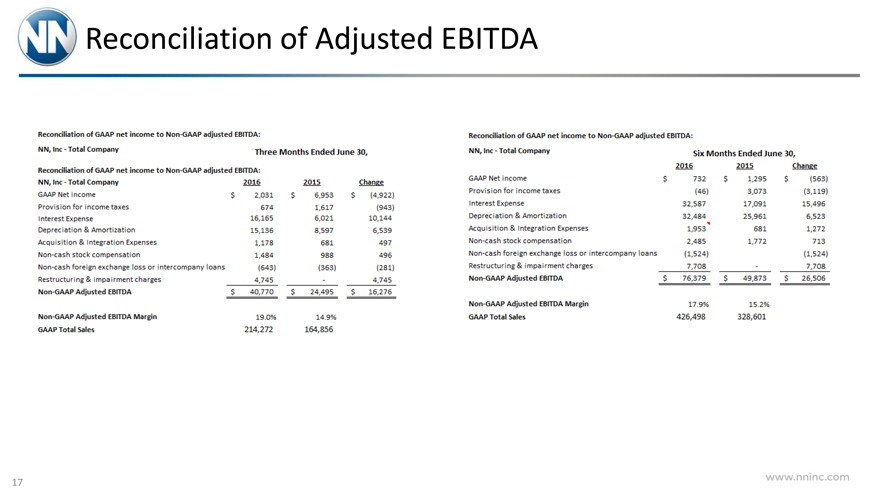
Reconciliation of Adjusted EBITDA
17
|
|
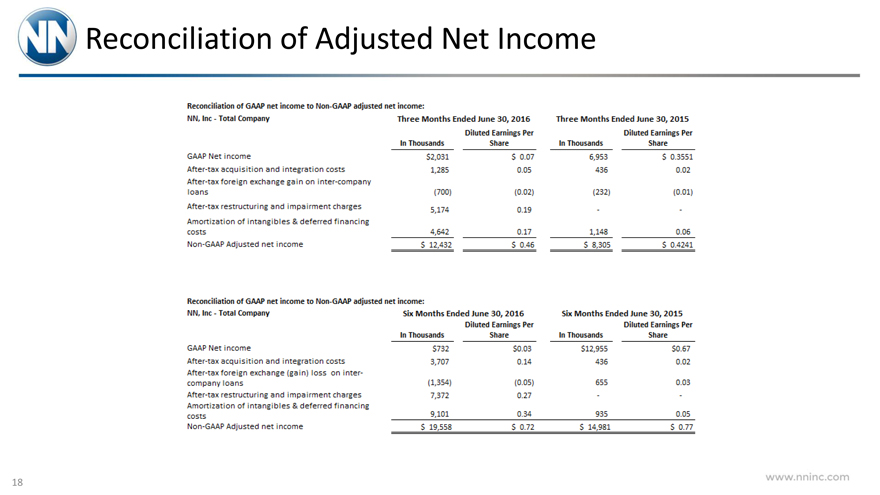
Reconciliation of Adjusted Net Income
18
|
|
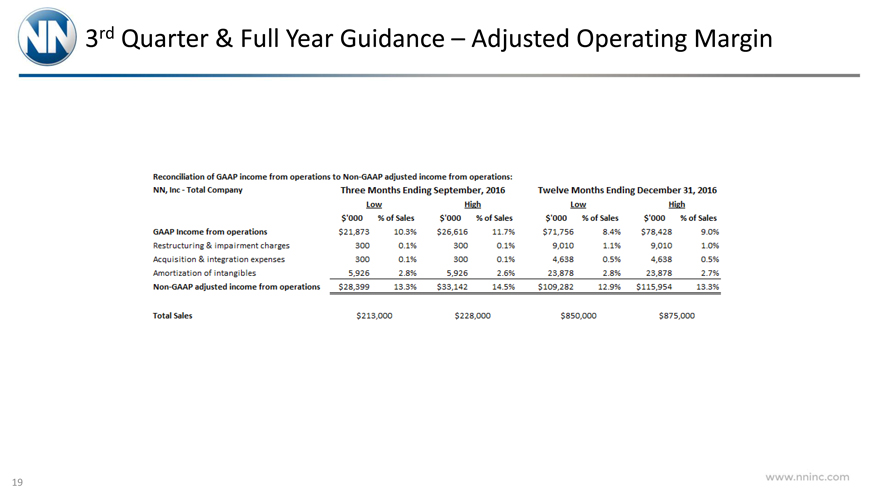
3rd Quarter & Full Year Guidance – Adjusted Operating Margin
19
|
|
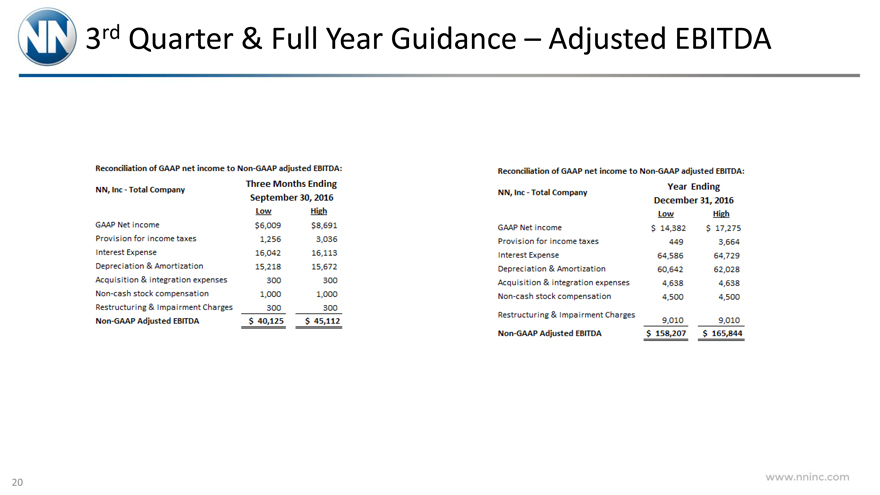
3rd Quarter & Full Year Guidance – Adjusted EBITDA
20
|
|
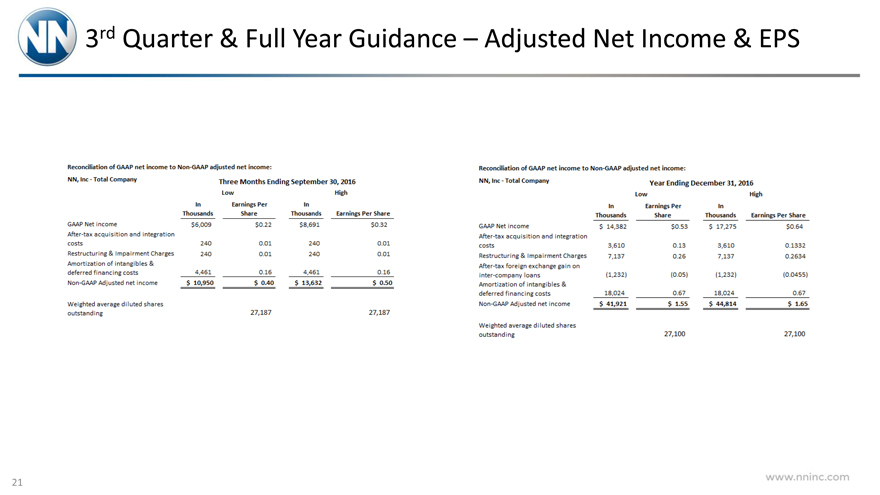
3rd Quarter & Full Year Guidance – Adjusted Net Income & EPS
21
|
|
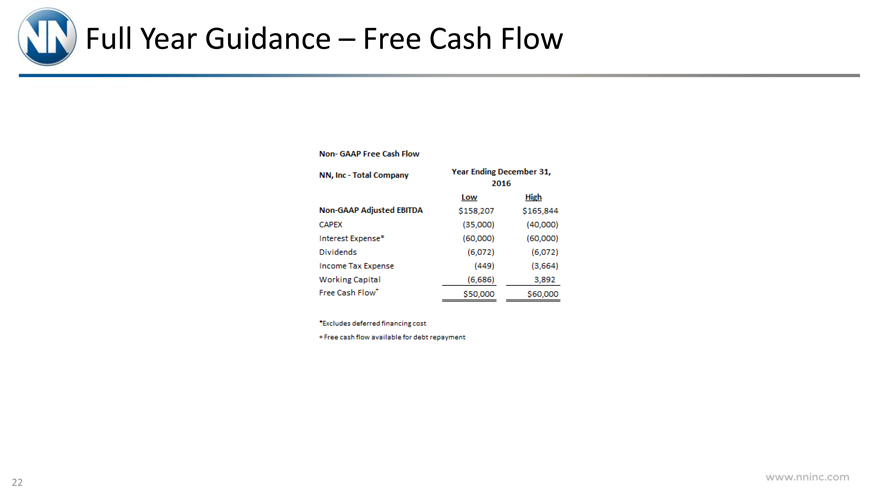
Full Year Guidance – Free Cash Flow
22