Attached files
| file | filename |
|---|---|
| EX-99.1 - EXHIBIT 99.1 - ASB Bancorp Inc | v445325_ex99-1.htm |
| 8-K - FORM 8-K - ASB Bancorp Inc | v445325_8k.htm |
Exhibit 99.2

KBW 2016 Community Bank Investor Conference New York, New York August 2 - 3, 2016 Exhibit 99.2

2 This presentation, as well as other written communications made from time to time by the Company and its subsidiaries and oral communications made from time to time by authorized officers of the Company, may contain statements relating to the future results of the Company (including certain projections and business trends) that are considered “forward - looking statements” as defined in the Private Securities Litigation Reform Act of 1995 (the PSLRA). Such forward - looking statements may be identified by the use of such words as “believe,” “expect,” “anticipate,” “should,” “targets,” “planned,” “under consideration,” “estimated,” “intend,” “potential” and similar expressions. For these statements, the Company claims the protection of the safe harbor for forward - looking statements contained in the PSLRA. The Company cautions you that a number of important factors could cause actual results to differ materially from those currently anticipated in any forward - looking statement. Such factors include, but are not limited to: prevailing economic and geopolitical conditions; changes in interest rates, loan demand, real estate values and competition; changes in accounting principles, policies, and guidelines; changes in any applicable law, rule, regulation or practice with respect to tax or legal issues; and other economic, competitive, governmental, regulatory and technological factors affecting the Company’s operations, pricing, products and services and other factors that may be described in the Company’s annual report on Form 10 - K and quarterly reports on Form 10 - Q as filed with the Securities and Exchange Commission. The forward - looking statements are made as of the date of this presentation, and, except as may be required by applicable law or regulation, the Company assumes no obligation to update the forward - looking statements or to update the reasons why actual results could differ from those projected in the forward - looking statements. Forward - Looking Statements
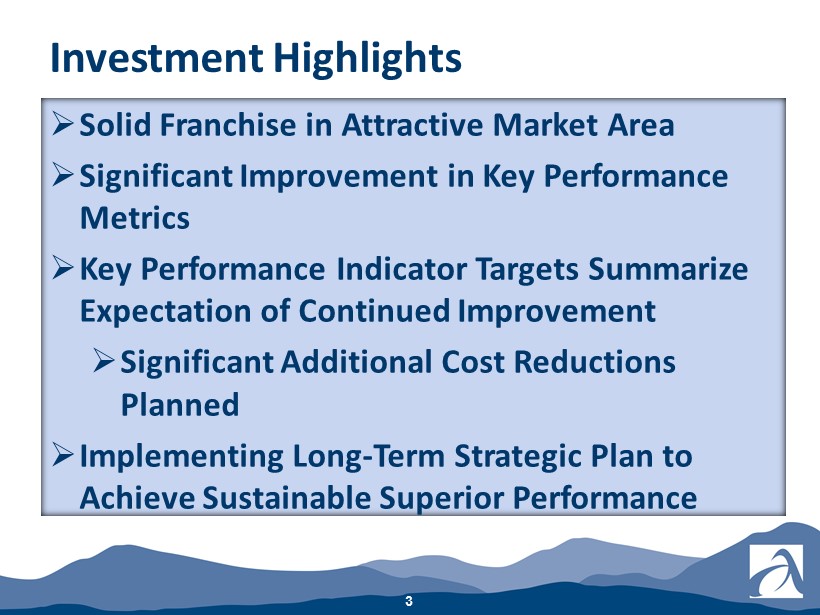
3 » Solid Franchise in Attractive Market Area » Significant Improvement in Key Performance Metrics » Key Performance Indicator Targets Summarize Expectation of Continued Improvement » Significant Additional Cost Reductions Planned » Implementing Long - Term Strategic Plan to Achieve Sustainable Superior Performance Investment Highlights

Solid Franchise in Attractive Market Area

5 » Headquartered in Asheville, North Carolina » Community bank founded in 1936 with total assets of $806 million » 13 offices in 5 Western North Carolina counties » 158 full - time equivalent employees » Converted from the mutual form of ownership on October 11, 2011 ASBB Profile

6 Executive Management Role Years in Banking Suzanne DeFerie President & Chief Executive Officer 24+ Kirby Tyndall Executive Vice President & Chief Financial Officer 27+ David Kozak Executive Vice President & Chief Credit Officer 32+ Vikki Bailey Executive Vice President & Chief Retail Officer 40+ Combined Management Team Experience 123+

7 Attractive Market Area » Asheville Metro population: 434,391 (2013 estimate) » Asheville MSA growth rate > 150% x national rate » Mar 2016 Metro Unemployment: 3.7% (currently lowest of NC MSAs) » NC current rate is 4.7% » Average Home Price (May 2016 YTD): $278,578 » Up 5.7% year over year » Sales volume up 29% over 2015 » Median Income: $43,681 (2013) » Diverse Industries: » Tourism » Healthcare » Government » Recreation » Light Manufacturing » Hospitality and Service

8 Local Market Recovery 2013 - present » Increasing loan demand; current low loan delinquencies » Construction returns – with gusto » Current unemployment rate at 3.7% – lowest MSA in NC » Real estate valuations, especially residential, are recovering » Transylvania County (location of most significant ASBB foreclosures) begins slow real estate recovery » Tourism booming again – “An estimated 9.8 million visitors spent a total of $1.7 billion in 2014, an increase of 3.9% and 4.6%, respectively, from 2013.” (Buncombe County Tourism Development Authority 2015 Annual Report) Local Market - Economic Drivers

9 Deposit Market Share – June 30, 2015 Institution # Br Deposits ($ millions) Market Share Institution # Br Deposits ($ millions) Market Share First Citizens Bank 21 $ 1,700 23.4% United Cmty (GA) 4 $ 147 2.0% Wells Fargo Bank (SD) 18 1,556 21.4% Capital Bank (FL) 4 134 1.8% Asheville Savings 13 630 8.7% Carolina Alliance (SC) 2 118 1.6% Bank of America 11 618 8.5% Fifth Third Bank (OH) 4 85 1.3% HomeTrust Bank 6 474 6.5% First Bank 3 82 1.1% SunTrust Bank (GA) 10 443 6.1% Bank of N Carolina 2 60 0.8% BB&T 8 402 5.5% Black Mtn Savings 1 30 0.4% TD Bank (DE) 8 385 5.3% Woodforest Natl (TX) 3 4 0.1% PNC Bank (DE) 8 222 3.0% Capital Bank (MD) 1 1 0.0% Entegra (Macon) Bank 3 180 2.5% Institutions: 19 130 $ 7,281 100.0% Markets are Buncombe, Henderson, Madison, McDowell & Transylvania Counties Source: FDIC Summary of Deposit Data

10 Markets are Buncombe, Henderson, Madison, McDowell & Transylvania Counties June 30 ($ millions) Deposit Market Share – 2015 vs. 2014 Source: FDIC Deposit Market Share Data $0 $500 $1,000 $1,500 $2,000 June 30, 2015 June 30, 2014 Column1 Source: FDIC Summary of Deposit Data Annual updates available in September Markets are Buncombe, Henderson, Madison, McDowell & Transylvania Counties

11 As of June 30, 2016 NASDAQ Global Market ASBB Closing price $24.53 Book value per share $23.80 Price to book value 103.1% Shares outstanding* 3,987,322 shares Shares repurchased* (Jan 1, 2013 ‒ Jun 30, 2016) 1,629,510 shares Stock Information * Excludes 200,000 share repurchase program completed on July 11, 2016.

12 Change in Stock Price -5.00% 0.00% 5.00% 10.00% 15.00% 20.00% 25.00% Trailing Twelve Months ASBB (11.75%) SNL U.S. Bank $500M-$1B (11.97%) SNL U.S. Thrift $500M-$1B (11.01%) Source: SNL Financial, 7/21/16

Significant Improvements in Key Performance Metrics

Balance Sheet — Loans Grew 14 $432.9 $387.7 $449.2 $521.8 $576.1 $606.2 $360 $410 $460 $510 $560 $610 12/31/2011 12/31/2012 12/31/2013 12/31/2014 12/31/2015 6/30/2016 ($ millions) +10% +16% » Solid track record of loan growth +15% +5% 6mo

Balance Sheet — Improved Asset Quality 15 $20.6 $1.2 $1.2 $2.7 $2.5 $2.5 $8.1 $19.4 $14.2 $8.8 $5.6 $4.8 3.63% 2.74% 2.10% 1.51% 1.05% 0.90% 0.00% 0.60% 1.20% 1.80% 2.40% 3.00% 3.60% 4.20% $0 $5 $10 $15 $20 $25 $30 $35 12/31/2011 12/31/2012 12/31/2013 12/31/2014 12/31/2015 6/30/2016 Nonperforming Assets ($ millions) Foreclosed Properties Nonperforming Loans Nonperforming Assets as % of Assets (right scale) NPAs down $21.4 million from 2011 peak

Balance Sheet — Low Loan Delinquencies 16 $15.7 $3.2 $2.2 $3.1 $2.8 $2.4 3.63% 0.82% 0.48% 0.60% 0.49% 0.40% 0.00% 0.90% 1.80% 2.70% 3.60% 4.50% $0.0 $5.0 $10.0 $15.0 $20.0 $25.0 12/31/2011 12/31/2012 12/31/2013 12/31/2014 12/31/2015 6/30/2016 Delinquent Loans Delinquent Loans As % of Total Loans (right scale) Loans Delinquent 31 Days or More ($ millions)

Balance Sheet — Core Deposits 17 $349.7 $389.1 $405.7 $449.3 $495.6 $505.4 $310 $335 $360 $385 $410 $435 $460 $485 12/31/2011 12/31/2012 12/31/2013 12/31/2014 12/31/2015 6/30/2016 ($ millions) » Solid track record of low cost core deposit growth to support Net Interest Margin +10% +10% +4% +11% Cml DDA +8% Nonint DDA +12% +2% 6mo

18 Balance Sheet — C ommercial C ore D eposits $71.4 $85.3 $95.2 $121.6 $147.0 $158.9 $60 $85 $110 $135 $160 12/31/2011 12/31/2012 12/31/2013 12/31/2014 12/31/2015 6/30/2016 ($ millions) » Commercial deposits believed to be much less rate sensitive than retail deposits +28% +21% +8% 6mo
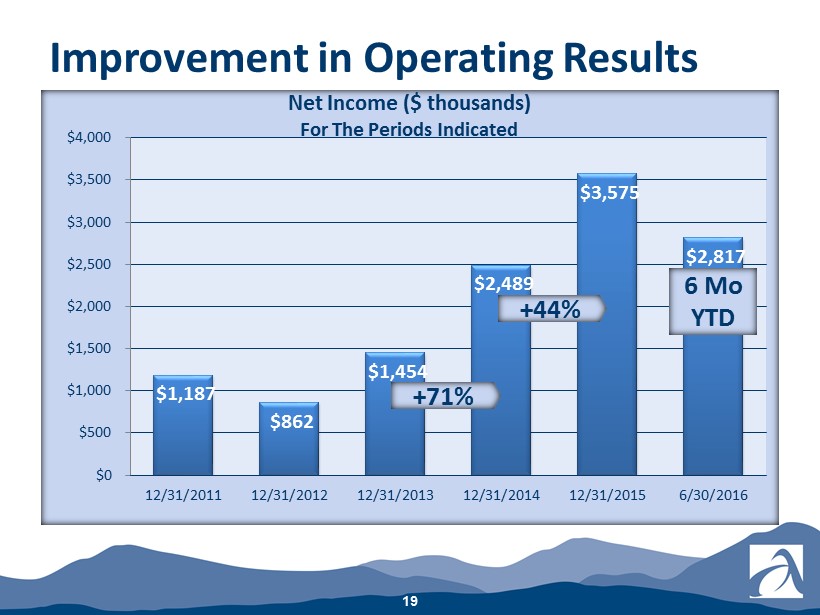
Improvement in Operating Results 19 $1,187 $862 $1,454 $2,489 $3,575 $2,817 $0 $500 $1,000 $1,500 $2,000 $2,500 $3,000 $3,500 $4,000 12/31/2011 12/31/2012 12/31/2013 12/31/2014 12/31/2015 6/30/2016 Net Income ($ thousands) For The Periods Indicated +44% +71% 6 Mo YTD

Improvement in Operating Results 20 $0.23 $0.17 $0.31 $0.59 $0.89 $0.75 $0.00 $0.10 $0.20 $0.30 $0.40 $0.50 $0.60 $0.70 $0.80 $0.90 $1.00 12/31/2011 12/31/2012 12/31/2013 12/31/2014 12/31/2015 6/30/2016 Diluted Earnings Per Share Earnings Per Share For The Periods Indicated +51% +90% 6 Mo YTD

Improvement in Operating Results 21 $0.21 $0.28 $0.24 $0.30 $0.45 $0.00 $0.05 $0.10 $0.15 $0.20 $0.25 $0.30 $0.35 $0.40 $0.45 $0.50 6/30/2015 9/30/2015 12/31/2015 3/31/2016 6/30/2016 Diluted Earnings Per Share Trailing Five Quarters +114%

Tangible Book Value Per Share (TBVPS) 22 $21.96 $22.41 $22.50 $23.10 $23.80 $21.00 $21.50 $22.00 $22.50 $23.00 $23.50 $24.00 6/30/2015 9/30/2015 12/31/2015 3/31/2016 6/30/2016 » TBVPS enhanced by both earnings increases and share repurchases +8% TBVPS Trailing Five Quarters

3.44% 3.46% 3.50% 3.67% 3.65% 0.63% 0.62% 0.61% 0.61% 0.61% 2.96% 3.00% 3.04% 3.21% 3.20% 0.00% 0.50% 1.00% 1.50% 2.00% 2.50% 3.00% 3.50% 4.00% 6/30/2015 9/30/2015 12/31/2015 3/31/2016 6/30/2016 Earning Asset Yield Cost of Funds Net Interest Margin Earning Asset Yield, Cost of Funds and Net Interest Margin Trailing Five Quarters Improvement in Operating Results 23

24 81.88% 76.80% 79.12% 76.29% 72.46% 3.08% 2.92% 2.96% 2.98% 2.88% 2.60% 2.80% 3.00% 3.20% 3.40% 3.60% 60.00% 65.00% 70.00% 75.00% 80.00% 85.00% 6/30/2015 9/30/2015 12/31/2015 3/31/2016 6/30/2016 Efficiency Ratio (excluding securities gains) Noninterest Expenses to Average Assets (right scale) Efficiency Efforts Gaining Traction Trailing Five Quarters Improvement in Operating Results

Key Performance Indicator Targets Summarize Expectation of Continued Improvement

26 » Return on average equity (ROE) target range of 8.1% to 9.0% » Return on average assets (ROA) target range of 1.0% to 1.1% » Efficiency ratio target range of 54% to 64% Targets do not include effects of any potential acquisitions. Long - Term Key Performance Targets

Significant Additional Cost Reductions Planned

28 Significant Additional Cost Reductions Planned ($ in thousands, except per share amounts) Impact On 2016 Impact 2017 Impact 2018 Impact FHLB debt interest expense ($40M matures 2017; $10M matures 2018) Pre - tax After - tax 1 Per share 2 NIM ROE Efficiency $ 1,970 $ 1,248 $ (0.33) ‒ 0.25% ‒ 1.35% ‒ 3.76% $ 862 $ 546 $ (0.15) ‒ 0.11% ‒ 0.55% ‒ 1.46% $ 263 $ 167 $ (0.04) ‒ 0.03% ‒ 0.15% ‒ 0.38% Qualified pension expense ($8.0M pre - tax, or $5.1M after - tax, of preliminary estimated settlement expense currently included in AOCI — Preliminary estimated settlement expense Pre - tax = $8.7M to $9.5M After - tax = $5.5M to $6.0M or $1.49 to $1.62 per share) Pre - tax After - tax 1 Per share 2 ROE Efficiency $ 810 $ 513 $ (0.14) ‒ 0.55% ‒ 1.60% $ 810 $ 513 $ (0.14) ‒ 0.51% ‒ 1.37% $ 810 $ 513 $ (0.14) ‒ 0.47% ‒ 1.17% 1 Assumes combined marginal Federal and state income tax rates of 36.64% for 2016 ‒ 2018. 2 Assumes 2016 - Q2 average shares outstanding of approximately 3,742,000.

Implementing Long - Term Strategic Plan to Achieve Sustainable Superior Performance

Strategic Vision: (3 Primary Focus Areas) » Focus: Commercial and Small Business Relationships (Loans & Deposits) for improved NIM » Focus: Mortgage Banking for improved Fee Income and NIM » Focus: Increased Efficiencies and Productivity, for improved expense and efficiency ratio s Implementing Long - Term Strategic Plan to Achieve Sustainable, Superior Performance 30

» Solid Franchise in Attractive Market Area » Significant Improvement in Key Performance Metrics » Key Performance Indicator Targets Summarize Expectation of Continued Improvement » Significant Additional Cost Reductions Planned » Implementing Long - Term Strategic Plan to Achieve Sustainable Superior Performance Investment Highlights 31

Appendix

33 Cash $51.6m (6%) Securities $110.9m (14%) Loans HFS $4.3m (1%) Loans, net $606.2m (75%) Fore - closures $4.8m (1%) Other $27.8m (3%) » Loans are largest earning asset category » Represent 75% of assets » Grew 5% during 2016 YTD Balance Sheet — Assets Composition, As of June 30, 2016 ($ millions)

Balance Sheet — Loans Composition, As of June 30, 2016 ($ millions) 34 Cml Const $30.1m (5%) Cml Mtg $240.1m (40%) Cml & Ind $23.4m (4%) Res Const $18.4m (3%) Res Mtg $200.5m (33%) Revolv Mtg $65.4m (11%) Consumer $28.7m (5%) » Commercial loans » 49% of total loans » Grew 8.5% in 2016 - YTD » Diversified portfolio » Residential mortgages » 47% of total loans » Most fixed rate loans sold in secondary market » Grew 5.4% in 2016 - YTD » Very low speculative construction loans

35 Balance Sheet — Liabilities & Equity Composition, As of June 30, 2016 ($ millions) Core Deposits* $505.4m (63%) Time Deposits $135.2m (17%) Debt $50.5m (6%) Other Liabilities $19.5m (2%) Equity $94.9m (12%) » Core deposits* are largest funding category » Represent 63% of assets » Grew 2% 2016 YTD » Low brokered time deposits » Low debt * Core deposits exclude all time deposits

Balance Sheet — Deposits Composition, As of June 30, 2016 ($ millions) 36 Demand $127.9 20% NOW $157.4 25% Savings $53.7 8% Money Market $166.4 26% CDs $135.2 21% » Core deposits* are largest funding category » Represent 63% of assets » 2.0% increase 2016 - YTD » Low brokered time deposits Core Deposits * $505.4 79% * Core deposits exclude all time deposits

Improvement in Operating Results 37 $0.21 $0.28 $0.24 $0.30 $0.45 $0.19 $0.25 $0.21 $0.22 $0.33 $0.00 $0.05 $0.10 $0.15 $0.20 $0.25 $0.30 $0.35 $0.40 $0.45 $0.50 6/30/2015 9/30/2015 12/31/2015 3/31/2016 6/30/2016 As Reported Excluding Securities Gains Diluted Earnings Per Share Trailing Five Quarters +114% +73%

Noninterest Income 38 Diluted Earnings Per Share Trailing Five Quarters $1,968 $2,084 $1,847 $2,049 $2,476 $1,825 $1,882 $1,673 $1,593 $1,760 $0 $500 $1,000 $1,500 $2,000 $2,500 $3,000 06/30/2015 09/30/2015 12/31/2015 03/31/2016 06/30/2016 Noninterest Income Excluding Securities Gains Noninterest Income Trailing Five Quarters

Noninterest Expenses 39 $6,010 $5,837 $5,921 $5,761 $5,637 $6,010 $5,831 $5,919 $5,761 $5,619 $5,400 $5,500 $5,600 $5,700 $5,800 $5,900 $6,000 $6,100 06/30/2015 09/30/2015 12/31/2015 03/31/2016 06/30/2016 Noninterest Expense Excluding Foreclosed Property Valuation Adjustments Noninterest Expenses Trailing Five Quarters

40 Quarter Ended Item 06/30/15 09/30/15 12/31/15 03/31/16 06/30/16 Net income (GAAP) $ 865 $ 1,142 $ 946 $ 1,121 $ 1,696 Less: Securities gains, net of tax* (90) (127) (109) (289) (454) Net income excluding after - tax securities gains (non - GAAP) $ 775 $ 1,015 $ 837 $ 832 $ 1,242 Earnings per share - Diluted (GAAP) $ 0.21 $ 0.28 $ 0.24 $ 0.30 $ 0.45 Less: Securities gains, net of tax* (0.02) (0.03) (0.03) (0.08) (0.12) Earnings per share - Diluted excluding after - tax securities gains (non - GAAP) $ 0.19 $ 0.25 $ 0.21 $ 0.22 $ 0.33 Weighted average shares outstanding - Diluted 4,013,332 4,079,029 3,931,470 3,720,127 3,742,458 Reconciliation of Non - GAAP to GAAP Items * Marginal income tax rates were 37.30% for 2015 periods and 36.64% for 2016 periods.

41 Quarter Ended Item 06/30/15 09/30/15 12/31/15 03/31/16 06/30/16 Noninterest income (GAAP) $ 1,968 $ 2,084 $ 1,847 $ 2,049 $ 2,476 Less: Securities gains (143) (202) (174) (456) (716) Noninterest income excluding securities gains (non - GAAP) $ 1,825 $ 1,882 $ 1,673 $ 1,593 $ 1,760 Noninterest expense (GAAP) $ 6,010 $ 5,837 $ 5,921 $ 5,761 $ 5,637 Less: Foreclosed property valuation adjustments - 0 - (6) (2) - 0 - (18) Noninterest expense excluding foreclosed property valuation adjustments (non - GAAP) $ 6,010 $ 5,831 $ 5,919 $ 5,761 $ 5,619 Reconciliation of Non - GAAP to GAAP Items
Inquiries may be directed to : Suzanne DeFerie, President & Chief Executive Officer Kirby Tyndall, Executive Vice President & Chief Financial Officer