Attached files
| file | filename |
|---|---|
| EX-31.2 - EXHIBIT 31.2 - ASB Bancorp Inc | ex31_2.htm |
| EX-31.1 - EXHIBIT 31.1 - ASB Bancorp Inc | ex31_1.htm |
| EX-23.0 - EXHIBIT 23.0 - ASB Bancorp Inc | ex23_0.htm |
| EX-32.0 - EXHIBIT 32.0 - ASB Bancorp Inc | ex32_0.htm |
| EX-21.0 - EXHIBIT 21.0 - ASB Bancorp Inc | ex21_0.htm |
UNITED STATES
SECURITIES AND EXCHANGE COMMISSION
Washington, DC 20549
FORM 10-K
(Mark one)
|
☒
|
ANNUAL REPORT PURSUANT TO SECTION 13 OR 15(d) OF THE SECURITIES EXCHANGE ACT OF 1934
|
For the fiscal year ended December 31, 2015
OR
|
☐
|
TRANSITION REPORT PURSUANT TO SECTION 13 OR 15(d) OF THE SECURITIES EXCHANGE ACT OF 1934
|
For the transition period from _______________ to _______________
Commission File Number: 001-35279
|
ASB BANCORP, INC.
|
||
|
(Exact name of registrant as specified in its charter)
|
|
North Carolina
|
45-2463413
|
|
|
(State or other jurisdiction of incorporation or organization)
|
|
(I.R.S. Employer Identification Number)
|
|
11 Church Street, Asheville, North Carolina
|
28801
|
|
|
(Address of principle executive offices)
|
(Zip code)
|
|
(828) 254-7411
|
||
|
(Registrant’s telephone number, including area code)
|
Securities registered pursuant to Section 12(b) of the Act:
|
Common Stock, par value $0.01 per share
|
The NASDAQ Global Market
|
|
|
(Title of each class)
|
(Name of each exchange on which registered)
|
Securities registered pursuant to Section 12(g) of the Act: None
Indicate by check mark if the Registrant is a well-known seasoned issuer, as defined by Rule 405 of the Securities Act. Yes ☐ No ☒
Indicate by check mark if the Registrant is not required to file reports pursuant to Section 13 or Section 15(d) of the Exchange Act. Yes ☐ No ☒
Indicate by check mark whether the Registrant (1) has filed all reports required to be filed by Section 13 or 15(d) of the Securities Exchange Act of 1934 during the preceding 12 months (or for such shorter period that the Registrant was required to file such reports), and (2) has been subject to such filing requirements for the past 90 days. Yes ☒ No ☐
Indicate by check mark whether the Registrant has submitted electronically and posted on its corporate Web site, if any, every Interactive Data File required to be submitted and posted pursuant to Rule 405 of Regulation S-T (§232.405 of this chapter) during the preceding 12 months (or such shorter period that the Registrant was required to submit and post such files) Yes ☒ No ☐
Indicate by check mark if disclosure of delinquent filers pursuant to Item 405 of Regulation S-K is not contained herein, and will not be contained, to the best of the registrant’s knowledge, in the definitive proxy or information statements incorporated by reference in Part III of this Form 10-K or any amendment to this Form 10-K. ☒
Indicate by check mark whether the Registrant is a large accelerated filer, an accelerated filer, a non-accelerated filer, or a smaller reporting company. See the definitions of “large accelerated filer,” “accelerated filer” and “smaller reporting company” in Rule 12b-2 of the Exchange Act. (Check one)
| Large accelerated filer | ☐ |
Accelerated filer
|
☒ | ||
| Non-accelerated filer | ☐ |
Smaller reporting company
|
☐ | ||
| (Do not check if a smaller reporting company) | |||||
Indicate by check mark whether the Registrant is a shell company (as defined in Rule 12b-2 of the Exchange Act). Yes ☐ No ☒
As of June 30, 2015, the aggregate market value of the voting and non-voting common equity held by non-affiliates was $87,242,126.
There were 3,985,475 shares of the registrant’s common stock, par value $0.01 per share, issued and outstanding as of February 29, 2016.
Documents Incorporated by Reference:
Portions of the proxy statement for the registrant’s 2016 annual meeting of shareholders are incorporated by reference into Part III of this Form 10-K.
ASB BANCORP, INC.
FORM 10-K
|
Item
|
Begins On
Page
|
|
|
Part I
|
||
|
Item 1.
|
2
|
|
|
Item 1A.
|
24
|
|
|
Item 1B.
|
33
|
|
|
Item 2.
|
34
|
|
|
Item 3.
|
35
|
|
|
Item 4.
|
35
|
|
|
Part II
|
||
|
Item 5.
|
35
|
|
|
Item 6.
|
38
|
|
|
Item 7.
|
40
|
|
|
Item 7A.
|
74
|
|
|
Item 8.
|
76
|
|
|
Item 9.
|
137
|
|
|
Item 9A.
|
138
|
|
|
Item 9B.
|
141
|
|
|
Part III
|
||
|
Item 10.
|
141
|
|
|
Item 11.
|
141
|
|
|
Item 12.
|
141
|
|
|
Item 13.
|
141
|
|
|
Item 14.
|
141
|
|
|
Part IV
|
||
|
Item 15.
|
142
|
|
|
144
|
||
This statement has not been reviewed, or confirmed for accuracy or relevance,
by the Federal Deposit Insurance Corporation.
A Caution About Forward-Looking Statements
This Annual Report on Form 10-K, including information included or incorporated by reference in this Report, contains statements which constitute forward-looking statements within the meaning of Section 27A of the Securities Act of 1933 and Section 21E of the Securities Exchange Act of 1934. Forward-looking statements may relate to our financial condition, results of operation, plans, objectives, or future performance. These statements are based on many assumptions and estimates and are not guarantees of future performance. Our actual results may differ materially from those anticipated in any forward-looking statements, as they will depend on many factors about which we are unsure, including many factors which are beyond our control. The words “may,” “would,” “could,” “should,” “will,” “expect,” “anticipate,” “predict,” “project,” “potential,” “believe,” “continue,” “assume,” “intend,” “plan,” and “estimate,” as well as similar expressions, are meant to identify such forward-looking statements. Potential risks and uncertainties that could cause our actual results to differ from those anticipated in any forward-looking statements include, but are not limited to, the following:
|
•
|
general economic conditions, either nationally or in our primary market area, that are worse than expected;
|
|
•
|
a continued decline in real estate values;
|
|
•
|
changes in the interest rate environment that reduce our interest margins or reduce the fair value of financial instruments;
|
|
•
|
increased competitive pressures among financial services companies;
|
|
•
|
changes in consumer spending, borrowing and savings habits;
|
|
•
|
legislative, regulatory or supervisory changes that adversely affect our business;
|
|
•
|
adverse changes in the securities markets;
|
|
•
|
increased cybersecurity risk, including potential business disruptions or financial losses;
|
|
•
|
changes in technology;
|
|
•
|
our ability to attract and retain personnel; and
|
|
•
|
changes in accounting policies and practices, as may be adopted by the bank regulatory agencies, the Financial Accounting Standards Board or the Public Company Accounting Oversight Board.
|
Any of the forward-looking statements that we make in this report and in other public statements we make may later prove incorrect because of inaccurate assumptions, the factors illustrated above or other factors that we cannot foresee. Consequently, no forward-looking statement can be guaranteed.
Additional factors that may affect our results are discussed below in Item 1A. “Risk Factors” and in other reports filed with the Securities and Exchange Commission. These risks and uncertainties should be considered in evaluating forward-looking statements and undue reliance should not be placed on such statements. Except as required by applicable law or regulation, ASB Bancorp, Inc. does not undertake, and specifically disclaims any obligation, to release publicly the result of any revisions that may be made to any forward-looking statements to reflect events or circumstances after the date of the statements or to reflect the occurrence of anticipated or unanticipated events.
Part I
General
ASB Bancorp, Inc. – ASB Bancorp, Inc. (“ASB Bancorp” or the “Company”), a North Carolina corporation, was incorporated in May 2011 to be the holding company for Asheville Savings Bank (“Asheville Savings” or the “Bank”) upon the completion of the Bank’s conversion from the mutual to the stock form of ownership on October 11, 2011. Before the completion of the conversion, the Company did not engage in any significant activities other than organizational activities. The Company’s principal business activity is the ownership of the outstanding shares of common stock of the Bank. The Company does not own or lease any real property, but instead uses the premises, equipment and other property of the Bank, with the payment of appropriate rental fees, as required by applicable laws and regulations, under the terms of an expense allocation agreement entered into with the Bank. The Company and the Bank also entered into an income tax allocation agreement that provides for the filing of a consolidated federal income tax return and formalizes procedures for the payment and allocation of federal income taxes between the Company and the Bank.
Asheville Savings Bank – Founded in 1936, the Bank is a North Carolina chartered savings bank headquartered in Asheville, North Carolina. We operate as a community-oriented financial institution offering traditional financial services to consumers and businesses in our primary market area. We attract deposits from the general public and use those funds to originate primarily one-to-four family residential mortgage loans and commercial real estate loans, and, to a lesser extent, home equity loans and lines of credit, consumer loans, construction and land development loans, and commercial and industrial loans. We conduct our lending and deposit activities primarily with individuals and small businesses in our primary market area.
Our primary market area is Asheville, North Carolina and the rest of Buncombe County where we have eight branch offices, as well as Henderson, Madison, McDowell and Transylvania Counties where we have five branch offices and a loan production office in Mecklenburg County.
Availability of Information
The Company’s Annual Reports on Form 10-K, Quarterly Reports on Form 10-Q, Current Reports on Form 8-K and any amendments to such reports filed or furnished pursuant to Section 13 or 15(d) of the Securities Exchange Act of 1934, as amended, are made available free of charge on the Company’s website, http://ir.ashevillesavingsbank.com, as soon as reasonably practicable after the Company electronically files such reports with, or furnishes them to, the Securities and Exchange Commission (the “SEC”). The information on the Company’s website shall not be considered as incorporated by reference into this Annual Report on Form 10-K.
Personnel
At December 31, 2015, the Company had 152 full-time equivalent employees, none of whom is represented by a collective bargaining unit. We believe our relationships with our employees are good.
Operating Strategy
Our primary objective is to operate and grow a profitable community-oriented financial institution serving customers in our primary market areas. We seek to achieve this through the adoption of a business strategy to provide superior financial services to help our customers and communities prosper by focusing on our core values while achieving sustainable profitability and reasonable returns for our shareholders. We plan to continue our focus on loan growth in 2016. In recent years, we hired senior management with substantial experience in consumer and commercial banking to help us diversify our product offerings and expand our consumer and commercial deposit and lending products, while maintaining high asset quality standards. Our operating strategies include the following:
|
•
|
profitable growth of our commercial and small business relationships;
|
|
•
|
profitable growth of our residential mortgage banking;
|
|
•
|
increase efficiencies and productivity bank wide; and
|
|
•
|
cultivate a culture of accountability bank wide.
|
Profitable growth of our commercial and small business relationships.
Our goal is to grow the number and profitability of business relationships across all product lines, which include loans, deposits, cash management/treasury services, payments, investments/wealth management and non-bank solutions. This will necessitate a more focused approach to identifying and targeting specific niches/customer segments. We will gain a better understanding of products, services, and delivery our target customers value, determination of gaps in our offering, and a plan to close those gaps. We will attain a better alignment of organization structure, talent, delivery, processes, procedures and technology in addition to marketing strategies to promote growth.
Profitable growth of our residential mortgage banking.
Residential mortgage lending remains an important part of our lending activities. We originate fixed and adjustable-rate residential mortgage loans that are retained in our loan portfolio. However, most of the fixed-rate residential mortgage loans that we originate are sold into the secondary market with servicing released as part of our efforts to reduce our interest rate risk. At December 31, 2015, residential mortgage loans totaled $186.8 million, or 32.4% of our total loan portfolio. Increasing the volume and profitability of single family residential mortgages originated and closed will necessitate an alignment of the Bank’s mortgage banking business model in support of growth goals including: people (talent and leadership), products, processes, acquisition relationships, technology, and back office operations in addition to marketing strategies to promote growth.
Increase efficiencies and productivity bank wide.
We seek to increase our profitability by improving efficiencies and productivity throughout the Bank. This necessitates right-sizing the Bank’s cost structure for revenue growth by allocating resources in alignment with our strategic priorities. This will require a laser-like focus that must be embedded in the culture of the Bank, having infrastructure, processes, procedures, technology and the like that makes it easier, simpler, faster and less expensive to conduct business. We plan to evaluate the Bank’s processes, policies, and technology to make it easy for the customer to do business with the Bank – simpler, faster and easier. This includes facilitating our teams’ abilities to recognize opportunities, delivering on commitments to customers and aligning our overall cost structure with our operating revenues.
Cultivate a culture of accountability bank wide.
We will strive to create a work environment in which employees are engaged and committed to the vision of the Bank and encouraged and rewarded for performing at their highest potential. This requires a strong performance management program that provides clear direction and expectations to all employees and focuses on performance, empowering employees to take responsibility that is aligned with our core values. We hold employees accountable for performance and we provide career and professional development opportunities for them.
Market Area
We are headquartered in Asheville, North Carolina, which is the county seat of Buncombe County, North Carolina and consider Buncombe, Madison, McDowell, Henderson and Transylvania Counties in Western North Carolina and the surrounding areas to be our primary market area. Asheville is situated in the Blue Ridge Mountains at the confluence of the Swannanoa River and French Broad River and is known for its natural beauty and scenic surroundings. The nearby Great Smoky Mountains National Park and Blue Ridge Parkway are among the more visited parks in the United States. In addition, the Asheville metropolitan area has a vibrant cultural and arts community that parallels that of many larger cities in the United States. It has been referred to as the “Paris of the South,” and The New York Times calls it a “surprisingly cosmopolitan city.” It is a place that combines local arts and diversity of a city with a friendly, small town feel. Asheville is home to a number of historical attractions, the most prominent of which is the Biltmore Estate, a historic mansion with gardens and the most visited winery in the nation, drawing more than one million tourists each year. Due to its scenic location and diverse cultural and historical offerings, the Asheville metropolitan area has become a popular destination for tourists, attracting approximately nine million visitors annually, with a direct economic impact of approximately $1.5 billion to our local economy. In addition, affordable housing prices, combined with the region’s favorable climate, scenic surroundings and cultural attractions, have also made the Asheville metropolitan area an increasingly attractive destination for retirees seeking to relocate from other parts of the United States. In February 2015, Top Retirements named the area as number one on the 2015 list of “Best Places to Retire,” noting Asheville’s reputation as a great place to retire makes it the standard that all other retirement towns can aspire to be. In July 2015, Forbes ranked Asheville 12th among U.S. cities as “Best Places for Business and Careers.” Also, in December 2014, Forbes featured Asheville in its series “An Unexpected Source of Innovation” as one of America’s little-known hubs of technological creativity. Originally established as a mountain retreat, Asheville now stands as a hub for technology, business innovation and growth, making it an attractive destination for corporate relocation.
The Asheville metropolitan area benefits from a diverse economy, and there is no single employer or industry upon which a significant number of our customers are dependent. The area has a mix of manufacturing including advanced manufacturing, plastics, metals, textiles, furniture and automotive parts. Agriculture including food processing is a growing segment of the local economy. Wood product businesses also are prevalent in Western North Carolina. Biopharmaceutical is also a growing segment of our economy with Jacob Holm and others having a presence in Asheville. Business services are predominant in the area with financial services, insurance, financial advisors and other professional practices making up a growing and steady part of the economy. IT/Software is emerging in our economy as well as other Knowledge Based businesses that are attracted to the area due to quality of life and available resources. Asheville is home to more than 16 climate services organizations and the headquarters of National Centers for Environmental Information (NCEI), the world’s largest archive of weather and climate data center of worldwide communication about climate change. The Travel and Tourism industry as well as entertainment, including performing arts, sports and film production continue to add economic value to the area. Western North Carolina has a number of manufacturing and technology companies located in the area, including Wilsonart International, Inc., Eaton Corporation, Thermo Fischer Scientific, Plasticard-Locktech International and Arvato Digital Services. GE Aviation, Linamar Corporation, White Labs Inc., Hi-Wire Brewing, Highland Brewing Company, Wicked Weed Brewing and BorgWarner Inc. are among the companies that expanded in the Asheville area during 2014 and 2015. Newer industries that moved to the area include American Recycling and brewers New Belgium, Sierra Nevada and Oskar Blues Brewery. The larger breweries and some successful local micro-breweries have spawned new opportunities in the region, which has created jobs and additional exposure for the area. Furthermore, the region is home to a number of educational organizations, private colleges and large public universities, such as the University of North Carolina at Asheville as well as satellite campuses of Lenoir-Rhyne University, North Carolina State University and Western Carolina University. Mission Health System, a leading employer in the Asheville metropolitan area and the state’s sixth largest health system, has been nationally recognized as one of the nation’s Top 15 Health Systems 2012-2015, the only health system in the nation to receive this recognition four years in a row, and the only health system in North Carolina to achieve Top 15 recognition. Mission Health has seven Centers of Excellence: Cancer, Heart, Mission Children’s Hospital, Neurosciences, Orthopedics, Trauma and Women’s Health.
Over the course of the past year, the tourism industry in the Asheville metropolitan area has improved, which has positively impacted the economy in a number of our local markets, such as Buncombe and Henderson counties, that directly benefit from this industry. The overall unemployment rate in the Asheville metropolitan area increased to 4.2% in December 2015 from 4.0% in December 2014; however, Buncombe County had the lowest unemployment rate in North Carolina for December 2015 at 3.9%, according to statistics published by the Employment Security Commission of North Carolina (“ESCNC”). For comparative purposes, the ESCNC reported seasonally adjusted unemployment rates of 5.6% for North Carolina and 5.0% for the United States for December 2015. The Company also considers McDowell County and Transylvania County, which are not included in the unemployment statistics for the Asheville metropolitan area, as part of its primary market area. The December 2015 unemployment rates were 5.1% for McDowell County and 5.3% for Transylvania County.
Competition
We face significant competition for the attraction of deposits and origination of loans. Our most direct competition for deposits has historically come from several financial institutions operating in our primary market area and from other financial service companies such as securities brokerage firms, credit unions and insurance companies. We also face competition for investors’ funds from money market funds, mutual funds and other corporate and government securities. At June 30, 2015, which is the most recent date for which deposit market share data is available from the Federal Deposit Insurance Corporation, we held approximately 10.14% of the deposits in Buncombe County, North Carolina, 3.30% of the deposits in Henderson County, North Carolina, 24.14% of the deposits in Madison County, North Carolina, 17.31% of the deposits in McDowell County, North Carolina and 4.52% of the deposits in Transylvania County, North
Carolina. This data does not reflect deposits held by credit unions with which we also compete. In addition, banks owned by large national and regional holding companies and other community-based banks also operate in our primary market area. Some of these institutions are larger than us and, therefore, have greater resources.
Our competition for loans comes primarily from financial institutions, including credit unions, in our primary market area and from other financial service providers, such as mortgage companies, mortgage brokers and private investors. Competition for loans also comes from non-depository financial service companies entering the mortgage market, such as insurance companies, securities companies and specialty finance companies.
We expect competition to increase in the future as a result of legislative, regulatory and technological changes and the continuing trend of consolidation in the financial services industry. Technological advances, for example, have lowered barriers to entry, allowed banks to expand their geographic reach by providing services over the Internet, and made it possible for non-depository institutions to offer products and services that traditionally have been provided by banks. Competition for deposits and the origination of loans could limit our growth in the future.
Lending Activities
General. The largest component of our loan portfolio is real estate mortgage loans, primarily one-to-four family residential mortgage loans and commercial mortgage loans, and to a lesser extent, revolving mortgage loans (which consist of home equity loans and lines of credit), consumer loans, construction and land development loans, and commercial and industrial loans. We originate loans for investment purposes, although we generally sell our fixed-rate residential mortgage loans into the secondary market with servicing released.
We intend to continue to emphasize residential and commercial mortgage lending, while also concentrating on ways to expand our commercial and industrial lending activities with a focus on serving small businesses and emphasizing relationship banking in our primary market area. We do not offer Alt-A, sub-prime or no-documentation mortgage loans.
One-to-Four Family Residential Loans. At December 31, 2015, we had $186.8 million in one-to-four and muti-family residential loans, which represented 32.4% of our total loan portfolio. Our origination of residential mortgage loans enables borrowers to purchase or refinance existing homes located in our primary market area.
Our residential lending policies and procedures conform to the secondary market guidelines. We offer a mix of adjustable rate mortgage loans and fixed-rate mortgage loans with terms of up to 30 years. Borrower demand for adjustable-rate loans compared to fixed-rate loans is a function of the level of interest rates, the expectations of changes in the level of interest rates, and the difference between the interest rates and loan fees offered for fixed-rate mortgage loans as compared to an initially discounted interest rate and loan fees for multi-year adjustable-rate mortgages. The relative amount of fixed-rate mortgage loans and adjustable-rate mortgage loans that can be originated at any time is largely determined by the demand for each in a competitive environment. We sell most of the fixed-rate mortgages we originate, which reduces our balances of adjustable rate mortgages as they are refinanced into fixed-rate mortgages during periods of low interest rates. We determine the loan fees, interest rates and other provisions of mortgage loans based on our own pricing criteria and competitive market conditions.
Interest rates and payments on our adjustable-rate mortgage loans adjust at intervals of one to five years after an initial fixed period that ranges from one to ten years. Interest rates on our adjustable-rate loans generally are indexed to the US Treasury Constant Maturity Index for the applicable periods. However, in some limited situations, these loans are indexed to the one year London Interbank Offered Rate (“LIBOR”).
While one-to-four family residential real estate loans are normally originated with up to 30-year terms, such loans typically remain outstanding for substantially shorter periods because borrowers often prepay their loans in full either upon sale of the property pledged as security or upon refinancing the original loan. Therefore, average loan maturity is a function of, among other factors, the level of purchase and sale activity in the real estate market, prevailing interest rates and the interest rates payable on outstanding loans on a regular basis. We do not offer residential mortgage loans with negative amortization and we currently offer marketable interest-only residential mortgage loans to well qualified borrowers in limited situations.
We do not make owner occupied one-to-four family residential real estate loans with loan-to-value ratios exceeding 95%, unless the loan is federally guaranteed. Loans with loan-to-value ratios in excess of 80% typically require private mortgage insurance. In addition, we do not make non-owner occupied one-to-four family residential real estate loans with loan-to-value ratios exceeding 85% unless we are able to sell the loan on the secondary market. We require all properties securing mortgage loans to be appraised by a board-approved independent appraiser. We also require title insurance on all mortgage loans. Borrowers must obtain hazard insurance, and flood insurance is required for all loans located in flood hazard areas.
At December 31, 2015, our largest residential mortgage loan had an outstanding balance of $3.0 million and was performing in accordance with its original terms.
Commercial Mortgage Loans. We offer fixed- and adjustable-rate mortgage loans secured by non-residential real estate. At December 31, 2015, commercial mortgage loans totaled $209.4 million, or 36.3% of our total loan portfolio, $208.6 million of which were performing. Our commercial mortgage loans are generally secured by commercial, industrial, manufacturing, small to moderately-sized office, retail, hotel, hospital and church properties located in our primary market area. Although we have historically made commercial mortgage loans that are secured by both owner-occupied and nonowner-occupied properties, we continue to emphasize the origination of commercial mortgage loans that are secured by owner-occupied properties. At December 31, 2015, $64.4 million, or 30.8% of our commercial real estate loans were secured by owner-occupied properties.
We originate fixed-rate and adjustable-rate commercial mortgage loans, generally with terms of three to five years and payments based on an amortization schedule of up to 30 years, resulting in “balloon” balances at maturity. For our adjustable-rate commercial mortgage loans, interest rates are typically equal either to the prime lending rate as reported in The Wall Street Journal or to LIBOR, plus an applicable margin. Depending upon the interest rate cycle, our adjustable-rate commercial mortgage loans typically provide for interest rate floors. Loans are secured by first mortgages, generally are originated with a maximum loan-to-value ratio of 85% and may require specified debt service coverage ratios depending on the characteristics of the project. Rates and other terms on such loans generally depend on our assessment of credit risk after considering such factors as the borrower’s financial condition, credit history, loan-to-value ratio, debt service coverage ratio and other factors, including whether the property securing the loan will be owner occupied.
At December 31, 2015, our largest commercial mortgage loan relationship consisted of five loans that had a total outstanding balance of $12.0 million. These loans were originated in February 2013 and November 2014. The loans are collateralized by leased income producing commercial properties, inclusive of retail shopping centers located in High Point, North Carolina and Greensboro, North Carolina. The loans are performing in accordance to their original loan terms.
Construction and Land Development Loans. We have originated construction and land development loans for commercial properties, such as retail shops and office units, and multi-family properties. At December 31, 2015, commercial construction and land development loans totaled $38.3 million, which represented 6.6% of our total loan portfolio, all of which were performing. Typically commercial construction loans are for a term of 12 to 24 months with interest payable monthly and are generally followed by a permanent loan with monthly principal and interest payments. Commercial construction loans generally require a maximum loan-to-value ratio of 80% and land development loans generally require a maximum loan-to-value ratio of 75%.
We also originate residential construction and land development loans for one-to-four family homes. At December 31, 2015, residential construction and land development loans totaled $16.6 million, which represented 2.9% of our total loan portfolio, all of which were performing. Residential construction loans are typically for a term of 12 months with interest payable monthly, and are generally followed by an automatic conversion to a 15-year or 30-year permanent loan with monthly payments of principal and interest. Residential construction loans are generally made only to homeowners and the repayment of such loans generally comes from the proceeds of a permanent mortgage loan for which a commitment is typically in place when the construction loan is originated. We generally require a maximum loan-to-value ratio of 80% for all construction loans unless Private Mortgage Insurance is obtained to allow for higher loan-to-value ratios.
Interest rates on all construction loans are generally tied to an index plus an applicable spread and funds are disbursed on a percentage-of-completion basis following an inspection by a third party inspector.
We also selectively originate loans to individuals and developers for the purpose of developing vacant land in our primary market area, typically for building an individual’s future residence or, in the case of a developer, residential subdivisions. Land development loans, which are offered for terms of up to 18 months, are generally indexed either to the prime rate as reported in The Wall Street Journal or to LIBOR, plus an applicable margin. We generally require a maximum loan-to-value ratio of 75% of the discounted market value based upon expected cash flows upon completion of the project. We also originate loans to individuals secured by undeveloped land held for investment purposes. These loans are typically amortized for no more than fifteen years with a three- or five-year balloon payment. At December 31, 2015, our largest commercial land development loan had an outstanding balance of $379,000, which was performing.
Revolving Mortgages and Consumer Loans. We offer revolving mortgage loans, which consist of home equity loans and lines of credit, and various consumer loans, including automobile loans and loans secured by deposits. At December 31, 2015, revolving mortgage loans totaled $66.3 million, or 11.5% of our total loan portfolio, of which $66.1 million were performing, and consumer loans totaled $36.3 million, or 6.3% of our total loan portfolio, substantially all of which were performing. Our revolving mortgage loans consist of both home equity loans with fixed-rate amortizing terms of up to 15 years and adjustable rate lines of credit with interest rates indexed either to the prime rate as published in The Wall Street Journal or to LIBOR, plus or minus an applicable margin. At December 31, 2015, our largest outstanding revolving mortgage loan balance was $500,000, which was performing. Consumer loans typically have shorter maturities and higher interest rates than traditional one-to-four family lending. In most cases, we do not originate home equity loans with loan-to-value ratios exceeding 80%, including any first mortgage loan balance. The procedures for underwriting consumer loans include an assessment of the applicant’s payment history on other debts and ability to meet existing obligations and payments on the proposed loan. During 2015, we discontinued the indirect origination of automobile loans through local dealers, although we continue to offer loans secured by motor vehicles directly to consumers.
Commercial and Industrial Loans. We typically offer commercial and industrial loans to small businesses located in our primary market area. At December 31, 2015, commercial and industrial loans totaled $22.9 million, which represented 4.0% of our total loan portfolio, of which $22.7 million were performing. Commercial and industrial loans consist of floating rate loans indexed either to the prime rate as published in The Wall Street Journal or to LIBOR, plus an applicable margin and fixed rate loans for terms of up to 10 years, depending on the useful life and type of collateral. Our commercial and industrial loan portfolio consists primarily of loans that are secured by equipment, accounts receivable and inventory, but also includes a smaller amount of unsecured loans for purposes of financing expansion or providing working capital for general business purposes. Key loan terms vary depending on the collateral, the borrower’s financial condition, credit history and other relevant factors. At December 31, 2015, our largest commercial and industrial relationship had an outstanding balance of $3.7 million, was secured by a blanket first lien on all business assets, including accounts receivable, inventory, furniture, fixtures and equipment, in addition to an assignment of insurance on the owner’s life. The loan was performing in accordance with its terms.
Loan Underwriting
Adjustable-Rate Loans. While we anticipate that adjustable-rate loans will better offset the adverse effects of an increase in interest rates as compared to fixed-rate mortgages, an increased monthly mortgage payment required of adjustable-rate loan borrowers in a rising interest rate environment could cause an increase in delinquencies and defaults. The marketability of the underlying property also may be adversely affected in a high interest rate environment. In addition, although adjustable-rate mortgage loans make our asset base more responsive to changes in interest rates, the extent of this interest sensitivity is limited by the annual and lifetime interest rate adjustment limits.
Commercial Mortgage Loans. Loans secured by commercial real estate generally have larger balances and involve a greater degree of risk than one-to-four family residential mortgage loans. Of primary concern in commercial mortgage lending is the borrower’s creditworthiness and the feasibility and cash flow potential of the project. Payments on loans secured by income producing properties often depend on successful operation and management of the properties. As a result, repayment of such loans may be subject to adverse conditions in the real estate market or the economy. We apply what we believe to be conservative underwriting standards when originating commercial mortgage loans and seek to limit our exposure to lending concentrations to related borrowers, types of business and geographies, as well as seeking to participate with other banks in both buying and selling larger loans of this nature. Management has hired additional experienced lending officers and credit management personnel over the past several years in order to continue to safely manage this type of lending. To monitor cash flows on income producing properties, we require borrowers and loan guarantors, if any, to provide annual financial statements on commercial real estate loans. In reaching a decision on whether to make a commercial real estate loan, we consider and review a global cash flow analysis of the borrower and consider the net operating income of the property, the borrower’s expertise, credit history and profitability, and the value of the underlying property. An environmental survey is obtained when the possibility exists that hazardous materials may have existed on the site, or the site may have been impacted by adjoining properties that handled hazardous materials.
Construction and Land Development Loans. Construction financing is generally considered to involve a higher degree of risk of loss than long-term financing on improved, occupied real estate. Risk of loss on a construction loan depends largely upon the accuracy of the initial estimate of the property’s value at completion of construction and the estimated cost of construction. During the construction phase, a number of factors could result in delays and cost overruns. If the estimate of construction costs proves to be inaccurate, we may be required to advance funds beyond the amount originally committed to permit completion of the building. If the estimate of value proves to be inaccurate, we may be confronted, at or before the maturity of the loan, with a building having a value which is insufficient to assure full repayment if liquidation is required. If we are forced to foreclose on a building before or at completion due to a default, we may be unable to recover all of the unpaid balance of, and accrued interest on, the loan as well as related foreclosure and holding costs. In addition, speculative construction loans, which are loans made to home builders who, at the time of loan origination, have not yet secured an end buyer for the home under construction, typically carry higher risks than those associated with traditional construction loans. These increased risks arise because of the risk that there will be inadequate demand to ensure the sale of the property within an acceptable time. As a result, in addition to the risks associated with traditional construction loans, speculative construction loans carry the added risk that the builder will have to pay the property taxes and other carrying costs of the property until an end buyer is found. Land development loans have substantially similar risks to speculative construction loans. To monitor cash flows on construction properties, we require borrowers and loan guarantors, if any, to provide annual financial statements and, in reaching a decision on whether to make a construction or land development loan, we consider and review a global cash flow analysis of the borrower and consider the borrower’s expertise, credit history and profitability. We also generally disburse funds on a percentage-of-completion basis following an inspection by a third party inspector.
Revolving Mortgages and Consumer Loans. Consumer loans may entail greater risk than do residential mortgage loans, particularly in the case of consumer loans that are secured by assets that depreciate rapidly, such as motor vehicles. In such cases, repossessed collateral for a defaulted consumer loan may not provide an adequate source of repayment for the outstanding loan and a small remaining deficiency often does not warrant further substantial collection efforts against the borrower. During 2015, we discontinued the indirect origination of automobile loans through local dealers, which resulted in a decline in our consumer loan portfolio. We continue to offer loans secured by motor vehicles directly to consumers. In the case of home equity loans, real estate values may be reduced to a level that is insufficient to cover the outstanding loan balance after accounting for the first mortgage loan balance. Consumer loan collections depend on the borrower’s continuing financial stability, and therefore are likely to be adversely affected by various factors, including job loss, divorce, illness or personal bankruptcy. Furthermore, the application of various federal and state laws, including federal and state bankruptcy and insolvency laws, may limit the amount that can be recovered on such loans.
Commercial and Industrial Loans. Unlike residential mortgage loans, which generally are made on the basis of the borrower’s ability to make repayment from his or her employment income or other income, and which are secured by real property whose value tends to be more easily ascertainable, commercial and industrial loans are of higher risk and typically are made on the basis of the borrower’s ability to make repayment from the cash flow of the borrower’s business. As a result, the availability of funds for the repayment of commercial and industrial loans may depend substantially on the success of the business itself. Further, any collateral securing such loans may depreciate over time, may be difficult to appraise and may fluctuate in value.
Loans to One Borrower. The maximum amount that we may lend to one borrower and the borrower’s related entities is generally limited by regulation to 15% of the Bank’s unimpaired capital and surplus. At December 31, 2015, our regulatory limit on loans to one borrower was $14.3 million. At that date, our largest lending relationship consisted of five loans totaling $12.0 million that are secured by leased income producing commercial properties, inclusive of retail shopping centers located in High Point, North Carolina and Greensboro, North Carolina. The loans are currently performing in accordance with their original terms.
Loan Commitments. We typically issue commitments for most loans conditioned upon the occurrence of certain events. Commitments to originate loans are legally binding agreements to lend to our customers. Generally, our loan commitments expire after 45 to 60 days. See note 12 to the consolidated financial statements included in this annual report.
Investment Activities
We have legal authority to invest in various types of liquid assets, including U.S. Treasury obligations, securities of various government-sponsored agencies and of state and municipal governments, mortgage-backed securities and certificates of deposit of federally insured institutions. Within certain regulatory limits, we also may invest a portion of our assets in other permissible securities. As a member of the Federal Home Loan Bank of Atlanta, we also are required to maintain an investment in Federal Home Loan Bank of Atlanta stock, which is not publicly traded.
At December 31, 2015, our investment portfolio consisted primarily of mortgage-backed securities, U.S. government and agency securities, securities issued by government sponsored enterprises and securities issued by state and local governments. We do not currently invest in trading account securities.
Our investment objectives are: (i) to provide and maintain liquidity within the guidelines of North Carolina banking law and the regulations of the Federal Deposit Insurance Corporation and (ii) to manage interest rate risk. Our Board of Directors has the overall responsibility for the investment portfolio, including approval of the investment policy. Our Chief Executive Officer and our Chief Financial Officer are responsible for implementation of the investment policy and monitoring our investment performance. Our Board of Directors reviews the status of our investment portfolio on a monthly basis.
Deposit Activities and Other Sources of Funds
General. Deposits, borrowings and loan repayments are the major sources of our funds for lending and other investment purposes. Scheduled loan repayments are a relatively stable source of funds, while deposit inflows and outflows and loan prepayments are significantly influenced by general interest rates and money market conditions.
Deposit Accounts. Deposits are attracted from within our primary market area through the offering of a broad selection of deposit instruments, including noninterest-bearing demand deposits (such as checking accounts), interest-bearing demand accounts (such as NOW and money market accounts), regular savings accounts and certificates of deposit. Deposit account terms vary according to the minimum balance required, the time periods the funds must remain on deposit and the interest rate, among other factors. In determining the terms of our deposit accounts, we consider the rates offered by our competition, our liquidity needs, profitability to us, matching deposit and loan products and customer preferences and concerns. We generally review our deposit mix and pricing weekly. Our deposit pricing strategy has typically been to offer competitive rates on all types of deposit products, and to periodically offer special rates in order to attract deposits of a specific type or term.
Borrowings. We use advances from the Federal Home Loan Bank of Atlanta to supplement our investable funds. The Federal Home Loan Bank functions as a central reserve bank providing credit for member financial institutions. As a member, we are required to own capital stock in the Federal Home Loan Bank of Atlanta and are authorized to apply for advances on the security of such stock and certain of our mortgage loans and other assets (principally securities which are obligations of, or guaranteed by, the United States), provided certain standards related to creditworthiness have been met. Advances are made under several different programs, each having its own interest rate, range of maturities and prepayment penalties. Depending on the program, limitations on the amount of advances are based either on a fixed percentage of an institution’s net worth, the Federal Home Loan Bank’s assessment of the institution’s creditworthiness, collateral value and level of Federal Home Loan Bank stock ownership. We also utilize securities sold under agreements to repurchase and overnight repurchase agreements to supplement our supply of investable funds and to meet deposit withdrawal requirements.
Financial Services
The Bank has an agreement with LPL Financial LLC (“LPL”), a third-party registered broker-dealer, through which the Bank offers its customers, under the brand of Asheville Savings Investment Services, a complete range of nondeposit investment products, including mutual funds, debt, equity and government securities, retirement accounts, insurance products and fixed and variable annuities. Pursuant to the agreement with LPL, the Bank received fees of $217,000, $268,000 and $224,000 for the years ended December 31, 2015, 2014 and 2013, respectively.
Subsidiaries
The Bank is the Company’s sole wholly owned subsidiary. The Bank has two subsidiaries, Appalachian Financial Services, Inc., which was formed to engage in investment activities and is currently inactive, and Wenoca, Inc., which serves as the Bank’s trustee regarding deeds of trust. Both subsidiaries are organized as North Carolina corporations.
REGULATION AND SUPERVISION
The Bank is a North Carolina chartered savings bank and the wholly owned subsidiary of the Company, which is a North Carolina corporation and registered bank holding company. The Bank’s deposits are insured up to applicable limits by the Federal Deposit Insurance Corporation (the “FDIC”). The Bank is subject to extensive regulation by the North Carolina Commissioner of Banks (the “NCCoB”), as its chartering agency, and by the FDIC, as its deposit insurer. The Bank is required to file reports with, and is periodically examined by, the FDIC and the NCCoB concerning its activities and financial condition and must obtain regulatory approvals prior to entering into certain transactions, including, but not limited to, mergers with or acquisitions of other financial institutions. This regulation and supervision establishes a comprehensive framework of activities in which an institution can engage and is intended primarily for the protection of depositors and, for purposes of the FDIC, the protection of the insurance fund. The regulatory structure also gives the regulatory authorities extensive discretion in connection with their supervisory and enforcement activities and examination policies, including policies with respect to the classification of assets and the establishment of adequate loan loss reserves for regulatory purposes. The Bank is a member of the Federal Home Loan Bank of Atlanta (the “FHLB of Atlanta” or “FHLB”). The Company is regulated as a bank holding company by the Federal Reserve Board (the “FRB”) and the NCCoB. Any change in such regulatory requirements and policies, whether by the North Carolina legislature, the FDIC, the FRB or Congress, could have a material adverse impact on the Company, the Bank and their operations.
Certain regulatory requirements applicable to the Company and the Bank are referred to below or elsewhere herein. This description of statutes and regulations is intended to be a summary of the material provisions of such statutes and regulations and their effects on the Company and the Bank. You are encouraged to reference the actual statutes and regulations for additional information.
Recent Regulatory Reform
Although the financial crisis has now passed, two legislative and regulatory responses – the Dodd-Frank Wall Street Reform and Consumer Protection Act (the “Dodd-Frank Act”) and the Basel III-based capital rules – will continue to have an impact on our operations.
The Dodd-Frank Wall Street Reform and Consumer Protection Act
The Dodd-Frank Act was signed into law in July 2010. The Dodd-Frank Act impacts financial institutions in numerous ways, including:
|
•
|
The creation of a Financial Stability Oversight Council responsible for monitoring and managing systemic risk;
|
|
•
|
Granting additional authority to the Federal Reserve to regulate certain types of nonbank financial companies;
|
|
•
|
Granting new authority to the FDIC as liquidator and receiver;
|
|
•
|
Changing the manner in which deposit insurance assessments are made;
|
|
•
|
Requiring regulators to modify capital standards;
|
|
•
|
Establishing the Consumer Financial Protection Bureau (the “CFPB”);
|
|
•
|
Capping interchange fees that banks with total assets of $15 billion or more charge merchants for debit card transactions;
|
|
•
|
Imposing more stringent requirements on mortgage lenders; and
|
|
•
|
Limiting banks’ proprietary trading activities.
|
There are many provisions in the Dodd-Frank Act mandating regulators to adopt new regulations and conduct studies upon which future regulation may be based. While some have been issued, many remain to be issued. Governmental intervention and new regulations could materially and adversely affect our business, financial condition and results of operations.
Basel Capital Standards
Regulatory capital rules released by the federal bank regulatory agencies in July 2013 to implement capital standards, referred to as Basel III and developed by an international body known as the Basel Committee on Banking Supervision, impose higher minimum capital requirements for bank holding companies and banks. The rules apply to all national and state banks and savings associations regardless of size and bank holding companies and savings and loan holding companies with $500 million or more in total consolidated assets. More stringent requirements are imposed on “advanced approaches” banking organizations ‒ which are organizations with $250 billion or more in total consolidated assets, with $10 billion or more in total foreign exposures, or that have opted in to the Basel II capital regime. The new regulatory capital rules became effective for the Company and the Bank on January 1, 2015 (subject to a phase-in period for certain provisions), and all of the requirements in the rules will be fully phased in by January 1, 2019.
The rules include certain new and higher risk-based capital and leverage requirements than those previously in place. Specifically, the following minimum capital requirements apply to us:
|
•
|
a new Common Equity Tier 1 risk-based capital ratio of 4.5%;
|
|
•
|
a Tier 1 risk-based capital ratio of 6% (increased from the former 4% requirement);
|
|
•
|
a total risk-based capital ratio of 8% (unchanged from the former requirement); and
|
|
•
|
a leverage ratio of 4% (also unchanged from the former requirement).
|
Under the rules, Tier 1 capital is redefined to include two components: Common Equity Tier 1 capital and additional Tier 1 capital. The new and highest form of capital, Common Equity Tier 1 capital, consists solely of common stock (plus related surplus), retained earnings, accumulated other comprehensive income, and limited amounts of minority interests that are in the form of common stock. Additional Tier 1 capital includes other perpetual instruments historically included in Tier 1 capital, such as noncumulative perpetual preferred stock. The rules permit bank holding companies with less than $15 billion in total consolidated assets to continue to include trust preferred securities and cumulative perpetual preferred stock issued before May 19, 2010 in Tier 1 capital, but not in Common Equity Tier 1 capital, subject to certain restrictions. Tier 2 capital consists of instruments that currently qualify in Tier 2 capital plus instruments
that the rules have disqualified from Tier 1 capital treatment. Cumulative perpetual preferred stock, formerly includable in Tier 1 capital, is now included only in Tier 2 capital. Accumulated other comprehensive income (“AOCI”) is presumptively included in Common Equity Tier 1 capital and often would operate to reduce this category of capital. The rules provided a one-time opportunity at the end of the first quarter of 2015 for covered banking organizations to opt out of much of this treatment of AOCI. We elected to opt out from the inclusion of AOCI in Common Equity Tier 1 capital.
In addition, in order to avoid restrictions on capital distributions or discretionary bonus payments to executives, a covered banking organization must maintain a “capital conservation buffer” on top of its minimum risk-based capital requirements. This buffer must consist solely of Tier 1 Common Equity, but the buffer applies to all three measurements (Common Equity Tier 1, Tier 1 capital and total capital). The capital conservation buffer will be phased in incrementally over time, becoming fully effective on January 1, 2019, and will consist of an additional amount of common equity equal to 2.5% of risk-weighted assets. As of January 1, 2016, our conservation buffers were 12.16% for Common Equity Tier 1 capital, 10.66% for Tier 1 capital and 9.77% for total capital.
In general, the rules have had the effect of increasing capital requirements by increasing the risk weights on certain assets, including high volatility commercial real estate, certain loans past due 90 days or more or in nonaccrual status, mortgage servicing rights not includable in Common Equity Tier 1 capital, equity exposures, and claims on securities firms, that are used in the denominator of the three risk-based capital ratios.
It is management’s belief that, as of December 31, 2015, the Company and the Bank would have met all capital adequacy requirements under the new capital rules on a fully phased-in basis if such requirements were effective at that time.
Volcker Rule
Section 619 of the Dodd-Frank Act, known as the “Volcker Rule,” prohibits any bank, bank holding company, or affiliate (referred to collectively as “banking entities”) from engaging in two types of activities: “proprietary trading” and the ownership or sponsorship of private equity or hedge funds that are referred to as “covered funds.” Proprietary trading is, in general, trading in securities on a short-term basis for a banking entity’s own account. Funds subject to the ownership and sponsorship prohibition are those not required to register with the SEC because they have only accredited investors or no more than 100 investors. In December 2013, the federal banking agencies, together with the SEC and the Commodity Futures Trading Commission, finalized a regulation to implement the Volcker Rule. While we continue to evaluate the impact of the final regulations, we do not currently anticipate that the Volcker Rule will have a material effect on our operations.
North Carolina Banking Laws and Supervision
General. As a North Carolina savings bank, Asheville Savings is subject to supervision, regulation and examination by the NCCoB and to various North Carolina statutes and regulations which govern, among other things, investment powers, lending and deposit taking activities, borrowings, maintenance of surplus and reserve accounts, distributions of earnings and payment of dividends. In addition, Asheville Savings is also subject to North Carolina consumer protection and civil rights laws and regulations. The approval of the NCCoB is required for a North Carolina savings bank to establish or relocate branches, merge with other financial institutions, organize a holding company, issue stock and undertake certain other activities.
Net Worth Requirement. North Carolina law requires that a North Carolina savings bank maintain a net worth of not less than 5% of its total assets. Intangible assets must be deducted from net worth and assets when computing compliance with this requirement.
Investment Activities. Subject to limitation by the NCCoB, North Carolina savings banks may make any loan or investment or engage in any activity that is permitted to federally chartered institutions. In addition to such lending authority, North Carolina savings banks are generally authorized to invest funds in certain statutorily permitted investments, including but not limited to (i) obligations of the United States, or those guaranteed by it; (ii) obligations of the State of North Carolina; (iii) bank demand or time deposits; (iv) stock or obligations of the federal deposit insurance fund or a Federal Home Loan Bank; (v) savings accounts of any savings institution as approved by the board of directors; and (vi) stock or obligations of any agency of the State of North Carolina or of the United States or of any corporation doing business in North Carolina whose principal business is to make education loans. However, a North Carolina savings bank cannot invest more than 15% of its total assets in business, commercial, corporate and agricultural loans, and cannot directly or indirectly acquire or retain any corporate debt security that is not of investment grade.
Loans to One Borrower Limitations. North Carolina law provides state savings banks with broad lending authority. However, subject to certain limited exceptions, no loans and extensions of credit to any borrower outstanding at one time and not fully secured by readily marketable collateral shall exceed 15% of the net worth of the savings bank, as defined. In addition, loans and extensions of credit fully secured by readily marketable collateral may not exceed 10% of the net worth of the savings bank. These limitations do not apply to loans or obligations made: (i) for any purpose otherwise permitted under North Carolina law in an amount not to exceed $500,000; (ii) to develop domestic residential housing units, not to exceed the lesser of $30 million or 30% of the savings bank’s net worth, provided that the purchase price of each single-family dwelling in the development does not exceed $500,000 and the aggregate amount of loans made pursuant to this authority does not exceed 150% of the savings bank’s net worth; or (iii) to finance the sale of real property acquired in satisfaction of debts in an amount up to 50% of the savings bank’s net worth.
Dividends. A North Carolina stock savings bank may not declare or pay a cash dividend on, or repurchase any of, its capital stock if after making such distribution, the institution would become, or if it already is, “undercapitalized” (as such term is defined under applicable law and regulations) or such transaction would reduce the net worth of the institution to an amount which is less than the minimum amount required by applicable federal and state regulations.
Regulatory Enforcement Authority. Any North Carolina savings bank that does not operate in accordance with the regulations, policies and directives of the NCCoB may be subject to sanctions for noncompliance, including revocation of its articles of incorporation. The NCCoB may, under certain circumstances, suspend or remove officers or directors of a state savings bank who have violated the law or conducted the bank’s business in a manner which is unsafe or unsound. Upon finding that a state savings bank has engaged in an unsafe, unsound or discriminatory manner, the NCCoB may issue an order to cease and desist and impose civil monetary penalties on the institution.
Federal Banking Regulations
Capital Requirements. Under the FDIC’s regulations, federally insured state-chartered banks that are not members of the Federal Reserve System (“state non-member banks”), such as Asheville Savings, are required to comply with minimum leverage capital requirements. For an institution determined by the FDIC to not be anticipating or experiencing significant growth and to be, in general, a strong banking organization rated composite 1 under the Uniform Financial Institutions Ranking System established by the Federal Financial Institutions Examination Council, the minimum capital leverage requirement is a ratio of Tier 1 capital to total assets of 3.0%. For all other institutions, the minimum leverage capital ratio is not less than 4.0%. Tier 1 capital is the sum of common shareholders’ equity, noncumulative perpetual preferred stock (including any related surplus) and minority investments in certain subsidiaries, less intangible assets (except for certain servicing rights and credit card relationships) and certain other specified items.
In addition, FDIC regulations require state non-member banks to maintain certain ratios of regulatory capital to regulatory risk-weighted assets, or “risk-based capital ratios.” Risk-based capital ratios are determined by allocating assets and specified off-balance sheet items to four risk-weighted categories ranging from 0.0% to 100.0%. State nonmember banks must maintain a minimum ratio of total capital to risk-weighted assets of at least 8.0%, of which at least one-half must be Tier 1 capital. Total capital consists of Tier 1 capital plus Tier 2 or supplementary capital items, which include allowances for loan losses in an amount of up to 1.25% of risk-weighted assets, cumulative preferred stock and certain other capital instruments, and a portion of the net unrealized gain on equity securities. The includable amount of Tier 2 capital cannot exceed the amount of the institution’s Tier 1 capital.
As further described under “Regulation and Supervision – Basel Capital Standards,” in July 2013, the federal bank regulatory agencies issued new regulatory capital rules that will impose higher minimum capital requirements for bank holding companies and banks. The rules became effective on January 1, 2015 and apply to all national and state banks and savings associations regardless of size and bank holding companies and savings and loan holding companies with more than $1 billion in total consolidated assets.
Standards for Safety and Soundness. As required by statute, the federal banking agencies adopted final regulations and Interagency Guidelines Establishing Standards for Safety and Soundness to implement safety and soundness standards. The guidelines set forth the safety and soundness standards that the federal banking agencies use to identify and address problems at insured depository institutions before capital becomes impaired. The guidelines address internal controls and information systems, internal audit system, credit underwriting, loan documentation, interest rate exposure, asset growth, asset quality, earnings and compensation, fees and benefits. Most recently, the agencies have established standards for safeguarding customer information. If the appropriate federal banking agency determines that an institution fails to meet any standard prescribed by the guidelines, the agency may require the institution to submit to the agency an acceptable plan to achieve compliance with the standard.
Investment Activities. Since the enactment of Federal Deposit Insurance Corporation Improvement Act (the “FDICIA”), all state-chartered federally insured banks, including savings banks, have generally been limited in their investment activities to principal and equity investments of the type and in the amount authorized for national banks, notwithstanding state law. The FDICIA and the FDIC regulations promulgated thereunder permit exceptions to these limitations. For example, state chartered banks may, with FDIC approval, continue to exercise state authority to invest in common or preferred stocks listed on a national securities exchange or the Nasdaq Global Market and in the shares of an investment company registered under the Investment Company Act of 1940, as amended. The maximum permissible investment is 100% of Tier 1 Capital, as specified by the FDIC’s regulations, or the maximum amount permitted by North Carolina law, whichever is less. In addition, the FDIC is authorized to permit such institutions to engage in state authorized activities or investments not permissible for national banks (other than non-subsidiary equity investments) if they meet all applicable capital requirements and it is determined that such activities or investments do not pose a significant risk to the Deposit Insurance Fund. The FDIC has adopted regulations governing the procedures for institutions seeking approval to engage in such activities or investments. The Gramm-Leach-Bliley Act of 1999 specifies that a non-member bank may control a subsidiary that engages in activities as principal that would only be permitted for a national bank to conduct in a “financial subsidiary” if a bank meets specified conditions and deducts its investment in the subsidiary for regulatory capital purposes.
Prompt Corrective Regulatory Action. Federal law requires, among other things, that federal bank regulatory authorities take “prompt corrective action” with respect to banks that do not meet minimum capital requirements. For these purposes, the law establishes five capital categories: well capitalized, adequately capitalized, undercapitalized, significantly undercapitalized and critically undercapitalized.
The FDIC has adopted regulations to implement the prompt corrective action legislation. An institution is deemed to be “well capitalized” if it has a Common Equity Tier 1 capital ratio of 6.5% or greater, a Tier 1 capital ratio of 8.0% or greater, a total capital ratio of 10.0% or greater and a leverage capital ratio of 5.0% or greater. An institution is deemed to be “adequately capitalized” if it has a Common Equity Tier 1 capital ratio of 4.5% or greater, a Tier 1 capital ratio of 6.0% or greater, a total capital ratio of 8.0% or greater and a leverage capital ratio of 4.0% or greater. An institution is deemed to be “undercapitalized” if it has a Common Equity Tier 1 capital ratio of less than 4.5%, a Tier 1 capital ratio of less than 6.0%, a total capital ratio of less than 8.0% and a leverage capital ratio of less than 4.0%. An institution is deemed to be “significantly undercapitalized” if it has a Common Equity Tier 1 capital ratio of less than 3.0%, a Tier 1 capital ratio of less than 4.0%, a total capital ratio of less than 6.0% and a leverage capital ratio of less than 3.0%. An institution is deemed to be “critically undercapitalized” if it has capital ratios, as defined in the regulations, that are equal to or less than 2.0%.
“Undercapitalized” banks must adhere to growth, capital distribution (including dividend) and other limitations and are required to submit a capital restoration plan. A bank’s compliance with such a plan is required to be guaranteed by any company that controls the undercapitalized institution in an amount equal to the lesser of 5.0% of the institution’s total assets when deemed undercapitalized or the amount necessary to achieve the status of adequately capitalized. If an “undercapitalized” bank fails to submit an acceptable plan, it is treated as if it is “significantly undercapitalized.” “Significantly undercapitalized” banks must comply with one or more of a number of additional restrictions, including but not limited to an order by the FDIC to sell sufficient voting stock to become adequately capitalized, requirements to reduce total assets, cease receipt of deposits from correspondent banks or dismiss directors or officers, and restrictions on interest rates paid on deposits, compensation of executive officers and capital distributions by the parent holding company. “Critically undercapitalized” institutions are subject to additional measures including, subject to a narrow exception, the appointment of a receiver or conservator within 270 days after it obtains such status.
As further described under “Regulation and Supervision – Basel Capital Standards,” in July 2013, the federal bank regulatory agencies issued new regulatory capital rules that will impose higher minimum capital requirements for bank holding companies and banks. The rules became effective on January 1, 2015 and apply to all national and state banks and savings associations regardless of size and bank holding companies and savings and loan holding companies with more than $1 billion in total consolidated assets. It is management’s belief that, as of December 31, 2015, the Company and the Bank would have met all capital adequacy requirements under the new capital rules on a fully phased-in basis if such requirements were effective at that time.
Transactions with Affiliates. Various legal limitations restrict the Bank from lending or otherwise supplying funds to the Company or its non-bank subsidiaries. The Company and the Bank are subject to Sections 23A and 23B of the Federal Reserve Act and Federal Reserve Regulation W. Section 23A of the Federal Reserve Act places limits on the amount of loans or extensions of credit to, or investments in, or certain other transactions with, affiliates and on the amount of advances to third parties collateralized by the securities or obligations of affiliates. The aggregate of all covered transactions is limited in amount, as to any one affiliate, to 10% of the Bank’s capital and surplus and, as to all affiliates combined, to 20% of the Bank’s capital and surplus. Furthermore, within the foregoing limitations as to amount, each covered transaction must meet specified collateral requirements. The Bank is forbidden to purchase low quality assets from an affiliate.
Section 23B of the Federal Reserve Act, among other things, prohibits a bank from engaging in certain transactions with certain affiliates unless the transactions are on terms and under circumstances, including credit standards, that are substantially the same, or at least as favorable to such bank or its subsidiaries, as those prevailing at the time for comparable transactions with or involving other nonaffiliated companies. If there are no comparable transactions, a bank’s (or one of its subsidiaries’) affiliate transaction must be on terms and under circumstances, including credit standards, that in good faith would be offered to, or would apply to, nonaffiliated companies. These requirements apply to all transactions subject to Section 23A as well as to certain other transactions.
The affiliates of a bank include any holding company of the bank, any other company under common control with the bank (including any company controlled by the same shareholders who control the bank), any subsidiary of the bank that is itself a bank, any company in which the majority of the directors or trustees also constitute a majority of the directors or trustees of the bank or holding company of the bank, any company sponsored and advised on a contractual basis by the bank or an affiliate, and any mutual fund advised by a bank or any of the bank’s affiliates. Regulation W generally excludes all non-bank subsidiaries of banks from treatment as affiliates, except for subsidiaries engaged in certain nonbank financial activities or to the extent that the Federal Reserve decides to treat these subsidiaries as affiliates.
The Bank is also subject to certain restrictions on extensions of credit to executive officers, directors, certain principal shareholders, and their related interests. Extensions of credit include derivative transactions, repurchase and reverse repurchase agreements, and securities borrowing and lending transactions to the extent that such transactions cause a bank to have credit exposure to an insider. Any extension of credit to an insider:
|
•
|
must be made on substantially the same terms, including interest rates and collateral, as those prevailing at the time for comparable transactions with third parties; and
|
|
•
|
must not involve more than the normal risk of repayment or present other unfavorable features.
|
In addition, the Bank may not purchase an asset from or sell an asset to an insider unless the transaction is on market terms and, if representing more than 10% of capital, is approved in advance by the majority of disinterested directors.
Enforcement. The FDIC has extensive enforcement authority over insured state-chartered savings banks, including Asheville Savings. This enforcement authority includes, among other things, the ability to assess civil money penalties, issue cease and desist orders and remove directors and officers. In general, these enforcement actions may be initiated in response to violations of laws and regulations and unsafe or unsound practices. The FDIC has authority under federal law to appoint a conservator or receiver for an insured bank under limited circumstances. The FDIC is required, with certain exceptions, to appoint a receiver or conservator for an insured state non-member bank if that bank was “critically undercapitalized” on average during the calendar quarter beginning 270 days after the date on which the institution became “critically undercapitalized.” The FDIC may also appoint itself as conservator or receiver for an insured state non-member institution under specific circumstances on the basis of the institution’s financial condition or upon the occurrence of other events, including: (i) insolvency; (ii) substantial dissipation of assets or earnings through violations of law or unsafe or unsound practices; (iii) existence of an unsafe or unsound condition to transact business; and (iv) insufficient capital, or the incurring of losses that will deplete substantially all of the institution’s capital with no reasonable prospect of replenishment without federal assistance.
Insurance of Deposit Accounts. The FDIC insures deposits at FDIC insured financial institutions such as Asheville Savings. Deposit accounts at the Bank are insured by the FDIC generally up to a maximum of $250,000 per separately insured depositor and up to a maximum of $250,000 for self-directed retirement accounts. The FDIC charges the insured financial institutions premiums to maintain the Deposit Insurance Fund.
Effective April 1, 2011, FDIC deposit assessments are based on an institution’s average consolidated total assets minus average tangible equity as opposed to total deposits. Since the new base is much larger than the previous base, the FDIC also lowered assessment rates so that the total amount of revenue collected from the industry would not be significantly altered. The rule is expected to benefit smaller financial institutions, which typically rely more on deposits for funding, and shift more of the burden for supporting the insurance fund to larger institutions, which have greater access to non-deposit sources of funding. The Bank’s 2015 FDIC insurance cost decreased approximately $20,000 primarily as a result of these changes.
Federal Home Loan Bank System. Asheville Savings is a member of the Federal Home Loan Bank System, which consists of twelve regional Federal Home Loan Banks. The FHLB provides a central credit facility primarily for member institutions. Asheville Savings, as a member of the FHLB of Atlanta, is required to acquire and hold shares of capital stock in that Federal Home Loan Bank. At December 31, 2015, Asheville Savings complied with this requirement with an investment in FHLB of Atlanta stock of $2.8 million.
The Federal Home Loan Banks were required to provide funds for the resolution of insolvent thrifts in the late 1980s and to contribute funds for affordable housing programs. These requirements, or general results of operations, could reduce or eliminate the dividends that the Federal Home Loan Banks pay to their members and result in the Federal Home Loan Banks imposing a higher rate of interest on advances to their members. If dividends were reduced, or interest on future Federal Home Loan Bank advances increased, our net interest income would likely also be reduced.
Community Reinvestment Act. Under the Community Reinvestment Act, as implemented by FDIC regulations, a savings association has a continuing and affirmative obligation consistent with its safe and sound operation to help meet the credit needs of its entire community, including low and moderate income neighborhoods. The Community Reinvestment Act does not establish specific lending requirements or programs for financial institutions nor does it limit an institution’s discretion to develop the types of products and services that it believes are best suited to its particular community. The Community Reinvestment Act requires the FDIC, in connection with its examination of a savings institution, to assess the institution’s record of meeting the credit needs of its community and to take such record into account in its evaluation of certain applications by such institution.
The Community Reinvestment Act requires public disclosure of an institution’s rating and requires the Federal Deposit Insurance Corporation to provide a written evaluation of an association’s Community Reinvestment Act performance utilizing a four-tiered descriptive rating system.
Asheville Savings received a “satisfactory” rating as a result of its most recent Community Reinvestment Act assessment.
Other Regulations
Interest and other charges collected or contracted for by Asheville Savings are subject to state usury laws and federal laws concerning interest rates. The Bank’s operations are also subject to federal laws applicable to credit transactions, such as the:
|
•
|
Truth-In-Lending Act, governing disclosures of credit terms to consumer borrowers;
|
|
•
|
Home Mortgage Disclosure Act of 1975, requiring financial institutions to provide information to enable the public and public officials to determine whether a financial institution is fulfilling its obligation to help meet the housing needs of the community it serves;
|
|
•
|
Equal Credit Opportunity Act, prohibiting discrimination on the basis of race, creed or other prohibited factors in extending credit;
|
|
•
|
Fair Credit Reporting Act of 1978, governing the use and provision of information to credit reporting agencies;
|
|
•
|
Fair Debt Collection Act, governing the manner in which consumer debts may be collected by collection agencies; and
|
|
•
|
Rules and regulations of the various federal agencies charged with the responsibility of implementing such federal laws.
|
The operations of Asheville Savings also are subject to, among other things, the:
|
•
|
Right to Financial Privacy Act, which imposes a duty to maintain confidentiality of consumer financial records and prescribes procedures for complying with administrative subpoenas of financial records;
|
|
•
|
Electronic Funds Transfer Act and Regulation E promulgated thereunder, which governs automatic deposits to and withdrawals from deposit accounts and customers’ rights and liabilities arising from the use of automated teller machines and other electronic banking services;
|
|
•
|
Check Clearing for the 21st Century Act (also known as “Check 21”), which gives “substitute checks,” such as digital check images and copies made from that image, the same legal standing as the original paper check;
|
|
•
|
Title III of the Uniting and Strengthening America by Providing Appropriate Tools Required to Intercept and Obstruct Terrorism Act of 2001 (referred to as the “USA PATRIOT Act”), which significantly expands the responsibilities of financial institutions in preventing the use of the U.S. financial system to fund terrorist activities. Among other provisions, it requires financial institutions operating in the United States to develop new anti-money laundering compliance programs, due diligence policies and controls to ensure the detection and reporting of money laundering. Such required compliance programs are intended to supplement existing compliance requirements, also applicable to financial institutions, under the Bank Secrecy Act and the Office of Foreign Assets Control (“OFAC”) Regulations; and
|
|
•
|
The Gramm-Leach-Bliley Act, which places limitations on the sharing of consumer financial information with unaffiliated third parties. Specifically, the Gramm-Leach-Bliley Act requires all financial institutions offering financial products or services to retail customers to provide such customers with the financial institution’s privacy policy and provide such customers the opportunity to “opt out” of the sharing of personal financial information with unaffiliated third parties.
|
Federal Reserve System
The FRB regulations require savings institutions to maintain noninterest earning reserves against their transaction accounts (primarily Negotiable Order of Withdrawal (“NOW”) and regular checking accounts). The regulations generally provide that reserves be maintained against aggregate transaction accounts as follows: a 3% reserve ratio is assessed on net transaction accounts greater than $14.5 million and less than $103.6 million; a 10% reserve ratio is assessed on net transaction accounts greater than $103.6 million. The first $14.5 million of otherwise reservable balances (subject to adjustments by the FRB) are exempted from the reserve requirements. The amounts are adjusted annually. Asheville Savings complies with the foregoing requirements.
Holding Company Regulation
The Company is subject to examination, regulation and periodic reporting under the Bank Holding Company Act of 1956, as amended, as administered by the FRB. As a result, prior FRB approval would be required for the Company to acquire direct or indirect ownership or control of any voting securities of any bank or bank holding company if, after such acquisition, it would, directly or indirectly, own or control more than 5% of any class of voting shares of the bank or bank holding company. In addition to the approval of the FRB, before any bank acquisition can be completed, prior approval may also be required to be obtained from other agencies having supervisory jurisdiction over the bank to be acquired.
A bank holding company is generally prohibited from engaging in, or acquiring, direct or indirect control of more than 5% of the voting securities of any company engaged in non-banking activities. One of the principal exceptions to this prohibition is for activities found by the FRB to be so closely related to banking or managing or controlling banks as to be a proper incident thereto. Some of the principal activities that the FRB has determined by regulation to be so closely related to banking are: (i) making or servicing loans; (ii) performing certain data processing services; (iii) providing discount brokerage services; (iv) acting as fiduciary, investment or financial advisor; (v) leasing personal or real property; (vi) making investments in corporations or projects designed primarily to promote community welfare; and (vii) acquiring a savings and loan association.
The Gramm-Leach-Bliley Act of 1999 authorizes a bank holding company that meets specified conditions, including being “well capitalized” and “well managed,” to opt to become a “financial holding company” and thereby engage in a broader array of financial activities than previously permitted. Such activities can include insurance underwriting and investment banking.
The Company is also subject to the FRB’s capital adequacy guidelines for bank holding companies (on a consolidated basis) substantially similar to those of the FDIC for Asheville Savings.
A bank holding company is generally required to give the FRB prior written notice of any purchase or redemption of then outstanding equity securities if the gross consideration for the purchase or redemption, when combined with the net consideration paid for all such purchases or redemptions during the preceding 12 months, is equal to 10% or more of the company’s consolidated net worth. The FRB may disapprove such a purchase or redemption if it determines that the proposal would constitute an unsafe and unsound practice, or would violate any law, regulation, FRB order or directive, or any condition imposed by, or written agreement with, the FRB. The FRB has adopted an exception to this approval requirement for well-capitalized bank holding companies that meet certain other conditions.
The FRB has issued a policy statement regarding the payment of dividends by bank holding companies. In general, the FRB’s policies provide that dividends should be paid only out of current earnings and only if the prospective rate of earnings retention by the bank holding company appears consistent with the organization’s capital needs, asset quality and overall financial condition. The FRB’s policies also require that a bank holding company serve as a source of financial strength to its subsidiary banks by standing ready to use available resources to provide adequate capital funds to those banks during periods of financial stress or adversity and by maintaining the financial flexibility and capital-raising capacity to obtain additional resources for assisting its subsidiary banks where necessary. Under the prompt corrective action laws, the ability of a bank holding company to pay dividends may be restricted if a subsidiary bank becomes undercapitalized. These regulatory policies could affect the ability of the Company to pay dividends or otherwise engage in capital distributions.
Under the Federal Deposit Insurance Act, depository institutions are liable to the FDIC for losses suffered or anticipated by the FDIC in connection with the default of a commonly controlled depository institution or any assistance provided by the FDIC to such an institution in danger of default. This law would have potential applicability if the Company ever held as a separate subsidiary a depository institution in addition to Asheville Savings.
The Company and the Bank will be affected by the monetary and fiscal policies of various agencies of the United States Government, including the Federal Reserve System. In view of changing conditions in the national economy and in the money markets, it is impossible for management to accurately predict future changes in monetary policy or the effect of such changes on the business or financial condition of the Company or the Bank.
The status of the Company as a registered bank holding company under the Bank Holding Company Act will not exempt it from certain federal and state laws and regulations applicable to corporations generally, including, without limitation, certain provisions of the federal securities laws.
Federal Securities Laws
The Company’s common stock is registered with the Securities and Exchange Commission under the Securities Exchange Act of 1934, as amended. As a result, the Company is subject to the information, proxy solicitation, insider trading restrictions and other requirements under the Securities Exchange Act of 1934, as amended.
Sarbanes-Oxley Act of 2002
The Sarbanes-Oxley Act of 2002 addresses, among other issues, corporate governance, auditing and accounting, executive compensation, and enhanced and timely disclosure of corporate information. As directed by the Sarbanes-Oxley Act of 2002, the Company’s principal executive officer and principal financial and accounting officer each are required to certify that the Company’s quarterly and annual reports do not contain any untrue statement of a material fact. The rules adopted by the Securities and Exchange
Commission under the Sarbanes-Oxley Act of 2002 have several requirements, including having these officers certify that: they are responsible for establishing, maintaining and regularly evaluating the effectiveness of our internal controls; they have made certain disclosures to our auditors and the audit committee of the board of directors about our internal controls; and they have included information in our quarterly and annual reports about their evaluation and whether there have been significant changes in our internal controls or in other factors that could significantly affect internal controls.
FEDERAL AND STATE TAXATION
Federal Income Taxation
General. We report our income on a calendar year basis using the accrual method of accounting. The federal income tax laws apply to us in the same manner as to other corporations with some exceptions, including particularly our reserve for bad debts discussed below. The following discussion of tax matters is intended only as a summary and does not purport to be a comprehensive description of the tax rules applicable to us. The Bank’s federal income tax returns were examined for 2008, 2009 and 2010. For its 2015 and 2014 calendar years, the Company’s maximum marginal federal income tax rate was 34%.
The Company and the Bank have entered into a tax allocation agreement. Because the Company owns 100% of the issued and outstanding capital stock of the Bank, the Company and the Bank are members of an affiliated group within the meaning of Section 1504(a) of the Internal Revenue Code, of which group the Company is the common parent corporation. As a result of this affiliation, the Bank may be included in the filing of a consolidated federal income tax return with the Company and, if a decision to file a consolidated tax return is made, the parties agree to compensate each other for their individual share of the consolidated tax liability and/or any tax benefits provided by them in the filing of the consolidated federal income tax return.
Bad Debt Reserves. For fiscal years beginning before June 30, 1996, thrift institutions that qualified under certain definitional tests and other conditions of the Internal Revenue Code were permitted to use certain favorable provisions to calculate their deductions from taxable income for annual additions to their bad debt reserve. A reserve could be established for bad debts on qualifying real property loans, generally secured by interests in real property improved or to be improved, under the percentage of taxable income method or the experience method. The reserve for nonqualifying loans was computed using the experience method. Federal legislation enacted in 1996 repealed the reserve method of accounting for bad debts and the percentage of taxable income method for tax years beginning after 1995 and require savings institutions to recapture or take into income certain portions of their accumulated bad debt reserves.
Distributions. If Asheville Savings makes “non-dividend distributions” to the Company, the distributions will be considered to have been made from the Bank’s unrecaptured tax bad debt reserves, including the balance of its reserves as of December 31, 1987, to the extent of the “non-dividend distributions,” and then from the Bank’s supplemental reserve for losses on loans, to the extent of those reserves, and an amount based on the amount distributed, but not more than the amount of those reserves, will be included in the Bank’s taxable income. Non-dividend distributions include distributions in excess of the Bank’s current and accumulated earnings and profits, as calculated for federal income tax purposes, distributions in redemption of stock, and distributions in partial or complete liquidation. Dividends paid out of the Bank’s current or accumulated earnings and profits will not be so included in the Bank’s taxable income.
The amount of additional taxable income triggered by a non-dividend is an amount that, when reduced by the tax attributable to the income, is equal to the amount of the distribution. Therefore, if Asheville Savings makes a non-dividend distribution to the Company, approximately one and one-half times the amount of the distribution not in excess of the amount of the reserves would be includable in income for federal income tax purposes, assuming a 34% federal corporate income tax rate. Asheville Savings does not intend to pay dividends that would result in a recapture of any portion of its bad debt reserves.
State Taxation
North Carolina. North Carolina imposes corporate income and franchise taxes. North Carolina’s corporate income tax was 5% for 2015 for the portion of a corporation’s net income allocable to the state. If a corporation in North Carolina does business in North Carolina and in one or more other states, North Carolina taxes a fraction of the corporation’s income based on the amount of sales, payroll and property it maintains within North Carolina. Effective for tax years beginning on or after January 1, 2014, North Carolina’s corporate income tax rate decreased to 6% from 6.9%. Effective for tax years beginning on or after January 1, 2015, North Carolina’s corporate income tax rate decreased to 5% from 6%. Reductions in North Carolina’s corporate income tax rates have the effect of reducing income taxes on current taxable income, but such reductions also have the effect of increasing income taxes on deferred tax assets that represent tax deductions deferred to future periods because the Federal income tax benefits from the state income taxes attributable to the deferred deductions are lower. North Carolina franchise tax is levied on business corporations at the rate of $1.50 per $1,000 of the largest of the following three alternate bases: (i) the amount of the corporation’s capital stock, surplus and undivided profits apportionable to the state; (ii) 55% of the appraised value of the corporation’s property in the state subject to local taxation; or (iii) the book value of the corporation’s real and tangible personal property in the state less any outstanding debt that was created to acquire or improve real property in the state.
Any cash dividends, in excess of a certain exempt amount, that would be paid with respect to ASB Bancorp, Inc. common stock to a shareholder (including a partnership and certain other entities) who is a resident of North Carolina will be subject to the North Carolina income tax. Any distribution by a corporation from earnings according to percentage ownership is considered a dividend, and the definition of a dividend for North Carolina income tax purposes may not be the same as the definition of a dividend for federal income tax purposes. A corporate distribution may be treated as a dividend for North Carolina income tax purposes if it is paid from funds that exceed the corporation’s earned surplus and profits under certain circumstances.
Risks Related to Our Business
Significant loan losses could require us to increase our allowance for loan losses through a charge to earnings.
When we loan money we incur the risk that our borrowers will not repay their loans. We provide for loan losses by establishing an allowance through a charge to earnings. The amount of this allowance is based on our assessment of loan losses inherent in our loan portfolio. The process for determining the amount of the allowance is critical to our financial condition and results of operations. It requires subjective and complex judgments about the future, including forecasts of economic or market conditions that might impair the ability of our borrowers to repay their loans. We might underestimate the loan losses inherent in our loan portfolio and have loan losses in excess of the amount recorded in our allowance for loan losses. In addition, we might increase the allowance because of changing economic conditions. For example, in a rising interest rate environment, borrowers with adjustable-rate loans could see their payments increase. There may be a significant increase in the number of borrowers who are unable or unwilling to repay their loans, resulting in our charging off more loans and increasing our allowance. Furthermore, when real estate values decline, the potential severity of loss on a real estate-secured loan can increase significantly, especially in the case of loans with high combined loan-to-value ratios. Downturns in the national economy and the local economies of the areas in which our loans are concentrated could result in an increase in loan delinquencies, foreclosures or repossessions resulting in increased charge-off amounts and the need for additional loan loss allowances in future periods. In addition, our determination as to the amount of our allowance for loan losses is subject to review by our primary regulators, the FDIC and the NCCoB, as part of their examination process, which may result in the establishment of an additional allowance based upon the judgment of the
FDIC and/or the NCCoB after a review of the information available at the time of their examination. Our allowance for loan losses amounted to $6.3 million and $5.9 million, or 1.09% and 1.14% of total loans outstanding and 246.82% and 221.32% of nonperforming loans, at December 31, 2015 and 2014, respectively. A large loss could deplete the allowance and require increased provisions to replenish the allowance, which would decrease our earnings. In addition, at December 31, 2015, we had 93 loan relationships with outstanding balances that exceeded $1 million, all of which were performing according to their original terms. The deterioration of one or more of these loan relationships could result in a significant increase in our nonperforming loans and our provision for loan losses, which would negatively impact our results of operations.
Our commercial lending activities exposed us to losses in recent recessionary periods and our continued emphasis on commercial lending may expose us to future lending risks.
Our emphasis on commercial mortgage, commercial construction and commercial land development loans exposed us to losses as the recent economic recession has adversely affected many businesses and developers in our market area. We are continuing to emphasize our commercial mortgage and commercial and industrial lending activities. At December 31, 2015, 30.8% of our commercial real estate loans were secured by owner-occupied properties.
At December 31, 2015, our loan portfolio included $209.4 million, or 36.3% of total loans, of commercial mortgage loans, $38.3 million, or 6.6% of total loans, of commercial construction and land development loans, and $22.9 million, or 4.0% of total loans, of commercial and industrial loans. Commercial mortgage loans, commercial construction and land development loans and commercial and industrial loans generally expose a lender to greater risk of nonpayment and loss than one-to-four family residential mortgage loans because repayment of these loans often depends on the successful operation of the property and the income stream of the borrowers, and in the case of commercial construction and land development loans, the successful completion and sale of the project. Such loans typically involve larger loan balances to single borrowers or groups of related borrowers compared to one-to-four family residential mortgage loans. Commercial and industrial loans also expose us to additional risks since they typically are made on the basis of the borrower’s ability to make repayments from the cash flow of the borrower’s business and are secured by non-real estate collateral that may depreciate over time. In addition, since such loans generally entail greater risk than one-to-four family residential mortgage loans, we may need to increase our allowance for loan losses in the future to account for the likely increase in probable credit losses associated with the growth of such loans. Also, many of our commercial borrowers have more than one loan outstanding with us. Consequently, an adverse development with respect to one loan or one credit relationship can expose us to a significantly greater risk of loss compared to an adverse development with respect to a one-to-four family residential mortgage loan.
A slowing or declining of national and local economic conditions could result in increases in our level of nonperforming loans and/or reduce demand for our products and services, which may negatively impact our financial condition and results of operations.
Our business activities and earnings are affected by general business conditions in the United States and in our primary market area. These conditions include short-term and long-term interest rates, inflation, unemployment levels, monetary supply, consumer confidence and spending, fluctuations in both debt and equity capital markets and the strength of the economy in the United States generally and in our primary market area in particular. In recent years, the national economy has experienced recessionary conditions that have resulted in general economic downturns, with rising unemployment levels, declines in real estate values and an erosion in consumer confidence. Over the course of the past two years, the tourism industry in the Asheville metropolitan area has largely recovered, which positively impacted the economy in a number of our local markets, such as Buncombe and Henderson Counties, that directly benefit from this industry. The overall unemployment rate in the Asheville metropolitan area was 4.2% in December 2015 compared to 4.0% in December 2014, 5.0% in December 2013, 7.5% in December 2012 and its recessionary high of
10.2% in February 2010. However, Buncombe County had the lowest unemployment rate in North Carolina for December 2015 at 3.9%. McDowell County and Transylvania County, which are located in our primary market area, continued to experience unemployment rates that exceeded the national unemployment rates. As of December 2015, the unemployment rate for McDowell County was 5.1%, and Transylvania County was 5.3%, while the national and state unemployment rates were 5.0% and 5.6%, respectively. In addition, our primary market area is recovering from a softening of the local real estate market, that included reductions in local property values and declines in the local manufacturing industry, which employs many of our borrowers. While economic conditions and real estate in our primary market areas have shown signs of improvement, there can be no assurance that this improvement will continue or that our local markets will not experience another economic decline. Economic downturns, elevated levels of unemployment, further declines in the values of real estate, or other events that affect household and/or corporate incomes could impair the ability of our borrowers to repay their loans in accordance with their terms. Deterioration in local economic conditions could also drive the level of loan losses beyond the level we have provided for in our allowance for loan and lease losses, which could necessitate increasing our provision for loans losses and reduce our earnings. Additionally, the demand for our products and services could be reduced, which would adversely impact our liquidity and the level of revenues we generate.
Further declines in real estate values may cause us to incur losses in our portfolio of foreclosed real estate.
Our portfolio of foreclosed real estate includes parcels of unimproved land, land with completed structures and land with structures in various stages of completion. We may have to incur additional costs to complete certain parcels of our foreclosed properties in order to market and sell the parcels, which may not fully recover upon the sale of the parcel thereby causing us to incur additional losses. In addition, although real estate values in our primary market areas have generally shown signs of improvement, there can be no assurance that this improvement will continue. If our local markets experience declines in the values of real estate, we may have to recognize further write-downs on our foreclosed real estate or incur losses when we sell our foreclosed real estate.
The geographic concentration of our loan portfolio and lending activities makes us vulnerable to a downturn in the local economy.
Nearly all of our loans are secured by real estate or made to businesses in our primary market area, which consists of Buncombe, Madison, McDowell, Henderson and Transylvania Counties in North Carolina and the surrounding areas. This concentration makes us vulnerable to a downturn in the local economy and real estate markets, such as the one that we experienced beginning in the latter half of 2007. Adverse conditions in the local economy such as inflation, unemployment, recession or other factors beyond our control could impact the ability of our borrowers to repay their loans, which could impact our net interest income. Decreases in local real estate values could adversely affect the value of the property used as collateral for our loans, which could cause us to realize a loss in the event of a foreclosure.
Changes in interest rates may hurt our profits and investment securities values.
Our net interest income is the interest we earn on loans and investments less the interest we pay on our deposits and borrowings. Our interest rate spread is the difference between the yield we earn on our assets and the interest rate we pay for deposits and our borrowings. Changes in interest rates could adversely affect our interest rate spread and, as a result, our net interest income. Although the yield we earn on our assets and our funding costs tend to move in the same direction in response to changes in interest rates, one can rise or fall faster than the other, causing our interest rate spread to expand or contract. Our liabilities are shorter in duration than our assets, so they will adjust faster in response to changes in interest rates. As a result, when interest rates rise, our funding costs will rise faster than the yield we earn on our assets, causing our interest rate spread to contract until the yield catches up. Changes in the slope of the “yield curve”—or the spread between short-term and long-term interest rates—will also reduce our interest rate spread. Normally, the yield curve is upward sloping, meaning short-term rates are lower than long-term
rates. Because our liabilities are shorter in duration than our assets, when the yield curve flattens or even inverts, we will experience pressure on our interest rate spread as our cost of funds increases relative to the yield we can earn on our assets. In addition, our mortgage banking income is sensitive to changes in interest rates. During periods of rising and relatively higher interest rates, mortgage originations for purchased homes can decline considerably and refinanced mortgage activity can severely decrease. During periods of falling and relatively lower interest rates, the opposite effects can occur.
Our business strategy includes moderate growth plans, and our financial condition and results of operations could be negatively affected if we fail to grow or fail to manage our growth effectively.
Over the long term, we expect to experience growth in our assets, our deposits and the scale of our operations, whether through organic growth or acquisitions. However, achieving our growth targets requires us to successfully execute our business strategies. Our business strategies include continuing to diversify our loan portfolio by increasing our commercial and industrial lending activities and introducing new and competitive deposit products. Our ability to successfully grow will also depend on the continued availability of loan opportunities that meet our stringent underwriting standards. If we do not manage our growth effectively, we may not be able to achieve our business plan, and our business and prospects could be adversely affected.
We are subject to extensive regulation that could restrict our activities, have an adverse impact on our operations, and impose financial requirements or limitations on the conduct of our business.
We operate in a highly regulated industry and are subject to examination, supervision, and comprehensive regulation by various regulatory agencies. The Company is subject to FRB regulation, and our Bank is subject to extensive regulation, supervision, and examination by our primary federal regulator, the FDIC, and by our primary state regulator, the NCCoB. Also, as a member of the FHLB of Atlanta, the Bank must comply with applicable regulations of the Federal Housing Finance Board and the FHLB. Our Bank’s activities are also regulated under consumer protection laws applicable to our lending, deposit, and other activities. A sufficient claim against us under these laws could have a material adverse effect on our results of operations.
Regulation by these agencies is intended primarily for the protection of our depositors and the deposit insurance fund and not for the benefit of our shareholders. Congress and federal regulatory agencies continually review banking laws, regulations and policies for possible changes. The Dodd-Frank Act, enacted in July 2010, instituted major changes to the banking and financial institutions regulatory regimes. The Dodd-Frank Act and other changes to statutes, regulations or regulatory policies or supervisory guidance, including changes in interpretation or implementation of statutes, regulations, policies or supervisory guidance, could affect us in substantial and unpredictable ways, including, among other things, subjecting us to increased capital, liquidity and risk management requirements, creating additional costs, limiting the types of financial services and products we may offer and/or increasing the ability of non-banks to offer competing financial services and products. Failure to comply with laws, regulations or policies could also result in heightened regulatory scrutiny and in sanctions by regulatory agencies (such as a memorandum of understanding, a written supervisory agreement or a cease and desist order), civil money penalties and/or reputation damage. Any of these consequences could restrict our ability to expand our business or could require us to raise additional capital or sell assets on terms that are not advantageous to us or our shareholders and could have a material adverse effect on our business, financial condition and results of operations. While we have policies and procedures designed to prevent any such violations, such violations may occur despite our best efforts.
New capital rules that were recently issued generally require insured depository institutions and their holding companies to hold more capital. The impact of the new rules on our financial condition and operations is uncertain but could be materially adverse.
In July 2013, the federal bank regulatory agencies issued a final rule that revised their risk-based capital requirements and the method for calculating risk-weighted assets to make them consistent with agreements that were reached by Basel III and certain provisions of the Dodd-Frank Act. This rule substantially amended the regulatory risk-based capital rules applicable to us. The requirements in the rule began to phase in on January 1, 2015 for the Company and the Bank. The requirements in the rule will be fully phased in by January 1, 2019.
The final rule includes certain new and higher risk-based capital and leverage requirements than those previously in place. Specifically, the following minimum capital requirements apply to us:
|
•
|
a new Common Equity Tier 1 risk-based capital ratio of 4.5%;
|
|
•
|
a Tier 1 risk-based capital ratio of 6.0% (increased from the former 4.0% requirement);
|
|
•
|
a total risk-based capital ratio of 8.0% (unchanged from the former requirement); and
|
|
•
|
a leverage ratio of 4.0% (also unchanged from the former requirement).
|
Under the rule, Tier 1 capital is redefined to include two components: Common Equity Tier 1 capital and additional Tier 1 capital. The new and highest form of capital, Common Equity Tier 1 capital, consists solely of common stock (plus related surplus), retained earnings, accumulated other comprehensive income, and limited amounts of minority interests that are in the form of common stock. Additional Tier 1 capital includes other perpetual instruments historically included in Tier 1 capital, such as noncumulative perpetual preferred stock. Tier 2 capital generally consists of instruments that previously qualified as Tier 2 capital plus instruments that the rule has disqualified from Tier 1 capital treatment. Cumulative perpetual preferred stock, formerly includable in Tier 1 capital, is now included only in Tier 2 capital; except that the rule permits bank holding companies with less than $15 billion in total consolidated assets to continue to include trust preferred securities and cumulative perpetual preferred stock issued before May 19, 2010 in Tier 1 Capital (but not in Common Equity Tier 1 capital), subject to certain restrictions. Accumulated other comprehensive income (“AOCI”) is presumptively included in Common Equity Tier 1 capital and often would operate to reduce this category of capital. The rule provided a one-time opportunity at the end of the first quarter of 2015 for covered banking organizations to opt out of much of this treatment of AOCI. We elected to opt out from the inclusion of AOCI in Common Equity Tier 1 capital.
In addition, in order to avoid restrictions on capital distributions or discretionary bonus payments to executives, a covered banking organization must maintain a “capital conservation buffer” on top of its minimum risk-based capital requirements. This buffer must consist solely of Tier 1 Common Equity, but the buffer applies to all three measurements (Common Equity Tier 1, Tier 1 capital and total capital). The capital conservation buffer will be phased in incrementally over time, becoming fully effective on January 1, 2019, and will consist of an additional amount of common equity equal to 2.5% of risk-weighted assets. As of January 1, 2016, we are required to hold a capital conservation buffer of 0.625%, increasing by that amount each successive year until 2019.
In general, the rules have had the effect of increasing capital requirements by increasing the risk weights on certain assets, including high volatility commercial real estate, certain loans past due 90 days or more or in nonaccrual status, mortgage servicing rights not includable in Common Equity Tier 1 capital, equity exposures, and claims on securities firms, that are used in the denominator of the three risk-based capital ratios.
In addition, in the current economic and regulatory environment, bank regulators may impose capital requirements that are more stringent than those required by applicable existing regulations. The application of more stringent capital requirements for us could, among other things, result in lower returns on equity, require the raising of additional capital, and result in regulatory actions if we were to be unable to comply with such requirements. Implementation of changes to asset risk weightings for risk-based capital calculations, items included or deducted in calculating regulatory capital or additional capital conservation buffers, could result in management modifying our business strategy and could limit our ability to make distributions, including paying dividends or buying back our shares.
The federal banking agencies have adopted liquidity standards that, while not directly applicable to us, could result in our having to lengthen the term of our funding, restructure our business lines by forcing us to seek new sources of liquidity for them, and/or increase our holdings of liquid assets.
As part of the Basel III capital process, the Basel Committee on Banking Supervision issued a new liquidity standard, a liquidity coverage ratio, which requires a banking organization to hold sufficient “high quality liquid assets” to meet liquidity needs for a 30 calendar day liquidity stress scenario, as well as a net stable funding ratio, which imposes a similar requirement over a one-year period. During 2014 the United States banking regulators approved a final rule with respect to a liquidity coverage ratio for systemically important banks. Although the liquidity coverage ratio rule does not apply directly to us, the substance of the rule may inform the regulators’ assessment of our liquidity. We could be required to reduce our holdings of illiquid assets and adversely affect our results and financial condition. The United States regulators have not yet proposed a net stable funding ratio requirement.
Increased and/or special FDIC assessments will hurt our earnings.
The recent economic recession caused a high level of bank failures, which dramatically increased FDIC resolution costs and led to a significant reduction in the balance of the deposit insurance fund. As a result, the FDIC significantly increased the initial base assessment rates paid by financial institutions for deposit insurance. If such increases in the base assessment rate occur in the future, our deposit insurance costs may increase thereby negatively impacting our earnings.
Strong competition within our market area could hurt our profits and slow growth.
Although we consider ourselves competitive in our primary market area of Buncombe, Madison, McDowell, Henderson and Transylvania Counties in North Carolina and the surrounding areas, we face intense competition both in making loans and attracting deposits. Price competition for loans and deposits might result in us earning less on our loans and paying more on our deposits, which reduces net interest income. Some of the institutions with which we compete have substantially greater resources and lending limits than we have and may offer services that we do not provide. We expect competition to increase in the future as a result of legislative, regulatory and technological changes and the continuing trend of consolidation in the financial services industry. Our profitability depends upon our continued ability to compete successfully in our market area.
Our operational or security systems may experience an interruption or breach in security, including as a result of cyber-attacks.
We rely heavily on communications and information systems to conduct our business. Any failure, interruption or breach in security of these systems, including as a result of cyber-attacks, could result in failures or disruptions in our client relationship management, deposit, loan, and other systems and also the disclosure or misuse of confidential or proprietary information. While we have systems, policies and procedures designed to prevent or limit the effect of the failure, interruption or security breach of our information systems, there can be no assurance that any such failures, interruptions or security breaches will not occur or, if they do occur, that they will be adequately addressed. The occurrence of any failures, interruptions or security breaches of our information systems could damage our reputation, result in a loss of client business, subject us to additional regulatory scrutiny, or expose us to civil litigation and possible financial liability, any of which could have a material adverse effect on our business, financial condition and results of operations.
Liquidity needs could adversely affect our results of operations and financial condition.
The primary sources of our Bank’s funds are client deposits and loan repayments. While scheduled loan repayments are a relatively stable source of funds, they are subject to the ability of borrowers to repay the loans. The ability of borrowers to repay loans can be adversely affected by a number of factors, including changes in economic conditions, adverse trends or events affecting business industry groups, reductions in real estate values or markets, business closings or lay-offs, inclement weather, natural disasters, which could be exacerbated by potential climate change, and international instability. Additionally, deposit levels may be affected by a number of factors, including rates paid by competitors, general interest rate levels, regulatory capital requirements, returns available to clients on alternative investments and general economic conditions. Accordingly, we may be required from time to time to rely on secondary sources of liquidity to meet withdrawal demands or otherwise fund operations. Such sources include FHLB advances, sales of securities and loans, and federal funds lines of credit from correspondent banks, as well as out-of-market time deposits. While we believe that these sources are currently adequate, there can be no assurance they will be sufficient to meet future liquidity demands, particularly if we continue to grow and experience increasing loan demand. We may be required to slow or discontinue loan growth, capital expenditures or other investments or liquidate assets should such sources not be adequate.
We are exposed to a need for additional capital resources for the future and these capital resources may not be available when needed or at all.
We may need to incur additional debt or equity financing in the future to make strategic acquisitions or investments or to strengthen our capital position. Our ability to raise additional capital, if needed, will depend on, among other things, conditions in the capital markets at that time, which are outside of our control and our financial performance. Accordingly, we cannot provide assurance that such financing will be available to us on acceptable terms or at all. If we cannot raise additional capital when needed, our ability to further expand our operations through internal growth and acquisitions could be materially impaired. In addition, if we decide to raise additional equity capital, our current shareholders’ interests could be diluted.
Failure to keep pace with technological change could adversely affect our business.
The financial services industry is continually undergoing rapid technological change with frequent introductions of new technology-driven products and services. The effective use of technology increases efficiency and enables financial institutions to better serve customers and to reduce costs. Our future success depends, in part, upon our ability to address the needs of our customers by using technology to provide products and services that will satisfy customer demands, as well as to create additional efficiencies in our operations. Many of our competitors have substantially greater resources to invest in technological improvements. We may not be able to effectively implement new technology-driven products and services or be successful in marketing these products and services to our clients. Failure to successfully keep pace with technological change affecting the financial services industry could have a material adverse impact on our business and, in turn, our financial condition and results of operations.
Consumers may decide not to use banks to complete their financial transactions.
Technology and other changes are allowing parties to complete financial transactions through alternative methods that historically have involved banks. For example, consumers can now maintain funds that would have historically been held as bank deposits in brokerage accounts, mutual funds or general-purpose reloadable prepaid cards. Consumers can also complete transactions such as paying bills and/or transferring funds directly without the assistance of banks. The process of eliminating banks as intermediaries, known as “disintermediation,” could result in the loss of fee income, as well as the loss of customer deposits, the related income generated from those deposits and, in the event of branch sales or closures, losses from the sales of premises. The loss of these revenue streams, the lower cost of deposits as a source of funds could have a material adverse effect on our financial condition and results of operations.
We depend on the accuracy and completeness of information about clients and counterparties.
In deciding whether to extend credit or enter into other transactions with clients and counterparties, we may rely on information furnished to us by or on behalf of clients and counterparties, including financial statements and other financial information. We also may rely on representations of clients and counterparties as to the accuracy and completeness of that information and, with respect to financial statements, on reports of independent auditors. For example, in deciding whether to extend credit to clients, we may assume that a customer’s audited financial statements conform to accounting principles generally accepted in the United States of America (“GAAP”) and present fairly, in all material respects, the financial condition, results of operations and cash flows of the customer. Our earnings are significantly affected by our ability to properly originate, underwrite and service loans. Our financial condition and results of operations could be negatively impacted to the extent we incorrectly assess the creditworthiness of our borrowers, fail to detect or respond to deterioration in asset quality in a timely manner, or rely on financial statements that do not comply with GAAP or are materially misleading.
The accuracy of our financial statements and related disclosures could be affected because we are exposed to conditions or assumptions different from the judgments, assumptions or estimates used in our critical accounting policies.
The preparation of financial statements and related disclosure in conformity with GAAP requires us to make judgments, assumptions, and estimates that affect the amounts reported in our consolidated financial statements and accompanying notes. Our critical accounting policies, included in this document, describe those significant accounting policies and methods used in the preparation of our consolidated financial statements that are considered “critical” by us because they require judgments, assumptions and estimates that materially impact our consolidated financial statements and related disclosures. As a result, if future events differ significantly from the judgments, assumptions and estimates in our critical accounting policies, such events or assumptions could have a material impact on our audited consolidated financial statements and related disclosures.
We are exposed to the possibility of technology failure and a disruption in our operations may adversely affect our business.
We rely on our computer systems and the technology of outside service providers. Our daily operations depend on the operational effectiveness of their technology. We rely on our systems to accurately track and record our assets and liabilities. If our computer systems or outside technology sources become unreliable, fail, or experience a breach of security, our ability to maintain accurate financial records may be impaired, which could materially affect our business operations and financial condition. In addition, a disruption in our operations resulting from failure of transportation and telecommunication systems, loss of power, interruption of other utilities, natural disaster, fire, global climate changes, computer hacking or viruses, failure of technology, terrorist activity or the domestic and foreign response to such activity or other events outside of our control could have an adverse impact on the financial services industry as a whole and/or on our business. Our business recovery plan may not be adequate and may not prevent significant interruptions of our operations or substantial losses. The increased number of cyber attacks during the past few years has further heightened our attention to this risk. As such, we are in the process of implementing additional security software and assigning persons to monitor and assist with the mitigation of this ever increasing risk.
Negative public opinion surrounding our company and the financial institutions industry generally could damage our reputation and adversely impact our earnings.
Reputation risk, or the risk to our business, earnings and capital from negative public opinion surrounding our company and the financial institutions industry generally, is inherent in our business. Negative public opinion can result from our actual or alleged conduct in any number of activities, including lending practices, corporate governance and acquisitions, and cybersecurity incidents, and from actions taken by government regulators and community organizations in response to those activities. Negative public opinion can adversely affect our ability to keep and attract clients and employees and can expose us to litigation and regulatory action. Although we take steps to minimize reputation risk in dealing with our clients and communities, this risk will always be present given the nature of our business.
We face a risk of noncompliance and enforcement action with the Bank Secrecy Act and other anti-money laundering statutes and regulations.
The federal Bank Secrecy Act, the Uniting and Strengthening America by Providing Appropriate Tools Required to Intercept and Obstruct Terrorism Act of 2001 (which we refer to as the “Patriot Act”) and other laws and regulations require financial institutions, among other duties, to institute and maintain effective anti-money laundering programs and file suspicious activity and currency transaction reports as appropriate. The federal Financial Crimes Enforcement Network, established by the U.S. Treasury Department to administer the Bank Secrecy Act, is authorized to impose significant civil money penalties for violations of those requirements and has recently engaged in coordinated enforcement efforts with the individual federal banking regulators, as well as the U.S. Department of Justice, Drug Enforcement Administration and Internal Revenue Service. There is also increased scrutiny of compliance with the rules enforced by the OFAC. Federal and state bank regulators also have begun to focus on compliance with Bank Secrecy Act and anti-money laundering regulations. If our policies, procedures and systems are deemed deficient or the policies, procedures and systems of the financial institutions that we have already acquired or may acquire in the future are deficient, we would be subject to liability, including fines and regulatory actions such as restrictions on our ability to pay dividends and the necessity to obtain regulatory approvals to proceed with certain aspects of our business plan, including our acquisition plans, which would negatively impact our business, financial condition and results of operations. Failure to maintain and implement adequate programs to combat money laundering and terrorist financing could also have serious reputational consequences for us.
Federal, state and local consumer lending laws may restrict our ability to originate certain mortgage loans or increase our risk of liability with respect to such loans and could increase our cost of doing business.
Federal, state and local laws have been adopted that are intended to eliminate certain lending practices considered “predatory.” These laws prohibit practices such as steering borrowers away from more affordable products, selling unnecessary insurance to borrowers, repeatedly refinancing loans and making loans without a reasonable expectation that the borrowers will be able to repay the loans irrespective of the value of the underlying property. Loans with certain terms and conditions and that otherwise meet the definition of a “qualified mortgage” may be protected from liability to a borrower for failing to make the necessary determinations. We have aligned our underwriting standards with the Ability to Repay and Qualified Mortgage rules and requirements issued by the Consumer Financial Protection Bureau. It is our policy not to make predatory loans and to determine borrowers’ ability to repay in accordance with CFPB standards, but the law and related rules create the potential for increased liability with respect to our lending and loan investment activities. They increase our cost of doing business and, ultimately, may prevent us from making certain loans and cause us to reduce the average percentage rate or the points and fees on loans that we do make.
We are subject to federal and state fair lending laws, and failure to comply with these laws could lead to material penalties.
Federal and state fair lending laws and regulations, such as the Equal Credit Opportunity Act and the Fair Housing Act, impose nondiscriminatory lending requirements on financial institutions. The Department of Justice, CFPB and other federal and state agencies are responsible for enforcing these laws and regulations. Private parties may also have the ability to challenge an institution’s performance under fair lending laws in private class action litigation. A successful challenge to our performance under the fair lending laws and regulations could adversely impact our rating under the Community Reinvestment Act and result in a wide variety of sanctions, including the required payment of damages and civil money penalties, injunctive relief, imposition of restrictions on merger and acquisition activity and restrictions on expansion activity, which could negatively impact our reputation, business, financial condition and results of operations.
The Federal Reserve Board may require us to commit capital resources to support the Bank.
The Federal Reserve Board requires a bank holding company to act as a source of financial and managerial strength to a subsidiary bank and to commit resources to support such subsidiary bank. Under the “source of strength” doctrine, the Federal Reserve Board may require a bank holding company to make capital injections into a troubled subsidiary bank and may charge the bank holding company with engaging in unsafe and unsound practices for failure to commit resources to such a subsidiary bank. In addition, the Dodd-Frank Act directs the federal bank regulators to require that all companies that directly or indirectly control an insured depository institution serve as a source of strength for the institution. Under these requirements, in the future, we could be required to provide financial assistance to our Bank if the Bank experiences financial distress.
A capital injection may be required at times when we do not have the resources to provide it, and therefore we may be required to borrow the funds. In the event of a bank holding company’s bankruptcy, the bankruptcy trustee will assume any commitment by the holding company to a federal bank regulatory agency to maintain the capital of a subsidiary bank. Moreover, bankruptcy law provides that claims based on any such commitment will be entitled to a priority of payment over the claims of the holding company’s general unsecured creditors, including the holders of its note obligations. Thus, any borrowing that must be done by the holding company in order to make the required capital injection becomes more difficult and expensive and will adversely impact the holding company’s cash flows, financial condition, results of operations and prospects.
None.
We conduct our business through our main office, banking centers and other offices. The following table sets forth certain information relating to these facilities as of December 31, 2015.
|
(Dollars in thousands)
|
Year
Opened
|
Square
Footage
|
Owned/
Leased
|
Lease
Expiration
Date
|
Net Book
Value At
December 31,
2015
|
|||||||||
|
Banking Centers:
|
||||||||||||||
|
Downtown Asheville (Main Office)
|
1936
|
24,124
|
Owned
|
–
|
$
|
3,071
|
||||||||
|
11 Church Street
|
||||||||||||||
|
Asheville, NC 28801
|
||||||||||||||
|
Black Mountain
|
1960
|
4,500
|
Owned
|
–
|
242
|
|||||||||
|
300 West State Street
|
||||||||||||||
|
Black Mountain, NC 28711
|
||||||||||||||
|
Mars Hill
|
1974
|
2,500
|
Owned
|
–
|
1,195
|
|||||||||
|
105 North Main Street
|
||||||||||||||
|
Mars Hill, NC 28754
|
||||||||||||||
|
Skyland
|
1976
|
3,108
|
Owned
|
–
|
574
|
|||||||||
|
1879 Hendersonville Road
|
||||||||||||||
|
Asheville, NC 28803
|
||||||||||||||
|
East Asheville
|
1978
|
3,570
|
Owned
|
–
|
117
|
|||||||||
|
10 South Tunnel Road
|
||||||||||||||
|
Asheville, NC 28805
|
||||||||||||||
|
North Asheville
|
1979
|
9,846
|
Owned
|
–
|
398
|
|||||||||
|
778 Merrimon Avenue
|
||||||||||||||
|
Asheville, NC 28804
|
||||||||||||||
|
West Asheville
|
1981
|
3,670
|
Owned
|
–
|
373
|
|||||||||
|
1012 Patton Avenue
|
||||||||||||||
|
Asheville, NC 28806
|
||||||||||||||
|
Marion
|
1981
|
6,000
|
Owned
|
–
|
216
|
|||||||||
|
162 North Main Street
|
||||||||||||||
|
Marion, NC 28752
|
||||||||||||||
|
Hendersonville
|
1992
|
4,000
|
Owned
|
–
|
549
|
|||||||||
|
601 North Main Street
|
||||||||||||||
|
Hendersonville, NC 28792
|
||||||||||||||
|
Brevard
|
1995
|
2,100
|
Owned
|
–
|
785
|
|||||||||
|
2 Market Street
|
||||||||||||||
|
Straus Park
|
||||||||||||||
|
Brevard, NC 28712
|
||||||||||||||
|
Reynolds
|
2001
|
3,500
|
Owned
|
–
|
959
|
|||||||||
|
5 Olde Eastwood Village Boulevard
|
||||||||||||||
|
US 74 East
|
||||||||||||||
|
Asheville, NC 28803
|
||||||||||||||
(Continued on following page)
(Continued from previous page)
|
(Dollars in thousands)
|
Year
Opened
|
Square
Footage
|
Owned/
Leased
|
Lease
Expiration
Date
|
Net Book
Value At
December 31,
2015
|
|||||||||
|
Enka-Candler
|
2003
|
3,500
|
Owned
|
–
|
$
|
970
|
||||||||
|
907 Smoky Park Highway
|
||||||||||||||
|
Candler, NC 28715
|
||||||||||||||
|
Fletcher
|
2008
|
3,415
|
Lot Leased
|
1/31/2027
|
846
|
|||||||||
|
3551 Hendersonville Road
|
Structure
|
|||||||||||||
|
Fletcher, NC 28732
|
Owned
|
|||||||||||||
|
Other Offices:
|
||||||||||||||
|
Operations and Administration
|
2003
|
46,000
|
Leased
|
4/30/2017
|
272
|
|||||||||
|
901 Smoky Park Highway
|
||||||||||||||
|
Candler, NC 28715
|
||||||||||||||
|
Commercial Lending
|
1998
|
1,940
|
Owned
|
–
|
–
|
(1) | ||||||||
|
11 Church Street
|
||||||||||||||
|
Asheville, NC 28801
|
||||||||||||||
|
(1)
|
Net book value is reflected in net book value for our main office located at 11 Church Street, Asheville, North Carolina.
|
Periodically, there have been various claims and lawsuits against us, such as claims to enforce liens, condemnation proceedings on properties in which we hold security interests, claims involving the making and servicing of real property loans and other issues incident to our business. We are not a party to any pending legal proceedings that, after review with our legal counsel, we believe would have a material adverse effect on our financial condition, results of operations or cash flows.
Not applicable.
Part II
|
Item 5.
|
The Company’s common stock is listed on the Nasdaq Global Market under the symbol “ASBB.” The common stock was issued at a price of $10.00 per share in connection with the Bank’s mutual-to-stock conversion and the initial public offering of the Company’s common stock. The common stock commenced trading on the Nasdaq Global Market on October 12, 2011. As of the close of business on December 31, 2015, there were 3,985,475 shares of common stock outstanding held by 463 holders of record.
The following table sets forth the high and low closing sales prices of the Company’s common stock as reported by the Nasdaq Global Market for the periods indicated.
|
Market Price Per Common Share
|
||||||||||||
|
Quarter Ended:
|
High Close
|
Low Close
|
Last Close
|
|||||||||
|
December 31, 2015
|
$
|
27.00
|
$
|
24.66
|
$
|
25.96
|
||||||
|
September 30, 2015
|
25.80
|
21.67
|
25.05
|
|||||||||
|
June 30, 2015
|
21.99
|
20.70
|
21.66
|
|||||||||
|
March 31, 2015
|
21.42
|
19.43
|
20.50
|
|||||||||
|
December 31, 2014
|
$
|
21.50
|
$
|
19.01
|
$
|
21.50
|
||||||
|
September 30, 2014
|
20.97
|
18.83
|
20.15
|
|||||||||
|
June 30, 2014
|
21.19
|
17.60
|
20.97
|
|||||||||
|
March 31, 2014
|
17.90
|
17.15
|
17.75
|
|||||||||
The following graph and table provide a comparison of the cumulative total returns for the common stock of the Company, the NASDAQ Composite Index and the SNL Financial Southeastern Bank and Thrift Index for the periods indicated. The graph assumes that an investor originally invested $100 in shares of our common stock at its closing price on October 12, 2011, the first day that our shares were traded. The stock price information below is not necessarily indicative of future price performance.
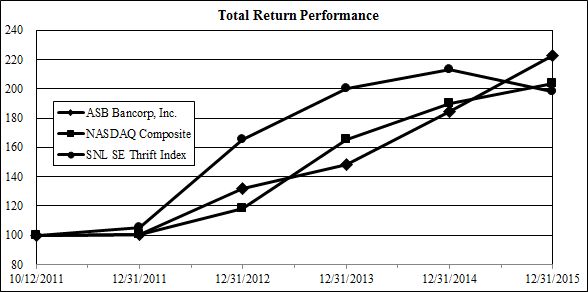
|
ASB
Bancorp, Inc.
|
NASDAQ
Composite
|
SNL SE
Thrift Index
|
||||||||||
|
October 12, 2011
|
100.00
|
100.00
|
100.00
|
|||||||||
|
December 31, 2011
|
100.51
|
100.32
|
105.47
|
|||||||||
|
December 31, 2012
|
131.62
|
118.14
|
165.42
|
|||||||||
|
December 31, 2013
|
148.20
|
165.60
|
200.09
|
|||||||||
|
December 31, 2014
|
184.71
|
190.17
|
213.13
|
|||||||||
|
December 31, 2015
|
223.00
|
203.69
|
198.04
|
|||||||||
The Company did not declare or pay any dividends to its shareholders during the years ended December 31, 2015 or 2014. See Item 1, “Business—Regulation and Supervision,” for more information regarding the Company’s and the Bank’s payment of dividends.
On September 19, 2012, the Company authorized the funding of a trust that purchased 223,382 shares of its stock during 2012 to be available for issuance under its 2012 Equity Incentive Plan. On February 5, 2013, 223,382 restricted stock awards were granted under the Plan.
The Company’s purchases of its common stock made during the quarter ended December 31, 2015 under the Company’s approved stock repurchase program and pursuant to privately negotiated transactions are set forth in the following table.
|
Period
|
Total
Number
Of Shares
Purchased
(a)
|
Average
Price Paid
Per Common
Share
(b)
|
Total
Number Of
Shares
Purchased
As Part Of
Publicly
Announced
Programs
(c) |
Maximum
Number Of
Shares That
May Yet Be
Purchased
Under The
Plan Or
Programs
(d) |
||||||||||||
|
October 1 - October 31, 2015
|
-
|
$
|
-
|
-
|
218,920
|
|||||||||||
|
November 1 - November 30, 2015 (1)
|
421,770
|
26.50
|
-
|
218,920
|
||||||||||||
|
December 1 - December 31, 2015
|
-
|
-
|
-
|
218,920
|
||||||||||||
|
Total
|
421,770
|
$
|
26.50
|
-
|
||||||||||||
| (1) | On November 19, 2015, the Company entered into a privately negotiated stock repurchase agreement with FVP Master Fund, L.P., pursuant to which the Company repurchased 421,770 shares of its common stock, from FVP Master Fund, L.P. for an aggregate purchase price of $11,176,905, or $26.50 per share. |
On March 31, 2015, the Company announced that the Company’s Board of Directors approved a stock repurchase program whereby the Company may repurchase up to 5%, or 218,920 shares, of its outstanding common stock as and when deemed appropriate by management and under any plan that may be deployed in accordance with Rule 10b5-1 of the Exchange Act of 1934. The Rule 10b5-1 repurchase plan allows the Company to repurchase its shares during periods when it would normally not be active in the market due to its internal blackout period. During 2015, there were no shares of common stock repurchased under this stock repurchase program, and a total of 218,920 shares of common stock may yet be purchased under the program.
The Company’s 2012 Equity Incentive Plan permits the exchange of shares issued upon the exercise of stock options for the surrender of shares currently held by the grant recipient. During 2015, the Company received 17,166 shares in exchange for the issuance of 25,391 option shares using this exercise method.
The summary financial data presented below for the years ended December 31, 2015, 2014, 2013, 2012 and 2011 are derived in part from the audited consolidated financial statements that appear in this annual report. The following is only a summary and should be read in conjunction with the audited consolidated financial statements and notes included in this annual report.
|
December 31,
|
||||||||||||||||||||
|
(Dollars in thousands)
|
2015
|
2014
|
2013
|
2012
|
2011
|
|||||||||||||||
|
Selected Financial Condition Data:
|
||||||||||||||||||||
|
Balances at end of period:
|
||||||||||||||||||||
|
Total assets
|
$
|
782,853
|
$
|
760,040
|
$
|
733,026
|
$
|
749,345
|
$
|
790,859
|
||||||||||
|
Cash and cash equivalents
|
33,401
|
56,858
|
52,791
|
47,390
|
72,327
|
|||||||||||||||
|
Securities available for sale
|
137,555
|
141,462
|
185,329
|
238,736
|
243,863
|
|||||||||||||||
|
Securities held to maturity
|
3,809
|
3,999
|
4,241
|
4,649
|
5,218
|
|||||||||||||||
|
Federal Home Loan Bank stock
|
2,807
|
2,902
|
3,131
|
3,429
|
3,870
|
|||||||||||||||
|
Loans held for sale
|
7,018
|
5,237
|
4,142
|
9,759
|
6,590
|
|||||||||||||||
|
Loans receivable, net of deferred fees
|
576,087
|
521,820
|
449,234
|
387,721
|
432,883
|
|||||||||||||||
|
Allowance for loan losses
|
(6,289
|
)
|
(5,949
|
)
|
(7,307
|
)
|
(8,513
|
)
|
(10,627
|
)
|
||||||||||
|
Foreclosed real estate
|
5,646
|
8,814
|
14,233
|
19,411
|
8,125
|
|||||||||||||||
|
Deposits
|
630,904
|
603,379
|
572,786
|
578,299
|
608,236
|
|||||||||||||||
|
Overnight and short-term borrowings
|
327
|
660
|
787
|
411
|
758
|
|||||||||||||||
|
Federal Home Loan Bank advances
|
50,000
|
50,000
|
50,000
|
50,000
|
60,000
|
|||||||||||||||
|
Total equity
|
89,682
|
94,397
|
101,088
|
111,529
|
115,571
|
|||||||||||||||
|
Average balances for period:
|
||||||||||||||||||||
|
Average total assets
|
781,974
|
747,491
|
751,406
|
781,633
|
766,130
|
|||||||||||||||
|
Average loans
|
557,221
|
476,782
|
421,415
|
418,569
|
471,260
|
|||||||||||||||
|
Average interest-earning assets
|
746,531
|
708,733
|
706,496
|
749,024
|
724,543
|
|||||||||||||||
|
Average deposits
|
621,741
|
588,511
|
582,858
|
595,183
|
617,733
|
|||||||||||||||
|
Average interest-bearing liabilities
|
562,228
|
551,995
|
561,892
|
594,908
|
626,562
|
|||||||||||||||
|
Average total equity
|
96,308
|
98,981
|
105,941
|
116,208
|
82,151
|
|||||||||||||||
|
(Dollars in thousands except
|
Year Ended December 31,
|
|||||||||||||||||||
|
per share data)
|
2015
|
2014
|
2013
|
2012
|
2011
|
|||||||||||||||
|
Selected Operating Data:
|
||||||||||||||||||||
|
Interest and dividend income
|
$
|
25,435
|
$
|
23,502
|
$
|
22,952
|
$
|
24,992
|
$
|
28,851
|
||||||||||
|
Interest expense
|
3,485
|
3,536
|
4,194
|
6,492
|
8,642
|
|||||||||||||||
|
Net interest income
|
21,950
|
19,966
|
18,758
|
18,500
|
20,209
|
|||||||||||||||
|
Provision for (recovery of) loan losses
|
361
|
(998
|
)
|
(681
|
)
|
1,700
|
3,785
|
|||||||||||||
|
Net interest income after provision for (recovery of) loan losses
|
21,589
|
20,964
|
19,439
|
16,800
|
16,424
|
|||||||||||||||
|
Noninterest income
|
7,509
|
6,333
|
8,034
|
9,456
|
7,422
|
|||||||||||||||
|
Noninterest expenses
|
23,540
|
23,548
|
25,394
|
25,092
|
22,071
|
|||||||||||||||
|
Income before income tax provision
|
5,558
|
3,749
|
2,079
|
1,164
|
1,775
|
|||||||||||||||
|
Income tax provision
|
1,983
|
1,260
|
625
|
302
|
588
|
|||||||||||||||
|
Net income
|
$
|
3,575
|
$
|
2,489
|
$
|
1,454
|
$
|
862
|
$
|
1,187
|
||||||||||
|
Selected Data Per Common Share:
|
||||||||||||||||||||
|
Earnings per share - Basic
|
$
|
0.92
|
$
|
0.60
|
$
|
0.31
|
$
|
0.17
|
$
|
0.23
|
||||||||||
|
Earnings per share - Diluted
|
0.89
|
0.59
|
0.31
|
0.17
|
0.23
|
|||||||||||||||
|
Tangible book value per share
|
22.50
|
21.56
|
20.06
|
19.97
|
20.69
|
|||||||||||||||
|
Stock price - High
|
27.24
|
21.96
|
18.41
|
16.40
|
11.99
|
|||||||||||||||
|
Low
|
19.29
|
17.15
|
14.91
|
11.40
|
11.30
|
|||||||||||||||
|
Close
|
25.96
|
21.50
|
17.25
|
15.32
|
11.70
|
|||||||||||||||
|
Year Ended December 31,
|
||||||||||||||||||||
|
2015
|
2014
|
2013
|
2012
|
2011
|
||||||||||||||||
|
Performance Ratios:
|
||||||||||||||||||||
|
Return on average assets
|
0.46
|
%
|
0.33
|
%
|
0.19
|
%
|
0.11
|
%
|
0.15
|
%
|
||||||||||
|
Return on average equity
|
3.71
|
%
|
2.51
|
%
|
1.37
|
%
|
0.74
|
%
|
1.44
|
%
|
||||||||||
|
Yield on average interest-earning assets
|
3.47
|
%
|
3.37
|
%
|
3.31
|
%
|
3.37
|
%
|
4.00
|
%
|
||||||||||
|
Cost of average interest-bearing liabilities
|
0.62
|
%
|
0.64
|
%
|
0.75
|
%
|
1.09
|
%
|
1.38
|
%
|
||||||||||
|
Interest rate spread (1)
|
2.85
|
%
|
2.73
|
%
|
2.56
|
%
|
2.28
|
%
|
2.62
|
%
|
||||||||||
|
Net interest margin (2)
|
3.00
|
%
|
2.87
|
%
|
2.72
|
%
|
2.50
|
%
|
2.80
|
%
|
||||||||||
|
Noninterest expense to average assets
|
3.01
|
%
|
3.15
|
%
|
3.38
|
%
|
3.21
|
%
|
2.88
|
%
|
||||||||||
|
Efficiency ratio (3)
|
78.64
|
%
|
88.17
|
%
|
93.16
|
%
|
89.08
|
%
|
79.60
|
%
|
||||||||||
|
Average interest-earning assets to average interest-bearing liabilities
|
132.78
|
%
|
128.39
|
%
|
125.74
|
%
|
125.91
|
%
|
115.64
|
%
|
||||||||||
|
Average equity to average assets
|
12.32
|
%
|
13.24
|
%
|
14.10
|
%
|
14.87
|
%
|
10.72
|
%
|
||||||||||
|
Capital Ratios:
|
||||||||||||||||||||
|
Common Equity Tier 1 capital (4)
|
16.66
|
%
|
n/a
|
|
n/a
|
|
n/a
|
|
n/a
|
|
||||||||||
|
Tier 1 risk-based capital to adjusted average assets (4)
|
11.87
|
%
|
13.17
|
%
|
14.35
|
%
|
14.69
|
%
|
14.30
|
%
|
||||||||||
|
Tier 1 risk-based capital to risk-weighted assets (4)
|
16.66
|
%
|
19.83
|
%
|
24.14
|
%
|
27.72
|
%
|
27.52
|
%
|
||||||||||
|
Total risk-based capital to risk-weighted assets (4)
|
17.77
|
%
|
21.01
|
%
|
25.39
|
%
|
28.98
|
%
|
28.79
|
%
|
||||||||||
|
Tangible capital to tangible assets
|
11.46
|
%
|
12.42
|
%
|
13.79
|
%
|
14.88
|
%
|
14.61
|
%
|
||||||||||
|
Asset Quality Ratios:
|
||||||||||||||||||||
|
Allowance for loan losses as a percent of total loans
|
1.09
|
%
|
1.14
|
%
|
1.63
|
%
|
2.20
|
%
|
2.45
|
%
|
||||||||||
|
Allowance for loan losses as a percent of nonperforming loans
|
246.82
|
%
|
221.32
|
%
|
610.44
|
%
|
739.62
|
%
|
51.53
|
%
|
||||||||||
|
Net charge-offs to average loans outstanding during period
|
0.00
|
%
|
0.08
|
%
|
0.12
|
%
|
0.91
|
%
|
1.24
|
%
|
||||||||||
|
Nonperforming loans as a percent of total loans
|
0.44
|
%
|
0.52
|
%
|
0.27
|
%
|
0.30
|
%
|
4.76
|
%
|
||||||||||
|
Nonperforming assets as a percent of total assets
|
1.05
|
%
|
1.51
|
%
|
2.10
|
%
|
2.74
|
%
|
3.63
|
%
|
||||||||||
|
Other Data:
|
||||||||||||||||||||
|
Banking centers
|
13
|
13
|
13
|
13
|
13
|
|||||||||||||||
|
Full-time equivalent employees
|
152
|
160
|
173
|
168
|
167
|
|||||||||||||||
| (1) | Represents the difference between the weighted average yield on average interest-earning assets and the weighted average cost on average interest-bearing liabilities. Tax exempt income is reported on a tax equivalent basis using a federal marginal tax rate of 34%. |
| (2) | Represents net interest income as a percent of average interest-earning assets. Tax exempt income is reported on a tax equivalent basis using a federal marginal tax rate of 34%. |
| (3) | Represents noninterest expenses divided by the sum of net interest income on a tax equivalent basis using a federal marginal tax rate of 34% and noninterest income. |
| (4) | Regulatory capital ratios are based on BASEL III capital standards for 2015 and BASEL I capital standards for 2011 through 2014. |
The objective of this section is to help readers understand our views on our results of operations and financial condition. You should read this discussion in conjunction with the consolidated financial statements and the notes to consolidated financial statements that appear at the end of this annual report.
Critical Accounting Policies
We consider accounting policies involving significant judgments and assumptions by management that have, or could have, a material impact on the carrying value of certain assets or on income to be critical accounting policies. The following represent our critical accounting policies:
Allowance for Loan Losses. The allowance for loan losses is the amount estimated by management as necessary to cover losses inherent in the loan portfolio at the balance sheet date. The allowance is established through the provision for loan losses, which is charged to earnings. Management’s estimates of the allowance for loan losses necessarily involves a high degree of judgment. Among the material estimates required to establish the allowance are: loss exposure at default; the amount and timing of future cash flows on impaired loans; value of collateral; and determination of loss factors to be applied to the various elements of the portfolio. All of these estimates are susceptible to significant change. Management reviews the level of the allowance monthly and establishes the provision for loan losses based upon an evaluation of the portfolio, past loss experience, current economic conditions and other factors related to the collectibility of the loan portfolio. Although we believe that we use the best information available to establish the allowance for loan losses, future adjustments to the allowance may be necessary if economic or other conditions differ substantially from the assumptions used in making the evaluation. In addition, the FDIC and the NCCoB, as an integral part of their examination process, periodically review our allowance for loan losses and may require us to recognize adjustments to the allowance based on their judgments about information available to them at the time of their examination. A large loss could deplete the allowance and require increased provisions to replenish the allowance, which would adversely affect our earnings. See notes 1 and 4 included in the consolidated financial statements.
Fair Value of Investments. Securities are characterized as available for sale or held to maturity based on management’s ability and intent regarding such investment at acquisition. On an ongoing basis, management estimates the fair value of its investment securities based on information and assumptions it deems reliable and reasonable, which may be quoted market prices or if quoted market prices are not available, fair values extrapolated from the quoted prices of similar instruments. Based on this information, an assessment must be made as to whether any decline in the fair value of an investment security should be considered as an other than temporary impairment and recorded in noninterest income as a loss on investments. The determination of such impairment is subject to a variety of factors, including management’s judgment and experience. See notes 2 and 13 included in the consolidated financial statements.
Foreclosed Real Estate. The Company’s valuations of its foreclosed real estate involve significant judgments and assumptions by management, which have a material impact on the reported values of foreclosed real estate assets and noninterest expense recorded in the financial statements. The judgments and assumptions used by management are described in “Foreclosed Real Estate” under note 1 included in the consolidated financial statements.
Pension Plan. The Company has a noncontributory defined benefit pension plan. This plan is accounted for under the provisions of Financial Accounting Standards Board (the “FASB”) Accounting Standards Codification (“ASC”) Topic 715: Compensation-Retirement Benefits (“FASB ASC Topic 715”), which requires an employer to recognize the overfunded or underfunded status of a defined benefit postretirement plan as an asset or liability in its statement of financial position and to recognize changes in that funded status in the year in which the changes occur through comprehensive income. The funded status of a benefit plan is measured as the difference between plan assets at fair value and the benefit obligation. For a pension plan, the benefit obligation is the projected benefit obligation. FASB ASC Topic 715 also requires an employer to measure the funded status of a plan as of the date of its year-end statement of financial position. Management must make certain estimates and assumptions when determining the projected benefit obligation. These estimates and assumptions include the expected return on plan assets and the appropriate discount rate to be used in determining the present value of the obligation. See note 11 included in the consolidated financial statements.
Comparison of Financial Condition at December 31, 2015 and December 31, 2014
General. Total assets increased $22.8 million, or 3.0%, to $782.9 million at December 31, 2015 from $760.0 million at December 31, 2014. Investment securities decreased $4.1 million, or 2.8%, to $141.4 million at December 31, 2015 from $145.5 million at December 31, 2014 and interest-earning deposits with banks decreased $24.0 million to $23.8 million at December 31, 2015 from $47.8 million at December 31, 2014, primarily due to the redeployment of these assets to fund loan growth. Loans receivable, net of deferred fees, increased $54.3 million, or 10.4%, to $576.1 million at December 31, 2015 from $521.8 million at December 31, 2014 as new loan originations exceeded loan repayments, prepayments, and foreclosures. Deposits increased $27.5 million, or 4.6%, to $630.9 million at December 31, 2015 from $603.4 million at December 31, 2014 with significant growth in lower cost transaction accounts.
Loans. Loan originations totaled $296.1 million for the year ended December 31, 2015 compared to $260.8 million for the year ended December 31, 2014. Residential mortgage loan originations, largely from residential purchase transactions, totaled $91.9 million in 2015 compared to $62.1million in 2014, while residential construction and land development loan originations totaled $32.5 million in 2015 compared to $27.1 million in 2014. Originations of commercial mortgage, commercial construction and land development, and commercial and industrial loans totaled $79.9 million, $23.9 million and $19.3 million, respectively, for the year ended December 31, 2015 compared to $84.1 million, $18.4 million and $14.8 million, respectively, for the year ended December 31, 2014. Revolving mortgage originations totaled $33.0 million in 2015 compared to $25.0 million in 2014, while consumer loan originations totaled $15.5 million in 2015 compared to $29.4 million in 2014. The decrease in consumer loan originations was mostly because of the discontinuation of originations of indirect automobile financing through dealers during the second quarter of 2015 due to the unprofitability of this activity. Origination activity was significantly offset by $163.8 million of normal loan repayments and prepayments and $76.1 million in loan sales for the year ended December 31, 2015, compared to $143.9 million and $42.7 million, respectively, for the year ended December 31, 2014.
Loan Portfolio Composition
The following table sets forth the composition of our loan portfolio at the dates indicated.
|
December 31,
|
||||||||||||||||||||||||
|
2015
|
2014
|
2013
|
||||||||||||||||||||||
|
(Dollars in thousands)
|
Amount
|
Percent
|
Amount
|
Percent
|
Amount
|
Percent
|
||||||||||||||||||
|
Commercial:
|
||||||||||||||||||||||||
|
Commercial mortgage
|
$
|
209,397
|
36.32
|
%
|
$
|
201,316
|
38.53
|
%
|
$
|
171,993
|
38.23
|
%
|
||||||||||||
|
Commercial construction and land development
|
38,313
|
6.64
|
%
|
21,661
|
4.14
|
%
|
15,593
|
3.47
|
%
|
|||||||||||||||
|
Commercial and industrial
|
22,878
|
3.97
|
%
|
15,872
|
3.04
|
%
|
14,770
|
3.28
|
%
|
|||||||||||||||
|
Total
|
270,588
|
46.93
|
%
|
238,849
|
45.71
|
%
|
202,356
|
44.98
|
%
|
|||||||||||||||
|
Non-commercial:
|
||||||||||||||||||||||||
|
Residential mortgage
|
186,839
|
32.41
|
%
|
172,163
|
32.95
|
%
|
161,437
|
35.89
|
%
|
|||||||||||||||
|
Residential construction and land development
|
16,587
|
2.88
|
%
|
14,781
|
2.83
|
%
|
8,759
|
1.95
|
%
|
|||||||||||||||
|
Revolving mortgage
|
66,258
|
11.49
|
%
|
56,370
|
10.79
|
%
|
49,561
|
11.02
|
%
|
|||||||||||||||
|
Consumer
|
36,291
|
6.29
|
%
|
40,363
|
7.72
|
%
|
27,719
|
6.16
|
%
|
|||||||||||||||
|
Total
|
305,975
|
53.07
|
%
|
283,677
|
54.29
|
%
|
247,476
|
55.02
|
%
|
|||||||||||||||
|
Total loans
|
576,563
|
100.00
|
%
|
522,526
|
100.00
|
%
|
449,832
|
100.00
|
%
|
|||||||||||||||
|
Less: Net deferred loan origination fees
|
476
|
706
|
598
|
|||||||||||||||||||||
|
Less: Allowance for loan losses
|
6,289
|
5,949
|
7,307
|
|||||||||||||||||||||
|
Loans receivable, net
|
$
|
569,798
|
$
|
515,871
|
$
|
441,927
|
||||||||||||||||||
|
December 31,
|
||||||||||||||||
|
2012
|
2011
|
|||||||||||||||
|
(Dollars in thousands)
|
Amount
|
Percent
|
Amount
|
Percent
|
||||||||||||
|
Commercial:
|
||||||||||||||||
|
Commercial mortgage
|
$
|
138,804
|
35.76
|
%
|
$
|
139,947
|
32.30
|
%
|
||||||||
|
Commercial construction and land development
|
5,161
|
1.34
|
%
|
22,375
|
5.17
|
%
|
||||||||||
|
Commercial and industrial
|
11,093
|
2.86
|
%
|
17,540
|
4.05
|
%
|
||||||||||
|
Total
|
155,058
|
39.96
|
%
|
179,862
|
41.52
|
%
|
||||||||||
|
Non-commercial:
|
||||||||||||||||
|
Residential mortgage
|
163,571
|
42.14
|
%
|
175,866
|
40.59
|
%
|
||||||||||
|
Residential construction and land development
|
3,729
|
0.96
|
%
|
3,907
|
0.90
|
%
|
||||||||||
|
Revolving mortgage
|
48,221
|
12.42
|
%
|
51,044
|
11.78
|
%
|
||||||||||
|
Consumer
|
17,552
|
4.52
|
%
|
22,588
|
5.21
|
%
|
||||||||||
|
Total
|
233,073
|
60.04
|
%
|
253,405
|
58.48
|
%
|
||||||||||
|
Total loans
|
388,131
|
100.00
|
%
|
433,267
|
100.00
|
%
|
||||||||||
|
Less: Net deferred loan origination fees
|
410
|
384
|
||||||||||||||
|
Less: Allowance for loan losses
|
8,513
|
10,627
|
||||||||||||||
|
Loans receivable, net
|
$
|
379,208
|
$
|
422,256
|
||||||||||||
Loan Portfolio Maturities
The following tables set forth certain information at December 31, 2015 regarding the dollar amount of loan principal repayments becoming due during the periods indicated. The tables do not include any estimate of prepayments that significantly shorten the average life of our loans and may cause our actual repayment experience to differ from that shown below. Demand loans, which are loans having no stated schedule of repayments and no stated maturity, are reported as due in one year or less.
|
December 31, 2015
|
||||||||||||||||
|
(Dollars in thousands)
|
Commercial
Mortgages |
Commercial
Construction |
Commercial
And |
Total
Commercial |
||||||||||||
|
Amounts due in:
|
||||||||||||||||
|
One year or less
|
$
|
7,029
|
$
|
1,968
|
$
|
2,823
|
$
|
11,820
|
||||||||
|
More than one year through two years
|
23,566
|
2,481
|
5,217
|
31,264
|
||||||||||||
|
More than two years through three years
|
31,903
|
685
|
3,637
|
36,225
|
||||||||||||
|
More than three years through five years
|
85,489
|
8,108
|
6,471
|
100,068
|
||||||||||||
|
More than five years through ten years
|
43,716
|
24,748
|
4,730
|
73,194
|
||||||||||||
|
More than ten years through fifteen years
|
17,079
|
323
|
-
|
17,402
|
||||||||||||
|
More than fifteen years
|
615
|
-
|
-
|
615
|
||||||||||||
|
Total
|
$
|
209,397
|
$
|
38,313
|
$
|
22,878
|
$
|
270,588
|
||||||||
|
December 31, 2015
|
||||||||||||||||||||||||
|
(Dollars in thousands)
|
Residential
Mortgages |
Residential
Construction |
Revolving
Mortgages |
Consumer
|
Total Non-
Commercial |
Total
Loans |
||||||||||||||||||
|
Amounts due in:
|
||||||||||||||||||||||||
|
One year or less
|
$
|
485
|
$
|
97
|
$
|
543
|
$
|
690
|
$
|
1,815
|
$
|
13,635
|
||||||||||||
|
More than one year through two years
|
2,585
|
48
|
1,140
|
871
|
4,644
|
35,908
|
||||||||||||||||||
|
More than two years through three years
|
4,455
|
-
|
1,188
|
2,922
|
8,565
|
44,790
|
||||||||||||||||||
|
More than three years through five years
|
13,610
|
130
|
6,254
|
15,137
|
35,131
|
135,199
|
||||||||||||||||||
|
More than five years through ten years
|
8,957
|
-
|
21,805
|
16,671
|
47,433
|
120,627
|
||||||||||||||||||
|
More than ten years through fifteen years
|
13,096
|
-
|
35,328
|
-
|
48,424
|
65,826
|
||||||||||||||||||
|
More than fifteen years
|
143,651
|
16,312
|
-
|
-
|
159,963
|
160,578
|
||||||||||||||||||
|
Total
|
$
|
186,839
|
$
|
16,587
|
$
|
66,258
|
$
|
36,291
|
$
|
305,975
|
$
|
576,563
|
||||||||||||
Fixed vs. Adjustable Rate Loans
The following table sets forth the dollar amount of all loans at December 31, 2015 that have contractual maturities after December 31, 2016 and have either fixed interest rates or floating or adjustable interest rates. The amounts shown below exclude unearned loan origination fees.
|
Due After December 31, 2016
|
||||||||||||
|
(Dollars in thousands)
|
Fixed
Rates |
Floating Or
Adjustable |
Total
|
|||||||||
|
Commercial:
|
||||||||||||
|
Commercial mortgage
|
$
|
137,074
|
$
|
65,294
|
$
|
202,368
|
||||||
|
Commercial construction and land development
|
12,623
|
23,722
|
36,345
|
|||||||||
|
Commercial and industrial
|
10,093
|
9,962
|
20,055
|
|||||||||
|
Total commercial
|
159,790
|
98,978
|
258,768
|
|||||||||
|
Non-commercial:
|
||||||||||||
|
Residential mortgage
|
81,817
|
104,537
|
186,354
|
|||||||||
|
Residential construction and land development
|
480
|
16,010
|
16,490
|
|||||||||
|
Revolving mortgage
|
12
|
65,703
|
65,715
|
|||||||||
|
Consumer
|
35,601
|
-
|
35,601
|
|||||||||
|
Total non-commercial
|
117,910
|
186,250
|
304,160
|
|||||||||
|
Total loans receivable
|
$
|
277,700
|
$
|
285,228
|
$
|
562,928
|
||||||
Some of our adjustable rate loans contain rate floors that are equal to the initial interest rate on the loan. When market interest rates fall below the rate floor loan rates do not adjust further downward. As market interest rates rise in the future, the interest rates on these loans may rise based on the contract rate (index plus the margin) exceeding the initial interest rate floor; however, contract interest rates will only increase when the index plus margin exceed the imposed rate floor.
Loan Activity
The following table shows loans originated, purchased and sold during the periods indicated, including residential mortgage loans intended for sale in the secondary market.
|
Year Ended December 31,
|
||||||||||||||||||||
|
(Dollars in thousands)
|
2015
|
2014
|
2013
|
2012
|
2011
|
|||||||||||||||
|
Total loans at beginning of period
|
$
|
521,108
|
$
|
446,069
|
$
|
388,967
|
$
|
428,846
|
$
|
495,713
|
||||||||||
|
Loans originated:
|
||||||||||||||||||||
|
Commercial:
|
||||||||||||||||||||
|
Commercial mortgage
|
79,933
|
84,145
|
102,280
|
61,910
|
32,688
|
|||||||||||||||
|
Construction and land development
|
23,920
|
18,352
|
14,772
|
1,050
|
1,068
|
|||||||||||||||
|
Commercial and industrial
|
19,306
|
14,782
|
9,698
|
5,853
|
7,199
|
|||||||||||||||
|
Non-commercial:
|
||||||||||||||||||||
|
Residential mortgage
|
91,932
|
62,082
|
120,555
|
110,682
|
81,705
|
|||||||||||||||
|
Construction and land development
|
32,512
|
27,071
|
21,913
|
10,986
|
10,734
|
|||||||||||||||
|
Revolving mortgage
|
33,041
|
24,962
|
18,683
|
7,107
|
6,385
|
|||||||||||||||
|
Consumer
|
15,503
|
29,444
|
25,237
|
9,830
|
483
|
|||||||||||||||
|
Total loans originated
|
296,147
|
260,838
|
313,138
|
207,418
|
140,262
|
|||||||||||||||
|
Loans purchased:
|
||||||||||||||||||||
|
Commercial:
|
||||||||||||||||||||
|
Commercial mortgage
|
430
|
110
|
55
|
2,909
|
125
|
|||||||||||||||
|
Construction and land development
|
-
|
-
|
-
|
-
|
560
|
|||||||||||||||
|
Total loans purchased
|
430
|
110
|
55
|
2,909
|
685
|
|||||||||||||||
|
Total loans originated and purchased
|
296,577
|
260,948
|
313,193
|
210,327
|
140,947
|
|||||||||||||||
|
Deduct:
|
||||||||||||||||||||
|
Loan principal repayments
|
163,775
|
143,863
|
150,027
|
139,879
|
131,393
|
|||||||||||||||
|
Loan sales
|
76,144
|
42,655
|
105,849
|
90,955
|
68,850
|
|||||||||||||||
|
Foreclosed loans transferred to foreclosed properties
|
820
|
281
|
708
|
17,464
|
3,533
|
|||||||||||||||
|
Charge-offs
|
476
|
504
|
630
|
3,995
|
6,134
|
|||||||||||||||
|
Deductions (additions) for other items (1)
|
(346
|
)
|
(1,394
|
)
|
(1,123
|
)
|
(2,087
|
)
|
(2,096
|
)
|
||||||||||
|
Net loan activity during the period
|
55,708
|
75,039
|
57,102
|
(39,879
|
)
|
(66,867
|
)
|
|||||||||||||
|
Total loans at end of period
|
$
|
576,816
|
$
|
521,108
|
$
|
446,069
|
$
|
388,967
|
$
|
428,846
|
||||||||||
| (1) | Other items consist of deferred loan fees, the allowance for loan losses and loans in process. |
Loan originations come from a number of sources. The primary sources of loan originations are existing customers, walk-in traffic, advertising and referrals from customers. We generally sell in the secondary market long-term fixed-rate residential mortgage loans that we originate. Our decision to sell loans is based on prevailing market interest rate conditions, interest rate management and liquidity needs.
Investment Security Portfolio
At December 31, 2015, our securities portfolio consisted of mortgage-backed securities issued by the Federal Home Loan Mortgage Corporation (also known as “Freddie Mac”), the Federal National Mortgage Association (also known as “Fannie Mae”) and the Government National Mortgage Association (also known as “Ginnie Mae”), securities of United States government agencies and corporations, securities of various government sponsored entities and securities of state and local governments. Our securities portfolio is used to invest excess funds for increased yield, manage interest rate risk and as collateralization for public unit deposits.
At December 31, 2015, our securities portfolio represented 18.1% of total assets compared to 19.1% at December 31, 2014, the decrease primarily due to a $54.3 million increase in loans receivable to $576.1 million at December 31, 2015. Securities classified as available for sale were $137.6 million of our securities portfolio at December 31, 2015, while $3.8 million of our securities portfolio was classified as held to maturity. Securities classified as held to maturity are United States government sponsored entity, mortgage-backed and state and local government securities. In addition, at December 31, 2015, we had $2.8 million of other investments held at cost, which consisted solely of Federal Home Loan Bank of Atlanta common stock. Total investment securities decreased by $4.1 million, or 2.8%, to $141.4 million at December 31, 2015 from $145.5 million at December 31, 2014.
The following table sets forth the amortized costs and fair values of our investment securities at the dates indicated. For all periods presented, our mortgage-backed and related securities did not include any private label issues or real estate mortgage investment conduits, but do include securities backed by the U.S. Small Business Administration (“SBA”).
|
December 31,
|
||||||||||||||||||||||||
|
2015
|
2014
|
2013
|
||||||||||||||||||||||
|
(Dollars in thousands)
|
Amortized
Cost |
Fair
Value |
Amortized
Cost |
Fair
Value |
Amortized
Cost |
Fair
Value |
||||||||||||||||||
|
Securities available for sale:
|
||||||||||||||||||||||||
|
U.S. government agencies and corporations
|
$
|
2,135
|
$
|
2,114
|
$
|
2,173
|
$
|
2,138
|
$
|
3,532
|
$
|
3,449
|
||||||||||||
|
Mortgage-backed and similar securities
|
68,700
|
68,092
|
95,814
|
95,886
|
129,712
|
128,538
|
||||||||||||||||||
|
State and local government
|
65,542
|
66,591
|
42,535
|
42,692
|
56,089
|
52,629
|
||||||||||||||||||
|
Other equity securities
|
760
|
758
|
744
|
746
|
728
|
713
|
||||||||||||||||||
|
Total available for sale
|
137,137
|
137,555
|
141,266
|
141,462
|
190,061
|
185,329
|
||||||||||||||||||
|
Securities held to maturity:
|
||||||||||||||||||||||||
|
U.S. government agencies and corporations
|
1,024
|
1,070
|
1,038
|
1,111
|
1,052
|
1,154
|
||||||||||||||||||
|
Mortgage-backed and similar securities
|
351
|
376
|
532
|
572
|
765
|
815
|
||||||||||||||||||
|
State and local government
|
2,434
|
2,640
|
2,429
|
2,680
|
2,424
|
2,563
|
||||||||||||||||||
|
Total held to maturity
|
3,809
|
4,086
|
3,999
|
4,363
|
4,241
|
4,532
|
||||||||||||||||||
|
Total securities
|
$
|
140,946
|
$
|
141,641
|
$
|
145,265
|
$
|
145,825
|
$
|
194,302
|
$
|
189,861
|
||||||||||||
The following table sets forth the stated maturities and weighted average yields of investment securities at December 31, 2015. Weighted average yields on tax-exempt securities are presented on a taxable equivalent basis using a federal marginal tax rate of 34%. Certain mortgage-backed securities have adjustable interest rates and will reprice annually within the various maturity ranges. These repricing schedules are not reflected in the table below. Weighted average yield calculations on investments available for sale do not give effect to changes in fair value that are reflected as a component of equity.
|
One Year Or Less
|
More Than One Year
To Five Years
|
More Than Five Years
To Ten Years
|
||||||||||||||||||||||
|
December 31, 2015
(Dollars in thousands) |
Carrying
Value (1) |
Weighted
Average |
Carrying
Value (1) |
Weighted
Average
Yield |
Carrying
Value (1) |
Weighted
Average |
||||||||||||||||||
|
Securities available for sale:
|
||||||||||||||||||||||||
|
U.S. government agencies and corporations
|
$
|
-
|
0.00
|
%
|
$
|
2,114
|
1.14
|
%
|
$
|
-
|
0.00
|
%
|
||||||||||||
|
Mortgage-backed and similar securities
|
-
|
0.00
|
%
|
763
|
2.70
|
%
|
10,903
|
1.79
|
%
|
|||||||||||||||
|
State and local government
|
-
|
0.00
|
%
|
687
|
2.29
|
%
|
8,935
|
3.12
|
%
|
|||||||||||||||
|
Total available for sale
|
-
|
0.00
|
%
|
3,564
|
1.70
|
%
|
19,838
|
2.39
|
%
|
|||||||||||||||
|
Securities held to maturity:
|
||||||||||||||||||||||||
|
U.S. government agencies and corporations
|
-
|
0.00
|
%
|
1,024
|
3.98
|
%
|
-
|
0.00
|
%
|
|||||||||||||||
|
Mortgage-backed and similar securities
|
2
|
4.41
|
%
|
160
|
4.36
|
%
|
189
|
4.90
|
%
|
|||||||||||||||
|
State and local government
|
-
|
0.00
|
%
|
-
|
0.00
|
%
|
965
|
6.23
|
%
|
|||||||||||||||
|
Total held to maturity
|
2
|
4.41
|
%
|
1,184
|
4.03
|
%
|
1,154
|
6.01
|
%
|
|||||||||||||||
|
Total securities
|
$
|
2
|
4.41
|
%
|
$
|
4,748
|
2.28
|
%
|
$
|
20,992
|
2.59
|
%
|
||||||||||||
|
More Than Ten Years
|
Total
|
|||||||||||||||
|
December 31, 2015
(Dollars in thousands)
|
Carrying
Value (1)
|
Weighted
Average
Yield
|
Carrying
Value (1)
|
Weighted
Average
Yield
|
||||||||||||
|
Securities available for sale:
|
||||||||||||||||
|
U.S. government agencies and corporations
|
$
|
-
|
0.00
|
%
|
$
|
2,114
|
1.14
|
%
|
||||||||
|
Mortgage-backed and similar securities
|
56,426
|
1.40
|
%
|
68,092
|
1.48
|
%
|
||||||||||
|
State and local government
|
56,969
|
3.78
|
%
|
66,591
|
3.68
|
%
|
||||||||||
|
Other equity securities
|
758
|
0.00
|
%
|
758
|
0.00
|
%
|
||||||||||
|
Total available for sale
|
114,153
|
2.58
|
%
|
137,555
|
2.53
|
%
|
||||||||||
|
Securities held to maturity:
|
||||||||||||||||
|
U.S. government agencies and corporations
|
-
|
0.00
|
%
|
1,024
|
3.98
|
%
|
||||||||||
|
Mortgage-backed and similar securities
|
-
|
0.00
|
%
|
351
|
4.65
|
%
|
||||||||||
|
State and local government
|
1,469
|
6.08
|
%
|
2,434
|
6.14
|
%
|
||||||||||
|
Total held to maturity
|
1,469
|
6.08
|
%
|
3,809
|
5.42
|
%
|
||||||||||
|
Total securities
|
$
|
115,622
|
2.62
|
%
|
$
|
141,364
|
2.60
|
%
|
||||||||
|
(1)
|
Carrying value is fair value for securities available for sale and amortized cost for securities held to maturity.
|
Deposits
We accept deposits primarily from individuals and businesses who are located in our primary market area or who have a preexisting lending relationship with us. We rely on competitive pricing, customer service, account features and the location of our branch offices to attract and retain deposits. Deposits serve as the primary source of funds for our lending and investment activities. Deposit accounts offered include individual and business checking accounts, money market accounts, individual NOW accounts, savings accounts and certificates of deposit. Noninterest-bearing accounts consist of free checking and commercial checking accounts.
The following table sets forth the balances of our deposit accounts at the dates indicated.
|
December 31,
|
||||||||||||||||||||||||
|
2015
|
2014
|
2013
|
||||||||||||||||||||||
|
(Dollars in thousands)
|
Total
|
Percent
|
Total
|
Percent
|
Total
|
Percent
|
||||||||||||||||||
|
Non-interest-bearing accounts
|
$
|
113,745
|
18.03
|
%
|
$
|
97,450
|
16.15
|
%
|
$
|
74,019
|
12.92
|
%
|
||||||||||||
|
NOW accounts
|
163,005
|
25.84
|
%
|
152,860
|
25.33
|
%
|
142,434
|
24.87
|
%
|
|||||||||||||||
|
Money market accounts
|
170,921
|
27.09
|
%
|
157,091
|
26.04
|
%
|
154,545
|
26.98
|
%
|
|||||||||||||||
|
Savings accounts
|
47,957
|
7.60
|
%
|
41,885
|
6.94
|
%
|
34,724
|
6.06
|
%
|
|||||||||||||||
|
Core deposits
|
495,628
|
78.56
|
%
|
449,286
|
74.46
|
%
|
405,722
|
70.83
|
%
|
|||||||||||||||
|
Certificates of deposit
|
135,276
|
21.44
|
%
|
154,093
|
25.54
|
%
|
167,064
|
29.17
|
%
|
|||||||||||||||
|
Total
|
$
|
630,904
|
100.00
|
%
|
$
|
603,379
|
100.00
|
%
|
$
|
572,786
|
100.00
|
%
|
||||||||||||
Core deposits, which exclude certificates of deposit, increased $46.3 million, or 10.3%, to $495.6 million at December 31, 2015 from $449.3 million at December 31, 2014. Also during 2015, noninterest-bearing deposits, NOW deposits, money market deposits and savings deposits increased $16.3 million, $10.1 million, $13.8 million and $6.1 million, respectively. While we continued to place greater emphasis on attracting lower cost core deposits, our core deposit growth was also significantly affected by sustained low deposit rates in our competitive markets as the spread between core deposits and certificate time deposits remained narrow throughout 2015.
Commercial checking and money market accounts increased $25.4 million, or 20.9%, to $147.0 million at December 31, 2015 from $121.6 million at December 31, 2014, reflecting expanded sources of lower cost funding. The Company’s initiatives to obtain new commercial deposit relationships in conjunction with making new commercial loans significantly contributed to this increase and reflects its commitment to establishing diversified relationships with business clients.
Certificates of deposit decreased $18.8 million, or 12.2%, to $135.3 million at December 31, 2015 from $154.1 million at December 31, 2014. The decrease reflects management’s continued focus on reducing deposit interest rates to improve the Bank’s net interest margin. A portion of these funds moved into our other types of interest-bearing deposits, including money market accounts. Our need for loan funding, ability to invest these funds for a positive return and consideration of other customer relationships influence our willingness to match competitors’ rates to retain these accounts.
Generally, deposit amounts in excess of $250,000 are not federally insured. The following table indicates the amount of certificates of deposit greater than or equal to $250,000 by time remaining until maturity at the dates indicated.
|
December 31,
|
||||||||||||
|
(Dollars in thousands)
|
2015
|
2014
|
2013
|
|||||||||
|
Maturity period:
|
||||||||||||
|
Three months or less
|
$
|
1,085
|
$
|
1,330
|
$
|
646
|
||||||
|
Over three through six months
|
1,887
|
602
|
507
|
|||||||||
|
Over six through twelve months
|
1,455
|
2,703
|
727
|
|||||||||
|
Over twelve months
|
4,986
|
4,249
|
3,679
|
|||||||||
|
Total
|
$
|
9,413
|
$
|
8,884
|
$
|
5,559
|
||||||
The following table sets forth time deposits classified by rates at the dates indicated.
|
December 31,
|
|||||||||||||
|
(Dollars in thousands)
|
2015
|
2014
|
2013
|
||||||||||
| 0.00 - 1.00 % |
|
$
|
118,036
|
$
|
127,618
|
$
|
119,451
|
||||||
| 1.01 - 2.00 % |
|
15,509
|
22,976
|
42,122
|
|||||||||
| 2.01 - 3.00 % |
|
1,731
|
3,499
|
4,968
|
|||||||||
| 3.01 - 4.00 % |
|
-
|
-
|
523
|
|||||||||
|
Total
|
$
|
135,276
|
$
|
154,093
|
$
|
167,064
|
|||||||
The following table sets forth the amount and maturities of time deposits at December 31, 2015.
|
Amount Due
|
|||||||||||||||||||||||||
|
December 31, 2015
(Dollars in thousands)
|
Less Than
One Year
|
More Than
One Year To
Two Years
|
More Than
Two Years To
Three Years
|
More Than
Three Years
|
Total
|
Percent Of
Total Time
Deposits
|
|||||||||||||||||||
|
0.00 - 1.00 %
|
|
$
|
72,117
|
$
|
28,583
|
$
|
16,633
|
$
|
703
|
$
|
118,036
|
87.26
|
%
|
||||||||||||
|
1.01 - 2.00 %
|
|
2,340
|
3,917
|
4,185
|
5,067
|
15,509
|
11.46
|
%
|
|||||||||||||||||
|
2.01 - 3.00 %
|
|
1,731
|
-
|
-
|
-
|
1,731
|
1.28
|
%
|
|||||||||||||||||
|
Total
|
$
|
76,188
|
$
|
32,500
|
$
|
20,818
|
$
|
5,770
|
$
|
135,276
|
100.00
|
%
|
|||||||||||||
The following table sets forth deposit activity for the periods indicated.
|
Year Ended December 31,
|
||||||||||||
|
(Dollars in thousands)
|
2015
|
2014
|
2013
|
|||||||||
|
Beginning balance
|
$
|
603,379
|
$
|
572,786
|
$
|
578,299
|
||||||
|
Increase (decrease) before interest credited
|
26,005
|
29,023
|
(7,741
|
)
|
||||||||
|
Interest credited
|
1,520
|
1,570
|
2,228
|
|||||||||
|
Net increase (decrease) in deposits
|
27,525
|
30,593
|
(5,513
|
)
|
||||||||
|
Ending balance
|
$
|
630,904
|
$
|
603,379
|
$
|
572,786
|
||||||
Borrowings
We use borrowings from the FHLB of Atlanta, federal funds purchased and other short-term borrowings to supplement our supply of funds for loans and investments and for interest rate risk management, which are summarized in the following table.
|
Year Ended December 31,
|
||||||||||||
|
(Dollars in thousands)
|
2015
|
2014
|
2013
|
|||||||||
|
Maximum balance outstanding at any month-end during period:
|
||||||||||||
|
FHLB advances
|
$
|
50,000
|
$
|
50,000
|
$
|
50,000
|
||||||
|
Overnight and short-term borrowings
|
1,091
|
1,001
|
787
|
|||||||||
|
Average balance outstanding during period:
|
||||||||||||
|
FHLB advances
|
$
|
50,000
|
$
|
50,000
|
$
|
50,000
|
||||||
|
Overnight and short-term borrowings
|
473
|
491
|
542
|
|||||||||
|
Weighted average interest rate during period:
|
||||||||||||
|
FHLB advances
|
3.93
|
%
|
3.93
|
%
|
3.93
|
%
|
||||||
|
Overnight and short-term borrowings
|
0.05
|
%
|
0.20
|
%
|
0.18
|
%
|
||||||
|
Balance outstanding at end of period:
|
||||||||||||
|
FHLB advances
|
$
|
50,000
|
$
|
50,000
|
$
|
50,000
|
||||||
|
Overnight and short-term borrowings
|
327
|
660
|
787
|
|||||||||
|
Weighted average interest rate at end of period:
|
||||||||||||
|
FHLB advances
|
3.88
|
%
|
3.88
|
%
|
3.88
|
%
|
||||||
|
Overnight and short-term borrowings
|
0.05
|
%
|
0.05
|
%
|
0.10
|
%
|
||||||
Our FHLB advances are fixed-rate borrowings that, at the option of the FHLB of Atlanta, can be converted to variable rates. If the FHLB of Atlanta exercises its options to convert the fixed-rate advances to variable rates, then the Bank can accept the new terms or repay the advance without any prepayment penalty. Had the Bank elected to prepay the advances at December 31, 2015, the prepayment penalties were estimated at approximately $2.1 million.
Average Balances and Yields
The following tables present information regarding average balances of assets and liabilities, the total dollar amounts of interest income and dividends from average interest-earning assets, the total dollar amounts of interest expense on average interest-bearing liabilities, and the resulting annualized average yields and costs. The yields and costs for the periods indicated are derived by dividing income or expense for twelve-month periods by the average balances of assets or liabilities, respectively, for the periods presented. Average balances have been calculated using daily balances. Nonaccrual loans are included in average balances only. Loan fees are included in interest income on loans and are not material. Tax-exempt income on loans and on investment securities has been calculated on a tax-equivalent basis using a federal marginal tax rate of 34%.
|
For The Year Ended December 31,
|
||||||||||||||||||||||||
|
2015
|
2014
|
|||||||||||||||||||||||
|
(Dollars in thousands)
|
Average
Balance
|
Interest
And
Dividends
|
Yield/
Cost
|
Average
Balance
|
Interest
And
Dividends
|
Yield/
Cost
|
||||||||||||||||||
|
Assets
|
||||||||||||||||||||||||
|
Interest-earning deposits with banks
|
$
|
49,059
|
$
|
136
|
0.28
|
%
|
$
|
72,936
|
$
|
213
|
0.29
|
%
|
||||||||||||
|
Loans receivable
|
557,221
|
22,761
|
4.08
|
%
|
476,782
|
20,518
|
4.30
|
%
|
||||||||||||||||
|
Investment securities
|
60,561
|
1,484
|
3.24
|
%
|
53,442
|
1,289
|
3.18
|
%
|
||||||||||||||||
|
Mortgage-backed and similar securities
|
76,863
|
927
|
1.21
|
%
|
102,620
|
1,357
|
1.32
|
%
|
||||||||||||||||
|
Other interest-earning assets
|
2,827
|
127
|
4.49
|
%
|
2,953
|
125
|
4.23
|
%
|
||||||||||||||||
|
Total interest-earning assets
|
746,531
|
25,435
|
3.47
|
%
|
708,733
|
23,502
|
3.37
|
%
|
||||||||||||||||
|
Allowance for loan losses
|
(6,161
|
)
|
(6,569
|
)
|
||||||||||||||||||||
|
Noninterest-earning assets
|
41,604
|
45,327
|
||||||||||||||||||||||
|
Total assets
|
$
|
781,974
|
$
|
747,491
|
||||||||||||||||||||
|
Liabilities and equity
|
||||||||||||||||||||||||
|
NOW accounts
|
$
|
153,283
|
214
|
0.14
|
%
|
$
|
147,986
|
210
|
0.14
|
%
|
||||||||||||||
|
Money market accounts
|
163,947
|
292
|
0.18
|
%
|
154,424
|
271
|
0.18
|
%
|
||||||||||||||||
|
Savings accounts
|
45,600
|
44
|
0.10
|
%
|
38,157
|
37
|
0.10
|
%
|
||||||||||||||||
|
Certificates of deposit
|
148,925
|
970
|
0.65
|
%
|
160,937
|
1,052
|
0.65
|
%
|
||||||||||||||||
|
Total interest-bearing deposits
|
511,755
|
1,520
|
0.30
|
%
|
501,504
|
1,570
|
0.31
|
%
|
||||||||||||||||
|
Overnight and short-term borrowings
|
473
|
-
|
0.05
|
%
|
491
|
1
|
0.20
|
%
|
||||||||||||||||
|
Federal Home Loan Bank advances
|
50,000
|
1,965
|
3.93
|
%
|
50,000
|
1,965
|
3.93
|
%
|
||||||||||||||||
|
Total interest-bearing liabilities
|
562,228
|
3,485
|
0.62
|
%
|
551,995
|
3,536
|
0.64
|
%
|
||||||||||||||||
|
Noninterest-bearing deposits
|
109,986
|
87,007
|
||||||||||||||||||||||
|
Other noninterest-bearing liabilities
|
13,452
|
9,508
|
||||||||||||||||||||||
|
Total liabilities
|
685,666
|
648,510
|
||||||||||||||||||||||
|
Total equity
|
96,308
|
98,981
|
||||||||||||||||||||||
|
Total liabilities and equity
|
$
|
781,974
|
$
|
747,491
|
||||||||||||||||||||
|
Net interest income
|
$
|
21,950
|
$
|
19,966
|
||||||||||||||||||||
|
Interest rate spread
|
2.85
|
%
|
2.73
|
%
|
||||||||||||||||||||
|
Net interest margin
|
3.00
|
%
|
2.87
|
%
|
||||||||||||||||||||
|
Average interest-earning assets to average interest-bearing liabilities
|
132.78
|
%
|
128.39
|
%
|
||||||||||||||||||||
|
For The Year Ended December 31,
|
||||||||||||||||||||||||
|
2014
|
2013
|
|||||||||||||||||||||||
|
(Dollars in thousands)
|
Average
Balance
|
Interest
And
Dividends
|
Yield/
Cost
|
Average
Balance
|
Interest
And
Dividends
|
Yield/
Cost
|
||||||||||||||||||
|
Assets
|
||||||||||||||||||||||||
|
Interest-earning deposits with banks
|
$
|
72,936
|
$
|
213
|
0.29
|
%
|
$
|
50,486
|
$
|
188
|
0.37
|
%
|
||||||||||||
|
Loans receivable
|
476,782
|
20,518
|
4.30
|
%
|
421,415
|
19,058
|
4.52
|
%
|
||||||||||||||||
|
Investment securities
|
53,442
|
1,289
|
3.18
|
%
|
65,072
|
1,523
|
3.06
|
%
|
||||||||||||||||
|
Mortgage-backed and similar securities
|
102,620
|
1,357
|
1.32
|
%
|
166,324
|
2,101
|
1.26
|
%
|
||||||||||||||||
|
Other interest-earning assets
|
2,953
|
125
|
4.23
|
%
|
3,199
|
82
|
2.56
|
%
|
||||||||||||||||
|
Total interest-earning assets
|
708,733
|
23,502
|
3.37
|
%
|
706,496
|
22,952
|
3.31
|
%
|
||||||||||||||||
|
Allowance for loan losses
|
(6,569
|
)
|
(8,239
|
)
|
||||||||||||||||||||
|
Noninterest-earning assets
|
45,327
|
53,149
|
||||||||||||||||||||||
|
Total assets
|
$
|
747,491
|
$
|
751,406
|
||||||||||||||||||||
|
Liabilities and equity
|
||||||||||||||||||||||||
|
NOW accounts
|
$
|
147,986
|
210
|
0.14
|
%
|
$
|
142,453
|
296
|
0.21
|
%
|
||||||||||||||
|
Money market accounts
|
154,424
|
271
|
0.18
|
%
|
153,804
|
376
|
0.24
|
%
|
||||||||||||||||
|
Savings accounts
|
38,157
|
37
|
0.10
|
%
|
32,366
|
32
|
0.10
|
%
|
||||||||||||||||
|
Certificates of deposit
|
160,937
|
1,052
|
0.65
|
%
|
182,727
|
1,524
|
0.83
|
%
|
||||||||||||||||
|
Total interest-bearing deposits
|
501,504
|
1,570
|
0.31
|
%
|
511,350
|
2,228
|
0.44
|
%
|
||||||||||||||||
|
Overnight and short-term borrowings
|
491
|
1
|
0.20
|
%
|
542
|
1
|
0.18
|
%
|
||||||||||||||||
|
Federal Home Loan Bank advances
|
50,000
|
1,965
|
3.93
|
%
|
50,000
|
1,965
|
3.93
|
%
|
||||||||||||||||
|
Total interest-bearing liabilities
|
551,995
|
3,536
|
0.64
|
%
|
561,892
|
4,194
|
0.75
|
%
|
||||||||||||||||
|
Noninterest-bearing deposits
|
87,007
|
71,508
|
||||||||||||||||||||||
|
Other noninterest-bearing liabilities
|
9,508
|
12,065
|
||||||||||||||||||||||
|
Total liabilities
|
648,510
|
645,465
|
||||||||||||||||||||||
|
Total equity
|
98,981
|
105,941
|
||||||||||||||||||||||
|
Total liabilities and equity
|
$
|
747,491
|
$
|
751,406
|
||||||||||||||||||||
|
Net interest income
|
$
|
19,966
|
$
|
18,758
|
||||||||||||||||||||
|
Interest rate spread
|
2.73
|
%
|
2.56
|
%
|
||||||||||||||||||||
|
Net interest margin
|
2.87
|
%
|
2.72
|
%
|
||||||||||||||||||||
|
Average interest-earning assets to average interest-bearing liabilities
|
128.39
|
%
|
125.74
|
%
|
||||||||||||||||||||
Rate/Volume Analysis. The following table sets forth the effects of changing rates and volumes on our net interest income. The rate column shows the effects attributable to changes in rate (changes in rate multiplied by prior volume). The volume column shows the effects attributable to changes in volume (changes in volume multiplied by prior rate). The net column represents the sum of the volume and rate columns. Changes attributable to changes in both rate and volume have been allocated proportionally based on the absolute dollar amounts of change in each.
|
Year Ended December 31, 2015
Compared To The
Year Ended December 31, 2014
|
Year Ended December 31, 2014
Compared To The
Year Ended December 31, 2013
|
|||||||||||||||||||||||
|
Increase (Decrease)
Due To: |
Increase (Decrease)
Due To: |
|||||||||||||||||||||||
|
(Dollars in thousands)
|
Volume
|
Rate
|
Net
|
Volume
|
Rate
|
Net
|
||||||||||||||||||
|
Interest income:
|
||||||||||||||||||||||||
|
Interest-earning deposits with banks
|
$
|
(67
|
)
|
$
|
(10
|
)
|
$
|
(77
|
)
|
$
|
71
|
$
|
(46
|
)
|
$
|
25
|
||||||||
|
Loans receivable
|
3,326
|
(1,083
|
)
|
2,243
|
2,415
|
(955
|
)
|
1,460
|
||||||||||||||||
|
Investment securities
|
174
|
21
|
195
|
(279
|
)
|
45
|
(234
|
)
|
||||||||||||||||
|
Mortgage-backed and similar securities
|
(318
|
)
|
(112
|
)
|
(430
|
)
|
(838
|
)
|
94
|
(744
|
)
|
|||||||||||||
|
Other interest-earning assets
|
(5
|
)
|
7
|
2
|
(7
|
)
|
50
|
43
|
||||||||||||||||
|
Total interest-earning assets
|
3,110
|
(1,177
|
)
|
1,933
|
1,362
|
(812
|
)
|
550
|
||||||||||||||||
|
Interest expense:
|
||||||||||||||||||||||||
|
NOW accounts
|
7
|
(3
|
)
|
4
|
11
|
(97
|
)
|
(86
|
)
|
|||||||||||||||
|
Money market accounts
|
17
|
4
|
21
|
2
|
(107
|
)
|
(105
|
)
|
||||||||||||||||
|
Savings accounts
|
7
|
-
|
7
|
6
|
(1
|
)
|
5
|
|||||||||||||||||
|
Certificates of deposit
|
(78
|
)
|
(4
|
)
|
(82
|
)
|
(168
|
)
|
(304
|
)
|
(472
|
)
|
||||||||||||
|
Total interest-bearing deposits
|
(47
|
)
|
(3
|
)
|
(50
|
)
|
(149
|
)
|
(509
|
)
|
(658
|
)
|
||||||||||||
|
Overnight and short-term borrowings
|
-
|
(1
|
)
|
(1
|
)
|
-
|
-
|
-
|
||||||||||||||||
|
Federal Home Loan Bank advances
|
-
|
-
|
-
|
-
|
-
|
-
|
||||||||||||||||||
|
Total interest-bearing liabilities
|
(47
|
)
|
(4
|
)
|
(51
|
)
|
(149
|
)
|
(509
|
)
|
(658
|
)
|
||||||||||||
|
Net increase (decrease) in net interest income
|
$
|
3,157
|
$
|
(1,173
|
)
|
$
|
1,984
|
$
|
1,511
|
$
|
(303
|
)
|
$
|
1,208
|
||||||||||
We have experienced an unfavorable variance relating to the interest rate component because rates on loans have declined at a greater pace compared to deposit cost. Accordingly, the prolonged low interest rate environment has resulted in a compression of the net interest margin. Our growth in loans continues to result in favorable volume component change and overall change.
Comparison of Results of Operations for the Years Ended December 31, 2015 and 2014
Overview. Net income was $3.6 million, or $0.89 per diluted common share, for the year ended December 31, 2015 compared to net income of $2.5 million or $0.59 per diluted common share, for the year ended December 31, 2014, the increase primarily due to a $2.0 million increase in net interest income in 2015 and a $1.2 million increase in noninterest income, which were partially offset by a $1.4 million increase in provision for loan losses and a $723,000 increase in income tax provision.
Net interest income. Net interest income increased $2.0 million, or 9.9%, for the year ended December 31, 2015 as compared to the year ended December 31, 2014, primarily due to an increase in interest income on loans and a decrease in interest expense on deposits, which were partially offset by a decrease in interest and dividend income on securities. Total interest and dividend income increased $1.9 million, or 8.2%, during the year ended December 31, 2015. Loan interest income increased $2.2 million, or 10.9%, during the year ended December 31, 2015, primarily due to an increase in average outstanding loans of $80.4 million, or 16.9%, which was partially offset by a 22 basis point decrease in the yield earned on loans during 2015. Interest income from investment securities decreased by $234,000, attributable to an $18.6 million decrease in the average balance of investment securities, partially offset by a 14 basis point increase in the yield earned on the investment portfolio. Total interest expense decreased $51,000, or 1.4%, during the year ended December 31, 2015. The slightly lower interest expense was primarily attributable to lower average balances of certificates of deposit, which were partially offset by higher average balances of NOW, money market and savings accounts. The Company continued its focus on core deposit growth, from which it excludes certificates of deposit. The average rate paid on total interest-bearing liabilities decreased two basis points during 2015. Average noninterest-bearing deposits grew $23.0 million, or 26.4%, when comparing the same periods, which contributed to the reduction in deposit interest expense while deposit funding grew.
Provision for Loan Losses. The Company recorded a provision for loan losses in the amount of $361,000 for the year ended December 31, 2015 compared to a recovery of loan losses of $998,000 for the year ended December 31, 2014. Net charge-offs were $21,000 for the year ended December 31, 2015 compared to $360,000 for the year ended December 31, 2014. The increase in the provision for loan losses was primarily due to loan growth in 2015 and to a reduction in loan loss reserves in 2014 due to a modification of our loan loss methodology for unimpaired commercial construction and land development, unimpaired residential construction and land development, and unimpaired commercial and industrial loans, which resulted in a nonrecurring reduction of approximately $1.3 million in the reserves for loans not considered impaired. The allowance for loan losses totaled $6.3 million, or 1.09% of total loans, at December 31, 2015 compared to $5.9 million, or 1.14% of total loans, at December 31, 2014.
Noninterest Income. During the year ended December 31, 2015, total noninterest income increased $1.2 million, or 18.6%, to $7.5 million from $6.3 million for the year ended December 31, 2014. The increase in noninterest income during 2015 was primarily attributable to $845,000 in higher mortgage banking income, $364,000 in higher net gains from the sale of investment securities, $141,000 in debit card income and $110,000 in deposit and other service charge income that were partially offset by decreases of $114,000 in loan fee income, $109,000 in income from an investment in a Small Business Investment Company and $90,000 in losses on sale of foreclosed properties. The increase in mortgage banking income was attributable to higher volumes of residential mortgage loans originated and sold. The increase in gains from sales of investment securities was primarily due to more sales of investment securities that were needed to fund loan growth. The increase in deposit fees was primarily the result of higher retail checking account fees, and the increase in income from debit card services was driven by volume.
Noninterest Expenses. Noninterest expenses remained the same at $23.5 million for the years ended December 31, 2015 and 2014. Increases of $469,000 in compensation and employee benefits and $90,000 in data processing fees were offset by lower expenses in most other categories. The increase in compensation and employee benefits included increases of $490,000 for employee incentives and $263,000 for pension plan expenses in 2015, which were partially offset by a decrease of $402,000 in equity incentive plan expenses primarily due to additional expense of $380,000 in 2014 for accelerated vesting related to the disability of a participant. Decreases of noninterest expenses in 2015 included $259,000 in foreclosed property expenses, $141,000 in professional and outside services, $119,000 in occupancy expenses and $77,000 in advertising. The decrease in foreclosed property expenses included a reduction of $141,000 in valuation write-downs of foreclosed properties.
Income Tax Expense. We recorded a provision for income taxes of $2.0 million for the year ended December 31, 2015 compared to $1.3 million for the year ended December 31, 2014, primarily due to an increase in pre-tax income to $5.6 million in 2015 compared to $3.7 million in 2014. The effective tax rate was 35.7% for the year ended December 31, 2015 compared to 33.6% for the year ended December 31, 2014, with the increase primarily resulting from the decrease in favorable permanent tax differences relative to the size of the pre-tax income in 2015 compared to 2014, and an increase in deferred state tax expense resulting from a decrease in North Carolina corporate tax rate which affected recorded deferred tax asset.
Total Comprehensive Income (Loss). Total comprehensive income or loss for the periods presented consists of net income, the change in unrealized gains and losses on securities available for sale and certain changes in our benefit obligations under our retirement plans, net of tax. We reported total comprehensive income of $4.3 million for the year ended December 31, 2015 compared to $4.1 million for the year ended December 31, 2014. The changes in the components of comprehensive income were net income of $3.6 million in 2015 compared to $2.5 million in 2014, a $141,000 increase in unrealized gains, net of taxes, on securities available for sale in 2015 compared to a $3.1 million increase in 2014, and a $600,000 decrease in defined benefit pension plan obligations, net of taxes, in 2015 compared to a $1.5 million increase in 2014. The decrease in defined benefit obligations reflected in other comprehensive income primarily resulted from an increase in the assumed discount rate used to estimate the pension liability that was partially offset by the effects of the Federally mandated use of revised mortality tables that reflected greater longevity at December 31, 2015 compared to December 31, 2014.
Comparison of Results of Operations for the Years Ended December 31, 2014 and 2013
Overview. Net income was $2.5 million, or $0.59 per diluted common share, for the year ended December 31, 2014 compared to net income of $1.5 million or $0.31 per diluted common share, for the year ended December 31, 2013, primarily due to a $1.8 million decrease in noninterest expenses in 2014, a $1.2 million increase in net interest income and a $317,000 increase in net recoveries of loan loss reserves, which were partially offset by a $1.7 million decrease in noninterest income.
Net interest income. Net interest income increased $1.2 million, or 6.4%, for the year ended December 31, 2014 as compared to the year ended December 31, 2013, primarily due to an increase in interest income on loans and a decrease in interest expense on deposits, which were partially offset by a decrease in interest and dividend income on securities. Total interest expense decreased $658,000, or 15.7%, during the year ended December 31, 2014, primarily resulting from a 13 basis point decrease in the rates paid on interest-bearing deposits as well as a decrease of $9.8 million, or 1.9%, in the average balances of interest-bearing deposits, reflecting a decline in average certificates of deposit that was partially offset by growth in average balances of NOW, money market, and savings accounts. The Company continued its focus on core deposit growth, from which it excludes certificates of deposit. The average rate paid on total interest-bearing liabilities decreased 11 basis points during 2014. Total interest and dividend income increased $550,000, or 2.4%, during the year ended December 31, 2014. Loan interest income increased $1.5 million, or 7.7%, during the year ended December 31, 2014, primarily due to an increase in average outstanding loans of $55.4 million, or 13.1%, which was partially offset by a 22 basis point decrease in the yield earned on loans during 2014. Interest income from securities decreased by $978,000, primarily due to a $63.7 million decrease in the average balance of mortgage-backed and related securities and a decrease of $11.6 million in the average balance of other investment securities that resulted from sales in 2014 to fund loan growth.
Provision for Loan Losses. The Company recorded a recovery of loan losses in the amount of $998,000 for the year ended December 31, 2014 compared to a recovery of loan losses of $681,000 for the year ended December 31, 2013. In the second quarter of 2014, the Company assessed and modified its loan loss methodology for unimpaired commercial construction and land development, unimpaired residential construction and land development, and unimpaired commercial and industrial loans, which resulted in a nonrecurring reduction of approximately $1.3 million in the Company’s reserves for loans not considered impaired in the second quarter of 2014. Charge-offs were $504,000 for the year ended December 31, 2014 compared to $630,000 for the year ended December 31, 2013. The allowance for loan losses totaled $5.9 million, or 1.14% of total loans, at December 31, 2014 compared to $7.3 million, or 1.63% of total loans, at December 31, 2013.
Noninterest Income. During the year ended December 31, 2014, total noninterest income decreased $1.7 million, or 21.2%, to $6.3 million compared to $8.0 million for the year ended December 31, 2013. Factors that contributed to the decrease in noninterest income during 2014 included $967,000 in lower mortgage banking income, a reduction of $659,000 in gains from the sale of investment securities, a reduction of $273,000 in gains from the sale of foreclosed properties and $132,000 in lower fees from deposits and other service charge income, which were partially offset by $219,000 in higher loan fees and $110,000 in higher income from debit card services. The decrease in mortgage banking income was attributable to lower volumes of residential mortgage loans originated and sold. The decrease in gains from sales of investment securities was primarily due to fewer sales of investment securities were needed to fund loan growth. The decrease in deposit fees was primarily the result of lower ATM and deposit overdraft fees. The increase in loan fees and income from debit card services was driven by volume.
Noninterest Expenses. Noninterest expenses decreased $1.8 million, or 7.3%, to $23.5 million for the year ended December 31, 2014 compared to $25.4 million for the year ended December 31, 2013. The decrease in noninterest expenses for 2014 was primarily attributable to $1.8 million in lower foreclosed property expenses resulting from a significant decline in valuation adjustments, $319,000 in lower data processing fees that primarily resulted from renegotiated vendor contracts and $168,000 in lower occupancy expenses resulting from lower depreciation expense, which were partially offset by $395,000 in higher salaries and employee benefits and $324,000 in higher professional and outside service fees resulting from higher legal and consulting expenses. The increase in salaries and employee benefits was primarily due to an increase of $457,000 relating to the Company’s equity incentive plan, which included $380,000 related to accelerated vesting due to the disability of a participant, and an increase of $537,000 in other employee benefits, which were partially offset by a decrease of $632,000 in compensation expenses in 2014. Employee benefits for 2013 included a $499,000 one-time credit to pension expense resulting from the curtailment of benefits for future service.
Income Tax Expense. We recorded a provision for income tax expense of $1.3 million for the year ended December 31, 2014 compared to $625,000 for the year ended December 31, 2013, primarily due to an increase in pre-tax income to $3.7 million in 2014 compared to $2.1 million in 2013. The effective tax rate was 33.6% for the year ended December 31, 2014 compared to 30.1% for the year ended December 31, 2013, with the increase primarily resulting from the decrease in favorable permanent tax differences relative to the size of the pre-tax income in 2014 compared to 2013.
Total Comprehensive Income (Loss). Total comprehensive income or loss for the periods presented consists of net income, the change in unrealized gains and losses on securities available for sale and certain changes in our benefit obligations under our retirement plans, net of tax. We reported total comprehensive income of $4.1 million for the year ended December 31, 2014 compared to a total comprehensive loss of $2.9 million for the year ended December 31, 2013. The changes in the components of comprehensive income or loss were net income of $2.5 million in 2014 compared to net income of $1.5 million in 2013, a $3.1 million increase in unrealized gain position on securities available for sale in 2014 to a net unrealized gain position compared to a $4.8 million decrease in unrealized gains on securities available for sale in 2013 and a $1.5 million increase in defined benefit pension plan obligations in 2014 compared to a $525,000 decrease in 2013. The increase in defined benefit obligations reflected in other comprehensive income (loss) primarily resulted from a decrease in the assumed discount rate used to estimate the pension liability, decrease in the assumed estimated yield on pension plan assets and the Federally mandated use of revised mortality tables that reflected greater longevity at December 31, 2014 compared to December 31, 2013.
Risk Management
Overview. Managing risk is an essential part of successfully managing a financial institution. Our most prominent risk exposures are credit risk, interest rate risk and market risk. Credit risk is the risk of not collecting the interest and/or the principal balance of a loan or investment when it is due. Interest rate risk is the potential reduction of interest income as a result of changes in interest rates. Market risk arises from fluctuations in interest rates that may result in changes in the values of financial instruments, such as available-for-sale securities that are accounted for on a mark-to-market basis. Other risks that we face are operational risks, liquidity risk and reputation risk. Operational risks include risks related to fraud, regulatory compliance, processing errors, technology and disaster recovery. Liquidity risk is the possible inability to fund obligations to depositors, lenders or borrowers. Reputation risk is the risk that negative publicity or press, whether true or not, could cause a decline in our customer base or revenue.
Credit Risk Management. Our strategy for credit risk management focuses on having well-defined credit policies and uniform underwriting criteria and providing prompt attention to potential problem loans. We do not offer Alt-A, sub-prime or no-documentation mortgage loans.
When a borrower fails to make a required loan payment, we take a number of steps to have the borrower cure the delinquency and restore the loan to current status. When the loan becomes 15 days past due, a late notice is sent to the borrower. When the loan becomes 30 days past due, a more formal letter is sent. Between 15 and 30 days past due, telephone calls are also made to the borrower. After 30 days, we regard the borrower in default. At 60 days delinquent, the borrower may be sent a letter from our attorney and we may commence collection proceedings. If a foreclosure action is instituted and the loan is not brought current, paid in full, or refinanced before the foreclosure sale, the real property securing the loan generally is sold at foreclosure. Generally, when a consumer loan becomes 60 days past due, we institute collection proceedings and attempt to repossess any personal property that secures the loan. Management informs the Board of Directors monthly of the amount of loans delinquent more than 30 days, all loans in foreclosure and repossessed property that we own.
Analysis of Nonperforming Assets and Classified Assets. We consider repossessed assets and loans that are 90 days or more past due and certain loans that are less than 90 days past due, but that we will not be able to collect the full amount of, to be nonperforming assets. Loans are generally placed on nonaccrual status when they become 90 days delinquent, or sooner if the facts and circumstances indicate that we will not be able to collect the full amount of the loan, at which time the accrual of interest ceases and accrued interest is reversed and deducted from income. Typically, payments received on a nonaccrual loan are first applied to the outstanding principal balance to the extent that principal is due and then recognized as interest income.
Real estate that we acquire as a result of foreclosure or by deed-in-lieu of foreclosure is classified as real estate owned until it is sold. Property acquired through foreclosure is recorded at the lower of its cost or fair market value at the date of foreclosure, less estimated costs to sell such property. Any holding costs and declines in fair value after acquisition of the property result in charges against income.
The following table provides information with respect to our nonperforming assets at the dates indicated.
|
At December 31,
|
||||||||||||||||||||
|
(Dollars in thousands)
|
2015
|
2014
|
2013
|
2012
|
2011
|
|||||||||||||||
|
Nonaccruing loans (1):
|
||||||||||||||||||||
|
Commercial:
|
||||||||||||||||||||
|
Commercial mortgage
|
$
|
818
|
$
|
881
|
$
|
373
|
$
|
-
|
$
|
833
|
||||||||||
|
Construction and land development
|
-
|
-
|
11
|
40
|
14,695
|
|||||||||||||||
|
Commercial and industrial
|
227
|
221
|
139
|
114
|
2,595
|
|||||||||||||||
|
Total nonaccruing commercial loans
|
1,045
|
1,102
|
523
|
154
|
18,123
|
|||||||||||||||
|
Non-commercial:
|
||||||||||||||||||||
|
Residential mortgage
|
1,309
|
1,354
|
549
|
808
|
1,922
|
|||||||||||||||
|
Construction and land development
|
-
|
-
|
-
|
-
|
110
|
|||||||||||||||
|
Revolving mortgage
|
194
|
230
|
116
|
155
|
440
|
|||||||||||||||
|
Consumer
|
-
|
2
|
9
|
34
|
27
|
|||||||||||||||
|
Total nonaccruing non-commercial loans
|
1,503
|
1,586
|
674
|
997
|
2,499
|
|||||||||||||||
|
Total nonaccruing loans
|
2,548
|
2,688
|
1,197
|
1,151
|
20,622
|
|||||||||||||||
|
Total nonperforming loans (nonaccruing and 90 days or more past due)
|
2,548
|
2,688
|
1,197
|
1,151
|
20,622
|
|||||||||||||||
|
Foreclosed properties
|
5,646
|
8,814
|
14,233
|
19,411
|
8,125
|
|||||||||||||||
|
Total nonperforming assets
|
8,194
|
11,502
|
15,430
|
20,562
|
28,747
|
|||||||||||||||
|
Performing troubled debt restructurings (2)
|
4,552
|
4,804
|
5,255
|
5,065
|
1,142
|
|||||||||||||||
|
Performing troubled debt restructurings and total nonperforming assets
|
$
|
12,746
|
$
|
16,306
|
$
|
20,685
|
$
|
25,627
|
$
|
29,889
|
||||||||||
|
Total nonperforming loans to total loans
|
0.44
|
%
|
0.52
|
%
|
0.27
|
%
|
0.30
|
%
|
4.76
|
%
|
||||||||||
|
Total nonperforming loans to total assets
|
0.33
|
%
|
0.35
|
%
|
0.16
|
%
|
0.15
|
%
|
2.61
|
%
|
||||||||||
|
Total nonperforming assets to total assets
|
1.05
|
%
|
1.51
|
%
|
2.10
|
%
|
2.74
|
%
|
3.63
|
%
|
||||||||||
|
Performing troubled debt restructurings and total nonperforming assets to total assets
|
1.63
|
%
|
2.15
|
%
|
2.82
|
%
|
3.42
|
%
|
3.78
|
%
|
||||||||||
|
(1)
|
Nonaccruing loans include nonperforming troubled debt restructurings that remain on nonaccrual status.
|
|
(2)
|
Performing troubled debt restructurings exclude nonaccruing troubled debt restructurings.
|
The following table provides information with respect to changes in our nonperforming assets.
|
At December 31,
|
||||||||||||||||
|
(Dollars in thousands)
|
2015
|
2014
|
$ Change
|
% Change
|
||||||||||||
|
Nonperforming Loans:
|
||||||||||||||||
|
Nonaccruing Loans (1)
|
||||||||||||||||
|
Commercial:
|
||||||||||||||||
|
Commercial mortgage
|
$
|
818
|
$
|
881
|
$
|
(63
|
)
|
-7.2
|
%
|
|||||||
|
Commercial and industrial
|
227
|
221
|
6
|
2.7
|
%
|
|||||||||||
|
Total nonaccruing commercial loans
|
1,045
|
1,102
|
(57
|
)
|
-5.2
|
%
|
||||||||||
|
Non-commercial:
|
||||||||||||||||
|
Residential mortgage
|
1,309
|
1,354
|
(45
|
)
|
-3.3
|
%
|
||||||||||
|
Revolving mortgage
|
194
|
230
|
(36
|
)
|
-15.7
|
%
|
||||||||||
|
Consumer
|
-
|
2
|
(2
|
)
|
-100.0
|
%
|
||||||||||
|
Total nonaccruing non-commercial loans
|
1,503
|
1,586
|
(83
|
)
|
-5.2
|
%
|
||||||||||
|
Total nonaccruing loans
|
2,548
|
2,688
|
(140
|
)
|
-5.2
|
%
|
||||||||||
|
Accruing loans past due 90 days or more:
|
||||||||||||||||
|
Total accruing loans past due 90 days or more
|
-
|
-
|
-
|
0.0
|
%
|
|||||||||||
|
Total nonperforming loans
|
2,548
|
2,688
|
(140
|
)
|
-5.2
|
%
|
||||||||||
|
Foreclosed properties
|
5,646
|
8,814
|
(3,168
|
)
|
-35.9
|
%
|
||||||||||
|
Total nonperforming assets
|
8,194
|
11,502
|
(3,308
|
)
|
-28.8
|
%
|
||||||||||
|
Performing troubled debt restructurings (2)
|
4,552
|
4,804
|
(252
|
)
|
-5.2
|
%
|
||||||||||
|
Performing troubled debt restructurings and total nonperforming assets
|
$
|
12,746
|
$
|
16,306
|
(3,560
|
)
|
-21.8
|
%
|
||||||||
| (1) | Troubled debt restructurings do not include troubled debt restructurings that remain on nonaccrual status and are included in nonaccrual loans above. |
| (2) | Performing troubled debt restructurings exclude nonaccrual troubled debt restructurings. |
Nonperforming assets decreased $3.3 million, or 28.8%, to $8.2 million, or 1.05% of total assets, at December 31, 2015, compared to $11.5 million, or 1.51% of total assets, at December 31, 2014. Nonperforming assets included $2.5 million in nonperforming loans and $5.6 million in foreclosed real estate at December 31, 2015, compared to $2.7 million and $8.8 million, respectively, at December 31, 2014.
Nonperforming loans decreased $140,000, or 5.2%, to $2.5 million at December 31, 2015 from $2.7 million at December 31, 2014. Real property securing nonperforming loans in the amount of $820,000 was moved into foreclosed real estate, while performing troubled debt restructurings decreased $252,000, or 5.2%, when comparing the same periods. Total performing troubled debt restructurings and nonperforming assets decreased $3.6 million, or 21.8%, to $12.7 million, or 1.63% of total assets, at December 31, 2015, compared to $16.3 million, or 2.15% of total assets, at December 31, 2014.
Nonperforming loans at December 31, 2015 included two commercial mortgage loans that totaled $818,000, four commercial and industrial loans that totaled $227,000, four residential mortgage loans that totaled $1.3 million, and four home equity loans that totaled $194,000. As of December 31, 2015, the nonperforming loans had specific reserves of $110,000. Foreclosed real estate at December 31, 2015 included six properties with a total carrying value of $5.6 million compared to ten properties with a total carrying value of $8.8 million at December 31, 2014. During 2015, there were three new properties in the amount of $820,000 added to foreclosed real estate, while seven properties totaling $3.3 million were sold, including a large parcel with a recorded amount of $3.1 million. In addition, during 2015, the Bank sold three of its 15 units in a mixed-use condominium complex for net proceeds of $508,000 along with three residential lots in a mixed-use lot subdivision and one parcel of land that was a portion of a residential property for net proceeds of $150,000. Loss provisions on foreclosed real estate of $9,000 were recorded during 2015 and there were no capital additions during the period.
The Bank’s largest foreclosed property resulted from a loan relationship that had an original purpose of constructing a mixed-use retail, commercial office, and residential condominium project located in Western North Carolina. As a result of this foreclosure, the Bank acquired 44 of the 48 condominium units in the building. Following an additional write-down of approximately $630,000 on the loans secured by this collateral in the fourth quarter of 2012, the Bank recorded this foreclosed property in the amount of $9.8 million. During 2013, the Bank recorded additional write-downs totaling $1.6 million, which resulted in an adjusted recorded amount of $8.2 million at December 31, 2013. During the year ended December 31, 2014, the Bank recorded an additional write-down of $133,000 on the property and sold 28 residential condominium units and one office unit. During 2015, the Bank sold one retail unit and two office units. At December 31, 2015, the adjusted recorded amount was $4.0 million for the remaining seven retail units and five office units.
We periodically modify loans to extend the term or make other concessions to help borrowers stay current on their loan and to avoid foreclosure. At December 31, 2015, we had $5.5 million of these modified loans, which are also referred to as troubled debt restructurings, of which $4.6 million were performing in accordance with their restructured terms, compared to $5.8 million troubled debt restructurings at December 31, 2014, of which $4.8 million were performing in accordance with their restructured terms. The decrease in troubled debt restructurings since December 31, 2014 was primarily the result of the excess of loan repayments, loans for which the collateral was transferred into foreclosed properties and loans charged off over newly restructured loans added during 2015. All troubled debt restructurings were restructured in order to help the borrowers remain current on their debt obligation. At December 31, 2015, $979,000 of the total $5.5 million of troubled debt restructurings were not performing according to their restructured terms and were included in the nonperforming asset table above as nonaccruing loans.
Interest income that would have been recorded had nonaccruing loans been current according to their original terms amounted to $180,000 for the year ended December 31, 2015 compared to $143,000 for the year ended December 31, 2014. Interest income recognized on nonperforming loans was $210,000 for the year ended December 31, 2015 compared to $232,000 for the year ended December 31, 2014.
At December 31, 2015, our nonaccruing loans included the following:
● Commercial Mortgage Loans
| ○ | Two loans to unrelated borrowers on commercial buildings located in Western North Carolina. As of December 31, 2015, the loans were considered impaired and nonaccruing with an aggregate balance of $818,000. The Bank had a specific reserve of $10,000 as of December 31, 2015. |
● Residential Mortgage Loans
| ○ | Four loans to multiple unrelated borrowers on one-to-four family residential properties with an aggregate balance of $1.3 million as of December 31, 2015. |
At December 31, 2015, our performing troubled debt restructurings included the following:
● Commercial Mortgage Loans
| ○ | One loan for the purchase of an existing mobile home park to be used for future development secured by nonowner-occupied commercial real estate located in coastal South Carolina. The loan was modified in the fourth quarter of 2014, which extended the terms of the loan and required scheduled principal payments. The future performance of the loan is dependent upon the guarantor group’s willingness and ability to service the debt. Such willingness and ability was demonstrated by the fact that, as of December 31, 2015, the loan was a performing troubled debt restructuring with a balance of $3.0 million that matures in May of 2017. As of December 31, 2015, the loan was considered impaired and had a specific reserve of $29,000. |
● Residential Mortgage Loans
| ○ | Eleven loans to multiple unrelated borrowers on one-to-four family residential properties with an aggregate balance of $1.6 million as of December 31, 2015. |
Foreclosed properties consisted of the following at the dates indicated.
|
At December 31,
|
||||||||||||||||||||||||
|
2015
|
2014
|
2013
|
||||||||||||||||||||||
|
(Dollars in thousands)
|
Number
|
Amount
|
Number
|
Amount
|
Number
|
Amount
|
||||||||||||||||||
|
By foreclosed loan type:
|
||||||||||||||||||||||||
|
Commercial construction and land development
|
5
|
$
|
4,941
|
8
|
$
|
8,706
|
9
|
$
|
13,822
|
|||||||||||||||
|
Residential mortgage
|
1
|
705
|
2
|
108
|
2
|
411
|
||||||||||||||||||
|
Total
|
6
|
$
|
5,646
|
10
|
$
|
8,814
|
11
|
$
|
14,233
|
|||||||||||||||
An analysis of foreclosed real estate follows:
|
Year Ended December 31,
|
||||||||||||
|
(Dollars in thousands)
|
2015
|
2014
|
2013
|
|||||||||
|
Beginning balance
|
$
|
8,814
|
$
|
14,233
|
$
|
19,411
|
||||||
|
Transfers from loans
|
820
|
281
|
708
|
|||||||||
|
Capitalized cost
|
-
|
242
|
39
|
|||||||||
|
Valuation adjustments of foreclosed real estate
|
(9
|
)
|
(150
|
)
|
(1,846
|
)
|
||||||
|
Net gain (loss) on sale of foreclosed properties
|
(33
|
)
|
57
|
330
|
||||||||
|
Net proceeds from sales of foreclosed properties
|
(3,946
|
)
|
(5,849
|
)
|
(4,409
|
)
|
||||||
|
Ending balance
|
$
|
5,646
|
$
|
8,814
|
$
|
14,233
|
||||||
Federal regulations require us to review and classify our assets on a regular basis. In addition, the FDIC and the NCCoB have the authority to identify problem assets and, if appropriate, require them to be classified. There are three classifications for problem assets: substandard, doubtful, and loss. “Substandard assets” must have one or more defined weaknesses and are characterized by the distinct possibility that we will sustain some loss if the deficiencies are not corrected. “Doubtful assets” have the weaknesses of substandard assets with the additional characteristic that the weaknesses make collection or liquidation in full questionable on the basis of currently existing facts, conditions, and values, and there is a high possibility of loss. Assets classified “loss” are considered uncollectible and of such little value that continued recognition as an asset of the institution is not warranted. The regulations also provide for a “special mention” category, described as assets which do not currently expose an institution to a sufficient degree of risk to warrant classification but do possess credit deficiencies or potential weaknesses deserving close attention. When we classify an asset as substandard or doubtful we may establish a specific allowance for loan losses. If we classify an asset as loss, we charge off an amount equal to 100% of the portion of the asset classified loss.
The following table shows the aggregate amounts of our classified and special mention assets at the dates indicated.
|
At December 31,
|
||||||||||||||||||||
|
(Dollars in thousands)
|
2015
|
2014
|
2013
|
2012
|
2011
|
|||||||||||||||
|
Adversely classified loans:
|
||||||||||||||||||||
|
Substandard
|
$
|
3,976
|
$
|
4,303
|
$
|
3,481
|
$
|
3,969
|
$
|
23,972
|
||||||||||
|
Doubtful
|
-
|
-
|
-
|
-
|
2
|
|||||||||||||||
|
Loss
|
-
|
-
|
-
|
4
|
569
|
|||||||||||||||
|
Total adversely classified loans
|
3,976
|
4,303
|
3,481
|
3,973
|
24,543
|
|||||||||||||||
|
Special mention loans
|
23,400
|
27,962
|
34,787
|
35,149
|
34,584
|
|||||||||||||||
|
Total adversely classified and special mention loans
|
$
|
27,376
|
$
|
32,265
|
$
|
38,268
|
$
|
39,122
|
$
|
59,127
|
||||||||||
The following table shows the aggregate amounts of our classified loans at the dates indicated and the related changes in our classified loans.
|
At December 31,
|
||||||||||||||||
|
(Dollars in thousands)
|
2015
|
2014
|
$ Change
|
% Change
|
||||||||||||
|
Adversely classified loans:
|
||||||||||||||||
|
Substandard
|
$
|
3,976
|
$
|
4,303
|
$
|
(327
|
)
|
-7.6
|
%
|
|||||||
|
Total adversely classified loans
|
3,976
|
4,303
|
(327
|
)
|
-7.6
|
%
|
||||||||||
|
Special mention loans
|
23,400
|
27,962
|
(4,562
|
)
|
-16.3
|
%
|
||||||||||
|
Total adversely classified and special mention loans
|
$
|
27,376
|
$
|
32,265
|
(4,889
|
)
|
-15.2
|
%
|
||||||||
Other than as disclosed in the above tables, there are no other loans where management has serious doubts about the ability of the borrowers to comply with the present loan repayment terms.
At December 31, 2015, adversely classified loans totaling $4.0 million included $2.5 million in nonaccruing loans that were previously discussed as nonperforming loans. The remaining $1.4 million in performing classified loans primarily included the following:
● Commercial Mortgage Loans
| ○ | Two loans to one borrower on two commercial retail properties located in Western North Carolina. As of December 31, 2015, the loans were performing with a balance of $616,000. |
● Residential Mortgage Loans
| ○ | Six loans to multiple unrelated borrowers for one-to-four family residential properties with an aggregate balance of $453,000 as of December 31, 2015. |
● Revolving Mortgage Loans
| ○ | Five loans to multiple unrelated borrowers for revolving home equity lines of credit with an aggregate balance of $330,000 as of December 31, 2015. |
Adversely classified assets include loans that are classified due to factors other than payment delinquencies, such as the absence of current financial statements and other required documentation, insufficient cash flows or other deficiencies and, therefore, are not included as nonperforming assets.
At December 31, 2015, special mention loans included the following large potentially problematic loan:
● Commercial Mortgage Loans
| ○ | One loan for the purchase of an existing mobile home park with a December 31, 2015 balance of $3.0 million that was previously discussed as a performing commercial mortgage loan restructured as troubled debt. |
The following table provides information about delinquencies, including nonaccruing loans, in our loan portfolio at the dates indicated.
|
Delinquent 31-89 Days
|
Delinquent 90 Days Or More
|
|||||||||||||||
|
(Dollars in thousands)
|
Number
Of
Loans
|
Principal
Balance
Of Loans
|
Number
Of
Loans
|
Principal
Balance
Of Loans
|
||||||||||||
|
At December 31, 2015
|
||||||||||||||||
|
Commercial:
|
||||||||||||||||
|
Commercial mortgage
|
-
|
$
|
-
|
1
|
$
|
496
|
||||||||||
|
Commercial and industrial
|
-
|
-
|
3
|
87
|
||||||||||||
|
Non-commercial:
|
||||||||||||||||
|
Residential mortgage
|
5
|
685
|
3
|
1,193
|
||||||||||||
|
Revolving mortgage
|
4
|
104
|
2
|
98
|
||||||||||||
|
Consumer
|
105
|
151
|
-
|
-
|
||||||||||||
|
Total delinquent loans
|
114
|
$
|
940
|
9
|
$
|
1,874
|
||||||||||
|
At December 31, 2014
|
||||||||||||||||
|
Commercial:
|
||||||||||||||||
|
Commercial mortgage
|
1
|
$
|
532
|
-
|
$
|
-
|
||||||||||
|
Commercial and industrial
|
-
|
-
|
2
|
43
|
||||||||||||
|
Non-commercial:
|
||||||||||||||||
|
Residential mortgage
|
3
|
576
|
5
|
1,226
|
||||||||||||
|
Revolving mortgage
|
9
|
396
|
3
|
141
|
||||||||||||
|
Consumer
|
94
|
227
|
1
|
1
|
||||||||||||
|
Total delinquent loans
|
107
|
$
|
1,731
|
11
|
$
|
1,411
|
||||||||||
|
At December 31, 2013
|
||||||||||||||||
|
Commercial:
|
||||||||||||||||
|
Commercial mortgage
|
1
|
$
|
372
|
-
|
$
|
-
|
||||||||||
|
Commercial construction and land development
|
-
|
-
|
1
|
11
|
||||||||||||
|
Commercial and industrial
|
4
|
165
|
1
|
79
|
||||||||||||
|
Non-commercial:
|
||||||||||||||||
|
Residential mortgage
|
6
|
241
|
7
|
549
|
||||||||||||
|
Revolving mortgage
|
9
|
434
|
1
|
24
|
||||||||||||
|
Consumer
|
114
|
300
|
-
|
-
|
||||||||||||
|
Total delinquent loans
|
134
|
$
|
1,512
|
10
|
$
|
663
|
||||||||||
|
At December 31, 2012
|
||||||||||||||||
|
Commercial:
|
||||||||||||||||
|
Commercial mortgage
|
1
|
$
|
393
|
-
|
$
|
-
|
||||||||||
|
Commercial construction and land development
|
1
|
16
|
1
|
40
|
||||||||||||
|
Commercial and industrial
|
7
|
135
|
1
|
114
|
||||||||||||
|
Non-commercial:
|
||||||||||||||||
|
Residential mortgage
|
9
|
875
|
10
|
808
|
||||||||||||
|
Revolving mortgage
|
4
|
203
|
2
|
60
|
||||||||||||
|
Consumer
|
158
|
492
|
4
|
28
|
||||||||||||
|
Total delinquent loans
|
180
|
$
|
2,114
|
18
|
$
|
1,050
|
||||||||||
|
Delinquent 31-89 Days
|
Delinquent 90 Days Or More
|
|||||||||||||||
|
(Dollars in thousands)
|
Number
Of
Loans
|
Principal
Balance
Of Loans
|
Number
Of
Loans
|
Principal
Balance
Of Loans
|
||||||||||||
|
At December 31, 2011
|
||||||||||||||||
|
Commercial:
|
||||||||||||||||
|
Commercial mortgage
|
-
|
$
|
-
|
1
|
$
|
833
|
||||||||||
|
Commercial construction and land development
|
1
|
363
|
7
|
6,251
|
||||||||||||
|
Commercial and industrial
|
9
|
2,177
|
4
|
506
|
||||||||||||
|
Non-commercial:
|
||||||||||||||||
|
Residential mortgage
|
12
|
1,426
|
11
|
1,922
|
||||||||||||
|
Residential construction and land development
|
-
|
-
|
1
|
110
|
||||||||||||
|
Revolving mortgage
|
11
|
751
|
4
|
407
|
||||||||||||
|
Consumer
|
213
|
939
|
7
|
27
|
||||||||||||
|
Total delinquent loans
|
246
|
$
|
5,656
|
35
|
$
|
10,056
|
||||||||||
The following table provides information about changes in our delinquencies, including nonaccruing loans, in our loan portfolio at the dates indicated.
|
At December 31,
|
||||||||||||||||
|
(Dollars in thousands)
|
2015
|
2014
|
$ Change
|
% Change
|
||||||||||||
|
Delinquent 31-89 Days:
|
||||||||||||||||
|
Commercial:
|
||||||||||||||||
|
Commercial mortgage
|
$
|
-
|
$
|
532
|
$
|
(532
|
)
|
-100.0
|
%
|
|||||||
|
Non-commercial:
|
||||||||||||||||
|
Residential mortgage
|
685
|
576
|
109
|
18.9
|
%
|
|||||||||||
|
Revolving mortgage
|
104
|
396
|
(292
|
)
|
-73.7
|
%
|
||||||||||
|
Consumer
|
151
|
227
|
(76
|
)
|
-33.5
|
%
|
||||||||||
|
Total loans delinquent 31-89 days
|
940
|
1,731
|
(791
|
)
|
-45.7
|
%
|
||||||||||
|
Delinquent 90 Days or More:
|
||||||||||||||||
|
Commercial:
|
||||||||||||||||
|
Commercial mortgage
|
496
|
-
|
496
|
n/a
|
|
|||||||||||
|
Commercial and industrial
|
87
|
43
|
44
|
102.3
|
%
|
|||||||||||
|
Non-commercial:
|
||||||||||||||||
|
Residential mortgage
|
1,193
|
1,226
|
(33
|
)
|
-2.7
|
%
|
||||||||||
|
Revolving mortgage
|
98
|
141
|
(43
|
)
|
-30.5
|
%
|
||||||||||
|
Consumer
|
-
|
1
|
(1
|
)
|
-100.0
|
%
|
||||||||||
|
Total loans delinquent 90 days or more
|
1,874
|
1,411
|
463
|
32.8
|
%
|
|||||||||||
|
Total delinquent loans
|
$
|
2,814
|
$
|
3,142
|
|
(328
|
)
|
-10.4
|
%
|
|||||||
The $791,000 decrease in loans 31 to 89 days past due to December 31, 2015 from December 31, 2014 was primarily due to a $532,000 decrease in commercial mortgage loans and a $292,000 decrease in revolving mortgage loans, which were partially offset by an increase of $109,000 in residential mortgage loans. The $940,000 in loans 31 to 89 days past due at December 31, 2015 was comprised of 114 loans with an average balance of approximately $8,000, the largest of which had a balance of $374,000.
The $463,000 increase in loans 90 days or more past due to December 31, 2015 from December 31, 2014 was primarily due to a $496,000 increase in commercial mortgage loans. The $1.9 million in loans 90 days or more past due at December 31, 2015 was comprised of nine loans with an average balance of approximately $208,000, the largest of which was a nonaccruing one-to-four family residential mortgage loan with a balance of $949,000.
Analysis and Determination of the Allowance for Loan Losses
The allowance for loan losses is a valuation allowance for probable losses inherent in the loan portfolio. On a monthly basis, we evaluate the need to establish allowances for probable losses on loans. When additional allowances are necessary, a provision for loan losses is charged to earnings and when allowance reductions are warranted, a recovery of loan losses is recognized in earnings. Our methodology for assessing the appropriateness of the allowance for loan losses is reviewed periodically by the Board of Directors. The Board of Directors also reviews the allowance for loan losses established on a quarterly basis.
General Valuation Allowance. We establish a general valuation allowance for loans that should be adequate to reserve for the estimated credit losses inherent in each segment of our loan portfolio, given the facts and circumstances as of the valuation date for all loans in the portfolio that have not been classified. Estimated loss percentages are assigned to loans based upon factors that include historical loan losses, delinquency trends, volume and interest rate trends, bank policy changes, and national, regional and local economic conditions. These loss factors are evaluated at least annually by our Asset Quality Committee, which consists of our President and Chief Executive Officer, our Executive Vice President and Chief Financial Officer, our Executive Vice President and Chief Credit Officer, and other key personnel from our credit, finance, and risk management departments, and documentation of this review is maintained in the Asset Quality Committee minutes. The Asset Quality Committee may also determine that certain events or circumstances have occurred that would impact the loan portfolio for the time period being reviewed, such as a natural disaster. In such cases, methodologies should be based on events that might not yet be recognized in the loan grading or performance of the loan groupings. The Asset Quality Committee reports to the Audit Committee of our Board of Directors on a quarterly basis.
Specific Valuation Allowance. The allowance for loan losses takes into consideration that specific losses on loans deemed to be impaired are recognized in accordance with the Financial Accounting Standards Board (the “FASB”) Accounting Standards Codification (“ASC”) Topic 310: Receivables. Pursuant to ASC Topic 310, we deem a loan to be impaired when it is probable that we will not be able to collect all amounts due, including principal and interest, according to the contractual terms of the loan agreement. Generally, all classified loans (loans classified substandard, doubtful, and loss) are considered impaired and are measured for impairment under ASC Topic 310 in order to determine if an impairment reserve is required. In addition, loans that are deemed to be troubled debt restructurings are considered impaired and evaluated for an impairment reserve under ASC Topic 310. Further, any non-accrual loan is considered impaired unless there is strong and credible evidence that the loan will begin performing according to the contractual terms of the loan agreement within a reasonable period of time. Such evidence must be well documented in a credit memorandum for the loan file. Any impaired loan, when evaluated for an impairment reserve under ASC Topic 310 and no requirement for such reserve is determined, will still be deemed impaired and will not be analyzed with respect to a general valuation allowance. Rather, such loan will continue to be included in impaired loans under ASC Topic 310 with a zero reserve.
ASC Topic 310 requires that impaired loans be measured based on the present value of expected future cash flows discounted at the loan’s effective interest rate or, for collateral dependent loans, the fair value of the collateral, net of estimated costs of disposal. Since full collection of principal and interest is not expected for impaired loans, income accrual is normally discontinued on such loans at the time they first become impaired.
Unallocated Valuation Allowance. Our allowance for loan losses methodology may also include an unallocated component to reflect the margin of imprecision inherent in the underlying assumptions used in the methodologies for estimating specific and general losses in the loan portfolio.
Methodology change – In the second quarter of 2014, the Bank accessed and modified its loan loss methodology for unimpaired commercial construction and land development, unimpaired residential construction and land development, and unimpaired commercial and industrial loans. This modification resulted in sub-segmentation of these classes of loans and the related historical charge-off rates. The purpose was to allocate the substantial historical charge-off rates created by three sub-segments of these loan classes against the significantly diminished or nonexistent current balances within these same loan sub-segments reflecting no continued credit exposure to the Bank. Specifically, additional sub-segments were identified where the Bank made (i) loans in excess of $2.5 million to construct commercial mixed-use buildings in small communities with low population growth, (ii) speculative loans to construct one-to-four family residences for the greater of 80% of the appraised value of the completed residence or 100% of the actual costs of construction, and (iii) loans secured by equity securities that do not have a readily determinable fair value. This change in methodology resulted in a nonrecurring reduction of approximately $1.3 million in the Bank’s reserves for loans not considered impaired in the second quarter of 2014.
Future material adjustments to the allowance for loan losses may be necessary due to improving or deteriorating economic conditions, delinquencies, charge-off levels or declining collateral values. In addition, regulatory agencies, as an integral part of their examination process, periodically review the Bank’s allowance for loan losses and may require the Bank to make adjustments to the allowance for loan losses based upon judgments that differ significantly from those of management.
The following table sets forth the allowance for loan losses by loan class at the dates indicated.
|
At December 31,
|
||||||||||||||||||||||||
|
2015
|
2014
|
|||||||||||||||||||||||
|
(Dollars in thousands)
|
Amount
|
% Of
Allowance
To Total
Allowance
|
% Of
Loans In
Class
To Total
Loans
|
Amount
|
% Of
Allowance
To Total
Allowance
|
% Of
Loans In
Class
To Total
Loans
|
||||||||||||||||||
|
Commercial:
|
||||||||||||||||||||||||
|
Commercial mortgage
|
$
|
3,021
|
48.04
|
%
|
36.32
|
%
|
$
|
2,863
|
48.13
|
%
|
38.53
|
%
|
||||||||||||
|
Commercial construction and land development
|
385
|
6.12
|
%
|
6.64
|
%
|
303
|
5.09
|
%
|
4.14
|
%
|
||||||||||||||
|
Commercial and industrial
|
304
|
4.83
|
%
|
3.97
|
%
|
243
|
4.08
|
%
|
3.04
|
%
|
||||||||||||||
|
Total commercial
|
3,710
|
58.99
|
%
|
46.93
|
%
|
3,409
|
57.30
|
%
|
45.71
|
%
|
||||||||||||||
|
Non-commercial:
|
||||||||||||||||||||||||
|
Residential mortgage
|
1,182
|
18.79
|
%
|
32.41
|
%
|
1,128
|
18.96
|
%
|
32.95
|
%
|
||||||||||||||
|
Residential construction and land development
|
139
|
2.21
|
%
|
2.88
|
%
|
116
|
1.95
|
%
|
2.83
|
%
|
||||||||||||||
|
Revolving mortgage
|
874
|
13.90
|
%
|
11.49
|
%
|
811
|
13.64
|
%
|
10.79
|
%
|
||||||||||||||
|
Consumer
|
384
|
6.11
|
%
|
6.29
|
%
|
485
|
8.15
|
%
|
7.72
|
%
|
||||||||||||||
|
Total non-commercial
|
2,579
|
41.01
|
%
|
53.07
|
%
|
2,540
|
42.70
|
%
|
54.29
|
%
|
||||||||||||||
|
Total allowance for loan losses
|
$
|
6,289
|
100.00
|
%
|
100.00
|
%
|
$
|
5,949
|
100.00
|
%
|
100.00
|
%
|
||||||||||||
|
At December 31,
|
||||||||||||||||||||||||
|
2013
|
2012
|
|||||||||||||||||||||||
|
(Dollars in thousands)
|
Amount
|
% Of
Allowance
To Total
Allowance
|
% Of
Loans In
Class
To Total
Loans
|
Amount
|
% Of
Allowance
To Total
Allowance
|
% Of
Loans In
Class
To Total
Loans
|
||||||||||||||||||
|
Commercial:
|
||||||||||||||||||||||||
|
Commercial mortgage
|
$
|
3,193
|
43.70
|
%
|
38.23
|
%
|
$
|
4,110
|
48.28
|
%
|
35.76
|
%
|
||||||||||||
|
Commercial construction and land development
|
836
|
11.44
|
%
|
3.47
|
%
|
160
|
1.88
|
%
|
1.34
|
%
|
||||||||||||||
|
Commercial and industrial
|
531
|
7.27
|
%
|
3.28
|
%
|
590
|
6.93
|
%
|
2.86
|
%
|
||||||||||||||
|
Total commercial
|
4,560
|
62.41
|
%
|
44.98
|
%
|
4,860
|
57.09
|
%
|
39.96
|
%
|
||||||||||||||
|
Non-commercial:
|
||||||||||||||||||||||||
|
Residential mortgage
|
1,074
|
14.70
|
%
|
35.89
|
%
|
1,841
|
21.63
|
%
|
42.14
|
%
|
||||||||||||||
|
Residential construction and land development
|
366
|
5.01
|
%
|
1.95
|
%
|
243
|
2.85
|
%
|
0.96
|
%
|
||||||||||||||
|
Revolving mortgage
|
834
|
11.41
|
%
|
11.02
|
%
|
1,123
|
13.19
|
%
|
12.42
|
%
|
||||||||||||||
|
Consumer
|
473
|
6.47
|
%
|
6.16
|
%
|
446
|
5.24
|
%
|
4.52
|
%
|
||||||||||||||
|
Total non-commercial
|
2,747
|
37.59
|
%
|
55.02
|
%
|
3,653
|
42.91
|
%
|
60.04
|
%
|
||||||||||||||
|
Total allowance for loan losses
|
$
|
7,307
|
100.00
|
%
|
100.00
|
%
|
$
|
8,513
|
100.00
|
%
|
100.00
|
%
|
||||||||||||
|
At December 31,
|
||||||||||||
|
2011
|
||||||||||||
|
(Dollars in thousands)
|
Amount
|
% Of
Allowance
To Total
Allowance
|
% Of
Loans In
Class
To Total
Loans
|
|||||||||
|
Commercial:
|
||||||||||||
|
Commercial mortgage
|
$
|
4,496
|
42.31
|
%
|
32.30
|
%
|
||||||
|
Commercial construction and land development
|
1,399
|
13.16
|
%
|
5.17
|
%
|
|||||||
|
Commercial and industrial
|
730
|
6.87
|
%
|
4.05
|
%
|
|||||||
|
Total commercial
|
6,625
|
62.34
|
%
|
41.52
|
%
|
|||||||
|
Non-commercial:
|
||||||||||||
|
Residential mortgage
|
2,125
|
20.00
|
%
|
40.59
|
%
|
|||||||
|
Residential construction and land development
|
189
|
1.78
|
%
|
0.90
|
%
|
|||||||
|
Revolving mortgage
|
1,092
|
10.27
|
%
|
11.78
|
%
|
|||||||
|
Consumer
|
596
|
5.61
|
%
|
5.21
|
%
|
|||||||
|
Total non-commercial
|
4,002
|
37.66
|
%
|
58.48
|
%
|
|||||||
|
Total allowance for loan losses
|
$
|
10,627
|
100.00
|
%
|
100.00
|
%
|
||||||
Although we believe that we use the best information available to establish the allowance for loan losses, future adjustments to the allowance for loan losses may be necessary and our results of operations could be adversely affected if circumstances differ substantially from the assumptions used in making the determinations. Furthermore, while we believe we have established our allowance for loan losses in conformity with GAAP, there can be no assurance that the FDIC and the NCCoB, in reviewing our loan portfolio, will not require us to increase our allowance for loan losses. The FDIC and the NCCoB may require us to increase our allowance for loan losses based on judgments different from ours. In addition, because future events affecting borrowers and collateral value cannot be predicted with certainty, there can be no assurance that the existing allowance for loan losses is adequate or that increases will not be necessary should the quality of any loans deteriorate as a result of the factors discussed above. Any material increase in the allowance for loan losses may adversely affect our financial condition and results of operation.
Analysis of Loan Loss Experience. The following table sets forth an analysis of the allowance for loan losses for the periods indicated.
|
At Or For The Years Ended December 31,
|
||||||||||||||||||||
|
(Dollars in thousands)
|
2015
|
2014
|
2013
|
2012
|
2011
|
|||||||||||||||
|
Balance at beginning of period
|
$
|
5,949
|
$
|
7,307
|
$
|
8,513
|
$
|
10,627
|
$
|
12,676
|
||||||||||
|
Provision for (recovery of) loan losses
|
361
|
(998
|
)
|
(681
|
)
|
1,700
|
3,785
|
|||||||||||||
|
Charge offs:
|
||||||||||||||||||||
|
Commercial:
|
||||||||||||||||||||
|
Commercial mortgage
|
-
|
-
|
-
|
593
|
1,121
|
|||||||||||||||
|
Commercial construction and land development
|
-
|
-
|
24
|
2,651
|
1,959
|
|||||||||||||||
|
Commercial and industrial
|
80
|
95
|
24
|
203
|
953
|
|||||||||||||||
|
Total commercial charge-offs
|
80
|
95
|
48
|
3,447
|
4,033
|
|||||||||||||||
|
Non-commercial:
|
||||||||||||||||||||
|
Residential mortgage
|
131
|
90
|
30
|
224
|
604
|
|||||||||||||||
|
Residential construction and land development
|
-
|
-
|
-
|
24
|
551
|
|||||||||||||||
|
Revolving mortgage
|
54
|
77
|
198
|
56
|
504
|
|||||||||||||||
|
Consumer
|
211
|
242
|
354
|
244
|
442
|
|||||||||||||||
|
Total non-commercial charge-offs
|
396
|
409
|
582
|
548
|
2,101
|
|||||||||||||||
|
Total charge-offs
|
476
|
504
|
630
|
3,995
|
6,134
|
|||||||||||||||
|
Recoveries:
|
||||||||||||||||||||
|
Commercial:
|
||||||||||||||||||||
|
Commercial mortgage
|
120
|
7
|
14
|
2
|
7
|
|||||||||||||||
|
Commercial construction and land development
|
100
|
-
|
-
|
8
|
1
|
|||||||||||||||
|
Commercial and industrial
|
4
|
17
|
33
|
11
|
86
|
|||||||||||||||
|
Total commercial recoveries
|
224
|
24
|
47
|
21
|
94
|
|||||||||||||||
|
Non-commercial:
|
||||||||||||||||||||
|
Residential mortgage
|
1
|
36
|
-
|
66
|
37
|
|||||||||||||||
|
Residential construction and land development
|
19
|
-
|
-
|
-
|
-
|
|||||||||||||||
|
Revolving mortgage
|
139
|
3
|
6
|
6
|
69
|
|||||||||||||||
|
Consumer
|
72
|
81
|
52
|
88
|
100
|
|||||||||||||||
|
Total non-commercial recoveries
|
231
|
120
|
58
|
160
|
206
|
|||||||||||||||
|
Total recoveries
|
455
|
144
|
105
|
181
|
300
|
|||||||||||||||
|
Net charge-offs
|
21
|
360
|
525
|
3,814
|
5,834
|
|||||||||||||||
|
Balance at end of period
|
$
|
6,289
|
$
|
5,949
|
$
|
7,307
|
$
|
8,513
|
$
|
10,627
|
||||||||||
|
At Or For The Years Ended December 31,
|
||||||||||||||||||||
|
(Dollars in thousands)
|
2015
|
2014
|
2013
|
2012
|
2011
|
|||||||||||||||
|
Allowance for loan losses to nonperforming loans
|
246.82
|
%
|
221.32
|
%
|
610.44
|
%
|
739.62
|
%
|
51.53
|
%
|
||||||||||
|
Allowance for loan losses to total loans outstanding at the end of the period
|
1.09
|
%
|
1.14
|
%
|
1.63
|
%
|
2.20
|
%
|
2.45
|
%
|
||||||||||
|
Net charge-offs to average loans outstanding during the period
|
0.00
|
%
|
0.08
|
%
|
0.12
|
%
|
0.91
|
%
|
1.24
|
%
|
||||||||||
Liquidity Management. Liquidity is the ability to meet current and future financial obligations of a short-term nature. Our primary sources of funds consist of deposit inflows, loan repayments, maturities and sales of investment securities and borrowings from the FHLB of Atlanta. While maturities and scheduled amortization of loans and securities are predictable sources of funds, deposit flows and mortgage prepayments are greatly influenced by general interest rates, economic conditions and competition.
We regularly adjust our investments in liquid assets based upon our assessment of (i) expected loan demand, (ii) expected deposit flows, (iii) yields available on securities and interest-earning deposits we place with other banks; and (iv) the objectives of our asset-liability management policy.
Our most liquid assets are cash and cash equivalents and interest-bearing deposits. The level of these assets depends on our operating, financing, lending and investing activities during any given period. At December 31, 2015, cash and cash equivalents totaled $33.4 million, including $23.8 million in interest-bearing deposits in other banks, of which $19.2 million was on deposit with the Federal Reserve Bank. Investment securities totaling $137.6 million classified as available-for-sale also provided an additional source of liquidity at December 31, 2015. In addition, at December 31, 2015, we had the ability to borrow a total of approximately $77.9 million from the FHLB of Atlanta and approximately $13.8 million from the Federal Reserve Bank’s discount window. At December 31, 2015, we had $50.0 million in FHLB advances outstanding and $6.0 million in letters of credit to secure public funds deposits.
A significant use of our liquidity is the funding of loan originations. At December 31, 2015, we had $171.3 million in commitments to extend credit outstanding. Certificates of deposit due within one year of December 31, 2015 totaled $76.2 million, or 56.3% of certificates of deposit. We believe the large percentage of certificates of deposit that mature within one year reflects customers’ hesitancy to invest their funds for long periods due to the recent low interest rate environment and local competitive pressure. If these maturing deposits do not remain with us, we will be required to seek other sources of funding, including other certificates of deposit and borrowings. Depending on market conditions, we may be required to pay higher rates on such deposits or other borrowings than we currently pay on the certificates of deposit due within one year of December 31, 2015. Based on past experience, we believe that a significant portion of our certificates of deposit will remain with us. We believe we have the ability to attract and retain deposits by adjusting the interest rates offered.
In addition, we believe that our branch network, which is presently comprised of 13 full-service branch offices located throughout our primary market area, our loan production office in Mecklenburg County, North Carolina and the general cash flows from our existing lending and investment activities will afford us sufficient long-term liquidity.
The following tables present our contractual obligations as of the dates indicated.
|
Payments Due By Period
|
||||||||||||||||||||
|
(Dollars in thousands)
|
Total
|
Less Than
One Year
|
One To
Three Years
|
Three To
Five Years
|
More Than
Five Years
|
|||||||||||||||
|
At December 31, 2015
|
||||||||||||||||||||
|
Long-term debt obligations
|
$
|
50,000
|
$
|
-
|
$
|
50,000
|
$
|
-
|
$
|
-
|
||||||||||
|
Operating lease obligations
|
1,074
|
362
|
222
|
121
|
369
|
|||||||||||||||
|
Total
|
$
|
51,074
|
$
|
362
|
$
|
50,222
|
$
|
121
|
$
|
369
|
||||||||||
|
At December 31, 2014
|
||||||||||||||||||||
|
Long-term debt obligations
|
$
|
50,000
|
$
|
-
|
$
|
40,000
|
$
|
10,000
|
$
|
-
|
||||||||||
|
Operating lease obligations
|
1,436
|
362
|
523
|
121
|
430
|
|||||||||||||||
|
Total
|
$
|
51,436
|
$
|
362
|
$
|
40,523
|
$
|
10,121
|
$
|
430
|
||||||||||
Capital Management. We are subject to various regulatory capital requirements administered by the FDIC and the NCCoB, including a risk-based capital measure. The risk-based capital guidelines include both a definition of capital and a framework for calculating risk-weighted assets by assigning balance sheet assets and off-balance sheet items to broad risk categories. At December 31, 2015, we exceeded all of our regulatory capital requirements and were considered “well capitalized” under regulatory guidelines.
We strive to manage our capital for maximum shareholder benefit. The capital from our stock offering significantly increased our liquidity and capital resources. Over time, the initial level of liquidity was reduced as net proceeds from the stock offering were used for general corporate purposes, including the funding of lending activities. Our financial condition and results of operations were enhanced by the capital from the offering, resulting over time in increased net interest-earning assets and net income. However, the large increase in equity resulting from the capital raised in the conversion offering had an adverse impact on our return on equity. To help us better manage our capital, we repurchased shares of our common stock and may consider other capital deployment measures as regulations permit.
The Company had the following actual and required regulatory capital amounts as of the periods indicated:
|
Regulatory Requirements
|
||||||||||||||||||||||||
|
Actual
|
Minimum For Capital
Adequacy Purposes
|
Minimum To Be
Well Capitalized
|
||||||||||||||||||||||
|
(Dollars in thousands)
|
Amount
|
Ratio
|
Amount
|
Ratio
|
Amount
|
Ratio
|
||||||||||||||||||
|
ASB Bancorp, Inc. (1)
|
||||||||||||||||||||||||
|
December 31, 2015
|
||||||||||||||||||||||||
|
Common Equity
|
||||||||||||||||||||||||
|
Tier I capital
|
$
|
94,743
|
16.66
|
%
|
$
|
25,587
|
4.50
|
%
|
$
|
36,960
|
6.50
|
%
|
||||||||||||
|
Tier I leverage capital
|
94,743
|
11.87
|
%
|
31,935
|
4.00
|
%
|
39,919
|
5.00
|
%
|
|||||||||||||||
|
Tier I risk-based capital
|
94,743
|
16.66
|
%
|
34,117
|
6.00
|
%
|
45,489
|
8.00
|
%
|
|||||||||||||||
|
Total risk-based capital
|
101,032
|
17.77
|
%
|
45,489
|
8.00
|
%
|
56,861
|
10.00
|
%
|
|||||||||||||||
|
December 31, 2014
|
||||||||||||||||||||||||
| Common Equity | ||||||||||||||||||||||||
|
Tier I capital
|
n/a
|
|
n/a
|
|
n/a
|
|
n/a
|
|
n/a
|
|
n/a
|
|
||||||||||||
|
Tier I leverage capital
|
$
|
100,199
|
13.17
|
%
|
$
|
30,442
|
4.00
|
%
|
$
|
38,052
|
5.00
|
%
|
||||||||||||
|
Tier I risk-based capital
|
100,199
|
19.83
|
%
|
20,210
|
4.00
|
%
|
30,315
|
6.00
|
%
|
|||||||||||||||
|
Total risk-based capital
|
106,149
|
21.01
|
%
|
40,420
|
8.00
|
%
|
50,525
|
10.00
|
%
|
|||||||||||||||
|
(1)
|
Regulatory capital ratios are based on BASEL III capital standards for 2015 and BASEL I capital standards for 2014.
|
The Bank had the following actual and required regulatory capital amounts as of the periods indicated:
|
Regulatory Requirements
|
||||||||||||||||||||||||
|
Actual
|
Minimum For Capital
Adequacy Purposes
|
Minimum To Be
Well Capitalized
|
||||||||||||||||||||||
|
(Dollars in thousands)
|
Amount
|
Ratio
|
Amount
|
Ratio
|
Amount
|
Ratio
|
||||||||||||||||||
|
Asheville Savings Bank, S.S.B. (1)
|
||||||||||||||||||||||||
|
December 31, 2015
|
||||||||||||||||||||||||
| Common Equity | ||||||||||||||||||||||||
|
Tier I capital
|
$
|
89,183
|
15.70
|
%
|
$
|
25,563
|
4.50
|
%
|
$
|
36,925
|
6.50
|
%
|
||||||||||||
|
Tier I leverage capital
|
89,183
|
11.20
|
%
|
31,848
|
4.00
|
%
|
39,810
|
5.00
|
%
|
|||||||||||||||
|
Tier I risk-based capital
|
89,183
|
15.70
|
%
|
34,084
|
6.00
|
%
|
45,446
|
8.00
|
%
|
|||||||||||||||
|
Total risk-based capital
|
95,472
|
16.81
|
%
|
45,446
|
8.00
|
%
|
56,807
|
10.00
|
%
|
|||||||||||||||
|
NC Savings Bank capital
|
95,472
|
12.21
|
%
|
39,087
|
5.00
|
%
|
n/a
|
|
n/a
|
|
||||||||||||||
|
December 31, 2014
|
||||||||||||||||||||||||
| Common Equity | ||||||||||||||||||||||||
|
Tier I capital
|
n/a
|
|
n/a
|
|
n/a
|
|
n/a
|
|
n/a
|
|
n/a
|
|
||||||||||||
|
Tier I leverage capital
|
$
|
93,044
|
12.26
|
%
|
$
|
30,353
|
4.00
|
%
|
$
|
37,942
|
5.00
|
%
|
||||||||||||
|
Tier I risk-based capital
|
93,044
|
18.43
|
%
|
20,195
|
4.00
|
%
|
30,293
|
6.00
|
%
|
|||||||||||||||
|
Total risk-based capital
|
98,994
|
19.61
|
%
|
40,390
|
8.00
|
%
|
50,488
|
10.00
|
%
|
|||||||||||||||
|
NC Savings Bank capital
|
98,994
|
13.07
|
%
|
37,870
|
5.00
|
%
|
n/a
|
|
n/a
|
|
||||||||||||||
|
(1)
|
Regulatory capital ratios are based on BASEL III capital standards for 2015 and BASEL I capital standards for 2014.
|
A reconciliation of equity under GAAP and regulatory capital amounts follows:
|
ASB Bancorp, Inc.
December 31,
|
Asheville Savings Bank, S.S.B.
December 31,
|
|||||||||||||||
|
(Dollars in thousands)
|
2015
|
2014
|
2015
|
2014
|
||||||||||||
|
Total GAAP equity
|
$
|
89,682
|
$
|
94,397
|
$
|
84,122
|
$
|
87,242
|
||||||||
|
Accumulated other comprehensive income, net of tax
|
5,061
|
5,802
|
5,061
|
5,802
|
||||||||||||
|
Tier I capital
|
94,743
|
100,199
|
89,183
|
93,044
|
||||||||||||
|
Unrealized gains on available for sale equity securities
|
-
|
1
|
-
|
1
|
||||||||||||
|
Allowable portion of allowance for loan losses
|
6,289
|
5,949
|
6,289
|
5,949
|
||||||||||||
|
Total risk-based capital
|
$
|
101,032
|
$
|
106,149
|
95,472
|
98,994
|
||||||||||
|
Disallowed portion of allowance for loan losses
|
n/a
|
|
n/a
|
|
-
|
-
|
||||||||||
|
NC Savings Bank capital
|
n/a
|
|
n/a
|
|
$
|
95,472
|
$
|
98,994
|
||||||||
The Bank subsidiary paid $8.5 million and $5.0 million in dividends to the Company in the years ended December 31, 2015 and 2014, respectively.
As further described under “Regulation and Supervision – Basel Capital Standards,” in July 2013, the federal bank regulatory agencies issued new regulatory capital rules that impose higher minimum capital requirements for bank holding companies and banks. The rules became effective on January 1, 2015 and apply to all national and state banks and savings associations regardless of size and bank holding companies and savings and loan holding companies with more than $1.0 billion in total consolidated assets. It is management’s belief that, as of December 31, 2015, the Company and the Bank would have met all capital adequacy requirements under new capital rules on a fully phased-in basis if such requirements were effective at that time.
Off-Balance Sheet Arrangements. In the normal course of operations, we engage in a variety of financial transactions that, in accordance with generally accepted accounting principles, are not recorded in our financial statements. These transactions involve, to varying degrees, elements of credit, interest rate and liquidity risk. Such transactions are used primarily to manage customers’ requests for funding and take the form of loan commitments, unused lines of credit and letters of credit.
For the years ended December 31, 2015 and 2014, we did not engage in any off-balance sheet transactions reasonably likely to have a material effect on our financial condition, results of operations or cash flows.
Interest Rate Risk Management. We manage the interest rate sensitivity of our interest-bearing liabilities and interest-earning assets in an effort to minimize the adverse effects of changes in the interest rate environment. Deposit accounts typically react more quickly to changes in market interest rates than mortgage loans because of the shorter maturities of deposits. As a result, sharp increases in interest rates may adversely affect our earnings while decreases in interest rates may beneficially affect our earnings. To reduce the potential volatility of our earnings, we have sought to improve the match between asset and liability maturities and rates, while maintaining an acceptable interest rate spread. Our strategy for managing interest rate risk emphasizes: adjusting the maturities of borrowings; adjusting the investment portfolio mix and duration; and, generally selling in the secondary market substantially all newly originated fixed rate one-to-four family residential real estate loans. We currently do not participate in hedging programs, interest rate swaps or other activities involving the use of derivative financial instruments.
We have an Asset-Liability Management Committee, which includes our Chairman of the Board and an additional Director, both of whom are Independent Directors, and members of Senior Management to communicate, coordinate and control all aspects involving asset-liability management. The Committee meets quarterly to establish and monitor the volume, maturities, pricing and mix of assets and funding sources with the objective of managing assets and funding sources to provide results that are consistent with liquidity, growth, risk limits and profitability goals.
Our goal is to manage asset and liability positions to moderate the effects of interest rate fluctuations on net interest and net income.
Interest Rate Risk Analysis. Our profitability depends to a large extent on our net interest income, which is the difference between interest income from loans and investments and interest expense on deposits and borrowings. Like most financial institutions, our interest income and interest expense are significantly affected by changes in market interest rates and other economic factors beyond our control. Our interest-earning assets consist of fixed and floating rate loans and investment securities that generally adjust more slowly to changes in interest rates than our interest-bearing liabilities, which are primarily nonmaturity deposits. Accordingly, our earnings are usually adversely affected during periods of rising interest rates and positively impacted during periods of declining interest rates. The recent periods of sustained historically low interest rates have also reduced our net interest margins as we could not lower our cost of interest-bearing liabilities commensurate with the reductions in the yields on our interest-earning assets.
We implement an interest rate risk simulation model to determine our possible adverse exposure to net interest income and economic value of equity due to changes in interest rates, repricing risk, yield curve risk and basis risk. Our internal simulation model evaluates our projected future net interest income and economic value of equity under various interest rate scenarios and applies certain contractual and behavioral assumptions to calculate results in an increasing rate scenario, in a decreasing rate scenario and in a constant rate scenario. The major assumptions applied to our internal simulation model include, but are not limited to, the present value discounting method, calculated and reported rate shock and rate ramp scenarios, key rates, curves and spreads, internal rate restrictions (such as rate floors and caps and teaser rates), prepay and decay tables and interest rate exposure limits.
Based on the results of our internal simulation model, which management believes accurately reflects the extraordinary stress currently existing in the financial markets with respect to potential margin compression resulting from our difficulty in reducing our costs of funds further in the current competitive pricing environment, our earnings may be adversely affected if interest rates were to further decline. Such a decline could result from, among other things, the Federal Reserve Board’s purchase of government securities and/or mortgage-backed securities in an effort to further stimulate the national economy. Although the current rate environment remains stable, we continue to carefully monitor, through our Asset/Liability Committee management process, the competitive landscape related to interest rates as well as various economic indicators in order to best position ourselves with respect to changing interest rates.
The following table reflects the estimated effects of changes in interest rates on the present value of our equity and on our projected net interest income over the next twelve months.
Rate Sensitivity Summary
|
As Of December 31, 2015
|
Over The Next Twelve Months
Ending December 31, 2016
|
||||||||||||||||||||||||
|
Present Value Of Equity
|
Projected Net Interest Income
|
||||||||||||||||||||||||
|
(Dollars in thousands)
|
Market
Value
|
$ Change
|
% Change
|
Net Interest
Income
|
$ Change
|
% Change
|
|||||||||||||||||||
|
Change In Rates (In Basis Points “BP”):
|
|||||||||||||||||||||||||
|
300 BP
|
$
|
93,957
|
$
|
(25,967
|
)
|
-21.65
|
%
|
$
|
22,733
|
$
|
(484
|
)
|
-2.08
|
%
|
|||||||||||
|
200
|
102,556
|
(17,368
|
)
|
-14.48
|
%
|
22,536
|
(681
|
)
|
-2.93
|
%
|
|||||||||||||||
|
100
|
111,662
|
(8,262
|
)
|
-6.89
|
%
|
22,861
|
(356
|
)
|
-1.53
|
%
|
|||||||||||||||
|
0
|
119,924
|
-
|
0.00
|
%
|
23,217
|
-
|
0.00
|
%
|
|||||||||||||||||
|
(100)
|
|
118,301
|
(1,623
|
)
|
-1.35
|
%
|
21,447
|
(1,770
|
)
|
-7.62
|
%
|
||||||||||||||
Our balance sheet contains interest-earning assets on which the interest rates adjust or reprice at a slower frequency than the liabilities we use to fund those interest-earning assets. The resulting mismatches can cause compression of our net interest margin during periods of rising interest rates when our ability to increase yields on interest-earning assets is outpaced by the rising cost of our funding liabilities. To mitigate the net interest margin compression resulting from our interest-earning assets, we make adjustable rate loans and fixed rate loans with call dates or maturities of less than ten years. We also invest in both variable and fixed rate investment securities. To mitigate the net interest margin compression resulting from our funding liabilities, we encourage growth of lower cost nonmaturity deposits such as checking, NOW, money market and savings deposits with an emphasis on commercial nonmaturity deposits.

Report of Independent Registered Public Accounting Firm
Board of Directors and Shareholders
ASB Bancorp, Inc. and Subsidiary
We have audited the accompanying consolidated balance sheets of ASB Bancorp, Inc. and Subsidiary (the “Company”) as of December 31, 2015 and 2014, and the related consolidated statements of income, comprehensive income (loss), changes in shareholders’ equity and cash flows for each of the years in the three-year period ended December 31, 2015. These consolidated financial statements are the responsibility of the Company’s management. Our responsibility is to express an opinion on these consolidated financial statements based on our audits.
We conducted our audits in accordance with the standards of the Public Company Accounting Oversight Board (United States). Those standards require that we plan and perform the audit to obtain reasonable assurance about whether the financial statements are free of material misstatement. An audit includes examining, on a test basis, evidence supporting the amounts and disclosures in the financial statements. An audit also includes assessing the accounting principles used and significant estimates made by management, as well as evaluating the overall financial statement presentation. We believe that our audits provide a reasonable basis for our opinion.
In our opinion, the consolidated financial statements referred to above present fairly, in all material respects, the financial position of ASB Bancorp, Inc. and Subsidiary as of December 31, 2015 and 2014, and the results of their operations and their cash flows for each of the years in the three-year period ended December 31, 2015, in conformity with accounting principles generally accepted in the United States of America.
We also have audited, in accordance with the standards of the Public Company Accounting Oversight Board (United States), the Company’s internal control over financial reporting as of December 31, 2015, based on criteria established in Internal Control-Integrated Framework (2013) issued by the Committee of Sponsoring Organizations of the Treadway Commission, and our report dated March 14, 2016 expressed an unqualified opinion on the effectiveness of the Company’s internal control over financial reporting.
|
/s/ DIXON HUGHES GOODMAN LLP
|
|
|
Atlanta, Georgia
|
|
|
March 14, 2016
|
ASB BANCORP, INC. AND SUBSIDIARY
CONSOLIDATED BALANCE SHEETS
|
December 31,
|
||||||||
|
(Dollars in thousands, except par values)
|
2015
|
2014
|
||||||
|
Assets
|
||||||||
|
Cash and due from banks
|
$
|
9,563
|
$
|
9,045
|
||||
|
Interest-earning deposits with banks
|
23,838
|
47,813
|
||||||
|
Total cash and cash equivalents
|
33,401
|
56,858
|
||||||
|
Securities available for sale (amortized cost of $137,137 at December 31, 2015 and $141,266 at December 31, 2014)
|
137,555
|
141,462
|
||||||
|
Securities held to maturity (estimated fair value of $4,086 at December 31, 2015 and $4,363 at December 31, 2014)
|
3,809
|
3,999
|
||||||
|
Investment in Federal Home Loan Bank stock, at cost
|
2,807
|
2,902
|
||||||
|
Loans held for sale
|
7,018
|
5,237
|
||||||
|
Loans receivable (net of deferred loan fees of $476 at December 31, 2015 and $706 at December 31, 2014)
|
576,087
|
521,820
|
||||||
|
Allowance for loan losses
|
(6,289
|
)
|
(5,949
|
)
|
||||
|
Loans receivable, net
|
569,798
|
515,871
|
||||||
|
Premises and equipment, net
|
11,616
|
11,932
|
||||||
|
Foreclosed real estate
|
5,646
|
8,814
|
||||||
|
Deferred income tax assets, net
|
4,716
|
5,588
|
||||||
|
Other assets
|
6,487
|
7,377
|
||||||
|
Total assets
|
$
|
782,853
|
$
|
760,040
|
||||
|
Liabilities and Shareholders’ Equity
|
||||||||
|
Liabilities
|
||||||||
|
Noninterest-bearing deposits
|
$
|
113,745
|
$
|
97,450
|
||||
|
Interest-bearing deposits
|
517,159
|
505,929
|
||||||
|
Total deposits
|
630,904
|
603,379
|
||||||
|
Overnight and short-term borrowings
|
327
|
660
|
||||||
|
Federal Home Loan Bank advances
|
50,000
|
50,000
|
||||||
|
Accounts payable and other liabilities
|
11,940
|
11,604
|
||||||
|
Total liabilities
|
693,171
|
665,643
|
||||||
|
Commitments and contingencies (Note 12)
|
||||||||
|
Shareholders’ Equity
|
||||||||
|
Preferred stock, $0.01 par value; 10,000,000 shares authorized; none issued
|
-
|
-
|
||||||
|
Common stock, $0.01 par value; 60,000,000 shares authorized; 3,985,475 shares issued at December 31, 2015 and 4,378,411 shares issued at December 31, 2014
|
40
|
44
|
||||||
|
Additional paid-in capital
|
24,056
|
34,047
|
||||||
|
Retained earnings
|
76,088
|
72,513
|
||||||
|
Accumulated other comprehensive loss, net of tax
|
(5,061
|
)
|
(5,802
|
)
|
||||
|
Unearned Employee Stock Ownership Plan (“ESOP”) shares
|
(3,138
|
)
|
(3,452
|
)
|
||||
|
Unearned equity incentive plan shares
|
(1,960
|
)
|
(2,610
|
)
|
||||
|
Stock-based deferral plan shares
|
(343
|
)
|
(343
|
)
|
||||
|
Total shareholders’ equity
|
89,682
|
94,397
|
||||||
|
Total liabilities and shareholders’ equity
|
$
|
782,853
|
$
|
760,040
|
||||
The accompanying notes are an integral part of these consolidated financial statements.
ASB BANCORP, INC. AND SUBSIDIARY
CONSOLIDATED STATEMENTS OF INCOME
|
Year Ended December 31,
|
||||||||||||
|
(Dollars in thousands, except per share data)
|
2015
|
2014
|
2013
|
|||||||||
|
Interest and dividend income
|
||||||||||||
|
Loans, including fees
|
$
|
22,761
|
$
|
20,518
|
$
|
19,058
|
||||||
|
Securities
|
2,411
|
2,646
|
3,624
|
|||||||||
|
Other earning assets
|
263
|
338
|
270
|
|||||||||
|
Total interest and dividend income
|
25,435
|
23,502
|
22,952
|
|||||||||
|
Interest expense
|
||||||||||||
|
Deposits
|
1,520
|
1,570
|
2,228
|
|||||||||
|
Overnight and short-term borrowings
|
-
|
1
|
1
|
|||||||||
|
Federal Home Loan Bank advances
|
1,965
|
1,965
|
1,965
|
|||||||||
|
Total interest expense
|
3,485
|
3,536
|
4,194
|
|||||||||
|
Net interest income
|
21,950
|
19,966
|
18,758
|
|||||||||
|
Provision for (recovery of) loan losses
|
361
|
(998
|
)
|
(681
|
)
|
|||||||
|
Net interest income after provision for (recovery of) loan losses
|
21,589
|
20,964
|
19,439
|
|||||||||
|
Noninterest income
|
||||||||||||
|
Mortgage banking income
|
1,763
|
918
|
1,885
|
|||||||||
|
Deposit and other service charge income
|
2,598
|
2,488
|
2,620
|
|||||||||
|
Income from debit card services
|
1,781
|
1,640
|
1,530
|
|||||||||
|
Gain on sale of investment securities
|
575
|
211
|
870
|
|||||||||
|
Other noninterest income
|
792
|
1,076
|
1,129
|
|||||||||
|
Total noninterest income
|
7,509
|
6,333
|
8,034
|
|||||||||
|
Noninterest expenses
|
||||||||||||
|
Salaries and employee benefits
|
13,510
|
13,041
|
12,646
|
|||||||||
|
Occupancy expense, net
|
1,781
|
1,900
|
2,068
|
|||||||||
|
Foreclosed property expenses
|
239
|
498
|
2,339
|
|||||||||
|
Data processing fees
|
2,444
|
2,354
|
2,673
|
|||||||||
|
Federal deposit insurance premiums
|
504
|
524
|
601
|
|||||||||
|
Advertising
|
537
|
614
|
686
|
|||||||||
|
Professional and outside services
|
1,066
|
1,207
|
883
|
|||||||||
|
Other noninterest expenses
|
3,459
|
3,410
|
3,498
|
|||||||||
|
Total noninterest expenses
|
23,540
|
23,548
|
25,394
|
|||||||||
|
Income before income tax provision
|
5,558
|
3,749
|
2,079
|
|||||||||
|
Income tax provision
|
1,983
|
1,260
|
625
|
|||||||||
|
Net income
|
$
|
3,575
|
$
|
2,489
|
$
|
1,454
|
||||||
|
Net income per common share – Basic
|
$
|
0.92
|
$
|
0.60
|
$
|
0.31
|
||||||
|
Net income per common share – Diluted
|
$
|
0.89
|
$
|
0.59
|
$
|
0.31
|
||||||
The accompanying notes are an integral part of these consolidated financial statements.
ASB BANCORP, INC. AND SUBSIDIARY
CONSOLIDATED STATEMENTS OF COMPREHENSIVE INCOME (LOSS)
|
Year Ended December 31,
|
||||||||||||
|
(Dollars in thousands)
|
2015
|
2014
|
2013
|
|||||||||
|
Comprehensive Income (Loss)
|
||||||||||||
|
Net income
|
$
|
3,575
|
$
|
2,489
|
$
|
1,454
|
||||||
|
Other comprehensive income (loss):
|
||||||||||||
|
Unrealized holding gains (losses) on securities available for sale:
|
||||||||||||
|
Reclassification of securities gains recognized in net income
|
(575
|
)
|
(211
|
)
|
(870
|
)
|
||||||
|
Deferred income tax benefit
|
214
|
79
|
327
|
|||||||||
|
Gains (losses) arising during the period
|
797
|
5,139
|
(6,993
|
)
|
||||||||
|
Deferred income tax benefit (expense)
|
(295
|
)
|
(1,931
|
)
|
2,705
|
|||||||
|
Unrealized holding gains (losses) adjustment, net of tax
|
141
|
3,076
|
(4,831
|
)
|
||||||||
|
Defined Benefit Pension Plans:
|
||||||||||||
|
Net periodic pension cost
|
(799
|
)
|
(565
|
)
|
(199
|
)
|
||||||
|
Net pension gain (loss)
|
1,843
|
(1,799
|
)
|
1,161
|
||||||||
|
Deferred income tax benefit (expense)
|
(444
|
)
|
859
|
(437
|
)
|
|||||||
|
Defined benefit pension plan adjustment, net of tax
|
600
|
(1,505
|
)
|
525
|
||||||||
|
Total other comprehensive income (loss)
|
741
|
1,571
|
(4,306
|
)
|
||||||||
|
Comprehensive income (loss)
|
$
|
4,316
|
$
|
4,060
|
$
|
(2,852
|
)
|
|||||
The accompanying notes are an integral part of these consolidated financial statements.
ASB BANCORP, INC. AND SUBSIDIARY
CONSOLIDATED STATEMENT OF CHANGES IN SHAREOLDERS’ EQUITY
|
Year Ended December 31,
|
||||||||||||
|
(Dollars in thousands)
|
2015
|
2014
|
2013
|
|||||||||
|
Common stock
|
||||||||||||
|
Beginning of year
|
$
|
44
|
$
|
50
|
$
|
56
|
||||||
|
Repurchase of common stock
|
(4
|
)
|
(6
|
)
|
(6
|
)
|
||||||
|
End of year
|
$
|
40
|
$
|
44
|
$
|
50
|
||||||
|
Additional paid-in capital
|
||||||||||||
|
Beginning of year
|
$
|
34,047
|
$
|
46,097
|
$
|
53,994
|
||||||
|
Issuance of common stock
|
722
|
25
|
-
|
|||||||||
|
Repurchase of common stock
|
(11,571
|
)
|
(12,896
|
)
|
(9,138
|
)
|
||||||
|
ESOP shares allocated
|
368
|
283
|
215
|
|||||||||
|
Stock-based compensation expense
|
1,082
|
1,484
|
1,026
|
|||||||||
|
Vesting of restricted stock
|
(650
|
)
|
(991
|
)
|
-
|
|||||||
|
Tax benefit from exercise/vesting of stock awards
|
58
|
45
|
-
|
|||||||||
|
End of year
|
$
|
24,056
|
$
|
34,047
|
$
|
46,097
|
||||||
|
Retained earnings
|
||||||||||||
|
Beginning of year
|
$
|
72,513
|
$
|
70,024
|
$
|
68,570
|
||||||
|
Net income
|
3,575
|
2,489
|
1,454
|
|||||||||
|
End of year
|
$
|
76,088
|
$
|
72,513
|
$
|
70,024
|
||||||
|
Accumulated other comprehensive income (loss), net of tax
|
||||||||||||
|
Beginning of year
|
$
|
(5,802
|
)
|
$
|
(7,373
|
)
|
$
|
(3,067
|
)
|
|||
|
Other comprehensive income (loss)
|
741
|
1,571
|
(4,306
|
)
|
||||||||
|
End of year
|
$
|
(5,061
|
)
|
$
|
(5,802
|
)
|
$
|
(7,373
|
)
|
|||
|
Unearned ESOP shares
|
||||||||||||
|
Beginning of year
|
$
|
(3,452
|
)
|
$
|
(3,766
|
)
|
$
|
(4,080
|
)
|
|||
|
ESOP shares allocated
|
314
|
314
|
314
|
|||||||||
|
End of year
|
$
|
(3,138
|
)
|
$
|
(3,452
|
)
|
$
|
(3,766
|
)
|
|||
|
Unearned equity incentive plan shares
|
||||||||||||
|
Beginning of year
|
$
|
(2,610
|
)
|
$
|
(3,601
|
)
|
$
|
(3,601
|
)
|
|||
|
Vesting of restricted stock
|
650
|
991
|
-
|
|||||||||
|
End of year
|
$
|
(1,960
|
)
|
$
|
(2,610
|
)
|
$
|
(3,601
|
)
|
|||
|
Stock-based deferral plan shares
|
||||||||||||
|
Beginning of year
|
$
|
(343
|
)
|
$
|
(343
|
)
|
$
|
(343
|
)
|
|||
|
End of year
|
$
|
(343
|
)
|
$
|
(343
|
)
|
$
|
(343
|
)
|
|||
|
Total shareholders’ equity
|
||||||||||||
|
Beginning of year
|
$
|
94,397
|
$
|
101,088
|
$
|
111,529
|
||||||
|
Issuance of common stock
|
722
|
25
|
-
|
|||||||||
|
Repurchase of common stock
|
(11,575
|
)
|
(12,902
|
)
|
(9,144
|
)
|
||||||
|
Net income
|
3,575
|
2,489
|
1,454
|
|||||||||
|
Other comprehensive income (loss)
|
741
|
1,571
|
(4,306
|
)
|
||||||||
|
ESOP shares allocated
|
682
|
597
|
529
|
|||||||||
|
Stock-based compensation expense
|
1,082
|
1,484
|
1,026
|
|||||||||
|
Tax benefit from exercise/vesting of stock awards
|
58
|
45
|
-
|
|||||||||
|
End of year
|
$
|
89,682
|
$
|
94,397
|
$
|
101,088
|
||||||
The accompanying notes are an integral part of these consolidated financial statements.
ASB BANCORP, INC. AND SUBSIDIARY
CONSOLIDATED STATEMENTS OF CASH FLOWS
|
Year Ended December 31,
|
||||||||||||
|
(Dollars in thousands)
|
2015
|
2014
|
2013
|
|||||||||
|
Operating Activities
|
||||||||||||
|
Net income
|
$
|
3,575
|
$
|
2,489
|
$
|
1,454
|
||||||
|
Adjustments to reconcile net income to net cash provided by operating activities:
|
||||||||||||
|
Provision for (recovery of) loan losses
|
361
|
(998
|
)
|
(681
|
)
|
|||||||
|
Valuation adjustments of foreclosed real estate
|
9
|
150
|
1,846
|
|||||||||
|
Depreciation
|
816
|
914
|
1,072
|
|||||||||
|
Loss (gain) on sale of fixed and other assets
|
(25
|
)
|
(4
|
)
|
1
|
|||||||
|
Loss (gain) on sale of foreclosed real estate
|
33
|
(57
|
)
|
(330
|
)
|
|||||||
|
Deferred income tax expense
|
347
|
1,160
|
304
|
|||||||||
|
Net amortization of premiums on securities
|
2,649
|
3,303
|
5,248
|
|||||||||
|
Gain on sale of investment securities
|
(575
|
)
|
(211
|
)
|
(870
|
)
|
||||||
|
Net accretion of deferred fees on loans
|
(55
|
)
|
(120
|
)
|
(128
|
)
|
||||||
|
Mortgage loans originated for sale
|
(76,162
|
)
|
(42,833
|
)
|
(98,348
|
)
|
||||||
|
Proceeds from sale of mortgage loans
|
76,144
|
42,655
|
105,849
|
|||||||||
|
Gain on sale of mortgage loans
|
(1,763
|
)
|
(918
|
)
|
(1,884
|
)
|
||||||
|
ESOP compensation expense
|
682
|
597
|
529
|
|||||||||
|
Stock-based compensation expense
|
1,082
|
1,484
|
1,026
|
|||||||||
|
Excess tax benefits from equity awards
|
(58
|
)
|
(45
|
)
|
-
|
|||||||
|
Decrease (increase) in income tax receivable
|
560
|
103
|
(129
|
)
|
||||||||
|
Decrease (increase) in interest receivable
|
(226
|
)
|
297
|
237
|
||||||||
|
Increase (decrease) in interest payable
|
6
|
-
|
(12
|
)
|
||||||||
|
Net change in other assets and liabilities
|
1,988
|
142
|
(126
|
)
|
||||||||
|
Net cash provided by operating activities
|
9,388
|
8,108
|
15,058
|
|||||||||
|
Investing Activities
|
||||||||||||
|
Securities available for sale:
|
||||||||||||
|
Purchases
|
(79,200
|
)
|
(26,494
|
)
|
(65,232
|
)
|
||||||
|
Proceeds from sales
|
69,086
|
55,821
|
86,220
|
|||||||||
|
Proceeds from maturities and/or calls
|
-
|
283
|
1,000
|
|||||||||
|
Principal repayments on mortgage-backed and asset-backed securities
|
12,359
|
16,335
|
40,846
|
|||||||||
|
Redemption of FHLB stock
|
95
|
229
|
298
|
|||||||||
|
Net increase in loans receivable
|
(55,053
|
)
|
(73,107
|
)
|
(62,618
|
)
|
||||||
|
Foreclosed real estate:
|
||||||||||||
|
Capitalized cost
|
-
|
(242
|
)
|
(39
|
)
|
|||||||
|
Net proceeds from sales
|
3,946
|
5,849
|
4,409
|
|||||||||
|
Purchases of premises and equipment
|
(500
|
)
|
(355
|
)
|
(261
|
)
|
||||||
|
Net proceeds from sales of fixed and other assets
|
25
|
6
|
1
|
|||||||||
|
Net cash provided by (used in) investing activities
|
(49,242
|
)
|
(21,675
|
)
|
4,624
|
|||||||
The accompanying notes are an integral part of these consolidated financial statements.
ASB BANCORP, INC. AND SUBSIDIARY
CONSOLIDATED STATEMENTS OF CASH FLOWS (Continued)
|
Year Ended December 31,
|
||||||||||||
|
(Dollars in thousands)
|
2015
|
2014
|
2013
|
|||||||||
|
Financing Activities
|
||||||||||||
|
Net increase (decrease) in deposits
|
$
|
27,525
|
$
|
30,593
|
$
|
(5,513
|
)
|
|||||
|
Net proceeds from (repayments of) repurchase agreements
|
(333
|
)
|
(127
|
)
|
376
|
|||||||
|
Proceeds from the exercise of stock options
|
722
|
25
|
-
|
|||||||||
|
Excess tax benefits from equity awards
|
58
|
45
|
-
|
|||||||||
|
Common stock repurchased
|
(11,575
|
)
|
(12,902
|
)
|
(9,144
|
)
|
||||||
|
Net cash provided by (used in) financing activities
|
16,397
|
17,634
|
(14,281
|
)
|
||||||||
|
Increase (decrease) in cash and cash equivalents
|
(23,457
|
)
|
4,067
|
5,401
|
||||||||
|
Cash and cash equivalents:
|
||||||||||||
|
Beginning of period
|
56,858
|
52,791
|
47,390
|
|||||||||
|
End of period
|
$
|
33,401
|
$
|
56,858
|
$
|
52,791
|
||||||
|
SUPPLEMENTAL DISCLOSURES:
|
||||||||||||
|
Cash paid (received) for:
|
||||||||||||
|
Interest on deposits, advances and other borrowings
|
$
|
3,479
|
$
|
3,536
|
$
|
4,206
|
||||||
|
Income taxes
|
1,075
|
1
|
687
|
|||||||||
|
Non-cash investing and financing transactions:
|
||||||||||||
|
Transfers from loans to foreclosed real estate
|
820
|
281
|
708
|
|||||||||
|
Increase (decrease) in unrealized gains (losses) on securities available for sale
|
222
|
4,928
|
(7,863
|
)
|
||||||||
|
Increase (decrease) in deferred income taxes resulting from other comprehensive income
|
(525
|
)
|
(993
|
)
|
2,595
|
|||||||
|
Increase (decrease) in deferred benefit pension plans
|
1,044
|
(2,364
|
)
|
962
|
||||||||
The accompanying notes are an integral part of these consolidated financial statements.
ASB BANCORP, INC. AND SUBSIDIARY
NOTES TO CONSOLIDATED FINANCIAL STATEMENTS
1. SUMMARY OF SIGNIFICANT ACCOUNTING POLICIES
Organization – ASB Bancorp, Inc. (the “Parent”) was incorporated on May 12, 2011 by Asheville Savings Bank, S.S.B. (the “Bank”) to be the Bank’s holding company upon completion of the Bank’s conversion from the mutual to stock form of organization.
The Bank is headquartered in Asheville, North Carolina and provides mortgage, consumer and commercial banking services primarily in Buncombe, Henderson, McDowell, Transylvania, and Madison counties in North Carolina and a loan production office in Mecklenburg County, North Carolina. The Bank is regulated by the Office of the North Carolina Commissioner of Banks (“NCCoB”) and the Federal Deposit Insurance Corporation (“FDIC”). The Company is regulated by the Board of Governors of the Federal Reserve System (the “FRB”) and the NCCoB.
Principles of Consolidation – The consolidated financial statements include the accounts of the Parent and its wholly owned subsidiary, the Bank (collectively, the “Company”). The Bank has two wholly owned subsidiaries, Appalachian Financial Services, Inc., which has on occasion managed the Bank’s real estate acquired through debt default but is currently inactive, and Wenoca, Inc., which serves as the Bank’s trustee regarding deeds of trust. Both subsidiaries are organized as North Carolina corporations. For purposes of the consolidated financial statements, all significant intercompany accounts and transactions have been eliminated. The accounting and reporting policies of the Company conform to accounting principles generally accepted in the United States of America (“GAAP”).
Use of Estimates – The preparation of financial statements in conformity with GAAP requires management to make estimates and assumptions that affect the reported amounts of assets and liabilities and disclosure of contingent assets and liabilities at the date of the financial statements and the reported amounts of revenues and expenses during the reporting period. Actual results could differ from those estimates.
Cash and Cash Equivalents – Cash equivalents include demand and time deposits (with original maturities of 90 days or less) at other financial institutions and federal funds sold.
Investment Securities – The Company classifies investment securities into three categories. Debt securities that the Company has the positive intent and ability to hold to maturity are classified as “held to maturity securities” and reported at amortized cost. Debt and equity securities that are bought and held principally for the purpose of selling in the near term are classified as “trading securities” and reported at fair value, with unrealized gains and losses included in earnings. Debt securities not classified as either held to maturity securities or trading securities and equity securities not classified as trading securities are classified as “available for sale securities” and reported at fair value, with unrealized gains and losses excluded from earnings and reported as a separate component of equity. The Company classified no securities as trading securities as of December 31, 2015 and December 31, 2014.
Realized gains and losses on sales of investment securities are recognized at the time of sale (“trade date”) based upon the specific identification method.
Interest income includes amortization of purchase premiums and discounts. Realized gains and losses are derived from the amortized cost of the security sold. Declines in the fair value of held to maturity and available for sale debt securities below their cost that are deemed to be other than temporary because of credit risk impairment are reflected in earnings as realized losses. In estimating other-than-temporary impairment losses, management considers, among other issues, (i) the length of time and the extent to which the fair value has been less than cost, (ii) the financial condition and near-term prospects of the issuer, (iii) the intent of the Company to retain its investment in the issuer for a period of time sufficient to allow for any anticipated recovery in fair value, and (iv) whether it is more likely than not that the Company will be required to sell the investment prior to a recovery.
ASB BANCORP, INC. AND SUBSIDIARY
NOTES TO CONSOLIDATED FINANCIAL STATEMENTS
1. SUMMARY OF SIGNIFICANT ACCOUNTING POLICIES (Continued)
Investments Held at Cost – The Bank, as a member of the Federal Home Loan Bank system (the “FHLB”), is required to maintain an investment in capital stock of the FHLB in an amount equal to the greater of 1% of its outstanding home loans or 5% of advances from the FHLB. This investment is carried at cost. Due to the redemption provisions of the FHLB, the Bank estimated that fair value equals cost and that this investment was not impaired at December 31, 2015 and December 31, 2014.
Loans – Loans that management has the intent and ability to hold for the foreseeable future are reported at their outstanding principal balances net of any unearned income, charge-offs, unamortized fees and costs on originated loans. The net amount of nonrefundable loan origination fees and certain direct costs associated with the lending processes are deferred and amortized to interest income over the contractual lives of the loans.
Loan Segments and Classes
The Bank’s portfolio segments and classes within those segments are subject to risks that could have an adverse impact on the credit quality of the loan portfolio. Management has identified the risks described below as significant risks that are generally similar among the loan segments and classes.
Commercial Loan Segment
The Bank’s commercial loans are centrally underwritten based primarily on the customer’s ability to generate the required cash flow to service the debt in accordance with the contractual terms and conditions of the loan agreement. The Bank’s commercial lenders and underwriters work to understand the borrower’s businesses and management experiences. The majority of the Bank’s commercial loans are secured by collateral, so collateral values are important to the transaction. In commercial loan transactions where the principals or other parties provide personal guarantees, the Bank’s commercial lenders and underwriters analyze the relative financial strength and liquidity of each guarantor. Risks that are common to the Bank’s commercial loan classes include general economic conditions, demand for the borrowers’ products and services, the personal circumstances of the principals, and reductions in collateral values.
In addition to these common risks for the Bank’s commercial loans, the various commercial loan classes also have certain risks specific to them.
Commercial Construction and Land Development loans are highly dependent on the supply and demand for commercial real estate in the Bank’s markets as well as the demand for the newly constructed residential homes and lots being developed by the Bank’s commercial loan customers. Prolonged deterioration in demand could result in significant decreases in the underlying collateral values and make repayment of the outstanding loans more difficult for the Bank’s commercial borrowers.
Commercial Mortgage and Commercial and Industrial loans are primarily dependent on the ability of the Bank’s commercial loan customers to achieve business results consistent with those projected at loan origination resulting in cash flow sufficient to service the debt. To the extent that a borrower’s actual business results significantly underperform the original projections, the ability of that borrower to service the Bank’s loan on a basis consistent with the contractual terms may be at risk. While these loans and leases are generally secured by real property, personal property, or business assets such as inventory or accounts receivable, it is possible that the liquidation of the collateral will not fully satisfy the obligation.
ASB BANCORP, INC. AND SUBSIDIARY
NOTES TO CONSOLIDATED FINANCIAL STATEMENTS
1. SUMMARY OF SIGNIFICANT ACCOUNTING POLICIES (Continued)
Non-Commercial Loan Segment
The Bank underwrites its non-commercial loans using automated credit scoring and analysis tools. These credit scoring tools take into account factors such as payment history, credit utilization, length of credit history, types of credit currently in use, and recent credit inquiries. To the extent that the loan is secured by collateral, the value of the collateral is also evaluated. Common risks to each class of non-commercial loans include general economic conditions within the Bank’s markets, such as unemployment and potential declines in collateral values, and the personal circumstances of the borrowers.
In addition to these common risks for the Bank’s non-commercial loans, various non-commercial loan classes may also have certain risks specific to them.
Residential Mortgage and Non-Commercial Construction and Land Development loans are to individuals and are typically secured by one-to-four family residential property, undeveloped land, and partially developed land in anticipation of pending construction of a personal residence. Significant and rapid declines in real estate values can result in residential mortgage loan borrowers having debt levels in excess of the current market value of the collateral. Recent declines in value have led to unprecedented levels of foreclosures and losses within the banking industry. Non-commercial construction and land development loans can experience delays in completion and cost overruns that exceed the borrower’s financial ability to complete the project. Such cost overruns can result in foreclosure of partially completed and unmarketable collateral.
Revolving Mortgage loans are often secured by second liens on residential real estate, thereby making such loans particularly susceptible to declining collateral values. A substantial decline in collateral value could render the Bank’s second lien position to be effectively unsecured. Additional risks include lien perfection inaccuracies and disputes with first lien holders that may further weaken collateral positions. Further, the open-end structure of these loans creates the risk that customers may draw on the lines in excess of the collateral value if there have been significant declines since origination.
Consumer loans are often closed-end whereby the loan is fully disbursed when the loan closes and is repaid according to agreed upon specified dates. Consumer loans include loans secured by personal property such as automobiles, marketable securities, other titled recreational vehicles including boats and motorcycles, as well as unsecured consumer debt. The value of underlying collateral within this class is especially volatile due to potential rapid depreciation in values since date of loan origination in excess of principal repayment.
Credit Quality Indicators
Loans are monitored for credit quality on a recurring basis and the composition of the loans outstanding by credit quality indicator is provided below.
Loan credit quality indicators are developed through review of individual borrowers on an ongoing basis, although certain non-commercial loans, including residential mortgage, revolving mortgage and consumer loans, are evaluated upon origination and are reevaluated upon a change in delinquency status. Most commercial loans are evaluated at least annually with more frequent evaluation of more severely criticized loans or leases. The indicators represent the rating for loans as of the date presented based on the most recent assessment performed. These credit quality indicators are defined as follows:
Pass – A pass rated asset is not adversely classified because it does not display any of the characteristics for adverse classification.
ASB BANCORP, INC. AND SUBSIDIARY
NOTES TO CONSOLIDATED FINANCIAL STATEMENTS
1. SUMMARY OF SIGNIFICANT ACCOUNTING POLICIES (Continued)
Special Mention – A special mention asset has potential weaknesses that deserve management’s close attention. If left uncorrected, such potential weaknesses may result in deterioration of the repayment prospects or collateral position at some future date. Special mention assets are not adversely classified and do not warrant adverse classification.
Substandard – A substandard asset is inadequately protected by the current net worth and paying capacity of the obligor and/or the realizable value of the collateral pledged, if any. Assets classified as substandard generally have a well-defined weakness, or weaknesses, that jeopardize the liquidation of the debt. These assets are characterized by the distinct possibility of loss if the deficiencies are not corrected.
Doubtful – An asset classified doubtful has all the weaknesses inherent in an asset classified substandard with the added characteristic that the weaknesses make collection or liquidation in full highly questionable and improbable, on the basis of currently existing facts, conditions, and values.
Loss – Assets classified loss are considered uncollectible and of such little value that their continuing to be carried as an asset is not warranted. This classification is not necessarily equivalent to no potential for recovery or salvage value, but rather that it is not appropriate to defer a full write-off even though partial recovery may be effected in the future.
Loans Held for Sale – Loans held for sale are residential mortgages carried at the lower of cost or market value. The market values of loans held for sale are based on what mortgage buyers are currently offering the Bank on a “best efforts” basis to buy the loans.
Allowance for Loan Losses – The allowance for loan losses is management’s estimate of probable credit losses that are inherent in the Bank’s loan portfolios at the balance sheet date. The allowance increases when the Bank provides for loan losses through charges to operating earnings and when the Bank recovers amounts from loans previously written down or charged off. The allowance decreases when the Bank writes down or charges off loans amounts that are deemed uncollectible.
Management determines the allowance for loan losses based on periodic evaluations that are inherently subjective and require substantial judgment because the evaluations require the use of material estimates that are susceptible to significant change. The Bank generally uses two allowance methodologies that are primarily based on management’s determination as to whether or not a loan is considered to be impaired.
Commercial loans, as well as non-commercial loans that are classified as substandard and secured by real estate, are evaluated for impairment on a loan-by-loan basis and are considered impaired when it is probable, based on current information, that the borrower will be unable to pay contractual interest or principal as required by the loan agreement. Loans that experience insignificant payment delays and payment shortfalls are not necessarily considered impaired. Management determines the significance of payment delays and payment shortfalls on a case-by-case basis, taking into consideration all of the circumstances surrounding the loan and the borrower, including the length of the delay, the reasons for the delay, the borrower’s prior payment history, and the amount of the shortfall relative to the principal and interest owed. Loans that are deemed to be troubled debt restructurings, which are discussed below, are also included as impaired loans. Impaired loans are measured at their estimated fair value based on either the value of the loan’s expected future cash flows discounted at the loan’s effective interest rate or on the collateral value, net of the estimated costs of disposal, if the loan is collateral dependent. For loans considered impaired, an individual allowance for loan losses is recorded when the loan principal balance exceeds the estimated fair value.
ASB BANCORP, INC. AND SUBSIDIARY
NOTES TO CONSOLIDATED FINANCIAL STATEMENTS
1. SUMMARY OF SIGNIFICANT ACCOUNTING POLICIES (Continued)
For loans not considered impaired, management determines the allowance for loan losses based on estimated loss percentages that are determined by and applied to the various classes of loans that comprise the segments of the Bank’s loan portfolio. The estimated loss percentages by loan class are based on a number of factors that include by class (i) average historical losses over the past three years, (ii) levels and trends in delinquencies, impairments, and net charge-offs, (iii) trends in the volume and direction of loan balances within that class, terms, and concentrations, (iv) trends in interest rates, (v) effects of changes in the Bank’s risk tolerance, underwriting standards, lending policies, procedures, and practices, and (vi) national and local business and economic conditions.
Methodology Change – In the second quarter of 2014, the Bank accessed and modified its loan loss methodology for unimpaired commercial construction and land development, unimpaired residential construction and land development, and unimpaired commercial and industrial loans. This modification resulted in further sub-segmentation of these classes of loans and the related historical charge-off rates. The purpose was to allocate the substantial historical charge-off rates created by three sub-segments of these loan classes against the significantly diminished or nonexistent current balances within these same loan sub-segments reflecting no continued credit exposure to the Bank. Specifically, additional sub-segments were identified where the Bank made (i) loans in excess of $2.5 million to construct commercial mixed-use buildings in small communities with low population growth, (ii) speculative loans to construct one-to-four family residences for the greater of 80% of the appraised value of the completed residence or 100% of the actual costs of construction, and (iii) loans secured by equity securities that do not have a readily determinable fair value. This change in methodology resulted in a nonrecurring reduction of approximately $1.3 million in the Bank’s reserves for loans not considered impaired in the second quarter of 2014. The Bank made no changes to its allowance methodology in 2015.
Future material adjustments to the allowance for loan losses may be necessary due to improving or deteriorating economic conditions, delinquencies, charge-off levels or declining collateral values. In addition, regulatory agencies, as an integral part of their examination process, periodically review the Bank’s allowance for loan losses and may require the Bank to make adjustments to the allowance for loan losses based upon judgments that differ significantly from those of management.
Nonperforming Assets – Nonperforming assets can include loans that are past due 90 days or more and continue to accrue interest, loans on which interest is not being accrued, and foreclosed real estate.
Loans Past Due 90 Days or More, Nonaccruing, Impaired, or Restructured – The Bank’s policies related to loans that are placed on nonaccruing status conform to guidelines prescribed by bank regulatory authorities. Generally, the Bank suspends the accrual of interest on loans (i) that are maintained on a cash basis because of the deterioration of the financial condition of the borrower, (ii) for which payment in full of principal or interest is not expected, or (iii) on which principal or interest has been in default for a period of 90 days or more, unless the loan is both well secured and in the process of collection. While a loan is on nonaccruing status, the Bank recognizes interest income only to the extent cash payments are received in excess of collection of the principal outstanding on the loan. Loans are returned to accruing status when all principal and interest amounts contractually due are brought current and concern no longer exists as to the future collectibility of principal and interest, which is generally confirmed when the loan demonstrates performance for six consecutive months or payment cycles.
ASB BANCORP, INC. AND SUBSIDIARY
NOTES TO CONSOLIDATED FINANCIAL STATEMENTS
1. SUMMARY OF SIGNIFICANT ACCOUNTING POLICIES (Continued)
A troubled debt restructuring (“TDR”) occurs when a borrower is experiencing financial difficulty and the Bank grants a concession it would not otherwise consider to provide the borrower relief from one or more of the contractual loan conditions. Concessions that the Bank might consider include the allowance of interest-only payments on more than a temporary basis, the reduction of interest rates, the extension of the loan term, the forgiveness of principal, or a combination of these. The Bank might require additional collateral or additional guarantors as conditions to modifying loans as TDRs.
The Bank might consider modifying both accruing or nonaccruing loans as TDRs. When a modification includes a reduction of principal that resulted from a partial charge off of the loan, the Bank typically accounts for the TDR as a nonaccruing loan.
The Bank classifies TDR’s as impaired loans and evaluates the need for an allowance for loan loss on a loan-by-loan basis consistent with its evaluation of impaired loans that have not been modified as TDRs. An allowance is based on either the present value of expected future cash flows discounted at the loan’s effective interest rate, the loan’s observable market price or the estimated fair value of the underlying collateral less any selling costs, if the loan is deemed to be collateral dependent.
The Bank’s policy for recognition of interest income on loans considered to be impaired, including restructured loans, is the same as its interest income recognition policy for loans not considered to be impaired.
Loan Charge-Offs – The Bank charges off loan balances, in whole or in part, when available, verifiable, and documentable information confirms that specific loans, or portions of specific loans, are uncollectible or unrecoverable. For unsecured loans, losses are confirmed when it can be determined that the borrower, or any guarantor, is unwilling or unable to pay the amounts as agreed. When the borrower, or any guarantors, are unwilling or unable to pay the amounts as agreed on a loan secured by collateral and any recovery is dependent upon the sale of the collateral, the loan is deemed to be collateral dependent. Repayments or recoveries for collateral dependent loans are directly affected by the value of the collateral at liquidation. As such, loan repayment can be affected by factors that influence the amount recoverable, the timing of the recovery, or a combination of the two. Such factors include economic conditions that affect the markets in which the loan or its collateral is sold, bankruptcy, repossession and foreclosure laws, and consumer banking regulations. Losses are also confirmed when the loan, or a portion of the loan, is classified as loss resulting from loan reviews conducted by the Bank.
Charge-offs of loans in the commercial loan segment are recognized when the uncollectibility of the loan balance and the inability to recover sufficient value from the sale of any collateral securing the loan is confirmed. The uncollectibility of the loan balance is evidenced by the inability of the commercial borrower to generate cash flows sufficient to repay the loan as agreed causing the loan to become delinquent. For collateral dependent commercial loans, the Bank determines the fair value of the collateral based on appraisals, current market conditions, and estimated costs to sell the collateral. For collateral dependent commercial loans where the loan balance, including any accrued interest, net deferred fees or costs, and unamortized premiums or discounts, exceeds the fair value of the collateral securing the loan, the deficiency is identified as unrecoverable, is deemed to be a confirmed loss, and is charged off.
ASB BANCORP, INC. AND SUBSIDIARY
NOTES TO CONSOLIDATED FINANCIAL STATEMENTS
1. SUMMARY OF SIGNIFICANT ACCOUNTING POLICIES (Continued)
Charge-offs of loans in the non-commercial loan segment are generally confirmed and recognized in a manner similar to loans in the commercial loan segment. Secured non-commercial loans that are identified as uncollectible and are deemed to be collateral dependent are confirmed as loss to the extent the fair value of the collateral is insufficient to recover the loan balance. Closed-end consumer loans that become 120 cumulative days past due and open-end consumer loans that become 180 cumulative days past due are charged off to the extent that the fair value of any collateral, less estimated costs to sell the collateral, is insufficient to recover the loan balance. Closed-end and open-end loans secured by residential real estate that become 180 days past due are charged off to the extent that the fair value of the residential real estate securing the loan, less estimated costs to sell the collateral, is insufficient to recover the loan balance. Loans determined to be fraudulent are charged off within 90 days of discovery. Loans to borrowers in bankruptcy are subject to modification by the bankruptcy court and are charged off to the extent that the fair value of any collateral securing the loan, less estimated costs to sell the collateral, is insufficient to recover the loan balance, unless the Bank expects repayment is likely to occur. Such loans are charged off within 60 days of the receipt of notification from a bankruptcy court or when the loans become 120 days past due, whichever is shorter.
Foreclosed Real Estate – Foreclosed real estate consists of real estate and other assets acquired as a result of customers’ loan defaults. Foreclosed real estate is stated at the lower of the related loan balance or the fair value of the property net of the estimated costs of disposal with a charge to the allowance for loan losses upon foreclosure. Any write-downs subsequent to foreclosure are charged against operating earnings. To the extent recoverable, costs relating to the development and improvement of property are capitalized, whereas those costs relating to holding the property are charged to expense.
Premises and Equipment – Premises and equipment are stated at cost less accumulated depreciation. Major additions and improvements are capitalized, and repairs which do not improve or extend the life of the respective assets are expensed in the period incurred. Gains and losses on dispositions are reflected in current operations.
Depreciation of premises and equipment is provided over the estimated useful lives of the related assets on the straight-line method for financial statement purposes and on a combination of straight-line and accelerated methods for income tax purposes. Estimated lives are 10 to 40 years for buildings, building components and improvements; 5 to 10 years for furniture, fixtures and equipment; and 3 years for computers.
Long-lived assets are reviewed for impairment whenever events or changes in circumstances indicate that the carrying amount of an asset may not be recoverable. In performing the review for recoverability, the Bank estimates the future cash flows expected to result from the use of the asset and its eventual disposition, and recognizes an impairment loss if the expected future cash flows are less than the carrying amount of the asset.
Deferred Loan Fees – The Bank defers loan origination fees, net of certain direct loan origination costs. Such costs and fees for loans held for investment are recognized as an adjustment to yield over the lives of the related loans utilizing a method of amortization that approximates the level-yield method. When a loan is prepaid or sold, the related unamortized net origination fee is included in income. Net deferred fees for loans held for sale are deferred until the loan is sold and included as part of the gain or loss on the sale.
Commitment fees to originate or purchase loans are deferred and, if the commitment is exercised, recognized over the life of the loan as an adjustment of yield. If the commitment expires unexercised, commitment fees are recognized in income upon expiration of the commitment.
ASB BANCORP, INC. AND SUBSIDIARY
NOTES TO CONSOLIDATED FINANCIAL STATEMENTS
1. SUMMARY OF SIGNIFICANT ACCOUNTING POLICIES (Continued)
Comprehensive Income – Comprehensive income is defined as the change in equity of an enterprise during a period from transactions and other events and circumstances from non-owner sources and, accordingly, includes both net income and amounts referred to as other comprehensive income (“OCI”). The items of other comprehensive income are included in the Consolidated Statements of Comprehensive Income (Loss). The accumulated balance of other comprehensive income is included in the equity section of the Consolidated Balance Sheets. The Company’s components of accumulated other comprehensive income include unrealized gains and/or losses on investment securities classified as available for sale and certain changes in the Company’s benefit obligations under its retirement plans. The Company adjusts the level of accumulated comprehensive income related to its retirement plans on an annual basis, consistent with the receipt of its annual actuarial studies.
The changes in the components of the Company’s accumulated other comprehensive loss, net of income taxes, are presented as follows:
|
(Dollars in thousands)
|
Beginning
Balance
|
OCI Before
Reclassification
|
Amount
Reclassified
|
Net
OCI
|
Ending
Balance
|
|||||||||||||||
|
Year Ended December 31, 2015
|
||||||||||||||||||||
|
Unrealized gain on securities
|
$
|
124
|
$
|
502
|
$
|
(361
|
)
|
$
|
141
|
$
|
265
|
|||||||||
|
Benefit plan liability
|
(5,926
|
)
|
1,101
|
(501
|
)
|
600
|
(5,326
|
)
|
||||||||||||
|
Accumulated other comprehensive income (loss), net of tax
|
$
|
(5,802
|
)
|
$
|
1,603
|
$
|
(862
|
)
|
$
|
741
|
$
|
(5,061
|
)
|
|||||||
|
Year Ended December 31, 2014
|
||||||||||||||||||||
|
Unrealized gain (loss) on securities
|
$
|
(2,952
|
)
|
$
|
3,208
|
$
|
(132
|
)
|
$
|
3,076
|
$
|
124
|
||||||||
|
Benefit plan liability
|
(4,421
|
)
|
(1,143
|
)
|
(362
|
)
|
(1,505
|
)
|
(5,926
|
)
|
||||||||||
|
Accumulated other comprehensive income (loss), net of tax
|
$
|
(7,373
|
)
|
$
|
2,065
|
$
|
(494
|
)
|
$
|
1,571
|
$
|
(5,802
|
)
|
|||||||
|
Year Ended December 31, 2013
|
||||||||||||||||||||
|
Unrealized gain (loss) on securities
|
$
|
1,879
|
$
|
(4,288
|
)
|
$
|
(543
|
)
|
$
|
(4,831
|
)
|
$
|
(2,952
|
)
|
||||||
|
Benefit plan liability
|
(4,946
|
)
|
651
|
(126
|
)
|
525
|
(4,421
|
)
|
||||||||||||
|
Accumulated other comprehensive loss, net of tax
|
$
|
(3,067
|
)
|
$
|
(3,637
|
)
|
$
|
(669
|
)
|
$
|
(4,306
|
)
|
$
|
(7,373
|
)
|
|||||
ASB BANCORP, INC. AND SUBSIDIARY
NOTES TO CONSOLIDATED FINANCIAL STATEMENTS
1. SUMMARY OF SIGNIFICANT ACCOUNTING POLICIES (Continued)
The Company’s reclassifications out of accumulated other comprehensive income are as follows:
|
Details About Accumulated Other
Comprehensive Income Components
|
Amount Reclassified
From Accumulated Other
Comprehensive Income
|
Affected Line Item In The
Statement Where Net
Income Is Presented
|
|||||||||||
|
Year Ended December 31,
|
|||||||||||||
|
(Dollars in thousands)
|
2015
|
2014
|
2013
|
||||||||||
|
Reclassification of securities gains recognized in net income
|
$
|
(575
|
)
|
$
|
(211
|
)
|
$
|
(870
|
)
|
Gain on sale of investment securities
|
|||
|
Deferred income tax expense
|
214
|
79
|
327
|
Income tax provision
|
|||||||||
|
Total reclassifications for the period
|
$
|
(361
|
)
|
$
|
(132
|
)
|
$
|
(543
|
)
|
Net of tax
|
|||
|
Net periodic pension cost
|
$
|
(799
|
)
|
$
|
(565
|
)
|
$
|
(199
|
)
|
Salaries and employee benefits
|
|||
|
Deferred income tax benefit
|
298
|
203
|
73
|
Income tax provision
|
|||||||||
|
Total reclassifications for the period
|
$
|
(501
|
)
|
$
|
(362
|
)
|
$
|
(126
|
)
|
Net of tax
|
|||
Income Taxes – The establishment of provisions for federal and state income taxes is a complex area of accounting, which involves the use of significant judgments and estimates in applying relevant tax statutes. The Company is subject to audit by federal and state tax authorities, the results of which may produce tax liabilities that differ from the Company’s tax estimates and provisions. The Company continually evaluates its exposure to possible tax assessments arising from audits and it records its estimate of possible exposure based on current facts and circumstances. The Parent and the Bank have entered into a formal agreement that will allow them, if so elected, to file consolidated federal and state income tax returns, where permitted, and each to pay its respective share of income taxes due.
Deferred tax assets and liabilities are recognized for the tax effects of differing carrying values of assets and liabilities for tax and financial statement purposes that will reverse in future periods. Deferred tax assets and liabilities are reflected at currently enacted income tax rates applicable to the period in which the deferred tax assets or liabilities are expected to be realized or settled. As changes in tax laws or rates are enacted, deferred tax assets and liabilities are adjusted through the provision for income taxes. When uncertainty exists concerning the recoverability of a deferred tax asset, the carrying value of the asset may be reduced by a valuation allowance. The amount of any valuation allowance established is based upon an estimate of the deferred tax asset that is more likely than not to be recovered. Increases or decreases in the valuation allowance result in increases or decreases to the provision for income taxes.
The Bank’s loss carry forward period under applicable North Carolina income tax laws is 15 years with a remaining loss carry forward period of 12 years. The Bank includes interest and penalties related to income tax liabilities in noninterest expense. The Bank’s tax filings for the years 2012 and thereafter are currently open to audit under statutes of limitations by the Internal Revenue Service and the North Carolina Department of Revenue.
ASB BANCORP, INC. AND SUBSIDIARY
NOTES TO CONSOLIDATED FINANCIAL STATEMENTS
1. SUMMARY OF SIGNIFICANT ACCOUNTING POLICIES (Continued)
Pension Plan – The Bank has qualified and nonqualified defined benefit pension plans. The Bank recognizes the overfunded or underfunded status of the plans as an asset or liability in its consolidated statement of financial position and recognizes changes in the funded status in the year in which the change occurs through comprehensive income. The funded status of a benefit plan is measured as the difference between plan assets at fair value and the benefit obligation. For a pension plan, the benefit obligation is the projected benefit obligation. GAAP also requires an employer to measure the funded status of a plan as of the date of its year-end statement of financial position. GAAP requires additional disclosure in the notes to financial statements about certain effects on net periodic benefit cost for the next fiscal year that arise from delayed recognition of the gains or losses, prior service costs or credits, and transition asset or obligation.
Employee Stock Ownership Plan (“ESOP”) – In connection with the mutual-to-stock conversion on October 11, 2011, the Bank established an ESOP for the benefit of all of its eligible employees. Full-time employees of the Bank who have been credited with at least 1,000 hours of service during a twelve-month period and who have attained age 21 are eligible to participate in the ESOP. Shares allocated under the ESOP vest at the rate of 20% per year of service beginning with the completion of two years of service and fully vest upon the completion of six years of service. The Bank anticipates it will make contributions to the ESOP in amounts necessary to amortize the ESOP loan payable to the Parent over a period of 15 years in accordance with the terms of the loan.
Unallocated ESOP shares are not considered outstanding (including for the calculation of net income per common share as discussed below) and are shown as a reduction of shareholders’ equity. Dividends on unallocated ESOP shares, if paid, are considered to be compensation expense. The Company recognizes compensation cost equal to the fair value of the ESOP shares during the periods in which they are committed to be released. The fair value of the annual share allocations is recorded on a monthly basis with fair value determined by calculating the average closing stock price for each day during the month. To the extent that the fair value of the Company’s ESOP shares differs from the cost of such shares, the difference is recognized in shareholders’ equity. The Company recognizes a tax deduction equal to the cost of the shares released. Because the ESOP is internally leveraged through a loan from the Company to the ESOP, the loan receivable by the Company from the ESOP is not reported as an asset nor is the debt of the ESOP shown as a liability in the consolidated financial statements.
Equity Incentive Plan – The Company issued restricted stock and stock options under the 2012 Equity Incentive Plan to key officers and outside directors during the first quarter of 2013 and to additional key officers and a newly appointed outside director during 2014. There were no grants under the 2012 Equity Incentive Plan during 2015. The Company uses a fair value based method of accounting for employee stock compensation plans, whereby compensation cost is measured based on the fair value of the award as of the grant date and recognized over the vesting period.
Net Income Per Common Share – Where presented, basic net income per common share is the Company’s net income available to common shareholders, which represents net income less dividends paid or payable to preferred stock shareholders, if any, divided by the weighted average number of common shares outstanding during the period. In calculating the weighted average number of common shares outstanding, shares held by the ESOP are not considered to be outstanding until they are committed to be released for allocation and the weighted average of unvested restricted shares are not considered outstanding until the shares vest.
ASB BANCORP, INC. AND SUBSIDIARY
NOTES TO CONSOLIDATED FINANCIAL STATEMENTS
1. SUMMARY OF SIGNIFICANT ACCOUNTING POLICIES (Continued)
For diluted income per common share, net income available to common shareholders is divided by the weighted average number of common shares issued and outstanding for each period plus amounts representing the dilutive effect of stock options and restricted stock, as well as any adjustment to income that would result from the assumed issuance. The effects of restricted stock and stock options are excluded from the computation of diluted income per common share in periods in which the effect would be antidilutive. Potential common shares that might be issued by the Company relate solely to outstanding stock options and restricted stock and are determined using the treasury stock method.
Net income per common share has been computed based on the following:
|
Year Ended December 31,
|
||||||||||||
|
(Dollars in thousands, except per share data)
|
2015
|
2014
|
2013
|
|||||||||
|
Numerator:
|
||||||||||||
|
Net income
|
$
|
3,575
|
$
|
2,489
|
$
|
1,454
|
||||||
|
Denominator:
|
||||||||||||
|
Weighted average common shares outstanding
|
4,339,806
|
4,687,699
|
5,285,766
|
|||||||||
|
Less: Weighted average unvested restricted shares
|
(125,555
|
)
|
(176,046
|
)
|
(201,962
|
)
|
||||||
|
Less: Weighted average unallocated ESOP shares
|
(329,560
|
)
|
(360,947
|
)
|
(392,334
|
)
|
||||||
|
Weighted average common shares used to compute net income per common share – Basic
|
3,884,691
|
4,150,706
|
4,691,470
|
|||||||||
|
Add: Effect of dilutive securities
|
119,694
|
46,983
|
7,527
|
|||||||||
|
Weighted average common shares used to compute net income per common share – Diluted
|
4,004,385
|
4,197,689
|
4,698,997
|
|||||||||
|
Net income per common share – Basic
|
$
|
0.92
|
$
|
0.60
|
$
|
0.31
|
||||||
|
Net income per common share – Diluted
|
$
|
0.89
|
$
|
0.59
|
$
|
0.31
|
||||||
For the year ended December 31, 2015, options to purchase 2,274 shares of common stock were excluded from the computation of net income per common share because their effect would be anti-dilutive, and there were no restricted stock shares excluded from the computation of net income per common share. For the year ended December 31, 2014, options to purchase 7,727 shares of common stock and 273 restricted stock shares were excluded from the computation of net income per common share because their effect would be anti-dilutive. For the year ended December 31, 2013, options to purchase 74,983 shares of common stock were excluded from the computation of net income per common share because their effect would be anti-dilutive, and there were no restricted stock shares excluded from the computation of net income per common share.
ASB BANCORP, INC. AND SUBSIDIARY
NOTES TO CONSOLIDATED FINANCIAL STATEMENTS
1. SUMMARY OF SIGNIFICANT ACCOUNTING POLICIES (Continued)
Recent Accounting Pronouncements
Accounting Standards Update ASU 2014-09 – In May, 2014, the Financial Accounting Standards Board (“FASB”) issued ASU 2014-09, Revenue from Contracts with Customers, which creates FASB Accounting Standards Codification (“FASB ASC”) Topic 606, Revenue Recognition Standard and FASB ASC Topic 610-20, Gains and Losses from the Derecognition of Nonfinancial Assets. The standards updates affect all entities that have contracts with customers, except for certain items, which include leases accounted for under FASB ASC Topic 840, Leases; insurance contracts accounted for under FASB ASC Topic 944, Financial Services – Insurance; and most financial instruments, and guarantees (other than product warranties). The new revenue recognition standard eliminates the transaction- and industry-specific revenue recognition guidance under current GAAP and replaces it with a principle-based approach for determining revenue recognition. Public entities are required to adopt ASU 2014-09 for reporting periods beginning after December 15, 2016, and interim and annual reporting periods thereafter. All entities will be required to apply the standard retrospectively, either using a full retrospective or a modified retrospective approach. Early adoption is not permitted for public entities. The adoption of the new guidance is not expected to have a material impact on the Company’s consolidated financial statements; however, if the Company chooses a full retrospective approach, the adoption will require a restatement for 2015 and 2016 to show comparative financial statements with a cumulative adjustment as of January 1, 2015 to disclose revenue and the direct effects of change in accounting principle.
Accounting Standards Update ASU 2014-11 – In June, 2014, the FASB issued ASU 2014-11, Repurchase-to-Maturity Transactions, Repurchase Financings, and Disclosures. The accounting changes in the ASU were effective for the first interim or annual period beginning after December 15, 2014 for public business entities. Early application for a public business entity was prohibited. Repurchase transactions included in ASU 2014-11 are considered immaterial for the Company’s consolidated financial statements and the guidance in the standard was not adopted by the Company.
Accounting Standards Update ASU 2015-02 – In February, 2015, the FASB issued ASU 2015-02, Amendments to the Consolidation Analysis. The amendments affect business entities that are required to evaluate whether they should consolidate certain legal entities. For public entities, the amendments in ASU 2015-02 are effective for fiscal years, and interim periods within those fiscal years, beginning after December 15, 2015. Early adoption, including adoption in an interim period, is permitted. The Company is currently evaluating this guidance to determine the impact on the Company’s consolidated financial statements.
Accounting Standards Update ASU 2015-03 – In April, 2015, the FASB issued ASU 2015-03, Simplifying the Presentation of Debt Issuance Costs. Under the ASU, an entity presents debt issuance costs in the balance sheet as a direct deduction from the related debt liability rather than as an asset. Amortization of the costs is reported as interest expense. For public entities, the amendments in ASU 2015-03 are effective for fiscal years beginning after December 15, 2015, and interim periods within those fiscal years. Early adoption is permitted for financial statements that have not been previously issued. The Company currently does not have debt issuance costs, and this guidance would not have an impact on the Company’s consolidated financial statements.
ASB BANCORP, INC. AND SUBSIDIARY
NOTES TO CONSOLIDATED FINANCIAL STATEMENTS
1. SUMMARY OF SIGNIFICANT ACCOUNTING POLICIES (Continued)
Accounting Standards Update ASU 2015-15 – In August, 2015, the FASB issued ASU 2015-15, Presentation and Subsequent Measurement of Debt Issuance Costs Associated with Line-of-Credit Arrangements: Amendments to SEC Paragraphs Pursuant to Staff Announcement at June 18, 2015 EITF Meeting, to clarify the SEC staff’s position on presenting and measuring debt issuance costs incurred in connection with line-of-credit arrangements given the lack of guidance on this topic in ASU 2015-03. The SEC staff has announced that it would not object to an entity deferring and presenting debt issuance costs as an asset and subsequently amortizing the deferred debt issuance costs ratably over the term of the line-of-credit arrangement. ASU 2015-15 is effective upon issuance for all entities. The Company currently does not have debt issuance costs, and this guidance would not have an impact on the Company’s consolidated financial statements.
ASB BANCORP, INC. AND SUBSIDIARY
NOTES TO CONSOLIDATED FINANCIAL STATEMENTS
2. INVESTMENT SECURITIES
Securities Available for Sale – The maturities, amortized cost, unrealized gains, unrealized losses and fair values of securities available for sale are as follows:
|
Type And Maturity Group
(Dollars in thousands)
|
Amortized
Cost
|
Unrealized
Gains
|
Unrealized
Losses
|
Fair
Value
|
||||||||||||
|
December 31, 2015
|
||||||||||||||||
|
U.S. Government Sponsored Entity (GSE) and agency securities due -
|
||||||||||||||||
|
After 1 year but within 5 years
|
$
|
2,135
|
$
|
-
|
$
|
(21
|
)
|
$
|
2,114
|
|||||||
|
Asset-backed securities issued by the Small Business Administration (SBA)
|
16,974
|
187
|
(17
|
)
|
17,144
|
|||||||||||
|
Residential mortgage-backed securities issued by GSEs (1)
|
51,726
|
29
|
(807
|
)
|
50,948
|
|||||||||||
|
State and local government securities due -
|
||||||||||||||||
|
After 1 year but within 5 years
|
682
|
4
|
-
|
686
|
||||||||||||
|
After 5 years but within 10 years
|
8,714
|
222
|
-
|
8,936
|
||||||||||||
|
After 10 years
|
56,146
|
835
|
(12
|
)
|
56,969
|
|||||||||||
|
Mutual funds
|
760
|
-
|
(2
|
)
|
758
|
|||||||||||
|
Total
|
$
|
137,137
|
$
|
1,277
|
$
|
(859
|
)
|
$
|
137,555
|
|||||||
|
December 31, 2014
|
||||||||||||||||
|
U.S. Government Sponsored Entity (GSE) and agency securities due -
|
||||||||||||||||
|
After 1 year but within 5 years
|
$
|
1,037
|
$
|
-
|
$
|
(11
|
)
|
$
|
1,026
|
|||||||
|
After 5 years but within 10 years
|
1,136
|
-
|
(24
|
)
|
1,112
|
|||||||||||
|
Asset-backed securities issued by the Small Business Administration (SBA)
|
28,139
|
354
|
(28
|
)
|
28,465
|
|||||||||||
|
Residential mortgage-backed securities issued by GSEs (1)
|
67,675
|
189
|
(443
|
)
|
67,421
|
|||||||||||
|
State and local government securities due -
|
||||||||||||||||
|
After 5 years but within 10 years
|
9,850
|
98
|
(31
|
)
|
9,917
|
|||||||||||
|
After 10 years
|
32,685
|
278
|
(188
|
)
|
32,775
|
|||||||||||
|
Mutual funds
|
744
|
2
|
-
|
746
|
||||||||||||
|
Total
|
$
|
141,266
|
$
|
921
|
$
|
(725
|
)
|
$
|
141,462
|
|||||||
| (1) | Residential mortgage-backed securities were issued by United States government sponsored entities including the Federal National Mortgage Association, Federal Home Loan Mortgage Corporation, or Government National Mortgage Association. The Company held no private label residential mortgage-backed securities at December 31, 2015 and December 31, 2014 or during the periods then ended. |
ASB BANCORP, INC. AND SUBSIDIARY
NOTES TO CONSOLIDATED FINANCIAL STATEMENTS
2. INVESTMENT SECURITIES (Continued)
Securities Held to Maturity – The maturities, amortized cost, unrealized gains, unrealized losses and fair values of securities classified as held to maturity are as follows:
|
Type And Maturity Group
(Dollars in thousands)
|
Amortized
Cost
|
Unrealized
Gains
|
Unrealized
Losses
|
Fair
Value
|
||||||||||||
|
December 31, 2015
|
||||||||||||||||
|
U.S. GSE and agency securities due -
|
||||||||||||||||
|
After 1 year but within 5 years
|
$
|
1,024
|
$
|
46
|
$
|
-
|
$
|
1,070
|
||||||||
|
Residential mortgage-backed securities issued by GSEs (1)
|
351
|
25
|
-
|
376
|
||||||||||||
|
State and local government securities due -
|
||||||||||||||||
|
After 5 years but within 10 years
|
965
|
89
|
-
|
1,054
|
||||||||||||
|
After 10 years
|
1,469
|
117
|
-
|
1,586
|
||||||||||||
|
Total
|
$
|
3,809
|
$
|
277
|
$
|
-
|
$
|
4,086
|
||||||||
|
December 31, 2014
|
||||||||||||||||
|
U.S. GSE and agency securities due -
|
||||||||||||||||
|
After 1 year but within 5 years
|
$
|
1,038
|
$
|
73
|
$
|
-
|
$
|
1,111
|
||||||||
|
Residential mortgage-backed securities issued by GSEs (1)
|
532
|
40
|
-
|
572
|
||||||||||||
|
State and local government securities due -
|
||||||||||||||||
|
After 5 years but within 10 years
|
961
|
98
|
-
|
1,059
|
||||||||||||
|
After 10 years
|
1,468
|
153
|
-
|
1,621
|
||||||||||||
|
Total
|
$
|
3,999
|
$
|
364
|
$
|
-
|
$
|
4,363
|
||||||||
| (1) | Residential mortgage-backed securities were issued by United States government sponsored entities including the Federal National Mortgage Association, Federal Home Loan Mortgage Corporation, or Government National Mortgage Association. The Company held no private label residential mortgage-backed securities at December 31, 2015 and December 31, 2014 or during the periods then ended. |
ASB BANCORP, INC. AND SUBSIDIARY
NOTES TO CONSOLIDATED FINANCIAL STATEMENTS
2. INVESTMENT SECURITIES (Continued)
The following tables show investment gross unrealized losses and fair value, aggregated by investment category and length of time that individual securities have been in a continuous unrealized loss position, at December 31, 2015 and December 31, 2014. The total number of securities with unrealized losses at December 31, 2015 and December 31, 2014 were 34 and 46, respectively. The unrealized losses relate to debt and equity securities that have incurred fair value reductions due to higher market interest rates since the securities were purchased. The unrealized losses are not likely to reverse unless and until market interest rates decline to the levels that existed when the securities were purchased. Management has the ability and intent to hold securities with unrealized losses until a recovery of the market value occurs. Management intends to manage the Company’s liquidity so as to minimize the need to sell securities with unrealized losses prior to a recovery of market value sufficient to negate the unrealized loss. The key factors considered in evaluating the mortgaged-backed and municipal securities were cash flows of the investment and the assessment of other relative economic factors, such as credit risk. In addition to the effects of higher market interest rates, the security fair values are also affected by shifts in the demand to U.S. Treasury and governmental agency bonds from non-governmental securities and municipal bonds due to market concerns. None of the unrealized losses relate to the marketability of the securities or the issuer’s ability to honor redemption obligations. Management has analyzed the creditworthiness of the underlying issuers and determined it is more likely than not that the Company will collect the contractual cash flows, therefore impairment is considered to be temporary.
|
December 31, 2015
|
||||||||||||||||||||||||
|
Less Than 12 Months
|
12 Months Or More
|
Total
|
||||||||||||||||||||||
|
(Dollars in thousands)
|
Fair
Value
|
Unrealized
Losses
|
Fair
Value
|
Unrealized
Losses
|
Fair
Value
|
Unrealized
Losses
|
||||||||||||||||||
|
Securities Available For Sale:
|
||||||||||||||||||||||||
|
US GSE and agency
|
$
|
1,018
|
$
|
(6
|
)
|
$
|
1,096
|
$
|
(15
|
)
|
$
|
2,114
|
$
|
(21
|
)
|
|||||||||
|
Asset-backed SBA
|
623
|
(1
|
)
|
1,821
|
(16
|
)
|
2,444
|
(17
|
)
|
|||||||||||||||
|
Residential mortgage-backed GSE (1)
|
36,960
|
(672
|
)
|
9,591
|
(135
|
)
|
46,551
|
(807
|
)
|
|||||||||||||||
|
State and local government
|
3,721
|
(5
|
)
|
557
|
(7
|
)
|
4,278
|
(12
|
)
|
|||||||||||||||
|
Mutual funds
|
760
|
(2
|
)
|
-
|
-
|
760
|
(2
|
)
|
||||||||||||||||
|
Total temporarily impaired securities
|
$
|
43,082
|
$
|
(686
|
)
|
$
|
13,065
|
$
|
(173
|
)
|
$
|
56,147
|
$
|
(859
|
)
|
|||||||||
| (1) | Residential mortgage-backed securities were issued by United States government sponsored entities including the Federal National Mortgage Association, Federal Home Loan Mortgage Corporation, or Government National Mortgage Association. The Company held no private label residential mortgage-backed securities at December 31, 2015 and December 31, 2014 or during the periods then ended. |
ASB BANCORP, INC. AND SUBSIDIARY
NOTES TO CONSOLIDATED FINANCIAL STATEMENTS
2. INVESTMENT SECURITIES (Continued)
|
December 31, 2014
|
||||||||||||||||||||||||
|
Less Than 12 Months
|
12 Months Or More
|
Total
|
||||||||||||||||||||||
|
(Dollars in thousands)
|
Fair
Value |
Unrealized
Losses |
Fair
Value |
Unrealized
Losses |
Fair
Value |
Unrealized
Losses |
||||||||||||||||||
|
Securities Available For Sale:
|
||||||||||||||||||||||||
|
US GSE and agency
|
$
|
-
|
$
|
-
|
$
|
2,138
|
$
|
(35
|
)
|
$
|
2,138
|
$
|
(35
|
)
|
||||||||||
|
Asset-backed SBA
|
1,006
|
(1
|
)
|
2,158
|
(27
|
)
|
3,164
|
(28
|
)
|
|||||||||||||||
|
Residential mortgage-backed GSE (1)
|
5,579
|
(13
|
)
|
27,089
|
(430
|
)
|
32,668
|
(443
|
)
|
|||||||||||||||
|
State and local government
|
1,867
|
(16
|
)
|
13,541
|
(203
|
)
|
15,408
|
(219
|
)
|
|||||||||||||||
|
Total temporarily impaired securities
|
$
|
8,452
|
$
|
(30
|
)
|
$
|
44,926
|
$
|
(695
|
)
|
$
|
53,378
|
$
|
(725
|
)
|
|||||||||
| (1) | Residential mortgage-backed securities were issued by United States government sponsored entities including the Federal National Mortgage Association, Federal Home Loan Mortgage Corporation, or Government National Mortgage Association. The Company held no private label residential mortgage-backed securities at December 31, 2015 and December 31, 2014 or during the periods then ended. |
The fair value of investment securities pledged as collateral follows:
|
December 31,
|
||||||||
|
(Dollars in thousands)
|
2015
|
2014
|
||||||
|
Pledged to Federal Reserve Discount Window
|
$
|
14,533
|
$
|
3,745
|
||||
|
Pledged to repurchase agreements for commercial customers
|
1,131
|
1,137
|
||||||
Interest income from taxable and tax-exempt securities recognized in interest and dividend income follow:
|
Year Ended December 31,
|
||||||||||||
|
(Dollars in thousands)
|
2015
|
2014
|
2013
|
|||||||||
|
Interest income from taxable securities
|
$
|
1,010
|
$
|
1,447
|
$
|
2,254
|
||||||
|
Interest income from tax-exempt securities
|
1,401
|
1,199
|
1,370
|
|||||||||
|
Total interest income from securities
|
$
|
2,411
|
$
|
2,646
|
$
|
3,624
|
||||||
ASB BANCORP, INC. AND SUBSIDIARY
NOTES TO CONSOLIDATED FINANCIAL STATEMENTS
2. INVESTMENT SECURITIES (Continued)
Gross proceeds and gross realized gains from sales of securities recognized in net income follow:
|
Year Ended December 31,
|
||||||||||||
|
(Dollars in thousands)
|
2015
|
2014
|
2013
|
|||||||||
|
Proceeds from sales of securities
|
$
|
69,086
|
$
|
55,821
|
$
|
64,960
|
||||||
|
Gross realized gains from sales of securities
|
841
|
603
|
1,514
|
|||||||||
|
Gross realized losses from sales of securities
|
(266
|
)
|
(392
|
)
|
(644
|
)
|
||||||
3. LOANS RECEIVABLE
The composition of loans receivable by segment and class follow:
|
December 31,
|
||||||||
|
(Dollars in thousands)
|
2015
|
2014
|
||||||
|
Commercial:
|
||||||||
|
Commercial construction and land development
|
$
|
38,313
|
$
|
21,661
|
||||
|
Commercial mortgage
|
209,397
|
201,316
|
||||||
|
Commercial and industrial
|
22,878
|
15,872
|
||||||
|
Total commercial
|
270,588
|
238,849
|
||||||
|
Non-commercial:
|
||||||||
|
Non-commercial construction and land development
|
16,587
|
14,781
|
||||||
|
Residential mortgage
|
186,839
|
172,163
|
||||||
|
Revolving mortgage
|
66,258
|
56,370
|
||||||
|
Consumer
|
36,291
|
40,363
|
||||||
|
Total non-commercial
|
305,975
|
283,677
|
||||||
|
Total loans receivable
|
576,563
|
522,526
|
||||||
|
Less: Deferred loan fees
|
(476
|
)
|
(706
|
)
|
||||
|
Total loans receivable net of deferred loan fees
|
576,087
|
521,820
|
||||||
|
Less: Allowance for loan losses
|
(6,289
|
)
|
(5,949
|
)
|
||||
|
Loans receivable, net
|
$
|
569,798
|
$
|
515,871
|
||||
ASB BANCORP, INC. AND SUBSIDIARY
NOTES TO CONSOLIDATED FINANCIAL STATEMENTS
3. LOANS RECEIVABLE (Continued)
Loans receivable by segment, class, and grade follow:
|
(Dollars in thousands)
|
Pass
|
Special
Mention
|
Substandard
|
Doubtful
|
Loss
|
Total
Loans
|
||||||||||||||||||
|
December 31, 2015
|
||||||||||||||||||||||||
|
Commercial:
|
||||||||||||||||||||||||
|
Commercial construction and land development
|
$
|
38,168
|
$
|
145
|
$
|
-
|
$
|
-
|
$
|
-
|
$
|
38,313
|
||||||||||||
|
Commercial mortgage
|
195,551
|
12,412
|
1,434
|
-
|
-
|
209,397
|
||||||||||||||||||
|
Commercial and industrial
|
21,709
|
942
|
227
|
-
|
-
|
22,878
|
||||||||||||||||||
|
Total commercial
|
255,428
|
13,499
|
1,661
|
-
|
-
|
270,588
|
||||||||||||||||||
|
Non-commercial:
|
||||||||||||||||||||||||
|
Non-commercial construction and land development
|
16,587
|
-
|
-
|
-
|
-
|
16,587
|
||||||||||||||||||
|
Residential mortgage
|
178,403
|
6,674
|
1,762
|
-
|
-
|
186,839
|
||||||||||||||||||
|
Revolving mortgage
|
62,922
|
2,812
|
524
|
-
|
-
|
66,258
|
||||||||||||||||||
|
Consumer
|
35,847
|
415
|
29
|
-
|
-
|
36,291
|
||||||||||||||||||
|
Total non-commercial
|
293,759
|
9,901
|
2,315
|
-
|
-
|
305,975
|
||||||||||||||||||
|
Total loans receivable
|
$
|
549,187
|
$
|
23,400
|
$
|
3,976
|
$
|
-
|
$
|
-
|
$
|
576,563
|
||||||||||||
|
December 31, 2014
|
||||||||||||||||||||||||
|
Commercial:
|
||||||||||||||||||||||||
|
Commercial construction and land development
|
$
|
21,336
|
$
|
323
|
$
|
2
|
$
|
-
|
$
|
-
|
$
|
21,661
|
||||||||||||
|
Commercial mortgage
|
184,992
|
14,809
|
1,515
|
-
|
-
|
201,316
|
||||||||||||||||||
|
Commercial and industrial
|
14,628
|
873
|
371
|
-
|
-
|
15,872
|
||||||||||||||||||
|
Total commercial
|
220,956
|
16,005
|
1,888
|
-
|
-
|
238,849
|
||||||||||||||||||
|
Non-commercial:
|
||||||||||||||||||||||||
|
Non-commercial construction and land development
|
14,781
|
-
|
-
|
-
|
-
|
14,781
|
||||||||||||||||||
|
Residential mortgage
|
161,859
|
8,544
|
1,760
|
-
|
-
|
172,163
|
||||||||||||||||||
|
Revolving mortgage
|
52,700
|
3,119
|
551
|
-
|
-
|
56,370
|
||||||||||||||||||
|
Consumer
|
39,965
|
294
|
104
|
-
|
-
|
40,363
|
||||||||||||||||||
|
Total non-commercial
|
269,305
|
11,957
|
2,415
|
-
|
-
|
283,677
|
||||||||||||||||||
|
Total loans receivable
|
$
|
490,261
|
$
|
27,962
|
$
|
4,303
|
$
|
-
|
$
|
-
|
$
|
522,526
|
||||||||||||
ASB BANCORP, INC. AND SUBSIDIARY
NOTES TO CONSOLIDATED FINANCIAL STATEMENTS
3. LOANS RECEIVABLE (Continued)
Loans receivable by segment, class, and delinquency status follow:
|
Past Due
|
||||||||||||||||||||
|
(Dollars in thousands)
|
31-89 Days
|
90 Days
Or More
|
Total
|
Current
|
Total
Loans
|
|||||||||||||||
|
December 31, 2015
|
||||||||||||||||||||
|
Commercial:
|
||||||||||||||||||||
|
Commercial construction and land development
|
$
|
-
|
$
|
-
|
$
|
-
|
$
|
38,313
|
$
|
38,313
|
||||||||||
|
Commercial mortgage
|
-
|
496
|
496
|
208,901
|
209,397
|
|||||||||||||||
|
Commercial and industrial
|
-
|
87
|
87
|
22,791
|
22,878
|
|||||||||||||||
|
Total commercial
|
-
|
583
|
583
|
270,005
|
270,588
|
|||||||||||||||
|
Non-commercial:
|
||||||||||||||||||||
|
Non-commercial construction and land development
|
-
|
-
|
-
|
16,587
|
16,587
|
|||||||||||||||
|
Residential mortgage
|
685
|
1,193
|
1,878
|
184,961
|
186,839
|
|||||||||||||||
|
Revolving mortgage
|
104
|
98
|
202
|
66,056
|
66,258
|
|||||||||||||||
|
Consumer
|
151
|
-
|
151
|
36,140
|
36,291
|
|||||||||||||||
|
Total non-commercial
|
940
|
1,291
|
2,231
|
303,744
|
305,975
|
|||||||||||||||
|
Total loans receivable
|
$
|
940
|
$
|
1,874
|
$
|
2,814
|
$
|
573,749
|
$
|
576,563
|
||||||||||
|
December 31, 2014
|
||||||||||||||||||||
|
Commercial:
|
||||||||||||||||||||
|
Commercial construction and land development
|
$
|
-
|
$
|
-
|
$
|
-
|
$
|
21,661
|
$
|
21,661
|
||||||||||
|
Commercial mortgage
|
532
|
-
|
532
|
200,784
|
201,316
|
|||||||||||||||
|
Commercial and industrial
|
-
|
43
|
43
|
15,829
|
15,872
|
|||||||||||||||
|
Total commercial
|
532
|
43
|
575
|
238,274
|
238,849
|
|||||||||||||||
|
Non-commercial:
|
||||||||||||||||||||
|
Non-commercial construction and land development
|
-
|
-
|
-
|
14,781
|
14,781
|
|||||||||||||||
|
Residential mortgage
|
576
|
1,226
|
1,802
|
170,361
|
172,163
|
|||||||||||||||
|
Revolving mortgage
|
396
|
141
|
537
|
55,833
|
56,370
|
|||||||||||||||
|
Consumer
|
227
|
1
|
228
|
40,135
|
40,363
|
|||||||||||||||
|
Total non-commercial
|
1,199
|
1,368
|
2,567
|
281,110
|
283,677
|
|||||||||||||||
|
Total loans receivable
|
$
|
1,731
|
$
|
1,411
|
$
|
3,142
|
$
|
519,384
|
$
|
522,526
|
||||||||||
ASB BANCORP, INC. AND SUBSIDIARY
NOTES TO CONSOLIDATED FINANCIAL STATEMENTS
3. LOANS RECEIVABLE (Continued)
The recorded investment in loans, by segment and class, that are not accruing interest or are 90 days or more past due and still accruing interest follow:
|
December 31, 2015
|
December 31, 2014
|
|||||||||||||||
|
(Dollars in thousands)
|
Nonaccruing
|
Past Due
90 Days
Or More
And Still
Accruing
|
Nonaccruing
|
Past Due
90 Days
Or More
And Still
Accruing
|
||||||||||||
|
Commercial:
|
||||||||||||||||
|
Commercial mortgage
|
$
|
818
|
$
|
-
|
$
|
881
|
$
|
-
|
||||||||
|
Commercial and industrial
|
227
|
-
|
221
|
-
|
||||||||||||
|
Total commercial
|
1,045
|
-
|
1,102
|
-
|
||||||||||||
|
Non-commercial:
|
||||||||||||||||
|
Residential mortgage
|
1,309
|
-
|
1,354
|
-
|
||||||||||||
|
Revolving mortgage
|
194
|
-
|
230
|
-
|
||||||||||||
|
Consumer
|
-
|
-
|
2
|
-
|
||||||||||||
|
Total non-commercial
|
1,503
|
-
|
1,586
|
-
|
||||||||||||
|
Total loans receivable
|
$
|
2,548
|
$
|
-
|
$
|
2,688
|
$
|
-
|
||||||||
Loans made to directors and executive officers in the ordinary course of business with terms consistent with those offered to the Bank’s other customers follow:
|
December 31,
|
||||||||
|
(Dollars in thousands)
|
2015
|
2014
|
||||||
|
At beginning of period
|
$
|
4,022
|
$
|
4,070
|
||||
|
New loans
|
718
|
698
|
||||||
|
Repayments of loans
|
(1,210
|
)
|
(746
|
)
|
||||
|
At end of period
|
$
|
3,530
|
$
|
4,022
|
||||
The Bank services loans for Habitat for Humanity of Western North Carolina as an in kind donation. The balances of these loans were $15.8 million and $14.9 million at December 31, 2015 and December 31, 2014, respectively.
ASB BANCORP, INC. AND SUBSIDIARY
NOTES TO CONSOLIDATED FINANCIAL STATEMENTS
4. ALLOWANCE FOR LOAN LOSSES
An analysis of the allowance for loan losses by segment follows:
|
(Dollars in thousands)
|
Commercial
|
Non-
Commercial
|
Total
|
|||||||||
|
Year Ended December 31, 2015
|
||||||||||||
|
Balance at beginning of period
|
$
|
3,409
|
$
|
2,540
|
$
|
5,949
|
||||||
|
Provision for loan losses
|
157
|
204
|
361
|
|||||||||
|
Charge-offs
|
(80
|
)
|
(396
|
)
|
(476
|
)
|
||||||
|
Recoveries
|
224
|
231
|
455
|
|||||||||
|
Balance at end of period
|
$
|
3,710
|
$
|
2,579
|
$
|
6,289
|
||||||
|
Year Ended December 31, 2014
|
||||||||||||
|
Balance at beginning of period
|
$
|
4,560
|
$
|
2,747
|
$
|
7,307
|
||||||
|
Provision for (recovery of) loan losses
|
(1,080
|
)
|
82
|
(998
|
)
|
|||||||
|
Charge-offs
|
(95
|
)
|
(409
|
)
|
(504
|
)
|
||||||
|
Recoveries
|
24
|
120
|
144
|
|||||||||
|
Balance at end of period
|
$
|
3,409
|
$
|
2,540
|
$
|
5,949
|
||||||
|
Year Ended December 31, 2013
|
||||||||||||
|
Balance at beginning of period
|
$
|
4,860
|
$
|
3,653
|
$
|
8,513
|
||||||
|
Recovery of loan losses
|
(299
|
)
|
(382
|
)
|
(681
|
)
|
||||||
|
Charge-offs
|
(48
|
)
|
(582
|
)
|
(630
|
)
|
||||||
|
Recoveries
|
47
|
58
|
105
|
|||||||||
|
Balance at end of period
|
$
|
4,560
|
$
|
2,747
|
$
|
7,307
|
||||||
ASB BANCORP, INC. AND SUBSIDIARY
NOTES TO CONSOLIDATED FINANCIAL STATEMENTS
4. ALLOWANCE FOR LOAN LOSSES (Continued)
The ending balances of loans and the related allowance, by segment and class, follows:
|
Allowance For Loan Losses
|
Total Loans Receivable
|
|||||||||||||||||||||||
|
(Dollars in thousands)
|
Loans
Individually
Evaluated
For
Impairment
|
Loans
Collectively
Evaluated
|
Total
|
Loans
Individually
Evaluated
For
Impairment
|
Loans
Collectively
Evaluated
|
Total
|
||||||||||||||||||
|
December 31, 2015
|
||||||||||||||||||||||||
|
Commercial:
|
||||||||||||||||||||||||
|
Commercial construction and land development
|
$
|
-
|
$
|
385
|
$
|
385
|
$
|
-
|
$
|
38,313
|
$
|
38,313
|
||||||||||||
|
Commercial mortgage
|
39
|
2,982
|
3,021
|
3,811
|
205,586
|
209,397
|
||||||||||||||||||
|
Commercial and industrial
|
13
|
291
|
304
|
252
|
22,626
|
22,878
|
||||||||||||||||||
|
Total commercial
|
52
|
3,658
|
3,710
|
4,063
|
266,525
|
270,588
|
||||||||||||||||||
|
Non-commercial:
|
||||||||||||||||||||||||
|
Non-commercial construction and land development
|
-
|
139
|
139
|
-
|
16,587
|
16,587
|
||||||||||||||||||
|
Residential mortgage
|
42
|
1,140
|
1,182
|
2,895
|
183,944
|
186,839
|
||||||||||||||||||
|
Revolving mortgage
|
86
|
788
|
874
|
97
|
66,161
|
66,258
|
||||||||||||||||||
|
Consumer
|
-
|
384
|
384
|
-
|
36,291
|
36,291
|
||||||||||||||||||
|
Total non-commercial
|
128
|
2,451
|
2,579
|
2,992
|
302,983
|
305,975
|
||||||||||||||||||
|
Total loans receivable
|
$
|
180
|
$
|
6,109
|
$
|
6,289
|
$
|
7,055
|
$
|
569,508
|
$
|
576,563
|
||||||||||||
|
December 31, 2014
|
||||||||||||||||||||||||
|
Commercial:
|
||||||||||||||||||||||||
|
Commercial construction and land development
|
$
|
-
|
$
|
303
|
$
|
303
|
$
|
-
|
$
|
21,661
|
$
|
21,661
|
||||||||||||
|
Commercial mortgage
|
67
|
2,796
|
2,863
|
3,976
|
197,340
|
201,316
|
||||||||||||||||||
|
Commercial and industrial
|
98
|
145
|
243
|
394
|
15,478
|
15,872
|
||||||||||||||||||
|
Total commercial
|
165
|
3,244
|
3,409
|
4,370
|
234,479
|
238,849
|
||||||||||||||||||
|
Non-commercial:
|
||||||||||||||||||||||||
|
Non-commercial construction and land development
|
-
|
116
|
116
|
-
|
14,781
|
14,781
|
||||||||||||||||||
|
Residential mortgage
|
160
|
969
|
1,129
|
3,023
|
169,140
|
172,163
|
||||||||||||||||||
|
Revolving mortgage
|
135
|
675
|
810
|
370
|
56,000
|
56,370
|
||||||||||||||||||
|
Consumer
|
-
|
485
|
485
|
-
|
40,363
|
40,363
|
||||||||||||||||||
|
Total non-commercial
|
295
|
2,245
|
2,540
|
3,393
|
280,284
|
283,677
|
||||||||||||||||||
|
Total loans receivable
|
$
|
460
|
$
|
5,489
|
$
|
5,949
|
$
|
7,763
|
$
|
514,763
|
$
|
522,526
|
||||||||||||
ASB BANCORP, INC. AND SUBSIDIARY
NOTES TO CONSOLIDATED FINANCIAL STATEMENTS
4. ALLOWANCE FOR LOAN LOSSES (Continued)
Impaired loans and the related allowance, by segment and class, follows:
|
Recorded Investment
|
||||||||||||||||||||
|
(Dollars in thousands)
|
Unpaid
Principal
Balance
|
With A
Recorded
Allowance
|
With No
Recorded
Allowance
|
Total
|
Related
Recorded
Allowance
|
|||||||||||||||
|
December 31, 2015
|
||||||||||||||||||||
|
Commercial:
|
||||||||||||||||||||
|
Commercial mortgage
|
$
|
3,934
|
$
|
3,315
|
$
|
496
|
$
|
3,811
|
$
|
39
|
||||||||||
|
Commercial and industrial
|
722
|
140
|
112
|
252
|
13
|
|||||||||||||||
|
Total commercial
|
4,656
|
3,455
|
608
|
4,063
|
52
|
|||||||||||||||
|
Non-commercial:
|
||||||||||||||||||||
|
Residential mortgage
|
2,965
|
2,125
|
770
|
2,895
|
42
|
|||||||||||||||
|
Revolving mortgage
|
107
|
86
|
11
|
97
|
86
|
|||||||||||||||
|
Total non-commercial
|
3,072
|
2,211
|
781
|
2,992
|
128
|
|||||||||||||||
|
Total impaired loans
|
$
|
7,728
|
$
|
5,666
|
$
|
1,389
|
$
|
7,055
|
$
|
180
|
||||||||||
|
December 31, 2014
|
||||||||||||||||||||
|
Commercial:
|
||||||||||||||||||||
|
Commercial mortgage
|
$
|
4,050
|
$
|
3,444
|
$
|
532
|
$
|
3,976
|
$
|
67
|
||||||||||
|
Commercial and industrial
|
779
|
328
|
66
|
394
|
98
|
|||||||||||||||
|
Total commercial
|
4,829
|
3,772
|
598
|
4,370
|
165
|
|||||||||||||||
|
Non-commercial:
|
||||||||||||||||||||
|
Residential mortgage
|
3,062
|
2,298
|
725
|
3,023
|
160
|
|||||||||||||||
|
Revolving mortgage
|
414
|
267
|
103
|
370
|
135
|
|||||||||||||||
|
Total non-commercial
|
3,476
|
2,565
|
828
|
3,393
|
295
|
|||||||||||||||
|
Total impaired loans
|
$
|
8,305
|
$
|
6,337
|
$
|
1,426
|
$
|
7,763
|
$
|
460
|
||||||||||
ASB BANCORP, INC. AND SUBSIDIARY
NOTES TO CONSOLIDATED FINANCIAL STATEMENTS
4. ALLOWANCE FOR LOAN LOSSES (Continued)
The average recorded investment in impaired loans and interest income recognized on impaired loans follows:
|
Year Ended December 31,
|
||||||||||||||||||||||||
|
2015
|
2014
|
2013
|
||||||||||||||||||||||
|
(Dollars in thousands)
|
Average
Recorded
Investment
|
Interest
Income
Recognized
|
Average
Recorded
Investment
|
Interest
Income
Recognized
|
Average
Recorded
Investment
|
Interest
Income
Recognized
|
||||||||||||||||||
|
Commercial:
|
||||||||||||||||||||||||
|
Commercial construction and land development
|
$
|
-
|
$
|
-
|
$
|
23
|
$
|
1
|
$
|
145
|
$
|
7
|
||||||||||||
|
Commercial mortgage
|
3,879
|
131
|
4,056
|
148
|
3,959
|
182
|
||||||||||||||||||
|
Commercial and industrial
|
294
|
1
|
302
|
7
|
336
|
7
|
||||||||||||||||||
|
Total commercial
|
4,173
|
132
|
4,381
|
156
|
4,440
|
196
|
||||||||||||||||||
|
Non-commercial:
|
||||||||||||||||||||||||
|
Residential mortgage
|
3,116
|
77
|
3,039
|
71
|
2,941
|
103
|
||||||||||||||||||
|
Revolving mortgage
|
226
|
1
|
319
|
5
|
252
|
7
|
||||||||||||||||||
|
Total non-commercial
|
3,342
|
78
|
3,358
|
76
|
3,193
|
110
|
||||||||||||||||||
|
Total loans receivable
|
$
|
7,515
|
$
|
210
|
$
|
7,739
|
$
|
232
|
$
|
7,633
|
$
|
306
|
||||||||||||
ASB BANCORP, INC. AND SUBSIDIARY
NOTES TO CONSOLIDATED FINANCIAL STATEMENTS
4. ALLOWANCE FOR LOAN LOSSES (Continued)
The following table summarizes the Bank’s recorded investment in TDRs before and after their modifications during the periods indicated. The payment terms on one loan was extended during the year ended December 31, 2015, and the Bank reduced the interest rate below market levels on two loans during the year ended December 31, 2015. The payment terms on two loans were extended during the year ended December 31, 2014, and the Bank did not reduce the interest rate below market levels on any loans during the year ended December 31, 2014.
|
Year Ended December 31, 2015
|
Year Ended December 31, 2014
|
|||||||||||||||||||||||
|
(Dollars in thousands)
|
Number
Of
Loans
|
Pre-
Modification
Outstanding
Recorded
Investment
|
Post-
Modification
Outstanding
Recorded
Investment
|
Number
Of
Loans
|
Pre-
Modification
Outstanding
Recorded
Investment
|
Post-
Modification
Outstanding
Recorded
Investment
|
||||||||||||||||||
|
Below market interest rate:
|
||||||||||||||||||||||||
|
Commercial:
|
||||||||||||||||||||||||
|
Commercial and industrial
|
1
|
$
|
153
|
$
|
153
|
-
|
$
|
-
|
$
|
-
|
||||||||||||||
|
Total commercial
|
1
|
153
|
153
|
-
|
-
|
-
|
||||||||||||||||||
|
Non-commercial:
|
||||||||||||||||||||||||
|
Residential mortgage
|
1
|
45
|
45
|
-
|
-
|
-
|
||||||||||||||||||
|
Total non-commercial
|
1
|
45
|
45
|
-
|
-
|
-
|
||||||||||||||||||
|
Total
|
2
|
$
|
198
|
$
|
198
|
-
|
$
|
-
|
$
|
-
|
||||||||||||||
|
Extended payment terms:
|
||||||||||||||||||||||||
|
Non-commercial:
|
||||||||||||||||||||||||
|
Residential mortgage
|
1
|
$
|
29
|
$
|
42
|
2
|
$
|
67
|
$
|
93
|
||||||||||||||
|
Total non-commercial
|
1
|
29
|
42
|
2
|
67
|
93
|
||||||||||||||||||
|
Total
|
1
|
$
|
29
|
$
|
42
|
2
|
$
|
67
|
$
|
93
|
||||||||||||||
|
Total
|
3
|
$
|
227
|
$
|
240
|
2
|
$
|
67
|
$
|
93
|
||||||||||||||
During the years ended December 31, 2015 and 2014, no loans went into default that were modified as a TDR within the preceding 12 months.
ASB BANCORP, INC. AND SUBSIDIARY
NOTES TO CONSOLIDATED FINANCIAL STATEMENTS
4. ALLOWANCE FOR LOAN LOSSES (Continued)
In the determination of the allowance for loan losses, management considers TDRs on commercial loans, and the subsequent nonperformance in accordance with their modified terms, by measuring impairment on a loan-by-loan basis based on either the present value of expected future cash flows discounted at the loan’s effective interest rate, the loan’s obtainable market price, or the fair value of the collateral if the loan is collateral dependent.
The Bank’s loans that were considered to be troubled debt restructurings follow:
|
December 31,
|
||||||||
|
(Dollars in thousands)
|
2015
|
2014
|
||||||
|
Nonperforming restructured loans
|
$
|
979
|
$
|
1,018
|
||||
|
Performing restructured loans
|
4,552
|
4,804
|
||||||
|
Total
|
$
|
5,531
|
$
|
5,822
|
||||
As of December 31, 2015, the Bank had $1.3 million of residential real estate loans in the process of foreclosure and $705,000 of foreclosed residential real estate property included in foreclosed real estate.
5. PREMISES AND EQUIPMENT
A summary of Bank premises and equipment, and related depreciation expense, follows:
|
December 31,
|
||||||||
|
(Dollars in thousands)
|
2015
|
2014
|
||||||
|
Land
|
$
|
3,395
|
$
|
3,395
|
||||
|
Office buildings and improvements
|
15,552
|
15,465
|
||||||
|
Furniture, fixtures, equipment and auto
|
7,192
|
7,839
|
||||||
|
Total
|
26,139
|
26,699
|
||||||
|
Less - accumulated depreciation
|
(14,523
|
)
|
(14,767
|
)
|
||||
|
Premises and equipment, net
|
$
|
11,616
|
$
|
11,932
|
||||
|
Year Ended December 31,
|
||||||||||||
|
(Dollars in thousands)
|
2015
|
2014
|
2013
|
|||||||||
|
Depreciation expense
|
$
|
816
|
$
|
914
|
$
|
1,072
|
||||||
ASB BANCORP, INC. AND SUBSIDIARY
NOTES TO CONSOLIDATED FINANCIAL STATEMENTS
6. DEPOSIT ACCOUNTS
The Bank’s deposit accounts are summarized as follows:
|
December 31,
|
||||||||
|
(Dollars in thousands)
|
2015
|
2014
|
||||||
|
Noninterest-bearing demand accounts
|
$
|
113,745
|
$
|
97,450
|
||||
|
NOW accounts
|
163,005
|
152,860
|
||||||
|
Money market accounts
|
170,921
|
157,091
|
||||||
|
Savings accounts
|
47,957
|
41,885
|
||||||
|
Certificate accounts
|
135,276
|
154,093
|
||||||
|
Total deposits
|
$
|
630,904
|
$
|
603,379
|
||||
The scheduled maturities of certificate of deposit accounts follow:
|
December 31,
|
||||||||
|
(Dollars in thousands)
|
2015
|
2014
|
||||||
|
2015
|
$
|
-
|
$
|
86,301
|
||||
|
2016
|
76,188
|
47,316
|
||||||
|
2017
|
32,500
|
15,670
|
||||||
|
2018
|
20,818
|
4,089
|
||||||
|
2019
|
2,903
|
717
|
||||||
|
2020
|
2,854
|
-
|
||||||
|
Thereafter
|
13
|
-
|
||||||
|
Total
|
$
|
135,276
|
$
|
154,093
|
||||
|
Additional certificate of deposit information:
(amounts included in the preceding tables)
|
||||||||
|
Aggregate certificate of deposit accounts of $250,000 or more
|
$
|
9,413
|
$
|
8,884
|
||||
|
Brokered certificate of deposit accounts
|
$
|
20,506
|
$
|
24,140
|
||||
ASB BANCORP, INC. AND SUBSIDIARY
NOTES TO CONSOLIDATED FINANCIAL STATEMENTS
7. OVERNIGHT AND SHORT-TERM BORROWINGS
Overnight and short-term borrowings follow:
|
December 31,
|
||||||||
|
(Dollars in thousands)
|
2015
|
2014
|
||||||
|
Securities sold under agreements to repurchase
|
$
|
327
|
$
|
660
|
||||
|
Total available credit under federal funds borrowing agreements
|
$
|
79,306
|
$
|
59,058
|
||||
The Bank has a federal funds borrowing agreement with the Federal Reserve Bank whereby any borrowings under the agreement are secured by qualifying assets pledged by the Bank.
8. ADVANCES FROM THE FEDERAL HOME LOAN BANK
The Bank has established a line of credit borrowing arrangement with the FHLB of Atlanta. Available credit under this commitment was $77.9 million at December 31, 2015 and $70.2 million at December 31, 2014. All qualifying residential mortgages and FHLB stock are pledged as collateral to secure FHLB advances.
Maturities, conversion dates, and interest rates on outstanding FHLB of Atlanta advances follow:
|
(Dollars in thousands)
|
||||||||||||||||
|
Date Convertible By
|
Interest
|
December 31,
|
||||||||||||||
|
Maturity Date
|
FHLB To Variable Rate
|
Rate
|
2015
|
2014
|
||||||||||||
|
March 13, 2017
|
March 14, 2016 (1)
|
4.09
|
%
|
$
|
10,000
|
$
|
10,000
|
|||||||||
|
March 13, 2017
|
March 14, 2016 (1)
|
4.20
|
%
|
10,000
|
10,000
|
|||||||||||
|
March 20, 2017
|
March 21, 2016 (1)
|
3.99
|
%
|
10,000
|
10,000
|
|||||||||||
|
September 11, 2017
|
March 11, 2016 (1)
|
3.45
|
%
|
10,000
|
10,000
|
|||||||||||
|
September 17, 2018
|
n/a |
3.65
|
%
|
10,000
|
10,000
|
|||||||||||
|
Total FHLB advances
|
$
|
50,000
|
$
|
50,000
|
||||||||||||
| (1) | FHLB has the option to convert the advance to a variable rate each quarter until maturity. |
If the FHLB of Atlanta exercises its conversion option, the Bank can accept the new terms or repay the advance without any prepayment penalty. These advance agreements also contain prepayment penalty provisions for early repayments if current advance rates are lower than the interest rates on the advances being repaid.
The Bank had outstanding irrevocable letters of credit totaling $6.0 million and $3.5 million from the FHLB of Atlanta at December 31, 2015 and December 31, 2014, respectively, used to secure uninsured deposits placed with the Bank by state and local governments and their political subdivisions, to the extent required by law.
ASB BANCORP, INC. AND SUBSIDIARY
NOTES TO CONSOLIDATED FINANCIAL STATEMENTS
9. INCOME TAXES
Components of the income tax provision follows:
|
Year Ended December 31,
|
||||||||||||
|
(Dollars in thousands)
|
2015
|
2014
|
2013
|
|||||||||
|
Current:
|
||||||||||||
|
Federal
|
$
|
1,464
|
$
|
100
|
$
|
321
|
||||||
|
State
|
172
|
-
|
-
|
|||||||||
|
Total current expense
|
1,636
|
100
|
321
|
|||||||||
|
Deferred:
|
||||||||||||
|
Federal
|
210
|
1,120
|
166
|
|||||||||
|
State
|
137
|
40
|
138
|
|||||||||
|
Total deferred expense
|
347
|
1,160
|
304
|
|||||||||
|
Total income tax provision
|
$
|
1,983
|
$
|
1,260
|
$
|
625
|
||||||
|
Increases (decreases) in deferred tax assets (liabilities) allocated to other comprehensive income related to:
|
||||||||||||
|
Unrealized (gains) losses on securities available for sale
|
$
|
(81
|
)
|
$
|
(1,852
|
)
|
$
|
3,032
|
||||
|
Qualified and non-qualified pension plan liability adjustments
|
(444
|
)
|
859
|
(437
|
)
|
|||||||
|
Total
|
$
|
(525
|
)
|
$
|
(993
|
)
|
$
|
2,595
|
||||
ASB BANCORP, INC. AND SUBSIDIARY
NOTES TO CONSOLIDATED FINANCIAL STATEMENTS
9. INCOME TAXES (Continued)
The approximate tax effects of each type of temporary difference that gave rise to the Bank’s deferred income tax assets and liabilities follows:
|
December 31,
|
||||||||
|
(Dollars in thousands)
|
2015
|
2014
|
||||||
|
Deferred tax assets relating to:
|
||||||||
|
Deferred loan fees
|
$
|
174
|
$
|
263
|
||||
|
Deferred compensation
|
500
|
530
|
||||||
|
Non-accrual interest, book versus tax
|
32
|
25
|
||||||
|
Accrued vacation
|
177
|
166
|
||||||
|
Allowance for loan losses
|
2,304
|
2,219
|
||||||
|
Pension liabilities and prepayments
|
3,080
|
3,526
|
||||||
|
Equity incentive plans
|
482
|
397
|
||||||
|
Net operating/net economic loss carry forward
|
-
|
537
|
||||||
|
Loss reserve on foreclosed real estate
|
230
|
374
|
||||||
|
Deferred gain on sale of foreclosed real estate
|
4
|
4
|
||||||
|
Other
|
169
|
267
|
||||||
|
Total deferred tax assets
|
7,152
|
8,308
|
||||||
|
Deferred tax liabilities relating to:
|
||||||||
|
Original issue discount - loan fees
|
(680
|
)
|
(635
|
)
|
||||
|
Property
|
(48
|
)
|
(66
|
)
|
||||
|
Pension liabilities and prepayments
|
(669
|
)
|
(990
|
)
|
||||
|
FHLB stock
|
(723
|
)
|
(736
|
)
|
||||
|
Unrealized gain on securities available for sale
|
(153
|
)
|
(71
|
)
|
||||
|
Other
|
(163
|
)
|
(222
|
)
|
||||
|
Total deferred tax liabilities
|
(2,436
|
)
|
(2,720
|
)
|
||||
|
Net recorded deferred tax assets
|
$
|
4,716
|
$
|
5,588
|
||||
ASB BANCORP, INC. AND SUBSIDIARY
NOTES TO CONSOLIDATED FINANCIAL STATEMENTS
9. INCOME TAXES (Continued)
Income taxes computed by applying the federal statutory income tax rate of 34% to income before income taxes differs from the actual income tax provision because of the following:
|
Year Ended December 31,
|
||||||||||||
|
(Dollars in thousands)
|
2015
|
2014
|
2013
|
|||||||||
|
Income tax provision at statutory rate
|
$
|
1,890
|
$
|
1,275
|
$
|
707
|
||||||
|
Increase (decrease) in income taxes resulting from:
|
||||||||||||
|
Tax exempt interest income, net of disallowed interest expense
|
(314
|
)
|
(408
|
)
|
(459
|
)
|
||||||
|
State taxes, net of federal effect
|
181
|
158
|
100
|
|||||||||
|
Deferred tax revaluation from reduction in state tax rate
|
35
|
40
|
138
|
|||||||||
|
ESOP fair market value adjustment
|
125
|
96
|
73
|
|||||||||
|
Incentive stock options
|
67
|
103
|
60
|
|||||||||
|
Other, net
|
(1
|
)
|
(4
|
)
|
6
|
|||||||
|
Total
|
$
|
1,983
|
$
|
1,260
|
$
|
625
|
||||||
Retained earnings include approximately $7.2 million representing pre-1988 tax bad debt reserve base year amounts for which no deferred income tax liability has been provided since these reserves are not expected to reverse and may never reverse. Circumstances that would require an accrual of a portion or all of this unrecorded tax liability are a reduction in qualifying loan levels relative to the end of 1987, failure to meet the definition of a bank, dividend payments in excess of accumulated tax earnings and profits, or other distributions, dissolution or liquidation of the Bank’s equity.
10. REGULATORY CAPITAL REQUIREMENTS
Capital Levels – The Company is a bank holding company regulated by the FRB and the NCCoB. The Bank is a state-chartered savings bank regulated by the FDIC and the NCCoB. Federal regulations require the maintenance of a minimum leverage ratio of 4%, a minimum Tier 1 capital ratio of 6% and a total capital ratio of 8%. Effective beginning in 2015, an additional requirement was added for a minimum Common Equity Tier I capital ratio of 4.5%. In addition, North Carolina regulations require North Carolina savings banks to maintain a ratio of qualifying total capital to total adjusted assets of 5%.
Failure to meet minimum capital requirements can initiate certain mandatory – and possibly additional discretionary – actions by regulators that, if undertaken, could have a direct material effect on the Company’s and the Bank’s financial statements. Under capital adequacy guidelines and the regulatory framework for prompt corrective action, the Bank must meet specific capital guidelines that involve quantitative measures of assets, liabilities, and certain off-balance sheet items as calculated under regulatory accounting practices. Capital amounts and classification also are subject to qualitative judgments by the regulators about components, risk weightings and other factors.
As of December 31, 2015, the most recent regulatory reporting period, the Bank was well capitalized under the current regulatory framework. To be categorized as well capitalized, the Bank must maintain minimum Common Equity Tier 1 capital, Tier 1 leverage capital, Tier 1 risk-based capital and total risk-based capital as set forth in the table below.
ASB BANCORP, INC. AND SUBSIDIARY
NOTES TO CONSOLIDATED FINANCIAL STATEMENTS
10. REGULATORY CAPITAL REQUIREMENTS (Continued)
The following tables set forth actual and required regulatory capital amounts as of the periods indicated:
|
Regulatory Requirements
|
||||||||||||||||||||||||
|
Actual
|
Minimum For Capital
Adequacy Purposes
|
Minimum To Be
Well Capitalized
|
||||||||||||||||||||||
|
(Dollars in thousands)
|
Amount
|
Ratio
|
Amount
|
Ratio
|
Amount
|
Ratio
|
||||||||||||||||||
|
ASB Bancorp, Inc. (1)
|
||||||||||||||||||||||||
|
December 31, 2015
|
||||||||||||||||||||||||
| Common Equity | ||||||||||||||||||||||||
|
Tier I capital
|
$
|
94,743
|
16.66
|
%
|
$
|
25,587
|
4.50
|
%
|
$
|
36,960
|
6.50
|
%
|
||||||||||||
|
Tier I leverage capital
|
94,743
|
11.87
|
%
|
31,935
|
4.00
|
%
|
39,919
|
5.00
|
%
|
|||||||||||||||
|
Tier I risk-based capital
|
94,743
|
16.66
|
%
|
34,117
|
6.00
|
%
|
45,489
|
8.00
|
%
|
|||||||||||||||
|
Total risk-based capital
|
101,032
|
17.77
|
%
|
45,489
|
8.00
|
%
|
56,861
|
10.00
|
%
|
|||||||||||||||
|
December 31, 2014
|
||||||||||||||||||||||||
|
Common Equity
|
||||||||||||||||||||||||
|
Tier I capital
|
n/a
|
n/a
|
|
n/a
|
|
n/a
|
|
n/a
|
|
n/a
|
|
|||||||||||||
|
Tier I leverage capital
|
$
|
100,199
|
13.17
|
%
|
$
|
30,442
|
4.00
|
%
|
$
|
38,052
|
5.00
|
%
|
||||||||||||
|
Tier I risk-based capital
|
100,199
|
19.83
|
%
|
20,210
|
4.00
|
%
|
30,315
|
6.00
|
%
|
|||||||||||||||
|
Total risk-based capital
|
106,149
|
21.01
|
%
|
40,420
|
8.00
|
%
|
50,525
|
10.00
|
%
|
|||||||||||||||
|
Asheville Savings Bank, S.S.B. (1)
|
||||||||||||||||||||||||
|
December 31, 2015
|
||||||||||||||||||||||||
|
Common Equity
|
||||||||||||||||||||||||
|
Tier I capital
|
$
|
89,183
|
15.70
|
%
|
$
|
25,563
|
4.50
|
%
|
$
|
36,925
|
6.50
|
%
|
||||||||||||
|
Tier I leverage capital
|
89,183
|
11.20
|
%
|
31,848
|
4.00
|
%
|
39,810
|
5.00
|
%
|
|||||||||||||||
|
Tier I risk-based capital
|
89,183
|
15.70
|
%
|
34,084
|
6.00
|
%
|
45,446
|
8.00
|
%
|
|||||||||||||||
|
Total risk-based capital
|
95,472
|
16.81
|
%
|
45,446
|
8.00
|
%
|
56,807
|
10.00
|
%
|
|||||||||||||||
|
NC Savings Bank capital
|
95,472
|
12.21
|
%
|
39,087
|
5.00
|
%
|
n/a
|
|
n/a
|
|
||||||||||||||
|
December 31, 2014
|
||||||||||||||||||||||||
|
Common Equity
|
||||||||||||||||||||||||
|
Tier I capital
|
n/a
|
|
n/a
|
|
n/a
|
|
n/a
|
|
n/a
|
|
n/a
|
|
||||||||||||
|
Tier I leverage capital
|
$
|
93,044
|
12.26
|
%
|
$
|
30,353
|
4.00
|
%
|
$
|
37,942
|
5.00
|
%
|
||||||||||||
|
Tier I risk-based capital
|
93,044
|
18.43
|
%
|
20,195
|
4.00
|
%
|
30,293
|
6.00
|
%
|
|||||||||||||||
|
Total risk-based capital
|
98,994
|
19.61
|
%
|
40,390
|
8.00
|
%
|
50,488
|
10.00
|
%
|
|||||||||||||||
|
NC Savings Bank capital
|
98,994
|
13.07
|
%
|
37,870
|
5.00
|
%
|
n/a
|
|
n/a
|
|
||||||||||||||
| (1) | Regulatory capital ratios are based on BASEL III capital standards for 2015 and BASEL I capital standards for 2014. |
ASB BANCORP, INC. AND SUBSIDIARY
NOTES TO CONSOLIDATED FINANCIAL STATEMENTS
10. REGULATORY CAPITAL REQUIREMENTS (Continued)
A reconciliation of GAAP equity and regulatory capital amounts follows:
|
ASB Bancorp, Inc.
December 31,
|
Asheville Savings Bank, S.S.B.
December 31,
|
|||||||||||||||
|
(Dollars in thousands)
|
2015
|
2014
|
2015
|
2014
|
||||||||||||
|
Total GAAP equity
|
$
|
89,682
|
$
|
94,397
|
$
|
84,122
|
$
|
87,242
|
||||||||
|
Accumulated other comprehensive income, net of tax
|
5,061
|
5,802
|
5,061
|
5,802
|
||||||||||||
|
Tier I capital
|
94,743
|
100,199
|
89,183
|
93,044
|
||||||||||||
|
Unrealized gains on available for sale equity securities
|
-
|
1
|
-
|
1
|
||||||||||||
|
Allowable portion of allowance for loan losses
|
6,289
|
5,949
|
6,289
|
5,949
|
||||||||||||
|
Total risk-based capital
|
$
|
101,032
|
$
|
106,149
|
95,472
|
98,994
|
||||||||||
|
Disallowed portion of allowance for loan losses
|
n/a
|
n/a
|
|
-
|
-
|
|||||||||||
|
NC Savings Bank capital
|
n/a
|
|
n/a
|
|
$
|
95,472
|
$
|
98,994
|
||||||||
Dividend Restrictions – The Company and the Bank may declare and pay cash dividends only with prior written regulatory approval.
A North Carolina stock savings bank may not declare or pay a cash dividend on, or repurchase any of, its capital stock if after making such distribution, the institution would become, or if it already is, “undercapitalized” (as such term is defined under applicable law and regulations) or such transaction would reduce the net worth of the institution to an amount which is less than the minimum amount required by applicable federal and state regulations.
The FRB issued a policy statement regarding the payment of dividends by bank holding companies. In general, the FRB’s policies provide that dividends should be paid only out of current earnings and only if the prospective rate of earnings retention by the bank holding company appears consistent with the organization’s capital needs, asset quality and overall financial condition. The FRB’s policies also require that a bank holding company serve as a source of financial strength to its subsidiary banks by standing ready to use available resources to provide adequate capital funds to those banks during periods of financial stress or adversity and by maintaining the financial flexibility and capital-raising capacity to obtain additional resources for assisting its subsidiary banks where necessary. Under the prompt corrective action laws, the ability of a bank holding company to pay dividends may be restricted if a subsidiary bank becomes undercapitalized. These regulatory policies could affect the ability of the Company to pay dividends or otherwise engage in capital distributions.
Liquidation Accounts – In connection with the Bank’s 2011 conversion from the mutual to the stock form of organization, liquidation accounts were established by the Company and the Bank for the benefit of eligible account holders and supplemental eligible account holders (collectively, “eligible depositors”) of the Bank as defined in the Bank’s Amended and Restated Plan of Conversion (the “Plan of Conversion”). Each eligible depositor will have a pro rata interest in the liquidation accounts for each of his or her deposit accounts based upon the proportion that the balance of each such account bears to the balance of all deposit accounts of the Bank as of the dates defined in the Plan of Conversion. The liquidation accounts will be maintained for the benefit of eligible depositors who continue to maintain their deposit accounts in the Bank after the conversion. The liquidation accounts will be reduced annually to the extent that eligible depositors have reduced their qualifying deposits. In the unlikely event of a complete liquidation of the Bank or the Company or both, and only in such event, eligible depositors who continue to maintain accounts will be entitled to receive a distribution from the liquidation accounts before any liquidation may be made with respect to common stock. Neither the Company nor the Bank may declare or pay a cash dividend if the effect thereof would cause its equity to be reduced below either the amount required for the liquidation accounts or the regulatory capital requirements imposed by the Company’s or the Bank’s regulators.
ASB BANCORP, INC. AND SUBSIDIARY
NOTES TO CONSOLIDATED FINANCIAL STATEMENTS
11. BENEFIT PLANS
Defined Benefit Plans – The Bank has a Qualified defined benefit pension plan covering substantially all of its employees. The benefits are based on years of service and the employee’s compensation during employment. The Bank’s funding policy is based on actuarially determined amounts. Prior service costs are amortized using the straight line method. Contributions are intended to provide for not only benefits attributed to service to date but also for those expected to be earned in the future. In addition, the Bank also has a Non-Qualified plan covering certain officers whose benefit under the Qualified plan would be reduced as a result of Internal Revenue Code limitations. The Non-Qualified plan is an unfunded plan and any benefits payable shall be paid from the general assets of the Bank.
In June 2015, the Board of Directors amended the Bank’s Qualified and Non-Qualified Pension Plans (the “Plans”), effective September 1, 2015, to offer immediate lump sum payments to inactive vested participants, determined as of October 31, 2015, as available. The election deadline for the inactive participant to make the lump sum selection was October 19, 2015. The total of immediate aggregate lump sum payments to all inactive participants making this selection was approximately $846,000 for 2015.
In June 2014, the Board of Directors further amended the Bank’s Plans, effective September 16, 2014, to offer immediate lump sum payments to inactive participants having an actuarial equivalent of vested accrued benefits below $60,000, determined as of November, 1, 2014, as available. The election deadline for the inactive participant to make the lump sum selection was October 17, 2014. The total of immediate aggregate lump sum payments to all inactive participants making this selection was approximately $544,000 for 2014.
Effective December 17, 2013, the Board of Directors amended the Bank’s Plans to adopt a technical amendment required by IRS regulations that place restrictions on forms of payment and benefit accruals in the event the “adjusted funding target attainment percentage” (or “AFTAP”) of the Pension Plan is ever less than 80%.
Effective March 31, 2013, the Board of Directors amended the Bank’s Plans to curtail or eliminate benefits under the plans for services to be performed in future periods. During the year ended December 31, 2013, pension expense was decreased by a $499,000 one-time credit recognized in the first quarter of 2013 that resulted from the curtailment of benefits for future services.
Effective January 1, 2010, the Board of Directors amended the Bank’s Plans to reduce the projected benefit obligations under the plans for services to be performed in future periods.
Effective December 31, 2009, benefits under the Bank’s Plans were reduced with respect to existing employees and no new participants were allowed to enter the Plans after the effective date.
ASB BANCORP, INC. AND SUBSIDIARY
NOTES TO CONSOLIDATED FINANCIAL STATEMENTS
11. BENEFIT PLANS (Continued)
The following tables set forth the status of both the Qualified and the Non-Qualified Pension Plans using measurement dates of December 31, 2015 and 2014:
|
Non-Qualified
|
Qualified
|
|||||||||||||||
|
(Dollars in thousands)
|
2015
|
2014
|
2015
|
2014
|
||||||||||||
|
Change In Benefit Obligation:
|
||||||||||||||||
|
Projected benefit obligation at beginning of year
|
$
|
1,397
|
$
|
1,191
|
$
|
23,764
|
$
|
19,699
|
||||||||
|
Interest cost
|
55
|
56
|
991
|
990
|
||||||||||||
|
Actuarial loss (gain)
|
(71
|
)
|
220
|
(1,707
|
)
|
4,354
|
||||||||||
|
Benefits paid
|
(70
|
)
|
(70
|
)
|
(1,659
|
)
|
(1,279
|
)
|
||||||||
|
Projected benefit obligation at end of year
|
$
|
1,311
|
$
|
1,397
|
$
|
21,389
|
$
|
23,764
|
||||||||
|
Change In Plan Assets:
|
||||||||||||||||
|
Fair value of plan assets at beginning of year
|
$
|
-
|
$
|
-
|
$
|
18,353
|
$
|
17,011
|
||||||||
|
Actual return (loss) on plan assets
|
-
|
-
|
(585
|
)
|
2,621
|
|||||||||||
|
Employer contribution
|
70
|
70
|
-
|
-
|
||||||||||||
|
Benefits paid
|
(70
|
)
|
(70
|
)
|
(1,659
|
)
|
(1,279
|
)
|
||||||||
|
Fair value of plan assets at end of year
|
$
|
-
|
$
|
-
|
$
|
16,109
|
$
|
18,353
|
||||||||
|
Non-Qualified
|
Qualified
|
|||||||||||||||
|
(Dollars in thousands)
|
2015
|
2014
|
2015
|
2014
|
||||||||||||
|
Net Amount Recognized:
|
||||||||||||||||
|
Funded status
|
$
|
(1,311
|
)
|
$
|
(1,397
|
)
|
$
|
(5,281
|
)
|
$
|
(5,411
|
)
|
||||
|
Unrecognized net actuarial loss
|
404
|
531
|
8,003
|
8,920
|
||||||||||||
|
Net amount recognized
|
$
|
(907
|
)
|
$
|
(866
|
)
|
$
|
2,722
|
$
|
3,509
|
||||||
|
Amounts Recognized In Balance Sheets:
|
||||||||||||||||
|
Pension obligation
|
$
|
(1,311
|
)
|
$
|
(1,397
|
)
|
$
|
(5,281
|
)
|
$
|
(5,411
|
)
|
||||
|
Amounts Recognized In Accumulated Other Comprehensive Income:
|
||||||||||||||||
|
Net actuarial loss
|
$
|
404
|
$
|
531
|
$
|
8,003
|
$
|
8,920
|
||||||||
|
Accumulated other comprehensive loss
|
$
|
404
|
$
|
531
|
$
|
8,003
|
$
|
8,920
|
||||||||
|
Expected To Be Amortized From Accumulated Other Comprehensive Income (Loss) Over Next Twelve Months:
|
||||||||||||||||
|
Net actuarial loss
|
$
|
46
|
$
|
57
|
$
|
666
|
$
|
722
|
||||||||
ASB BANCORP, INC. AND SUBSIDIARY
NOTES TO CONSOLIDATED FINANCIAL STATEMENTS
11. BENEFIT PLANS (Continued)
Net periodic benefit cost related to defined benefit plans included the following components for the periods indicated:
|
Year Ended December 31,
|
||||||||||||
|
(Dollars in thousands)
|
2015
|
2014
|
2013
|
|||||||||
|
Non-Qualified Defined Benefit Plan
|
||||||||||||
|
Components of Net Periodic Benefit Costs:
|
||||||||||||
|
Interest cost
|
$
|
55
|
$
|
56
|
$
|
51
|
||||||
|
Amortization of net loss
|
57
|
29
|
41
|
|||||||||
|
Curtailment credit
|
-
|
-
|
(34
|
)
|
||||||||
|
Net periodic benefit cost
|
$
|
112
|
$
|
85
|
$
|
58
|
||||||
|
Qualified Defined Benefit Plan
|
||||||||||||
|
Components of Net Periodic Benefit Costs:
|
||||||||||||
|
Interest cost
|
$
|
991
|
$
|
990
|
$
|
922
|
||||||
|
Expected return on plan assets
|
(946
|
)
|
(975
|
)
|
(979
|
)
|
||||||
|
Amortization of net loss
|
742
|
536
|
657
|
|||||||||
|
Curtailment credit
|
-
|
-
|
(465
|
)
|
||||||||
|
Net periodic benefit cost
|
$
|
787
|
$
|
551
|
$
|
135
|
||||||
ASB BANCORP, INC. AND SUBSIDIARY
NOTES TO CONSOLIDATED FINANCIAL STATEMENTS
11. BENEFIT PLANS (Continued)
|
Non-Qualified
|
Qualified
|
|||||||||||||||
|
(Dollars in thousands)
|
2015
|
2014
|
2015
|
2014
|
||||||||||||
|
Additional Information:
|
||||||||||||||||
|
Accumulated benefit obligation
|
$
|
1,311
|
$
|
1,397
|
$
|
21,389
|
$
|
23,764
|
||||||||
|
Increase in minimum liability included in other comprehensive income
|
$
|
-
|
$
|
-
|
$
|
-
|
$
|
-
|
||||||||
Assumptions used in accounting for the defined benefit plans follow:
|
Non-Qualified
|
Qualified
|
|||||||||||||||
|
2015
|
2014
|
2015
|
2014
|
|||||||||||||
|
Weighted Average Assumptions Used to Determine Benefit Obligations at Year-End:
|
||||||||||||||||
|
Discount rate
|
4.40
|
%
|
4.06
|
%
|
4.63
|
%
|
4.25
|
%
|
||||||||
|
Expected long-term return on plan assets
|
n/a
|
n/a
|
|
5.28
|
%
|
5.28
|
%
|
|||||||||
|
Weighted Average Assumptions Used to Determine Net Period Benefit Cost for The Year:
|
||||||||||||||||
|
Discount rate
|
4.06
|
%
|
4.86
|
%
|
4.25
|
%
|
5.11
|
%
|
||||||||
|
Expected long-term return on plan assets
|
n/a
|
|
n/a
|
|
5.28
|
%
|
5.88
|
%
|
||||||||
|
Rate of compensation increase
|
n/a
|
|
n/a
|
|
n/a
|
|
n/a
|
|
||||||||
|
Qualified
|
||||||||
|
2015
|
2014
|
|||||||
|
Asset Allocation:
|
||||||||
|
Actual Percentage of Plan Assets:
|
||||||||
|
Equity securities
|
20
|
%
|
19
|
%
|
||||
|
Debt securities
|
75
|
%
|
77
|
%
|
||||
|
Cash and equivalents
|
5
|
%
|
4
|
%
|
||||
|
Total
|
100
|
%
|
100
|
%
|
||||
|
Target Allocation:
|
||||||||
|
Equity securities
|
20
|
%
|
20
|
%
|
||||
|
Debt securities
|
80
|
%
|
80
|
%
|
||||
|
Total
|
100
|
%
|
100
|
%
|
||||
ASB BANCORP, INC. AND SUBSIDIARY
NOTES TO CONSOLIDATED FINANCIAL STATEMENTS
11. BENEFIT PLANS (Continued)
Investment Policy and Strategy – Qualified Plan
The policy, as established by the Pension Committee, is to provide for preservation of capital by investing assets per the target allocations stated above, which has been established to achieve the long-term goal of creating a level of performance correlation between the plan’s liabilities and the assets that are gained. The assets will be reallocated dynamically, in accordance with the adopted glide path allocations as the estimated plan fund percentage improves. The investment policy will be reviewed on a quarterly basis, under the advisement of a certified investment advisor, to determine if the policy should be changed.
Determination of Expected Long-Term Rate of Return
The expected long-term rate of return for the plan’s total assets is based on the expected return of each of the above categories, weighted based on the median of the target allocation for each class. Equity securities are expected to return 6% to 8% over a full market cycle of 5-7 years, while cash and fixed income securities are expected to return 1% to 6%. Based on historical experience, the Pension Committee expects that the Plan’s asset managers will provide a premium of approximately 0.40% per annum to their respective market benchmark indices.
Cash Flows
The expected contribution to the Non-Qualified Plan for the year ending December 31, 2016 is $70,154. The Bank does not expect to make a Qualified Plan contribution in 2016.
The following benefit payments reflecting expected future service are expected to be paid as follows:
|
(Dollars in thousands)
|
Non-
Qualified
|
Qualified
|
||||||
|
Fiscal Year Ending December 31,
|
||||||||
|
2016
|
$
|
70
|
$
|
918
|
||||
|
2017
|
70
|
978
|
||||||
|
2018
|
70
|
1,030
|
||||||
|
2019
|
70
|
1,063
|
||||||
|
2020
|
70
|
1,102
|
||||||
|
2021 – 2025
|
480
|
6,298
|
||||||
401(k) Plan – The Bank sponsors an employee savings plan under Section 401(k) of the Internal Revenue Code, and the Plan covers substantially all employees. The Bank’s matching contribution is equal to 100% of the first 3% of each employee’s compensation for the plan year, plus 50% of the employee’s deferral contributions in excess of 3% but not in excess of 5% of the employee’s compensation for the plan year.
Matching contributions to the Bank’s defined contribution plan under Section 401(k) of the Internal Revenue Code were as follows for the periods indicated:
|
Year Ended December 31,
|
||||||||||||
|
(Dollars in thousands)
|
2015
|
2014
|
2013
|
|||||||||
|
Contributions to defined contribution plan
|
$
|
228
|
$
|
215
|
$
|
221
|
||||||
ASB BANCORP, INC. AND SUBSIDIARY
NOTES TO CONSOLIDATED FINANCIAL STATEMENTS
11. BENEFIT PLANS (Continued)
Deferred Compensation Plan – The Bank has adopted a non-qualified Directors and Officers Deferral Plan (the “D&O Plan”) under which designated executive officers and directors can defer compensation and board/committee meeting fees into the D&O Plan which contains certain investment elections approved by the Bank’s Compensation Committee and selected by the D&O Plan’s Participants, including the option to invest in the Company’s common stock. All D&O Plan Participants are 100% vested in their account balances at all times. Executive officers must first maximize their participation in the Bank’s qualified 401K Plan and can defer no less than five percent (5%) of compensation. No Participant may defer more than one hundred percent (100%) of fees and compensation. The Bank may, at its discretion, make matching contributions to the D&O Plan but has heretofore not elected to do so. The D&O Plan has been amended to comply with Section 409A of the Internal Revenue Code. The Bank’s assets under the D&O Plan were $1,359,000 at December 31, 2015 and $1,418,000 at December 31, 2014.
Stock-Based Deferral Plan – The Bank adopted a non-qualified Stock-Based Deferral Plan to facilitate the investment of D&O Plan funds in the Company’s common stock as elected by D&O Plan participants.
Employee Stock Ownership Plan – In conjunction with the initial public offering, the Company established an ESOP to provide eligible employees the opportunity to own Company stock. The Company provided a loan to the ESOP in the amount of $4,468,000, which was used to purchase 446,764 shares of the Company’s common stock at a price of $10.00 per share in the Company’s initial public offering. The loan had a fixed interest rate of 3.25% and provided for annual payments of interest and principal over the 15 year term of the loan.
At December 31, 2015, the remaining principal balance on the ESOP debt is payable as follows:
|
(Dollars in thousands)
|
Amount
|
|||
|
Principal amounts due on December 31,
|
||||
|
2016
|
$
|
288
|
||
|
2017
|
298
|
|||
|
2018
|
307
|
|||
|
2019
|
317
|
|||
|
2020
|
327
|
|||
|
Thereafter
|
1,805
|
|||
|
Total
|
$
|
3,342
|
||
The Bank committed to make contributions to the ESOP sufficient to support the debt service of the loan. The loan is secured by the shares purchased, which are held in a trust until released for allocation to the participants, as principal and interest payments are made by the ESOP to the Company.
Shares released are allocated to each eligible participant based on the ratio of each participant’s compensation, as defined in the ESOP, to the total compensation of all eligible plan participants. Forfeited shares shall be reallocated among other participants in the Plan. At the discretion of the Bank, cash dividends, when paid on allocated shares, will be distributed to participants’ accounts or used to repay the principal and interest on the ESOP loan used to acquire Company stock on which dividends were paid. Cash dividends on unallocated shares will be used to repay the outstanding debt of the ESOP.
ASB BANCORP, INC. AND SUBSIDIARY
NOTES TO CONSOLIDATED FINANCIAL STATEMENTS
11. BENEFIT PLANS (Continued)
Shares held by the ESOP include the following:
|
December 31,
|
||||||||
|
(Dollars in thousands)
|
2015
|
2014
|
||||||
|
Allocated ESOP shares, beginning of year
|
98,624
|
69,778
|
||||||
|
ESOP shares committed to be released during the year
|
31,387
|
31,387
|
||||||
|
ESOP shares withdrawn during the year
|
(11,317
|
)
|
(2,541
|
)
|
||||
|
Unallocated ESOP shares
|
313,866
|
345,253
|
||||||
|
Total ESOP shares, end of year
|
432,560
|
443,877
|
||||||
|
Fair value of unallocated ESOP shares
|
$
|
8,147
|
$
|
7,423
|
||||
As ESOP shares are earned by the participants, the Company recognizes compensation expense equal to the fair value of the earned ESOP shares during the periods in which they become committed to be released.
Total expense recognized in connection with the ESOP was as follows:
|
Year Ended December 31,
|
||||||||||||
|
(Dollars in thousands)
|
2015
|
2014
|
2013
|
|||||||||
|
ESOP expense
|
$
|
682
|
$
|
597
|
$
|
529
|
||||||
2012 Equity Incentive Plan - The Company’s 2012 Equity Incentive Plan (the “2012 Equity Incentive Plan”) provides for awards of restricted stock and stock options to key officers and outside directors. Cost recognized under the 2012 Equity Incentive Plan is based on the fair value of restricted stock and stock option awards on their grant date. The maximum number of shares that may be awarded under the plan is 781,837 shares, including 223,382 for restricted stock shares and 558,455 shares for stock options.
Shares of common stock granted under the 2012 Equity Incentive Plan may be issued from authorized but unissued shares or, in the case of restricted stock awards, may be awarded with shares purchased on the open market. During 2012, the Company purchased the 223,382 shares of its common stock at a total cost of $3.6 million, or an average of $16.12 per share, through an independent trustee to fulfill anticipated restricted stock awards. The share-based awards granted under the 2012 Equity Incentive Plan have some similar characteristics, except some awards have been granted in restricted stock and other awards have been granted in stock options. Therefore, the following disclosures have been disaggregated for the restricted stock awards and the stock option grants under the plan due to their dissimilar characteristics.
Share-based compensation expenses related to restricted stock and stock options recognized for the years ended December 31, 2015, 2014 and 2013 were $1.1 million, $1.5 million and $1.0 million, respectively.
ASB BANCORP, INC. AND SUBSIDIARY
NOTES TO CONSOLIDATED FINANCIAL STATEMENTS
11. BENEFIT PLANS (Continued)
The table below presents restricted stock award activity for the years ended December 31, 2015, 2014 and 2013.
|
Restricted
Stock
Awards
|
Weighted
Average
Grant Date
Fair Value
|
|||||||
|
Unvested restricted shares at December 31, 2012
|
-
|
$
|
-
|
|||||
|
Granted
|
223,382
|
15.71
|
||||||
|
Unvested restricted shares at December 31, 2013
|
223,382
|
15.71
|
||||||
|
Granted
|
3,600
|
17.51
|
||||||
|
Vested
|
(61,476
|
)
|
15.71
|
|||||
|
Forfeited
|
(3,600
|
)
|
15.71
|
|||||
|
Unvested restricted shares at December 31, 2014
|
161,906
|
15.75
|
||||||
|
Vested
|
(40,296
|
)
|
15.74
|
|||||
|
Unvested restricted shares at December 31, 2015
|
121,610
|
$
|
15.75
|
|||||
At December 31, 2015, unrecognized compensation expense adjusted for expected forfeitures was $1.2 million related to restricted stock. The weighted-average period over which compensation cost related to unvested awards is expected to be recognized was 2.13 years at December 31, 2015.
ASB BANCORP, INC. AND SUBSIDIARY
NOTES TO CONSOLIDATED FINANCIAL STATEMENTS
11. BENEFIT PLANS (Continued)
The table below presents stock option award activity for the years ended December 31, 2015, 2014 and 2013.
|
(Dollars in thousands,
except per share data)
|
Stock
Options
Available For
Granting
|
Stock
Options
Outstanding
|
Weighted
Average
Exercise
Price
|
Remaining
Contractual
Life
(Years)
|
Aggregate
Intrinsic
Value
|
|||||||||||||||
|
Outstanding at December 31, 2012
|
558,455
|
-
|
$
|
-
|
-
|
$
|
-
|
|||||||||||||
|
Granted
|
(467,000
|
)
|
467,000
|
15.71
|
10.00
|
|||||||||||||||
|
Forfeited
|
8,000
|
(8,000
|
)
|
15.71
|
||||||||||||||||
|
Outstanding at December 31, 2013
|
99,455
|
459,000
|
15.71
|
9.10
|
$
|
706
|
||||||||||||||
|
Granted
|
(45,500
|
)
|
45,500
|
18.85
|
||||||||||||||||
|
Exercised
|
-
|
(1,600
|
)
|
15.71
|
||||||||||||||||
|
Forfeited
|
6,400
|
(6,400
|
)
|
15.71
|
||||||||||||||||
|
Outstanding at December 31, 2014
|
60,355
|
496,500
|
16.00
|
7.61
|
$
|
2,731
|
||||||||||||||
|
Exercised
|
-
|
(46,000
|
)
|
15.71
|
||||||||||||||||
|
Outstanding at December 31, 2015
|
60,355
|
450,500
|
$
|
16.03
|
7.24
|
$
|
4,473
|
|||||||||||||
|
Options exercisable at December 31, 2015
|
168,100
|
$
|
15.88
|
7.18
|
$
|
1,694
|
||||||||||||||
The fair value of each option award is estimated on the date of the grant using the Black-Scholes option pricing model. The following table illustrates the weighted-average assumptions for the Black-Scholes model used in determining the fair value of options granted to directors and officers in the years ended December 31, 2014 and 2013. There were 46,000 stock options exercised during 2015. There were no stock options granted or forfeited in 2015.
|
Year Ended December 31,
|
||||||||
|
2014
|
2013
|
|||||||
|
Fair value per option award
|
$
|
6.00
|
$
|
4.79
|
||||
|
Expected life in years
|
6.5 years
|
6.5 years
|
||||||
|
Expected stock price volatility
|
26.89%
|
27.54%
|
|
|||||
|
Expected dividend yield
|
0.00%
|
|
0.00%
|
|
||||
|
Risk-free interest rate
|
2.05%
|
|
1.26%
|
|
||||
|
Expected forfeiture rate
|
4.91%
|
|
5.63%
|
|
||||
At December 31, 2015, the Company had $0.9 million of unrecognized compensation expense, adjusted for expected forfeitures, related to stock options. The period over which compensation cost related to unvested stock options was 2.37 years at December 31, 2015. There were 168,100 options vested and exercisable at December 31, 2015.
ASB BANCORP, INC. AND SUBSIDIARY
NOTES TO CONSOLIDATED FINANCIAL STATEMENTS
12. COMMITMENTS AND CONTINGENCIES
Loan Commitments - The Bank is party to financial instruments with off-balance sheet risk in the normal course of business to meet the financing needs of its customers. These financial instruments include commitments to extend credit and standby letters of credit. These instruments involve, to varying degrees, elements of credit and interest rate risk in excess of the amount recorded in the accompanying consolidated balance sheets. Such financial instruments are recorded when they are funded.
The Bank’s exposure to credit loss in the event of nonperformance by the counterparty to the financial instruments for commitments to extend credit and standby letters of credit is represented by the contractual amount of those instruments. The Bank uses the same credit policies in making such commitments as it does for instruments that are included in the balance sheet.
Commitments to extend credit are agreements to lend to a customer as long as there is no violation of any condition established in the contract. Commitments generally have fixed expiration dates or other termination clauses and may require payment of a fee. Since many of the commitments are expected to expire without being drawn upon, the total commitment amounts do not necessarily represent future cash requirements. The Bank evaluates each customer’s creditworthiness on a case-by-case basis. The amount of collateral obtained, if deemed necessary by the Bank upon extension of credit, is based on management’s credit evaluation. Collateral held varies but may include accounts receivable, inventory, property and equipment, and income-producing commercial real estate.
Standby letters of credit are conditional commitments issued by the Bank to guarantee the performance of a customer to a third party. Standby letters of credit generally have fixed expiration dates or other termination clauses and may require payment of a fee. The credit risk involved in issuing letters of credit is essentially the same as that involved in extending loan facilities to customers. The Bank’s policy for obtaining collateral, and the nature of such collateral, is essentially the same as that involved in making commitments to extend credit.
The Bank’s commitments to extend or originate credit and under standby letters of credit follow:
|
December 31,
|
||||||||
|
(Dollars in thousands)
|
2015
|
2014
|
||||||
|
Financial instruments whose contract amounts represent credit risk:
|
||||||||
|
Commitments to extend or originate credit
|
$
|
171,339
|
$
|
149,590
|
||||
|
Commitments under standby letters of credit
|
120
|
36
|
||||||
|
Total
|
$
|
171,459
|
$
|
149,626
|
||||
The Bank renegotiated the operating lease for the operations center location to include additional space. This lease commenced May 1, 2007 with an original term of ten years. The lease has four five-year renewal options with predetermined rates per square foot rented. A new lease for land in Fletcher, North Carolina commenced on February 1, 2007 with an initial term of 20 years. The lease has renewal options of four consecutive renewal periods of five years each. The monthly payments are subject to adjustment every 60 months based on the increase of the Consumer Price Index.
ASB BANCORP, INC. AND SUBSIDIARY
NOTES TO CONSOLIDATED FINANCIAL STATEMENTS
12. COMMITMENTS AND CONTINGENCIES (Continued)
Future minimum lease payments under these leases are as follows:
|
December 31,
|
||||
|
(Dollars in thousands)
|
2015
|
|||
|
2016
|
$
|
362
|
||
|
2017
|
161
|
|||
|
2018
|
61
|
|||
|
2019
|
61
|
|||
|
2020
|
60
|
|||
|
Thereafter
|
369
|
|||
|
Total
|
$
|
1,074
|
||
Total rental expense related to operating leases follows:
|
Year Ended December 31,
|
||||||||||||
|
(Dollars in thousands)
|
2015
|
2014
|
2013
|
|||||||||
|
Rental expense
|
$
|
362
|
$
|
362
|
$
|
362
|
||||||
Concentrations of Credit Risk - The Bank’s primary market area consists of Buncombe, Henderson, McDowell, Transylvania and Madison counties of North Carolina. The majority of the Bank’s loans are residential mortgage loans and commercial real estate loans. The Bank’s policy generally will allow residential mortgage loans up to 80% of the value of the real estate that is pledged as collateral or up to 95% with private mortgage insurance and commercial real estate loans up to 85% of the value of the real estate that serves as collateral to secure the loan.
Interest Rate Risk - The Bank’s profitability depends to a large extent on its net interest income, which is the difference between interest income from loans and investments and interest expense on deposits and borrowings. Like most financial institutions, the Bank’s interest income and interest expense are significantly affected by changes in market interest rates and other economic factors beyond its control. The Bank’s interest-earning assets consist primarily of long-term, fixed-rate mortgage loans, adjustable rate mortgage loans, commercial loans, and investments that typically adjust more slowly to changes in interest rates than its interest-bearing liabilities, which are primarily term deposits. Accordingly, the Bank’s earnings are usually adversely affected during periods of rising interest rates and positively impacted during periods of declining interest rates. However, based on the results of the Bank’s interest rate risk simulation model, which management believes accurately reflects the extraordinary stress currently existing in the financial markets with respect to potential margin compression resulting from the Bank’s difficulty in reducing its cost of funds further in this competitive pricing environment, the Bank’s earnings may well be adversely affected if interest rates decline further. Such a decline in rates could result from, among other things, the Federal Reserve Board’s purchase of government securities and/or mortgage-backed securities in an effort to further stimulate the economy. Accordingly, the Bank is carefully monitoring, through its Asset/Liability management process, the competitive landscape related to interest rates as well as various economic indicators in order to optimally position the Bank in terms of changes in interest rates.
Litigation - The Bank is periodically involved in legal actions in the normal course of business. The Bank is not a party to any pending legal proceedings that, after review with its legal counsel, the Bank’s management believes would have a material adverse effect on the Bank’s financial condition, results of operations, or cash flows.
Investment Commitments - During 2012, the Bank entered into an agreement to invest $2.0 million as a limited partner in a Small Business Investment Company. The Bank invested $350,000 of its investment commitment in 2013, $250,000 in 2014 and $200,000 in 2015. This investment is recognized using the cost method and is included in “other assets” on the balance sheet.
ASB BANCORP, INC. AND SUBSIDIARY
NOTES TO CONSOLIDATED FINANCIAL STATEMENTS
13. FAIR VALUE MEASUREMENTS
FASB ASC Topic 820: Fair Value Measurements and Disclosures (“FASB ASC Topic 820”) requires disclosure of the fair value of financial assets and financial liabilities, including those financial assets and financial liabilities that are not measured and reported at fair value on a recurring basis or non-recurring basis. The methodologies for estimating the fair value of financial assets and financial liabilities that are measured at fair value on a recurring or non- recurring basis are discussed below. The estimated fair value amounts shown below have been determined by the Bank using available market information and appropriate valuation methodologies. However, considerable judgment is required to interpret market data to develop the estimates of fair value. Accordingly, the estimates presented herein are not necessarily indicative of the amounts the Bank could realize in a current market exchange. The use of different market assumptions and/or valuation methodologies could have a material effect on the estimated fair value amounts.
Fair value estimates are made at a specific point in time, based on relevant market information and information about the financial instrument. These estimates do not reflect any premium or discount that could result from offering for sale at one time the entire holdings of a particular financial instrument. Because no highly liquid market exists for a significant portion of the Company’s financial instruments, fair value estimates are based on judgments regarding future expected loss experience, current economic conditions, risk characteristics of various financial instruments, and other factors. These estimates are subjective in nature and involve uncertainties and matters of significant judgment and therefore cannot be determined with precision.
The fair value estimates presented below are based on pertinent information available to management as of December 31, 2015 and December 31, 2014. Although management is not aware of any factors that would significantly affect the estimated fair value amounts, such amounts have not been comprehensively revalued since the dates presented herein and, therefore, current estimates of fair value may differ significantly from the amounts presented.
The fair value measurement and disclosure guidance contained in FASB ASC Topic 820 defines fair value as the exchange price that would be received for an asset or paid to transfer a liability (an exit price) in the principal or most advantageous market for the asset or liability in an orderly transaction between market participants on the measurement date. The guidance also establishes a fair value hierarchy which requires an entity to maximize the use of observable inputs and minimize the use of unobservable inputs when measuring fair value. The standard describes three levels of inputs that may be used to measure fair value.
Level 1
The fair values of Level 1 assets are determined by quoted prices in active markets for identical assets or liabilities. Level 1 assets and liabilities include debt and equity securities that are traded in an active exchange market, as well as certain U.S. Treasury debt securities.
Level 2
Observable inputs other than Level 1 prices, such as quoted prices for similar assets or liabilities; quoted prices in markets that are not active; or other inputs that are observable or can be corroborated by observable market data for substantially the full term of the assets or liabilities. Level 2 assets and liabilities include debt securities with quoted prices that are traded less frequently than exchange-traded instruments whose value is determined using a pricing model with inputs that are observable in the market or can be derived principally from or corroborated by observable market data. This category generally includes certain U.S. Government and agency mortgage-backed debt securities, SBA asset-backed securities, securities issued by state and local governments, and corporate debt securities.
ASB BANCORP, INC. AND SUBSIDIARY
NOTES TO CONSOLIDATED FINANCIAL STATEMENTS
13. FAIR VALUE MEASUREMENTS (Continued)
Level 3
Unobservable inputs that are supported by little or no market activity and that are significant to the fair value of the assets or liabilities. Level 3 assets and liabilities include financial instruments whose value is determined using pricing models, discounted cash flow methodologies, or similar techniques, as well as instruments for which the determination of fair value requires significant management judgment or estimation. This category generally includes certain private equity investments, loans receivable held for investment, accrued interest receivable and payable, time deposits, repurchase agreements, and FHLB advances.
The methodologies for estimating fair values of financial assets and financial liabilities were determined as discussed below. The estimated fair value approximates carrying value for cash and cash equivalents, accrued interest, Federal Home Loan Bank Stock and demand deposits.
Investment Securities – Investment securities available for sale are recorded at fair value on a recurring basis. Fair value measurement is primarily based upon quoted prices of like or similar securities, if available. If quoted prices are not available, fair values are measured using independent pricing models or other model-based valuation techniques such as the present value of future cash flows, adjusted for the security’s credit rating, prepayment assumptions and other factors such as credit loss assumptions. The fair values of investments in mutual funds are determined by quoted prices and are included as recurring Level 1 assets. The fair values of investments in securities issued by U.S. GSEs, asset-backed securities issued by the SBA, residential mortgage-backed securities issued by U.S. GSEs, and securities issued by state and local governments are measured using independent pricing models or other model-based valuation techniques such as the present value of future cash flows, adjusted for the security’s credit rating, prepayment assumptions and other factors such as credit loss assumptions and are included as recurring Level 2 assets.
Loans Held for Sale – Loans held for sale are residential mortgages carried at the lower of cost or market value. The market values of loans held for sale are based on what mortgage buyers are currently offering on a “best efforts” basis to buy the loans. As such, mortgages held for sale are classified as nonrecurring Level 2 assets.
Loans Receivable – For variable rate loans, carrying value is a reasonable estimate of fair value. For fixed rate loans, fair values are estimated based on discounted future cash flows using the current interest rates at which loans with similar terms would be made to borrowers of similar credit quality. Valuation adjustments are made for credit risk, which are represented by the allowance for loan losses, but do not include adjustments for illiquidity or other market risks.
The Bank does not record loans at fair value on a recurring basis. However, from time to time, a loan is considered impaired and an allowance for loan losses is established. Loans for which it is probable that payment of interest and principal will not be made in accordance with the contractual terms of the loan agreement are considered impaired. Once a loan is identified as individually impaired, management measures impairment in accordance with the accounting guidance contained in FASB ASC Topic 310: Receivables (“FASB ASC Topic 310”). The fair value of impaired loans is estimated using one of several methods, including collateral value, market value of similar debt, enterprise value, liquidation value, or discounted cash flows. Those impaired loans not requiring an allowance represent loans for which the fair value of the expected repayments or collateral exceed the recorded investments in such loans. Substantially all of the total impaired loans were evaluated based on the fair value of the collateral. In accordance with the fair value measurement and disclosure guidance contained in FASB ASC Topic 820, impaired loans where an allowance is established based on the fair value of collateral require classification in the fair value hierarchy.
ASB BANCORP, INC. AND SUBSIDIARY
NOTES TO CONSOLIDATED FINANCIAL STATEMENTS
13. FAIR VALUE MEASUREMENTS (Continued)
When the fair value of the collateral is based on an observable market price or a current appraised value, the impaired loan is recorded as nonrecurring Level 2 assets. When an appraised value is not available or management determines the fair value of the collateral is further impaired below the appraised value and there is no observable market price, the Bank records the impaired loan as nonrecurring Level 3 assets.
Accrued Interest Receivable and Payable – The carrying amount is a reasonable estimate of fair value.
Deferred Compensation Assets – Assets include debt and equity securities that are traded in an active exchange market. Fair values are obtained from quoted prices in active markets for identical assets.
Demand and Savings Deposits – By definition, the carrying values are equal to the fair values.
Time Deposits and Repurchase Agreements – Fair value of fixed maturity certificates of deposit is estimated using the FHLB Rate Curve for similar remaining maturities. Fair value of repurchase agreements is estimated using the borrowing rate for overnight borrowings.
Federal Home Loan Bank Advances – The fair value of Federal Home Loan Bank advances is estimated using the rates currently offered for advances of similar remaining maturities.
Deferred Compensation Liabilities – Fair values are measured based on the fair values of the related deferred compensation assets.
Defined Benefit Plan Assets – The Nonqualified Defined Benefit Plan had no plan assets because it was not funded. The assets of the Qualified Defined Benefit Plan, which are invested in interest-bearing depository accounts and money market, debt and equity security mutual funds, are included at fair value in the Qualified Plan’s separate financial statements. Fair value measurement is based upon quoted prices of like or similar securities. The fair values of the Plan’s investments in interest-bearing depository accounts and money market, debt and equity security mutual funds are determined by quoted prices and are included as recurring Level 1 assets.
Foreclosed Properties – Foreclosed properties are measured and recorded at the lower of cost or estimated fair value. The fair value of foreclosed properties is measured using the current appraised value of the property less the estimated expenses necessary to sell the property. Foreclosed properties are classified as nonrecurring Level 3 assets.
ASB BANCORP, INC. AND SUBSIDIARY
NOTES TO CONSOLIDATED FINANCIAL STATEMENTS
13. FAIR VALUE MEASUREMENTS (Continued)
The estimated fair values and carrying amounts of financial instruments follow:
|
Fair Value Measurement Using
|
Total
Carrying
Amount In
Balance
Sheet
|
|||||||||||||||||||
|
(Dollars in thousands)
|
Level 1
|
Level 2
|
Level 3
|
Estimated
Fair Value
|
||||||||||||||||
|
December 31, 2015
|
||||||||||||||||||||
|
Financial assets:
|
||||||||||||||||||||
|
Cash and cash equivalents
|
$
|
33,401
|
$
|
-
|
$
|
-
|
$
|
33,401
|
$
|
33,401
|
||||||||||
|
Securities available for sale
|
758
|
136,797
|
-
|
137,555
|
137,555
|
|||||||||||||||
|
Securities held to maturity
|
-
|
4,086
|
-
|
4,086
|
3,809
|
|||||||||||||||
|
Investments in FHLB stock
|
-
|
-
|
2,807
|
2,807
|
2,807
|
|||||||||||||||
|
Loans held for sale
|
-
|
7,169
|
-
|
7,169
|
7,018
|
|||||||||||||||
|
Loans receivable, net
|
-
|
-
|
572,286
|
572,286
|
569,798
|
|||||||||||||||
|
Accrued interest receivable
|
-
|
-
|
2,456
|
2,456
|
2,456
|
|||||||||||||||
|
Deferred compensation assets
|
1,359
|
-
|
-
|
1,359
|
1,359
|
|||||||||||||||
|
Financial liabilities:
|
||||||||||||||||||||
|
Demand deposits
|
-
|
-
|
495,628
|
495,628
|
495,628
|
|||||||||||||||
|
Time deposits
|
-
|
-
|
135,212
|
135,212
|
135,276
|
|||||||||||||||
|
Repurchase agreements
|
-
|
-
|
324
|
324
|
327
|
|||||||||||||||
|
Federal Home Loan Bank Advances
|
-
|
-
|
52,116
|
52,116
|
50,000
|
|||||||||||||||
|
Deferred compensation liabilities
|
1,365
|
-
|
-
|
1,365
|
1,365
|
|||||||||||||||
|
Accrued interest payable
|
-
|
-
|
121
|
121
|
121
|
|||||||||||||||
|
Financial instruments whose contract amounts represent credit risk:
|
||||||||||||||||||||
|
Commitments to extend or originate credit
|
-
|
-
|
-
|
-
|
-
|
|||||||||||||||
|
Commitments under standby letters of credit
|
-
|
-
|
-
|
-
|
-
|
|||||||||||||||
ASB BANCORP, INC. AND SUBSIDIARY
NOTES TO CONSOLIDATED FINANCIAL STATEMENTS
13. FAIR VALUE MEASUREMENTS (Continued)
|
Fair Value Measurement Using
|
Total
Carrying
Amount In
Balance
Sheet
|
|||||||||||||||||||
|
(Dollars in thousands)
|
Level 1
|
Level 2
|
Level 3
|
Estimated
Fair Value
|
||||||||||||||||
|
December 31, 2014
|
||||||||||||||||||||
|
Financial assets:
|
||||||||||||||||||||
|
Cash and cash equivalents
|
$
|
56,858
|
$
|
-
|
$
|
-
|
$
|
56,858
|
$
|
56,858
|
||||||||||
|
Securities available for sale
|
746
|
140,716
|
-
|
141,462
|
141,462
|
|||||||||||||||
|
Securities held to maturity
|
-
|
4,363
|
-
|
4,363
|
3,999
|
|||||||||||||||
|
Investments in FHLB stock
|
-
|
-
|
2,902
|
2,902
|
2,902
|
|||||||||||||||
|
Loans held for sale
|
-
|
5,350
|
-
|
5,350
|
5,237
|
|||||||||||||||
|
Loans receivable, net
|
-
|
-
|
516,752
|
516,752
|
515,871
|
|||||||||||||||
|
Accrued interest receivable
|
-
|
-
|
2,230
|
2,230
|
2,230
|
|||||||||||||||
|
Deferred compensation assets
|
1,418
|
-
|
-
|
1,418
|
1,418
|
|||||||||||||||
|
Financial liabilities:
|
||||||||||||||||||||
|
Demand deposits
|
-
|
-
|
449,286
|
449,286
|
449,286
|
|||||||||||||||
|
Time deposits
|
-
|
-
|
153,994
|
153,994
|
154,093
|
|||||||||||||||
|
Repurchase agreements
|
-
|
-
|
653
|
653
|
660
|
|||||||||||||||
|
Federal Home Loan Bank Advances
|
-
|
-
|
53,382
|
53,382
|
50,000
|
|||||||||||||||
|
Deferred compensation liabilities
|
1,418
|
-
|
-
|
1,418
|
1,418
|
|||||||||||||||
|
Accrued interest payable
|
-
|
-
|
115
|
115
|
115
|
|||||||||||||||
|
Financial instruments whose contract amounts represent credit risk:
|
||||||||||||||||||||
|
Commitments to extend or originate credit
|
-
|
-
|
-
|
-
|
-
|
|||||||||||||||
|
Commitments under standby letters of credit
|
-
|
-
|
-
|
-
|
-
|
|||||||||||||||
ASB BANCORP, INC. AND SUBSIDIARY
NOTES TO CONSOLIDATED FINANCIAL STATEMENTS
13. FAIR VALUE MEASUREMENTS (Continued)
Assets and Liabilities Recorded at Fair Value on a Recurring Basis
Below is a table that presents information about certain assets and liabilities measured at fair value on a recurring basis. There were no transfers to or from Levels 1 and 2 during the years ended December 31, 2015 and December 31, 2014.
|
(Dollars in thousands)
|
Fair Value Measurement Using
|
|||||||||||||||||||
|
Description
|
Level 1
|
Level 2
|
Level 3
|
Total
Carrying
Amount In
Balance
Sheets
|
Assets/
Liabilities
Measured At
Fair Value
|
|||||||||||||||
|
December 31, 2015
|
||||||||||||||||||||
|
Securities available for sale:
|
||||||||||||||||||||
|
U.S. GSE and agency securities
|
$
|
-
|
$
|
2,114
|
$
|
-
|
$
|
2,114
|
$
|
2,114
|
||||||||||
|
Asset-backed SBA securities
|
-
|
17,144
|
-
|
17,144
|
17,144
|
|||||||||||||||
|
Residential mortgage-backed securities issued by GSEs
|
-
|
50,948
|
-
|
50,948
|
50,948
|
|||||||||||||||
|
State and local government securities
|
-
|
66,591
|
-
|
66,591
|
66,591
|
|||||||||||||||
|
Mutual funds
|
758
|
-
|
-
|
758
|
758
|
|||||||||||||||
|
Total
|
$
|
758
|
$
|
136,797
|
$
|
-
|
$
|
137,555
|
$
|
137,555
|
||||||||||
|
Defined benefit plan assets:
|
||||||||||||||||||||
|
Cash and cash equivalents
|
$
|
652
|
$
|
-
|
$
|
-
|
||||||||||||||
|
Money market mutual funds
|
145
|
-
|
-
|
|||||||||||||||||
|
Debt security mutual funds
|
12,089
|
-
|
-
|
|||||||||||||||||
|
Equity security mutual funds
|
3,231
|
-
|
-
|
|||||||||||||||||
|
Defined benefit plan liabilities:
|
||||||||||||||||||||
|
Administrative Fees
|
8
|
-
|
-
|
|||||||||||||||||
|
Total assets, net of liabilities
|
$
|
16,109
|
$
|
-
|
$
|
-
|
||||||||||||||
|
December 31, 2014
|
||||||||||||||||||||
|
Securities available for sale:
|
||||||||||||||||||||
|
U.S. GSE and agency securities
|
$
|
-
|
$
|
2,138
|
$
|
-
|
$
|
2,138
|
$
|
2,138
|
||||||||||
|
Asset-backed SBA securities
|
-
|
28,465
|
-
|
28,465
|
28,465
|
|||||||||||||||
|
Residential mortgage-backed securities issued by GSEs
|
-
|
67,421
|
-
|
67,421
|
67,421
|
|||||||||||||||
|
State and local government securities
|
-
|
42,692
|
-
|
42,692
|
42,692
|
|||||||||||||||
|
Mutual funds
|
746
|
-
|
-
|
746
|
746
|
|||||||||||||||
|
Total
|
$
|
746
|
$
|
140,716
|
$
|
-
|
$
|
141,462
|
$
|
141,462
|
||||||||||
|
Defined benefit plan assets:
|
||||||||||||||||||||
|
Cash and cash equivalents
|
$
|
489
|
$
|
-
|
$
|
-
|
||||||||||||||
|
Money market mutual funds
|
145
|
-
|
-
|
|||||||||||||||||
|
Debt security mutual funds
|
14,166
|
-
|
-
|
|||||||||||||||||
|
Equity security mutual funds
|
3,553
|
-
|
-
|
|||||||||||||||||
|
Total
|
$
|
18,353
|
$
|
-
|
$
|
-
|
||||||||||||||
ASB BANCORP, INC. AND SUBSIDIARY
NOTES TO CONSOLIDATED FINANCIAL STATEMENTS
13. FAIR VALUE MEASUREMENTS (Continued)
Assets and Liabilities Recorded at Fair Value on a Nonrecurring Basis
As may be required from time to time, certain assets may be recorded at fair value on a nonrecurring basis in certain circumstances such as evidence of impairment in accordance with U.S. GAAP. Assets measured at fair value on a nonrecurring basis segregated by the level of the valuation inputs within the fair value hierarchy that were held for the periods indicated are in the table below.
|
(Dollars in thousands)
|
Fair Value Measurement Using
|
|||||||||||||||||||
|
Description
|
Level 1
|
Level 2
|
Level 3
|
Total
Carrying
Amount In
Balance
Sheets (1)
|
Assets/
Liabilities
Measured At
Fair Value (1)
|
|||||||||||||||
|
December 31, 2015
|
||||||||||||||||||||
|
Impaired loans
|
$
|
-
|
$
|
-
|
$
|
1,876
|
$
|
1,876
|
$
|
1,876
|
||||||||||
|
Foreclosed properties
|
-
|
-
|
1,682
|
1,682
|
1,682
|
|||||||||||||||
|
December 31, 2014
|
||||||||||||||||||||
|
Impaired loans
|
$
|
-
|
$
|
-
|
$
|
1,847
|
$
|
1,847
|
$
|
1,847
|
||||||||||
|
Foreclosed properties
|
-
|
-
|
4,341
|
4,341
|
4,341
|
|||||||||||||||
| (1) | Properties recorded at cost and not market are excluded. |
Quantitative Information About Level 3 Fair Value Measurements
The following table presents quantitative information about financial and nonfinancial assets measured at fair value on a nonrecurring basis using Level 3 valuation inputs:
|
(Dollars in thousands)
|
Fair
Value (1)
|
Valuation Technique
|
Unobservable Input
|
Discount
Range
(Weighted
Average)
|
||||||
|
December 31, 2015
|
||||||||||
|
Impaired loans
|
$
|
1,876
|
Discounted appraisals (2)
|
Collateral discounts (3)
|
0%-36% (21
|
%)
|
||||
|
Foreclosed properties
|
1,682
|
Discounted appraisals (2)
|
Collateral discounts (3)
|
0%-22% (5
|
%)
|
|||||
|
December 31, 2014
|
||||||||||
|
Impaired loans
|
$
|
1,847
|
Discounted appraisals (2)
|
Collateral discounts (3)
|
6%-35% (13
|
%)
|
||||
|
Foreclosed properties
|
4,341
|
Discounted appraisals (2)
|
Collateral discounts (3)
|
0%-40% (9
|
%)
|
|||||
| (1) | Properties recorded at cost and not market are excluded. |
| (2) | Fair value is generally based on appraisals of the underlying collateral. |
| (3) | Appraisals of collateral may be adjusted by management for customized discounting criteria, estimated sales costs, and proprietary qualitative adjustments. |
ASB BANCORP, INC. AND SUBSIDIARY
NOTES TO CONSOLIDATED FINANCIAL STATEMENTS
14. CONDENSED FINANCIAL STATEMENTS OF PARENT COMPANY
The following financial information pertains to ASB Bancorp, Inc. (parent company only), and should be read in conjunction with the consolidated financial statements of the Company.
Condensed Balance Sheets
|
December 31,
|
||||||||
|
(Dollars in thousands)
|
2015
|
2014
|
||||||
|
Assets
|
||||||||
|
Cash on deposit with bank subsidiary
|
$
|
711
|
$
|
911
|
||||
|
Interest-earning deposits with other financial institutions
|
1,040
|
2,313
|
||||||
|
Total cash and cash equivalents
|
1,751
|
3,224
|
||||||
|
ESOP loan receivable
|
3,342
|
3,621
|
||||||
|
Investment in bank subsidiary
|
84,122
|
87,242
|
||||||
|
Other assets
|
535
|
376
|
||||||
|
Total assets
|
$
|
89,750
|
$
|
94,463
|
||||
|
Liabilities and Shareholders’ Equity
|
||||||||
|
Other liabilities
|
$
|
68
|
$
|
66
|
||||
|
Total liabilities
|
68
|
66
|
||||||
|
Total shareholders’ equity
|
89,682
|
94,397
|
||||||
|
Total liabilities and shareholders’ equity
|
$
|
89,750
|
$
|
94,463
|
||||
Condensed Statements of Net Income
|
Year Ended December 31,
|
||||||||||||
|
(Dollars in thousands)
|
2015
|
2014
|
2013
|
|||||||||
|
Dividend distributions from bank subsidiary
|
$
|
8,500
|
$
|
5,000
|
$
|
-
|
||||||
|
Other interest and dividend income
|
125
|
150
|
246
|
|||||||||
|
Other noninterest income
|
-
|
(5
|
)
|
4
|
||||||||
|
Total income
|
8,625
|
5,145
|
250
|
|||||||||
|
Noninterest expenses
|
615
|
566
|
517
|
|||||||||
|
Total expenses
|
615
|
566
|
517
|
|||||||||
|
Income (loss) before income taxes and equity in income of bank subsidiary net of dividend distributions
|
8,010
|
4,579
|
(267
|
)
|
||||||||
|
Income tax benefit
|
(166
|
)
|
(143
|
)
|
(91
|
)
|
||||||
|
Net income (loss) before equity in income of bank subsidiary net of dividend distributions
|
8,176
|
4,722
|
(176
|
)
|
||||||||
|
Equity in income of bank subsidiary net of dividend distributions
|
(4,601
|
)
|
(2,233
|
)
|
1,630
|
|||||||
|
Net income
|
$
|
3,575
|
$
|
2,489
|
$
|
1,454
|
||||||
ASB BANCORP, INC. AND SUBSIDIARY
NOTES TO CONSOLIDATED FINANCIAL STATEMENTS
14. CONDENSED FINANCIAL STATEMENTS OF PARENT COMPANY (Continued)
Condensed Statements of Cash Flows
|
Year Ended December 31,
|
||||||||||||
|
(Dollars in thousands)
|
2015
|
2014
|
2013
|
|||||||||
|
Operating Activities
|
||||||||||||
|
Net income
|
$
|
3,575
|
$
|
2,489
|
$
|
1,454
|
||||||
|
Adjustments to reconcile net income to net cash provided by (used in) operating activities:
|
||||||||||||
|
Equity in income of bank subsidiary net of dividend distributions
|
4,601
|
2,233
|
(1,630
|
)
|
||||||||
|
Net amortization of premiums on securities
|
-
|
32
|
121
|
|||||||||
|
Loss (gain) on sale of securities
|
-
|
5
|
(4
|
)
|
||||||||
|
Increase in income tax receivable
|
(168
|
)
|
(144
|
)
|
(90
|
)
|
||||||
|
Decrease in interest receivable
|
-
|
13
|
16
|
|||||||||
|
Net change in other assets and liabilities
|
11
|
31
|
(22
|
)
|
||||||||
|
Net cash provided by (used in) operating activities
|
8,019
|
4,659
|
(155
|
)
|
||||||||
|
Investing Activities
|
||||||||||||
|
Securities available for sale:
|
||||||||||||
|
Proceeds from sales
|
-
|
3,755
|
1,101
|
|||||||||
|
Principal repayments on mortgage-backed and asset-backed securities
|
-
|
412
|
2,088
|
|||||||||
|
ESOP principal payments received
|
279
|
271
|
262
|
|||||||||
|
Net cash provided by investing activities
|
279
|
4,438
|
3,451
|
|||||||||
|
Financing Activities
|
||||||||||||
|
Proceeds from exercise of stock options
|
722
|
25
|
-
|
|||||||||
|
Proceeds from bank subsidiary for stock-based compensation expense
|
1,082
|
1,484
|
1,026
|
|||||||||
|
Common stock repurchased
|
(11,575
|
)
|
(12,902
|
)
|
(9,144
|
)
|
||||||
|
Net cash used in financing activities
|
(9,771
|
)
|
(11,393
|
)
|
(8,118
|
)
|
||||||
|
Net decrease in cash and cash equivalents
|
(1,473
|
)
|
(2,296
|
)
|
(4,822
|
)
|
||||||
|
Cash and cash equivalents:
|
||||||||||||
|
Beginning of period
|
3,224
|
5,520
|
10,342
|
|||||||||
|
End of period
|
$
|
1,751
|
$
|
3,224
|
$
|
5,520
|
||||||
|
SUPPLEMENTAL DISCLOSURES:
|
||||||||||||
|
Non-cash investing and financing transactions:
|
||||||||||||
|
Change in unrealized gain on securities available for sale
|
$
|
-
|
$
|
28
|
$
|
(90
|
)
|
|||||
|
Change in deferred income taxes resulting from other comprehensive income
|
-
|
(11
|
)
|
35
|
||||||||
ASB BANCORP, INC. AND SUBSIDIARY
NOTES TO CONSOLIDATED FINANCIAL STATEMENTS
15. UNAUDITED INTERIM FINANCIAL INFORMATION
The unaudited condensed statements of income (loss) for each of the quarters are summarized below for the periods indicated.
|
Three Months Ended
|
||||||||||||||||
|
December 31,
2015 |
September 30,
2015 |
June 30,
2015 |
March 31,
2015 |
|||||||||||||
|
Interest and dividend income
|
$
|
6,533
|
$
|
6,459
|
$
|
6,289
|
$
|
6,154
|
||||||||
|
Interest expense
|
867
|
877
|
880
|
861
|
||||||||||||
|
Net interest income
|
5,666
|
5,582
|
5,409
|
5,293
|
||||||||||||
|
Provision for (recovery of) loan losses
|
(89
|
)
|
191
|
65
|
194
|
|||||||||||
|
Net interest income after provision for (recovery of) loan losses
|
5,755
|
5,391
|
5,344
|
5,099
|
||||||||||||
|
Noninterest income
|
1,847
|
2,084
|
1,968
|
1,610
|
||||||||||||
|
Noninterest expenses
|
5,921
|
5,837
|
6,010
|
5,772
|
||||||||||||
|
Income before income tax provision
|
1,681
|
1,638
|
1,302
|
937
|
||||||||||||
|
Income tax provision
|
735
|
496
|
437
|
315
|
||||||||||||
|
Net income
|
$
|
946
|
$
|
1,142
|
$
|
865
|
$
|
622
|
||||||||
|
Net income per common share – Basic
|
$
|
0.25
|
$
|
0.29
|
$
|
0.22
|
$
|
0.16
|
||||||||
|
Net income per common share – Diluted
|
$
|
0.24
|
$
|
0.28
|
$
|
0.21
|
$
|
0.16
|
||||||||
|
Three Months Ended
|
||||||||||||||||
|
December 31,
2014
|
September 30,
2014
|
June 30,
2014
|
March 31,
2014
|
|||||||||||||
|
Interest and dividend income
|
$
|
6,117
|
$
|
5,873
|
$
|
5,771
|
$
|
5,741
|
||||||||
|
Interest expense
|
877
|
886
|
886
|
887
|
||||||||||||
|
Net interest income
|
5,240
|
4,987
|
4,885
|
4,854
|
||||||||||||
|
Provision for (recovery of) loan losses
|
220
|
240
|
(1,390
|
)
|
(68
|
)
|
||||||||||
|
Net interest income after provision for (recovery of) loan losses
|
5,020
|
4,747
|
6,275
|
4,922
|
||||||||||||
|
Noninterest income
|
1,681
|
1,642
|
1,554
|
1,456
|
||||||||||||
|
Noninterest expenses
|
5,714
|
5,624
|
6,350
|
5,860
|
||||||||||||
|
Income before income tax provision
|
987
|
765
|
1,479
|
518
|
||||||||||||
|
Income tax provision
|
345
|
263
|
538
|
114
|
||||||||||||
|
Net income
|
$
|
642
|
$
|
502
|
$
|
941
|
$
|
404
|
||||||||
|
Net income per common share – Basic
|
$
|
0.17
|
$
|
0.12
|
$
|
0.22
|
$
|
0.09
|
||||||||
|
Net income per common share – Diluted
|
$
|
0.16
|
$
|
0.12
|
$
|
0.22
|
$
|
0.09
|
||||||||
|
Item 9.
|
Changes in and Disagreements with Accountants on Accounting and Financial Disclosure
|
None.
The Company’s management has carried out an evaluation, under the supervision and with the participation of the Company’s principal executive officer and principal financial officer, of the effectiveness of the “disclosure controls and procedures,” as such term is defined in Rule 13a-15(e) promulgated under the Securities Exchange Act of 1934, as amended (the “Exchange Act”). Based on this evaluation, the Company’s principal executive officer and principal financial officer concluded that, as of the end of the period covered by this report, the Company’s disclosure controls and procedures were effective for the purpose of ensuring that information required to be disclosed by the Company in reports that it files or submits under the Exchange Act (i) is recorded, processed, summarized and reported, within the time periods specified in the Securities and Exchange Commission’s rules and forms, and (ii) is accumulated and communicated to the Company’s management, including its principal executive and principal financial officers, as appropriate, to allow timely decisions regarding required disclosure.
Changes in Internal Control Over Financial Reporting
Management of the Company has evaluated, with the participation of the Company’s principal executive officer and principal financial officer, changes in the Company’s internal control over financial reporting as defined in Rule 13a-15(f) of the Exchange Act during the quarter ended December 31, 2015. In connection with the above evaluation of the effectiveness of the Company’s disclosure controls and procedures, no changes in its internal control over financial reporting were identified as having occurred during the quarter ended December 31, 2015 that have materially affected, or are reasonably likely to materially affect, the Company’s internal control over financial reporting.
MANAGEMENT’S ANNUAL REPORT ON INTERNAL CONTROL OVER FINANCIAL REPORTING
The management of ASB Bancorp, Inc. is responsible for establishing and maintaining adequate internal control over financial reporting. ASB Bancorp, Inc.’s internal control system was designed to provide reasonable assurance to the Company’s management and Board of Directors regarding the preparation and fair presentation of published financial statements. Management assessed the effectiveness of the Company’s internal control over financial reporting as of December 31, 2015. In making this assessment, it used criteria set forth by the Committee of Sponsoring Organizations of the Treadway Commission (“COSO”) in Internal Control-Integrated Framework (2013). Based on that assessment, ASB Bancorp, Inc.’s management believes that the Company maintained effective internal control over financial reporting as of December 31, 2015.
All internal control systems, no matter how well designed, have inherent limitations. Therefore, even those systems determined to be effective can provide only reasonable assurance with respect to financial statement preparation and presentation. A control deficiency exists when the design or operation of a control does not allow management or employees, in the normal course of performing their assigned functions, to prevent or detect misstatements on a timely basis. A significant deficiency is a control deficiency, or combination of control deficiencies, in internal control over financial reporting that is less severe than a material weakness, yet important enough to merit attention by those responsible for oversight of the Company’s financial reporting. A material weakness in internal control over financial reporting is a control deficiency, or combination of control deficiencies, in internal control over financial reporting such that there is a reasonable possibility that a material misstatement of a company’s annual or interim financial statements will not be prevented or detected on a timely basis.
The Company’s independent registered public accounting firm that audited the Company’s consolidated financial statements included in this annual report has issued an audit report on the Company’s internal control over financial reporting.
|
/s/ SUZANNE S. DEFERIE
|
/s/ KIRBY A. TYNDALL
|
|
|
President and Chief
|
Executive Vice President and
|
|
|
Executive Officer
|
Chief Financial Officer
|

Report of Independent Registered Public Accounting Firm
Board of Directors and Shareholders
ASB Bancorp, Inc. and Subsidiary
We have audited the internal control over financial reporting of ASB Bancorp, Inc. and Subsidiary (the “Company”) as of December 31, 2015, based on criteria established in Internal Control-Integrated Framework (2013) issued by the Committee of Sponsoring Organizations of the Treadway Commission. The Company’s management is responsible for maintaining effective internal control over financial reporting and for its assessment of the effectiveness of internal control over financial reporting, included in the accompanying Management’s Annual Report on Internal Control over Financial Reporting. Our responsibility is to express an opinion on the Company’s internal control over financial reporting based on our audit.
We conducted our audit in accordance with the standards of the Public Company Accounting Oversight Board (United States). Those standards require that we plan and perform the audit to obtain reasonable assurance about whether effective internal control over financial reporting was maintained in all material respects. Our audit included obtaining an understanding of internal control over financial reporting, assessing the risk that a material weakness exists, and testing and evaluating the design and operating effectiveness of internal control based on the assessed risk. Our audit also included performing such other procedures as we considered necessary in the circumstances. We believe that our audit provides a reasonable basis for our opinion.
A company’s internal control over financial reporting is a process designed to provide reasonable assurance regarding the reliability of financial reporting and the preparation of financial statements for external purposes in accordance with generally accepted accounting principles. A company’s internal control over financial reporting includes those policies and procedures that (1) pertain to the maintenance of records that, in reasonable detail, accurately and fairly reflect the transactions and dispositions of the assets of the company; (2) provide reasonable assurance that transactions are recorded as necessary to permit preparation of financial statements in accordance with generally accepted accounting principles, and that receipts and expenditures of the company are being made only in accordance with authorizations of management and directors of the company; and (3) provide reasonable assurance regarding prevention or timely detection of unauthorized acquisition, use, or disposition of the company’s assets that could have a material effect on the financial statements.
Because of its inherent limitations, internal control over financial reporting may not prevent or detect misstatements. Also, projections of any evaluation of effectiveness to future periods are subject to the risk that controls may become inadequate because of changes in conditions, or that the degree of compliance with the policies or procedures may deteriorate.
In our opinion, ASB Bancorp, Inc. and Subsidiary maintained, in all material respects, effective internal control over financial reporting as of December 31, 2015, based on criteria established in Internal Control-Integrated Framework (2013) issued by the Committee of Sponsoring Organizations of the Treadway Commission.
We have also audited, in accordance with the standards of the Public Company Accounting Oversight Board (United States), the consolidated financial statements of ASB Bancorp, Inc. and Subsidiary as of December 31, 2015 and 2014 and for each of the years in the three-year period ended December 31, 2015, and our report, dated March 14, 2016, expressed an unqualified opinion on those consolidated financial statements.
|
/s/ DIXON HUGHES GOODMAN LLP
|
|
|
Atlanta, Georgia
|
|
|
March 14, 2016
|
Not applicable.
Part III
In response to this Item, this information is contained in our Proxy Statement for the 2016 Annual Meeting of Shareholders and is incorporated herein by reference.
In response to this Item, this information is contained in our Proxy Statement for the 2016 Annual Meeting of Shareholders and is incorporated herein by reference.
| Item 12. | Security Ownership of Certain Beneficial Owners and Management and Related Shareholder Matters |
The following table sets forth information as of December 31, 2015 regarding shares of our common stock that may be issued upon exercise of options previously granted and currently outstanding under our stock option plans, as well as the number of shares available for the grant of options that had not been granted as of that date.
Equity Compensation Plan Information
|
Plan Category
|
Number Of securities To
Be Issued Upon Exercise
Of Outstanding Options
Warrants And Rights
(a)
|
Weighted-Average
Exercise Price
Of Outstanding Options
Warrants And Rights
(b)
|
Number Of Securities
Remaining Available For
Future Issuance Under
Equity Compensation
Plans (Excluding
Securities Reflected In
Column (a)
(c)
|
|||||||||
|
Equity compensation plans approved by security holders
|
450,500
|
$
|
16.03
|
60,355
|
||||||||
|
Equity compensation plans not approved by security holders
|
–
|
N/A
|
–
|
|||||||||
|
Total
|
450,500
|
$
|
16.03
|
60,355
|
||||||||
The remaining information required by Part III, Item 12 of Form 10-K is contained in our Proxy Statement for the 2016 Annual Meeting of Shareholders and is incorporated herein by reference.
In response to this Item, this information is contained in our Proxy Statement for the 2016 Annual Meeting of Shareholders and is incorporated herein by reference.
In response to this Item, this information is contained in our Proxy Statement for the 2016 Annual Meeting of Shareholders and is incorporated herein by reference.
Part IV
| (1) | The financial statements required in response to this item are incorporated herein by reference from Item 8 of this Annual Report on Form 10-K. |
| (2) | All financial statement schedules are omitted because they are not required or applicable, or the required information is shown in the consolidated financial statements or the notes thereto. |
| (3) | Exhibits |
|
3.1
|
Articles of Incorporation of ASB Bancorp, Inc. (1)
|
|
|
3.2
|
Bylaws of ASB Bancorp, Inc. (1)
|
|
|
3.3
|
Amendment of the Bylaws of ASB Bancorp, Inc., adopted September 15, 2014 (7)
|
|
|
4.1
|
Form of Common Stock Certificate of ASB Bancorp, Inc. (1)
|
|
|
10.1
|
Employment Agreement, amended and restated as of June 16, 2015, by and between ASB Bancorp, Inc., Asheville Savings Bank, S.S.B. and Suzanne S. DeFerie * (2)
|
|
|
10.2
|
Employment Agreement, amended and restated as of June 16, 2015, by and between ASB Bancorp, Inc., Asheville Savings Bank, S.S.B. and Kirby A. Tyndall * (2)
|
|
|
10.3
|
Employment Agreement, amended and restated as of June 16, 2015, by and between ASB Bancorp, Inc., Asheville Savings Bank, S.S.B. and David A. Kozak * (2)
|
|
|
10.4
|
Employment Agreement, amended and restated as of June 16, 2015, by and between ASB Bancorp, Inc., Asheville Savings Bank, S.S.B. and Vikki D. Bailey * (2)
|
|
|
10.5
|
Asheville Savings Bank, S.S.B. Change In Control Severance Plan * (3)
|
|
|
10.6
|
ASB Bancorp, Inc. Stock-Based Deferral Plan * (3)
|
|
|
10.7
|
ASB Bancorp, Inc. 2012 Equity Incentive Plan * (4)
|
|
|
10.8
|
Stock Repurchase Agreement with Stilwell Value Partners II, L.P., Stilwell Value Partners V, L.P., Stilwell Value Partners VII, L.P., Stilwell Activist Fund, L.P., Stilwell Activist Investments, L.P., Stilwell Associates, L.P., and Stilwell Partners, L.P. (6)
|
|
|
10.9
|
Stock Repurchase Agreement with FVP Master Fund, L.P. (8)
|
|
|
10.10
|
Agreement, dated January 20, 2016, by and among ASB Bancorp, Inc., Asheville Savings Bank, S.S.B., Seidman and Associates, L.L.C., Seidman Investment Partnership, L.P., Seidman Investment Partnership II, L.P., Seidman Investment Partnership III, L.P., LSBK06-08, L.L.C., Broad Park Investors, L.L.C., Chewy Gooey Cookies, L.P., 2514 Multi-Strategy Fund, L.P., CBPS, LLC, Veteri Place Corporation, JBRC I, LLC, Lawrence B. Seidman, and Kenneth J. Wrench (9)
|
|
|
Subsidiaries of ASB Bancorp, Inc.
|
||
|
Consent of Independent Registered Public Accounting Firm
|
||
|
Rule 13a-14(a) Certification of Chief Executive Officer
|
||
|
Rule 13a-14(a) Certification of Chief Financial Officer
|
||
|
Section 1350 Certifications
|
(Continued on following page)
(Continued from previous page)
|
101.0
|
|
The following materials from the Company’s Annual Report on Form 10-K for the year ended December 31, 2015, formatted in XBRL (Extensible Business Reporting Language):
|
|
|
(i) the Consolidated Balance Sheets, (ii) the Consolidated Statements of Income, (iii) the Consolidated Statements of Comprehensive Income (Loss), (iv) the Consolidated Statement of Changes in Shareholders’ Equity, (v) the Consolidated Statements of Cash Flows and (vi) the Notes to Consolidated Financial Statements.
|
|||
|
*
|
Management contract or compensatory plan, contract or arrangement.
|
||
|
(1)
|
Incorporated herein by reference to the exhibits to ASB Bancorp, Inc.’s Registration Statement on Form S-1 (File No. 333-174527), filed with the Securities and Exchange Commission on May 26, 2011.
|
||
|
(2)
|
Incorporated herein by reference to the exhibits to ASB Bancorp, Inc.’s Quarterly Report on Form 10-Q filed with the Securities and Exchange Commission on August 7, 2015.
|
||
|
(3)
|
Incorporated herein by reference to the exhibits to ASB Bancorp, Inc.’s Quarterly Report on Form 10-Q filed with the Securities and Exchange Commission on November 10, 2011.
|
||
|
(4)
|
Incorporated herein by reference to Appendix A to ASB Bancorp, Inc.’s definitive proxy statement on Form DEF14A filed with the Securities and Exchange Commission on April 12, 2012.
|
||
|
(5)
|
Incorporated herein by reference to the exhibits to ASB Bancorp, Inc.’s Current Report on Form 8-K filed with the Securities and Exchange Commission on December 21, 2012.
|
||
|
(6)
|
Incorporated herein by reference to the exhibits to ASB Bancorp, Inc.’s Current Report on Form 8-K filed with the Securities and Exchange Commission on July 22, 2014.
|
||
|
(7)
|
Incorporated herein by reference to the exhibits to ASB Bancorp, Inc.’s Current Report on Form 8-K filed with the Securities and Exchange Commission on September 19, 2014.
|
||
|
(8)
|
Incorporated herein by reference to the exhibits to ASB Bancorp, Inc.’s Current Report on Form 8-K filed with the Securities and Exchange Commission on November 25, 2015.
|
||
|
(9)
|
Incorporated herein by reference to the exhibits to ASB Bancorp, Inc.’s Current Report on Form 8-K filed with the Securities and Exchange Commission on January 21, 2016.
|
||
Pursuant to the requirements of Section 13 or 15(d) of the Securities Exchange Act of 1934, the registrant has duly caused this report to be signed on its behalf by the undersigned, thereunto duly authorized.
|
ASB BANCORP, INC.
|
||
|
By:
|
/s/ SUZANNE S. DEFERIE
|
|
|
Suzanne S. DeFerie
|
||
|
President and Chief Executive Officer
|
||
|
(Principal Executive Officer)
|
Pursuant to the requirements of Section 13 or 15(d) of the Securities Exchange Act of 1934, this report has been signed by the following persons on behalf of the registrant and in the capacities and on the dates indicated.
|
Name
|
Title
|
Date
|
||
|
/s/ SUZANNE S. DEFERIE
|
President and Chief Executive Officer
|
March 14, 2016
|
||
|
Suzanne S. DeFerie
|
(Principal Executive Officer)
|
|||
|
/s/ KIRBY A. TYNDALL
|
Executive Vice President and
|
March 14, 2016
|
||
|
Kirby A. Tyndall
|
Chief Financial Officer
|
|||
|
(Principal Financial and Accounting
Officer)
|
||||
|
/s/ PATRICIA S. SMITH
|
Chairman of the
|
March 14, 2016
|
||
|
Patricia S. Smith
|
Board of Directors
|
|||
|
/s/ JOHN B. GOULD
|
Vice Chairman of the
|
March 14, 2016
|
||
|
John B. Gould
|
Board of Directors
|
|||
|
/s/ JOHN B. DICKSON
|
Director
|
March 14, 2016
|
||
|
John B. Dickson
|
||||
|
/s/ LESLIE D. GREEN
|
Director
|
March 14, 2016
|
||
|
Leslie D. Green
|
||||
|
/s/ KENNETH E. HORNOWSKI
|
Director
|
March 14, 2016
|
||
|
Kenneth E. Hornowski
|
||||
|
/s/ STEPHEN P. MILLER
|
Director
|
March 14, 2016
|
||
|
Stephen P. Miller
|
||||
|
/s/ ALISON J. SMITH
|
Director
|
March 14, 2016
|
||
|
Alison J. Smith
|
||||
|
/s/ WYATT S. STEVENS
|
Director
|
March 14, 2016
|
||
|
Wyatt S. Stevens
|
144