Attached files
| file | filename |
|---|---|
| EX-99.1 - EXHIBIT 99.1 - BENCHMARK ELECTRONICS INC | ex99_1.htm |
| 8-K - FORM 8-K - BENCHMARK ELECTRONICS INC | form8k.htm |

design develop deliver advanced technology Q2 - 2016 Earnings Presentation July 21, 2016

design develop deliver advanced technology 2 Forward - Looking Statements This document contains forward - looking statements within the scope of the Securities Act of 1933 and the Securities Exchange Act of 1934. The words “expect,” “estimate,” “anticipate,” “predict” and similar expressions, and the negatives thereof, often identify forward - looking statements, which are not limited to historical facts. F orward - looking statements include, among other things: guidance for the third quarter of 2016 relating to sales; statements , express or implied, concerning future operating results or margins, the ability to generate sales and income or cash flow; and Benchmark’s business and growth strategies and expected growth and performance. Although Benchmark believes these statements are based upon reasonable assumptions, they involve risks and uncertainties relating to operations , markets and the business environment generally. If one or more of these risks or uncertainties materializes, or underlying assumptions prove incorrect, actual outcomes may vary materially from those indicated. All forward - looking statements included in this document are based upon information available to the Company as of the date of this document, and it assumes no obligation to update them. Readers are advised to consult further disclosures on related subjects, particularly in Item 1A, “Risk Factors”, of the Company’s annual report on Form 10 - K for the year ended December 31, 2015, in its other filings with the Securities and Exchange Commission and in its press releases. Non - GAAP Financial Information This document includes certain financial measures, such as operating margin, that exclude certain items and therefore are not in accordance with generally accepted accounting principles (“GAAP”). A detailed reconciliation between GAAP results and results excluding special items (“non - GAAP”) is included in the Appendix of this document. This document also references “free cash flow”, which the Company defines as cash flow from operations less additions to property, plant and equipment and purchased software.

design develop deliver advanced technology 3 President and CEO Update

design develop deliver advanced technology 4 Second Quarter 2016 Summary ▪ Revenue of $579 million and non - GAAP operating margin of 3.7%, each within expectations − Quarter - over - quarter growth in higher - value markets − Strong performance in Medical and Test & Instrumentation markets ▪ Operating model remains strong, and we are executing cost alignment actions ▪ Cash conversion cycle of 83 days versus 99 days in Q1 - 16; Q4 - 16 target of 75 days ▪ Generated $141 million in free cash flow year - to - date compared to $16 million in the same period in 2015 ▪ Returned $15 million of domestic cash to shareholders through share repurchases - $105 million remaining on our current plan

design develop deliver advanced technology 5 New Business Wins by Segment ▪ 33 manufacturing and 12 engineering project awards ▪ Estimated annual revenue run rate between $105 - 130 million ▪ Continued new business wins in targeted markets Estimated Annual Revenue from New Business Wins Second Quarter 2016 New Business Wins $115 $120 $120 $125 $125 $118 $- $10 $20 $30 $40 $50 $60 $70 $80 $90 $100 $110 $120 $130 $140 $150 $160 Q1-15 Q2-15 Q3-15 Q4-15 Q1-16 Q2-16 $ (USD M)

design develop deliver advanced technology 6 Guidance Net Sales (in millions) $570 – $600 Operating Margin – non - GAAP* 4.1% – 4.4% Interest Expense (in millions) $2.3 million Effective Tax Rate 23% Diluted EPS – GAAP $0.28 – $0.33 Diluted EPS – non - GAAP* $0.33 – $0.38 * The above guidance excludes the impact of amortization of intangible assets – See Appendix 2 Third Quarter 2016 Guidance

design develop deliver advanced technology 7 Q2 2016 Financial Highlights

design develop deliver advanced technology 8 (In millions, except EPS) Jun 30 , 2016 Mar 31 , 2016 Jun 30 , 2015 Net Sales $579.3 $549.2 $664.0 Net Income – GAAP $12.7 $11.1 $21.2 Net Income – non - GAAP $15.2 $13.2 $22.0 Diluted EPS – GAAP $0.26 $0.22 $0.40 Diluted EPS – non - GAAP $0.31 $0.26 $0.42 Operating Margin – GAAP 3.1% 3.0% 3.9% Operating Margin – non - GAAP 3.7% 3.5% 4.2% Effective Tax Rate – non - GAAP 21.8% 21.6% 22.0% For the Three Months Ended Guidance Provided for the June 30, 2016 Quarter: ▪ Revenue (in millions) $570 – $600 ▪ Diluted EPS – non - GAAP $0.29 – $0.33 Second Quarter 2016 Financial Summary

design develop deliver advanced technology 9 27.8 27.2 28.2 19.1 21.3 4.2% 4.3% 4.5% 3.5% 3.7% 0.0% 1.0% 2.0% 3.0% 4.0% 5.0% 6.0% 7.0% 0.0 10.0 20.0 30.0 40.0 50.0 60.0 Q2-15 Q3-15 Q4-15 Q1-16 Q2-16 664 630 626 549 579 8.4% 8.6% 9.1% 9.2% 9.1% 1.0% 3.0% 5.0% 7.0% 9.0% 11.0% 13.0% 15.0% 0 200 400 600 800 1,000 1,200 1,400 Q2-15 Q3-15 Q4-15 Q1-16 Q2-16 9.8% 10.2% 9.8% 9.1% 8.5% 0.0% 2.0% 4.0% 6.0% 8.0% 10.0% 12.0% 14.0% 16.0% 18.0% 20.0% Q2-15 Q3-15 Q4-15 Q1-16 Q2-16 Revenue & Gross Margin ($ M ) Key Business Trends Return on Invested Capital (LTM) ROIC = [(Non - GAAP income from operations plus stock compensation )*( 1 - Tax Rate )] ÷ [ Average Invested Capital less Average Cash for last 5 quarters] Non - GAAP Operating Margin 27.9 27.0 28.6 31.3 31.3 4.2% 4.3% 4.6% 5.7% 5.4% 0.0% 1.0% 2.0% 3.0% 4.0% 5.0% 6.0% 7.0% 8.0% 0.0 10.0 20.0 30.0 40.0 50.0 60.0 70.0 Q2-15 Q3-15 Q4-15 Q1-16 Q2-16 SG&A ($M)

design develop deliver advanced technology 10 Higher - Value Markets Mar 31 , 2016 Jun 30 , 2016 Q3 - 16 Outlook (%) Industrials 39% $213 37% $214 Up Low to Mid - Singles Medical 15% $83 16% $92 Down Mid - Singles Test & Instrumentation 10% $53 10% $60 Flat Total Revenue $349 $366 Traditional Markets Mar 31 , 2016 Jun 30 , 2016 Q3 - 16 Outlook (%) Computing 18% $98 21% $120 Down 15% Telecommunication s 18% $102 16% $93 Up 20% Total Revenue $200 $213 Benchmark Results and Outlook by Market Segment For the Three Months Ended Industrials and Telecommunications Up for Q3 - 16 (1) (1) (1) In millions (1) (1)

design develop deliver advanced technology 11 Balance Sheet and Cash Flows (In millions) Jun 30 , 2016 Mar 31 , 2016 Jun 30, 2015 Cash $573.2* $519.2 $409.3 Debt $229.4 $232.3 $9.2 Cash Flows from (used in) Operating Activities $81.1 $76.5 $52.0 Capital Expenditures $8.4 $7.8 $8.2 Depreciation & Amortization $14.0 $13.9 $12.3 Accounts Receivable $421.9 $414.2 $500.7 Days Sales Outstanding 66 68 68 Inventory $375.1 $389.9 $444.7 Inventory Turns 5.6x 5.1x 5.5x Total Cost of Shares Repurchased $15.1 $14.2 $18.8 * Includes $38 million of cash available in the U.S. Financial Statement Highlights

design develop deliver advanced technology 12 Working Capital Update Ongoing initiatives support improvements from a high number of outsourcing projects in 2015 87 79 78 81 99 91 90 94 99 83 0 20 40 60 80 100 120 140 Q1-14 Q2-14 Q3-14 Q4-14 Q1-15 Q2-15 Q3-15 Q4-15 Q1-16 Q2-16 Accounts Receivable Days Accounts Payable Days Inventory Days Q1 - 14 Q2 - 14 Q3 - 14 Q4 - 14 Q1 - 15 Q2 - 15 Q3 - 15 Q4 - 15 Q1 - 16 Q2 - 16 Accounts Receivable Days 65 63 66 66 71 68 67 69 68 66 Accounts Payable Days 46 41 46 40 39 43 43 40 39 47 Inventory Days 68 57 58 55 67 66 66 65 70 64 Cash Conversion Cycle 87 79 78 81 99 91 90 94 99 83
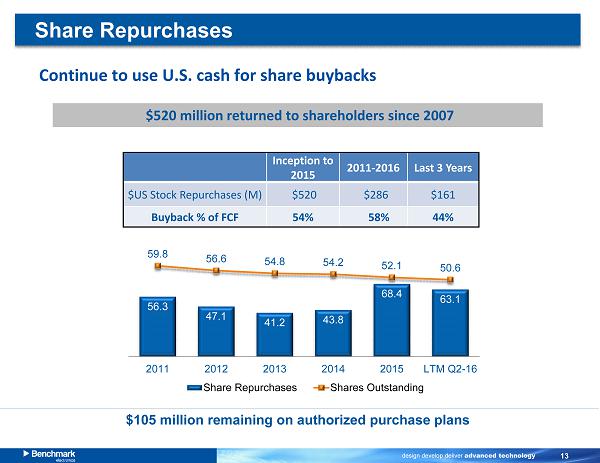
design develop deliver advanced technology 13 Share Repurchases Continue to use U.S. cash for share buybacks $ 520 million returned to shareholders since 2007 $105 m illion remaining on authorized purchase plans Inception to 2015 2011 - 2016 Last 3 Years $US Stock Repurchases (M ) $520 $286 $161 Buyback % of FCF 54% 58% 44% 56.3 47.1 41.2 43.8 68.4 63.1 59.8 56.6 54.8 54.2 52.1 50.6 0.0 10.0 20.0 30.0 40.0 50.0 60.0 70.0 0 10 20 30 40 50 60 70 80 90 100 2011 2012 2013 2014 2015 LTM Q2-16 Share Repurchases Shares Outstanding

design develop deliver advanced technology 14 Strategic Priorities Portfolio Transition ▪ Focus on higher - value markets ▪ More complex products in traditional markets ▪ Better returns on invested capital Margin Expansion ▪ Near - term SG&A investments for sales, marketing, & engineering ▪ Realign cost structure and capacity ▪ Gain leverage from future revenue improvement Cash Generation and Balanced Capital Deployment ▪ Continued progress on cash conversion cycle and free cash flows ▪ Balanced investments in CAPEX, M&A, and share buybacks ▪ Focus on shareholder value

design develop deliver advanced technology 15 Appendix

design develop deliver advanced technology 16 APPENDIX 1 - Reconciliation of GAAP to non - GAAP Financial Results (Amounts in Thousands, Except Per Share Data) – (UNAUDITED) Jun 30, Mar 31, Jun 30, 2016 2016 2015 2016 2015 17,740$ 16,268$ 26,208$ 34,008$ 44,916$ 3,602 2,789 1,588 6,391 6,457 21,342$ 19,057$ 27,796$ 40,399$ 51,373$ 12,685$ 11,052 21,210 23,737 35,415 3,602 2,789 1,588 6,391 6,457 (1,078) (691) (816) (1,769) (2,089) 15,209$ 13,150$ 21,982$ 28,359$ 39,783$ Basic 0.26$ 0.22$ 0.41$ 0.48$ 0.68$ Diluted 0.26$ 0.22$ 0.40$ 0.47$ 0.67$ Basic 0.31$ 0.26$ 0.42$ 0.57$ 0.76$ Diluted 0.31$ 0.26$ 0.42$ 0.57$ 0.75$ (1) This amount represents the tax impact of the non-GAAP adjustments using the applicable effective tax rates. Income from operations (GAAP) Net income (GAAP) Six Months EndedThree Months Ended June 30, Restructuring charges and other costs Earnings per share: (GAAP) Earnings per share: (Non-GAAP) Non-GAAP income from operations Non-GAAP net income Restructuring charges and other costs Income tax adjustments (1)

design develop deliver advanced technology 17 APPENDIX 2 – Recast Reconciliation of GAAP to non - GAAP Financial Results (Amounts in Thousands, Except Per Share Data) – (UNAUDITED) Jun 30, Mar 31, Jun 30, 2016 2016 2015 17,740$ 16,268$ 26,208$ 3,602 2,789 1,588 2,972 2,803 1,111 24,314$ 21,860$ 28,907$ 12,685$ 11,052$ 21,210$ 3,602 2,789 1,588 2,972 2,803 1,111 (2,087) (1,641) (1,175) 17,172$ 15,003$ 22,734$ Basic 0.26$ 0.22$ 0.41$ Diluted 0.26$ 0.22$ 0.40$ Basic 0.35$ 0.30$ 0.44$ Diluted 0.35$ 0.30$ 0.43$ (1) This amount represents the tax impact of the non-GAAP adjustments using the applicable effective tax rates. Non-GAAP net income Earnings per share: (GAAP) Earnings per share: (Non-GAAP) Restructuring charges and other costs Amortization of intangibles Income tax adjustments (1) Income from operations (GAAP) Net income (GAAP) Three Months Ended Restructuring charges and other costs Amortization of intangibles Non-GAAP income from operations