Attached files
| file | filename |
|---|---|
| EX-32.2 - EXHIBIT 32.2 - QUANTUM CORP /DE/ | a03312016exhibit-322.htm |
| EX-32.1 - EXHIBIT 32.1 - QUANTUM CORP /DE/ | a03312016exhibit-321.htm |
| EX-31.2 - EXHIBIT 31.2 - QUANTUM CORP /DE/ | a03312016exhibit-312.htm |
| EX-31.1 - EXHIBIT 31.1 - QUANTUM CORP /DE/ | a03312016exhibit-311.htm |
| EX-23 - EXHIBIT 23 - QUANTUM CORP /DE/ | a03312016exhibit-23.htm |
| EX-21 - EXHIBIT 21 - QUANTUM CORP /DE/ | a03312016exhibit-21.htm |
| EX-12.1 - EXHIBIT 12.1 - QUANTUM CORP /DE/ | a03312016exhibit-121.htm |
| EX-10.31 - EXHIBIT 10.31 - QUANTUM CORP /DE/ | a03312016exhibit-1031.htm |
UNITED STATES
SECURITIES AND EXCHANGE COMMISSION
Washington, D.C. 20549
FORM 10-K
ý | ANNUAL REPORT PURSUANT TO SECTION 13 OR 15(d) OF THE SECURITIES EXCHANGE ACT OF 1934 | |
For the fiscal year ended March 31, 2016 | ||
OR | ||
¨ | TRANSITION REPORT PURSUANT TO SECTION 13 OR 15(d) OF THE SECURITIES EXCHANGE ACT OF 1934 | |
For the transition period from _____ to _____
Commission file number 1-13449
QUANTUM CORPORATION
(Exact name of registrant as specified in its charter)
Delaware | 94-2665054 |
(State or other jurisdiction of incorporation or organization) | (I.R.S. Employer Identification No.) |
224 Airport Parkway, Suite 300, San Jose, California | 95110 |
(Address of principal executive offices) | (Zip Code) |
Registrant’s telephone number, including area code: (408) 944-4000
Securities registered pursuant to Section 12(b) of the Act:
Title of each class | Name of each exchange on which registered | |
QUANTUM CORPORATION COMMON STOCK | NEW YORK STOCK EXCHANGE | |
Securities registered pursuant to Section 12(g) of the Act:
NONE
Indicate by check mark if the registrant is a well-known seasoned issuer, as defined in Rule 405 of the Securities Act. YES ¨ NO ý
Indicate by check mark if the registrant is not required to file reports pursuant to Section 13 or 15(d) of the Act. YES ¨ NO ý
Indicate by check mark whether the registrant (1) has filed all reports required to be filed by Section 13 or 15(d) of the Securities Exchange Act of 1934 during the preceding 12 months (or for such shorter period that the registrant was required to file such reports), and (2) has been subject to such filing requirements for the past 90 days. YES ý NO ¨
Indicate by check mark whether the registrant has submitted electronically and posted on its corporate website, if any, every Interactive Data File required to be submitted and posted pursuant to Rule 405 of Regulation S-T (§232.405 of this chapter) during the preceding 12 months (or for such shorter period that the registrant was required to submit and post such files). YES ý NO ¨
Indicate by check mark if disclosure of delinquent filers pursuant to Item 405 of Regulation S-K (§229.405 of this chapter) is not contained herein, and will not be contained, to the best of registrant’s knowledge, in definitive proxy or information statements incorporated by reference in Part III of this Form 10-K or any amendment to this Form 10-K. ý
Indicate by check mark whether the registrant is a large accelerated filer, an accelerated filer, a non-accelerated filer, or a smaller reporting company. See the definitions of “large accelerated filer,” “accelerated filer” and “smaller reporting company” in Rule 12b-2 of the Exchange Act.
Large accelerated filer o | Accelerated filer x | Non-accelerated filer o | Smaller reporting company o |
Indicate by check mark whether the registrant is a shell company (as defined in Rule 12b-2 of the Exchange Act). YES ¨ NO ý
The aggregate market value of Quantum Corporation’s common stock, $0.01 par value per share, held by nonaffiliates of the registrant was approximately $121.4 million on September 30, 2015 the last day of the registrant’s most recently completed second fiscal quarter, based on the closing sales price of the registrant’s common stock on that date on the New York Stock Exchange. For purposes of this disclosure, shares of common stock held by persons who hold more than 5% of the outstanding shares of common stock and shares held by officers and directors of the registrant have been excluded in that such persons may be deemed to be affiliates. This determination of affiliate status is not necessarily conclusive for other purposes.
As of the close of business on May 27, 2016, there were 266,278,126 shares of the registrant’s common stock issued and outstanding.
DOCUMENTS INCORPORATED BY REFERENCE
The registrant’s definitive Proxy Statement for the Annual Meeting of Stockholders, which the registrant will file with the Securities and Exchange Commission within 120 days after the end of the fiscal year covered by this report, is incorporated by reference in Part III of this Form 10-K to the extent stated herein.
INDEX
Page Number | ||
PART I | ||
PART II | ||
PART III | ||
PART IV | ||
i
PART I
This report contains forward-looking statements within the meaning of Section 27A of the Securities Act of 1933, as amended, and Section 21E of the Securities Exchange Act of 1934, as amended. Forward-looking statements in this report usually contain the words “will,” “estimate,” “anticipate,” “expect,” “believe,” “project” or similar expressions and variations or negatives of these words. All such forward-looking statements including, but not limited to, (1) our goals, strategy and expectations for future financial and operating performance, including increasing market share, continuing to add customers and increasing revenue and earnings; (2) our expectation that we will continue to derive a substantial portion of our revenue from products based on tape technology; (3) our belief that our existing cash and capital resources will be sufficient to meet all currently planned expenditures, debt service and sustain our operations for at least the next 12 months; (4) our expectations regarding our ongoing efforts to control our cost structure; (5) our expectations regarding the outcome of any litigation in which we are involved; and (6) our business goals, objectives, key focuses, opportunities and prospects which are inherently uncertain as they are based on management’s expectations and assumptions concerning future events, and they are subject to numerous known and unknown risks and uncertainties. Readers are cautioned not to place undue reliance on these forward-looking statements, about which we speak only as of the date hereof. As a result, our actual results may differ materially from the forward-looking statements contained herein. Factors that could cause actual results to differ materially from those described herein include, but are not limited to: (1) the amount of orders received in future periods; (2) our ability to timely ship our products; (3) uncertainty regarding information technology spending and the corresponding uncertainty in the demand for our products and services; (4) our ability to maintain supplier relationships; (5) general economic, political and fiscal conditions in the U.S. and internationally; (6) our ability to successfully introduce new products; (7) our ability to capitalize on market demand; (8) our ability to achieve anticipated gross margin levels; and (9) those factors discussed under Item 1A “Risk Factors.” Our forward-looking statements are not guarantees of future performance. We disclaim any obligation to update information in any forward-looking statement.
ITEM 1. BUSINESS
Business Description
Quantum Corporation (“Quantum”, the “Company”, “us” or “we”), founded in 1980 and reincorporated in Delaware in 1987, is a leading expert in scale-out storage, archive and data protection, providing solutions for capturing, sharing, managing and preserving digital assets over the entire data lifecycle. Our customers, ranging from small businesses to large/multi-national enterprises, trust us to address their most demanding data workflow challenges. Our end-to-end tiered storage solutions enable users to maximize the value of their data by making it accessible whenever and wherever needed, retaining it indefinitely and reducing total cost and complexity. We work closely with a broad network of distributors, value-added resellers (“VARs”), direct marketing resellers (“DMRs”), original equipment manufacturers (“OEMs”) and other suppliers to meet customers’ evolving needs. Our common stock is traded on the New York Stock Exchange under the symbol QTM.
Our scale-out storage portfolio includes StorNext® software, appliances and full systems called StorNext ProTM Solutions, as well as XcellisTM workflow storage, QXS disk storage, LattusTM extended online storage and Q-CloudTM Archive and Vault services. Our StorNext offerings enable customers to manage large unstructured data sets in an information workflow, providing high-performance ingest, real-time collaboration, scalable capacity and intelligent protection. They are centered on our StorNext 5 platform, which is designed for today's modern workflow challenges of capturing, sharing, managing and preserving massive amounts of data in the most demanding environments. StorNext 5 includes the industry's fastest streaming file system and policy-based tiering for automatically moving data across primary storage, extended online storage, tape archive and the cloud.
We also have a comprehensive portfolio of data protection solutions for physical, virtual and cloud environments. This includes our DXi® deduplication systems, Scalar® automated tape libraries and vmPRO™ virtual server backup software. In addition, we offer a Q-Cloud service for data center customers and we also provide the underlying technology platform to partners and end user customers to build their own clouds.
In addition, Artico, an active archive appliance providing network-attached storage ("NAS") connectivity, and QXS hybrid disk and flash storage serve both scale-out storage and data protection customers.
We are a member of the consortium that develops and has licensed LTO® media technology to tape media manufacturing companies. We receive royalty payments for both LTO and DLT® media technology sold under licensing agreements. We have also entered into various licensing agreements with respect to our technology, patents and similar intellectual property which provide licensing revenues in certain cases and may expand the market for products and solutions using these technologies.
We are focused on driving profitable revenue growth and long-term shareholder value by capitalizing on new market opportunities, leveraging the strength of our technology, products and install base across scale-out storage and data protection, continuing to expand our solutions portfolio and building new and enhanced channel and technology partnerships.
3
Industry Background
For most of our customers, demands on data have changed and so have the requirements for storing and retaining it. Previously, data had a one-way, predictable life cycle where the information technology (“IT”) focus was around risk mitigation. Now, companies know that their data can be a source of competitive advantage, revenue and growth. They are much more focused on the opportunity of data, so IT must save everything and make it available based on business requirements. In addition, the challenge of dealing with large data files is extending beyond a narrow set of vertical markets such as media and entertainment, government intelligence or oil and gas to commercial enterprises more broadly.
All of this is leading to new workflows and putting pressure on status quo approaches. Traditional infrastructures are breaking down based on the sheer volume of data and the need to store data indefinitely and continue to produce value from it. IT departments have determined that adding more spinning disk to the problem will not resolve the issues, nor will legacy backup processes.
We believe the industry is evolving to a new infrastructure that is based on high-performance, tiered storage solutions with smart data movement that fits a customer’s workflow. These tiered storage solutions need to support unpredictable, on-demand access, whenever and wherever customers need their data, and incorporate new approaches to data protection and archive. At the same time, these solutions must be cost-effective.
While there are different workflows which require different solutions, there are common elements that must be addressed. Quantum products offer a unique combination of high performance, low-cost capacity and fast data access designed to help customers drive business and operational success.
Products
Scale-out Storage
With new digital technologies creating larger data files that can generate greater business value, there is a growing need to retain data for progressively longer periods while maintaining visibility and access to it. IT departments as well as vertically focused business units, including but not limited to media and entertainment, video surveillance, oil and gas, life sciences and high performance computing, are increasingly focused on managing large amounts of unstructured data. Generally, unstructured data refers to relatively new data types that produce large files, often measured in petabytes, such as video, imaging, documents and audio. In some cases, this also refers to large collections of small data, such as retail purchasing information, underwater photos of the ocean floor and feeds from traffic cameras that when combined, create meaningful information and increasingly competitive advantage. In addition, in managing unstructured data, organizations are increasingly recognizing that they need efficient and cost-effective ways to archive it. We offer StorNext software and appliance-based solutions, in addition to Lattus Object Storage for extended online storage and tape for low cost archiving, to address this growing need for managing and archiving growing unstructured data sets.
StorNext and Xcellis Workflow Storage
Our StorNext appliances leverage the power of our StorNext 5 software and market-leading hardware to offer predictable high-performance file sharing and archiving in purpose-built configurations of metadata controllers, expansion appliances and disk and archive enabled libraries. StorNext 5 delivers higher levels of performance, scalability and flexibility in a new generation of the industry’s leading scale-out shared storage file system, tiered storage and archive. StorNext 5 is a complete end-to-end solution that combines file management technology with easy-to-deploy appliances to support the world’s most complex and demanding workflows. In addition, our StorNext Storage Manager™ software automatically copies and migrates data between different tiers of storage based on user-defined policies. The result is a highly scalable, high-performance data management solution designed to optimize the use of storage while enabling long-term protection and recoverability of data.
StorNext Appliances and StorNext Pro Solutions are simple to deploy and architected to deliver scalable, industry-leading performance, drive lower operational costs and provide a flexible open system for enabling third party applications. These appliances also work seamlessly with traditional StorNext software and partner hardware offerings to provide additional options for building a shared storage area network (“SAN”) and scale-out NAS environment. They are intended to serve a wide range of markets, such as broadcast, post-production, video surveillance storage, DNA sequencing, corporate video and seismic exploration, and balance the highest performance with the lowest long-term cost for sharing all types of unstructured data used in data intensive operations.
4
Our Xcellis product optimizes workflow and shared access by combining functions that were formerly provided by separate components into a compact, space- and energy-saving solution. Xcellis manages high-speed disk for the most demanding workflows and provides multi-protocol SAN and local area network (“LAN”) client access. It also offers single-pane-of-glass management and monitoring and automatic data movement to low-cost storage such as cloud, object and tape. Overall, Xcellis maximizes operational and workflow efficiency and reduces the cost of data storage.
Lattus Object Storage
Our family of Lattus Object Storage solutions enables high volumes of data to be immediately available to extract valuable information at any time, and over time. The Lattus family is designed as extended online storage with wide-ranging scalability from terabytes to hundreds of petabytes with predictable retrieval times for high speed file access. These systems have self-healing capabilities that offer extremely high durability to ensure data is not lost and virtually eliminate unscheduled maintenance and performance degradation. Lattus has been designed to be self-migrating through innovative algorithms that simplify upgrades to new storage technologies.
Q-Cloud Archive and Vault Services
Many customers are using the cloud in different ways and we offer Q-Cloud services for a variety of applications, including using the cloud as a tier for archive storage within StorNext storage environments. Q-Cloud Archive and Q-Cloud Vault incorporate the power of the public cloud as an off-site tier within a StorNext 5 workflow environment without changes to existing applications or processes required.
StorNext AEL Archives
Our tape-based StorNext AEL archives products are purpose-built for extreme data environments, offering highly scalable data management solutions that are also cost effective and easy to manage. When added to a StorNext file system deployment, StorNext AEL archives products provide near-line archiving with built-in data protection and self-healing capabilities to ensure that valuable digital assets are protected and accessible over time. As a result, StorNext AEL archives products play a key role as we continue to expand our footprint in the growing market for unstructured data archive solutions.
Data Protection
DXi Disk Systems
Our DXi disk systems use deduplication technology to increase the amount of backup data users can retain on traditional disk systems. The result is a cost-effective means for IT departments to store backup data on disk for months instead of days, providing high-speed restores, increasing available data recovery points and reducing media management. For disaster recovery in distributed environments, the DXi-Series™ also makes wide area network (“WAN”) replication practical because of the greatly reduced bandwidth required with data deduplication. By greatly increasing effective disk capacity, data deduplication enables users to retain backup data on fast recovery disk much longer than possible using conventional disk and significantly reduces the bandwidth needed to move data between sites. We hold a key patent in one of the most efficient methods of data deduplication, known as variable-length data deduplication.
Q-Cloud Protect
In addition to using the cloud as a tier for archive storage within StorNext storage environments, we also offer Q-Cloud Protect for off-site disaster recovery storage using our deduplication technology. In both cases, our customers get the benefits of the cloud such as pricing flexibility and offsite storage for disaster recovery protection in a way that integrates with their existing on-premise applications. Our approach enables customers to use the cloud as a tier of storage, resulting in hybrid-cloud storage solutions that best fit the needs of our customers’ workflows and storage requirements.
Scalar Tape Automation Systems
We are a leading supplier of tape automation products and we continue to expand features and functionality of our tape library offerings to increase storage capacity and improve performance. Our Scalar tape automation portfolio includes a range of products, from autoloaders with one tape drive and up to sixteen cartridges to large enterprise-class libraries which can hold hundreds of drives and thousands of cartridges. Our tape libraries intelligently manage and protect business critical data in workgroup, medium size business and enterprise data center environments. With an emphasis on ease of use, management features and investment optimization, Scalar tape libraries are designed to grow with business needs. These products integrate tape drives into a system with automation technology, advanced connectivity and sophisticated management tools, including integrated media integrity analysis in tape drives and library diagnostic systems. We also offer the SuperLoader®3 autoloader designed to maximize data density and performance.
5
Tying our libraries together from entry-level to enterprise is a common, integrated software called iLayerTM, which provides monitoring, alerts and proactive diagnostics, thereby reducing service calls, shortening issue resolution time and decreasing the time users spend managing their tape automation solutions. In addition, we believe the growth in archiving of unstructured data represents a substantial opportunity for tape automation systems. To capitalize on this trend and the changing role of tape automation systems in data protection, we have invested in our enterprise Scalar i6000 and midrange Scalar i500 platforms to provide increased redundancy capabilities. These platforms can be implemented on their own or in an appliance configuration with our StorNext archiving software.
Devices and Media
Our device and media products include removable disk drives and libraries, tape drives and media. We offer tape drives and media primarily based on the LTO format. Our LTO family of devices is designed to deliver outstanding performance, capacity and reliability, combining the advantages of linear multi-channel, bi-directional formats with enhancements in servo technology, data compression, track layout and error correction. These LTO tape drives are designed to provide midrange and enterprise customers with disaster recovery and cost-effective backup solutions.
We also sell a full range of storage media offerings to complement each tape drive technology and to satisfy a variety of specific media requirements. Our media is compatible with our drives, autoloaders and libraries as well as other industry products.
Global Services and Warranty
Our global services strategy is an integral component of our total customer solution. Service is typically a significant purchase factor for customers considering scale-out or data protection storage solutions, and our ability to provide comprehensive service and support can be a noteworthy competitive advantage to attract new customers and retain existing customers. In addition, we believe that our ability to retain long-term customer relationships and secure repeat business is frequently tied directly to our service capabilities and performance.
Our extensive use of technology and innovative, built-in product intelligence allows us to scale our global services operations to meet the needs of our expanding installed base. We are currently able to provide service to customers in more than 100 countries, supported by 24-hour, multi-language technical support centers located in North America, Europe and Asia. We provide our customers with warranty coverage on all of our products. Customers with high availability requirements may also purchase additional service to extend the warranty period, obtain faster response times, or both, on our disk backup systems, tape automation products and StorNext appliances. We offer this additional support coverage at a variety of response levels up to 24-hours a day, seven-days-a-week, 365-days-a-year, for customers with stringent high-availability needs. We provide support ranging from repair and replacement to 24-hour rapid exchange to on-site service support for our midrange and enterprise-class products.
We generally warrant our hardware products against defects for periods ranging from one to three years from the date of sale. We provide warranty and non-warranty repair services through our service team and third party service providers. In addition, we utilize various other third party service providers throughout the world to perform repair and warranty services for us to reach additional geographic areas and industries in order to provide quality services in a cost-effective manner.
Research and Development
We compete in an industry characterized by rapid technological change and evolving customer requirements. Our success depends, in part, on our ability to introduce new products and features to meet end user needs. Our research and development teams are working on the next generation disk, data deduplication, virtual systems, cloud solutions, object storage solutions, tape automation and scale-out storage technologies as well as software solutions to advance these technologies for the scale-out storage and data protection markets to meet changing customer requirements. We continue to focus our efforts on software and integrated software and hardware solutions that offer improvements in the efficiency and cost of storing, moving, managing and protecting large amounts of data and providing solutions for the continuing convergence between backup and archive to provide compelling solutions for our customers.
We continue to invest in research and development to improve and expand our product lines and introduce new product lines, striving to provide superior data protection and scale-out storage solutions, for both on-premise cloud environments. Research and development costs were $48.7 million, $58.6 million, and $64.4 million for fiscal 2016, 2015 and 2014, respectively.
6
Sales and Distribution Channels
Quantum Branded Sales Channels
For Quantum-branded products, we utilize distributors, VARs and DMRs. Our integrated Quantum Alliance Reseller Program provides our channel partners the option of purchasing products directly or through distribution and provides them access to a more comprehensive product line. Additionally, we sell directly to a select number of large corporate entities and government agencies.
OEM Relationships
We sell our products to several OEM customers that resell our hardware products under their own brand names and typically assume responsibility for product sales, end user service and support. We also license our software to certain OEM customers that include this software in their own brand name products. These OEM relationships enable us to reach end users not served by our branded distribution channels or our direct sales force. They also allow us to sell to select geographic or vertical markets where specific OEMs have exceptional strength.
Customers
Our sales are concentrated with several key customers because under our business model, as is typical for our industry, we sell to OEMs, distributors, VARs and DMRs to reach end user customers. Sales to our top five customers represented 28% of revenue in fiscal 2016 and 31% of revenue in each of fiscal 2015 and 2014. No customer accounted for 10% or more of our revenue in fiscal 2016, 2015 or 2014. Through our Quantum Alliance Reseller Program and our emphasis on growing our branded business, including increasing the independent channel, we are expanding our customer base and continue to distribute our products and services across a larger number of customers.
Competition
The markets in which we participate are highly competitive, characterized by rapid technological change and changing customer requirements. In some cases, our competitors in one market area are customers or suppliers in another. Our competitors often have greater financial, technical, manufacturing, marketing or other resources than we do. Additionally, the competitive landscape continues to change due to merger and acquisition activity as well as new entrants into the market.
Our StorNext appliances and workflow solutions primarily face competition from EMC Corporation (“EMC”), International Business Machines Corporation (“IBM”), NetApp, Inc. (“NetApp”) and other content storage vendors in the media and entertainment industry as well as government agencies and departments. Our cloud solutions face competition from a large number of businesses that provide hardware, software and virtual solutions as well as companies that offer cloud services based on other technology. Our Lattus Object Storage solutions primarily compete with object storage solutions from other providers, ranging from startup companies to established companies, such as EMC and IBM, as well as large public cloud storage providers.
Our disk backup solutions primarily compete with products sold by EMC, Hewlett-Packard Company (“HP”), IBM and NetApp. Additionally, a number of software companies that have traditionally been partners with us have deduplication features in their products and will, at times, compete with us. A number of our competitors also license technology from other competing companies.
In the tape automation market, we primarily compete for midrange and enterprise reseller and end user business with Dell, Inc. ("Dell"), IBM, Oracle Corporation and SpectraLogic Corporation as well as HP through its OEM relationship with other tape automation suppliers. Competitors for entry-level and OEM tape automation business include BDT Products, Inc. and several others that supply or manufacture similar products. In addition, disk backup products are a competitive alternative to tape products and solutions.
At the storage device level, our main competitors are HP and IBM. Both HP and IBM develop and sell their own LTO tape drives, which compete with our device offerings. We also face competition from disk alternatives, including removable disk drives in the entry-level market.
For a discussion of risks associated with competing technologies, see the Risk Factor in Item 1A "Risk Factors" titled, “We derive the majority of our revenue from products incorporating tape technology. Our future operating results depend in part on continued market acceptance and use of products employing tape technology and decreases in the market could materially and adversely impact our business, financial condition and operating results. In addition, if we are unable to compete with new or alternative storage technologies, our business, financial condition and operating results could be materially and adversely affected.”
7
Manufacturing
In fiscal 2014, we transitioned our manufacturing from a model incorporating in-house production and contract manufacturers to a fully outsourced model as part of our strategy to enhance our variable cost structure and provide more flexibility to cost-effectively manage the volume of products manufactured to align with our expectations, including market declines in the tape business and growth expectations in disk backup products and scale-out storage solutions. During fiscal 2016 and 2015, we used only contract manufacturers to produce our products.
We outsource the manufacture, repair and fulfillment of disk backup products, scale-out storage solutions, tape automation systems, tape devices and service parts to contract manufacturers. Tape drives used in our products are primarily sourced from Hungary and China. Disk drives used in our products are largely sourced from Thailand, the Philippines and China. Certain tape automation system materials and assemblies as well as certain disk system materials and assemblies are sourced in China, Malaysia, Thailand, Mexico and the U.S.
Our recording tape media is manufactured by one or more tape media manufacturing companies, which are qualified and licensed to manufacture, use and sell media products. In most cases, the media is produced in Japan and multi-sourced on a worldwide basis.
Intellectual Property and Technology
We develop and protect our technology and know-how, principally in the field of data storage. We generally rely on patent, copyright, trademark and trade secret laws and contract rights to establish and maintain our proprietary rights in our technology and products. As of March 31, 2016, we hold over 300 U.S. patents and have over 70 pending U.S. patent applications. In general, these patents have a 20-year term from the first effective filing date for each patent. We also hold a number of foreign patents and patent applications for certain of our products and technologies. Although we believe that our patents and applications have significant value, rapidly changing technology in our industry means that our future success may also depend heavily on the technical competence and creative skills of our employees.
From time to time, third parties have asserted that the manufacture and sale of our products have infringed on their patents. We are not knowingly infringing any third party patents. Should it ultimately be determined that licenses for third party patents are required, we will make best efforts to obtain such licenses on commercially reasonable terms. See Item 3 “Legal Proceedings” for additional disclosures regarding lawsuits alleging patent infringement.
On occasion, we have entered into various patent licensing and cross-licensing agreements with other companies. We may enter into patent cross-licensing agreements with other third parties in the future as part of our normal business activities. These agreements, when and if entered into, would enable these third parties to use certain patents that we own and enable us to use certain patents owned by these third parties. We have also sold certain patents, retaining a royalty-free license for these patents.
Segment Information
We operate as a single reporting unit and operating segment for business and operating purposes. Information about revenue attributable to each of our product groups is included in Item 7 “Management’s Discussion and Analysis of Financial Condition and Results of Operations” and information about revenue and long-lived assets attributable to certain geographic regions is included in Note 14 “Geographic Information” to the Consolidated Financial Statements and risks attendant to our foreign operations is set forth below in Item 1A “Risk Factors.”
Seasonality
As is typical in our industry, we generally have the greatest demand for our products and services in the fourth quarter of each calendar year, or our fiscal third quarter. We usually experience the lowest demand for our products and services in the first and second quarters of each calendar year, or our fiscal fourth quarter and fiscal first quarter, respectively.
Backlog
Our products are manufactured based on forecasts of customer demand. We also place inventory in strategic locations throughout the world in order to enable certain key customers to obtain products on demand. Orders are generally placed by customers on an as-needed basis. Product orders are confirmed and, in most cases, shipped to customers within one week. More complex systems and product configurations often have longer lead times and may include on-site integration or customer acceptance. Most of the backlog accumulated during any particular fiscal quarter is shipped in the same quarter in which the backlog initially occurs. Therefore, our backlog generally grows during the first part of each fiscal quarter and shrinks during the latter part of the quarter to reach its lowest levels at the end of that same quarter, by which time significant shipments have occurred. As a result, our backlog as of the end of any fiscal quarter is not material and is not a predictor of future sales.
8
Employees
We had approximately 1,200 employees worldwide as of March 31, 2016.
Available Information
Our Annual Report on Form 10-K, Quarterly Reports on Form 10-Q, Current Reports on Form 8-K and amendments to reports filed or furnished pursuant to Sections 13(a) and 15(d) of the Securities Exchange Act of 1934, as amended, are available free of charge on our website at http://www.quantum.com generally when such reports are available on the Securities and Exchange Commission (“SEC”) website. The contents of our website are not incorporated into this Annual Report on Form 10-K.
The public may read and copy any materials we file with the SEC at the SEC’s Public Reference Room at 100 F Street, NE, Washington, D.C. 20549. The public may obtain information on the operation of the Public Reference Room by calling the SEC at 1-800-SEC-0330. The SEC maintains an internet site that contains reports, proxy and information statements and other information regarding issuers that file electronically with the SEC at http://www.sec.gov.
Executive Officers and Management Team
Following are the names and positions of our management team as of May 27, 2016, including a brief account of his business experience.
Name | Position with Quantum | |
Jon W. Gacek* | President and Chief Executive Officer | |
Fuad Ahmad* | Senior Vice President, Chief Financial Officer | |
William C. Britts* | Senior Vice President, Worldwide Sales and Marketing | |
Robert S. Clark* | Senior Vice President, Product Operations | |
Shawn D. Hall* | Senior Vice President, General Counsel and Secretary | |
Don Martella | Senior Vice President, Engineering | |
Geoff Stedman | Senior Vice President, Marketing and Scale-Out Storage Solutions | |
Bassam Tabbara | Chief Technology Officer | |
* Determined by the Board of Directors to be an “officer” for the purposes of Section 16 (a) of the Exchange Act.
Mr. Gacek became President and Chief Executive Officer and was also appointed to the Board of Directors in April 2011. He was President and Chief Operating Officer from January 2011 through March 2011. He joined Quantum as Executive Vice President and Chief Financial Officer in August 2006, upon Quantum’s acquisition of Advanced Digital Information Corporation (“ADIC”) and was promoted to Executive Vice President, Chief Financial Officer and Chief Operating Officer in June 2009. Previously, he served as the Chief Financial Officer at ADIC from 1999 to 2006 and also led Operations during his last three years at ADIC. Prior to ADIC, Mr. Gacek was an audit partner at PricewaterhouseCoopers LLP and led the Technology Practice in the firm’s Seattle office. While at PricewaterhouseCoopers LLP, he assisted several private equity investment firms with a number of mergers, acquisitions, leveraged buyouts and other transactions.
Mr. Ahmad joined Quantum as Chief Financial Officer in April 2016. Mr. Ahmad has been a partner with FLG Partners, a consulting firm providing interim and permanent financial leadership services, since 2013 and has been advising various companies on matters ranging from scaling their operations and growth and financing strategies to restructuring and reorganizations. Prior to FLG Partners, from 2010 to 2012, he was Chief Financial Officer of Sezmi Inc. a provider of cloud-based, turnkey video solutions for personalized and multi-screen offerings serving telecommunications, media/content and ISP companies. From 2004 to 2010, Mr. Ahmad was Senior Vice President and Chief Financial Officer of Globalstar Inc., an industry-leading provider of mobile satellite voice and data services.
Mr. Britts joined Quantum as Executive Vice President, Sales and Marketing in August 2006, upon Quantum’s acquisition of ADIC. He served in this position until June 2011, when he assumed the role of Senior Vice President, Worldwide Marketing, Service and Business Development. In April 2012, Mr. Britts added Operations to his portfolio. In July 2013, he was named Senior Vice President, Worldwide Sales and Marketing. Prior to Quantum, he spent 12 years at ADIC, where he held numerous leadership positions, including Executive Vice President of Worldwide Sales and Marketing, Vice President of Sales and Marketing and Director of Marketing. Before ADIC, Mr. Britts served in a number of marketing and sales positions at Raychem Corp. and its subsidiary, Elo TouchSystems.
9
Mr. Clark joined Quantum as Director of Tape Products in August 2006, upon Quantum’s acquisition of ADIC. In March 2009, he was promoted to Vice President with responsibility for various product lines, as well as business operations and OEM sales. In April 2010, he was named Senior Vice President, Tape and OEM Product Group (subsequently reorganized as Disk and Tape Backup Product Group). In January 2014, Mr. Clark assumed additional responsibility for all Quantum products in a newly named Product Operations organization. In April 2015, Mr. Clark also assumed responsibility for both Operations and Service. Prior to Quantum, Mr. Clark was at HP for 10 years in various engineering and sales positions.
Mr. Hall joined Quantum in 1999 as Corporate Counsel, became Vice President, General Counsel and Secretary in 2001 and was promoted to Senior Vice President, General Counsel and Secretary in May 2009. Prior to Quantum, Mr. Hall worked at the law firms of Skadden, Arps and Willkie Farr & Gallagher, where he practiced in the areas of mergers and acquisitions and corporate finance, representing numerous public and private technology companies.
Mr. Martella joined Quantum as Vice President, Automation Engineering in August 2006, upon Quantum’s acquisition of ADIC. In June 2010, he was promoted to Senior Vice President, Platform Engineering, and in April 2011 assumed his current role. Before joining Quantum, Mr. Martella served as a Vice President of Engineering and Quality at ADIC, where he spent five years in various leadership positions. Previously, he held engineering positions in the storage and process control industries.
Mr. Stedman joined Quantum as Senior Vice President, Scale-out Storage Solutions in March 2014. From March 2012 to February 2014, Mr. Stedman served as vice president of marketing at Tintri, Inc., and he was senior vice president and general manager of the Storage Business Unit at Harmonic, Inc. He joined Harmonic in conjunction with its acquisition of Omneon, Inc. where he spent seven years as senior vice president of worldwide marketing. Before Omneon, Mr. Stedman held marketing positions at several technology companies.
Mr. Tabbara joined Quantum as Executive Director, Cloud Services, in August 2014, in conjunction with Quantum’s acquisition of Symform’s cloud storage services platform. In July 2015, he was promoted to Chief Technology Officer with responsibility for driving the company’s long-term technology strategy to capitalize on new market opportunities. Prior to Quantum, Mr. Tabbara was the CTO and co-founder of Symform from November 2007 to July 2014. Before Symform, Mr. Tabbbara spent 12 years at Microsoft, where he worked on a number of key initiatives, including Microsoft Research, MSN, Windows, Visual Studio and System Center. Mr. Tabbara holds more than 30 patents.
10
ITEM 1A. RISK FACTORS
YOU SHOULD CAREFULLY CONSIDER THE RISKS DESCRIBED BELOW, TOGETHER WITH ALL OF THE OTHER INFORMATION INCLUDED IN THIS ANNUAL REPORT ON FORM 10-K. THE RISKS AND UNCERTAINTIES DESCRIBED BELOW ARE NOT THE ONLY ONES FACING QUANTUM. ADDITIONAL RISKS AND UNCERTAINTIES NOT PRESENTLY KNOWN TO US OR THAT WE CURRENTLY BELIEVE ARE IMMATERIAL MAY ALSO IMPAIR OUR BUSINESS AND OPERATIONS. THIS ANNUAL REPORT ON FORM 10-K CONTAINS “FORWARD-LOOKING” STATEMENTS THAT INVOLVE RISKS AND UNCERTAINTIES. PLEASE SEE PAGE 1 OF THIS REPORT FOR ADDITIONAL DISCUSSION OF THESE FORWARD-LOOKING STATEMENTS.
We derive the majority of our revenue from products incorporating tape technology. Our future operating results depend in part on continued market acceptance and use of products employing tape technology, and decreases in the market have materially and adversely impacted our business, financial condition and operating results. In addition, if we are unable to compete with new or alternative storage technologies, our business, financial condition and operating results could be materially and adversely affected.
We currently derive the majority of our revenue from products that incorporate some form of tape technology, and we expect to continue to derive significant revenue from these products in the next several years. As a result, our future operating results depend in part on continued market acceptance and use of products employing tape technology. We believe that the storage environment is changing, including reduced demand for tape products. Decreased market acceptance or use of products employing tape technology has materially and adversely impacted our business, financial condition and operating results and we expect that our revenues from tape products will continue to decline, which could materially and adversely impact our business, financial condition and operating results in the future.
Disk products as well as various software solutions and alternative technologies continue to gain broader market acceptance. We expect that, over time, many of our tape customers will continue to migrate toward these products and solutions and that revenue from these products and solutions will generate a greater proportion of our revenue. While we are making targeted investments in software, disk backup systems and other alternative technologies, these markets are characterized by rapid innovation, evolving customer demands and strong competition, including competition with several companies who are also significant customers. If we are not successful in our efforts, our business, financial condition and operating results could be materially and adversely affected.
We have significant indebtedness, which imposes upon us debt service obligations, and our credit facility contains various operating and financial covenants that limit our discretion in the operation of our business. If we are unable to generate sufficient cash flows from operations and overall operating results to meet these debt obligations or remain in compliance with the covenants, our business, financial condition and operating results could be materially and adversely affected.
Our level of indebtedness presents significant risks to investors, both in terms of the constraints that it places on our ability to operate our business and because of the possibility that we may not generate sufficient cash and operating results to remain in compliance with our covenants and pay the principal and interest on our indebtedness as it becomes due. For further description of our outstanding debt, see the section captioned "Liquidity and Capital Resources" in Item 7 "Management’s Discussion and Analysis of Financial Condition and Results of Operations."
As a result of our indebtedness:
• | Our ability to invest in the growth areas of our business is constrained by the financial covenants contained in our credit agreement, which require us to maintain a minimum fixed charge coverage ratio and liquidity levels; |
• | We must dedicate a portion of our cash flow from operations and other capital resources to debt service, thereby reducing our ability to fund working capital, capital expenditures, research and development and other cash requirements; |
• | Our flexibility in planning for, or reacting to, changes and opportunities in the markets in which we compete may be limited, including our ability to engage in mergers and acquisitions activity, which may place us at a competitive disadvantage; |
• | We are subject to mandatory field audits and control of cash receipts by the lender if we do not maintain liquidity above certain thresholds; |
• | We may be more vulnerable to adverse economic and industry conditions; |
• | We may be unable to make payments on other indebtedness or obligations; and |
• | We may be unable to incur additional debt or refinance our existing debt on acceptable terms, if at all. |
11
Our credit facility agreement contains restrictive covenants that require us to comply with and maintain certain liquidity levels and a minimum fixed charge coverage ratio, as well as restrict our ability, subject to certain thresholds, to:
• | Incur debt; |
• | Incur liens; |
• | Make acquisitions of businesses or entities or sell certain assets; |
• | Make investments, including loans, guarantees and advances; |
• | Engage in transactions with affiliates; |
• | Pay dividends or engage in stock repurchases; and |
• | Enter into certain restrictive agreements. |
The recent weakness we have seen in the general storage and backup market, and the resulting underperformance of our data protection business, which is the primary driver of our overall cash flow and operating income, has placed increased pressure on our ability to meet our liquidity and fixed charge coverage ratio covenants. We have taken steps and are making changes to our business designed to ensure that our operating results are sufficient to meet these covenants, but if we are not successful in implementing these changes or our results turn out to be lower than expected, we may violate a covenant, which could result in a default under our credit facility agreement.
Our credit facility agreement is collateralized by a pledge of all of our assets. If we were to default and were unable to obtain a waiver for such a default, the lender would have a right to foreclose on our assets in order to satisfy our obligations under the credit agreement. Any such action on the part of the lender against us could have a materially adverse impact on our business, financial condition and results of operations.
We rely on indirect sales channels to market and sell our branded products. Therefore, the loss of or deterioration in our relationship with one or more of our resellers or distributors, or our inability to establish new indirect sales channels to drive growth of our branded revenue, especially for disk backup systems and scale-out storage solutions, could negatively affect our operating results.
We sell the majority of our branded products to distributors such as Ingram Micro, Inc. and others, value-added resellers ("VARs") and direct marketing resellers ("DMRs") such as CDW Corporation, who in turn sell our products to end users. The success of these sales channels is hard to predict, particularly over time, and we have no purchase commitments or long-term orders from them that assure us of any baseline sales through these channels. Several of our resellers carry competing product lines that they may promote over our products. A reseller might not continue to purchase our products or market them effectively, and each reseller determines the type and amount of our products that it will purchase from us and the pricing of the products that it sells to end user customers. Establishing new indirect sales channels is an important part of our strategy to drive growth of our branded revenue.
As we introduce new products and solutions, we could negatively impact our relationship with channel partners that historically have sold other products and solutions that now compete with our new offerings. For example, we introduced various StorNext appliance solutions beginning in fiscal 2012 causing us to more directly compete for hardware sales with channel partners that sold other hardware products in conjunction with our StorNext software.
Certain of our contracts with customers contain “most favored nation” pricing provisions mandating that we offer our products to these customers at the lowest price offered to other similarly situated customers. In addition, sales of our enterprise products, and the revenue associated with the on-site service of those products, are somewhat concentrated in specific customers, including government agencies and government-related companies. Any failure of such customers and agencies to continue purchasing products in the same quantities and in the same time frames as they have in the past could affect our operating results. Our operating results could be adversely affected by any number of factors including:
• | A change in competitive strategy that adversely affects a reseller’s willingness or ability to distribute our products; |
• | The reduction, delay or cancellation of orders or the return of a significant amount of products; |
• | Our inability to gain traction in developing new indirect sales channels for our branded products; |
• | The loss of one or more of such distributors or resellers; |
• | Any financial difficulties of such distributors or resellers that result in their inability to pay amounts owed to us; or |
• | Changes in requirements or programs that allow our products to be sold by third parties to government customers. |
12
If our products fail to meet our or our customers’ specifications for quality and reliability, we may face liability and reputational or financial harm which may adversely impact our results of operations and our competitive position may suffer.
Although we place great emphasis on product quality, we may from time to time experience problems with the performance of our products, which could result in one or more of the following:
• | Increased costs related to fulfillment of our warranty obligations; |
• | The reduction, delay or cancellation of orders or the return of a significant amount of products; |
• | Focused failure analysis causing distraction of the sales, operations and management teams; or |
• | The loss of reputation in the market and customer goodwill. |
These factors could cause our business, financial condition and results of operations to be materially and adversely affected.
In addition, we face potential liability for performance problems of our products because our end users employ our storage technologies for the storage and backup of important data and to satisfy regulatory requirements. We could potentially face claims for product liability from our customers if our products cause property damage or bodily injury. Although we maintain technology errors and omissions liability and general liability insurance, our insurance may not cover potential claims of these types or may not be adequate to indemnify us for all liability that may be imposed. Any imposition of liability or litigation costs that is not covered by insurance or is in excess of our insurance coverage could harm our business.
A large percentage of our sales are to a few customers, some of which are also competitors, and these customers generally have no minimum or long-term purchase commitments. The loss of, or a significant reduction in demand from, one or more key customers could materially and adversely affect our business, financial condition and operating results.
Our sales have been and continue to be concentrated among a few customers because under our business model, we sell to OEMs, distributors, VARs and DMRs to reach end user customers. Furthermore, customers are not obligated to purchase any minimum product volume, and our relationships with customers are terminable at will. Revenue from OEM customers has decreased in recent years. If we experience further declines in revenue from OEM customers or any of our other large customers, our business, financial condition and operating results could be materially and adversely affected. In addition, certain of our large customers are also our competitors, and such customers could decide to reduce or terminate their purchases of our products for competitive reasons.
Some of our tape and disk products are incorporated into larger storage systems or solutions that are marketed and sold to end users by large OEM customers as well as VARs, channel partners and other distributors. Because of this, we have limited market access to these end users, limiting our ability to reach and influence their purchasing decisions. These market conditions further our reliance on these OEM and other large customers such as distributors and VARs. Thus if they were to significantly reduce, cancel or delay their orders with us, our results of operations could be materially and adversely affected.
A portion of our sales are to various agencies and departments of the U.S. federal government, and funding cuts to federal spending can adversely impact our revenue. The American Taxpayer Relief Act of 2012 implemented automatic spending cuts beginning March 1, 2013. Between October 1 and October 16, 2013, the U.S. government partial shutdown caused reductions, cancellations and delayed orders. Future spending cuts by the U.S. federal government could decrease revenue from sales to the federal government that could materially and adversely affect our results of operations.
13
Our operating results depend on a limited number of products and on new product introductions, which may not be successful, in which case our business, financial condition and operating results may be materially and adversely affected.
A limited number of products comprise a significant majority of our sales, and due to rapid technological change in the industry, our future operating results depend on our ability to develop and successfully introduce new products. To compete effectively, we must continually improve existing products and introduce new ones. We have devoted and expect to continue to devote considerable management and financial resources to these efforts. We cannot provide assurance that:
• | We will introduce new products in the time frame we are forecasting; |
• | We will not experience technical, quality, performance-related or other difficulties that could prevent or delay the introduction and market acceptance of new products; |
• | Our new products will achieve market acceptance and significant market share, or that the markets for these products will continue or grow as we have anticipated; |
• | Our new products will be successfully or timely qualified with our customers by meeting customer performance and quality specifications which must occur before customers will place large product orders; or |
• | We will achieve high volume production of these new products in a timely manner, if at all. |
If we are not successful in timely completion of our new product qualifications and then ramping sales to our key customers, our revenue and results of operations could be adversely impacted. In addition, if the quality of our products is not acceptable to our customers, this could result in customer dissatisfaction, lost revenue and increased warranty and repair costs.
We continue to face risks related to economic uncertainty and slow economic growth.
Uncertainty about economic conditions poses a risk as businesses may further reduce or postpone spending in response to reduced budgets, tightening of credit markets, negative financial news and declines in income or asset values which could adversely affect our business, financial condition and results of operations. The slow economic growth in recent years along with periods of economic uncertainty in various countries around the world has had a material and adverse impact on our business and our financial condition.
In particular, we have experienced reduced demand for IT products and services overall and more specifically for products with tape technology in the data protection market. We continue to face risks related to economic conditions in Europe, including concerns about sovereign debt and related political matters, which could negatively impact the U.S. and global economies and adversely affect our financial results. In addition, our ability to access capital markets may be restricted, which could have an impact on our ability to react to changing economic and business conditions and could also adversely affect our results of operations and financial condition.
Competition may intensify in the data protection market as a result of competitors introducing products based on new technology standards and merger and acquisition activity, which could materially and adversely affect our business, financial condition and results of operations.
Our competitors in the data protection market for disk backup systems and virtual machine solutions are aggressively trying to advance and develop new technologies and products to compete against our technologies and products, and we face the risk that customers could choose competitor products over ours. Competition in our markets is characterized by technological innovation and advancement. As a result of competition and new technology standards, our sales or gross margins could decline, which could materially and adversely affect our business, financial condition and results of operations.
Technological developments and competition over the years in the tape automation market and in the storage market in general has resulted in decreased prices for tape automation products and product offerings. Pricing pressure is more pronounced in the tape automation market for entry-level products and less pronounced for enterprise products. Over time, the prices of our products and competitor products have decreased, but such products often incorporate new and/or different features and technologies than in prior years. We face risks that customers could choose competitor products over ours due to these features and technologies or due to pricing differences. We have managed pricing pressure by reducing production costs and/or adding features to increase value to maintain a certain level of gross margin for our tape automation systems. However, certain of our costs are fixed in the short term, so we may not be able to offset price decreases or reductions in demand sufficiently to maintain our profitability. In addition, if competition further intensifies, or if there is additional industry consolidation, our sales and gross margins for tape automation systems could decline, which could materially and adversely affect our business, financial condition and results of operations.
14
Industry consolidation and competing technologies with device products, which include tape drives and removable hard drives, have resulted in decreased prices and increasingly commoditized device products. Our response has been to manage our device business at the material margin level, and we have chosen not to compete for sales in intense price-based situations or if we would be unable to maintain a certain gross margin level. Our focus has shifted to higher margin opportunities in other product lines. Although revenue from devices has decreased in recent years, our material margins have remained relatively stable over this period. We have exited certain portions of the device market and have anticipated decreased sales of devices. We face risk of reduced shipments of our devices beyond our plans and could have reduced margins on these products, which could adversely impact our business, financial condition and results of operations.
Additionally, the competitive landscape could change due to merger and acquisition activity in the data protection market. Such transactions may impact us in a number of ways. For instance, they could result in:
• | Competitors decreasing in number but having greater resources and becoming more competitive with us; |
• | Companies that we have not historically competed against entering into one or more of our primary markets and increasing competition in such market(s); |
• | Customers that are also competitors becoming more competitive with us and/or reducing their purchase of our products; and |
• | Competitors acquiring our current suppliers or business partners and negatively impacting our business model. |
These transactions also create uncertainty and disruption in the market because whether a pending transaction will be completed, the timing of such a transaction and its degree of impact are often unknown. Given these factors and others, such merger and acquisition activity may materially and adversely impact our business, financial condition and results of operations.
Competition may intensify in the scale-out storage market as a result of competitors introducing products based on new technology standards and market consolidation, which could materially and adversely affect our business, financial condition and results of operations.
Competition in the scale-out storage market is characterized by technological innovation and advancement, including performance and scale features, and our competitors are aggressively trying to advance and develop new technologies and solutions. If we are unable to compete effectively in these markets and develop solutions that have features and technologies that our customers desire, including new technology standards, our sales from software solutions and appliances could decline, which could materially and adversely affect our business, financial condition and results of operations.
Additionally, the competitive landscape could change due to mergers and acquisitions among our competitors, customers and partners. Transactions such as these may impact us in a number of ways. For instance, they could result in:
• | Competitors decreasing in number but having greater resources and becoming more competitive with us; |
• | Companies that we have not historically competed against entering into one or more of our primary markets and increasing competition in such market(s); |
• | Customers that are also competitors becoming more competitive with us and/or reducing their purchase of our products; and |
• | Competitors acquiring our current suppliers or business partners and negatively impacting our business model. |
These transactions also create uncertainty and disruption in the market, because whether a pending transaction will be completed, the timing of such a transaction and its degree of impact are often unknown. Given these factors and others, such merger and acquisition activity may materially and adversely impact our business, financial condition and results of operations.
15
A significant decline in our media royalty, branded software or OEM deduplication software revenues could materially and adversely affect our business, financial condition and operating results.
Our media royalties, branded software and OEM deduplication software revenues are relatively profitable and can significantly impact total company profitability. We receive media royalty revenue based on tape media cartridges sold by various tape media manufacturers and resellers. Under our license agreements with these companies, each of the licensees determines the pricing and number of units of tape media cartridges that it sells. Our media royalty revenue varies depending on the level of sales of the various media cartridge offerings sold by the licensees and other factors, including:
• | The size of the installed base of devices and similar products that use tape media cartridges; |
• | The performance of our strategic licensing partners, which sell tape media cartridges; |
• | The relative growth in units of newer device products, since the associated media cartridges for newer products typically sell at higher prices than the media cartridges associated with older products; |
• | The media consumption habits and rates of end users; |
• | The pattern of device retirements; and |
• | The level of channel inventories. |
Our media royalties depend on royalty rates and the quantity of media consumed in the market. We do not control licensee sales of these tape media cartridges. Reduced royalty rates, or a reduced installed device base using tape media cartridges, would result in further reductions in our media royalty revenue and could reduce gross margins. This could materially and adversely affect our business, financial condition and results of operations.
Our branded software revenues are also dependent on many factors, including the success of competitive offerings, our ability to execute on our product roadmap and our effectiveness at marketing and selling our branded software solutions directly or through our channel partners. Disruptions to any one of these factors could reduce our branded software revenues, which could adversely affect our business, financial condition and operating results.
Our OEM deduplication software revenues also depend on many factors, including the success of competitive offerings, our ability to execute on our product roadmap with our OEM deduplication software partners, the effort of our OEM deduplication software partners in marketing and selling the resulting products, the market acceptance of the resulting products and changes in the competitive landscape, including the impact of acquisitions. At various times, we had significant revenue from OEM deduplication software revenue and at times we had negligible revenue from OEM deduplication software, which negatively impacted our results. Any further disruptions to the factors on which our OEM deduplication software revenues depend could adversely affect our business, financial condition and operating results.
Some of our products contain licensed, third-party technology that provides important product functionality and features. The loss or inability to obtain any such license could have a material adverse effect on our business.
Certain of our products contain technology licensed from third parties that provides important product functionality and features. We have contractual protections within our license agreements to help mitigate against the risks of incorporating third-party technology into our products. However, there remains a risk that we may not have continued access to this technology, for instance, if the licensing company ceased to exist, either from bankruptcy, dissolution or purchase by a competitor. In some cases, we may seek to enforce our contractual protections via litigation against the licensing company itself, which may cause us to incur significant legal or other costs and may not be resolved in our favor. Other legal actions, such as intellectual property actions, brought against the licensing company could also impact our future access to the technology. We also have limited control of the technology roadmap and cannot ensure that the licensing company will advance the roadmap of the licensed technology in the manner best for Quantum. Any of these actions could negatively impact our technology licensing, thereby reducing the functionality and/or features of our products, and adversely affect our business, financial condition and operating results. We also face the risk of not being able to quickly implement a replacement technology or otherwise mitigate the risks associated with not having access to this licensed technology, which may adversely affect our business, financial condition and operating results.
16
We have taken considerable steps towards reducing our cost structure and may take further cost reduction actions. The steps we have taken and may take in the future may not reduce our cost structure to a level appropriate in relation to our future sales and therefore, these anticipated cost reductions may be insufficient to result in consistent profitability.
In the last several years, we have recorded significant restructuring charges and made cash payments in order to reduce our cost of sales and operating expenses to respond to adverse economic and industry conditions, from strategic management decisions and to rationalize our operations following acquisitions. In the third quarter of fiscal 2016, we implemented a restructuring plan, which we refer to as the Fiscal 2016 Restructuring Plan, to eliminate approximately 65 positions in the U.S. and internationally, primarily in research and development and sales and marketing functions. These restructurings may result in decreases to our revenues or adversely affect our ability to grow our business in the future. Workforce reductions may also adversely affect employee morale and our ability to retain our employees. We may take future steps to further reduce our operating costs, including future cost reduction steps or restructurings in response to strategic decisions, adverse changes in our business or industry or future acquisitions. We may be unable to reduce our cost of sales and operating expenses at a rate and to a level appropriate in relation to our future sales, which may adversely affect our business, financial condition and operating results.
In addition, our ability to achieve the anticipated cost savings and other benefits from these restructuring within the expected time frame is subject to many estimates and assumptions. These estimates and assumptions are subject to significant economic, competitive and other uncertainties, some of which are beyond our control. If these estimates and assumptions are incorrect, if we experience delays, or if other unforeseen events occur, our business, financial condition and operating results could be adversely affected.
If we are unable to attract and retain skilled employees, our business could be adversely impacted.
We may be subject to increased turnover in our employee base or the inability to fill open headcount requisitions due to competition, concerns about our operational performance or other factors. In addition, we may need to rely on the performance of employees whose skill sets are not sufficiently developed to fulfill their expected job responsibilities. Either of these situations could impair or delay our ability to realize operational and strategic objectives and cause increased expenses and lost sales opportunities.
Additionally, over the last several years, we made certain changes in our strategic direction focusing on key technology segments. As part of this change in focus, we reduced costs of revenue and other operating expenses. Executing on this new strategic direction as well as the ongoing efficiency initiatives across the company, such as the Fiscal 2016 Restructuring Plan could adversely affect our ability to retain and hire key personnel and may result in reduced productivity by our employees.
The loss of the services of any of our key employees, the inability to attract or retain qualified talent in the future, or delays in hiring required talent, particularly sales and engineering talent, could delay the development and introduction of our products or services and/or negatively affect our ability to sell our products or services.
Third party intellectual property infringement claims could result in substantial liability and significant costs, and, as a result, our business, financial condition and operating results may be materially and adversely affected.
From time to time, third parties allege our infringement of and need for a license under their patented or other proprietary technology, such as our current litigation with Crossroads Systems, Inc. described in Item 3 "Legal Proceedings." While we currently believe the amount of ultimate liability, if any, with respect to any such actions will not materially affect our financial position, results of operations or liquidity, the ultimate outcome of any license discussion or litigation is uncertain. Adverse resolution of any third party infringement claim could subject us to substantial liabilities and require us to refrain from manufacturing and selling certain products. In addition, the costs incurred in intellectual property litigation can be substantial, regardless of the outcome. As a result, our business, financial condition and operating results could be materially and adversely affected.
17
In addition, certain products or technologies acquired or developed by us may include “open source” software. Open source software is typically licensed for use at no initial charge. Certain open source software licenses, however, require users of the open source software to license to others any software that is based on, incorporates or interacts with, the open source software under the terms of the open source license. Although we endeavor to comply fully with such requirements, third parties could claim that we are required to license larger portions of our software than we believe we are required to license under open source software licenses. If such claims were successful, they could adversely impact our competitive position and financial results by providing our competitors with access to sensitive information that may help them develop competitive products. In addition, our use of open source software may harm our business and subject us to intellectual property claims, litigation or proceedings in the future because:
• | Open source license terms may be ambiguous and may subject us to unanticipated obligations regarding our products, technologies and intellectual property; |
• | Open source software generally cannot be protected under trade secret law; and |
• | It may be difficult for us to accurately determine the origin of the open source code and whether the open source software infringes, misappropriates or violates third party intellectual property or other rights. |
As a result of our global manufacturing and sales operations, we are subject to a variety of risks related to our business outside of the U.S., any of which could, individually or in the aggregate, have a material adverse effect on our business.
A significant portion of our manufacturing and sales operations and supply chain occurs in countries other than the U.S. We also have sales outside the U.S. We utilize contract manufacturers to produce and fulfill orders for our products and have suppliers for various components, several of which have operations located in foreign countries including China, Hungary, Japan, Malaysia, Singapore, Mexico, the Philippines and Thailand. Because of these operations, we are subject to a number of risks including:
• | Reduced or limited protection of our intellectual property; |
• | Compliance with multiple and potentially conflicting regulatory requirements and practices; |
• | Commercial laws that favor local businesses; |
• | Exposure to economic fluctuations including inflationary risk and continuing sovereign debt risk; |
• | Shortages in component parts and raw materials; |
• | Import, export and trade regulation changes that could erode our profit margins or restrict our ability to transport our products; |
• | The burden and cost of complying with foreign and U.S. laws governing corporate conduct outside the U.S. including the Foreign Corrupt Practices Act, the United Kingdom Bribery Act and other similar regulations; |
• | Adverse movement of foreign currencies against the U.S. dollar (the currency in which our results are reported) and global economic conditions generally; |
• | Inflexible employee contracts and employment laws that may make it difficult to terminate or change the compensation structure for employees in some foreign countries in the event of business downturns; |
• | Recruiting employees in highly competitive markets and wage inflation in certain markets; |
• | Potential restrictions on the transfer of funds between countries; |
• | Political, military, social and infrastructure risks, especially in emerging or developing economies; |
• | Import and export duties and value-added taxes; |
• | Natural disasters, including earthquakes, flooding, typhoons and tsunamis; and |
• | Cultural differences that affect the way we do business. |
Any or all of these risks could have a material adverse effect on our business.
18
Our quarterly operating results have fluctuated significantly, and past quarterly operating results should not be used to predict future performance.
Our quarterly operating results have fluctuated significantly in the past and could fluctuate significantly in the future. As a result, our quarterly operating results should not be used to predict future performance. Quarterly operating results could be materially and adversely affected by a number of factors, including, but not limited to:
• | Fluctuations in IT spending as a result of economic conditions or fluctuations in U.S. federal government spending; |
• | Failure by our contract manufacturers to complete shipments in the last month of a quarter during which a substantial portion of our products are typically shipped; |
• | Customers canceling, reducing, deferring or rescheduling significant orders as a result of excess inventory levels, weak economic conditions or other factors; |
• | Seasonality, including customer fiscal year-ends and budget availability impacting customer demand for our products; |
• | Declines in large orders (defined as orders greater than $200,000); |
• | Declines in royalty or software revenues; |
• | Product development and ramp cycles and product performance or quality issues of ours or our competitors; |
• | Poor execution of and performance against expected sales and marketing plans and strategies; |
• | Reduced demand from our OEM or distribution, VAR, DMR and other large customers; |
• | Increased competition which may, among other things, increase pricing pressure or reduce sales; |
• | Failure to meet the expectations of investors or analysts; |
• | Restructuring actions or unexpected costs; and |
• | Foreign exchange fluctuations. |
If we fail to meet our projected quarterly results, our business, financial condition and results of operations may be materially and adversely affected.
If we fail to protect our intellectual property or if others use our proprietary technology without authorization, our competitive position may suffer.
Our future success and ability to compete depends in part on our proprietary technology. We rely on a combination of copyright, patent, trademark and trade secrets laws and nondisclosure agreements to establish and protect our proprietary technology. However, we cannot provide assurance that patents will be issued with respect to pending or future patent applications that we have filed or plan to file or that our patents will be upheld as valid or will prevent the development of competitive products or that any actions we have taken will adequately protect our intellectual property rights. We generally enter into confidentiality agreements with our employees, consultants, customers, potential customers, contract manufacturers and others as required, in which we strictly limit access to, and distribution of, our software and further limit the disclosure and use of our proprietary information.
Despite our efforts to protect our proprietary rights, unauthorized parties may attempt to copy or otherwise obtain or use our products or technology. Enforcing our intellectual property rights can sometimes only be accomplished through the use of litigation. Our competitors may also independently develop technologies that are substantially equivalent or superior to our technology. In addition, the laws of some foreign countries do not protect our proprietary rights to the same extent as the laws of the U.S.
19
Because we may order components from suppliers in advance of receipt of customer orders for our products that include these components, we could face a material inventory risk if we fail to accurately forecast demand for our products or manage production, which could have a material and adverse effect on our results of operations and cash flows.
Although we use third parties to manufacture our products, in some cases we may retain the responsibility to purchase component inventory to support third party manufacturing activities, which presents a number of risks that could materially and adversely affect our financial condition. For instance, as part of our component planning, we may place orders with or pay certain suppliers for components in advance of receipt of customer orders. We may occasionally enter into negotiated orders with vendors early in the manufacturing process of our products to ensure that we have sufficient components for our products to meet anticipated customer demand. Because the design and manufacturing process for these components can be complicated, it is possible that we could experience a design or manufacturing flaw that could delay or even prevent the production of the components for which we previously committed to pay. We also face the risk of ordering too many components, or conversely, not enough components, since supply orders are generally based on forecasts of customer orders rather than actual customer orders. In addition, in some cases, we may make non-cancelable order commitments to our suppliers for work-in-progress, supplier’s finished goods, custom sub-assemblies, discontinued (end-of-life) components and Quantum-unique raw materials that are necessary to meet our lead times for finished goods. If we cannot change or be released from supply orders, we could incur costs from the purchase of unusable components, either due to a delay in the production of the components or other supplies or as a result of inaccurately predicting supply orders in advance of customer orders. These same risks exist with our third party contract manufacturing partners. Our business and operating results could be materially and adversely affected if we incur increased costs or are unable to fulfill customer orders.
Our manufacturing, component production and service repair are outsourced to third party contract manufacturers, component suppliers and service providers. If we cannot obtain products, parts and services from these third parties in a cost effective and timely manner that meets our customers’ expectations, this could materially and adversely impact our business, financial condition and results of operations.
Many aspects of our supply chain and operational results are dependent on the performance of third party business partners. We increased the use of third party contract manufacturers, service providers and/or product integrators in fiscal 2014 in connection with our transition to an outsourced manufacturing model. We face a number of risks as a result of these relationships, including, among others:
• | Sole source of product supply |
In many cases, our business partner may be the sole source of supply for the products or parts they manufacture, or the services they provide, for us. Because we are relying on one supplier, we are at greater risk of experiencing shortages, reduced production capacity or other delays in customer deliveries that could result in customer dissatisfaction, lost sales and increased expenses, each of which could materially damage customer relationships and result in lost revenue.
• | Cost and purchase commitments |
We may not be able to control the costs for the products our business partners manufacture for us or the services they provide to us. They procure inventory to build our products based upon a forecast of customer demand that we provide. We could be responsible for the financial impact on the contract manufacturer, supplier or service provider of any reduction or product mix shift in the forecast relative to materials that they had already purchased under a prior forecast. Such a variance in forecasted demand could require us to pay them for finished goods in excess of current customer demand or for excess or obsolete inventory and generally incur higher costs. As a result, we could experience reduced gross margins and operating losses based on these purchase commitments. With respect to service providers, although we have contracts for most of our third party repair service vendors, the contract period may not be the same as the underlying service contract with our customer. In such cases, we face risks that the third party service provider may increase the cost of providing services over subsequent periods contracted with our customer.
• | Financial condition and stability |
Our third party business partners may suffer adverse financial or operational results or may be negatively impacted by global and local economic conditions. Therefore, we may face interruptions in the supply of product components or service as a result of financial or other volatility affecting our supply chain. We could suffer production downtime or increased costs to procure alternate products or services as a result of the possible inadequate financial condition of one or more of our business partners.
20
• | Quality and supplier conduct |
We have limited control over the quality of products and components produced and services provided by our supply chain and third party contract manufacturing and service business partners. Therefore, the quality of the products, parts or services may not be acceptable to our customers and could result in customer dissatisfaction, lost revenue and increased warranty costs. In addition, we have limited control over the manner in which our business partners conduct their business. Sub-tier suppliers selected by the primary third party could have process control issues or could select components with latent defects that manifest over a longer period of time. We may face negative consequences or publicity as a result of a third party’s failure to comply with applicable compliance, trade, environmental or employment regulations.
Any or all of these risks could have a material adverse effect on our business. In the past we have successfully transitioned products or component supply from one supplier or manufacturing location to another without significant financial or operational impact, but there is no guarantee of our continued ability to do so.
If we do not successfully manage the changes that we have made and may continue to make to our infrastructure and management, our business could be disrupted, and that could adversely impact our results of operations and financial condition.
Managing change is an important focus for us. In recent years, we have implemented several significant initiatives involving our sales and marketing, engineering and operations organizations, aimed at increasing our efficiency and better aligning these groups with our corporate strategy. In addition, we have reduced headcount to streamline and consolidate our supporting functions as appropriate in response to market or competitive conditions and following past acquisitions and have increased our reliance on certain third party business relationships. Our inability to successfully manage the changes that we implement and detect and address issues as they arise could disrupt our business and adversely impact our results of operations and financial condition.
Because we rely heavily on distributors and other resellers to market and sell our products, if one or more distributors were to experience a significant deterioration in its financial condition or its relationship with us, this could disrupt the distribution of our products and reduce our revenue, which could materially and adversely affect our business, financial condition and operating results.
In certain product and geographic segments we heavily utilize distributors and value added resellers to perform the functions necessary to market and sell our products. To fulfill this role, the distributor must maintain an acceptable level of financial stability, creditworthiness and the ability to successfully manage business relationships with the customers it serves directly. Under our distributor agreements with these companies, each of the distributors determines the type and amount of our products that it will purchase from us and the pricing of the products that it sells to its customers. If the distributor is unable to perform in an acceptable manner, we may be required to reduce the amount of sales of our product to the distributor or terminate the relationship. We may also incur financial losses for product returns from distributors or for the failure or refusal of distributors to pay obligations owed to us. Either scenario could result in fewer of our products being available to the affected market segments, reduced levels of customer satisfaction and/or increased expenses, which could in turn have a material and adverse impact on our business, results of operations and financial condition.
Our stock price has been volatile and such volatility could increase based on the trading activity of our institutional investors. In addition, there are other factors and events that could affect the trading prices of our common stock.
A small number of institutional investors have owned a significant portion of our common stock at various times in recent years. If any or all of these investors were to decide to purchase significant additional shares or to sell significant amounts or all of the common shares they currently own, or if there is a perception that those sales may occur, that may cause our stock price to be more volatile. For example, there have been instances in the past where a shareholder with a significant equity position began to sell shares, putting downward pressure on our stock price for the duration of their selling activity. In these situations, selling pressure outweighed buying demand and our stock price declined. This situation has occurred due to our stock price falling below institutional investors’ price thresholds and our volatility increasing beyond investors’ volatility parameters, causing even greater selling pressure.
21
Trading prices of our common stock may fluctuate in response to a number of other events and factors, such as:
• | General economic conditions; |
• | Changes in interest rates; |
• | Fluctuations in the stock market in general and market prices for technology companies in particular; |
• | Quarterly variations in our operating results; |
• | Failure to meet our expectations or the expectations of securities analysts and investors; |
• | New products, services, innovations and strategic developments by our competitors or us, or business combinations and investments by our competitors or us; |
• | Changes in financial estimates by us or securities analysts and recommendations by securities analysts; |
• | Changes in our capital structure, including issuance of additional debt or equity to the public; and |
• | Strategic acquisitions. |
Any of these events and factors may cause our stock price to rise or fall and may adversely affect our business and financing opportunities.
Our design processes are subject to safety and environmental regulations which could lead to increased costs, or otherwise adversely affect our business, financial condition and results of operations.
We are subject to a variety of laws and regulations relating to, among other things, the use, storage, discharge and disposal of materials and substances used in our facilities as well as the safety of our employees and the public. Current regulations in the U.S. and various international jurisdictions restrict the use of certain potentially hazardous materials used in electronic products and components (including lead and some flame retardants), impose a “take back” obligation on manufacturers for the financing of the collection, recovery and disposal of electrical and electronic equipment and require extensive investigation into and disclosure regarding certain minerals used in our supply chain. We have implemented procedures and will likely continue to introduce new processes to comply with current and future safety and environmental legislation. However, measures taken now or in the future to comply with such legislation may adversely affect our costs or product sales by requiring us to acquire costly equipment or materials, redesign processes or to incur other significant expenses in adapting our waste disposal and emission management processes. Furthermore, safety or environmental claims or our failure to comply with present or future regulations could result in the assessment of damages or imposition of fines against us or the suspension of affected operations, which could have an adverse effect on our business, financial condition and results of operations.
We are subject to many laws and regulations, and violation of or changes in those requirements could materially and adversely affect our business.
We are subject to numerous U.S. and international laws regarding corporate conduct, fair competition, corruption prevention and import and export practices, and requirements including laws applicable to U.S. government contractors. In addition, the SEC has adopted disclosure rules related to the supply of certain minerals originating from the conflict zones of the Democratic Republic of Congo or adjoining countries, and we have incurred costs to comply with such regulations and may realize other costs relating to the sourcing and availability of minerals used in our products. While we maintain a rigorous corporate ethics and compliance program, we may be subject to increased regulatory scrutiny, significant monetary fines or penalties, suspension of business opportunities or loss of jurisdictional operating rights as a result of any failure to comply with those requirements. If we were to be subject to a compliance investigation, we may incur increased personnel and legal costs. Our supply and distribution models may be reliant upon the actions of our third party business partners and we may also be exposed to potential liability resulting from their violation of these or other compliance requirements. Further, our U.S. and international business models are based on currently applicable regulatory requirements and exceptions. Changes in those requirements or exceptions could necessitate changes to our business model. Any of these consequences could materially and adversely impact our business and operating results.
A cybersecurity breach could adversely affect our ability to conduct our business, harm our reputation, expose us to significant liability or otherwise damage our financial results.
A cybersecurity breach could negatively affect our reputation as a trusted provider of scale-out storage, archive and data protection products by adversely affecting the market’s perception of the security or reliability of our products and services. Many of our customers and partners store sensitive data on our products, and a cybersecurity breach related to our products could harm our reputation and potentially expose us to significant liability.
We also maintain sensitive data related to our employees, strategic partners and customers, including intellectual property, proprietary business information and personally identifiable information on our own systems. We employ sophisticated security measures; however, we may face threats across our infrastructure including unauthorized access, security breaches and other system disruptions.
22
It is critical to our business that our employees’, strategic partners’ and customers’ sensitive information remains secure and that our customers perceive that this information is secure. A cybersecurity breach could result in unauthorized access to, loss of, or unauthorized disclosure of such information. A cybersecurity breach could expose us to litigation, indemnity obligations, government investigations and other possible liabilities. Additionally, a cyber-attack, whether actual or perceived, could result in negative publicity which could harm our reputation and reduce our customers’ confidence in the effectiveness of our solutions, which could materially and adversely affect our business and operating results. A breach of our security systems could also expose us to increased costs including remediation costs, disruption of operations or increased cybersecurity protection costs that may have a material adverse effect on our business.
Our actual or perceived failure to adequately protect personal data could adversely affect our business, financial condition and results of operations.
A variety of state, national, foreign, and international laws and regulations apply to the collection, use, retention, protection, disclosure, transfer and other processing of personal data. These privacy- and data protection-related laws and regulations are evolving, with new or modified laws and regulations proposed and implemented frequently and existing laws and regulations subject to new or different interpretations. Compliance with these laws and regulations can be costly and can delay or impede the development of new products.
For example, we historically have relied upon adherence to the U.S. Department of Commerce’s Safe Harbor Privacy Principles and compliance with the U.S.-EU Safe Harbor Framework agreed to by the U.S. Department of Commerce and the EU. The U.S.-EU Safe Harbor Framework, which established means for legitimizing the transfer of personal data by U.S. companies from the European Economic Area, or EEA, to the U.S., recently was invalidated by a decision of the European Court of Justice, or the ECJ. In light of the ECJ’s decision, we are reviewing our business practices and may find it necessary or desirable to make changes to our personal data handling to cause our transfer and receipt of EEA residents’ personal data to be legitimized under applicable European law. Additionally, the European Commission is considering adoption of a general data protection regulation that would supersede current EU data protection legislation, impose more stringent EU data protection requirements and provide for greater penalties for noncompliance. Our actual or alleged failure to comply with applicable laws and regulations, or to protect personal data, could result in enforcement actions and significant penalties against us, which could result in negative publicity, increase our operating costs, subject us to claims or other remedies and have a material adverse effect on our business, financial condition, and results of operations.
We must maintain appropriate levels of service parts inventories. If we do not have sufficient service parts inventories, we may experience increased levels of customer dissatisfaction. If we hold excessive service parts inventories, we may incur financial losses.
We maintain levels of service parts inventories to satisfy future warranty obligations and also to earn service revenue by providing enhanced and extended warranty and repair service during and beyond the warranty period. We estimate the required amount of service parts inventories based on historical usage and forecasts of future warranty and extended warranty requirements, including estimates of failure rates and costs to repair, and out of warranty revenue. Given the significant levels of judgment inherently involved in the process, we cannot provide assurance that we will be able to maintain appropriate levels of service parts inventories to satisfy customer needs and to avoid financial losses from excess service parts inventories. If we are unable to maintain appropriate levels of service parts inventories, our business, financial condition and results of operations may be materially and adversely impacted.
From time to time we have made acquisitions. The failure to successfully integrate future acquisitions could harm our business, financial condition and operating results.
As a part of our business strategy, we have in the past and may make acquisitions in the future, subject to certain debt covenants. We may also make significant investments in complementary companies, products or technologies. If we fail to successfully integrate such acquisitions or significant investments, it could harm our business, financial condition and operating results. Risks that we may face in our efforts to integrate any recent or future acquisitions include, among others:
• | Failure to realize anticipated synergies from the acquisition; |
• | Difficulties in assimilating and retaining employees; |
• | Potential incompatibility of business cultures or resistance to change; |
• | Coordinating geographically separate organizations; |
• | Diversion of management’s attention from ongoing business concerns; |
• | Coordinating infrastructure operations in a rapid and efficient manner; |
• | The potential inability to maximize our financial and strategic position through the successful incorporation of acquired technology and rights into our products and services; |
• | Failure of acquired technology or products to provide anticipated revenue or margin contribution; |
23
• | Insufficient revenues to offset increased expenses associated with the acquisition; |
• | Costs and delays in implementing or integrating common systems and procedures; |
• | Reduction or loss of customer orders due to the potential for market confusion, hesitation and delay; |
• | Impairment of existing customer, supplier and strategic relationships of either company; |
• | Insufficient cash flows from operations to fund the working capital and investment requirements; |
• | Difficulties in entering markets in which we have no or limited direct prior experience and where competitors in such markets have stronger market positions; |
• | The possibility that we may not receive a favorable return on our investment, the original investment may become impaired, and/or we may incur losses from these investments; |
• | Dissatisfaction or performance problems with the acquired company; |
• | The assumption of risks of the acquired company that are difficult to quantify, such as litigation; |
• | The cost associated with the acquisition, including restructuring actions, which may require cash payments that, if large enough, could materially and adversely affect our liquidity; and |
• | Assumption of unknown liabilities or other unanticipated adverse events or circumstances. |
Acquisitions present many risks, and we may not realize the financial and strategic goals that were contemplated at the time of any transaction. We cannot provide assurance that we will be able to successfully integrate any business, products, technologies or personnel that we may acquire in the future, and our failure to do so could negatively impact our business, financial condition and operating results.
We were notified by the New York Stock Exchange (“NYSE”) that we did not meet its continued listing requirements, and we potentially face delisting if we do not comply with NYSE standards.
We received notification from the NYSE on October 2, 2015 that we are not in compliance with the NYSE’s continued listing standard requiring that our stock trade at a minimum average closing price of $1.00 for thirty consecutive trading days. In order to regain compliance, we expect that we will need to take actions, such as a reverse stock split, which will require shareholder action at our annual shareholder meeting for fiscal year 2016. If shareholders do not approve the actions we propose to regain compliance, or we are unable to otherwise regain compliance with the NYSE listing requirements, our common stock will be delisted from the NYSE, and, as a result, we would likely have our common stock quoted on the Over-the-Counter Bulletin Board, or the OTC BB. Securities that trade on the OTC BB generally have less liquidity and greater volatility than securities that trade on the NYSE. In addition, because issuers whose securities trade on the OTC BB are not subject to the corporate governance and other standards imposed by the NYSE, our reputation may suffer, which could result in a decrease in the trading price of our shares. The market price of our common stock has historically fluctuated and is likely to fluctuate in the future.
If the future outcomes related to the estimates used in recording tax liabilities to various taxing authorities result in higher tax liabilities than estimated, then we would have to record tax charges, which could be material.
We have provided amounts and recorded liabilities for probable and estimable tax adjustments that may be proposed by various taxing authorities in the U.S. and foreign jurisdictions. If events occur that indicate payments of these amounts will be less than estimated, then reversals of these liabilities would create tax benefits recognized in the periods when we determine the liabilities have reduced. Conversely, if events occur which indicate that payments of these amounts will be greater than estimated, then tax charges and additional liabilities would be recorded. In particular, various foreign jurisdictions could challenge the characterization or transfer pricing of certain intercompany transactions. In the event of an unfavorable outcome of such challenge, there exists the possibility of a material tax charge and adverse impact on the results of operations in the period in which the matter is resolved or an unfavorable outcome becomes probable and estimable.
Certain changes in stock ownership could result in a limitation on the amount of net operating loss and tax credit carryovers that can be utilized each year. Should we undergo such a change in stock ownership, it would severely limit the usage of these carryover tax attributes against future income, resulting in additional tax charges, which could be material.
We are exposed to fluctuations in foreign currency exchange rates, and an adverse change in foreign currency exchange rates relative to our position in such currencies could have a material adverse impact on our business, financial condition and results of operations.
We do not currently use derivative financial instruments for speculative purposes. We have used in the past, and may use in the future, foreign currency forward contracts and derivative instruments to hedge our exposure to foreign currency exchange rates. To the extent that we have assets or liabilities denominated in a foreign currency that are inadequately hedged or not hedged at all, we may be subject to foreign currency losses, which could be significant.
24
Our international operations can act as a natural hedge when both operating expenses and sales are denominated in local currencies. In these instances, although an unfavorable change in the exchange rate of a foreign currency against the U.S. dollar would result in lower sales when translated to U.S. dollars, operating expenses would also be lower in these circumstances. An increase in the rate at which a foreign currency is exchanged for U.S. dollars would require more of that particular foreign currency to equal a specified amount of U.S. dollars than before such rate increase. In such cases, and if we were to price our products and services in that particular foreign currency, we would receive fewer U.S. dollars than we would have received prior to such rate increase for the foreign currency. Likewise, if we were to price our products and services in U.S. dollars while competitors priced their products in a local currency, an increase in the relative strength of the U.S. dollar would result in our prices being uncompetitive in those markets. Such fluctuations in currency exchange rates could materially and adversely affect our business, financial condition and results of operations.
The Company faces various risks associated with shareholder activists, including a potential proxy contest at our 2016 annual meeting of stockholders.
On June 3, 2016, VIEX Capital Advisors, LLC (“VIEX”) delivered a letter to us nominating five director candidates, for election to the Board at the 2016 annual meeting of stockholders, (the “2016 Annual Meeting”). Depending on certain circumstances, including how many nominees VIEX seeks to elect, it is possible that VIEX nominated directors could constitute a majority of the Board following the 2016 Annual Meeting.
If our Board chooses to nominate different director candidates, there would be a proxy contest. A proxy contest would require us to incur significant legal fees and proxy solicitation expenses and require significant time and attention by management and the Board. Further, any perceived uncertainties as to our future direction and control could result in the loss of potential business opportunities and may make it more difficult to attract and retain qualified personnel and business partners, any of which could adversely affect our business and operating results.
Under certain circumstances, a change in a majority of the Board may result in a change of control under the severance and change of control agreements we have with our management. Pursuant to the severance and change in control agreements, certain severance payments may be triggered following a change of control, but only upon there being a qualifying termination that occurs within twelve months of any such change of control. A change in a majority of the Board may also result in a change of control under certain contracts with third parties, including our directors’ and officers’ liability insurance and our Wells Fargo credit agreement, if we are unable to secure appropriate waivers or amendments to any such contracts. The occurrence of any of the foregoing events could adversely affect our business.
25
ITEM 1B. UNRESOLVED STAFF COMMENTS
None.
ITEM 2. PROPERTIES
Our headquarters are located in San Jose, California. We lease facilities in North America, Europe and Asia Pacific. The following is a summary of the significant locations and primary functions of those facilities as of March 31, 2016:
Location | Function | |
North America | ||
San Jose, CA | Corporate headquarters, research and development | |
Irvine, CA | Administration, research and development, sales, service | |
Colorado Springs, CO | Administration, operations management, research and development, service | |
Englewood, CO | Research and development, sales, service | |
Mendota Heights, MN | Research and development | |
Richardson, TX | Research and development | |
Bellevue, WA | Administration and sales | |
Seattle, WA | Research and development | |
Other North America | Sales | |
Europe | ||
Paris, France | Sales and service | |
Boehmenkirch, Germany | Service | |
Munich, Germany | Sales and service | |
Zurich, Switzerland | Administration and operations | |
Bracknell, UK | Sales and service | |
Northampton, UK | Service | |
Other Europe | Sales and service | |
Asia Pacific | ||
Adelaide, Australia | Research and development | |
Beijing, China | Marketing and sales | |
Kuala Lumpur, Malaysia | Customer service | |
Singapore City, Singapore | Administration, operations management, sales | |
Other Asia Pacific | Sales | |
26
ITEM 3. LEGAL PROCEEDINGS
On February 18, 2014, Crossroads Systems, Inc. (“Crossroads”) filed a patent infringement lawsuit against Quantum in the U.S. District Court for the Western District of Texas, alleging infringement of U.S. patents 6,425,035 and 7,934,041. An amended complaint filed on April 15, 2014 also alleged infringement of U.S. patent 7,051,147. Crossroads asserts that we have incorporated Crossroads' patented technology into our StorNext QX and Q-Series lines of disk array products and into our Scalar libraries. Crossroads seeks unspecified monetary damages and injunctive relief. Crossroads has already dismissed all claims of infringement with respect to the StorNext QX and Q-Series products. In July and September of 2014, we filed for inter partes review of all three asserted Crossroads patents before the Patent Trial and Appeal Board and a review has been initiated for all claims. On June 16, 2015, the U.S. District Court, Western District of Texas stayed the Crossroads trial proceedings pending resolution of the inter partes review proceedings. On January 29, 2016, the Patent Trial and Appeal Board issued decisions on the inter partes reviews for U.S. patents 6,425,035 and 7,051,147, ordering all claims of both patents to be unpatentable. On March 17, 2016, the Patent Trial and Appeal Board issued a decision on the inter partes review for U.S. patent 7,934,041, ordering all claims to be unpatentable. On March 31, 2016, Crossroads filed Notices of Appeal in each of the inter partes review decisions. We believe the probability that this lawsuit will have a material adverse effect on our business, operating results or financial condition is remote.
On September 23, 2014, we filed a lawsuit against Crossroads in the U.S. District Court for the Northern District of California alleging patent infringement of our U.S. patent 6,766,412 by Crossroads' StrongBox VSeries Library Solution product. We are seeking injunctive relief and the recovery of monetary damages. On December 4, 2014, we amended our complaint alleging infringement of a second U.S. patent, 5,940,849, related to Crossroads' SPHiNX product line. On December 16, 2014, we withdrew the amended complaint alleging infringement of the second patent, 5,940,849. On November 23, 2015, we dismissed the lawsuit alleging patent infringement of U.S. patent 6,766,412 pursuant to a confidential settlement agreement.
On September 23, 2014, we filed a lawsuit against Crossroads in the U.S. District Court for the Northern District of California alleging patent infringement of our U.S. patent 6,766,412 by Crossroads' StrongBox VSeries Library Solution product. We are seeking injunctive relief and the recovery of monetary damages. On December 4, 2014, we amended our complaint alleging infringement of a second U.S. patent, 5,940,849, related to Crossroads' SPHiNX product line. On December 16, 2014, we withdrew the amended complaint alleging infringement of the second patent, 5,940,849. On November 23, 2015, we dismissed the lawsuit alleging patent infringement of U.S. patent 6,766,412 pursuant to a confidential settlement agreement.
ITEM 4. MINE SAFETY DISCLOSURES
Not applicable.
27
PART II
ITEM 5. | MARKET FOR REGISTRANT’S COMMON EQUITY, RELATED STOCKHOLDER MATTERS AND ISSUER PURCHASES OF EQUITY SECURITIES |
Our common stock is traded on the New York Stock Exchange under the symbol “QTM.” As of May 27, 2016, the closing price of our common stock was $0.38 per share. The prices per share reflected in the following table represent the range of high and low sales prices of our common stock for the quarters indicated:
Fiscal 2016 | High | Low | |||||
First quarter ended June 30, 2015 | $ | 2.22 | $ | 1.48 | |||
Second quarter ended September 30, 2015 | 1.72 | 0.69 | |||||
Third quarter ended December 31, 2015 | 1.05 | 0.66 | |||||
Fourth quarter ended March 31, 2016 | 0.93 | 0.40 | |||||
Fiscal 2015 | High | Low | |||||
First quarter ended June 30, 2014 | $ | 1.23 | $ | 0.97 | |||
Second quarter ended September 30, 2014 | 1.34 | 1.14 | |||||
Third quarter ended December 31, 2014 | 1.83 | 1.02 | |||||
Fourth quarter ended March 31, 2015 | 1.80 | 1.35 | |||||
Historically, we have not paid cash dividends on our common stock and do not intend to pay dividends in the foreseeable future. Our ability to pay dividends is restricted by the covenants in our senior secured revolving credit agreement unless we meet certain defined thresholds. See the section captioned “Liquidity and Capital Resources” in Item 7 “Management’s Discussion and Analysis of Financial Condition and Results of Operations” and also Note 7 “Debt” to the Consolidated Financial Statements.
As of May 27, 2016, there were 960 Quantum stockholders of record, including the Depository Trust Company, which holds shares of Quantum common stock on behalf of an indeterminate number of beneficial owners. The information required by this item regarding equity compensation plans is provided in Item 12, “Security Ownership of Certain Beneficial Owners and Management and Related Stockholder Matters.”
Performance Graph
The following graph compares the cumulative total return to stockholders of Quantum common stock at March 31, 2016 for the period since March 31, 2011 to the cumulative total return over such period of (i) the NASDAQ Composite Index and (ii) the S&P Computer Storage & Peripherals Index. The graph assumes an investment of $100 on March 31, 2011 in our common stock and in each of the indices listed on the graph and reflects the change in the market price of our common stock relative to the changes in the noted indices at March 31, 2012, 2013, 2014, 2015 and 2016. The performance shown below is based on historical data and is not indicative of, nor intended to forecast, future price performance of our common stock.
28
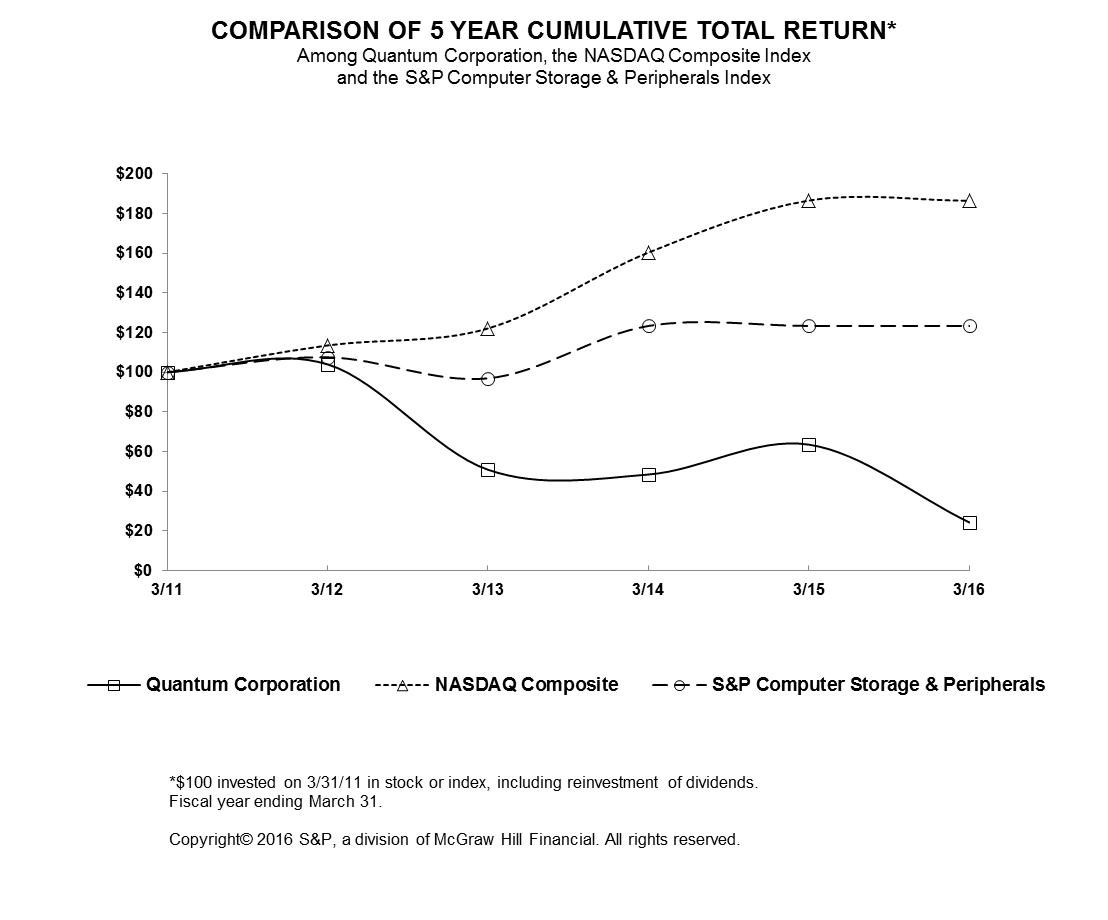
29
ITEM 6. SELECTED FINANCIAL DATA
This summary of selected consolidated financial information of Quantum for fiscal 2012 to 2016 should be read together with our Consolidated Financial Statements contained in this Annual Report on Form 10-K.
Other Items
Fiscal 2016 results included a $55.6 million goodwill impairment charge.
For the year ended March 31, | |||||||||||||||||||
(In thousands, except per share data) | 2016 | 2015 | 2014 | 2013 | 2012 | ||||||||||||||
Statement of Operations Data: | |||||||||||||||||||
Total revenue | $ | 475,958 | $ | 553,095 | $ | 553,165 | $ | 587,439 | $ | 651,987 | |||||||||
Total cost of revenue | 271,206 | 308,409 | 313,545 | 346,878 | 378,542 | ||||||||||||||
Gross margin | 204,752 | 244,686 | 239,620 | 240,561 | 273,445 | ||||||||||||||
Income (loss) from operations | (66,098 | ) | 14,397 | (11,799 | ) | (42,460 | ) | 4,745 | |||||||||||
Net income (loss) | (74,683 | ) | 16,760 | (21,474 | ) | (52,179 | ) | (9,256 | ) | ||||||||||
Basic net income (loss) per share | (0.28 | ) | 0.07 | (0.09 | ) | (0.22 | ) | (0.04 | ) | ||||||||||
Diluted net income (loss) per share | (0.28 | ) | 0.06 | (0.09 | ) | (0.22 | ) | (0.04 | ) | ||||||||||
As of March 31, | ||||||||||||||||||||
2016 | 2015 | 2014 | 2013 | 2012 | ||||||||||||||||
Balance Sheet Data: | ||||||||||||||||||||
Total assets | $ | 229,546 | $ | 357,158 | * | $ | 358,510 | * | $ | 364,136 | * | $ | 392,263 | * | ||||||
Short-term debt | 3,000 | 83,345 | — | — | — | |||||||||||||||
Long-term debt | 131,962 | 68,793 | * | 200,447 | * | 200,254 | * | 183,535 | * | |||||||||||
* Debt issuance costs related to convertible subordinated debts were previously included in other current and long-term assets. Previously reported amounts have been reclassified from other current and long-term assets to convertible subordinated debt to conform to current period presentation.
30
ITEM 7. | MANAGEMENT’S DISCUSSION AND ANALYSIS OF FINANCIAL CONDITION AND RESULTS OF OPERATIONS |
OVERVIEW
Quantum Corporation (“Quantum”, the “Company”, “us” or “we”), founded in 1980 and reincorporated in Delaware in 1987, is a leading expert in scale-out storage, archive and data protection, providing solutions for capturing, sharing, managing and preserving digital assets over the entire data lifecycle. Our customers, ranging from small businesses to large/multi-national enterprises, trust us to address their most demanding data workflow challenges. Our end-to-end tiered storage solutions enable users to maximize the value of their data by making it accessible whenever and wherever needed, retaining it indefinitely and reducing total cost and complexity. We work closely with a broad network of distributors, value-added resellers (“VARs”), direct marketing resellers (“DMRs”), original equipment manufacturers (“OEMs”) and other suppliers to meet customers’ evolving needs. Our stock is traded on the New York Stock Exchange under the symbol QTM.
Business
We believe our combination of expertise, innovation and platform independence enables us to solve scale-out storage and data protection challenges more easily, cost-effectively and securely than competitive offerings. We earn our revenue from the sale of products, systems and services through an array of channel partners and our sales force. Our products are sold under both the Quantum brand name and the names of various OEM customers. Our scale-out storage solutions include StorNext software, StorNext appliances (which include StorNext disk storage, StorNext-related tape storage and Xcellis workflow storage), StorNext Pro Solutions, Lattus extended online storage systems, Q-Cloud Archive and Q-Cloud Vault. These products are designed to help customers manage large unstructured data sets in an information workflow, encompassing high-performance ingest, real-time collaboration, scalable processing, intelligent protection and high-value monetization. Our data protection solutions include DXi deduplication backup systems and Scalar automated tape libraries that optimize backup and recovery, simplify management and lower cost. Our vmPRO virtual server backup and disaster recovery offerings protect virtual environments while minimizing the impact on servers and storage. In addition, we offer software for cloud backup and disaster recovery of physical and virtual servers. We have a full range of services and the global scale and scope to support our worldwide customer base.
Our goal for fiscal 2016 was to increase shareholder value by growing our scale-out storage revenue and investing to drive future scale-out growth while also delivering on our operating profit goals. In scale-out storage, we continued to focus on building our market presence beyond media and entertainment into video surveillance, technical workflow and unstructured data archive use cases. Outside of scale-out storage, our strategy is to continue leveraging our technology leadership, our extensive customer base and our channel and technology partnerships to generate profits and cash from our offerings.
During fiscal 2016, we added Xcellis workflow storage and Artico NAS archive appliance to our scale-out storage portfolio. Xcellis is a high performance storage solution engineered to optimize demanding workflows and accelerate time to insight. Artico offers a flexible, low-cost entry point for archiving data across multiple storage tiers, both on-premise and in the cloud. We also expanded Q-Cloud offerings with the launch of Q-Cloud Vault, a new service that enables users to take advantage of secure, low-cost public cloud storage for long-term retention of digital assets. We began offering LTO-7 to our tiered storage portfolio, more than doubling the capacity over previous generations and enabling low-cost, energy-efficient and secure storage for protecting and retaining data.
Building on our strength in tape automation, we announced enhancements to the Scalar i6000, including doubling drive density and adding web services management capabilities. We established a new partnership with Veeam to maximize data availability for virtual environments. Leveraging Veeam Backup & Replication software and our DXi, customers can restore files in seconds and virtual machines in minutes, while reducing both on-premise and disaster recovery site storage costs compared to traditional backup applications.
In fiscal 2016, we repaid the $83.7 million remaining balance of our 3.50% convertible subordinated notes due November 15, 2015 ("3.50% notes") using a combination of cash and $68.9 million of proceeds from our credit agreement with Wells Fargo ("WF credit agreement") to fund the purchases and pay the accrued interest.
Our data protection revenues have been impacted by overall weakness in general storage market during fiscal 2016. In November 2015, we approved a plan ("Fiscal 2016 Restructuring Plan") to eliminate approximately 65 positions in the U.S. and internationally, primarily in research and development and sales and marketing functions, in order to improve our cost structure and align spending with continuing operations plans. We incurred aggregate restructuring charges of approximately $2.0 million under this plan, of which $1.7 million was paid. The ending balance for accrued restructuring charges for the Fiscal 2016 Restructuring Plan is $0.3 million as of March 31, 2016, which is expected to be paid by the second quarter of fiscal 2017.
31
Results
We had total revenue of $476.0 million in fiscal 2016, a $77.1 million decrease from fiscal 2015, primarily due to decreased revenue from data protection tape automation systems, disk backup systems, media and service, partially offset by an increase in revenue from scale-out storage solutions. Those factors also resulted in a net 13% decrease in our branded product and service revenue. Revenue from branded scale-out storage solutions increased in fiscal 2016 compared to fiscal 2015 in North America. Our continued focus on our branded business is reflected in a greater proportion of non-royalty revenue from branded business, reaching 89% in fiscal 2016, compared to 88% in fiscal 2015.
Our fiscal 2016 gross margin percentage decreased 120 basis points from fiscal 2015 to 43.0% primarily due to a decrease in material margin related to changes in our overall revenue mix as well as lower revenue to cover fixed costs. Higher margin service revenue decreased and lower margin products comprised a higher portion of our product revenue. In addition, we are experiencing overall pricing pressure in the storage market, which has resulted in increased discounting of our products.
Our operating expenses increased $40.1 million, or 17.4%, from fiscal 2015 as a result of a $55.6 million goodwill impairment charge. The increase from the impairment was offset by a decrease in compensation and benefits largely attributable to recognition of a profit sharing bonus in fiscal 2015 which was not repeated in fiscal 2016, a decrease in commission expense on lower branded revenue and a decrease in intangible amortization expense due to certain intangibles becoming fully amortized during fiscal 2015. The goodwill impairment charge does not impact our cash balance, ability to generate cash flows from operations, liquidity or compliance with debt covenants.
We had $74.7 million of net loss in fiscal 2016 compared to $16.8 million of net income in fiscal 2015, which included a gain of $13.6 million resulting from the sale of our investment in a privately held company in fiscal 2015.
RESULTS OF OPERATIONS FOR FISCAL 2016, 2015 and 2014
Revenue
For the year ended March 31, | Change | |||||||||||||||||||||||||||||||||
(dollars in thousands) | 2016 | 2015 | 2014 | 2016 vs. 2015 | 2015 vs. 2014 | |||||||||||||||||||||||||||||
% of revenue | % of revenue | % of revenue | ||||||||||||||||||||||||||||||||
Product revenue | $ | 286,217 | 60.1 | % | $ | 355,579 | 64.3 | % | $ | 348,318 | 63.0 | % | $ | (69,362 | ) | (19.5 | )% | $ | 7,261 | 2.1 | % | |||||||||||||
Service revenue | 148,548 | 31.2 | % | 155,674 | 28.1 | % | 147,199 | 26.6 | % | (7,126 | ) | (4.6 | )% | 8,475 | 5.8 | % | ||||||||||||||||||
Royalty revenue | 41,193 | 8.7 | % | 41,842 | 7.6 | % | 57,648 | 10.4 | % | (649 | ) | (1.6 | )% | (15,806 | ) | (27.4 | )% | |||||||||||||||||
Total revenue | $ | 475,958 | 100.0 | % | $ | 553,095 | 100.0 | % | $ | 553,165 | 100.0 | % | $ | (77,137 | ) | (13.9 | )% | $ | (70 | ) | 0.0 | % | ||||||||||||
Total revenue in fiscal 2016 decreased from fiscal 2015 primarily due to reduced revenue from branded and OEM tape automation systems, media, disk backup systems and service, partially offset by increased revenue from scale-out storage solutions.
We believe the changes in our product and service revenue are driven by the changing storage environment, including increased market demand for scale-out storage solutions and reduced demand for data protection tape products. Revenue from branded data protection products and services decreased $84.0 million, or 24%, from fiscal 2015 largely due to a decrease in tape automation systems, media, disk backup systems and service revenue. Data protection products include our tape automation systems, disk backup systems and devices and media offerings. Revenue from branded scale-out storage solutions and services increased $24.2 million, or 24%, from fiscal 2015 largely due to increased sales of our StorNext appliances. Scale-out storage solutions include StorNext software, StorNext appliances (which include StorNext disk storage, StorNext-related tape storage and Xcellis workflow storage), StorNext Pro Solutions, Lattus extended online storage systems, Q-Cloud Archive and Q-Cloud Vault. In addition, OEM product and service revenue, which is primarily comprised of data protection tape automation systems, decreased $16.7 million, or 26%, from fiscal 2015. Royalty revenue decreased slightly from fiscal 2015 primarily due to lower LTO media technology royalties.
32
Total revenue in fiscal 2015 remained relatively flat compared to fiscal 2014. Revenue from scale-out storage solutions, disk backup systems and service increased. These increases were offset by decreases in OEM and branded tape automation systems revenue, royalty revenue as well as branded devices and media revenue. The decrease in royalty revenue was primarily due to a $15.0 million royalty in connection with an intellectual property agreement received in the prior year. Revenue from branded data protection products and services decreased $13.7 million, or 4%, from fiscal 2014, largely due to decreases in tape automation systems and media revenue. Revenue from branded scale-out storage solutions and services increased $43.4 million, or 74%, from fiscal 2014 largely due to increased sales of our StorNext appliances. In addition, OEM product and service revenue, which primarily comprises tape automation systems, decreased $14.0 million from fiscal 2014.
Product Revenue
Total product revenue, which includes sales of our hardware and software products sold through both our Quantum branded and OEM channels, decreased $69.4 million in fiscal 2016 compared to fiscal 2015. The decrease in product revenue was largely due to lower sales of branded and OEM tape automation systems, disk backup systems and media, partially offset by increased sales of scale-out storage solutions. Revenue from sales of branded products decreased 18%, and sales of products to our OEM customers decreased 26% in fiscal 2016 compared to fiscal 2015.
Total product revenue increased $7.3 million in fiscal 2015 compared to fiscal 2014. The increase in product revenue was primarily due to increased sales of scale-out storage solutions; revenue from disk backup systems also increased. These increases were partially offset by decreased sales of OEM and branded tape automation systems and devices and media. Revenue from sales of branded products increased 8% in fiscal 2015, and sales of products to our OEM customers decreased 20% compared to fiscal 2014.
For the year ended March 31, | Change | |||||||||||||||||||||||||||||||||
(dollars in thousands) | 2016 | 2015 | 2014 | 2016 vs. 2015 | 2015 vs. 2014 | |||||||||||||||||||||||||||||
% of revenue | % of revenue | % of revenue | ||||||||||||||||||||||||||||||||
Tape automation systems | $ | 97,454 | 20.6 | % | $ | 152,205 | 27.6 | % | $ | 174,438 | 31.5 | % | $ | (54,751 | ) | (36.0 | )% | $ | (22,233 | ) | (12.7 | )% | ||||||||||||
Disk backup systems | 39,722 | 8.3 | % | 54,845 | 9.9 | % | 50,217 | 9.1 | % | (15,123 | ) | (27.6 | )% | 4,628 | 9.2 | % | ||||||||||||||||||
Devices and media | 45,767 | 9.6 | % | 62,642 | 11.3 | % | 70,680 | 12.8 | % | (16,875 | ) | (26.9 | )% | (8,038 | ) | (11.4 | )% | |||||||||||||||||
Scale-out storage solutions | 103,274 | 21.6 | % | 85,887 | 15.5 | % | 52,983 | 9.6 | % | 17,387 | 20.2 | % | 32,904 | 62.1 | % | |||||||||||||||||||
Total product revenue | $ | 286,217 | 60.1 | % | $ | 355,579 | 64.3 | % | $ | 348,318 | 63.0 | % | $ | (69,362 | ) | (19.5 | )% | $ | 7,261 | 2.1 | % | |||||||||||||
Fiscal 2016 Compared to Fiscal 2015
Branded data protection tape automation revenue declined 42%, or $41.8 million while OEM tape automation revenue decreases of 25%, or $13.0 million in fiscal 2016 compared to fiscal 2015. The decline in branded data protection tape automation revenue resulted from decreased sales in all product categories with enterprise, midrange and entry-level systems each declining at similar rates. The decline in OEM tape automation revenue was due to decreased sales of midrange and entry-level systems partially offset by an increase in enterprise systems revenue.
Revenue from disk backup systems decreased in fiscal 2016 compared to fiscal 2015 primarily due to decreased sales of midrange systems, which comprised of over half of the decrease, as well as lower enterprise systems and OEM deduplication software revenue.
Product revenue from devices, which includes tape drives and removable hard drives, and non-royalty media sales decreased in fiscal 2016 primarily due to lower media sales.
Our scale-out storage solutions revenue increased in fiscal 2016 compared to fiscal 2015 primarily due to increased sales of StorNext appliances in the unstructured data market segment. During fiscal 2016, we also experienced an increase in revenue from large scale-out storage solutions orders over $200,000.
Fiscal 2015 Compared to Fiscal 2014
Our branded tape automation business performed better in fiscal 2015 than our OEM tape automation systems business. Branded tape automation revenue declined 7%, or $7.4 million, compared to an OEM tape automation revenue decrease of 22%, or $14.8 million. The OEM decreases during fiscal 2015 were primarily due to a decline in revenue from midrange and enterprise systems, with midrange systems declining nearly twice as much as enterprise systems. The decline in fiscal 2015 of our branded tape automation revenue was primarily due to a decrease in sales of enterprise systems.
33
Revenue from disk backup systems, primarily attributed to our branded business, increased 9%, or $4.6 million, during fiscal 2015. A decrease in revenue from our enterprise systems was offset by increases in revenue from entry-level systems, driven by the introduction of DXi 4700, and midrange systems, including DXi 6900. The DXi 6900 scales to higher storage capacities than previous midrange systems, which contributed to the decrease in enterprise systems revenue. During fiscal 2015, we experienced an increase in large disk backup systems orders over $200,000.
Product revenue from devices, which includes tape drives and removable hard drives, and non-royalty media sales decreased during fiscal 2015 primarily due to lower media sales.
Our scale-out storage solutions revenue increased during fiscal 2015 primarily due to increased sales of StorNext appliances. Revenue from Lattus extended online storage and StorNext Pro Solutions products also increased, partially offset by a decrease in StorNext standalone software revenue. During fiscal 2015, we experienced an increase in revenue from large scale-out storage solutions orders over $200,000.
Service Revenue
Service revenue is primarily comprised of hardware service contracts, which are typically purchased by our customers to extend the warranty or to provide faster service response time, or both.
Fiscal 2016 Compared to Fiscal 2015
Service revenue decreased in fiscal 2016 compared to fiscal 2015 due to decreased service revenue for our data protection products which was partially offset by increased revenue from branded service contracts for our StorNext appliances.
Fiscal 2015 Compared to Fiscal 2014
Service revenue increased in fiscal 2015 compared to fiscal 2014 primarily due to increased revenue from branded service contracts for our StorNext appliances, partially offset by decreased service revenue for our data protection products.
Royalty Revenue
Fiscal 2016 Compared to Fiscal 2015
Royalty revenue decreased in fiscal 2016 compared fiscal 2015 primarily due to lower media royalties from LTO generation 1 through 5, offset by increased media royalties from LTO 6 and the recently-introduced LTO 7.
Fiscal 2015 Compared to Fiscal 2014
Royalty revenue decreased in fiscal 2015 compared to fiscal 2014 primarily due to a $15.0 million royalty received in connection with an intellectual property agreement in fiscal 2014. We also experienced expected decreases in DLT® media royalties in fiscal 2015 as customers chose to not use this older technology.
Gross Margin
For the year ended March 31, | Change | |||||||||||||||||||||||||||||||||
(dollars in thousands) | 2016 | 2015 | 2014 | 2016 vs. 2015 | 2015 vs. 2014 | |||||||||||||||||||||||||||||
Margin | Margin Rate | Margin | Margin Rate | Margin | Margin Rate | Margin | Basis points | Margin | Basis points | |||||||||||||||||||||||||
Product margin | $ | 79,358 | 27.7 | % | $ | 117,900 | 33.2 | % | $ | 111,242 | 31.9 | % | $ | (38,542 | ) | (550 | ) | $ | 6,658 | 130 | ||||||||||||||
Service margin | 84,201 | 56.7 | % | 84,944 | 54.6 | % | 71,269 | 48.4 | % | (743 | ) | 210 | 13,675 | 620 | ||||||||||||||||||||
Royalty margin | 41,193 | 100.0 | % | 41,842 | 100.0 | % | 57,648 | 100.0 | % | (649 | ) | — | (15,806 | ) | — | |||||||||||||||||||
Gross margin | $ | 204,752 | 43.0 | % | $ | 244,686 | 44.2 | % | $ | 239,620 | * | 43.3 | % | $ | (39,934 | ) | (120 | ) | $ | 5,066 | 90 | |||||||||||||
* Fiscal 2014 total gross margin includes $0.5 million of restructuring expense related to cost of revenue.
The 120 basis point decrease in gross margin percentage in fiscal 2016 compared to fiscal 2015 was primarily driven by decreased higher margin service revenue and a shift in revenue mix from higher margin products to lower margin products.
34
The 90 basis point increase in gross margin percentage in fiscal 2015 compared to fiscal 2014 was primarily driven by an increase in the service gross margin rates and to a lesser extent, product gross margin rates. The improvement in the overall gross margin rate reflects the impact of the changes we have implemented in our operations, repair and service business models, partially offset by the decline in royalty revenue.
Product Margin
Fiscal 2016 Compared to Fiscal 2015
Product gross margin dollars decreased $38.5 million, or 33% in fiscal 2016, and our product gross margin rate decreased 550 basis points in fiscal 2016. These decreases were the result of a combination of lower revenue to cover fixed costs, a shift in revenue mix from higher margin products to lower margin products, and increased discounting from overall pricing pressure in the storage market.
Fiscal 2015 Compared to Fiscal 2014
Product gross margin dollars increased $6.7 million, or 6% in fiscal 2015, and our product gross margin rate increased 130 basis points in fiscal 2015. The increase in the product gross margin rate was primarily due to shifting to an outsourced manufacturing model during the second half of fiscal 2014. Outsourcing our manufacturing has created a more variable cost model, reducing costs during fiscal 2015 that were relatively fixed during most of fiscal 2014 when the majority of our products were manufactured in our facilities. Notable cost decreases from fiscal 2014 driven by the implementation of outsourced manufacturing include compensation and benefits and facility expenses.
Service Margin
Fiscal 2016 Compared to Fiscal 2015
Service gross margin dollars decreased $0.7 million, or 1%, in fiscal 2016 compared to fiscal 2015, and service gross margin percentage increased 210 basis points compared to fiscal 2015 on a 5% decrease in service revenue. The increased service margin percentage was primarily due to decreases in external repair expense and compensation and benefits from recognition of a profit sharing bonus in fiscal 2015 which was not repeated in fiscal 2016.
Fiscal 2015 Compared to Fiscal 2014
Service gross margin dollars increased $13.7 million, or 19%, in fiscal 2015 compared to fiscal 2014, and service gross margin percentage increased 620 basis points compared to fiscal 2014 on a 6% increase in service revenue. The increase in service gross margin rate was primarily due to reduced costs as a result of continued improvements to our service delivery model, including outsourcing geographies with lower service and repair volumes and improving utilization of our service team and service parts inventories. In addition, our service activities continue to reflect a larger proportion of branded products under contract, which have margins that are relatively higher than for OEM repair services.
Royalty Margin
Royalties typically do not have related cost of sales and have a 100% gross margin percentage. Therefore, royalty gross margin dollars vary directly with royalty revenue. Royalty revenue and related gross margin dollars decreased in both fiscal 2016 and fiscal 2015 compared to the prior year periods.
Research and Development Expenses
For the year ended March 31, | Change | |||||||||||||||||||||||||||||||||
(dollars in thousands) | 2016 | 2015 | 2014 | 2016 vs. 2015 | 2015 vs. 2014 | |||||||||||||||||||||||||||||
% of revenue | % of revenue | % of revenue | ||||||||||||||||||||||||||||||||
Research and development | $ | 48,703 | 10.2 | % | $ | 58,618 | 10.6 | % | $ | 64,375 | 11.6 | % | $ | (9,915 | ) | (16.9 | )% | $ | (5,757 | ) | (8.9 | )% | ||||||||||||
35
Fiscal 2016 Compared to Fiscal 2015
The decrease in research and development expense in fiscal 2016 compared to fiscal 2015 was primarily due to a $8.4 million decrease in compensation and benefits largely related to lower staffing levels and recognition of a profit sharing bonus in fiscal 2015 which was not repeated in fiscal 2016. Additionally, we had a $1.2 million decrease in depreciation expense due to lower capital expenditures.
Fiscal 2015 Compared to Fiscal 2014
The decrease in research and development expenses compared to fiscal 2014 was primarily due to additional cost controls and spending reductions that resulted in a $4.7 million decrease in compensation and benefits from reduced staffing levels. Additionally, there was a $1.2 million decrease in depreciation expense due to declining capital expenditures.
Sales and Marketing Expenses
For the year ended March 31, | Change | |||||||||||||||||||||||||||||||||
(dollars in thousands) | 2016 | 2015 | 2014 | 2016 vs. 2015 | 2015 vs. 2014 | |||||||||||||||||||||||||||||
% of revenue | % of revenue | % of revenue | ||||||||||||||||||||||||||||||||
Sales and marketing | $ | 108,735 | 22.8 | % | $ | 113,954 | 20.6 | % | $ | 118,771 | 21.5 | % | $ | (5,219 | ) | (4.6 | )% | $ | (4,817 | ) | (4.1 | )% | ||||||||||||
Fiscal 2016 Compared to Fiscal 2015
The decrease in sales and marketing expense in fiscal 2016 compared to fiscal 2015 was primarily due to net decreases of $4.9 million in commission expense due to lower branded product revenue, $2.8 million in intangible amortization expense due to certain intangibles becoming fully amortized during fiscal 2015 and $1.0 million in compensation and benefits primarily due to recognition of a profit sharing bonus in fiscal 2015 which was not repeated in fiscal 2016. These decreases were offset by increases of $2.6 million in advertising and marketing, $0.6 million in sponsored employee activities from higher spending on sales-related meetings and $0.4 million in sales demonstration unit costs.
Fiscal 2015 Compared to Fiscal 2014
The most significant factor driving the decrease in sales and marketing expense compared to fiscal 2014 was a $4.6 million decrease in intangible amortization expense due to certain intangibles becoming fully amortized during fiscal 2015. We had a $2.5 million decrease in compensation and benefits from decreased staffing levels. Additionally, spending reductions in fiscal 2015 resulted in decreases of $0.8 million in advertising costs, $0.8 million in travel expense and $0.8 million in external service provider expense compared to fiscal 2014. These decreases were partially offset by a $4.8 million increase in commission expense related to increased branded product revenue.
General and Administrative Expenses
For the year ended March 31, | Change | |||||||||||||||||||||||||||||||||
(dollars in thousands) | 2016 | 2015 | 2014 | 2016 vs. 2015 | 2015 vs. 2014 | |||||||||||||||||||||||||||||
% of revenue | % of revenue | % of revenue | ||||||||||||||||||||||||||||||||
General and administrative | $ | 53,793 | 11.3 | % | $ | 56,513 | 10.2 | % | $ | 57,865 | 10.5 | % | $ | (2,720 | ) | (4.8 | )% | $ | (1,352 | ) | (2.3 | )% | ||||||||||||
Fiscal 2016 Compared to Fiscal 2015
The decrease in general and administrative expense in fiscal 2016 compared to fiscal 2015 was largely the result of a $3.1 million decrease in compensation and benefits primarily from recognition of a profit sharing bonus in fiscal 2015 which was not repeated in fiscal 2016 and decreased share-based compensation expense. We also had a $0.6 million decrease in IT-related expense as a result of cost reductions in fiscal 2016. These decreases were partially offset by an increase of $0.7 million related to a refund received for IT purchases in fiscal 2015.
36
Fiscal 2015 Compared to Fiscal 2014
The decrease in general and administrative expense was primarily due to a $1.6 million decrease in facility-related expenses from vacating portions of various facilities in fiscal 2014 and continuing into fiscal 2015. Additionally, we had a $0.8 million decrease in depreciation expense due to declining capital expenditures. These decreases were partially offset by a $0.9 million increase in legal and advisory fees, primarily due to costs related to intellectual property matters and costs related to activities and inquiries of Starboard Value LP incurred during fiscal 2015.
Restructuring Charges
For the year ended March 31, | Change | |||||||||||||||||||||||||||||||||
(dollars in thousands) | 2016 | 2015 | 2014 | 2016 vs. 2015 | 2015 vs. 2014 | |||||||||||||||||||||||||||||
% of revenue | % of revenue | % of revenue | ||||||||||||||||||||||||||||||||
Restructuring charges related to cost of revenue | $ | — | — | % | $ | — | — | % | $ | 539 | 0.1 | % | $ | — | — | % | $ | (539 | ) | (100.0 | )% | |||||||||||||
Restructuring charges in operating expenses | 4,006 | 0.8 | % | 1,666 | 0.3 | % | 10,675 | 1.9 | % | 2,340 | 140.5 | % | (9,009 | ) | (84.4 | )% | ||||||||||||||||||
Total restructuring charges | $ | 4,006 | 0.8 | % | $ | 1,666 | 0.3 | % | $ | 11,214 | 2.0 | % | $ | 2,340 | 140.5 | % | $ | (9,548 | ) | (85.1 | )% | |||||||||||||
Our restructuring plans have been undertaken in an effort to return to consistent profitability and generate cash from operations.
For additional information on our restructuring plans and disclosure of restructuring charges refer to Note 8 “Restructuring Charges” to the Consolidated Financial Statements. Until we achieve consistent and sustainable levels of profitability, we may incur restructuring charges in the future from additional strategic cost reduction efforts.
Fiscal 2016 Compared to Fiscal 2015
Restructuring charges increased in fiscal 2016 compared to fiscal 2015 primarily due to a $1.9 million increase in severance and benefits restructuring charges from the Fiscal 2016 Restructuring Plan and a $0.5 million increase in facility restructuring charges resulting from a change in estimate of sublease timing for our facilities previously used in manufacturing.
Fiscal 2015 Compared to Fiscal 2014
Restructuring charges decreased in fiscal 2015 compared to fiscal 2014 primarily due to decreased severance and benefits restructuring and facility restructuring charges. Severance and benefits restructuring charges decreased $5.7 million in fiscal 2015 compared to fiscal 2014 primarily due to strategic management decisions to outsource our manufacturing operations and further consolidate production and service activities in fiscal 2014. Facility restructuring charges decreased $3.1 million in fiscal 2015 compared to fiscal 2014 primarily due to vacating a majority of our manufacturing and warehouse facilities in the U.S. in fiscal 2014.
Goodwill Impairment
For the year ended March 31, | Change | ||||||||||||||||||||||||||||||||
(dollars in thousands) | 2016 | 2015 | 2014 | 2016 vs. 2015 | 2015 vs. 2014 | ||||||||||||||||||||||||||||
% of revenue | % of revenue | % of revenue | |||||||||||||||||||||||||||||||
Goodwill impairment | $ | 55,613 | 11.7 | % | $ | — | — | % | $ | — | — | % | $ | 55,613 | n/a | $ | — | — | % | ||||||||||||||
During the fourth quarter of fiscal 2016, our stock price declined from $0.93 per share at December 31, 2015 to a low closing price of $0.44 per share. As a result of this decrease in stock price, we determined it was more likely than not that the fair value of our goodwill was less than its carrying amount and performed an analysis to quantify the potential amount of goodwill impairment during the fourth quarter of fiscal 2016. Based on our impairment analysis, we determined our goodwill was impaired and recorded an impairment charge of $55.6 million in fiscal 2016. For additional information, refer to Note 5 “Intangible Assets and Goodwill” to the Consolidated Financial Statements.
37
Gain on Sale of Assets
For the year ended March 31, | Change | |||||||||||||||||||||||||||||||||
(dollars in thousands) | 2016 | 2015 | 2014 | 2016 vs. 2015 | 2015 vs. 2014 | |||||||||||||||||||||||||||||
% of revenue | % of revenue | % of revenue | ||||||||||||||||||||||||||||||||
Gain on sale of assets | $ | — | — | % | $ | 462 | 0.1 | % | $ | 267 | 0.0 | % | $ | (462 | ) | (100.0 | )% | $ | 195 | 73.0 | % | |||||||||||||
We had a $0.5 million gain on the sale of assets primarily due to the sale of IP addresses in fiscal 2015.
Other Income and Expense
For the year ended March 31, | Change | ||||||||||||||||||||||||||||||||
(dollars in thousands) | 2016 | 2015 | 2014 | 2016 vs. 2015 | 2015 vs. 2014 | ||||||||||||||||||||||||||||
% of revenue | % of revenue | % of revenue | |||||||||||||||||||||||||||||||
Other income and (expense) | $ | (191 | ) | — | % | $ | 13,836 | 2.5 | % | $ | 1,296 | 0.2 | % | $ | (14,027 | ) | n/m | $ | 12,540 | 967.6 | % | ||||||||||||
The change in other expense in fiscal 2016 compared to other income in fiscal 2015 and the increase in other income and expense in fiscal 2015 compared to fiscal 2014 was primarily due to a $13.6 million gain on the sale of our investment in a privately held company in fiscal 2015.
Interest Expense
For the year ended March 31, | Change | |||||||||||||||||||||||||||||||||
(dollars in thousands) | 2016 | 2015 | 2014 | 2016 vs. 2015 | 2015 vs. 2014 | |||||||||||||||||||||||||||||
% of revenue | % of revenue | % of revenue | ||||||||||||||||||||||||||||||||
Interest expense | $ | 6,817 | 1.4 | % | $ | 9,460 | 1.7 | % | $ | 9,754 | 1.8 | % | $ | (2,643 | ) | (27.9 | )% | $ | (294 | ) | (3.0 | )% | ||||||||||||
Interest expense includes the amortization of debt issuance costs for debt facilities. For further information, refer to Note 7 “Debt” to the Consolidated Financial Statements.
Interest expense decreased in both fiscal 2016 and fiscal 2015 compared to the prior year periods primarily due to the payment of $50.0 million of aggregate principal amount of 3.50% notes during the fourth quarter of fiscal 2015.
Loss on Debt Extinguishment
For the year ended March 31, | Change | ||||||||||||||||||||||||||||||||
(dollars in thousands) | 2016 | 2015 | 2014 | 2016 vs. 2015 | 2015 vs. 2014 | ||||||||||||||||||||||||||||
% of revenue | % of revenue | % of revenue | |||||||||||||||||||||||||||||||
Loss on debt extinguishment | $ | 394 | 0.1 | % | $ | 1,295 | 0.2 | % | $ | — | — | % | $ | (901 | ) | (69.6 | )% | $ | 1,295 | n/a | |||||||||||||
The loss on debt extinguishment in fiscal 2016 was due to the purchase of $81.0 million of aggregate principal amount of the 3.50% notes for $82.4 million, which included $1.1 million of accrued interest. In connection with this transaction, we recorded a loss on debt extinguishment of $0.4 million comprised of a loss of $0.3 million from the notes purchased and $0.1 million of unamortized debt issuance costs related to the purchased notes.
The loss on debt extinguishment in fiscal 2015 was due to the purchase of $50.0 million of aggregate principal amount of the 3.50% notes for $51.0 million. In connection with this transaction, we recorded a loss on debt extinguishment of $1.3 million comprised of the loss of $1.0 million from the notes purchased and a write-off of $0.3 million of unamortized debt costs related to the purchased notes. For further information, refer to Note 7 “Debt” to the Consolidated Financial Statements.
38
Income Taxes
For the year ended March 31, | Change | ||||||||||||||||||||||||||||||||
(dollars in thousands) | 2016 | 2015 | 2014 | 2016 vs. 2015 | 2015 vs. 2014 | ||||||||||||||||||||||||||||
% of pre-tax loss | % of pre-tax income | % of pre-tax loss | |||||||||||||||||||||||||||||||
Income tax provision | $ | 1,183 | (1.6 | )% | $ | 718 | 4.1 | % | $ | 1,217 | (6.0 | )% | $ | 465 | 64.8 | % | $ | (499 | ) | (41.0)% | |||||||||||||
Tax expense in fiscal 2016, 2015 and 2014 was primarily comprised of foreign income taxes and state taxes. The increase in income tax provision was primarily due to higher foreign taxes in fiscal 2016 compared to fiscal 2015. The decrease in income tax provision in fiscal 2015 compared to fiscal 2014 was primarily due to lower foreign taxes. For additional information, including a reconciliation of the effective tax rate, refer to Note 11 “Income Taxes” to the Consolidated Financial Statements.
Amortization of Intangible Assets
The following table details intangible asset amortization expense by classification within our Consolidated Statements of Operations (in thousands):
For the year ended March 31, | Change | ||||||||||||||||||||||||
2016 | 2015 | 2014 | 2016 vs. 2015 | 2015 vs. 2014 | |||||||||||||||||||||
Cost of revenue | $ | 280 | $ | 913 | $ | 1,476 | $ | (633 | ) | (69.3 | )% | $ | (563 | ) | (38.1 | )% | |||||||||
Sales and marketing | — | 2,784 | 7,426 | (2,784 | ) | (100.0 | )% | (4,642 | ) | (62.5 | )% | ||||||||||||||
$ | 280 | $ | 3,697 | $ | 8,902 | $ | (3,417 | ) | (92.4 | )% | $ | (5,205 | ) | (58.5 | )% | ||||||||||
The decreases in intangible asset amortization in fiscal 2016 and 2015 compared to the respective prior years was due to certain intangible assets becoming fully amortized. Refer to Note 5 “Intangible Assets and Goodwill” to the Consolidated Financial Statements for further information regarding our amortizable intangible assets.
Share-Based Compensation
The following table summarizes share-based compensation within our Consolidated Statements of Operations (in thousands):
For the year ended March 31, | Change | ||||||||||||||||||||||||
2016 | 2015 | 2014 | 2016 vs. 2015 | 2015 vs. 2014 | |||||||||||||||||||||
Cost of revenue | $ | 1,241 | $ | 1,489 | $ | 1,963 | $ | (248 | ) | (16.7 | )% | $ | (474 | ) | (24.1 | )% | |||||||||
Research and development | 1,864 | 2,559 | 3,430 | (695 | ) | (27.2 | )% | (871 | ) | (25.4 | )% | ||||||||||||||
Sales and marketing | 2,907 | 3,506 | 4,097 | (599 | ) | (17.1 | )% | (591 | ) | (14.4 | )% | ||||||||||||||
General and administrative | 2,904 | 4,029 | 3,969 | (1,125 | ) | (27.9 | )% | 60 | 1.5 | % | |||||||||||||||
$ | 8,916 | $ | 11,583 | $ | 13,459 | $ | (2,667 | ) | (23.0 | )% | $ | (1,876 | ) | (13.9 | )% | ||||||||||
Fiscal 2016 Compared to Fiscal 2015
The decrease in share-based compensation expense in fiscal 2016 was primarily due to a $1.9 million decrease in restricted stock expense resulting from a decrease in the fair value of restricted stock units and departures of highly compensated employees. We also had a $0.6 million decrease in stock options expense as options became fully vested early in the first quarter of fiscal 2016.
Fiscal 2015 Compared to Fiscal 2014
The decrease in share-based compensation in fiscal 2015 was primarily due to a $1.3 million decrease in restricted stock expense resulting from a lower fair value of restricted stock units. We also had a $0.4 million decrease in stock purchase plan expense as a result of decreased headcount.
39
LIQUIDITY AND CAPITAL RESOURCES
Capital Resources and Financial Condition
As of March 31, 2016, we had $33.9 million of cash and cash equivalents which is comprised of money market funds and cash deposits.
We continue to focus on improving our operating performance, including efforts to increase revenue and to continue to control costs in order to improve margins, return to consistent profitability and generate positive cash flows from operating activities. We believe that our existing cash and capital resources will be sufficient to meet all currently planned expenditures, debt service, contractual obligations and sustain operations for at least the next 12 months. This belief is dependent upon our ability to achieve gross margin projections and to control operating expenses in order to provide positive cash flow from operating activities. Although we recorded facility restructuring charges in fiscal 2016 and anticipate other charges in fiscal 2017 to further consolidate our facilities, payments for the accrued facility restructuring will be made monthly in accordance with the lease agreements, which continue through December 2021. As a result, the facility restructuring is not expected to change our cash requirements. Our cash outlay for these lease payments could be reduced in the future if we are able to sublease facilities. Should any of the above assumptions prove incorrect, either in combination or individually, it would likely have a material negative effect on our cash balances and capital resources.
The following is a description of our existing capital resources including outstanding balances, funds available to borrow and primary repayment terms including interest rates. For additional information, see Note 7 “Debt” to the Consolidated Financial Statements.
On October 5, 2015, we entered into a private transaction with a note holder to purchase $81.0 million of aggregate principal amount of the 3.50% notes for $82.4 million, which included $1.1 million of accrued interest. In connection with this transaction, we recorded a loss on debt extinguishment of $0.4 million comprised of a loss of $0.3 million from the notes purchased and $0.1 million of unamortized debt issuance costs related to the purchased notes. We used a combination of $66.1 million of proceeds from the WF credit agreement and $16.3 million of cash to fund the purchase and pay the accrued interest. On November 15, 2015, we purchased the remaining $2.8 million outstanding principal amount of 3.50% notes and funded this payment using proceeds from the WF credit agreement.
As of March 31, 2016, we had $70.0 million of 4.50% convertible subordinated debt due November 15, 2017 ("4.50% notes") outstanding, excluding unamortized debt issuance costs. The 4.50% notes require semi-annual interest payments paid on May 15 and November 15 of each year and have no early call provisions. We paid $3.2 million of interest on the 4.50% notes in fiscal 2016. In addition, we had a $65.7 million outstanding balance on a line of credit under the WF credit agreement at a weighted average interest rate of 3.18% as of March 31, 2016.
Under the WF credit agreement, as amended, we have the ability to borrow the lesser of $75 million or the amount of the monthly borrowing base under a senior secured revolving credit facility which matures August 10, 2017. We have letters of credit totaling $1.0 million, reducing the maximum amount available to $8.3 million at March 31, 2016. Quarterly, we are required to pay a 0.375% commitment fee on undrawn amounts under the revolving credit facility. There is a blanket lien on all of our assets under the WF credit agreement in addition to certain financial and reporting covenants. As of March 31, 2016, and during fiscal 2016, we were in compliance with all covenants.
The interest rate on amounts borrowed is based on an election by us of an annual rate equal to (1) a base rate established by Wells Fargo plus an applicable margin of 1.0% to 1.5%, based on availability levels under the WF credit agreement or (2) the LIBOR rate plus an applicable margin ranging from 2.0% and 2.5%, based on availability levels under the WF credit agreement. The base rate is defined in the WF credit agreement. We paid $1.1 million of interest on the WF credit agreement in fiscal 2016.
The WF credit agreement contains financial covenants and customary events of default for such securities, including cross-payment default and cross-acceleration to other material indebtedness for borrowed money which require notice from the trustee or holders of at least 25% of the notes and are subject to a cure period upon receipt of such notice. Average liquidity must exceed $15 million each month, and at all times we must maintain minimum liquidity of $10 million, at least $5 million of which must be excess availability under the WF revolving credit facility. The excess availability requirement increases by $1.5 million on June 1, 2016, and on the first day of each September, December, March and June occurring thereafter. The fixed charge coverage ratio is required to be greater than 1.2 for the 12 month period ending on the last day of any month in which the covenant is applicable. This covenant is applicable only in months in which borrowings exceed $5 million at any time during the month. To avoid triggering mandatory field audits and Wells Fargo controlling our cash receipts, we must maintain liquidity of at least $20 million at all times. The fixed charge coverage ratio, average liquidity, liquidity and excess availability are each defined in the WF credit agreement and/or amendments. Certain schedules in the compliance certificate must be filed monthly if borrowings exceed $5 million; otherwise they are to be filed quarterly.
40
Generation of positive cash flow from operating activities has historically been, and will continue to be, an important source of cash to fund operating needs and meet our current and long-term obligations. We may choose to raise additional capital if strategically advantageous to the company. We can provide no assurance that such debt or equity financing would be available to us on commercially acceptable terms or at all.
We have taken many actions in recent years and are continuing to take such actions to offset the negative impact of economic uncertainty and slow economic growth and their impact on the data protection and scale-out storage markets. We cannot provide assurance that the actions we have taken in the past or any actions we may take in the future will ensure a consistent, sustainable and sufficient level of net income and positive cash flow from operating activities to fund, sustain or grow our business. Certain events that are beyond our control, including prevailing economic, competitive and industry conditions, as well as various legal and other disputes, may prevent us from achieving these financial objectives. Any inability to achieve consistent and sustainable net income and cash flow could result in:
(i) | Restrictions on our ability to manage or fund our existing operations, which could result in a material and adverse effect on our future results of operations and financial condition. |
(ii) | Unwillingness on the part of the lenders to do any of the following: |
• | Provide a waiver or amendment for any covenant violations we may experience in future periods, thereby triggering a default under, or termination of, the revolving credit line, or |
• | Approve any amendments to the credit agreement we may seek to obtain in the future. |
Any lack of renewal, waiver, or amendment, if needed, could result in the revolving credit line becoming unavailable to us and any amounts outstanding becoming immediately due and payable.
(iii) | Further impairment of our financial flexibility, which could require us to raise additional funding in the capital markets sooner than we otherwise would, and on terms less favorable to us, if available at all. |
Any of the above mentioned items, individually or in combination, could have a material and adverse effect on our results of operations, available cash and cash flows, financial condition, access to capital and liquidity.
Cash Flows
Following is a summary of cash flows from operating, investing and financing activities (in thousands):
As of or for the year ended March 31, | ||||||||||||
(In thousands) | 2016 | 2015 | 2014 | |||||||||
Cash and cash equivalents | $ | 33,870 | $ | 67,948 | $ | 99,125 | ||||||
Net income (loss) | (74,683 | ) | 16,760 | (21,474 | ) | |||||||
Net cash provided by (used in) operating activities | (11,720 | ) | 6,034 | 35,474 | ||||||||
Net cash provided by (used in) investing activities | (3,621 | ) | 11,641 | (6,649 | ) | |||||||
Net cash provided by (used in) financing activities | (18,724 | ) | (48,641 | ) | 1,285 | |||||||
Fiscal 2016
The $63.0 million difference between net loss and net cash used in operating activities in fiscal 2016 was primarily due to $78.2 million in non-cash items, the largest of which were goodwill impairment, share-based compensation, depreciation and service parts lower of cost or market adjustment. In addition, we had a $18.2 million decrease in accounts receivable, which was offset by decreases of $12.7 million in accrued compensation, $11.1 million in deferred revenue and $8.2 million in accounts payable. The decrease in accounts receivable was primarily due to lower revenue in the fourth quarter of fiscal 2016 compared to the fourth quarter of fiscal 2015. The decrease in accrued compensation was primarily due to payments of a profit sharing bonus accrued in fiscal 2015 which was not repeated in fiscal 2016 and a lower commission accrual in fiscal 2016 related to lower branded revenue. The decrease in deferred revenue was largely due to decreased deferred service contracts revenue for tape automation systems. The decrease in accounts payable was primarily due to the timing of invoice payments and lower inventory purchases in fiscal 2016 compared to fiscal 2015.
Cash used in investing activities was primarily due to $3.5 million of property and equipment purchases. Equipment purchases were primarily for engineering equipment for product development, IT infrastructure upgrades and leasehold improvements in our Colorado Springs facility.
Cash used in financing activities was primarily due to the $83.7 million payment of the 3.50% notes, partially offset by $65.7 million of net borrowings under the WF credit agreement.
41
Fiscal 2015
The $10.7 million difference between reported net income and cash provided by operating activities during fiscal 2015 was primarily due to a $22.6 million increase in accounts receivable, a $19.7 million increase in manufacturing inventories and a $13.6 million gain on sale of other investments, offset by $29.0 million of non-cash items and a $12.8 million increase in accounts payable. The increase in accounts receivable was primarily due to increased product revenue and service billings in the fourth quarter of fiscal 2015 as compared to the fourth quarter of fiscal 2014. The increases in manufacturing inventories and accounts payable were due to increased inventory purchases to ensure adequate quantities on hand to fulfill orders. The largest non-cash items included share-based compensation, depreciation, amortization and service parts lower of cost or market adjustment.
Cash provided by investing activities was primarily due to $15.1 million of proceeds of sale of other investments in a privately held company, partially offset by $3.2 million of property and equipment purchases. Equipment purchases were primarily for engineering equipment for product development and permanent demo units.
Cash used in financing activities was primarily due to the purchase of $50.0 million of aggregate principal amount of convertible subordinated debt.
Fiscal 2014
The $56.9 million difference between reported net loss and cash provided by operating activities during fiscal 2014 was primarily due to $46.1 million in non-cash items, the largest of which were share-based compensation, service parts lower of cost or market adjustment, depreciation and amortization. In addition, we had a $13.4 million decrease in manufacturing inventories primarily due to outsourcing our manufacturing operations and an $8.7 million increase in deferred revenue primarily due to increased service contract revenue deferred at March 31, 2014 compared to March 31, 2013. These were partially offset by a $6.1 million decrease in accrued compensation due to decreased staffing and timing of payroll payments, and a $5.9 million decrease in accounts payable primarily due to decreased purchases.
Cash used in investing activities was primarily due to $6.0 million of property and equipment purchases. Equipment purchases were primarily for engineering equipment to support product development activities, IT equipment and software, largely related to an ERP system upgrade, leasehold improvements in locations we started leasing in the second quarter of fiscal 2014 and the purchase of permanent demo units.
Cash provided by financing activities during fiscal 2014 was primarily due to receipt of $4.4 million from the exercise of stock options and issuance of shares under the employee stock purchase plan, partially offset by $1.9 million paid for taxes due upon vesting of restricted stock and the purchase of $1.3 million of convertible subordinated debt.
Off Balance Sheet Arrangements
Lease Commitments
We lease certain facilities under non-cancelable lease agreements. Some of the leases have renewal options ranging from one to ten years and others contain escalation clauses and provisions for maintenance, taxes or insurance. We also have equipment leases for computers and other office equipment. Future minimum lease payments under these operating leases are shown below in the “Contractual Obligations” section.
Commitments to Purchase Inventory
We use contract manufacturers for our manufacturing operations. Under these arrangements, the contract manufacturer procures inventory to manufacture products based upon our forecast of customer demand. We have similar arrangements with certain other suppliers. We are responsible for the financial impact on the supplier or contract manufacturer of any reduction or product mix shift in the forecast relative to materials that the third party had already purchased under a prior forecast. Such a variance in forecasted demand could require a cash payment for inventory in excess of current customer demand or for costs of excess or obsolete inventory. As of March 31, 2016, we had issued non-cancelable commitments for $42.2 million to purchase inventory from our contract manufacturers and suppliers.
Stock Repurchases
During fiscal 2000, the Board of Directors authorized us to repurchase up to $700 million of our common stock in open market purchases or private transactions. As of March 31, 2016, $87.9 million remained under this authorization. No stock repurchases were made during the fiscal years ended March 31, 2016, 2015 or 2014. Our ability to repurchase our common stock is restricted unless we meet certain thresholds under the terms of the WF credit agreement.
42
Contractual Obligations
The table below summarizes our contractual obligations as of March 31, 2016 (in thousands):
Payments Due by Period | |||||||||||||||||||
Less than 1 year | 1 – 3 years | 3 –5 years | More than 5 years | Total | |||||||||||||||
Long-term debt | $ | 5,076 | $ | 63,424 | $ | — | $ | — | $ | 68,500 | |||||||||
Convertible subordinated debt | 3,150 | 73,150 | — | — | 76,300 | ||||||||||||||
Purchase obligations | 42,167 | — | — | — | 42,167 | ||||||||||||||
Operating leases: | |||||||||||||||||||
Lease payments | 8,564 | 15,124 | 10,495 | 2,156 | 36,339 | ||||||||||||||
Sublease rental income | (971 | ) | (1,875 | ) | (1,755 | ) | — | (4,601 | ) | ||||||||||
Total operating leases | 7,593 | 13,249 | 8,740 | 2,156 | 31,738 | ||||||||||||||
Total contractual cash obligations | $ | 57,986 | $ | 149,823 | $ | 8,740 | $ | 2,156 | $ | 218,705 | |||||||||
The contractual commitments shown above include $9.1 million in interest payments on our various debt obligations. As of March 31, 2016, we had $5.7 million of long-term tax liabilities for uncertain tax positions, for which we cannot make a reasonably reliable estimate of when payments are likely to occur.
RECENT ACCOUNTING PRONOUNCEMENTS
See Recent Accounting Pronouncements in Note 2 “Summary of Significant Accounting Policies” to the Consolidated Financial Statements for a full description of recent accounting pronouncements including the respective expected dates of adoption and effects on our results of operations and financial condition.
CRITICAL ACCOUNTING ESTIMATES AND POLICIES
Our discussion and analysis of the financial condition and results of operations is based on the accompanying Consolidated Financial Statements, which have been prepared in accordance with accounting principles generally accepted in the U.S. The preparation of these statements requires us to make significant estimates and judgments about future uncertainties that affect reported assets, liabilities, revenues and expenses and related disclosures. We base our estimates on historical experience and on various other assumptions believed to be reasonable under the circumstances. Our significant accounting policies are presented within Note 2 to the Consolidated Financial Statements. Our critical accounting estimates require the most difficult, subjective or complex judgments and are described below. An accounting estimate is considered critical if it requires estimates about the effect of matters that are inherently uncertain when the estimate is made, if different estimates reasonably could have been used or if changes in the estimate that are reasonably possible could materially impact the financial statements. We have discussed the development, selection and disclosure of our critical accounting policies with the Audit Committee of our Board of Directors. We believe the assumptions and estimates used and the resulting balances are reasonable; however, actual results may differ from these estimates under different assumptions or conditions.
Revenue Recognition
Application of the various accounting principles related to measurement and recognition of revenue requires us to make judgments and estimates in the following related areas: determining estimated selling prices and allocating revenue based on the relative selling prices in arrangements with multiple deliverables, including assessing whether we have vendor-specific objective evidence (“VSOE”) of selling price, third-party evidence of selling price (“TPE”) or best estimate of selling price ("BESP") for each deliverable; the interpretation of non-standard terms and conditions in sales agreements; assessments of future price adjustments, such as rebates, price protection and future product returns and estimates for contractual licensee fees.
When we enter into sales arrangements with customers that contain multiple deliverables such as hardware, software and services, these arrangements require us to identify each deliverable and determine its estimated selling price. Additionally, we sometimes use judgment in order to determine the appropriate timing of revenue recognition and to assess whether any software and non-software components function together to deliver a tangible product’s essential functionality in order to ensure the arrangement is properly accounted for as software or hardware revenue.
43
When we enter into multiple deliverable revenue arrangements with customers which are not subject to software revenue guidance, we use judgment to (1) separate the deliverables based on specific criteria, (2) assign an estimated selling price to each deliverable based on the fair value hierarchy using VSOE, TPE, or BESP and (3) allocate the total arrangement consideration using the relative selling price method. When VSOE cannot be established we attempt to establish the selling price of each element based on TPE. TPE is determined based on competitor prices for largely interchangeable products when sold separately. When we are unable to establish selling price using VSOE or TPE, we use BESP. We use judgment to determine BESP, which is the price at which we would transact a sale if the product or service were regularly sold on a standalone basis. In this determination we consider our discounting and internal pricing practices, external market conditions and competitive positioning for similar offerings.
While the majority of our sales arrangements contain standard terms and conditions, we sometimes apply judgment when interpreting complex arrangements with non-standard terms and conditions to determine the appropriate accounting and timing of revenue recognition. An example of such a judgment is deferring revenue related to significant post-delivery obligations and customer acceptance criteria until such obligations are fulfilled.
For software products, we generally recognize revenue upon delivery of the software. Revenue from post-contract customer support agreements, which entitle software customers to both telephone support and any unspecified upgrades and enhancements during the term of the agreement, is classified as product revenue, as the value of these support arrangements are the upgrades and enhancements to the software licenses themselves and there is no on-site support, and is recognized ratably over the term of the support agreement.
We license certain software to customers under licensing agreements that allow those customers to embed the software into specific products they offer. As consideration, licensees pay us a fee based on the amount of sales of their products that incorporate our software. On a periodic and timely basis, the licensees provide us with reports listing their sales to end users for which they owe us license fees. Similarly, royalty revenue is estimated from licensee reports of units sold to end users subject to royalties under master contracts. In both cases, these reports are used to substantiate delivery and we recognize revenue based on the information in these reports or when amounts can be reasonably estimated.
Inventory Allowances
Our manufacturing and service parts inventories are stated at the lower of cost or market, with cost computed on a first-in, first-out (“FIFO”) basis. Adjustments to reduce the carrying value of both manufacturing and service parts inventories to their net realizable value are made for estimated excess, obsolete or impaired balances. Factors influencing these adjustments include significant estimates and judgments about the future of product life cycles, product demand, rapid technological changes, development plans, product pricing, physical deterioration, quality issues, end of service life plans and volume of enhanced or extended warranty service contracts.
Impairment of Long-lived Assets and Goodwill
We use an undiscounted cash flow approach to evaluate our long-lived assets for recoverability when there are impairment indicators. Estimates of future cash flows require significant judgments about the future and include company forecasts and our expectations of future use of our long-lived assets, both of which may be impacted by market conditions. Other critical estimates include determining the asset group or groups within our long-lived assets, the primary asset of an asset group and the primary asset’s useful life.
We apply judgment when reviewing goodwill for impairment, including when evaluating potential impairment indicators. Indicators we consider include adverse changes in the economy or business climate that could affect the value of our goodwill, overall financial performance such as negative or declining cash flows or operating income, changes in our business strategy, product mix or to the long-term economic outlook, a sustained decrease in our stock price and testing long-lived assets for recoverability. In addition, we evaluate on the basis of the weight of evidence the significance of identified events and circumstances along with how they could affect the relationship between the reporting unit's fair value and carrying amount, including positive mitigating events and circumstances.
In addition to comparing the carrying value of the reporting unit to its fair value, because we have negative book value, we perform a qualitative analysis to determine whether it is more likely than not that the fair value of goodwill is less than its carrying amount. If we determine it is more likely than not that the fair value of goodwill is less than its carrying amount, then a second step must be performed to quantify the amount of goodwill impairment, if any, requiring additional assumptions and judgments.
44
If the second step of a goodwill impairment test is required, the following assumptions and estimates may be used by management in an income approach analysis. We derive discounted cash flows using estimates and assumptions about the future. Other significant assumptions may include: expected future revenue growth rates, operating profit margins, working capital levels, asset lives used to generate future cash flows, a discount rate, a terminal value multiple, income tax rates and utilization of net operating loss tax carryforwards. These assumptions are developed using current market conditions as well as internal projections. Inherent in our development of cash flow projections for the income approach used in an impairment test are assumptions and estimates derived from a review of our operating results, approved business plans, expected growth, cost of capital and income tax rates. We also make certain assumptions about future economic conditions, applicable interest rates and other market data.
Accrued Warranty
We estimate future product failure rates based upon historical product failure trends as well as anticipated future failure rates if believed to be significantly different from historical trends. Similarly, we estimate future costs of repair based upon historical trends and anticipated future costs if they are expected to significantly differ, for example due to negotiated agreements with third parties. We use a consistent model and exercise considerable judgment in determining the underlying estimates. Our model requires an element of subjectivity for all of our products. For example, historical return rates are not completely indicative of future return rates and we must therefore exercise judgment with respect to future deviations from our historical return rates. When actual failure rates differ significantly from our estimates, we record the impact in subsequent periods and update our assumptions and forecasting models accordingly. As our newer products mature, we are able to improve our estimates with respect to these products.
Income Taxes
A number of estimates and judgments are necessary to determine deferred tax assets, deferred tax liabilities and valuation allowances. We recognize the benefit from a tax position only if it is more-likely-than-not that the position would be sustained upon audit based solely on the technical merits of the tax position. The calculation of our tax liabilities requires judgment related to uncertainties in the application of complex tax regulations. It is inherently difficult and subjective to estimate such amounts, as we have to determine the probability of various possible outcomes. We reevaluate these uncertain tax positions on a quarterly basis. This evaluation is based on factors including, but not limited to, changes in facts or circumstances, changes in tax law, effectively settled issues under audit and new audit activity.
We have provided a full valuation allowance against our U.S. net deferred tax assets due to our history of net losses, difficulty in predicting future results and our conclusion that we cannot rely on projections of future taxable income to realize the deferred tax assets. In addition, we have provided a full valuation allowance against certain of our international net deferred tax assets. Due to reorganizations in these jurisdictions, it is unclear whether we will be able to realize a benefit from these deferred tax assets. Also, certain changes in stock ownership could result in a limitation on the amount of net operating loss and tax credit carryovers that can be utilized each year. Should we undergo such a change in stock ownership, it would severely limit the usage of these carryover tax attributes against future income, resulting in additional tax charges.
Significant management judgment is required in determining our deferred tax assets and liabilities and valuation allowances for purposes of assessing our ability to realize any future benefit from our net deferred tax assets. We intend to maintain this valuation allowance until sufficient evidence exists to support the reversal of the valuation allowance. Future income tax expense will be reduced to the extent that we have sufficient evidence to support a reversal or decrease in this allowance. We also have deferred tax assets and liabilities due to prior business acquisitions with corresponding valuation allowances after assessing our ability to realize any future benefit from these acquired net deferred tax assets.
ITEM 7A. QUANTITATIVE AND QUALITATIVE DISCLOSURES ABOUT MARKET RISK
Interest Rate Risk
Changes in interest rates affect interest income earned on our cash equivalents, which consisted solely of money market funds in fiscal 2016 and 2015. During both fiscal 2016 and 2015, interest rates on these funds were under 1.0% and we earned a negligible amount of interest income, thus a hypothetical 100 basis point decrease in interest rates would have an insignificant impact on interest income.
45
In addition, changes in interest rates affect interest expense on our borrowings under the WF credit agreement. The interest rate on amounts borrowed is based on an election by us of an annual rate equal to (1) a base rate established by Wells Fargo plus an applicable margin of 1.0% to 1.5%, based on availability levels under the WF credit agreement or (2) the LIBOR rate plus an applicable margin ranging from 2.0% and 2.5%, based on availability levels under the WF credit agreement. The base rate is defined in the WF credit agreement. We had $65.7 million outstanding borrowings under the WF credit agreement as of March 31, 2016 at a weighted average interest rate of 3.18%. A hypothetical 100 basis point increase in interest rates would result in an approximate $0.7 million change in our annual interest expense on our outstanding borrowings as of March 31, 2016.
Our convertible subordinated notes have fixed interest rates, thus a hypothetical 100 basis point increase in interest rates would not impact interest expense.
Foreign Exchange Risk
We conduct business in certain international markets, primarily in the European Union. Because we operate in international markets, we have exposure to different economic climates, political arenas, tax systems and regulations that could affect foreign exchange rates. Our primary exposure to foreign currency risk relates to transacting in foreign currency and recording the activity in U.S. dollars. Changes in exchange rates between the U.S. dollar and these other currencies will result in transaction gains or losses, which we recognize in our Consolidated Statements of Operations.
To the extent practicable, we minimize our foreign currency exposures by maintaining natural hedges between our assets and liabilities and revenues and expenses denominated in foreign currencies. Additionally, in fiscal 2015 we entered into a foreign currency option contract to economically hedge euro product revenue exposures. We may enter into foreign exchange derivative contracts or other economic hedges in the future. Our goal in managing our foreign exchange risk is to reduce to the extent practicable our potential exposure to the changes that exchange rates might have on our earnings. We make a number of estimates in conducting hedging. In the event those estimates differ significantly from actual results, we could experience greater volatility as a result of our hedges.
46
ITEM 8. FINANCIAL STATEMENTS AND SUPPLEMENTARY DATA
INDEX TO CONSOLIDATED FINANCIAL STATEMENTS
Page | |
Quantum Corporation – Financial Statements | |
47
Report of Independent Registered Public Accounting Firm
To the Board of Directors and Stockholders of Quantum Corporation:
In our opinion, the accompanying consolidated balance sheets and the related consolidated statements of operations, comprehensive income (loss), stockholders’ deficit and cash flows present fairly, in all material respects, the financial position of Quantum Corporation and its subsidiaries at March 31,2016 and March 31, 2015, and the results of their operations and their cash flows for each of the three years in the period ended March 31, 2016 in conformity with accounting principles generally accepted in the United States of America. In addition, in our opinion, the financial statement schedule listed in the accompanying index presents fairly, in all material respects, the information set forth therein when read in conjunction with the related consolidated financial statements. Also in our opinion, the Company maintained, in all material respects, effective internal control over financial reporting as of March 31, 2016, based on criteria established in Internal Control - Integrated Framework (2013) issued by the Committee of Sponsoring Organizations of the Treadway Commission (COSO). The Company’s management is responsible for these financial statements and financial statement schedule, for maintaining effective internal control over financial reporting and for its assessment of the effectiveness of internal control over financial reporting, included in Management’s Report on Internal Control over Financial Reporting appearing under Item 9A. Our responsibility is to express opinions on these financial statements, on the financial statement schedule and on the Company’s internal control over financial reporting based on our integrated audits. We conducted our audits in accordance with the standards of the Public Company Accounting Oversight Board (United States). Those standards require that we plan and perform the audits to obtain reasonable assurance about whether the financial statements are free of material misstatement and whether effective internal control over financial reporting was maintained in all material respects. Our audits of the financial statements included examining, on a test basis, evidence supporting the amounts and disclosures in the financial statements, assessing the accounting principles used and significant estimates made by management, and evaluating the overall financial statement presentation. Our audit of internal control over financial reporting included obtaining an understanding of internal control over financial reporting, assessing the risk that a material weakness exists, and testing and evaluating the design and operating effectiveness of internal control based on the assessed risk. Our audits also included performing such other procedures as we considered necessary in the circumstances. We believe that our audits provide a reasonable basis for our opinions.
As discussed in Note 2 "Summary of Significant Accounting Policies" to the consolidated financial statements, the Company adopted ASU No. 2015-03, Interest - Imputation of Interest (Topic 835-30): Simplifying the Presentation of Debt Issuance Costs, which changed the manner in which it classifies debt issue costs on the consolidated balance sheets.
A company’s internal control over financial reporting is a process designed to provide reasonable assurance regarding the reliability of financial reporting and the preparation of financial statements for external purposes in accordance with generally accepted accounting principles. A company’s internal control over financial reporting includes those policies and procedures that (i) pertain to the maintenance of records that, in reasonable detail, accurately and fairly reflect the transactions and dispositions of the assets of the company; (ii) provide reasonable assurance that transactions are recorded as necessary to permit preparation of financial statements in accordance with generally accepted accounting principles, and that receipts and expenditures of the company are being made only in accordance with authorizations of management and directors of the company; and (iii) provide reasonable assurance regarding prevention or timely detection of unauthorized acquisition, use, or disposition of the company’s assets that could have a material effect on the financial statements.
Because of its inherent limitations, internal control over financial reporting may not prevent or detect misstatements. Also, projections of any evaluation of effectiveness to future periods are subject to the risk that controls may become inadequate because of changes in conditions, or that the degree of compliance with the policies or procedures may deteriorate.
/s/ PricewaterhouseCoopers LLP
Seattle, Washington
June 3, 2016
48
QUANTUM CORPORATION
CONSOLIDATED BALANCE SHEETS
(In thousands, except par value)
March 31, 2016 | March 31, 2015 | ||||||
Assets | |||||||
Current assets: | |||||||
Cash and cash equivalents | $ | 33,870 | $ | 67,948 | |||
Restricted cash | 2,788 | 2,621 | |||||
Accounts receivable, net of allowance for doubtful accounts of $22 and $27, respectively | 105,959 | 124,159 | |||||
Manufacturing inventories | 40,614 | 50,274 | |||||
Service parts inventories | 21,407 | 24,640 | |||||
Other current assets | 6,953 | 11,942 | |||||
Total current assets | 211,591 | 281,584 | |||||
Long-term assets: | |||||||
Property and equipment, less accumulated depreciation | 12,939 | 14,653 | |||||
Intangible assets, less accumulated amortization | 451 | 731 | |||||
Goodwill | — | 55,613 | |||||
Other long-term assets | 4,565 | 4,577 | |||||
Total long-term assets | 17,955 | 75,574 | |||||
$ | 229,546 | $ | 357,158 | ||||
Liabilities and Stockholders’ Deficit | |||||||
Current liabilities: | |||||||
Accounts payable | $ | 46,136 | $ | 54,367 | |||
Accrued warranty | 3,430 | 4,219 | |||||
Deferred revenue, current | 88,919 | 95,899 | |||||
Accrued restructuring charges, current | 1,621 | 3,855 | |||||
Long-term debt, current | 3,000 | — | |||||
Convertible subordinated debt, current, net of unamortized debt issuance costs of | |||||||
$390 at March 31, 2015 | — | 83,345 | |||||
Accrued compensation | 22,744 | 35,414 | |||||
Other accrued liabilities | 13,806 | 20,740 | |||||
Total current liabilities | 179,656 | 297,839 | |||||
Long-term liabilities: | |||||||
Deferred revenue, long-term | 35,427 | 39,532 | |||||
Accrued restructuring charges, long-term | 1,116 | 991 | |||||
Long-term debt | 62,709 | — | |||||
Convertible subordinated debt, long-term net of unamortized debt issuance costs of | |||||||
$747 and $1,207, respectively | 69,253 | 68,793 | |||||
Other long-term liabilities | 8,324 | 10,441 | |||||
Total long-term liabilities | 176,829 | 119,757 | |||||
Commitments and contingencies (Note 13) | — | — | |||||
Stockholders’ deficit: | |||||||
Preferred stock: | |||||||
Preferred stock, 20,000 shares authorized; no shares issued as of March 31, 2016 and 2015 | — | — | |||||
Common stock: | |||||||
Common stock, $0.01 par value; 1,000,000 shares authorized; 266,209 and 258,208 | |||||||
shares issued and outstanding at March 31, 2016 and March 31, 2015, respectively | 2,662 | 2,582 | |||||
Capital in excess of par | 464,549 | 456,411 | |||||
Accumulated deficit | (597,994 | ) | (523,311 | ) | |||
Accumulated other comprehensive income | 3,844 | 3,880 | |||||
Stockholders’ deficit | (126,939 | ) | (60,438 | ) | |||
$ | 229,546 | $ | 357,158 | ||||
The accompanying notes are an integral part of these Consolidated Financial Statements.
49
QUANTUM CORPORATION
CONSOLIDATED STATEMENTS OF OPERATIONS
(In thousands, except per share data)
For the year ended March 31, | |||||||||||
2016 | 2015 | 2014 | |||||||||
Product revenue | $ | 286,217 | $ | 355,579 | $ | 348,318 | |||||
Service revenue | 148,548 | 155,674 | 147,199 | ||||||||
Royalty revenue | 41,193 | 41,842 | 57,648 | ||||||||
Total revenue | 475,958 | 553,095 | 553,165 | ||||||||
Product cost of revenue | 206,859 | 237,679 | 237,076 | ||||||||
Service cost of revenue | 64,347 | 70,730 | 75,930 | ||||||||
Restructuring charges related to cost of revenue | — | — | 539 | ||||||||
Total cost of revenue | 271,206 | 308,409 | 313,545 | ||||||||
Gross margin | 204,752 | 244,686 | 239,620 | ||||||||
Operating expenses: | |||||||||||
Research and development | 48,703 | 58,618 | 64,375 | ||||||||
Sales and marketing | 108,735 | 113,954 | 118,771 | ||||||||
General and administrative | 53,793 | 56,513 | 57,865 | ||||||||
Restructuring charges | 4,006 | 1,666 | 10,675 | ||||||||
Goodwill impairment | 55,613 | — | — | ||||||||
Total operating expenses | 270,850 | 230,751 | 251,686 | ||||||||
Gain on sale of assets | — | 462 | 267 | ||||||||
Income (loss) from operations | (66,098 | ) | 14,397 | (11,799 | ) | ||||||
Other income and expense | (191 | ) | 13,836 | 1,296 | |||||||
Interest expense | (6,817 | ) | (9,460 | ) | (9,754 | ) | |||||
Loss on debt extinguishment | (394 | ) | (1,295 | ) | — | ||||||
Income (loss) before income taxes | (73,500 | ) | 17,478 | (20,257 | ) | ||||||
Income tax provision | 1,183 | 718 | 1,217 | ||||||||
Net income (loss) | $ | (74,683 | ) | $ | 16,760 | $ | (21,474 | ) | |||
Basic net income (loss) per share | $ | (0.28 | ) | $ | 0.07 | $ | (0.09 | ) | |||
Diluted net income (loss) per share | $ | (0.28 | ) | $ | 0.06 | $ | (0.09 | ) | |||
Weighted average shares: | |||||||||||
Basic | 262,730 | 254,665 | 247,024 | ||||||||
Diluted | 262,730 | 260,027 | 247,024 | ||||||||
The accompanying notes are an integral part of these Consolidated Financial Statements.
50
QUANTUM CORPORATION
CONSOLIDATED STATEMENTS OF COMPREHENSIVE INCOME (LOSS)
(In thousands)
For the year ended March 31, | |||||||||||
2016 | 2015 | 2014 | |||||||||
Net income (loss) | $ | (74,683 | ) | $ | 16,760 | $ | (21,474 | ) | |||
Other comprehensive income (loss), net of taxes: | |||||||||||
Foreign currency translation adjustments | 21 | (3,490 | ) | 679 | |||||||
Net unrealized gain (loss) on revaluation of long-term intercompany balances, net of taxes of $(15), $200 and $(67), respectively | (57 | ) | 750 | (251 | ) | ||||||
Total other comprehensive income (loss) | (36 | ) | (2,740 | ) | 428 | ||||||
Total comprehensive income (loss) | $ | (74,719 | ) | $ | 14,020 | $ | (21,046 | ) | |||
The accompanying notes are an integral part of these Consolidated Financial Statements.
51
QUANTUM CORPORATION
CONSOLIDATED STATEMENTS OF CASH FLOWS
(In thousands)
For the year ended March 31, | |||||||||||
2016 | 2015 | 2014 | |||||||||
Cash flows from operating activities: | |||||||||||
Net income (loss) | $ | (74,683 | ) | $ | 16,760 | $ | (21,474 | ) | |||
Adjustments to reconcile net income (loss) to net cash provided by (used in) operating activities: | |||||||||||
Depreciation | 6,410 | 8,281 | 10,713 | ||||||||
Amortization of intangible assets | 280 | 3,697 | 8,902 | ||||||||
Amortization and write off of debt issuance costs | 1,062 | 1,896 | 1,634 | ||||||||
Service parts lower of cost or market adjustment | 5,972 | 3,698 | 11,307 | ||||||||
Deferred income taxes | (85 | ) | (160 | ) | 36 | ||||||
Share-based compensation | 8,916 | 11,583 | 13,459 | ||||||||
Goodwill impairment | 55,613 | — | — | ||||||||
Gain on sale of assets | — | (462 | ) | — | |||||||
Gain on sale of other investments | — | (13,574 | ) | — | |||||||
Changes in assets and liabilities, net of effect of acquisition: | |||||||||||
Accounts receivable | 18,200 | (22,554 | ) | (4,770 | ) | ||||||
Manufacturing inventories | 6,325 | (19,688 | ) | 13,352 | |||||||
Service parts inventories | (780 | ) | (1,010 | ) | 2,675 | ||||||
Accounts payable | (8,180 | ) | 12,849 | (5,881 | ) | ||||||
Accrued warranty | (789 | ) | (1,897 | ) | (1,404 | ) | |||||
Deferred revenue | (11,085 | ) | (2,721 | ) | 8,651 | ||||||
Accrued restructuring charges | (2,109 | ) | (3,548 | ) | 3,619 | ||||||
Accrued compensation | (12,712 | ) | 11,318 | (6,140 | ) | ||||||
Other assets and liabilities | (4,075 | ) | 1,566 | 795 | |||||||
Net cash provided by (used in) operating activities | (11,720 | ) | 6,034 | 35,474 | |||||||
Cash flows from investing activities: | |||||||||||
Purchases of property and equipment | (3,482 | ) | (3,241 | ) | (5,957 | ) | |||||
Proceeds from sale of assets | — | 462 | — | ||||||||
Change in restricted cash | (139 | ) | (250 | ) | 426 | ||||||
Purchases of other investments | — | (22 | ) | (1,118 | ) | ||||||
Return of principal from other investments | — | 112 | — | ||||||||
Proceeds from sale of other investments | — | 15,097 | — | ||||||||
Payment for business acquisition, net of cash acquired | — | (517 | ) | — | |||||||
Net cash provided by (used in) investing activities | (3,621 | ) | 11,641 | (6,649 | ) | ||||||
Cash flows from financing activities: | |||||||||||
Borrowings of long-term debt, net | 68,920 | — | — | ||||||||
Repayments of long-term debt | (3,211 | ) | — | — | |||||||
Repayments of convertible subordinated debt | (83,735 | ) | (50,000 | ) | (1,265 | ) | |||||
Payment of taxes due upon vesting of restricted stock | (3,176 | ) | (2,378 | ) | (1,880 | ) | |||||
Proceeds from issuance of common stock | 2,478 | 3,737 | 4,430 | ||||||||
Net cash provided by (used in) financing activities | (18,724 | ) | (48,641 | ) | 1,285 | ||||||
Effect of exchange rate changes on cash and cash equivalents | (13 | ) | (211 | ) | 39 | ||||||
Net increase (decrease) in cash and cash equivalents | (34,078 | ) | (31,177 | ) | 30,149 | ||||||
Cash and cash equivalents at beginning of period | 67,948 | 99,125 | 68,976 | ||||||||
Cash and cash equivalents at end of period | $ | 33,870 | $ | 67,948 | $ | 99,125 | |||||
Supplemental disclosure of cash flow information: | |||||||||||
Proceeds from sale of other investments included in other assets | $ | — | $ | 1,564 | $ | — | |||||
Purchases of property and equipment included in accounts payable | 367 | 429 | 649 | ||||||||
Cash paid during the year for: | |||||||||||
Interest | 6,873 | 8,498 | 8,247 | ||||||||
Income taxes, net of refunds | 579 | 750 | 574 | ||||||||
The accompanying notes are an integral part of these Consolidated Financial Statements.
52
QUANTUM CORPORATION
CONSOLIDATED STATEMENTS OF STOCKHOLDERS’ DEFICIT
(In thousands)
Common Stock | Capital in Excess of Par Value | Accumulated Deficit | Accumulated Other Comprehensive Income | Total | ||||||||||||||||||
Shares | Amount | |||||||||||||||||||||
Balances as of March 31, 2013 | 243,080 | $ | 2,431 | $ | 427,611 | $ | (518,597 | ) | $ | 6,192 | $ | (82,363 | ) | |||||||||
Net loss | — | — | — | (21,474 | ) | — | (21,474 | ) | ||||||||||||||
Foreign currency translation adjustments | — | — | — | — | 679 | 679 | ||||||||||||||||
Net unrealized loss on revaluation of long-term intercompany balance, net of tax of $(67) | — | — | — | — | (251 | ) | (251 | ) | ||||||||||||||
Shares issued under employee stock purchase plan | 3,220 | 32 | 3,424 | — | — | 3,456 | ||||||||||||||||
Shares issued under employee stock incentive plans, net | 4,110 | 41 | (947 | ) | — | — | (906 | ) | ||||||||||||||
Share-based compensation expense | — | — | 13,459 | — | — | 13,459 | ||||||||||||||||
Balances as of March 31, 2014 | 250,410 | 2,504 | 443,547 | (540,071 | ) | 6,620 | (87,400 | ) | ||||||||||||||
Net income | — | — | — | 16,760 | — | 16,760 | ||||||||||||||||
Foreign currency translation adjustments | — | — | — | — | (3,490 | ) | (3,490 | ) | ||||||||||||||
Net unrealized gain on revaluation of long-term intercompany balance, net of tax of $200 | — | — | — | — | 750 | 750 | ||||||||||||||||
Shares issued under employee stock purchase plan | 2,790 | 28 | 2,865 | — | — | 2,893 | ||||||||||||||||
Shares issued under employee stock incentive plans, net | 5,008 | 50 | (1,584 | ) | — | — | (1,534 | ) | ||||||||||||||
Share-based compensation expense | — | — | 11,583 | — | — | 11,583 | ||||||||||||||||
Balances as of March 31, 2015 | 258,208 | 2,582 | 456,411 | (523,311 | ) | 3,880 | (60,438 | ) | ||||||||||||||
Net loss | — | — | — | (74,683 | ) | — | (74,683 | ) | ||||||||||||||
Foreign currency translation adjustments | — | — | — | — | 21 | 21 | ||||||||||||||||
Net unrealized loss on revaluation of long-term intercompany balance, net of tax of $(15) | — | — | — | — | (57 | ) | (57 | ) | ||||||||||||||
Shares issued under employee stock purchase plan | 3,273 | 33 | 2,147 | — | — | 2,180 | ||||||||||||||||
Shares issued under employee stock incentive plans, net | 4,728 | 47 | (2,925 | ) | — | — | (2,878 | ) | ||||||||||||||
Share-based compensation expense | — | — | 8,916 | — | — | 8,916 | ||||||||||||||||
Balances as of March 31, 2016 | 266,209 | $ | 2,662 | $ | 464,549 | $ | (597,994 | ) | $ | 3,844 | $ | (126,939 | ) | |||||||||
The accompanying notes are an integral part of these Consolidated Financial Statements.
53
NOTE 1: BASIS OF PRESENTATION
Quantum Corporation (“Quantum”, the “Company”, “us” or “we”), founded in 1980 and reincorporated in Delaware in 1987, is a leading expert in scale-out storage, archive and data protection, providing solutions for capturing, sharing, managing and preserving digital assets over the entire data lifecycle. Our customers, ranging from small businesses to large/multi-national enterprises, trust us to address their most demanding data workflow challenges. Our end-to-end tiered storage solutions enable users to maximize the value of their data by making it accessible whenever and wherever needed, retaining it indefinitely and reducing total cost and complexity. We work closely with a broad network of distributors, value-added resellers (“VARs”), direct marketing resellers (“DMRs”), original equipment manufacturers (“OEMs”) and other suppliers to meet customers’ evolving needs. Our stock is traded on the New York Stock Exchange under the symbol QTM.
The accompanying Consolidated Financial Statements include the accounts of Quantum and our wholly-owned subsidiaries. All intercompany accounts and transactions have been eliminated. In the Consolidated Balance Sheets, prior period convertible subordinated debt, current and long-term, have been presented net of debt issuance costs to conform to current period presentation. The preparation of our Consolidated Financial Statements in conformity with generally accepted accounting principles (“GAAP”) in the U.S. requires management to make estimates and assumptions that affect the reported amount of assets and liabilities at the date of the financial statements and the reported amount of revenues and expenses during the period. We base estimates on historical experience and on various assumptions about the future that are believed to be reasonable based on available information. Our reported financial position or results of operations may be materially different under different conditions or when using different estimates and assumptions, particularly with respect to significant accounting policies, which are discussed below. In the event that estimates or assumptions prove to differ from actual results, adjustments are made in the current period to reflect this current information.
NOTE 2: SUMMARY OF SIGNIFICANT ACCOUNTING POLICIES
Revenue Recognition
Revenue consists of sales of hardware, software and services, as well as royalties we earn for the license of certain intellectual property. Revenue is recognized from the sale of products and services when it is realized or realizable and earned. Revenue is considered realized and earned when: persuasive evidence of an arrangement exists; delivery has occurred or services have been rendered; the price to the buyer is fixed or determinable; and when collectability is reasonably assured. Royalty revenue is recognized when earned or when earned amounts can be reasonably estimated.
Multiple Element Arrangements
We enter into sales arrangements with customers that contain multiple deliverables such as hardware, software and services, and these arrangements require assessment of each deliverable to determine its estimated selling price. Additionally, we use judgment in order to determine the appropriate timing of revenue recognition and to assess whether any software and non-software components function together to deliver a tangible product’s essential functionality in order to ensure the arrangement is properly accounted for as software or hardware revenue. The majority of our products are hardware products which contain software essential to the overall functionality of the product. Hardware products are generally sold with customer field support agreements.
For multiple element arrangements, consideration is first allocated between software (consisting of nonessential and stand-alone software) and non-software deliverables on a relative fair value basis.
Consideration in such multiple element transactions is allocated to each non-software element based on the fair value hierarchy, where the selling price for an element is based on vendor-specific objective evidence (“VSOE”), if available; third-party evidence (“TPE”), if VSOE is not available; or the best estimate of selling price (“BESP”), if neither VSOE nor TPE is available. For BESP, we consider our discounting and internal pricing practices, external market conditions and competitive positioning for similar offerings.
For software deliverables, we allocate consideration between multiple elements based on software revenue recognition guidance, which requires revenue earned on software arrangements involving multiple elements to be allocated to each element based on the relative fair values of those elements. The fair value of an element must be based on VSOE. Where fair value of delivered elements is not available, revenue is recognized on the “residual method” based on the fair value of undelivered elements. If evidence of fair value of one or more undelivered elements does not exist, all revenue is deferred and recognized at the earlier of the delivery of those elements or the establishment of fair value of the remaining undelivered elements.
54
Product Revenue — Hardware
Revenue for hardware products sold to distributors, VARs, DMRs, OEMs and end users is generally recognized upon shipment. When significant post-delivery obligations exist, the related revenue is deferred until such obligations are fulfilled. If there are customer acceptance criteria in the contract, we recognize revenue upon end user acceptance.
In the period revenue is recognized, allowances are provided for estimated future price adjustments, such as rebates, price protection and future product returns. These allowances are based on programs in existence at the time revenue is recognized, plans regarding future price adjustments, the customers’ master agreements and historical product return rates. Since we have historically been able to reliably estimate the amount of allowances required, we recognize revenue, net of projected allowances, upon shipment to our customers. If we were unable to reliably estimate the amount of revenue adjustments in any specific reporting period, then we would be required to defer recognition of the revenue until the rights had lapsed and we were no longer under any obligation to reduce the price or accept the return of the product.
Product Revenue — Software
For software products, we generally recognize revenue upon delivery of the software. Revenue from post-contract customer support agreements, which entitle software customers to both telephone support and any unspecified upgrades and enhancements during the term of the agreement, is classified as product revenue, as the value of these support arrangements are the upgrades and enhancements to the software licenses themselves and there is no on-site support, and recognized ratably over the term of the support agreement.
We license certain software to customers under licensing agreements that allow those customers to embed our software into specific products they offer. As consideration, licensees pay us a fee based on the amount of sales of their products that incorporate our software. On a periodic and timely basis, the licensees provide us with reports listing their sales to end users for which they owe us license fees. As the reports substantiate delivery has occurred, we recognize revenue based on the information in these reports or when amounts can be reasonably estimated.
Service Revenue
Revenue for service is generally recognized upon services being rendered. Service revenue primarily consists of customer field support agreements for our hardware products. For customer field support agreements, revenue equal to the separately stated price of these service contracts is initially deferred and recognized as revenue ratably over the contract period.
Royalty Revenue
We license certain intellectual property to third party manufacturers under arrangements that are represented by master contracts. The master contracts give the third party manufacturers rights to the intellectual property which include allowing them to either manufacture or include the intellectual property in products for resale. As consideration, the licensees pay us a per-unit royalty for sales of their products that incorporate our intellectual property. On a periodic and timely basis, the licensees provide us with reports listing units sold to end users subject to the royalties. As the reports substantiate delivery has occurred, we recognize revenue based on the information in these reports or when amounts can be reasonably estimated.
Service Cost of Revenue
We classify expenses as service cost of revenue by estimating the portion of our total cost of revenue that relates to providing field support to our customers under contract. These estimates are based upon a variety of factors, including the nature of the support activity and the level of infrastructure required to support the activities from which we earn service revenue. In the event our service business changes, our estimates of cost of service revenue may be impacted.
Shipping and Handling Fees
Shipping and handling fees are included in cost of revenue and were $10.6 million, $12.3 million and $13.6 million in fiscal 2016, 2015 and 2014, respectively.
Research and Development Costs
Expenditures relating to the development of new products and processes are expensed as incurred. These costs include expenditures for employee compensation, materials used in the development effort, other internal costs, as well as expenditures for third party professional services. We have determined that technological feasibility for our software products is reached shortly before the products are released to manufacturing. Costs incurred after technological feasibility is established have not been material. We expense software-related research and development costs as incurred.
55
Advertising Expense
We expense advertising costs as incurred. Advertising expense for the years ended March 31, 2016, 2015 and 2014 was $9.2 million, $7.6 million and $8.4 million, respectively.
Restructuring Charges
In recent periods and over the past several years, we have recorded significant restructuring charges related to the realignment and restructuring of our business operations. These charges represent expenses incurred in connection with strategic planning, certain cost reduction programs that we have implemented and consist of the cost of involuntary termination benefits, facilities charges, asset write-offs and other costs of exiting activities or geographies.
The charges for involuntary termination costs and associated expenses often require the use of estimates, primarily related to the number of employees to be paid severance and the amounts to be paid, largely based on years of service and statutory requirements. Assumptions to estimate facility exit costs include the ability to secure sublease income largely based on market conditions, the likelihood and amounts of a negotiated settlement for contractual lease obligations and other exit costs. Other estimates for restructuring charges consist of the realizable value of assets including associated disposal costs and termination fees with third parties for other contractual commitments.
Share-Based Compensation
The majority of our share-based awards are measured based on the fair market value of the underlying stock on the date of grant. We use the Black-Scholes stock option pricing model to estimate the fair value of stock option awards at the date of grant. For awards that contain market conditions, we use a Monte-Carlo simulation model to estimate the fair value of share-based awards. Both the Black-Scholes and Monte-Carlo models require the use of highly subjective assumptions, including expected life, expected volatility and expected risk-free rate of return. Other reasonable assumptions in either model could provide differing results. We calculate a forfeiture rate to estimate the share-based awards that will ultimately vest based on types of awards and historical experience. Additionally, for awards which are performance based, we make estimates as to the probability of the underlying performance being achieved.
Foreign Currency Translation and Transactions
Assets, liabilities and operations of foreign offices and subsidiaries are recorded based on the functional currency of the entity. For a majority of our foreign operations, the functional currency is the U.S. dollar. The assets and liabilities of foreign offices with a local functional currency are translated, for consolidation purposes, at current exchange rates from the local currency to the reporting currency, the U.S. dollar. The resulting gains or losses are reported as a component of other comprehensive income. Foreign exchange gains and losses from changes in the exchange rates underlying intercompany balances that are of a long-term investment nature are also reported as a component of other comprehensive income. Assets and liabilities denominated in other than the functional currency are remeasured each month with the remeasurement gain or loss recorded in other income and expense in the Consolidated Statements of Operations. Foreign currency gains and losses recorded in other income and expense were a $0.3 million loss in fiscal 2016, a $0.2 million gain in fiscal 2015 and a $0.3 million gain in fiscal 2014.
Derivative Instruments
Derivative instruments are carried at fair value on our Consolidated Balance Sheets. The fair values of the derivative financial instruments generally represent the estimated amounts we would expect to receive or pay upon termination of the contracts as of the reporting date. We did not hold any material derivative instruments during fiscal 2016, 2015 or 2014.
56
Income Taxes
We recognize deferred tax assets and liabilities due to the effect of temporary differences between the carrying amounts of assets and liabilities for financial reporting purposes and the amounts used for income tax purposes. We also reduce deferred tax assets by a valuation allowance if it is more likely than not that some or all of the deferred tax asset will not be realized.
We recognize the benefit from a tax position only if it is more-likely-than-not that the position would be sustained upon audit based solely on the technical merits of the tax position. The calculation of our tax liabilities requires judgment related to uncertainties in the application of complex tax regulations. It is inherently difficult and subjective to estimate such amounts, as we have to determine the probability of various possible outcomes. We reevaluate these uncertain tax positions on a quarterly basis. This evaluation is based on factors including, but not limited to, changes in facts or circumstances, changes in tax law, effectively settled issues under audit and new audit activity. A change in recognition or measurement would result in the recognition of a tax benefit or an additional tax charge to the provision.
We recognize interest and penalties related to uncertain tax positions in the income tax provision in the Consolidated Statements of Operations. To the extent accrued interest and penalties do not become payable, amounts accrued will be reduced and reflected as a reduction of the overall income tax provision in the period that such determination is made.
Cash Equivalents, Restricted Cash and Other Investments
We consider all highly liquid debt instruments with a maturity of 90 days or less at the time of purchase to be cash equivalents. Cash equivalents are carried at fair value, which approximates their cost.
Restricted cash is comprised of bank guarantees and similar required minimum balances that serve as cash collateral in connection with various items including insurance requirements, value added taxes, ongoing tax audits and leases in certain countries.
Investments in private technology venture limited partnerships are currently accounted for using the equity method because we are deemed to have influence. Ownership interests in these limited partnerships are accounted for under the equity method unless our interest is so minor that we have virtually no influence over the partnership operating and financial policies, in which case the cost method is used.
Investments in other privately held companies are accounted for under the cost method unless we hold a significant stake. We review non-marketable equity investments on a regular basis to determine if there has been any impairment of value which is other than temporary by reviewing their financial information, gaining knowledge of any new financing or other business agreements and assessing their operating viability. In fiscal 2015, we sold our investment in a privately held company that was accounted for under the cost method and recorded a $13.6 million gain in other income and expense in the Consolidated Statements of Operations. Investments in non-marketable equity investments are recorded in other long-term assets in the Consolidated Balance Sheets.
Allowance for Doubtful Accounts
We perform ongoing credit evaluations of our customers’ financial condition and, for the majority of our customers, require no collateral. For customers that do not meet our credit standards, we often require a form of collateral, such as cash deposits or letters of credit, prior to the completion of a transaction. These credit evaluations require significant judgment and are based on multiple sources of information. We analyze such factors as our historical bad debt experience, industry and geographic concentrations of credit risk, current economic trends and changes in customer payment terms. We maintain an allowance for doubtful accounts based on historical experience and expected collectability of outstanding accounts receivable. We record bad debt expense in general and administrative expenses.
Manufacturing Inventories
Our manufacturing inventory is stated at the lower of cost or market, with cost computed on a first-in, first-out (“FIFO”) basis. Adjustments to reduce the cost of manufacturing inventory to its net realizable value, if required, are made for estimated excess, obsolete or impaired balances. Factors influencing these adjustments include declines in demand, rapid technological changes, product life cycle and development plans, component cost trends, product pricing, physical deterioration and quality issues. Revisions to these adjustments would be required if these factors differ from our estimates.
57
Service Parts Inventories
Our service parts inventories are stated at the lower of cost or market. We carry service parts because we generally provide product warranty for one to three years and earn revenue by providing enhanced and extended warranty and repair service during and beyond this warranty period. Service parts inventories consist of both component parts, which are primarily used to repair defective units, and finished units, which are provided for customer use permanently or on a temporary basis while the defective unit is being repaired. Defective parts returned from customers that can be repaired are repaired and put back into service parts inventories at their current carrying value. We record adjustments to reduce the carrying value of service parts inventory to its net realizable value, and we dispose of parts with no use and a net realizable value of zero. Factors influencing these adjustments include product life cycles, end of service life plans and volume of enhanced or extended warranty service contracts. Estimates of net realizable value involve significant estimates and judgments about the future, and revisions would be required if these factors differ from our estimates.
Property and Equipment
Property and equipment are carried at cost, less accumulated depreciation and amortization, computed on a straight-line basis over the estimated useful lives of the assets as follows:
Machinery and equipment | 3 to 5 years |
Computer equipment | 3 to 5 years |
ERP software | 10 years |
Other software | 3 years |
Furniture and fixtures | 5 years |
Other office equipment | 5 years |
Leasehold improvements | Life of lease |
Amortizable Intangible and Other Long-lived Assets
We review the useful lives of amortizable intangible and other long-lived assets (“long-lived assets”) quarterly and review long-lived assets for impairment whenever events or changes in circumstances indicate the carrying amount of such assets may not be recoverable. The company operates as a single reporting unit for business and operating purposes, and our impairment evaluation also treats the company as a single asset group. Impairment indicators we consider include a significant decrease in the market price of our long-lived asset group, adverse changes in the extent or manner in which our long-lived assets are being used, adverse changes in the business climate that could affect the value of our long-lived assets, a current period operating or cash flow loss combined with a history of operating or cash flow losses or a projection or forecast that demonstrates continuing losses associated with the use of our long-lived assets and an expectation that it is more likely than not our long-lived assets will be sold or otherwise disposed of significantly before the end of their previously estimated useful life. If we identify impairment indicators, we evaluate recoverability using an undiscounted cash flow approach. Estimates of future cash flows incorporate company forecasts and our expectations of future use of our long-lived assets, and these factors are impacted by market conditions. If impairment is indicated, an impairment charge is recorded to write the long-lived assets down to their estimated fair value.
58
Goodwill
We evaluate goodwill for impairment annually during the fourth quarter of our fiscal year, or more frequently when indicators of impairment are present. We operate as a single reporting unit and consider the company as a whole when reviewing impairment factors. Because we have negative book value, we perform a qualitative analysis to determine whether it is more likely than not that the fair value of goodwill is less than its carrying amount. Some of the impairment indicators we consider include our stock price, significant differences between the carrying amount and the estimated fair value of our assets and liabilities; macroeconomic conditions such as a deterioration in general economic condition or limitations on accessing capital; industry and market considerations such as a deterioration in the environment in which we operate and an increased competitive environment; cost factors such as increases in raw materials, labor, or other costs that have a negative effect on earnings and cash flows; overall financial performance such as negative or declining cash flows or a decline in actual or planned revenue or earnings compared with actual and projected results of relevant prior periods; other relevant events such as litigation, changes in management, key personnel, strategy or customers; the testing for recoverability of our long-lived assets and a sustained decrease in share price. We evaluate the significance of identified events and circumstances on the basis of the weight of evidence along with how they could affect the relationship between the reporting unit's fair value and carrying amount. If we determine it is more likely than not that the fair value of goodwill is less than its carrying amount, then a second step is performed to quantify the amount of goodwill impairment. If impairment is indicated, a goodwill impairment charge is recorded in the current period to write the goodwill down to its implied fair value.
Accrued Warranty
We generally warrant our hardware products against certain defects for periods ranging from one to three years from the date of sale. Our tape automation systems, disk backup systems and scale-out storage solutions may carry service agreements with customers that choose to extend or upgrade the warranty service. We use a combination of internal resources and third party service providers to supply field service and support. If the actual costs were to differ significantly from our estimates, we would record the impact of these unforeseen costs or cost reductions in subsequent periods.
We estimate future failure rates based upon historical product failure trends as well as anticipated future failure rates if believed to be significantly different from historical trends. Similarly, we estimate future costs of repair based upon historical trends and anticipated future costs if they are expected to significantly differ, for example due to negotiated agreements with third parties. We use a consistent model and exercise considerable judgment in determining the underlying estimates. Our model requires an element of subjectivity for all of our products. For example, historical rates of return are not completely indicative of future return rates and we must therefore exercise judgment with respect to future deviations from our historical return rate. If we determine in a future period that either actual failure rates or actual costs of repair were to differ from our estimates, we record the impact of those differences in that future period. As our newer products mature, we are able to improve our estimates with respect to these products. It is reasonably likely that assumptions will be updated for failure rates and, therefore, our accrued warranty estimate could change in the future.
Business Combinations
We allocate the purchase price paid to the assets acquired and liabilities assumed in a business combination at their estimated fair values as of the acquisition date. Any excess purchase price above the identified net tangible and intangible assets and assumed liabilities is allocated to goodwill. We consider fair value to be the price that would be received to sell an asset or paid to transfer a liability in an orderly transaction between market participants at the measurement date. We estimate fair value using the fair value hierarchy for the tangible and intangible assets acquired as well as liabilities and contingencies assumed from the acquired company.
Common Stock Repurchases
During fiscal 2000, the Board of Directors authorized us to repurchase up to $700 million of our common stock in open market or private transactions. As of March 31, 2016 and 2015, there was $87.9 million remaining on our authorization to repurchase Quantum common stock. Our ability to repurchase our common stock is restricted unless we meet certain thresholds under the terms of our Wells Fargo credit agreement.
59
Fair Value of Financial Instruments
We use exit prices, that is the price to sell an asset or transfer a liability, to measure assets and liabilities that are within the scope of the fair value measurements guidance. We classify these assets and liabilities based on the following fair value hierarchy:
Level 1: | Quoted (observable) market prices in active markets for identical assets or liabilities. |
Level 2: | Observable inputs other than Level 1, such as quoted prices for similar assets or liabilities; quoted prices in markets that are not active; or other inputs that are observable or can be corroborated by observable market data for substantially the full term of the asset or liability. |
Level 3: | Prices or valuations that require inputs that are both significant to the fair value measurement and unobservable. |
The assets measured and recorded at fair value on a recurring basis consist of money market funds which are valued using quoted market prices at the respective balance sheet dates and are level 1 fair value measurements (in thousands):
As of March 31, | |||||||
2016 | 2015 | ||||||
Money market funds | $ | 1,640 | $ | 34,278 | |||
We have certain non-financial assets that are measured at fair value on a non-recurring basis when there is an indicator of impairment, and they are recorded at fair value only when an impairment is recognized. These assets include property and equipment, amortizable intangible assets and goodwill. We did not record impairments to any non-financial assets in fiscal 2016 or fiscal 2015 except for a goodwill impairment in fiscal 2016, which is further described in Note 5 "Intangible Assets and Goodwill" to the Consolidated Financial Statements. We do not have any non-financial liabilities measured and recorded at fair value on a non-recurring basis.
Our financial liabilities were comprised primarily of convertible subordinated debt and long-term debt at March 31, 2016 and convertible subordinated debt at March 31, 2015. The carrying value and fair value were as follows (in thousands):
As of March 31, | |||||||||||||||
2016 | 2015 | ||||||||||||||
Carrying Value | Fair Value | Carrying Value | Fair Value | ||||||||||||
Convertible subordinated debt(1) | $ | 69,253 | $ | 51,686 | $ | 152,138 | $ | 166,551 | |||||||
Long-term debt(2) | $ | 65,709 | $ | 65,741 | $ | — | $ | — | |||||||
(1) Fair value based on quoted market prices in less active markets (level 2). | ||||
(2) Fair value based on outstanding borrowings and market interest rates (level 2) | ||||
Risks and Uncertainties
As is typical in the information storage industry, a significant portion of our customer base is concentrated among a small number of OEMs, distributors and large VARs. The loss of any one of our more significant customers, or a significant decrease in the sales volume with one of these significant customers, could have a material adverse effect on our results of operations and financial condition. Furthermore, if there is a downturn in general economic conditions, the resulting effect on IT spending could also have a material adverse effect on our results of operations and financial condition. We also face risks and uncertainties since our competitors in one area may be customers or suppliers in another.
A limited number of products comprise a significant majority of our sales, and due to increasingly rapid technological change in the industry, our future operating results depend on our ability to develop and successfully introduce new products.
Concentration of Credit Risk
We currently invest our excess cash in deposits with major banks and in money market funds. In the past, we have also held investments in short-term debt securities of companies with strong credit ratings from a variety of industries, and we may make investments in these securities in the future. We have not experienced any material losses on these investments and limit the amount of credit exposure to any one issuer and to any one type of investment.
60
We sell products to customers in a wide variety of industries on a worldwide basis. In countries or industries where we are exposed to material credit risk, we may require collateral, including cash deposits and letters of credit, prior to the completion of a transaction. We do not believe we have significant credit risk beyond that provided for in the financial statements in the ordinary course of business.
Sales to our top five customers represented 28% of revenue in fiscal 2016 and 31% of revenue in fiscal 2015 and 2014. We had no customers that comprised 10% or greater of revenue in fiscal 2016, fiscal 2015 or fiscal 2014.
Recently Adopted Accounting Pronouncements
In April 2015, the FASB issued ASU No. 2015-03, Interest - Imputation of Interest (Topic 835-30): Simplifying the Presentation of Debt Issuance Costs ("ASU 2015-03"). ASU 2015-03 requires that debt issuance costs related to a recognized debt liability be presented on the balance sheet as a direct deduction from the carrying amount of that debt liability, consistent with debt discounts. The recognition and measurement guidance for debt issuance costs is not affected by ASU 2015-03. We early adopted ASU 2015-03 in the first quarter of fiscal 2016 and reclassified debt issuance costs from other current and long-term assets to convertible subordinated debt on the Consolidated Balance Sheets. Adoption did not otherwise impact our statements of financial position or results of operations.
In August 2015, the FASB issued ASU No. 2015-15, Interest - Imputation of Interest (Topic 835-30): Presentation and Subsequent Measurement of Debt Issuance Costs Associated with Line-of-Credit Arrangements ("ASU 2015-15"). ASU 2015-15 states that given the absence of authoritative guidance within ASU 2015-03, which does not address for debt issuance costs related to line-of-credit arrangements, the SEC staff would not object to an entity deferring and presenting debt issuance costs as an asset and subsequently amortizing the deferred costs ratably over the term of the line-of-credit arrangement regardless of whether there are any outstanding borrowings on the line-of-credit arrangement. We adopted ASU 2015-15 in the second quarter of fiscal 2016 and present debt issuance costs related to our line-of-credit arrangements as an asset. Adoption did not impact our statements of financial position or results of operations.
In November 2015, the FASB issued ASU No. 2015-17, Income Taxes (Topic 740) Balance Sheet Classification of Deferred Taxes ("ASU 2015-17"). ASU 2015-17 requires that deferred tax liabilities and assets be classified as non-current in a classified statement of financial positions. We early adopted ASU 2015-17 in the fourth quarter of fiscal 2016 on a prospective basis and classified our net deferred tax asset as non-current on the Consolidated Balance Sheets. No prior periods were retrospectively adjusted. Adoption did not otherwise impact our statements of financial position or results of operations.
Recent Accounting Pronouncements
In August 2014, the FASB issued ASU No. 2014-15, Presentation of Financial Statements – Going Concern (Topic 205-40): Disclosure of Uncertainties about an Entity's Ability to Continue as a Going Concern (“ASU 2014-15”). ASU 2014-15 requires that management assess an entity’s ability to continue as a going concern by incorporating and expanding upon certain principles that are currently in U.S. auditing standards. ASU 2014-15 is effective for annual periods ending after December 15, 2016, and for annual periods and interim periods thereafter. We plan to adopt ASU 2014-15 as of the end of our fiscal year ending March 31, 2017 and do not anticipate adoption will impact our statements of financial position or results of operations.
In April 2015, the FASB issued ASU No. 2015-05, Customer's Accounting for Fees Paid in a Cloud Computing Arrangement ("ASU 2015-05"). ASU 2015-05 requires that customers apply the same criteria as vendors to determine whether a cloud computing arrangement ("CCA") contains a software license or is solely a service contract. Under ASU 2015-05, fees paid by a customer in a CCA will be within the scope of internal-use software guidance if both of the following criteria are met: 1) the customer has the contractual right to take possession of the software at any time without significant penalty, and 2) it is feasible for the customer to run the software on its own hardware (or to contract with another party to host the software). ASU 2015-05 will be effective for us beginning April 1, 2016, or fiscal 2017. We do not anticipate adoption will impact our statements of financial position or results of operations.
In July 2015, the FASB issued ASU No. 2015-11, Inventory (Topic 330) ("ASU 2015-11"). ASU 2015-11 requires that an entity measure all inventory at the lower of cost and net realizable value, except for inventory that is measured using last-in, first-out (LIFO) or the retail inventory method. ASU 2015-11 will become effective for us beginning April 1, 2017, or fiscal 2018. We are currently evaluating the guidance to determine the potential impact on our financial condition, results of operations, cash flows and financial statement disclosures.
61
In January 2016, the FASB issued ASU No. 2016-01, Financial Instruments - Overall (Topic 825-10): Recognition and Measurement of Financial Assets and Financial Liabilities ("ASU 2016-01"). ASU 2016-01 addresses certain aspects of recognition, measurement, presentation and disclosures of financial instruments. ASU 2016-01 will become effective for us beginning April 1, 2018, or fiscal 2019. We are currently evaluating the guidance to determine the potential impact on our financial condition, results of operations, cash flows and financial statement disclosures.
In February 2016, the FASB issued ASU No. 2016-02, Leases (Topic 842)("ASU 2016-02"). ASU 2016-02 provides a new comprehensive model for lease accounting. Under ASU 2016-02, lessees and lessors should apply a "right-of-use" model in accounting for all leases and eliminate the concept of operating leases and off-balance sheet leases. ASU 2016-02 will become effective for us beginning April 1, 2019, or fiscal 2020. We are currently evaluating the guidance to determine the potential impact on our financial condition, results of operations, cash flows and financial statement disclosures.
In March 2016, the FASB issued ASU No. 2016-09, Compensation - Stock compensation (Topic 718): Improvements to Employee Share-Based Payment Accounting ("ASU 2016-09"). ASU 2016-09 simplifies several aspects of the accounting for share-based payment transactions, including the income tax consequences, classification of awards as either equity or liabilities and classification on the statement of cash flows. ASU 2016-09 will become effective for us beginning April 1, 2017, or fiscal 2018. We are currently evaluating the guidance to determine the potential impact on our financial condition, results of operations, cash flows and financial statement disclosures.
The FASB issued the following accounting standard updates related to Topic 606:
• | ASU No. 2014-09, Revenue from Contracts with Customers (Topic 606) (“ASU 2014-09”) in May 2014. ASU 2014-09 requires entities to recognize revenue through the application of a five-step model, which includes identification of the contract, identification of the performance obligations, determination of the transaction price, allocation of the transaction price to the performance obligations and recognition of revenue as the entity satisfies the performance obligations. |
• | ASU No. 2016-08, Revenue from Contracts with Customers (Topic 606): Principal versus Agent Considerations (Reporting Revenue Gross versus Net) ("ASU 2016-08") in March 2016. ASU 2016-08 does not change the core principle of revenue recognition in Topic 606 but clarifies the implementation guidance on principal versus agent considerations. |
• | ASU No. 2016-10, Revenue from Contracts with Customers (Topic 606): Identifying Performance Obligations and Licensing ("ASU 2016-10") in April 2016. ASU 2016-10 does not change the core principle of revenue recognition in Topic 606 but clarifies the implementation guidance on identifying performance obligations and the licensing implementation guidance, while retaining the related principles for those areas. |
• | ASU No. 2016-11, Revenue Recognition (Topic 605) and Derivatives and Hedging (Topic 815): Rescission of SEC Guidance Because of Accounting Standards Updates 2014-09 and 2014-16 Pursuant to Staff Announcements at the March 3, 2016 EITF Meeting (SEC Update) ("ASU 2016-11") in May 2016. ASU 2016-11 rescinds SEC paragraphs pursuant to two SEC Staff Announcements at the March 3, 2016 EITF meeting. The SEC Staff is rescinding SEC Staff Observer comments that are codified in Topic 605 and Topic 932, effective upon adoption of Topic 606. |
• | ASU No. 2016-12, Revenue from Contracts with Customers (Topic 606): Narrow-Scope Improvements and Practical Expedients in May 2016. ASU 2016-12 does not change the core principle of revenue recognition in Topic 606 but clarifies the implementation guidance on a few narrow areas and adds some practical expedients to the guidance. |
These ASUs will become effective for us beginning April 1, 2018, or fiscal 2019. We are currently evaluating the guidance to determine the potential impact on our financial condition, results of operations, cash flows and financial statement disclosures.
NOTE 3: ACQUISITION
On July 29, 2014, we acquired a majority of the assets of Symform, Inc., a Washington corporation, for cash of approximately $0.5 million. The assets, consisting primarily of Symform technology, were recorded as purchased technology and are expected to enhance our cloud software capabilities and service offerings for data protection and scale-out storage. This acquisition was recorded as a business combination and the effect was not material to our financial position, results of operations or cash flows.
62
NOTE 4: BALANCE SHEET DETAILS
Cash, cash equivalents and restricted cash consisted of (in thousands):
As of March 31, | |||||||
2016 | 2015 | ||||||
Cash | $ | 35,018 | $ | 36,291 | |||
Money market funds | 1,640 | 34,278 | |||||
$ | 36,658 | $ | 70,569 | ||||
Manufacturing inventories consisted of (in thousands):
As of March 31, | |||||||
2016 | 2015 | ||||||
Finished goods | $ | 22,127 | $ | 28,022 | |||
Work in process | 665 | 58 | |||||
Materials and purchased parts | 17,822 | 22,194 | |||||
$ | 40,614 | $ | 50,274 | ||||
Service parts inventories consisted of (in thousands):
As of March 31, | |||||||
2016 | 2015 | ||||||
Finished goods | $ | 16,381 | $ | 18,143 | |||
Component parts | 5,026 | 6,497 | |||||
$ | 21,407 | $ | 24,640 | ||||
Property and equipment consisted of (in thousands):
As of March 31, | |||||||
2016 | 2015 | ||||||
Machinery and equipment | $ | 105,511 | $ | 122,339 | |||
Furniture and fixtures | 4,316 | 5,816 | |||||
Leasehold improvements | 19,799 | 20,309 | |||||
129,626 | 148,464 | ||||||
Less: accumulated depreciation | (116,687 | ) | (133,811 | ) | |||
$ | 12,939 | $ | 14,653 | ||||
NOTE 5: INTANGIBLE ASSETS AND GOODWILL
Intangible Assets
Acquired intangible assets are amortized over their estimated useful lives, which generally range from one to eight years. In estimating the useful lives of intangible assets, we considered the following factors:
• | The cash flow projections used to estimate the useful lives of the intangible assets showed a trend of growth that was expected to continue for an extended period of time; |
• | Our tape automation products, disk backup systems and scale-out storage solutions, in particular, have long development cycles; these products have experienced long product life cycles; and |
• | Our ability to leverage core technology into data protection and scale-out storage solutions and, therefore, to extend the lives of these technologies. |
Acquired IPR&D is amortized over its estimated useful life once technological feasibility is reached. If IPR&D is determined to not have technological feasibility or is abandoned, we write off the IPR&D in that period.
63
Following is the weighted average amortization period for our amortizable intangible assets:
Amortization (Years) | |
Purchased technology | 6.3 |
Trademarks | 6.0 |
Customer lists | 8.2 |
All intangible assets | 6.8 |
Intangible amortization within our Consolidated Statements of Operations for the years ended March 31, 2016, 2015 and 2014 is provided in the table below (in thousands):
For the year ended March 31, | |||||||||||
2016 | 2015 | 2014 | |||||||||
Purchased technology | $ | 280 | $ | 913 | $ | 1,476 | |||||
Customer lists | — | 2,784 | 7,426 | ||||||||
$ | 280 | $ | 3,697 | $ | 8,902 | ||||||
The following table provides a summary of the carrying value of intangible assets (in thousands):
As of March 31, | |||||||||||||||||||||||
2016 | 2015 | ||||||||||||||||||||||
Gross Amount | Accumulated Amortization | Net Amount | Gross Amount | Accumulated Amortization | Net Amount | ||||||||||||||||||
Purchased technology | $ | 178,292 | $ | (177,841 | ) | $ | 451 | $ | 179,992 | $ | (179,261 | ) | $ | 731 | |||||||||
Trademarks | 3,900 | (3,900 | ) | — | 3,900 | (3,900 | ) | — | |||||||||||||||
Customer lists | 64,701 | (64,701 | ) | — | 66,219 | (66,219 | ) | — | |||||||||||||||
$ | 246,893 | $ | (246,442 | ) | $ | 451 | $ | 250,111 | $ | (249,380 | ) | $ | 731 | ||||||||||
The total expected future amortization related to amortizable intangible assets is provided in the table below (in thousands):
Amortization | |||
Fiscal 2017 | $ | 175 | |
Fiscal 2018 | 138 | ||
Fiscal 2019 | 103 | ||
Fiscal 2020 | 35 | ||
Total as of March 31, 2016 | $ | 451 | |
We evaluate our amortizable intangible and other long-lived assets for impairment whenever indicators of impairment exist and concluded the carrying amount of our long-lived assets was recoverable and there was no impairment in fiscal 2016, 2015 and 2014. In fiscal 2016 and fiscal 2015, we retired $3.2 million and $9.8 million, respectively, of fully amortized intangible assets related to prior acquisitions.
64
Goodwill
The following provides a summary of activity relating to the carrying value of goodwill (in thousands):
Goodwill | Accumulated Impairment Losses | Net Amount | |||||||||
Balance as of March 31, 2015 and March 31, 2014 | $ | 394,613 | $ | (339,000 | ) | $ | 55,613 | ||||
Impairment charges | — | (55,613 | ) | (55,613 | ) | ||||||
Balance as of March 31, 2016 | $ | 394,613 | $ | (394,613 | ) | $ | — | ||||
We evaluate goodwill for impairment annually during the fourth quarter of our fiscal year, or more frequently when indicators of impairment exist. Because we have negative book value, we perform a qualitative analysis to determine whether it is more likely than not that the fair value of goodwill is less than its carrying amount. During the fourth quarter of fiscal 2016, our stock price dropped to a low closing price of $0.44 per share, down from $0.93 per share at December 31, 2015. As a result, during the fourth quarter of fiscal 2016 we determined it was more likely than not that the fair value of our goodwill is less than its carrying amount and performed a second step to quantify the amount of goodwill impairment.
We determined the fair value of our single reporting unit using the income approach derived from a discounted cash flow methodology and other valuation techniques, as well as necessary estimates and assumptions about the future to determine fair value. We allocated the fair value of our single reporting unit to all tangible and intangible assets and liabilities in a hypothetical sale transaction to determine the implied fair value of our goodwill. After performing our analysis, we determined our goodwill was impaired and recorded an impairment charge of $55.6 million in fiscal 2016.
Inherent in the development of our cash flow projections using the income approach are assumptions and estimates derived from a review of our operating results, approved business plans, expected growth, cost of capital and income tax rates. We also made certain assumptions about future economic conditions, applicable interest rates and other market data. Many of the factors used in assessing fair value are outside of our control. Future period results could differ from these estimates and assumptions, which could materially affect the determination of fair value of the company and future amounts of potential impairment. The following significant assumptions were used to determine fair value under the income approach: expected future revenue growth; operating profit margins; working capital levels; asset lives used to generate future cash flows; a discount rate; a terminal value multiple; an income tax rate; and utilization of net operating loss carryforwards.
Our annual impairment evaluation for goodwill in the fourth quarters of fiscal 2015 and 2014 did not indicate any impairment of our goodwill in fiscal 2015 and 2014.
NOTE 6: ACCRUED WARRANTY
The following table details the change in the accrued warranty balance (in thousands):
For the year ended March 31, | |||||||
2016 | 2015 | ||||||
Beginning balance | $ | 4,219 | $ | 6,116 | |||
Additional warranties issued | 6,139 | 6,146 | |||||
Adjustments for warranties issued in prior fiscal years | 666 | (185 | ) | ||||
Settlements | (7,594 | ) | (7,858 | ) | |||
Ending balance | $ | 3,430 | $ | 4,219 | |||
We warrant our products against certain defects for one to three years. A provision for estimated future costs and estimated returns for repair or replacement relating to warranty is recorded when products are shipped and revenue recognized. Our estimate of future costs to satisfy warranty obligations is primarily based on historical trends and, if believed to be significantly different from historical trends, estimates of future failure rates and future costs of repair. Future costs of repair include materials consumed in the repair, labor and overhead amounts necessary to perform the repair. If we determine in a future period that either actual failure rates or actual costs of repair were to differ from our estimates, we record the impact of those differences in that future period.
65
NOTE 7: DEBT
Convertible Subordinated Debt
4.50% Notes
On October 31, 2012, we issued $60 million aggregate principal amount of 4.50% convertible subordinated notes due November 15, 2017, and on November 6, 2012 we issued an additional $10 million aggregate principal amount of 4.50% convertible subordinated notes due November 15, 2017 pursuant to an over-allotment provision (“4.50% notes”). These notes are convertible into shares of our common stock at a conversion rate of 607.1645 shares per $1,000 principal amount, a conversion price of approximately $1.65 per share. We may not redeem the notes prior to their maturity date although investors may convert the 4.50% notes into Quantum common stock until November 14, 2017 at their option. In addition, since purchasers are qualified institutional investors, as defined in Rule 144A under the Securities Act of 1933 (“Securities Act”), the 4.50% notes have not been registered under the Securities Act. We pay 4.50% interest per annum on the principal amount of the 4.50% notes semi-annually on May 15 and November 15 of each year beginning in May 2013. The terms of the 4.50% notes are governed by an agreement dated October 31, 2012 between Quantum and U.S. Bank National Association. The 4.50% notes are subordinated to any existing indebtedness and other liabilities. We incurred and capitalized $2.3 million of fees for the 4.50% notes which are included in convertible subordinated debt, long-term in our Consolidated Balance Sheets as a direct deduction of the carrying amount of the 4.50% notes as of March 31, 2016 and 2015. These fees are amortized to interest expense over the term of the notes.
3.50% Notes
On November 15, 2010, we issued $135 million aggregate principal amount of 3.50% convertible subordinated notes due November 15, 2015 with a conversion price of $4.33 per share of our common stock (“3.50% notes”). We incurred and capitalized $5 million of loan fees in fiscal 2011 for the 3.50% notes which were included in convertible subordinated debt, short-term in our Consolidated Balance Sheets as a direct deduction of the carrying amount of the 3.50% notes as of March 31, 2015. These fees were amortized to interest expense over the term of the notes.
On March 11, 2014, we entered into a private transaction with a note holder to purchase $1.3 million of aggregate principal amount of notes for $1.3 million. On January 28, 2015, we entered into a private transaction with a note holder to purchase $50 million of aggregate principal amount for $51 million. In connection with this transaction, we recorded a loss on debt extinguishment of $1.3 million comprised of the loss of $1 million from the notes purchased and a write-off of $0.3 million of unamortized debt issuance costs related to the purchased notes. We also paid accrued interest on the purchased notes of $0.4 million. We funded these transactions using cash on hand.
On October 5, 2015, we entered into a private transaction with a note holder to purchase $81.0 million of aggregate principal amount for $82.4 million, which included $1.1 million of accrued interest. In connection with this transaction, we recorded a loss on debt extinguishment of $0.4 million comprised of a loss of $0.3 million from the notes purchased and $0.1 million of unamortized debt issuance costs related to the purchased notes. We used a combination of $66.1 million of proceeds from our credit agreement with Wells Fargo and $16.3 million of cash to fund the purchase and pay the accrued interest. On November 15, 2015, we purchased the remaining $2.8 million of the 3.50% notes and funded this payment using proceeds from the credit agreement with Wells Fargo.
Wells Fargo Credit Agreement
On March 29, 2012, we refinanced a secured credit agreement with Credit Suisse by entering into a senior secured credit agreement (“WF credit agreement”) with Wells Fargo Capital Finance, LLC. We incurred and capitalized $1.0 million of fees related to the WF credit agreement which are included in other long-term assets in our Consolidated Balance Sheets. These fees are being amortized to interest expense over the term of the WF credit agreement in the Consolidated Statements of Operations.
On April 24, 2014, the WF credit agreement was amended to allow us to use proceeds from the credit agreement to repay the convertible subordinated notes so long as we have a fixed charge coverage ratio of 1.5 and liquidity of $25 million. The amendment also impacted the available line, maturity date and certain covenants and compliance obligations which are reflected below. In addition, there were amendments in fiscal 2013 and fiscal 2014, including an amendment to allow the assignment of one third of the total revolver commitment to Silicon Valley Bank and other conforming and related modifications.
On August 7, 2015, the WF credit agreement was amended to modify the maturity date, increase the amount of foreign accounts receivable and intellectual property assets included in our borrowing base and add an additional liquidity covenant.
66
On April 15, 2016, the WF credit agreement was amended to modify the maturity date, increase the excess availability requirement over time and reduce the maximum amount of intellectual property assets that may be included in the borrowing base over time.
Under the WF credit agreement, as amended, we have the ability to borrow the lesser of $75 million or the amount of the monthly borrowing base under a senior secured revolving credit facility, which matures August 10, 2017. As of March 31, 2016, we had a $65.7 million outstanding balance on the line of credit at a weighted average interest rate of 3.18%. In addition, we have letters of credit totaling $1.0 million, reducing the amount available to borrow to $8.3 million at March 31, 2016. Quarterly, we are required to pay a .375% commitment fee on undrawn amounts under the revolving credit facility.
There is a blanket lien on all of our assets under the WF credit agreement in addition to certain financial and reporting covenants.
The interest rate on amounts borrowed is based on an election by us of an annual rate equal to (1) a base rate established by Wells Fargo plus an applicable margin of 1.0% to 1.5%, based on availability levels under the WF credit agreement or (2) the LIBOR rate plus an applicable margin ranging from 2.0% and 2.5%, based on availability levels under the WF credit agreement. The base rate is defined in the WF credit agreement.
The WF credit agreement contains financial covenants and customary events of default for such securities, including cross-payment default and cross-acceleration to other material indebtedness for borrowed money which require notice from the trustee or holders of at least 25% of the notes and are subject to a cure period upon receipt of such notice. Average liquidity must exceed $15 million each month, and at all times we must maintain minimum liquidity of $10 million, at least $5 million of which must be excess availability under the WF revolving credit facility. The excess availability requirement increases by $1.5 million on June 1, 2016, and on the first day of each September, December, March and June occurring thereafter. The fixed charge coverage ratio is required to be greater than 1.2 for the 12 month period ending on the last day of any month in which the covenant is applicable. This covenant is applicable only in months in which borrowings exceed $5 million at any time during the month. To avoid triggering mandatory field audits and Wells Fargo controlling our cash receipts, we must maintain liquidity of at least $20 million at all times. The fixed charge coverage ratio, average liquidity, liquidity and excess availability are each defined in the WF credit agreement and/or amendments thereto. Certain schedules in the compliance certificate must be filed monthly if borrowings exceed $5 million; otherwise they are to be filed quarterly. As of March 31, 2016, and during fiscal 2016, we were in compliance with all covenants.
Debt Maturities
A summary of the scheduled maturities for our outstanding debt as of March 31, 2016 follows (in thousands):
Debt Maturity | |||
Fiscal 2017 | $ | 3,000 | |
Fiscal 2018 | 132,709 | ||
Total as of March 31, 2016 | $ | 135,709 | |
NOTE 8: RESTRUCTURING CHARGES
Fiscal 2016 Restructuring Plan
In November 2015, we approved a plan ("Fiscal 2016 Restructuring Plan") to eliminate approximately 65 positions in the U.S. and internationally, primarily in research and development and sales and marketing functions, in order to improve our cost structure and align spending with continuing operations plans. The costs associated with these actions consist of restructuring charges related to severance and benefits. We incurred aggregate restructuring charges of approximately $2.0 million under this plan, of which $1.7 million was paid. The ending balance for accrued restructuring charges for the Fiscal 2016 Restructuring Plan is $0.3 million as of March 31, 2016, which is expected to be paid by the second quarter of fiscal 2017.
The following summarizes the type of restructuring expense for fiscal 2016, 2015 and 2014 (in thousands):
For the year ended March 31, | |||||||||||
2016 | 2015 | 2014 | |||||||||
Restructuring expense related to cost of revenue | $ | — | $ | — | $ | 539 | |||||
Restructuring expense in operating expense | 4,006 | 1,666 | 10,675 | ||||||||
$ | 4,006 | $ | 1,666 | $ | 11,214 | ||||||
67
For the year ended March 31, | |||||||||||
2016 | 2015 | 2014 | |||||||||
Severance and benefits | $ | 2,293 | $ | 406 | $ | 6,139 | |||||
Facilities | 1,713 | 1,250 | 4,303 | ||||||||
Other | — | 10 | 772 | ||||||||
$ | 4,006 | $ | 1,666 | $ | 11,214 | ||||||
Fiscal 2016
Restructuring charges in fiscal 2016 were largely due to $2.3 million of severance and benefits costs primarily from the Fiscal 2016 Restructuring Plan. Additionally, we incurred $1.7 million of restructuring charges related to facilities costs primarily due to a change in estimate of sublease timing for our facilities previously used in manufacturing.
Fiscal 2015
Restructuring charges in fiscal 2015 were primarily due to facilities costs of $1.3 million as a result of further consolidating our facilities in the U.S.
Fiscal 2014
Restructuring charges in fiscal 2014 were primarily due to strategic management decisions to outsource our manufacturing operations and further consolidate repair and service activities, inclusive of exiting manufacturing facilities. In addition, we had additional consolidation in research and development, sales and marketing and administrative activities and teams to align our workforce with our continuing operations plans. Severance and benefits charges of $6.1 million in fiscal 2014 were attributable to positions eliminated worldwide, with the majority of positions eliminated in the U.S. Facility restructuring charges of $4.3 million in fiscal 2014 were primarily due to accruing the remaining lease obligation for the vacated portion of our manufacturing facility in the U.S, reduced by estimated future sublease amounts. Other restructuring charges of $0.8 million were primarily due to charges related to cost of sales as a result of our manufacturing outsource decision.
The following tables show the activity and the estimated timing of future payouts for accrued restructuring (in thousands):
Severance and benefits | Facilities | Other | Total | ||||||||||||
Balance as of March 31, 2013 | $ | 2,711 | $ | 2,045 | $ | — | $ | 4,756 | |||||||
Restructuring costs | 7,522 | 4,392 | 772 | 12,686 | |||||||||||
Adjustments of prior estimates | (1,383 | ) | (89 | ) | — | (1,472 | ) | ||||||||
Cash payments | (7,276 | ) | (607 | ) | (702 | ) | (8,585 | ) | |||||||
Other non-cash | — | 983 | — | 983 | |||||||||||
Balance as of March 31, 2014 | 1,574 | 6,724 | 70 | 8,368 | |||||||||||
Restructuring costs | 749 | 1,680 | 13 | 2,442 | |||||||||||
Adjustments of prior estimates | (343 | ) | (430 | ) | (3 | ) | (776 | ) | |||||||
Cash payments | (1,791 | ) | (3,617 | ) | (80 | ) | (5,488 | ) | |||||||
Other non-cash | — | 300 | — | 300 | |||||||||||
Balance as of March 31, 2015 | 189 | 4,657 | — | 4,846 | |||||||||||
Restructuring costs | 2,266 | 656 | — | 2,922 | |||||||||||
Adjustments of prior estimates | 27 | 1,057 | — | 1,084 | |||||||||||
Cash payments | (2,128 | ) | (4,087 | ) | — | (6,215 | ) | ||||||||
Other non-cash | — | 100 | — | 100 | |||||||||||
Balance as of March 31, 2016 | $ | 354 | $ | 2,383 | $ | — | $ | 2,737 | |||||||
68
Estimated timing of future payouts: | Severance and benefits | Facilities | Total | ||||||||
Fiscal 2017 | $ | 220 | $ | 1,401 | $ | 1,621 | |||||
Fiscal 2018 to 2022 | 134 | 982 | 1,116 | ||||||||
$ | 354 | $ | 2,383 | $ | 2,737 | ||||||
Facility restructuring accruals will be paid in accordance with the respective facility lease terms and amounts above are net of estimated sublease amounts.
NOTE 9: STOCK INCENTIVE PLANS AND SHARE-BASED COMPENSATION
Description of Stock Incentive Plans
2012 Long-Term Incentive Plan
We have a stockholder approved 2012 Long-Term Incentive Plan (the “Plan”) which had 39.3 million shares authorized at March 31, 2016. There were 21.9 million shares available for grant and 15.2 million stock options and restricted shares that were outstanding under the Plan as of March 31, 2016, which expire at various times through April 2018.
Stock options under the Plan are granted at prices determined by the Board of Directors, but at not less than the fair market value. The majority of restricted stock units granted to employees vest over three to four years. Stock option and restricted stock grants to nonemployee directors typically vest over one year. Both stock options and restricted stock units granted under the Plan are subject to forfeiture if employment terminates.
Other Stock Incentive Plans
In addition to the Plan, we have other stock incentive plans which are inactive for future share grant purposes, including plans assumed in acquisitions, under which stock options, stock appreciation rights, stock purchase rights, restricted stock awards and long-term performance awards to employees, consultants, officers and affiliates were authorized (“Other Plans”).
Stock options granted and assumed under the Other Plans generally vest over one to four years and expire seven to ten years after the grant date, and restricted stock granted under the Other Plans generally vests over one to four years. The Other Plans have been terminated, and outstanding stock options and restricted stock units granted and assumed remain outstanding and continue to be governed by the terms and conditions of the respective Other Plan. Stock options and restricted stock granted under the Other Plans are subject to forfeiture if employment terminates. Stock options under the Other Plans were granted at prices determined by the Board of Directors, but at not less than the fair market value, and stock options assumed were governed by the respective acquisition agreement. Stock options under the Other Plans expire at various times through June 2021.
Stock Purchase Plan
We have an employee stock purchase plan (the “Purchase Plan”) that allows for the purchase of stock at a 15% discount to fair market value at the date of grant or the exercise date, whichever value is less. The Purchase Plan is qualified under Section 423 of the Internal Revenue Code. The maximum number of shares that may be issued under the Purchase Plan is 64.3 million shares. As of March 31, 2016, 62.0 million shares had been issued. Under the Purchase Plan, rights to purchase shares are granted during the second and fourth quarter of each fiscal year. The Purchase Plan allows a maximum amount of 2.0 million shares to be purchased in any six month offering period. Employees purchased 3.3 million shares, 2.8 million shares and 3.2 million shares of common stock under the Purchase Plan in fiscal 2016, 2015 and 2014, respectively. The weighted-average price of stock purchased under the Purchase Plan was $0.67, $1.04 and $1.07 in fiscal 2016, 2015 and 2014, respectively. There were 2.3 million shares available for issuance as of March 31, 2016.
69
Determining Fair Value
We use the Black-Scholes stock option valuation model for estimating fair value of stock options granted under our plans and rights to acquire stock granted under our Purchase Plan. We amortize the fair value of stock options on a ratable basis over the requisite service periods, which are generally the vesting periods. The expected life of awards granted represents the period of time that they are expected to be outstanding. We determine the expected life based on historical experience with similar awards, giving consideration to the contractual terms, exercise patterns and post-vesting forfeitures. We estimate volatility based on the historical volatility of our common stock over the most recent period corresponding with the estimated expected life of the award. We base the risk-free interest rate used in the Black-Scholes stock option valuation model on the implied yield currently available on U.S. Treasury zero-coupon issues with an equivalent term equal to the expected life of the award. We have not paid any cash dividends on our common stock and do not anticipate paying any cash dividends in the foreseeable future. We use historical data to estimate forfeitures and record share-based compensation for those awards that are expected to vest. We adjust share-based compensation for actual forfeitures.
We granted 0.8 million RSUs with market conditions (“market RSUs”) in fiscal 2014 and estimated the fair value of these market RSUs using a Monte Carlo simulation model. The number of market RSUs is dependent on Quantum’s common stock achieving certain 60-day average stock price targets as of specified dates, which vest immediately to two years after the specified dates. The Monte Carlo model requires the input of assumptions including expected volatility, risk-free interest rate and expected term in order to simulate a large number of possible outcomes to provide an estimated fair value of the market RSUs. We used an expected volatility of 66%, a risk free interest rate of 0.5% and expected terms of ten months, 22 months and 34 months that mirrors the various vesting dates of the awards. The estimated grant date fair value of the market RSUs was $0.7 million which is being recognized over the respective vesting periods of the awards.
We granted 1.5 million, 2.4 million and 0.2 million of RSUs with performance conditions (“performance RSUs”) in fiscal 2016, 2015 and 2014, respectively, and the fair values of the performance RSUs at the grant date were $2.6 million, $3.0 million and $0.2 million, respectively. Performance RSUs become eligible for vesting based on Quantum achieving certain revenue and operating income targets through the end of the fiscal year when the performance RSUs were granted. Share-based compensation expense for performance RSUs is recognized when it is probable that the performance conditions will be achieved. The revenue and operating income targets of the fiscal 2015 performance RSUs were achieved and $0.3 million and $0.4 million of share-based compensation expense were recognized during fiscal 2016 and 2015, respectively. The performance RSUs granted in fiscal 2016 and 2014 were canceled in accordance with the grant agreement as the fiscal 2016 and 2014 targets were not met; and, therefore no share-based compensation expense was recognized.
Stock Options
No stock options were granted in fiscal 2016, 2015 or 2014.
Restricted Stock
The fair value of our restricted stock is the intrinsic value as of the grant date.
Stock Purchase Plan
The weighted-average fair values and the assumptions used in calculating fair values during each fiscal period are as follows:
For the year ended March 31, | |||||||||||
2016 | 2015 | 2014 | |||||||||
Option life (in years) | 0.5 | 0.5 | 0.5 | ||||||||
Risk-free interest rate | 0.26 | % | 0.07 | % | 0.07 | % | |||||
Stock price volatility | 77.94 | % | 36.58 | % | 43.71 | % | |||||
Weighted-average grant date fair value | $ | 0.29 | $ | 0.36 | $ | 0.40 | |||||
70
Share-Based Compensation Expense
The following tables summarize share-based compensation expense (in thousands):
For the year ended March 31, | |||||||||||
2016 | 2015 | 2014 | |||||||||
Share-based compensation expense: | |||||||||||
Cost of revenue | $ | 1,241 | $ | 1,489 | $ | 1,963 | |||||
Research and development | 1,864 | 2,559 | 3,430 | ||||||||
Sales and marketing | 2,907 | 3,506 | 4,097 | ||||||||
General and administrative | 2,904 | 4,029 | 3,969 | ||||||||
Total share-based compensation expense | $ | 8,916 | $ | 11,583 | $ | 13,459 | |||||
For the year ended March 31, | |||||||||||
2016 | 2015 | 2014 | |||||||||
Share-based compensation by type of award: | |||||||||||
Stock options | $ | 2 | $ | 617 | $ | 826 | |||||
Restricted stock | 8,220 | 10,102 | 11,356 | ||||||||
Stock purchase plan | 694 | 864 | 1,277 | ||||||||
Total share-based compensation expense | $ | 8,916 | $ | 11,583 | $ | 13,459 | |||||
The total share-based compensation cost capitalized as part of inventory as of March 31, 2016 and 2015 was not material. During fiscal 2016, 2015 and 2014, no tax benefit was realized for the tax deduction from stock option exercises and other awards due to tax benefit carryforwards and tax ordering requirements.
As of March 31, 2016, there was no unrecognized compensation cost related to stock options granted under our plans. Total intrinsic value of stock options exercised for the years ended March 31, 2016, 2015 and 2014 was $0.3 million, $0.4 million and $0.4 million, respectively. We settle stock option exercises by issuing additional common shares.
As of March 31, 2016, there was $10.0 million of total unrecognized compensation cost related to nonvested restricted stock. The unrecognized compensation cost for restricted stock is expected to be recognized over a weighted-average period of 1.75 years. Total fair value of awards vested during the years ended March 31, 2016, 2015 and 2014 was $9.9 million, $7.7 million and $6.2 million, respectively, based on the fair value of our common stock on the award's vest date. We issue additional common shares upon vesting of restricted stock units.
Stock Activity
Stock Options
A summary of activity relating to all of our stock option plans is as follows (stock options and intrinsic value in thousands):
Stock Options | Weighted- Average Exercise Price | Weighted- Average Remaining Contractual Term | Aggregate Intrinsic Value | |||||||||
Outstanding as of March 31, 2015 | 4,944 | $ | 1.47 | |||||||||
Exercised | (294 | ) | 1.01 | |||||||||
Forfeited | (323 | ) | 1.00 | |||||||||
Expired | (196 | ) | 1.69 | |||||||||
Outstanding as of March 31, 2016 | 4,131 | $ | 1.52 | 0.84 | $ | 1,646 | ||||||
Vested and expected to vest at March 31, 2016 | 4,131 | $ | 1.52 | 0.84 | $ | 1,646 | ||||||
Exercisable as of March 31, 2016 | 4,131 | $ | 1.52 | 0.84 | $ | 1,646 | ||||||
71
The following table summarizes information about stock options outstanding and exercisable as of March 31, 2016 (stock options in thousands):
Range of Exercise Prices | Stock Options Outstanding | Weighted- Average Exercise Price | Weighted- Average Remaining Contractual Life (Years) | Stock Options Exercisable | Weighted- Average Exercise Price | |||||||||||||||
$0.63 | — | $0.92 | 40 | $ | 0.72 | 3.54 | 40 | $ | 0.72 | |||||||||||
$0.98 | — | $1.23 | 2,651 | 0.99 | 0.24 | 2,651 | 0.99 | |||||||||||||
$1.85 | — | $2.59 | 1,419 | 2.52 | 1.91 | 1,419 | 2.52 | |||||||||||||
$2.90 | — | $2.93 | 21 | 2.91 | 0.94 | 21 | 2.91 | |||||||||||||
4,131 | 4,131 | |||||||||||||||||||
Expiration dates ranged from April 2016 to June 2021 for stock options outstanding at March 31, 2016. Prices for stock options exercised during the three-year period ended March 31, 2016, ranged from $0.11 to $1.81.
Restricted Stock
A summary of activity relating to our restricted stock follows (shares in thousands):
Shares | Weighted-Average Grant Date Fair Value | |||||
Nonvested as March 31, 2015 | 13,791 | $ | 1.34 | |||
Granted | 6,854 | 1.61 | ||||
Vested | (6,426 | ) | 1.43 | |||
Forfeited | (3,110 | ) | 1.54 | |||
Nonvested as March 31, 2016 | 11,109 | $ | 1.39 | |||
NOTE 10: 401K PLAN
Substantially all of the U.S. employees are eligible to make contributions to our 401(k) savings and investment plan. We typically make discretionary contributions to the plan by matching a percentage of our employees’ contributions. Employer contributions were $0.6 million, $2.4 million and $2.6 million in fiscal 2016, 2015 and 2014, respectively.
NOTE 11: INCOME TAXES
Pre-tax income (loss) reflected in the Consolidated Statements of Operations for the years ended March 31, 2016, 2015 and 2014 follows (in thousands):
For the year ended March 31, | |||||||||||
2016 | 2015 | 2014 | |||||||||
U.S | $ | (77,245 | ) | $ | 13,507 | $ | (22,549 | ) | |||
Foreign | 3,745 | 3,971 | 2,292 | ||||||||
$ | (73,500 | ) | $ | 17,478 | $ | (20,257 | ) | ||||
72
Income tax provision consists of the following (in thousands):
For the year ended March 31, | |||||||||||
2016 | 2015 | 2014 | |||||||||
Federal: | $ | (401 | ) | $ | (138 | ) | $ | — | |||
State: | |||||||||||
Current | 52 | 125 | 76 | ||||||||
Foreign: | |||||||||||
Current | 1,591 | 890 | 1,096 | ||||||||
Deferred | (59 | ) | (159 | ) | 45 | ||||||
Total foreign | 1,532 | 731 | 1,141 | ||||||||
Income tax provision | $ | 1,183 | $ | 718 | $ | 1,217 | |||||
The income tax provision differs from the amount computed by applying the federal statutory rate of 35% to income (loss) before income taxes as follows (in thousands):
For the year ended March 31, | |||||||||||
2016 | 2015 | 2014 | |||||||||
Expense (benefit) at federal statutory rate | $ | (25,725 | ) | $ | 6,117 | $ | (7,090 | ) | |||
State taxes | 53 | 125 | 76 | ||||||||
Unbenefited (benefited) losses and credits | 27,035 | (4,727 | ) | 7,974 | |||||||
Contingent tax reserves | 108 | 103 | 460 | ||||||||
Foreign rate differential | (347 | ) | (778 | ) | (218 | ) | |||||
Other | 59 | (122 | ) | 15 | |||||||
$ | 1,183 | $ | 718 | $ | 1,217 | ||||||
73
Significant components of deferred tax assets and liabilities are as follows (in thousands):
As of March 31, | |||||||
2016 | 2015 | ||||||
Deferred tax assets: | |||||||
Inventory valuation method | $ | 2,025 | $ | 1,588 | |||
Accrued warranty expense | 1,320 | 1,624 | |||||
Distribution reserves | 3,898 | 4,283 | |||||
Loss carryforwards | 108,022 | 75,262 | |||||
Tax credits | 132,061 | 185,578 | |||||
Restructuring charge accruals | 1,054 | 1,866 | |||||
Other accruals and reserves not currently deductible for tax purposes | 28,656 | 34,490 | |||||
277,036 | 304,691 | ||||||
Less valuation allowance | (224,138 | ) | (252,475 | ) | |||
Deferred tax asset | $ | 52,898 | $ | 52,216 | |||
Deferred tax liabilities: | |||||||
Depreciation | $ | (3,962 | ) | $ | (4,302 | ) | |
Acquired intangibles | (8,244 | ) | (4,920 | ) | |||
Tax on unremitted foreign earnings | (16,549 | ) | (15,968 | ) | |||
Other | (23,123 | ) | (26,093 | ) | |||
Deferred tax liability | $ | (51,878 | ) | $ | (51,283 | ) | |
Net deferred tax asset | $ | 1,020 | $ | 933 | |||
The valuation allowance decreased $28.3 million, $8.9 million and $8.0 million in fiscal years 2016, 2015 and 2014, respectively. The decrease in the valuation allowance during fiscal year 2016 was primarily due to NOL usage and expiring tax credits.
A reconciliation of the gross unrecognized tax benefits follows (in thousands):
For the year ended March 31, | |||||||||||
2016 | 2015 | 2014 | |||||||||
Beginning balance | $ | 32,449 | $ | 32,449 | $ | 32,549 | |||||
Settlement and effective settlements with tax authorities and related remeasurements | — | — | (488 | ) | |||||||
Increase in balances related to tax positions taken in prior period | 411 | — | 388 | ||||||||
Ending balance | $ | 32,860 | $ | 32,449 | $ | 32,449 | |||||
During fiscal 2016, excluding interest and penalties, there was a $0.4 million change in our unrecognized tax benefits. Including interest and penalties, the total unrecognized tax benefit at March 31, 2016 was $34.1 million, all of which, if recognized, would favorably affect the effective tax rate. At March 31, 2016, accrued interest and penalties totaled $1.2 million. Our practice is to recognize interest and penalties related to income tax matters in income tax provision in the Consolidated Statements of Operations. Unrecognized tax benefits, including interest and penalties, were recorded in other long-term liabilities in the Consolidated Balance Sheets.
We file our tax returns as prescribed by the laws of the jurisdictions in which we operate. Our U.S. tax returns have been audited for years through 2002 by the Internal Revenue Service. In other major jurisdictions, we are generally open to examination for the most recent three to five fiscal years. Although timing of the resolution and closure on audits is highly uncertain, we do not believe it is likely that the unrecognized tax benefits would materially change in the next 12 months.
74
As of March 31, 2016, we had federal net operating loss and tax credit carryforwards of approximately $351.1 million and $90.4 million, respectively. Our federal net operating loss carryforwards include $34.3 million attributable to excess tax deductions from stock option exercises, and are not included in the deferred tax assets shown above. The benefit of these loss carryforwards will be credited to equity when realized. The net operating loss and tax credit carryforwards expire in varying amounts beginning in fiscal 2017 if not previously utilized, the utilization of which is limited under the tax law ownership change provision. These carryforwards include $11.1 million of acquired net operating losses and $10.7 million of credits.
Certain changes in stock ownership could result in a limitation on the amount of net operating loss and tax credit carryovers that can be utilized each year. Should the company undergo such a change in stock ownership, it could severely limit the usage of these carryover tax attributes against future income, resulting in additional tax charges.
Due to our history of net losses and the difficulty in predicting future results, we believe that we cannot rely on projections of future taxable income to realize the deferred tax assets. Accordingly, we have established a full valuation allowance against our U.S. net deferred tax assets. Significant management judgment is required in determining our deferred tax assets and liabilities and valuation allowances for purposes of assessing our ability to realize any future benefit from our net deferred tax assets. We intend to maintain this valuation allowance until sufficient positive evidence exists to support the reversal of the valuation allowance. Our income tax expense recorded in the future will be reduced to the extent that sufficient positive evidence materializes to support a reversal of, or decrease in, our valuation allowance.
NOTE 12: NET INCOME (LOSS) PER SHARE
Equity Instruments Outstanding
We have stock options and restricted stock units granted under various stock incentive plans that, upon exercise and vesting, respectively, would increase shares outstanding. We have 4.50% convertible subordinated notes which are convertible at the option of the holders at any time prior to maturity into shares of Quantum common stock at a conversion price of $1.65 per share. We also had 3.50% convertible subordinated notes outstanding as of March 31, 2015 and 2014, which were convertible at the option of the holders at any time prior to maturity into shares of Quantum common stock at a conversion price of $4.33 per share. Both the 4.50% and 3.50% notes, if converted, would increase shares outstanding.
In June 2009, we issued a warrant to EMC Corporation to purchase 10 million shares of our common stock at a $0.38 per share exercise price. Only in the event of a change of control of Quantum will this warrant vest and be exercisable. The warrant expires seven years from the date of issuance or three years after change of control, whichever occurs first. Due to these terms, no share-based compensation expense related to this warrant has been recorded to date.
Net Income (Loss) per Share
The following table sets forth the computation of basic and diluted net income (loss) per share (in thousands, except per-share data):
For the year ended March 31, | |||||||||||
2016 | 2015 | 2014 | |||||||||
Numerator: | |||||||||||
Net income (loss) | $ | (74,683 | ) | $ | 16,760 | $ | (21,474 | ) | |||
Denominator: | |||||||||||
Weighted average shares: | |||||||||||
Basic | 262,730 | 254,665 | 247,024 | ||||||||
Dilutive shares from stock plans | — | 5,362 | — | ||||||||
Diluted | 262,730 | 260,027 | 247,024 | ||||||||
Basic net income (loss) per share | $ | (0.28 | ) | $ | 0.07 | $ | (0.09 | ) | |||
Diluted net income (loss) per share | $ | (0.28 | ) | $ | 0.06 | $ | (0.09 | ) | |||
Dilutive and potentially dilutive common shares from stock incentive plans are determined by applying the treasury stock method to the assumed exercise of outstanding options and the assumed vesting of outstanding restricted stock units. The dilutive impact related to our convertible subordinated notes is determined by applying the if-converted method, which includes adding the related weighted average shares to the denominator and the related interest expense to net income.
75
The computations of diluted net income (loss) per share for the periods presented exclude the following because the effect would have been anti-dilutive:
• | For fiscal 2016, 2015 and 2014, there were 10.0 million, 29.0 million and 31.1 million, respectively, of weighted average shares related to the 3.50% convertible subordinated notes that were excluded. For fiscal 2016, 2015 and 2014, $1.8 million, $5.3 million and $5.7 million, respectively, of related interest expense was excluded. |
• | For fiscal 2016, 2015 and 2014, there were 42.5 million of weighted average shares and $3.6 million of related interest expense related to the 4.50% convertible subordinated notes that were excluded |
• | Stock options to purchase 4.5 million, 2.4 million and 12.8 million weighted average shares in fiscal 2016, 2015 and 2014, respectively, were excluded. |
• | Unvested restricted stock units of 12.1 million, less than 0.1 million, and 11.0 million weighted average shares for fiscal 2016, 2015 and 2014, respectively, were excluded. |
NOTE 13: COMMITMENTS AND CONTINGENCIES
Lease Commitments
We lease certain facilities under non-cancelable lease agreements and also have equipment leases for various types of office equipment. Some of the leases have renewal options ranging from one to ten years and others contain escalation clauses. These leases are operating leases.
In February 2006, we leased a campus facility in Colorado Springs, Colorado, comprised of three buildings in three separate operating leases with initial terms of five, seven and 15 years. In August 2010, we negotiated lower lease rates and a five year extension on one of the buildings. In March 2015, we entered into a sublease agreement to sublease a portion of one of the buildings. The future minimum lease payment schedule below includes $15.0 million of lease payments and $4.4 million of sublease rental income for this Colorado Springs campus.
Rent expense was $6.6 million in fiscal 2016, $7.0 million in fiscal 2015 and $10.3 million in fiscal 2014. Sublease income was $0.1 million for fiscal 2016 and immaterial in fiscal 2015 and 2014.
Future minimum lease payments and sublease rental income are as follows (in thousands):
Lease Payments | Sublease Rental Income | Total | |||||||||
For the year ending March 31, | |||||||||||
2017 | $ | 8,564 | $ | (971 | ) | $ | 7,593 | ||||
2018 | 7,961 | (966 | ) | 6,995 | |||||||
2019 | 7,163 | (909 | ) | 6,254 | |||||||
2020 | 5,558 | (943 | ) | 4,615 | |||||||
2021 | 4,937 | (812 | ) | 4,125 | |||||||
Thereafter | 2,156 | — | 2,156 | ||||||||
$ | 36,339 | $ | (4,601 | ) | $ | 31,738 | |||||
Commitments to Purchase Inventory
We use contract manufacturers for our manufacturing operations. Under these arrangements, the contract manufacturer procures inventory to manufacture products based upon our forecast of customer demand. We have similar arrangements with certain other suppliers. We are responsible for the financial impact on the supplier or contract manufacturer of any reduction or product mix shift in the forecast relative to materials that the third party had already purchased under a prior forecast. Such a variance in forecasted demand could require a cash payment for inventory in excess of current customer demand or for costs of excess or obsolete inventory. As of March 31, 2016, we had issued non-cancelable commitments for $42.2 million to purchase inventory from our contract manufacturers and suppliers.
76
Legal Proceedings
On February 18, 2014, Crossroads Systems, Inc. (“Crossroads”) filed a patent infringement lawsuit against Quantum in the U.S. District Court for the Western District of Texas, alleging infringement of U.S. patents 6,425,035 and 7,934,041. An amended complaint filed on April 15, 2014 also alleged infringement of U.S. patent 7,051,147. Crossroads asserts that we have incorporated Crossroads' patented technology into our StorNext QX and Q-Series lines of disk array products and into our Scalar libraries. Crossroads seeks unspecified monetary damages and injunctive relief. Crossroads has already dismissed all claims of infringement with respect to the StorNext QX and Q-Series products. In July and September of 2014, we filed for inter partes review of all three asserted Crossroads patents before the Patent Trial and Appeal Board and a review has been initiated for all claims. On June 16, 2015, the U.S. District Court, Western District of Texas stayed the Crossroads trial proceedings pending resolution of the inter partes review proceedings. On January 29, 2016, the Patent Trial and Appeal Board issued decisions on the inter partes reviews for U.S. patents 6,425,035 and 7,051,147, ordering all claims of both patents to be unpatentable. On March 17, 2016, the Patent Trial and Appeal Board issued a decision on the inter partes review for U.S. patent 7,934,041, ordering all claims to be unpatentable. On March 31, 2016, Crossroads filed Notices of Appeal in each of the inter partes review decisions. We believe the probability that this lawsuit will have a material adverse effect on our business, operating results or financial condition is remote.
On September 23, 2014, we filed a lawsuit against Crossroads in the U.S. District Court for the Northern District of California alleging patent infringement of our U.S. patent 6,766,412 by Crossroads' StrongBox VSeries Library Solution product. We are seeking injunctive relief and the recovery of monetary damages. On December 4, 2014, we amended our complaint alleging infringement of a second U.S. patent, 5,940,849, related to Crossroads' SPHiNX product line. On December 16, 2014, we withdrew the amended complaint alleging infringement of the second patent, 5,940,849. On November 23, 2015, we dismissed the lawsuit alleging patent infringement of U.S. patent 6,766,412 pursuant to a confidential settlement agreement.
On September 23, 2014, we filed a lawsuit against Crossroads in the U.S. District Court for the Northern District of California alleging patent infringement of our U.S. patent 6,766,412 by Crossroads' StrongBox VSeries Library Solution product. We are seeking injunctive relief and the recovery of monetary damages. On December 4, 2014, we amended our complaint alleging infringement of a second U.S. patent, 5,940,849, related to Crossroads' SPHiNX product line. On December 16, 2014, we withdrew the amended complaint alleging infringement of the second patent, 5,940,849. On November 23, 2015, we dismissed the lawsuit alleging patent infringement of U.S. patent 6,766,412 pursuant to a confidential settlement agreement.
Indemnifications
We have certain financial guarantees, both express and implied, related to product liability and potential infringement of intellectual property. Other than certain product liabilities recorded as of March 31, 2016 and 2015, we did not record a liability associated with these guarantees, as we have little or no history of costs associated with such indemnification requirements. Contingent liabilities associated with product liability may be mitigated by insurance coverage that we maintain.
In the normal course of business to facilitate transactions of our services and products, we indemnify certain parties with respect to certain matters. We have agreed to hold certain parties harmless against losses arising from a breach of representations or covenants, or out of intellectual property infringement or other claims made against certain parties. These agreements may limit the time within which an indemnification claim can be made and the amount of the claim. In addition, we have entered into indemnification agreements with our officers and directors, and our bylaws contain similar indemnification obligations to our agents.
It is not possible to determine the maximum potential amount under these indemnification agreements due to the limited history of our indemnification claims and the unique facts and circumstances involved in each particular agreement. Historically, payments made by us under these agreements have not had a material impact on our operating results, financial position or cash flows.
NOTE 14: GEOGRAPHIC INFORMATION
The company operates in one reportable segment.
Revenue, attributed to regions based on the location of customers, and long-lived assets, comprised of property and equipment, by region were as follows (in thousands):
As of and for the year ended March 31, | |||||||||||||||||||||||
2016 | 2015 | 2014 | |||||||||||||||||||||
Long- Lived Assets | Revenue | Long- Lived Assets | Revenue | Long-Lived Assets | Revenue | ||||||||||||||||||
Americas | $ | 12,657 | $ | 304,007 | $ | 14,063 | $ | 340,811 | $ | 16,759 | $ | 359,259 | |||||||||||
Europe | 145 | 124,821 | 421 | 152,186 | 524 | 143,508 | |||||||||||||||||
Asia Pacific | 137 | 47,130 | 169 | 60,098 | 291 | 50,398 | |||||||||||||||||
$ | 12,939 | $ | 475,958 | $ | 14,653 | $ | 553,095 | $ | 17,574 | $ | 553,165 | ||||||||||||
77
Revenue for Americas regions outside of the United States is immaterial. Following are revenues attributable to each of our product groups, services and royalties (in thousands):
For the year ended March 31, | |||||||||||
2016 | 2015 | 2014 | |||||||||
Tape automation systems | $ | 97,454 | $ | 152,205 | $ | 174,438 | |||||
Disk backup systems | 39,722 | 54,845 | 50,217 | ||||||||
Devices and media | 45,767 | 62,642 | 70,680 | ||||||||
Scale-out storage solutions | 103,274 | 85,887 | 52,983 | ||||||||
Service | 148,548 | 155,674 | 147,199 | ||||||||
Royalty | 41,193 | 41,842 | 57,648 | ||||||||
Total revenue | $ | 475,958 | $ | 553,095 | $ | 553,165 | |||||
NOTE 15: UNAUDITED QUARTERLY FINANCIAL DATA
For the year ended March 31, 2016 | |||||||||||||||
(In thousands, except per share data) | 1st Quarter | 2nd Quarter | 3rd Quarter | 4th Quarter | |||||||||||
Revenue | $ | 110,856 | $ | 117,025 | $ | 128,048 | $ | 120,029 | |||||||
Gross margin | 46,965 | 46,317 | 56,697 | 54,773 | |||||||||||
Net loss | (10,755 | ) | (11,227 | ) | (299 | ) | (52,402 | ) | |||||||
Basic and diluted net loss per share | (0.04 | ) | (0.04 | ) | (0.00) | (0.20 | ) | ||||||||
For the year ended March 31, 2015 | |||||||||||||||
1st Quarter | 2nd Quarter | 3rd Quarter | 4th Quarter | ||||||||||||
Revenue | $ | 128,128 | $ | 135,106 | $ | 142,063 | $ | 147,798 | |||||||
Gross margin | 55,526 | 61,929 | 65,067 | 62,164 | |||||||||||
Net income (loss) | (4,324 | ) | 1,248 | 6,931 | 12,905 | ||||||||||
Basic net income (loss) per share | (0.02 | ) | 0.00 | 0.03 | 0.05 | ||||||||||
Diluted net income (loss) per share | (0.02 | ) | 0.00 | 0.03 | 0.04 | ||||||||||
Net income for fiscal 2015 included a $13.6 million gain on the sale of our investment in a privately held company which was recorded in the fourth quarter of fiscal 2015. Net loss for fiscal 2016 included a $55.6 million goodwill impairment charge which was recorded in the fourth quarter of fiscal 2016.
78
SCHEDULE II
CONSOLIDATED VALUATION AND QUALIFYING ACCOUNTS
Allowance for doubtful accounts (in thousands):
Balance at beginning of period | Net additions (releases) charged to expense | Recoveries(Deductions) (i) | Balance at end of period | ||||||||||||
For the year ended: | |||||||||||||||
March 31, 2016 | $ | 27 | $ | (78 | ) | $ | 73 | $ | 22 | ||||||
March 31, 2015 | 88 | 40 | (101 | ) | 27 | ||||||||||
March 31, 2014 | 62 | (39 | ) | 65 | 88 | ||||||||||
____________________
(i) Uncollectible accounts written off, net of recoveries.
ITEM 9. | CHANGES IN AND DISAGREEMENTS WITH ACCOUNTANTS ON ACCOUNTING AND FINANCIAL DISCLOSURE |
None.
ITEM 9A. CONTROLS AND PROCEDURES
Attached as exhibits to this Annual Report on Form 10-K are certifications of our Chief Executive Officer (“CEO”) and Chief Financial Officer (“CFO”), which are required pursuant to Rule 13a-14 of the Securities Exchange Act of 1934, as amended (the “Exchange Act”). This “Controls and Procedures” section of this Annual Report on Form 10-K includes information concerning the controls and controls evaluation referenced in the certifications. This section of the Annual Report on Form 10-K should be read in conjunction with the certifications and the report of PricewaterhouseCoopers LLP as described below for a more complete understanding of the matters presented.
Evaluation of Disclosure Controls and Procedures
We evaluated the effectiveness of the design and operation of our disclosure controls and procedures as defined in Rules 13a-15(e) and 15d-15(e) under the Exchange Act as of the end of the period covered by this Annual Report on Form 10-K. This control evaluation was performed under the supervision and with the participation of management, including our CEO and CFO. Disclosure controls and procedures are designed to ensure that information required to be disclosed in our reports filed under the Exchange Act, such as this Annual Report on Form 10-K, is recorded, processed, summarized and reported within the time periods specified by the SEC. Disclosure controls are also designed to ensure that such information is accumulated and communicated to our management, including the CEO and CFO, as appropriate, to allow timely decisions regarding required disclosure.
Based on the controls evaluation, our CEO and CFO have concluded that as of the end of the period covered by this Annual Report on Form 10-K, our disclosure controls were effective.
Management's Report on Internal Control over Financial Reporting
Our management is responsible for establishing and maintaining adequate internal control over financial reporting, as such term is defined in Exchange Act Rules 13a-15(f) and 15d-15(f). Under the supervision and with the participation of our management, including our CEO and CFO, we conducted an evaluation of the effectiveness of our internal control over financial reporting as of March 31, 2016 based on the criteria for effective control over financial reporting described in Internal Control - Integrated Framework (2013) issued by the Committee of Sponsoring Organizations of the Treadway Commission (COSO). Based on the results of our evaluation, our management concluded that our internal control over financial reporting was effective as of March 31, 2016 to provide reasonable assurance regarding the reliability of financial reporting and preparation of financial statements for external reporting purposes in accordance with generally accepted accounting principles.
PricewaterhouseCoopers LLP, our independent registered public accounting firm, has issued an attestation report regarding its assessment of the Company’s internal control over financial reporting as of March 31, 2016, as set forth at the beginning of Part II, Item 8 "Financial Statements and Supplementary Data" of this Annual Report on Form 10-K.
79
Limitations on Effectiveness of Controls
Our management, including our CEO and CFO, does not expect that our disclosure controls or our internal control over financial reporting will prevent all errors and all fraud. A control system, no matter how well conceived and operated, can provide only reasonable, not absolute, assurance that the objectives of the control system are met. Further, the design of a control system must reflect the fact that there are resource constraints, and the benefits of controls must be considered relative to their costs. Because of the inherent limitations in all control systems, no evaluation of controls can provide absolute assurance that all control issues and instances of fraud, if any, within the Company have been detected. These inherent limitations include the realities that judgments in decision-making can be faulty, and that breakdowns can occur because of simple error or mistake. Additional controls can be circumvented by the individual acts of some persons, by collusion of two or more people, or by management override of the controls. The design of any system of controls also is based in part upon certain assumptions about the likelihood of future events, and there can be no assurance that any design will succeed in achieving its stated goals under all potential future conditions; over time, controls may become inadequate because of changes in conditions, or the degree of compliance with the policies or procedures may deteriorate. Because of the inherent limitations in a cost-effective control system, misstatements due to error or fraud may occur and not be detected.
Changes in Internal Controls over Financial Reporting
There was no change in our internal control over financial reporting during the fourth quarter of fiscal 2016 that has materially affected, or is reasonably likely to materially affect, our internal controls over financial reporting.
ITEM 9B. OTHER INFORMATION
None.
PART III
ITEM 10. DIRECTORS, EXECUTIVE OFFICERS AND CORPORATE GOVERNANCE
The information required by this item with respect to our directors, audit committee and audit committee financial expert is incorporated by reference to the information set forth in our proxy statement for the 2016 Annual Meeting of Stockholders to be filed with the Commission within 120 days after the end of our fiscal year ended March 31, 2016. For information pertaining to our executive officers, refer to the section captioned “Executive Officers & Management Team”, Item 1 "Business" of this Annual Report on Form 10-K.
We have adopted a code of ethics that applies to our principal executive officer and all members of our finance department, including the principal financial officer and principal accounting officer. This code of ethics is posted on our website. The Internet address for our website is: http://www.quantum.com, and the code of ethics may be found by clicking “About Us” from the home page and then choosing “Investor Relations” and then "Corporate Governance." Copies of the code are available free upon request by a stockholder.
We intend to satisfy the disclosure requirement under Item 5.05 of Form 8-K regarding an amendment to, or waiver from, a provision of this code of ethics by posting such information on our website, at the address and location specified above.
We have adopted Corporate Governance Principles, which are available on our website at http://www.quantum.com, where they may be found by clicking “About Us” from the home page and then choosing “Investor Relations” and then “Corporate Governance.” Copies of our Corporate Governance Principles are available free upon request by a stockholder. The charters of our Audit Committee, Leadership and Compensation Committee and Corporate Governance and Nominating Committee are also available on our website at http://www.quantum.com, where they may be found by clicking “About Us” from the home page and then choosing “Investor Relations” and then “Corporate Governance.” Copies of these committee charters are available free upon request by a stockholder.
ITEM 11. EXECUTIVE COMPENSATION
The information required by this item is incorporated by reference to the information set forth in our proxy statement for the 2016 Annual Meeting of Stockholders to be filed with the Commission within 120 days after the end of our fiscal year ended March 31, 2016.
80
ITEM 12. | SECURITY OWNERSHIP OF CERTAIN BENEFICIAL OWNERS AND MANAGEMENT AND RELATED STOCKHOLDER MATTERS |
The following discloses our equity compensation plan information (securities in thousands):
As of March 31, 2016 | |||||||||
(a) Number of securities to be issued upon exercise of outstanding stock options, warrants and rights | Weighted- average exercise price of outstanding stock options, warrants and rights | Number of securities remaining available for grant under equity compensation plans (excluding shares reflected in column (a)) | |||||||
Equity compensation plans approved by stockholders (1) | 15,220 | $ | 0.41 | 21,907 | |||||
Equity compensation plans not approved by stockholders (2) | 20 | $ | 0.63 | — | |||||
15,240 | $ | 0.41 | 21,907 | ||||||
____________________
(1) | Included in the stockholder approved plans are 11.1 million restricted stock units with a zero purchase price. The weighted average exercise price of outstanding stock options for stockholder approved plans is $1.53. |
(2) | The Pancetera 2008 Stock Incentive Compensation Plan was assumed by Quantum on June 13, 2011 according to the terms detailed in the Agreement and Plan of Merger dated June 13, 2011 (“Pancetera Merger Agreement”). Outstanding stock options and restricted shares granted under this plan continue to be governed by the terms and conditions of this plan; however, the number of stock options and restricted shares and exercise prices of the outstanding stock options were changed in accordance with the formula in the Pancetera Merger Agreement for the right to purchase Quantum common stock. |
We also have an employee stock purchase plan with 2.3 million shares available for issuance that has been approved by stockholders.
The remaining information required by this item is incorporated by reference to the information set forth in our proxy statement for the 2016 Annual Meeting of Stockholders to be filed with the Commission within 120 days after the end of our fiscal year ended March 31, 2016.
ITEM 13. | CERTAIN RELATIONSHIPS AND RELATED TRANSACTIONS, AND DIRECTOR INDEPENDENCE |
The information required by this item is incorporated by reference to the information set forth in our proxy statement for the 2016 Annual Meeting of Stockholders to be filed with the Commission within 120 days after the end of our fiscal year ended March 31, 2016.
ITEM 14. PRINCIPAL ACCOUNTING FEES AND SERVICES
The information required by this item is incorporated by reference to the information set forth in our proxy statement for the 2016 Annual Meeting of Stockholders to be filed with the Commission within 120 days after the end of our fiscal year ended March 31, 2016.
81
PART IV
ITEM 15. EXHIBITS, FINANCIAL STATEMENT SCHEDULES
Upon written request, we will provide, without charge, a copy of our Annual Report on Form 10-K, including the Consolidated Financial Statements, financial statement schedules and any exhibits for our most recent fiscal year. All requests should be sent to:
Investor Relations
Quantum Corporation
Brinlea Johnson or Allise Furlani
Investor Relations
The Blueshirt Group
(212) 331-8424 or (212) 331-8433
ir@quantum.com
(a) The following documents are filed as a part of this Report:
1. | Financial Statements—Our Consolidated Financial Statements are listed in the Index to Consolidated Financial Statements. |
2. | Financial Statement Schedules — Our consolidated valuation and qualifying accounts (Schedule II) financial statement schedule is listed in the Index to Consolidated Financial Statements. All other schedules have been omitted because the information required to be set forth therein is not applicable or is shown in the Consolidated Financial Statements or the notes hereto. |
(b) Exhibits
82
Incorporated by Reference | ||||||||||
Exhibit Number | Exhibit Description | Form | File No. | Exhibit(s) | Filing Date | |||||
2.1 | Agreement and Plan of Merger by and between Registrant, Pancetera Software, Inc., Quarry Acquisition Corporation and Henrik Rosendahl as the stockholder representative, dated June 13, 2011. | 10-Q | 001-13449 | 10.8 | August 9, 2011 | |||||
3.1 | Amended and Restated Certificate of Incorporation of Registrant. | 8-K | 001-13449 | 3.1 | August 16, 2007 | |||||
3.2 | Amended and Restated By-laws of Registrant, as amended. | 8-K | 001-13449 | 3.1 | December 5, 2008 | |||||
3.3 | Certificate of Designation of Rights, Preferences and Privileges of Series B Junior Participating Preferred Stock. | S-3 | 333-109587 | 4.7 | October 9, 2003 | |||||
3.4 | Certification of Amendment to the Bylaws of Quantum Corporation, as adopted on January 20, 2010. | 8-K | 001-13449 | 3.1 | January 26, 2010 | |||||
3.5 | Certification of Amendment to the Bylaws of Quantum Corporation, as adopted on February 3, 2016 | 8-K | 001-13449 | 3.1 | February 8, 2016 | |||||
4.1 | Indenture for 3.50% Convertible Senior Subordinated Notes due 2015, between the Registrant and U.S. Bank National Association, as trustee, dated November 15, 2010, including the form of 3.50% Convertible Senior Subordinated Note due 2015. | 8-K | 001-13449 | 4.1 | November 15, 2010 | |||||
4.2 | Indenture for 4.50% Convertible Senior Subordinated Notes due 2017, between the Registrant and U.S. Bank National Association, as trustee, dated October 31, 2012, including the form of 4.50% Convertible Senior Subordinated Note due 2017. | 8-K | 001-13449 | 4.1 | October 31, 2012 | |||||
10.1 | Form of Indemnification Agreement between Registrant and the Named Executive Officers and Directors. * | 8-K | 001-13449 | 10.4 | April 4, 2007 | |||||
10.2 | Form of Amended and Restated Change of Control Agreement between Registrant and each of Registrant’s Executive Officers.* | 10-Q | 001-13449 | 10.2 | November 6, 2015 | |||||
10.3 | Form of Amended and Restated Director Change of Control Agreement between Registrant and the Directors (Other than the Executive Chairman and the CEO). * | 8-K | 001-13449 | 10.2 | May 10, 2011 | |||||
10.4 | Quantum Corporation 2012 Long-Term Incentive Plan as amended.* | 8-K | 001-13449 | 10.1 | August 31, 2015 | |||||
10.5 | Form of Restricted Stock Unit Agreement (U.S. Employees), under the Quantum Corporation 2012 Long-Term Incentive Plan. * | 10-Q/A | 001-13449 | 10.2 | February 15, 2013 | |||||
10.6 | Form of Restricted Stock Unit Agreement (Non-U.S. Employees), under the Quantum Corporation 2012 Long-Term Incentive Plan. * | 10-Q/A | 001-13449 | 10.3 | February 15, 2013 | |||||
10.7 | Form of Restricted Stock Unit Agreement (Directors), under the Quantum Corporation 2012 Long-Term Incentive Plan. * | 10-Q/A | 001-13449 | 10.4 | February 15, 2013 | |||||
10.8 | Quantum Corporation Employee Stock Purchase Plan, as amended. * | 10-K | 001-13449 | 10.9 | June 12, 2015 | |||||
10.9 | Quantum Corporation Executive Officer Incentive Plan. * | 10-K | 001-13449 | 10.10 | June 12, 2015 | |||||
10.10 | Employment Offer Letter, dated March 31, 2011, between Registrant and Jon W. Gacek. * | 8-K | 001-13449 | 10.1 | April 5, 2011 | |||||
10.11 | Amendment to Employment Offer Letter between Registrant and Jon W. Gacek. * | 10-Q | 001-13449 | 10.1 | February 8, 2013 | |||||
10.12 | Employment Offer Letter, dated August 31, 2006, between Registrant and William C. Britts. * | 8-K | 001-13449 | 10.1 | September 7, 2006 | |||||
10.13 | Amendment to Employment Offer Letter between Registrant and William C. Britts. * | 10-Q | 001-13449 | 10.6 | November 7, 2008 | |||||
83
Incorporated by Reference | ||||||||||
Exhibit Number | Exhibit Description | Form | File No. | Exhibit(s) | Filing Date | |||||
10.14 | Amendment to Employment Offer Letter between Registrant and William C. Britts. * | 10-Q | 001-13449 | 10.3 | February 5, 2010 | |||||
10.15 | Offer Letter of Mr. David A. Krall, dated August 11, 2011. * | 8-K | 001-13449 | 10.1 | August 22, 2011 | |||||
10.16 | Offer Letter, dated May 2, 2011, between Registrant and David E. Roberson. * | 8-K | 001-13449 | 10.1 | May 10, 2011 | |||||
10.17 | Offer Letter, dated August 20, 2007, between Registrant and Paul Auvil. * | 8-K | 001-13449 | 10.1 | August 29, 2007 | |||||
10.18 | Offer Letter, dated August 7, 2013, between Registrant and Louis DiNardo.* | 10-Q | 001-13449 | 10.3 | November 12, 2013 | |||||
10.19 | Offer Letter, dated August 7, 2013, between Registrant and Gregg J. Powers.* | 10-Q | 001-13449 | 10.4 | November 12, 2013 | |||||
10.20 | Offer Letter, dated August 29, 2014, between Registrant and Dale L. Fuller.* | 10-K | 001-13449 | 10.23 | June 12, 2015 | |||||
10.21 | Offer Letter, dated May 1, 2015, between Registrant and Robert J. Andersen.* | 10-K | 001-13449 | 10.24 | June 12, 2015 | |||||
10.22 | Offer Letter, dated March 29, 2016, between Registrant and Clifford Press.* | 8-K | 001-13449 | 10.1 | April 5, 2016 | |||||
10.23 | Form of Agreement to Advance Legal Fees between the Registrant and certain of its Executive Officers.* | 10-K | 001-13449 | 10.25 | June 12, 2015 | |||||
10.24 | Credit Agreement, dated March 29, 2012, by and among the Registrant, Wells Fargo Capital Finance, LLC, as Administrative Agent, and the Lenders party thereto. | 10-K | 001-13449 | 10.22 | June 14, 2012 | |||||
10.25 | Security Agreement, dated March 29, 2012, among the Registrant and Wells Fargo Capital Finance, LLC. | 8-K | 001-13449 | 10.2 | April 2, 2012 | |||||
10.26 | First Amendment to Credit Agreement, dated June 28, 2012, among Registrant, the lenders identified therein, and Wells Fargo Capital Finance, LLC, as the administrative agent for the lenders. | 8-K | 001-13449 | 10.1 | June 28, 2012 | |||||
10.27 | Fourth Amendment to Credit Agreement and First Amendment to Security Agreement, dated January 31, 2013, among Registrant, the lenders identified therein, and Wells Fargo Capital Finance, LLC, as the administrative agent for the lenders. | 8-K | 001-13449 | 10.1 | February 6, 2013 | |||||
10.28 | Consent and Fifth Amendment to Credit Agreement, dated February 6, 2014, by and among Wells Fargo Capital Finance, LLC, as administrative agent, the lenders that are parties thereto, and Quantum Corporation | 8-K | 001-13449 | 10.1 | April 29, 2014 | |||||
10.29 | Sixth Amendment to Credit Agreement and Second Amendment to Security Agreement, dated April 24, 2014, by and among Wells Fargo Capital Finance, LLC, as administrative agent, the lenders that are parties thereto, and Quantum Corporation. | 8-K | 001-13449 | 10.2 | April 29, 2014 | |||||
84
Incorporated by Reference | ||||||||||
Exhibit Number | Exhibit Description | Form | File No. | Exhibit(s) | Filing Date | |||||
10.30 | Seventh Amendment to Credit Agreement, dated August 7, 2015, by and among Wells Fargo Capital Finance, LLC, as administrative agent, the lenders that are parties thereto, and Quantum Corporation | 8-K | 001-13449 | 10.1 | August 13, 2015 | |||||
10.31 | Eighth Amendment to Credit Agreement, dated November 13, 2015, by and among Wells Fargo Capital Finance, LLC, as administrative agent, the lenders that are parties thereto, and Quantum Corporation. ‡ | |||||||||
10.32 | Ninth Amendment to Credit Agreement, dated April 15, 2016, by and among Wells Fargo Capital Finance, LLC, as administrative agent, the lenders that are parties thereto, and Quantum Corporation. | 8-K | 001-13449 | 10.1 | April 18, 2016 | |||||
10.33 | Agreement for Purchase and Sale of Real Property, dated as November 18, 2005, among Registrant, SELCO Service Corporation and CS/Federal Drive LLC, as amended by Amendments 1 through 6. | 8-K | 001-13449 | 10.1 | February 10, 2006 | |||||
10.34 | Lease Agreement, dated February 6, 2006, between Registrant and CS/Federal Drive AB LLC (for Building A). | 8-K | 001-13449 | 10.2 | February 10, 2006 | |||||
10.35 | Lease Agreement, dated February 6, 2006, between Registrant and CS/Federal Drive AB LLC (for Building B). | 8-K | 001-13449 | 10.3 | February 10, 2006 | |||||
10.36 | First Amendment dated August 1, 2010 to Lease Agreement between Registrant and CS/Federal Drive AB LLC (for Building B). | 10-K | 001-13449 | 10.35 | June 12, 2015 | |||||
10.37 | Lease Agreement, dated February 6, 2006, between Registrant and CS/Federal Drive AB LLC (for Building C). | 8-K | 001-13449 | 10.4 | February 10, 2006 | |||||
10.38 | First Amendment dated August 1, 2010 to Lease Agreement between Registrant and CS/Federal Drive AB LLC (for Building C). | 10-K | 001-13449 | 10.37 | June 12, 2015 | |||||
10.39 | Patent Cross License Agreement, dated February 27, 2006, between Registrant and Storage Technology Corporation. | 8-K | 001-13449 | 10.1 | March 3, 2006 | |||||
10.40 | Warrant Purchase Agreement, dated as of June 3, 2009, by and between Quantum Corporation and EMC Corporation. | 8-K | 001-13449 | 10.1 | June 9, 2009 | |||||
10.41 | First Amendment to the Purchase Agreement, dated as of June 17, 2009, by and between Quantum Corporation and EMC Corporation. | 8-K | 001-13449 | 10.1 | June 23, 2009 | |||||
10.42 | Agreement, dated as of May 13, 2013, by and among Registrant, Starboard Value LP, and certain of its affiliates. | 8-K | 001-13449 | 10.1 | May 14, 2013 | |||||
10.43 | Agreement, dated as of July 28, 2014, by and among Registrant and Starboard Value L.P. and certain of its affiliates | 8-K | 001-13449 | 10.1 | July 29, 2014 | |||||
12.1 | Ratio of Earnings to Fixed Charges. ‡ | |||||||||
21 | Quantum Subsidiaries. ‡ | |||||||||
23 | Consent of Independent Registered Public Accounting Firm, PricewaterhouseCoopers LLP. ‡ | |||||||||
24 | Power of Attorney (see signature page). | |||||||||
31.1 | Certification of the Chief Executive Officer pursuant to Section 302(a) of the Sarbanes-Oxley Act of 2002. ‡ | |||||||||
31.2 | Certification of the Chief Financial Officer pursuant to Section 302(a) of the Sarbanes-Oxley Act of 2002. ‡ | |||||||||
85
Incorporated by Reference | |||||||||||
Exhibit Number | Exhibit Description | Form | File No. | Exhibit(s) | Filing Date | ||||||
32.1 | Certification of Chief Executive Officer pursuant to 18 U.S.C. section 1350, as adopted pursuant to section 906 of the Sarbanes-Oxley act of 2002. † | ||||||||||
32.2 | Certification of Chief Financial Officer pursuant to 18 U.S.C. section 1350, as adopted pursuant to section 906 of the Sarbanes-Oxley act of 2002. † | ||||||||||
101.INS | XBRL Instance Document. †† | ||||||||||
101.SCH | XBRL Taxonomy Extension Schema Document. †† | ||||||||||
101.CAL | XBRL Taxonomy Extension Calculation Linkbase Document. †† | ||||||||||
101.DEF | XBRL Taxonomy Extension Definition Linkbase Document. †† | ||||||||||
101.LAB | XBRL Taxonomy Extension Label Linkbase Document. †† | ||||||||||
101.PRE | XBRL Taxonomy Extension Presentation Linkbase Document. †† | ||||||||||
* | Indicates management contract or compensatory plan, contract or arrangement. |
‡ | Filed herewith. |
† | Furnished herewith. |
†† | XBRL (Extensible Business Reporting Language) information is furnished and not filed herewith, is not a part of a registration statement or prospectus for purposes of sections 11 or 12 of the Securities Act of 1933, is deemed not filed for purposes of section 18 of the Securities Exchange Act of 1934, and otherwise is not subject to liability under these sections. |
86
SIGNATURE
Pursuant to the requirements of Section 13 or 15(d) of the Securities Exchange Act of 1934, the registrant has duly caused this report to be signed on its behalf by the undersigned, thereunto duly authorized.
QUANTUM CORPORATION | ||
/s/ FUAD AHMAD | ||
Fuad Ahmad | ||
Chief Financial Officer | ||
(Principal Financial and Chief Accounting Officer) | ||
Date: | June 3, 2016 | |
87
POWER OF ATTORNEY
KNOW ALL PERSONS BY THESE PRESENTS, that each person whose signature appears below constitutes and appoints Jon W. Gacek and Fuad Ahmad, jointly and severally, his attorneys-in-fact, each with the power of substitution, for him in any and all capacities, to sign any amendments to this Annual Report on Form 10-K, and to file the same, with exhibits thereto and other documents in connection therewith, with the Securities and Exchange Commission, hereby ratifying and confirming all that each of said attorneys-in-fact, or his substitute or substitutes, may do or cause to be done by virtue hereof.
Pursuant to the requirements of the Securities Exchange Act of 1934, this Report has been signed below by the following persons in the capacities and on June 3, 2016.
Signature | Title | |||
/s/ JON W. GACEK | Director, President and Chief Executive Officer | |||
Jon W. Gacek | (Principal Executive Officer) | |||
/s/ FUAD AHMAD | Chief Financial Officer | |||
Fuad Ahmad | (Principal Financial and Chief Accounting Officer) | |||
/s/ ROBERT J. ANDERSEN | Director | |||
Robert J. Andersen | ||||
/s/ PAUL R. AUVIL III | Director | |||
Paul R. Auvil III | ||||
/s/ LOUIS DINARDO | Director | |||
Louis DiNardo | ||||
/s/ DALE L. FULLER | Director | |||
Dale L. Fuller | ||||
/s/ DAVID A. KRALL | Director | |||
David A. Krall | ||||
/s/ GREGG J. POWERS | Director | |||
Gregg J. Powers | ||||
/s/ CLIFFORD PRESS | Director | |||
Clifford Press | ||||
/s/ DAVID E. ROBERSON | Director | |||
David E. Roberson | ||||
88