Attached files
| file | filename |
|---|---|
| EX-32.2 - EXHIBIT 32.2 - QUANTUM CORP /DE/ | a03312020exhibit-322.htm |
| EX-32.1 - EXHIBIT 32.1 - QUANTUM CORP /DE/ | a03312020exhibit-321.htm |
| EX-31.2 - EXHIBIT 31.2 - QUANTUM CORP /DE/ | a03312020exhibit-312.htm |
| EX-31.1 - EXHIBIT 31.1 - QUANTUM CORP /DE/ | a03312020exhibit-311.htm |
| EX-23.1 - EXHIBIT 23.1 - QUANTUM CORP /DE/ | a03312020exhibit-23.htm |
| EX-21 - EXHIBIT 21 - QUANTUM CORP /DE/ | a03312020exhibit-21.htm |
| EX-10.6 - EXHIBIT 10.6 - QUANTUM CORP /DE/ | exhibit106rsuagreementdire.htm |
| EX-10.5 - EXHIBIT 10.5 - QUANTUM CORP /DE/ | exhibit105psuagreement.htm |
| EX-10.4 - EXHIBIT 10.4 - QUANTUM CORP /DE/ | exhibit104rsuagreementnon-.htm |
| EX-10.3 - EXHIBIT 10.3 - QUANTUM CORP /DE/ | exhibit103marketrsuagreeme.htm |
| EX-10.2 - EXHIBIT 10.2 - QUANTUM CORP /DE/ | exhibit102rsuagreement.htm |
| EX-10 - EXHIBIT 10 - QUANTUM CORP /DE/ | exhibit101king.htm |
| EX-4.1 - EXHIBIT 4.1 - QUANTUM CORP /DE/ | exhibit41.htm |
UNITED STATES
SECURITIES AND EXCHANGE COMMISSION
Washington, D.C. 20549
FORM 10-K
(Mark One)
☒ | ANNUAL REPORT PURSUANT TO SECTION 13 OR 15(d) OF THE SECURITIES EXCHANGE ACT OF 1934 |
For the fiscal year ended March 31, 2020
or
☐ | TRANSITION REPORT PURSUANT TO SECTION 13 OR 15(d) OF THE SECURITIES EXCHANGE ACT OF 1934 |
For the transition period from ___ to ___
Commission File Number 001-13449

Quantum Corporation |
(Exact name of registrant as specified in its charter) |
Delaware | 94-2665054 | |||
(State or other jurisdiction of incorporation or organization) | (I.R.S. Employer Identification No.) | |||
224 Airport Parkway | Suite 550 | |||
San Jose | CA | 95110 | ||
(Address of Principal Executive Offices) | (Zip Code) | |||
(408 | ) | 944-4000 |
Registrant's telephone number, including area code | ||
(Former name, former address, and former fiscal year, if changed since last report) | |
Securities registered pursuant to Section 12(b) of the Act:
Title of each class | Trading Symbol | Name of each exchange on which registered | ||
Common Stock, $0.01 par value per share | QMCO | Nasdaq Global Select Market | ||
Securities registered pursuant to Section 12(g) of the Act: None
Indicate by check mark if the registrant is a well-known seasoned issuer, as defined in Rule 405 of the Securities Act. | ¨ | Yes | x | No |
Indicate by check mark if the registrant is not required to file reports pursuant to Section 13 or Section 15(d) of the Act. | ¨ | Yes | x | No |
Indicate by check mark whether the registrant (1) has filed all reports required to be filed by Section 13 or 15(d) of the Securities Exchange Act of 1934 during the preceding 12 months (or for such shorter period that the registrant was required to file such reports), and (2) has been subject to such filing requirements for the past 90 days. | x | Yes | ¨ | No |
Indicate by check mark whether the registrant has submitted electronically every Interactive Data File required to be submitted pursuant to Rule 405 of Regulation S-T (§232.405 of this chapter) during the preceding 12 months (or for such shorter period that the registrant was required to submit such files). | x | Yes | ¨ | No |
Indicate by check mark whether the registrant is a large accelerated filer, an accelerated filer, a non-accelerated filer, or a smaller reporting company. See the definitions of “large accelerated filer,” “accelerated filer” and “smaller reporting company” in Rule 12b-2 of the Exchange Act. (Check one):
Large accelerated filer | o | Accelerated filer | o | |||
Non-accelerated filer | x | Smaller reporting company | o | |||
Emerging growth company | o | |||||
If an emerging growth company, indicate by check mark if the registrant has elected not to use the extended transition period for complying with any new or revised | o | |||||
Indicate by check mark whether the registrant has filed a report on and attestation to its management’s assessment of the effectiveness of its internal control over financial reporting under Section 404(b) of the Sarbanes-Oxley Act (15 U.S.C. 7262(b) by the registered public accounting firm that prepared or issued its audit report. | x | |||||
Indicate by check mark whether the registrant is a shell company (as defined in Rule 12b-2 of the Exchange Act). | o | Yes | x | No | ||
As of the last business day of the registrant’s most recently completed second fiscal quarter, the aggregate market value of the registrant's common stock held by its non-affiliates, computed by reference to the price at which the common stock was last sold, was $115,331,509.
As of the close of business on June 22, 2020, there were 39,905,090 shares of Quantum Corporation’s common stock issued and outstanding.
DOCUMENTS INCORPORATED BY REFERENCE
The portions of the registrant's proxy statement to be filed in connection with the Annual Meeting of Stockholders to be held in 2020 have been incorporated by reference into Part III of this Annual Report on Form 10-K.
QUANTUM CORPORATION
ANNUAL REPORT ON FORM 10-K
For the Year Ended March 31, 2020
Table of Contents
Page Number | ||
PART I | ||
PART II | ||
PART III | ||
PART IV | ||
i
As used in this Annual Report on Form 10-K (this "Annual Report"), the terms "Quantum," "we," "us," and "our" refer to Quantum Corporation and its subsidiaries taken as a whole, unless otherwise noted or unless the context indicates otherwise.
Note Regarding Forward-Looking Statements
This Annual Report contains forward-looking statements. All statements contained in this report other than statements of historical fact, including statements regarding COVID-19's anticipated impacts on our business, our future operating results and financial position, our business strategy and plans, our market growth and trends, and our objectives for future operations, are forward-looking statements. The words “believe,” “may,” “will,” “estimate,” “continue,” “anticipate,” “intend,” “expect,” “could,” “would,” “project,” “plan,” “potentially,” “preliminary,” “likely,” and similar expressions are intended to identify forward-looking statements. We have based these forward-looking statements largely on our current expectations and projections about future events and trends that we believe may affect our financial condition, results of operations, business strategy, short-term and long-term business operations and objectives, and financial needs. These forward-looking statements are subject to a number of risks, uncertainties, and assumptions, including those described under Item 1A. Moreover, we operate in a competitive and changing environment. New risks emerge from time to time. It is not possible for our management to predict all risks, nor can we assess the effect of all factors on our business or the extent to which any factor, or combination of factors, may cause actual results to differ materially from those contained in any forward-looking statements we may make. In light of these risks, uncertainties, and assumptions, the future events and trends discussed in this report may not occur and actual results could differ materially and adversely from those anticipated or implied in the forward-looking statements. Accordingly, you should not rely on forward-looking statements as predictions of future events. Although we believe that the expectations reflected in the forward-looking statements are reasonable, we cannot guarantee that the future results, performance, or events and circumstances reflected in the forward-looking statements will be achieved or occur. We undertake no obligation to update any of these forward-looking statements for any reason after the date of this report or to conform these statements to actual results or revised expectations.
PART I
ITEM 1. BUSINESS
COVID-19 Risks and Uncertainties
We are subject to the risks arising from COVID-19 which have caused substantial financial market volatility and have adversely affected both the U.S. and the global economy. For many of our customers, the COVID-19 pandemic has significantly affected their business. Movie and television production has been paused, professional and collegiate sports seasons have been postponed or cancelled, and many corporations and enterprises have put information technology spending on hold while they assess the short- and long-term impact of the pandemic. While our supply chain remains intact and operating, we have experienced issues related to our logistics network. The reduced capacity within and across freight lanes (aircraft, personnel, customs clearance, etc.) has caused late deliveries from re-routes and mis-shipments, as well as increased expedite and other charges to deliver and receive products. To date, we have experienced minimal impact on product availability, although future capacity constraints across the network due to lost capacity from factory down time, closures, as well as reduced staff and demand signal fluctuations are expected to impact product availability in the months and possibly quarters to come.
We believe that these social and economic impacts have had a negative effect on sales due to the decline in our customers' ability or willingness to purchase our products and services. The extent of the impact will depend, in part, on how long the negative trends in customer demand and supply chain levels will continue. Our management continues to actively monitor the situation and may take further actions altering our business operations that we determine are in the best interests of our employees, customers, partners, suppliers, and stakeholders, or as required by federal, state, or local authorities.
3
Overview
We are a leader in storing and managing digital video and other forms of unstructured data. We help customers around the world to ingest, process, and analyze digital data at high speed, and preserve and protect it for decades. Our customers include some of the world’s largest corporations, government agencies, service providers, broadcasters, movie studios, sports leagues and teams, and enterprises in all industries. We work closely with a broad network of distributors, VARs, DMRs, OEMs and other suppliers to solve our customers most pressing business challenges.
Our Customer Solution
Our customers are typically managing and storing large amounts of digital video and other forms of “video-like” data such as high-resolution images. This data is generally referred to as “unstructured” data, and video and digital images represent the largest subset of this data. This unstructured data is growing rapidly, and already represents the vast majority of the data being created every day.
This data has unique requirements, and our portfolio has been designed to address these requirements end-to-end. When this data is first created, it requires very high-speed performance, which we provide using a combination of non-volatile memory express (“NVMe”), solid state drives (“SSD”), and hard disk drives (“HDD”). Once this data is ingested and processed, it typically needs to be stored and protected forever. We provide both object storage systems and tape storage systems for low-cost, long-term protection and archiving, and the complete solution is managed by our StorNext software. StorNext is both a high-speed file system as well as a data management platform. In addition to providing customers access to their data across the various types of storage systems above, StorNext can also move data to and from public cloud storage, which our customers are increasingly using as part of their overall data infrastructure.
We also offer a portfolio of products designed for video surveillance recording and storage, including a line of network video recording servers, and a line of hyperconverged storage systems for surveillance recording and management.
With the exception of our tape storage systems, which are based on hardware we have designed, all of our products are powered by our software, and run on commodified server hardware. Our product portfolio is increasingly software-defined, and our technology roadmap is moving to becoming completely software-defined.
We are a member of the consortium that develops, patents, and licenses Linear Tape-Open, (or “LTO® tape”) technology to media manufacturing companies. We receive royalty payments for LTO media technology sold under licensing agreements. We have also entered into various licensing agreements with respect to our technology, patents and similar intellectual property which provide licensing revenues in certain cases and may expand the market for products and solutions using these technologies.
Industry Background
Digital video and imaging data is growing exponentially, and in the next few years is likely to represent the vast majority of the data produced in the world. This class of data presents a unique set of challenges for our customers. These data sets are exponentially larger than the average corporate database, they need to be stored and protected for decades, and many of the data services designed for databases and other corporate applications do not work with this data. In addition, video and image data is very difficult to search, and yet it is the data that has the most value to the business lines of many of our customers. Lastly, these datasets typically have a lifecycle that initially requires very high performance for creation, intake, cataloging, analysis and collaboration, which then needs to be archived and protected for decades at a low cost. With these challenges in mind, our mission is to design products to address these needs, enabling our customers with solutions that will help them create, innovate and protect.
Some examples across the industries that we serve include:
• | The media and entertainment industry producing high-resolution content for movies and TV shows, including content in streaming services; |
• | Large corporations producing video content for marketing and advertising, and for internal training and communication purposes; |
4
• | Surveillance cameras for city surveillance, critical infrastructure, higher education, retail, restaurants, and more; |
• | Scientific research and applications; |
• | Life sciences, genome sequencing and microscopy; |
• | Military and defense applications that manage images and video from drones and satellites; |
• | Video, image, and sensor data captured on the manufacturing floor; |
• | Video, image, and sensor data produced by cars as part of ADAS and autonomous vehicle development. |
Products
High-Performance Shared Storage Systems
At the core of our high-performance shared storage product line is our StorNext software that enables high-speed ingest, editing, processing and management of digital video and image datasets. Major broadcasters and studios, post-production companies including streaming services, sports franchises, and corporations around the world use StorNext.
Our StorNext software is both a shared file system and data management platform. StorNext provides fast streaming performance and data access, a shared file storage environment for macOS, Microsoft Windows, and Linux workstations, and intelligent data management to protect data across its lifecycle. StorNext runs on standard servers and is sold with storage arrays that are used within the StorNext environment. These storage arrays include:
• | The Quantum F-Series: A line of ultra-fast, highly available NVMe storage servers for editing, rendering, and processing of video content and other large unstructured datasets. |
• | Quantum QXS-Series: A line of high performance, reliable hybrid storage arrays, offered with either HDDs, SSDs, or some combination of the two. |
Customers are now deploying our StorNext file system with a combination of NVMe storage and more traditional SSD and HDD storage to balance cost and performance. Our StorNext software can also manage data across different types, or pools, of storage, such as public cloud object stores and disk-based object storage systems. StorNext supports a broad range of both private and public object stores to meet customer needs. For customers that archive video and image data for years, StorNext is also integrated with our tape storage, and can assign infrequently used but important data to tape to create a large-scale active archive.
Object Storage Systems
With the acquisition of the ActiveScale object storage business from Western Digital that was completed in March of 2020, we now offer leading object storage systems for massive-scale, online content repositories such as media archives, genome sequencing data repositories, and big data lakes. Our ActiveScale object storage provides high levels of data durability and facilitates the management of many petabytes and billions of objects. ActiveScale object storage software stores data in object format and uses patented erasure-encoding software to protect data across storage nodes and across multiple geographic sites.
Tape Storage
Our Scalar® tape systems are low-cost, long-term data storage used by large cloud providers and leading enterprises to archive and preserve digital content for decades. The product line scales from entry-level libraries for small backup environments up to massive petabyte and even exabyte scale archive libraries.
Our tape systems provide storage density, offline secure storage to protect against ransomware and malware, and an intelligent, advanced diagnostics engine designed to reduce downtime and operational expense relative to other tape systems. Our tape systems are used by thousands of enterprises around the world as well as by large cloud service providers. In addition to our tape systems, we also sell LTO tape cartridges as well as standalone LTO tape drives for small business and desktop use.
Backup Storage Systems
5
Our DXi backup systems provide high-performance, scalable storage for backup and multi-site disaster recovery. Our variable-length de-duplication technology maximizes data reduction, our replication engine enables multi-site protection and data recovery, and our high-efficiency design enables customers to maximize backup performance while minimizing data center footprint.
Storage Systems for Surveillance and Physical Security
We offer a broad portfolio of products designed for the capture and analysis of video surveillance and security. These products include network video recording servers, as well as hyperconverged storage systems for video surveillance management and recording. In addition, we offer appliances designed for video surveillance analytics and to run different types of access control systems.
Our strategy is to offer the broadest physical security server and storage portfolio available from any single supplier, with solutions designed and optimized for surveillance and physical security workloads, providing high performance and density, resulting in cost-effective solutions.
In-Vehicle Storage Systems
Our R-Series is a line of ruggedized, removable storage systems for in-vehicle data capture, mobile surveillance, and military applications. Our R-Series includes a removable storage magazine which allows data generated in the vehicle to be easily uploaded to a shared storage environment, such as our StorNext file system, for processing and analytics.
Services
We offer a broad range of services to complement our systems and technology, including managed services, implementation and training services, and support services for our customers around the world. Our customers are increasingly looking to purchase our technology using an as-a-service model, or different forms of managed services, and we now offer a full line of these services to meet these needs.
Global Services and Warranty
Our global services strategy is an integral component of our total customer solution. Service is typically a significant purchase factor for customers considering long-term storage for archiving and retention or data protection storage solutions. Consequently, our ability to provide comprehensive installation and integration services as well as maintenance services can be a noteworthy competitive advantage to attract new customers and retain existing customers. In addition, we believe that our ability to retain long-term customer relationships and secure repeat business is frequently tied directly to our comprehensive service capabilities and performance.
Our extensive use of technology and innovative product intelligence allows us to scale our global services operations to meet the needs of our customers. We are currently able to provide service to customers in more than 100 countries, supported by 24-hour, multi-language technical support centers located in North America, Europe, and Asia. We provide our customers with warranty coverage on our products. Customers with high availability requirements may also purchase additional services to obtain faster response times on our high-performance shared storage systems, tape systems, and disk backup systems. We offer this additional support coverage at a variety of response levels up to 24-hours a day, seven-days-a-week, 365-days-a-year, for customers with stringent high-availability needs. We provide support ranging from repair and replacement to 24-hour rapid exchange to on-site service support for our midrange and enterprise-class products. In addition to these traditional installation and maintenance services, we also provide project management, managed services, and other value-added services to enhance our customer’s experience and engagement. These incremental services create a deeper relationship with customers that enables them to maximize the value of our solution and better positions us to retain our customers through technology transitions.
We generally warrant our hardware products against defects for periods ranging from one to three years from the date of sale. We provide warranty and non-warranty repair services through our service team and third-party service providers. In addition, we utilize various other third-party service providers throughout the world to perform repair and warranty services for us to reach additional geographic areas and industries to provide quality services in a cost-effective manner.
6
Research and Development
We compete in an industry characterized by rapid technological change and evolving customer requirements. Our success depends, in part, on our ability to introduce new products and features to meet end user needs. Our research and development teams are focused on technology and services to make our storage systems smarter and easier to manage at scale; software enhancements to make our storage more searchable and accessible, software-defined hyperconverged storage technology, next generation solid-state and hard-drive storage system software, data deduplication and other data reduction technologies, and making tape even more efficient as a storage medium for long term archival storage.
Sales and Distribution Channels
Product Sales Channels
We utilize distributors, VARs and DMRs in our sales process. Our reseller program provides our channel partners the option of purchasing products directly or through distribution channels and provides them access to a more comprehensive product line. Additionally, we sell directly to multiple large corporate entities and government agencies.
OEM Relationships
We sell our products to several OEM customers that resell our hardware products under their own brand names and typically assume responsibility for product sales, end user service and support. We also license our software to certain OEM customers that include this software in their own brand name products. These OEM relationships enable us to reach end users not served by our branded distribution channels or our direct sales force. They also allow us to sell to select geographic or vertical markets where specific OEMs have exceptional strength.
Customers
Our customers vary across multiple industries worldwide ranging from small businesses to global enterprises. In addition, we sell to OEMs, distributors, VARs and DMRs to reach end user customers. Sales to our top five customers represented 23%, 33%, 29% revenue in fiscal 2020, fiscal 2019 and fiscal 2018, respectively, of which no customer represented 10% or more of our total revenue.
Competition
The markets in which we participate are highly competitive, characterized by rapid technological change and changing customer requirements. In some cases, our competitors in one market area are customers or suppliers in another. Our competitors often have greater financial, technical, manufacturing, marketing, or other resources than we do. Additionally, the competitive landscape continues to change due to merger and acquisition activity as well as new entrants into the market.
As our customers look to use more public cloud storage services, providers provide both a competitive threat and new platforms on which to run our software. We expect that the infrastructures of the future will be both hybrid-cloud and multi-cloud, meaning our customers will store their data in the various large public cloud environments, and also want to use services from multiple public cloud vendors.
Our high-performance shared storage systems and object storage systems primarily face competition from the EMC business unit of Dell Inc., (“Dell”), International Business Machines Corporation, (“IBM”), NetApp, Inc., (“NetApp”), and other enterprise storage vendors in the markets we serve.
Our tape storage systems primarily compete in the midrange and enterprise reseller and end user markets with IBM, Oracle Corporation and SpectraLogic Corporation as well as Hewlett-Packard Enterprise Company, (“HPE”), through its OEM relationship with other tape system suppliers. Competitors for entry-level and OEM tape systems include BDT Products, Inc. and several others that supply or manufacture similar products. In addition, disk backup products and cloud storage are an indirect competitive alternative to tape storage.
7
Our backup storage systems primarily compete with products sold by Dell, HPE and Veritas Technologies LLC. Additionally, several software companies that have traditionally been partners with us have deduplication features in their products and will, at times, compete with us.
Manufacturing and Supply Chain
We are constantly improving our supply chain and manufacturing operations to deliver a variable cost model while improving customer delivered quality and service. This process includes the transition to a multi-geographical manufacturing model using a configure-to-order methodology; a redesign of our service and supplier network; and talent acquisition and development. Our supply chain and manufacturing strategy minimizes geo-political and environmental causal risks and provides flexibility to support demand fluctuations by region, further enhancing our variable cost structure.
Manufacturing of our tape, backup, and shared storage systems is performed in the U.S. and Mexico using contract manufacturers, along with supporting third-party logistics companies in the Europe, Middle East, and Africa region, or (“EMEA”), and the Asia-Pacific region, or (“APAC”). The value of utilizing well-run logistics companies and supply chain solutions is that our product logistics is optimized for cost reductions with a competitive advantage allowing the physical flow and information flow to work together seamlessly.
Our tape media is manufactured in Japan and distributed globally.
Intellectual Property and Technology
We generally rely on patent, copyright, trademark and trade secret laws and contract rights to establish and maintain our proprietary rights in our technology and products. As of March 31, 2020, we hold approximately 319 U.S. patents and have 40 pending U.S. patent applications. In general, these patents have a 20-year term from the first effective filing date for each patent. We also hold multiple foreign patents and patent applications for certain of our products and technologies. Although we believe that our patents and applications have significant value, rapidly changing technology in our industry means that our future success may also depend heavily on the technical competence and creative skills of our employees.
From time to time, third parties have asserted that the manufacture and sale of our products have infringed on their patents. We are not knowingly infringing any third-party patents. Should it ultimately be determined that licenses for third-party patents are required, we will undertake best efforts to obtain such licenses on commercially reasonable terms. See Item 3 Legal Proceedings for additional disclosures regarding lawsuits alleging patent infringement.
On occasion, we have entered into various patent licensing and cross-licensing agreements with other companies. We may enter into patent cross-licensing agreements with other third parties in the future as part of our normal business activities. These agreements, when and if entered into, would enable these third parties to use certain patents we own and enable us to use certain patents owned by these third parties. We have also sold certain patents, retaining a royalty-free license for these patents.
We, along with HPE and IBM, belong to the LTO Consortium, an organization that licenses the Consortium members’ patents covering the LTO specifications. Media manufacturers and other parties take licenses to the LTO Consortium patent pool in exchange for a royalty payment to the Consortium, which then distributes the royalties to each of the three Consortium members.
Segment Information
We operate as a single reporting unit and operating segment for business and operating purposes. Information about revenue attributable to each of our product groups is included in Item 7 Management’s Discussion and Analysis of Financial Condition and Results of Operations and information about revenue and long-lived assets attributable to certain geographic regions is included in Note 2 , Revenue and Note 3, Balance Sheet Information, respectively, to the consolidated financial statements and risks attendant to our foreign operations is set forth below in Item 1A Risk Factors.
Seasonality
8
As is typical in our industry, we generally have the greatest demand for our products and services in the fourth quarter of each calendar year, or our fiscal third quarter. We usually experience the lowest demand for our products and services in the first and second quarters of each calendar year, or our fiscal fourth quarter and fiscal first quarter, respectively.
Backlog
We believe that product backlog has not been a meaningful indicator of net revenue that can be expected for any period. Our products are manufactured based on forecasts of customer demand and we work with our manufacturers and suppliers to support increases and decreases in demand. Orders are generally placed by customers on an as-needed basis. Product orders are confirmed and, in most cases, shipped to customers within four to six weeks. More complex systems and product configurations often have longer lead times, sometimes as much as 26 weeks. Much of the product backlog is from these more complex systems and typically increases at the end of each fiscal quarter, with these products typically being shipped in the following quarter. Product backlog at any point in time may not translate into net revenue in any subsequent period, as unfilled orders can generally be canceled at any time by the customer.
Executive Officers and Management Team
Following are the names and positions of our management team as of June 22, 2020, including a brief account of the business experience of each.
Name | Position with Quantum | |
James J. Lerner | President, Chief Executive Officer and Chairman of the Board | |
J. Michael Dodson | Chief Financial Officer | |
Elizabeth King | Chief Revenue Officer | |
Lewis Moorehead | Chief Accounting Officer | |
Regan MacPherson | Senior Vice President, Chief Legal & Compliance Officer and Secretary | |
Don Martella | Senior Vice President, Engineering | |
James J. Lerner, 50, was appointed as President and CEO of the Company, effective July 1, 2018, and was appointed Chairman of the Board on August 7, 2018. He also serves on the Company’s Board. Mr. Lerner has previously served as Vice President and Chief Operating Officer at Pivot3 Inc. from March 2017 to June 2018, and Chief Revenue Officer from November 2016 to March 2017. Prior to Pivot3, from March 2014 to August 2015, Mr. Lerner served as President of Cloud Systems and Solutions at Seagate Technology Public Limited Company. Prior to Seagate, Mr. Lerner served in various executive roles at Cisco Systems, Inc., including most recently as Senior Vice President and General Manager of the Cloud & Systems Management Technology Group. Before beginning his career as a technology company executive, Mr. Lerner was a Senior Consultant at Andersen Consulting. Since 2011, Mr. Lerner has served on the Board of Trustees of Astia, a global not-for-profit organization built on a community of men and women dedicated to the success of women-led, high-growth ventures, and is currently serving as the Chair of the Board of Trustees. Mr. Lerner earned a Bachelor of Arts in Quantitative Economics and Decision Sciences from U.C. San Diego.
J. Michael Dodson, 59, was appointed Chief Financial Officer effective May 31, 2018. He was also appointed interim Chief Executive Officer, a position in which he served until James J. Lerner joined the Company on July 1, 2018. From August 2017 to May 2018, Mr. Dodson served as the Chief Financial Officer of Greenwave Systems. Prior to joining Greenwave Systems, Mr. Dodson served as the Chief Operating Officer and Chief Financial Officer at Mattson Technology, Inc. from 2012 to 2017. He joined Mattson as Executive Vice President, Chief Financial Officer and Secretary in 2011. Prior to joining Mattson, Mr. Dodson served as Chief Financial Officer at four global public technology companies and Chief Accounting Officer for an S&P 500 company. Mr. Dodson started his career with Ernst & Young in San Jose, California. Since July 2013, he has served on the Board of Directors of Sigma Designs, Inc., a provider of system-on-chip solutions, including as Lead Independent Director since January 2014 and Chairman of the Audit Committee since 2015. He has also served on Board of Directors of A10 Network since February 2020 and was named Chairman of their Audit Committee in June 2020. In addition, Mr. Dodson serves as a director of two private entities: a charitable organization and a privately held for-profit company. He holds a B.B.A. degree with dual majors in Accounting and Information Systems Analysis and Design from the University of Wisconsin-Madison.
9
Elizabeth King, 62, has served as Quantum’s Chief Revenue Officer since March 2019. Prior to Quantum, from January 2017 to February 2019, she was Vice President, Go-to-Market & Enablement, HPC & AI at HPE. She joined HPE as part of HPE’s acquisition of SGI, where she served as SVP of worldwide sales from January 2014 through December 2016. Prior to HPE/SGI, she was vice president of strategic alliances for IBM and global systems integrators at Juniper Networks from June 2010 to January 2014. Prior to Juniper, she was vice president and general manager of the Hitachi Server Group of Hitachi Data Systems. She also held key senior sales, business development and operations roles at Nokia (formerly Alcatel-Lucent), Oracle (formerly Sun Microsystems), Raytheon, and Texas Instruments. Ms. King holds an MBA with honors from the University of Dallas and a Bachelor of Science in mechanical engineering from Lehigh University.
Lewis Moorehead, 48, has served as our Chief Accounting Officer since October 2018. Prior to joining Quantum, Mr. Moorehead was the Director of Finance, Accounting and Tax at Carvana, Co., a publicly traded on-line retailer, from November 2016 to October 2018. From September 2004 to October 2016, he served as Managing Partner at Quassey, an investment firm. While at Quassey, he also served as Vice President of Finance and Principal Accounting Officer at Limelight Networks, a NASDAQ-listed global content delivery network and SaaS provider, from March 2010 to August 2013. He has also held finance and accounting positions at eTelecare Global Solutions, Rivers and Moorehead PLLC, Intelligentias, Inc., American Express and PricewaterhouseCoopers. He holds a Bachelor of Business Administration (B.B.A.), cum laude, in Accounting from the University of Wisconsin-Whitewater.
Regan MacPherson, 57, joined Quantum in October 2019 as Chief Legal & Compliance Officer. Prior to joining Quantum, she was the Vice President and Chief Compliance Officer at Marvell Semiconductor, Inc. from June 2017 to October 2019. Ms. MacPherson served as Senior Vice President and General Counsel of Seagate Technology, PLC from March 2016 to June 2017. Ms. MacPherson also served as Vice President and Interim General Counsel from August 2015 to March 2016, Deputy General Counsel from September 2013 to August 2015, in addition to varying roles of increasing responsibility from July 2005 to September 2013, at Seagate Technology plc. Ms. MacPherson holds a Juris Doctor from Southwestern Law School and a Bachelor of Arts in political science from San Francisco State University.
Don Martella, 52, joined Quantum in August 2006 as Vice President, Tape Automation Engineering in connection with Quantum’s acquisition of ADIC. In April 2011, he assumed his current role as Senior Vice President of Engineering. In that capacity he is responsible for our research and development and advanced manufacturing activities. Before joining Quantum, Mr. Martella held leadership positions in R&D and Quality at ADIC; and engineering and management roles at Oracle (formerly StorageTek) in the tape business. Mr. Martella holds a master's in business administration and a Bachelor of Science in electrical and computer engineering from the University of Colorado.
Employees
As of March 31, 2020, we had 829 employees.
Available Information
We were founded in 1980 and reincorporated in Delaware in 1987.
Our Annual Report on Form 10-K, Quarterly Reports on Form 10-Q, Current Reports on Form 8-K, and amendments to reports filed or furnished pursuant to Sections 13(a) and 15(d) of the Securities Exchange Act of 1934, as amended, are available free of charge on our website at https://www.quantum.com generally when such reports are available on the SEC website. The contents of our website are not incorporated into this Annual Report on Form 10-K.
The public may read and copy any materials we file with the SEC at the SEC’s Public Reference Room at 100 F Street, NE, Washington, D.C. 20549. The public may obtain information on the operation of the Public Reference Room by calling the SEC at 1-800-SEC-0330. The SEC maintains an internet site that contains reports, proxy, and information statements and other information regarding issuers that file electronically with the SEC at http://www.sec.gov.
10
ITEM 1A. RISK FACTORS
You should carefully consider the risks described below, together with all other information in this Annual Report, before investing in any of our securities. The occurrence of any single risk or any combination of risks could materially and adversely affect our business, operating results, financial condition, liquidity, or competitive position, and consequently, the value of our securities. The material adverse effects include, but are not limited to, not growing our revenue or market share at the pace that they have grown historically or at all, our revenue and market share fluctuating on a quarterly and annual basis, an extension of our history of losses and a failure to become profitable, not achieving the revenue and net income (loss) guidance that we provide, and harm to our reputation and brand.
The recent COVID-19 pandemic could adversely affect our business, results of operations and financial condition.
The COVID-19 pandemic and efforts to control its spread have impacted and will continue to impact our workforce and operations, and those of our strategic partners, customers, suppliers and logistics providers. These impacts have included and may include under-absorbed overhead, increased logistics and other costs and decreased product output. While our third-party partners are all currently operational, in some cases with exemptions from government restrictions, this is subject to change based on evolving conditions related to the pandemic.
The effects of the pandemic are uncertain and difficult to predict, but may include:
• | Further disruptions to our supply chain, our operations or those of our strategic partners, customers or suppliers caused by employees or others contracting COVID-19, or governmental orders to contain the spread of COVID-19 such as travel restrictions, quarantines, shelter in place orders, trade controls, and business shutdowns; |
• | A global economic downturn or a recession causing a decrease in short- or long-term demand for our products, resulting in industry oversupply and decreases of average selling prices (“ASPs”), which would negatively impact our sales and profitability; |
• | Deterioration of worldwide credit markets that may limit our ability or increase our cost to obtain external financing to fund our operations and capital expenditures and result in a higher rate of losses on our accounts receivables due to customer credit defaults; |
• | Extreme volatility in financial markets which has and may continue to adversely impact our stock price and our ability to access the financial markets on acceptable terms, or at all; |
• | Increased data security and technology risk as many employees transition to work from home arrangements, including possible outages to systems and technologies critical to remote work and increased data privacy risk with cybercriminals attempting to take advantage of the disruption; and |
• | Management’s ongoing commitment of significant time, attention and resources to respond to the pandemic. |
The degree to which the pandemic ultimately impacts our business and results of operations will depend on future developments beyond our control which are highly uncertain and cannot be predicted at this time, including the severity and duration of the pandemic, the extent of actions to contain or treat COVID-19, the effectiveness of government stimulus programs, any possible resurgence of COVID-19 that may occur after the initial outbreak subsides, how quickly and to what extent normal economic and operating activity can resume, and the severity and duration of the global economic downturn that results from the pandemic. To the extent the COVID-19 pandemic adversely affects our business and financial results, it may also have the effect of heightening many of the other risks described in more detail in this “Risk Factors” section, such as those relating to adverse global or regional conditions, our highly competitive industry, supply chain disruption, customer demand conditions and our ability to forecast demand, cost saving initiatives, our indebtedness and liquidity, and cyber-attacks.
We have significant indebtedness, which imposes upon us debt service obligations, and our term loan and credit facility contains various operating and financial covenants that limit our discretion in the operation of our business. If we are unable to generate sufficient cash flows from operations and overall results of operations to meet these debt obligations or remain in compliance with the covenants, our business, financial condition and results of operations could be materially and adversely affected.
Our level of indebtedness presents significant risks to our business and investors, both in terms of the constraints that it places on our ability to operate our business and because of the possibility that we may not generate
11
sufficient cash and results of operations to remain in compliance with our covenants and pay the principal and interest on our indebtedness as it becomes due. We recently failed to meet certain financial covenants in our debt agreements, which could have resulted in a default under these agreements if we had not obtained a waiver of noncompliance from our lenders. For further description of our outstanding debt, see the section captioned “Liquidity and Capital Resources” in Part II, Item 7 Management’s Discussion and Analysis of Financial Condition and Results of Operations.
As a result of our indebtedness:
• | Our ability to invest in growing our business is constrained by the financial covenants contained in our credit facility, which require us to maintain a minimum fixed charge coverage ratio and liquidity levels; |
• | We must dedicate a significant portion of our cash flow from operations and other capital resources to debt service, thereby reducing our ability to fund working capital, capital expenditures, research and development and other cash requirements; |
• | Our flexibility in planning for, or reacting to, changes and opportunities in the markets in which we compete may be limited, including our ability to engage in mergers and acquisitions activity, which may place us at a competitive disadvantage; |
• | We are subject to mandatory field audits and control of cash receipts by the lenders if we do not maintain liquidity above certain thresholds; |
• | We may be more vulnerable to adverse economic and industry conditions; and |
• | We may be unable to make payments on other indebtedness or obligations. |
Our credit facility contains restrictive covenants that require us to comply with and maintain certain liquidity levels and a minimum fixed charge coverage ratio, as well as restrict our ability, subject to certain thresholds, to:
• | Incur debt; |
• | Incur liens; |
• | Make acquisitions of businesses or entities or sell certain assets; |
• | Make investments, including loans, guarantees and advances; |
• | Engage in transactions with affiliates; |
• | Pay dividends or engage in stock repurchases; and |
• | Enter into certain restrictive agreements. |
The weakness we experienced for several years in the market for our storage, back up and data protection business, which is the primary driver of our overall cash flow and operating income, placed increased pressure on our ability to meet our liquidity and fixed charge coverage ratio covenants. In recent periods, our business has declined due, in part, to the negative impact of the COVID-19 pandemic. As a result, we fell out of compliance with certain financial covenants, including, for example, the total net leverage ratio and total leverage ratio covenants for the fourth fiscal quarter period ending March 31, 2020. We received a waiver from our lenders for the noncompliance of these covenants. In June 2020, we amended our debt agreements to revise our financial covenants in light of currently expected business levels under current market conditions, including the negative impact of COVID-19. These amendments required us to make significant payments to our lenders, including approximately $1.0 million and to issue 3,400,000 warrants that are exercisable for shares of our common stock, which when exercised will result in significant dilution to our stockholders and could cause our stock price to decline. In addition, we also incurred significant costs related to advisors, attorneys and accountants. We believe we will be able to meet these covenants in the future, but if our financial results turn out to be lower than expected, we may breach a covenant, which could result in a default under our credit facility agreements.
Our ability to make scheduled payments of the principal, to pay interest on, or to refinance our indebtedness, or to make cash payments in connection with our credit facility, depends on our future performance, which is subject to economic, financial, competitive and other factors beyond our control. Further, as our indebtedness reaches maturity, we will be required to make large cash payments or adopt one or more alternatives, such as restructuring indebtedness or obtaining additional debt or equity financing on terms that may be onerous or highly dilutive. Our ability to restructure or refinance our indebtedness will depend on the capital markets and our financial condition at such time. We may be unable to incur additional debt or refinance our existing debt on acceptable terms, if at all.
Our credit facility is collateralized by a pledge of all our assets. If we were to default and were unable to obtain a waiver for such a default, the lenders would have a right to foreclose on our assets to satisfy our obligations under
12
these agreements. Any such action on the part of the lenders against us could have a materially adverse impact on our business, financial condition and results of operations.
In connection with entering into our credit facilities and certain amendments to our prior credit facilities, we were required to issue warrants to purchase our common stock to our lenders. When exercised, these warrants will result in significant dilution to our stockholders. As a result, the issuance of common stock upon the exercise of our outstanding warrants may cause our stock price to decline.
We have previously identified deficiencies in our control environment and financial reporting process that resulted in material weaknesses in our internal control over financial reporting and previously concluded that our internal control over financial reporting and our disclosure controls and procedures were not effective as of March 31, 2019. As of March 31, 2020, we remediated these material weaknesses and have concluded that our internal control over financial reporting and our disclosure controls and procedures were effective. However, if we fail to maintain proper and effective internal controls, material misstatements in our financial statements could occur and impair our ability to produce accurate and timely financial statements and could adversely affect investor confidence in our financial reports, which could negatively affect our business.
We have concluded that our internal control over financial reporting and disclosure controls and procedures were effective as of March 31, 2020. However, in our prior fiscal year and as of March 31, 2019, we concluded that our internal control over financial reporting and disclosure controls and procedures were not effective due to the existence of material weaknesses in our control environment, financial reporting process and internal control over financial reporting. We restated our consolidated financial statements and related disclosures for the year ended March 31, 2017, and restated each of the quarterly periods related to the three months ended June 30, 2017 and the three- and six-month periods ended September 30, 2017, following the identification of misstatements as a result of an internal investigation that we concluded in fiscal 2020. This prior restatement and our ineffective internal control over financial reporting damaged our reputation, caused us to incur a significant amount of costs and resulted in the distraction of our management team from the operation of our business. We cannot provide assurance that the material weaknesses and deficiencies that we identified as of March 31, 2019 will not reoccur, or that additional material weaknesses in our internal control over financial reporting will not arise or be identified in the future. We intend to continue to monitor the tone at the top of our organization, our financial reporting process, and our operational, information technology, financial systems, compliance and infrastructure procedures and controls. We also intend to continue to expand, train, retain and manage our personnel who are essential to effective internal control and compliance. In doing so, we will continue to incur expenses and expend management time.
If we fail to maintain proper and effective internal controls, our consolidated financial statements may contain material misstatements and we could be required to restate our financial results in the future. Moreover, because of the inherent limitations of any control system, material misstatements due to error or fraud may not be prevented or detected on a timely basis, or at all. If we are unable to provide reliable and timely financial reports in the future, our business and reputation may be further harmed. Restated financial statements and failures in internal control may also cause us to fail to meet reporting obligations or debt covenants, negatively affect investor confidence in our management and the accuracy of our financial statements and disclosures, or result in adverse publicity and concerns from investors, any of which could have a negative effect on the price of our common stock, subject us to further regulatory investigations and penalties or stockholder litigation, and materially and adversely impact our business and financial condition.
Risks Related to our Business Operations
We derive significant revenue from products incorporating tape technology. Our future results of operations depend in part on continued market acceptance and use of products incorporating tape technology; in the past, decreases in the market have materially and adversely impacted our business, financial condition and results of operations. In addition, if we are unable to compete with the introduction of new storage technologies by other companies, our business, financial condition and results of operations could be materially and adversely affected.
We currently derive significant revenue from products that incorporate some form of tape technology, and we expect to continue to derive significant revenue from these products in the next several years. As a result, our future results of operations depend in part on continued market acceptance and use of products employing tape technology. We believe that the storage environment is changing, including reduced demand for tape products.
13
Decreased market acceptance or use of products employing tape technology has materially and adversely impacted our business, financial condition and results of operations, and we expect that our revenues from certain types of tape products could continue to decline, which could materially and adversely impact our business, financial condition and results of operations in the future.
Disk and solid-state products, as well as various software solutions and alternative technologies such as crystal and organic material-based storage have been announced by other companies. We expect that, over time, many of our tape customers could migrate toward our other products and solutions and that revenue from these other products and solutions will generate a greater proportion of our revenue in the future. While we are making targeted investments in software, disk backup systems and other alternative technologies, these markets are characterized by rapid innovation, evolving customer demands and strong competition, including competition with several companies who are also significant customers. If we are not successful in our efforts, we may not be able to retain customers or attract new customers, and our business, financial condition and results of operations could be materially and adversely affected.
We may not be entitled to forgiveness of our recently received Paycheck Protection Program loan, and our application for the Paycheck Protection Program loan could in the future be determined to have been impermissible, which could result in the imposition on us of fines and other penalties, or could result in damage to our reputation.
On April 13, 2020 we entered into a Paycheck Protection Term Note for a principal amount of $10,000,000, or the PPP Loan, under the Paycheck Protection Program, or PPP, of the recently enacted Coronavirus Aid, Relief, and Economic Security Act, or the CARES Act. We have used all of the proceeds from the PPP Loan to maintain our employees and their current salaries in the United States. The PPP Loan has a two-year term and bears annual interest at a rate of 1.0%. Payments of principal and interest on the PPP Loan will be deferred for no longer than ten months from loan origination. Thereafter, we are required to pay the lender equal monthly payments of principal and interest.
The CARES Act and the PPP provide a mechanism for forgiveness of up to the full amount borrowed. Under the PPP, we may apply for and be granted forgiveness for all or part of the PPP Loan. The amount of loan proceeds eligible for forgiveness is based on a formula that takes into account a number of factors, including the amount of loan proceeds used by us during a specified period after receipt of the loan proceeds for certain purposes, including payroll costs, interest on certain mortgage obligations, rent payments on certain leases, and certain qualified utility payments, provided that at least 60% of the loan amount is used for eligible payroll costs. Subject to the other requirements and limitations on loan forgiveness, only loan proceeds spent on payroll and other eligible costs during the covered period will qualify for forgiveness. We will be required to repay any portion of the outstanding principal that is not forgiven, along with accrued interest, in accordance with the amortization schedule described above, and we cannot provide any assurance that we will be eligible for loan forgiveness, that we will ultimately apply for forgiveness, or that any amount of the PPP Loan will ultimately be forgiven by the U.S. Small Business Administration, or the SBA.
In order to apply for the PPP Loan, we were required to certify, among other things, that the current economic uncertainty made the PPP Loan request necessary to support our ongoing operations. We made this certification in good faith after analyzing, among other things, our financial situation and access to alternative forms of capital, and believe that we satisfied all eligibility criteria for the PPP Loan, and that our receipt of the PPP Loan is consistent with the spirit and broad objectives of the PPP and of the CARES Act. The certification described above does not contain any objective criteria and is subject to interpretation. On April 23, 2020, the SBA issued guidance stating that it is unlikely that a public company with substantial market value and access to capital markets will be able to make the required certification in good faith. In addition, the SBA stated its intent to audit the PPP Loan application of any company, like us, that received proceeds under the PPP of more than $2 million. Additionally, on May 8, 2020, we were one of five publicly traded companies to receive a letter from the United States House of Representatives’ Select Subcommittee on the Coronavirus Crisis, or the Subcommittee, requesting that we return the PPP Loan proceeds, and if we did not return the proceeds, requiring us to produce to the Subcommittee specified documentation related to our PPP Loan. We intend to cooperate fully with the Subcommittee’s review of our PPP Loan. There has also been significant media coverage and controversy with respect to public companies applying for and receiving PPP loans. If we are later determined to have violated any of the laws or governmental regulations that apply to us in connection with the PPP Loan, such as the False Claims Act, or it is otherwise determined that we were ineligible to receive the PPP Loan, we may be subject to penalties, including significant
14
civil, criminal and administrative penalties and could be required to repay the PPP Loan in its entirety. In addition, receipt of a PPP Loan may result in adverse publicity and damage to our reputation. The Subcommittee’s review of our PPP Loan is requiring us to consume a significant amount of financial and management resources. In addition, any review or audit by the SBA or other government entity or claims under the False Claims Act, could consume additional significant financial and management resources. Any of these events could have a material adverse effect on our business, results of operations and financial condition.
We rely on indirect sales channels to market and sell our branded products. Therefore, the loss of or deterioration in our relationship with one or more of our resellers or distributors, or our inability to establish new indirect sales channels to drive growth of our branded revenue, especially for disk backup systems and scale-out tiered storage, could negatively affect our results of operations.
We sell most of our branded products to distributors such as Arrow Electronics, Inc. and other VARs and DMRs such as CDW Corporation, who in turn sell our products to end users. We use different distributors, VARs and DMRs in different countries and regions in the world. The success of these sales channels is hard to predict, particularly over time, and we have no purchase commitments or long-term orders from them that assure us of any baseline sales through these channels. Several of our resellers carry competing product lines that they may promote over our products. A reseller might not continue to purchase our products or market them effectively, and each reseller determines the type and amount of our products that it will purchase from us and the pricing of the products that it sells to end user customers. Establishing new indirect sales channels is an important part of our strategy to drive growth of our branded revenue and as our business shifts toward our branded products, these indirect sales channels will have increasing importance to our business.
When we introduce new products and solutions, as we did in the last half of our fiscal year 2019, our relationship with channel partners that historically have sold other products and solutions and that now compete with our new offerings could be adversely impacted. For example, we introduced our new F-Series all-flash array and R-Series ruggedized products in fiscal year 2019, causing us in some cases to more directly compete for primary storage sales with channel partners that sell other primary storage products.
Our results of operations could be adversely affected by any number of factors related to our channel partners, including:
• | A change in competitive strategy that adversely affects a reseller’s willingness or ability to distribute our products; |
• | The reduction, delay or cancellation of orders or the return of a significant amount of products; |
• | Our inability to gain traction in developing new indirect sales channels for our branded products; |
• | The loss of one or more of such distributors or resellers; |
• | Any financial difficulties of such distributors or resellers that result in their inability to pay amounts owed to us; or |
• | Changes in requirements or programs that allow our products to be sold by third parties to government customers. |
If our products fail to meet our or our customers’ specifications for quality and reliability, we may face liability and reputational or financial harm which may adversely impact our results of operations and our competitive position may suffer.
Although we place great emphasis on product quality, we may from time to time experience problems with the performance of our products, which could result in one or more of the following:
• | Increased costs related to fulfillment of our warranty obligations; |
• | The reduction, delay or cancellation of orders or the return of a significant amount of products; |
• | Focused failure analysis causing distraction of the sales, operations and management teams; or |
• | The loss of reputation in the market and customer goodwill. |
These factors could cause our business, financial condition and results of operations to be materially and adversely affected.
In addition, we face potential liability for performance problems of our products because our end users employ our storage technologies for the storage and backup of important data and to satisfy regulatory requirements. Loss of
15
this data could cost our customers significant amounts of money, directly and indirectly as a result of lost revenues, intellectual property, proprietary business information or other harm to their business. In some cases, the failure of our products may have been caused by third-party technology that we incorporate into our products. Even if failures are caused by third-party technology, we may be required to expend resources to address the failure and work with our customers to preserve our relationship with them. We could also potentially face claims for product liability from our customers if our products cause property damage or bodily injury. Although there are limitations of liability in our commercial agreements and we maintain technology errors and omissions liability and general liability insurance, our insurance may not cover potential claims of these types or may not be adequate to indemnify us for all liability that may be imposed. Any imposition of liability or litigation costs that are not covered by insurance or is in excess of our limitation of liability or our insurance coverage could harm our business.
A certain percentage of our sales are to a few customers, some of which are also competitors, and these customers generally have no minimum or long-term purchase commitments. The loss of, or a significant reduction in demand from, one or more key customers could materially and adversely affect our business, financial condition and results of operations.
Our product sales have been and continue to be concentrated among a small number of our direct end-user customers and channel partners as a result of how we sell our products. Under our business model, we sell directly to end user customers, through distributors, VARs and DMRs (which we collectively call our “channel partners”), as well as to OEMs. We sell to many end-user customers and channel partners on purchase orders, not under the terms of a binding long-term procurement agreement. Accordingly, they generally are not obligated to purchase any minimum product volume, and our relationships with them are terminable at will. In addition, recently we have focused our direct-sales business on the largest users of hierarchical storage architectures, the so-called “Hyper-scalers”; there are very few of these extremely large storage customers. During the fiscal years ended March 31, 2020 and March 31, 2019 no customers represented 10% or more of the Company’s total revenue. A significant reduction in orders from, or a loss of, one or more large customers would have a material adverse effect on our results of operations.
Some of our tape and disk products are incorporated into larger storage systems or solutions that are marketed and sold to end users by large OEM customers as well as channel partners. Because of this, we have limited market access to the end users who purchase from the OEMs and channel partners, which limits our ability to influence the end users’ purchasing decisions and to forecast their future purchases of our products. Revenue from OEM customers has decreased in recent years. Certain of our large OEM customers are also our competitors, and such customers could decide to reduce or terminate their purchases of our products for competitive reasons. These market conditions increase our reliance on these OEM and channel partners. Thus, a significant reduction, delay or cancellation of their orders with us would materially and adversely affect our results of operations.
A portion of our sales are to various agencies and departments of the U.S. federal government, and funding cuts to federal spending can adversely impact our revenue. In the past, we have experienced the impact of reduced government spending and temporary government shutdowns on our sales to government agencies. Future spending cuts by the U.S. federal government, temporary shutdowns of the U.S. federal government or changes in its procurement processes or criteria could decrease our sales to the federal government and could materially and adversely affect our results of operations.
Our results of operations depend on continuing and increasing market acceptance of our existing limited number of products and on new product introductions, which may not be successful, in which case our business, financial condition and results of operations may be materially and adversely affected.
A limited number of products comprise a significant majority of our sales, and due to rapid technological change in the industry, our future results of operations depend on our ability to develop and successfully introduce new products. To compete effectively, we must continually improve existing products and introduce new ones. We have devoted and expect to continue to devote considerable management and financial resources to these efforts. Since July 2018, we have introduced several new products that are designed to solve a variety of our customers’ pressing needs. Those products include:
• | F-Series: an all-flash NVMe storage array – designed for the most demanding media workloads |
• | R-Series: a ruggedized in-vehicle storage array purpose-built for autonomous vehicle development (to ingest large number of data streams) or for transportation surveillance applications; |
16
• | VS-Series: a highly resilient, hyper-converged surveillance storage system that meets all the needs of security teams; and |
• | Distributed Cloud Services: a set of Quantum services that offers cloud-like simplicity and economics for on-premise environments. |
We have seen market interest in each of these new product lines; however, we cannot provide assurance that:
• | Our new products will achieve market acceptance and significant market share, or that the markets for these products will continue or grow as we have anticipated; |
• | Our new products will be successfully or timely qualified with our customers by meeting customer performance and quality specifications which must occur before customers will place large product orders; or |
• | We will achieve high volume production of these new products in a timely manner, if at all; |
• | We will introduce additional new products in the time frame we are forecasting; or |
• | We will not experience technical, quality, performance-related or other difficulties that could prevent or delay the introduction and market acceptance of new products. |
If we are not successful in timely completion of our new product qualifications and then ramping sales to our key customers, our revenue and results of operations could be adversely impacted. In addition, if the quality of our products is not acceptable to our customers, this could result in customer dissatisfaction, lost revenue and increased warranty and repair costs.
We continue to face risks related to economic uncertainty and slow economic growth.
Uncertainty about economic conditions, particularly under the current circumstances caused by the COVID-19 pandemic, poses a risk as businesses may further reduce or postpone spending in response to reduced budgets, tightening of credit markets, negative financial news and declines in income or asset values which could adversely affect our business, financial condition and results of operations. The volatile economic conditions in recent years along with periods of economic uncertainty in various countries around the world has made planning more difficult for us. We continue to face risks related to uncertain tariff levels between countries where our products are manufactured and where they are sold, unstable political and economic conditions in Europe, including concerns about sovereign debt, and uncertainty related to the United Kingdom’s exit from the European Union and related political matters, which could negatively impact the U.S. and global economies and adversely affect our financial results. In addition, we may not be able to access capital markets in the near-term or our ability to access capital markets may be restricted. We will not be eligible to use a common short-form registration statement on Form S-3, which would better enable us to access capital markets, until November 2020. Our inability to access capital markets in an effective and efficient manner could have an impact on our ability to react to changing economic and business conditions and could also materially and adversely affect our ability to sustain our operations at their current levels.
Competition is intensifying in the data storage and protection market as a result of competitors introducing products based on new technology standards and merger and acquisition activity, which could materially and adversely affect our business, financial condition and results of operations.
Our competitors in the data storage and protection market are aggressively trying to advance and develop new technologies and products to compete against our technologies and products; consequently, we face the risk that customers could choose competitor products over ours. Competition in our markets is characterized by technological innovation and advancement. As a result of competition and new technology standards, our sales or gross margins could decline, which could materially and adversely affect our business, financial condition and results of operations. Some of those competitors, such as IBM, HPE, Seagate Technology and others, are much larger and have more diverse product offerings, and aggressively compete based on their reputations and greater size.
Technological developments and competition over the years in the tape automation market, and in the storage market in general, have resulted in decreased prices for tape automation products and our other product offerings. Pricing pressure is more pronounced in the tape automation market for entry-level products and less pronounced for enterprise products. Over time, the prices of our products and competitor products have decreased, but such products often incorporate new and/or different features and technologies from what we offered in prior years. We face risks that customers could choose competitors’ products over ours due to these features and technologies or
17
due to pricing differences. We address pricing pressure in three ways: first, by reducing production costs; second, by adding features to increase value to maintain a certain level of gross margin for our tape automation systems; and third, by selling the overall value of our technologies in solving the customer’s business challenges thereby changing the conversation from a pricing negotiation to a value discussion. However, short term cost reduction efforts, and the value discussions may not yield new sales. In addition, if competition further intensifies, or if there is additional industry consolidation, our sales and gross margins for tape automation systems could decline, which could materially and adversely affect our business, financial condition and results of operations.
Industry consolidation and competing technologies with device products, which include tape drives and removable hard drives, have resulted in decreased prices and increasingly commoditized device products. Additionally, the competitive landscape in the data storage and protection market could continue to change due to merger and acquisition activity. Such transactions may impact us in a number of ways. For instance, they could result in:
• | competitors consolidating, having greater resources and becoming more competitive with us; |
• | companies that we have not historically competed against entering into one or more of our primary markets and increasing competition in such market(s); |
• | customers that are also competitors becoming more competitive with us and/or reducing their purchase of our products; and |
• | competitors acquiring our current suppliers or business partners and negatively impacting our business model. |
These transactions also create uncertainty and disruption in the market because the timing of such a transaction and its degree of impact, or whether it will happen at all, are often unknown. Given these factors and others, such merger and acquisition activity may materially and adversely impact our business, financial condition and results of operations.
A significant decline in our media royalty or branded software revenues could materially and adversely affect our business, financial condition and results of operations.
Our media royalties and branded software revenues generate relatively greater profit margins than some of our other products, and can significantly impact our overall profitability. We receive media royalty revenue based on tape media cartridges sold by various tape media manufacturers and resellers. Under our patent and technology license agreements with these companies, each of the licensees determines the pricing and number of units of tape media cartridges that it sells. Our media royalty revenue varies depending on the level of sales of the various media cartridge offerings sold by the licensees and other factors, including:
• | The continued use by our customers of tape media for storage; |
• | The size of the installed base of devices and similar products that use tape media cartridges; |
• | The performance of our strategic licensing partners, which sell tape media cartridges; |
• | The relative growth in units of newer device products, since the associated media cartridges for newer products typically sell at higher prices than the media cartridges associated with older products; |
• | The media consumption habits and rates of end users; |
• | The pattern of device retirements; |
• | The level of channel inventories; and |
• | agreement on standards for newer generations of the tape media that generates our royalty revenue. |
Some of our products contain licensed, third-party technology that provides important product functionality and features. The loss or inability to obtain any such license could have a material adverse effect on our business.
Certain of our products contain technology licensed from third parties that provides important product functionality and features. We may not have continued access to this technology, for instance, if the licensing company ceased to exist, either from bankruptcy, dissolution or purchase by a competitor. In some cases, we may seek to enforce our contractual protections via litigation against the licensing company itself, which may cause us to incur significant legal or other costs and may not be resolved in our favor. Other legal actions, such as intellectual property actions, brought against the licensing company could also impact our future access to the technology. We also have limited visibility or control of the technology roadmap at the licensing company and cannot ensure that the licensing company will advance the roadmap of the licensed technology in the manner best for us. Any of these actions could negatively impact our technology licensing, thereby reducing the functionality or features of our products, and could
18
materially and adversely affect our business, financial condition and results of operations. We also face the risk of not being able to quickly implement a replacement technology or otherwise mitigate the risks associated with not having access to this licensed technology, which may also materially and adversely affect our business, financial condition and results of operations.
We have taken considerable steps towards reducing our cost structure. The steps we have taken may not reduce our cost structure to a level appropriate in relation to our future sales and therefore, these cost reductions may be insufficient to achieve profitability.
In the last several years, we have recorded significant restructuring charges and made cash payments to reduce our cost of sales and operating expenses to respond to adverse economic and industry conditions, to execute strategic management decisions and to rationalize our operations following acquisitions. During fiscal years 2018 through 2020 we have implemented restructuring plans to eliminate certain positions in the U.S. and internationally and to exit certain locations. These restructuring plans may result in decreases to our revenues or adversely affect our ability to grow our business in the future. Workforce reductions may also adversely affect employee morale and our ability to retain our employees. We may take future steps to further reduce our operating costs, including future cost reduction steps or restructurings in response to strategic decisions, adverse changes in our business or industry or future acquisitions. We may be unable to reduce our cost of sales and operating expenses at a rate and to a level appropriate in relation to our future sales, which may materially and adversely affect our business, financial condition and results of operations.
In addition, our ability to achieve the anticipated cost savings and other benefits from these restructuring plans within the expected time frame is subject to many estimates and assumptions. These estimates and assumptions are subject to significant economic, competitive and other uncertainties, some of which are beyond our control. If these estimates and assumptions are incorrect, if we experience delays, or if other unforeseen events occur, our business, financial condition and results of operations could be adversely affected.
Since May 2018, we have hired almost an entirely new executive team, including a new CEO and new CFO. In addition, prior year restructurings and the events that led to our restatement have resulted in a significant loss of employees. If we are unable to integrate our new executives, as well as retain skilled executives and other employees, our business could be materially and adversely impacted.
In May of 2018, we hired a new CFO, and in July 2018, we hired a new CEO. Since that time, we have hired several other new senior executives in many areas of our business, including sales, supply chain management, finance and legal. These changes were due in part to the events that caused us to restate our financial statements for the past several years. In addition, in fiscal 2016, 2017 and 2018, we laid off employees in order to reduce costs in response to declining sales. All of these factors have increased the possibility that employees may decide to leave our company to pursue their careers elsewhere.
We may not be able to integrate all of our new executives successfully. Further, we may be subject to continued turnover in our employee base or the inability to fill open headcount requisitions due to competition, concerns about our operational performance, business culture or other factors. In addition, we may need to rely on the performance of employees whose skill sets are not sufficiently developed to fulfill their expected job responsibilities. Any of these situations could disrupt our business, prevent us from implementing the policy and process changes advocated by new management, and otherwise impair or delay our ability to realize operational and strategic objectives and cause increased expenses and lost sales opportunities.
The loss of the services of any of our key employees, the inability to attract or retain qualified talent in the future, or delays in hiring required talent, particularly sales and engineering talent, could delay the development and introduction of our products or services and/or negatively affect our ability to sell our products or services.
If we do not successfully manage the changes that we have made and may continue to make to our infrastructure and management, our business could be disrupted, and that could adversely impact our results of operations and financial condition.
Managing change is an important focus for us. In recent years, we have implemented several significant initiatives involving our sales and marketing, product engineering and operations organizations, aimed at increasing our efficiency and better aligning these groups with our corporate strategy. In addition, we have reduced headcount to streamline and consolidate our supporting functions as appropriate in response to market or competitive conditions
19
and following past acquisitions and have increased our reliance on certain third-party business relationships. If we are unable to successfully manage the changes that we implement and detect and address issues as they arise, our business could be disrupted, and our results of operations and financial condition could be materially and adversely impacted.
Third-party intellectual property infringement claims could result in substantial liability and significant costs, and, as a result, our business, financial condition and results of operations may be materially and adversely affected.
From time to time, third parties allege that our products infringe their patented or proprietary technology and demand that we purchase a license from them. For example, we are currently in patent litigation with Realtime Data LLC d/b/a IXO, which has been stayed, described in Note 10: Commitments and Contingencies. The ultimate outcome of any license discussion or litigation, including the Realtime litigation, is uncertain. Adverse resolution of any third-party infringement claim could subject us to substantial liabilities and require us to refrain from manufacturing and selling certain products. In addition, the costs incurred in intellectual property litigation can be substantial, regardless of the outcome. As a result, our business, financial condition and results of operations could be materially and adversely affected.
If we fail to protect our intellectual property or if others use our proprietary technology without authorization, our competitive position may suffer.
Our future success and ability to compete depends in part on our proprietary technology. We rely on a combination of copyright, patent, trademark and trade secrets laws and nondisclosure agreements to establish and protect our proprietary technology. However, we cannot provide assurance that patents will be issued with respect to pending or future patent applications that we have filed or plan to file or that our patents will be upheld as valid or will prevent the development of competitive products or that any actions we have taken will adequately protect our intellectual property rights. We generally enter into confidentiality agreements with our employees, consultants, customers, potential customers, contract manufacturers and others as required, in which we strictly limit access to, and distribution of, our software and further limit the disclosure and use of our proprietary information.
Despite our efforts to protect our proprietary rights, unauthorized parties may attempt to copy or otherwise obtain or use our products or technology. Enforcing our intellectual property rights can sometimes only be accomplished through the use of litigation. Our competitors may also independently develop technologies that are substantially equivalent or superior to our technology. In addition, the laws of some foreign countries do not protect our proprietary rights to the same extent as the laws of the U.S.
We license certain of our software under “open source” licenses. Because of the characteristics of open source software licenses, it may be relatively easy for competitors, some of whom have greater resources than we have, to enter our markets and compete with us.
One of the characteristics of open source software is that the source code for our open source projects is publicly available, and anyone who obtains copies has a license under certain of our intellectual property rights, which, depending on the license, may include certain of our patents, to modify and redistribute the software and use it to compete in the marketplace. Such competition can develop without the degree of overhead and lead time required by traditional proprietary software companies. It is possible for competitors to use our open source project software to develop their own software, potentially reducing the demand for our solution and putting price pressure on our subscription offerings. We cannot guarantee that competitive pressure or the availability of new open source software will not result in price reductions, reduced operating margins and loss of market share, any one of which could harm our business, financial condition, results of operations and cash flows.
In addition, we use our own open source project software in our proprietary products. As a result, there is a risk that we may inadvertently release as open source certain code that was intended to be kept as proprietary, that reveals confidential information regarding the inner workings of our proprietary products, or that could enable competitors to more readily reverse engineer or replicate aspects of our proprietary technology that we would otherwise protect as trade secrets. We may also accept contributions from third parties to our open source projects, and it may be difficult for us to accurately determine the origin of the contributions and whether their use, including in our proprietary products, infringes, misappropriates or violates third-party intellectual property or other rights. The availability of certain of our own software in source code form may also enable others to detect and exploit security vulnerabilities in our products.
20
Our products may contain "open source" software and failure to comply with the terms of the open source license could have a material adverse effect on our competitive positions and financial results.
Certain products or technologies acquired or developed by us may include “open source” software. Open source software is typically licensed for use at no initial charge. Certain open source software licenses, however, require users of the open source software to license to others any software that is based on, incorporates or interacts with, the open source software under the terms of the open source license. Although we endeavor to comply fully with such requirements, third parties could claim that we are required to license larger portions of our software than we believe we are required to license under open source software licenses. If such claims were successful, they could adversely impact our competitive position and financial results by providing our competitors with access to sensitive information that may help them develop competitive products. In addition, our use of open source software may harm our business and subject us to intellectual property claims, litigation or proceedings in the future because:
• | open source license terms may be ambiguous and may subject us to unanticipated obligations regarding our products, technologies and intellectual property; |
• | open source software generally cannot be protected under trade secret law; and |
• | it may be difficult for us to accurately determine the origin of the open source code and whether the open source software infringes, misappropriates or violates third-party intellectual property or other rights. |
As a result of our global manufacturing and sales operations, we are subject to a variety of risks related to our business outside of the U.S., any of which could, individually or in the aggregate, have a material adverse effect on our business.
A significant portion of our manufacturing and sales operations and supply chain occurs in countries other than the U.S. We also have sales outside the U.S. We utilize contract manufacturers to produce and fulfill orders for our products and have suppliers for various components, several of which have operations located in foreign countries including China, Hungary, Japan, Malaysia, Singapore, Mexico, the Philippines and Thailand. Because of these operations, we are subject to a number of risks including:
• | import and export duties and value-added taxes; |
• | import, export and trade regulation changes that could erode our profit margins or restrict our ability to transport our products; |
• | reduced or limited protection of our intellectual property; |
• | compliance with multiple and potentially conflicting regulatory requirements and practices; |
• | commercial laws that favor local businesses; |
• | exposure to economic fluctuations including inflationary risk and continuing sovereign debt risk; |
• | shortages in component parts and raw materials; |
• | the burden and cost of complying with foreign and U.S. laws governing corporate conduct outside the U.S. including the Foreign Corrupt Practices Act, the United Kingdom Bribery Act and other similar regulations; |
• | adverse movement of foreign currencies against the U.S. dollar (the currency in which our results are reported) and uncertain global economic conditions generally; |
• | inflexible employee contracts and employment laws that may make it difficult to terminate or change the compensation structure for employees in some foreign countries in the event of business downturns; |
• | recruiting employees in highly competitive markets and wage inflation in certain markets; |
• | potential restrictions on the transfer of funds between countries; |
• | political instability, military, social and infrastructure risks, especially in emerging or developing economies; |
• | natural disasters, including earthquakes, flooding, typhoons and tsunamis; |
• | pandemics and epidemics, including the impact of COVID-19, and governmental restrictions on the operation of businesses, travel and other restrictions, which may vary from country-to-country; and |
• | cultural differences that affect the way we do business. |
Any or all of these risks could have a material adverse effect on our business.
21
Our quarterly results of operations have fluctuated significantly, and past quarterly results of operations should not be used to predict future performance.
Our quarterly results of operations have fluctuated significantly in the past and could fluctuate significantly in the future. As a result, our quarterly results of operations should not be used to predict future performance. Quarterly results of operations could be materially and adversely affected by a number of factors, including, but not limited to:
• | fluctuations in IT spending as a result of economic conditions or fluctuations in U.S. federal government spending; |
• | failure by our contract manufacturers to complete shipments in the last month of a quarter during which a substantial portion of our products are typically shipped; |
• | changes in product mix; |
• | new product announcements by us or our competitors which may cause delays in purchasing; |
• | customers canceling, reducing, deferring or rescheduling significant orders as a result of excess inventory levels, weak economic conditions or other factors; |
• | seasonality, including customer fiscal year-ends and budget availability impacting customer demand for our products; |
• | declines in large orders (defined as orders greater than $200,000); |
• | declines in royalty or software revenues; |
• | product development and ramp cycles and product performance or quality issues of ours or our competitors; |
• | poor execution of and performance against expected sales and marketing plans and strategies; |
• | reduced demand from our OEM or distributors, VAR, DMR and other large customers; |
• | increased competition which may, among other things, increase pricing pressure or reduce sales; |
• | restructuring actions or unexpected costs; and |
• | foreign exchange fluctuations. |
Our manufacturing, component production and service repair are outsourced to third-party contract manufacturers, component suppliers and service providers. If we cannot obtain products, parts and services from these third parties in a cost effective and timely manner that meets our customers’ expectations, this could materially and adversely impact our business, financial condition and results of operations.
Many aspects of our supply chain and operational results are dependent on the performance of third-party business partners. We use third-party contract manufacturers, service providers and/or product integrators in connection with our outsourced manufacturing model. We face a number of risks as a result of these relationships, including, among others:
Sole source of product supply
In many cases, our business partner may be the sole source of supply for the products or parts they manufacture, or the services they provide, for us. Because we are relying on one supplier, we are at greater risk of experiencing shortages, reduced production capacity or other delays in customer deliveries that could result in customer dissatisfaction, lost sales and increased expenses, each of which could materially damage customer relationships and result in lost revenue.
Cost and purchase commitments
We may not be able to control the costs for the products our business partners manufacture for us or the services they provide to us. They procure inventory to build our products based upon a forecast of customer demand that we provide. We could be responsible for the financial impact on the contract manufacturer, supplier or service provider of any reduction or product mix shift in the forecast relative to materials that they had already purchased under a prior forecast. Such a variance in forecasted demand could require us to pay them for finished goods in excess of current customer demand or for excess or obsolete inventory and generally incur higher costs. As a result, we could experience reduced gross margins and operating losses based on these purchase commitments. With respect to service providers, although we have contracts for most of our third-party repair service vendors, the contract period may not be the same as the underlying service contract with our customer. In such cases, we face risks that the third-party service provider may increase the cost of providing services over subsequent periods contracted with our customer.
22
Financial condition and stability
Our third-party business partners may suffer adverse financial or operational results or may be negatively impacted by global and local economic conditions. Therefore, we may face interruptions in the supply of product components or service as a result of financial or other volatility affecting our supply chain. We could suffer production downtime or increased costs to procure alternate products or services as a result of the possible inadequate financial condition of one or more of our business partners.
Quality and supplier conduct
We have limited control over the quality of products and components produced and services provided by our supply chain and third-party contract manufacturing and service business partners. Therefore, the quality of the products, parts or services may not be acceptable to our customers and could result in customer dissatisfaction, lost revenue and increased warranty costs. In addition, we have limited control over the manner in which our business partners conduct their business. Sub-tier suppliers selected by the primary third-party could have process control issues or could select components with latent defects that manifest over a longer period of time. We may face negative consequences or publicity as a result of a third-party’s failure to comply with applicable compliance, trade, environmental or employment regulations.
Any or all of these risks could have a material adverse effect on our business.
Because we may order components from suppliers in advance of receipt of customer orders for our products that include these components, we could face a material inventory risk if we fail to accurately forecast demand for our products or manage production, which could have a material and adverse effect on our results of operations and cash flows.
Although we use third parties to manufacture our products, in some cases we may retain the responsibility to purchase component inventory to support third-party manufacturing activities, which presents a number of risks that could materially and adversely affect our financial condition. For instance, as part of our component planning, we may place orders with or pay certain suppliers for components in advance of receipt of customer orders. We may occasionally enter into negotiated orders with vendors early in the manufacturing process of our products to ensure that we have sufficient components for our products to meet anticipated customer demand. Because the design and manufacturing process for these components can be complicated, it is possible that we could experience a design or manufacturing flaw that could delay or even prevent the production of the components for which we previously committed to pay. We also face the risk of ordering too many components, or conversely, not enough components, since supply orders are generally based on forecasts of customer orders rather than actual customer orders. In addition, in some cases, we may make non-cancelable order commitments to our suppliers for work-in-progress, supplier’s finished goods, custom sub-assemblies, discontinued (end-of-life) components and Quantum-unique raw materials that are necessary to meet our lead times for finished goods. If we cannot change or be released from supply orders, we could incur costs from the purchase of unusable components, either due to a delay in the production of the components or other supplies or as a result of inaccurately predicting supply orders in advance of customer orders. These same risks exist with our third-party contract manufacturing partners. Our business and results of operations could be materially and adversely affected if we incur increased costs or are unable to fulfill customer orders.
Because we rely heavily on distributors and other resellers to market and sell our products, if one or more distributors were to experience a significant deterioration in its financial condition or its relationship with us, this could disrupt the distribution of our products and reduce our revenue, which could materially and adversely affect our business, financial condition and results of operations.
We heavily utilize distributors and VARs to perform the functions necessary to market and sell our products in certain product and geographic segments. To fulfill this role, the distributor must maintain an acceptable level of financial stability, creditworthiness and the ability to successfully manage business relationships with the customers it serves directly. Under our distributor agreements with these companies, each of the distributors determines the type and amount of our products that it will purchase from us and the pricing of the products that it sells to its customers. If the distributor is unable to perform in an acceptable manner, we may be required to reduce the amount of sales of our product to the distributor or terminate the relationship. We may also incur financial losses for product returns from distributors or for the failure or refusal of distributors to pay obligations owed to us. Either scenario could result in fewer of our products being available to the affected market segments, reduced levels of
23
customer satisfaction and/or increased expenses, which could in turn have a material and adverse impact on our business, results of operations and financial condition.
Our stock price has experienced significant volatility in the recent past, and this significant volatility may continue to occur and could cause the trading price of our common stock to
decline.
Our stock price has been extremely volatile in the recent past. For example, the closing price of our common stock was $8.35 on January 29, 2020 and was $1.48 on March 18, 2020.
The trading price of our common stock may fluctuate in response to a number of events and factors, many of which are beyond our control, such as:
• | quarterly variations in our results of operations; |
• | failure to meet our expectations or the expectations of securities analysts and investors; |
• | failure to comply with applicable regulatory requirements or any investigations or enforcement actions; related to a potential failure to comply with applicable regulations; |
• | significant changes in our brand or reputation; |
• | new products, services, innovations and strategic developments by our competitors or us, or business combinations and investments by our competitors or us; |
• | changes in our capital structure, including issuance of additional debt or equity to the public, and the issuance of common stock upon exercise of our outstanding warrants; |
• | large or sudden purchases or sales of stock by existing or new investors; and |
• | the result of any litigation or governmental investigation, which could result in liabilities and reputational harm. |
Other macro-economic forces also could affect our stock price, including:
• | changes in interest and exchange rates; |
• | a continued widespread decline in the U.S. or global economy as a result of the continued impact of COVID-19 or other pandemics or natural disasters; |
• | fluctuations in the stock market in general and market prices for technology companies in particular; and |
• | tariffs imposed by the U.S. Government on sales originating in or being shipped to countries with which we have on-going trade or other political conflicts. |
Any of these events and factors may cause our stock price to rise or fall and may adversely affect our business and financing opportunities.
Our operation and design processes are subject to safety and environmental regulations which could lead to increased costs, or otherwise adversely affect our business, financial condition and results of operations.
We are subject to a variety of laws and regulations relating to, among other things, the use, storage, discharge and disposal of materials and substances used in our facilities as well as the safety of our employees and the public. Current regulations in the U.S. and various international jurisdictions restrict the use of certain potentially hazardous materials used in electronic products and components (including lead and some flame retardants), impose a “take back” obligation on manufacturers for the financing of the collection, recovery and disposal of electrical and electronic equipment and require extensive investigation into and disclosure regarding certain minerals used in our supply chain. We have implemented procedures and will likely continue to introduce new processes to comply with current and future safety and environmental legislation. However, measures taken now or in the future to comply with such legislation may adversely affect our costs or product sales by requiring us to acquire costly equipment or materials, redesign processes or to incur other significant expenses in adapting our supply chain, waste disposal and emission management processes. Furthermore, safety or environmental claims or our failure to comply with present or future regulations could result in the assessment of damages or imposition of fines against us or the suspension of affected operations, which could have an adverse effect on our business, financial condition and results of operations.
We are subject to many laws and regulations, and violation of or changes in those requirements could materially and adversely affect our business.
24
We are subject to numerous U.S. and international laws and requirements regarding corporate conduct, fair competition, corruption prevention and import and export practices, including laws applicable to U.S. government contractors. In addition, the SEC has adopted disclosure rules related to the supply of certain minerals originating from the conflict zones of the Democratic Republic of the Congo or adjoining countries, and we have incurred costs to comply with such regulations and may realize other costs relating to the sourcing and availability of minerals used in our products. While we maintain a rigorous corporate ethics and compliance program, we may be subject to increased regulatory scrutiny, significant monetary fines or penalties, suspension of business opportunities or loss of jurisdictional operating rights as a result of any failure to comply with those requirements. If we were to be subject to a compliance investigation, we may incur increased personnel and legal costs. In addition, if we identify that we have fallen out of compliance, we may proactively take corrective actions, including the filing of voluntary self-disclosure statements with applicable agencies, which could cause us to incur additional expenses and subject us to penalties and other consequences that could adversely affect our business, operating results and financial condition. Our supply and distribution models may be reliant upon the actions of our third-party business partners and we may also be exposed to potential liability resulting from their violation of these or other compliance requirements. Further, our U.S. and international business models are based on currently applicable regulatory requirements and exceptions. Changes in those requirements or exceptions could necessitate changes to our business model. Any of these consequences could materially and adversely impact our business and results of operations.
A cybersecurity breach into our products when used by our customers could adversely affect our ability to conduct our business, harm our reputation, expose us to significant liability or otherwise damage our financial results.
A cybersecurity breach into a system we have sold to a customer could negatively affect our reputation as a trusted provider of large-scale storage, archive and data protection products by adversely affecting the market’s perception of the security or reliability of our products and services. Many of our customers and partners store sensitive data on our products, and a cybersecurity breach related to our products could harm our reputation and potentially expose us to significant liability.
We also maintain sensitive data related to our employees, strategic partners and customers, including intellectual property, proprietary business information and personally identifiable information on our own systems. We employ sophisticated security measures; however, we may face threats across our infrastructure including unauthorized access, security breaches and other system disruptions.
It is critical to our business that our employees’, strategic partners’ and customers’ sensitive information remains secure and that our customers perceive that this information is secure. A cybersecurity breach could result in unauthorized access to, loss of, or unauthorized disclosure of such information. A cybersecurity breach could expose us to litigation, indemnity obligations, government investigations and other possible liabilities. Additionally, a cyber-attack, whether actual or perceived, could result in negative publicity which could harm our reputation and reduce our customers’ confidence in the effectiveness of our solutions, which could materially and adversely affect our business and results of operations. A breach of our security systems could also expose us to increased costs including remediation costs, disruption of operations or increased cybersecurity protection costs that may have a material adverse effect on our business. Although we maintain technology errors and omissions liability insurance, our insurance may not cover potential claims of these types or may not be adequate to indemnify us for inability that may be imposed. Any imposition or liability or litigation costs that are not covered by insurance or in excess of our insurance coverage could harm our business.
Our actual or perceived failure to adequately protect personal data could adversely affect our business, financial condition and results of operations.
A variety of state, national, foreign, and international laws and regulations apply to the collection, use, retention, protection, disclosure, transfer and other processing of personally identifiable information. These privacy- and data protection-related laws and regulations are evolving, with new or modified laws and regulations proposed and implemented frequently and existing laws and regulations subject to new or different interpretations. Compliance with these laws and regulations can be costly and can delay or impede the development of new products.
For example, in 2016, the European Parliament enacted the General Data Protection Regulation (or “GDPR”) which governs the collection, storage and use of personal information gathered in the European Union, regardless of
25
where such information is stored. In 2018, California enacted the Consumer Privacy Act (“CCPA”), which regulates information stored by companies doing business in California. The regulations implementing the CCPA have not yet been published, and the implementation of standards for GDPR compliance continue to evolve. Our products’ and internal systems’ actual or alleged failure to comply with applicable laws and regulations, or to protect personal data, could result in enforcement actions and significant penalties against us, which could result in negative publicity, increase our operating costs, subject us to claims or other remedies and have a material adverse effect on our business, financial condition, and results of operations.
We must maintain appropriate levels of service parts inventories. If we do not have sufficient service parts inventories, we may experience increased levels of customer dissatisfaction. If we hold excessive service parts inventories, we may incur financial losses.
We maintain levels of service parts inventories to satisfy future warranty obligations and also to earn service revenue by providing enhanced and extended warranty and repair service during and beyond the warranty period. We estimate the required amount of service parts inventories based on historical usage and forecasts of future warranty and extended warranty requirements, including estimates of failure rates and costs to repair, and out of warranty revenue. Given the significant levels of judgment inherently involved in the process, we cannot provide assurance that we will be able to maintain appropriate levels of service parts inventories to satisfy customer needs and to avoid financial losses from excess service parts inventories. If we are unable to maintain appropriate levels of service parts inventories, our business, financial condition and results of operations may be materially and adversely impacted.
From time to time we have made acquisitions. The failure to successfully integrate future acquisitions could harm our business, financial condition and results of operations.
As a part of our business strategy, we have in the past and may make acquisitions in the future, subject to certain debt covenants. For example, in March 2020, we acquired the ActiveScale object storage business from Western Digital Technologies, Inc. We may also make significant investments in complementary companies, products or technologies. If we fail to successfully integrate such acquisitions or significant investments, it could harm our business, financial condition and results of operations. Risks that we may face in our efforts to integrate any recent or future acquisitions include, among others:
• | failure to realize anticipated synergies from the acquisition; |
• | difficulties in assimilating and retaining employees; |
• | potential incompatibility of business cultures or resistance to change; |
• | coordinating geographically separate organizations; |
• | diversion of management’s attention from ongoing business concerns; |
• | coordinating infrastructure operations in a rapid and efficient manner; |
• | the potential inability to maximize our financial and strategic position through the successful incorporation of acquired technology and rights into our products and services; |
• | failure of acquired technology or products to provide anticipated revenue or margin contribution; |
• | insufficient revenues to offset increased expenses associated with the acquisition; |
• | costs and delays in implementing or integrating common systems and procedures; |
• | reduction or loss of customer orders due to the potential for market confusion, hesitation and delay; |
• | impairment of existing customer, supplier and strategic relationships of either company; |
• | insufficient cash flows from operations to fund the working capital and investment requirements; |
• | difficulties in entering markets in which we have no or limited direct prior experience and where competitors in such markets have stronger market positions; |
• | the possibility that we may not receive a favorable return on our investment, the original investment may become impaired, and/or we may incur losses from these investments; |
• | dissatisfaction or performance problems with the acquired company; |
• | the assumption of risks of the acquired company that are difficult to quantify, such as litigation; |
• | the cost associated with the acquisition, including restructuring actions, which may require cash payments that, if large enough, could materially and adversely affect our liquidity; and |
• | assumption of unknown liabilities or other unanticipated adverse events or circumstances. |
Acquisitions present many risks, and we may not realize the financial and strategic goals that were contemplated at the time of any transaction. We cannot provide assurance that we will be able to successfully integrate any business, products, technologies or personnel that we may acquire in the future, and our failure to do so could negatively impact our business, financial condition and results of operations.
26
If the future outcomes related to the estimates used in recording tax liabilities to various taxing authorities result in higher tax liabilities than estimated, then we would have to record tax charges, which could be material.
We have provided amounts and recorded liabilities for probable and estimable tax adjustments required by various taxing authorities in the U.S. and foreign jurisdictions. If events occur that indicate payments of these amounts will be less than estimated, then reversals of these liabilities would create tax benefits recognized in the periods when we determine the liabilities have reduced. Conversely, if events occur which indicate that payments of these amounts will be greater than estimated, then tax charges and additional liabilities would be recorded. In particular, various foreign jurisdictions could challenge the characterization or transfer pricing of certain intercompany transactions. In the event of an unfavorable outcome of such challenge, there exists the possibility of a material tax charge and adverse impact on the results of operations in the period in which the matter is resolved or an unfavorable outcome becomes probable and estimable.
Certain changes in stock ownership could result in a limitation on the amount of net operating loss and tax credit carryovers that can be utilized each year. Should we undergo such a change in stock ownership, it would severely limit the usage of these carryover tax attributes against future income, resulting in additional tax charges, which could be material.
We are exposed to fluctuations in foreign currency exchange rates, and an adverse change in foreign currency exchange rates relative to our position in such currencies could have a material adverse impact on our business, financial condition and results of operations.
We do not currently use derivative financial instruments for speculative purposes. We have used in the past, and may use in the future, foreign currency forward contracts and derivative instruments to hedge our exposure to foreign currency exchange rates. To the extent that we have assets or liabilities denominated in a foreign currency that are inadequately hedged or not hedged at all, we may be subject to foreign currency losses, which could be significant.
Our international operations can act as a natural hedge when both operating expenses and sales are denominated in local currencies. In these instances, although an unfavorable change in the exchange rate of a foreign currency against the U.S. dollar would result in lower sales when translated to U.S. dollars, operating expenses would also be lower in these circumstances. An increase in the rate at which a foreign currency is exchanged for U.S. dollars would require more of that particular foreign currency to equal a specified amount of U.S. dollars than before such rate increase. In such cases, and if we were to price our products and services in that particular foreign currency, we would receive fewer U.S. dollars than we would have received prior to such rate increase for the foreign currency. Likewise, if we were to price our products and services in U.S. dollars while competitors priced their products in a local currency, an increase in the relative strength of the U.S. dollar would result in our prices being uncompetitive in those markets. Such fluctuations in currency exchange rates could materially and adversely affect our business, financial condition and results of operations.
27
ITEM 1B. UNRESOLVED STAFF COMMENTS
None.
ITEM 2. PROPERTIES
Our headquarters are located in San Jose, California. We lease facilities in North America, Europe, and Asia Pacific. We believe our facilities are adequate for our current needs. The following is a summary of the significant locations and primary functions of those facilities as of March 31, 2020:
Location | Function | |
North America | ||
San Jose, CA | Corporate headquarters, administration, research and development | |
Irvine, CA | Administration, research and development, sales, service | |
Englewood, CO | Administration, research and development, sales, service, operations | |
Mendota Heights, MN | Research and development | |
Richardson, TX | Research and development | |
Bellevue, WA | Administration and sales | |
Europe | ||
Paris, France | Sales and service | |
Boehmenkirch, Germany | Service | |
Munich, Germany | Sales, service | |
Zurich, Switzerland | Administration, operations management | |
Bracknell, UK | Sales, service | |
London, UK | Sales | |
Ghent, Belgium | Research and development | |
Asia Pacific | ||
Adelaide, Australia | Research and development | |
Kuala Lumpur, Malaysia | Customer service | |
Seoul, Korea | Sales, service | |
Singapore City, Singapore | Administration, operations management, sales | |
Tokyo, Japan | Sales | |
ITEM 3. LEGAL PROCEEDINGS
See Item 8 of Part II, “Financial Statements and Supplementary Data — Note 10 — Commitments and Contingencies.”
ITEM 4. MINE SAFETY DISCLOSURE
None.
PART II
ITEM 5. MARKET FOR REGISTRANT’S COMMON EQUITY, RELATED STOCKHOLDER MATTERS AND ISSUER PURCHASES OF EQUITY SECURITIES
Market Information, Holders of Record, and Dividends
28
Our common stock was traded on the New York Stock Exchange ("NYSE") under the symbol “QTM.” On January 15, 2019, we were delisted from the NYSE.
On January 16, 2019, we started trading under the symbol “QMCO” on the OTC Pink, which is operated by OTC Markets Group Inc.
On February 4, 2020, we started trading on the Nasdaq Global Select Market under the symbol "QMCO".
The per share prices reflected in the following table represent the range of high and low sales prices of our common stock for the quarters indicated. The OTC Pink quotations do not reflect retail markup, markdown or commission and may not necessarily represent the prices of actual transactions during these quarterly periods.
High | Low | ||
Fiscal 2020 | |||
First quarter ended June 30, 2019 | $2.81 | $2.31 | |
Second quarter ended September 30, 2019 | 6.26 | 2.63 | |
Third quarter ended December 31, 2019 | 7.42 | 5.30 | |
Fourth quarter ended March 31, 2020 | 8.35 | 1.48 | |
Fiscal 2019 | |||
First quarter ended June 30, 2018 | $4.04 | $2.06 | |
Second quarter ended September 30, 2018 | 2.58 | 1.63 | |
Third quarter ended December 31, 2018 | 2.97 | 1.21 | |
Fourth quarter ended March 31, 2019 | 2.65 | 1.40 | |
As of June 22, 2020, we had 248 holders of record of our common stock.
We have no intention of paying cash dividends in the foreseeable future. Our ability to pay dividends is restricted by the covenants in our senior secured term loan and amended PNC credit facility agreements. See the section captioned “Liquidity and Capital Resources” in Item 7 Management’s Discussion and Analysis of Financial Condition and Results of Operations and Note 4: Debt to the consolidated financial statements.
Recent Sales of Unregistered Securities
During the year ended March 31, 2020, we did not sell any equity securities that were not registered under the Securities Act of 1933.
Issuer Purchases of Equity Securities
During the year ended March 31, 2020, there were no purchases of our common stock by or on behalf of us or any of our affiliated purchasers, as such term is defined in Rule 10b-18(a)(3) under the Securities Exchange Act of 1934.
29
Stock Performance Graph
The graph below compares the cumulative total return of a $100 investment in our common stock with the cumulative total return of the same investment in the Nasdaq and the S&P 500 Index from March 31, 2015 through March 31, 2020.
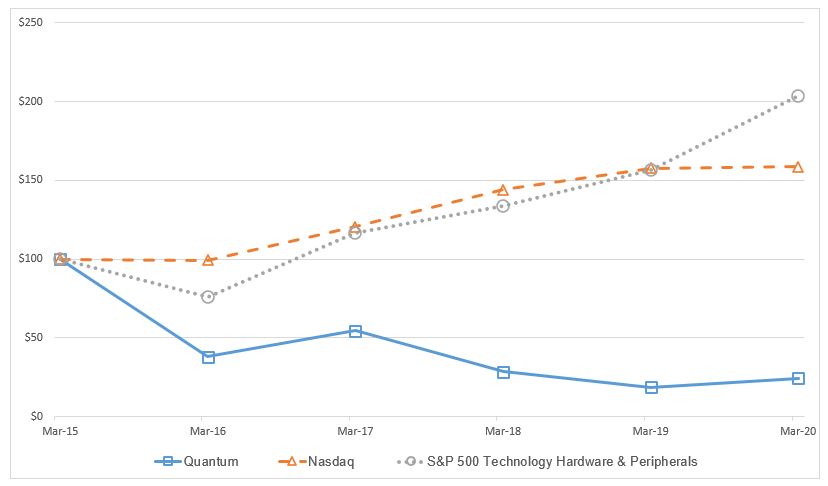
30
ITEM 6. SELECTED FINANCIAL DATA
You should read the following selected financial data in conjunction with Item 7, "Management's Discussion and Analysis of Financial Condition and Results of Operations," our audited consolidated financial statements included in Item 8, "Financial Statements and Supplementary Data" and other financial information included elsewhere in this Annual Report on Form 10-K.
For the Year Ended March 31, | |||||||||||||||||||
2020(1) | 2019 | 2018 | 2017 | 2016 | |||||||||||||||
(In thousands, except per share data) | |||||||||||||||||||
Statement of Operations Data | |||||||||||||||||||
Total revenue | $ | 402,949 | $ | 402,680 | $ | 437,684 | $ | 493,054 | $ | 479,843 | |||||||||
Total cost of revenue | 230,441 | 235,066 | 264,900 | 287,782 | 276,524 | ||||||||||||||
Gross margin | 172,508 | 167,614 | 172,784 | 205,272 | 203,319 | ||||||||||||||
Income (loss) from operations | 21,204 | (4,746 | ) | (28,622 | ) | 6,681 | (67,040 | ) | |||||||||||
Net loss | (5,210 | ) | (42,797 | ) | (43,346 | ) | (2,408 | ) | (75,626 | ) | |||||||||
Net loss per share - basic and diluted | $ | (0.14 | ) | $ | (1.20 | ) | $ | (1.25 | ) | $ | (0.07 | ) | $ | (2.30 | ) | ||||
Balance Sheet Data | |||||||||||||||||||
Total assets | $ | 165,995 | $ | 172,871 | $ | 202,639 | $ | 221,242 | $ | 230,812 | |||||||||
Short-term debt | 7,321 | 1,650 | 7,500 | 62,827 | 3,000 | ||||||||||||||
Long-term debt, net | 146,847 | 145,621 | 115,986 | 66,676 | 131,961 | ||||||||||||||
(1) 2020 amounts reflect our adoption of the new lease accounting standard, which resulted in the recording of $12.7 million of right-of-use assets and corresponding lease liabilities as of April 1, 2020, which were not retroactively adjusted and reflect our historical accounting policies. See Note 1 to our consolidated financial statements for additional information.
31
ITEM 7. | MANAGEMENT’S DISCUSSION AND ANALYSIS OF FINANCIAL CONDITION AND RESULTS OF OPERATIONS |
The following discussion and analysis of our financial condition and results of operations should be read together with our consolidated financial statements, the accompanying notes, and other information included in this Annual Report. In particular, the risk factors contained in Item 1A may reflect trends, demands, commitments, events, or uncertainties that could materially impact our results of operations and liquidity and capital resources.
The following discussion contains forward-looking statements, such as statements regarding COVID-19's anticipated impacts on our business, our future operating results and financial position, our business strategy and plans, our market growth and trends, and our objectives for future operations. Please see "Note Regarding Forward-Looking Statements" for more information about relying on these forward-looking statements.
OVERVIEW
We are a leader in storing and managing digital video and other forms of unstructured data. We help customers around the world to ingest, process, and analyze digital data at high speed, and preserve and protect it for decades. Our customers include some of the world’s largest corporations, government agencies, service providers, broadcasters, movie studios, sports leagues and teams, and enterprises in all industries. We work closely with a broad network of distributors, VARs, DMRs, OEMs and other suppliers to solve our customers most pressing business challenges.
We earn our revenue from the sale of products and services through our channel partners and our sales force. Our products are sold under both the Quantum brand name and the names of various OEM providers. Our portfolio of solutions includes:
• | StorNext scale out file storage: A line of products designed for the highest speed ingest, processing, and analysis of video and other forms of unstructured data. Powered by the StorNext file system software and data management platform, this product line includes new NVMe flash storage servers (F-series) and hybrid SSD/HDD storage arrays. |
• | Video Surveillance Systems: Quantum offers a broad portfolio of solutions designed for video surveillance and physical security, including network video recording servers (NVRs), hyperconverged (HCI) storage servers to host multiple physical security workloads, GPU-based analytics servers, and file and object storage systems for large scale surveillance archives. |
• | ActiveScale Object Storage: Massively scalable object storage systems used to preserve and protect data with the highest levels of data durability. |
• | Tape Storage: Low cost, ultra-secure storage systems for long term archiving and ransomware protection. Quantum provides both the storage systems and sells tape media under the Quantum brand. |
• | Backup Storage Systems: high-performance, scalable storage for backup and multi-site disaster recovery. |
• | Quantum Services: A full line of services including managed services and Storage-as-a-Service offerings, as well as maintenance, implementation, training and consulting services. |
COVID-19 IMPACT AND ASSOCIATED ACTIONS
Since the beginning of March 2020, COVID-19 has led governments and other authorities around the world, including federal, state and local authorities in the United States, to impose measures intended to reduce its spread, including restrictions on freedom of movement and business operations such as travel bans, border closings, business limitations and closures (subject to exceptions for essential operations and businesses), quarantines and shelter-in-place orders. These measures may remain in place for a significant period of time.
In light of these events, we have taken actions to protect the health and safety of our employees while continuing to serve our global customers as an essential business. We have implemented more thorough sanitation practices as outlined by health organizations and instituted social distancing policies at our locations around the world, including working from home, limiting the number of employees attending meetings, reducing the number of people in our sites at any one time, and suspending employee travel.
For many of our customers, the COVID-19 pandemic has significantly affected their business. Movie and television production has been paused, professional and collegiate sports seasons have been postponed or cancelled, and many corporations and enterprises have put information technology spending on hold while they assess the short- and long-term impact of the pandemic. While our supply chain remains intact and operating, we have experienced issues related to our logistics network. The reduced capacity within and across freight lanes (aircraft, personnel,
32
customs clearance, etc.) has caused late deliveries from re-routes and mis-shipments, as well as increased expedite and other charges to deliver and receive products. To date, we have experienced minimal impact on product availability, although future capacity constraints across the network due to lost capacity from factory down time, closures, as well as reduced staff and demand signal fluctuations are expected to impact product availability in the months and possibly quarters to come.
We believe that these social and economic impacts have had a negative effect on sales due to the decline in our customers' ability or willingness to purchase our products and services. The extent of the impact will depend, in part, on how long the negative trends in customer demand and supply chain levels will continue. We expect COVID-19 to significantly impact our financial condition, results of operations, and liquidity through at least our second quarter and likely much longer.
We will continue to actively monitor the situation and may take further actions altering our business operations that we determine are in the best interests of our employees, customers, partners, suppliers, and stakeholders, or as required by federal, state, or local authorities. See “The recent COVID-19 pandemic could adversely affect our business, results of operations and financial condition” in Part II, Item 1A, Risk Factors, of this Annual Report on Form 10-K for more information regarding the risks we face as a result of the COVID-19 pandemic.
NON-U.S. GAAP FINANCIAL MEASURES
To provide investors with additional information regarding our financial results, we have presented Adjusted EBITDA and Adjusted Net Income (Loss), non-U.S. GAAP financial measures defined below.
Adjusted EBITDA is a non-U.S. GAAP financial measure defined by us as net loss before interest expense, net, provision for income taxes, depreciation and amortization expense, stock-based compensation expense, restructuring charges, costs related to the financial restatement and related activities described in the Explanatory Paragraph and Note 2: – Restatement in our Annual Report on Form 10-K for the year ended March 31, 2019, and other non-recurring expenses.
Adjusted Net Income (Loss) is a non-U.S. GAAP financial measure defined by us as net loss before restructuring charges, stock-based compensation expense, costs related to the financial restatement and related activities described in the Explanatory Paragraph and Note 2: – Restatement in the Annual Report on Form 10-K for the year ended March 31, 2019 and other non-recurring (income) expenses. The Company calculates Adjusted Net Income (Loss) per Basic and Diluted share using the Company’s above-referenced definition of Adjusted Net Income (Loss).
The Company considers non-recurring expenses to be expenses that have not been incurred within the prior two years and are not expected to recur within the next two years. Such expenses include certain strategic and financial restructuring expenses.
We have provided below a reconciliation of Adjusted EBITDA and Adjusted Net Income (Loss) to Net Income (Loss), the most directly comparable U.S. GAAP financial measure. We have presented Adjusted EBITDA because it is a key measure used by our management and the board of directors to understand and evaluate our core operating performance and trends, to prepare and approve our annual budget and to develop short and long-term operating plans. In particular, we believe that the exclusion of the amounts eliminated in calculating Adjusted EBITDA can provide a useful measure for period-to-period comparisons of our core business performance. We believe Adjusted Net Income (Loss) and Adjusted Net Income (Loss) per Basic and Diluted Share serve as appropriate measures to be used in evaluating the performance of our business and help our investors better compare our operating performance over multiple periods. Accordingly, we believe that Adjusted EBITDA and Adjusted Net Income (Loss) provide useful information to investors and others in understanding and evaluating our operating results in the same manner as our management and our board of directors.
Our use of Adjusted EBITDA and Adjusted Net Income (Loss) have limitations as analytical tools, and you should not consider them in isolation or as a substitute for analysis of our financial results as reported under U.S. GAAP. Some of these limitations are as follows:
• | Although depreciation and amortization expense are non-cash charges, the assets being depreciated and amortized may have to be replaced in the future, and Adjusted EBITDA does not reflect cash capital expenditure requirements for such replacements or for new capital expenditure requirements; |
• | Adjusted EBITDA does not reflect: (1) interest and tax payments that may represent a reduction in cash available to us; (2) capital expenditures, future requirements for capital expenditures or contractual commitments; (3) changes in, or cash requirements for, working capital needs; (4) the potentially dilutive impact |
33
of stock-based compensation expense; (5) loss on debt extinguishment or (6) potential future restructuring expenses;
• | Adjusted Net Income (Loss) does not reflect: (1) potential future restructuring activities; (2) the potentially dilutive impact of stock-based compensation expense; (3) loss on debt extinguishment; or (4) potential future restructuring expenses; and |
• | Other companies, including companies in our industry, may calculate Adjusted EBITDA, Adjusted Net Income (Loss) or similarly titled measures differently, which reduces its usefulness as a comparative measure. |
Because of these and other limitations, you should consider Adjusted EBITDA and Adjusted Net Income (Loss) along with other U.S. GAAP-based financial performance measures, including various cash flow metrics and our U.S. GAAP financial results.
The following is a reconciliation of Adjusted EBITDA to the most comparable U.S. GAAP financial measure, Net Income (Loss) (dollars in thousands):
Year Ended March 31, | |||||||||||
2020 | 2019 | 2018 | |||||||||
Net loss | $ | (5,210 | ) | $ | (42,797 | ) | $ | (43,346 | ) | ||
Interest expense, net | 25,350 | 21,095 | 11,670 | ||||||||
Provision (benefit) for income taxes | 803 | 2,376 | (3,113 | ) | |||||||
Depreciation and amortization expense | 4,287 | 4,266 | 4,970 | ||||||||
Stock-based compensation expense | 6,748 | 3,409 | 5,394 | ||||||||
Restructuring charges | 1,022 | 5,570 | 8,474 | ||||||||
Loss on debt extinguishment | — | 17,458 | 6,934 | ||||||||
Cost related to financial restatement and related activities | 12,868 | 19,664 | 1,709 | ||||||||
Other non-recurring (income) expense, net | — | 1,500 | 2,848 | ||||||||
Adjusted EBITDA | $ | 45,868 | $ | 32,541 | $ | (4,460 | ) | ||||
The following is a reconciliation of Adjusted Net Income (Loss) to the most comparable U.S. GAAP financial measure, Net Income (Loss) (in thousands, except per share amounts): | |||||||||||
Year Ended March 31, | |||||||||||
2020 | 2019 | 2018 | |||||||||
Net loss | $ | (5,210 | ) | $ | (42,797 | ) | $ | (43,346 | ) | ||
Restructuring charges | 1,022 | 5,570 | 8,474 | ||||||||
Loss on debt extinguishment | — | 17,458 | 6,934 | ||||||||
Stock-based compensation | 6,748 | 3,409 | 5,394 | ||||||||
Cost related to financial restatement and related activities | 12,868 | 19,664 | 1,709 | ||||||||
Other non-recurring (income) expense, net | — | 1,500 | 2,848 | ||||||||
Adjusted net income (loss) | $ | 15,428 | $ | 4,804 | $ | (17,987 | ) | ||||
Adjusted net income (loss) per share: | |||||||||||
Basic | $ | 0.41 | $ | 0.14 | $ | (0.52 | ) | ||||
Diluted | $ | 0.34 | $ | 0.12 | $ | (0.52 | ) | ||||
Weighted average shares outstanding: | |||||||||||
Basic | 37,593 | 35,551 | 34,687 | ||||||||
Diluted | 45,059 | 40,515 | 34,687 | ||||||||
34
RESULTS OF OPERATIONS
Year Ended March 31, | |||||||||||
(dollars in thousands) | 2020 | 2019 | 2018 | ||||||||
Total revenue | $ | 402,949 | $ | 402,680 | $ | 437,684 | |||||
Total cost of revenue (1) | 230,441 | 235,066 | 264,900 | ||||||||
Gross profit | 172,508 | 167,614 | 172,784 | ||||||||
Operating expenses | |||||||||||
Research and development (1) | 36,301 | 32,113 | 38,562 | ||||||||
Sales and marketing (1) | 59,524 | 69,400 | 102,242 | ||||||||
General and administrative (1) | 54,457 | 65,277 | 52,128 | ||||||||
Restructuring charges | 1,022 | 5,570 | 8,474 | ||||||||
Total operating expenses | 151,304 | 172,360 | 201,406 | ||||||||
Income (loss) from operations | 21,204 | (4,746 | ) | (28,622 | ) | ||||||
Other income (expense) | (261 | ) | 2,878 | 767 | |||||||
Interest expense | (25,350 | ) | (21,095 | ) | (11,670 | ) | |||||
Loss on debt extinguishment, net | — | (17,458 | ) | (6,934 | ) | ||||||
Income (loss) before income taxes | (4,407 | ) | (40,421 | ) | (46,459 | ) | |||||
Income tax provision (benefit) | 803 | 2,376 | (3,113 | ) | |||||||
Net income (loss) | $ | (5,210 | ) | $ | (42,797 | ) | $ | (43,346 | ) | ||
(1) Includes stock-based compensation as follows:
Year Ended March 31, | |||||||||||
(dollars in thousands) | 2020 | 2019 | 2018 | ||||||||
Cost of revenue | $ | 452 | $ | 334 | $ | 725 | |||||
Research and development | 984 | 440 | 906 | ||||||||
Sales and marketing | 1,165 | 179 | 1,790 | ||||||||
General and administrative | 4,147 | 2,456 | 1,973 | ||||||||
Total | $ | 6,748 | $ | 3,409 | $ | 5,394 | |||||
35
Comparison of the Years Ended March 31, 2020 and 2019
Revenue
Year Ended March 31, | ||||||||||||||||||||
(dollars in thousands) | 2020 | % of revenue | 20191 | % of revenue | $ Change | % Change | ||||||||||||||
Product revenue | ||||||||||||||||||||
Secondary storage systems | $ | 111,672 | 28 | % | $ | 126,528 | 31 | % | $ | (14,856 | ) | (12 | )% | |||||||
Primary storage systems | 77,152 | 19 | % | 58,811 | 15 | % | 18,341 | 31 | % | |||||||||||
Devices and media | 62,344 | 15 | % | 59,315 | 15 | % | 3,029 | 5 | % | |||||||||||
Total product revenue | $ | 251,168 | 62 | % | $ | 244,654 | 61 | % | $ | 6,514 | 3 | % | ||||||||
Service revenue | 131,050 | 33 | % | 134,696 | 33 | % | (3,646 | ) | (3 | )% | ||||||||||
Royalty revenue | 20,731 | 5 | % | 23,330 | 6 | % | (2,599 | ) | (11 | )% | ||||||||||
Total revenue | $ | 402,949 | 100 | % | $ | 402,680 | 100 | % | $ | 269 | — | % | ||||||||
1 Primary and Secondary storage system revenue has been adjusted for fiscal year 2019 due to certain reclassifications from Primary to Secondary storage systems.
Product Revenue
In fiscal 2020, product revenue increased $6.5 million, or 3%, as compared to fiscal 2019. Primary storage systems represented $18.3 million of the increase driven by growth across both our Media & Entertainment and government vertical markets. Devices and media increased $3.0 million driven by the resolution of a legal dispute, which had caused a constraint on LTO tape supply between the two principal suppliers in the market. This was offset in part by a $14.9 million decrease in Secondary storage systems due to declines in our legacy enterprise backup business for both branded and OEM products.
Service Revenue
Service revenue decreased $3.6 million, or 3%, in fiscal 2020 compared to fiscal 2019. This decrease was due to reduced support renewals from our legacy backup customers, partially offset by new customer support agreements and installations.
Royalty Revenue
We receive royalties from third parties that license our LTO media patents through our membership in the LTO consortium. Royalty revenue decreased $2.6 million, or 11%, in fiscal 2020, as compared to fiscal 2019, related to overall declines in market unit volumes as the primary use of tape transitions from backup to archive workflows.
Gross Profit and Margin
Year Ended March 31, | ||||||||||||||||||||
(dollars in thousands) | 2020 | Gross margin % | 2019 | Gross margin % | $ Change | Basis point change | ||||||||||||||
Product gross profit | $ | 71,408 | 28.4 | % | $ | 64,808 | 26.5 | % | $ | 6,600 | 190 | |||||||||
Service gross profit | 80,369 | 61.3 | % | 79,476 | 59.0 | % | 893 | 230 | ||||||||||||
Royalty gross profit | 20,731 | 100.0 | % | 23,330 | 100.0 | % | (2,599 | ) | — | |||||||||||
Gross profit | $ | 172,508 | 42.8 | % | $ | 167,614 | 41.6 | % | $ | 4,894 | 120 | |||||||||
Product Gross Margin
Product gross margin increased 190 basis points in fiscal 2020, as compared with fiscal 2019. This increase was due primarily to cost reductions across a wide range of product offerings, and a mix weighted towards more profitable products.
Service Gross Margin
36
Service gross margin increased 230 basis points for fiscal 2020, as compared with the same period in 2019. This increase was due primarily to reductions in cost of service.
Royalty Gross Margin
Royalties do not have significant related cost of sales.
Operating expenses
Year Ended March 31, | ||||||||||||||||||||
(dollars in thousands) | 2020 | % of revenue | 2019 | % of revenue | $ Change | % Change | ||||||||||||||
Research and development | $ | 36,301 | 9 | % | $ | 32,113 | 8 | % | $ | 4,188 | 13 | % | ||||||||
Sales and marketing | 59,524 | 15 | % | 69,400 | 17 | % | (9,876 | ) | (14 | )% | ||||||||||
General and administrative | 54,457 | 14 | % | 65,277 | 16 | % | (10,820 | ) | (17 | )% | ||||||||||
Restructuring charges | 1,022 | — | % | 5,570 | 1 | % | (4,548 | ) | (82 | )% | ||||||||||
Total operating expenses | $ | 151,304 | 38 | % | $ | 172,360 | 43 | % | $ | (21,056 | ) | (12 | )% | |||||||
In fiscal 2020, research and development expense increased $4.2 million, or 13%, as compared with fiscal 2019. This increase was partially attributable to an increase in research and development headcount and professional services cost related to new product development.
In fiscal 2020, sales and marketing expenses decreased $9.9 million, or 14%, as compared with fiscal 2019. This decrease was driven by a decrease in compensation and benefits as the result of lower headcount and a decrease in marketing programs and professional services costs.
In fiscal 2020, general and administrative expenses decreased $10.8 million, or 17%, as compared with fiscal 2019. This decrease was driven primarily by lower costs related to our prior financial restatement and related activities, which we primarily incurred in fiscal 2019 compared to fiscal 2020, lower software expenses as we streamline our processes and tools throughout the company, decreased facilities expenses as we consolidate our physical footprint, and decreased bank fees. These decreases were partially offset by increases to stock compensation expense.
In fiscal 2020, restructuring expenses decreased $4.5 million, or 82%, as compared with fiscal 2019. This decrease was primarily due to the higher level of headcount reductions that occurred during fiscal 2019.
Other Income (Expense)
Year Ended March 31, | ||||||||||||||||||||
(dollars in thousands) | 2020 | % of revenue | 2019 | % of revenue | $ Change | % Change | ||||||||||||||
Other income (expense) | $ | (261 | ) | 0 | % | $ | 2,878 | 1 | % | $ | 3,139 | (109 | )% | |||||||
Interest expense | (25,350 | ) | (6 | )% | (21,095 | ) | (5 | )% | 4,255 | 20 | % | |||||||||
Loss on debt extinguishment | — | — | % | (17,458 | ) | (4 | )% | (17,458 | ) | (100 | )% | |||||||||
In fiscal 2020, other (income) expense, net decreased $3.1 million or 109%, compared to fiscal 2019. The decrease was primarily related to a gain on the disposal of an investment that occurred in fiscal 2019, and differences in foreign currency gains and losses during each period.
In fiscal 2020, interest expense increased $4.3 million, or 20%, as compared to fiscal 2019. This increase was primarily due to a higher average principal balance of our outstanding debt.
In fiscal 2019, we incurred a loss on debt extinguishment related to our Term Loan.
37
Year Ended March 31, | ||||||||||||||||||||
(dollars in thousands) | 2020 | % of revenue | 2019 | % of revenue | $ Change | % Change | ||||||||||||||
Income tax provision | $ | 803 | — | % | $ | 2,376 | 1 | % | $ | (1,573 | ) | (66 | )% | |||||||
Our income tax provision is primarily influenced by foreign and state income taxes. In fiscal 2020, the income tax provision decreased $1.6 million or 66%, compared to fiscal 2019, related primarily to an unfavorable $1.4 million valuation allowance recorded in fiscal 2019 for our Australian deferred tax assets.
Due to our history of net losses in the U.S., the protracted period for utilizing tax attributes in certain foreign jurisdictions, and the difficulty in predicting future results, we believe that we cannot rely on projections of future taxable income to realize most of our deferred tax assets. Accordingly, we have established a full valuation allowance against our U.S. and certain foreign net deferred tax assets. Significant management judgement is required in assessing our ability to realize any future benefit from our net deferred tax assets. We intend to maintain this valuation allowance until sufficient positive evidence exists to support its reversal. Our income tax expense recorded in the future will be reduced to the extent that sufficient positive evidence materializes to support a reversal of, or decrease in, our valuation allowance.
Comparison of the Years Ended March 31, 2019 and 2018
Revenue
Year Ended March 31, | ||||||||||||||||||||
(dollars in thousands) | 20191 | % of revenue | 20181 | % of revenue | $ Change | % Change | ||||||||||||||
Product revenue | ||||||||||||||||||||
Primary storage systems | $ | 58,811 | 15 | % | $ | 77,976 | 18 | % | $ | (19,165 | ) | (25 | )% | |||||||
Secondary storage systems | 126,528 | 31 | % | 121,402 | 28 | % | 5,126 | 4 | % | |||||||||||
Devices and media | 59,315 | 15 | % | 69,204 | 16 | % | (9,889 | ) | (14 | )% | ||||||||||
Total product revenue | $ | 244,654 | 61 | % | $ | 268,582 | 61 | % | $ | (23,928 | ) | (9 | )% | |||||||
Service revenue | 134,696 | 33 | % | 136,523 | 31 | % | (1,827 | ) | (1 | )% | ||||||||||
Royalty revenue | 23,330 | 6 | % | 32,579 | 8 | % | (9,249 | ) | (28 | )% | ||||||||||
Total revenue | $ | 402,680 | 100 | % | $ | 437,684 | 100 | % | $ | (35,004 | ) | (8 | )% | |||||||
1 Primary and Secondary storage system revenue has been adjusted for fiscal years 2019 and 2018 due to certain reclassifications from Primary to Secondary storage systems.
Product Revenue
In fiscal 2019, product revenue decreased $23.9 million, or 9%, as compared to fiscal 2018. Primary storage systems represented $19.2 million of the decrease, driven by declines in lower margin disk business in our U.S. domestic market. Devices and media decreased $9.9 million driven by a legal dispute, which caused a constraint on LTO tape supply between the two principal suppliers in the market. These were offset in part by secondary storage systems which increased $5.1 million driven by growth with our hyperscale customers.
Service Revenue
Service revenue was relatively flat, decreasing 1% in fiscal 2019 compared to fiscal 2018. This decrease was due to a combination of reduced new customer installations and reduced support renewals from our legacy customers.
Royalty Revenue
We receive royalties from third parties that license our LTO media patents through our membership in the LTO consortium. Royalty revenue decreased $9.2 million, or 28%, in fiscal 2019 as compared to fiscal 2018 due to overall declines in market unit volumes as the primary use of tape transitions from backup to archive workflows.
38
Gross Profit and Margin
Year Ended March 31, | ||||||||||||||||||||
(dollars in thousands) | 2019 | Gross margin % | 2018 | Gross margin % | $ Change | Basis point change | ||||||||||||||
Product gross profit | $ | 64,808 | 26.5 | % | $ | 62,471 | 23.3 | % | $ | 2,337 | 320 | |||||||||
Service gross profit | 79,476 | 59.0 | % | 77,734 | 56.9 | % | 1,742 | 210 | ||||||||||||
Royalty gross profit | 23,330 | 100.0 | % | 32,579 | 100.0 | % | (9,249 | ) | — | |||||||||||
Gross profit | $ | 167,614 | 41.6 | % | $ | 172,784 | 39.5 | % | $ | (5,170 | ) | 210 | ||||||||
Product Gross Margin
Product gross margin increased 320 basis points in fiscal 2019, as compared with fiscal 2018. This increase was due primarily to cost reductions across a wide range of product offerings, and a mix weighted towards more profitable products.
Service Gross Margin
Service gross margin increased 210 basis points in fiscal 2019, as compared with fiscal 2018. This increase was due primarily to reductions in cost of service.
Royalty Gross Margin
Royalties do not have significant related cost of sales.
Operating expenses
Year Ended March 31, | ||||||||||||||||||||
(dollars in thousands) | 2019 | % of revenue | 2018 | % of revenue | $ Change | % Change | ||||||||||||||
Research and development | $ | 32,113 | 8 | % | $ | 38,562 | 9 | % | $ | (6,449 | ) | (17 | )% | |||||||
Sales and marketing | 69,400 | 17 | % | 102,242 | 23 | % | (32,842 | ) | (32 | )% | ||||||||||
General and administrative | 65,277 | 16 | % | 52,128 | 12 | % | 13,149 | 25 | % | |||||||||||
Restructuring charges | 5,570 | 1 | % | 8,474 | 2 | % | (2,904 | ) | (34 | )% | ||||||||||
Total operating expenses | $ | 172,360 | 43 | % | $ | 201,406 | 46 | % | $ | (29,046 | ) | (14 | )% | |||||||
In fiscal 2019, research and development expense decreased $6.4 million, or 17%, as compared with fiscal 2018. This decrease was partially attributable to a decrease in research and development headcount and professional services cost as we drove efficiencies throughout the business.
In fiscal 2019, sales and marketing expenses decreased $32.8 million, or 32%, as compared with fiscal 2018. This decrease was driven by a decrease in compensation and benefits as the result of lower headcount and a decrease in marketing programs and professional services costs.
In fiscal 2019, general and administrative expenses increased $13.1 million, or 25%, as compared with fiscal 2018. This increase was driven primarily by higher costs in fiscal 2019 related to our prior financial restatement and related activities. and increases in stock compensation expense.
In fiscal 2019, restructuring expenses decreased $2.9 million, or 34%, as compared with fiscal 2018. This decrease was primarily due to the high level of headcount reductions that occurred during fiscal 2018.
39
Other Income (Expense)
Year Ended March 31, | |||||||||||||||||||
(dollars in thousands) | 2019 | % of revenue | 2018 | % of revenue | $ Change | % Change | |||||||||||||
Other income (expense) | $ | 2,878 | 1 | % | $ | 767 | 0 | % | (2,111 | ) | 275 | % | |||||||
Interest expense | (21,095 | ) | (5 | )% | (11,670 | ) | (3 | )% | 9,425 | (81 | )% | ||||||||
Loss on debt extinguishment | (17,458 | ) | (4 | )% | (6,934 | ) | (2 | )% | 10,524 | (152 | )% | ||||||||
In fiscal 2019, other (income) expense, net increased $2.1 million or 275%, compared to fiscal 2018. The increase was primarily due to a gain of $2.8 million on the disposal of an investment in fiscal 2019, offset by a $0.6 million reduction in foreign exchange gain as compared to fiscal 2018.
In fiscal 2019, interest expense increased $9.4 million, or 81%, as compared with fiscal 2018. This increase was primarily due to a higher average principal balance.
Loss on debt extinguishment increased $10.5 million or 152% in fiscal 2019 compared to fiscal 2018. The fiscal 2019 loss on debt extinguishment included $14.9 million related to the August 2018 modification of our TCW Term Loan, $1.8 million related to the August 2018 amendment to the PNC Credit Facility, and $0.8 million related to the December 2018 amendment to the PNC Credit Facility. During fiscal 2018, we recorded a loss on debt extinguishment of $6.9 million related to the February 2018 amendment to our TCW Term Loan.
Year Ended March 31, | ||||||||||||||||||||
(dollars in thousands) | 2019 | % of revenue | 2018 | % of revenue | $ Change | % Change | ||||||||||||||
Income tax provision (benefit) | $ | 2,376 | 1 | % | $ | (3,113 | ) | (1 | )% | $ | 5,489 | (176 | )% | |||||||
Our income tax provision is primarily influenced by foreign and state income taxes. In fiscal 2019, our income tax provision (benefit) increased $5.5 million or 176%, compared to fiscal 2018. The increase was primarily due to fiscal 2018 benefitting from a $2.1 million reserve release resulting from an audit settlement with a foreign taxing authority and a $2.9 million refundable tax credit resulting from the repeal of the Corporate Alternative Minimum Tax enacted as part of the Tax Cuts and Jobs Act in 2017.
40
Quarterly Results of Operations and Key Business Metrics
The following tables set forth our unaudited quarterly statements of operations data for the most recent eight quarters, as well as the percentage that each line item represents of our revenue for each quarter presented. The information for each quarter has been prepared on a basis consistent with our consolidated financial statements and reflect, in the opinion of management, all adjustments of a normal, recurring nature that are necessary for a fair presentation of the financial information contained in those statements. The following quarterly financial data should be read in conjunction with Item 7, "Management's Discussion and Analysis of Financial Condition and Results of Operations," our audited consolidated financial statements included in Item 8, "Financial Statements and Supplementary Data" and other financial information included elsewhere in this Annual Report on Form 10-K.
Three Months Ended | |||||||||||||||||||||||||||||||
Mar. 31, 2020 | Dec. 31, 2019 | Sep. 30, 2019 | June 30, 2019 | Mar. 31, 2019 | Dec. 31, 2018 | Sep. 30, 2018 | June 30, 2018 | ||||||||||||||||||||||||
Total revenue | $ | 88,215 | $ | 103,315 | $ | 105,789 | $ | 105,630 | $ | 103,277 | $ | 101,979 | $ | 89,912 | $ | 107,512 | |||||||||||||||
Total cost of revenue | 52,132 | 56,239 | 62,266 | 59,804 | 60,611 | 58,897 | 54,385 | 61,173 | |||||||||||||||||||||||
Gross profit | 36,083 | 47,076 | 43,523 | 45,826 | 42,666 | 43,082 | 35,527 | 46,339 | |||||||||||||||||||||||
Operating expenses: | |||||||||||||||||||||||||||||||
Research and development | 9,243 | 9,325 | 9,350 | 8,383 | 8,083 | 7,907 | 7,862 | 8,261 | |||||||||||||||||||||||
Sales and marketing | 13,423 | 15,421 | 14,824 | 15,856 | 16,603 | 16,990 | 16,682 | 19,125 | |||||||||||||||||||||||
General and administrative | 10,833 | 10,719 | 14,329 | 18,576 | 18,333 | 13,481 | 14,072 | 19,391 | |||||||||||||||||||||||
Restructuring charges | 2 | (64 | ) | 821 | 263 | 142 | 1,227 | 294 | 3,907 | ||||||||||||||||||||||
Total | 33,501 | 35,401 | 39,324 | 43,078 | 43,161 | 39,605 | 38,910 | 50,684 | |||||||||||||||||||||||
Income (loss) from operations | 2,582 | 11,675 | 4,199 | 2,748 | (495 | ) | 3,477 | (3,383 | ) | (4,345 | ) | ||||||||||||||||||||
Other income (expense) | 185 | (611 | ) | 76 | 89 | (992 | ) | 3,846 | (196 | ) | 220 | ||||||||||||||||||||
Interest expense | (6,272 | ) | (6,425 | ) | (6,347 | ) | (6,306 | ) | (6,286 | ) | (6,238 | ) | (4,636 | ) | (3,935 | ) | |||||||||||||||
Loss on debt extinguishment, net | — | — | — | — | — | (5,033 | ) | (12,425 | ) | — | |||||||||||||||||||||
Income (loss) before income taxes | (3,505 | ) | 4,639 | (2,072 | ) | (3,469 | ) | (7,773 | ) | (3,948 | ) | (20,640 | ) | (8,060 | ) | ||||||||||||||||
Income tax provision (benefit) | 332 | (110 | ) | 243 | 338 | 1,637 | 337 | 977 | (575 | ) | |||||||||||||||||||||
Net income (loss) | $ | (3,837 | ) | $ | 4,749 | $ | (2,315 | ) | $ | (3,807 | ) | $ | (9,410 | ) | $ | (4,285 | ) | $ | (21,617 | ) | $ | (7,485 | ) | ||||||||
Net income (loss) per share | |||||||||||||||||||||||||||||||
Basic | $ | (0.10 | ) | $ | 0.12 | $ | (0.06 | ) | $ | (0.11 | ) | $ | (0.26 | ) | $ | (0.12 | ) | $ | (0.61 | ) | $ | (0.21 | ) | ||||||||
Diluted | $ | (0.10 | ) | $ | 0.10 | $ | (0.06 | ) | $ | (0.11 | ) | $ | (0.26 | ) | $ | (0.12 | ) | $ | (0.61 | ) | $ | (0.21 | ) | ||||||||
Liquidity and Capital Resources
We consider liquidity in terms of the sufficiency of internal and external cash resources to fund our operating, investing and financing activities. Our principal sources of liquidity include cash from operating activities, cash and cash equivalents on our balance sheet and amounts available under our Amended PNC Credit Facility (as defined below). We require significant cash resources to meet obligations to pay principal and interest on our outstanding debt, provide for our research and development activities, fund our working capital needs, and make capital expenditures. Our future liquidity requirements will depend on multiple factors, including our research and development plans and capital asset needs. We are subject to the risks arising from COVID-19 which have caused substantial financial market volatility and have adversely affected both the U.S. and the global economy. We believe that these social and economic impacts have had a negative effect on sales due to the decline in our customers' ability or willingness to purchase our products and services. The extent of the impact will depend, in part, on how long the negative trends in customer demand and supply chain levels will continue. We expect the impact of COVID-19 to have a significant impact on our liquidity and capital resources.
We believe that our existing sources of liquidity including the Amended PNC Credit Facility will be sufficient to fund our cash flow requirements for at least the next 12 months. We may need or decide to seek additional funding through equity or debt financings but cannot guarantee that additional funds would be available on terms
41
acceptable to us, if at all. We believe we were in compliance with all covenants under the Credit Agreements as of the date of filing of this Annual Report on Form 10-K.
We had cash and cash equivalents of $6.4 million as of March 31, 2020, compared to $10.8 million as of March 31, 2019. These amounts exclude, as of both dates, $5.0 million in restricted cash that we are required to maintain under the Credit Agreements (as defined below) and $0.8 million and $1.1 million of short-term restricted cash, respectively.
Our outstanding long-term debt amounted to $146.8 million as of March 31, 2020, net of $13.7 million in unamortized debt issuance costs and $7.3 million in current portion of long-term debt, and $145.6 million as of March 31, 2019, net of $17.3 million in unamortized debt issuance costs and $1.7 million in current portion of long-term debt. Included in long-term debt as of March 31, 2020 was $2.6 million of borrowings under our Amended PNC Credit Facility, which had an additional $22.7 million of borrowing availability as of March 31, 2020 (subject to change based on certain financial metrics). See “—Liquidity and Long-Term Debt” and “—Contractual Obligations” below for further information about our outstanding debt.
We are subject to various debt covenants under our Credit Agreements (as defined below). Our failure to comply with our debt covenants could materially and adversely affect our financial condition and ability to service our obligations. See "Risks Related to our Business Operations" section of Item 1A Risk Factors.
Cash Flows
The following table summarizes our consolidated cash flows for the periods indicated.
Year Ended March 31, | |||||||||||
(Dollars in thousands) | 2020 | 2019 | 2018 | ||||||||
Cash provided by (used in): | |||||||||||
Operating activities | (1,181 | ) | $ | (16,859 | ) | $ | (5,032 | ) | |||
Investing activities | (4,599 | ) | 235 | (2,296 | ) | ||||||
Financing activities | 1,211 | 16,210 | (11,232 | ) | |||||||
Effect of exchange rate changes | (16 | ) | 62 | (145 | ) | ||||||
Net decrease in cash and cash equivalents and restricted cash | $ | (4,585 | ) | $ | (352 | ) | $ | (18,705 | ) | ||
Net Cash Used In Operating Activities
Net cash used in operating activities was $1.2 million for the year ended March 31, 2020, primarily attributable $20.9 million of changes in assets and liabilities due primarily to lower deferred revenue and manufacturing inventories, offset in part by certain non-cash items.
Net cash used in operating activities was $16.9 million in fiscal 2019, an increase of $11.8 million from $5.0 million in fiscal 2018, mainly reflecting a $25.4 million decrease in payables in fiscal 2019, compared to a $21.6 million increase in fiscal 2018, and an approximately $7.4 million increase in cash interest expense in fiscal 2019 compared to fiscal 2018, reflecting the terms of our refinanced debt. Our outstanding payables increased steadily through each quarter in 2018 due to our efforts to manage working capital, undertaken mainly to fund costs related to professional fees associated with the financial restatement activities and related civil ligation defense costs, and decreased steadily through fiscal 2019, except in the fourth quarter, reflecting a normalization of our payables cycles following our debt refinancing in late December 2018. These factors more than offset the impact of a $20.9 million improvement in loss from operations.
Net Cash Provided by (Used in) Investing Activities
Net cash used in investing activities was $4.6 million for the year ended March 31, 2020, primarily attributable to $2.6 million of capital expenditures and $2.0 million for the purchase of the ActiveScale business.
42
Net cash provided by investing activities was $0.2 million in fiscal 2019, reflecting investment income of $2.9 million related to an investment in an equity fund that was liquidated during the period, which more than offset $2.7 million in capital expenditures.
Net Cash Provided by (Used in) Financing Activities
Net cash provided by (used in) financing activities was $1.2 million, $16.2 million, and ($11.2) million for the years ended March 31, 2020, 2019 and 2018. Net cash provided by financing activities during the year ended March 31, 2020 related primarily to net borrowings under the Amended PNC Credit Facility. Activity during the years ended March 31, 2019 and 2018 related primarily to our debt refinancing activities, which are summarized under “—Debt Profile and Covenants” below and Note 4: Debt, to our consolidated financial statements.
Liquidity and Long-Term Debt
Paycheck Protection Program
On April 13, 2020, we entered into a Payment Protection Term Note (the “Note”) effective April 11, 2020 with PNC Bank, National Association as the lender (“Lender”) in an aggregate principal amount of $10.0 million pursuant to the Paycheck Protection Program under the Coronavirus Aid, Relief, and Economic Security (CARES) Act (the “PPP Loan”). Subject to the terms of the Note, the PPP Loan bears interest at a fixed rate of 1% per annum, with interest deferred up to a maximum of 10 months payable monthly thereafter, has an initial term of two years and is unsecured and guaranteed by the Small Business Administration. Under the terms of the PPP Loan, we may apply for forgiveness of the amount due on the Loan. We have utilized the proceeds from the PPP Loan for qualifying expenses and to apply for forgiveness of the PPP Loan in accordance with the terms of the CARES Act. However, we cannot be assured at this time that the PPP Loan will be forgiven partially, or in full.
Long-Term Debt
We are party to the Amended PNC Credit Agreement, a senior secured revolving credit facility in an available principal amount equal to the lesser of (i) $45.0 million and (ii) the “borrowing base” (as defined under the Amended PNC Credit Agreement). The Amended PNC Credit Facility had a borrowing base of $27.0 million as of March 31, 2020, $22.7 million of which was available at that date.
We are also party to a senior secured term loan facility in an aggregate principal amount of $165.2 million as of March 31, 2020 (the “Senior Secured Term Loan” and together with the Amended PNC Credit Agreement, the “Credit Agreements”). The Senior Secured Term Loan provides for a senior secured term loan of $150.0 million, drawn on the closing date, and a senior secured delayed draw term loan of $15.0 million, drawn in January 2019. The proceeds of the Senior Secured Term Loan were used to repay our previously outstanding long-term debt and fund our working capital requirements. Outstanding amounts under both Credit Agreements mature and are due and payable on December 27, 2023.
Pursuant to each Credit Agreement, we granted a lien to the respective agents under the Senior Secured Term Loan and the Amended PNC Credit Facility in all of the assets now owned or hereafter acquired by us, Quantum LTO Holdings, LLC, our wholly-owned direct subsidiary and any future domestic subsidiary that, at the respective agent’s discretion, becomes a loan party under the Credit Agreements, including, without limitation: accounts, books, chattel paper, commercial tort claims, deposit accounts, equipment, fixtures, general intangibles, inventory, investment property, intellectual property and intellectual property licenses, equity interests, securities accounts, supporting obligations, money and cash equivalents, and the proceeds and products of each of the foregoing, in each case, subject to certain exceptions.
The Credit Agreements contain certain customary financial and other covenants, including requirements to prepay the loans in an amount equal to 100% of the net cash proceeds from certain assets dispositions, subject to certain reinvestment rights and other exceptions, and restrictions on the payment of dividends and certain other payments (subject to certain exceptions). Amounts outstanding under the Credit Agreements may become due and payable upon the occurrence of specified events, which among other things include (subject to certain exceptions and cure periods): failure to pay principal, interest, or any fees when due; breach of any representation or warranty, covenant, or other agreement in the Credit Agreements; the occurrence of a bankruptcy or insolvency proceeding with respect us or any of our subsidiaries; any “Event of Default” with respect to other indebtedness involving an aggregate amount of $1.0 million or more; any lien created by the Credit Agreements or any related security
43
documents ceasing to be valid and perfected; the Credit Agreements or any related security documents or guarantees ceasing to be legal, valid, and binding upon the parties thereto; or a change of control.
Amendments to the Senior Secured Term Loan
On March 30, 2020 and March 31, 2020, we entered into amendments to the Senior Secured Term Loan which, among other things, included (a) a payment of $1.9 million of the interest due on April 1, 2020 in kind rather than in cash, and (b) the waiver of compliance with the total net leverage ratio covenant, as defined in the Senior Secured Term Loan agreement, for the quarter ended March 31, 2020.
On June 16, 2020, we entered into an amendment to the Senior Secured Term Loan (the "June 2020 Term Loan Amendment"). The amendment provides an additional borrowing of $20.0 million in senior secured term loans, which was immediately drawn in full. The amendment also: (a) waives the excess cash flow payment ("ECF") of $5.3 million for the year ended March 31, 2020; (b) defers payment of the scheduled amortization payments due on June 30, 2020, September 30, 2020, and December 31, 2020 until the maturity date; (c) amends the definition of “EBITDA” to, among other things, add an add-back for certain costs, expenses and fees incurred in connection with the transactions contemplated by the amendment; (d) waives compliance with the total net leverage ratio, fixed charge coverage ratio, minimum liquidity and minimum EBITDA financial covenants for the quarters ending on June 30, 2020, September 30, 2020, December 31, 2020, and March 31, 2021; (e) adds a financial covenant that requires a minimum monthly average undrawn availability of $7.0 million under the Amended PNC Credit Facility during the period from June 30, 2020 through and including May 31, 2021; and (f) amends the covenant levels for the total net leverage ratio, fixed charge coverage ratio, and minimum EBITDA financial covenants, commencing with the quarter ending June 30, 2021. The amendment modified the Equity Clawback to allow us to prepay up to 50% of the aggregate principal amount of the outstanding Senior Secured Term Loan balance with cash proceeds of a public offering of our common stock at a prepayment premium of 5% of the principal amount being repaid. The amendment also added an exit fee of 2% of the aggregate principal amount repaid excluding amounts repaid that are subject to the Equity Clawback.
Borrowings under the Senior Secured Term Loan bear interest at a rate per annum, at our option, equal to (a) the greater of (i) 3.00%, (ii) the Federal funds rate plus 0.50%, (iii) the LIBOR rate plus 1.0%, and (iv) the Prime rate as quoted by the Wall Street Journal, plus an applicable margin of 9.00% or (b) LIBOR Rate plus an applicable margin of 10.00%. Interest on the Senior Secured Term Loan is payable quarterly. Principal payments of 0.25% of the original balance of the Senior Secured Term Loan are due quarterly with the remaining principal balance due at maturity. Additionally, on an annual basis beginning with the fiscal year ending March 31, 2021, we will be required to perform a calculation of ECF which may require an additional payment of the principal in certain circumstances. The interest rate applicable to our borrowings under the Senior Secured Term Loan as of March 31, 2020 was 12.0%.
In connection with the June 2020 Term Loan Amendment, we issued to certain lenders and certain of their affiliates warrants (the “2020 Term Loan Warrants”) to purchase 3,400,000 shares our common stock, at an exercise price of $3.00 per share. The exercise price and the number of shares underlying the 2020 Term Loan Warrants are subject to adjustment in the event of specified events, including dilutive issuances of common stock linked equity instruments at a price lower than the exercise price of the 2020 Term Loan Warrants, a subdivision or combination of our common stock, a reclassification of our common stock or specified dividend payments. The 2020 Term Loan Warrants are exercisable until June 16, 2030. Upon exercise, the aggregate exercise price may be paid, at each warrant holder’s election, in cash or on a net issuance basis, based upon the fair market value of our common stock at the time of exercise.
Amendments to Amended PNC Credit Facility
On April 3, 2020, we entered into an amendment to the Amended PNC Credit Facility. The amendment amends certain terms, including to waive compliance with the total net leverage ratio and total leverage ratio covenants for the quarter ending March 31, 2020.
On June 16, 2020, we entered into an amendment to the Amended PNC Credit Facility. The amendment includes certain terms, including: (a) amend the definition of “EBITDA” to, among other things, an add-back for certain costs, expenses and fees incurred in connection with the transactions contemplated by the amendment; (b) waive compliance with the total net leverage ratio, total leverage ratio, fixed charge coverage ratio, minimum average liquidity and minimum EBITDA financial covenants for the quarters ending on June 30, 2020, September 30, 2020, December 31, 2020, and
44
March 31, 2021; (c) add a financial covenant that requires a minimum monthly average undrawn availability level of $7.0 million for the period from June 30, 2020 through and including May 31, 2021; (d) add a financial covenant that requires a minimum liquidity of not less than $10.0 million at the end of each quarter, beginning with the quarter ending June 30, 2021; and (e) amend the covenant levels for the total net leverage ratio, total leverage ratio, fixed charge coverage ratio, and minimum EBITDA financial covenants, commencing with the quarter ending June 30, 2021. The Amended PNC Credit Facility continues to include a covenant that requires a minimum of $5.0 million of PNC qualified cash at all times.
The amendment also adjusts the applicable margin for advances under the Amended PNC Credit Facility such that (i) advances designated as “Domestic Rate Loans” and “Swing Loans” will have an applicable margin of (a) 4.50% for the period from the June 16, 2020 until the date quarterly financial statements are delivered to PNC for the fiscal quarter ending June 30, 2021 and (b) thereafter, ranging from 3.50% to 4.50% based on our applicable total leverage ratio and (ii) advances designated as “LIBOR Rate Loans” will have an applicable margin of (a) 5.50% for the period from June 16, 2020, until the date quarterly financial statements are delivered to PNC for the fiscal quarter ending June 30, 2021 and (b) thereafter, ranging from 4.50% to 5.50% based on our applicable total leverage ratio.
Commitments and Contingencies
Our contingent liabilities consist primarily of certain financial guarantees, both express and implied, related to product liability and potential infringement of intellectual property. We have little history of costs associated with such indemnification requirements and contingent liabilities associated with product liability may be mitigated by our insurance coverage. In the normal course of business to facilitate transactions of our services and products, we indemnify certain parties with respect to certain matters, such as intellectual property infringement or other claims. We also have indemnification agreements with our current and former officers and directors. It is not possible to determine the maximum potential amount under these indemnification agreements due to the limited history of our indemnification claims, and the unique facts and circumstances involved in each particular agreement. Historically, payments made by us under these agreements have not had a material impact on our operating results, financial position or cash flows.
We are also subject to ordinary course of business litigation, See Note 10, Commitments and Contingencies, to our consolidated financial statements included elsewhere in this Annual Report on Form 10-K.
Off-Balance Sheet Arrangements
We do not currently have any other off-balance sheet arrangements and do not have any holdings in variable interest entities.
Contractual Obligations
Contractual obligations are cash amounts that we are obligated to pay as part of certain contracts that we have entered into during the normal course of business. Below is a table that shows our contractual obligations as of March 31, 2020 (in thousands):
Payments Due by Period | |||||||||||||||||||
(in thousands) | Total | Less than 1 year | 1 – 3 Years | 3 –5 Years | More than 5 years | ||||||||||||||
Long-term debt(1) | $ | 167,828 | $ | 7,321 | $ | 3,300 | $ | 157,207 | $ | — | |||||||||
Interest on long-term debt(2) | 69,419 | 17,546 | 37,874 | 13,999 | — | ||||||||||||||
Operating leases(3) | 19,405 | 4,878 | 6,496 | 5,142 | 2,889 | ||||||||||||||
Purchase obligations(4) | 19,487 | 19,487 | — | — | — | ||||||||||||||
Total | $ | 276,139 | $ | 49,232 | $ | 47,670 | $ | 176,348 | $ | 2,889 | |||||||||
(1) Represents nominal principal amount of debt outstanding under the Senior Secured Term Loan as of March 31, 2020. See Note 4: Debt, to our consolidated financial statements included elsewhere in this Annual Report on Form 10-K.
(2) Estimated interest payment obligations have been calculated for all periods assuming an interest rate of 12.0%, which was the rate applicable to outstanding amounts under the Senior Secured Term Loan as of March 31, 2020.
45
(3) Operating leases include leases of certain facilities under non-cancelable lease agreements and equipment leases for various types of office equipment. Some of the leases have renewal options ranging from one to ten years and others contain escalation clauses.
(4) Includes primarily contractual commitments to purchase inventory from contract manufacturers and other suppliers.
See Note 4: Debt, to our consolidated financial statements included elsewhere in this Annual Report on Form 10-K.
CRITICAL ACCOUNTING ESTIMATES AND POLICIES
The preparation of our consolidated financial statements in accordance with U.S. GAAP requires management to make judgments, estimates and assumptions that affect the amounts reported in the consolidated financial statements and accompanying notes included elsewhere in this Annual Report on Form 10-K. On an ongoing basis, we evaluate estimates, which are based on historical experience and on various other assumptions that we believe to be reasonable under the circumstances. We consider the following accounting policies to be critical to understanding our financial statements because the application of these policies requires significant judgment on the part of management, which could have a material impact on our financial statements if actual performance should differ from historical experience or if our assumptions were to change. The following accounting policies include estimates that require management’s subjective or complex judgments about the effects of matters that are inherently uncertain. For information on our significant accounting policies, including the policies discussed below, see Note 1: Description of Business and Summary of Significant Accounting Policies, to our consolidated financial statements.
Revenue Recognition
Our revenue is derived from three main sources: (1) Products, (2) Professional services and (3) Royalties. Our performance obligations are satisfied at a point in time or over time as stand ready obligations. The majority of our revenue is recognized at a point in time when products are accepted, installed or delivered. Product revenue is recognized at the point in time when the customer takes control of the product, which typically occurs at the point of shipment. Professional services revenue primarily consists of installation, consulting and training and hardware and software support. Installation services are typically completed within a short period of time and revenue from these services is recognized upon completion, while revenue from support plans is recognized ratably over the contractual term of the service contract. We license certain products under royalty arrangements, pursuant to which our licensees periodically provide us with reports containing units sold to end users subject to the royalties. The reports substantiate that our performance obligation has been satisfied and we recognize royalty revenue based on the reports or when amounts can be reasonably estimated.
There are significant judgements used when applying ASC Topic 606 to contracts with customers. Most of our contracts contain multiple goods and services designed to meet each customers’ unique storage needs. For contracts with multiple performance obligations, we allocate the transaction price to each performance obligation based on the relative standalone selling price of the good or service underlying each performance obligation. Where standalone selling price may not be directly observable (e.g., the performance obligation is not sold separately), we maximize the use of observable inputs by using information including reviewing discounting practices, performance obligations with similar customers and product groupings. We determined that invoice price is the best representation of what we expect to receive from the delivery of each performance obligation. This judgment is based on the fact that each storage solution is customizable to meet an individual customer’s needs and every product’s transaction price can vary depending on the mix of other products included in the same purchase order and there are no identifiable trends that provide a good representation of expected margin for each product.
Product revenue may be impacted by a variety of price adjustments or other factors, including rebates, returns and stock rotation. We use the expected value method to estimate the net consideration expected to be returned by the customer. We use historical data and current trends to drive our estimates. We record a reduction to revenue to account for these items that may result in variable consideration. We initially measure a returned asset at the carrying amount of the inventory, less any expected costs to recover the goods including potential decreases in value of the returned goods.
Income Taxes
Deferred tax assets and liabilities are recognized based on temporary differences between the financial reporting and tax bases of assets and liabilities, measured at the enacted tax rates expected to apply to taxable income in the
46
years in which those tax assets or liabilities are expected to be realized or settled. Based on the evaluation of available evidence, both positive and negative, we recognize future tax benefits, such as net operating loss carryforwards and tax credit carryforwards, to the extent that realizing these benefits is considered to be more likely than not.
A valuation allowance is provided if we believe it is more likely than not that all or some portion of the deferred tax asset will not be realized. An increase or decrease in the valuation allowance, if any, that results from a change in circumstances, and which causes a change in our judgment about the realizability of the related deferred tax asset, is included in the tax provision.
We recognize the financial statement effects of an uncertain income tax position when it is more likely than not, based on technical merits, that the position will be sustained upon examination. We reevaluate these uncertain tax positions on a quarterly basis. This evaluation is based on factors including, but not limited to, changes in facts or circumstances and changes in tax law. We recognize penalties and tax-related interest expense as a component of income tax expense in our consolidated statements of operations. See Note 9: Income Taxes, to our consolidated financial statements included elsewhere in this Annual Report on Form 10-K.
Inventories
Manufacturing Inventories
Our manufacturing inventory is recorded at the lower of cost or net realizable value, with cost being determined on a first-in, first-out (“FIFO”) basis. Costs include material, direct labor, and an allocation of overhead in the case of work in process. Adjustments to reduce the cost of manufacturing inventory to its net realizable value, if required, are made for estimated excess, obsolete or impaired balances. Factors influencing these adjustments include declines in demand, rapid technological changes, product life cycle and development plans, component cost trends, product pricing, physical deterioration and quality issues. Revisions to these adjustments would be required if these factors differ from our estimates.
Service Parts Inventories
Our service parts inventories are recorded at the lower of cost or net realizable value, with cost being determined on a FIFO basis. Service parts inventories consist of both component parts, which are primarily used to repair defective units, and finished units, which are provided for customer use permanently or on a temporary basis while the defective unit is being repaired. We record adjustments to reduce the carrying value of service parts inventory to its net realizable value and dispose of parts with no use and a net realizable value of zero. Factors influencing these adjustments include product life cycles, end of service life plans and the volume of enhanced or extended warranty service contracts. Estimates of net realizable value involve significant estimates and judgments about the future, and revisions would be required if these factors differ from our estimates.
Restructuring Reserves
Restructuring reserves include charges related to the realignment and restructuring of our business operations. These charges represent judgments and estimates of costs of severance, closure and consolidation of facilities and settlement of contractual obligations under our operating leases, including sublease rental rates, asset write-offs and other related costs. We reassess the reserve requirements to complete each individual plan under restructuring programs at the end of each reporting period. If these estimates change in the future or actual results differ from our estimates, additional charges may be required.
Recently Issued and Adopted Accounting Pronouncements
For recently issued and adopted accounting pronouncements, see Note 1: Business Description and Significant Accounting Policies, to our consolidated financial statements.
47
ITEM 7A. QUANTITATIVE AND QUALITATIVE DISCLOSURES ABOUT MARKET RISK
Market risk represents the risk of loss that may impact our financial position due to adverse changes in financial market prices and rates. Our market risk exposure is primarily a result of exposure due to potential changes in inflation or interest rates. We do not hold financial instruments for trading purposes.
Interest Rate Risk
Our primary interest rate risk exposure is to changing interest rates on our long-term debt. We had total outstanding debt of $165.2 million under our variable interest Senior Secured Term Loan as of March 31, 2020. Borrowings under the Senior Secured Term Loan bear interest at a rate per annum, at the Company’s option, equal to (a) the greater of (i) 3.00%, (ii) the Federal funds rate plus 0.50%, (iii) the LIBOR Rate based upon an interest period of 1 month plus 1.00%, and (iv) the Prime Rate as quoted by the Wall Street Journal, plus an applicable margin of 9.00% or (b) LIBOR Rate plus an applicable margin of 10.00%. Interest on the Senior Secured Term Loan is payable quarterly beginning in the fiscal quarter ended March 31, 2021 under the terms of our amended Senior Secured Term Loan. As of March 31, 2020, we have $2.6 million in borrowings on our Amended PNC Credit Facility. Based on the amounts outstanding, a 100-basis point increase or decrease in market interest rates as of March 31, 2020 would not result in a change to our annual interest expense. Our other long-term debt related to lease obligations have fixed interest rates and terms, and as such, we consider the associated risk to our results of operations from changes in market rates of interest applied to our lease obligations to be minimal.
Foreign Exchange Risk
We conduct business in certain international markets. Because we operate in international markets, we have exposure to different economic climates, political arenas, tax systems and regulations that could affect foreign exchange rates. Our primary exposure to foreign currency risk relates to transacting in foreign currency and recording the activity in U.S. dollars. Changes in exchange rates between the U.S. dollar and these other currencies will result in transaction gains or losses, which we recognize in our Consolidated Statements of Operations.
To the extent practicable, we minimize our foreign currency exposures by maintaining natural hedges between our assets and liabilities and revenues and expenses denominated in foreign currencies. We may enter into foreign exchange derivative contracts or other economic hedges in the future. Our goal in managing our foreign exchange risk is to reduce to the extent practicable our potential exposure to the changes that exchange rates might have on our earnings.
Inflation Risk
Based on our analysis of the periods presented, we believe that inflation has not had a material effect on our operating results. There can be no assurance that future inflation will not have an adverse impact on our operating results and financial condition.
48
ITEM 8. FINANCIAL STATEMENTS AND SUPPLEMENTARY DATA
INDEX TO CONSOLIDATED FINANCIAL STATEMENTS
49
Report of Independent Registered Public Accounting Firm
To the Board of Directors and Stockholders
Quantum Corporation
San Jose, California
Opinions on the Consolidated Financial Statements and Internal Control over Financial Reporting
We have audited the accompanying consolidated balance sheets of Quantum Corporation and its subsidiaries (the Company) as of March 31, 2020 and 2019 and the related consolidated statements of operations and comprehensive loss, stockholders' deficit, and cash flows for each of the years in the three-year period ended March 31, 2020, and the related notes (collectively referred to as the consolidated financial statements). We also have audited the Company's internal control over financial reporting as of March 31, 2020, based on criteria established in Internal Control-Integrated Framework (2013) issued by the Committee of Sponsoring Organizations of the Treadway Commission (COSO).
In our opinion, the consolidated financial statements referred to above present fairly, in all material respects, the financial position of the Company as of March 31, 2020 and 2019, and the results of its operations and its cash flows for each of the years in the three-year period ended March 31, 2020 in conformity with accounting principles generally accepted in the United States of America. Also, in our opinion, the Company maintained, in all material respects, effective internal control over financial reporting as of March 31, 2020, based on the criteria established in Internal Control - Integrated Framework (2013) issued by COSO.
Change in Accounting Principle
As discussed in Note 1 to the consolidated financial statements, the Company changed its method of accounting for leases in 2020 due to the adoption of Accounting Standards Update (ASU) No. 2016-02, Leases (Topic 842), using the modified retrospective transition method.
Basis for Opinion
The Company's management is responsible for these consolidated financial statements, for maintaining effective internal control over financial reporting, and for its assessment of the effectiveness of internal control over financial reporting, included in the accompanying Management Report on Internal Control Over Financial Reporting. Our responsibility is to express an opinion on the Company's consolidated financial statements and an opinion on the Company's internal control over financial reporting based on our audits. We are a public accounting firm registered with the Public Company Accounting Oversight Board (United States) ("PCAOB") and are required to be independent with respect to the Company in accordance with the U.S. federal securities laws and the applicable rules and regulations of the Securities and Exchange Commission and the PCAOB.
We conducted our audits in accordance with the standards of the PCAOB. Those standards require that we plan and perform the audit to obtain reasonable assurance about whether the consolidated financial statements are free of material misstatement, whether due to error or fraud, and whether effective internal control over financial reporting was maintained in all material respects.
Our audits of the consolidated financial statements included performing procedures to assess the risks of material misstatement of the consolidated financial statements, whether due to error or fraud, and performing procedures that respond to those risks. Such procedures included examining, on a test basis, evidence regarding the amounts and disclosures in the consolidated financial statements. Our audits also included evaluating the accounting principles used and significant estimates made by management, as well as evaluating the overall presentation of the consolidated financial statements. Our audits of internal control over financial reporting included obtaining an understanding of internal control over financial reporting, assessing the risk that a material weakness exists, and testing and evaluating the design and operating effectiveness of internal control based on the assessed risk. Our audit also included performing such other procedures as we considered necessary in the circumstances. We believe that our audits provide a reasonable basis for our opinions.
Definition and Limitations of Internal Control over Financial Reporting
50
A company's internal control over financial reporting is a process designed to provide reasonable assurance regarding the reliability of financial reporting and the preparation of financial statements for external purposes in accordance with generally accepted accounting principles. A company's internal control over financial reporting includes those policies and procedures that (1) pertain to the maintenance of records that, in reasonable detail, accurately and fairly reflect the transactions and dispositions of the assets of the company; (2) provide reasonable assurance that transactions are recorded as necessary to permit preparation of financial statements in accordance with generally accepted accounting principles, and that receipts and expenditures of the company are being made only in accordance with authorizations of management and directors of the company; and (3) provide reasonable assurance regarding prevention or timely detection of unauthorized acquisition, use, or disposition of the company's assets that could have a material effect on the consolidated financial statements.
Because of its inherent limitations, internal control over financial reporting may not prevent or detect misstatements. Also, projections of any evaluation of effectiveness to future periods are subject to the risk that controls may become inadequate because of changes in conditions, or that the degree of compliance with the policies or procedures may deteriorate.
Emphasis of Matter - COVID-19
As described in Note 1 to the consolidated financial statements, the World Health Organization has declared COVID-19 a global pandemic leading to broader global economic uncertainties. The measures taken by government agencies to slow the progression of the disease are uncertain and may adversely affect the Company’s result of operations, cash flows and financial position. Our opinions are not modified with respect to this matter.
/s/ ArmaninoLLP
San Ramon, California
June 24, 2020
We have served as the Company's auditor since 2019.
51
QUANTUM CORPORATION
CONSOLIDATED BALANCE SHEETS
(in thousands, except per share amounts)
March 31, | |||||||
2020 | 2019 | ||||||
Assets | |||||||
Current assets: | |||||||
Cash and cash equivalents | $ | 6,440 | $ | 10,790 | |||
Restricted cash | 830 | 1,065 | |||||
Accounts receivable, net of allowance for doubtful accounts of $1,247 and $68, respectively | 70,370 | 86,828 | |||||
Manufacturing inventories | 29,196 | 18,440 | |||||
Service parts inventories | 20,502 | 19,070 | |||||
Other current assets | 8,489 | 18,095 | |||||
Total current assets | 135,827 | 154,288 | |||||
Property and equipment, net | 9,046 | 8,437 | |||||
Restricted cash | 5,000 | 5,000 | |||||
Right-of-use assets, net | 12,689 | — | |||||
Other long-term assets | 3,433 | 5,146 | |||||
Total assets | $ | 165,995 | $ | 172,871 | |||
Liabilities and Stockholders’ Deficit | |||||||
Current liabilities: | |||||||
Accounts payable | $ | 36,949 | $ | 37,395 | |||
Deferred revenue | 81,492 | 90,407 | |||||
Accrued restructuring charges | — | 2,876 | |||||
Long-term debt, current portion | 7,321 | 1,650 | |||||
Accrued compensation | 14,957 | 17,117 | |||||
Other accrued liabilities | 17,535 | 29,025 | |||||
Total current liabilities | 158,254 | 178,470 | |||||
Deferred revenue | 37,443 | 36,733 | |||||
Long-term debt, net of current portion | 146,847 | 145,621 | |||||
Operating lease liability | 10,822 | — | |||||
Other long-term liabilities | 11,154 | 11,827 | |||||
Total liabilities | 364,520 | 372,651 | |||||
Commitments and Contingencies (Note 10) | |||||||
Stockholders’ deficit | |||||||
Preferred stock: | |||||||
Preferred stock, 20,000 shares authorized; no shares issued as of March 31, 2020 and 2019 | — | — | |||||
Common stock: | |||||||
Common stock, $0.01 par value; 125,000 shares authorized; 39,905 and 36,040 shares issued and outstanding at March 31, 2020 and 2019, respectively | 399 | 360 | |||||
Additional paid-in capital | 505,762 | 499,224 | |||||
Accumulated deficit | (703,164 | ) | (697,954 | ) | |||
Accumulated other comprehensive loss | (1,522 | ) | (1,410 | ) | |||
Total stockholders' deficit | (198,525 | ) | (199,780 | ) | |||
Total liabilities and stockholders' deficit | $ | 165,995 | $ | 172,871 | |||
The accompanying notes are an integral part of these consolidated financial statements.
52
QUANTUM CORPORATION
CONSOLIDATED STATEMENTS OF OPERATIONS AND COMPREHENSIVE LOSS
(in thousands, except per share amounts)
Year Ended March 31, | |||||||||||
2020 | 2019 | 2018 | |||||||||
Revenue: | |||||||||||
Product | $ | 251,168 | $ | 244,654 | $ | 268,582 | |||||
Service | 131,050 | 134,696 | 136,523 | ||||||||
Royalty | 20,731 | 23,330 | 32,579 | ||||||||
Total revenue | 402,949 | 402,680 | 437,684 | ||||||||
Cost of revenue: | |||||||||||
Product | 179,760 | 179,846 | 206,111 | ||||||||
Service | 50,681 | 55,220 | 58,789 | ||||||||
Total cost of revenue | 230,441 | 235,066 | 264,900 | ||||||||
Gross profit | 172,508 | 167,614 | 172,784 | ||||||||
Operating expenses: | |||||||||||
Research and development | 36,301 | 32,113 | 38,562 | ||||||||
Sales and marketing | 59,524 | 69,400 | 102,242 | ||||||||
General and administrative | 54,457 | 65,277 | 52,128 | ||||||||
Restructuring charges | 1,022 | 5,570 | 8,474 | ||||||||
Total operating expenses | 151,304 | 172,360 | 201,406 | ||||||||
Income (loss) from operations | 21,204 | (4,746 | ) | (28,622 | ) | ||||||
Other income (expense), net | (261 | ) | 2,878 | 767 | |||||||
Interest expense | (25,350 | ) | (21,095 | ) | (11,670 | ) | |||||
Loss on debt extinguishment, net | — | (17,458 | ) | (6,934 | ) | ||||||
Net loss before income taxes | (4,407 | ) | (40,421 | ) | (46,459 | ) | |||||
Income tax provision (benefit) | 803 | 2,376 | (3,113 | ) | |||||||
Net loss | $ | (5,210 | ) | $ | (42,797 | ) | $ | (43,346 | ) | ||
Net loss per share - basic and diluted | $ | (0.14 | ) | $ | (1.20 | ) | $ | (1.25 | ) | ||
Weighted average shares - basic and diluted | 37,593 | 35,551 | 34,687 | ||||||||
Net loss | $ | (5,210 | ) | $ | (42,797 | ) | $ | (43,346 | ) | ||
Foreign currency translation adjustments, net | (112 | ) | (1,136 | ) | 1,402 | ||||||
Total comprehensive loss | $ | (5,322 | ) | $ | (43,933 | ) | $ | (41,944 | ) | ||
The accompanying notes are an integral part of these consolidated financial statements.
53
QUANTUM CORPORATION
CONSOLIDATED STATEMENTS OF CASH FLOWS
(In thousands)
Year Ended March 31, | |||||||||||
2020 | 2019 | 2018 | |||||||||
Operating activities | |||||||||||
Net loss | $ | (5,210 | ) | $ | (42,797 | ) | $ | (43,346 | ) | ||
Adjustments to reconcile net loss to net cash used in operating activities: | |||||||||||
Depreciation and amortization | 4,287 | 4,266 | 4,970 | ||||||||
Amortization of debt issuance costs | 4,017 | 2,825 | 1,537 | ||||||||
Paid-in-kind interest | 1,858 | — | — | ||||||||
Provision for manufacturing and service inventories | 6,255 | 8,851 | 8,146 | ||||||||
Tax benefit from settlement and Tax Reform Act | — | — | (3,952 | ) | |||||||
Stock-based compensation | 6,748 | 3,409 | 5,394 | ||||||||
Deferred income taxes | 458 | 2,356 | 69 | ||||||||
Bad debt expense | 1,221 | 315 | 295 | ||||||||
Unrealized foreign exchange (gain) loss | 128 | (224 | ) | 1,437 | |||||||
Non-cash loss on debt extinguishment | — | 17,851 | 6,962 | ||||||||
(Gain) loss on investment | — | (2,729 | ) | 118 | |||||||
Other non-cash | — | 1,795 | 566 | ||||||||
Changes in assets and liabilities, net of effect of acquisition: | |||||||||||
Accounts receivable | 15,237 | 8,054 | 6,510 | ||||||||
Manufacturing inventories | (11,092 | ) | 13,054 | (2,613 | ) | ||||||
Service parts inventories | (3,817 | ) | (3,506 | ) | (6,760 | ) | |||||
Accounts payable | (768 | ) | (25,356 | ) | 21,647 | ||||||
Deferred revenue | (11,334 | ) | (8,367 | ) | 4,228 | ||||||
Accrued restructuring charges | (2,876 | ) | (2,943 | ) | (463 | ) | |||||
Accrued compensation | (2,161 | ) | (2,342 | ) | (4,330 | ) | |||||
Other assets and liabilities | (4,132 | ) | 8,629 | (5,447 | ) | ||||||
Net cash used in operating activities | (1,181 | ) | (16,859 | ) | (5,032 | ) | |||||
Investing activities | |||||||||||
Purchases of property and equipment | (2,633 | ) | (2,708 | ) | (2,584 | ) | |||||
Cash distributions from investments | — | 2,943 | 288 | ||||||||
Business acquisition | (1,966 | ) | — | — | |||||||
Net cash provided by (used in) investing activities | (4,599 | ) | 235 | (2,296 | ) | ||||||
Financing activities | |||||||||||
Borrowings of long-term debt and credit facility | 331,632 | 507,707 | 367,755 | ||||||||
Repayments of long-term debt and credit facility | (330,250 | ) | (491,143 | ) | (316,053 | ) | |||||
Repayments of convertible subordinated debt | — | — | (62,827 | ) | |||||||
Payment of taxes due upon vesting of restricted stock | (171 | ) | (354 | ) | (1,822 | ) | |||||
Proceeds from issuance of common stock | — | — | 1,715 | ||||||||
Net cash provided by (used in) financing activities | 1,211 | 16,210 | (11,232 | ) | |||||||
Effect of exchange rate changes on cash and cash equivalents | (16 | ) | 62 | (145 | ) | ||||||
Net change in cash, cash equivalents and restricted cash | (4,585 | ) | (352 | ) | (18,705 | ) | |||||
Cash and cash equivalents at beginning of period | 16,855 | 17,207 | 35,912 | ||||||||
Cash and cash equivalents at end of period | $ | 12,270 | $ | 16,855 | $ | 17,207 | |||||
Supplemental disclosure of cash flow information | |||||||||||
Cash paid for interest | $ | 16,488 | $ | 17,677 | $ | 10,244 | |||||
Cash paid for income taxes, net of refunds | $ | (490 | ) | $ | 68 | $ | 1,455 | ||||
Non-cash transactions | |||||||||||
Purchases of property and equipment included in accounts payable | $ | 368 | $ | 105 | $ | 173 | |||||
Transfer of inventory to property and equipment | $ | 400 | $ | 408 | $ | 1,036 | |||||
Payment of litigation settlements with insurance proceeds | $ | 8,950 | $ | — | $ | — | |||||
The following table provides a reconciliation of cash, cash equivalents and restricted cash reported within the consolidated balance sheets that sum to the total of the same such amounts shown in the statement of cash flows: | |||||||||||
Cash and cash equivalents | $ | 6,440 | $ | 10,790 | $ | 10,865 | |||||
Restricted cash, current | 830 | 1,065 | 1,342 | ||||||||
Restricted cash, long-term | 5,000 | 5,000 | 5,000 | ||||||||
Total cash, cash equivalents and restricted cash at the end of period | $ | 12,270 | $ | 16,855 | $ | 17,207 | |||||
The accompanying notes are an integral part of these consolidated financial statements.
54
QUANTUM CORPORATION
CONSOLIDATED STATEMENTS OF STOCKHOLDERS’ DEFICIT
(in thousands)
Common Stock | Additional Paid-in Capital | Accumulated Deficit | Accumulated Other Comprehensive Loss | Total Stockholders' Deficit | ||||||||||||||||||
Shares | Amount | |||||||||||||||||||||
Balance, March 31, 2017 | 34,063 | $ | 340 | $ | 473,851 | $ | (611,811 | ) | $ | (1,676 | ) | $ | (139,296 | ) | ||||||||
Net loss | — | — | — | (43,346 | ) | — | (43,346 | ) | ||||||||||||||
Foreign currency translation adjustments, net | — | — | — | — | 1,402 | 1,402 | ||||||||||||||||
Shares issued under employee stock purchase plan | 316 | 3 | 1,712 | — | — | 1,715 | ||||||||||||||||
Shares issued under employee incentive plans, net | 1,064 | 11 | (1,827 | ) | — | — | (1,816 | ) | ||||||||||||||
Share-based compensation | — | — | 5,990 | — | — | 5,990 | ||||||||||||||||
Reclassifications of liability classified warrants to equity | — | — | 1,884 | — | — | 1,884 | ||||||||||||||||
Balance, March 31, 2018 | 35,443 | 354 | 481,610 | (655,157 | ) | (274 | ) | (173,467 | ) | |||||||||||||
Net loss | — | — | — | (42,797 | ) | — | (42,797 | ) | ||||||||||||||
Foreign currency translation adjustments, net | — | — | — | — | (1,136 | ) | (1,136 | ) | ||||||||||||||
Shares issued under employee incentive plans, net | 597 | 6 | (360 | ) | — | — | (354 | ) | ||||||||||||||
Share-based compensation | — | — | 3,409 | — | — | 3,409 | ||||||||||||||||
Reclassifications of liability classified warrants to equity | — | — | 14,565 | — | — | 14,565 | ||||||||||||||||
Balance, March 31, 2019 | 36,040 | 360 | 499,224 | (697,954 | ) | (1,410 | ) | (199,780 | ) | |||||||||||||
Net loss | — | — | — | (5,210 | ) | — | (5,210 | ) | ||||||||||||||
Foreign currency translation adjustments, net | — | — | — | — | (112 | ) | (112 | ) | ||||||||||||||
Shares issued under employee incentive plans, net | 1,082 | 11 | (182 | ) | — | — | (171 | ) | ||||||||||||||
Shares issued from warrants exercised, net | 2,783 | 28 | (28 | ) | — | — | — | |||||||||||||||
Share-based compensation | — | — | 6,748 | — | — | 6,748 | ||||||||||||||||
Balance, March 31, 2020 | 39,905 | $ | 399 | $ | 505,762 | $ | (703,164 | ) | $ | (1,522 | ) | $ | (198,525 | ) | ||||||||
The accompanying notes are an integral part of these consolidated financial statements.
55
INDEX TO NOTES TO CONDENSED CONSOLIDATED FINANCIAL STATEMENTS
Page | ||
Note 1: | ||
Note 2: | ||
Note 3: | ||
Note 4: | ||
Note 5: | ||
Note 6: | ||
Note 7: | ||
Note 8: | ||
Note 9: | ||
Note 10: | ||
Note 11: | ||
Note 12: | ||
NOTES TO CONSOLIDATED FINANCIAL STATEMENTS
NOTE 1: DESCRIPTION OF BUSINESS AND SIGNIFICANT ACCOUNTING POLICIES
Description of Business
Quantum Corporation, together with its consolidated subsidiaries (“Quantum” or the “Company”), was founded in 1980 and reincorporated in Delaware in 1987, and is headquartered in San Jose, California. The Company is a leader in storing and managing digital video and other forms of unstructured data, delivering top streaming performance for video and rich media applications, along with low-cost, long-term storage systems for data protection and archiving. The Company helps customers around the world capture, create and share digital data and preserve and protect it for decades. The Company’s software-defined, hyperconverged storage solutions span from non-violate memory express (“NVMe”), to solid state drives, (“SSD”), hard disk drives, (“HDD”), tape and the cloud and are tied together leveraging a single namespace view of the entire data environment. The Company works closely with a broad network of distributors, value-added resellers (“VARs”), direct marketing resellers (“DMRs”), original equipment manufacturers (“OEMs”) and other suppliers to meet customers’ evolving needs.
Basis of Presentation
The consolidated financial statements and accompanying notes have been prepared in accordance with generally accepted accounting principles in the United States of America (“GAAP”). All intercompany balances and transactions have been eliminated. The Company reviews subsidiaries and affiliates, as well as other entities, to determine if they should be considered variable interest entities (“VIE”), and whether it should change the consolidation determinations based on changes in their characteristics. The Company considers an entity a VIE if its equity investors own an interest therein that lacks the characteristics of a controlling financial interest or if such investors do not have sufficient equity at risk for the entity to finance its activities without additional subordinated financial support or if the entity is structured with non-substantive voting interests. To determine whether or not the entity is consolidated with the Company’s results, the Company also evaluates which interests are variable interests in the VIE and which party is the primary beneficiary of the VIE.
COVID-19 Risks and Uncertainties
We are subject to the risks arising from COVID-19 which have caused substantial financial market volatility and have adversely affected both the U.S. and the global economy. For many of our customers, the COVID-19 pandemic has significantly affected their business. Movie and television production has been paused, professional and collegiate sports seasons have been postponed or cancelled, and many corporations and enterprises have put
56
information technology spending on hold while they assess the short- and long-term impact of the pandemic. While our supply chain remains intact and operating, we have experienced issues related to our logistics network. The reduced capacity within and across freight lanes (aircraft, personnel, customs clearance, etc.) has caused late deliveries from re-routes and mis-shipments, as well as increased expedite and other charges to deliver and receive products. To date, we have experienced minimal impact on product availability, although future capacity constraints across the network due to lost capacity from factory down time, closures, as well as reduced staff and demand signal fluctuations are expected to impact product availability in the months and possibly quarters to come.
We believe that these social and economic impacts have had a negative effect on sales due to the decline in our customers' ability or willingness to purchase our products and services. The extent of the impact will depend, in part, on how long the negative trends in customer demand and supply chain levels will continue. Our management continues to actively monitor the situation and may take further actions altering our business operations that we determine are in the best interests of our employees, customers, partners, suppliers, and stakeholders, or as required by federal, state, or local authorities.
Principles of Consolidation
The consolidated financial statements include the accounts of Quantum and our wholly owned subsidiaries. All intercompany accounts and transactions have been eliminated.
Use of Estimates
Company management has made estimates and assumptions relating to the reporting of certain assets and liabilities in conformity with U.S. GAAP. These estimates and assumptions have been applied using methodologies that are consistent throughout the periods presented with consideration given to the potential impacts of COVID-19 pandemic. However, actual results could differ materially from these estimates and be significantly affected by the severity and duration of the pandemic, the extent of actions to contain or treat COVID-19, how quickly and to what extent normal economic and operating activity can resume, and the severity and duration of the global economic downturn that results from the pandemic.
Cash and Cash Equivalents
The Company has cash deposits and cash equivalents deposited in or managed by major financial institutions. Cash equivalents include all highly liquid investment instruments with an original maturity of three months or less and consist primarily of money market accounts. At times the related amounts are in excess of amounts insured by the Federal Deposit Insurance Corporation. The Company has not experienced any losses with these financial institutions and does not believe such balances are exposed to significant credit risk.
Restricted Cash
Restricted cash is primarily attributable to minimum cash reserve requirements under the Company’s revolving credit agreements. The remaining restricted cash is comprised of bank guarantees and similar required minimum balances that serve as cash collateral in connection with various items including insurance requirements, value added taxes, ongoing tax audits and leases in certain countries.
Allowance for Doubtful Accounts
The Company maintains an allowance for doubtful accounts for estimated losses based on historical experience and expected collectability of outstanding accounts receivable. The Company performs ongoing credit evaluations of its customers’ financial condition, and for the majority of its customers require no collateral. For customers that do not meet the Company’s credit standards, the Company often requires a form of collateral, such as cash deposits or letters of credit, prior to the completion of a transaction. These credit evaluations require significant judgment and are based on multiple sources of information. The Company analyzes such factors as its historical bad debt experience, industry and geographic concentrations of credit risk, current economic trends and changes in customer payment terms. The Company will write-off customer balances in full to the reserve when it has determined that the balance is not recoverable. Changes in the allowance for doubtful accounts are recorded in general and administrative expenses.
57
Fair Value of Financial Instruments
Fair value is defined as the price that would be received to sell an asset or paid to transfer a liability in an orderly transaction between market participants at the measurement date. To increase the comparability of fair value measures, the following hierarchy prioritizes the inputs to valuation methodologies used to measure fair value:
Level 1: | Unadjusted quoted prices in active markets for identical assets or liabilities. |
Level 2: | Other than quoted prices that are observable in the market for the asset or liability, either directly or indirectly, such as quoted prices for similar assets or liabilities; quoted prices in markets that are not active; or model-derived valuations or other inputs that are observable or can be corroborated by observable market data for substantially the full term of the assets or liabilities. |
Level 3: | Inputs are unobservable and reflect management’s estimates of assumptions that market participants would use in pricing the asset or liability. |
The categorization of a financial instrument within the valuation hierarchy is based upon the lowest level of input that is significant to the fair value measurement. Our financial instruments consist of Level 3 liabilities.
Manufacturing Inventories
Manufacturing inventory is recorded at the lower of cost or net realizable value, with cost being determined on a first-in, first-out (“FIFO”) basis. Costs include material, direct labor, and an allocation of overhead in the case of work in process. Adjustments to reduce the cost of manufacturing inventory to its net realizable value, if required, are made for estimated excess, obsolete or impaired balances. Factors influencing these adjustments include declines in demand, rapid technological changes, product life cycle and development plans, component cost trends, product pricing, physical deterioration and quality issues. Revisions to these adjustments would be required if these factors differ from the Company’s estimates.
Service Parts Inventories
Service parts inventories are recorded at the lower of cost or net realizable value, with cost being determined on a FIFO basis. The Company carries service parts because it generally provides product warranty for one to three years and earns revenue by providing enhanced and extended warranty and repair services during and beyond this warranty period. Service parts inventories consist of both component parts, which are primarily used to repair defective units, and finished units, which are provided for customer use permanently or on a temporary basis while the defective unit is being repaired. The Company records adjustments to reduce the carrying value of service parts inventory to its net realizable value and disposes of parts with no use and a net realizable value of zero. Factors influencing these adjustments include product life cycles, end of service life plans and volume of enhanced or extended warranty service contracts. Estimates of net realizable value involve significant estimates and judgments about the future, and revisions would be required if these factors differ from the Company’s estimates.
Property and Equipment
Property and equipment are carried at cost, less accumulated depreciation and amortization, computed on a straight-line basis over the estimated useful lives of the assets as follows:
Machinery and equipment | 3 to 5 years |
Computer equipment | 3 to 5 years |
ERP software | 10 years |
Other software | 3 years |
Furniture and fixtures | 5 years |
Other office equipment | 5 years |
Leasehold improvements | Shorter of useful life or life of lease |
When assets are retired or otherwise disposed of, the related costs and accumulated depreciation are removed from the balance sheet and any resulting gain or loss is reflected in the consolidated statements of operations and comprehensive income (loss) in the period realized.
58
The Company evaluates the recoverability of the carrying amount of its property and equipment whenever events or changes in circumstances indicate that the carrying amount of an asset group may not be fully recoverable. A potential impairment charge is evaluated when the undiscounted expected cash flows derived from an asset group are less than its carrying amount. Impairment losses, if applicable, are measured as the amount by which the carrying value of an asset group exceeds its fair value and are recognized in operating results. Judgment is used when applying these impairment rules to determine the timing of impairment testing, the undiscounted cash flows used to assess impairments and the fair value of the asset group.
Cost of Service Revenue
The Company classifies expenses as service cost of revenue by estimating the portion of our total cost of revenue that relates to providing field support to our customers under contract. These estimates are based upon a variety of factors, including the nature of the support activity and the level of infrastructure required to support the activities from which it earns service revenue. In the event its service business changes, its estimates of cost of service revenue may be impacted.
Research and Development Costs
Expenditures relating to the development of new products and processes are expensed as incurred. These costs include expenditures for employee compensation, materials used in the development effort, other internal costs, as well as expenditures for third party professional services. The Company has determined that technological feasibility for its software products is reached shortly before the products are released to manufacturing. Costs incurred after technological feasibility is established have not been material. The Company expenses software-related research and development costs as incurred. Research and development costs were $36.3 million, $32.1 million, and $38.6 million in fiscal 2020, 2019 and 2018, respectively.
Advertising Expense
Advertising expense is recorded as incurred and was $3.4 million, $4.5 million, and $8.9 million in fiscal 2020, 2019 and 2018, respectively.
Shipping and Handling Fees
Shipping and handling fees are included in cost of revenue and were $9.4 million, $9.1 million, and $10.3 million in fiscal 2020, 2019 and 2018, respectively.
Restructuring Reserves
Restructuring reserves include charges related to the realignment and restructuring of the Company’s business operations. These charges represent judgments and estimates of the Company’s costs of severance, closure and consolidation of facilities and settlement of contractual obligations under its operating leases, including sublease rental rates, asset write-offs and other related costs. The Company reassesses the reserve requirements to complete each individual plan under the restructuring programs at the end of each reporting period. If these estimates change in the future or actual results differ from the Company’s estimates, additional charges may be required.
Foreign Currency Translation
The Company's international operations generally use their local currency as their functional currency. Assets and liabilities are translated at exchange rates in effect at the balance sheet date. Income and expense accounts are translated at the average monthly exchange rates during the year. Resulting translation adjustments are reported as a component of other comprehensive income (loss) and recorded in accumulated other comprehensive loss on our consolidated balance sheets.
Income Taxes
The Company accounts for income taxes in accordance with ASC Topic 740, Income Taxes in which deferred tax asset and liabilities are recognized based on differences between the financial reporting carrying values of assets and liabilities and the tax basis of those assets and liabilities, measured at the enacted tax rates expected to apply to taxable income in the years in which those tax assets or liabilities are expected to be realized or settled.
59
A valuation allowance is provided if the Company believes it is more likely than not that all or some portion of the deferred tax asset will not be realized. An increase or decrease in the valuation allowance, if any, that results from a change in circumstances, and which causes a change in the Company’s judgment about the realizability of the related deferred tax asset, is included in the tax provision.
The Company assesses whether tax benefits claimed or expected to be claimed on a tax return should be recorded in the financial statements. The Company may recognize the tax benefit from an uncertain tax position only if it is more likely than not that the tax position will be sustained on examination by the taxing authorities, including resolution of any related appeals or litigation processes, based on the technical merits of the position. The tax benefit to be recognized in the financial statements from such a position is measured as the largest amount of benefit that has a greater than fifty percent likelihood of being realized upon ultimate settlement. The Company reevaluates these uncertain tax positions on a quarterly basis. This evaluation is based on factors including, but not limited to, changes in facts or circumstances and changes in tax law. The Company recognizes penalties and tax-related interest expense as a component of income tax expense in the consolidated statements of operations.
Asset Retirement Obligations
The Company records an asset retirement obligation for the fair value of legal obligations associated with the retirement of tangible long-lived assets and a corresponding increase in the carrying amount of the related asset in the period in which the obligation is incurred. In periods subsequent to initial measurement, the Company recognizes changes in the liability resulting from the passage of time and revisions to either the timing or the amount of the original estimate. Over time, the liability is accreted to its present value and the capitalized cost is depreciated over the estimated useful life of the asset. The Company’s obligations relate primarily to certain legal obligations to remediate leased property on which certain assets are located.
Warranty Expense
The Company warranties its products against certain defects and the terms range from one to three years. The Company provides for the estimated costs of fulfilling its obligations under hardware warranties at the time the related revenue is recognized. The Company estimates the provision based on historical and projected product failure rates, historical and projected repair costs, and knowledge of specific product failures (if any). The Company regularly reassess its estimates to determine the adequacy of the recorded warranty liability and adjusts the provision, as necessary.
Debt Issuance Costs
Debt issuance costs for revolving credit agreements are capitalized and amortized over the term of the underlying agreements on a straight-line basis. Amortization of these debt issuance costs is included in interest expense while the unamortized debt issuance cost balance is included in other current assets and other assets. Debt issuance costs for the Company’s term loans are recorded as a reduction to the carrying amount and are amortized over their term using the effective interest method. Amortization of these debt issuance costs is included in interest expense.
Stock-Based Compensation
The Company classifies stock-based awards granted in exchange for services as either equity awards or liability awards. The classification of an award as either an equity award or a liability award is generally based upon cash settlement options. Equity awards are measured based on the fair value of the award at the grant date. Liability awards are re-measured to fair value each reporting period. Each reporting period, the Company recognizes the change in fair value of awards issued to non-employees as expense. The Company recognizes stock-based compensation on a straight-line basis over the award’s requisite service period, which is generally the vesting period of the award, less actual forfeitures. No compensation expense is recognized for awards for which participants do not render the requisite services. For equity and liability awards earned based on performance or upon occurrence of a contingent event, when and if the awards will be earned is estimated. If an award is not considered probable of being earned, no amount of stock-based compensation is recognized. If the award is deemed probable of being earned, related compensation expense is recorded over the estimated service period. To the extent the estimate of awards considered probable of being earned changes, the amount of stock-based compensation recognized will also change.
Concentration of Credit Risk
60
The Company sells products to customers in a wide variety of industries on a worldwide basis. In countries or industries where the Company is exposed to material credit risk, the Company may require collateral, including cash deposits and letters of credit, prior to the completion of a transaction. The Company does not believe it has significant credit risk beyond that provided for in the consolidated financial statements in the ordinary course of business. During the fiscal years ended March 31, 2020, 2019 and 2018 no customers represented 10% or more of the Company’s total revenue. The Company had one customer comprising approximately 7% of accounts receivable as of March 31, 2020, one customer comprising approximately 21% of accounts receivable as of March 31, 2019 and one customer comprising approximately 10% of accounts receivable as of March 31, 2018.
If the Company is unable to obtain adequate quantities of the inventory needed to sell its products, the Company could face costs increases or delays or discontinuations in product shipments, which could have a material/adverse effect on the Company’s results of operations. In many cases, the Company’s chosen vendor may be the sole source of supply for the products or parts they manufacture, or services they provide, for the Company. Some of the products the Company purchases from these sources are proprietary or complex in nature, and therefore cannot be readily or easily replaced by alternative sources.
Segment Reporting
Business segments are defined as components of an enterprise about which discrete financial information is available and is evaluated regularly by the chief operating decision maker in deciding how to allocate resources and in assessing operating performance. Based on the way the Company manages its business, the Company has determined that it currently operates with one reportable segment. The chief operating decision maker focuses on consolidated results in assessing operating performance and allocating resources. Furthermore, the Company offers similar products and services and uses similar processes to sell those products and services to similar classes of customers.
The Company’s chief operating decision-maker is its Chief Executive Officer who makes resource allocation decisions and assesses performance based on financial information presented on a consolidated basis. There are no segment managers who are held accountable by the chief operating decision-maker, or anyone else, for operations, operating results, and planning for levels or components below the consolidated unit level. Accordingly, the Company has determined that it has a single reportable segment and operating segment structure.
Based on how the Company manages its business, the Company has determined that it currently operates in one reportable segment. The Company operates in three geographic regions: (a) Americas; (b) Europe, Middle East, and Africa (“EMEA”); and (c) Asia Pacific (“APAC”).
The following table summarizes property and equipment, net by geographic region (in thousands):
For the year ended March 31, | |||||||
2020 | 2019 | ||||||
United States | $ | 8,488 | $ | 7,912 | |||
International | 558 | 525 | |||||
Total | $ | 9,046 | $ | 8,437 | |||
Defined Contribution Plan
The Company sponsors a qualified 401(k) retirement plan for its U.S employees. The plan covers substantially all employees who have attained the age of 18. Participants may voluntarily contribute to the plan up to the maximum limits established by Internal Revenue Service regulations. No matching contributions were made in the fiscal years ended March 31, 2020 and 2019, and $0.8 million was incurred for the year ended March 31, 2018.
Recently Adopted Accounting Pronouncements
In April 2019, the Company adopted ASU 2016-02, Leases (Topic 842), using the modified retrospective transition method under ASU 2018-11, Leases (Topic 842) Targeted Improvements. The modified retrospective transition method applies to all leases existing at the date of initial application and recognizes a cumulative-effect adjustment
61
to the opening balance of retained earnings in the period of adoption. The Company evaluated its portfolio of leases upon adoption and determined a cumulative-effect adjustment to the opening balance of retained earnings was not needed, as the portfolio of leases contained only operating leases. Further description of the impact of this pronouncement is included in Note 5.
In February 2018, the FASB issued ASU 2018-02, Income Statement – Reporting Comprehensive Income (Topic 220): Reclassification of Certain Tax Effects from Accumulated Other Comprehensive Income (“ASU 2018-02”). ASU 2018-20 allows a reclassification from accumulated other comprehensive income to retained earnings for stranded tax effects resulting from the Tax Cuts and Jobs Act. The Company did not elect to reclassify the income tax effects of the Tax Cuts and Jobs Act from accumulated other comprehensive income to accumulated deficit.
In June 2018, the FASB issued ASU No. 2018-07, Share-based Payments to Non-Employees (“ASU 2018-07”), to simplify the accounting for share- based payments to non-employees by aligning it with the accounting for share-based payments to employees, with certain exceptions. For public business entities, this ASU is effective for annual reporting periods beginning after December 15, 2018, including interim periods within that fiscal year. The adoption of ASU 2018-07 did not impact the Company’s condensed consolidated financial statements and related disclosures.
Recently Issued Accounting Pronouncements Not Yet Adopted
In August 2018, the FASB issued ASU No. 2018-15, Implementation Costs Incurred in Cloud Computing Arrangements (“ASU 2018-15”), which aligns the requirements for capitalizing implementation costs incurred in a hosting arrangement that is a service contract with the requirements for capitalizing implementation costs incurred to develop or obtain internal-use software (and hosting arrangements that include an internal-use software license). For public entities, ASU 2018-15 is effective for annual reporting periods beginning after December 15, 2019, and interim periods within that fiscal year. The accounting guidance should be applied either retrospectively or prospectively to all implementation costs incurred after the date of adoption. The Company will apply the guidance in ASU 2018-15 prospectively and adoption will not have an impact on its historical consolidated financial statements.
In June 2016, the FASB issued ASU No. 2016-13, Financial Instruments-Credit Losses (Topic 326): Measurement of Credit Losses on Financial Instruments (“ASU-2016-13”). ASU 2016-13 will change how entities account for credit impairment for trade and other receivables, as well as for certain financial assets and other instruments. ASU 2016-13 will replace the current “incurred loss” model with an “expected loss” model. Under the “incurred loss” model, a loss (or allowance) is recognized only when an event has occurred (such as a payment delinquency) that causes the entity to believe that it is probable that a loss has occurred (i.e., that it has been “incurred”). Under the “expected loss” model, a loss (or allowance) is recognized upon initial recognition of the asset that reflects all future events that leads to a loss being realized, regardless of whether it is probable that the future event will occur. The “incurred loss” model considers past events and current conditions, while the “expected loss” model includes expectations for the future which have yet to occur. ASU 2018-19, Codification Improvements to Topic 326, Financial Instruments – Credit Losses, was issued in November 2018 and excludes operating leases from the new guidance. The standard will require entities to record a cumulative-effect adjustment to the balance sheet as of the beginning of the first reporting period in which the guidance is effective. For public entities, ASU 2016-13 is effective for fiscal years beginning after December 15, 2019. The Company is currently evaluating the potential impact that ASU 2016-13 may have on the timing of recognition and measurement of future provisions for expected losses on its accounts receivable.
NOTE 2: REVENUE RECOGNITION
In May 2014 the FASB issued ASU No. 2014-09, Revenue from Contracts with Customers (ASC 606), which is a comprehensive new revenue recognition model that requires a company to recognize revenue to depict the transfer of goods or services to a customer at an amount that reflects the consideration it expects to receive in exchange for those goods or services. On April 1, 2018, the Company adopted ASC 606, using the modified retrospective transition method applied to those contracts which were not completed as of April 1, 2018. Results for reporting periods beginning after April 1, 2018 are presented under ASC 606, while prior period amounts have not been adjusted and continue to be reported in accordance with the Company’s historical accounting policies.
62
The Company’s performance obligations are satisfied at a point in time or over time as stand ready obligations. A majority of the Company’s revenue is recognized at a point in time when products are accepted, installed or delivered. The Company’s revenue is derived from three main sources: (1) Product, (2) Professional services, and (3) Royalties. Sales tax collected on sales is netted against government remittances and thus, recorded on a net basis.
Product Revenue
The Company's product revenue is comprised of multiple storage solution hardware and software offerings targeted towards consumer and enterprise customers. Revenue from product sales is recognized at the point in time when the customer takes control of the product. If there are significant post-delivery obligations, the related revenue is deferred until such obligations are fulfilled. Revenue from contracts with customer acceptance criteria are recognized upon end user acceptance. The Company's standard contractual terms are F.O.B. shipping point and net 30 days payment, with exceptions on a case by case basis.
Service Revenue
Service revenue primarily consists of three components: (1) post-contract customer support agreements.
(2) installation, and (3) consulting & training.
Customers have the option to choose between different levels of hardware and software support. The Company's support plans include various stand-ready obligations such as technical assistance hot-lines, replacement parts maintenance, and remote monitoring that are delivered whenever called upon by its customers. Support plans provide additional services and assurance outside the scope of our primary product warranties. Revenue from support plans are recognized ratably over the contractual term of the service contract.
The Company offers installation services on all its products. Customers can opt to either have Quantum or a Quantum-approved third-party service provider install our products. Installation services are typically completed within a short period of time and revenue from these services are recognized at the point when installation is complete. A majority of our consulting and training revenue does not take significant time to complete therefore these obligations are satisfied upon completion of such services at a point in time.
Royalty Revenue
The Company licenses certain intellectual property to third party manufacturers which gives the manufacturers rights to intellectual property including the right to either manufacture or include the intellectual property in their products for resale. Licensees pay us a per-unit royalty for sales of their products that incorporate our intellectual property. On a periodic and timely basis, the licensees provide the Company with reports containing units sold to end users subject to the royalties. The reports substantiate that the performance obligation has been satisfied therefore revenue is recognized based on the reports or when amounts can be reasonably estimated.
Significant Judgments
The following significant judgments were used when applying ASC 606 to contracts with customers.
Identification of performance obligations
The Company generally enters into contracts with customers to provide storage solutions to meet their individual needs. Most of the Company’s contracts contain multiple goods and services designed to meet each customers’ unique storage needs. Contracts with multiple goods and services have multiple distinct performance obligations as the promise to transfer hardware, installation services, and support services are capable of being distinct and provide economic benefit to customers on their own.
Stand-alone selling price
For contracts with multiple performance obligations, the Company allocates the transaction price to each performance obligation based on the relative standalone selling price (“SSP”) of the good or service underlying each performance obligation. The SSP represents the amount for which the Company would sell the good or service to a customer on a standalone basis (i.e., not sold as a bundle with any other products or services). Where
63
SSP may not be directly observable (e.g., the performance obligation is not sold separately), the Company maximized the use of observable inputs by using information including reviewing discounting practices, performance obligations with similar customers and product groupings. The Company evaluated all methods included in ASC 606 to determine SSP and concluded that invoice price is the best representation of what the Company expects to receive from the delivery of each performance obligation.
This judgment is based on; (1) the fact that each storage solution is customizable to meet an individual customer’s needs (2) sales representatives use various discounting methods based on each purchase orders’ unique mix of product offerings (3) every products’ transaction price can vary depending on the mix of other products included in the same purchase order and (4) there are no identifiable trends that provide a good representation of expected margin for each product. In addition, individual products may have multiple values for SSP depending on factors such as where they are sold, what channel they are sold through, and other products on the purchase order. Due to the use of invoice price as SSP, Step 4 (Allocate Transaction Price) of ASC 606’s 5 step model creates no differences when compared to U.S. GAAP.
Variable consideration
Product revenue includes multiple types of variable consideration, such as rebates, returns, or stock rotations. All contracts with variable consideration require payment upon satisfaction of the performance obligation typically with net 30-day payment terms. The Company does not include significant financing components in its contracts. The Company constrains estimates of variable consideration to amounts that are not expected to result in a significant revenue reversal in the future, primarily based on the most likely level of consideration to be returned to the customer under the specific terms of the underlying programs.
The expected value method is used to estimate the consideration expected to be returned to the customer. The Company uses its large volume of historical data and current trends to drive its estimates. The Company records a reduction to revenue to account for these programs. ASC 606 requires entities to recognize a return asset and corresponding adjustment to cost of sales for its right to recover the goods returned by the customer, at the time of the initial sale. Quantum initially measures this asset at the carrying amount of the inventory, less any expected costs to recover the goods including potential decreases in the value of the returned goods.
In the following table, revenue is disaggregated by major product offering and geographies (in thousands):
64
Year Ended March 31, | |||||||||||
2020 | 20191 | 20181 | |||||||||
Americas2 | |||||||||||
Primary storage systems | $ | 54,211 | $ | 33,789 | $ | 44,693 | |||||
Secondary storage systems | 57,192 | 72,696 | 69,582 | ||||||||
Device and media | 31,228 | 34,079 | 39,664 | ||||||||
Service | 82,607 | 87,040 | 87,960 | ||||||||
Total revenue | 225,238 | 227,604 | 241,899 | ||||||||
EMEA | |||||||||||
Primary storage systems | 16,078 | 18,902 | 24,006 | ||||||||
Secondary storage systems | 40,008 | 40,666 | 37,376 | ||||||||
Device and media | 25,484 | 19,064 | 21,306 | ||||||||
Service | 39,467 | 37,216 | 37,875 | ||||||||
Total revenue | 121,037 | 115,848 | 120,563 | ||||||||
APAC | |||||||||||
Primary storage systems | 6,863 | 6,120 | 9,277 | ||||||||
Secondary storage systems | 14,472 | 13,166 | 14,444 | ||||||||
Device and media | 5,632 | 6,172 | 8,234 | ||||||||
Service | 8,976 | 10,440 | 10,688 | ||||||||
Total revenue | 35,943 | 35,898 | 42,643 | ||||||||
Consolidated | |||||||||||
Primary storage systems | 77,152 | 58,811 | 77,976 | ||||||||
Secondary storage systems | 111,672 | 126,528 | 121,402 | ||||||||
Device and media | 62,344 | 59,315 | 69,204 | ||||||||
Service | 131,050 | 134,696 | 136,523 | ||||||||
Royalty3 | 20,731 | 23,330 | 32,579 | ||||||||
Total revenue | $ | 402,949 | $ | 402,680 | $ | 437,684 | |||||
1 Primary and Secondary storage system revenue has been adjusted for fiscal years 2019 and 2018 due to certain reclassifications from Primary to Secondary storage systems.
2 Revenue for Americas geographic region outside of the United States is not significant.
3 Royalty revenue is not allocable to geographic regions.
Contract Balances
Contract assets consist of unbilled receivables and are recorded when revenue is recognized in advance of scheduled billings to our customers. Contract liabilities consist of deferred revenue which is recorded when customers have been billed for support services, but the Company hasn’t fulfilled its service obligation and revenue related to certain product sales.
The following table presents the Company’s contract liabilities and certain information related to this balance as of March 31, 2020 (in thousands):
March 31, 2020 | ||||
Deferred revenue | $ | 118,935 | ||
Revenue recognized in the period from amounts included in contract liabilities at the beginning of the period | $ | 80,977 | ||
65
Costs of Obtaining and Fulfilling Contracts with Customers
ASC 606 provides new guidance on capitalizing certain fulfillment costs and costs to obtain a contract. The Company’s primary cost to obtain contracts is sales commissions earned by sales representatives. These costs are incremental and expected to be recovered indirectly through the margin inherent within the contract. A large portion of the Company’s contracts are completed within a one-year performance period, and for contracts with a specified term of one year or less, the Company has elected to apply a practical expedient available in ASC 606, which allows the Company to recognize the incremental costs of obtaining a contract as an expense when incurred if the amortization period of the asset that the Company would otherwise have recognized is one year or less.
Only sales commissions attributed to service contracts qualify for capitalization after application of the practical expedient. Total costs subject to capitalization were immaterial to the Company’s consolidated financial statements for the fiscal years ended March 31, 2020 and 2019.
The Company’s costs to fulfill contracts consist of shipping and handling activities. The Company elected to apply the practical expedient available in ASC 606 which allows entities to expense the costs of shipping and handling in the period incurred.
Remaining Performance Obligations
Transaction price allocated to the remaining performance obligations represents contracted revenue that has not yet been recognized, which includes deferred revenue and contractually agreed upon amounts, yet to be invoiced, that will be recognized as revenue in future periods. Remaining performance obligations are subject to change and are affected by several factors, including terminations, changes in the scope of contracts, adjustments for revenue that have not materialized and foreign exchange adjustments. The Company applied the practical expedient in accordance with ASC 606, to exclude amounts for variable consideration constituting a sale- or usage-based royalty promised in exchange for a license of intellectual property from remaining performance obligations.
Remaining performance obligation consisted of the following (in thousands):
Current | Non-Current | Total | ||||||||||
As of March 31, 2020 | $ | 89,036 | $ | 46,827 | $ | 135,864 | ||||||
The Company expects to recognize approximately 65.5% of the remaining performance obligations within the next 12 months. The majority of the Company’s noncurrent remaining performance obligations is expected to be recognized in the next 13 to 60 months.
Revenue Recognition - Prior to the Adoption of ASC 606
The Company followed the guidance provided in ASC 605 prior to the adoption of ASC 606, which the Company adopted using the modified retrospective method beginning on April 1, 2018.
Under ASC 605, revenue is considered realized, earned, and recognized when all of the following occurs,
• | persuasive evidence of an arrangement exists, |
• | delivery has occurred or services have been rendered, |
• | the price to the buyer is fixed or determinable, and |
• | when collectability is reasonably assured. |
Royalty revenue is recognized when earned or when earned amounts can be reasonably estimated.
Multiple Element Arrangements
The Company enters into contracts with customers that contain multiple deliverables such as hardware, software and services, and these arrangements require assessment of each deliverable to determine its estimated selling price. Additionally, the Company used judgment in order to determine the appropriate timing of revenue recognition and to assess whether any software and non-software components function together to deliver a tangible product’s essential functionality in order to ensure the arrangement is properly accounted for as software or hardware
66
revenue. The majority of the Company’s products are hardware products which contain software essential to the overall functionality of the product. Hardware products are generally sold with customer support agreements.
Consideration in such multiple element arrangements is allocated to each non-software element based on the fair value hierarchy, where the selling price for an element is based on vendor-specific objective evidence (“VSOE”), if available; third-party evidence (“TPE”) if VSOE is not available; or the best estimate of selling price (“BESP”), if neither VSOE nor TPE is available. The Company establishes VSOE based upon the selling price of elements when sold on a standalone basis and TPE is determined based upon competitor’s selling price for largely interchangeable products. For BESP, the Company considers its discounting and internal pricing practices, external market conditions and competitive positioning for similar offerings.
For software deliverables, the Company allocates consideration between multiple elements based on software revenue recognition guidance, which requires revenue to be allocated to each element based on the relative fair values of those elements. The fair value of an element must be based on VSOE. Where fair value of delivered elements is not available, revenue is recognized on the “residual method” deferring the fair value of the undelivered elements and recognizing the balance as revenue for the delivered elements. If evidence of fair value of one or more undelivered elements does not exist, all revenue is deferred and recognized at the earlier of the delivery of those elements or the establishment of fair value of the remaining undelivered elements.
Product Revenue — Hardware
Revenue for hardware products sold to distributors, VARs, DMRs, OEMs and end users is generally recognized upon shipment, consistent with the transfer of title and risk of loss. When significant post-delivery obligations exist, the related revenue is deferred until such obligations are fulfilled (sell-through basis). If there are customer acceptance criteria in the contract, the Company recognized revenue upon end user acceptance.
In the period revenue is recognized, allowances are provided for estimated future price adjustments, such as rebates, price protection and future product returns. These allowances are based on programs in existence at the time revenue is recognized, plans regarding future price adjustments, the customers’ master agreements and historical product return rates. Since the Company has historically been able to reliably estimate the amount of allowances required, the Company recognized revenue, net of projected allowances, upon shipment to its customers. If the Company was unable to reliably estimate the amount of revenue adjustments in any specific reporting period, then it would be required to defer recognition of the revenue until the rights had lapsed and the Company was no longer under any obligation to reduce the price or accept the return of the product.
Product Revenue — Software
For software products, the Company generally recognized revenue upon delivery of the software. Revenue from post-contract customer support agreements, which entitle software customers to both telephone support and any unspecified upgrades and enhancements during the term of the agreement, is classified as product revenue, as the value of these support arrangements are the upgrades and enhancements to the software licenses themselves and there is no on-site support. The Company recognized revenue from its post-contract customer support ratably over the term of the agreement. The Company licenses certain software to customers under licensing agreements that allow those customers to embed the Company’s software into specific products offered by the customer. The Company also licenses its software to licensees who pay a fee based on the amount of sales of their products that incorporate the Company’s software. On a periodic basis, the licensees provide the Company with reports listing their sales to end users for which they owe the Company license fees. As the reports substantiate delivery has occurred, the Company recognized revenue based on the information in these reports or when amounts could be reasonably estimated.
Service Revenue
Revenue for service is generally recognized upon the services being rendered. Service revenue primarily consists of customer field support agreements for the Company’s hardware products. For customer field support agreements, revenue equal to the separately stated price of these service contracts is initially deferred and recognized as revenue ratably over the contract period.
Royalty Revenue
67
The Company licenses certain intellectual property to third party manufacturers under arrangements that are represented by master contracts. The master contracts give the third-party manufacturers rights to the intellectual property which include allowing them to either manufacture or include the intellectual property in products for resale. As consideration, the licensees pay the Company a per-unit royalty for sales of their products that incorporate the Company’s intellectual property. On a periodic and timely basis, the licensees provide the Company with reports listing units sold to end users subject to the royalties. As the reports substantiate delivery has occurred, the Company recognized revenue based on the information either in these reports or when amounts can be reasonably estimated.
NOTE 3: BALANCE SHEET INFORMATION
Certain significant amounts included in the Company's consolidated balance sheets consist of the following (in thousands):
Manufacturing inventories | March 31, | ||||||
2020 | 2019 | ||||||
Finished goods | |||||||
Manufactured finished goods | $ | 15,790 | $ | 8,160 | |||
Distributor inventory | 504 | 3,345 | |||||
Total finished goods | 16,294 | 11,505 | |||||
Work in progress | 1,001 | 107 | |||||
Raw materials | 11,901 | 6,828 | |||||
Total manufacturing inventories | $ | 29,196 | $ | 18,440 | |||
Service inventories | March 31, | ||||||
2020 | 2019 | ||||||
Finished goods | $ | 15,845 | $ | 13,437 | |||
Component parts | 4,657 | 5,633 | |||||
Total service inventories | $ | 20,502 | $ | 19,070 | |||
Other current assets | March 31, | ||||||
2020 | 2019 | ||||||
Insurance receivable | $ | — | $ | 8,950 | |||
Other | 8,489 | 9,145 | |||||
Total other current assets | $ | 8,489 | $ | 18,095 | |||
Property and equipment, net | March 31, | ||||||
2020 | 2019 | ||||||
Machinery and equipment | $ | 33,804 | $ | 30,306 | |||
Leasehold improvements | 6,733 | 6,990 | |||||
Furniture and fixtures | 1,862 | 2,073 | |||||
42,399 | 39,369 | ||||||
Less: accumulated depreciation | (33,353 | ) | (30,932 | ) | |||
Total property, plant and equipment, net | $ | 9,046 | $ | 8,437 | |||
Other accrued liabilities | March 31, | ||||||
2020 | 2019 | ||||||
Accrued expenses | $ | 3,237 | $ | 8,925 | |||
Asset retirement obligation | 1,655 | 1,936 | |||||
Accrued settlement | 101 | 10,452 | |||||
Accrued warranty | 2,668 | 3,456 | |||||
Accrued interest | 3,192 | 230 | |||||
Other | 6,682 | 4,026 | |||||
Total other accrued liabilities | $ | 17,535 | $ | 29,025 | |||
68
Depreciation and amortization expense for property and equipment amounted to $4.3 million, $4.2 million, and $4.8 million for the years ended March 31, 2020, 2019, and 2018, respectively.
The following table details the change in the accrued warranty balance (in thousands):
Year Ended March 31, | |||||||||||
2020 | 2019 | 2018 | |||||||||
Balance as of April 1 | $ | 3,456 | $ | 2,422 | 3,689 | ||||||
Current period accruals | 3,516 | 5,766 | 5,140 | ||||||||
Adjustments to prior estimates | (114 | ) | 326 | (116 | ) | ||||||
Charges incurred | (4,190 | ) | (5,058 | ) | (6,291 | ) | |||||
Balance as of March 31 | $ | 2,668 | $ | 3,456 | $ | 2,422 | |||||
NOTE 4: DEBT
TCW Term Loan and PNC Credit Facility
On October 21, 2016 (the “Closing Date”), the Company entered into a term loan and security agreement (the “TCW Term Loan”) with TCW Asset Management Company LLC (“TCW”) and a revolving credit and security agreement (the “PNC Credit Facility” and together with the TCW Term Loan, the “Credit Agreements”) with PNC Bank, National Association (“PNC”).
Borrowings under the TCW Term Loan paid interest at a rate per annum equal to, at the Company’s option, either (a) the greater of (i) 3.00%, (ii) the federal funds rate plus 0.50%, (iii) the LIBOR rate based upon an interest period of 1 month plus 1.0% and (iv) the “prime rate” last quoted by the Wall Street Journal, plus a margin ranging from 6.00% to 7.25% based on the applicable senior net leverage ratio, as defined in the TCW Term Loan agreement, or (b) the LIBOR rate plus 7.00% to 8.25% based on the applicable senior net leverage ratio. Borrowings under the PNC Credit Facility charged interest at a rate per annum equal to, at the Company’s option, either (a) the greater of (i) the base rate, as defined in the PNC Credit Facility Agreement, (ii) the federal funds rate plus 0.50% and (iii) the 1 month LIBOR rate, plus 1.0%, plus an applicable margin of 1.50%, or (b) the LIBOR rate plus an applicable margin of 2.50%. Additionally, the Company was required to pay a 0.375% commitment fee on undrawn amounts under the PNC Credit Facility on a quarterly basis, which was recorded as interest expense in the period incurred.
February 2018 Amendment
In February 2018, the Company amended the Credit Agreements (the “February 2018 Amendment”) to, among other things, (a) provide for 2% paid-in-kind interest on the TCW Term Loan, (b) allow for the release of $7.0 million in restricted cash required under the terms of the PNC Credit Facility, and (c) modify certain covenants associated with the Credit Agreements.
In connection with the February 2018 Amendment, the Company issued warrants to purchase 150,000 shares of the Company’s common stock at an exercise price of $0.01 per share to TCW (“February 2018 Amendment Warrants”). TCW immediately exercised 75,000 of the February 2018 Amendment Warrants and the remaining warrants to purchase 75,000 of the Company’s common stock were contingently exercisable if the Company failed to meet certain financial requirements. The Company determined the fair value of the February 2018 Amendment Warrants to be approximately $0.6 million of which $0.3 million was allocated to the non-contingent warrants to purchase 75,000 shares of the Company’s common stock and recorded as additional paid in capital and $0.3 million was allocated to the remaining contingency exercisable warrants to purchase 75,000 shares of the Company’s common stock and was recorded as a liability with changes in fair value recorded in the consolidated statements of operations until the exercise contingencies were met.
The Company accounted for the February 2018 Amendment related to the TCW Term Loan as a debt extinguishment. Accordingly, a $6.9 million loss on debt extinguishment was recorded during the year ended
69
March 31, 2018 which included unamortized debt issuance costs of approximately $3.8 million and fees paid to TCW of $3.1 million (including $0.6 million related to the value of the February 2018 Amendment Warrants). The Company accounted for the February 2018 Amendment related to the PNC Credit Facility as a modification. The Company paid PNC an amendment fee of $0.6 million which was included in other current assets and amortized to interest expense over the term of the PNC Credit Facility.
August 2018 Amendment
In August 2018, the Company amended the Credit Agreements (the “August 2018 Amendment”) to, among other things, (a) provide for an additional $20 million in available borrowings under an additional incremental delayed draw term loan with TCW (the “AIDDTL”) of which $6.7 million was immediately borrowed, (b) accelerate the maturity date of the TCW Term Loan to January 31, 2019, (c) defer required principal and interest payments until the January 31, 2019 maturity date, (d) modify certain financial covenants and related definitions, (e) extend the due date for the Company to provide audited financial statements, and (f) require the Company to meet certain milestones related to the Company completing a refinancing transaction, as defined in the August 2018 Amendment (the “Refinancing Transaction”).
In connection with the August 2018 Amendment, the Company issued warrants to purchase 1,099,533 of the Company’s common stock at an exercise price of $2.11 per share. To the extent that the Company did not complete a Refinancing Transaction and repay the entire TCW Term Loan by September 30, 2018, October 31, 2018, November 30, 2018 and December 31, 2018, then on each such date the Company was required to issue additional warrants to purchase 3% of the then outstanding common stock of the Company with an exercise price equal to the closing price of the Company’s common stock on the business day immediately prior to the date of issuance of the warrants. A total of 4,398,132 warrants to purchase the Company’s common stock were issued related to the August 2018 Amendment (the “August 2018 Amendment Warrants”) with warrants to purchase 1,099,533 shares issued on each of September 30, 2018, October 31, 2018 and November 30, 2018 with exercise prices of $2.40 per share, $2.39 per share and $2.40 per share, respectively.
The August 2018 Amendment Warrants were not exercisable until February 1, 2019, on which date, the exercise price of each of the warrants that were issued was reset to the lower of: (a) the applicable existing exercise price for such warrant or (b) the lowest of the 5-day volume-weighted average closing prices of the Company’s common stock for the last five trading days in the months of September 2018, October 2018, November 2018, December 2018 and January 2019. The exercise price for all of the August 2018 Amendment Warrants was adjusted to $1.62 per share on February 1, 2019.
Due to the exercise price reset provision in the August 2018 Amendment Warrants, the Company initially recorded the value of the warrants as a liability with changes in fair value recorded as other income (expense) in the accompanying consolidated statements of operations. The Company reclassified the fair value of the warrants of $5.6 million to additional paid in capital on February 1, 2019, the exercise price reset date. A loss of approximately $0.4 million was recorded to other income (expense) during fiscal year 2019 before the reclassification to equity.
The August 2018 Amendment provided a repurchase right allowing the Company to repurchase 50% of the August 2018 Amendment Warrants issued within 30 days of repayment of amounts due under the TCW Term Loan for $0.001 per warrant. The Company repaid the TCW Term Loan on December 27, 2018 and repurchased 549,766 warrants for $550 which resulted in a reduction in the fair value of the August 2018 Amendment Warrants liability of $0.4 million which was recorded as other income (expense) in the accompanying consolidated statements of operations and comprehensive income. On November 18, 2019, the 3.8 million outstanding August 2018 Amendment Warrants were exercised on a cashless basis, resulting in the issuance of 2.8 million shares of common stock.
The Company accounted for the August 2018 Amendment related to the TCW Term Loan as a debt extinguishment. Accordingly, a $14.9 million loss on debt extinguishment was recorded during the year ended March 31, 2018 related primarily to fees paid to TCW (including $5.7 million related to the value of the August 2018 Amendment Warrants). The Company also accounted for the August 2018 Amendment related to the PNC Credit Facility as a debt extinguishment and recorded a loss on debt extinguishment of approximately $1.8 million related to a portion of the unamortized debt issuance costs. The Company paid PNC an amendment fee of $1.7 million which was included into other current assets and amortized to interest expense over the original term of the PNC Credit Facility.
70
Senior Secured Term Loan and Amended PNC Credit Facility
On December 27, 2018 (the “Closing Date”), the Company entered into a senior secured term loan of $150.0 million with U.S. Bank, National Association (“U.S. Bank”), drawn on the Closing Date, and a senior secured delayed draw term loan of $15.0 million (collectively, “the Senior Secured Term Loan”) which was drawn in January 2019. In connection with the Senior Secured Term Loan, the Company amended its existing PNC Credit Facility providing for borrowings up to a maximum principal amount of the lesser of: (a) $45.0 million or (b) the amount of the borrowing base, as defined in the PNC Credit Facility agreement. Borrowings under the Senior Secured Term Loan and Amended PNC Credit Facility (collectively, the “December 2018 Credit Agreements”) mature on December 27, 2023.
A portion of the proceeds from the Senior Secured Term Loan was used to repay all outstanding borrowings under the TCW Term Loan. The Company recorded a loss on debt extinguishment of $0.8 million related to repayment of the TCW Term Loan including unamortized debt issuance costs of $0.1 million and costs paid to TCW of $0.7 million. The Company accounted for the Amended PNC Credit Facility as a modification. The Company incurred $1.4 million in costs related to the amendment which was recorded to other assets and is being recognized as interest expense over the term of the Amended PNC Credit Facility.
Borrowings under the Senior Secured Term Loan bear interest at a rate per annum, at the Company’s option, equal to (a) the greater of (i) 3.00%, (ii) the Federal funds rate plus 0.50%, (iii) the LIBOR Rate based upon an interest period of 1 month plus 1.0%, and (iv) the Prime Rate as quoted by the Wall Street Journal, plus an applicable margin of 9.00% or (b) LIBOR Rate plus an applicable margin of 10.00%. Interest on the Senior Secured Term Loan is payable quarterly. Principal payments of 0.25% of the original balance of the Senior Secured Term Loan are due quarterly with the remaining principal balance due at maturity. Additionally, on an annual basis beginning with the fiscal year ending March 31, 2020, the Company will be required to perform a calculation of excess cash flow, as defined in the Senior Secured Term Loan agreement, which may require an additional payment of the principal in certain circumstances (the "ECF Payment"). As of March 31, 2020, an ECF Payment of $5.3 million was payable during the quarter ended June 30, 2020 and has been included in the current portion of long-term debt in the accompanying consolidated balance sheets.
Borrowings under the Amended PNC Credit Facility bear interest, at the Company’s option, equal to, (a) the greater of (i) the base rate, as defined in the PNC Credit Facility, (ii) the daily Overnight Bank Funding Rate plus 0.5% and (iii) the daily LIBOR rate plus 1.0%, plus an applicable margin of (a) 4.50% for the period from the Amendment Date until the date quarterly financial statements are delivered to PNC for the fiscal quarter ending June 30, 2021 and (b) thereafter, ranging from 3.50% to 4.50% based on the Company’s applicable Total Leverage Ratio, as defined, or (b) the LIBOR Rate plus an applicable margin of (a) 5.00% for the period from the Amendment Date until the date quarterly financial statements are delivered to PNC for the fiscal quarter ending June 30, 2021 and (b) thereafter, ranging from 4.50% to 5.00% based on the Company’s applicable total leverage ratio, as defined in the Amended PNC Credit Facility agreement. Interest on the Amended PNC Credit Facility is payable quarterly.
In connection with the Senior Secured Term Loan agreement, the Company issued warrants to purchase 7,110,616 shares of the Company’s common stock, at an exercise price of $1.33 per share (the “2018 Term Loan Warrants”). The exercise price and the number of shares underlying the 2018 Term Loan Warrants are subject to adjustment in the event of specified events, including dilutive issuances of common stock linked equity instruments at a price lower than the exercise price of the warrants (“Down Round Feature”), a subdivision or combination of the Company’s common stock, a reclassification of the Company’s common stock or specified dividend payments. The 2018 Term Loan Warrants are exercisable until December 27, 2028. Upon exercise, the aggregate exercise price may be paid, at each warrant holder’s election, in cash or on a net issuance basis, based upon the fair market value of the Company’s common stock at the time of exercise.
In accordance with ASU No. 2017-11, Earnings Per Share (Topic 260); Distinguishing Liabilities from Equity (Topic 480); Derivatives and Hedging (Topic 815): (Part I) Accounting for Certain Financial Instruments with Down Round Features; (Part II) Replacement of the Indefinite Deferral for Mandatorily Redeemable Financial Instruments of Certain Nonpublic Entities and Certain Mandatorily Redeemable Noncontrolling Interests with a Scope Exception (“ASU 2017-11”), the presence of the Down Round Feature does not preclude the Term Loan Warrants from being classified in stockholders’ deficit. Accordingly, the Company determined that the fair value of the warrants of $8.8 million should be classified within stockholders’ deficit upon issuance. The Company incurred $18.3 million in costs related to the Senior Secured Term Loan (including $8.8 million related to the value of the Term Loan Warrants).
71
These debt issuance costs are reflected as a reduction of the carrying amount of the Senior Secured Term Loan and are being recognized as interest expense over the term of the Senior Secured Term Loan.
The December 2018 Credit Agreements contain certain covenants, including requirements to prepay the loans in an amount equal to 100% of the net cash proceeds from certain assets dispositions, subject to certain reinvestment rights and other exceptions and equity issuances. Amounts outstanding under the December 2018 Credit Agreements may become due and payable upon the occurrence of specified events, which among other things include (subject to certain exceptions and cure periods) (i) failure to pay principal, interest, or any fees when due, (ii) breach of any representation or warranty, covenant, or other agreement, (iii) the occurrence of a bankruptcy or insolvency proceeding with respect to the Company or any of its subsidiaries, (iv) any event of default with respect to other indebtedness involving an aggregate amount of $1.0 million or more, (v) any lien created by the December 2018 Credit Agreements or any related security documents ceasing to be valid and perfected; (vi) the December 2018 Credit Agreements or any related security documents or guarantees ceasing to be legal, valid, and binding upon the parties thereto; or a change of control shall occur. The December 2018 Credit Agreements contain financial covenants relating to a fixed charge coverage ratio, total net leverage ratio, minimum EBITDA, and minimum liquidity. The Amended PNC Credit Facility also includes a total leverage ratio covenant. As of March 31, 2020, the Company was in compliance with all covenants.
The Senior Secured Term Loan contains a prepayment penalty which is calculated based on (i) if prepayment occurs prior to 30-month anniversary of the Closing Date, the prepayment penalty is the present value of all required interest payments due on the Senior Secured Term Loan that are prepaid from the date of prepayment through and including the 30-month anniversary of the Closing Date calculated based on the 3 month LIBOR Rate plus 10%, plus 5.0% of the amount of principal prepaid, (ii) if prepayment occurs between the 30-month anniversary of Closing Date through the third anniversary of the Closing Date, the prepayment penalty is 5.0% of the principal prepaid and (iii) if prepayment occurs between the third anniversary of the Closing Date through the fourth anniversary of Closing Date, the prepayment penalty is 2.0% of the principal prepaid (the “Prepayment Penalty”). There is no Prepayment Penalty after the fourth anniversary of the Closing Date. In the event of a change in control, as defined in the Senior Secured Term Loan agreement, the Company is required to make a change in control premium payment equal to the greater of the Prepayment Penalty or 1.0% of the principal amount being repaid. The Company is permitted to prepay up to 25% of the aggregate principal amount of the outstanding Senior Secured Term Loan balance with cash proceeds of a public offering of the Company’s common stock at a prepayment premium of 12% of the principal amount being repaid (the "Equity Clawback").
On March 30, 2020 and March 31, 2020, the Company entered into amendments to the Senior Secured Term Loan which, among other things, included (a) payment deferral of the scheduled amortization payment of $0.4 million due on April 1, 2020 to June 30, 2020; payment of $1.9 million of the interest due on April 1, 2020 in kind rather than in cash, and (b) the waiver of compliance with the total net leverage ratio covenant, as defined in the Senior Secured Term Loan agreement, for the quarter ended March 31, 2020.
Registration Rights Agreement
In connection with the 2018 Senior Secured Term Loan, the Company entered into a registration rights agreement with the holders of the 2018 Term Loan Warrants (the “Registration Rights Agreement”). The Registration Rights Agreement grants the holders of the 2018 Term Loan Warrants certain registration rights for the shares of common stock issuable upon the exercise of the warrants. The agreement calls for the Company to prepare and file a registration statement with the SEC and use commercially reasonable efforts to cause the registration statement to be declared effective as soon as practicable, but in no event later than October 31, 2019 (the “Registration Penalty Date”). If the Company is unable to file and have a Form S-1 registration statement declared effective on the Registration Penalty Date (the “Filing Failure”), the Company is required to pay each holder of Term Loan Warrants an amount of cash equal to (i) $0.3 million multiplied by (ii) such holder’s pro rata share of all Term Loan Warrants (the “Registration Delay Payments”) on the day of a Registration Penalty Date and on every thirtieth day thereafter until such Filing Failure is cured. In the event the Company fails to make Registration Delay Payments in a timely manner, such Registration Delay Payments shall bear interest at 5.0% of such unpaid Registration Delay Payment until paid in full. The Company expects to meet all registration requirements and has determined that such a payment under the Registration Rights Agreement was not probable at the time the agreement was entered into, nor did such a payment become probable prior to or as of March 31, 2020.
As of March 31, 2020, the interest rates on the Senior Secured Term Loan and the Amended PNC Credit Facility were 12.0% and 6.25%, respectively. The Company is required to maintain a $5.0 million restricted cash reserve
72
as part of the Amended PNC Credit Facility, which is presented as long-term restricted cash within the accompanying consolidated balance sheet as of March 31, 2020.
The following table summarizes the Company's borrowing as of the periods presented (in thousands):
Year Ended March 31, | |||||||
2020 | 2019 | ||||||
Senior Secured Term Loan | $ | 165,208 | $ | 164,588 | |||
Amended PNC Credit Facility | 2,620 | — | |||||
Less: current portion | (7,321 | ) | (1,650 | ) | |||
Less unamortized debt issuance costs(1) | (13,660 | ) | (17,317 | ) | |||
Long-term debt, net | $ | 146,847 | $ | 145,621 | |||
(1) The unamortized debt issuance costs related to the Senior Secured Term Loan are presented as a reduction of the carrying amount of the corresponding debt balance on the accompanying consolidated balance sheets. Unamortized debt issuance costs related to the PNC Credit Facility are presented within other assets on the accompanying consolidated balance sheets.
See Note 12, Subsequent Events, for additional information related to amendments to the Company's Amended PNC Credit Facility and the Senior Secured Term Loan.
NOTE 5: LEASES
The Company adopted ASU No. 2016-02, Leases (“ASC 842”) effective April 1, 2019 using the optional transition method in ASU 2018-11, Targeted Improvements. Therefore, the consolidated balance sheet and consolidated statements of operations as of and for the fiscal year ended March 31, 2020 reflect the application of Topic 842, while the consolidated balance sheet as of March 31, 2019 and consolidated statements of operations for the fiscal years ended March 31, 2019 and 2018 were not adjusted and continue to be reported under ASC 840, Leases, the accounting guidance in effect for the prior periods. The adoption of ASC 842 resulted in the recording of right of use assets and corresponding lease liabilities of $13.5 million and $12.7 million, respectively, as of April 1, 2019, which include the impact of existing deferred rents and tenant improvement allowances on the consolidated balance sheet as of April 1, 2019.
Under ASC 842, the Company determines if an arrangement is a lease at inception. The lease term begins on the commencement date, which is the date the Company takes possession of the property and may include options to extend or terminate the lease when it is reasonably certain that the option will be exercised. The lease terms are used to determine lease classification as an operating or finance lease and is used to calculate straight-line lease expense for operating leases. The Company elected the package of practical expedients permitted under the transition guidance within the standard, allowing it to carry forward the historical lease classification, carry forward the conclusions on whether current or expired contracts contain leases and carry forward the accounting for initial direct costs for existing leases. Additionally, the Company elected the practical expedient for use of hindsight to determine the lease term for existing leases whereby the Company evaluated the performance of existing leases in relation to the Company's leasing strategy and determined that most renewal options would not be reasonably certain to be exercised. This resulted in the shortening of lease terms for the existing leases.
Right-of-use (“ROU”) assets represent the Company’s right to use an underlying asset for the lease term and lease liabilities represent the Company’s obligation to make lease payments arising from the lease. ROU assets and lease liabilities are recognized at commencement date based on the present value of lease payments over the lease term. ROU assets also include prepaid lease payments and exclude lease incentives received. As the Company’s leases typically do not provide an implicit rate, the Company uses its incremental borrowing rate based on the information available at commencement date for its leases. The Company determines the incremental borrowing rate using the Company’s current unsecured borrowing rate, adjusted for various factors such as collateralization and term to align with the terms of the lease. The determination of the incremental borrowing rate requires judgment. The Company elected the short-term lease recognition exemption for all leases that qualify. Therefore, leases with an initial term of 12 months or less are not recorded on the balance sheet; instead, lease payments are recognized as lease expense on a straight-line basis over the lease term.
73
The Company has operating leases for facilities, vehicles, computers, and other office equipment with various expiration dates. The leases have remaining terms of 1 to 8 years. Certain leases contain renewal options for varying periods, which are at the Company’s sole discretion. The Company did not use hindsight when determining lease term, therefore, the Company carried forward the lease term as determined prior to the adoption of ASC 842. For new leases with renewal or termination options, such option periods will be included in the determination of the Company’s ROU assets and lease liabilities if the Company is reasonably certain to exercise the option. Certain leases require the Company to pay taxes, insurance, maintenance, and other operating expenses associated with the leased asset. Such amounts are not included in the measurement of the lease liability to the extent they are variable in nature. These variable lease costs are recognized as a variable lease expense when incurred.
Supplemental balance sheet information related to leases is as follows (in thousands):
Operating leases | March 31, 2020 | |||
Operating lease right-of-use asset | $ | 12,689 | ||
Other current liabilities | $ | 3,065 | ||
Operating lease liability | 10,822 | |||
Total operating lease liabilities | $ | 13,887 | ||
The components of lease expense were as follows (in thousands):
Lease expense | Year Ended March 31, 2020 | |||
Operating lease expense | $ | 4,901 | ||
Variable lease expense | 277 | |||
Short-term lease expense | 102 | |||
Total lease expense | $ | 5,280 | ||
Maturity of Lease Liabilities | Operating Leases | |||
2021 | 4,878 | |||
2022 | 3,671 | |||
2023 | 2,825 | |||
2024 | 2,857 | |||
2025 | 2,285 | |||
Thereafter | 2,889 | |||
Total lease payments | $ | 19,405 | ||
Less: Imputed interest | (5,518 | ) | ||
Present value of lease liabilities | $ | 13,887 | ||
Lease Term and Discount Rate | March 31, 2020 | ||
Weighted average remaining operating lease term (years) | 4.99 | ||
Weighted average discount rate for operating leases | 13.91 | % | |
Operating cash outflows related to operating leases totaled $4.5 million for the twelve months ended March 31, 2020.
NOTE 6: RESTRUCTURING CHARGES
During fiscal years 2019 and 2018, the Company approved certain restructuring plans to improve operational efficiencies and rationalize its cost structure. These plans included a reduction in workforce of approximately 80 positions and 210 positions during the fiscal years 2019 and 2018, respectively, and the exit of certain facility space occurring throughout fiscal years 2018 through 2020.
74
The following tables show the activity and the estimated timing of future payouts for accrued restructuring (in thousands):
Severance and benefits | Facilities | Total | |||||||||
Balance as of March 31, 2017 | $ | 130 | $ | 6,152 | $ | 6,282 | |||||
Restructuring costs | 8,266 | 208 | 8,474 | ||||||||
Cash payments | (6,368 | ) | (1,971 | ) | (8,339 | ) | |||||
Other non-cash | (598 | ) | — | (598 | ) | ||||||
Balance as of March 31, 2018 | 1,430 | 4,389 | 5,819 | ||||||||
Restructuring costs | 4,708 | 862 | 5,570 | ||||||||
Cash payments | (6,138 | ) | (2,375 | ) | (8,513 | ) | |||||
Balance as of March 31, 2019 | — | 2,876 | 2,876 | ||||||||
Adjustments of prior estimates | — | 1,022 | 1,022 | ||||||||
Cash payments | — | (3,961 | ) | (3,961 | ) | ||||||
Other non-cash | — | 63 | 63 | ||||||||
Balance as of March 31, 2020 | $ | — | $ | — | $ | — | |||||
Facility restructuring accruals will be paid in accordance with the respective facility lease terms and amounts above are net of estimated sublease amounts.
NOTE 7: STOCK INCENTIVE PLANS AND SHARE-BASED COMPENSATION
Amended and Restated 2012 Long-Term Incentive Plan
The Company has a stockholder-approved 2012 Long-Term Incentive Plan (the “Plan”) which has 6.3 million shares authorized for issuance of new shares at March 31, 2020. There were 2.7 million stock options, performance shares and restricted shares outstanding, and 3.6 million shares available for future issuance under the Plan as of March 31, 2020.
In February 2018, the Company enacted a deferral of release of all vested restricted stock units and performance share units granted prior to February 2018. The deferral of release impacted only pre-February 2018 restricted stock units and performance share units and was intended to prevent the release of unregistered shares to grantees. During the deferral period, a grantee retained the legal right to the awards they had vested in, but the Company deferred the release of the underlying shares until it could become current with its SEC reporting requirements. The Company ended the deferral of release in February 2019. The deferral of release and its removal were both modifications to the awards; however, the impact of the modifications were not material and no incremental compensation expense was recorded. All employees with outstanding stock-based awards were impacted by the modifications.
Stock options under the Plan are granted at prices determined by the Board of Directors, but at not less than the fair market value of our common stock on the date of grant. The majority of performance share units, restricted stock units and stock options granted to employees vest over three to four years. Stock options, performance shares and restricted stock grants to non-employee directors typically vest over one year. The term of each stock option under the plan will not exceed seven years. Stock options, performance share units and restricted stock units granted under the Plan are subject to forfeiture if employment terminates. The Company accounts for all forfeitures of stock-based awards when they occur.
Employee Stock Purchase Plan
The Company's Employee Stock Purchase Plan (the "ESPP") has 9.7 million shares authorized at March 31, 2020. The plan enables eligible employees to purchase shares of our common stock at a discount. Purchases will be accomplished through participation in discrete offering periods. On each purchase date, eligible employees will purchase our common stock at a price per share equal to 85% of the lesser of (i) the fair market value of our common stock on the first trading day of the offering period, and (ii) the fair market value of our common stock on the purchase date.
75
We have reserved shares of common stock for future issuance under our ESPP as follows:
March 31, | |||||
2020 | 2019 | ||||
Shares available for issuance at beginning of period | 497 | 497 | |||
Additional shares authorized during the period | 900 | — | |||
Total shares available for future issuance at end of period | 1,397 | 497 | |||
The Company uses the Black-Scholes-Merton option-pricing model (“Black-Scholes”) to determine the fair value for stock options, shares forecasted to be issued pursuant to our ESPP, and warrants. This requires the use of assumptions about expected life, stock price, volatility, risk-free interest rates and expected dividends.
Expected Life—The expected term was based on historical experience with similar awards, giving consideration to the contractual terms, exercise patterns and post-vesting forfeitures.
Volatility—The expected stock price volatility for our common stock was based on the historical volatility of our common stock over the most recent period corresponding with the estimated expected life of the award.
Risk-Free Rate—The risk-free interest rate is based on the yields of U.S. Treasury securities with maturities similar to the expected term of the options for each option group.
Dividend Yield—We have never declared or paid any cash dividends and do not presently plan to pay cash dividends in the foreseeable future. Consequently, an expected dividend yield of zero was used.
The weighted-average grant date fair value and the assumptions used in calculating fair values of shares forecasted to be issued pursuant to our ESPP are as follows:
Year Ended March 31, | |||||
2020 | 2019 | 2018 | |||
Expected life | 0.5 years | n/a | 0.5 years | ||
Volatility | 49.81% | n/a | 0.05% | ||
Risk-free interest rate | 0.41% | n/a | 91% | ||
Dividend yield | —% | n/a | —% | ||
Weighted-average grant date fair value | $4.78 | n/a | $2.20 | ||
Other Stock Incentive Plans
In addition to the Plan, we have other stock incentive plans which are mostly inactive for future share grant purposes, including plans assumed in acquisitions, under which stock options, stock appreciation rights, stock purchase rights, restricted stock awards and long-term performance awards to employees, consultants, officers and affiliates were authorized (“Other Plans”). On April 1, 2019, we granted 0.3 million shares as an inducement to employment of our Chief Revenue Officer, half of which are time-based and the other half performance-based. The shares have the same vesting and market performance conditions as the performance stock units we granted in 2020. As of March 31, 2020, there were 0.25 million shares outstanding pertaining to this grant.
Performance Stock Units
The Company granted 1.5 million, 0.7 million and 0.5 million of performance share units with market conditions (“Market PSUs”) in fiscal 2020, 2019, and 2018, respectively. The number of Market PSUs issued is dependent on Quantum’s common stock achieving certain average closing stock price targets as of specified dates. Market PSUs vest one to three years after the issuance date based on the stock price targets achieved and are contingent upon continued service of the holder of the award during this period. The estimated fair value of these Market PSUs is determined at the issuance date using a Monte Carlo simulation model.
76
Assumptions used in the Monte Carlo model to calculate fair values of market PSU’s during each fiscal period are as follows:
Weighted-Average | 2020 | 2019 | 2018 | |||
Discount period (years) | 3.00 | 1.95 | 7.00 | |||
Risk-free interest rate | 1.45% | 2.63% | 2.48% | |||
Stock price volatility | 72.00% | 69.35% | 75.52% | |||
Grant date fair value | $5.92 | $1.70 | $4.29 | |||
The Company granted 0.3 million, 0.0 million and 0.4 million of performance share units with financial performance conditions (“Performance PSUs”) in the fiscal years ended March 31, 2020, 2019 and 2018, respectively. Performance PSUs become eligible for vesting based on the Company achieving certain financial performance targets through the end of the fiscal year when the performance PSUs were granted, and are contingent upon continued service of the holder of the award during this period. Performance PSUs are valued at the market closing share price on the date of grant and compensation expense for Performance PSUs is recognized when it is probable that the performance conditions will be achieved. Compensation expense recognized related to Performance PSUs is reversed if the Company determines that it is no longer probable that the performance conditions will be achieved.
The following table summarizes activity for Market PSUs and Performance PSUs for the year ended March 31, 2020:
Shares | Weighted-Average Grant Date Fair Value per Share | |||||
Outstanding as of March 31, 2019 | 770 | $ | 1.78 | |||
Granted | 1,807 | $ | 4.99 | |||
Vested | (311 | ) | $ | 1.94 | ||
Forfeited or cancelled | (322 | ) | $ | 5.67 | ||
Outstanding as of March 31, 2020 | 1,944 | $ | 4.09 | |||
As of March 31, 2020, there was $4.9 million of total unrecognized stock-based compensation related to Market PSUs, which is expected to be recognized over a weighted-average period of 1.23 years. As of March 31, 2020, there was no unrecognized stock-based compensation related to Performance PSUs. The total fair value of shares vested during fiscal years ended March 31, 2020, 2019, and 2018 was $0.6 million, $0.1 million, and $0.7 million, respectively.
Restricted Stock Units
The Company granted 0.6 million, 1.0 million, and 1.5 million of service-based restricted stock units (“RSUs”) in the fiscal years ended March 31, 2020, 2019 and 2018, respectively, which generally vest ratably over a three-year service period. RSUs are valued at the market closing share price on the date of grant and compensation expense for RSUs is recognized ratably over the applicable vesting period.
The following table summarizes activity for restricted stock units for the year ended March 31, 2020:
Shares | Weighted-Average Grant Date Fair Value per Share | |||||
Outstanding as of March 31, 2019 | 1,313 | $ | 3.61 | |||
Granted | 645 | $ | 4.77 | |||
Vested | (877 | ) | $ | 4.55 | ||
Forfeited or cancelled | (95 | ) | $ | 5.54 | ||
Outstanding as of March 31, 2020 | 986 | $ | 3.42 | |||
77
As of March 31, 2020, there was $1.4 million of total unrecognized stock-based compensation related to restricted stock units, which is expected to be recognized over a weighted-average period of 1.03 years. The total fair value of RSUs vested during fiscal years ended March 31, 2020, 2019, and 2018 was $4.0 million, $5.1 million, and $4.8 million, respectively.
Compensation Expense
The following table details the Company's stock-based compensation, net of forfeitures:
Year Ended March 31, | |||||||||||
2020 | 2019 | 2018 | |||||||||
Cost of revenue | $ | 452 | $ | 334 | $ | 725 | |||||
Research and development | 984 | 440 | 906 | ||||||||
Sales and marketing | 1,165 | 179 | 1,790 | ||||||||
General and administrative | 4,147 | 2,456 | 1,973 | ||||||||
Total share-based compensation | $ | 6,748 | $ | 3,409 | $ | 5,394 | |||||
Year Ended March 31, | |||||||||||
2020 | 2019 | 2018 | |||||||||
Restricted stock units | $ | 3,610 | $ | 3,178 | $ | 5,004 | |||||
Performance share units | 3,103 | 274 | (171 | ) | |||||||
Stock options | — | (43 | ) | 44 | |||||||
Employee stock purchase plan | 35 | — | 517 | ||||||||
Total share-based compensation | $ | 6,748 | $ | 3,409 | $ | 5,394 | |||||
NOTE 8: NET LOSS PER SHARE
Equity Instruments Outstanding
The Company has stock options, performance share units, restricted stock units and options to purchase shares under its ESPP, granted under various stock incentive plans that, upon exercise and vesting, respectively, would increase shares outstanding. In addition, the Company had Convertible Notes, which were convertible at the option of the holders at any time prior to maturity into shares of Quantum common stock. During November 2017, the Company paid all outstanding principal and accrued interest on the Convertible Notes. The Company has also issued warrants to purchase shares of the Company’s stock that are related to the TCW Term Loan and the Senior Secured Term Loan as described within Note 4: Debt to the consolidated financial statements.
The following table sets forth the computation of basic and diluted net loss per share (in thousands, except per-share data):
Year Ended March 31, | |||||||||||
2020 | 2019 | 2018 | |||||||||
Numerator: | |||||||||||
Net loss | $ | (5,210 | ) | $ | (42,797 | ) | $ | (43,346 | ) | ||
Denominator: | |||||||||||
Weighted average shares - basic and diluted | 37,593 | 35,551 | 34,687 | ||||||||
Net loss per share - basic and diluted | $ | (0.14 | ) | $ | (1.20 | ) | $ | (1.25 | ) | ||
The following outstanding shares of common stock equivalents were excluded from the computation of the diluted net loss per share attributable to common stock for the periods presented because their effect would have been anti-dilutive (in thousands):
78
Year Ended March 31, | ||||||||
2020 | 2019 | 2018 | ||||||
Stock awards | 931 | 307 | 1,838 | |||||
Warrants | 6,312 | 4,657 | 75 | |||||
ESPP | 223 | — | — | |||||
Total | 7,466 | 4,964 | 1,913 | |||||
The dilutive impact related to common shares from stock incentive plans and outstanding warrants is determined by applying the treasury stock method to the assumed vesting of outstanding performance share units and restricted stock units and the exercise of outstanding options and warrants. The dilutive impact related to common shares from contingently issuable performance share units is determined by applying a two-step approach using both the contingently issuable share guidance and the treasury stock method.
We had outstanding market based restricted stock units as of March 31, 2020 that were eligible to vest into shares of common stock subject to the achievement of certain average stock price targets in addition to a time-based vesting period. These contingently issuable shares are excluded from the computation of diluted earnings per share if, based on current period results, the shares would not be issuable if the end of the reporting period were the end of the contingency period. There were 0.9 million shares of contingently issuable market based restricted stock units that were excluded from the table above as the market conditions were not satisfied as of March 31, 2020.
On November 18, 2019, 3.8 million warrants issued by the Company related to the TCW Term Loan agreement were exercised on a cashless basis, resulting in the issuance of 2.8 million shares of common stock.
NOTE 9: INCOME TAXES
Pre-tax loss reflected in the consolidated statements of operations for the years ended March 31, 2020, 2019 and 2018 is as follows (in thousands):
Year Ended March 31, | ||||||||||||
2020 | 2019 | 2018 | ||||||||||
U.S. | $ | (6,318 | ) | $ | (40,935 | ) | $ | (46,923 | ) | |||
Foreign | 1,911 | 514 | 514 | 464 | ||||||||
Total | $ | (4,407 | ) | $ | (40,421 | ) | $ | (46,459 | ) | |||
Income tax provision (benefit) consists of the following (in thousands):
Year Ended March 31, | |||||||||||
2020 | 2019 | 2018 | |||||||||
Current tax expense | |||||||||||
Federal | $ | (115 | ) | $ | (217 | ) | $ | (3,484 | ) | ||
State | 106 | 31 | 26 | ||||||||
Foreign | 1,271 | 1,103 | 206 | ||||||||
Total current tax expense | 1,262 | 917 | (3,252 | ) | |||||||
Deferred tax expense | |||||||||||
State | 33 | 32 | 32 | ||||||||
Foreign | (492 | ) | 1,427 | 107 | |||||||
Total deferred tax expense | (459 | ) | 1,459 | 139 | |||||||
Income tax provision (benefit) | $ | 803 | $ | 2,376 | $ | (3,113 | ) | ||||
79
The income tax provision differs from the amount computed by applying the federal statutory rate of 21% for 2020 and 2019, and 31.5% for 2018 to income (loss) before income taxes as follows (in thousands):
For the year ended March 31, | |||||||||||
2020 | 2019 | 2018 | |||||||||
Expense (benefit) at the federal statutory rate | $ | (925 | ) | $ | (8,488 | ) | $ | (14,634 | ) | ||
Equity compensation | 280 | 905 | 1,024 | ||||||||
Permanent items | 914 | 359 | 564 | ||||||||
Foreign taxes | 1,612 | (2,133 | ) | 1,336 | |||||||
State income taxes | (20 | ) | (997 | ) | (830 | ) | |||||
Valuation allowance | (2,639 | ) | 10,913 | (42,784 | ) | ||||||
Uncertain tax positions | (8,654 | ) | (9,278 | ) | (336 | ) | |||||
Tax reform | — | (207 | ) | 52,682 | |||||||
Credit monetization | — | — | (323 | ) | |||||||
Expiration of attributes | 11,679 | 12,268 | 410 | ||||||||
Research and development credits | (1,566 | ) | (879 | ) | (1,714 | ) | |||||
Other | 122 | (87 | ) | 1,492 | |||||||
Income tax provision | $ | 803 | $ | 2,376 | $ | (3,113 | ) | ||||
Significant components of deferred tax assets and liabilities are as follows (in thousands):
As of March 31, | |||||||
2020 | 2019 | ||||||
Deferred tax assets | |||||||
Inventory valuation method | $ | 924 | $ | 882 | |||
Accrued warranty expense | 650 | 814 | |||||
Distribution reserves | 187 | 2,137 | |||||
Loss carryforwards | 85,638 | 93,308 | |||||
Tax credits | 17,416 | 20,346 | |||||
Restructuring charge accruals | — | 678 | |||||
Deferred revenue | 17,043 | 13,094 | |||||
Acquired intangibles | 2,660 | 2,822 | |||||
Lease obligations | 3,413 | — | |||||
Other accruals and reserves not currently deductible for tax purposes | 16,152 | 7,051 | |||||
Gross deferred tax assets | 144,083 | 141,132 | |||||
Valuation allowance | (137,814 | ) | (140,359 | ) | |||
Total deferred tax assets, net of valuation allowance | $ | 6,269 | $ | 773 | |||
Deferred tax liabilities | |||||||
Depreciation | $ | (1,440 | ) | $ | (450 | ) | |
Lease assets | (3,413 | ) | — | ||||
Other | (967 | ) | (524 | ) | |||
Total deferred tax liabilities | $ | (5,820 | ) | $ | (974 | ) | |
Net deferred tax assets (liabilities) | $ | 449 | $ | (201 | ) | ||
The valuation allowance decreased by $2,545 during the year ended March 31, 2020, increased by $10,311 during the year ended March 31, 2019, and decreased by $24,248 during the year ended March 31, 2018.
A reconciliation of the gross unrecognized tax benefits follows (in thousands):
80
For the year ended March 31, | |||||||||||
2020 | 2019 | 2018 | |||||||||
Beginning Balance | $ | 116,032 | $ | 150,559 | $ | 170,730 | |||||
Increase in balances related to tax positions in current period | 2,275 | 1,718 | 3,298 | ||||||||
Increase in balances related to tax positions in prior period | 144 | — | 25 | ||||||||
Decrease in balances related to tax positions in prior period | (4 | ) | (25,095 | ) | (20,692 | ) | |||||
Decrease in balances due to lapse in statute of limitations | (11,165 | ) | (11,150 | ) | (810 | ) | |||||
Settlement and effective settlements with tax authorities and related remeasurements | — | — | (1,992 | ) | |||||||
Ending balance | $ | 107,282 | $ | 116,032 | $ | 150,559 | |||||
During fiscal 2020, excluding interest and penalties, there was a $8.8 million change in the Company's unrecognized tax benefits. Including interest and penalties, the total unrecognized tax benefit at March 31, 2020 was $108.4 million, of which $90.1 million, if recognized, would favorably affect the effective tax rate. At March 31, 2020, accrued interest and penalties totaled $1.1 million. The Company's practice is to recognize interest and penalties related to income tax matters in the income tax provision in the consolidated statements of operations. As of March 31, 2020, $102.3 million of unrecognized tax benefits were recorded as a contra deferred tax asset in other long-term assets in the consolidated balance sheets and $6.1 million (including interest and penalties) were included in other long-term liabilities in the consolidated balance sheets.
The Company files its tax returns as prescribed by the laws of the jurisdictions in which we operate. Our U.S. tax returns have been audited for years through 2002 by the Internal Revenue Service. In other major jurisdictions, the Company is generally open to examination for the most recent three to five fiscal years. During the next 12 months, it is reasonably possible that approximately $9.1 million of tax benefits, inclusive of interest and penalties, that are currently unrecognized could be recognized as a result of the expiration of applicable statutes of limitations.
As of March 31, 2020, the Company had federal net operating loss and tax credit carryforwards of approximately $334.2 million and $67.6 million, respectively. The net operating loss and tax credit carryforwards expire in varying amounts beginning in fiscal year 2022 if not previously utilized, and $13.3 million are indefinite-lived net operating loss carryforwards. These carryforwards include $11.1 million of acquired net operating losses and $8.4 million of acquired credits, the utilization of which is subject to various limitations due to prior changes in ownership.
Certain changes in stock ownership could result in a limitation on the amount of both acquired and self-generated net operating loss and tax credit carryovers that can be utilized each year. If the Company has previously undergone, or should it experience in the future, such a change in stock ownership, it could severely limit the usage of these carryover tax attributes against future income, resulting in additional tax charges.
Due to its history of net losses and the difficulty in predicting future results, Quantum believes that it cannot rely on projections of future taxable income to realize the deferred tax assets. Accordingly, it has established a full valuation allowance against its U.S. and certain foreign net deferred tax assets. Significant management judgement is required in determining the Company's deferred tax assets and liabilities and valuation allowances for purposes of assessing its ability to realize any future benefit from its net deferred tax assets. The Company intends to maintain this valuation allowance until sufficient positive evidence exists to support the reversal of the valuation allowance. The Company's income tax expense recorded in the future will be reduced to the extent that sufficient positive evidence materializes to support a reversal of, or decrease in, its valuation allowance.
NOTE 10: COMMITMENTS AND CONTINGENCIES
Commitments to Purchase Inventory
The Company uses contract manufacturers for our manufacturing operations. Under these arrangements, the contract manufacturer procures inventory to manufacture products based upon our forecast of customer demand. The Company has similar arrangements with certain other suppliers. The Company is responsible for the financial impact on the supplier or contract manufacturer of any reduction or product mix shift in the forecast relative to materials that the third party had already purchased under a prior forecast. Such a variance in forecasted demand could require a cash payment for inventory in excess of current customer demand or for costs of excess or obsolete
81
inventory. As of March 31, 2020, the Company had issued non-cancelable commitments for $19.5 million to purchase inventory from our contract manufacturers and suppliers.
Legal Proceedings
On July, 22 2016, Realtime Data LLC d/b/a IXO (“Realtime Data”) filed a patent infringement lawsuit against Quantum in the U.S. District Court for the Eastern District of Texas, alleging infringement of U.S. Patents Nos. 7,161,506, 7,378,992, 7,415,530, 8,643,513, 9,054,728, and 9,116,908. The lawsuit has been transferred to the U.S. District Court for the Northern District of California for further proceedings. Realtime Data asserts that we have incorporated Realtime Data’s patented technology into our compression products and services. Realtime Data seeks unspecified monetary damages and other relief that the Court deems appropriate. On July 31, 2017, the District Court stayed proceedings in this litigation pending decision in Inter Partes Review proceedings before the Patent Trial and Appeal Board relating to the Realtime patents. In those proceedings the asserted claims of the ’506 patent, the ’992 patent, and the ’513 patent were found unpatentable. In addition on July 19, 2019, all claims of the ’728 patent, the ’530 patent, and the ’908 patent were found invalid under 35 U.S.C. § 101 by Judge Connolly in the District of Delaware. The stay remains in effect pending Realtime’s appeal of those rulings. We believe the probability that this lawsuit will have a material adverse effect on our business, operating results or financial condition is remote.
Indemnifications
The Company has certain financial guarantees, both express and implied, related to product liability and potential infringement of intellectual property. Other than certain product warranty liabilities recorded as of March 31, 2020 and 2019, the Company did not record a liability associated with these guarantees, as the Company has little, or no history of costs associated with such indemnification requirements. Contingent liabilities associated with product liability may be mitigated by insurance coverage that the Company maintains.
In the normal course of business to facilitate transactions of the Company’s services and products, the Company indemnifies certain parties with respect to certain matters. The Company has agreed to hold certain parties harmless against losses arising from a breach of representations or covenants, or out of intellectual property infringement or other claims made against certain parties. These agreements may limit the time within which an indemnification claim can be made and the amount of the claim. In addition, the Company has entered into indemnification agreements with its officers and directors, and the Company’s bylaws contains similar indemnification obligations to its agents. It is not possible to determine the maximum potential amount under these indemnification agreements due to the limited history of the Company’s indemnification claims, and the unique facts and circumstances involved in each particular agreement. Historically, payments made by the Company under these agreements have not had a material impact on its operating results, financial position, or cash flows.
NOTE 11: FAIR VALUE OF FINANCIAL INSTRUMENTS
The Company has certain non-financial assets that are measured at fair value on a non-recurring basis when there is an indicator of impairment, and they are recorded at fair value only when an impairment is recognized. These assets include property and equipment and amortizable intangible assets. The Company did not record impairments to any non-financial assets in the fiscal years ended March 31, 2020, 2019 and 2018. The Company does not have any non-financial liabilities measured and recorded at fair value on a non-recurring basis. The carrying amounts reported in the accompanying consolidated financial statements for cash and cash equivalents, restricted cash, accounts receivable, accounts payable, accrued expenses and other current liabilities approximate their respective fair values because of the short-term nature of these accounts.
Warrants and Warrant Liability
The Company uses the Black-Scholes-Merton option valuation model for estimating fair value of common stock warrants. The expected life of warrants granted represent the period of time that they are expected to be outstanding. The Company determines the expected life based on historical experience with similar awards, giving consideration to the contractual terms, exercise patterns, and post-vesting forfeitures. The Company estimates volatility based on the historical volatility of the common stock over the most recent period corresponding with the estimated expected life of the award. The Company bases the risk-free interest rate used in the Black-Scholes-Merton stock option valuation model on the implied yield currently available on U.S. Treasury zero-coupon issues
82
with an equivalent term equal to the expected life of the award. The Company has not paid any cash dividends on the common stock and does not anticipate paying any cash dividends in the foreseeable future.
During fiscal year 2018, the Company began issuing common stock warrants in connection with amendments to the TCW Term Loan. The warrants were initially accounted for as a liability and recorded at estimated fair value on a recurring basis due to exercise price reset provisions contained in the warrant agreements. As such, the Company estimated the fair value of the warrants at the end of each reporting period using the Black-Scholes-Merton valuation model. At the end of each reporting period, the Company recorded the changes in the estimated fair value during the period in other (income) expense in the consolidated statements of operations and comprehensive income (loss). The warrant liabilities are valued at issuance and each subsequent measurement date using the Black-Scholes-Merton option valuation model.
The following table shows the ranges of assumptions and estimates utilized within the Black-Scholes-Merton option valuation models for the period presented:
Inputs | Year Ended March 31, | |||
2019 | 2018 | |||
Company's stock price | $1.62 - $2.40 | $3.64 - $5.63 | ||
Exercise prices | $0.01 - $2.40 | $0.01 | ||
Expected term (years) | 4.5 to 5.0 | 4.8 to 5.0 | ||
Volatility | 64.1% - 71.8% | 59.8% - 69.1% | ||
Risk free interest rate | 2.5% - 3.0% | 2.1% - 2.7% | ||
Dividend rate | —% | —% | ||
During the three months ended March 31, 2019, the exercise price for these warrants reset and became fixed, at which time they were considered to be indexed to the Company’s own stock and met the scope requirements for equity classification. The fair value of the warrants upon the exercise price reset was reclassified to stockholders’ deficit. The Company classified the warrant liability subject to recurring fair value measurement as Level 3 prior to the reclassification to stockholders’ deficit. As the outstanding warrants were reclassified to stockholders’ deficit in the three months ended March 31, 2019, there was no warrant liability as of March 31, 2020 and 2019.
The table presented below is a summary of changes in the fair value of the Company’s Level 3 valuations for the warrant liability for the periods presented (in thousands):
Warrant liability | |||
As of March 31, 2018 | $ | 272 | |
Issuances | 5,683 | ||
Settlements | (615 | ) | |
Changes in fair value | 297 | ||
Reclassifications to stockholders' deficit | (5,637 | ) | |
As of March 31, 2019 | $ | — | |
Debt
The table below represents the carrying value and total estimated fair value of long-term debt as of March 31, 2020 and March 31, 2019, respectively. The fair value has been classified as Level 2 within the fair value hierarchy.
March 31, | ||||||||||||||||
2020 | 2019 | |||||||||||||||
Carrying Value | Fair Value | Carrying Value | Fair Value | |||||||||||||
Senior Secured Term Loan | $ | 165,208 | $ | 151,678 | $ | 164,588 | $ | 160,259 | ||||||||
Amended PNC Credit Facility | 2,620 | 2,226 | — | — | ||||||||||||
83
NOTE 12: SUBSEQUENT EVENTS
Paycheck Protection Program
On April 13, 2020, Quantum Corporation (the “Company”) entered into a Payment Protection Term Note (the “Note”) effective April 11, 2020 with PNC Bank, National Association as the lender (“Lender”) in an aggregate principal amount of $10.0 million pursuant to the Paycheck Protection Program under the Coronavirus Aid, Relief, and Economic Security (CARES) Act (the “PPP Loan”). Subject to the terms of the Note, the PPP Loan bears interest at a fixed rate of 1% per annum, with interest deferred up to a maximum of 10 months payable monthly thereafter, has an initial term of two years and is unsecured and guaranteed by the Small Business Administration. Under the terms of the PPP Note, the Company may apply for forgiveness of the amount due on the Loan. The Company intends to use the proceeds from the PPP Loan for qualifying expenses and to apply for forgiveness of the PPP Loan in accordance with the terms of the CARES Act. However, the Company cannot assure at this time that the PPP Loan will be forgiven partially, or in full.
In order to apply for the PPP Loan, the Company was required to certify, among other things, that the current economic uncertainty made the PPP Loan request necessary to support its ongoing operations. The Company made this certification in good faith after analyzing, among other things, its financial situation and access to alternative forms of capital, and believe that it satisfied all eligibility criteria for the PPP Loan, and that its receipt of the PPP Loan is consistent with the spirit and broad objectives of the PPP and of the CARES Act. The certification described above does not contain any objective criteria and is subject to interpretation. On April 23, 2020, the SBA issued guidance stating that it is unlikely that a public company with substantial market value and access to capital markets will be able to make the required certification in good faith. In addition, the SBA stated its intent to audit the PPP Loan application of any company, like the Company, that received proceeds under the PPP of more than $2 million. Additionally, on May 8, 2020, the Company was one of five publicly traded companies to receive a letter from the United States House of Representatives’ Select Subcommittee on the Coronavirus Crisis ("the Subcommittee") requesting that the Company return the PPP Loan proceeds, and if it did not return the proceeds, requiring the Company to produce to the Subcommittee specified documentation related to its PPP Loan. The Company intends to cooperate fully with the Subcommittee’s review of its PPP Loan. If the Company is later determined to have violated any of the laws or governmental regulations that apply to it in connection with the PPP Loan, such as the False Claims Act, or it is otherwise determined that the Company was ineligible to receive the PPP Loan, the Company may be subject to penalties, including significant civil, criminal and administrative penalties and could be required to repay the PPP Loan in its entirety.
Long-Term Debt Amendments
Amendment to the Senior Secured Term Loan
On June 16, 2020, the Company entered into an amendment to the Senior Secured Term Loan (the "June 2020 Term Loan Amendment"). The amendment provides an additional borrowing of $20.0 million which was immediately drawn in full. The amendment also: (a) waives the ECF Payment of $5.3 million for the year ended March 31, 2020; (b) defers payment of the scheduled amortization payments due on June 30, 2020, September 30, 2020, and December 31, 2020 until the maturity date; (c) amends the definition of “EBITDA” to, among other things, add an add-back for certain costs, expenses and fees incurred in connection with the transactions contemplated by the amendment; (d) waives compliance with the total net leverage ratio, fixed charge coverage ratio, minimum liquidity and minimum EBITDA financial covenants for the quarters ending on June 30, 2020, September 30, 2020, December 31, 2020, and March 31, 2021; (e) adds a financial covenant that requires a minimum monthly average undrawn availability of $7.0 million under the Amended PNC Credit Facility during the period from June 30, 2020 through and including May 31, 2021; and (f) amends the covenant levels for the total net leverage ratio, fixed charge coverage ratio, and minimum EBITDA financial covenants, commencing with the quarter ending June 30, 2021. The amendment modified the Equity Clawback to allow the Company to prepay up to 50% of the aggregate principal amount of the outstanding Senior Secured Term Loan balance with cash proceeds of a public offering of the Company’s common stock at a prepayment premium of 5% of the principal amount being repaid. The amendment also added an exit fee of 2% of the aggregate principal amount repaid excluding amounts repaid that are subject to the Equity Clawback.
In connection with the June 2020 Term Loan Amendment, the Company issued to the lenders warrants (the “2020 Term Loan Warrants”) to purchase 3,400,000 shares of the Company’s common stock, at an exercise price of $3.00
84
per share. The exercise price and the number of shares underlying the 2020 Term Loan Warrants are subject to adjustment in the event of specified events, including dilutive issuances of common stock linked equity instruments at a price lower than the exercise price of the warrants, a subdivision or combination of the Company’s common stock, a reclassification of the Company’s common stock or specified dividend payments. The 2020 Term Loan Warrants are exercisable until June 16, 2030. Upon exercise, the aggregate exercise price may be paid, at each warrant holder’s election, in cash or on a net issuance basis, based upon the fair market value of the Company’s common stock at the time of exercise.
Registration Rights Agreement
In connection with the June 2020 Term Loan Amendment, the Company entered into an amended and restated registration rights agreement (the “Amended Registration Rights Agreement”) with the holders of the 2018 Term Loan Warrants and the 2020 Term Loan Warrants (collectively, the “Term Loan Warrants”). The Amended Registration Rights Agreement grants the holders of the Term Loan Warrants certain registration rights for the shares of common stock issuable upon the exercise of the applicable Term Loan Warrants, including (i) the ability of a holder to request that the Company file a Form S-1 registration statement with respect to at least 40% of the registrable securities held by such holder as of the issuance date of the applicable Term Loan Warrants on or after June 16, 2020; (ii) the ability of a holder to request that the Company file a Form S-3 registration statement with respect to outstanding registrable securities if at any time the Company is eligible to use a Form S-3 registration statement; and (iii) certain piggyback registration rights related to potential future equity offerings of the Company, subject to certain limitations.
Amendments to Amended PNC Credit Facility
On April 3, 2020, the Company entered into an amendment to the Amended PNC Credit Facility. The amendment amends certain terms, including to waive compliance with the total net leverage ratio and total leverage ratio covenants for the quarter ending March 31, 2020.
On June 16, 2020, the Company entered into an amendment to the Amended PNC Credit Facility. The amendment amends certain terms, including: (a) amends the definition of “EBITDA” to, among other things, add an add-back for certain costs, expenses and fees incurred in connection with the transactions contemplated by the amendment; (b) waives compliance with the total net leverage ratio, total leverage ratio, fixed charge coverage ratio, minimum liquidity and minimum EBITDA financial covenants for the quarters ending on June 30, 2020, September 30, 2020, December 31, 2020, and March 31, 2021; (c) adds a financial covenant that requires a minimum monthly average undrawn availability level of $7.0 million for the period from June 30, 2020 through and including May 31, 2021; (d) adds a financial covenant that requires a minimum liquidity of not less than $10.0 million at the end of each quarter and a minimum average liquidity level $10.0 million for the ninety days preceding the last day of each quarter, beginning with the quarter ending June 30, 2021; (e) amends the covenant levels for the total net leverage ratio, total leverage ratio, fixed charge coverage ratio, and minimum EBITDA financial covenants, commencing with the quarter ending June 30, 2021; and (f) continues to includes a covenant that requires a minimum of $5.0 million of PNC qualified cash at all times.
The amendment also adjusts the applicable margin for advances under the Amended PNC Credit Facility such that (i) advances designated as “Domestic Rate Loans” and “Swing Loans” will have an applicable margin of (a) 4.50% for the period from the June 16, 2020 until the date quarterly financial statements are delivered to PNC for the fiscal quarter ending June 30, 2021 and (b) thereafter, ranging from 3.50% to 4.50% based on the Company’s applicable total leverage ratio and (ii) advances designated as “LIBOR Rate Loans” will have an applicable margin of (a) 5.50% for the period from June 16, 2020, until the date quarterly financial statements are delivered to PNC for the fiscal quarter ending June 30, 2021 and (b) thereafter, ranging from 4.50% to 5.50% based on the Company’s applicable total leverage ratio.
85
ITEM 9. CHANGES IN AND DISAGREEMENTS WITH ACCOUNTANTS ON ACCOUNTING AND FINANCIAL DISCLOSURE
None.
ITEM 9A. CONTROLS AND PROCEDURES
Limitations on Effectiveness of Controls and Procedures
In designing and evaluating our disclosure controls and procedures, management recognizes that any controls and procedures, no matter how well designed and operated, can provide only reasonable assurance of achieving the desired control objectives. In addition, the design of disclosure controls and procedures must reflect the fact that there are resource constraints and that management is required to apply judgment in evaluating the benefits of possible controls and procedures relative to their costs.
Evaluation of Disclosure Controls and Procedures
Our management, with the participation of our chief executive officer and chief financial officer, has evaluated the effectiveness of our disclosure controls and procedures (as defined in Rules 13a-15(e) and 15d-15(e) under the Securities Exchange Act of 1934, as amended, or the "Exchange Act,") as of the end of the period covered by this Annual Report on Form 10-K.
Based on this evaluation, our chief executive officer and chief financial officer concluded that, as of March 31, 2020, our disclosure controls and procedures were effective at the reasonable assurance level.
Remediation of Material Weakness
Throughout the year ended March 31, 2020, the Company undertook remediation measures related to the previously reported material weaknesses in internal control over financial reporting. We completed these remediation measures in the quarter ended March 31, 2020, including testing of the design, and concluding on the operating effectiveness of the related controls.
Specifically, we undertook the following remediation measures:
• | We enhanced the controls over revenue recognition and the preparation, analysis, and review of significant account reconciliations and closing adjustments required to assess the appropriateness of revenue recognition and certain other account balances at period end. The enhanced controls have operated for a sufficient period of time in order for management to conclude, through testing, that these controls are designed and operating effectively. |
• | We assessed our accounting resource requirements across the Company and as a result have hired additional experienced accounting personnel and have taken steps to improve the overall control effectiveness and efficiency of our accounting and reporting processes. Our assessment was performed in the prior fiscal year, continuing into the current fiscal year, which has allowed for the hiring of additional personnel to have a sufficient period of time to operate relevant controls. In addition to these resources, we have enhanced the design of our existing controls and implemented certain new controls over the following areas: (1) our global risk assessment process, evaluation, and mitigation strategies; (2) updated our internal audit plan to include internal audit monitoring activities responsive to the issues identified in the independent investigation and review of our financial records; and (3) implemented new procedures and enhanced controls governing our internal management-led Disclosure Committee and strengthened our sub-certification and external reporting processes associated with the review and approval of the content of our SEC filings and other public disclosures. The enhanced controls have operated for a sufficient period of time in order for management to conclude, through testing, that these controls are designed and operating effectively. |
• | We have designed and where appropriate enhanced controls over the preparation, analysis and review of revenue recognition and significant account reconciliations. In addition, we have reinforced existing policies |
and procedures and enacted policy and procedures changes, where necessary, to better define requirements for effective and timely reconciliations of balance sheet and significant accounts, including independent review.
Based on these procedures, we believe that the previously reported material weaknesses have been remediated. However, completion of remediation procedures for these material weaknesses does not provide assurance that our modified controls will continue to operate properly or that our financial statements will be free from error.
Management’s Annual Report on Internal Control over Financial Reporting
Our management is responsible for establishing and maintaining adequate internal control over financial reporting, as defined in Rules 13a-15(f) under the Securities Exchange Act of 1934. Our management, with the participation of our principal executive and principal financial officers, evaluated the effectiveness of our internal control over financial reporting using the framework set forth by the Committee of Sponsoring Organizations of the Treadway Commission in Internal Control—Integrated Framework (2013). Based on this assessment, management concluded
that Quantum Corporation maintained effective internal control over financial reporting as of the end of the period covered by this Annual Report. Armanino LLP, our independent registered public accounting firm, has issued an attestation report on our internal control over financial reporting, and this attestation report appears in Item 8.
Changes in Internal Controls over Financial Reporting
Other than described above in this Item 9A, there was no change in our internal control over financial reporting (as defined in Rules 13a-15(f) and 15d-15(f) under the Exchange Act) identified in connection with the evaluation of our internal control performed during the fiscal quarter ended March 31, 2020, that has materially affected, or is reasonably likely to materially affect, our internal control over financial reporting.
ITEM 9B. OTHER INFORMATION
None.
PART III
ITEM 10. DIRECTORS, EXECUTIVE OFFICERS AND CORPORATE GOVERNANCE
The information required by Item 10 is incorporated by reference from the sections entitled “Election of Directors”, “Board of Directors and Committees”, “Security Ownership of Certain Beneficial Owners and Management” and “Audit Committee Report” in our definitive Proxy Statement for our 2020 annual stockholders’ meeting.
ITEM 11. EXECUTIVE COMPENSATION
The information required by Item 11 is incorporated by reference from the sections entitled “Election of Directors”, “Director Compensation”, “Corporate Governance”, “Director Compensation”, “Compensation Discussion and Analysis”, “Compensation Committee Report”, “Compensation Committee Interlocks and Insider Participation”, and “Executive Compensation” in our definitive Proxy Statement for our 2020 annual stockholders’ meeting.
86
ITEM 12. SECURITY OWNERSHIP OF CERTAIN BENEFICIAL OWNERS AND MANAGEMENT AND RELATED STOCKHOLDER MATTERS
The information required by Item 12 is incorporated by reference from the section entitled “Security Ownership of Certain Beneficial Owners and Management” and “Equity Compensation Plan Information” in our definitive Proxy Statement for our 2020 annual stockholders’ meeting.
ITEM 13. CERTAIN RELATIONSHIPS AND RELATED TRANSACTIONS, AND DIRECTOR INDEPENDENCE
The information required by Item 13 is incorporated by reference from the section entitled “Board of Directors and Committees”, “Corporate Governance” and “Transactions with Related Persons” in our definitive Proxy Statement for our 2020 annual stockholders’ meeting.
ITEM 14. PRINCIPAL ACCOUNTING FEES AND SERVICES
The information required by Item 14 is incorporated by reference from the section entitled “Audit and Audit-Related Fees” in our definitive Proxy Statement for our 2020 annual stockholders’ meeting.
87
PART IV
ITEM 15. EXHIBITS, FINANCIAL STATEMENT SCHEDULES
The financial statements and financial statement schedules required to be filed as part of this Annual Report are included under Item 8. The exhibits required to be filed as part of this Annual Report are listed below. Exhibits 10.1 through 10.39 constitute management contracts or compensatory plans or arrangements. Notwithstanding any language to the contrary, Exhibits 32.1, 32.2, 101, and 104 shall not be deemed to be filed as part of this Annual Report for purposes of Section 18 of the Securities Exchange Act of 1934.
Incorporated by Reference | ||||||||||
Exhibit Number | Exhibit Description | Form | Filing Date | Exhibit | Filed or Furnished Herewith | |||||
3.1 | 8-K | 8/16/07 | 3.1 | |||||||
3.2 | 8-K | 12/5/08 | 3.1 | |||||||
3.3 | 8-K | 1/26/10 | 3.1 | |||||||
3.4 | 8-K | 2/8/16 | 3.5 | |||||||
3.5 | 10-Q | 11/9/17 | 3.1 | |||||||
4.1 | S-3 | 10/9/03 | 4.7 | |||||||
4.2 | 8-K | 12/28/18 | 4.1 | |||||||
4.3 | 8-K | 12/28/18 | 4.2 | |||||||
4.4 | 8-K | 12/28/18 | 4.3 | |||||||
4.5 | 8-K | 6/17/20 | 4.1 | |||||||
4.6 | 8-K | 6/17/20 | 4.2 | |||||||
4.7 | 8-K | 6/17/20 | 4.3 | |||||||
4.8 | 8-K | 6/17/20 | 4.4 | |||||||
4.9 | 8-K | 6/17/20 | 4.5 | |||||||
4.10 | 4.1 | X | ||||||||
10.1 | 8-K | 2/10/06 | 10.2 | |||||||
10.2 | 8-K | 2/10/06 | 10.3 | |||||||
10.3 | 8-K | 4/4/07 | 10.4 | |||||||
10.4 | 8-K | 5/10/11 | 10.3 | |||||||
10.5 | 10-K | 6/12/15 | 10.25 | |||||||
10.6 | 10-Q | 11/6/15 | 10.2 | |||||||
10.7 | 8-K | 10/21/16 | 10.2 | |||||||
10.8 | 8-K | 5/4/17 | 10.1 | |||||||
10.9 | 8-K | 8/24/17 | 10.2 | |||||||
10.10 | 8-K | 9/5/17 | 10.1 | |||||||
10.11 | 8-K | 11/9/17 | 10.2 | |||||||
10.12 | 8-K | 2/20/18 | 10.1 | |||||||
88
10.13 | 8-K | 5/30/18 | 10.1 | |||||||
10.14 | 8-K | 5/30/18 | 10.2 | |||||||
10.15 | 8-K | 6/27/18 | 10.1 | |||||||
10.16 | 8-K | 6/27/18 | 10.2 | |||||||
10.17 | 8-K | 12/28/18 | 10.1 | |||||||
10.18 | 8-K | 12/28/18 | 10.2 | |||||||
10.19 | 8-K | 5/31/19 | 99.2 | |||||||
10.20 | 10-K | 8/6/19 | 10.68 | |||||||
10.21 | 10-K | 8/6/19 | 10.75 | |||||||
10.22 | 10-K | 8/6/19 | 10.76 | |||||||
10.23 | 10-Q | 11/5/19 | 10.1 | |||||||
10.24 | 8-K | 11/13/2019 | 10.1 | |||||||
10.25 | 8-K | 11/13/2019 | 10.2 | |||||||
10.26 | 10-Q | 1/29/2020 | 10.1 | |||||||
10.27 | 8-K | 4/6/20 | 10.1 | |||||||
10.28 | 8-K | 4/6/20 | 10.2 | |||||||
10.29 | 8-K | 4/16/20 | 10.1 | |||||||
10.30 | 8-K | 4/16/20 | 10.2 | |||||||
10.31 | 8-K | 4/16/20 | 10.3 | |||||||
10.32 | 8-K | 6/17/20 | 10.1 | |||||||
10.33 | 8-K | 6/17/20 | 10.2 | |||||||
10.34 | 10.1 | X | ||||||||
10.35 | 10.2 | X | ||||||||
10.36 | 10.3 | X | ||||||||
10.37 | 10.4 | X | ||||||||
10.38 | 10.5 | X | ||||||||
10.39 | 10.6 | X | ||||||||
16.1 | 8-K | 1/25/19 | 16.1 | |||||||
89
21.1 | X | |||||||||
23.1 | X | |||||||||
24.1 | X | |||||||||
31.1 | X | |||||||||
31.2 | X | |||||||||
32.1 | X | |||||||||
32.2 | X | |||||||||
101 | Interactive Data Files | X | ||||||||
104 | Cover page interactive data file, submitted using XBRL (contained in Exhibit 101) | X | ||||||||
90
ITEM 16. FORM 10-K SUMMARY
None.
SIGNATURE
Pursuant to the requirements of Section 13 or 15(d) of the Securities Exchange Act of 1934, the registrant has duly caused this report to be signed on its behalf by the undersigned, thereunto duly authorized.
Quantum Corporation | ||||
(Registrant) | ||||
June 24, 2020 | /s/ J. Michael Dodson | |||
(Date) | J. Michael Dodson | |||
Chief Financial Officer | ||||
91
POWER OF ATTORNEY
KNOW ALL PERSONS BY THESE PRESENTS, that each person whose signature appears below constitutes and appoints James Lerner and Michael Dodson, jointly and severally, his attorneys-in-fact, each with the power of substitution, for him in any and all capacities, to sign any amendments to this Annual Report on Form 10-K, and to file the same, with exhibits thereto and other documents in connection therewith, with the Securities and Exchange Commission, hereby ratifying and confirming all that each of said attorneys-in-fact, or his substitute or substitutes, may do or cause to be done by virtue hereof.
Pursuant to the requirements of the Securities Exchange Act of 1934, this Report has been signed below by the following persons in the capacities on June 24, 2020.
Signature | Title | |
/s/ James J. Lerner | President, Chief Executive Officer and Chairman of the Board | |
James J. Lerner | (Principal Executive Officer) | |
/s/ J. Michael Dodson | Chief Financial Officer | |
J. Michael Dodson | (Principal Financial Officer) | |
/s/ Lewis Moorehead | Chief Accounting Officer | |
Lewis Moorehead | (Principal Accounting Officer) | |
/s/ Raghavendra Rau | Director | |
Raghavendra Rau | ||
/s/ Marc E. Rothman | Director | |
Marc E. Rothman | ||
Director | ||
John A. Fichthorn | ||
/s/ Rebecca J. Jacoby | Director | |
Rebecca J. Jacoby | ||
92