Attached files
| file | filename |
|---|---|
| EX-99.1 - PRESS RELEASE - PennyMac Mortgage Investment Trust | pmt_8k-ex9901.htm |
| 8-K - CURRENT REPORT - PennyMac Mortgage Investment Trust | pmt_8k.htm |
Exhibit 99.2

PennyMac Mortgage Investment Trust May 5, 2016 First Quarter 2016 Earnings Report

1Q16 Earnings Report 2 This presentation contains forward - looking statements within the meaning of Section 21 E of the Securities Exchange Act of 1934 , as amended, regarding management’s beliefs, estimates, projections and assumptions with respect to, among other things, the Company’s financial results, future operations, business plans and investment strategies, as well as industry and market conditions, all of which are subject to change . Words like “believe,” “expect,” “anticipate,” “promise,” “plan,” and other expressions or words of similar meanings, as well as future or conditional verbs such as “will,” “would,” “should,” “could,” or “may” are generally intended to identify forward - looking statements . Actual results and operations for any future period may vary materially from those projected herein, from past results discussed herein, or illustrative examples provided herein . Factors which could cause actual results to differ materially from historical results or those anticipated include, but are not limited to : changes in our investment objectives or investment or operational strategies ; volatility in our industry, the debt or equity markets, the general economy or the residential finance and real estate markets ; changes in general business, economic, market, employment and political conditions or in consumer confidence ; declines in residential real estate or significant changes in U . S . housing prices or activity in the U . S . housing market ; availability of, and level of competition for, attractive risk - adjusted investment opportunities in residential mortgage loans and mortgage - related assets that satisfy our investment objectives ; concentration of credit risks to which we are exposed ; the degree and nature of our competition ; our dependence on our manager and servicer, potential conflicts of interest with such entities, and the performance of such entities ; availability, terms and deployment of short - term and long - term capital ; unanticipated increases or volatility in financing and other costs ; the performance, financial condition and liquidity of borrowers ; incomplete or inaccurate information or documentation provided by customers or counterparties, or adverse changes in the financial condition of our customers and counterparties ; the quality and enforceability of the collateral documentation evidencing our ownership and rights in the assets in which we invest ; increased rates of delinquency, default and/or decreased recovery rates on our investments ; increased prepayments of the mortgages and other loans underlying our mortgage - backed securities and other investments ; the degree to which our hedging strategies may protect us from interest rate volatility ; our failure to maintain appropriate internal controls over financial reporting ; our ability to comply with various federal, state and local laws and regulations that govern our business ; changes in legislation or regulations or the occurrence of other events that impact the business, operations or prospects of government agencies, mortgage lenders and/or publicly - traded companies ; the creation of the Consumer Financial Protection Bureau, or CFPB, and enforcement of its rules ; changes in government support of homeownership ; changes in government or government - sponsored home affordability programs ; changes in governmental regulations, accounting treatment, tax rates and similar matters (including changes to laws governing the taxation of real estate investment trusts, or REITs ; limitations imposed on our business and our ability to satisfy complex rules for us to qualify as a REIT for U . S . federal income tax purposes and qualify for an exclusion from the Investment Company Act of 1940 and the ability of certain of our subsidiaries to qualify as REITs or as taxable REIT subsidiaries for U . S . federal income tax purposes and our ability and the ability of our subsidiaries to operate effectively within the limitations imposed by these rules ; and the effect of public opinion on our reputation . You should not place undue reliance on any forward - looking statement and should consider all of the uncertainties and risks described above, as well as those more fully discussed in reports and other documents filed by the Company with the Securities and Exchange Commission from time to time . The Company undertakes no obligation to publicly update or revise any forward - looking statements or any other information contained herein, and the statements made in this presentation are current as of the date of this presentation only . Forward - Looking Statements

3 First Quarter Highlights • Net income of $14.5 million on net investment income of $52.2 million – Diluted earnings per share of $0.20; return on equity of 4% – Dividend of $0.47 per share declared on March 28, 2016 – Book value per share increased to $20.59 at March 31, 2016 • Underperformance of distressed loan investments totaling approximately $10 million, approximately $6 million in valuation losses on other credit investments and approximately $10 million in net valuation losses from interest rate strategies – Partially offset by a $1.4 million benefit from repricing deferred taxes and $1.7 million reduction in representations and warranties liability • Segment pretax results: Investment Activities: $0.1 million; Correspondent Production: $10.9 million • Continued investment in GSE credit risk transfer (CRT) and MSRs resulting from PMT’s correspondent production business – CRT - eligible deliveries for the quarter totaled $1.9 billion in UPB resulting in $67 million of new CRT investments – Added $36 million in new MSRs • Repurchased 5.3 million PMT common shares through April 4 th at a cost of $65.8 million – PMT’s Board of Trustees authorized an increase in the previously announced share repurchase program from $150 million to $200 million 1Q16 Earnings Report

4 First Quarter Highlights (continued) • Continued strong cash flows from PMT’s existing investments, including $96.5 million in cash proceeds generated from the liquidation and paydown of mortgage loans and REO • Sold ESS related to Fannie Mae and Freddie Mac MSRs to PennyMac Financial for $59 million in cash Notable Activity After Quarter End: • Completed the sale of $ 419 million of performing loans, generating approximately $100 million in net cash proceeds 1Q16 Earnings Report

3.0% 3.5% 4.0% 4.5% 5.0% Jan-13 Apr-13 Jul-13 Oct-13 Jan-14 Apr-14 Jul-14 Oct-14 Jan-15 Apr-15 Jul-15 Oct-15 Jan-16 Apr-16 Hundreds Average 30 - year fixed rate mortgage (1) 5 Current Market Environment and Outlook 1Q16 Earnings Report • Widespread volatility across financial markets during the quarter – Significant decline in U.S. interest rates; mortgage rates have remained low into 2Q16 and are at their lowest levels since May 2013 – Mortgage credit spreads widened driven by lower oil prices and concerns over growth in overseas economies • Economic fundamentals in the U.S. remain solid, favoring the housing market – Housing demand remains strong and the inventory of homes for sale is low – Low mortgage rates support affordability • Continued regulatory actions and new regulations underscore the importance of effective governance, compliance and operating systems 3.97% 3.71% (1) Freddie Mac Primary Mortgage Market Survey. 3.66% as of 4/28/2016 (2) Average spread to 1 - month LIBOR for outstanding STACR and CAS Class B bonds. Spread was 1,050 basis points as of 4/15/2016 GSE “First Loss” Credit Risk Spreads (2) (Basis points) 800 900 1,000 1,100 12/31/2015 1/31/2016 2/29/2016 3/31/2016 Spread to 1-month Libor

6 First Quarter Income and Return Contributions by Strategy (1) Income contribution is net of any direct expenses associated with investments (e.g., loan fulfillment fees, loan servicing fe es) (2) MSR, ESS and distressed loan strategies include an allocation of exchangeable senior notes and associated expenses (3) Management’s internal allocation of equity. Amounts represent weighted averages during the period 1Q16 Earnings Report ($ in millions) Market-Driven Value Changes Income Excluding Market-Driven Value Changes (1) Total Income Contribution (1) WA Equity Allocated (3) Annualized Return on Equity (ROE) Credit sensitive strategies: Distressed loan investments (2) n/a 13.1$ 13.1$ 777$ 6.7% Other credit sensitive strategies GSE credit risk transfer (6.7)$ 2.2$ (4.5)$ Non-Agency subordinate bonds (0.4)$ 0.3$ (0.2)$ Commercial real estate finance (0.2)$ 0.3$ 0.0$ Subtotal net other credit sensitive strategies (7.4)$ 2.7$ (4.7)$ 107$ -17.6% Net credit sensitive strategies (7.4)$ 15.8$ 8.4$ 884$ 3.8% Interest rate sensitive strategies: MSRs (incl. recapture) (2) (26.7)$ 2.0$ (24.7)$ ESS (incl. recapture) (2) (19.4)$ 6.5$ (12.9)$ Agency MBS 3.7$ 1.5$ 5.2$ Non-Agency senior MBS (incl. jumbo) 3.0$ 1.6$ 4.6$ Interest rate hedges 29.8$ -$ 29.8$ Net interest rate sensitive strategies (9.6)$ 11.6$ 2.1$ 407$ 2.0% Correspondent production 11.8$ 11.8$ 97$ 48.8% Cash, short term investments and other n/a 0.2$ 0.2$ Management fees & corporate expenses n/a 11.4$ 11.4$ Income tax benefit n/a (3.5)$ (3.5)$ Net income (16.9)$ 31.4$ 14.5$ 1,473$ 3.9%
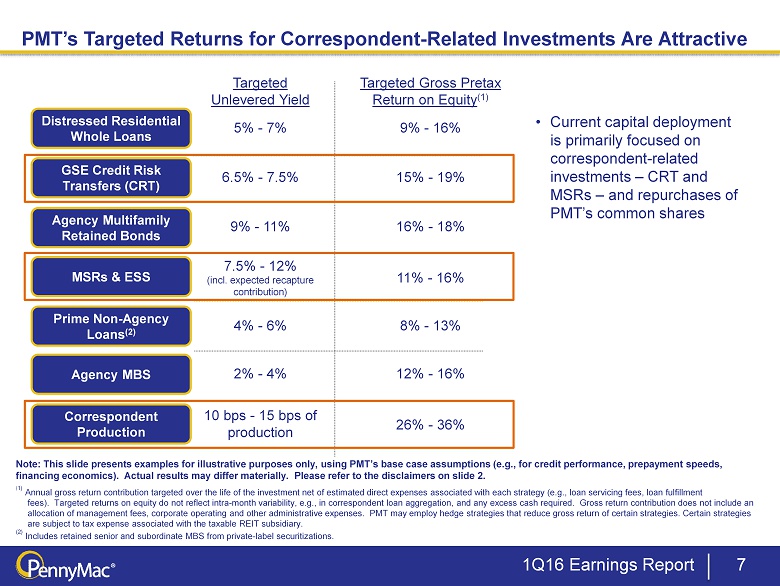
PMT’s Targeted Returns for Correspondent - Related Investments Are Attractive 7 1Q16 Earnings Report Agency Multifamily Retained Bonds Correspondent Production MSRs & ESS Distressed Residential Whole Loans GSE Credit Risk Transfers (CRT) Prime Non - Agency Loans (2) Agency MBS Targeted Unlevered Yield Targeted Gross Pretax Return on Equity (1) 5% - 7% 10 bps - 15 bps of production 2% - 4% 7.5% - 12% (incl. expected recapture contribution) 6.5% - 7.5% 9% - 11% 9% - 16% 26% - 36% 12% - 16% 11% - 16% 15% - 19% 16% - 18% 4% - 6% 8% - 13% • Current capital deployment is primarily focused on correspondent - related investments – CRT and MSRs – and repurchases of PMT’s common shares Note: This slide presents examples for illustrative purposes only, using PMT’s base case assumptions (e.g., for credit perfor man ce, prepayment speeds, financing economics). Actual results may differ materially. Please refer to the disclaimers on slide 2. ( 1) Annual gross return contribution targeted over the life of the investment net of estimated direct expenses associated with ea ch strategy (e.g., loan servicing fees, loan fulfillment fees). Targeted returns on equity do not reflect intra - month variability, e.g., in correspondent loan aggregation, and any excess cash required. Gross return contribution does not include an allocation of management fees, corporate operating and other administrative expenses. PMT may employ hedge strategies that redu ce gross return of certain strategies. Certain strategies are subject to tax expense associated with the taxable REIT subsidiary. (2) Includes retained senior and subordinate MBS from private - label securitizations.

8 Share Repurchase Program Update 1Q16 Earnings Report • Repurchased 5 . 3 million PMT common shares year - to - date ( 1 ) ; 6 . 3 million shares since inception • On February 24 th , PMT’s Board of Trustees authorized an increase in its previously announced share repurchase program from $ 150 million to $ 200 million (1) Repurchases of common shares through 4/4/2016 2016 Share Repurchases through April 4 th PMT Shares Outstanding $65.8 $106.6 $0 $20 $40 $60 $80 $100 $120 Cost Estimated Book Value 74.8 73.8 68.7 60 65 70 75 At inception of repurchase program 12/31/2015 4/4/2016 ($ in millions) (in millions)

• After quarter end, PMT completed the sale of performing loans totaling $419 million in UPB at a modest premium to our December 31, 2015 carrying value; generated approximately $100 million in net cash proceeds (1) – Sale of these loans demonstrates that a strong market exists for performing loans with high - quality attributes • All of the loans sold had at least 12 consecutive months in “current” payment status; buyers place the greatest value on loans’ current payment history • Ongoing execution of our strategy for resolving segments of our distressed portfolio through loan modifications and subsequent monetization of the seasoned performing loans • Following the sale, the remaining portfolio of performing loans totals approximately $800 million in UPB and is in varying states of “ reperformance ” – Approximately two thirds of the performing loans have a current payment history of less than 6 months and require additional seasoning before they are candidates for sale 9 Performing Loan Sale to Fund Ongoing Investments and Share Repurchases 1Q16 Earnings Report (1) After debt repayment and related expenses, including servicing activity fees of $5.1 million payable to PFSI.

Mortgage Investment Activities

11 Strong Resolution Activity on Distressed Loan Investments Payoffs Foreclosure sales Short sales REO sales Modifications ($ in millions) Resolution Activity (UPB) Total Liquidation Activities $21 $11 $7 $6 $14 $10 $109 $101 $151 $127 $99 $115 4Q15 1Q16 4Q15 1Q16 4Q15 1Q16 4Q15 1Q16 4Q15 1Q16 4Q15 1Q16 1Q16 Earnings Report 52% 45% 35% 43% 42% 27% 27% 37% 40% 47% 11% 16% 15% 6% 4% 7% 8% 8% 8% 4% 4% 4% 5% 3% 2% 0% 25% 50% 75% 100% 1Q15 2Q15 3Q15 4Q15 1Q16 REO sales Modifications Short sales Payoffs Foreclosure sales Resolution Activity (% of UPB) ($ in millions) $217 $239 $210 $250 $241 Resolution volumes trending positively: • Modifications comprised 47% of total resolution activity in 1Q16 vs. 27% in 1Q15 – Sustained increase in modification pipeline since 1Q15; $363 million in UPB at March 31 st vs. $277 million for the same last year o Proprietary modification strategies implemented last year have gained traction – Focus on driving resolutions through modification also results in fewer short sales and foreclosure sales • REO property sales have decreased as a percentage of total resolutions due to growth in other resolution types, but have remained fairly consistent on an absolute basis – Decreased modestly from the prior quarter, primarily as a result of the seasonal slowdown in home sales

Correspondent production sellers Selected Operational Metrics 1Q16 437 4Q15 432 Purchase money loans, as % of total acquisitions 73% 72% • Correspondent acquisitions totaled $9.7 billion, down 3% Q/Q – In line with overall origination market – Purchase - money focused volume impacted by seasonal factors – Conventional conforming and jumbo acquisitions were $3.3 billion; locks were $3.9 billion – Total lock volume of $10.4 billion, down 3% Q/Q • 1Q16 acquisitions were 21% higher than 1Q15 – Includes a 12% Y/Y increase in conventional conforming acquisitions • April correspondent acquisitions totaled $4.0 billion ; locks totaled $4.6 billion – Acquisitions up 24% from the average of $ 3.2 billion per month in 1Q16 Correspondent Production Volume and Mix Correspondent Production Volumes Stable in 1Q16, and Higher Than a Year Ago (1) For Government loans, PMT earns a sourcing fee and interest income for its holding period and does not pay a fulfillment fee ($ in billions) UPB (1) (1) 12 $5.1 $6.6 $6.4 $2.8 $3.5 $3.3 $0 $4 $8 $12 1Q15 4Q15 1Q16 Govt Jumbo Conventional Conforming Total Locks 1Q16 Earnings Report $10.4 $9.5 $10.6

1Q16 Earnings Report 13 ($ in millions) CRT Investments Created (3) $ 95 $ 118 Equity Requirement (4) $ 24 $ 30 Quarterly Conventional Conforming Production Scenario $3.6 bn in UPB $4.5 bn in UPB CRT Investment Outstanding ($ in millions) Capital Required for Ongoing CRT Investments (2) • Total CRT investments have grown to $214 million at March 31, 2016 • PMT entered into a third CRT transaction with Fannie Mae for $5 billion in UPB of PMT’s production – Currently approximately 70% of PMT’s conventional conforming production is being delivered into CRT transactions • Attractive investment created through PMT’s industry - leading correspondent business – Significantly enhances the value of conventional conforming correspondent acquisitions • Underlying collateral performance is strong and unrelated to market spread widening – Total 60+ day delinquencies are < 0.02% of $5.9 billion in UPB (1 ) – No credit losses to date PMT's Unique Investments in GSE Credit Risk Transfer (1) See page 35 for additional details. (2) Although definitive documentation has been executed, credit risk transfer transactions are subject to continuing due diligence and customary closing conditions, including required regulatory approvals. There can be no assurance regarding the size of any transactions or that the transactions will be completed at all. (3) Assumes 75% of conventional conforming production is eligible for CRT. (4) Assumes 74% advance rate on financing. $14 $43 $84 $88 $147 $214 3Q15 4Q15 1Q16 Equity invested in CRT CRT Investment

MSRs and ESS Investments Decreased in 1Q16 Primarily Due to ESS Sale 14 ($ in millions) • Organic MSR investments resulting from correspondent production activity were $455 million, down from $460 million at December 31, 2015 • ESS investments resulting from bulk, mini - bulk and flow MSR acquisitions by PFSI were $322 million, down from $412 million at December 31, 2015 – Decline driven primarily by PMT’s sale of ESS related to Fannie Mae and Freddie Mac MSRs to PennyMac Financial for $59 million in cash o Lower yielding investment was owned by PMT without leverage MSR and ESS Assets at Period End Carrying value on balance sheet Related UPB Ŷ MSRs Ŷ ESS Ŷ UPB (right axis) $581 $754 $842 $872 $777 $20,000 $40,000 $60,000 $80,000 $100,000 $120,000 $0 $200 $400 $600 $800 $1,000 1Q15 2Q15 3Q15 4Q15 1Q16 1Q16 Earnings Report

Financial Results

16 Pretax Income (Loss) by Operating Segment Note: Figures may not sum exactly due to rounding Investment Correspondent Total Pretax ($ in millions) Activities Production Income 1Q15 (8.2)$ 4.4$ (3.8)$ 2Q15 19.9$ 5.2$ 25.1$ 3Q15 34.9$ 10.2$ 45.1$ 4Q15 (6.1)$ 13.1$ 6.9$ 1Q16 0.1$ 10.9$ 11.0$ 1Q16 Earnings Report

17 Investment Activities Segment Results (1) Includes $1.8 million in recapture income (2) Servicing fees include both special servicing for PMT’s distressed portfolio and subservicing for PMT’s mortgage servicing rights of $6.8 million and $4.6 million, respectively in 1Q16. • Segment revenue increased 17% Q/Q: – Net gain on investments decreased $6.9 million Q/Q, driven by: o ESS fair value loss of $17.6 million, partially offset by net MBS portfolio valuation gains of $3.5 million o Loss on CRT agreements due to spread widening o Increase in distressed loan portfolio valuation gains (see slide 19) – Net interest income increased 7% Q/Q (see slide 18) – Net loan servicing fees increased 107% Q/Q, primarily driven by an $0.8 million hedge gain in excess of MSR valuation losses and provisioning for impairment, vs. a $7.7 million loss in 4Q15 – Loss in Other revenues from advances on the REO portfolio in excess of gains from liquidation • Expenses decreased 8 % Q/Q – Lower servicing fee expense from a smaller distressed portfolio and a decrease in management fees resulting from share repurchases 1Q16 Earnings Report Quarter Ended ($ in thousands) March 31, 2016 December 31, 2015 Revenues: Net gain on investments: Mortgage loans at fair value 14,395$ 1,987$ Mortgage loans held by variable interest entity net of asset-backed secured financing (4,105) (1,657) Mortgage-backed securities 7,582 (6,054) CRT Agreements (4,143) (33) Excess servicing spread investment (1) (17,627) 8,740 (3,898) 2,983 Net interest income Interest income 45,343 43,771 Interest expense 26,885 26,573 18,458 17,198 Net loan servicing fees 15,554 7,509 Other (3,688) (5,096) Total revenues 26,426 22,594 Expenses: Servicing and Management fees payable to PennyMac Financial Services, Inc. (2) Other 9,905 11,626 Total expenses 26,291 28,725 Pretax income 135$ (6,131)$ 16,386 17,099

18 Interest Income Is a Large Component of Investment Activities Returns • Total interest income from Investment Activities was $45.3 million, a 4% Q/Q increase • Total interest expense from Investment Activities was $26.9 million, a 1% Q/Q increase • Interest income from the distressed loan portfolio was $29.2 million, up 3% Q/Q – Capitalized interest on loan modifications of $23.3 million, up 2% Q/Q (1) • ESS interest income was $7.0 million, down 10% Q/Q, driven by the sale of Fannie Mae and Freddie Mac ESS ( 1 ) Capitalized interest from loan modifications increases interest income and reduces gains from loan valuations 1Q16 Earnings Report ($ in thousands) Short-term investments 376$ 398$ 220$ Mortgage-backed securities 2,712 2,513 2,633 Mortgage loans: At fair value 29,186 28,446 21,554 Held by variable interest entity 5,529 4,464 5,413 Acquired for sale at fair value 241 43 (11) Total mortgage loans 34,956 32,953 26,956 Excess spread investment 7,015 7,769 3,752 Other 284 138 12 Total interest income 45,343 43,771 33,573 Interest expense 26,885 26,573 21,926 Net interest income 18,458$ 17,198$ 11,647$ Quarter ended March 31, 2016 Quarter ended December 31, 2015 Quarter ended March 31, 2015

19 Investment Gains and Cash Flows from the Distressed Loan Portfolio • Net gains on distressed loans totaled $14.4 million, an increase from $2.0 million in 4Q15 – Performing loan valuations positively impacted by sale of $419 million in UPB of reperforming loans – Loan modification activity increased 16% from 4Q15, resulting in $23 million in capitalized interest income (1) o Focus on modification outcomes and growing the reperforming portfolio which becomes increasingly valuable as the loans season – Current period home price performance better than prior forecast; long - term forecast relatively unchanged – Transition of loans from foreclosure status to REO improving in some cases, but remains slow o Longer timelines drive higher advance balances, reducing returns o Net REO realization value after transaction costs can also be adversely impacted • Cash proceeds from liquidation and paydown activity on distressed loans and REO totaled $96.5 million – Accumulated gains on assets liquidated during the quarter were $4.9 million, and gains on liquidation were $6.1 million Net Gains on Mortgage Loans Cash Proceeds and Gain on Liquidation (2) Represents valuation gains and losses recognized during the period the Company held the respective asset, but excludes the gain or loss recorded upon sale or repayment of the respective asset (3) Represents the gain or loss recognized as of the date of sale or repayment of the respective asset ($ in thousands) Mar. 31, 2016 Dec. 31, 2015 Valuation Changes: Peforming loans 4,884$ (2,207)$ Nonperfoming loans 7,965 1,553 12,849 (654) Payoffs 1,548 2,641 Sales (2) - 14,395$ 1,987$ Quarter ended ($ in thousands) Quarter ended March 31, 2016 Accumulated Gain on Proceeds gains (2) liquidation (3) Mortgage loans 31,556$ 3,285$ 1,540$ REO 64,908 1,587 4,609 96,464$ 4,872$ 6,149$ 1Q16 Earnings Report (1) Increases interest income and decreases gains on loan valuations
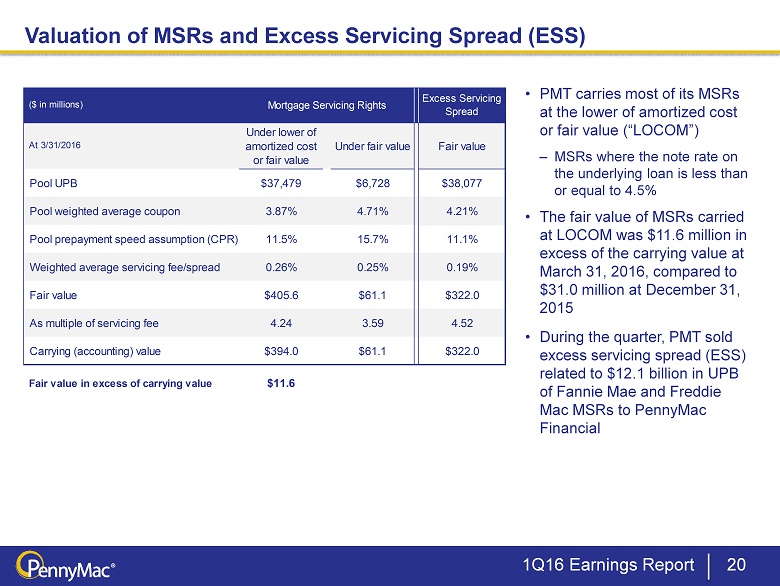
20 Valuation of MSRs and Excess Servicing Spread (ESS) • PMT carries most of its MSRs at the lower of amortized cost or fair value (“LOCOM”) – MSRs where the note rate on the underlying loan is less than or equal to 4.5% • The fair value of MSRs carried at LOCOM was $11.6 million in excess of the carrying value at March 31, 2016, compared to $31.0 million at December 31, 2015 • During the quarter, PMT sold excess servicing spread (ESS) related to $12.1 billion in UPB of Fannie Mae and Freddie Mac MSRs to PennyMac Financial 1Q16 Earnings Report At 3/31/2016 Under lower of amortized cost or fair value Under fair value Fair value Pool UPB $37,479 $6,728 $38,077 Pool weighted average coupon 3.87% 4.71% 4.21% Pool prepayment speed assumption (CPR) 11.5% 15.7% 11.1% Weighted average servicing fee/spread 0.26% 0.25% 0.19% Fair value $405.6 $61.1 $322.0 As multiple of servicing fee 4.24 3.59 4.52 Carrying (accounting) value $394.0 $61.1 $322.0 Fair value in excess of carrying value $11.6 ($ in millions) Mortgage Servicing Rights Excess Servicing Spread

($ in thousands) Since Inception (1) UPB of mortgage loans transferred under CRT Agreements..................... 6,525,620$ Deposits of restricted cash to secure guarantees........................................ 214,152$ Gains (losses) recognized on derivatives related to CRT agreements..... included in Net gain on investments............................................................. Realized........................................................................................................ 4,367$ Resulting from valuation changes.............................................................. (7,917)$ (3,550)$ Payments made to settle losses..................................................................... -$ At March 31, 2016 UPB of mortgage loans subject to guarantee obligation............................. 5,931,409$ Delinquency Current to 89 days delinquent....................................................................... 5,930,936$ 90 or more days delinquent.......................................................................... 473$ Carrying value of CRT agreements Restricted cash included in Other assets.................................................... 213,536$ Net derivative liability included in Derivative liabilities............................ 4,218$ Gains and losses resulting from valuation changes represent mark - to - market valuations Payments made to Fannie Mae , from pledged cash, for losses on loans underlying the CRT agreements Cash income or loss to PMT from the SPVs Total UPB of loans delivered to the CRT Special Purpose Vehicles and sold to Fannie Mae Credit Risk Transfer – Income Statement and Balance Sheet Treatment 21 1Q16 Earnings Report (1) Cumulative for the four quarters ending 3/31/2016 Cash deposited in the SPV in “restricted cash.” Represents the initial credit risk retained Current UPB of loans delivered to the CRT Special Purpose Vehicles and sold to Fannie Mae Current “restricted cash” balance included in “Other assets” Derivative liability represents net value of expected future cash inflows related to assumption of credit risk and expected future losses

($ in thousands) Quarter Ended Mar. 31, 2016 As % of Interest Rate Lock Commitments (1) Quarter Ended Dec. 31, 2015 As % of Interest Rate Lock Commitments (1) Revenues: Net gain on mortgage loans acquired for sale 15,049$ 0.39% 15,780$ 0.43% Net interest income 3,904 0.10% 5,228 0.14% Other income 6,837 0.18% 6,966 0.19% 25,790$ 0.67% 27,974$ 0.77% Expenses: Loan fulfillment, servicing, and management fees payable to PennyMac Financial Services, Inc. Other 1,527 0.04% 1,608 0.04% 14,881$ 0.38% 14,915$ 0.41% Pretax income 10,909$ 0.28% 13,059$ 0.36% 13,307$ 0.37%13,354$ 0.35% Correspondent Production Segment Results 22 • Segment revenue totaled $25.8 million, an 8% decrease from 4 Q15 – Increase in lock volumes offset by decreased margins – Decrease in net interest income driven by a lower average balance of loan inventory during the quarter • Conventional conforming acquisition volumes increased 15% from a year earlier – Higher volume drives improved opportunities for optimizing GSE deliveries and specified loan sales • Fulfillment fee paid for the quarter was 40bp , up from 37bp in 4Q15 (2) (1) Conventional conforming and jumbo interest rate lock commitments (2) Fulfillment fees are based on funding volumes. Contractual fulfillment fee is in general 0.50% of the funding of conventional and jumbo loans, subject to reductions at specified volumes and discretionary reductions by PFSI . (2) (2) 1Q16 Earnings Report

Appendix

Book value per share (1) 24 PMT Dividends and Book Value Over Time 14% 10% 19% 14% 7% 7% Return on Equity (2) (1) At period end. Book value per share in 4Q13 was reduced by two dividends declared in that quarter. ( 2) Return on average equity during the respective quarter; return on average equity is calculated based on annualized quarterly net income as a percentage of monthly average shareholders’ equity during the period. 2% EPS & Dividend $0.69 $0.50 $0.93 $0.69 $0.34 $0.09 $0.36 $0.49 $0.21 $0.20 $0.59 $0.59 $0.59 $0.61 $0.61 $0.61 $0.61 $0.47 $0.47 $0.47 $20.59 $17 $18 $19 $20 $21 $22 $0.00 $0.25 $0.50 $0.75 $1.00 4Q13 1Q14 2Q14 3Q14 4Q14 1Q15 2Q15 3Q15 4Q15 1Q16 Diluted EPS Dividend Book value per share (right axis) 10% 4% 1Q16 Earnings Report 4%

• PMT’s focus is mortgage - related investments that require specialized operational capabilities enabled by our relationship with PennyMac Financial Services (PFSI) • Opportunistic investment in distressed whole loans • Recent capital deployment has favored interest rate and credit sensitive strategies: – Correspondent loan aggregation which also creates long - term investments in MSRs and GSE credit risk transfers – Excess servicing spread (ESS) resulting from the co - investment in bulk, mini - bulk and flow MSR acquisitions by PFSI – Development of small balance - focused multifamily investments • Increasing emphasis on repeatable, organically created investments designed to produce improved earnings predictability and reduced volatility • Repurchase of PMT’s common shares is a highly attractive use of capital at current market prices GSE Risk Transfers & Subordinate Bonds (1) Objective of Superior Returns Over the Long Term Through Multiple Strategies 25 Correspondent Loan Aggregation MSRs & ESS Prime Non - Agency Loans (2) Agency Multifamily Retained Bonds Distressed Residential Whole Loans Agency & Senior Non - Agency MBS Interest rate s ensitive strategies Credit sensitive strategies (1) Includes subordinate bonds from private - label securitizations (2) Includes retained senior MBS from private - label securitizations 1Q16 Earnings Report

$5,279 $6,159 $4,965 $5,128 $4,960 $0 $1,000 $2,000 $3,000 $4,000 $5,000 $6,000 $7,000 1Q15 2Q15 3Q15 4Q15 1Q16 Correspondent loan inventory (3) PMT’s L ong - Term Investments Ŷ Retained interests from private - label securitizations Ŷ MSRs and ESS Ŷ Agency and non - Agency MBS Ŷ Distressed whole loans and REO 26 PMT's Mortgage Assets and Leverage Ratio Over Time Leverage ratio (2) 2.6x 3.2x (1) Excludes CRT investments which are reflected on the balance sheet as restricted cash included in other assets and net derivat iv e liability included in derivative liabilities. (2) All borrowings, including exchangeable senior notes and asset - backed secured financing of the variable interest entity, divided by s hareholders’ equity at period end. (3) 2Q15 amounts included $649 million of loans delivered into credit risk transfer transaction. Mortgage Assets (1) ($ in millions) 2.6x 3.1x 1Q16 Earnings Report 3.4x

(2) • PMT’s interest rate risk exposure is managed on a “global” basis – Disciplined hedging – Multiple mortgage - related investment strategies with complementary interest rate sensitivities – Also employ financial hedge instruments Management of PMT’s Interest Rate Risk (1) 27 Estimated Sensitivity to Changes in Interest Rates % change in PMT shareholders’ equity At 3/31/16 (1) Analysis does not include PMT assets for which interest rates are not a key driver of values, i.e ., distressed whole loans and REO. The sensitivity analyses on the slide and the associated commentary are limited in that they are estimates as of March 31, 2016; only reflect movements in interest rates and do not contemplate other variables; do not incorporate changes in the variables in relation to other variables; are subject to the accuracy of various models and assumptions used; and do not inco rpo rate other factors that would affect the Company’s overall financial performance in such scenarios, including operational adjustments made by management to account for changing circums tan ces. For these reasons, the preceding estimates should not be viewed as an earnings forecast . ( 2) Includes loans acquired for sale and IRLCs, net of associated hedges, Agency and Non - Agency MBS assets ( 3) Includes MSRs, ESS, and hedges which include put and call options on MBS, Eurodollar futures and Treasury futures (4) Net exposure represents the net position of the “Long” Assets Position and the MSR/ESS Investments and Hedges (3) (4) Instantaneous parallel shock in interest rates (in bps) -1.5% -1.0% -0.5% 0.0% 0.5% 1.0% 1.5% 2.0% 2.5% 3.0% -100 -75 -50 -25 0 25 50 75 100 "Long" Assets MSRs/ESS and Hedges Net Exposure 1Q16 Earnings Report

$960 $1,424 $1,229 $0 $500 $1,000 $1,500 $2,000 Fair Value on Balance Sheet Collateral Value Unpaid Principal Balance $1,087 $1,579 $1,502 $0 $500 $1,000 $1,500 $2,000 Fair Value on Balance Sheet Collateral Value Unpaid Principal Balance 28 Nonperforming Loans (at March 31, 2016) Performing Loans ( at March 31, 2016) • Nonperforming loans are held on average at an approximate 30% discount to current property value – earned over expected liquidation timeline net of expected costs, plus additional value from property appreciation and reperformance of rehabilitated loans • PMT advances funds for items such as property taxes and property preservation to protect the value of its investment in the underlying property; these advances are recovered from the proceeds when the loan is liquidated before loan balances are repaid • Performing loans provide ongoing cash interest income and, as they season, the opportunity to monetize gains through payoffs, refinances, or loan sales Carrying Values for PMT’s Distressed Whole Loans (in millions) (in millions) 1Q16 Earnings Report

Distressed Portfolio by Acquisition Period 29 (1) Ratio of unpaid principal balance remaining to unpaid principal balance at acquisition 1Q16 Earnings Report Purchase 1Q16 Purchase 1Q16 Purchase 1Q16 Purchase 1Q16 Balance ($mm) 182.7$ 31.6 Balance ($mm) 195.5$ 27.5 Balance ($mm) 146.2$ 19.0 Balance ($mm) 277.8$ 48.4 Pool Factor (1) 1.00 0.17 Pool Factor (1) 1.00 0.14 Pool Factor (1) 1.00 0.13 Pool Factor (1) 1.00 0.17 Current 6.2% 46.6% Current 5.1% 33.9% Current 1.2% 36.2% Current 5.0% 44.0% 30 1.6% 4.1% 30 2.0% 10.7% 30 0.4% 2.5% 30 4.0% 6.7% 60 5.8% 2.6% 60 4.1% 1.9% 60 1.3% 11.6% 60 5.1% 3.6% 90+ 37.8% 11.1% 90+ 42.8% 14.8% 90+ 38.2% 22.0% 90+ 26.8% 15.5% FC 46.4% 22.8% FC 45.9% 30.9% FC 58.9% 18.7% FC 59.1% 13.6% REO 2.3% 12.7% REO 0.0% 7.8% REO 0.0% 9.0% REO 0.0% 16.7% Purchase 1Q16 Purchase 1Q16 Purchase 1Q16 Purchase 1Q16 Balance ($mm) 515.1$ 131.6 Balance ($mm) 259.8$ 74.3 Balance ($mm) 542.6$ 126.5 Balance ($mm) 49.0$ 23.3 Pool Factor (1) 1.00 0.26 Pool Factor (1) 1.00 0.29 Pool Factor (1) 1.00 0.23 Pool Factor (1) 1.00 0.48 Current 2.0% 33.3% Current 11.5% 38.9% Current 0.6% 38.3% Current 0.2% 43.6% 30 1.9% 6.2% 30 6.5% 4.1% 30 1.3% 5.9% 30 0.1% 3.8% 60 3.9% 0.8% 60 5.2% 2.9% 60 2.0% 2.6% 60 0.2% 0.5% 90+ 25.9% 16.1% 90+ 31.2% 18.3% 90+ 22.6% 17.6% 90+ 70.4% 21.3% FC 66.3% 31.4% FC 43.9% 23.2% FC 73.0% 22.0% FC 29.0% 19.3% REO 0.0% 12.2% REO 1.7% 12.6% REO 0.4% 13.6% REO 0.0% 11.5% Purchase 1Q16 Purchase 1Q16 Purchase 1Q16 Balance ($mm) 402.5$ 126.4 Balance ($mm) 357.2$ 141.0 Balance ($mm) 290.3$ 133.5 Pool Factor (1) 1.00 0.31 Pool Factor (1) 1.00 0.39 Pool Factor (1) 1.00 0.46 Current 45.0% 47.1% Current 0.0% 33.8% Current 3.1% 44.1% 30 4.0% 8.0% 30 0.0% 2.7% 30 1.3% 8.1% 60 4.3% 3.6% 60 0.1% 1.5% 60 5.4% 3.6% 90+ 31.3% 17.7% 90+ 49.1% 17.3% 90+ 57.8% 15.2% FC 15.3% 16.9% FC 50.8% 25.7% FC 32.4% 15.1% REO 0.1% 6.7% REO 0.0% 19.1% REO 0.0% 13.8% 1Q12 2Q12 3Q12 No Pools Purchased in this Quarter. 4Q12 1Q10 2Q10 3Q10 4Q10 1Q11 2Q11 3Q11 4Q11

Distressed Portfolio by Acquisition Period (cont.) 30 (1) Ratio of unpaid principal balance remaining to unpaid principal balance at acquisition 1Q16 Earnings Report Purchase 1Q16 Purchase 1Q16 Purchase 1Q16 Purchase 1Q16 Balance ($mm) 366.2$ 182.0 Balance ($mm) 397.3$ 249.4 Balance ($mm) 929.5$ 572.1 Balance ($mm) 507.3$ 372.2 Pool Factor (1) 1.00 0.50 Pool Factor (1) 1.00 0.63 Pool Factor (1) 1.00 0.62 Pool Factor (1) 1.00 0.73 Current 1.6% 54.3% Current 4.8% 40.3% Current 0.8% 28.6% Current 1.4% 17.9% 30 1.5% 6.7% 30 7.4% 5.4% 30 0.3% 3.2% 30 0.2% 3.4% 60 3.5% 3.7% 60 7.6% 2.8% 60 0.7% 1.8% 60 0.0% 0.4% 90+ 82.2% 14.8% 90+ 45.3% 15.2% 90+ 58.6% 18.0% 90+ 38.3% 15.4% FC 11.2% 11.8% FC 34.9% 22.3% FC 39.6% 29.4% FC 60.0% 41.9% REO 0.0% 8.7% REO 0.0% 13.9% REO 0.0% 19.1% REO 0.0% 20.9% Purchase 1Q16 Purchase 1Q16 Purchase 1Q16 Balance ($mm) 439.0$ 324.1 Balance ($mm) 37.9$ 30.6 Balance ($mm) 330.8$ 292.1 Pool Factor (1) 1.00 0.74 Pool Factor (1) 1.00 0.81 Pool Factor (1) 1.00 0.88 Current 6.2% 21.9% Current 0.7% 32.6% Current 1.6% 32.5% 30 0.7% 1.9% 30 0.6% 6.5% 30 1.6% 3.7% 60 0.7% 1.1% 60 1.4% 3.4% 60 7.1% 2.1% 90+ 37.5% 18.9% 90+ 59.0% 29.6% 90+ 52.7% 25.0% FC 53.8% 40.6% FC 38.2% 14.0% FC 36.9% 27.8% REO 1.1% 15.5% REO 0.0% 13.9% REO 0.0% 9.0% Purchase 1Q16 Balance ($mm) 310.2$ 270.8 Pool Factor (1) 1.00 0.87 Current 1.8% 18.0% 30 0.3% 1.6% 60 0.1% 1.4% 90+ 66.7% 24.3% FC 31.1% 38.9% REO 0.0% 15.8% No Pools Purchased in this Quarter. 1Q15 2Q15 1Q14 2Q14 3Q14 3Q15 4Q14 1Q13 2Q13 3Q13 4Q13 4Q15 No Pools Purchased in this Quarter.No Pools Purchased in this Quarter. No Pools Purchased in this Quarter.

Fundings and Locks by Product 31 Note: Figures may not sum exactly due to rounding 1Q16 Earnings Report ($ in millions) 1Q15 2Q15 3Q15 4Q15 1Q16 Fundings Conventional $ 2,831 $ 3,553 $ 4,055 $ 3,460 $ 3,253 Government 5,106 8,316 10,348 6,558 6,423 Jumbo 59 26 19 12 7 Total $ 7,996 $ 11,895 $ 14,421 $ 10,030 $ 9,683 Locks Conventional $ 3,433 $ 4,404 $ 4,085 $ 3,630 $ 3,857 Government 6,010 9,936 9,483 7,001 6,511 Jumbo 70 41 32 14 11 Total $ 9,512 $ 14,381 $ 13,599 $ 10,645 $ 10,379

Net Cash Flows from Existing Investments 32 (1) Quarterly cash flows from investing activities are derived from the Company’s year - to - date statements of cash flows (2) Debt repayment from liquidations calculated based on debt advance rates for each asset type (3) Revenue component of net loan servicing fees as reported quarterly (4) Investment Activities segment net interest income from the quarterly segment income statement (5) Q uarterly income statement items excluding noncash items and fulfillment fees Reconciliation of Non - GAAP Financial Measure 1Q16 Earnings Report ($ in thousands) March 31, 2016 Dec 31, 2015 Sept 30, 2015 June 30, 2015 March 31, 2015 Cash flows from investing activities (1) 93,069$ 81,054$ (22,526)$ 44,642$ (91,348)$ Adjustments to remove items: Purchase of mortgage-backed securities at fair value 50,702 22,604 37,095 - 25,129 Purchase of mortgage loans at fair value - - - (1,653) 241,981 Purchase of excess servicing spread - 102 84,165 140,875 46,412 Deposit of restricted cash to secure CRT agreements 66,706 59,555 87,891 - - Settlements of derivative financial instruments 2 (1,957) (1,788) (2,912) 13,466 Margin deposits and restricted cash (2,368) (6,710) (37,441) 20,211 15,792 Net purchase of mortgage servicing rights - 1,975 - - - Net decrease (increase) in short-term investments 5,635 10,347 (899) (12,532) (94,951) Sale of mortgage-backed securities at fair value - - - - - Sale of excess servicing spread to PFSI (59,045) Bulk sale of mortgage loans at fair value - - - (1,074) (939) 154,701$ 166,970$ 146,497$ 187,557$ 155,542$ Other adjustments: Debt repayment on investment liquidations/sales (2) (93,997)$ (104,158)$ (93,962)$ (126,254)$ (103,031)$ Servicing fees (3) 28,872$ 28,131$ 25,500$ 25,887$ 22,629$ Net interest income from Investment Activities (4) 18,458$ 17,198$ 16,300$ 11,360$ 11,647$ Less capitalized interest (23,294)$ (22,775)$ (14,849)$ (9,921)$ (10,209)$ Expenses (5) (28,237)$ (30,785)$ (28,114)$ (28,203)$ (26,067)$ Net cash flows from existing investments 56,503$ 54,974$ 51,372$ 60,426$ 50,511$ Quarter Ended

Opportunity for PFSI and PMT in MSR Acquisitions 33 Why Are MSR Sales Occurring? How Do MSRs Come to Market? • Large servicers may sell MSRs due to continuing operational pressures, higher regulatory capital requirements for banks (treatment under Basel III) and a re - focus on core customers/businesses • Independent mortgage banks sell MSRs from time to time due to a need for capital • Intermittent large bulk portfolio sales ($10+ billion in UPB) – Require considerable coordination with selling institutions and Agencies • Mini - bulk sales (typically $500 million to $5 billion in UPB) • Flow/co - issue MSR transactions (monthly commitments, typically $ 20 - 100 million in UPB) – Alternative delivery method typically from larger independent originators Which MSR Transactions Are Attractive? • GSE and Ginnie Mae servicing in which PFSI has distinctive expertise • MSRs sold and operational servicing transferred to PFSI (not subserviced by a third party) • Measurable rep and warranty liability for PFSI PFSI is uniquely positioned be a successful acquirer of MSRs • Proven track record of complex MSR and distressed loan transfers • Operational platform that addresses the demands of the Agencies, regulators, and financing partners • Physical capacity in place to service over $200 billion in UPB • Co - investment opportunity for PMT in the excess servicing spread 1Q16 Earnings Report

PMT's Excess Servicing Spread Investments in Partnership with PFSI 34 (1) The contractual servicer and MSR owner is PennyMac Loan Services, LLC, an indirect subsidiary of PennyMac Financial Services, Inc. (2) Subject and subordinate to Agency rights (under the related servicer guide); does not change the contractual servicing fee pa id by the Agency to the servicer. Excess Servicing Spread (e.g., 12.5bp) MSR Asset (e.g., 25bp servicing fee) Acquired by PFSI from Third - Party Seller (1) ▪ PMT co - invests in Agency MSRs acquired from third - party sellers by PFSI; presently only related to Ginnie Mae MSRs ▪ PMT acquires the right to receive the excess servicing spread cash flows over the life of the underlying loans ▪ PFSI owns the MSRs and services the loans Excess Servicing Spread (2) ▪ Interest income from a portion of the contractual servicing fee – Realized yield dependent on prepayment speeds and recapture Base MSR ▪ Income from a portion of the contractual servicing fee ▪ Also entitled to ancillary income ▪ Bears expenses of performing loan servicing activities ▪ Required to advance certain payments largely for delinquent loans Base MSR (e.g., 12.5bp) Acquired by PMT from PFSI (1) Example transaction: actual transaction details may vary materially 1Q16 Earnings Report

Credit Risk Transfer Delinquency Metrics 35 1Q16 Earnings Report ($ in billions) CRT 2015 -1 CRT 2015 -2 CRT 2016 -1 Total Origination period............................ 5/15 - 7/15 8/15 - 2/16 2/16 - current 5/15- current Original UPB.................................... 1.2$ 4.2$ 5.0$ 10.4$ Outstanding UPB............................ 1.1$ 4.1$ 0.7$ 5.9$ Loan count....................................... 3,995 15,037 1,883 20,915 60+ Days Delinquent Loan Count... 2 3 - 5 60+ Days Delinquent % o/s UPB.... 0.057% 0.016% 0.000% 0.022% 180+ Days Delinquent Loan Count. - - - - Actual losses................................... - - - - % Purchase 66% 71% 62% - FICO................................................ 742 743 748 - LTV.................................................. 81 82 81 - Italics denote estimate At March 31, 2016