Attached files
| file | filename |
|---|---|
| 8-K - FORM 8-K - BNC BANCORP | form8-kforpresentation.htm |

2016 Gulf South Bank Conference May 2-3, 2016
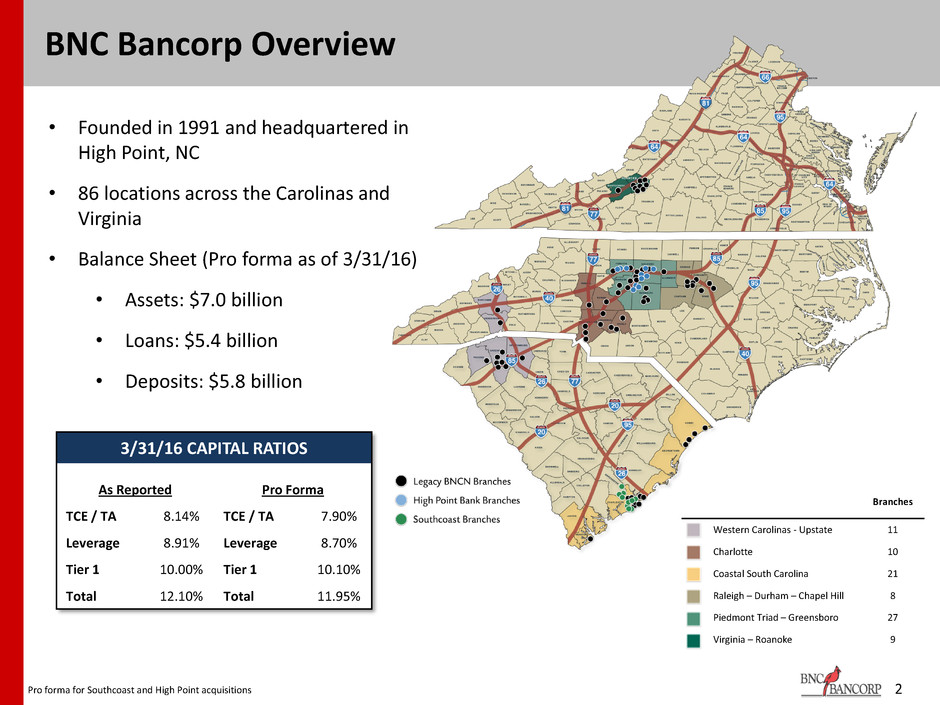
2 BNC Bancorp Overview • Founded in 1991 and headquartered in High Point, NC • 86 locations across the Carolinas and Virginia • Balance Sheet (Pro forma as of 3/31/16) • Assets: $7.0 billion • Loans: $5.4 billion • Deposits: $5.8 billion 3/31/16 CAPITAL RATIOS As Reported Pro Forma TCE / TA 8.14% TCE / TA 7.90% Leverage 8.91% Leverage 8.70% Tier 1 10.00% Tier 1 10.10% Total 12.10% Total 11.95% Branches Western Carolinas - Upstate 11 Charlotte 10 Coastal South Carolina 21 Raleigh – Durham – Chapel Hill 8 Piedmont Triad – Greensboro 27 Virginia – Roanoke 9 Pro forma for Southcoast and High Point acquisitions

Building Premier Franchise in the Carolinas & Virginia 3 • Headquarters: • Branches: • Total Assets: • Total Loans: • Total Deposits: • Tangible Book Value High Point, NC 86 $7.0B $5.4B $5.8B $11.07 per share • Exchange: • Recent Stock Price: • Price to TBV: • Market Cap: • Annual Dividend: • Dividend Yield: NASDAQ: BNCN $22.39 202% $912 million $0.20 0.90% Primary Objective: Maximize Long-term Shareholder Value All numbers are pro forma and include Southcoast Financial Corp. and High Point Bank Corp., with fair value marks and balance sheet deleveraging. Total shares outstanding of 40.8 million. Market data as of April 26, 2016 BNC BANCORP PRO FORMA
• Disciplined leadership with proven track record • Franchise concentrated in high growth markets in the Carolinas & Southern Virginia • Outstanding growth, both organic and M&A – Thirteen completed acquisitions since 2010, including whole bank, FDIC-assisted and branch deals – Two pending whole bank acquisitions (Southcoast and High Point) – Compound annual growth in originated loans of 16.4% since 2009 • Strong momentum with substantial earnings upside – Management focused on achieving core EPS of $2.00 • Attractive valuation versus peers • Continued positive regulatory relationship 4 Investment Thesis

5 Franchise Concentrated in Attractive Markets • Pro forma footprint covers key locations in NC, SC, and VA • In 11 of the top 15 cities in NC • In 8 of the top 10 cities in SC • Projected population growth of 3+ million people in NC through 2030; 1+ million in SC • NC is the #1 state for corporate relocations and has been for 8 of the past 9 years • NC’s two largest metro areas, Charlotte and the Triangle, account for nearly 70% of new jobs statewide • Charleston MSA is SC’s 3rd largest with median household incomes 14% higher than the state • Home to 10 colleges and universities and over 22,000 military personnel • Voted #1 travel destination in US – 4th year running • The Upstate region of SC has a population of more than 1.3 million and has attracted many well-known employers, including BMW, Michelin North America, Walgreens and Bank of America Sources: SNL Financial LC, US Census Bureau, Charleston Chamber of Commerce, Charlotte Business Journal April 2014 Pro forma for Southcoast and High Point acquisitions Pro Forma Franchise Overview Branches Loans ($000) Deposits ($000) Piedmont Triad – Greensboro 27 1,480,000 2,364,000 Charlotte 10 1,305,000 877,000 Charleston – Myrtle Beach 21 905,000 916,000 Raleigh – Durham – Chapel Hill 8 680,000 463,000 Virginia – Roanoke 9 578,000 715,000 Western Carolinas – Upstate 11 452,000 465,000

6 Consistent Acquisition Discipline 13 Completed Acquisitions Since 2010 8 Whole Bank completed; 3 FDIC-assisted; 2 Branch Transactions; 2 Pending Acquisition Target Announce Date Rationale Anticipated Outcome at Announcement EPS Accretion TBV Earnback High Point Bank & Trust 11/16/2015 Strong Core Deposit Base – In-Market $0.12-$0.14 1.0 yr Southcoast Community Bank 8/14/2015 Strong Core Deposit Base – Expansion in Charleston, SC $0.04 Accretive CertusBank (7 Branches) 6/1/2015 Improved market share in Upstate SC $0.06 3.0 yrs Valley Bank 11/17/2014 Strong Core Deposit Base – Virginia Expansion 5.0% 2.5 yrs Harbor National Bank 6/5/2014 100% Core Deposits – Charleston, SC Expansion 4.5% 1.5 yrs Harrington Bank 12/18/2013 100% Core Deposits - 33% Noninterest DDA - Raleigh CSA 6.0% < 1.0 yr Home Savings Bank of Albemarle 12/18/2013 100% Core Deposits – Charlotte CSA Expansion 6.0% < 1.0 yr Randolph Bank & Trust 5/31/2013 100% Core Deposits - Loans Primarily Retail $0.04 1.0 yr Carolina Federal Savings Bank (FDIC) 6/8/2012 100% Core Deposits – Charleston, SC Market Entry NA NA First Trust Bank 6/4/2012 Strong Core Deposit Base – Charlotte Metro Expansion Accretive 3.0 yrs Bank of Hampton Roads (2 branches) 4/30/2012 100% Core Deposits – Raleigh CSA Expansion NA NA KeySource Commercial Bank 12/21/2011 Diversify Lending – Raleigh CSA Entry Accretive Accretive Blue Ridge Savings Bank (FDIC) 10/14/2011 100% Core Deposits - Loans Primarily Retail NA NA Regent Bank 9/8/2011 100% Core Deposits – Greenville, SC Market Entry Accretive < 3.0 yrs Beach First National Bank (FDIC) 4/9/2010 Strong Core Deposits - Reduce Wholesale Reliance Accretive Accretive BNC has become an “Acquirer of Choice” in the Carolinas & Virginia
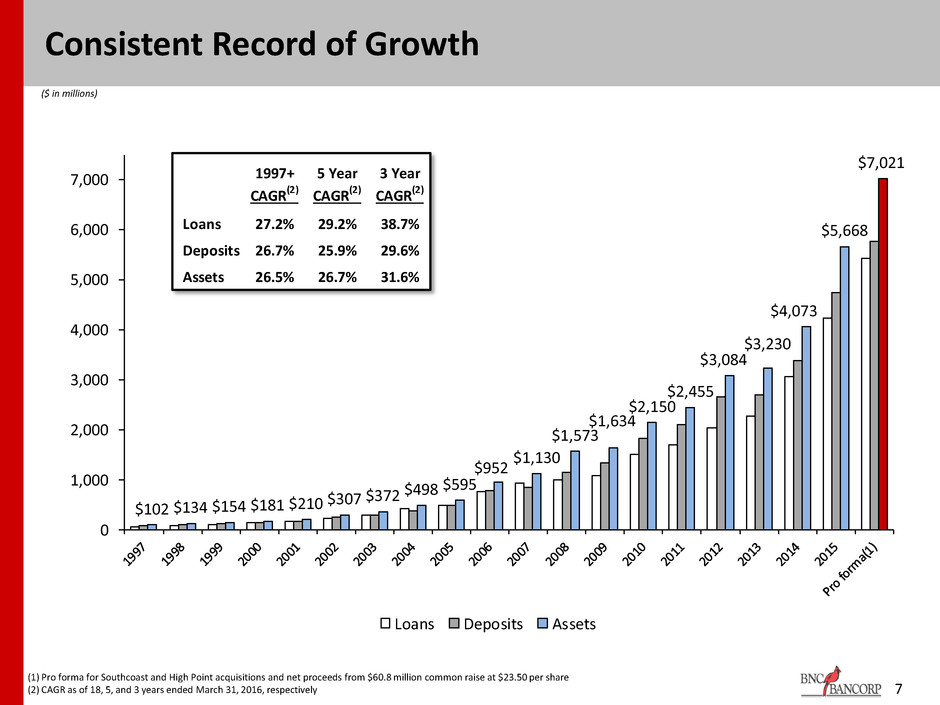
$102 $134 $154 $181 $210 $307 $372 $498 $595 $952 $1,130 $1,573 $1,634 $2,150 $2,455 $3,084 $3,230 $4,073 $5,668 $7,021 0 1,000 2,000 3,000 4,000 5,000 6,000 7,000 Loans Deposits Assets 7 Consistent Record of Growth ($ in millions) (1) Pro forma for Southcoast and High Point acquisitions and net proceeds from $60.8 million common raise at $23.50 per share (2) CAGR as of 18, 5, and 3 years ended March 31, 2016, respectively 1997+ 5 Year 3 Year CAGR(2) CAGR(2) CAGR(2) Loans 27.2% 29.2% 38.7% Deposits 26.7% 25.9% 29.6% Assets 26.5% 26.7% 31.6%

Growth in Originated Loans Strong Organic Loan Growth ($ in millions) 8 CAGR: 14.9% Originated loans is calculated as total gross loans reported at period end less the fair value of loans acquired at period end $1,079 $1,199 $1,358 $1,439 $1,705 $2,116 $2,721 $2,847 0 500 1,000 1,500 2,000 2,500 3,000 2009 2010 2011 2012 2013 2014 2015 Q1 2016

Current Price $22.39 EPS Price/EPS • 2012 Actual $0.48 • 2013 Actual $0.63 • 2014 Actual $1.21 • 2015 Actual $1.47 • 2016 Consensus* $1.64 13.6x • 2017 Consensus* $1.85 12.1x P/E inexpensive versus peers Earnings Per Share Ramping as Planned Consensus EPS estimates indicate upside to current valuations *2016 and 2017 EPS estimates are exclusive of one-time income and expense Source: Bloomberg and Company filings Market data as of April 28, 2016 9 EPS ramp at a 31% Compounded Annual Growth Rate between 2012 actual and 2017 estimates Consensus Core EPS Forecasts $0.48 $0.63 $1.21 $1.47 $1.64 $1.85 -$0.2 $0.3 $0.8 $1.3 $1.8 $2.3 2012 Actual 2013 Actual 2014 Actual 2015 Actual 2016 Consensus 2017 Consensus
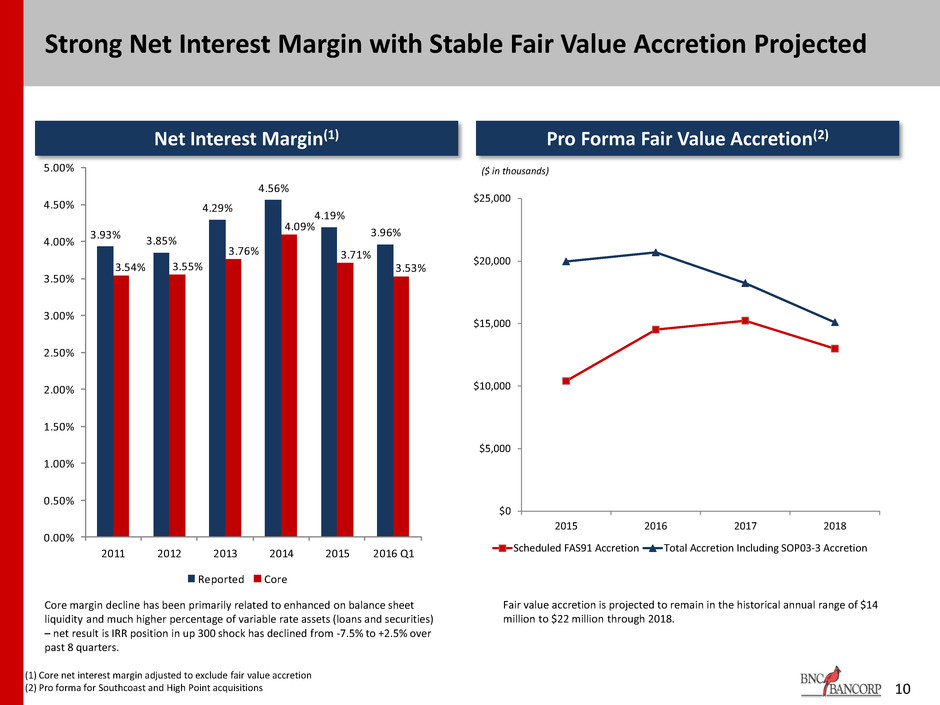
3.93% 3.85% 4.29% 4.56% 4.19% 3.96% 3.54% 3.55% 3.76% 4.09% 3.71% 3.53% 0.00% 0.50% 1.00% 1.50% 2.00% 2.50% 3.00% 3.50% 4.00% 4.50% 5.00% 2011 2012 2013 2014 2015 2016 Q1 Reported Core 10 Strong Net Interest Margin with Stable Fair Value Accretion Projected Net Interest Margin(1) Pro Forma Fair Value Accretion(2) (1) Core net interest margin adjusted to exclude fair value accretion (2) Pro forma for Southcoast and High Point acquisitions $0 $5,000 $10,000 $15,000 $20,000 $25,000 2015 2016 2017 2018 Scheduled FAS91 Accretion Total Accretion Including SOP03-3 Accretion ($ in thousands) Core margin decline has been primarily related to enhanced on balance sheet liquidity and much higher percentage of variable rate assets (loans and securities) – net result is IRR position in up 300 shock has declined from -7.5% to +2.5% over past 8 quarters. Fair value accretion is projected to remain in the historical annual range of $14 million to $22 million through 2018.
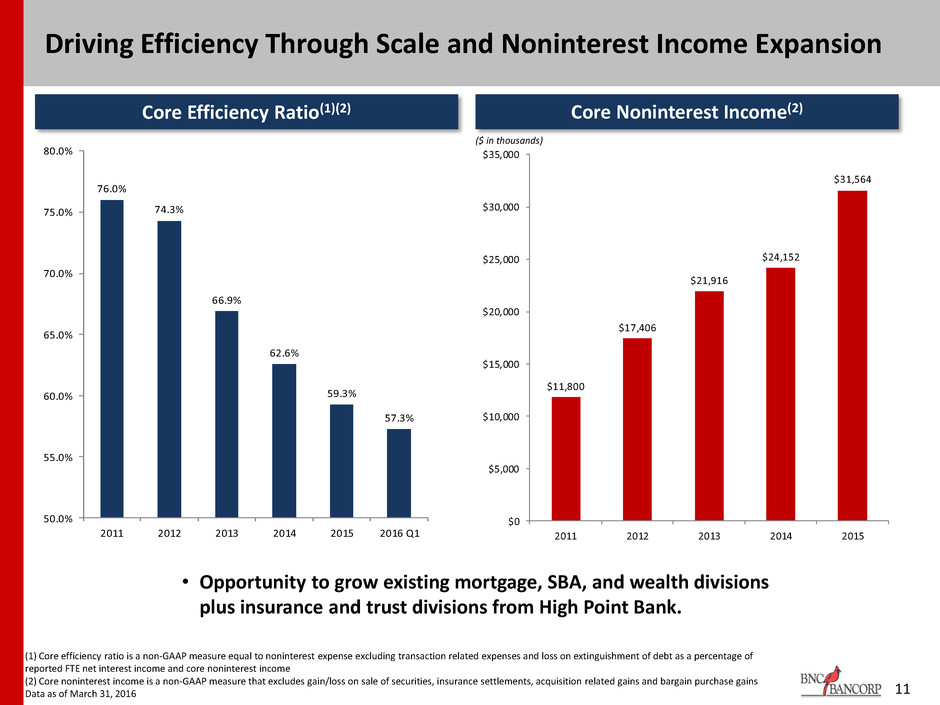
76.0% 74.3% 66.9% 62.6% 59.3% 57.3% 50.0% 55.0% 60.0% 65.0% 70.0% 75.0% 80.0% 2011 2012 2013 2014 2015 2016 Q1 11 Driving Efficiency Through Scale and Noninterest Income Expansion Core Efficiency Ratio(1)(2) Core Noninterest Income(2) (1) Core efficiency ratio is a non-GAAP measure equal to noninterest expense excluding transaction related expenses and loss on extinguishment of debt as a percentage of reported FTE net interest income and core noninterest income (2) Core noninterest income is a non-GAAP measure that excludes gain/loss on sale of securities, insurance settlements, acquisition related gains and bargain purchase gains Data as of March 31, 2016 ($ in thousands) • Opportunity to grow existing mortgage, SBA, and wealth divisions plus insurance and trust divisions from High Point Bank. $11,800 $17,406 $21,916 $24,152 $31,564 $0 $5,000 $10,000 $15,000 $20,000 $25,000 $30,000 $35,000 2011 2 2 2013 2014 2015

Diversified and Quality Loan Portfolio Data as of March 31, 2016 (1) Nonperforming loans defined as nonaccrual loans and accruing loans greater than 90 days past due. 12 Nonperforming Loans / Total Loans(1) • Reserves and acquisition discounts to total loans equal to 1.63% as of March 31, 2016 Loan Composition ($ in millions) Total Loans: $4,764 1.74% 1.14% 0.96% 0.63% 0.28% 0.15% 4.60% 4.29% 2.45% 1.17% 0.53% 0.30% 6.34% 5.43% 3.41% 1.80% 0.81% 0.45% 0.00% 1.00% 2.00% 3.00% 4.00% 5.00% 6.00% 7.00% 2010 2011 2012 2013 2014 2015 Originated Acquired Constr & Land Dev 11.6% 1-4 Family 16.3% HE Lines 8.8% Multifamily 4.2% Comm RE & Farm 48.6% C&I 9.4% Consumer 0.4% Other Non-RE 0.7%
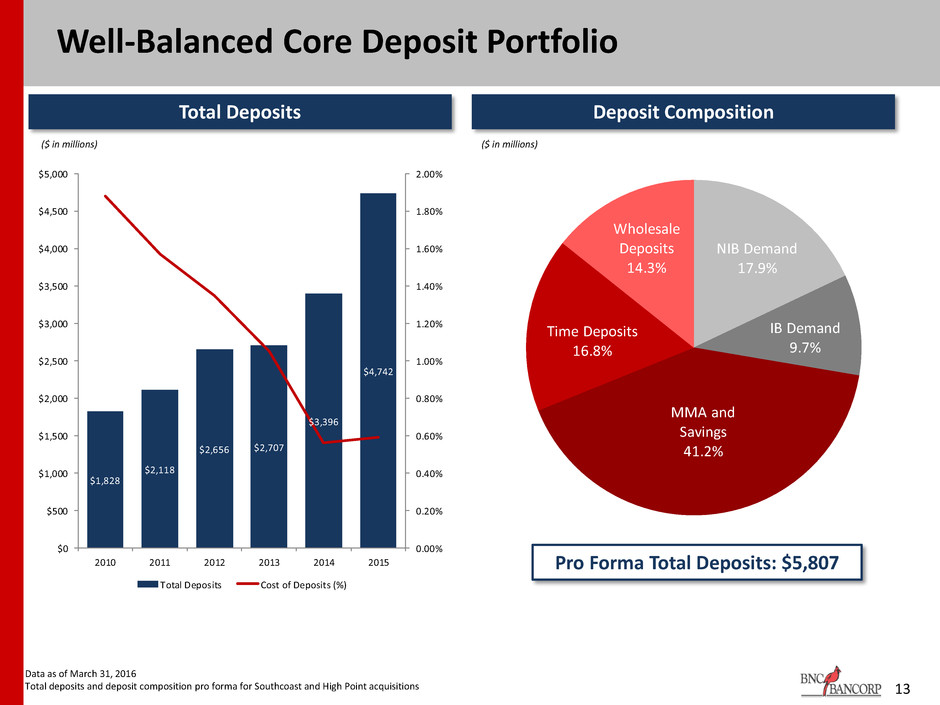
Well-Balanced Core Deposit Portfolio ($ in millions) 13 Total Deposits Deposit Composition Data as of March 31, 2016 Total deposits and deposit composition pro forma for Southcoast and High Point acquisitions Pro Forma Total Deposits: $5,807 ($ in millions) ($ in millions) $1,828 $2,118 $2,656 $2,707 $3,396 $4,742 0.00% 0.20% 0.40% 0.60% 0.80% 1.00% 1.20% 1.40% 1.60% 1.80% 2.00% $0 $500 $1,000 $1,500 $2,000 $2,500 $3,000 $3,500 $4,000 $4,500 $5,000 2010 2011 2012 2013 2014 2015 Total Deposits Cost of Deposits (%) NIB Demand 17.9% IB Demand 9.7% MMA and Savings 41.2% Time Deposits 16.8% Wholesale Deposits 14.3%
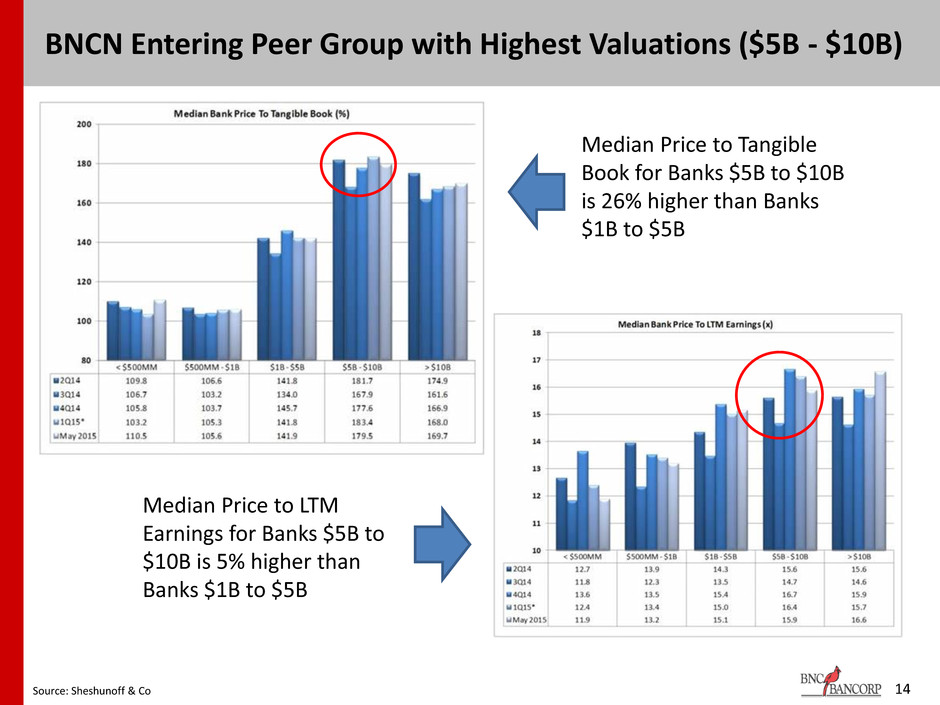
14 BNCN Entering Peer Group with Highest Valuations ($5B - $10B) Source: Sheshunoff & Co Median Price to Tangible Book for Banks $5B to $10B is 26% higher than Banks $1B to $5B Median Price to LTM Earnings for Banks $5B to $10B is 5% higher than Banks $1B to $5B
Financial Metrics
• BNC is acquiring High Point Bank Corporation “HPTB” for $141.3 million in stock and cash • BNC’s cash consideration in the High Point transaction is at least $42.4 million • Accretive to 2017 EPS of $0.13 • Tangible Book Value Earnback less than 1 Year • Nearly 27% of HPTB’s deposits are noninterest-bearing 16 High Point Bank Transaction
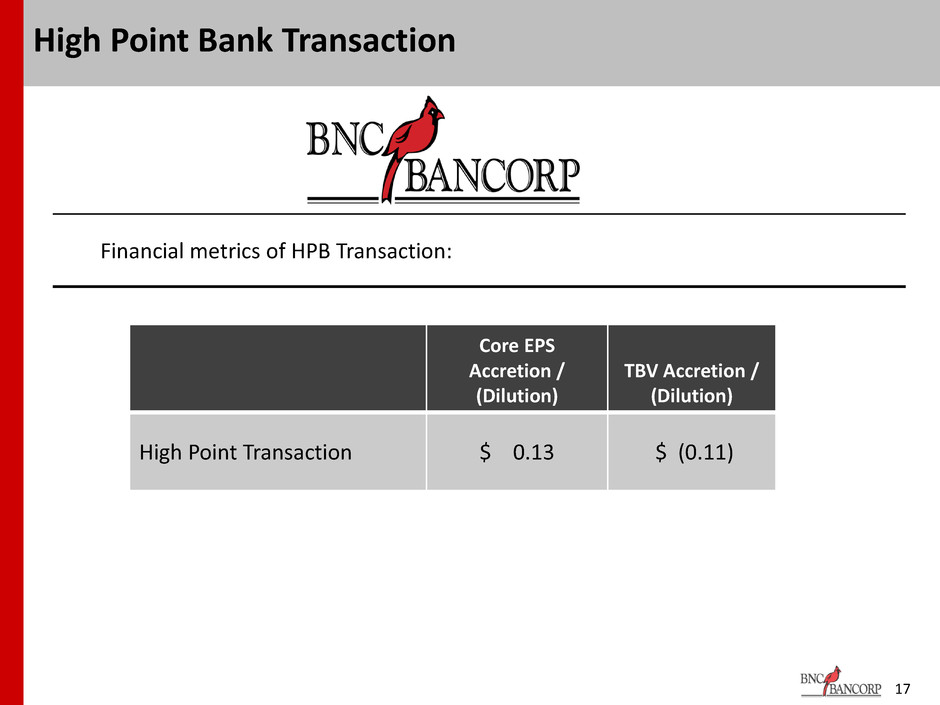
Financial metrics of HPB Transaction: 17 High Point Bank Transaction Core EPS Accretion / (Dilution) TBV Accretion / (Dilution) High Point Transaction $ 0.13 $ (0.11)
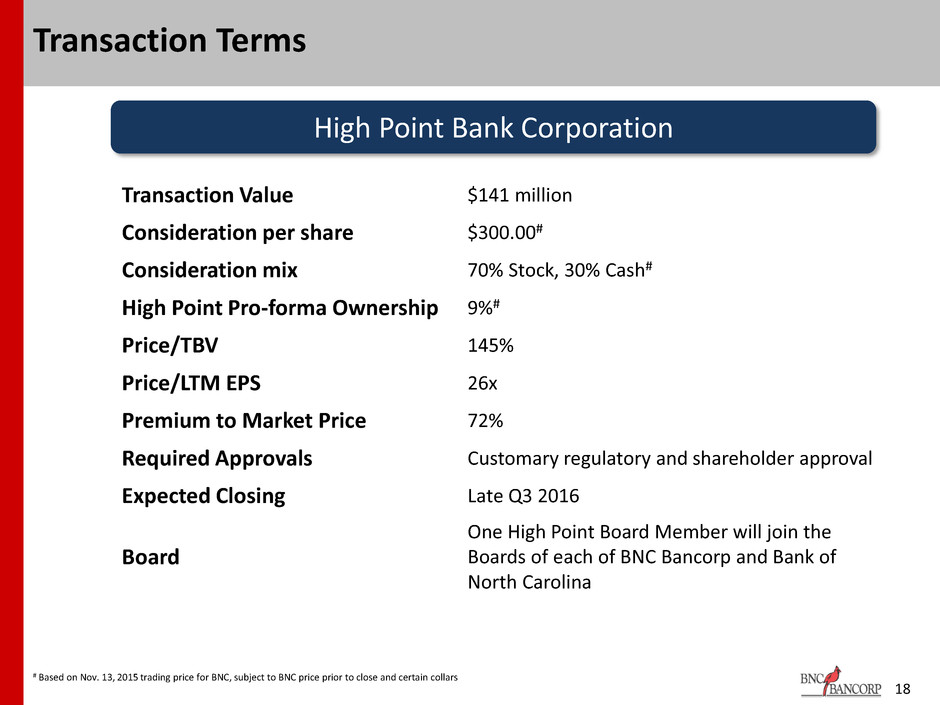
18 Transaction Terms # Based on Nov. 13, 2015 trading price for BNC, subject to BNC price prior to close and certain collars High Point Bank Corporation Transaction Value $141 million Consideration per share $300.00# Consideration mix 70% Stock, 30% Cash# High Point Pro-forma Ownership 9%# Price/TBV 145% Price/LTM EPS 26x Premium to Market Price 72% Required Approvals Customary regulatory and shareholder approval Expected Closing Late Q3 2016 Board One High Point Board Member will join the Boards of each of BNC Bancorp and Bank of North Carolina

19 Transaction Assumptions Cost savings % savings of HPTB’s LTM non-interest expense realized: • 44% realized in 2016 • 50% realized in 2017 Revenue synergies None assumed One-time costs $12mm, pretax Core deposit intangible $6mm Fair value marks $18mm gross credit mark; expected $2mm write-up on carrying value of bank premises High Point Bank Corporation

High Point shareholders will receive $300 per share in cash or BNC stock based on BNC’s 20-day volume-weighted average price (“VWAP”) prior to closing, subject to minimum and maximum exchange ratios. If BNC’s VWAP immediately prior to closing is - • equal to or greater than $25.60, each share of the High Point common stock will be converted into cash in the amount of $300, or 11.7188 shares of BNC common stock, prorated to 30% cash and 70% BNC common stock • less than $25.60 but equal to or greater than $22.25, each share of the High Point common stock will be converted into cash in the amount of $300, or $300 payable in BNC common stock, prorated to 30% cash and 70% BNC common stock • less than $22.25 but equal to or greater than $18.90, each share of the High Point common stock would be converted into cash in the amount of $300, or $300 payable in BNC common stock, prorated to no more than $57,267,325 in cash and 4,444,205 shares of BNC common stock • less than $18.90, each share of the High Point common stock would be converted into cash in the amount of $300, or 15.8730 shares of BNC common stock, prorated to 40.5% cash and 59.5% BNC common stock 20 Collars and Exchange Ratios
Benefits to BNC Franchise Value
• 12 branches in attractive Greensboro-High Point, NC MSA (9) and Winston-Salem, NC MSA (3) • #1 Deposit market share among local banks in High Point MSA • 110-year-old bank with deep local roots and strong customer relationships • Nearly 27% of High Point’s deposits are noninterest-bearing • High Point Trust Division: Largest Community Bank Trust Division in NC • High Point Insurance Division: One of Triad’s largest independent Agencies 22 Benefits to BNC Franchise

• High Point Trust Division: Largest Community Bank Trust Division in NC • Over $800 million in managed funds, serving approximately 500 families • Annual revenue: Trust $3.5 million; Brokerage $0.7 million • Offers Trust and estate planning, investment management, and retirement plan services • Combined Pre-tax income of over $1.0 million 23 High Point Bank Trust and Brokerage Divisions
• One of Triad’s largest independent Agencies – 30 Licensed agents • Offers Commercial (51%), Personal (37%), and Employee Benefits (12%) • Insurance Division over 100 years old having completed three prior acquisitions • Named the Best Insurance Agency in the Triad in 2013 by local paper • Revenues of over $3.5 million 24 High Point Bank Insurance Division

• Both BNC and High Point are on the same core system – JHA Silverlake • Concentration of Seasoned Talent in Support Areas proficient at JHA Silverlake • High Point has state-of-the-art Operations Center with adequate space to support future growth • Provides space and talent to combine loan and deposit operations under one roof and drive greater efficiencies • “Best of Both” talent and processes will drive greater efficiency 25 Operational Synergies
High Point Bank Corporation Overview
27 High Point Bank Corporation – Overview Founded in High Point, NC in 1905 Quality core deposit franchise Current balance sheet built solely through organic growth Largest community bank trust department in North Carolina More than $800mm in managed funds, approximately 500 families Sixth-largest insurance agency in Triad market HPB Insurance Group has been in operation for over 100 years 12 branches – 9 in the Greensboro-High Point MSA and 3 in the Winston- Salem MSA

28 High Point Bank Corporation – Overview (cont.) Source: SNL Financial, bank-level data 4.30% 4.58% 3.57% 2.03% 1.47% 3.73% 2.85% 1.70% 1.00% 0.92% 0.00% 1.00% 2.00% 3.00% 4.00% 5.00% 2011Y 2012Y 2013Y 2014Y 2015Y Asset Quality Trends NPAs/Assets NPAs ex. TDRs/Assets 2011Y 2012Y 2013Y 2014Y 2015Y Assets 789,191 818,555 824,487 828,717 849,373 Gross Loans 534,279 523,528 524,492 515,210 507,148 Deposits 617,914 643,669 657,138 663,983 700,452 Net Income -2,370 1,934 2,602 4,993 4,657 Efficiency 87.57 77.56 81.61 79.19 85.56 ROAA -0.30 0.24 0.32 0.62 0.57 ROAE -2.52 2.11 2.83 5.17 4.71 NIM 3.62 3.50 3.23 3.33 3.21 Cost of Funds 0.88 0.75 0.61 0.51 0.38 TE/TA 10.97 10.76 10.85 11.31 11.20 Tier 1 Ratio 13.99 14.35 14.47 15.43 15.47 Leverage Ratio 10.84 10.43 10.38 11.11 11.46

29 Greensboro-High Point Market Share The combined company will have the No. 4 overall and the No. 1 community bank deposit market share in the Greensboro-High Point MSA Source: SNL Financial Greensboro-High Point, NC Rank Institution # of Branches Deposits ($000) Deposit Market Share (%) 1 BB&T Corp. (NC) 24 2,213,872 19.08 2 Wells Fargo & Co. (CA) 34 2,022,572 17.43 3 Bank of America Corp. (NC) 17 1,185,069 10.21 Pro Forma Combined 17 1,106,932 9.54 4 SunTrust Banks Inc. (GA) 13 1,088,696 9.38 5 Yadkin Financial Corporation (NC) 12 845,800 7.29 6 First Citizens BancShares Inc. (NC) 14 647,436 5.58 7 High Point Bank Corp. (NC) 9 623,360 5.37 8 Carolina Bank Holdings Inc. (NC) 5 540,752 4.66 9 BNC Bancorp (NC) 8 483,572 4.17 10 CommunityOne Bancorp (NC) 9 392,538 3.38 Total For Institutions In Market 199 11,604,601
Appendix CREDIT
31 Commercial Real Estate • BNC CRE concentration has declined over past 5 years and is expected to continue to decline • BNC CRE and Multi-Family sectors had the lowest cumulative loss within the BNC loan portfolio during the last credit cycle • During Period 2008-2013 cumulative loss percentage was: – Multi-Family 0.22% – Commercial Construction 0.35% – CRE – Owner Occupied 2.69% – CRE – Non-Owner Occupied 3.32% – Remainder of Portfolio 9.50% (primarily A&D/Land and 1-4 Residential Construction) • A&D, Land and 1-4 Residential Construction portfolios have been reduced from 23% to under 5% on a percentage of portfolio basis • Approximately $1.5 billion of the $4.2 billion loan portfolio was acquired, and conservatively marked as part of fair value accounting (total mark = 2.8% of NBV) • Credit Risk Management Practices and Expertise have resulted in minimal downgrades from external and internal credit reviews • U.S. Department of Commerce forecasts the North Carolina economy to grow at a 3.5% rate versus a national average of 2.4% • BNC has spent last 2.5 years building its C&I credit infrastructure and in late 2014 rolled out dedicated middle-market lending team – This sector increased from 6% to 10% of total portfolio during 2015. Anticipated growth in this sector will continue to reduce CRE exposure in the future.

43% 54% 28% 22% 29% 23% 0% 10% 20% 30% 40% 50% 60% w Southcoast & HPBank Dec-15Dec-14Dec-13Dec-12Dec-11Dec-10Dec-09Dec-08 CRE/Construction/A&D/Land Residential RE C&I, Leases, & Own. Occ. CRE Linear (CRE/Construction/A&D/Land) Linear (Residential RE) Linear (C&I, Leases, & Own. Occ. CRE) BNC has targeted acquisition candidates with loan portfolios that reduced CRE concentrations 32 Historical Loan Portfolio Trends Loan Mix as a % of Portfolio
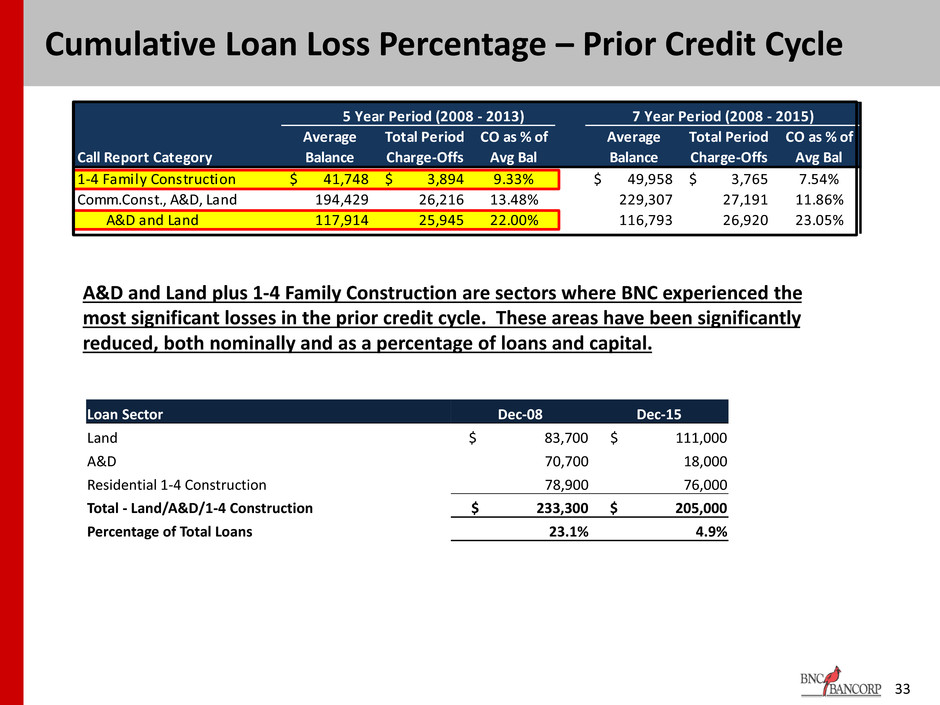
33 5 Year Period (2008 - 2013) 7 Year Period (2008 - 2015) Average Total Period CO as % of Average Total Period CO as % of Call Report Category Balance Charge-Offs Avg Bal Balance Charge-Offs Avg Bal 1-4 Family Construction 41,748$ 3,894$ 9.33% 49,958$ 3,765$ 7.54% Comm.Const., A&D, Land 194,429 26,216 13.48% 229,307 27,191 11.86% A&D and Land 117,914 25,945 22.00% 116,793 26,920 23.05% Commercial Construction 76,515 271 0.35% 112,514 271 0.24% Multi-Family 38,725 84 0.22% 61,208 236 0.39% CRE - Own-Occ 250,824 6,759 2.69% 355,106 8,984 2.53% CRE - Investment 431,050 14,314 3.32% 591,632 14,855 2.51% Commercial & Industrial 135,308 12,001 8.87% 183,393 13,222 7.21% Residential Mtg. 309,092 15,427 4.99% 461,886 18,344 3.97% Consumer 9,507 1,038 10.92% 11,367 1,184 10.42% Cumulative Loan Loss Percentage – Prior Credit Cycle Loan Sector Dec-08 Dec-15 Land $ 83,700 $ 111,000 A&D 70,700 18,000 Residential 1-4 Construction 78,900 76,000 Total - Land/A&D/1-4 Construction $ 233,300 $ 205,000 Percentage of Total Loans 23.1% 4.9% A&D and Land plus 1-4 Family Construction are sectors where BNC experienced the most significant losses in the prior credit cycle. These areas have been significantly reduced, both nominally and as a percentage of loans and capital.
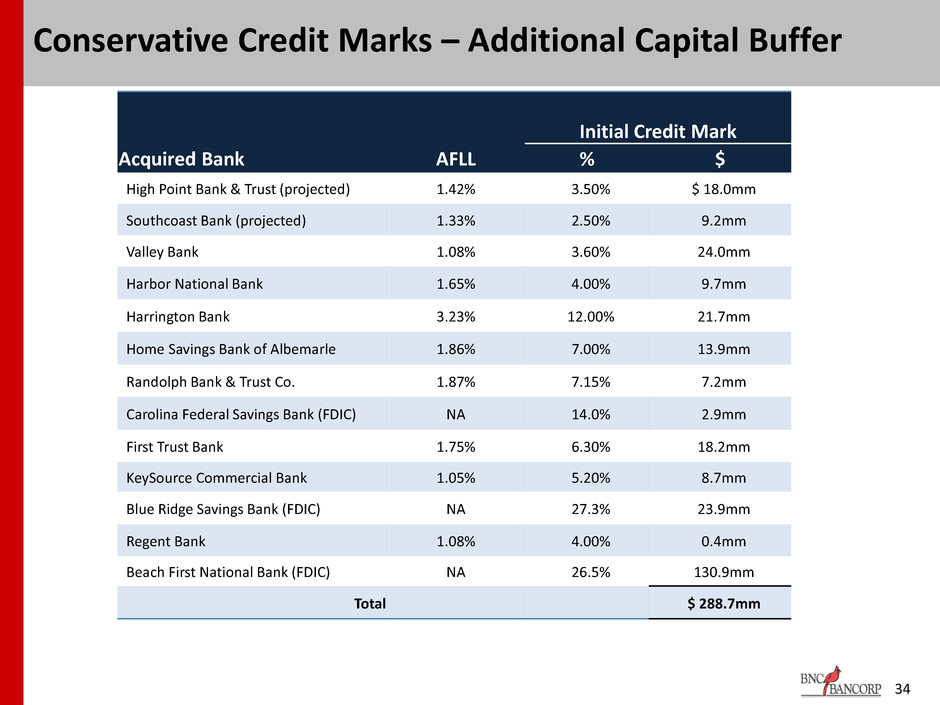
34 Conservative Credit Marks – Additional Capital Buffer Initial Credit Mark Acquired Bank AFLL % $ High Point Bank & Trust (projected) 1.42% 3.50% $ 18.0mm Southcoast Bank (projected) 1.33% 2.50% 9.2mm Valley Bank 1.08% 3.60% 24.0mm Harbor National Bank 1.65% 4.00% 9.7mm Harrington Bank 3.23% 12.00% 21.7mm Home Savings Bank of Albemarle 1.86% 7.00% 13.9mm Randolph Bank & Trust Co. 1.87% 7.15% 7.2mm Carolina Federal Savings Bank (FDIC) NA 14.0% 2.9mm First Trust Bank 1.75% 6.30% 18.2mm KeySource Commercial Bank 1.05% 5.20% 8.7mm Blue Ridge Savings Bank (FDIC) NA 27.3% 23.9mm Regent Bank 1.08% 4.00% 0.4mm Beach First National Bank (FDIC) NA 26.5% 130.9mm Total $ 288.7mm
35 CRE Concentration Management • Recent initiatives that positively impact concentrations ─ New Consumer Lending platform creates streamlined retail lending channel ─ Created in-house community outreach mortgage division to provide mortgage loans to under-served customers and communities ─ HELOC campaigns in last 3 years increased consumer loans as % of portfolio ─ Both Southcoast and High Point Bank transactions reduce BNC CRE concentrations. Southcoast is predominantly a retail bank ─ Middle Market Group created in 2015 – doubled production in that category with growing positive momentum ─ Construction/Perm Mortgage team created, resulting in growing consumer residential construction portfolio ─ Enhanced SBA Group will provide additional C&I lending opportunities
36 Investor Contacts Richard D. Callicutt II President & Chief Executive Officer David B. Spencer Senior Executive Vice President & Chief Financial Officer BNC Bancorp 3980 Premier Drive, Suite 210 High Point, NC 27265 (366) 869-9200 www.bncbancorp.com

37 Forward Looking Statements This presentation contains certain forward-looking information about BNC that is intended to be covered by the safe harbor for “forward-looking statements” provided by the Private Securities Litigation Reform Act of 1995. All statements other than statements of historical fact, are forward-looking statements. In some cases, you can identify forward-looking statements by words such as “may,” “hope,” “will,” “should,” “expect,” “plan,” “anticipate,” “intend,” “believe,” “estimate,” “predict,” “potential,” “continue,” “could,” “future” or the negative of those terms or other words of similar meaning. You should carefully read forward-looking statements, including statements that contain these words, because they discuss the future expectations or state other “forward-looking” information about BNC. Such statements involve inherent risks and uncertainties, many of which are difficult to predict and are generally beyond the control of BNC. Forward-looking statements speak only as of the date they are made and BNC assumes no duty to update such statements. In addition to factors previously disclosed in reports filed by BNC with the SEC, additional risks and uncertainties may include, but are not limited to: the possibility that any of the anticipated benefits of the proposed merger will not be realized or will not be realized within the expected time period; the risk that integration of operations with those of BNC will be materially delayed or will be more costly or difficult than expected; the inability to complete the merger due to the failure of shareholder approval to adopt the merger agreement; the failure to satisfy other conditions to completion of the merger, including receipt of required regulatory and other approvals; the failure of the proposed merger to close for any other reason; the effect of the announcement of the merger on customer relationships and operating results; the possibility that the merger may be more expensive to complete than anticipated, including as a result of unexpected factors or events; and general competitive, economic, political and market conditions and fluctuations. Additional factors affecting BNC are discussed in its Annual Reports on Form 10-K, Quarterly Reports on Form 10-Q and Current Reports on Form 8-K filed with the SEC. Please refer to the SEC’s website at www.sec.gov where you can review those documents.
