Attached files
| file | filename |
|---|---|
| EX-23 - BNC BANCORP | v214479_ex23.htm |
| EX-11 - BNC BANCORP | v214479_ex11.htm |
| EX-32 - BNC BANCORP | v214479_ex32.htm |
| EX-21 - BNC BANCORP | v214479_ex21.htm |
| EX-12 - BNC BANCORP | v214479_ex12.htm |
| EX-31.1 - BNC BANCORP | v214479_ex31-1.htm |
| EX-99.2 - BNC BANCORP | v214479_ex99-2.htm |
| EX-31.2 - BNC BANCORP | v214479_ex31-2.htm |
| EX-99.1 - BNC BANCORP | v214479_ex99-1.htm |
UNITED STATES
SECURITIES AND EXCHANGE COMMISSION
Washington, D.C. 20549
FORM 10-K
ANNUAL REPORT PURSUANT TO SECTION 13 OR 15(d)
OF THE SECURITIES EXCHANGE ACT OF 1934
For the fiscal year ended December 31, 2010
Commission File Number: 000-50128
BNC BANCORP
(Exact name of registrant as specified in its charter)
|
North Carolina
|
47-0898685
|
|
|
(State or Other Jurisdiction of
|
(I.R.S. Employer Identification No.)
|
|
|
Incorporation or Organization)
|
||
|
1226 Eastchester Drive
|
||
|
High Point, North Carolina
|
27265
|
|
|
(Address of Principal Executive Offices)
|
(Zip Code)
|
(336) 476-9200
(Registrant’s telephone number, including area code)
Securities Registered Pursuant to Section 12(b) of the Act: None
|
Securities Registered Pursuant to Section 12(g) of the Act:
|
Common stock, no par value
|
||
|
(Title of Class)
|
Indicate by check mark if the registrant is a well-known seasoned issuer, as defined in Rule 405 of the Securities Act. Yes ¨ No x
Indicate by check mark if the registrant is not required to file reports pursuant to Section 13 or Section 15(d) of the Act. Yes ¨ No x
Indicate by check mark whether the registrant (1) has filed all reports required to be filed by Section 13 or 15(d) of the Securities Exchange Act of 1934 during the preceding 12 months (or for such shorter period that the registrant was required to file such reports), and (2) has been subject to such filing requirements for the past 90 days.
Yes x No ¨
Indicate by check mark whether registrant has submitted electronically and posted on its corporate website, if any, every Interactive Data File required to be submitted and posted pursuant to Rule 405 of Regulation S-T during the preceding 12 months (or for such shorter period that the registrant was required to submit and post such files). Yes ¨ No ¨
Indicate by check mark if disclosure of delinquent filers pursuant to Item 405 of Regulation S-K is not contained herein, and will not be contained, to the best of registrant’s knowledge, in definitive proxy or information statements incorporated by reference in Part III of this Form 10-K or any amendment to this Form 10-K. ¨
Indicate by check mark whether the registrant is a large accelerated filer, an accelerated filer, a non-accelerated file, or a smaller reporting company (as defined in Rule 12b-2 of the Exchange Act).
|
Large Accelerated filer ¨
|
Accelerated filer x
|
Non-Accelerated filer ¨
|
Smaller Reporting Company x
Indicate by check mark whether the Registrant is a shell company (as defined in Rule 12b-2 of the Exchange Act).
Yes ¨ No x
$79,240,000
(Aggregate value of voting and non-voting common equity held by non-affiliates of the registrant based
on the price at which the registrant’s common stock, no par value per share was sold on June 30, 2010)
On March 11, 2011, the registrant had 9,059,809 shares of common stock outstanding.
DOCUMENTS INCORPORATED BY REFERENCE
Portions of the Proxy Statement for the 2011 Annual Meeting of Stockholders of BNC Bancorp to be held on May 17, 2011, are incorporated by reference into Part III.
PART I
ITEM 1. BUSINESS
General
BNC Bancorp (the “Company”, “we”, “our”) was formed in 2002 to serve as a one-bank holding company for Bank of North Carolina (the “Bank”). The Company is registered with the Board of Governors of the Federal Reserve System (the “FRB”) under the Bank Holding Company Act of 1956, as amended (the “BHCA”) and the bank holding company laws of North Carolina. The Company’s administrative office is located at 1226 Eastchester Drive, High Point, North Carolina 27265 and the Bank’s main office is located at 831 Julian Avenue, Thomasville, North Carolina 27360. The Company’s only business at this time is owning the Bank and its primary source of income is any dividends that are declared
and paid by the Bank on its capital stock.
The Bank is a full service commercial bank that was incorporated under the laws of the State of North Carolina on November 15, 1991, and opened for business on December 3, 1991. On April 9, 2010, the Bank acquired certain assets and assumed certain liabilities of Beach First National Bank (“Beach First”) from the Federal Deposit Insurance Corporation (“FDIC”) in a FDIC-assisted transaction. Beach First was a full-service commercial bank headquartered in Myrtle Beach, South Carolina that operated seven branch locations in the Coastal South Carolina region. The Bank made this acquisition to enter into a new market outside the central North Carolina region and to allow the Bank to expand its geographic footprint. The loans and other real estate owned acquired as part of the Purchase and
Assumption Agreement are covered by two loss share agreements between the FDIC and the Bank (one for single family residential mortgage loans and the other for all other loans and other real estate owned), which affords the Bank significant loss protection. Under the terms of the loss share agreements, the FDIC will absorb 80% of losses and share in 80% of loss recoveries. The term for the loss share agreement for single family residential mortgage loans is in effect for 10 years from the April 9, 2010 acquisition date and the loss share agreement for all other loans and other real estate owned is in effect for 5 years from the acquisition date. The loss recovery provisions are in effect for 10 years and 8 years, respectively, from the acquisition date. The South Carolina branches are operated under the name BNC Bank.
As of December 31, 2010, we were the seventh largest North Carolina-domiciled bank by assets and had 23 full-service banking offices along the I-85 / I-40 / I-77 / I-73 corridors in central North Carolina including Davidson, Randolph, Rowan, Forsyth, Guilford, Iredell and Cabarrus Counties and six full-service banking offices along the coast of South Carolina including Horry County, Georgetown County and Beaufort County. The Bank operates under the rules and regulations of and is subject to examination by the FDIC and the North Carolina Commissioner of Banks, North Carolina Department of Commerce (the “Commissioner”). The Bank is also subject to certain regulations of the Federal Reserve governing the reserves to be maintained against deposits and other
matters.
The Bank provides a wide range of banking services tailored to the particular banking needs of the communities it serves. It is principally engaged in the business of attracting deposits from the general public and using such deposits, together with other funding from the Bank’s lines of credit, to make primarily consumer and commercial loans. The Bank has pursued a strategy that emphasizes its local affiliations. This business strategy stresses the provision of high quality banking services to individuals and small to medium-sized local businesses. Specifically, the Bank makes business loans secured by real estate, personal property and accounts receivable; unsecured business loans; consumer loans, which are secured by consumer products, such as automobiles and boats; unsecured consumer loans; commercial
real estate loans; and other loans. The Bank also offers a wide range of banking services, including checking and savings accounts, commercial, installment and personal loans, safe deposit boxes, and other associated services.
The Company targets business professionals and small to mid-size business customers with superior customer service, excellent branch locations and long-term, experienced bankers. The Company believes that the markets it operates in provide a unique opportunity for the Bank, as the Company is able to target customers with credit relationships in the $250,000 to $5 million range that are too small for regional community banks but too large for smaller community banks with lower legal lending limits. The Company has been able to grow assets, deposits and loans while maintaining above peer asset quality with non-performing assets to total assets, excluding assets covered under loss share agreements of 2.75% and 2.04% at December 31, 2010 and 2009, respectively. Including assets covered by loss share
agreements, the nonperforming assets to total assets ratio was 6.29%. In large part, the Company’s superior asset quality relative to peers is due to our strong team of lenders and asset quality management; most of our asset quality personnel have been in the banking industry for more than 20 years and several members of our senior credit team have experienced several economic and real estate cycles during their banking careers.
2
Lending involves credit risk. Credit risk is controlled and monitored through active asset quality management including the use of lending standards, thorough review of potential borrowers, and active asset quality administration. Credit risk management is discussed under Item 7. Management’s Discussion and Analysis of Financial Condition and Results of Operations, “Executive Summary”, “Asset/Liability Management”, “Lending Activities”, “Asset Quality”, “Nonperforming Assets” and “Analysis of Allowance for Loan Losses”. Also see Item 1A, “Risk Factors.”
Deposits are the primary source of the Bank’s funds for lending and other investment purposes. The Bank attracts both short-term and long-term deposits from the general public locally and out-of-state by offering a variety of accounts and rates. The Bank offers statement savings accounts, negotiable order of withdrawal accounts, money market demand accounts, noninterest-bearing accounts, and fixed interest rate certificates with varying maturities.
Deposit flows are greatly influenced by economic conditions, the general level of interest rates, competition, and other factors. The Bank’s deposits are obtained both from its primary market area and through wholesale sources throughout the United States. The Bank uses traditional marketing methods to attract new customers and savings deposits, including print media advertising and direct mailings.
The Company’s primary sources of revenue are interest and fee income from its lending and investing activities, primarily consisting of making business loans for small- to medium-sized businesses, and, to a lesser extent, from its investment portfolio. In prior years, investments have not been a primary source of income for the Company. In November and December of 2008, the Company purchased $265 million in government agency sponsored mortgage-backed securities and an additional $76 million of bank-qualified municipal government securities during the fourth quarter of 2008 and first quarter of 2009, to leverage the $31.3 million of proceeds from the U.S. Department of the Treasury (“UST”) Capital Purchase Program (“CPP”). Under the CPP, the Company sold shares of preferred stock and
issued a warrant to purchase common stock to the UST. During the first quarter of 2009, the Company negotiated an unsecured $250 million money market funding arrangement and interest rate swap agreement resulting in a five-year interest cost of 2.95%. This leverage transaction has provided sufficient net interest income to offset the cost of dividends on the CPP preferred stock and provide additional operational income to the Company. The major expenses of the Company are interest paid on deposits and borrowings and general administrative expenses such as salaries, employee benefits, advertising and office occupancy.
On June 14, 2010, the Company entered into an Investment Agreement (the “Investment Agreement”) with Aquiline BNC Holdings LLC, a Delaware limited liability company (“Aquiline”). Pursuant to the Investment Agreement, Aquiline purchased 892,799 shares of the Company’s common stock, no par value per share, at $10.00 per share and 1,804,566 shares of the Company’s Mandatorily Convertible Non-Voting Preferred Stock, Series B (the “Series B Preferred Stock”) at $10.00 per share. The purchase of common stock and Series B Preferred Stock by Aquiline was part of a $35 million private placement that closed on June 14, 2010 (the “Private Placement”). In addition to Aquiline, other investors, including certain directors of the Company, purchased 802,635 shares
of the Company’s common stock at $10.00 per share (collectively, with Aquiline, the “Investors”) as a part of the Private Placement on June 14, 2010. The Investors, other than Aquiline, entered into Subscription and Registration Rights Agreements with the Company in connection with their investment in the Company’s common stock in the Private Placement.
The Bank has experienced steady growth over its twenty-year history. The Company’s assets totaled $2.15 billion and $1.63 billion as of December 31, 2010 and 2009, respectively. Net income for the year ended December 31, 2010 was $7.7 million compared to $6.5 million for the year ended December 31, 2009. Net income available to common shareholders for the year ended December 31, 2010 totaled $5.5 million, or $0.61 per diluted common share, as compared to $4.6 million, or $0.62 per diluted common share, for the year ended December 31, 2009.
Because the Bank is the sole banking subsidiary of the Company, the Company’s operations are located at the Bank level. Throughout this Annual Report, results of operations will relate to the Bank’s operation, unless a specific reference is made to the Company and its operating results other than through the Bank’s business and activities.
3
Competition and Market Area
We face substantial competition in all areas of our operations from a variety of different competitors, many of which are larger and may have more financial resources. Such competitors primarily include national, regional, and internet banks within the various markets in which we operate. We also face competition from many other types of financial institutions, including, without limitation, savings and loans, credit unions, finance companies, brokerage firms, insurance companies, and other financial intermediaries. The financial services industry could become even more competitive as a result of legislative, regulatory, and technological changes and continued consolidation. Banks, securities firms, and insurance companies can merge under the umbrella of a financial holding company, which can offer virtually any
type of financial service, including banking, securities underwriting, insurance (both agency and underwriting), and merchant banking. Also, technology has lowered barriers to entry and made it possible for nonbanks to offer products and services traditionally provided by banks, such as automatic transfer and automatic payment systems. Many of our competitors have fewer regulatory constraints and may have lower cost structures. Additionally, due to their size, many competitors may be able to achieve economies of scale and, as a result, may offer a broader range of products and services as well as better pricing for those products and services than we can.
The Company operates in markets that have not experienced the tremendous property value increases recognized in other parts of the country and as a result the property valuation declines have not been as severe. Based on SNL Financial data, the Company’s markets had population growth of 18.3% from 2000-2010, versus 10.6% nationwide. The Company’s markets have a projected population growth rate of 8.0% for 2010 to 2015, which is higher than the projected growth rate of 3.9% for the U.S.
As of June 30, 2010, the Company has a deposit market share of 34.6% in its largest market, Davidson County. Rowan and Cabarrus Counties are located in the growing Piedmont region of North Carolina between the Charlotte metro market and the High Point and Thomasville markets. Rowan and Cabarrus Counties offer a premier location for warehouses, manufacturing and distribution facilities because the largest consolidated rail system in the country is centered in the region. Rowan County is home to over 45 freight companies. Cabarrus County is the home to Lowes Motor Speedway and numerous NASCAR-related suppliers and team headquarters. Lexington, High Point, Archdale and Thomasville’s traditional economic base includes furniture and textile manufacturing, which have been negatively impacted by the recession.
Greensboro’s economic base is more diversified and service-oriented and is also home to several colleges and universities.
The Company’s primary market areas in South Carolina are located along the coastal regions and predominately center on the Metro regions of Myrtle Beach and Hilton Head Island, South Carolina. In the three counties in South Carolina in which the Company operates six branch offices, Horry County, Georgetown County and Beaufort County, the Company has deposit market shares of 7.6%, 2.75%, and 1.94%, respectively.
Employees
At December 31, 2010, the Bank had 358 full-time and 14 part-time equivalent employees. When the Company acquired Beach First it retained 78 employees to operate the 6 branches throughout the Myrtle Beach, South Carolina area.
Subsidiaries
The Company is a one-bank holding company for Bank of North Carolina. In addition, the Company has wholly owned subsidiaries to issue trust preferred securities: BNC Bancorp Capital Trust I, BNC Bancorp Capital Trust II, BNC Bancorp Capital Trust III and BNC Bancorp Capital Trust IV. These long-term obligations, which qualify as Tier I capital for the Company, constitute a full and unconditional guarantee by the Company of the trusts’ obligations under the preferred securities.
The Bank has three subsidiaries that operate in the mortgage and real estate areas: BNC Credit Corp. serves as the Bank’s trustee on deeds of trust and Sterling Real Estate Holdings, LLC and Sterling Real Estate Development of North Carolina, LLC hold and dispose of the Bank’s real estate owned. Each of these subsidiaries were incorporated or organized under the laws of the State of North Carolina.
4
Supervision and Regulation
Bank holding companies and state commercial banks are extensively regulated under both federal and state law. The following is a brief summary of certain statutes and rules and regulations that affect or will affect the Company and the Bank. This summary contains what management believes to be the material information related to the supervision and regulation of the Company and the Bank but is not intended to be an exhaustive description of the statutes or regulations applicable to the business of the Company and the Bank. Supervision, regulation and examination of the Company and the Bank by the regulatory agencies are intended primarily for the protection of depositors rather than shareholders of the Company. The Company cannot predict whether or in what form any proposed statute or regulation
will be adopted or the extent to which the business of the Company and the Bank may be affected by a statute or regulation.
General. There are a number of obligations and restrictions imposed on bank holding companies and their depository institution subsidiaries by law and regulatory policy that are designed to minimize potential loss to the depositors of such depository institutions and the FDIC insurance funds in the event the depository institution becomes in danger of default or in default. For example, to avoid receivership of an insured depository institution subsidiary, a bank holding company is required to guarantee the compliance of any insured depository institution subsidiary that may become “undercapitalized” with the terms of any capital restoration plan filed by such subsidiary with its appropriate federal
banking agency up to the lesser of (i) an amount equal to 5% of the bank’s total assets at the time the bank became undercapitalized or (ii) the amount which is necessary (or would have been necessary) to bring the bank into compliance with all acceptable capital standards as of the time the bank fails to comply with such capital restoration plan. The Company, as a registered bank holding company, is subject to the regulation of the Federal Reserve. Under a policy of the Federal Reserve with respect to bank holding company operations, a bank holding company is required to serve as a source of financial strength to its subsidiary depository institutions and to commit resources to support such institutions in circumstances where it might not do so absent such policy. The Federal Reserve under the BHCA also has the authority to require a bank holding company to terminate any activity or to relinquish control of a nonbank subsidiary (other than a nonbank subsidiary of a bank) upon
the Federal Reserve’s determination that such activity or control constitutes a serious risk to the financial soundness and stability of any bank subsidiary of the bank holding company.
In addition, insured depository institutions under common control are required to reimburse the FDIC for any loss suffered by its deposit insurance funds as a result of the default of a commonly controlled insured depository institution or for any assistance provided by the FDIC to a commonly controlled insured depository institution in danger of default. The FDIC may decline to enforce the cross-guarantee provisions if it determines that a waiver is in the best interest of the deposit insurance funds. The FDIC’s claim for damages is superior to claims of stockholders of the insured depository institution or its holding company but is subordinate to claims of depositors, secured creditors and holders of subordinated debt (other than affiliates) of the commonly
controlled insured depository institutions.
As a result of the Company’s ownership of the Bank, the Company is also registered under the bank holding company laws of North Carolina. Accordingly, the Company is also subject to regulation and supervision by the North Carolina Commissioner of Banks.
Emergency Economic Stabilization Act of 2008. The Emergency Economic Stabilization Act of 2008 (“EESA”) gave the UST authority to take certain actions to restore liquidity and stability to the U.S. banking markets. Based upon its authority in the EESA, a number of programs to implement EESA have been announced. The first program implemented by the UST is the Capital Purchase Program (“CPP”). Pursuant to this program, the UST, on behalf of the U.S. government, is authorized to purchase preferred stock, along with warrants to purchase common stock, from certain financial institutions, including bank holding companies, savings and loan holding companies and banks or savings associations not controlled by a holding company. The investment
will have a dividend rate of 5% per year, until the fifth anniversary of the UST’s investment and a dividend of 9% thereafter. During the time the UST holds securities issued pursuant to this program, participating financial institutions will be required to comply with certain provisions regarding executive compensation and corporate governance. Participation in this program also imposes certain restrictions upon an institution’s dividends to common shareholders and stock repurchase activities. As described further herein, we elected to participate in the CPP and received $31.3 million pursuant to the program.
5
American Recovery and Reinvestment Act of 2009. The American Recovery and Reinvestment Act of 2009 (“ARRA”) includes a wide variety of programs intended to stimulate the economy and provide for extensive infrastructure, energy, health, and education needs. In addition, ARRA imposes certain new executive compensation and corporate governance obligations on all current and future CPP recipients, including the Company, until the institution has redeemed the preferred stock, which CPP recipients are now permitted to do under ARRA without regard to the three-year holding period and without the need to raise new capital, subject to approval of its primary federal regulator.
Additionally, ARRA amends Section 111 of EESA to require the UST to adopt additional standards with respect to executive compensation and corporate governance for CPP recipients, which are set forth in the TARP Standards for Compensation and Corporate Governance: Interim Final Rule (“Interim Final Rule”), adopted by the UST on June 15, 2009. Among the executive compensation and corporate governance provisions included in ARRA and the Interim Final Rule are the following:
|
|
•
|
an incentive compensation “clawback” provision to cover “senior executive officers” (defined in this instance and below to mean the “named executive officers” for whom compensation disclosure is provided in the company’s proxy statement) and the next 20 most highly compensated employees;
|
|
|
•
|
a prohibition on certain golden parachute payments to cover any payment related to a departure for any reason (with limited exceptions) made to any senior executive officer (as defined above) and the next five most highly compensated employees;
|
|
|
•
|
a limitation on incentive compensation paid or accrued to the five most highly compensated employees of the financial institution, subject to limited exceptions for pre-existing arrangements set forth in written employment contracts executed on or prior to February 11, 2009, and certain awards of restricted stock which may not exceed one-third of annual compensation, are subject to a two-year holding period and cannot be transferred until the UST’s preferred stock is redeemed in full;
|
|
|
•
|
a requirement that a company’s chief executive officer and chief financial officer provide in annual securities filings, a written certification of compliance with the executive compensation and corporate governance provisions of the Interim Final Rule;
|
|
|
•
|
an obligation for the compensation committee of the board of directors to evaluate with a company’s chief risk officer certain compensation plans to ensure that such plans do not encourage unnecessary or excessive risks or the manipulation of reported earnings;
|
|
|
•
|
a requirement that companies adopt a company-wide policy regarding excessive or luxury expenditures;
|
|
|
•
|
a requirement that companies permit a separate, non-binding shareholder vote to approve the compensation of executives; and
|
|
|
•
|
a provision that allows the UST to review compensation paid prior to enactment of ARRA to senior executive officers and the next 20 most highly-compensated employees to determine whether any payments were inconsistent with the executive compensation restrictions of EESA, CPP or otherwise contrary to the public interest.
|
The Dodd-Frank Wall Street Reform and Consumer Protection Act of 2010. On July 21, 2010, President Obama signed into law the Dodd-Frank Wall Street Reform and Consumer Protection Act of 2010 ( the “Dodd-Frank Act”). The Dodd-Frank Act will have a broad impact on the financial services industry, including significant regulatory and compliance changes including, among other things, (i) enhanced resolution authority of troubled and failing banks and their holding companies; (ii) increased capital and liquidity requirements; (iii) increased regulatory examination fees; (iv) changes to assessments to be paid to the FDIC for federal deposit insurance; and (v) numerous other provisions designed to improve supervision and oversight of, and strengthening
safety and soundness for, the financial services sector. Additionally, the Dodd-Frank Act establishes a new framework for systemic risk oversight within the financial system to be distributed among new and existing federal regulatory agencies, including the Financial Stability Oversight Council, the Federal Reserve, the Office of the Comptroller of the Currency, and the FDIC. A summary of certain provisions of the Dodd-Frank Act is set forth below.
6
|
|
·
|
Increased Capital Standards and Enhanced Supervision. The federal banking agencies are required to establish minimum leverage and risk-based capital requirements for banks and bank holding companies. These new standards will be no lower than current regulatory capital and leverage standards applicable to insured depository institutions and may, in fact, be higher when established by the agencies. The Dodd-Frank Act also increases regulatory oversight, supervision and examination of banks, bank holding companies and their respective subsidiaries by the appropriate regulatory agency.
|
|
|
·
|
The Consumer Financial Protection Bureau (“Bureau”). The Dodd-Frank Act creates the Bureau within the Federal Reserve. The Bureau is tasked with establishing and implementing rules and regulations under certain federal consumer protection laws with respect to the conduct of providers of certain consumer financial products and services. The Bureau has rulemaking authority over many of the statutes governing products and services offered to bank customers. In addition, the Dodd-Frank Act permits states to adopt consumer protection laws and regulations that are more stringent than those regulations promulgated by the Bureau and state attorneys general are permitted to enforce consumer protection rules adopted by the Bureau against state- chartered institutions.
|
|
|
·
|
Deposit Insurance. The Dodd-Frank Act makes permanent the $250,000 deposit insurance limit for insured deposits. Amendments to the Federal Deposit Insurance Act also revise the assessment base against which an insured depository institution’s deposit insurance premiums paid to the Deposit Insurance Fund (“DIF”) will be calculated. Under the amendments, the assessment base will no longer be the institution’s deposit base, but rather its average consolidated total assets less its average tangible equity during the assessment period. Additionally, the Dodd-Frank Act makes changes to the minimum designated reserve ratio of the DIF, increasing the minimum from 1.15 percent to 1.35 percent of the estimated amount of total insured deposits and eliminating the requirement that the FDIC pay dividends to depository
institutions when the reserve ratio exceeds certain thresholds. In December 2010, the FDIC increased the reserve ratio to 2.0 percent. The Dodd- Frank Act also provides that, effective one year after the date of enactment, depository institutions may pay interest on demand deposits.
|
|
|
·
|
Transactions with Affiliates. The Dodd-Frank Act enhances the requirements for certain transactions with affiliates under Section 23A and 23B of the Federal Reserve Act, including an expansion of the definition of “covered transactions” and increasing the amount of time for which collateral requirements regarding covered transactions must be maintained.
|
|
|
·
|
Transactions with Insiders. Insider transaction limitations are expanded through the strengthening of loan restrictions to insiders and the expansion of the types of transactions subject to the various limits, including derivative transactions, repurchase agreements, reverse repurchase agreements and securities lending or borrowing transactions. Restrictions are also placed on certain asset sales to and from an insider to an institution, including requirements that such sales be on market terms and, in certain circumstances, approved by the institution’s board of directors.
|
|
|
·
|
Enhanced Lending Limits. The Dodd-Frank Act strengthens the existing limits on a depository institution’s credit exposure to one borrower. Current banking law limits a depository institution’s ability to extend credit to one person (or group of related persons) in an amount exceeding certain thresholds. The Dodd-Frank Act expands the scope of these restrictions to include credit exposure arising from derivative transactions, repurchase agreements, and securities lending and borrowing transactions.
|
|
|
·
|
Compensation Practices. The Dodd-Frank Act provides that the appropriate federal regulators must establish standards prohibiting as an unsafe and unsound practice any compensation plan of a bank holding company or other “covered financial institution” that provides an insider or other employee with “excessive compensation” or could lead to a material financial loss to such firm. In June 2010, prior to the Dodd-Frank Act, the bank regulatory agencies promulgated the Interagency Guidance on Sound Incentive Compensation Policies, which requires that financial institutions establish metrics for measuring the impact of activities to achieve incentive compensation with the related risk to the financial institution of such behavior. Together, the Dodd-Frank Act and the recent guidance on compensation may impact the
current compensation policies at the Company.
|
7
|
|
·
|
Holding Company Capital Levels. The Dodd-Frank Act requires bank regulators to establish minimum capital levels for holding companies that are at least of the same nature as those applicable to financial institutions. All trust preferred securities, or TRUPs, issued by bank or thrift holding companies after May 19, 2010 will be counted as Tier II Capital (with an exception for certain small bank holding companies). Bank holding companies with at least $15 billion in assets as of December 31, 2009 will have five years to comply with this provision, and starting on January 1, 2013, these holding companies will phase in the requirement by deducting one-third of TRUPs per year for the following three years from Tier 1 capital. TRUPs issued prior to May 19, 2010 by bank holding companies with less than $15 billion in assets as of December
31, 2009 are exempt from these capital deductions entirely.
|
We expect that many of the requirements called for in the Dodd-Frank Act will be implemented over time, and most will be subject to implementing regulations over the course of several years. Given the uncertainty associated with the manner in which the provisions of the Dodd-Frank Act will be implemented by the various regulatory agencies and through regulations, the full extent of the impact such requirements will have on financial institutions’ operations is unclear. The changes resulting from the Dodd-Frank Act may impact the profitability of our business activities, require changes to certain of our business practices, impose upon us more stringent capital, liquidity and leverage ratio requirements or otherwise adversely affect our business. These changes may also require us to invest significant
management attention and resources to evaluate and make necessary changes in order to comply with new statutory and regulatory requirements.
Capital Requirements for the Bank. The Bank, as a North Carolina commercial bank, is required to maintain a surplus account equal to 50% or more of its paid-in capital stock. As a North Carolina chartered, FDIC-insured commercial bank which is not a member of the Federal Reserve System, the Bank is also subject to capital requirements imposed by the FDIC. Under the FDIC’s regulations, state nonmember banks that (a) receive the highest rating during the examination process and (b) are not anticipating or experiencing any significant growth, are required to maintain a minimum leverage ratio of 3% of total consolidated assets; all other banks are required to maintain a minimum ratio of 1% or 2% above the
stated minimum, with a minimum leverage ratio of not less than 4%. At December 31, 2010, the Bank’s leverage ratio was 7.42%.
Dividend and Repurchase Limitations. The Company must obtain Federal Reserve approval prior to repurchasing common stock in excess of 10% of its net worth during any twelve-month period unless the Company (i) both before and after the redemption satisfies capital requirements for “well capitalized” state member banks; (ii) received a one or two rating in its last examination; and (iii) is not the subject of any unresolved supervisory issues. As long as the UST holds equity in the Company pursuant to the CPP, UST approval is required for the Company to repurchase shares of outstanding common stock.
Although the payment of dividends and repurchase of stock by the Company are subject to certain requirements and limitations of North Carolina corporate law, except as set forth in this paragraph, neither the Commissioner nor the FDIC have promulgated any regulations specifically limiting the right of the Company to pay dividends and repurchase shares. However, the ability of the Company to pay dividends or repurchase shares may be dependent upon the Company’s receipt of dividends from the Bank.
North Carolina commercial banks, such as the Bank, are subject to legal limitations on the amounts of dividends they are permitted to pay. Dividends may be paid by the Bank from undivided profits, which are determined by deducting and charging certain items against actual profits, including any contributions to surplus required by North Carolina law. Also, an insured depository institution, such as the Bank, is prohibited from making capital distributions, including the payment of dividends, if, after making such distribution, the institution would become “undercapitalized” (as such term is defined in the applicable law and regulations).
Under the terms of the CPP, the UST has a preferential right to the payment of cumulative dividends on the CPP Series A preferred stock. No dividends are permitted to be paid to common shareholders unless all accrued and unpaid dividends for all past dividend periods on the CPP preferred stock were fully paid. In the case of the Company, any increase in dividends to common shareholders above $0.05 per share quarterly is subject to the consent of the UST for the first three years of the CPP preferred stock investment.
8
Deposit Insurance. The deposit accounts of the Bank are insured by the Deposit Insurance Fund (the “DIF”) of the FDIC. Pursuant to EESA and ARRA, the maximum deposit insurance amount per depositor was temporarily increased from $100,000 to $250,000. The Dodd-Frank Act permanently increased the maximum amount of deposit insurance for banks, savings institutions and credit unions to $250,000 per depositor, retroactive to January 1, 2009. The Dodd-Frank Act also provides unlimited deposit insurance for non-interest bearing transaction accounts through December 31, 2013.
The FDIC issues regulations and conducts periodic examinations, requires the filing of reports and generally supervises the operations of its insured banks. This supervision and regulations are intended primarily for the protection of depositors. Any insured bank that is not operated in accordance with or does not conform to FDIC regulations, policies and directives may be sanctioned for noncompliance. Civil and criminal proceedings may be instituted against any insured bank or any director, officer or employee of such bank for the violations of applicable laws and regulations, breaches of fiduciary duties or engaging in any unsafe or unsound practice. The FDIC has the authority to terminate insurance of accounts pursuant to procedures established for that purpose.
The Bank is subject to insurance assessments imposed by the FDIC. The FDIC imposes a risk-based deposit premium assessment system, which was amended pursuant to the Federal Deposit Insurance Reform Act of 2005. Under this system, as amended, the assessment rates for an insured depository institution vary according to the level of risk incurred in its activities. To arrive at an assessment rate for a banking institution, the FDIC places it in one of four risk categories determined by reference to its capital levels and supervisory ratings. In addition, in the case of those institutions in the lowest risk category, the FDIC further determines its assessment rate based on certain specified financial ratios or, if applicable, its long-term debt ratings.
Recently, the FDIC has been actively seeking to replenish the DIF. The FDIC increased risk-based assessment rates uniformly by seven basis points, on an annual basis, beginning in the first quarter of 2009. On May 22, 2009, the FDIC adopted a final rule imposing a five basis point special assessment on each insured depository institution’s qualifying assets less Tier 1 capital as of June 30, 2009. The FDIC collected this special assessment on September 30, 2009. On November 12, 2009, the FDIC adopted a final rule that required insured financial institutions to prepay their estimated quarterly risk-based assessments for the fourth quarter of 2009 and for the following three years. Such prepaid assessments were collected on December 30, 2009 at a rate based on the insured institution’s modified third
quarter 2009 assessment rate. The Company’s prepaid assessment was $8.5 million. Under the Dodd-Frank Act, the minimum designated reserve ratio of the DIF increased from 1.15 percent to 1.35 percent of estimated insured deposits. Additionally, the Dodd-Frank Act revised the assessment base against which an insured depository institution’s deposit insurance premiums paid to the DIF will be calculated. Under the FDIC’s proposed rules, the assessment base will change from adjusted domestic deposits to average consolidated total assets minus average tangible equity.
FDIC Temporary Liquidity Guarantee Program. On October 14, 2008, the FDIC announced its Temporary Liquidity Guarantee Program (“TLGP”), which is comprised of the Debt Guarantee Program (“DGP”) and the Transaction Account Guarantee Program (“TAGP”).
The TAGP provided unlimited deposit insurance coverage through December 31, 2009, for non-interest bearing transaction accounts and certain interest-bearing accounts (negotiable order of withdrawal (NOW) accounts with interest rates of 0.50% or less and lawyers trust accounts) at FDIC-insured depository institutions. Depository institutions participating in the TAGP were assessed, on a quarterly basis, an annualized 10 basis points fee on the balance of each covered account in excess of the existing FDIC deposit insurance limit of $250,000 that was established on a temporary basis, through December 31, 2009. The $250,000 deposit insurance coverage limit was scheduled to return to $100,000 on January 1, 2010, but was extended by congressional action until December 31,
2013. The TLGP was extended to cover debt of FDIC-insured institutions issued through April 30, 2010, and the TAGP was extended through June 30, 2010. The Company participated in the TAGP since its beginning, and has elected to continue its participation during the extension period.
The DGP provides an FDIC guarantee of certain senior unsecured debt of FDIC-insured institutions and their holding companies. The unsecured debt must have been issued on or after October 14, 2008 and not later than October 31, 2009, and the guarantee is effective through the earlier of the maturity date or June 30, 2012. The DGP coverage limit is generally 125% of the eligible entity’s eligible debt outstanding on September 30, 2008 and scheduled to mature on or before June 30, 2009 or, for certain insured institutions, 2% of their liabilities as of September 30, 2008. The proceeds of debt guaranteed under the DGP may not be used to prepay debt that is not guaranteed by the FDIC. Depending on the term of the debt maturity, the
nonrefundable DGP fee ranges from 50 to 100 basis points (annualized) for covered debt outstanding until the earlier of maturity or June 30, 2012. The Company was eligible to participate in the DGP although it chose to not issue any debt under the program.
9
FDIC Liquidation Authority under the Dodd-Frank Act. In January 2011, the FDIC issued an interim final rule on depositor preference which clarifies how the FDIC will treat certain creditors’ claims under the FDIC’s new liquidation authority under the Dodd-Frank Act, whereby the FDIC may be appointed as receiver for a financial company if the failure of such company and its liquidation under the Bankruptcy Code or other insolvency proceeding would pose significant risks to U.S. financial stability. Pursuant to the interim final rule, the FDIC will allow additional payments to a creditor in rare circumstances after the FDIC’s board of directors has determined that such payments meet certain
statutory standards. The payments would be subject to recoupment; however, if the ultimate recoveries are insufficient to repay any temporary government-provided liquidity support. The interim final rule also (1) provides the FDIC with authority to continue a company’s operations by paying for services provided by employees and others; (2) clarifies how damages will be calculated for creditors’ contingent claims; and (3) describes the application of proceeds from the liquidation of subsidiaries.
Federal Deposit Insurance Corporation Improvement Act of 1991. The Federal Deposit Insurance Corporation Improvement Act of 1991 (“FDICIA”) provides for, among other things, (i) publicly available annual financial condition and management reports for certain financial institutions, including audits by independent accountants, (ii) the establishment of uniform accounting standards by federal banking agencies, (iii) the establishment of a “prompt corrective action” system of regulatory supervision and intervention, based on capitalization levels, with greater scrutiny and restrictions placed on depository institutions with lower levels of capital, (iv) additional grounds for the appointment
of a conservator or receiver, and (v) restrictions or prohibitions on accepting brokered deposits, except for institutions which significantly exceed minimum capital requirements. FDICIA also provides for increased funding of the FDIC insurance funds and the implementation of risk-based premiums.
A central feature of FDICIA is the requirement that the federal banking agencies take “prompt corrective action” with respect to depository institutions that do not meet minimum capital requirements. Pursuant to FDICIA, the federal bank regulatory authorities have adopted regulations setting forth a five-tiered system for measuring the capital adequacy of the depository institutions that they supervise. Under the regulations, a depository institution is classified in one of the following capital categories: “well capitalized,” “adequately capitalized,” “undercapitalized,” “significantly undercapitalized,” and “critically undercapitalized.” An institution may be deemed by the regulators to be in a
capitalization category that is lower than is indicated by its actual capital position if, among other things, it receives an unsatisfactory examination rating with respect to asset quality, management, earnings or liquidity. FDICIA provides the federal banking agencies with significantly expanded powers to take enforcement action against institutions which fail to comply with capital or other standards. Such action may include the termination of deposit insurance by the FDIC or the appointment of a receiver or conservator for the institution.
Federal Home Loan Bank System. The FHLB system provides a central credit facility for member institutions. As a member of the FHLB of Atlanta and under the its capital plan, the Bank is required to own capital stock in the FHLB of Atlanta in an amount at least equal to 0.20% (or 20 basis points) of the Bank’s total assets at the end of each calendar year, plus 4.5% of its outstanding advances (borrowings) from the FHLB of Atlanta under the new activity-based stock ownership requirement. On December 31, 2010, the Bank was in compliance with this requirement.
Community Reinvestment. Under the Community Reinvestment Act (“CRA”), as implemented by regulations of the FDIC, an insured institution has a continuing and affirmative obligation consistent with its safe and sound operation to help meet the credit needs of its entire community, including low and moderate income neighborhoods. The CRA does not establish specific lending requirements or programs for financial institutions, nor does it limit an institution’s discretion to develop, consistent with the CRA, the types of products and services that it believes are best suited to its particular community. The CRA requires the federal banking regulators, in connection with their examinations of insured
institutions, to assess the institutions’ records of meeting the credit needs of their communities, using the ratings of “outstanding,” “satisfactory,” “needs to improve,” or “substantial noncompliance,” and to take that record into account in its evaluation of certain applications by those institutions. All institutions are required to make public disclosure of their CRA performance ratings. The Bank received a “satisfactory” rating in its last CRA examination which was conducted during February 2008.
10
Changes in Control. The BHCA prohibits the Company from acquiring direct or indirect control of more than 5% of the outstanding voting stock or substantially all of the assets of any bank or savings bank or merging or consolidating with another bank holding company or savings bank holding company without prior approval of the Federal Reserve. Similarly, Federal Reserve approval (or, in certain cases, non-disapproval) must be obtained prior to any person acquiring control of the Company. Control is conclusively presumed to exist if, among other things, a person acquires more than 25% of any class of voting stock of the Company or controls in any manner the election of a majority of the directors of the Company.
Control is presumed to exist if a person acquires more than 10% of any class of voting stock and the stock is registered under Section 12 of the Securities Exchange Act of 1934 as amended (the “Exchange Act”) or the acquiror will be the largest shareholder after the acquisition.
Federal Securities Law. The Company has registered its common stock with the Securities and Exchange Commission (the “SEC”) pursuant to Section 12(g) of the Exchange Act. As a result of such registration, the proxy and tender offer rules, insider trading reporting requirements, annual and periodic reporting and other requirements of the Exchange Act are applicable to the Company.
Transactions with Affiliates. Under current federal law, depository institutions are subject to the restrictions contained in Section 22(h) of the Federal Reserve Act with respect to loans to directors, executive officers and principal shareholders. Under Section 22(h), loans to directors, executive officers and shareholders who own more than 10% of a depository institution (18% in the case of institutions located in an area with less than 30,000 in population), and certain affiliated entities of any of the foregoing, may not exceed, together with all other outstanding loans to such person and affiliated entities, the institution’s
loans-to-one-borrower limit (as discussed below). Section 22(h) also prohibits loans above amounts prescribed by the appropriate federal banking agency to directors, executive officers and shareholders who own more than 10% of an institution, and their respective affiliates, unless such loans are approved in advance by a majority of the board of directors of the institution. Any “interested” director may not participate in the voting. The FDIC has prescribed the loan amount (which includes all other outstanding loans to such person), as to which such prior board of director approval is required, as being the greater of $25,000 or 5% of capital and surplus (up to $500,000). Further, pursuant to Section 22(h), the Federal Reserve requires that loans to directors, executive officers, and principal shareholders be made on terms substantially the same as offered in comparable transactions with non-executive employees of the Bank. The FDIC has imposed additional limits on the
amount a bank can loan to an executive officer. The Dodd-Frank Act also increases requirements relating to transactions with affiliates. See “The Dodd-Frank Wall Street Reform and Consumer Protection Act of 2010” discussed earlier herein.
Loans to One Borrower. The Bank is subject to the Commissioner’s loans to one borrower limits which are substantially the same as those applicable to national banks. Under these limits, no loans and extensions of credit to any borrower outstanding at one time and not fully secured by readily marketable collateral shall exceed 15% of the unimpaired capital and unimpaired surplus of the bank. Loans and extensions of credit fully secured by readily marketable collateral may comprise an additional 10% of unimpaired capital and unimpaired surplus. The Dodd-Frank Act expands the scope of these restrictions. See The Dodd-Frank Wall Street
Reform and Consumer Protection Act of 2010” discussed earlier herein.
Gramm-Leach-Bliley Act. The federal Gramm-Leach-Bliley Act (the “GLB Act”) dramatically changed various federal laws governing the banking, securities and insurance industries. The GLB Act has expanded opportunities for banks and bank holding companies to provide services and engage in other revenue-generating activities that previously were prohibited to them. However, this expanded authority also may present us with new challenges as our larger competitors are able to expand their services and products into areas that are not feasible for smaller, community oriented financial institutions. The GLB Act likely will have a significant economic impact on the banking industry and on competitive conditions in the financial services industry
generally.
USA Patriot Act of 2001. In 2001, Congress enacted the Uniting and Strengthening America by Providing Appropriate Tools Required to Intercept and Obstruct Terrorism Act (the “Patriot Act”). The Patriot Act is intended to strengthen the ability of U.S. law enforcement and the intelligence community to work cohesively to combat terrorism on a variety of fronts. The potential impact of the Act on financial institutions of all kinds is significant and wide ranging. The Act contains sweeping anti-money laundering and financial transparency laws and requires various regulations, including standards for verifying customer identification at account opening, and rules to promote cooperation among financial institutions, regulators, and law enforcement
entities in identifying parties that may be involved in terrorism or money laundering.
11
Interstate Banking and Branching. The BHCA was amended by the Interstate Banking Act. The Interstate Banking Act provides that adequately capitalized and managed financial and bank holding companies are permitted to acquire banks in any state.
State law prohibiting interstate banking or discriminating against out-of-state banks are preempted. States are not permitted to enact laws opting out of this provision; however, states are allowed to adopt a minimum age restriction requiring that target banks located within the state be in existence for a period of years, up to a maximum of five years, before a bank may be subject to the Interstate Banking Act. The Interstate Banking Act, as amended by the Dodd-Frank Act, establishes deposit caps which prohibit acquisitions that result in the acquiring company controlling 30% or more of the deposits of insured banks and thrift institutions held in the state in which the target maintains a breach or 10% or more of the deposits nationwide. States have the authority to
waive the 30% deposit cap. State-level deposit caps are not preempted as long as they do not discriminate against out-of-state companies, and the federal deposit caps apply only to initial entry acquisitions.
Under the Dodd-Frank Act, national banks and state banks are able to establish branches in any state if that state would permit the establishment of the branch by a state bank chartered in that state. North Carolina law permits a state bank to establish a branch of the bank anywhere in the state. Accordingly, under the Dodd-Frank Act, a bank with its headquarters outside the State of North Carolina may establish branches anywhere within North Carolina.
Government Monetary Policies and Economic Controls. Our earnings and growth, as well as the earnings and growth of the banking industry, are affected by the credit policies of monetary authorities, including the Federal Reserve. An important function of the Federal Reserve is to regulate the national supply of bank credit in order to combat recession and curb inflationary pressures. Among the instruments of monetary policy used by the Federal Reserve to implement these objectives are open market operations in U.S. government securities, changes in reserve requirements against member bank deposits, and changes in the Federal Reserve discount rate. These means are used in varying combinations to influence overall growth of bank loans, investments, and deposits,
and may also affect interest rates charged on loans or paid for deposits. The monetary policies of the Federal Reserve authorities have had a significant effect on the operating results of commercial banks in the past and are expected to continue to have such an effect in the future.
In view of changing conditions in the national economy and in money markets, as well as the effect of credit policies by monetary and fiscal authorities, including the Federal Reserve, no prediction can be made as to possible future changes in interest rates, deposit levels, and loan demand, or their effect on our business and earnings or on the financial condition of our various customers.
Other. The federal banking agencies, including the FDIC, have developed joint regulations requiring annual examinations of all insured depository institutions by the appropriate federal banking agency, with some exceptions for small, well-capitalized institutions and state chartered institutions examined by state regulators, and establish operational and managerial, asset quality, earnings and stock valuation standards for insured depository institutions, as well as compensation standards when such compensation would endanger the insured depository institution or would constitute an unsafe practice.
In addition, the Bank is subject to various other state and federal laws and regulations, including state usury laws, laws relating to fiduciaries, consumer credit and equal credit, fair credit reporting laws and laws relating to branch banking. The Bank, as an insured North Carolina commercial bank, is prohibited from engaging as a principal in activities that are not permitted for national banks, unless (i) the FDIC determines that the activity would pose no significant risk to the appropriate deposit insurance fund and (ii) the Bank is, and continues to be, in compliance with all applicable capital standards.
Under Chapter 53 of the North Carolina General Statutes, if the capital stock of a North Carolina commercial bank is impaired by losses or otherwise, the Commissioner is authorized to require payment of the deficiency by assessment upon the bank’s shareholders, pro rata, and to the extent necessary, if any such assessment is not paid by any shareholder, upon 30 days notice, to sell as much as is necessary of the stock of such shareholder to make good the deficiency.
12
ITEM 1A. RISK FACTORS
Risks Related to Recent Economic Conditions and Governmental Response Efforts
Our business has been and may continue to be adversely affected by current conditions in the financial markets and economic conditions generally. The global, U.S., North Carolina and South Carolina economies are experiencing significantly reduced business activity and consumer spending as a result of, among other factors, disruptions in the capital and credit markets. Dramatic declines in the housing market, with falling home prices and increasing foreclosures and unemployment, have resulted in significant write-downs of asset values by financial institutions, including government-sponsored entities and major commercial and investment banks. A sustained weakness or weakening in business and
economic conditions generally or specifically in the principal markets in which we do business could have one or more of the following adverse effects on our business:
|
|
•
|
a decrease in the demand for loans or other products and services offered by us;
|
|
|
•
|
a decrease in the value of our loans or other assets secured by consumer or commercial real estate;
|
|
|
•
|
a decrease to deposit balances due to overall reductions in the accounts of customers;
|
|
|
•
|
an impairment of certain intangible assets or investment securities;
|
|
|
•
|
a decreased ability to raise additional capital on terms acceptable to us or at all; or
|
|
|
•
|
an increase in the number of borrowers who become delinquent, file for protection under bankruptcy laws or default on their loans or other obligations to us. An increase in the number of delinquencies, bankruptcies or defaults could result in a higher level of nonperforming assets, net charge-offs and provision for credit losses, which would reduce our earnings.
|
Until conditions improve, we expect our business, financial condition and results of operations to be adversely affected.
Recent and future legislation and regulatory initiatives to address the current financial services market and general economic conditions may not achieve their intended objectives, including stabilizing the U.S. banking system or reviving the overall U.S. economy. Recent and future legislative and regulatory initiatives to address current financial services market and economic conditions, such as EESA, ARRA and the Dodd-Frank Act, may not achieve their intended objectives. In addition, Treasury and banking regulators have implemented, and likely will continue to implement, various other programs to address capital and liquidity issues in the banking system. There can be no assurance as to the actual impact that any of the recent, or future,
legislative and regulatory initiatives will have on the financial markets and the overall economy. Any failure of these initiatives to improve the financial markets and the economy, and a worsening of the current financial market and economic conditions could materially and adversely affect our business, financial condition, results of operations, access to credit or the trading price of our common stock.
The Dodd-Frank Act was signed into law on July 21, 2010. While many of the provisions of the Dodd-Frank Act are aimed at financial institutions significantly larger than us, it includes several items that could significantly impact our business. These include, among others:
|
|
·
|
the creation of the Bureau of Consumer Financial Protection (“BCFP”) authorized to promulgate and enforce consumer protection regulations relating to financial products;
|
|
|
·
|
the establishment of strengthened capital and prudential standards for banks and bank holding companies;
|
|
|
·
|
enhanced regulation of financial markets, including derivatives and securitization markets; and
|
|
|
·
|
a permanent increase of the previously implemented temporary increase of FDIC deposit insurance to $250,000.
|
A number of provisions of the Dodd-Frank Act remain to be implemented through the rulemaking process at various regulatory agencies. We are unable to predict what the final form of these rules will be when implemented by the respective agencies, but management believes that certain aspects of the new legislation, including, without limitation, the additional cost of higher deposit insurance assessment rates, possible future special assessments by the FDIC, and the costs of compliance with disclosure and reporting requirements and examinations by the BCFP, could have a significant impact on our business, financial condition, and results of operations.
13
The BCFP may reshape the consumer financial laws through rulemaking and enforcement of the prohibitions against unfair, deceptive and abusive business practices, which may directly impact the business operations of depository institutions offering consumer financial products or services, including the Bank. The BCFP has broad rulemaking authority to administer and carry out the provisions of the Dodd-Frank Act with respect to financial institutions that offer to consumers covered financial products and services. The BCFP has also been directed to write rules identifying practices or acts that are unfair, deceptive or abusive in connection with any transaction with a consumer for a consumer financial product or service, or the
offering of a consumer financial product or service. The concept of what may be considered to be an “abusive” practice is new under the law. The full scope of the impact of this authority has not yet been determined as the implementing rules of the Dodd-Frank Act with respect to the BCFP have not yet been released. Moreover, the Bank will be supervised and examined by the BCFP for compliance with the BCFP’s regulations and policies. The costs and limitations related to this additional regulatory reporting regimen have yet to be fully determined, although they may be material and the limitations and restrictions that will be placed upon the Bank with respect to its consumer product offering and services will also likely produce significant, material effects on the Bank’s (and the Company’s) profitability.
Additional requirements under our regulatory framework, especially those imposed under the Dodd-Frank Act, ARRA, EESA, or other legislation intended to strengthen the U.S. financial system, could adversely affect us. The President, Congress, the Federal Reserve, the Treasury, the FDIC and others have taken numerous actions to address the current liquidity and credit situation in the financial markets. These measures include actions to encourage loan restructuring and modification for homeowners, the establishment of significant liquidity and credit facilities for financial institutions and investment banks, and coordinated efforts to address liquidity and other weaknesses in the banking sector. As part of EESA, the Treasury
created the Capital Purchase Program, or CPP, which authorizes the Treasury to invest up to $250 billion in senior preferred stock of U.S. banks and savings associations or their holdings companies for the purpose of stabilizing and providing liquidity to the U.S. financial markets. On February 17, 2009, ARRA was enacted as a sweeping economic recovery package intended to stimulate the economy and provide for extensive infrastructure, energy, health and education needs. We participated in the CPP and sold $31.2 million in Fixed Rate Cumulative Perpetual Preferred Stock, Series A (the “Series A Preferred Stock”), and a warrant to purchase 543,337 shares of our common stock to the Treasury. Future participation in this or similar programs may subject us to additional restrictions and regulation. There can be no assurance as to the actual impact that EESA or its programs, including the CPP, and ARRA or its programs, will have on the national economy or
financial markets.
Further, federal and state regulatory authorities continually review banking laws, regulations and policies for possible changes. Changes to statutes, regulations or regulatory policies and implementation of EESA, AARA, and the Dodd-Frank Act, could affect us in substantial and unpredictable ways, including limiting the types of financial services and products we may offer or increasing the ability of non-banks to offer competing financial services and products. While we cannot predict the regulatory changes that may be borne out of the current economic condition, and we cannot predict whether we will become subject to increased regulatory scrutiny by any of these regulatory agencies, any regulatory changes or scrutiny
could increase or decrease the cost of doing business, limit or expand our permissible activities, or affect the competitive balance among banks, credit unions, savings and loan associations and other institutions. We cannot predict whether additional legislation will be enacted and, if enacted, the effect that it, or any regulations, would have on our business, financial condition or results of operations.
The limitations on incentive compensation contained in the ARRA may adversely affect our ability to retain our highest performing employees. In the case of a company such as BNC Bancorp that received CPP funds, the ARRA, and subsequent regulations issued by UST, contain restrictions on bonus and other incentive compensation payable to the company’s senior executive officers. As a consequence, we may be unable to create a compensation structure that permits us to retain our highest performing employees and attract new employees of a high caliber. If this were to occur, our businesses and results of operations could be adversely affected.
Our participation in the CPP imposes restrictions and obligations on us that limit our ability to increase dividends, repurchase shares of our common stock and access the equity capital markets. On December 5, 2008, we issued and sold (i) 31,260 shares of Series A Preferred Stock and (ii) a warrant to purchase 543,337 shares of our common stock (“Warrant”) to the UST as part of its CPP. Prior to December 5, 2011, unless we have redeemed all of the Series A Preferred Stock or the UST has transferred all of the Series A Preferred Stock to a third party, the Securities Purchase Agreement pursuant to which such securities were sold, among other things, limits the payment of dividends on our common stock to a maximum quarterly
dividend of $0.05 per share without prior regulatory approval, limits our ability to repurchase shares of our common stock (with certain exceptions, including the repurchase of our common stock to offset share dilution from equity-based compensation awards), and grants the holders of such securities certain registration rights which, in certain circumstances, impose lock-up periods during which we would be unable to issue equity securities. In addition, unless we are able to redeem the Series A Preferred Stock during the first five years, the dividends on this capital will increase substantially at that point, from 5% to 9%. Depending on market conditions at the time, this increase in dividends could significantly impact our liquidity.
14
The soundness of other financial institutions could adversely affect us. Since mid-2007, the financial services industry as a whole, as well as the securities markets generally, have been materially and adversely affected by significant declines in the values of nearly all asset classes and by a serious lack of liquidity. Financial institutions in particular have been subject to increased volatility and an overall loss in investor confidence.
Our ability to engage in routine funding transactions could be adversely affected by the actions and commercial soundness of other financial institutions. Financial services companies are interrelated as a result of trading, clearing, counterparty, or other relationships. We have exposure to many different industries and counterparties, and we routinely execute transactions with counterparties in the financial services industry, including brokers and dealers, commercial banks, and other institutional clients.
From time to time, we utilize derivative financial instruments, primarily to hedge our exposure to changes in interest rates, but also to hedge cash flow. By entering into these transactions and derivative instrument contracts, we expose ourselves to counterparty credit risk in the event of default of our counterparty or client. When the fair value of a derivative contract is in an asset position, the counterparty has a liability to us, which creates credit risk for us. We attempt to minimize this risk by selecting counterparties with investment grade credit ratings, limiting our exposure to any single counterparty and regularly monitoring our market position with each counterparty. Nonetheless, defaults by, or even rumors or questions about, one or more financial services companies, or the financial services
industry generally, have led to market-wide liquidity problems and could lead to losses or defaults by us or by other institutions. In addition, our credit risk may be exacerbated when the collateral held by us cannot be realized or is liquidated at prices not sufficient to recover the full amount of the loan due us. There is no assurance that any such losses would not materially and adversely affect our businesses, financial condition or results of operations.
Current levels of market volatility are unprecedented. The capital and credit markets have been experiencing volatility and disruption for more than two years. The volatility and disruption has reached unprecedented levels. In some cases, the markets have produced downward pressure on stock prices and credit availability for certain issuers without regard to those issuers’ underlying financial strength. If current levels of market disruption and volatility continue or worsen, there can be no assurance that we will not experience an adverse effect, which may be material, on our ability to access capital and on our business, financial condition and results of operations.
We may be required to pay significantly higher FDIC deposit insurance premiums and assessments in the future. Recent insured depository institution failures, as well as deterioration in banking and economic conditions, have significantly increased the loss provisions of the FDIC, resulting in a decline in the designated reserve ratio of the DIF to historical lows. The FDIC recently increased the designated reserve ratio from 1.25 to 2.00. In addition, the deposit insurance limit on FDIC deposit insurance coverage generally has increased to $250,000, which may result in even larger losses to the DIF. These developments have caused an increase to our assessments, and the FDIC may be required to make additional increases to the assessment
rates and levy additional special assessments on us. Higher assessments increase our non-interest expense.
Since 2009, our assessment rates, which also include our assessment for participating in the FDIC’s TAGP have increased. Additionally, on May 22, 2009, the FDIC announced a final rule imposing a special 5.00 basis points emergency assessment as of June 30, 2009, payable September 30, 2009, based on assets minus Tier 1 Capital at June 30, 2009, but the amount of the assessment was capped at 10.00 basis points of domestic deposits. Finally, on November 12, 2009, the FDIC adopted a new rule requiring insured institutions to prepay on December 30, 2009, estimated quarterly risk-based assessments for the fourth quarter of 2009 and for all of 2010, 2011, and 2012. We prepaid an assessment of $7.3 million, which incorporated a uniform increase effective January 1, 2011.
15
These higher FDIC assessment rates and special assessments have had and will continue to have an adverse impact on our results of operations. Our FDIC insurance related cost was $3.0 million and $2.8 million for the years ended December 31, 2010 and December 31, 2009, respectively, compared to $642,000 for the year ended December 31, 2008. We are unable to predict the impact in future periods, including whether and when additional special assessments will occur.
Higher insurance premiums and assessments increase our costs and may limit our ability to pursue certain business opportunities. We also may be required to pay even higher FDIC premiums than the recently increased level, because financial institution failures resulting from the depressed market conditions have depleted and may continue to deplete the deposit insurance fund and reduce its ratio of reserves to insured deposits.
Risks Related to Our Business
Failure to comply with the terms of the loss sharing agreements with the FDIC may result in significant losses. On April 9, 2010, the Bank acquired certain assets and assumed certain liabilities of Beach First from the FDIC in a FDIC-assisted transaction. Beach First was a full-service commercial bank headquartered in Myrtle Beach, South Carolina that operated seven branch locations in the coastal South Carolina region. The loans and other real estate owned acquired as part of the Purchase and Assumption Agreement, are covered by two loss share agreements between the FDIC and the Bank (one for single family residential mortgage loans and the other for all other loans and other real estate
owned), which affords the Bank significant loss protection. Under the terms of the loss share agreements, the FDIC will absorb 80% of losses and share in 80% of loss recoveries. The term for the loss share agreement for single family residential mortgage loans is in effect for 10 years from the April 9, 2010 acquisition date and the loss share agreement for all other loans and other real estate owned is in effect for 5 years from the acquisition date. The loss recovery provisions are in effect for 10 years and 8 years, respectively, from the acquisition date.
The Purchase Assumption Agreement and the related loss share agreements between the FDIC and the Bank have specific, detailed and extensive compliance, servicing, notification and reporting requirements, including certain restrictions on our change of control. The loss sharing agreements prohibit the assignment by the Bank of its rights under the loss sharing agreements and the sale or transfer of any subsidiary of the Bank holding title to assets covered under the loss sharing agreements without the prior written consent of the FDIC. An assignment would include (i) the merger or consolidation of the Bank with or into another bank, if we will own less than 66.66% of the equity of the resulting bank; (ii) our merger or consolidation with or into another company, if our shareholders will own less than 66.66% of the
equity of the resulting company; (iii) the sale of all or substantially all of the assets of the Bank to another company or person; or (iv) a sale of shares by any one or more shareholders of the Company or the Bank that would effect a change in control of the Bank. The Bank’s rights under the loss sharing agreements will terminate if any assignment of the loss sharing agreements occurs without the prior written consent of the FDIC.
Our failure to comply with the terms of the loss share agreements or to properly service the loans and bank owned real estate under the requirements of the loss share agreements may cause individual loans or large pools of loans to lose eligibility for loss share payments from the FDIC. This could result in material losses that are currently not anticipated.
We may have difficulties integrating Beach First’s operations into our own or may fail to realize the anticipated benefits of the acquisition. Our acquisition of Beach First involves the integration of certain operations that have previously operated independently of the Company. Successful integration of Beach First’s operations will depend primarily on our ability to consolidate Beach First’s operations, systems and procedures into those of ours to eliminate redundancies and costs. We may not be able to integrate the operations without encountering difficulties, including, without limitation:
|
•
|
the loss of key employees and customers;
|
|
•
|
possible inconsistencies in standards, control procedures and policies; and
|
|
•
|
unexpected problems with costs, operations, personnel, technology or credit.
|
In addition, any enhanced earnings or cost savings that we expect to result from the acquisition, including by reducing costs, improving efficiencies, and cross-marketing, may not be fully realized or may take longer to be realized than expected.
16
We rely on dividends from the Bank for most of our revenue. The Company is a separate and distinct legal entity from the Bank. The Company receives substantially all of its revenue from dividends received from the Bank. These dividends are the principal source of funds to pay dividends on our common and preferred stock, and interest and principal on our outstanding debt securities. Various federal and state laws and regulations limit the amount of dividends that the Bank may pay to the Company. In the event the Bank is unable to pay dividends to the Company, the Company may not be able to service debt, pay obligations, or pay dividends on its common stock. The inability to receive dividends from the Bank could have a material adverse effect
on the Company’s business, financial condition and results of operations.
The Bank is exposed to risks in connection with the loans it makes. A significant source of risk for us and the Bank arises from the possibility that losses will be sustained by the Bank because borrowers, guarantors and related parties may fail to perform in accordance with the terms of their loans. The Bank has underwriting and credit monitoring procedures and credit policies, including the establishment and review of the allowance for loan losses, that it believes are appropriate to minimize this risk by assessing the likelihood of nonperformance, tracking loan performance and diversifying its loan portfolio. Such policies and procedures, however, may not prevent unexpected losses that could adversely affect the Bank’s results of
operations.
If our nonperforming assets increase, our earnings will suffer. At December 31, 2010, our nonperforming assets (which consist of non-accruing loans, loans 90+ days delinquent, and foreclosed real estate assets) totaled $135.3 million, or 6.29% of total assets, which is an increase of $101.9 million over nonperforming assets at December 31, 2009. The majority of this increase was from the nonperforming assets that were acquired from our acquisition of Beach First. At December 31, 2008, our nonperforming assets were $18.3 million, or 1.17% of total assets. Our nonperforming assets adversely affect our net income in various ways. We do not record interest income on nonaccrual loans or real estate owned. We must reserve for probable
losses, which is established through a current period charge to the provision for loan losses as well as from time to time, as appropriate, the write down the value of properties in our other real estate owned portfolio to reflect changing market values. Additionally, there are legal fees associated with the resolution of problem assets as well as carrying costs such as taxes, insurance and maintenance related to our other real estate owned. Further, the resolution of non-performing assets requires the active involvement of management, which can distract them from more profitable activity. Finally, if our estimate for the recorded allowance for loan losses proves to be incorrect and our allowance is inadequate, we will have to increase the allowance accordingly.
Our loan portfolio includes loans with a higher risk of loss. We originate commercial real estate loans, construction and development loans, consumer loans, and residential mortgage loans primarily within our market area. Commercial real estate, commercial, and construction and development loans tend to involve larger loan balances to a single borrower or groups of related borrowers and are most susceptible to a risk of loss during a downturn in the business cycle. These loans also have historically had greater credit risk than other loans for the following reasons:
|
|
•
|
Real Estate Loans. Repayment is dependent on income being generated in amounts sufficient to cover operating expenses and debt service. These loans also involve greater risk because they are generally not fully amortizing over a loan period, but rather have a balloon payment due at maturity. A borrower’s ability to make a balloon payment typically will depend on being able to either refinance the loan or timely sell the underlying property. As of December 31, 2010, commercial and residential real estate loans comprised approximately 44.9% and 26.7%, respectively, of our total loan portfolio.
|
|
|
•
|
Commercial and Industrial Loans. Repayment is generally dependent upon the successful operation of the borrower’s business. In addition, the collateral securing the loans may depreciate over time, be difficult to appraise, be illiquid, or fluctuate in value based on the success of the business. As of December 31, 2010, commercial and industrial loans comprised approximately 9.1% of our total loan portfolio.
|
|
|
•
|
Construction and Development Loans. The risk of loss is largely dependent on our initial estimate of whether the property’s value at completion equals or exceeds the cost of property construction and the availability of take-out financing. During the construction phase, a number of factors can result in delays or cost overruns. If our estimate is inaccurate or if actual construction costs exceed estimates, the value of the property securing our loan may be insufficient to ensure full repayment when completed through a permanent loan, sale of the property, or by seizure of collateral. As of December 31, 2010, commercial and residential construction and development loans comprised approximately 17.6% of our total loan portfolio.
|
17
|
|
•
|
Consumer Loans. Consumer loans (such as personal lines of credit) are collateralized, if at all, with assets that may not provide an adequate source of payment of the loan due to depreciation, damage, or loss. As of December 31, 2010, consumer loans comprised approximately 1.0% of our total loan portfolio.
|
Our allowance for loan losses may be insufficient. All borrowers carry the potential to default and our remedies to recover (seizure and/or sale of collateral, legal actions, guarantees, etc.) may not fully satisfy money previously lent. We maintain an allowance for loan losses, which is a reserve established through a provision for loan losses charged to expense, which represents management’s best estimate of probable credit losses that have been incurred within the existing portfolio of loans. The allowance, in the judgment of management, is necessary to reserve for estimated loan losses and risks inherent in the loan portfolio. The level of the allowance for loan losses reflects management’s continuing evaluation of industry
concentrations; specific credit risks; loan loss experience; current loan portfolio quality; present economic, political, and regulatory conditions; and unidentified losses inherent in the current loan portfolio. The determination of the appropriate level of the allowance for loan losses inherently involves a high degree of subjectivity and requires us to make significant estimates of current credit risks using existing qualitative and quantitative information, all of which may undergo material changes. Changes in economic conditions affecting borrowers, new information regarding existing loans, identification of additional problem loans, and other factors, both within and outside of our control, may require an increase in the allowance for loan losses. In addition, bank regulatory agencies periodically review our allowance for loan losses and may require an increase in the provision for loan losses or the recognition of additional loan charge-offs, based on judgments different than
those of management. An increase in the allowance for loan losses results in a decrease in net income, and possibly risk-based capital, and may have a material adverse effect on our financial condition and results of operations.
We may need additional capital resources in the future and these capital resources may not be available on acceptable terms or at all. We may need to incur additional debt or equity financing in the future to make strategic acquisitions or investments, for future growth, to fund losses or additional provisions for loan losses in the future, or to maintain certain capital levels in accordance with banking regulations. Such financing may not be available to us on acceptable terms or at all. Our ability to raise additional capital may also be restricted by the Loss Share Agreements we entered into with the FDIC if the capital raise would effect a change in control of the Bank.
Further, in the event that we offer additional shares of our common stock in the future, our articles of incorporation do not provide shareholders with preemptive rights and such shares may be offered to investors other than our existing shareholders for prices at or below the then current market price of our common stock, all at the discretion of the Board. If we do sell additional shares of common stock to raise capital, the sale could reduce market price per share of common stock and dilute your ownership interest and such dilution could be substantial.
Because we engage in lending secured by real estate and may be forced to foreclose on the collateral property and own the underlying real estate, we may be subject to the increased costs associated with the ownership of real property, which could result in reduced net income. Since we originate loans secured by real estate, we may have to foreclose on the collateral property to protect our investment and may thereafter own and operate such property, in which case we are exposed to the risks inherent in the ownership of real estate.
The amount that we, as a mortgagee, may realize after a default is dependent upon factors outside of our control, including, but not limited to:
|
|
•
|
general or local economic conditions;
|
|
|
•
|
environmental cleanup liability;
|
|
|
•
|
neighborhood values;
|
|
|
•
|
interest rates;
|
|
|
•
|
real estate tax rates;
|
|
|
•
|
operating expenses of the mortgaged properties;
|
|
|
•
|
supply of and demand for rental units or properties;
|
|
|
•
|
ability to obtain and maintain adequate occupancy of the properties;
|
18
|
|
•
|
zoning laws;
|
|
|
•
|
governmental rules, regulations and fiscal policies; and
|
|
|
•
|
acts of God.
|
Certain expenditures associated with the ownership of real estate, principally real estate taxes and maintenance costs, may adversely affect the income from the real estate. Therefore, the cost of operating real property may exceed the rental income earned from such property, and we may have to advance funds in order to protect our investment or we may be required to dispose of the real property at a loss.
Liquidity risk could impair our ability to fund operations and jeopardize our financial condition. Liquidity is essential to our business. An inability to raise funds through deposits, borrowings, and other sources, could have a substantial negative effect on our liquidity. Our access to funding sources in amounts adequate to finance our activities on terms that are acceptable to us could be impaired by factors that affect us specifically or the financial services industry or economy in general. Factors that could negatively impact our access to liquidity sources include a decrease in the level of our business activity as a result of an economic downturn in the markets in which our loans are concentrated, adverse regulatory action against
us, or our inability to attract and retain deposits. Our ability to borrow could be impaired by factors that are not specific to us or our region, such a disruption in the financial markets or negative views and expectations about the prospects for the financial services industry in light of recent turmoil faced by banking organizations and the unstable credit markets.
Consumers may decide not to use banks to complete their financial transactions, which could limit our revenue. Technology and other changes are allowing parties to complete financial transactions through alternative methods that historically have involved banks. For example, consumers can now maintain funds in brokerage accounts or mutual funds that would have historically been held as bank deposits. Consumers can also complete transactions such as paying bills and/or transferring funds directly without the assistance of banks through the use of various electronic payment systems. The process of eliminating banks as intermediaries could result in the loss of fee income, as well as the loss of customer deposits and the related income
generated from those deposits. The loss of these revenue streams and the lower cost deposits as a source of funds could have a material adverse effect on our financial condition and results of operation.
We continue to hold and acquire a significant amount of other real estate, which has led to increased operating expenses and vulnerability to additional declines in real property values. We foreclose on and take title to the real estate serving as collateral for many of our loans as part of our business. Real estate owned by the Bank and not used in the ordinary course of its operations is referred to as “other real estate” or “ORE” property. At December 31, 2010, we had ORE with an aggregate book value of $39.7 million, compared to $14.3 million at December 31, 2009, an increase of $25.4 million. Of this increase, $15.8 million is covered under loss share agreements. Increased ORE balances have led to
greater expenses as we incur costs to manage and dispose of the properties. We expect that our earnings will continue to be negatively affected by various expenses associated with ORE, including personnel costs, insurance and taxes, completion and repair costs, valuation adjustments and other expenses associated with property ownership, as well as by the funding costs associated with assets that are tied up in ORE. Any further decrease in real estate market prices may lead to additional ORE write-downs, with a corresponding expense in our statement of operations.
We are in the process of improving our policies and procedures relating to the administration of both performing and non-performing loans, however, this process is not currently complete. The administration of loans is an important function in attempting to mitigate any future losses related to our non-performing assets. We are currently in the process of improving and centralizing our credit administration function. While we are making efforts to complete this process in a timely manner, we can give you no assurances that we will be able to successfully update and improve our credit administration policies and procedures. If we are unable to do so in a timely manner or at all, our loan losses could increase and this could have a material
adverse effect on our results of operations and the value of, or market for, our common stock.
Loss of key personnel could adversely impact results. The success of the Bank has been and will continue to be greatly influenced by the ability to retain the services of existing senior management. The Bank has benefited from consistency within its senior management team, with its top five executives averaging over 16 years of service with the Bank. The Company has entered into employment contracts with each of these top management officials. Nevertheless, the unexpected loss of the services of any of the key management personnel, or the inability to recruit and retain qualified personnel in the future, could have an adverse impact on the business and financial results of the Bank.
19
Changes in interest rates affect profitability and assets. Changes in prevailing interest rates may hurt the Bank’s business. The Bank derives its income primarily from the difference or “spread” between the interest earned on loans, securities and other interest earning assets, and interest paid on deposits, borrowings and other interest-bearing liabilities. In general, the larger the spread, the more the Bank earns. When market rates of interest change, the interest the Bank receives on its assets and the interest the Bank pays on its liabilities will fluctuate. This can cause decreases in the “spread” and can adversely affect the Bank’s income. Changes in
market interest rates could reduce the value of the Bank’s financial assets. Fixed-rate investments, mortgage-backed and related securities and mortgage loans generally decrease in value as interest rates rise. In addition, interest rates affect how much money the Bank lends. For example, when interest rates rise, the cost of borrowing increases and the loan originations tend to decrease. If the Bank is unsuccessful in managing the effects of changes in interest rates, the financial condition and results of operations could suffer.
We may face increasing deposit-pricing pressures, which may, among other things, reduce our profitability. Checking and savings account balances and other forms of deposits can decrease when our deposit customers perceive alternative investments, such as the stock market or other non-depository investments, as providing superior expected returns or seek to spread their deposits over several banks to maximize FDIC insurance coverage. Furthermore, technology and other changes have made it more convenient for bank customers to transfer funds into alternative investments, including products offered by other financial institutions or non-bank service providers. Additional increases in short-term interest rates could increase transfers of
deposits to higher yielding deposits. Efforts and initiatives we undertake to retain and increase deposits, including deposit pricing, can increase our costs. When bank customers move money out of bank deposits in favor of alternative investments or into higher yielding deposits, or spread their accounts over several banks, we can lose a relatively inexpensive source of funds, thus increasing our funding costs.
The Company and the Bank compete with much larger companies for some of the same business. The banking and financial services business in our market areas continues to be a competitive field and it is becoming more competitive as a result of:
|
|
•
|
changes in regulations;
|
|
|
•
|
changes in technology and product delivery systems; and
|
|
|
•
|
the accelerating pace of consolidation among financial services providers.
|
We may not be able to compete effectively in our markets, and our results of operations could be adversely affected by the nature or pace of change in competition. We compete for loans, deposits and customers with various bank and nonbank financial services providers, many of which are much larger in total assets and capitalization, have greater access to capital markets and offer a broader array of financial services.
Negative publicity could damage our reputation. Reputation risk, or the risk to our earnings and capital from negative public opinion, is inherent in our business. Negative public opinion could adversely affect our ability to keep and attract customers and expose us to adverse legal and regulatory consequences. Negative public opinion could result from our actual or alleged conduct in any number of activities, including lending practices, corporate governance, regulatory compliance, mergers and acquisitions, and disclosure, sharing or inadequate protection of customer information, and from actions taken by government regulators and community organizations in response to that conduct.
The Company is subject to environmental liability risk associated with lending activities. A significant portion of the Bank’s loan portfolio is secured by real property. During the ordinary course of business, the Bank may foreclose on and take title to properties securing certain loans. In doing so, there is a risk that hazardous or toxic substances could be found on these properties. If hazardous or toxic substances are found, the Bank may be liable for remediation costs, as well as for personal injury and property damage. Environmental laws may require the Bank to incur substantial expenses and may materially reduce the affected property’s value or limit the Bank’s
ability to use or sell the affected property. In addition, future laws or more stringent interpretations of enforcement policies with respect to existing laws may increase the Bank’s exposure to environmental liability. Although the Bank has policies and procedures to perform an environmental review before initiating any foreclosure action on real property, these reviews may not be sufficient to detect all potential environmental hazards. The remediation costs and any other financial liabilities associated with an environmental hazard could have a material adverse effect on the Company’s financial condition and results of operations.
20
Financial services companies depend on the accuracy and completeness of information about customers and counterparties. In deciding whether to extend credit or enter into other transactions, we may rely on information furnished by or on behalf of customers and counterparties, including financial statements, credit reports, and other financial information. We may also rely on representations of those customers, counterparties, or other third parties, such as independent auditors, as to the accuracy and completeness of that information. Reliance on inaccurate or misleading financial statements, credit reports, or other financial information could cause us to enter into unfavorable transactions,
which could have a material adverse effect on our financial condition and results of operations.
Changes in our accounting policies or in accounting standards could materially affect how we report our financial results and condition. Our accounting policies are fundamental to understanding our financial results and condition. Some of these policies require use of estimates and assumptions that may affect the value of our assets or liabilities and financial results. Some of our accounting policies are critical because they require management to make difficult, subjective and complex judgments about matters that are inherently uncertain and because it is likely that materially different amounts would be reported under different conditions or using different assumptions.
From time to time the Financial Accounting Standards Board (FASB) and the SEC change the financial accounting and reporting standards or the interpretation of those standards that govern the preparation of our external financial statements. These changes are beyond our control, can be hard to predict and could materially impact how we report our results of operations and financial condition. We could be required to apply a new or revised standard retroactively, resulting in our restating prior period financial statements in material amounts.
Impairment of investment securities, goodwill, other intangible assets, or deferred tax assets could require charges to earnings, which could result in a negative impact on our results of operations. In assessing the impairment of investment securities, management considers the length of time and extent to which the fair value has been less than cost, the financial condition and near-term prospects of the issuers, and the intent and ability of the Company to retain its investment in the issuer for a period of time sufficient to allow for any anticipated recovery in fair value in the near term. Under current accounting standards, goodwill and certain other intangible assets with indeterminate
lives are no longer amortized but, instead, are assessed for impairment periodically or when impairment indicators are present. Assessment of goodwill and such other intangible assets could result in circumstances where the applicable intangible asset is deemed to be impaired for accounting purposes. Under such circumstances, the intangible asset’s impairment would be reflected as a charge to earnings in the period during which such impairment is identified. In assessing the realizability of deferred tax assets, management considers whether it is more likely than not that some portion or all of the deferred tax assets will not be realized. The ultimate realization of deferred tax assets is dependent upon the generation of future taxable income during the periods in which those temporary differences become deductible. The impact of each of these impairment matters could have a material adverse effect on our business, results of operations, and financial condition.
We rely on other companies to provide key components of our business infrastructure. Third party vendors provide key components of our business infrastructure such as internet connections, network access and core application processing. While we have selected these third party vendors carefully, we do not control their actions. Any problems caused by these third parties, including as a result of their not providing us their services for any reason or their performing their services poorly, could adversely affect our ability to deliver products and services to our customers and otherwise to conduct our business. Replacing these third party vendors could also entail significant delay and
expense.
Our information systems may experience an interruption or breach in security. We rely heavily on communications and information systems to conduct our business. Any failure, interruption, or breach in security or operational integrity of these systems could result in failures or disruptions in our customer relationship management, general ledger, deposit, loan, and other systems. While we have policies and procedures designed to prevent or limit the effect of the failure, interruption, or security breach of our information systems, we cannot assure you that any such failures, interruptions, or security breaches will not occur or, if they do occur, that they will be adequately addressed. The
occurrence of any failures, interruptions, or security breaches of our information systems could damage our reputation, result in a loss of customer business, subject us to additional regulatory scrutiny, or expose us to civil litigation and possible financial liability, any of which could have a material adverse effect on our financial condition and results of operations.
21
Government regulations may prevent or impair the Company’s ability to pay dividends, engage in mergers or operate in other ways. Current and future legislation and the policies established by federal and state regulatory authorities will affect our operations. The Bank is subject to supervision and periodic examination by the FDIC and the Commissioner. The Company is subject to regulation by the Federal Reserve and the Commissioner. Banking regulations, designed primarily for the protection of depositors, may limit the growth and the return to the Company’s stockholders by restricting certain activities, such as:
|
|
•
|
the payment of dividends to our stockholders;
|
|
|
•
|
possible mergers with or acquisitions of or by other institutions;
|
|
|
•
|
our desired investments;
|
|
|
•
|
loans and interest rates on loans;
|
|
|
•
|
interest rates paid on our deposits;
|
|
|
•
|
the possible expansion of our branch offices; and
|
|
|
•
|
our ability to provide securities or trust services.
|
The Bank also is subject to capitalization guidelines set forth in federal legislation, and could be subject to enforcement actions to the extent that it is found by regulatory examiners to be undercapitalized. The Company cannot predict what changes, if any, will be made to existing federal and state legislation and regulations or the effect that such changes may have on the Company’s future business and earnings prospects. The cost of compliance with regulatory requirements may adversely affect our ability to operate profitably.
Acquisitions may disrupt our business and dilute shareholder value. We regularly evaluate merger and acquisition opportunities and conduct due diligence activities related to possible transactions with other financial institutions and financial services companies. As a result, negotiations may take place and future mergers or acquisitions involving cash, debt, or equity securities may occur at any time. We seek merger or acquisition partners that are culturally similar, have experienced management, and possess either significant market presence or have potential for improved profitability through financial management, economies of scale, or expanded services.
Acquiring other banks, businesses, or branches involves potential adverse impact to our financial results and various other risks commonly associated with acquisitions, including, among other things:
|
|
•
|
difficulty in estimating the value of the target company;
|
|
|
•
|
payment of a premium over book and market values that may dilute our tangible book value and earnings per share in the short and long term;
|
|
|
•
|
potential exposure to unknown or contingent liabilities of the target company;
|
|
|
•
|
exposure to potential asset quality issues of the target company;
|
|
|
•
|
there may be volatility in reported income as goodwill impairment losses could occur irregularly and in varying amounts;
|
|
|
•
|
difficulty and expense of integrating the operations and personnel of the target company;
|
|
|
•
|
inability to realize the expected revenue increases, cost savings, increases in geographic or product presence, and/or other projected benefits;
|
|
|
•
|
potential disruption to our business;
|
|
|
•
|
potential diversion of our management’s time and attention;
|
|
|
•
|
the possible loss of key employees and customers of the target company; and
|
|
|
•
|
potential changes in banking or tax laws or regulations that may affect the target company.
|
Risks Related to our Common Stock
Our stock price can be volatile. Stock price volatility may make it more difficult for you to resell your common stock when you want and at prices you find attractive. Our stock price can fluctuate significantly in response to a variety of factors including, among other things:
|
|
•
|
actual or anticipated variations in quarterly results of operations;
|
|
|
•
|
recommendations by securities analysts;
|
22
|
|
•
|
operating results and stock price performance of other companies that investors deem comparable to us;
|
|
|
•
|
news reports relating to trends, concerns, and other issues in the financial services industry;
|
|
|
•
|
perceptions in the marketplace regarding us and/or our competitors;
|
|
|
•
|
new technology used or services offered by competitors;
|
|
|
•
|
significant acquisitions or business combinations, strategic partnerships, joint ventures, or capital commitments by or involving us or our competitors; and
|
|
|
•
|
changes in government regulations.
|
Our trading volume has been low compared with larger national and regional banks. Our common stock is traded on the NASDAQ Capital Market. However, the trading volume of our common stock is relatively low when compared with more seasoned companies listed on the NASDAQ Capital Market, NASDAQ Global Select Market, or other consolidated reporting systems or stock exchanges. Thus, the market in our common stock may be limited in scope relative to other larger companies. In addition, we cannot say with any certainty that a more active and liquid trading market for its common stock will develop.
We have issued Series A Preferred Stock and subordinated debentures, and the Bank has issued subordinated debt securities, all of which rank senior to our common stock. We have issued 31,260 shares of Series A Preferred Stock. This series of preferred stock ranks senior to shares of the Series B Preferred Stock and the common stock. As a result, we must make dividend payments on our Series A Preferred Stock before any dividends can be paid on our Series B Preferred Stock or our common stock and, in the event of our bankruptcy, dissolution or liquidation, the holders of our Series A Preferred Stock must be satisfied before any distributions can be made on our Series B Preferred Stock or our common stock. If we do not remain
current in the payment of dividends on the Series A Preferred Stock, no dividends may be paid on our Series B Preferred Stock or our common stock. In addition, we have issued $23.7 million in subordinated debentures in connection with its issuance of trust preferred securities, and the Bank has issued $8.0 million in subordinated debt securities. These debentures and debt securities also rank senior to our common stock.
We have also issued Series B Preferred Stock, which carries liquidation rights senior to our common stock. We have issued 1,804,566 shares of Series B Preferred Stock to Aquiline. This series of preferred stock ranks junior, with regard to dividends, to the Series A Preferred Stock, and will receive such dividends and other distributions as declared and paid by us to all holders of common stock, on an as-converted basis. The Series B Preferred Stock should have the same priority, with regard to dividends, as our common stock. However, in the event of our liquidation, dissolution or winding-up of affairs, after payment or provision for payment of our debts and other liabilities, holders of the Series B Preferred Stock will be entitled to
receive, out of our assets after any payment required to be made to any holders of the Series A Preferred Stock and any other series of preferred stock that we issued from time to time unless so designated in such series of preferred stock, (i) $0.01 per share, (ii) the amount that a holder of shares of our common stock would be entitled to receive (based on each share of Series B Preferred Stock being converted into one share of common stock immediately prior to the liquidation, dissolution or winding up, assuming such shares of common stock were outstanding) and (iii) an amount equal to all declared and unpaid dividends for prior dividend periods, before any distribution shall be made to holders of the common stock or any other class of stock or series thereof ranking junior to the Series B Preferred Stock with respect to the distribution of assets.
Our Series A Preferred Stock reduces net income available to holders of our common stock and earnings per common share, and the Warrant and Series B Preferred Stock may be dilutive to holders of our common stock. The dividends declared on our Series A Preferred Stock will reduce any net income available to holders of common stock and our earnings per common share. Our Series A Preferred Stock will also receive preferential treatment in the event of sale, merger, liquidation, dissolution or winding up of our company, and our Series B Preferred Stock will receive preferential treatment in the event of liquidation, dissolution or winding up of our company. Additionally, the ownership interest of holders of our common stock will be diluted to
the extent the Warrant is exercised or the Series B Preferred Stock is converted.
Our common stock is not FDIC insured. The Company’s common stock is not a savings or deposit account or other obligation of any bank and is not insured by the FDIC or any other governmental agency and is subject to investment risk, including the possible loss of principal. Investment in our common stock is inherently risky for the reasons described in this “Risk Factors” section and elsewhere in this report and is subject to the same market forces that affect the price of common stock in any company. As a result, holders of our common stock may lose some or all of their investment.
23
We may reduce or eliminate dividends on our common stock. Although we have historically paid a quarterly cash dividend to the holders of our common stock, holders of our common stock are not entitled to receive dividends. Downturns in the domestic and global economies could cause our board of directors to consider, among other things, reducing or eliminating of dividends paid on our common stock. This could adversely affect the market price of our common stock. Because of our agreements with the UST as part of the CPP under the TARP, prior to December 5, 2011, or the date on which the UST’s senior preferred stock investment has been fully redeemed or transferred, if earlier, we may not pay quarterly dividends on our common
stock greater than $0.05 per share without the UST’s consent. In addition, we may not pay dividends on our common stock unless all accrued and unpaid dividends for all past dividend periods are fully paid on our outstanding preferred stock issued to the UST. Furthermore, as a bank holding company, our ability to pay dividends is subject to the guidelines of the Federal Reserve regarding capital adequacy and dividends before declaring or paying any dividends. Dividends also may be limited as a result of safety and soundness considerations.
There may be future sales of additional common stock or preferred stock or other dilution of our equity, which may adversely affect the market price of our common stock. The Company is not restricted from issuing additional common stock or preferred stock, including any securities that are convertible into or exchangeable for, or that represent the right to receive, common stock or preferred stock or any substantially similar securities. The market value of the Company’s common stock could decline as a result of sales by us of a large number of shares of common stock or preferred stock or similar securities in the market or the perception that such sales could occur.
There may be future issuances of additional subordinated debentures, which may adversely affect the market price of our common stock. The Company may issue additional subordinated debentures in connection with the issuance of additional trust preferred securities. Such additional debentures would rank senior to the Company’s common stock. The market value of the Company’s common stock could decline as a result of future issuances or the perception that such issuances could occur.
Our articles of incorporation, as amended, amended and restated bylaws, and certain banking laws may have an anti-takeover effect. Provisions of our articles of incorporation and bylaws, as amended, and federal banking laws, including regulatory approval requirements, could make it more difficult for a third party to acquire us, even if doing so would be perceived to be beneficial to our shareholders. The combination of these provisions may prohibit a non-negotiated merger or other business combination, which, in turn, could adversely affect the market price of our common stock.
ITEM 1B. UNRESOLVED STAFF COMMENTS
None.
ITEM 2. PROPERTIES
At December 31, 2010, the Company conducted its business from its headquarters located in High Point, North Carolina, the Bank’s main office in Thomasville and 17 other branch offices and one limited services office in North Carolina and six branch offices in South Carolina. The following list sets forth certain information regarding the Company’s and Bank’s properties.
|
|
Owned properties:
|
Main Office: 831 Julian Avenue, Thomasville, NC 27360.
Archdale Branch Office: 113 Trindale Road, Archdale, NC 27263.
Lexington Branch Office: 115 East Center Street, Lexington, NC 27292.
North Thomasville Branch Office: 1317 National Highway, Thomasville, NC 27360.
Kernersville Branch Office: 211 Broad Street, Kernersville, NC 27284.
Oak Ridge Branch Office: 8000 Linville Road, Oak Ridge, NC 27310.
Elm Street Branch Office: 801 North Elm Street, High Point, NC 27262.
Eastchester Branch Office: 2630 Eastchester Dr., High Point, NC 27265.
Salisbury Branch Office: 415 Jake Alexander Boulevard West, Salisbury, NC 28147.
Harrisburg Branch Office: 3890 Main Street, Harrisburg, NC 28075.
N. Davidson Branch Office: 6355 Old US Hwy 52, Lexington, NC 27295.
Concord Branch Office: 271 Copperfield Blvd., NE Concord, NC 28025
24
Raleigh Branch Office: 4525 Falls of Neuse Road, Raleigh, NC 27609
Leased properties:
High Point Administrative Offices: 1224/1226 Eastchester Drive, High Point, NC 27265.
Friendly Center Branch Office: 3202 Northline Avenue, Greensboro, NC 27408.
Dover Road Branch Office: 1110 Dover Road, Greensboro, NC 27408.
Elm Street Branch Office: 112 N. Elm Street, Greensboro, NC 27404.
Winston Salem Branch Office: 1810 N. Peace Haven Road, Winston-Salem, NC 27104
Mooresville Limited Service Office: 125 Commerce Park Road, Mooresville, NC 28117
Charlotte Office: 5970 Fairview Road, Charlotte, NC 28210
Myrtle Beach Office: 3751 Robert M. Grissom Parkway, Myrtle Beach, SC 29577
North Myrtle Beach Office: 710 Highway 17 North, North Myrtle Beach, SC 29582
Surfside Beach Office: 3064 Dick Pond Road, Myrtle Beach, SC 29588
Litchfield Office: 115 Willbrook Blvd, Pawleys Island, SC 29585
Pineland Station Office: 430 William Hilton Pkwy, Hilton Head, SC 29926
The Village at Wexford Office: 1000 William Hilton Pkwy, Hilton Head, SC 29928
The total net book value of the Company’s premises and equipment on December 31, 2010 was $30.6 million. All properties are considered by the Company’s management to be in good condition and adequately covered by insurance.
Any property acquired as a result of foreclosure or by deed in lieu of foreclosure is classified as “real estate owned” until it is sold or otherwise disposed of by the Company to recover its investment. As of December 31, 2010, the Company had $39.7 million of assets classified as real estate owned.
|
ITEM 3.
|
LEGAL PROCEEDINGS
|
In the opinion of management, the Company is not involved in any material pending legal proceeding.
|
ITEM 4.
|
[REMOVED AND RESERVED]
|
PART II
|
ITEM 5.
|
MARKET FOR REGISTRANT’S COMMON EQUITY, RELATED STOCK HOLDER MATTERS AND ISSUER PURCHASES OF EQUITY SECURITIES
|
The Company’s common stock is traded on the NASDAQ Capital Market under the symbol “BNCN”. Scott & Stringfellow, Inc., Morgan Keegan, Sandler O’Neill & Partners, L.P., Raymond James & Associates, Howe Barnes, McKinnon and Company, and Monroe Securities are the market makers in the Company’s stock. Wachovia Securities is not a market maker; however, they do attempt to match-up buyers and sellers through their local offices.
See Table 21 for certain market and dividend information for the last two fiscal years.
As of March 11, 2011, the Company had approximately 1,333 shareholders of record not including persons or entities whose stock is held in nominee or “street” name and by various banks and brokerage firms.
See “Item 1. Business — Supervision and Regulation – Dividend and Repurchase Limitations” above for regulatory restrictions which limit the ability of the Bank to pay dividends. The Company has paid seven annual cash dividends, with the most recent being a cash dividends of $0.20 per share of common stock on February 22, 2008. In 2009, the Company began paying quarterly dividends, with the last being a cash dividend of $0.05 paid on February 25, 2011.
There were no purchases made by or on behalf of the Company or any “affiliated purchases” (as defined in Rule 10b-18(a)(3) under the Securities Exchange Act of 1934), of the Company’s common stock during the three months ended December 31, 2010. The maximum amount of shares that may be purchased in the stock repurchase program will be limited to 10% of the outstanding common stock. As of December 31, 2010, the maximum of stock able to be purchased by the Company amounted to 905,336 shares, with 247,904 shares repurchased. Because of the Company’s participation in the CPP, there are restrictions on the Company’s ability to repurchase its shares.
25
The information required to be disclosed under Item 201(d) of Regulation S-K is presented in Item 12 of this Form 10-K.
Performance Graph
The following graph compares the Company’s cumulative stockholder return on its Common Stock with a NASDAQ index and with a southeastern bank index. The graph was prepared by SNL Financial, LC using data as of December 31, 2010.
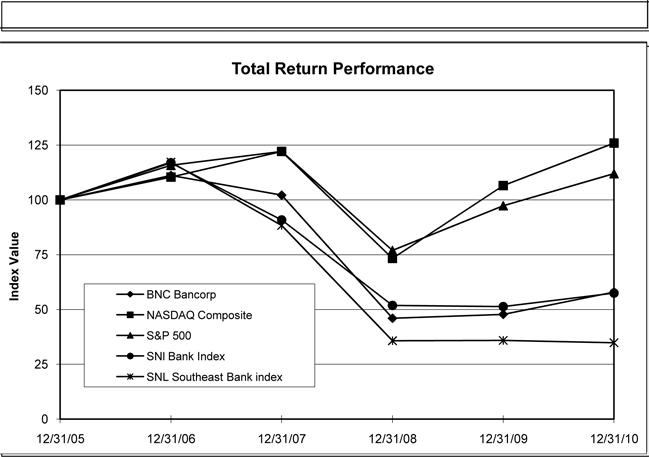
| Period Ending | ||||||||||||||||||||||||
|
Index
|
12/31/05
|
12/31/06
|
12/31/07
|
12/31/08
|
12/31/09
|
12/31/10
|
||||||||||||||||||
|
BNC Bancorp
|
100.00 | 111.21 | 102.19 | 45.99 | 47.78 | 57.97 | ||||||||||||||||||
|
NASDAQ Composite
|
100.00 | 110.39 | 122.15 | 73.32 | 106.57 | 125.91 | ||||||||||||||||||
|
S&P 500
|
100.00 | 115.79 | 122.16 | 76.96 | 97.33 | 111.99 | ||||||||||||||||||
|
SNl Bank Index
|
100.00 | 116.98 | 90.90 | 51.87 | 51.33 | 57.52 | ||||||||||||||||||
|
SNL Southeast Bank index
|
100.00 | 117.26 | 88.33 | 35.76 | 35.90 | 34.86 | ||||||||||||||||||
26
ITEM 6. SELECTED FINANCIAL DATA
SELECTED CONSOLIDATED FINANCIAL INFORMATION AND OTHER DATA
The following table sets forth our historical consolidated financial data and operating information for the periods indicated. The selected historical annual consolidated statement of operations and balance sheet data as of and for each of the five fiscal years presented are derived from our consolidated financial statements. Historical results are not necessarily indicative of the results to be expected in the future. You should read the following data together with “Item 1. Business,” “Item 7. Management’s Discussion and Analysis of Financial Condition and Results of Operations,” and our consolidated financial statements and the related notes appearing in “Item 8. Financial Statements and Supplementary Data.” (Dollars in
thousands, except share and per share data).
Table 1
Selected Consolidated Financial Information and Other Data
($ in thousands, except per share and nonfinancial data)
|
At or for the Year Ended December 31,
|
||||||||||||||||||||
|
2010
|
2009
|
2008
|
2007
|
2006
|
||||||||||||||||
|
Operating Data:
|
||||||||||||||||||||
|
Total interest income
|
$ | 95,010 | $ | 79,082 | $ | 71,034 | $ | 73,670 | $ | 53,211 | ||||||||||
|
Total interest expense
|
34,747 | 32,867 | 37,426 | 41,265 | 26,481 | |||||||||||||||
|
Net interest income
|
60,263 | 46,215 | 33,608 | 32,405 | 26,730 | |||||||||||||||
|
Provision for loan losses
|
26,382 | 15,750 | 7,075 | 3,090 | 2,655 | |||||||||||||||
|
Net interest income after provision for loan losses
|
33,881 | 30,465 | 26,533 | 29,315 | 24,075 | |||||||||||||||
|
Non-interest income
|
28,813 | 8,686 | 5,651 | 5,249 | 3,821 | |||||||||||||||
|
Non-interest expense
|
55,172 | 32,899 | 27,783 | 24,068 | 19,110 | |||||||||||||||
|
Income before income taxes
|
7,522 | 6,252 | 4,401 | 10,496 | 8,786 | |||||||||||||||
|
Income tax expense (benefit)
|
(204 | ) | (285 | ) | 414 | 3,058 | 2,616 | |||||||||||||
|
Net income
|
7,726 | 6,537 | 3,987 | 7,438 | 6,170 | |||||||||||||||
|
Less preferred stock dividends and discount accretion
|
2,196 | 1,984 | 142 | - | - | |||||||||||||||
|
Net income available to common shareholders
|
$ | 5,530 | $ | 4,553 | $ | 3,845 | $ | 7,438 | $ | 6,170 | ||||||||||
|
Per Common Share Data: (1)
|
||||||||||||||||||||
|
Basic earnings per share
|
$ | 0.62 | $ | 0.62 | $ | 0.53 | $ | 1.08 | $ | 1.09 | ||||||||||
|
Diluted earnings per share
|
0.61 | 0.62 | 0.52 | 1.05 | 1.04 | |||||||||||||||
|
Cash dividends paid
|
0.20 | 0.20 | 0.20 | 0.18 | 0.15 | |||||||||||||||
|
Book value
|
11.63 | 13.20 | 12.49 | 11.90 | 11.89 | |||||||||||||||
|
Tangible common book value (2)
|
8.49 | 9.43 | 8.69 | 8.02 | 7.23 | |||||||||||||||
|
Weighted average shares outstanding:
|
||||||||||||||||||||
|
Basic
|
9,262,369 | 7,340,015 | 7,322,723 | 6,865,204 | 5,658,196 | |||||||||||||||
|
Diluted
|
9,337,392 | 7,347,700 | 7,396,170 | 7,088,218 | 5,957,478 | |||||||||||||||
|
Year-end shares outstanding
|
9,053,360 | 7,341,901 | 7,350,029 | 7,257,532 | 6,709,007 | |||||||||||||||
|
Selected Year-End Balance Sheet Data:
|
||||||||||||||||||||
|
Total assets
|
$ | 2,149,932 | $ | 1,634,185 | $ | 1,572,876 | $ | 1,130,112 | $ | 951,731 | ||||||||||
|
Investment securities available for sale
|
352,871 | 360,506 | 416,564 | 86,683 | 76,700 | |||||||||||||||
|
Loans
|
1,508,180 | 1,079,179 | 1,007,788 | 932,562 | 774,664 | |||||||||||||||
|
Allowance for loan losses
|
24,813 | 17,309 | 13,210 | 11,784 | 10,400 | |||||||||||||||
|
Goodwill
|
26,129 | 26,129 | 26,129 | 26,129 | 26,129 | |||||||||||||||
|
Deposits
|
1,828,070 | 1,349,878 | 1,146,013 | 855,130 | 786,777 | |||||||||||||||
|
Short-term borrowings
|
60,207 | 50,283 | 194,143 | 80,928 | 4,673 | |||||||||||||||
|
Long-term debt
|
97,713 | 100,713 | 105,713 | 101,713 | 81,713 | |||||||||||||||
|
Shareholders' equity
|
152,224 | 126,206 | 120,680 | 86,392 | 72,523 | |||||||||||||||
27
Table 1
Selected Consolidated Financial Information and Other Data
($ in thousands, except per share and nonfinancial data)
|
At or for the Year Ended December 31,
|
||||||||||||||||||||
|
2010
|
2009
|
2008
|
2007
|
2006
|
||||||||||||||||
|
Selected Average Balances:
|
||||||||||||||||||||
|
Total assets
|
$ | 2,027,261 | $ | 1,617,744 | $ | 1,227,246 | $ | 1,041,018 | $ | 747,997 | ||||||||||
|
Investment securities available for sale
|
346,099 | 424,684 | 117,531 | 79,727 | 58,519 | |||||||||||||||
|
Loans, including loans held for sale
|
1,359,107 | 1,026,635 | 981,069 | 849,271 | 615,689 | |||||||||||||||
|
Total interest-earning assets
|
1,799,324 | 1,496,230 | 1,116,766 | 943,756 | 685,981 | |||||||||||||||
|
Deposits, interest-bearing
|
1,613,886 | 1,257,333 | 890,058 | 782,755 | 564,084 | |||||||||||||||
|
Total interest-bearing liabilities
|
1,765,391 | 1,418,935 | 1,063,171 | 891,695 | 643,325 | |||||||||||||||
|
Shareholders' Equity
|
149,959 | 123,641 | 86,858 | 76,065 | 48,949 | |||||||||||||||
|
Selected Performance Ratios:
|
||||||||||||||||||||
|
Return on average assets (3)
|
0.38 | % | 0.40 | % | 0.32 | % | 0.71 | % | 0.82 | % | ||||||||||
|
Return on average common equity (4)
|
4.98 | % | 4.81 | % | 4.54 | % | 9.78 | % | 12.60 | % | ||||||||||
|
Return on average tangible common equity (5)
|
6.70 | % | 6.82 | % | 6.79 | % | 15.58 | % | 15.86 | % | ||||||||||
|
Net interest margin (6)
|
3.65 | % | 3.39 | % | 3.17 | % | 3.60 | % | 4.08 | % | ||||||||||
|
Average equity to average assets
|
7.40 | % | 7.64 | % | 7.08 | % | 7.31 | % | 6.54 | % | ||||||||||
|
Efficiency ratio (7)
|
58.38 | % | 55.36 | % | 67.66 | % | 61.36 | % | 60.07 | % | ||||||||||
|
Dividend payout ratio
|
32.26 | % | 32.26 | % | 38.09 | % | 16.61 | % | 13.34 | % | ||||||||||
|
Asset Quality Ratios:
|
||||||||||||||||||||
|
Allowance for loan losses to period-end loans
|
1.65 | % | 1.60 | % | 1.31 | % | 1.26 | % | 1.34 | % | ||||||||||
|
Allowance for loan losses to nonperforming loans (8)
|
25.96 | % | 90.86 | % | 99.18 | % | 327.42 | % | 839.39 | % | ||||||||||
|
Nonperforming assets to total assets (9)
|
6.29 | % | 2.04 | % | 1.17 | % | 0.54 | % | 0.24 | % | ||||||||||
|
Net loan charge-offs to average loans
|
1.39 | % | 1.13 | % | 0.58 | % | 0.20 | % | 0.20 | % | ||||||||||
|
Capital Ratios: (10)
|
||||||||||||||||||||
|
Total risk-based capital
|
13.01 | % | 12.79 | % | 11.46 | % | 10.31 | % | 10.23 | % | ||||||||||
|
Tier 1 risk-based capital
|
11.19 | % | 10.87 | % | 9.60 | % | 8.26 | % | 8.00 | % | ||||||||||
|
Leverage ratio
|
7.42 | % | 8.32 | % | 8.44 | % | 7.40 | % | 7.40 | % | ||||||||||
|
Other Data:
|
||||||||||||||||||||
|
Number of full service banking offices
|
23 | 17 | 15 | 14 | 13 | |||||||||||||||
|
Number of limited service offices
|
1 | 1 | 1 | 1 | 1 | |||||||||||||||
|
Number of full time equivalent employees
|
358 | 249 | 221 | 218 | 196 | |||||||||||||||
|
(1)
|
All per share data has been restated to reflect the dilutive effect of a 10% stock dividend distributed on January 22, 2007.
|
|
(2)
|
Calculated by dividing common equity less intangibles by year-end shares outstanding. Intangibles include core deposit intangibles of $2.3 million, $1.6 million, $1.8 million, $2.1 million, and $2.3 million at December 31, 2010, 2009, 2008, 2007, and 2006, respectively.
|
|
(3)
|
Calculated by dividing net income by average assets.
|
|
(4)
|
Calculated by dividing net income available to common shareholders by average common equity.
|
|
(5)
|
Calculated by dividing net income available to common shareholders by average common equity less average intangibles.
|
|
(6)
|
Calculated by dividing tax equivalent net interest income by average interest-earning assets.
|
|
(7)
|
Calculated by dividing non-interest expense by the sum of tax-equivalent net interest income plus non-interest income. The tax-equivalent adjustment was $5.4 million, $4.5 million, $1.8 million, $1.6 million, and $1.3 million for the years ended December 31, 2010, 2009, 2008, 2007, and 2006 respectively.
|
|
(8)
|
Includes $69.3 million of nonperforming loans covered under loss share agreements at December 31, 2010.
|
|
(9)
|
Nonperforming assets consist of nonaccrual loans, restructured loans in nonaccrual, and real estate owned, where applicable.
|
|
(10)
|
Capital ratios are for the bank.
|
28
|
ITEM 7.
|
MANAGEMENT’S DISCUSSION AND ANALYSIS OF FINANCIAL CONDITION AND RESULTS OF OPERATIONS
|
Management's discussion and analysis is intended to assist readers in understanding and evaluating of the consolidated financial condition and results of operations of the Company. It should be read in conjunction with the audited consolidated financial statements and accompanying notes included in this annual report. Additional discussion and analysis related to fiscal 2010 is contained in our Quarterly Reports on Form 10-Q for the fiscal quarters ended March 31, 2010, June 30, 2010 and September 30, 2010, respectively.
FORWARD-LOOKING INFORMATION
Forward-looking statements appear in this Annual Report, including but not limited to Item 7, “Management’s Discussion and Analysis of Financial Condition and Results of Operations,” and in other written and oral statements made by or on behalf of us. These forward-looking statements include, but are not limited to, statements relating to our goals, strategies, expectations, competitive environment, general economic conditions, the impact of changes in financial services laws and regulations, the demand for products or services of the Company and the Bank, our ability to integrate and achieve expected synergies from acquired entities, future events and future financial performance. Such forward-looking statements are made pursuant to the safe harbor provisions
of the Private Securities Litigation Reform Act of 1995. These forward-looking statements typically can be identified by such words as “anticipate,” “estimate,” “forecast,” “project,” “intend,” “expect,” “believe,” “should,” “could,” “may,” or other similar words or expressions. We caution readers that such forward-looking statements involve risks and uncertainties that could cause actual events or results to differ materially from those expressed or implied herein, including, but not limited to, the risk factors detailed in this Annual Report.
Our forward-looking statements are based on our beliefs and assumptions using information available at the time the statements are made. We caution the reader not to place undue reliance on our forward-looking statements (i) as these statements are neither a prediction nor a guarantee of future events or circumstances and (ii) the assumption, beliefs, expectations and projections about future events may differ materially from actual results. We undertake no obligation to publicly update any forward-looking statement to reflect developments occurring after the statement is made.
The Company is a one-bank holding company incorporated under the laws of North Carolina to serve as the holding company for the Bank. The Company acquired all of the outstanding capital stock of the Bank on December 16, 2002. The Bank is a full service commercial bank that was incorporated under the laws of the State of North Carolina on November 15, 1991, and opened for business on December 3, 1991. In April 2010, the Bank acquired the assets and certain liabilities of Beach First in an FDIC assisted transaction. The Bank operates the six branches of Beach First, headquartered in Myrtle Beach, South Carolina, under the name BNC Bank. The Bank concentrates its marketing and banking efforts to serve the citizens and business interests of the cities and communities located in Davidson, Randolph, Rowan, Forsyth,
Guilford, Iredell and Cabarrus Counties in North Carolina and Horry, Georgetown and Beaufort Counties in South Carolina. The Bank has three subsidiaries: BNC Credit Corp. serves as the Bank’s trustee on deeds of trust and Sterling Real Estate Holdings, LLC and Sterling Real Estate Development of North Carolina, LLC hold and dispose of the Bank’s real estate owned. See “Part I, Item 1 — Business” for an overview of the business operations of the Company and the Bank.
EXECUTIVE SUMMARY
Net income for the year ended December 31, 2010 was $7.7 million compared to $6.5 million for the year ended December 31, 2009. Net income available to common shareholders for the year ended December 31, 2010 totaled $5.5 million, or $0.61 per diluted common share, as compared to $4.6 million, or $0.62 per diluted common share, for the year ended December 31, 2009. Preferred stock dividends and accretion of the discount on the Company’s preferred stock reduced net income available to common shareholders by $2.2 million ($0.24 per common share) and $2.0 million ($0.27 per common share) for the years ended December 31, 2010 and 2009, respectively.
The Company’s results of operations and financial condition were impacted by a number of significant events during 2010. The Company’s investment in people, facilities and technology over the past several years has allowed the Company to quickly integrate a major acquisition and successfully convert it to the Company’s processes and systems, and produce organic growth in both loans and deposits in excess of 10%. In addition to the gains in both loans and deposits, our positive operating trends in net interest margin, pre-credit operating earnings, and core capital levels were all positive operating trends in a year where national and local economies continued to experience significant weakness.
29
During April 2010, the Bank acquired certain assets and assumed certain liabilities of Beach First National Bank (“Beach First”) from the Federal Deposit Insurance Corporation (“FDIC”) in a FDIC-assisted transaction. Beach First was a full-service commercial bank headquartered in Myrtle Beach, South Carolina that operated seven branch locations in the Coastal South Carolina region. The Bank made this acquisition to enter into a new market outside the central North Carolina region and to allow the Bank to expand its geographic footprint. The loans and other real estate owned (“covered loans” or “covered assets”) acquired as part of the Purchase and Assumption Agreement, are covered by two loss share agreements between the FDIC and the Bank (one
for single family residential mortgage loans and the other for all other loans and other real estate owned), which affords the Bank significant loss protection.
The purchased assets and assumed liabilities were recorded at their respective acquisition date fair values, and identifiable intangible assets were recorded at fair value. Fair values are preliminary and subject to refinement for up to one year after the closing date of an acquisition as information relative to closing date fair values become available. A pre-tax gain totaling $19.3 million ($11.8 million tax-effected) resulted from the acquisition and is included as a component of non-interest income in the consolidated statement of income. The amount of the gain is equal to the amount by which the fair value of assets purchased exceeded the fair value of liabilities assumed. During the fourth quarter of 2010, adjustments were made to the gains based on additional information regarding the respective
acquisition date fair values. These adjustments were made retroactive to the acquisition date.
The statement of assets acquired and liabilities assumed from the Beach First acquisition are as follows:
|
(In thousands)
|
||||
|
Assets Acquired
|
||||
|
Cash and due from banks
|
$ | 61,112 | ||
|
Investment securities available for sale
|
59,961 | |||
|
Loans
|
348,842 | |||
|
FDIC indemnification asset
|
95,765 | |||
|
Other real estate owned
|
6,721 | |||
|
Core deposit intangible
|
1,118 | |||
|
Accrued interest receivable
|
2,717 | |||
|
Other assets
|
5,704 | |||
|
Total assets acquired
|
$ | 581,940 | ||
|
Liabilities Assumed
|
||||
|
Deposits
|
$ | 499,983 | ||
|
Borrowings
|
60,569 | |||
|
Deferred tax liability
|
7,436 | |||
|
Other liabilities
|
2,127 | |||
|
Total liabilities assumed
|
$ | 570,115 | ||
|
Net Assets Acquired
|
$ | 11,825 | ||
Total assets at December 31, 2010 were $2.15 billion, an increase of $515.7 million, or 31.6%, from $1.63 billion at December 31, 2009. The increase was primarily due to the acquisition mentioned above and organic growth of 12.1% in the legacy loan portfolio. Total deposits have increased $478.2 million, or 35.4%, to $1.83 billion. The Company was able to retain the majority of the Beach First deposits. Some highlights for 2010 are as follows:
|
|
·
|
Net income available to common shareholders increased 21.5% to $5.5 million
|
|
|
o
|
Pre-credit operating earnings increased 19.0%
|
|
|
·
|
Net interest income increased $14.0 million, or 30.4%
|
|
|
·
|
Total assets increased $515.7 million, or 31.6%
|
|
|
·
|
Net interest margin increased 26 basis points to 3.65%
|
30
|
|
·
|
Acquired and integrated Beach First through a loss-sharing FDIC transaction
|
|
|
·
|
Loans increased $429.0 million, or 39.8%
|
|
|
·
|
Loans not covered by loss share increased $130.4 million, or 12.1%
|
|
|
o
|
Non-covered loans, excluding construction related, increased $164.4 million
|
|
|
o
|
Construction and development loans declined by $34.0 million
|
|
|
·
|
Completed a $35 million capital raise
|
|
|
·
|
Completed a conversion of our core bank operating systems to a more robust software platform
|
|
|
·
|
Continued to build our Senior Management Team, with nine of the 13 members added in the last two years
|
|
|
·
|
New offices in Concord, Raleigh, Charlotte and Winston-Salem provided organic growth and strength
|
|
|
·
|
Allowance, as a percentage of non-covered loans, moved from 1.60% to 2.07%
|
|
|
·
|
NPAs on non-covered assets ended the year at 2.75%, still well below peers
|
|
|
·
|
Core deposits increased $619.2 million. $303.8 million was organic; $315.4 was acquired
|
|
|
·
|
Wholesale CDs declined to $262.6 million
|
|
|
o
|
Wholesale CDs represent 14.4% of total deposits, down from the high of 62.7% in late 2008
|
|
|
·
|
Core tangible book value, excluding the mark-to-market component, increased from $8.73 to $9.24 during 2010
|
The Company’s year-end results were also impacted by the continued economic slowdown in both the real estate sector and the general economy in our state and local communities. Weaknesses in residential development and rising unemployment levels in our market areas resulted in higher charge-offs and a higher allowance for loan losses in 2010 also impacted earnings. As a result of these difficult issues, the Company recorded a provision for loan losses of $26.4 million, which represents an increase of $10.6 million compared to 2009. The weak economy also impacted our allowance for loan losses, which increased to $24.8 million at December 31, 2010 from $17.3 million recorded at December 31, 2009. Nonperforming assets increased to $135.3 million at December 31, 2010
representing 6.29% of nonperforming assets to total assets, compared to $33.4 million at December 31, 2009 representing 2.04% of nonperforming assets to total assets. Nonperforming assets not covered by loss share agreements increased to $50.2 million, or 2.75% of total assets.
RESULTS OF OPERATIONS
Overview
The Company reported net income for the year ended December 31, 2010 of $7.7 million compared to $6.5 million for the year ended December 31, 2009. Net income available to common shareholders for the year ended December 31, 2010 totaled $5.5 million, or $0.61 per diluted common share, as compared to $4.6 million, or $0.62 per diluted common share, for the year ended December 31, 2009. Net interest income increased $14.0 million in 2010, while non-interest income increased $20.1 million. The increases in income were partially offset by the increases in the provision for loan losses and non-interest expenses in the amounts of $10.6 million and $22.3 million, respectively. Included in non-interest income was $19.3 million of gain from the Beach First
acquisition. Also reducing net income available to common shares for 2010 and 2009 were preferred stock dividends and accretion of the discount on the Company’s preferred stock, totaling $2.2 million and $2.0 million, respectively.
Net Interest Income
Like most financial institutions, the primary component of earnings for the Company is net interest income. Net interest income is the difference between interest income, principally from loan and investment securities portfolios, and interest expense, principally on customer deposits and borrowings. For internal analytical purposes, management adjusts net interest income to a “fully taxable-equivalent” basis (“(FTE)”) using a 34% federal tax rate on tax exempt items. Changes in net interest income result from changes in volume, spread and margin. For this purpose, “volume” refers to the average dollar level of interest-earning assets and interest-bearing liabilities, “spread” refers to the difference between the average
yield on interest-earning assets and the average cost of interest-bearing liabilities, and “margin” refers to net interest income divided by average interest-earning assets and is influenced by the level and relative mix of interest-earning assets and interest-bearing liabilities, as well as levels of non-interest-bearing liabilities.
31
As described above, the primary component of earnings for the Company is net interest income (FTE). Net interest income (FTE) increased to $65.6 million for the year ended December 31, 2010, a $14.9 million, or 29.3%, increase from the $50.7 million earned in 2009. The Company experienced an increase of $15.3 million, or 43.3% from 2009 to 2008. For the year ended December 31, 2010, the net interest margin increased 26 basis points to 3.65% from 3.39% in 2009. For the year ended December 31, 2009, the net interest margin increased 22 basis points to 3.39% from 3.17% in 2008. The Company’s net interest spread for the years ended December 31, 2010, 2009 and 2008 were 3.61%, 3.27% and 3.00%, respectively. The factors contributing to the
changes in net interest income (FTE) for 2010, 2009 and 2008 are presented in Table 2 and Table 3. Table 2 is an analysis of average balances and the components of net interest income (FTE). Table 3 presents an analysis of the overall changes in the level of net interest income (FTE) into rate/volume activity.
Total interest income (FTE) increased $16.7 million, or 20.0%, to $100.3 million for the year ended December 31, 2010 compared to $83.6 million for the year ended December 31, 2009. Average total interest-earning assets increased $303.1 million during 2010 as compared to 2009, while the average yield decreased by one basis point from 5.59% to 5.58%. The increase in interest income was due to the $332.5 million, or 32.4% increase in the average balance of loans, primarily from the Beach First acquisition. The $47.7 million, or 150.3% increase in average interest-earning bank balances was due to the significantly higher liquidity position the Company maintained to support the Beach First acquisition
. The average balance of investment securities decreased $78.6 million, or 18.2%. The average yield on loans and investment securities increased 12 basis points and 32 basis points, respectively.
Total interest expense increased $1.9 million, or 5.7%, to $34.7 million for the year ended December 31, 2010 compared to $32.9 million for the year ended December 31, 2009. Average total interest-bearing liabilities increased $346.5 million during 2010 as compared to 2009, while the average cost of funding decreased by 35 basis points from 2.32% to 1.97%. The average balance of demand deposits increased by $249.3 million, or 55.2%, with the average cost increasing eight basis points to 1.32%. The average balance of time deposits increased $100.1 million, or 12.6%, with the average cost decreasing 50 basis points, as result of the maturities of higher costing time deposits being replaced by time deposits with lower cost of funds. Average borrowings decreased by $10.1
million, or 6.2%, with the average cost decreasing four basis points to 2.42%.
When comparing 2009 to 2008, net interest income (FTE) increased by $15.3 million, or 43.3%. Average earning assets increased $379.5 million, or 34.0%. During 2009, the Company’s average growth consisted of average investment securities increasing $311.2 million, or 260.3%, average loans increasing $45.6 million, or 4.6%, and interest-earning bank balances increasing $29.5 million from 2008. With short-term interest rates down significantly from 2008, loan yields decreased 100 basis points, reducing the yield on average-earning assets by 93 basis points. Offsetting this were decreases of 120 basis points in interest-bearing liabilities, primarily in time deposits where the funding costs decreased by 107 basis points.
32
Table 2
Average Balance and Net Interest Income (FTE)
($ in thousands)
|
Year Ended December 31, 2010
|
Year Ended December 31, 2009
|
Year Ended December 31, 2008
|
||||||||||||||||||||||||||||||||||
|
Average
|
Average
|
Average
|
Average
|
Average
|
Average
|
|||||||||||||||||||||||||||||||
|
Balance
|
Interest
|
Rate
|
Balance
|
Interest
|
Rate
|
Balance
|
Interest
|
Rate
|
||||||||||||||||||||||||||||
|
Interest-earning assets:
|
||||||||||||||||||||||||||||||||||||
|
Loans (1)
|
$ | 1,359,107 | $ | 77,788 | 5.72 | % | $ | 1,026,635 | $ | 57,556 | 5.61 | % | $ | 981,069 | $ | 64,855 | 6.61 | % | ||||||||||||||||||
|
Investment securities, tax effected (2)
|
352,099 | 22,352 | 6.35 | % | 430,684 | 25,982 | 6.03 | % | 119,531 | 7,616 | 6.37 | % | ||||||||||||||||||||||||
|
Interest-earning balances
|
79,509 | 177 | 0.22 | % | 31,765 | 52 | 0.16 | % | 2,243 | 92 | 4.10 | % | ||||||||||||||||||||||||
|
Other
|
8,609 | 31 | 0.36 | % | 7,146 | 14 | 0.20 | % | 13,923 | 276 | 1.98 | % | ||||||||||||||||||||||||
|
Total interest-earning assets
|
1,799,324 | 100,348 | 5.58 | % | 1,496,230 | 83,604 | 5.59 | % | 1,116,766 | 72,839 | 6.52 | % | ||||||||||||||||||||||||
|
Other assets
|
227,937 | 121,514 | 110,480 | |||||||||||||||||||||||||||||||||
|
Total assets
|
$ | 2,027,261 | $ | 1,617,744 | $ | 1,227,246 | ||||||||||||||||||||||||||||||
|
Interest-bearing liabilities:
|
||||||||||||||||||||||||||||||||||||
|
Deposits:
|
||||||||||||||||||||||||||||||||||||
|
Demand deposits
|
700,648 | 9,278 | 1.32 | % | 451,317 | 5,592 | 1.24 | % | 180,353 | 2,725 | 1.51 | % | ||||||||||||||||||||||||
|
Savings deposits
|
18,937 | 46 | 0.24 | % | 11,835 | 14 | 0.12 | % | 11,058 | 13 | 0.12 | % | ||||||||||||||||||||||||
|
Time deposits
|
894,301 | 21,752 | 2.43 | % | 794,181 | 23,292 | 2.93 | % | 698,647 | 27,978 | 4.00 | % | ||||||||||||||||||||||||
|
Borrowings
|
151,505 | 3,671 | 2.42 | % | 161,602 | 3,969 | 2.46 | % | 173,113 | 6,710 | 3.88 | % | ||||||||||||||||||||||||
|
Total interest-bearing liabilities
|
1,765,391 | 34,747 | 1.97 | % | 1,418,935 | 32,867 | 2.32 | % | 1,063,171 | 37,426 | 3.52 | % | ||||||||||||||||||||||||
|
Non-interest-bearing deposits
|
96,526 | 63,604 | 72,008 | |||||||||||||||||||||||||||||||||
|
Other liabilities
|
15,385 | 11,564 | 5,209 | |||||||||||||||||||||||||||||||||
|
Shareholders' equity
|
149,959 | 123,641 | 86,858 | |||||||||||||||||||||||||||||||||
|
Total liabilities and stockholders' equity
|
$ | 2,027,261 | $ | 1,617,744 | $ | 1,227,246 | ||||||||||||||||||||||||||||||
|
Net interest income and interest rate spread (3)
|
$ | 65,601 | 3.61 | % | $ | 50,737 | 3.27 | % | $ | 35,413 | 3.00 | % | ||||||||||||||||||||||||
|
Net interest margin (4)
|
3.65 | % | 3.39 | % | 3.17 | % | ||||||||||||||||||||||||||||||
|
Ratio of average interest-earning assets to average interest-bearing liabilities
|
101.92 | % | 105.45 | % | 105.04 | % | ||||||||||||||||||||||||||||||
|
(1)
|
Average loans include non-accruing loans and loans held for sale.
|
|
(2)
|
Yields on tax-exempt investments have been adjusted to a fully taxable-equivalent basis (FTE) using the federal income tax rate of 34%. The taxable equivalent adjustment was $5.4 million, $4.5 million, and $1.8 million for the years 2010, 2009, and 2008, respectively.
|
|
(3)
|
Interest rate spread equals the earning asset yield minus the interest-bearing liability rate.
|
|
(4)
|
Net interest margin is computed by dividing net interest income by total earning assets.
|
Table 3
Volume and Rate Variance Analysis
(In thousands)
|
Year Ended December 31, 2010 vs. 2009
|
Year Ended December 31, 2009 vs. 2008
|
|||||||||||||||||||||||
|
Increase (Decrease) Due to
|
Increase (Decrease) Due to
|
|||||||||||||||||||||||
|
Volume
|
Rate
|
Total
|
Volume
|
Rate
|
Total
|
|||||||||||||||||||
|
Interest income:
|
||||||||||||||||||||||||
|
Loans
|
$ | 18,834 | $ | 1,398 | $ | 20,232 | $ | 2,783 | $ | (10,082 | ) | $ | (7,299 | ) | ||||||||||
|
Investment securities, tax effected
|
(4,865 | ) | 1,235 | (3,630 | ) | 19,296 | (930 | ) | 18,366 | |||||||||||||||
|
Interest-earning balances
|
92 | 33 | 125 | 630 | (670 | ) | (40 | ) | ||||||||||||||||
|
Other
|
4 | 13 | 17 | (74 | ) | (188 | ) | (262 | ) | |||||||||||||||
|
Total interest income
|
14,065 | 2,679 | 16,744 | 22,635 | (11,870 | ) | 10,765 | |||||||||||||||||
|
Interest expense:
|
||||||||||||||||||||||||
|
Deposits
|
||||||||||||||||||||||||
|
Demand deposits
|
3,195 | 491 | 3,686 | 3,726 | (859 | ) | 2,867 | |||||||||||||||||
|
Savings deposits
|
13 | 19 | 32 | 1 | - | 1 | ||||||||||||||||||
|
Time deposits
|
2,686 | (4,226 | ) | (1,540 | ) | 3,314 | (8,000 | ) | (4,686 | ) | ||||||||||||||
|
Borrowings
|
(246 | ) | (52 | ) | (298 | ) | (364 | ) | (2,377 | ) | (2,741 | ) | ||||||||||||
|
Total interest expense
|
5,648 | (3,768 | ) | 1,880 | 6,677 | (11,236 | ) | (4,559 | ) | |||||||||||||||
|
Net interest income increase (decrease)
|
$ | 8,417 | $ | 6,447 | $ | 14,864 | $ | 15,958 | $ | (634 | ) | $ | 15,324 | |||||||||||
33
Provision for Loan Losses
Provisions for loan losses are charged to income to bring the allowance for loan losses to a level deemed appropriate by management. In evaluating the allowance for loan losses, management considers factors that include growth, composition and industry diversification of the portfolio, historical loan loss experience, current delinquency levels, adverse situations that may affect a borrower's ability to repay, estimated value of any underlying collateral, prevailing economic conditions and other relevant factors. The provision for loan losses for the year ended December 31, 2010 was $26.4 million, representing an increase of $10.6 million from the $15.8 million provision made in 2009. The allowance for loan losses, as a percentage of loans outstanding, increased from 1.60% at the
beginning of 2010 to 1.65% at the end of 2010. At December 31, 2010, the allowance for loan losses was $24.8 million, an increase of $7.5 million, or 43.4% from the $17.3 million at the end of 2009. The increases in the provision and the allowance for loan losses over the last two years were due to an increase in nonperforming loans, continued weakness in the residential construction and housing markets, and the prolonged economic downturn, as well as overall loan growth.
Net loan growth totaled $119.7 million (excludes $309.3 million of covered loans) in 2010 and $71.4 million in 2009. At December 31, 2010, the Company had $91.0 million in nonaccrual loans (includes $64.8 million of covered loans) compared to $19.1 million at the end of 2009. The nonaccrual balance at December 31, 2010 has been written down to a balance that management believes is collectible under current market conditions.
Net loan charge-offs were $18.9 million, an increase of $7.2 million, or 62.0%, from 2009 to 2010. This increase was primarily from commercial and industrial and residential mortgages having increases in charge-offs of $4.4 million and 2.4 million, respectively. In addition, commercial real estate loan charge-offs increased by $1.9 million. The loan net charge-offs exclude write-downs on purchased impaired loans because the fair value already considers the estimated credit losses, as such, no covered loan losses were incurred during 2010. The ratio of net-charge offs to average loans in 2010 total 1.39%, compared to 1.13% for 2009.
Net loan charge-offs were $11.7 million, an increase of $6.0 million, or 106.2%, from 2008 to 2009. The allowance for loan losses, as a percentage of loans outstanding, increased from 1.31% at the beginning of 2009 to 1.60% at the end of 2009. At December 31, 2009, the allowance increased $4.1 million, or 31.0% from the $13.2 million at the end of 2008. The ratio of net-charge offs to average loans in 2009 total 1.13%, compared to 0.58% for 2008.
Non-Interest Income
Non-interest income increased $20.1 million to $28.8 million for the year ended December 31, 2010 as compared with $8.7 million and $5.7 million for the years ended December 31, 2009 and 2008, respectively. Table 4 presents a comparative analysis of the components of non-interest income.
The increase in non-interest income for 2010 resulted primarily from the $19.3 million gain on acquisition of Beach First in April 2010 and $1.1 million from the accretion of the FDIC indemnification asset associated with the acquisition.
The gain on sale of investment securities available for sale decreased $3.1 million compared to 2009 due to decreased activity in the sales of investments. Gain on sale of investment securities available for sale increased $3.4 million in 2009 compared to 2008.
Mortgage fees generated from the Company’s mortgage market operations increased $475,000, compared to 2009 and increased $325,000 when comparing 2009 to 2008. The increased volume of originations and refinancing continued in 2009 and 2010 due to the historically low interest rates and increased emphasis in this area.
Service charges and fees on deposit accounts increased $376,000 compared to 2009. Overall growth in volume of the related service charges were offset by lower overdraft and NSF fees due to new Federal Reserve Board’s consumer protection regulations. When comparing 2009 to 2008, service charges and fees on deposit accounts decreased $314,000 in 2009 largely as a result of the tightened consumer spending and continued effects of the economic environment.
Earnings on bank-owned life insurance increased $55,000 compared to 2009. Late in 2010, the Company purchased additional bank-owned life insurance which increased the revenue. When comparing 2009 to 2008, earnings on bank-owned life insurance decreased $170,000 in 2009 from decreased rate of return given to policy holders of the bank-owned life insurance.
34
From the acquisition of Beach First, the Company now has merchant fee revenue as a component of non-interest income. Merchant fees for 2010 totaled $779,000, a significant source of revenue in the retail-oriented coastal economy of South Carolina.
Table 4
Non-Interest Income
(In thousands)
|
Year Ended December 31,
|
||||||||||||
|
2010
|
2009
|
2008
|
||||||||||
|
Mortgage fees
|
$ | 1,583 | $ | 1,108 | $ | 783 | ||||||
|
Service charges
|
3,083 | 2,707 | 3,021 | |||||||||
|
Earnings on bank-owned life insurance
|
986 | 931 | 1,101 | |||||||||
|
Investment brokerage fees
|
326 | 249 | 434 | |||||||||
|
Merchant fees
|
779 | - | - | |||||||||
|
Core non-interest income
|
6,757 | 4,995 | 5,339 | |||||||||
|
Gain on sale of investment securities available for sale, net
|
535 | 3,610 | 223 | |||||||||
|
Gain on acquisition
|
19,261 | - | - | |||||||||
|
Other non-interest income
|
2,260 | 81 | 89 | |||||||||
|
Total non-interest income
|
$ | 28,813 | $ | 8,686 | $ | 5,651 | ||||||
Non-Interest Expense
The Company strives to maintain levels of non-interest expense that management believes are appropriate given the nature of its operations and the investments in personnel and facilities that have been necessary to generate growth. One of the keys to the momentum the Company has experienced has been the continuous investment in the core banking franchise, both in people and locations. As the Company strives to maintain momentum in its growth and strategy, it will incur costs associated with investments in people, facilities and technology that are anticipated to benefit the shareholders as these investments reach their potential. Non-interest expenses increased $22.3 million to $55.2 million for the year ended December 31, 2010 as compared with $32.9 million and $27.8 million for
the years ended December 31, 2009 and 2008, respectively. Table 5 presents a comparative analysis of the components of non-interest expense.
Salaries and employee benefits increased $7.8 million during 2010 when compared to the prior year and increased $1.2 million from 2008 to 2009. The increase for 2010 is mainly due to headcount growth resulting from the Beach First acquisition, and to a lesser extent, strategic additions to the Company’s senior management team, several new branch locations, expansion of the credit team and other initiatives. The increase for 2009 is attributable to the development and expansion of headcount for strategic initiatives, including the opening of new offices. Salaries and employee benefits consists of employee compensation and employee benefits, incentives, health care, 401(k) employee savings plan, salary continuation plans and other supplemental retirement benefits.
Occupancy expense, including furniture and equipment expenses totaled $5.4 million, an increase of $2.0 million during 2010 compared to 2009, mainly due to facilities acquired from the Beach First acquisition, and to a lesser extent, legacy bank growth in opening new branch locations. In addition, expenses associated with the increased operating activity from Beach First and a core system conversion initiative were included in the increase. In comparison of 2009 to 2008, the increase of $149,000 was not significant.
Data processing and supply expenses increased $852,000 during 2010, following a $148,000 increase in 2009. The increases in 2010 and 2009 were primarily due to increased operating activity from both organic growth of the Company and from the Beach First acquisition.
35
Advertising and business development expenses increased $838,000 in 2010 compared to 2009 mostly due to increased activity from our new markets in South Carolina and increases in business development expenses associated with the Company’s strategy to grow core deposits and increase visibility during a period when many larger competitors were in a defensive posture. Advertising and business development expenses increased $683,000 from 2008 to 2009 mainly due to above mentioned strategy to grow core deposits.
Insurance, professional and other services increased $1.6 million in 2010 compared to 2009, mostly due to the increased costs associated with the Beach First acquisition, including technology consulting, legal, and valuation expenditures. For 2009, insurance, professional and other services increased $341,000 when compared to 2008, primarily from strategic related expenditures, increased corporate governance and the overall growth of the Company.
FDIC insurance assessments increased $126,000 in 2010 and increased $2.2 million in 2009 as a result of increased annual assessment fees imposed by the FDIC and a $750,000 special deposit insurance assessment that was levied on all insured depository institutions.
Loan, foreclosure and collection expenses increased $8.0 million due to increased volume of expenses primarily relating to the write-down of other real estate owned properties, the ongoing expenses relating to these properties, and other loan, foreclosure and collection expenses.
Table 5
Non-Interest Expense
(In thousands)
|
Year Ended December 31,
|
||||||||||||
|
2010
|
2009
|
2008
|
||||||||||
|
Salaries and employee benefits
|
$ | 25,340 | $ | 17,499 | $ | 16,293 | ||||||
|
Occupancy
|
3,218 | 1,913 | 2,155 | |||||||||
|
Furniture and equipment
|
2,145 | 1,475 | 1,084 | |||||||||
|
Data processing and supply
|
2,113 | 1,261 | 1,113 | |||||||||
|
Advertising and business development
|
1,994 | 1,156 | 473 | |||||||||
|
Insurance, professional and other services
|
4,012 | 2,452 | 2,111 | |||||||||
|
FDIC insurance assessments
|
2,970 | 2,844 | 642 | |||||||||
|
Loan, foreclosure and collection
|
9,054 | 1,078 | 1,173 | |||||||||
|
Other
|
4,326 | 3,221 | 2,739 | |||||||||
|
Total non-interest expense
|
$ | 55,172 | $ | 32,899 | $ | 27,783 | ||||||
Income Taxes
The Company generates significant amounts of non-taxable income from tax exempt investment securities and from investments in bank-owned life insurance. Accordingly, the level of such income in relation to income before income taxes significantly affects our effective tax rate. For the years ended December 31, 2010 and 2009, non-taxable income exceeded income before income taxes, resulting in a reduction of total income subject to income taxes for the year. For 2010 and 2009, the provision for income taxes reflects a tax benefit of $204,000 and $285,000, respectively, or 2.7% and 4.6% of income before income taxes, respectively. For 2008, the provision for income taxes reflects a tax expense of $414,000, or 9.4% of income before income taxes.
Preferred Stock Dividend and Accretion
For the years ended December 31, 2010 and 2009, dividends on preferred stock and accretion amounted to $2.2 million and $2.0 million, respectively. The increase is associated with the preferred stock dividend paid on the Series B Preferred Stock that was issued during the second quarter of 2010. The remaining amounts were associated with the Series A Preferred Stock that was issued to the United States Treasury in December 2008, in connection with our participation in the TARP Capital Purchase Program. For the year ended December 31, 2008, dividends on preferred stock and accretion amounted to $142,000.
36
FINANCIAL CONDITION
Total assets at December 31, 2010 were $2.15 billion, an increase of $515.7 million when compared to total assets at December 31, 2009. Total earning assets, which are comprised of interest-earning balances at banks, investment securities and loans, were $1.91 billion at December 31, 2010 compared to $1.50 billion at December 31, 2009. Earning assets serve as the primary revenue sources for the Company. The majority of the increases resulted from the acquisition of Beach First during the second quarter of 2010, and to a lesser extent, core franchise growth.
The Company continually monitors liquidity levels in relation to the market conditions, and adjusts levels to what we deem to be an appropriate level for the current operating environment. Historically, liquid assets, consisting of cash and cash equivalents and investment securities available for sale, have been managed towards a target of 10% of total assets. With debt markets becoming less liquid, unsecured credit availability through correspondent institutions less reliable, and customers shifting funds to maximize their FDIC insurance protection, management began maintaining higher levels of liquid assets throughout 2010 and 2009. At December 31, 2010, liquid assets totaled $383.0 million, or 17.8% of total
assets, with the majority being available to meet short-term liquidity needs. At December 31, 2009, liquid assets totaled $408.7 million, or 25.0% of total assets. The average balance of liquid assets during 2010 totaled $451.2 million, or 22.3% of total assets. The decrease in liquid assets at year-end 2010 was due to the purchase of $32.9 million of seasoned single family residential mortgage loans from another financial institution and the additional investment of $18.0 million in bank-owned life insurance.
Investment Securities
Investment securities were $358.9 million at December 31, 2010 and $366.5 million at December 31, 2009. The majority of the investment securities in the portfolio are bank-qualified municipal government securities and mortgage-backed securities issued or guaranteed by U.S. government agencies. The Company’s investment portfolios are high quality securities that are designed to enhance liquidity while providing acceptable rates of return. The majority of the investment securities in the portfolio are to be held for indefinite periods of time, and not intended to be held to maturity, are classified as available for sale and carried at fair value with any unrealized gains or losses, net of related taxes, reflected as an adjustment to stockholders' equity. Securities
held for indefinite periods of time include securities that management intends to use as part of its asset/liability management strategy and that may be sold in response to changes in interest rates and/or significant prepayment risks. It is the Company’s policy to classify all investment securities as available for sale, except in the case with certain corporate bond investments in other local community banks. Table 6 below summarizes the amortized costs, gross unrealized gains and losses and estimated fair values of investment securities available for sale and held to maturity at December 31, 2010, 2009 and 2008.
37
Table 6
Investment Securities Portfolio Composition
(In thousands)
|
Gross
|
Gross
|
Estimated
|
||||||||||||||
|
Amortized
|
unrealized
|
unrealized
|
fair
|
|||||||||||||
|
cost
|
gains
|
losses
|
value
|
|||||||||||||
|
December 31, 2010
|
||||||||||||||||
|
Available for sale:
|
||||||||||||||||
|
State and municipals
|
$ | 221,902 | $ | 2,722 | $ | 4,082 | $ | 220,542 | ||||||||
|
Mortgage-backed
|
124,604 | 7,854 | 176 | 132,282 | ||||||||||||
|
Other
|
47 | - | - | 47 | ||||||||||||
| $ | 346,553 | $ | 10,576 | $ | 4,258 | $ | 352,871 | |||||||||
|
Held to maturity:
|
||||||||||||||||
|
Corporate bonds
|
$ | 6,000 | $ | - | $ | 720 | $ | 5,280 | ||||||||
|
December 31, 2009
|
||||||||||||||||
|
Available for sale:
|
||||||||||||||||
|
State and municipals
|
$ | 186,526 | $ | 4,328 | $ | 2,261 | $ | 188,593 | ||||||||
|
Mortgage-backed
|
163,067 | 8,799 | - | 171,866 | ||||||||||||
|
Other
|
47 | - | - | 47 | ||||||||||||
| $ | 349,640 | $ | 13,127 | $ | 2,261 | $ | 360,506 | |||||||||
|
Held to maturity:
|
||||||||||||||||
|
Corporate bonds
|
$ | 6,000 | $ | - | $ | 640 | $ | 5,360 | ||||||||
|
December 31, 2008
|
||||||||||||||||
|
Available for sale:
|
||||||||||||||||
|
U. S. Government agency obligations
|
$ | 4,980 | $ | 24 | $ | - | $ | 5,004 | ||||||||
|
State and municipals
|
123,623 | 1,612 | 4,802 | 120,433 | ||||||||||||
|
Mortgage-backed
|
286,792 | 4,297 | 128 | 290,961 | ||||||||||||
|
Other
|
166 | - | - | 166 | ||||||||||||
| $ | 415,561 | $ | 5,933 | $ | 4,930 | $ | 416,564 | |||||||||
|
Held to maturity:
|
||||||||||||||||
|
Corporate bonds
|
$ | 6,000 | $ | - | $ | 600 | $ | 5,400 | ||||||||
The Company’s investment security portfolio is an important source of liquidity and earnings. A stated objective in managing the securities portfolio is to provide consistent liquidity to support balance sheet growth but also to provide a safe and consistent stream of earnings.
The Company does not engage in, nor does it presently intend to engage in, securities trading activities and therefore does not maintain a trading account. At December 31, 2010, there were no securities of any issuer (other than governmental agencies) that exceeded 10% of the Company's shareholders' equity.
Table 7 below summarizes the amortized costs, fair values and weighted average yields of investment securities available for sale at December 31, 2010, by contractual maturity groups.
38
Table 7
Investment Securities Portfolio Expected Maturities
($ in thousands)
|
Amortized
|
Fair
|
Book
|
||||||||||
|
cost
|
value
|
yield (1)
|
||||||||||
|
Available for sale:
|
||||||||||||
|
State and municipals
|
||||||||||||
|
Due within one year
|
4,653 | 4,662 | 12.02 | % | ||||||||
|
After one through five years
|
28,603 | 28,189 | 6.41 | % | ||||||||
|
After five through ten years
|
85,459 | 84,930 | 6.92 | % | ||||||||
|
Over ten years
|
103,187 | 102,761 | 7.16 | % | ||||||||
|
|
221,902 | 220,542 | 7.07 | % | ||||||||
|
Mortgage-backed
|
||||||||||||
|
Due within one year
|
25,241 | 26,846 | 4.96 | % | ||||||||
|
After one through five years
|
54,816 | 58,499 | 5.07 | % | ||||||||
|
After five through ten years
|
19,154 | 20,259 | 4.76 | % | ||||||||
|
Over ten years
|
25,393 | 26,678 | 5.27 | % | ||||||||
| 124,604 | 132,282 | 5.04 | % | |||||||||
|
Other
|
||||||||||||
|
Over ten years
|
47 | 47 | 0.00 | % | ||||||||
|
Total available for sale:
|
||||||||||||
|
Due within one year
|
29,894 | 31,508 | 6.06 | % | ||||||||
|
After one through five years
|
83,419 | 86,688 | 5.53 | % | ||||||||
|
After five through ten years
|
104,613 | 105,189 | 6.53 | % | ||||||||
|
Over ten years
|
128,627 | 129,486 | 6.78 | % | ||||||||
| $ | 346,553 | $ | 352,871 | 6.34 | % | |||||||
|
Held to maturity:
|
||||||||||||
|
Corporate bonds:
|
||||||||||||
|
After five through ten years
|
6,000 | 5,280 | 4.60 | % | ||||||||
| $ | 6,000 | $ | 5,280 | 4.60 | % | |||||||
(1) Based on amortized cost, taxable-equivalent basis
Loans
Loans increased by $429.0 million to $1.51 billion at December 31, 2010 from $1.08 billion at December 31, 2009. For 2010, average total loans were $1.36 billion, compared to $1.03 billion for 2009. The majority of this increase resulted from the acquisition of Beach First in the second quarter of 2010 where the Company acquired $348.8 million of loans. The remaining increase of $80.2 million was a result of the Company’s continued focus to lend to our customers during this economic downturn. At December 31, 2010, loans covered under loss share agreements amounted to $309.3 million. During December 2010, the Company purchased $32.9 million of seasoned single family residential mortgage loans from another financial institution. These loans were for
properties located within our existing footprint and were comprised of low loan-to-value ratios and good to excellent FICO scores.
Table 8 sets forth information about the Company’s loan portfolio composition, for the periods indicated:
39
Table 8
Loan Portfolio Composition
($ in thousands)
|
At December 31,
|
||||||||||||||||||||||||||||||||||||||||
|
2010
|
2009
|
2008
|
2007
|
2006
|
||||||||||||||||||||||||||||||||||||
|
% of
|
% of
|
% of
|
% of
|
% of
|
||||||||||||||||||||||||||||||||||||
|
Total
|
Total
|
Total
|
Total
|
Total
|
||||||||||||||||||||||||||||||||||||
|
Amount
|
Loans
|
Amount
|
Loans
|
Amount
|
Loans
|
Amount
|
Loans
|
Amount
|
Loans
|
|||||||||||||||||||||||||||||||
|
Commercial real estate
|
$ | 677,687 | 44.9 | % | $ | 449,209 | 41.7 | % | $ | 350,849 | 34.8 | % | $ | 306,450 | 32.9 | % | $ | 269,096 | 34.7 | % | ||||||||||||||||||||
|
Commercial construction
|
232,958 | 15.5 | % | 183,509 | 17.0 | % | 228,330 | 22.7 | % | 196,105 | 21.0 | % | 141,398 | 18.3 | % | |||||||||||||||||||||||||
|
Commercial and industrial
|
136,571 | 9.1 | % | 113,670 | 10.5 | % | 98,595 | 9.8 | % | 109,869 | 11.8 | % | 97,071 | 12.5 | % | |||||||||||||||||||||||||
|
Leases
|
10,985 | 0.7 | % | 12,216 | 1.1 | % | 15,190 | 1.5 | % | 14,370 | 1.5 | % | 11,034 | 1.4 | % | |||||||||||||||||||||||||
|
Residential construction
|
32,351 | 2.1 | % | 50,156 | 4.6 | % | 78,942 | 7.8 | % | 89,897 | 9.7 | % | 62,297 | 8.1 | % | |||||||||||||||||||||||||
|
Residential mortgage
|
403,316 | 26.7 | % | 257,445 | 23.9 | % | 223,053 | 22.1 | % | 197,904 | 21.2 | % | 175,628 | 22.7 | % | |||||||||||||||||||||||||
|
Consumer and other
|
14,503 | 1.0 | % | 12,655 | 1.2 | % | 12,829 | 1.3 | % | 17,967 | 1.9 | % | 18,140 | 2.3 | % | |||||||||||||||||||||||||
|
Total loans
|
$ | 1,508,371 | 100.0 | % | $ | 1,078,860 | 100.0 | % | $ | 1,007,788 | 100.0 | % | $ | 932,562 | 100.0 | % | $ | 774,664 | 100.0 | % | ||||||||||||||||||||
|
Loan not covered under loss share agreements
|
$ | 1,199,029 | 79.5 | % | $ | 1,078,860 | 100.0 | % | $ | 1,007,788 | 100.0 | % | $ | 932,562 | 100.0 | % | $ | 774,664 | 100.0 | % | ||||||||||||||||||||
|
Loans covered under loss share agreements
|
309,342 | 20.5 | % | - | - | - | - | - | - | - | - | |||||||||||||||||||||||||||||
|
Total loans
|
$ | 1,508,371 | 100.0 | % | $ | 1,078,860 | 100.0 | % | $ | 1,007,788 | 100.0 | % | $ | 932,562 | 100.0 | % | $ | 774,664 | 100.0 | % | ||||||||||||||||||||
These classifications are based upon Call Report Classification codes.
See Note D to the accompanying Consolidated Financial Statements contained in this Annual Report for detailed information.
Excluding loans covered under loss share agreements, the mix and stratification within certain classifications of the Company’s loan portfolio has changed when compared to the loan portfolio composition at December 31, 2009. The Company’s construction, land, and acquisition & development (“A&D”) portfolios were reduced from $234.9 million at December 31, 2009 to $200.9 million at December 31, 2010, representing a decrease of 14.5%. At December 31, 2010, the residential construction portfolios were reduced by 35.5% from year-end 2009 levels, including reducing the speculative 1-4 family construction loans to $17.7 million, down from $33.4 million at year end. Residential and commercial A&D exposure was reduced by $14.5 million during
2010. The Company will continue its efforts to divest A&D exposures as needed and deemed appropriate by management. and continue to reblance the portfolio mix and concentrations as needed. The Company’s commercial real estate portfolio increased from $449.2 million at December 31, 2009 to $557.6 million at December 31, 2010, having increases of $33.0 million and $41.8 million in the owner occupied retail commercial real estate and investment retail commercial real estate portfolios, respectively. New loan originations in this area during 2010 carried much higher credit standards for liquidity, contingencies, net worth, loan-to-value and management expertise.
40
Table 9
Loan Maturities
(In thousands)
|
At December 31, 2010
|
||||||||||||||||
|
Due after
|
||||||||||||||||
|
Due within
|
one year but
|
Due after
|
||||||||||||||
|
one year
|
within five
|
five years
|
Total
|
|||||||||||||
|
By loan type:
|
||||||||||||||||
|
Commercial real estate
|
$ | 117,618 | $ | 503,150 | $ | 56,919 | $ | 677,687 | ||||||||
|
Commercial construction
|
183,177 | 39,219 | 10,562 | 232,958 | ||||||||||||
|
Commercial and industrial
|
69,969 | 57,012 | 9,590 | 136,571 | ||||||||||||
|
Leases
|
2,209 | 8,776 | - | 10,985 | ||||||||||||
|
Residential construction
|
27,664 | 2,131 | 2,556 | 32,351 | ||||||||||||
|
Residential mortgage
|
63,481 | 150,889 | 188,946 | 403,316 | ||||||||||||
|
Consumer and other
|
6,211 | 6,174 | 2,118 | 14,503 | ||||||||||||
|
Total loans
|
$ | 470,329 | $ | 767,351 | $ | 270,691 | $ | 1,508,371 | ||||||||
|
By interest rate type:
|
||||||||||||||||
|
Fixed rate loans
|
$ | 212,117 | $ | 469,506 | $ | 90,185 | $ | 771,808 | ||||||||
|
Variable rate loans
|
258,212 | 297,845 | 180,506 | 736,563 | ||||||||||||
| $ | 470,329 | $ | 767,351 | $ | 270,691 | $ | 1,508,371 | |||||||||
The above table is based on contractual scheduled maturities. Early repayment of loans or renewals at maturity are not considered in this table.
Deposits
The Company provides a range of deposit services, including non-interest bearing demand accounts, interest-bearing demand and savings accounts, money market accounts and time deposits. These accounts generally earn interest at rates established by management based on competitive market factors and management's desire to increase or decrease certain types or maturities of deposits. Deposits continue to be our primary funding source. At December 31, 2010, deposits totaled $1.83 billion, an increase of $478.2 million, or 35.4%, from year-end 2009. The increase in year-end deposits was due primarily to the acquisition of Beach First, which had $315.4 million of local deposits at year-end. The total average deposits increased by $389.5 million, or 29.5%, from $1.32 billion
at December 31, 2009 to $1.71 billion at December 31, 2010. Interest-bearing demand accounts increased by $262.7 million, or 45.4%. Time deposits increased $174.7 million, or 24.8%, and comprise 48.1% of total deposits at December 31, 2010, a decrease from 52.2% at December 31, 2009. Time deposits of $100,000 or more represented 34.4% and 35.0%, respectively, of the Company’s total deposits at December 31, 2010 and 2009.
While overall deposit growth continues to be an emphasis, the more important element is the shift in the mix of deposits to higher levels of core deposits and away from wholesale CDs. Over the one-year period from December 31, 2009 to December 31, 2010, core deposits increased by over $619.2 million, while wholesale CD’s declined by over $171.0 million. As a percentage of total deposits, wholesale CD’s currently comprise only 14.4% of total deposits, down significantly from 32.1% at December 31, 2009.
During 2009 and 2010, the Company continued its efforts to grow core relationships and focused on its Business Services, Retail and Private Banking groups. This focus has created a solid foundation of seasoned leadership and specialized banking expertise, dedicated to delivering exceptional service to each and every customer. This commitment transformed the Company’s deposit mix and deposit growth capabilities into a driver of current and future franchise value.
41
During 2009, the Company established a brokered money market relationship which enabled the Company to pay down borrowings at the FHLB that required over $270 million of our investment securities to be pledged as collateral. The collateral became unencumbered and was available to meet certain unforeseen liquidity demands that could arise. At December 31, 2010 and 2009, the money market relationship totaled $330.1 million and $273.7 million, respectively.
The following is the Company’s average deposits for a three-year period:
Table 10
Average Deposits
($ in thousands)
|
For the Year Ended December 31,
|
||||||||||||||||||||||||
|
2010
|
2009
|
2008
|
||||||||||||||||||||||
|
Average
|
Average
|
Average
|
Average
|
Average
|
Average
|
|||||||||||||||||||
|
Amount
|
Rate
|
Amount
|
Rate
|
Amount
|
Rate
|
|||||||||||||||||||
|
Demand deposits
|
$ | 700,648 | 1.32 | % | $ | 451,317 | 1.24 | % | $ | 180,353 | 1.51 | % | ||||||||||||
|
Savings deposits
|
18,937 | 0.24 | % | 11,835 | 0.12 | % | 11,058 | 0.12 | % | |||||||||||||||
|
Time deposits
|
894,301 | 2.43 | % | 794,181 | 2.93 | % | 698,647 | 4.00 | % | |||||||||||||||
|
Total interest-bearing deposits
|
1,613,886 | 1.92 | % | 1,257,333 | 2.30 | % | 890,058 | 3.45 | % | |||||||||||||||
|
Non-interest-bearing deposits
|
96,526 | - | 63,604 | - | 72,008 | - | ||||||||||||||||||
|
Total deposits
|
$ | 1,710,412 | 1.81 | % | $ | 1,320,937 | 2.19 | % | $ | 962,066 | 3.19 | % | ||||||||||||
The following is the Company’s maturities of time deposits of $100,000 or more as of December 31, 2010:
Table 11
Maturities of Time Deposits of $100,000 or More
($ in thousands)
|
At December 31, 2010
|
||||||||||||||||||||
|
3 Months
|
Over 3 Months
|
Over 6 Months
|
Over 12
|
|||||||||||||||||
|
or Less
|
to 6 Months
|
to 12 Months
|
Months
|
Total
|
||||||||||||||||
|
Time Deposits of $100,000 or more
|
$ | 140,747 | $ | 46,865 | $ | 140,595 | $ | 301,296 | $ | 629,503 | ||||||||||
Borrowings
Borrowings provide an additional source of funding for the Company and the Bank. Short-term borrowings increased from $50.3 million at December 31, 2009 to $60.2 million at December 31, 2010. Short-term borrowings consist of FHLB term advances with remaining maturities of less than one year, Federal funds purchased from correspondent banks, securities sold under repurchase agreements and an unsecured revolving line of credit. During 2010, short-term FHLB advances increased by $43.0 million, mainly in daily rate overnight funding, while all of the other components of short-term borrowings have significantly decreased. The Bank may purchase federal funds through unsecured federal funds guidance lines of credit totaling $52.0 million at December 31, 2010. In
addition, the Company has an unsecured revolving line of credit of $25.0 million that is available to utilize at management’s discretion, with $3.3 million outstanding at December 31, 2010.
The average balances for short-term borrowings during 2010 decreased by $8.9 million to $53.4 million, down from the 2009 average balance of $62.3 million. During 2010, the Company maintained an unusually high position of liquidity at the Federal Reserve to assure that any funding needs from the acquisition of Beach First were immediately addressed and to provide less reliance on overnight funding.
42
At December 31, 2010, long-term debt outstanding totaled $97.7 million, compared to $100.7 million outstanding at year-end 2009. Long-term debt consists of $66.0 million of FHLB advances and $31.7 million of subordinated debt, of which $23.7 million have been issued through the Company’s trust subsidiaries. Note I and Note J to the accompanying consolidated financial statements present detailed information on short-term borrowings and long-term debt, respectively.
Table 12 sets forth information about the Company’s borrowings, both short-term and long-term, for the three-year period ending December 31, 2010:
Table 12
Borrowings
($ in thousands)
|
For the Year Ended December 31,
|
||||||||||||
|
2010
|
2009
|
2008
|
||||||||||
|
Short-term borrowings:
|
||||||||||||
|
Repurchase agreements, federal funds purchased, lines of credit, and
|
||||||||||||
|
current portion of Federal Home Loan Bank advances
|
||||||||||||
|
Balance outstanding at end of period
|
$ | 60,207 | $ | 50,283 | $ | 194,143 | ||||||
|
Maximum amount outstanding at any month end during the period
|
104,175 | 176,971 | 194,143 | |||||||||
|
Average balance outstanding
|
53,406 | 62,305 | 56,935 | |||||||||
|
Weighted-average interest rate during the period
|
1.10 | % | 1.01 | % | 2.56 | % | ||||||
|
Weighted-average interest rate at end of period
|
0.74 | % | 2.68 | % | 0.68 | % | ||||||
|
Long-term debt:
|
||||||||||||
|
Federal Home Loan Bank advances and subordinated debentures
|
||||||||||||
|
Balance outstanding at end of period
|
$ | 97,713 | $ | 100,713 | $ | 105,713 | ||||||
|
Maximum amount outstanding at any month end during the period
|
100,713 | 105,713 | 119,713 | |||||||||
|
Average balance outstanding
|
98,405 | 99,297 | 116,184 | |||||||||
|
Weighted-average interest rate during the period
|
3.13 | % | 3.37 | % | 4.52 | % | ||||||
|
Weighted-average interest rate at end of period
|
2.92 | % | 3.02 | % | 4.24 | % | ||||||
|
Total borrowings:
|
||||||||||||
|
Balance outstanding at end of period
|
$ | 157,920 | $ | 150,996 | $ | 299,856 | ||||||
|
Maximum amount outstanding at any month end during the period
|
201,888 | 282,684 | 313,856 | |||||||||
|
Average balance outstanding
|
151,811 | 161,602 | 173,113 | |||||||||
|
Weighted-average interest rate during the period
|
2.42 | % | 2.46 | % | 3.88 | % | ||||||
|
Weighted-average interest rate at end of period
|
2.09 | % | 2.91 | % | 2.04 | % | ||||||
As an additional source of borrowings the Bank utilizes securities sold under agreements to repurchase, with balances outstanding of $7.7 million and $16.5 million at December 31, 2010 and 2009, respectively. Securities sold under agreements to repurchase generally mature within one day from the transaction date and are collateralized by either U.S. Government Agency obligations, government agency sponsored mortgage-backed securities or securities issued by local governmental municipalities.
In addition, the Bank has the ability to borrow funds from the FRB of Richmond utilizing the discount window and the borrower-in-custody of collateral arrangement. As of December 31, 2010, the Company had approximately $182.5 million in additional borrowing capacity available under these arrangements with no outstanding balances for 2010 or 2009.
The Bank also uses advances from the FHLB of Atlanta under a line of credit equal to 30% of the Bank’s total assets, subject to qualifying collateral being pledged. Outstanding advances totaled $66.0 million and $74.0 million at December 31, 2010 and 2009, respectively. These advances are secured by a blanket-floating lien on qualifying first mortgage loans, equity lines of credit, certain commercial real estate loans, and certain government agency sponsored mortgage-backed securities pledged to the FHLB. At December 31, 2010, the Company had $89.0 million of additional borrowing capacity available that was secured. A more detailed analysis of FHLB advances is presented in Note I and Note J to the accompanying consolidated
financial statements.
43
Other
The Company, as a member of the FHLB, had an investment of $9.1 million in FHLB stock at December 31, 2010, an increase of $3.0 million from $6.2 million at December 31, 2009. The Company’s investment in premises and equipment increased by $2.8 million, primarily from purchase of premises and equipment from the Beach First acquisition and the costs associated with the Company’s new core operating systems. At December 31, 2010, the Company had goodwill of $26.1 million that is not amortizable and core deposit intangibles, associated with the Company’s acquisitions, amounted to $2.3 million. Other real estate owned increased by $25.4 million during 2010. The Company recorded an FDIC indemnification asset in conjunction with the Beach First acquisition
totaling $69.5 million at December 31, 2010. In addition, the Company purchased an additional $18.0 million of bank owned life insurance.
During 2010, total shareholders' equity increased by $26.0 million, or 20.6%, to $152.2 million. The Company increased capital during 2010 with an equity offering of $33.3 million, net of expenses. The Company’s retained earnings increased by $3.9 million for the year ended December 31, 2010, which was comprised of net income of $7.7 million, offset by common share dividends of $1.6 million and dividend and discount accretion on preferred stock of $2.2 million. Accumulated other comprehensive income decreased $11.9 million from $5.1 million at December 31, 2009 to a loss of $6.8 million at December 31, 2010. The Company and the Bank are subject to minimum capital requirements, and as such, all capital ratios continue to place the Company and the Bank in excess of
the minimum required to be deemed a “well-capitalized” bank by regulatory measures.
CAPITAL RESOURCES
The Company and the Bank are subject to various regulatory capital requirements administered by the federal banking agencies. Capital adequacy guidelines and the regulatory framework for prompt corrective action prescribe specific capital guidelines that involve quantitative measures of the Company’s and Bank's assets, liabilities, and certain off-balance sheet items as calculated under regulatory accounting practices. The Company and Bank's capital amounts and classification are also subject to qualitative judgments by the regulators about components, risk weightings, and other factors. As
of December 31, 2010, 2009 and 2008, the Company and Bank exceed all regulatory capital requirements to be considered “well capitalized” as such terms are defined in applicable regulations. The Company and Bank’s capital adequacy ratios are set forth below:
Table 13
Capital Adequacy Ratios
|
To be well
|
||||||||||||||||
|
capitalized
|
||||||||||||||||
|
under prompt
|
December 31,
|
|||||||||||||||
|
action
|
2010
|
2009
|
2008
|
|||||||||||||
|
provisions
|
Ratio
|
Ratio
|
Ratio
|
|||||||||||||
|
BNC Bancorp
|
||||||||||||||||
|
Total Capital (to risk weighted assets)
|
10.00 | % | 12.75 | % | 11.60 | % | 11.83 | % | ||||||||
|
Tier 1 Capital (to risk weighted assets)
|
6.00 | % | 10.94 | % | 9.71 | % | 9.99 | % | ||||||||
|
Tier 1 Capital (to average assets)
|
5.00 | % | 7.26 | % | 7.43 | % | 8.77 | % | ||||||||
|
Bank of North Carolina
|
||||||||||||||||
|
Total Capital (to risk weighted assets)
|
10.00 | % | 13.01 | % | 12.79 | % | 11.46 | % | ||||||||
|
Tier 1 Capital (to risk weighted assets)
|
6.00 | % | 11.19 | % | 10.87 | % | 9.60 | % | ||||||||
|
Tier 1 Capital (to average assets)
|
5.00 | % | 7.42 | % | 8.32 | % | 8.44 | % | ||||||||
SHAREHOLDERS’ EQUITY
The Company's shareholders’ equity totaled $152.2 million, an increase of $26.0 million, or 20.6%, compared to $126.2 million at December 31, 2009. At December 31, 2010 and 2009, the Company’s tangible shareholders’ equity totaled $123.8 million and $98.5 million, respectively, and tangible equity to asset ratio on those dates was 5.76% and 6.03%, respectively. At December 31, 2008, shareholders’ equity totaled $120.7 million, there was $92.7 million of tangible shareholders’ equity and the tangible equity to asset ratio was 5.90%.
44
On June 14, 2010, the Company entered into an Investment Agreement (the “Investment Agreement”) with Aquiline BNC Holdings LLC, a Delaware limited liability company (“Aquiline”). Pursuant to the Investment Agreement, Aquiline purchased 892,799 shares of the Company’s common stock, no par value per share, at $10.00 per share and 1,804,566 shares of the Company’s Mandatorily Convertible Non-Voting Preferred Stock, Series B (the “Series B Preferred Stock”) at $10.00 per share. The purchase of common stock and Series B Preferred Stock by Aquiline was part of a $35 million private placement that closed on June 14, 2010 (the “Private Placement”). In addition to Aquiline, other investors, including certain directors of the Company, purchased
802,635 shares of the Company’s common stock at $10.00 per share (collectively, with Aquiline, the “Investors”) as a part of the Private Placement on June 14, 2010. The Investors, other than Aquiline, entered into Subscription and Registration Rights Agreements with the Company in connection with their investment in the Company’s common stock in the Private Placement.
On December 5, 2008, the Company issued 31,260 shares of Series A preferred stock and a warrant to purchase 543,337 shares of the Company's common stock to the UST through a private placement. This issuance of shares was not registered under the Securities Act of 1933, as amended, in reliance on the exemption set for in Section 4(2) thereof. The Series A preferred stock qualifies as Tier I capital under risk-based capital guidelines and will pay cumulative dividends at a rate of 5% per annum for the first five years and 9% per annum thereafter. The Series A preferred stock is non-voting except for class voting rights on matters that would adversely affect the rights of the holders of the Series A preferred stock.
The Company also utilizes alternative forms of regulatory capital to supplement our shareholders’ equity in order to remain “well capitalized” for regulatory purposes. The Company has issued four blocks of 30 year variable rate junior subordinated debentures to its wholly owned capital trusts: $5.2 million in April of 2003 priced at 3 month LIBOR + 3.25%; $6.2 million in March of 2004 priced at 3 month LIBOR + 2.80%; $5.2 million in September of 2004 priced at 3 month LIBOR + 2.40%; and $7.2 million in September of 2006 priced at 3 month LIBOR + 1.70%. In addition, during 2005 the Bank issued $8.0 million of subordinated debentures at 3 month LIBOR + 1.80%, which counts as Tier II capital for regulatory purposes. These instruments are classified as
long-term debt on our Company’s financial statements.
Note L to the accompanying consolidated financial statements presents an analysis of the Company’s and Bank’s regulatory capital position as of December 31, 2010 and 2009. Management expects that the Company and the Bank will remain "well-capitalized" for regulatory purposes throughout 2011, although there can be no assurance that the Bank or Company will not fall into the “adequately-capitalized” classification.
LENDING ACTIVITIES
General.
The Company provides to its customers a full range of short- to medium-term commercial, mortgage, construction and personal loans, both secured and unsecured. The Company also makes real estate mortgage and construction loans.
The Company’s loan policies and procedures establish the basic guidelines governing its lending operations. Generally, the guidelines address the types of loans that the Company seeks, target markets, underwriting and collateral requirements, terms, interest rate and yield considerations and compliance with laws and regulations. All loans or credit lines are subject to approval procedures and amount limitations. These limitations apply to the borrower's total outstanding indebtedness to the Company, including the indebtedness of any guarantor. The policies are reviewed and approved at least annually by the Board of Directors of the Company. The Company supplements its own supervision of the loan underwriting and approval process with periodic loan
audits by internal loan examiners and outside professionals experienced in loan review work. The Company has focused its portfolio lending activities on higher yielding commercial loans.
Table 8 in this Item 7 provides an analysis of the Company’s loan portfolio composition by type of loan as of the end of each of the last five years.
Table 9 in this Item 7 presents, at December 31, 2010, (i) the aggregate maturities or repricing of loans in the named categories of the Company's loan portfolio and (ii) the aggregate amounts of variable and fixed rate loans that mature or reprice after one year.
45
Commercial Loans
Commercial business lending is a major focus of the Company’s lending activities. At December 31, 2010, the Company’s commercial and industrial loan portfolio and lease portfolio equaled $147.6 million or 9.78% of total loans, as compared with $125.9 million or 11.7% of total loans at December 31, 2009. At December 31, 2010, commercial loans covered under loss share agreements totaled $24.9 million. Commercial and industrial loans and leases include both secured and unsecured loans for working capital, expansion, and other business purposes. Short-term working capital loans generally are secured by accounts receivable, inventory and/or equipment. The Company also makes term commercial loans secured by real estate, which are categorized as real
estate loans. Lending decisions are based on an evaluation of the financial strength, management and credit history of the borrower, and the quality of the collateral securing the loan. With few exceptions, the Bank requires personal guarantees and secondary sources of repayment.
Commercial loans generally provide greater yields and reprice more frequently than other types of loans, such as real estate loans. More frequent repricing means that yields on our commercial loans adjust with changes in interest rates.
Real Estate Loans
Real estate loans are made for purchasing and refinancing 1-4 family, multi-family and commercial properties. Real estate loans also include home equity credit lines. The Bank offers fixed and adjustable rate options and provides customers access to long-term conventional real estate loans through its mortgage loan department which makes secondary market conforming loans that are originated with a commitment from a correspondent financial institution to purchase the loan within 30 days of closing. Residential real estate loans amounted to $403.3 million and $257.4 million at December 31, 2010 and 2009, respectively. The Company’s residential mortgage loans are generally secured by properties located within the Bank’s market area. At December 31, 2010,
residential real estate loans covered under loss share agreements totaled $94.7 million.
Many of the residential mortgage loans that the Company makes are originated for the account of third parties. Such loans are classified as loans held for sale in the financial statements. At December 31, 2010 and 2009, loans held for sale amounted to $6.8 million and $2.8 million, respectively. The Company receives fees for each such loan originated, with such fees aggregating $1.6 million for the year ended December 31, 2010 and $1.1 million for the year ended December 31, 2009. The Company anticipates that it will continue to be an active originator of residential loans for the account of third parties. The Company does not originate sub-prime mortgages, unless through a correspondent who has full
underwriting authority. In these cases, since the Company is not involved in the credit decision, there is limited exposure to defaults and buy back provisions.
Commercial real estate loans totaled $677.7 million and $449.2 million at December 31, 2010 and 2009, respectively, with $120.0 million covered under loss share agreements at December 31, 2010. This lending has involved loans secured principally by commercial buildings for office, storage and warehouse space, and by a lesser extent, agricultural properties. Generally in underwriting commercial real estate loans, the Company requires the personal guaranty of borrowers and a demonstrated cash flow capability sufficient to service the debt. Loans secured by commercial real estate may be in greater amount and involve a greater degree of risk than 1-4 family residential mortgage loans. Payments on such loans are often dependent on successful operation or
management of the properties.
Real Estate Construction Loans
Real estate loans are made for constructing 1-4 family and multi-family residential properties, the acquisition and development of land for the purpose of providing residential and commercial lots for sale, and the construction of commercial properties. The Company primarily offers a variable rate option and provides customers access to short-term conventional real estate financing through a reasonable construction and development process. At December 31, 2010, the real estate construction loan portfolio was $265.3 million, with $65.3 million of loans covered under loss share agreements. Loans not covered under loss share agreements consisted of the following categories:
46
|
·
|
Acquisition and development
|
$ | 26.2 million | ||
|
·
|
Residential construction
|
$ | 29.9 million | ||
|
·
|
Commercial construction
|
$ | 44.9 million | ||
|
·
|
1-4 family buildable lots
|
$ | 42.8 million | ||
|
·
|
Commercial buildable lots
|
$ | 13.6 million | ||
|
·
|
Land held for development
|
$ | 26.9 million | ||
|
·
|
Raw/Agricultural land
|
$ | 15.7 million |
Management closely monitors residential real estate, specifically its Acquisition, Development and Construction loans, since these loans are generally considered most vulnerable to economic downturns. We attempt to mitigate this risk by employing experienced real estate lenders, providing real estate underwriting standards within the Credit Policy Manual, engaging an outside firm to conduct ongoing credit reviews and, most recently, contracting with a firm to provide quarterly real estate updates and trends for communities in which we have credit exposure. Most residential construction loans require full personal guarantees from the principals of the borrowing entity and maturities are typically limited to 12 months. Trends within the Bank’s real estate portfolio have
followed the general trends within our markets including increases in average time houses are on the market for sale and housing inventory available for sale with a slight decrease in average home prices. Increases in 2010 and 2009 non-performing assets were primarily due to specific adjustments within the real estate portfolio.
Consumer and Other
Consumer and other loans include automobile loans, boat and recreational vehicle financing and miscellaneous secured and unsecured personal loans. Consumer loans generally can carry significantly greater risks than other loans, even if secured, because the collateral often consists of rapidly depreciating assets such as automobiles and equipment. Repossessed collateral securing a defaulted consumer loan may not provide an adequate source of repayment of the loan. Consumer loan collections are sensitive to job loss, illness and other personal factors. The Company attempts to manage the risks inherent in consumer lending by following established credit guidelines and underwriting practices designed to minimize risk of loss. Consumer and other loans amounted to
$14.5 million and $12.7 million at December 31, 2010 and 2009, respectively.
ASSET QUALITY
The Company considers asset quality to be of primary importance, and employs a formal internal loan review process to ensure adherence to its lending policy as approved by the Company’s and the Bank’s Boards of Directors. It is the responsibility of each lending officer to assign an appropriate risk grade to every loan originated. Credit Administration, through the loan review process, validates the accuracy of the initial risk grade assessment. In addition, as a given loan's credit quality improves or deteriorates, it is Credit Administration's and the Lender’s responsibility to change the borrower's risk grade accordingly. The function of determining the allowance for loan losses is fundamentally driven by the risk grade system. In
determining the allowance for loan losses and any resulting provision to be charged against earnings, particular emphasis is placed on the results of the loan review process. Consideration is also given to historical loan loss experience, the value and adequacy of collateral, economic conditions in the Company’s market area and other factors. For loans determined to be impaired, the allowance is based on discounted cash flows using the loan's initial effective interest rate or the fair value of the collateral for certain collateral dependent loans. This evaluation is inherently subjective, as it requires material estimates, including the amounts and timing of future cash flows expected to be received on impaired loans that may be susceptible to significant change. The allowance for loan losses represents management's estimate of the appropriate level of reserve to provide for probable losses inherent in the loan portfolio.
The Company’s policy regarding past due loans normally requires a prompt charge-off to the allowance for loan losses following timely collection efforts and a thorough review. Further efforts are then pursued through various means available. Loans carried in a non-accrual status are generally collateralized and probable losses are considered in the determination of the allowance for loan losses. During 2010, management tightened underwriting guidelines and procedure and rewritten loan policies, along with an enhanced internal loan review function, to address the changing risk of the Company’s loan portfolio.
47
NONPERFORMING ASSETS
The Company’s nonperforming assets, which consist of loans past due 90 days or more, real estate acquired in the settlement of loans, restructured loans and loans in nonaccrual status, increased to $135.3 million, or 6.29% of total assets, at December 31, 2010 from $33.4 million, or 2.04% of total assets, at December 31, 2009. The increase is primarily related to our acquisition of Beach First. The majority of these nonperforming assets are covered under loss share agreements. Excluding assets covered by loss share agreements, nonperforming assets increased to $50.2 million, or 2.75% of assets not covered under loss share agreements. Despite increasing levels of nonperforming assets, management believes asset quality
and nonperforming levels remain favorable to its peers. Our allowance for loan losses, expressed as a percentage of gross loans, was 1.65% and 1.60% at December 31, 2010 and 2009, respectively.
Table 14 sets forth, for the periods indicated, information with respect to the Bank’s nonaccrual loans, restructured loans, total nonperforming loans (nonaccrual loans plus restructured loans plus loans ninety days past due and still accruing), and total nonperforming assets.
Table 14
Nonperforming Assets
($ in thousands)
|
At December 31,
|
||||||||||||||||||||
|
2010
|
2009
|
2008
|
2007
|
2006
|
||||||||||||||||
|
Nonaccrual loans (1):
|
||||||||||||||||||||
|
Not covered by loss share agreements
|
$ | 26,224 | $ | 19,050 | $ | 13,319 | $ | 3,599 | $ | 1,074 | ||||||||||
|
Covered by loss share agreements
|
64,753 | - | - | - | - | |||||||||||||||
|
90 days past due:
|
||||||||||||||||||||
|
Not covered by loss share agreements
|
44 | - | - | - | 165 | |||||||||||||||
|
Covered by loss share agreements
|
4,554 | - | - | - | - | |||||||||||||||
|
Other real estate owned
|
||||||||||||||||||||
|
Not covered by loss share agreements
|
23,912 | 14,325 | 5,022 | 2,509 | 1,078 | |||||||||||||||
|
Covered by loss share agreements
|
15,825 | - | - | - | - | |||||||||||||||
|
Total nonperforming assets
|
$ | 135,312 | $ | 33,375 | $ | 18,341 | $ | 6,108 | $ | 2,317 | ||||||||||
|
Nonperforming assets not covered by loss share
|
$ | 50,180 | $ | 33,375 | $ | 18,341 | $ | 6,108 | $ | 2,317 | ||||||||||
|
Commercial loans restructured/modified not included in categories above :
|
$ | 5,107 | $ | 4,168 | $ | - | $ | - | $ | - | ||||||||||
|
Allowance for loan losses
|
24,813 | 17,309 | 13,210 | 11,784 | 10,400 | |||||||||||||||
|
Loans outstanding, net
|
1,508,180 | 1,079,179 | 1,007,788 | 932,562 | 774,664 | |||||||||||||||
|
Not covered by loss share agreements
|
1,198,838 | 1,079,179 | 1,007,788 | 932,562 | 774,664 | |||||||||||||||
|
Nonperforming assets to loans and other real estate
|
8.74 | % | 3.05 | % | 1.81 | % | 0.60 | % | 0.30 | % | ||||||||||
|
Not covered by loss share agreements
|
4.10 | % | 3.05 | % | 1.81 | % | 0.60 | % | 0.30 | % | ||||||||||
|
Nonperforming assets to total assets
|
6.29 | % | 2.04 | % | 1.17 | % | 0.54 | % | 0.24 | % | ||||||||||
|
Not covered by loss share agreements
|
2.75 | % | 2.04 | % | 1.17 | % | 0.54 | % | 0.24 | % | ||||||||||
|
Allowance for loan losses to nonperforming loans
|
25.96 | % | 90.86 | % | 99.18 | % | 327.42 | % | 839.39 | % | ||||||||||
|
Not covered by loss share agreements
|
94.46 | % | 90.86 | % | 99.18 | % | 327.42 | % | 839.39 | % | ||||||||||
|
(1)
|
Includes restructured loans of $3.4 million, $348,000, $665,000 and $2.6 million at December 31, 2010, 2009, 2008 and 2007, respectively.
|
The Company’s consolidated financial statements are prepared on the accrual basis of accounting, including the recognition of interest income on loans, unless we place a loan on nonaccrual basis. The Company accounts for loans on a nonaccrual basis when it has serious doubts about the ability to collect principal or interest in full. Generally, the Company’s policy is to place a loan on nonaccrual status before the loan becomes past due 90 days. Loans are also placed on nonaccrual status in cases where management is uncertain whether the borrower can satisfy the contractual terms of the loan agreement. Amounts received on nonaccrual loans generally are applied first to principal and then to interest only after all principal has been
collected. Restructured loans are those for which concessions, including the reduction of interest rates below a rate otherwise available to that borrower or the deferral of interest or principal, have been granted due to the borrower's weakened financial condition. The Company accrues interest on restructured loans at the restructured rates when management anticipates that no loss of original principal will occur. Potential problem loans are loans which are currently performing and are not included in nonaccrual or restructured loans above, but about which management has serious doubts as to the borrower's ability to comply with present repayment terms. These loans are likely to be included later in nonaccrual, past due or restructured loans, so they are considered by management in assessing the adequacy of the Company’s allowance for loan losses. At December 31, 2010, the Company had $91.0 million in nonaccrual and
renegotiated loans, an increase of $71.9 million from $19.1 million at the end of 2009, and of this increase, $64.8 million were from nonaccrual loans covered under loss share agreements. The amount of interest that would have been recorded on nonaccrual loans had the loans not been classified as “nonaccrual” was $7.5 million and $476,000 for the years ended December 31, 2010 and 2009, respectively. For 2008, the amounts were not considered material. There were $4.6 million of loans ninety-days past due and still accruing interest at the end of 2010, with $4.6 million covered under loss share agreements. There were no loans ninety-days past due and still accruing interest at December 31, 2009. Real estate acquired in the settlement of loans consists of foreclosed, repossessed and idled properties, both residential and commercial. At December 31, 2010 and 2009, there were $39.7 million and $14.3 million,
respectively, in assets classified as real estate owned, with $15.8 million covered under loss share agreements at December 31, 2010. The carrying values of real estate owned represent the lower of the carrying amount or fair value less costs to sell.
48
The following is a summary of other real estate owned at the periods presented:
Table 15
Other Real Estate Owned
($ in thousands)
|
December 31,
|
||||||||||||
|
2010
|
2009
|
2008
|
||||||||||
|
Residential 1-4 family properties
|
$ | 10,739 | $ | 2,391 | $ | 2,704 | ||||||
|
Multifamily properties
|
1,101 | - | - | |||||||||
|
Commercial properties
|
10,757 | 1,743 | - | |||||||||
|
Construction, land development and other land
|
17,140 | 10,191 | 2,318 | |||||||||
|
Total other real estate owned
|
$ | 39,737 | $ | 14,325 | $ | 5,022 | ||||||
ANALYSIS OF ALLOWANCE FOR LOAN LOSSES
The allowance for loan losses is established through charges to earnings in the form of a provision for loan losses. Management increases allowance for loan losses by provisions charged to operations and by recoveries of amounts previously charged off. The allowance is reduced by loans charged off. Management evaluates the adequacy of the allowance at least monthly. In addition, on a monthly basis our Board of Directors reviews the loan portfolio, conducts an evaluation of credit quality and reviews the computation of the loan loss allowance. In evaluating the adequacy of the allowance, management considers the growth, composition and industry diversification of the portfolio, historical loan loss experience, current delinquency levels, adverse situations
that may affect a borrower's ability to repay, estimated value of any underlying collateral, prevailing economic conditions and other relevant factors deriving from the Bank’s history of operations. In addition to the Company’s history, management also considers the loss experience and allowance levels of other similar banks and the historical experience encountered by our management and senior lending officers prior to joining us. In addition, regulatory agencies, as an integral part of their examination process, periodically review allowance for loan losses and may require us to make additions for estimated losses based upon judgments different from those of management. No regulatory agency asked for a change in our allowance for loan losses during 2010 or 2009.
Management uses the risk-grading program, as described under "Asset Quality," to facilitate evaluation of probable inherent loan losses and the adequacy of the allowance for loan losses. In this program, risk grades are initially assigned by loan officers and reviewed by Credit Administration, and tested by the Company’s internal auditor. The testing program includes an evaluation of a sample of new loans, large loans, loans that are identified as having potential credit weaknesses, loans past due 90 days or more and still accruing, and nonaccrual loans. The Company strives to maintain the loan portfolio in accordance with conservative loan underwriting policies that result in loans specifically tailored to the needs of the Company’s market area. Every
effort is made to identify and minimize the credit risks associated with such lending strategies. The Company has no foreign loans and does not engage in significant lease financing or highly leveraged transactions.
Management follows a loan review program designed to evaluate the credit risk in our loan portfolio. Through this loan review process, we maintain an internally classified watch list that helps management assess the overall quality of the loan portfolio and the adequacy of the allowance for loan losses. In establishing the appropriate classification for specific assets, management considers, among other factors, the estimated value of the underlying collateral, the borrower's ability to repay, the borrower's payment history and the current delinquent status. As a result of this process, certain loans are categorized as substandard, doubtful or loss and reserves are allocated based on management's judgment and historical experience.
49
Loans classified as "substandard" are those loans with clear and defined weaknesses such as unfavorable financial ratios, uncertain repayment sources or poor financial condition that may jeopardize the liquidation of the debt. They are characterized by the distinct possibility that the Company will sustain some losses if the deficiencies are not corrected. A reserve range of 5% - 45% is generally allocated to these loans, depending on credit quality. Loans classified as "doubtful" are those loans that have characteristics similar to substandard loans but with an increased risk that collection or liquidation in full is highly questionable and improbable. A reserve of 50% or greater is generally allocated to loans classified as doubtful. Loans classified as
"loss" are considered uncollectible and of such little value that their continuance as bankable assets is not warranted. This classification does not mean that the loan has absolutely no recovery or salvage value but rather it is not practical or desirable to defer writing off this asset even though partial recovery may be achieved in the future. As a practical matter, when loans are identified as loss they are charged off against the allowance for loan losses. In addition to the above classification categories, the Company also categorizes loans based upon risk grade and loan type, assigning an allowance allocation based upon each category.
Growth in loans outstanding has, throughout the Company’s history, been the motivating factor for increases in the Company’s allowance for loan losses and the resultant provisions for loan losses necessary to provide for those increases. During 2010 and 2009, the significant weakness in the local economies had weakened many borrowers financial condition. During 2010, the Company experienced a significant increase in our nonperforming asset levels as the management aggressively recognized impairments on performing credits where it had become evident that the underlying collateral values would no longer support the principal repayment terms. The Company is actively restructuring these relationships with borrowers in an effort to restore these credits to an accruing
status.
Table 16 shows the allocation of the allowance for loan losses at the dates indicated. The allocation is based on an evaluation of defined loan problems, historical ratios of loan losses and other factors that may affect future loan losses in the categories of loans shown.
Table 16
Allocation of the Allowance for Loan Losses
($ in thousands)
|
December 31,
|
|||||||||||||||||||||||||||||||||||
|
2010
|
2009
|
2008
|
2007
|
2006
|
|||||||||||||||||||||||||||||||
|
% of Total
|
% of Total
|
% of Total
|
% of Total
|
% of Total
|
|||||||||||||||||||||||||||||||
|
Amount
|
Loans (1)
|
Amount
|
Loans (1)
|
Amount
|
Loans (1)
|
Amount
|
Loans (1)
|
Amount
|
Loans (1)
|
||||||||||||||||||||||||||
|
Real estate loans
|
$ | 15,839 | 71.7 | % | $ | 11,355 | 65.6 | % | $ | 7,516 | 56.9 | % | $ | 6,375 | 54.1 | % | $ | 5,970 | 57.5 | % | |||||||||||||||
|
Real estate construction loans
|
5,207 | 17.6 | % | 3,739 | 21.6 | % | 4,029 | 30.5 | % | 3,618 | 30.7 | % | 2,735 | 26.3 | % | ||||||||||||||||||||
|
Commercial and industrial loans
|
3,525 | 9.0 | % | 1,817 | 10.5 | % | 1,295 | 9.8 | % | 1,391 | 11.8 | % | 1,303 | 12.5 | % | ||||||||||||||||||||
|
Consumer loans and other
|
209 | 1.0 | % | 208 | 1.2 | % | 172 | 1.3 | % | 223 | 1.9 | % | 249 | 2.3 | % | ||||||||||||||||||||
|
Leases
|
33 | 0.7 | % | 190 | 1.1 | % | 198 | 1.5 | % | 177 | 1.5 | % | 143 | 1.4 | % | ||||||||||||||||||||
| $ | 24,813 | 100.0 | % | $ | 17,309 | 100.0 | % | $ | 13,210 | 100.0 | % | $ | 11,784 | 100.0 | % | $ | 10,400 | 100.0 | % | ||||||||||||||||
(1) Represents total of all outstanding loans in each category as a percent of total loans outstanding, grouped by collateral type.
Table 17 sets forth for the periods indicated information regarding changes in the Company’s allowance for loan losses.
50
Table 17
Loan Loss and Recovery Experience
($ in thousands)
|
At or for the Year Ended December 31,
|
||||||||||||||||||||
|
2010
|
2009
|
2008
|
2007
|
2006
|
||||||||||||||||
|
Total loans, net outstanding at end of year
|
$ | 1,508,180 | $ | 1,079,179 | $ | 1,007,788 | $ | 932,562 | $ | 774,664 | ||||||||||
|
Average loans outstanding during the year
|
$ | 1,359,107 | $ | 1,026,635 | $ | 981,069 | $ | 849,271 | $ | 615,689 | ||||||||||
|
Allowance for loan losses at beginning of year
|
$ | 17,309 | $ | 13,210 | $ | 11,784 | $ | 10,400 | $ | 6,140 | ||||||||||
|
Provision for loan losses
|
26,382 | 15,750 | 7,075 | 3,090 | 2,655 | |||||||||||||||
|
Allowance acquired in merger of SterlingSouth Bank
|
- | - | - | - | 2,816 | |||||||||||||||
| 43,691 | 28,960 | 18,859 | 13,490 | 11,611 | ||||||||||||||||
|
Loans charged off:
|
||||||||||||||||||||
|
Commercial real estate
|
5,038 | 3,171 | 516 | - | - | |||||||||||||||
|
Commercial construction
|
4,330 | 5,046 | 875 | 1,107 | - | |||||||||||||||
|
Commercial and industrial
|
5,342 | 941 | 2,529 | 248 | 352 | |||||||||||||||
|
Leases
|
9 | 60 | - | - | - | |||||||||||||||
|
Residential construction
|
725 | 1,183 | 790 | - | - | |||||||||||||||
|
Residential mortgage
|
3,624 | 1,262 | 816 | 310 | 738 | |||||||||||||||
|
Consumer and other
|
263 | 204 | 257 | 90 | 199 | |||||||||||||||
|
Total charge-offs
|
19,331 | 11,867 | 5,783 | 1,755 | 1,289 | |||||||||||||||
|
Recoveries of loans previously charged off:
|
||||||||||||||||||||
|
Commercial real estate
|
30 | 4 | 23 | - | - | |||||||||||||||
|
Commercial construction
|
36 | - | - | - | - | |||||||||||||||
|
Commercial and industrial
|
122 | 133 | 54 | - | 8 | |||||||||||||||
|
Residential construction
|
26 | 32 | - | - | - | |||||||||||||||
|
Residential mortgage
|
221 | 20 | 33 | 30 | 64 | |||||||||||||||
|
Consumer and other
|
18 | 27 | 24 | 19 | 6 | |||||||||||||||
|
Total recoveries
|
453 | 216 | 134 | 49 | 78 | |||||||||||||||
|
Net charge-offs
|
18,878 | 11,651 | 5,649 | 1,706 | 1,211 | |||||||||||||||
|
Allowance for loan losses at end of year
|
$ | 24,813 | $ | 17,309 | $ | 13,210 | $ | 11,784 | $ | 10,400 | ||||||||||
|
Ratios:
|
||||||||||||||||||||
|
Net charge-offs as a percent of average loans
|
1.39 | % | 1.13 | % | 0.58 | % | 0.20 | % | 0.20 | % | ||||||||||
|
Allowance for loan losses as a percent of loans at end of year
|
1.65 | % | 1.60 | % | 1.31 | % | 1.26 | % | 1.34 | % | ||||||||||
For the fiscal years 2006 through 2009, the Bank’s loan loss experience has seen net loan charge-offs in each year range from 0.20% to 1.13% of average loans outstanding. For 2010, net charge-offs were 1.39% of average loans outstanding as compared to 1.13% in the prior year. The elevated levels of net charge-offs for 2010 and 2009, compared to 2008 and prior years, was due primarily to a significant softening of both the local housing market and local economy.
The Company’s allowance for loan losses at December 31, 2010 of $24.8 million represents 1.65% of total loans outstanding, excluding loans held for sale. The Company’s allowance for loan losses at December 31, 2009 of $17.3 million represents 1.60% of total loans outstanding, excluding loans held for sale. This increase in the allowance relative to our gross loans was primarily due to a higher level of perceived risk in this environment, and a greater amount of specific credits where impairment assessments have been assigned.
The allowance for loan losses represents management's estimate of an amount adequate to provide for known and inherent losses in the loan portfolio in the normal course of business. The Company makes specific allowances that are allocated to certain individual loans and pools of loans based on risk characteristics, as discussed below. While management believes that it uses the best information available to establish the allowance for loan losses, future adjustments to the allowance may be necessary and results of operations could be adversely affected if circumstances differ substantially from the assumptions used in making the determinations.
51
Furthermore, while management believes it has established the allowance for loan losses in conformity with U.S. generally accepted accounting principles, there can be no assurance that regulators, in reviewing our portfolio, will not require an adjustment to the allowance for loan losses. No regulatory agency asked for a change in our allowance for loan losses during 2010 or 2009. In addition, because future events affecting borrowers and collateral cannot be predicted with certainty, there can be no assurance that the existing allowance for loan losses is adequate or that increases will not be necessary should the quality of any loans deteriorate as a result of the factors discussed herein. Any material increase in the allowance for loan losses may adversely affect the
Company’s financial condition and results of operations.
ASSET/LIABILITY MANAGEMENT
The Company’s results of operations depend substantially on its net interest income. Like most financial institutions, the Company's interest income and cost of funds are affected by general economic conditions and by competition in the marketplace. The purpose of asset/liability management is to provide stable net interest income growth by protecting the Company’s earnings from undue interest rate risk, which arises from volatile interest rates and changes in the balance sheet mix, and by managing the risk/return relationships between liquidity, interest rate risk, market risk, and capital adequacy. The Company maintains, and has complied with, an asset/liability management policy approved by the Board of Directors of the Company that provides guidelines for
controlling exposure to interest rate risk by utilizing the following ratios and trend analysis: liquidity, equity, volatile liability dependence, portfolio maturities, maturing assets and maturing liabilities, earnings at risk, and economic value at risk. This policy is to control the exposure of its earnings to changing interest rates by generally endeavoring to maintain a position within a narrow range around an "earnings neutral position," which is defined as the mix of assets and liabilities that generate a net interest margin that is least affected by interest rate changes.
When suitable lending opportunities are not sufficient to utilize available funds, the Company has generally invested such funds in investment securities, primarily U.S. Treasury securities, securities issued by governmental agencies, government agency sponsored mortgage-backed securities and securities issued by local governmental municipalities. The investment securities portfolio contributes to the Company's profits, and plays an important part in the overall interest rate management. However, management of the investment securities portfolio alone cannot balance overall interest rate risk. The investment securities portfolio must be used in combination with other asset/liability techniques to actively manage the balance sheet. The primary objectives in the
overall management of the investment securities portfolio are safety, yield, liquidity, asset/liability management (interest rate risk), and investing in securities that can be pledged for public deposits or as collateral for FHLB advances or borrowings through the Federal Reserve’s Discount Window.
In reviewing the needs of the Company with regard to proper management of its asset/liability program, the Company’s management estimates its future needs, taking into consideration historical periods of high loan demand and low deposit balances, estimated loan and deposit increases (due to increased demand through marketing), and forecasted interest rate changes. A number of measures are used to monitor and manage interest rate risk, including income simulations and interest sensitivity analyses. An income simulation model is the primary tool used to assess the direction and magnitude of changes in net interest income resulting from changes in interest rates. Key assumptions in the model include prepayments on loan and loan-backed assets, cash flows and maturities of
other investment securities, loan and deposit volumes and pricing. These assumptions are inherently uncertain and, as a result, the model cannot precisely estimate net interest income or precisely predict the impact of higher or lower interest rates on net interest income. Actual results will differ from simulated results due to timing, magnitude and frequency of interest rate changes and changes in market conditions and management strategies, among other factors.
Based on the results of the income simulation model as of December 31, 2010, looking forward for 12 months, the Company would expect an increase in net interest income of $827,000 if interest rates increase from current rates by 300 basis points and a decrease in net interest income of $2.0 million if applicable interest rates decrease from current rates by 300 basis points. If rates increase from the current rates by 400 basis points, the Company would expect an increase in net interest income of $2.3 million. However, in today’s economic environment, simulation models may not be as reliable as in the past.
52
The analysis of an institution's interest rate gap (the difference between the repricing of interest-earning assets and interest-bearing liabilities during a given period of time) is another standard tool for the measurement of the exposure to interest rate risk. Management believes that because interest rate gap analysis does not address all factors that can affect earnings performance, it should be used in conjunction with other methods of evaluating interest rate risk.
The following Table 18 “Interest Rate Sensitivity Analysis” sets forth the amounts of interest-earning assets and interest-bearing liabilities outstanding at December 31, 2010, which are projected to reprice or mature in each of the future time periods presented. Except as stated below, the amounts of assets and liabilities shown which reprice or mature within a particular period were determined in accordance with the contractual terms of the assets or liabilities. Loans with adjustable rates are shown as being due at the end of the next upcoming adjustment period. Money market deposit accounts are considered rate sensitive and are placed in the shortest period, while negotiable order of withdrawal or other transaction accounts are assumed to be more stable sources
that are less price elastic and have been placed in the longest period. In making the gap computations, none of the assumptions sometimes made regarding prepayment rates and deposit decay rates have been used for any interest-earning assets or interest-bearing liabilities. In addition, the table does not reflect scheduled principal payments, which will be received throughout the lives of the loans. The interest rate sensitivity of the Company’s assets and liabilities illustrated in the following table would vary substantially if different assumptions were used or if actual experience differs from that indicated by such assumptions.
Table 18
Interest Rate Sensitivity Analysis
($ in thousands)
|
At December 31, 2010
|
||||||||||||||||||||
|
3 Months
|
Over 3 Months
|
Total Within
|
Over 12
|
|||||||||||||||||
|
or Less
|
to 12 Months
|
12 Months
|
Months
|
Total
|
||||||||||||||||
|
Interest-earning assets
|
||||||||||||||||||||
|
Loans
|
$ | 783,850 | $ | 213,825 | $ | 997,675 | $ | 510,696 | $ | 1,508,371 | ||||||||||
|
Interest rate swap
|
(15,000 | ) | 15,000 | - | - | - | ||||||||||||||
|
Loans held for sale
|
6,751 | - | 6,751 | - | 6,751 | |||||||||||||||
|
Investment securities, cost
|
9,328 | 21,168 | 30,496 | 322,057 | 352,553 | |||||||||||||||
|
Other earning assets
|
22,275 | 9,146 | 31,421 | - | 31,421 | |||||||||||||||
|
Total interest-earning assets
|
$ | 807,204 | $ | 259,139 | $ | 1,066,343 | $ | 832,753 | $ | 1,899,096 | ||||||||||
|
Interest-bearing liabilities
|
||||||||||||||||||||
|
Interest-bearing demand deposits
|
$ | 718,448 | $ | - | $ | 718,448 | $ | 338,508 | $ | 1,056,956 | ||||||||||
|
Interest rate cap
|
(250,000 | ) | - | (250,000 | ) | - | (250,000 | ) | ||||||||||||
|
Time deposits and savings
|
215,471 | 304,802 | 520,273 | 393,294 | 913,567 | |||||||||||||||
|
Borrowings
|
88,915 | 4,037 | 92,952 | 64,968 | 157,920 | |||||||||||||||
|
Total interest-bearing liabilities
|
$ | 772,834 | $ | 308,839 | $ | 1,081,673 | $ | 796,770 | $ | 1,878,443 | ||||||||||
|
Interest sensitivity gap
|
$ | 34,370 | $ | (49,700 | ) | $ | (15,330 | ) | $ | 35,983 | $ | 20,653 | ||||||||
|
Cumulative interest rate sensitivity gap
|
34,370 | (15,330 | ) | (15,330 | ) | 20,653 | 20,653 | |||||||||||||
|
Cumulative interest rate sensitivity gap as a percent of total interest-earning assets
|
1.81 | % | -0.81 | % | -0.81 | % | 1.09 | % | 1.09 | % | ||||||||||
|
Cumulative ratio of interest-sensitive assets to interest-sensitive liabilities
|
104.45 | % | 98.58 | % | 98.58 | % | 101.10 | % | 101.10 | % | ||||||||||
The interest rate sensitivity analysis indicates that if assets and liabilities reprice in the time intervals indicated in the table, the Company is liability sensitive within twelve months, and asset sensitive thereafter. As stated above, certain shortcomings are inherent in the method of analysis presented in the table. For example, although certain assets and liabilities may have similar maturities or periods to repricing, they may react in different degrees to changes in market interest rates. Also, the interest rates on certain types of assets and liabilities may fluctuate in advance of changes in market interest rates, while interest rates on other types may lag behind changes in market interest rates. For instance, while the table is based on the assumption that money market accounts are immediately sensitive to movements in rates, the Company expects that in a changing rate environment the amount of the adjustment in interest rates for such accounts would be less than the adjustment in categories of assets
that are considered to be immediately sensitive. The same is true for all other interest bearing transaction accounts. Additionally, certain assets have features that restrict changes in the interest rates of such assets both on a short-term basis and over the lives of such assets. Further, in the event of a change in market interest rates, prepayment and early withdrawal levels could deviate significantly from those assumed in calculating the tables. Finally, the ability of many borrowers to service their adjustable-rate debt may decrease in the event of an increase in market interest rates. Due to these shortcomings, the Company places primary emphasis on its income simulation model when managing its exposure to changes in interest rates.
53
LIQUIDITY
Liquidity management involves the ability to meet and ensure the cash flow requirements of the Company’s depositors and borrowers, as well as the Company’s various needs, including operating, strategic and capital. In addition, the Company’s principal source of liquidity is dividends from the Bank and an unsecured revolving line of credit with another financial institution. Liquidity is required at the parent holding company level for the purpose of paying dividends declared for its common and preferred shareholders, servicing debt, as well as general corporate expenses. The Company’s Asset/Liability Committee meets on a regular basis to consider the operating needs of the Company and the Bank, reviewing internal analysis of its liquidity, knowledge of
current economic and market trends and forecasts of future conditions.
The asset portion of the balance sheet provides liquidity primarily through loan principal repayments, maturities of investment securities available for sale, interest-earning deposits in other banks and occasional sales of various assets. These funds are used to make loans and to fund continuing operations. At December 31, 2010, liquid assets totaled $383.0 million, or 17.8% of total assets, compared to $408.7 million, or 25% of assets at December 31, 2009.
The liability portion of the balance sheet provides liquidity primarily through various interest-bearing and non-interest-bearing deposit accounts. The Company may purchase federal funds through unsecured federal funds guidance lines of credit totaling $52.0 million, with no outstanding balances at December 31, 2010. The Company also has an unsecured revolving line of credit of up to $25.0 million with a bank, with $3.3 million outstanding at December 31, 2010. In addition, the Company had credit availability with the FRB and FHLB of approximately $385.5 million, with $114.0 million outstanding. The Company also has access to the wholesale deposit markets for additional liquidity.
Total net cash outflows totaled $18.1 million during 2010, a decrease of $29.5 million from net cash inflows of $11.4 million during 2009. For 2008, net cash inflows totaled $15.7 million. Cash flows from operations increased to $35.1 million in 2010 from $3.3 million in 2009 and from $8.5 million in 2008. Cash provided by operating activities increased primarily as a result of an increase in the provision for loan losses and a decrease in other assets. Cash used in investing activities were $9.6 million in 2010, a decrease from $43.8 million in 2009 and $431.0 million used in 2008. Cash provided from the Beach First acquisition was offset primarily to fund loan growth and invest in bank-owned life insurance. The cash flows used in
financing activities were $43.7 million in 2010, compared to cash flows provided by financing activities in 2009 of $52.0 million in 2009 and from $438.2 million in 2008. The cash used by financing activities were for matured wholesale deposits and payment of debt. The Consolidated Statement of Cash Flows in the accompanying consolidated financial statements provides a detailed analysis of cash from operating, investing and financing activities for each of the years ended December 31, 2010, 2009 and 2008.
Management anticipates that the Company will rely primarily upon wholesale funding sources, customer deposits, loan repayments and current earnings to provide liquidity, fund loans and to purchase investment securities. Investment securities will be primarily issued by the federal government and its agencies, municipal securities and government agency sponsored mortgage-backed securities. See “Deposits” and “Borrowings” in this Item 7 for an overview of the deposit activities and borrowings of the Company and the Bank.
In the normal course of business there are various outstanding contractual obligations of the Company that will require future cash outflows. In addition there are commitments and contingent liabilities, such as commitments to extend credit that may or may not require future cash outflows. Table 20 in this Item 7, “Contractual Obligations and Commitments”, summarizes the Company’s contractual obligations and commitments as of December 31, 2010.
MARKET RISK
Market risk reflects the risk of economic loss resulting from adverse changes in market price and interest rates. This risk of loss can be reflected in diminished current market values and/or reduced potential net interest income in future periods. Our market risk arises primarily from interest rate risk inherent in our lending and deposit-taking activities. The structure of our loan and deposit portfolios is such that a significant decline in interest rates may adversely impact net market values and net interest income. We do not maintain a trading account nor are we subject to currency exchange risk or commodity price risk. Interest rate risk is monitored as part of the Bank’s asset/liability management function. See “Asset/Liability
Management” section of this Item 7.
54
Table 18 in this Item 7 sets forth the amounts of interest-earning assets and interest-bearing liabilities outstanding at December 31, 2010, which is projected to reprice or mature in each of the future time periods presented.
Table 19 presents information about the contractual maturities, average interest rates and estimated fair values of our financial instruments that are considered market risk sensitive at December 31, 2010.
Table 19
Market Risk Sensitive Investments
($ in thousands)
|
Expected Maturities of Market Sensitive Instruments Held
|
||||||||||||||||||||||||||||||||||||
|
at December 31, 2010 Occuring in the Indicated Year
|
||||||||||||||||||||||||||||||||||||
|
Average
|
||||||||||||||||||||||||||||||||||||
|
Interest
|
Fair
|
|||||||||||||||||||||||||||||||||||
|
2011
|
2012
|
2013
|
2014
|
2015
|
Beyond
|
Total
|
Rate
|
Value
|
||||||||||||||||||||||||||||
|
Interest-earning assets:
|
||||||||||||||||||||||||||||||||||||
|
Interest-earning bank
|
$ | 22,275 | $ | - | $ | - | $ | - | $ | - | $ | - | $ | 22,275 | 0.25 | % | $ | 22,275 | ||||||||||||||||||
|
Other earning assets
|
6,751 | - | - | - | - | 9,146 | 15,897 | 1.39 | % | 15,897 | ||||||||||||||||||||||||||
|
Investment securities (1) (2)
|
29,894 | 17,032 | 24,073 | 21,462 | 20,852 | 239,240 | 352,553 | 6.13 | % | 358,151 | ||||||||||||||||||||||||||
|
Loans - fixed rate (3)
|
212,117 | 150,124 | 100,082 | 131,580 | 87,720 | 90,185 | 771,808 | 6.29 | % | 758,752 | ||||||||||||||||||||||||||
|
Loans - variable rate (3)
|
258,212 | 93,193 | 62,128 | 85,514 | 57,010 | 180,506 | 736,563 | 4.98 | % | 722,563 | ||||||||||||||||||||||||||
| $ | 529,249 | $ | 260,349 | $ | 186,283 | $ | 238,556 | $ | 165,582 | $ | 519,077 | $ | 1,899,096 | 5.64 | % | $ | 1,877,638 | |||||||||||||||||||
|
Interest-bearing liabilities:
|
||||||||||||||||||||||||||||||||||||
|
NOW and money market
|
$ | 468,448 | $ | - | $ | - | $ | 250,000 | $ | - | $ | 88,508 | $ | 806,956 | 1.37 | % | $ | 806,956 | ||||||||||||||||||
|
Time deposits and savings
|
520,273 | 185,282 | 77,872 | 65,334 | 27,216 | 37,590 | 913,567 | 2.30 | % | 939,776 | ||||||||||||||||||||||||||
|
Subordinated debentures
|
- | - | - | - | - | 31,713 | 31,713 | 2.74 | % | 17,940 | ||||||||||||||||||||||||||
|
Borrowings
|
60,207 | 4,000 | - | 17,000 | - | 45,000 | 126,207 | 1.89 | % | 130,582 | ||||||||||||||||||||||||||
| $ | 1,048,928 | $ | 189,282 | $ | 77,872 | $ | 332,334 | $ | 27,216 | $ | 202,811 | $ | 1,878,443 | 1.88 | % | $ | 1,895,254 | |||||||||||||||||||
|
(1)
|
Based on amortized cost, taxable-equivalent basis.
|
|
(2)
|
Callable securities and borrowings with favorable market rates at December 31, 2010 are assumed to mature at their call dates for purposes of this table.
|
|
(3)
|
Includes nonaccrual loans but not the allowance for loan losses
|
OFF BALANCE SHEET RISK
In the ordinary course of business, the Company enters into various types of transactions that include commitments to extend credit that are not included in loans receivable, net, presented on the Company's consolidated balance sheets. The Company applies the same credit standards to these commitments as it uses in all its lending activities and has included these commitments in its lending risk evaluations. The Company’s exposure to credit loss under commitments to extend credit is represented by the amount of these commitments. The Company does not expect that all such commitments will fund. See the following table 20 and Note P to the accompanying consolidated financial statements.
In addition, the Company has entered into a number of long-term leasing arrangements to support the ongoing activities of the Company. The required payments under such commitments and other debt instruments at December 31, 2010 are shown in the following table:
55
Table 20
Contractual Obligations and Commitments
(In thousands)
|
Payments Due by Period
|
||||||||||||||||||||
|
On Demand
|
||||||||||||||||||||
|
or Within
|
After
|
|||||||||||||||||||
|
Contractual Obligations
|
Total
|
1 Year
|
2-3 Years
|
4-5 Years
|
5 Years
|
|||||||||||||||
|
Short-term borrowings
|
$ | 60,207 | $ | 60,207 | $ | - | $ | - | $ | - | ||||||||||
|
Long-term debt
|
97,713 | - | 4,000 | 17,000 | 76,713 | |||||||||||||||
|
Deposits
|
1,828,070 | 1,194,826 | 263,154 | 342,550 | 27,540 | |||||||||||||||
|
Operating leases
|
13,818 | 1,708 | 3,049 | 2,583 | 6,478 | |||||||||||||||
|
Total contractual cash obligations
|
$ | 1,999,808 | $ | 1,256,741 | $ | 270,203 | $ | 362,133 | $ | 110,731 | ||||||||||
|
Amount of Commitment Expiration Per Period
|
||||||||||||||||||||
|
Total
|
||||||||||||||||||||
|
Amounts
|
Within
|
After
|
||||||||||||||||||
|
Commitments
|
Committed
|
1 Year
|
2-3 Years
|
4-5 Years
|
5 Years
|
|||||||||||||||
|
Lines of credit and loan commitments
|
$ | 205,965 | $ | 88,771 | $ | 39,966 | $ | 2,638 | $ | 74,590 | ||||||||||
|
Standby letters of credit
|
23,716 | 23,453 | 263 | - | - | |||||||||||||||
|
Commitments to sell loans held for sale
|
6,751 | 6,751 | - | - | - | |||||||||||||||
|
Total commitments
|
$ | 236,432 | $ | 118,975 | $ | 40,229 | $ | 2,638 | $ | 74,590 | ||||||||||
DERIVATIVE FINANCIAL INSTRUMENTS
A derivative is a financial instrument that derives its cash flows, and therefore its value, by reference to an underlying instrument, index or reference rate. These instruments primarily consist of interest rate swaps, caps, floors, financial forward and futures contracts and options written or purchased. Derivative contracts are written in amounts referred to as notional amounts. Notional amounts only provide the basis for calculating payments between counterparties and do not represent amounts to be exchanged between parties and are not a measure of financial risk. Credit risk arises when amounts receivable from a counterparty exceed amounts payable. We control our risk of loss on derivative contracts by subjecting counterparties to credit reviews and approvals similar to those used in making loans and other
extensions of credit.
The Company utilizes interest rate swaps and caps in the management of interest rate risk. Interest rate swaps are contractual agreements between two parties to exchange a series of cash flows representing interest payments. A swap allows both parties to alter the repricing characteristics of assets or liabilities without affecting the underlying principal positions. Through the use of a swap, assets and liabilities may be transformed from fixed to floating rates, from floating rates to fixed rates, or from one type of floating rate to another. At December 31, 2010, swap derivatives with a total notional value of $30 million, with remaining terms of less than one year were outstanding. During 2009, the Company entered into a five-year interest rate cap. The interest rate cap
assists in minimizing the exposure of risk of rising interest rates. This derivative contract, with a notional amount of $250 million, was executed to offset the effects of interest rate changes on an unsecured $250 million variable rate money market funding arrangement. Under this cash flow hedge relationship, the cap’s objective is to offset the effect of interest rate changes, whenever funding rates are higher than the strike rate of the cap.
Although off-balance sheet derivative financial instruments do not expose us to credit risk equal to the notional amount, such agreements generate credit risk to the extent of the fair value gain in an off-balance sheet derivative financial instrument if the counterparty fails to perform. We minimize such risk by evaluating the creditworthiness of the counterparties and consistently monitoring these agreements. The counterparties to these arrangements are primarily large commercial banks and investment banks. Where appropriate, master netting agreements are arranged or collateral is obtained in the form of rights to securities. At December 31, 2010, the Company’s derivatives reflected a $10.7 million loss, net of tax, of accumulated other comprehensive income.
56
Other risks associated with interest-sensitive derivatives include the effect on fixed rate positions during periods of changing interest rates. Indexed amortizing swaps' notional amounts and maturities change based on certain interest rate indices. Generally, as rates fall the notional amounts decline more rapidly, and as rates increase notional amounts decline more slowly. As of December 31, 2010, we had no indexed amortizing swaps outstanding. Under unusual circumstances, financial derivatives also increase liquidity risk, which could result from an environment of rising interest rates in which derivatives produce negative cash flows while being offset by increased cash flows from variable rate loans. The Company considers such risk to be insignificant due to the relatively small
derivative positions we hold. A discussion of derivatives is presented in Note O to our consolidated financial statements, which are presented under Item 8 of Part II in this Form 10-K.
QUARTERLY FINANCIAL INFORMATION
Table 21 sets forth, for the periods indicated, certain of our consolidated quarterly financial information. This information is derived from our unaudited financial statements, which include, in the opinion of management, all normal recurring adjustments which management considers necessary for a fair presentation of the results for such periods. This information should be read in conjunction with our consolidated financial statements included elsewhere in this report. The results for any quarter are not necessarily indicative of results for any future period.
Table 21
Quarterly Financial Data
($ in thousands, except per share data)
|
Year Ended December 31, 2010
|
Year Ended December 31, 2009
|
|||||||||||||||||||||||||||||||
|
Fourth
Quarter
|
Third
Quarter
|
Second
Quarter
|
First
Quarter
|
Fourth
Quarter
|
Third
Quarter
|
Second
Quarter
|
First
Quarter
|
|||||||||||||||||||||||||
|
Operating Data:
|
||||||||||||||||||||||||||||||||
|
Total interest income
|
$ | 25,329 | $ | 25,580 | $ | 24,829 | $ | 19,272 | $ | 19,586 | $ | 20,107 | $ | 19,848 | $ | 19,541 | ||||||||||||||||
|
Total interest expense
|
9,051 | 8,734 | 9,234 | 7,728 | 7,550 | 7,927 | 8,264 | 9,126 | ||||||||||||||||||||||||
|
Net interest income
|
16,278 | 16,846 | 15,595 | 11,544 | 12,036 | 12,180 | 11,584 | 10,415 | ||||||||||||||||||||||||
|
Provision for loan losses
|
12,000 | 5,436 | 6,000 | 2,946 | 4,750 | 5,000 | 3,000 | 3,000 | ||||||||||||||||||||||||
|
Net interest income after provision
|
4,278 | 11,410 | 9,595 | 8,598 | 7,286 | 7,180 | 8,584 | 7,415 | ||||||||||||||||||||||||
|
Non-interest income
|
1,847 | 3,906 | 21,698 | 1,362 | 2,930 | 3,328 | 1,210 | 1,218 | ||||||||||||||||||||||||
|
Non-interest expense
|
17,202 | 15,479 | 13,604 | 8,887 | 8,602 | 8,417 | 8,494 | 7,386 | ||||||||||||||||||||||||
|
Income (loss) before income taxes
|
(11,077 | ) | (163 | ) | 17,689 | 1,073 | 1,614 | 2,091 | 1,300 | 1,247 | ||||||||||||||||||||||
|
Income tax expense (benefit)
|
(5,021 | ) | (823 | ) | 5,956 | (316 | ) | (173 | ) | 138 | (130 | ) | (120 | ) | ||||||||||||||||||
|
Net income (loss)
|
(6,056 | ) | 660 | 11,733 | 1,389 | 1,787 | 1,953 | 1,430 | 1,367 | |||||||||||||||||||||||
|
Less preferred stock dividends and discount accretion
|
600 | 591 | 502 | 503 | 498 | 499 | 496 | 491 | ||||||||||||||||||||||||
|
Net income (loss) available to common shareholders
|
$ | (6,656 | ) | $ | 69 | $ | 11,231 | $ | 886 | $ | 1,289 | $ | 1,454 | $ | 934 | $ | 876 | |||||||||||||||
|
Per Share Data:
|
||||||||||||||||||||||||||||||||
|
Earnings per share - basic
|
$ | (0.61 | ) | $ | 0.01 | $ | 1.42 | $ | 0.12 | $ | 0.18 | $ | 0.20 | $ | 0.13 | $ | 0.12 | |||||||||||||||
|
Earnings per share - diluted
|
(0.61 | ) | 0.01 | 1.41 | 0.12 | 0.18 | 0.20 | 0.13 | 0.12 | |||||||||||||||||||||||
|
Cash dividends paid
|
0.05 | 0.05 | 0.05 | 0.05 | 0.05 | 0.05 | 0.05 | 0.05 | ||||||||||||||||||||||||
|
Common stock price:
|
||||||||||||||||||||||||||||||||
|
High
|
10.00 | 10.50 | 10.66 | 8.25 | 8.00 | 8.15 | 8.15 | 7.74 | ||||||||||||||||||||||||
|
Low
|
8.29 | 9.50 | 7.81 | 6.81 | 6.45 | 6.95 | 5.25 | 3.96 | ||||||||||||||||||||||||
Fourth Quarter Analysis
For the quarter ending December 31, 2010, the Company reported a quarterly net loss of $6.7 million, or $0.61 per diluted share, compared to net income of $1.3 million, or $0.18 per diluted share, for the fourth quarter of 2009. During the quarter, the Company incurred $15.4 million of credit and other real estate owned (“OREO”) related charges continuing management’s commitment of aggressively addressing realized and potential impairments in certain sectors of the credit portfolio. Total assets declined by $30.1 million, or 1.4%, from September 30, 2010. During the quarter, the
Company’s level of core deposits increased by $18.7 million and non-covered loans increased by $64.1 million.
Net interest income for the fourth quarter of 2010 was $16.3 million, an increase of $4.2 million, or 35.2%, from the comparable period last year. Taxable-equivalent net interest margin increased 19 basis points from the fourth quarter of 2009 to 3.71%. Compared to the third quarter of 2010, taxable-equivalent net interest margin decreased five basis points from 3.76%, primarily due to the migration of $20 million of loans into a nonperforming status. During the fourth quarter of 2010, the Company concentrated on reducing its excess liquidity position, having increased loans by $64.1 million, an increase of 5.6% from the prior quarter.
57
During the fourth quarter 2010, the Company recorded a provision for loan losses of $12.0 million, an increase from the $5.4 million recorded during the third quarter of 2010. The allowance for loan losses was $24.8 million at December 31, 2010, and $18.8 million at September 30, 2010. Loan loss reserves to total period-end loans increased from 1.60% and 1.27% reported at December 31, 2009 and September 30, 2010, respectively, to 1.65% at December 31, 2010. Since the assets acquired in the FDIC-assisted transaction were marked to fair value, including estimated loan impairment, no loan loss reserves are needed on these loans at this time. Management considers the loan loss reserve adequate to absorb credit losses inherent in the loan portfolio at December 31,
2010.
The Company recorded charges during the fourth quarter of 2010 totaling $3.4 million on non-covered assets held as OREO. OREO not covered by loss share agreements totaled $23.9 million at December 31, 2010, a decrease of $2.1 million from the $26.0 million reported at September 30, 2010. The change primarily consisted of $2.6 million in additions at fair value, $3.4 million in write-downs, and $1.3 million in sales. Of the $23.9 million on OREO at year-end, $11.4 million are either under contract for sale or under a scheduled lot takedown.
Net charge-offs for 2010’s fourth quarter were $6.0 million, or 1.62% of average loans annualized, up from the $5.7 million, or 1.56% reported for the third quarter of 2010. Nonperforming assets not covered by loss share at December 31, 2010 were 2.75% of total assets, and were 6.29% including covered assets, compared to 1.99% and 5.66%, respectively, at September 30, 2010. The covered assets are covered by a FDIC loss-share agreement that provides 80% protection on those assets and are being carried at estimated fair value.
Non-interest income was $1.8 million for the fourth quarter of 2010 compared to $2.9 million for the year-ago quarter. Included in non-interest income for the fourth quarter of 2010 was $6,000 of loss on sales of investment securities and $283,000 of income true-up associated with FDIC receivable and related loss share receipts. During the fourth quarter of 2009, included in non-interest income was $1.7 million of gains on sales of investment securities. Excluding investment securities transactions and FDIC related transactions, non-interest income was $2.1 million for the current quarter, up 69.1% from the $1.3 million reported for the 2009 fourth quarter. The increases were primarily due to the increases in mortgage fees generated from the Company’s mortgage
market operations in the amount of $291,000; increases in investment brokerage activity of $178,000, and the addition of $145,000 of merchant fee and debit card income, a significant ongoing source of revenue in the retail-oriented coastal economy. In comparison to the previous quarter, recurring non-interest income increased $174,000.
Non-interest expenses for the fourth quarter increased $8.6 million compared to the same quarter a year ago, and were $1.7 million, or 11.1%, higher than the third quarter of 2010. As a result of the acquisition and continued growth of the legacy Bank, personnel costs have increased $2.9 million, or 63.6%, compared to the same quarter a year ago, and were $470,000, or 6.8%, higher than the previous quarter, primarily due to non-executive level bonuses and commissions on higher levels of revenue from mortgage and investment services. Loan, foreclosure and collection expenses have increased $3.9 million compared to the same quarter a year ago, and were $934,000 higher than the previous quarter. The higher level of loan, foreclosure and collection expense primarily relates to the
write-down of other real estate owned properties and the ongoing expenses relating to these properties. Insurance, professional and other services increased by $854,000 compared to the same quarter a year-ago, and were $133,000 higher than the previous quarter.
RECENT ACCOUNTING PRONOUNCEMENTS
See Note A to the accompanying Consolidated Financial Statements for a full description of recent accounting pronouncements including the respective expected dates of adoption and effects on results of operations and financial condition.
58
CRITICAL ACCOUNTING ESTIMATES AND POLICIES
The Company prepares its consolidated financial statements in conformity with accounting principles generally accepted in the United States of America. The preparation of these consolidated financial statements requires management to make estimates and assumptions that affect the reported amounts of assets and liabilities and disclosure of contingent assets and liabilities at the date of the financial statements, and the reported amount of revenues and expenses during the reporting period. Actual results could differ from those estimates.
Critical accounting estimates and policies are those management believes are both most important to the portrayal of the Company’s financial condition and results, and require management’s most difficult, subjective or complex judgments, often as a result of the need to make estimates about the effect of matters that are inherently uncertain. Judgments and uncertainties affecting the application of those policies may result in materially different amounts being reported under different conditions or using different assumptions. The allowance for loan losses represents a particularly sensitive accounting estimate. The amount of the allowance is based on management’s evaluation of the collectability of the loan
portfolio, including the maturity of the loan portfolio, credit concentration, trends in historical loss experience, specific impaired loans and general economic conditions. For further discussion of the allowance for loan losses and a detailed description of the methodology used in determining the adequacy of the allowance, see the sections of this Item 7 titled “Asset Quality” and “Analysis of Allowance for Loan Losses” and Note D to the consolidated financial statements contained in this Annual Report.
Additionally, intangible assets are subject to sensitive accounting estimate. Intangible assets include goodwill and other identifiable assets, such as core deposit premiums, resulting from acquisitions. Core deposit premiums are amortized primarily on a straight-line basis over a ten-year life based upon historical studies of core deposits. Goodwill is not amortized but is tested annually for impairment or at any time an event occurs or circumstances change that may trigger a decline in the value of the reporting unit. Examples of such events or circumstances include a decline in the value of the Company’s common stock below book value, adverse changes in legal factors, business climate, unanticipated competition, change in regulatory environment, or loss of key personnel.
The Company tests for impairment in accordance with Accounting Standards Codification Topic 350, Intangibles – Goodwill and Other. Potential impairment of goodwill exists when the carrying amount of a reporting unit exceeds its fair value. Management first estimates the fair value of the Company in a business combination using one of two approaches. The Comparable Transaction Approach utilizes a regional transaction group and a national transaction group. For each group, average and median pricing ratios were applied to provide a range of values along with several qualitative factors being considered. The Discounted Cash Flow Approach is derived from the present value of future dividends over
a five year time horizon and the projected terminal value at the end of the fifth year. The goodwill that would arise from this estimate is compared to the carrying value of the goodwill currently on the books to determine impairment. See Note G to the accompanying consolidated financial statements for information on goodwill.
To the extent a reporting unit’s carrying amount exceeds its fair value, an indication exists that the reporting unit’s goodwill may be impaired, and a second step of impairment testing will be performed. In the second step, the implied fair value of the reporting unit’s goodwill, determined by allocating the reporting unit’s fair value to all of its assets (recognized and unrecognized) and liabilities as if the reporting unit had been acquired in a business combination at the date of the impairment test, will be determined. If the implied fair value of reporting unit goodwill is lower than its carrying amount, goodwill is impaired and is written down to its implied fair value. The loss recognized is limited to the carrying amount
of goodwill. Once an impairment loss is recognized, future increases in fair value will not result in the reversal of previously recognized losses.
The Company accounts for its acquisitions under ASC Topic No. 805, Business Combinations, which requires the use of the purchase method of accounting. All identifiable assets acquired, including loans, are recorded at fair value. No allowance for loan losses related to the acquired loans is recorded on the acquisition date as the fair value of the loans acquired incorporates assumptions regarding credit risk. Loans acquired are recorded at fair value in accordance with the fair value methodology prescribed in ASC Topic No. 820, exclusive of the loss sharing agreements with the FDIC. These fair value estimates associated with the loans include estimates related to expected prepayments and the amount and timing of undiscounted expected principal, interest and other cash
flows.
59
For an FDIC-assisted acquisition, the FDIC will reimburse the Company for certain acquired assets should the Company experience a loss; an indemnification asset is established and is recorded at fair value at the acquisition date. The indemnification asset is recognized at the same time as the indemnified asset, and measured on the same basis, subject to collectability or contractual limitations. The loss sharing agreements on the acquisition date reflect the reimbursements expected to be received from the FDIC, using an appropriate discount rate, which reflects counterparty credit risk and other uncertainties. Because the acquired loans are subject to the accounting prescribed by ASC Topic 310, subsequent changes to the basis of the loss sharing agreements also follow that
model. Deterioration in the credit quality of the loans (immediately recorded as an adjustment to the allowance for loan losses) would immediately increase the basis of the loss sharing agreements, with the offset recorded through the consolidated statement of income. Improvements in the credit quality or cash flows of loans (reflected as an adjustment to yield and accreted into income over the remaining life of the loans) decrease the basis of the loss sharing agreements, with such decrease being amortized into income over 1) the same period or 2) the life of the loss sharing agreements, whichever is shorter. For further discussion of the Company’s acquisitions and related FDIC indemnification assets, see Note B and Note E of the footnotes to the consolidated financial statements.
OFF-BALANCE SHEET ARRANGEMENTS
Information about the Company’s off-balance sheet risk exposure is presented in this Item 7 “Off-Balance Sheet Risk”. As part of the Company’s ongoing business, the Company does not participate in transactions that generate relationships with unconsolidated entities or financial partnerships, such as entities often referred to as special purpose entities (SPEs), which generally are established for the purpose of facilitating off-balance sheet arrangements or other contractually narrow or limited purposes. As of December 31, 2010, our SPE activity is limited to our capital trust subsidiaries: BNC Bancorp Capital Trust I, BNC Bancorp Capital Trust II, BNC Bancorp Capital Trust III and BNC Bancorp Capital Trust IV, which in aggregate issued 23,000,000 Trust
Preferred Securities.
|
ITEM 7A.
|
QUANTITATIVE AND QUALIATATIVE DISCLOSURES ABOUT MARKET RISK
|
See “Asset/Liability Management” and “Market Risk” under Item 7.
60
|
ITEM 8.
|
FINANCIAL STATEMENTS AND SUPPLEMENTARY DATA
|
BNC Bancorp
CONSOLIDATED FINANCIAL STATEMENTS
Years Ended December 31, 2010, 2009 and 2008
61
BNC BANCORP AND SUBSIDIARY
INDEX TO THE CONSOLIDATED FINANCIAL STATEMENTS
|
Page No.
|
|
|
Report of Independent Registered Public Accounting Firm
|
F-2
|
|
Consolidated Balance Sheets
|
|
|
As of December 31, 2010 and 2009
|
F-4
|
|
Consolidated Statements of Income
|
|
|
For the years ended December 31, 2010, 2009 and 2008
|
F-5
|
|
Consolidated Statements of Comprehensive Income
|
|
|
For the years ended December 31, 2010, 2009 and 2008
|
F-6
|
|
Consolidated Statements of Shareholders’ Equity
|
|
|
For the years ended December 31, 2010, 2009 and 2008
|
F-7
|
|
Consolidated Statements of Cash Flows
|
|
|
For the years ended December 31, 2010, 2009 and 2008
|
F-9
|
|
Notes to Consolidated Financial Statements
|
F-10
|
F-1
REPORT OF INDEPENDENT REGISTERED PUBLIC ACCOUNTING FIRM
To the Board of Directors and
Shareholders of BNC Bancorp
We have audited the accompanying consolidated balance sheets of BNC Bancorp and subsidiary (the “Company”) as of December 31, 2010 and 2009, and the related consolidated statements of income, comprehensive income, shareholders’ equity, and cash flows for each of the years in the three-year period ended December 31, 2010. We also have audited the Company’s internal control over financial reporting as of December 31, 2010 based on criteria established in Internal Control – Integrated Framework issued by the Committee of Sponsoring Organizations of the Treadway Commission (COSO). The Company’s management is responsible for these consolidated financial statements, for maintaining effective internal control over financial reporting, and for its assessment of the
effectiveness of internal control over financial reporting, included in the accompanying Management’s Report on Internal Control over Financial Reporting. Our responsibility is to express an opinion on these consolidated financial statements and an opinion on the Company’s internal control over financial reporting based on our audits.
We conducted our audits in accordance with the standards of the Public Company Accounting Oversight Board (United States). Those standards require that we plan and perform the audits to obtain reasonable assurance about whether the financial statements are free of material misstatement and whether effective internal control over financial reporting was maintained in all material respects. Our audits of the financial statements included examining, on a test basis, evidence supporting the amounts and disclosures in the financial statements, assessing the accounting principles used and significant estimates made by management, and evaluating the overall financial statement presentation. Our audit of internal control over financial reporting included obtaining an understanding of internal control over financial
reporting, assessing the risk that a material weakness exists, and testing and evaluating the design and operating effectiveness of internal control based on the assessed risk. Our audits also included performing such other procedures as we considered necessary in the circumstances. We believe that our audits provide a reasonable basis for our opinions.
A company's internal control over financial reporting is a process designed to provide reasonable assurance regarding the reliability of financial reporting and the preparation of financial statements for external purposes in accordance with generally accepted accounting principles. A company's internal control over financial reporting includes those policies and procedures that (1) pertain to the maintenance of records that, in reasonable detail, accurately and fairly reflect the transactions and dispositions of the assets of the company; (2) provide reasonable assurance that transactions are recorded as necessary to permit preparation of financial statements in accordance with generally accepted accounting principles, and that receipts and expenditures of the company are being made only in accordance
with authorizations of management and directors of the company; and (3) provide reasonable assurance regarding prevention or timely detection of unauthorized acquisition, use, or disposition of the company's assets that could have a material effect on the financial statements.
F-2
Because of its inherent limitations, internal control over financial reporting may not prevent or detect misstatements. Also, projections of any evaluation of effectiveness to future periods are subject to the risk that controls may become inadequate because of changes in conditions, or that the degree of compliance with the policies or procedures may deteriorate.
In our opinion, the consolidated financial statements referred to above present fairly, in all material respects, the financial position of BNC Bancorp and subsidiary as of December 31, 2010 and 2009, and the results of their operations and their cash flows for each of the years in the three-year period ended December 31, 2010 in conformity with accounting principles generally accepted in the United States of America. Also in our opinion, BNC Bancorp and subsidiary maintained, in all material respects, effective internal control over financial reporting as of December 31, 2010, based on criteria established in Internal Control – Integrated Framework issued by the Committee of Sponsoring Organizations of the Treadway
Commission (COSO).
/s/ Cherry, Bekaert & Holland, L.L.P.
Raleigh, North Carolina
March 15, 2011
F-3
CONSOLIDATED BALANCE SHEETS
December 31, 2010 and 2009
|
2010
|
2009
|
|||||||
|
(Amounts in thousands,
|
||||||||
|
except share data)
|
||||||||
|
Assets
|
||||||||
|
Cash and due from banks
|
$ | 7,812 | $ | 4,129 | ||||
|
Interest-earning deposits in other banks
|
22,275 | 44,044 | ||||||
|
Investment securities available for sale, at fair value
|
352,871 | 360,506 | ||||||
|
Investment securities held to maturity, at amortized cost
|
6,000 | 6,000 | ||||||
|
Federal Home Loan Bank stock, at cost
|
9,146 | 6,160 | ||||||
|
Loans held for sale
|
6,751 | 2,766 | ||||||
|
Loans, net of deferred loan costs/fees
|
1,508,180 | 1,079,179 | ||||||
|
Less allowance for loan losses
|
(24,813 | ) | (17,309 | ) | ||||
|
Net loans
|
1,483,367 | 1,061,870 | ||||||
|
Accrued interest receivable
|
10,363 | 8,178 | ||||||
|
Premises and equipment, net
|
30,550 | 27,703 | ||||||
|
Other real estate owned
|
39,737 | 14,325 | ||||||
|
FDIC indemnification asset
|
69,493 | - | ||||||
|
Investment in bank-owned life insurance
|
46,607 | 27,593 | ||||||
|
Goodwill
|
26,129 | 26,129 | ||||||
|
Other assets
|
38,831 | 44,782 | ||||||
|
Total assets
|
$ | 2,149,932 | $ | 1,634,185 | ||||
|
Liabilities and Shareholders’ Equity
|
||||||||
|
Deposits:
|
||||||||
|
Non-interest bearing demand
|
$ | 107,547 | $ | 66,801 | ||||
|
Interest-bearing demand
|
841,062 | 578,329 | ||||||
|
Time deposits
|
879,461 | 704,748 | ||||||
|
Total deposits
|
1,828,070 | 1,349,878 | ||||||
|
Short-term borrowings
|
60,207 | 50,283 | ||||||
|
Long-term debt
|
97,713 | 100,713 | ||||||
|
Accrued expenses and other liabilities
|
11,718 | 7,105 | ||||||
|
Total liabilities
|
1,997,708 | 1,507,979 | ||||||
|
Shareholders’ Equity
|
||||||||
|
Preferred stock, no par value, authorized 20,000,000 shares;
|
||||||||
|
Series A, Fixed Rate Cumulative Perpetual Preferred Stock, $1,000 liquidation
|
||||||||
|
value per share, 31,260 shares issued and outstanding, net of discount
|
29,757 | 29,304 | ||||||
|
Series B, Mandatorily Convertible Non-Voting Preferred Stock, $10 stated
|
||||||||
|
value, 1,804,566 shares issued and outstanding
|
17,161 | - | ||||||
|
Common stock, no par value; authorized 80,000,000 shares; 9,053,360 and
|
||||||||
|
7,341,901 issued and outstanding at December 31, 2010 and 2009, respectively
|
86,791 | 70,376 | ||||||
|
Common stock warrants
|
2,412 | 2,412 | ||||||
|
Retained earnings
|
22,901 | 19,009 | ||||||
|
Stock in directors rabbi trust
|
(1,729 | ) | (1,388 | ) | ||||
|
Directors deferred fees obligation
|
1,729 | 1,388 | ||||||
|
Accumulated other comprehensive income (loss)
|
(6,798 | ) | 5,105 | |||||
|
Total shareholders' equity
|
152,224 | 126,206 | ||||||
|
Total liabilities and shareholders’ equity
|
$ | 2,149,932 | $ | 1,634,185 | ||||
See accompanying notes.
F-4
CONSOLIDATED STATEMENTS OF INCOME
Years Ended December 31, 2010, 2009, and 2008
|
2010
|
2009
|
2008
|
||||||||||
|
(Amounts in thousands, except per share data)
|
||||||||||||
|
Interest Income
|
||||||||||||
|
Interest and fees on loans
|
$ | 77,788 | $ | 57,556 | $ | 64,855 | ||||||
|
Investment securities:
|
||||||||||||
|
Taxable
|
7,579 | 13,421 | 2,307 | |||||||||
|
Tax-exempt
|
9,435 | 8,039 | 3,504 | |||||||||
|
Interest on interest-earning balances and other
|
208 | 66 | 368 | |||||||||
|
Total interest income
|
95,010 | 79,082 | 71,034 | |||||||||
|
Interest Expense
|
||||||||||||
|
Interest on demand deposits
|
9,324 | 5,606 | 2,738 | |||||||||
|
Interest on time deposits
|
21,752 | 23,292 | 27,978 | |||||||||
|
Interest on short-term borrowings
|
587 | 627 | 1,458 | |||||||||
|
Interest on long-term debt
|
3,084 | 3,342 | 5,252 | |||||||||
|
Total interest expense
|
34,747 | 32,867 | 37,426 | |||||||||
|
Net Interest Income
|
60,263 | 46,215 | 33,608 | |||||||||
|
Provision for loan losses
|
26,382 | 15,750 | 7,075 | |||||||||
|
Net interest income after provision for loan losses
|
33,881 | 30,465 | 26,533 | |||||||||
|
Non-Interest Income
|
||||||||||||
|
Mortgage fees
|
1,583 | 1,108 | 783 | |||||||||
|
Service charges
|
3,083 | 2,707 | 3,021 | |||||||||
|
Earnings on bank-owned life insurance
|
986 | 931 | 1,101 | |||||||||
|
Gain on sale of investment securities available for sale, net
|
535 | 3,610 | 223 | |||||||||
|
Gain on acquisition
|
19,261 | - | - | |||||||||
|
Other
|
3,365 | 330 | 523 | |||||||||
|
Total non-interest income
|
28,813 | 8,686 | 5,651 | |||||||||
|
Non-Interest Expense
|
||||||||||||
|
Salaries and employee benefits
|
25,340 | 17,499 | 16,293 | |||||||||
|
Occupancy
|
3,218 | 1,913 | 2,155 | |||||||||
|
Furniture and equipment
|
2,145 | 1,475 | 1,084 | |||||||||
|
Data processing and supply
|
2,113 | 1,261 | 1,113 | |||||||||
|
Advertising and business development
|
1,994 | 1,156 | 473 | |||||||||
|
Insurance, professional and other services
|
4,012 | 2,452 | 2,111 | |||||||||
|
FDIC insurance assessments
|
2,970 | 2,844 | 642 | |||||||||
|
Loan, foreclosure and collection
|
9,054 | 1,078 | 1,173 | |||||||||
|
Other
|
4,326 | 3,221 | 2,739 | |||||||||
|
Total non-interest expense
|
55,172 | 32,899 | 27,783 | |||||||||
|
Income before income tax expense (benefit)
|
7,522 | 6,252 | 4,401 | |||||||||
|
Income tax expense (benefit)
|
(204 | ) | (285 | ) | 414 | |||||||
|
Net Income
|
7,726 | 6,537 | 3,987 | |||||||||
|
Less preferred stock dividends and discount accretion
|
2,196 | 1,984 | 142 | |||||||||
|
Net Income Available to Common Shareholders
|
$ | 5,530 | $ | 4,553 | $ | 3,845 | ||||||
|
Basic earnings per common share
|
$ | 0.62 | $ | 0.62 | $ | 0.53 | ||||||
|
Diluted earnings per common share
|
$ | 0.61 | $ | 0.62 | $ | 0.52 | ||||||
See accompanying notes.
F-5
CONSOLIDATED STATEMENTS OF COMPREHENSIVE INCOME
Years Ended December 31, 2010, 2009 and 2008
|
2010
|
2009
|
2008
|
||||||||||
|
(Amounts in thousands)
|
||||||||||||
|
Net income
|
$ | 7,726 | $ | 6,537 | $ | 3,987 | ||||||
|
Other comprehensive income (loss):
|
||||||||||||
|
Investment securities available for sale:
|
||||||||||||
|
Unrealized holding gains (losses)
|
(4,014 | ) | 13,473 | 174 | ||||||||
|
Tax effect
|
1,547 | (5,194 | ) | (89 | ) | |||||||
|
Reclassification of (gains) losses recognized in net income
|
(535 | ) | (3,610 | ) | (223 | ) | ||||||
|
Tax effect
|
206 | 1,392 | 86 | |||||||||
|
Net of tax amount
|
(2,796 | ) | 6,061 | (52 | ) | |||||||
|
Cash flow hedging activities:
|
||||||||||||
|
Unrealized holding gains (losses)
|
(16,886 | ) | (8,150 | ) | 2,600 | |||||||
|
Tax effect
|
6,509 | 3,142 | (1,002 | ) | ||||||||
|
Reclassification of (gains) losses recognized in net income
|
2,066 | 1,061 | - | |||||||||
|
Tax effect
|
(796 | ) | (409 | ) | - | |||||||
|
Net of tax amount
|
(9,107 | ) | (4,356 | ) | 1,598 | |||||||
|
Total other comprehensive income (loss)
|
(11,903 | ) | 1,705 | 1,546 | ||||||||
|
Comprehensive income (loss)
|
$ | (4,177 | ) | $ | 8,242 | $ | 5,533 | |||||
See accompanying notes.
F-6
CONSOLIDATED STATEMENTS OF SHAREHOLDERS' EQUITY
Years Ended December 31, 2010, 2009 and 2008
|
Directors
|
Accumulated
|
|||||||||||||||||||||||||||||||||||||||
|
Common
|
Discount on
|
Stock in
|
deferred
|
other com-
|
||||||||||||||||||||||||||||||||||||
|
Common stock
|
stock
|
Preferred
|
preferred
|
Retained
|
directors
|
fees
|
prehensive
|
|||||||||||||||||||||||||||||||||
|
Shares
|
Amount
|
warrants
|
stock
|
stock
|
earnings
|
rabbi trust
|
obligation
|
income (loss)
|
Total
|
|||||||||||||||||||||||||||||||
|
(Amounts in thousands, except share and per share data)
|
||||||||||||||||||||||||||||||||||||||||
|
Balance, December 31, 2007
|
7,257,532 | $ | 70,042 | $ | - | $ | - | $ | - | $ | 14,496 | $ | (1,001 | ) | $ | 1,001 | $ | 1,854 | $ | 86,392 | ||||||||||||||||||||
|
Adoption of new accounting standard
|
- | - | - | - | - | (959 | ) | - | - | - | (959 | ) | ||||||||||||||||||||||||||||
|
Net income
|
- | - | - | - | - | 3,987 | - | - | - | 3,987 | ||||||||||||||||||||||||||||||
|
Directors deferred fees
|
- | - | - | - | - | - | (232 | ) | 232 | - | - | |||||||||||||||||||||||||||||
|
Other comprehensive income, net of tax
|
- | - | - | - | - | - | - | - | 1,546 | 1,546 | ||||||||||||||||||||||||||||||
|
Issuance of preferred stock and related common stock warrants
|
- | - | 2,412 | 31,260 | (2,412 | ) | - | - | - | - | 31,260 | |||||||||||||||||||||||||||||
|
Common stock issued pursuant to:
|
||||||||||||||||||||||||||||||||||||||||
|
Exercise of stock options
|
146,177 | 671 | - | - | - | - | - | - | - | 671 | ||||||||||||||||||||||||||||||
|
Current income tax benefit
|
- | 286 | - | - | - | - | - | - | - | 286 | ||||||||||||||||||||||||||||||
|
Shares traded to exercise options
|
(16,282 | ) | (236 | ) | - | - | - | - | - | - | (236 | ) | ||||||||||||||||||||||||||||
|
Stock-based compensation:
|
||||||||||||||||||||||||||||||||||||||||
|
Restricted stock awards
|
2,200 | 55 | - | - | - | - | - | - | - | 55 | ||||||||||||||||||||||||||||||
|
Repurchase of common shares
|
(39,598 | ) | (385 | ) | - | - | - | - | - | - | - | (385 | ) | |||||||||||||||||||||||||||
|
Cash dividends:
|
||||||||||||||||||||||||||||||||||||||||
|
Common stock, $.25 per share
|
- | - | - | - | - | (1,825 | ) | - | - | - | (1,825 | ) | ||||||||||||||||||||||||||||
|
Preferred stock, net of accretion
|
- | - | - | - | 30 | (142 | ) | - | - | - | (112 | ) | ||||||||||||||||||||||||||||
|
Balance, December 31, 2008
|
7,350,029 | 70,433 | 2,412 | 31,260 | (2,382 | ) | 15,557 | (1,233 | ) | 1,233 | 3,400 | 120,680 | ||||||||||||||||||||||||||||
|
Net income
|
- | - | - | - | - | 6,537 | - | - | - | 6,537 | ||||||||||||||||||||||||||||||
|
Directors deferred fees
|
- | - | - | - | - | - | (155 | ) | 155 | - | - | |||||||||||||||||||||||||||||
|
Other comprehensive income, net of tax
|
- | - | - | - | - | - | - | - | 1,705 | 1,705 | ||||||||||||||||||||||||||||||
|
Common stock issued pursuant to:
|
||||||||||||||||||||||||||||||||||||||||
|
Exercise of stock options
|
5,438 | 32 | - | - | - | - | - | - | - | 32 | ||||||||||||||||||||||||||||||
|
Current income tax benefit
|
- | 3 | - | - | - | - | - | - | - | 3 | ||||||||||||||||||||||||||||||
|
Stock-based compensation:
|
||||||||||||||||||||||||||||||||||||||||
|
Stock option expense
|
- | 42 | 42 | |||||||||||||||||||||||||||||||||||||
|
Restricted stock awards
|
1,500 | 10 | - | - | - | - | - | - | - | 10 | ||||||||||||||||||||||||||||||
|
Repurchase of common shares
|
(15,066 | ) | (144 | ) | (144 | ) | ||||||||||||||||||||||||||||||||||
|
Cash dividends:
|
||||||||||||||||||||||||||||||||||||||||
|
Common stock, $.15 per share
|
- | - | - | - | - | (1,101 | ) | - | - | - | (1,101 | ) | ||||||||||||||||||||||||||||
|
Preferred stock, net of accretion
|
- | - | - | - | 426 | (1,984 | ) | - | - | - | (1,558 | ) | ||||||||||||||||||||||||||||
|
Balance, December 31, 2009
|
7,341,901 | $ | 70,376 | $ | 2,412 | $ | 31,260 | $ | (1,956 | ) | $ | 19,009 | $ | (1,388 | ) | $ | 1,388 | $ | 5,105 | $ | 126,206 | |||||||||||||||||||
See accompanying notes.
F-7
CONSOLIDATED STATEMENTS OF SHAREHOLDERS' EQUITY
Years Ended December 31, 2010, 2009 and 2008 (continued)
|
Directors
|
Accumulated
|
|||||||||||||||||||||||||||||||||||||||
|
Common
|
Discount on
|
Stock in
|
deferred
|
other com-
|
||||||||||||||||||||||||||||||||||||
|
Common stock
|
stock
|
Preferred
|
preferred
|
Retained
|
directors
|
fees
|
prehensive
|
|||||||||||||||||||||||||||||||||
|
Shares
|
Amount
|
warrants
|
stock
|
stock
|
earnings
|
rabbi trust
|
obligation
|
income (loss)
|
Total
|
|||||||||||||||||||||||||||||||
|
(Amounts in thousands, except share and per share data)
|
||||||||||||||||||||||||||||||||||||||||
|
Net income
|
- | - | - | - | - | 7,726 | - | - | - | 7,726 | ||||||||||||||||||||||||||||||
|
Directors deferred fees
|
- | - | - | - | - | - | (341 | ) | 341 | - | - | |||||||||||||||||||||||||||||
|
Other comprehensive loss, net of tax
|
- | - | - | - | - | - | - | - | (11,903 | ) | (11,903 | ) | ||||||||||||||||||||||||||||
|
Common stock issued pursuant to:
|
||||||||||||||||||||||||||||||||||||||||
|
Common stock issued, net
|
1,695,434 | 16,122 | - | - | - | - | - | - | - | 16,122 | ||||||||||||||||||||||||||||||
|
Exercise of stock options
|
900 | 6 | - | - | - | - | - | - | - | 6 | ||||||||||||||||||||||||||||||
|
Current income tax benefit
|
- | 1 | - | - | - | - | - | - | - | 1 | ||||||||||||||||||||||||||||||
|
Stock-based compensation
|
10,584 | 247 | - | - | - | - | - | - | - | 247 | ||||||||||||||||||||||||||||||
|
Dividend reinvestment plan
|
4,541 | 39 | - | - | - | - | - | - | - | 39 | ||||||||||||||||||||||||||||||
|
Preferred stock issued, net
|
- | - | - | 17,161 | - | - | - | - | - | 17,161 | ||||||||||||||||||||||||||||||
|
Cash dividends:
|
- | - | ||||||||||||||||||||||||||||||||||||||
|
Common stock, $.20 per share
|
- | - | - | - | - | (1,638 | ) | - | - | - | (1,638 | ) | ||||||||||||||||||||||||||||
|
Preferred stock, net of accretion
|
- | - | - | - | 453 | (2,196 | ) | - | - | - | (1,743 | ) | ||||||||||||||||||||||||||||
|
Balance, December 31, 2010
|
9,053,360 | $ | 86,791 | $ | 2,412 | $ | 48,421 | $ | (1,503 | ) | $ | 22,901 | $ | (1,729 | ) | $ | 1,729 | $ | (6,798 | ) | $ | 152,224 | ||||||||||||||||||
See accompanying notes.
F-8
CONSOLIDATED STATEMENTS OF CASH FLOWS
Years Ended December 31, 2010, 2009 and 2008
|
2010
|
2009
|
2008
|
||||||||||
|
(Amounts in thousands)
|
||||||||||||
|
Operating Activities
|
||||||||||||
|
Net income
|
$ | 7,726 | $ | 6,537 | $ | 3,987 | ||||||
|
Adjustments to reconcile net income to net
|
||||||||||||
|
cash provided by operating activities:
|
||||||||||||
|
Provision for loan losses
|
26,382 | 15,750 | 7,075 | |||||||||
|
Depreciation and amortization
|
1,912 | 1,579 | 1,497 | |||||||||
|
Amortization (accretion) of premiums and discounts, net
|
355 | 529 | (259 | ) | ||||||||
|
Amortization of core deposit intangible
|
372 | 246 | 248 | |||||||||
|
Provision for deferred income taxes (benefit)
|
(1,017 | ) | (2,259 | ) | (758 | ) | ||||||
|
Accretion of fair value purchase accounting adjustments
|
(6,296 | ) | - | - | ||||||||
|
Stock-based compensation
|
247 | 52 | 55 | |||||||||
|
Deferred compensation
|
810 | 844 | 791 | |||||||||
|
Earnings on bank-owned life insurance
|
(986 | ) | (931 | ) | (1,101 | ) | ||||||
|
Gain on acquisition
|
(19,261 | ) | - | - | ||||||||
|
Gain on sale of investment securities, net
|
(535 | ) | (3,610 | ) | (223 | ) | ||||||
|
Losses on other real estate owned
|
5,384 | 109 | 317 | |||||||||
|
Gain on sale of loans
|
(1,583 | ) | (1,108 | ) | (783 | ) | ||||||
|
Origination of loans held for sale
|
(103,461 | ) | (81,949 | ) | (47,320 | ) | ||||||
|
Proceeds from sales of loans held for sale
|
101,059 | 80,851 | 49,858 | |||||||||
|
(Increase) decrease in accrued interest receivable
|
532 | (786 | ) | (2,318 | ) | |||||||
|
(Increase) decrease in other assets
|
20,329 | (13,858 | ) | (707 | ) | |||||||
|
Increase (decrease) in accrued expenses and other liabilities
|
1,080 | 208 | (1,852 | ) | ||||||||
|
Other operating activities, net
|
2,100 | 1,064 | (1 | ) | ||||||||
|
Net cash provided by operating activities
|
35,149 | 3,268 | 8,506 | |||||||||
|
Investing Activities
|
||||||||||||
|
Purchases of investment securities available for sale
|
(67,125 | ) | (68,603 | ) | (347,063 | ) | ||||||
|
Purchases of investment securities held to maturity
|
- | - | (6,000 | ) | ||||||||
|
Proceeds from sales of investment securities available for sale
|
77,148 | 89,808 | 7,823 | |||||||||
|
Proceeds from maturities of investment securities available for sale
|
53,204 | 48,120 | 9,495 | |||||||||
|
(Purchases) redemption of Federal Home Loan Bank stock
|
675 | 7,284 | (6,211 | ) | ||||||||
|
Investment in bank-owned life insurance
|
(18,028 | ) | (33 | ) | (1,527 | ) | ||||||
|
Net increase in loans
|
(122,027 | ) | (95,713 | ) | (85,240 | ) | ||||||
|
Purchases of premises and equipment
|
(4,682 | ) | (3,531 | ) | (4,147 | ) | ||||||
|
Proceeds from disposal of premises and equipment
|
14 | 27 | 12 | |||||||||
|
Investment in foreclosed assets
|
(1,295 | ) | (1,829 | ) | - | |||||||
|
Proceeds from sales of foreclosed assets
|
11,433 | 4,656 | 1,850 | |||||||||
|
Purchase of interest rate derivative
|
- | (24,003 | ) | - | ||||||||
|
Net cash received from acquisition
|
61,112 | - | - | |||||||||
|
Net cash used by investing activities
|
(9,571 | ) | (43,817 | ) | (431,008 | ) | ||||||
|
Financing Activities
|
||||||||||||
|
Net increase (decrease) in deposits
|
(20,395 | ) | 203,865 | 290,864 | ||||||||
|
Net increase (decrease) in short-term borrowings
|
(28,615 | ) | (148,860 | ) | 113,215 | |||||||
|
Net increase (decrease) in long-term debt
|
(24,602 | ) | - | 4,000 | ||||||||
|
Proceeds from issuance of preferred stock
|
17,161 | - | 31,260 | |||||||||
|
Proceeds from issuance of common stock
|
16,122 | - | - | |||||||||
|
Proceeds from exercise of stock options
|
6 | 32 | 435 | |||||||||
|
Tax benefit from exercise of stock options
|
1 | 3 | 286 | |||||||||
|
Purchase and retirement common stock
|
- | (144 | ) | (385 | ) | |||||||
|
Common stock issued pursuant to dividend reinvestment plan
|
39 | - | - | |||||||||
|
Cash dividends paid, net of accretion
|
(3,381 | ) | (2,944 | ) | (1,457 | ) | ||||||
|
Net cash provided (used) by financing activities
|
(43,664 | ) | 51,952 | 438,218 | ||||||||
|
Net increase (decrease) in cash and cash equivalents
|
(18,086 | ) | 11,403 | 15,716 | ||||||||
|
Cash and cash equivalents, beginning of year
|
48,173 | 36,770 | 21,054 | |||||||||
|
Cash and cash equivalents, end of year
|
$ | 30,087 | $ | 48,173 | $ | 36,770 | ||||||
|
Supplemental Statement of Cash Flows Disclosure
|
||||||||||||
|
Interest paid
|
$ | 34,595 | $ | 33,475 | $ | 37,458 | ||||||
|
Income taxes paid
|
2,152 | 2,710 | 1,170 | |||||||||
|
Summary of Noncash Investing and Financing Activities
|
||||||||||||
|
Increase (decrease) in fair value of investment securities available for sale, net of tax
|
$ | (2,796 | ) | $ | 6,061 | $ | (52 | ) | ||||
|
Increase (decrease) in fair value of cash flow hedge, net of tax
|
(9,107 | ) | (4,356 | ) | 1,598 | |||||||
|
Transfer of loans to foreclosed assets
|
34,213 | 12,348 | 4,679 | |||||||||
|
Increase (decrease) in accrual of dividends payable
|
- | (285 | ) | 480 | ||||||||
|
Liability accrued under adoption of new accounting standard
|
- | - | 959 | |||||||||
See accompanying notes.
F-9
Notes To Consolidated Financial Statements
December 31, 2010, 2009 and 2008
NOTE A - ORGANIZATION AND SUMMARY OF SIGNIFICANT ACCOUNTING POLICIES
Organization
BNC Bancorp (“the Company”) is a bank holding company for Bank of North Carolina (the “Bank”), a wholly owned subsidiary, headquartered in High Point, North Carolina. The Company also maintains four wholly-owned special-purpose subsidiary trusts that issue trust preferred securities. The information in the consolidated financial statements relates primarily to the Bank. The Bank is a full service commercial bank providing commercial banking services tailored to the particular banking needs of the communities it serves in North and South Carolina. The Bank's primary source of revenue is derived from loans to customers, who are predominantly individuals and small to medium size businesses in their respective market areas. The Bank has
three subsidiaries: BNC Credit Corp. serves as the Bank’s trustee on deeds of trust and Sterling Real Estate Holdings, LLC and Sterling Real Estate Development of North Carolina, LLC hold and dispose of the Bank’s real estate owned.
The Company is subject to the rules and regulations of the Federal Reserve Bank. The Bank is operating under the Banking Laws of North Carolina, and is subject to the rules and regulations of the North Carolina Commissioner of Banks and Federal Deposit Insurance Corporation (“FDIC”). Accordingly, the Company and the Bank are examined periodically by those regulatory authorities.
Basis of Presentation
The accompanying consolidated financial statements include the accounts and transactions of the Company and the Bank, collectively referred to herein as the “Company”. All significant intercompany transactions and balances are eliminated in consolidation.
Use of Estimates
The preparation of consolidated financial statements in conformity with accounting principles generally accepted in the United States of America (“GAAP”) requires management to make estimates and assumptions that affect the reported amounts of assets and liabilities and disclosure of contingent assets and liabilities at the date of the financial statements and the reported amounts of revenues and expenses during the reporting period. Actual results could differ from those estimates. Material estimates that are particularly susceptible to significant change in the near term relate to the determination of the allowance for loan losses.
Cash and Cash Equivalents
For the purpose of presentation in the statements of cash flows, cash and cash equivalents include cash and due from banks and interest-earning deposits in other banks with maturities of three months or less. From time to time, the Bank may have deposits in excess of federally insured limits.
Federal regulations require financial institutions to set aside a specified amount as a reserve against transaction accounts and time deposits. At December 31, 2010, the Company’s reserve requirement was $9.7 million.
Investment Securities
Investment securities are classified into one of three categories on the date of purchase and accounted for as follows: (1) debt securities that the Company has the positive intent and the ability to hold to maturity are classified as held to maturity and reported at amortized cost; (2) debt and equity securities that are bought and held principally for the purpose of selling them in the near term are classified as trading securities and reported at fair value, with unrealized gains and losses included in earnings; (3) debt and equity securities not classified as either held to maturity securities or trading securities are classified as available for sale securities and reported at fair value, with unrealized gains and losses, net of taxes, reported as other comprehensive income.
Premiums are amortized and discounts accreted using the interest method over the remaining terms of the related securities. Gains and losses on the sale of investment securities are determined using the specific identification method and are included in non-interest income on a trade date basis.
F-10
Notes To Consolidated Financial Statements
December 31, 2010, 2009 and 2008
Federal Home Loan Bank Stock
As a member of the Federal Home Loan Bank of Atlanta (the "FHLB"), the Company is required to maintain an investment in the stock of the FHLB based upon the amount of outstanding FHLB borrowings. This stock is carried at cost, which amounted to $9.1 million and $6.2 million at December 31, 2010 and 2009, respectively. Due to the redemption provisions of the FHLB, the Company estimated that fair value equals cost and that this investment was not impaired at December 31, 2010.
Loans Held for Sale
The Company originates certain single family, residential first mortgage loans for sale on a presold basis. Loans held for sale are carried at the lower of cost or estimated fair value in the aggregate as determined by outstanding commitments from investors. Upon closing, these loans, together with their servicing rights, are sold to other financial institutions under prearranged terms. The Company recognizes certain origination and service fees at the time of sale, which are classified as mortgage fee income on the consolidated statements of income.
Loans and Allowance for Loan Losses
Loans that management has the intent and ability to hold for the foreseeable future or until maturity are reported at their outstanding principal adjusted for any charge-offs, the allowance for loan losses, and any deferred fees or costs on originated loans and unamortized premiums or discounts on purchased loans. Loan origination fees and certain direct origination costs are capitalized and recognized as an adjustment of the yield of the related loan. Interest on loans is recorded based on the principal amount outstanding.
Acquired loans are recorded at estimated fair value on their purchase date and prohibit the carryover of the related allowance for loan losses. When the loans have evidence of credit deterioration since origination and it is probable at the date of acquisition that the Company will not collect all contractually required principal and interest payments, the difference between contractually required payments at acquisition and the cash flows expected to be collected at acquisition is referred to as the non-accretable difference. The Company must estimate expected cash flows at each reporting date. Subsequent decreases to the expected cash flows will generally result in a provision for loan losses. Subsequent increases in cash flows result in a reversal of the provision for loan losses to the extent of prior charges
and adjusted accretable yield which will have a positive impact on interest income.
The allowance for loan losses is established through a provision for loan losses charged to expense. Loans are charged-off against the allowance when management believes that the collectibility of principal is unlikely. Recoveries of amounts previously charged-off are credited to the allowance. The allowance is an amount that management believes will be adequate to absorb probable losses on existing loans based on evaluations of the collectibility of loans. The evaluations take into consideration such factors as changes in the nature and volume of the
loan portfolio, overall portfolio quality, historical loan losses, review of specific loans for impairment, and current economic conditions and trends that may affect the borrowers' ability to pay. Accrual of interest is discontinued on loans when management believes, after considering economic and business conditions and collection efforts and the value of the underlying collateral, that the borrowers' financial condition is such that collection is doubtful.
The Company considers a loan impaired, based on current information and events, if it is probable that the Company will be unable to collect the scheduled payments of principal or interest when due according to the contractual terms of the loan agreement. All impaired loans are measured based on the present value of the expected future cash flows discounted at the loan's effective interest rate, the loan's observable market price, or at the fair value of the collateral if the loan is collateral dependent.
The Company uses several factors in determining if a loan is impaired. Internal asset classification procedures include a thorough review of significant loans and lending relationships and include the accumulation of related data. This data includes loan payment status and the borrowers' financial data, cash flows, operating income or loss, and other factors. While management uses the best information available to make evaluations, this evaluation is inherently subjective as it requires material estimates including the amounts and timing of future cash flows expected to be received on impaired loans that may be susceptible to significant change.
F-11
Notes To Consolidated Financial Statements
December 31, 2010, 2009 and 2008
In addition, various regulatory agencies, as an integral part of their examination process, periodically review the Bank's allowance for loan losses. Such agencies may require the Bank to recognize adjustments to the allowance based on their judgments of information available to them at the time of their examination.
Loans, including impaired loans, are generally classified as nonaccrual if they are past due as to maturity or payment of principal or interest for a period of more than ninety (90) days, unless such loans are well-secured and in the process of collection. If a loan or a portion of a loan is classified as doubtful or is partially charged off, the loan is generally classified as nonaccrual. Loans that are on a current payment status or past due less than ninety (90) days may also be classified as nonaccrual if repayment in full of principal and/or interest is in
doubt.
Loans may be returned to accrual status when all principal and interest amounts contractually due (including arrearages) are reasonably assured of repayment within an acceptable period of time and there is a sustained period of repayment performance (generally, a minimum of six months) by the borrower in accordance with the contractual terms of interest and principal.
While a loan is classified as nonaccrual and the future collectibility of the recorded loan balance is doubtful, collections of interest and principal are generally applied as a reduction to principal outstanding, except loans with scheduled amortizations where the payment is generally applied to the oldest payment due. When future collection of the recorded loan balance is expected, interest income may be recognized on a cash basis. In the case where a nonaccrual loan had been partially charged off, recognition of interest on a cash basis is limited to that
which would have been recognized on the recorded loan balance at the contractual interest rate. Receipts in excess of that amount are recorded as recoveries to the allowance for loan losses until prior charge-offs have been fully recovered.
Comprehensive Income
Comprehensive income is defined as the change in equity during a period for non-owner transactions and is divided into net income and other comprehensive income. Other comprehensive income includes revenues, expenses, gains, and losses that are excluded from earnings under current accounting standards. Accumulated other comprehensive income at December 31, 2010, 2009 and 2008 consists of the following:
|
2010
|
2009
|
2008
|
||||||||||
|
(Amounts in thousands)
|
||||||||||||
|
Unrealized holding gains – investment securities available for sale, net of tax
|
3,882 | 6,677 | 616 | |||||||||
|
Unrealized holding gains (losses) – cash flow hedge instruments, net of tax
|
(10,680 | ) | (1,572 | ) | 2,784 | |||||||
|
Total accumulated other comprehensive income (loss)
|
$ | (6,798 | ) | $ | 5,105 | $ | 3,400 | |||||
Premises and Equipment
Premises and equipment are stated at cost less accumulated depreciation and amortization. Land is carried at cost. Depreciation and amortization are computed using the straight-line method over the estimated useful lives of the respective assets which are 40 years for buildings and 3 to 10 years for furniture and equipment. Leasehold improvements are amortized over the terms of the respective leases or the estimated useful lives of the improvements, whichever is shorter. Repairs and maintenance costs are charged to operations as incurred.
Other Real Estate Owned
Other real estate owned acquired through, or in lieu of, loan foreclosure is held for sale and are recorded at estimated fair value less cost of disposal. When property is acquired, the excess, if any, of the loan balance over estimated fair value is charged to the allowance for loan losses. Subsequent to foreclosure, valuations are periodically performed by management and the assets are carried at the lower of carrying amount or fair value less cost to sell. Revenue and expenses from operations and changes in the valuation allowance are included in other non-interest expense. The carrying value of other real estate owned was $39.7 million, of which $15.8 million is covered under loss share agreements at December 31, 2010. The carrying value of other real
estate owned was $14.3 million at December 31, 2009.
F-12
Notes To Consolidated Financial Statements
December 31, 2010, 2009 and 2008
FDIC Indemnification Asset
The FDIC indemnification asset represents the estimated amounts due from the FDIC related to the loss share agreements which were booked as of the acquisition date for Beach First National Bank (“Beach First”). The estimate represents the discounted value of the FDIC’s reimbursed portion of estimated losses we expect to realize on loans and other real estate (“Covered Assets”) acquired as a result of the Beach First acquisitions. When losses are realized on Covered Assets, the portion that the FDIC pays the Company in cash for principal and up to 90 days of interest reduces the FDIC indemnification asset. On a quarterly basis, the Company will evaluate the FDIC indemnification asset to determine if the estimated losses on covered assets support the
amount recorded as FDIC indemnification asset.
Bank-Owned Life Insurance
The Company has purchased life insurance policies on certain key employees and directors. These policies are recorded at their cash surrender value. Income from these policies and changes in the net cash surrender value are recorded in non-interest income as earnings on bank-owned life insurance. The cash value accumulation is permanently tax deferred if the policy is held to the insured person’s death and certain other conditions are met.
Goodwill and Other Intangibles Assets
On an annual basis or more frequently as circumstances dictate, the Company’s management reviews goodwill and other intangible assets and evaluates events or other developments that may indicate impairment in the carrying amount in accordance with Accounting Standards Codification (“ASC”) Topic 350, Intangibles – Goodwill and Other, which represents the excess of cost over the fair value of the net assets of an acquired business, is not being amortized. Identifiable intangible assets are acquired assets that lack physical substance but can be distinguished from goodwill because of contractual or legal rights or because the assets are capable of being sold or exchanged either on their own or in combination with a related contract,
asset, or liability. The Company’s identifiable intangible assets relate to premiums on purchased core deposits and are being amortized over their estimated useful lives.
Derivatives
The Company accounts for derivative instruments in accordance with the provisions of ASC Topic 815, Derivatives and Hedging, as amended, which defines derivatives, requires that derivatives be carried at fair value on the balance sheet and provides for hedge accounting when certain conditions are met. In accordance with this topic, the Company’s derivative financial instruments are recognized on the balance sheet at fair value. Changes in the fair value of derivative instruments designated as “cash flow” hedges, to the extent the hedges are highly effective, are recorded in other comprehensive income, net of tax effects. Ineffective portions of cash flow hedges, if any, are recognized in current period earnings. Other comprehensive income
or loss is reclassified into current period earnings when the hedged transaction affects earnings.
The Company assesses, both at the inception of the hedge and on an ongoing basis, whether derivatives used as hedging instruments are highly effective in offsetting the changes in the cash flow of the hedge items. If it is determined that a derivative is not highly effective as a hedge or ceases to be highly effective, the Company will discontinue hedge accounting prospectively.
Earnings Per Share
Basic earnings per common share is computed using the weighted average number of common shares and participating securities outstanding during the reporting period. Diluted earnings per common share is the amount of earnings available to each share of common stock during the reporting period adjusted to include the effect of potentially dilutive common shares. Potentially dilutive common shares include incremental shares issued for stock options, restricted stock awards and the warrant under the United States Treasury’s Capital Purchase Program (collectively referred to herein as “Stock Rights”). Potentially dilutive common shares are excluded from the computation of dilutive earnings per share in the periods in which the effect would be anti-dilutive.
F-13
Notes To Consolidated Financial Statements
December 31, 2010, 2009 and 2008
The weighted average numbers of shares outstanding or assumed to be outstanding for the years ended December 31, is as follows:
|
2010
|
2009
|
2008
|
||||||||||
|
(Dollars in thousands)
|
||||||||||||
|
Net income available to common shareholders
|
$ | 5,530 | $ | 4,553 | $ | 3,845 | ||||||
|
Add: Convertible preferred stock dividends
|
180 | - | - | |||||||||
|
Net income available to participating common shareholders
|
$ | 5,710 | $ | 4,553 | $ | 3,845 | ||||||
|
Weighted average common shares - basic
|
8,273,566 | 7,340,015 | 7,322,723 | |||||||||
|
Add: Convertible preferred stock
|
988,803 | - | - | |||||||||
|
Weighted average participating common shares - basic
|
9,262,369 | 7,340,015 | 7,322,723 | |||||||||
|
Effects of dilutive Stock Rights
|
75,023 | 7,685 | 73,447 | |||||||||
|
Weighted average participating common shares - diluted
|
9,337,392 | 7,347,700 | 7,396,170 | |||||||||
|
Basic earnings per common share
|
$ | 0.62 | $ | 0.62 | $ | 0.53 | ||||||
|
Diluted earnings per common share
|
$ | 0.61 | $ | 0.62 | $ | 0.52 | ||||||
For the years ended December 31, 2010, 2009 and 2008, there were 121,653, 747,735 and 674,390 shares, respectively, of Stock Rights that were excluded in computing diluted shares outstanding because the exercise price exceeded the market price of the common shares outstanding.
Income Taxes
Deferred income taxes are recognized for the tax consequences of temporary differences between financial statement carrying amounts and the tax bases of existing assets and liabilities that will result in taxable or deductible amounts in future years. These temporary differences are multiplied by the enacted income tax rate expected to be in effect when the taxes become payable or receivable. The effect on deferred taxes of a change in tax rates is recognized in income in the period that includes the enactment date. Deferred tax assets are reduced, if necessary, by the amount of such benefits that are not expected to be realized based on available evidence.
Stock Compensation Plans
The Company follows the provisions of ASC Topic 718, Compensation – Stock Compensation for share-based compensation. This topic establishes fair value as the measurement objective in accounting for stock awards and requires the application of fair value measurement method in accounting for compensation cost, which is recognized over the requisite service period.
Segment Reporting
The Company follows the provisions of ASC Topic 280, Segment Reporting which requires management to report selected financial and descriptive information about reportable operating segments. It also establishes standards for related disclosures about products and services, geographic areas, and major customers. Generally, disclosures are required for segments internally identified to evaluate performance and resource allocation. In all material respects, the Company’s operations are entirely within the commercial banking segment, and the financial statements presented herein reflect the results of that segment. Also, the Bank has no foreign operations or customers.
Reclassifications
Certain amounts in the 2009 and 2008 consolidated financial statements have been reclassified to conform to the 2010 presentation. The reclassifications had no effect on net income, net income available to common shareholders or shareholders' equity as previously reported.
F-14
Notes To Consolidated Financial Statements
December 31, 2010, 2009 and 2008
Recently Adopted and Issued Accounting Standards
In January 2010, the Financial Accounting Standards Board (“FASB”) issued Accounting Standards Update (“ASU”) No. 2010-06, Fair Value Measurements and Disclosures (Topic 820): Improving Disclosures about Fair Value Measurement (“ASU No. 2010-06”). ASU No. 2010-06 requires some new disclosures and clarifies some existing disclosure requirements about fair value measurement as set forth in Codification Subtopic 820-10. The FASB’s objective is to improve these disclosures and, thus, increase the transparency in financial reporting. Specifically, ASU 2010-06 amends Codification Subtopic 820-10 to now require that: (1) a reporting entity disclose
separately the amounts of significant transfers in and out of Level 1 and Level 2 fair value measurements and describe the reasons for the transfers; and (2) a reporting entity present separately information about purchases, sales, issuances, and settlements in the reconciliation for fair value measurements using significant unobservable inputs. In addition, ASU 2010-06 clarifies the requirements for purposes of reporting fair value measurement for each class of assets and liabilities, a reporting entity needs to use judgment in determining the appropriate classes of assets and liabilities, and a reporting entity should provide disclosures about the valuation techniques and inputs used to measure fair value for both recurring and nonrecurring fair value measurements. ASU 2010-06 became effective for interim and annual reporting periods beginning after December 15, 2009, except for the disclosures about purchases, sales, issuances, and settlements in the roll
forward of activity in Level 3 fair value measurements which are effective for fiscal years beginning after December 15, 2010, and for interim periods within those fiscal years. The adoption of ASU No. 2010-06 during the quarter ended March 31, 2010 had no effect on the Company’s consolidated financial statements.
In February 2010, the FASB issued ASU No. 2010-09, Subsequent Events: Amendments to Certain Recognition and Disclosure Requirements (“ASU No. 2010-09”). ASU No. 2010-09 removes some contradictions between the requirements of GAAP and the filing rules of the Securities and Exchange Commission (“SEC”). SEC filers are required to evaluate subsequent events through the date the financial statements are issued, and they are no longer required to disclose the date through which subsequent events have been evaluated. This guidance was effective upon issuance except for the use of the issued date for conduit debt obligors, and the adoption had no impact on the Company’s consolidated financial statements.
In April 2010, the FASB issued ASU No. 2010-18, Effect of a Loan Modification When the Loan Is Part of a Pool That Is Accounted for as a Single Asset (“ASU No. 2010-18”). ASU No. 2010-18 provides guidance on the accounting for loan modifications when the loan is part of a pool of loans accounted for as a single asset such as acquired loans that have evidence of credit deterioration upon acquisition that are accounted for under the guidance in ASC 310-30. ASU No. 2010-18 addresses diversity in practice on whether a loan that is part of a pool of loans accounted for as a single asset should be removed from that pool upon a modification that would constitute a troubled debt restructuring or remain in the pool after modification.
ASU No. 2010-18 clarifies that modifications of loans that are accounted for within a pool under ASC 310-30 do not result in the removal of those loans from the pool even if the modification of those loans would otherwise be considered a troubled debt restructuring. An entity will continue to be required to consider whether the pool of assets in which the loan is included is impaired if the expected cash flows for the pool change. The amendments in this update do not require any additional disclosures and are effective for modifications of loans accounted for within pools under ASC 310-30 occurring in the first interim or annual period ending on or after July 15, 2010. The adoption did not have an impact on the Company’s consolidated financial statements.
In July 2010, the FASB issued ASU No. 2010-20, Disclosures about the Credit Quality of Financing Receivables and the Allowance for Credit Losses (“ASU No. 2010-20”). ASU No. 2010-20 will require the Company to provide a greater level of disaggregated information about the credit quality of the Company’s loans and leases and the Allowance for Loan and Lease Losses (the “Allowance”). ASU No. 2010-20 will also require the Company to disclose additional information related to credit quality indicators, past due information, and information related to loans modified in a troubled debt restructuring. The provisions of ASU No. 2010-20 are effective for the Company’s reporting period ending
December 31, 2010, except as amended by ASU 2011-01. As this ASU amends only the disclosure requirements for loans and leases and the Allowance, the adoption did not have an impact on the Company’s consolidated financial statements.
F-15
Notes To Consolidated Financial Statements
December 31, 2010, 2009 and 2008
In December 2010, the FASB issued ASU No. 2010-28, Intangibles – Goodwill and Other (Topic 350) – When to Perform Step 2 of the Goodwill Impairment Test for Reporting Units with Zero or Negative Carrying Amounts. This update provides guidance on when to perform step 2 of the goodwill impairment test for reporting units with zero or negative carrying amounts. For those reporting units, an entity is required to perform step 2 of the goodwill impairment test if it is more likely than not that a goodwill impairment exists. In determining whether it is more likely than not that a goodwill impairment exists, an entity should consider whether there are any adverse
qualitative factors indicating that an impairment may exist. For public entities the amendments are effective for fiscal years, and interim periods within those fiscal years, beginning after December 15, 2010. Early adoption is not permitted. This guidance is not expected to have a material impact on the Company’s consolidated financial statements.
In January 2011, the FASB issued ASU No. 2011-01, Deferral of the Effective Date of Disclosures about Troubled Debt Restructurings in Update No. 2010-20. The provisions of ASU No. 2010-20 required the disclosure of more granular information on the nature and extent of troubled debt restructurings and their effect on the Allowance for the period ending March 31, 2011. The amendments in this ASU defer the effective date related to these disclosures, enabling creditors to provide those disclosures after the FASB completes its project clarifying the guidance for determining what constitutes a troubled debt restructuring. Currently, that guidance is expected to be effective for interim and
annual periods ending after June 15, 2011. As the provisions of this ASU only defer the effective date of disclosure requirements related to troubled debt restructurings, the adoption of this ASU will have no impact on the Company’s consolidated financial statements.
Other accounting standards that have been issued or proposed by the FASB or other standards-setting bodies are not expected to have a material impact on the Company’s financial position, results of operations and cash flows.
NOTE B – FDIC-ASSISTED ACQUISITION
On April 9, 2010, the Bank acquired certain assets and assumed certain liabilities of Beach First National Bank (“Beach First”) from the Federal Deposit Insurance Corporation (“FDIC”) in a FDIC-assisted transaction. Beach First was a full-service commercial bank headquartered in Myrtle Beach, South Carolina that operated seven branch locations in the Coastal South Carolina region. The Bank made this acquisition to enter into a new market outside the central North Carolina region and to allow the Bank to expand its geographic footprint. The loans and other real estate owned acquired as part of the Purchase and Assumption Agreement, are covered by two loss share agreements between the FDIC and the Bank (one for single family residential mortgage loans and the other for
all other loans and other real estate owned), which affords the Bank significant loss protection with respect to the acquired loans and other real estate owned. Under the terms of the loss share agreements, the FDIC will absorb 80% of losses and share in 80% of loss recoveries. The term for the loss share agreement for single family residential mortgage loans is in effect for 10 years from the April 9, 2010 acquisition date and the loss share agreement for all other loans and other real estate owned is in effect for five years from the acquisition date. The loss recovery provisions are in effect for 10 years and eight years, respectively, from the acquisition date.
The purchased assets and assumed liabilities were recorded at their respective acquisition date fair values, and identifiable intangible assets were recorded at fair value. Fair values are preliminary and subject to refinement for up to one year after the closing date of an acquisition as information relative to closing date fair values become available. A pre-tax gain totaling $19.3 million ($11.8 million tax-effected) resulted from the acquisition and is included as a component of non-interest income in the consolidated statement of income. The amount of the gain is equal to the amount by which the fair value of assets purchased exceeded the fair value of liabilities assumed. During the fourth quarter of 2010, adjustments were made to the gains based on additional information regarding the respective
acquisition date fair values. These adjustments were made retroactive to the acquisition date, resulting in an adjustment to the pretax gain of $28,000. The results of operations of Beach First for the period of April 9, 2010 to December 31, 2010 are included in the consolidated financial statements.
The Company’s management made significant estimates and exercised significant judgment in accounting for the acquisition of Beach First. Management engaged an independent third party to assist in determining the value of Beach First’s loans. The Bank also recorded an identifiable intangible asset representing the value of the core deposit customer base of Beach First. Management used quoted market prices and observable data to determine the fair value of investment securities. The fair values of time deposits and other borrowings which were purchased and assumed from Beach First were determined based on discounted cash flows at current rates for similar instruments. The fair values of Federal Home Loan Bank (“FHLB”) advances were derived using pricing
supplied by the FHLB.
F-16
Notes To Consolidated Financial Statements
December 31, 2010, 2009 and 2008
Acquired credit-impaired loans are accounted for under the accounting guidance for loans and debt securities acquired with deteriorated credit quality, found in Accounting Standards Codification (“ASC”) Topic 310-30, Receivables – Loans and Debt Securities Acquired with Deteriorated Credit Quality, formerly American Institute of Certified Public Accountants Statement of Position (SOP) 03-3, Accounting for Certain Loans or Debt Securities Acquired in a Transfer, and initially measured at fair value, which includes estimated future credit losses expected to be incurred over the life of the loans. Loans acquired in business combinations with evidence of credit deterioration since origination and for which it is probable that all
contractually required payments will not be collected are considered to be credit impaired. Evidence of credit quality deterioration as of purchase dates may include information such as past-due and nonaccrual status, borrower credit scores and recent loan to value percentages. The Company considers expected prepayments and estimates the amount and timing of undiscounted expected principal, interest and other cash flows for each loan meeting the criteria above, and determines the excess of the loan’s scheduled contractual principal and contractual interest payments of all cash flows expected at acquisition as an amount that should not be accreted (nonaccretable difference). The remaining amount, representing the excess of the loan’s or pool’s cash flows expected to be collected over the amount paid, is accreted into interest income over the remaining life of the loan or pool (accretable yield). The Company records a discount
on these loans at acquisition to record them at their realizable cash flow.
Loans acquired through business combinations that do not meet the specific criteria of ASC Topic 310-30, but for which a discount is attributable, at least in part, to credit quality, are also accounted for under this guidance. As a result, related discounts are recognized subsequently through accretion based on the expected cash flow of the acquired loans.
A summary of the net assets received from the FDIC and the estimated fair value adjustments resulting in the net gain are as follows:
|
(In thousands)
|
||||
|
Beach First's cost basis net assets
|
$ | 55,920 | ||
|
Cash payment from the FDIC
|
13,267 | |||
|
Fair value adjustments:
|
||||
|
Investment securities available for sale
|
(472 | ) | ||
|
Loans
|
(138,934 | ) | ||
|
FDIC indemnification asset
|
95,765 | |||
|
Other real estate owned
|
(1,998 | ) | ||
|
Core deposit intangible
|
1,118 | |||
|
Time deposits
|
(1,396 | ) | ||
|
Borrowings
|
(2,491 | ) | ||
|
Deferred tax liability
|
(7,436 | ) | ||
|
Other liabilities
|
(1,518 | ) | ||
|
Net after-tax gain on acquisition
|
$ | 11,825 | ||
The net gain on acquisition represents the excess of the estimated fair value of the assets acquired over the estimated fair value of the liabilities assumed and is influenced significantly by the FDIC-assisted transaction process. Under the FDIC-assisted transaction process, only certain assets and liabilities are transferred to the acquirer and, depending on the nature and amount of the acquirer’s bid, the FDIC may be required to make a cash payment to the acquirer.
Under the terms of the Purchase and Assumption Agreement, the Bank purchased certain Beach First premises and equipment totaling $989,000.
F-17
Notes To Consolidated Financial Statements
December 31, 2010, 2009 and 2008
The statement of assets acquired and liabilities assumed from the Beach First acquisition are as follows:
|
(In thousands)
|
||||
|
Assets Acquired
|
||||
|
Cash and due from banks
|
$ | 61,112 | ||
|
Investment securities available for sale
|
59,961 | |||
|
Loans
|
348,842 | |||
|
FDIC indemnification asset
|
95,765 | |||
|
Other real estate owned
|
6,721 | |||
|
Core deposit intangible
|
1,118 | |||
|
Accrued interest receivable
|
2,717 | |||
|
Other assets
|
5,704 | |||
|
Total assets acquired
|
$ | 581,940 | ||
|
Liabilities Assumed
|
||||
|
Deposits
|
$ | 499,983 | ||
|
Borrowings
|
60,569 | |||
|
Deferred tax liability
|
7,436 | |||
|
Other liabilities
|
2,127 | |||
|
Total liabilities assumed
|
$ | 570,115 | ||
|
Net Assets Acquired
|
$ | 11,825 | ||
F-18
Notes To Consolidated Financial Statements
December 31, 2010, 2009 and 2008
NOTE C – INVESTMENT SECURITIES
The amortized cost and estimated fair values of investment securities as of December 31 are as follows:
|
Gross
|
Gross
|
Estimated
|
||||||||||||||
|
Amortized
|
unrealized
|
unrealized
|
fair
|
|||||||||||||
|
cost
|
gains
|
losses
|
value
|
|||||||||||||
|
(Amounts in thousands)
|
||||||||||||||||
|
2010
|
||||||||||||||||
|
Avaliable for sale:
|
||||||||||||||||
|
State and municipals
|
$ | 221,902 | $ | 2,722 | $ | 4,082 | $ | 220,542 | ||||||||
|
Mortgage-backed
|
124,604 | 7,854 | 176 | 132,282 | ||||||||||||
|
Other
|
47 | - | - | 47 | ||||||||||||
| $ | 346,553 | $ | 10,576 | $ | 4,258 | $ | 352,871 | |||||||||
|
Held to maturity:
|
||||||||||||||||
|
Corporate bonds
|
$ | 6,000 | $ | - | $ | 720 | $ | 5,280 | ||||||||
|
Gross
|
Gross
|
Estimated
|
||||||||||||||
|
Amortized
|
unrealized
|
unrealized
|
fair
|
|||||||||||||
|
cost
|
gains
|
losses
|
value
|
|||||||||||||
|
(Amounts in thousands)
|
||||||||||||||||
|
2009
|
||||||||||||||||
|
Avaliable for sale:
|
|
|||||||||||||||
|
State and municipals
|
$ | 186,526 | $ | 4,328 | $ | 2,261 | $ | 188,593 | ||||||||
|
Mortgage-backed
|
163,067 | 8,799 | - | 171,866 | ||||||||||||
|
Other
|
47 | - | - | 47 | ||||||||||||
| $ | 349,640 | $ | 13,127 | $ | 2,261 | $ | 360,506 | |||||||||
|
Held to maturity:
|
||||||||||||||||
|
Corporate bonds
|
$ | 6,000 | $ | - | $ | 640 | $ | 5,360 | ||||||||
The following tables show gross unrealized losses and fair values of investment securities, aggregated by investment category and length of time that the individual securities have been in a continuous unrealized loss position, at December 31, 2010 and 2009. At December 31, 2010, the unrealized losses relate to 137 state and municipal securities, two mortgage-backed securities and two corporate bonds. Of those, 13 of the state and municipal securities and the corporate bonds had continuous unrealized losses for more than twelve months. At December 31, 2009, the unrealized losses relate to 75 state and municipal securities and two corporate bonds. Of those, 28 of the state and municipal securities had continuous unrealized losses for more than twelve months. At December
31, 2010, the Company performed an extensive evaluation of the state and municipal securities portfolio at a bond-by-bond level, and based on the evaluation, none of the temporary impairment relates to the issuer’s ability to honor redemption obligations or the credit quality of the issuer. The deterioration in value is attributable to changes in market interest rates and the Company expects these securities to be paid in full and that any temporary impairment be fully recoverable prior to or at maturity. The Company has the ability and intent to hold the investment securities for a reasonable period of time sufficient for a forecasted recovery or until maturity. The temporarily impaired investment securities as of December 31, 2010 and 2009 are as follows:
F-19
Notes To Consolidated Financial Statements
December 31, 2010, 2009 and 2008
|
2010
|
||||||||||||||||||||||||
|
Less Than 12 Months
|
12 Months or More
|
Total
|
||||||||||||||||||||||
|
Fair
|
Unrealized
|
Fair
|
Unrealized
|
Fair
|
Unrealized
|
|||||||||||||||||||
|
value
|
losses
|
value
|
losses
|
value
|
losses
|
|||||||||||||||||||
|
(Amounts in thousands)
|
||||||||||||||||||||||||
|
Securities available for sale:
|
||||||||||||||||||||||||
|
State and municipals
|
$ | 112,579 | $ | 2,896 | $ | 9,330 | $ | 1,186 | $ | 121,909 | $ | 4,082 | ||||||||||||
|
Mortgage-backed
|
10,171 | 176 | - | - | 10,171 | 176 | ||||||||||||||||||
| $ | 122,750 | $ | 3,072 | $ | 9,330 | $ | 1,186 | $ | 132,080 | $ | 4,258 | |||||||||||||
|
Securities held to maturity:
|
||||||||||||||||||||||||
|
Corporate bonds
|
$ | - | $ | - | $ | 5,280 | $ | 720 | $ | 5,280 | $ | 720 | ||||||||||||
|
2009
|
||||||||||||||||||||||||
|
Less Than 12 Months
|
12 Months or More
|
Total
|
||||||||||||||||||||||
|
Fair
|
Unrealized
|
Fair
|
Unrealized
|
Fair
|
Unrealized
|
|||||||||||||||||||
|
value
|
losses
|
value
|
losses
|
value
|
losses
|
|||||||||||||||||||
|
(Amounts in thousands)
|
||||||||||||||||||||||||
|
Securities available for sale:
|
||||||||||||||||||||||||
|
State and municipals
|
$ | 37,336 | $ | 714 | $ | 25,544 | $ | 1,547 | $ | 62,880 | $ | 2,261 | ||||||||||||
|
Securities held to maturity:
|
||||||||||||||||||||||||
|
Corporate bonds
|
$ | - | $ | - | $ | 5,360 | $ | 640 | $ | 5,360 | $ | 640 | ||||||||||||
The amortized cost and estimated fair value of investment securities at December 31, 2010, by contractual maturity and projected cash flows, are shown below. Actual maturities may differ from contractual maturities because borrowers may have the right to call or prepay obligations with or without penalties.
|
Available for sale
|
||||||||
|
Amortized cost
|
Fair value
|
|||||||
|
(Amounts in thousands)
|
||||||||
|
Available for sale:
|
||||||||
|
Due within one year
|
$ | 29,894 | $ | 31,508 | ||||
|
Due after one year through five years
|
83,419 | 86,688 | ||||||
|
Due after five through ten years
|
104,613 | 105,189 | ||||||
|
Due after ten years
|
128,627 | 129,486 | ||||||
| $ | 346,553 | $ | 352,871 | |||||
|
Held to maturity:
|
||||||||
|
Due after five through ten years
|
$ | 6,000 | $ | 5,280 | ||||
F-20
Notes To Consolidated Financial Statements
December 31, 2010, 2009 and 2008
The following is a summary of realized gains and losses from the sales of investment securities classified as available for sale:
|
For the years ended December 31,
|
||||||||||||
|
2010
|
2009
|
2008
|
||||||||||
|
(Amounts in thousands)
|
||||||||||||
|
Proceeds from sales
|
$ | 77,148 | $ | 89,808 | $ | 7,823 | ||||||
|
Gross realized gains on sales
|
$ | 799 | $ | 3,729 | $ | 248 | ||||||
|
Gross realized losses on sales
|
(264 | ) | - | (25 | ) | |||||||
|
Other than temporary impairment loss
|
- | (119 | ) | - | ||||||||
|
Total realized gains, net
|
$ | 535 | $ | 3,610 | $ | 223 | ||||||
At December 31, 2010 and 2009, investment securities with an estimated fair value of approximately $165.0 million and $190.8 million, respectively, were pledged to secure public deposits and for other purposes required or permitted by law.
NOTE D - LOANS AND ALLOWANCE FOR LOAN LOSSES
Major classifications of loans at December 31 are summarized below:
|
2010
|
||||||||||||||||
|
Loans
|
Loans not
|
|||||||||||||||
|
covered under
|
covered under
|
|||||||||||||||
|
loss share
|
loss share
|
|||||||||||||||
|
agreements
|
agreements
|
Total
|
2009
|
|||||||||||||
|
(Amounts in thousands)
|
||||||||||||||||
|
Commercial real estate
|
$ | 120,053 | $ | 557,634 | $ | 677,687 | $ | 449,209 | ||||||||
|
Commercial construction
|
62,879 | 170,079 | 232,958 | 183,509 | ||||||||||||
|
Commercial and industrial
|
24,903 | 111,668 | 136,571 | 113,670 | ||||||||||||
|
Leases
|
- | 10,985 | 10,985 | 12,216 | ||||||||||||
|
Total commercial
|
207,835 | 850,366 | 1,058,201 | 758,604 | ||||||||||||
|
Residential construction
|
2,402 | 29,949 | 32,351 | 50,156 | ||||||||||||
|
Residential mortgage
|
94,701 | 308,615 | 403,316 | 257,445 | ||||||||||||
|
Consumer and other
|
4,404 | 10,099 | 14,503 | 12,655 | ||||||||||||
| $ | 309,342 | $ | 1,199,029 | 1,508,371 | 1,078,860 | |||||||||||
|
Deferred loan costs (fees)
|
(191 | ) | 319 | |||||||||||||
|
Total loans, net of deferred loan costs/fees
|
$ | 1,508,180 | $ | 1,079,179 | ||||||||||||
The Company has loan and deposit relationships with its directors and executive officers and with companies with which certain directors and executive officers are associated. The following is a summary of loans to executive officers, directors, and their affiliates for the year ended December 31, 2010 in thousands:
|
Balance at beginning of year
|
$ | 31,943 | ||
|
Additional borrowings during the year
|
2,412 | |||
|
Loan repayments during the year
|
(4,281 | ) | ||
|
Balance at end of year
|
$ | 30,074 |
F-21
Notes To Consolidated Financial Statements
December 31, 2010, 2009 and 2008
As a matter of policy, these loans and credit lines are approved by the Board of Directors and are made with interest rates, terms, and collateral requirements comparable to those required of other borrowers. In the opinion of management, these loans do not involve more than the normal risk of collectability.
At December 31, 2010, the Company had pre-approved but unused lines of credit totaling $4.1 million to executive officers, directors and their affiliates.
A summary of activity in the allowance for loan losses for the years ended December 31 is as follows:
|
2010
|
2009
|
2008
|
||||||||||
|
(Amounts in thousands)
|
||||||||||||
|
Balance at beginning of year
|
$ | 17,309 | $ | 13,210 | $ | 11,784 | ||||||
|
Provision charged to operations
|
26,382 | 15,750 | 7,075 | |||||||||
|
Loans charged-off:
|
||||||||||||
|
Commercial real estate
|
5,038 | 3,171 | 516 | |||||||||
|
Commercial construction
|
4,330 | 5,046 | 875 | |||||||||
|
Commercial and industrial
|
5,342 | 941 | 2,529 | |||||||||
|
Leases
|
9 | 60 | - | |||||||||
|
Residential construction
|
725 | 1,183 | 790 | |||||||||
|
Residential mortgage
|
3,624 | 1,262 | 816 | |||||||||
|
Consumer and other
|
263 | 204 | 257 | |||||||||
|
Total loans charged-off
|
19,331 | 11,867 | 5,783 | |||||||||
|
Recoveries of loans:
|
||||||||||||
|
Commercial real estate
|
30 | 4 | 23 | |||||||||
|
Commercial construction
|
36 | - | - | |||||||||
|
Commercial and industrial
|
122 | 133 | 54 | |||||||||
|
Residential construction
|
26 | 32 | - | |||||||||
|
Residential mortgage
|
221 | 20 | 33 | |||||||||
|
Consumer and other
|
18 | 27 | 24 | |||||||||
|
Total loan recoveries
|
453 | 216 | 134 | |||||||||
|
Net charge-offs
|
18,878 | 11,651 | 5,649 | |||||||||
|
Balance at end of year
|
$ | 24,813 | $ | 17,309 | $ | 13,210 | ||||||
F-22
Notes To Consolidated Financial Statements
December 31, 2010, 2009 and 2008
The following presents by loan category, the balance in the allowance for loan losses disaggregated on the basis of the Company’s measurement method and the related recorded investment in loans as of December 31, 2010:
|
Commercial Loan Portfolio
|
||||||||||||||||||||
|
Commercial
|
Commercial
|
Commercial and
|
||||||||||||||||||
|
real estate
|
construction
|
industrial
|
Leases
|
Total
|
||||||||||||||||
|
(Amounts in thousands)
|
||||||||||||||||||||
|
Specific reserves:
|
||||||||||||||||||||
|
Impaired loans
|
$ | 1,414 | $ | 383 | $ | 570 | $ | - | $ | 2,367 | ||||||||||
|
Purchase credit impaired loans
|
- | - | - | - | - | |||||||||||||||
|
Total specific reserves
|
1,414 | 383 | 570 | - | 2,367 | |||||||||||||||
|
General reserves
|
11,558 | 4,142 | 2,955 | 33 | 18,688 | |||||||||||||||
|
Total
|
$ | 12,972 | $ | 4,525 | $ | 3,525 | $ | 33 | $ | 21,055 | ||||||||||
|
Loans individually evaluated for impairment
|
$ | 7,170 | $ | 13,560 | $ | 5,957 | $ | - | $ | 26,687 | ||||||||||
|
Purchase credit impaired loans
|
31,396 | 22,810 | 2,084 | - | 56,290 | |||||||||||||||
|
Loans collectively evaluated for impairment
|
639,121 | 196,588 | 128,530 | 10,985 | 975,224 | |||||||||||||||
|
Total
|
$ | 677,687 | $ | 232,958 | $ | 136,571 | $ | 10,985 | $ | 1,058,201 | ||||||||||
|
Residential Loan Portfolio
|
||||||||||||||||
|
Residential
|
Residential
|
Consumer
|
||||||||||||||
|
construction
|
mortgage
|
and other
|
Total
|
|||||||||||||
|
(Amounts in thousands)
|
||||||||||||||||
|
Specific reserves:
|
||||||||||||||||
|
Impaired loans
|
$ | - | $ | 359 | $ | - | $ | 359 | ||||||||
|
Purchase credit impaired loans
|
- | - | - | - | ||||||||||||
|
Total specific reserves
|
- | 359 | - | 359 | ||||||||||||
|
General reserves
|
682 | 2,508 | 209 | 3,399 | ||||||||||||
|
Total
|
$ | 682 | $ | 2,867 | $ | 209 | $ | 3,758 | ||||||||
|
Loans individually evaluated for impairment
|
$ | 322 | $ | 2,826 | $ | - | $ | 3,148 | ||||||||
|
Purchase credit impaired loans
|
- | 22,723 | - | 22,723 | ||||||||||||
|
Loans collectively evaluated for impairment
|
32,029 | 377,767 | 14,503 | 424,299 | ||||||||||||
|
Total
|
$ | 32,351 | $ | 403,316 | $ | 14,503 | $ | 450,170 | ||||||||
F-23
Notes To Consolidated Financial Statements
December 31, 2010, 2009 and 2008
The following presents by loan category, information related to impaired loans as of and for the year ended December 31, 2010:
|
Impaired Loans - With
|
||||||||||||||||||||
|
Impaired Loans - With Allowance
|
No Allowance
|
|||||||||||||||||||
|
Unpaid
|
Allowance for
|
Unpaid
|
||||||||||||||||||
|
Recorded
|
principal
|
loan losses
|
Recorded
|
principal
|
||||||||||||||||
|
investment
|
balance
|
allocated
|
investment
|
balance
|
||||||||||||||||
|
(Amounts in thousands)
|
||||||||||||||||||||
|
Commercial real estate
|
$ | 4,534 | $ | 4,534 | $ | 1,414 | $ | 34,032 | $ | 46,188 | ||||||||||
|
Commercial construction
|
1,788 | 1,788 | 383 | 34,582 | 51,253 | |||||||||||||||
|
Commercial and industrial
|
1,323 | 1,323 | 570 | 6,718 | 7,549 | |||||||||||||||
|
Leases
|
- | - | - | - | - | |||||||||||||||
|
Residential construction
|
- | - | - | 322 | 322 | |||||||||||||||
|
Residential mortgage
|
929 | 929 | 359 | 24,620 | 40,615 | |||||||||||||||
|
Consumer and other
|
- | - | - | - | - | |||||||||||||||
|
Total
|
$ | 8,574 | $ | 8,574 | $ | 2,726 | $ | 100,274 | $ | 145,927 | ||||||||||
The following presents by loan category, a summary of recorded investment in nonaccrual loans at December 31, 2010, including those that are covered under loss share agreements:
|
Loans
|
Loans not
|
|||||||||||
|
covered under
|
covered under
|
|||||||||||
|
loss share
|
loss share
|
|||||||||||
|
agreements
|
agreements
|
Total
|
||||||||||
|
(Amounts in thousands)
|
||||||||||||
|
Nonaccrual loans
|
||||||||||||
|
Commercial real estate
|
$ | 22,090 | $ | 11,187 | $ | 33,277 | ||||||
|
Commercial construction
|
20,474 | 10,245 | 30,719 | |||||||||
|
Commercial and industrial
|
1,749 | 1,065 | 2,814 | |||||||||
|
Residential construction
|
20,413 | 252 | 20,665 | |||||||||
|
Residential mortgage
|
- | 3,475 | 3,475 | |||||||||
|
Consumer and other
|
27 | - | 27 | |||||||||
|
Total nonaccrual loans
|
$ | 64,753 | $ | 26,224 | $ | 90,977 | ||||||
|
Accruing greater than 90 days past due
|
||||||||||||
|
Commercial real estate
|
$ | 3,009 | $ | - | $ | 3,009 | ||||||
|
Commercial construction
|
267 | - | 267 | |||||||||
|
Commercial and industrial
|
337 | - | 337 | |||||||||
|
Residential construction
|
- | - | - | |||||||||
|
Residential mortgage
|
930 | 44 | 974 | |||||||||
|
Consumer and other
|
11 | - | 11 | |||||||||
|
Total 90 days past due loans
|
$ | 4,554 | $ | 44 | $ | 4,598 | ||||||
F-24
Notes To Consolidated Financial Statements
December 31, 2010, 2009 and 2008
The following presents by loan category, an aging analysis of past due loans as of December 31, 2010:
|
Greater
|
||||||||||||||||||||||||||||
|
Than
|
||||||||||||||||||||||||||||
|
30-59 Days
|
60-89 Days
|
90 Days
|
Total
|
Total
|
||||||||||||||||||||||||
|
Past Due
|
Past Due
|
Past Due
|
Nonaccrual
|
Past Due
|
Current
|
Loans
|
||||||||||||||||||||||
|
(Amounts in thousands)
|
||||||||||||||||||||||||||||
|
Commercial real estate
|
$ | 4,029 | $ | 1,426 | $ | 3,009 | $ | 33,277 | $ | 41,741 | $ | 635,946 | $ | 677,687 | ||||||||||||||
|
Commercial construction
|
606 | 3,213 | 267 | 30,719 | 34,805 | 198,153 | 232,958 | |||||||||||||||||||||
|
Commercial and industrial
|
513 | 130 | 337 | 2,814 | 3,794 | 132,777 | 136,571 | |||||||||||||||||||||
|
Leases
|
98 | - | - | - | 98 | 10,887 | 10,985 | |||||||||||||||||||||
|
Residential construction
|
2,827 | - | - | 20,665 | 23,492 | 8,859 | 32,351 | |||||||||||||||||||||
|
Residential mortgage
|
3,836 | 3,105 | 974 | 3,475 | 11,390 | 391,926 | 403,316 | |||||||||||||||||||||
|
Consumer and other
|
44 | 8 | 11 | 27 | 90 | 14,413 | 14,503 | |||||||||||||||||||||
|
Total
|
$ | 11,953 | $ | 7,882 | $ | 4,598 | $ | 90,977 | $ | 115,410 | $ | 1,392,961 | $ | 1,508,371 | ||||||||||||||
A summary of impaired loans at December 31 is as follows:
|
2010
|
2009
|
|||||||
|
(Amounts in thousands)
|
||||||||
|
Nonaccrual loans
|
$ | 90,977 | $ | 19,050 | ||||
|
Impaired loans continuing to accrue interest
|
17,871 | 4,168 | ||||||
|
Total impaired loans
|
$ | 108,848 | $ | 23,218 | ||||
|
Specific loan loss allowance on impaired loans
|
$ | 2,726 | $ | 2,113 | ||||
|
Balance of impaired loans with specific allowance
|
8,574 | 11,284 | ||||||
|
Balance of impaired loans with no specific allowance
|
100,274 | 11,586 | ||||||
The average balance of impaired loans during the years ended December 31, 2010 and 2009 was $75.7 million and $15.0 million, respectively. For the years ended December 31, 2010, 2009 and 2008, the interest income recognized on nonaccrual loans during the time in which they were in nonaccrual status was not considered material. The amount of interest that would have been recorded on nonaccrual loans had the loans not been classified as “nonaccrual” was $7.5 million and $476,000 for the years ended December 31, 2010 and 2009, respectively. For 2008, the amounts were not considered material.
At December 31, 2010 and 2009, there were $7.0 million and $348,000 of troubled debt restructurings, respectively, with specific valuation allowances of such loans in the amounts of $1.2 million and $123,000, respectively.
Credit quality indicators
The Company uses several credit quality indicators to manage credit risk in an ongoing manner. The Company's primary credit quality indicators are to use an internal credit risk rating system that categorizes loans and leases into pass, special mention, or classified categories. Credit risk ratings are applied individually to those classes of loans and leases that have significant or unique credit characteristics that benefit from a case-by-case evaluation. These are typically loans and leases to businesses or individuals in the classes which comprise the commercial portfolio segment. Groups of loans and leases that are underwritten and structured using standardized criteria and characteristics are typically risk rated and monitored collectively. These are typically loans and leases to individuals in the classes
which comprise the consumer portfolio segment.
Loans excluded from the scope of the annual review process above are generally classified as pass credits until: (a) they become past due; (b) management becomes aware of a deterioration in the creditworthiness of the borrower; or (c) the customer contacts the Company for a modification. In these circumstances, the loan is specifically evaluated for potential classification as to special mention, substandard or even charged off. The Company uses the following definitions for risk ratings:
F-25
Notes To Consolidated Financial Statements
December 31, 2010, 2009 and 2008
Special Mention. Loans classified as special mention have a potential weakness that deserves management’s close attention. If left uncorrected, these potential weaknesses may result in deterioration of the repayment prospects for the loan or of the institution’s credit position at some future date.
Substandard. Loans classified as substandard are inadequately protected by the current net worth and payment capacity of the obligor or of the collateral pledged, if any. Loans so classified have a well-defined weakness or weaknesses that jeopardize the liquidation of the debt. They are characterized by the distinct possibility that the institution will sustain some loss if the deficiencies are not corrected.
Doubtful/Loss. Loans classified as doubtful/loss have all the weaknesses inherent in those classified as substandard, with the added characteristic that the weaknesses make collection or liquidation in full, on the basis of currently existing facts, conditions, and values, highly questionable and improbable.
The following presents by loan category and by credit quality indicator, the recorded investment in the Company’s loans as of December 31, 2010:
|
Pass
|
Special
|
|||||||||||||||||||
|
Total
|
credits
|
mention
|
Substandard
|
Doubtful / Loss
|
||||||||||||||||
|
(Amounts in thousands)
|
||||||||||||||||||||
|
Commercial real estate
|
$ | 677,687 | $ | 551,893 | $ | 50,594 | $ | 63,143 | $ | 12,057 | ||||||||||
|
Commercial construction
|
232,958 | 126,213 | 32,101 | 56,904 | 17,740 | |||||||||||||||
|
Commercial and industrial
|
136,571 | 114,492 | 14,069 | 6,649 | 1,361 | |||||||||||||||
|
Leases
|
10,985 | 10,985 | - | - | - | |||||||||||||||
|
Residential construction
|
32,351 | 23,633 | 3,948 | 4,770 | - | |||||||||||||||
|
Residential mortgage
|
403,316 | 308,110 | 45,718 | 40,214 | 9,274 | |||||||||||||||
|
Consumer and other
|
14,503 | 13,265 | 716 | 488 | 34 | |||||||||||||||
|
Total
|
$ | 1,508,371 | $ | 1,148,591 | $ | 147,146 | $ | 172,168 | $ | 40,466 | ||||||||||
|
Loans covered under loss share agreements
|
$ | 309,342 | $ | 124,522 | $ | 65,252 | $ | 79,397 | $ | 40,171 | ||||||||||
Acquired loans
The Company has purchased loans as part of its acquisition of Beach First during 2010. Initial contractual loan payments receivable, estimates of amounts not expected to be collected, other fair value adjustments and the resulting fair values of acquired loans impaired at acquisition date for the year ending December 31, 2010 are as follows (amounts in thousands):
|
Total
|
||||
|
Contractually-required principal and interest
|
$ | 487,776 | ||
|
Non-accretable difference
|
(122,624 | ) | ||
|
Cash flows expected to be collected
|
365,152 | |||
|
Accretable yield
|
(16,310 | ) | ||
|
Fair Value
|
$ | 348,842 | ||
Income on acquired loans that are not impaired at acquisition date is recognized in the same manner as loans impaired at acquisition date. A portion of the fair value discount on acquired non-impaired loans has been ascribed as an accretable yield that is accreted into interest income over the estimated remaining life of the loans. The remaining nonaccretable difference represents cash flows not expected to be collected.
F-26
Notes To Consolidated Financial Statements
December 31, 2010, 2009 and 2008
The following shows the changes in the carrying value of covered acquired loans and accretable yield for covered loans receivable for the year ended December 31, 2010:
|
2010
|
||||||||
|
Accretable
|
Carrying
|
|||||||
|
Yield
|
Amount
|
|||||||
|
(Amounts in thousands)
|
||||||||
|
Balance at beginning of period
|
$ | - | $ | - | ||||
|
Additions due to acquisitions
|
(16,310 | ) | 348,842 | |||||
|
Reductions from payments and foreclosures, net
|
- | (42,801 | ) | |||||
|
Accretion
|
3,301 | 3,301 | ||||||
|
Balance at end of period
|
$ | (13,009 | ) | $ | 309,342 | |||
Loans held for sale
The Company originates certain single family, residential first mortgage loans for sale on a presold basis. Loan sale activity for the years ended December 31, 2010, 2009 and 2008 is summarized below:
|
2010
|
2009
|
2008
|
||||||||||
|
(Amounts in thousands)
|
||||||||||||
|
Loans held for sale at December 31
|
$ | 6,751 | $ | 2,766 | $ | 560 | ||||||
|
Proceeds from sales of loans held for sale
|
101,059 | 80,851 | 49,858 | |||||||||
|
Mortgage fees
|
1,583 | 1,108 | 783 | |||||||||
During December 2010, the Company purchased $32.9 million of seasoned single family residential mortgage loans from a local market finanical institution with the Company’s geographical footprint.. These loans had exceptional FICO and LTV ratios.
NOTE E – FDIC INDEMNIFICATION ASSET
The FDIC indemnification asset activity is summarized as follows (amounts in thousands):
|
2010
|
||||
|
Balance at beginning of year
|
$ | - | ||
|
Receivable from acquisitions
|
95,765 | |||
|
Accretion of discounts
|
1,136 | |||
|
Receipt of payments from FDIC
|
(27,408 | ) | ||
|
Balance at end of year
|
$ | 69,493 | ||
The FDIC indemnification asset is measured separately for the related Covered Assets and is recorded at fair value. The fair value was estimated using projected cash flows related to the loss share agreements based on the expected reimbursements for losses and the applicable loss share percentages.
F-27
Notes To Consolidated Financial Statements
December 31, 2010, 2009 and 2008
NOTE F - PREMISES AND EQUIPMENT
Premises and equipment at December 31 are summarized as follows:
|
2010
|
2009
|
|||||||
|
(Amounts in thousands)
|
||||||||
|
Land
|
$ | 6,893 | $ | 6,893 | ||||
|
Buildings and improvements
|
21,904 | 19,735 | ||||||
|
Furniture and equipment
|
10,437 | 7,968 | ||||||
| $ | 39,234 | $ | 34,596 | |||||
|
Less accumulated depreciation and amortization
|
8,684 | 6,893 | ||||||
| $ | 30,550 | $ | 27,703 | |||||
Depreciation and amortization expense for the years ended December 31, 2010, 2009 and 2008 amounted to $1.8 million, $1.6 million and $1.5 million, respectively.
The Company has entered into various noncancellable operating leases for land and buildings used in its operations that expire at various dates through 2022. Most of the leases contain renewal options. Certain leases provide for periodic rate negotiation or escalation. The leases generally provide for payment of property taxes, insurance and maintenance costs by the Company. Rental expense, including month-to-month leases, reported in non-interest expense was $1.4 million, $463,000, and $417,000 for the years ended December 31, 2010, 2009 and 2008, respectively.
At December 31, 2010, future minimum rental commitments under noncancellable operating leases that have a remaining life in excess of one year are as follows (in thousands):
|
2011
|
$ | 1,708 | ||
|
2012
|
1,582 | |||
|
2013
|
1,467 | |||
|
2014
|
1,421 | |||
|
2015
|
1,162 | |||
|
Thereafter
|
6,478 | |||
|
Total
|
$ | 13,818 |
The Company had previously leased a branch facility from one of its directors. This lease was not renewed at the expiration date during 2010. Rent expense for this lease totaled $46,000, $49,000, and $48,000 for the years ended December 31, 2010, 2009 and 2008, respectively.
NOTE G - GOODWILL AND OTHER INTANGIBLES
Goodwill at both December 31, 2010 and 2009 amounted to $26.1 million. For the year ended December 31, 2010, there were additional intangibles acquired of $1.1 million. In 2009 and 2008, there was no additional goodwill or other intangibles acquired, or impairment losses recognized on goodwill. The last test for goodwill impairment conducted as of June 30, 2010 concluded that there was no goodwill impairment.
F-28
Notes To Consolidated Financial Statements
December 31, 2010, 2009 and 2008
The following is a summary of other intangible assets at December 31, 2010 and 2009:
|
2010
|
2009
|
|||||||
|
(Amounts in thousands)
|
||||||||
|
Other intangibles – gross
|
$ | 3,488 | $ | 2,524 | ||||
|
Less accumulated amortization
|
1,172 | 954 | ||||||
|
Other intangibles – net
|
$ | 2,316 | $ | 1,570 | ||||
Other intangibles amortization expense for the years ended December 31, 2010, 2009, and 2008 amounted to $372,000, $246,000, and $248,000, respectively. The following table presents estimated amortization expense for other intangibles for the year ending December 31(in thousands):
|
2011
|
$ | 386 | ||
|
2012
|
364 | |||
|
2013
|
351 | |||
|
2014
|
349 | |||
|
2015
|
349 | |||
|
Thereafter
|
517 | |||
| $ | 2,316 |
NOTE H – DEPOSITS
At December 31, 2010, the scheduled maturities of time deposits are as follows:
|
Less than
|
Greater than
|
|||||||||||
| $100,000 | $100,000 |
Total
|
||||||||||
|
(Amounts in thousands)
|
||||||||||||
|
2011
|
$ | 168,010 | $ | 328,207 | $ | 496,217 | ||||||
|
2012
|
69,969 | 115,313 | 185,282 | |||||||||
|
2013
|
8,378 | 69,494 | 77,872 | |||||||||
|
2014
|
2,442 | 62,892 | 65,334 | |||||||||
|
2015
|
982 | 26,234 | 27,216 | |||||||||
|
Thereafter
|
177 | 27,363 | 27,540 | |||||||||
|
Total
|
$ | 249,958 | $ | 629,503 | $ | 879,461 | ||||||
NOTE I - SHORT-TERM BORROWINGS
Short-term borrowings at December 31, 2010 and 2009 consisted of the following:
|
2010
|
2009
|
|||||||
|
(In thousands)
|
||||||||
|
Repurchase agreements
|
$ | 7,735 | $ | 16,494 | ||||
|
Advances from the FHLB
|
48,018 | 5,000 | ||||||
|
Federal funds purchased
|
1,199 | 13,290 | ||||||
|
Revolving line of credit
|
3,255 | 15,499 | ||||||
| $ | 60,207 | $ | 50,283 | |||||
Securities sold under agreements to repurchase generally mature within one day from the transaction date and are collateralized by either U.S. Government Agency obligations, government sponsored mortgage-backed securities or securities issued by local governmental municipalities.
F-29
Notes To Consolidated Financial Statements
December 31, 2010, 2009 and 2008
During the year ended December 31, 2010, the Company has reclassified $3.0 million of its FHLB advances to short-term borrowings due to current maturities being within one year. Additionally, the Company utilizes short-term borrowings from FHLB, with $45.0 million outstanding at December 31, 2010 and no outstanding balances at December 31, 2009. These borrowings are secured as discussed below in the long-term debt note for FHLB advances.
The Company may purchase federal funds through unsecured federal funds guidance lines of credit totaling $52.0 million as of December 31, 2010. These lines are intended for short-term borrowings and are subject to restrictions limiting the frequency and terms of advances. These lines of credit are payable on demand and bear interest based upon the daily federal funds rate.
The Company also has an unsecured revolving line of credit of up to $25.0 million with a bank, bearing interest at the prime rate with a floor of 5.00% and maturing on September 25, 2011 with $3.3 million and $15.5 million outstanding at December 31, 2010 and 2009, respectively.
In addition, the Company has the ability to borrow funds from the Federal Reserve Bank of Richmond utilizing the discount window and the borrower-in-custody of collateral arrangement. At December 31, 2010, securities available for sale and commercial loans in the amounts of $77.6 million and $159.2 million, respectively, were assigned under these arrangements. As of December 31, 2010, the Company had approximately $182.5 million in additional borrowing capacity available under these arrangements with no outstanding balances.
NOTE J - LONG-TERM DEBT
Long-term debt at December 31, 2010 and 2009 consisted of the following advances from the FHLB:
|
Interest rate
|
2010
|
2009
|
||||||||||
|
(Amounts in thousands)
|
||||||||||||
|
March 2010
|
5.71 | % | $ | - | $ | 5,000 | ||||||
|
February 2011
|
0.29 | % | 3,000 | 3,000 | ||||||||
|
June 2012
|
2.05 | % | 4,000 | 4,000 | ||||||||
|
December 2014
|
3.62 | % | 2,000 | 2,000 | ||||||||
|
December 2014
|
3.87 | % | 15,000 | 15,000 | ||||||||
|
September 2017
|
3.73 | % | 10,000 | 10,000 | ||||||||
|
September 2017
|
3.66 | % | 10,000 | 10,000 | ||||||||
|
January 2018
|
2.15 | % | 15,000 | 15,000 | ||||||||
|
January 2018
|
2.27 | % | 10,000 | 10,000 | ||||||||
|
February 2011 advance reclassified to short-term borrowings
|
0.29 | % | (3,000 | ) | - | |||||||
|
Advances repaid during 2010
|
- | (5,000 | ) | |||||||||
| $ | 66,000 | $ | 69,000 | |||||||||
The above advances have been made against a $203.0 million line of credit secured by real estate loans in the amount of $209.6 million and investment securities with a fair value of $59.2 million. Advances must be adequately collateralized. The weighted average rate for advances outstanding at December 31, 2010 and 2009 was 2.95% and 3.23%, respectively.
F-30
Notes To Consolidated Financial Statements
December 31, 2010, 2009 and 2008
A description of the junior subordinated debentures outstanding at December 31, 2010 and 2009 is as follows:
|
Date of
|
Shares
|
Interest
|
Maturity
|
Principal Amount
|
|||||||||||||
|
Issuance
|
Issued
|
Rate
|
Date
|
2010
|
2009
|
||||||||||||
|
(Amounts in thousands)
|
|||||||||||||||||
|
Bank of North Carolina
|
6/07/2005
|
8,000 |
Libor plus
|
7/7/2015
|
$ | 8,000 | $ | 8,000 | |||||||||
| 1.80% | |||||||||||||||||
|
BNC Bancorp Capital Trust I
|
4/03/2003
|
5,000 |
Libor plus
|
4/15/2033
|
5,155 | 5,155 | |||||||||||
| 3.25% | |||||||||||||||||
|
BNC Bancorp Capital Trust II
|
3/11/2004
|
6,000 |
Libor plus
|
4/7/2034
|
6,186 | 6,186 | |||||||||||
| 2.80% | |||||||||||||||||
|
BNC Bancorp Capital Trust III
|
9/23/2004
|
5,000 |
Libor plus
|
9/23/2034
|
5,155 | 5,155 | |||||||||||
| 2.40% | |||||||||||||||||
|
BNC Bancorp Capital Trust IV
|
9/27/2006
|
7,000 |
Libor plus
|
12/31/2036
|
7,217 | 7,217 | |||||||||||
| 1.70% | |||||||||||||||||
| $ | 31,713 | $ | 31,713 | ||||||||||||||
The junior subordinated debentures issued by the Bank of North Carolina are classified as Tier II capital for regulatory purposes. The junior subordinated debentures issued by the trusts currently qualify as Tier I capital for the Company, subject to certain limitations, and constitute a full and unconditional guarantee by the Company of the trust’s obligations under the preferred securities. At December 31, 2010 and 2009, the Company had $713,000 of equity investment in the above wholly-owned BNC Bancorp Capital Trusts and is included in other assets in the accompanying consolidated balance sheets. The weighted average rate for the junior subordinated debentures outstanding for the years ending December 31, 2010 and 2009 was 2.74% and 3.26%, respectively.
NOTE K – SHAREHOLDERS’ EQUITY
On June 14, 2010, the Company entered into an Investment Agreement (the “Investment Agreement”) with Aquiline BNC Holdings LLC, a Delaware limited liability company (“Aquiline”). Pursuant to the Investment Agreement, Aquiline purchased 892,799 shares of the Company’s common stock, no par value per share, at $10.00 per share and 1,804,566 shares of the Company’s Mandatorily Convertible Non-Voting Preferred Stock, Series B (the “Series B Preferred Stock”) at $10.00 per share. The purchase of common stock and Series B Preferred Stock by Aquiline was part of a $35 million private placement that closed on June 14, 2010 (the “Private Placement”). In addition to Aquiline, other investors, including certain directors of the Company, purchased
802,635 shares of the Company’s common stock at $10.00 per share (collectively, with Aquiline, the “Investors”) as a part of the Private Placement on June 14, 2010. The Investors, other than Aquiline, entered into Subscription and Registration Rights Agreements with the Company in connection with their investment in the Company’s common stock in the Private Placement. Proceeds from the Private Placement, after deducting issuance costs, were $16.1 million and $17.2 million for common stock issued and Series B Preferred Stock issued, respectively. The amount of issuance costs for the Private Placement was $832,000 and $885,000, respectively.
During 2008, the Company issued 31,260 shares of preferred stock to the U.S. Treasury for $31.3 million pursuant to the U.S. Treasury’s Capital Purchase Program (“CPP”). Additionally, the Company issued 543,337 common stock warrants to the U.S. Treasury as a condition to its participation in the CPP. The warrants have an exercise price of $8.63 each, are immediately exercisable and expire 10 years from the date of issuance. The CPP preferred stock is non-voting, other than having class voting rights on certain matters, and pays cumulative dividends quarterly at a rate of 5% per annum for the first five years and 9% thereafter. The preferred shares are redeemable at the option of the Company under certain circumstances during the first three years and only thereafter without
restriction. The preferred stock and common stock warrants qualify as Tier 1 capital. The CPP participation also limits the rate of dividend payments on the Company’s common stock to the amount of its last quarterly cash dividend prior to participation in the program of $0.05 per share unless an increase is approved by the Treasury.
F-31
Notes To Consolidated Financial Statements
December 31, 2010, 2009 and 2008
The fair value of the preferred stock was estimated on the date of issuance by discounting future cash flows at 13% under the assumption that the shares will be redeemed at the end of five years. The fair value of the warrants was estimated on the date of grant using the Black-Scholes option pricing model assuming a risk-free interest rate of 2.73%, expected volatility of 49.1%, a dividend yield of 2.50% and an expected life of 10 years. The total proceeds of $31.3 million were allocated to the preferred stock and the warrants based upon those relative fair values, resulting in a value assigned to the warrants of $2.4 million and discount on the preferred stock of the same amount. For the year ended December 31, 2010, the Company declared dividends on the CPP preferred stock and
had accretion of discount on preferred stock of $1.6 million and $453,000, respectively. For the year ended December 31, 2009, the Company declared dividends on preferred stock and had accretion of discount on preferred stock of $1.6 million and $426,000, respectively.
For the year ended December 31, 2010, the Company paid quarterly cash dividends on common stock of $0.05 per share on February 26, 2010, May 28, 2010, August 27, 2010 and November 26, 2010. For the year ended December 31, 2009, the Company paid quarterly cash dividends on common stock of $0.05 per share on February 20, 2009, May 29, 2009, August 28, 2009 and November 27, 2009. In addition the Company paid cash dividends on the Series B Preferred Stock of $0.05 per share on August 27, 2010 and November 26, 2010.
NOTE L - REGULATORY CAPITAL REQUIREMENTS
The Bank, as a North Carolina banking corporation, may pay cash dividends to the Company only out of undivided profits as determined pursuant to North Carolina General Statutes Section 53-87. However, regulatory authorities may limit payment of dividends by any bank when it is determined that such a limitation is in the public interest and is necessary to ensure financial soundness of the bank.
The Company and the Bank are subject to various regulatory capital requirements administered by the federal banking agencies. Failure to meet minimum capital requirements can initiate certain mandatory - and possibly additional discretionary - actions by regulators that, if undertaken, could have a material adverse effect on the Company’s consolidated financial statements. Capital adequacy guidelines and the regulatory framework for prompt corrective action prescribe specific capital guidelines that involve quantitative measures of the Bank's assets, liabilities, and certain off-balance sheet items as calculated under regulatory accounting practices. The Bank's capital amounts and classification are also subject to qualitative judgments by the regulators about components, risk weightings, and other factors. As of December 31, 2010, the most recent notification from the FDIC categorized the Bank as well capitalized under the regulatory framework for prompt corrective action. To be categorized as well capitalized the Bank must maintain minimum amounts and ratios, as set forth in the table below. There are no conditions or events since that notification that management believes have changed the Bank’s category. Prompt corrective action provisions are not applicable to bank holding companies.
Quantitative measures established by regulation to ensure capital adequacy require the Company and the Bank to maintain minimum amounts and ratios, as prescribed by regulations, of total and Tier I capital to risk-weighted assets and of Tier I capital to average assets. As of December 31, 2010 and 2009, the Bank met its capital adequacy requirements as set forth below:
F-32
Notes To Consolidated Financial Statements
December 31, 2010, 2009 and 2008
|
To be well capitalized
|
||||||||||||||||||||||||
|
For capital
|
under prompt corrective
|
|||||||||||||||||||||||
|
adequacy purposes
|
action provisions
|
|||||||||||||||||||||||
|
Actual
|
Minimum
|
Minimum
|
||||||||||||||||||||||
|
Amount
|
Ratio
|
Amount
|
Ratio
|
Amount
|
Ratio
|
|||||||||||||||||||
|
(Amounts in thousands)
|
||||||||||||||||||||||||
|
As of December 31, 2010:
|
||||||||||||||||||||||||
|
Total Capital (to risk weighted assets)
|
$ | 182,637 | 13.01 | % | $ | 112,293 | 8.00 | % | $ | 140,366 | 10.00 | % | ||||||||||||
|
Tier 1 Capital (to risk weighted assets)
|
157,002 | 11.19 | % | 56,146 | 4.00 | % | 84,219 | 6.00 | % | |||||||||||||||
|
Tier 1 Capital (to average assets)
|
157,002 | 7.42 | % | 84,587 | 4.00 | % | 105,734 | 5.00 | % | |||||||||||||||
|
As of December 31, 2009:
|
||||||||||||||||||||||||
|
Total Capital (to risk weighted assets)
|
$ | 155,264 | 12.79 | % | $ | 97,153 | 8.00 | % | $ | 121,441 | 10.00 | % | ||||||||||||
|
Tier 1 Capital (to risk weighted assets)
|
132,050 | 10.87 | % | 48,576 | 4.00 | % | 72,864 | 6.00 | % | |||||||||||||||
|
Tier 1 Capital (to average assets)
|
132,050 | 8.32 | % | 63,462 | 4.00 | % | 79,327 | 5.00 | % | |||||||||||||||
The Company is also subject to these capital requirements. At December 31, 2010 and 2009, the Company’s capital amounts are as follows:
|
2010
|
2009
|
|||||||
|
Total capital to risk-weighted assets
|
12.75 | % | 11.60 | % | ||||
|
Tier I capital to risk-weighted assets
|
10.94 | % | 9.71 | % | ||||
|
Tier I capital to average assets
|
7.26 | % | 7.43 | % | ||||
NOTE M - EMPLOYEE BENEFITS
During 2004 the Company adopted, with shareholder approval, the BNC Bancorp Omnibus Stock Ownership and Long Term Incentive Plan. The Compensation Committee may grant or award eligible participants options, rights to receive restricted shares of common stock, and or stock appreciation rights (collectively referred to herein as “Rights”). This plan makes available 346,445 grants of Rights, subject to appropriate adjustment for stock splits, stock combinations, reclassifications and similar changes. On June 15, 2010, at the 2010 Annual Meeting of the Company’s shareholders, the shareholders approved Amendment No. 1 to the Company’s Omnibus Stock Ownership and Long Term Incentive Plan. This amendment provides for an increase of 400,000 shares of the
Company’s common stock underlying rights which may be granted pursuant to the plan. In addition, the Company maintains shareholder-approved, stock-based compensation plans including a nonqualified stock option plan for directors and a qualified incentive stock option plan for key employees. Options granted under the nonqualified plan vest immediately and expire ten years after the grant date. Options granted under the qualified plan vest ratably over a five year period and expire ten years after the grant date. At December 31, 2010, the Company had 385,440 unissued Rights available for grants or awards.
The share-based awards granted under the aforementioned plans have similar characteristics, except that some awards have been granted in options and certain awards have been granted in restricted stock. Therefore, the following disclosures have been disaggregated for the stock option and restricted stock awards of the plans due to their dissimilar characteristics. The Company funds the option shares and restricted stock from unauthorized but un-issued shares.
F-33
Notes To Consolidated Financial Statements
December 31, 2010, 2009 and 2008
Stock Option Awards - The fair value of each option award is estimated on the date of grant using the Black-Scholes-Merton option pricing model. The risk-free interest rate is based on the U.S. Treasury rate for the expected life at the time of grant. Volatility is based on the average volatility of the Company based upon previous trading history. The expected life and forfeiture assumptions are based on historical data. Dividend yield is based on the yield at the time of the option grant. The assumptions used for the grants of options to employees for the year ended December 31, 2010 and 2009 is presented below. There were no grants of options during the year ended
December 31, 2008.
|
Assumptions in estimating option values:
|
2010
|
2009
|
||||||
|
Weighted-average volatility
|
34.46 | % | 31.32 | % | ||||
|
Expected dividend yield
|
2.05 | % | 2.70 | % | ||||
|
Risk-free interest rate
|
3.57 | % | 3.25 | % | ||||
|
Expected life
|
10 years
|
7 years
|
||||||
A summary of option activity under the stock option plans as of December 31, 2010 and changes during the year ended December 31, 2010 is presented below:
|
Weighted
|
|||||||||||||
|
Weighted
|
Average
|
||||||||||||
|
Average
|
Remaining
|
Aggregate
|
|||||||||||
|
Exercise
|
Contractual
|
Intrinsic
|
|||||||||||
|
Shares
|
Price
|
Term
|
Value
|
||||||||||
|
(In thousands)
|
|||||||||||||
|
Outstanding December 31, 2009
|
266,720 | $ | 9.62 | ||||||||||
|
Granted
|
7,000 | 9.75 | |||||||||||
|
Exercised
|
900 | 5.95 | |||||||||||
|
Forfeited
|
3,575 | 9.34 | |||||||||||
|
Outstanding December 31, 2010
|
269,245 | 9.64 |
3.7 years
|
$ | 269 | ||||||||
|
Exercisable December 31, 2010
|
249,629 | 9.75 |
3.3 years
|
$ | 249 | ||||||||
|
Share options expected to vest
|
19,616 | 8.25 |
8.8 years
|
$ | 20 | ||||||||
For the years ended December 31, 2010, 2009 and 2008 the intrinsic value of options exercised amounted to $3,000, $7,000, and $1.2 million, respectively, and the fair value of options vested amounted to $9,000, $9,000 and $0, respectively.
Cash received from option exercises under all share-based payment arrangements for the years ended December 31, 2010, 2009 and 2008 was $5,000, $32,000 and $435,000, respectively. The actual tax benefit realized for tax deductions from option exercise of the share-based payment arrangements totaled $1,000, $3,000, and $286,000, respectively, for the years ended December 31, 2010, 2009 and 2008.
Restricted Stock Awards - A summary of the status of the Company’s non-vested stock awards as of December 31, 2010 and changes during the year ended December 31, 2010 is presented below:
F-34
Notes To Consolidated Financial Statements
December 31, 2010, 2009 and 2008
|
Weighted
|
||||||||
|
average
|
||||||||
|
grant date
|
||||||||
|
2010
|
fair value
|
|||||||
|
Non-vested - beginning of year
|
50,269 | $ | 7.03 | |||||
|
Granted
|
29,750 | 9.03 | ||||||
|
Vested
|
10,576 | 8.40 | ||||||
|
Forfeited
|
- | - | ||||||
|
Non-vested - end of year
|
69,443 | $ | 7.68 | |||||
There were no restricted stock awards granted during the year ended December 31, 2008. The fair value of restricted stock grants vested during 2010, 2009 and 2008 was $89,000, $17,000 and $21,000, respectively.
The Company’s pre-tax compensation cost for stock-based employee compensation was $247,000 and $52,000 for the years ended December 31, 2010 and 2009, respectively. There were no stock-based compensation costs for the year ended December 31, 2008. As of December 31, 2010, there was $404,000 of unrecognized compensation cost related to non-vested share-based compensation arrangements granted under the plans.
Qualified Profit Sharing 401 (k) Plan - The Company maintains a qualified profit sharing 401(k) plan for employees 20.5 years of age or over which covers substantially all employees. Under the plan, employees may contribute up to an annual maximum as determined by the Internal Revenue Code. During 2009, the Company reduced the matching of employee contributions from 100% to 50% of such contributions up to 6% of the participant's compensation. The plan provides that employees' contributions are 100% vested at all times, and the Company's contributions
vest at 20% each year after the second year of service. The expense related to the plan for the years ended December 31, 2010, 2009 and 2008 was $463,000, $475,000 and $598,000, respectively.
Employment Agreements - The Company has entered into employment agreements with its chief executive officer and two other executive officers to ensure a stable and competent management base. The agreements provide for a three-year term, with an automatic one-year renewal on each anniversary date. The agreements provide for benefits as set forth in the contracts and cannot be terminated by the Board of Directors, except for cause, without prejudicing the officers’ rights to receive certain vested benefits, including compensation. In the event of a change in control of the Company, as outlined in the agreements, the acquirer will be bound to the terms of the contracts.
Director and Executive Officer Benefit Plans - The Company has Salary Continuation Agreements and supplemental retirement benefits with its chief executive officer and certain other officers. The Salary Continuation Agreements provide for lifetime benefits to be paid to each executive with the payment amounts varying upon different retirement scenarios, such as normal retirement, early termination, disability, or change in control. The Company has purchased life insurance policies on the participating officers in order to provide future funding of benefit payments. Provisions of $810,000 in 2010, $657,000 in 2009 and $583,000 in 2008 were expensed for future benefits to be provided under these benefit
plans. The corresponding liability related to these benefit plans was $5.1 million, $4.4 million and $3.9 million as of December 31, 2010, 2009 and 2008, respectively.
The Company also has a deferred compensation plan for its directors. Expense provided under the plan totaled $654,000, $187,000 and $208,000 for the years ended December 31, 2010, 2009 and 2008, respectively. Since 2003, directors have had the option to invest amounts deferred in Company common stock that is held in a rabbi trust established for that purpose. At December 31, 2010 and 2009, the trust held 155,622 and 121,490 shares of Company common stock, respectively.
F-35
Notes To Consolidated Financial Statements
December 31, 2010, 2009 and 2008
NOTE N - INCOME TAXES
Income tax expense is summarized as follows for the years ended December 31:
|
2010
|
2009
|
2008
|
||||||||||
|
(In thousands)
|
||||||||||||
|
Current tax provision:
|
||||||||||||
|
Federal
|
$ | 451 | $ | 1,133 | $ | 680 | ||||||
|
State
|
362 | 841 | 492 | |||||||||
|
Total current tax provision
|
813 | 1,974 | 1,172 | |||||||||
|
Deferred tax provision (benefit):
|
||||||||||||
|
Federal
|
(1,330 | ) | (1,953 | ) | (630 | ) | ||||||
|
State
|
313 | (306 | ) | (128 | ) | |||||||
|
Total deferred tax provision (benefit)
|
(1,017 | ) | (2,259 | ) | (758 | ) | ||||||
|
Total income tax provision (benefit)
|
$ | (204 | ) | $ | (285 | ) | $ | 414 | ||||
The difference between income tax expense and the amount computed by applying the statutory federal income tax rate of 34% was as follows for the years ended December 31:
|
2010
|
2009
|
2008
|
||||||||||
|
(In thousands)
|
||||||||||||
|
Pre-tax income
|
$ | 7,522 | $ | 6,252 | $ | 4,401 | ||||||
|
Tax at statutory federal rate
|
$ | 2,557 | $ | 2,126 | $ | 1,496 | ||||||
|
State income tax, net of federal benefit
|
445 | 353 | 240 | |||||||||
|
Tax exempt interest income
|
(3,029 | ) | (2,570 | ) | (1,024 | ) | ||||||
|
Income from life insurance
|
(281 | ) | (287 | ) | (374 | ) | ||||||
|
Nondeductible deferred compensation
|
5 | 5 | 49 | |||||||||
|
Other
|
99 | 88 | 27 | |||||||||
| $ | (204 | ) | $ | (285 | ) | $ | 414 | |||||
F-36
Notes To Consolidated Financial Statements
December 31, 2010, 2009 and 2008
Significant components of deferred tax assets and liabilities at December 31 were as follows:
|
2010
|
2009
|
|||||||
|
(In thousands)
|
||||||||
|
Deferred tax assets:
|
||||||||
|
Allowance for loan losses
|
$ | 9,431 | $ | 6,976 | ||||
|
Net operating losses carryforwards
|
1,152 | 221 | ||||||
|
Deferred compensation
|
1,919 | 1,621 | ||||||
|
Unrealized loss on interest rate cap
|
6,494 | 1,669 | ||||||
|
Loans
|
- | 30 | ||||||
|
Investments
|
33 | 94 | ||||||
|
Other real estate owned writedowns
|
1,690 | - | ||||||
|
AMT credit carryforward
|
1,996 | 891 | ||||||
|
Other
|
393 | 204 | ||||||
|
Total deferred tax assets
|
23,108 | 11,706 | ||||||
|
Deferred tax liabilities:
|
||||||||
|
Premises and equipment
|
680 | 675 | ||||||
|
Leasing activities
|
640 | 1,148 | ||||||
|
Unrealized gains on securities available for sale
|
2,435 | 4,189 | ||||||
|
Unrealized gains on interest rate swaps
|
98 | 987 | ||||||
|
Core deposit intangibles
|
503 | 605 | ||||||
|
FDIC acquisition
|
6,039 | - | ||||||
|
Other
|
188 | 62 | ||||||
|
Total deferred tax liabilities
|
10,583 | 7,666 | ||||||
|
Net deferred tax asset included in other assets
|
$ | 12,525 | $ | 4,040 | ||||
It is management's opinion that realization of the net deferred tax asset is more likely than not based on the Company's history of taxable income and estimates of future taxable income.
The Company has net operating loss carryforwards of approximately $305,000, which were acquired in the merger of Independence Bank. These loss carryforwards expire at various dates through 2022.
When tax returns are filed, it is highly certain that some positions taken would be sustained upon examination by the taxing authorities, while others are subject to uncertainty about the merits of the position taken or the amount of the position that would be ultimately sustained. The benefit of a tax position is recognized in the financial statements in the period during which, based on all available evidence, management believes it is more likely than not that the position will be sustained upon examination, including the resolution of appeals or litigation processes, if any. Tax positions taken are not offset or aggregated with other positions. Tax positions that meet the more-likely-than-not recognition threshold are measured as the largest amount of tax benefit that is
more than 50 percent likely of being realized upon settlement with the applicable taxing authority. The portion of the benefits associated with tax positions taken that exceeds the amount measured as described above is reflected as a liability for unrecognized tax benefits in the accompanying consolidated balance sheet along with any associated interest and penalties that would be payable to the taxing authorities upon examination. The Company did not have an accrual for uncertain tax positions at December 31, 2010 or 2009.
NOTE O – DERIVATIVES
The Company utilizes derivative financial instruments primarily to hedge its exposure to changes in interest rates. All derivative financial instruments are recorded on the balance sheet at their respective fair values. The Company does not use financial instruments or derivatives for any trading or other speculative purposes.
F-37
Notes To Consolidated Financial Statements
December 31, 2010, 2009 and 2008
Risk Management Policies - Hedging Instruments
The primary focus of the Company’s asset/liability management program is to monitor the sensitivity of the Company’s net portfolio value and net income under varying interest rate scenarios to take steps to control its risks. On a quarterly basis, the Company simulates the net portfolio value and net income expected to be earned over a twelve-month period following the date of simulation. The simulation is based on a projection of market interest rates at varying levels and estimates the impact of such market rates on the levels of interest-earning assets and interest-bearing liabilities during the measurement period. Based upon the outcome of the simulation analysis, the Company considers the use of derivatives as a means of reducing the volatility of net portfolio
value and projected net income within certain ranges of projected changes in interest rates. The Company evaluates the effectiveness of entering into any derivative instrument agreement by measuring the cost of such an agreement in relation to the reduction in net portfolio value and net income volatility within an assumed range of interest rates.
The Company entered into interest rate swaps designated as cash flow hedges with nominal amounts aggregating $30 million, to fix the interest rate received on certain variable rate loans at a combined weighted average rate of 8.01%. These loans expose the Company to variability in cash flows, primarily from interest receipts due to changes to interest rates. If interest rates increase, interest income increases. Conversely, if interest rates decrease, interest income decreases. Management believes it is prudent to limit the variability of a portion of its cash flows on variable rate loans therefore, generally hedges a portion of its variable-rate receipts. The aggregate fair value of these derivatives of $255,000 is included in other assets in the accompanying
consolidated balance sheet at December 31, 2010. The change in fair value of these derivatives was a decrease of $2.3 million for the year ended December 31, 2010, when compared to the $2.6 million recorded at December 31, 2009. For the years ended December 31, 2010, 2009 and 2008, no hedge ineffectiveness was recognized on these loan cash flow hedges. The amount of net settlement gains recorded from the interest rate swaps totaled $2.5 million, $2.5 million and $1.6 million for the years ended December 31, 2010, 2009 and 2008, respectively, and is included in loan interest income in the accompanying consolidated statements of income.
During the first quarter of 2009, the Company entered into a five-year interest rate derivative contract, with a notional amount of $250 million, to offset the effects of interest rate changes on an unsecured $250 million variable rate money market funding arrangement. The Company is exposed to risk of rising interest rates. Under this cash flow hedge relationship, the Company has structured a synthetic cap, where the objective is to offset the effect of interest rate changes, whenever funding rates are higher than the strike rate of the synthetic cap. During the third quarter of 2009, the Company paid $24.0 million to self finance the transaction, thus securing a traditional interest rate cap. From this modification, the Company will achieve significantly reduced
funding costs. Going forward, the amounts reclassified from other comprehensive income into earnings are expected to be more than compensated for by the reduced variable rate funding costs, as the hedge only covers a portion of the Company’s variable interest rate exposure. The fair value of this derivative was an asset of $5.8 million, which is included in other assets in the accompanying consolidated balance sheet at December 31, 2010. The change in fair value of this derivative was a decrease of $14.6 million for the year ended December 31, 2010, when compared to the $20.3 million recorded at December 31, 2009. The Company recorded a $10.8 million loss, net of tax, as accumulated other comprehensive income at December 31, 2010, and expects $5.6 million to be reclassified into earnings within the next 12 months. In addition, ineffectiveness related to this hedge amounted to $2.1 million and $1.1 million for the years ended
December 31, 2010 and 2009, respectively, and is included in interest expense on demand deposits in the accompanying consolidated statements of income.
Counterparty Credit Risk - By entering into derivative instrument contracts, the Company exposes itself, from time to time, to counterparty credit risk. Counterparty credit risk is the risk of failure of the counterparty to perform under the terms of the derivative contract. When the fair value of a derivative contract is in an asset position, the counterparty has a liability to the Company, which creates credit risk for the Company. The Company attempts to minimize this risk by selecting counterparties with investment grade credit ratings, limiting its exposure to any single counterparty and regularly monitoring its market position with each counterparty.
Credit-Risk Related Contingent Features - The Company’s derivative instrument does not contain any credit-risk related contingent features.
F-38
Notes To Consolidated Financial Statements
December 31, 2010, 2009 and 2008
The table below presents the fair value of the Company’s derivative financial instruments designated as hedging instruments under ASC Topic 815, as well as their classification on the balance sheet as of December 31, 2010 and December 31, 2009.
|
2010
|
2009
|
||||||||||
|
Balance Sheet
|
Estimated
|
Balance Sheet
|
Estimated
|
||||||||
|
location
|
fair value
|
location
|
fair value
|
||||||||
|
(Amounts in thousands)
|
|||||||||||
|
Interest rate swaps
|
Other assets
|
$ | 255 |
Other assets
|
$ | 2,561 | |||||
|
Interest rate cap
|
Other assets
|
5,754 |
Other assets
|
20,336 | |||||||
|
Total derivatives
|
$ | 6,009 | $ | 22,897 | |||||||
NOTE P - OFF-BALANCE SHEET RISK
The Company is a party to financial instruments with off-balance sheet risk in the normal course of business to meet the financing needs of its customers. These financial instruments include commitments to extend credit, unfunded lines of credit, and standby letters of credit. These instruments involve elements of credit risk in excess of amounts recognized in the accompanying consolidated financial statements.
The Company's risk of loss in the event of nonperformance by the other party to the commitment to extend credit, line of credit and standby letter of credit is represented by the contractual amount of these instruments. The Company uses the same credit policies in making commitments under such instruments as it does for on-balance sheet instruments. The amount of collateral obtained, if any, is based on management's evaluation of the borrower. Collateral held varies, but may include accounts receivable, inventory, real estate and time deposits with financial institutions. Since many of the commitments are expected to expire without being drawn upon, the total commitment amounts do not necessarily represent cash requirements.
At December 31, 2010 and 2009, outstanding off-balance sheet financial instruments whose contract amounts represent potential credit risk were as follows:
|
2010
|
2009
|
|||||||
|
(In thousands)
|
||||||||
|
Commitments under unfunded loans and lines of credit
|
$ | 205,965 | $ | 156,538 | ||||
|
Standby letters of credit
|
23,716 | 13,091 | ||||||
|
Commitments to sell loans held for sale
|
6,751 | 2,766 | ||||||
The Company is party to various legal proceedings arising in the ordinary course of business. In the opinion of management, after consultation with legal counsel, there are no proceedings expected to have a material adverse effect on the financial statements of the Company. The Company has pending litigation as a result of the Beach First acquisition but any resulting losses are covered by the terms of the loss share indemnification agreement.
NOTE Q - FAIR VALUE MEASUREMENTS
The Company adopted the provisions of ASC Topic 820, Fair Value Measurements and Disclosures, which defines fair value, establishes a framework for measuring fair value, establishes a three-level valuation hierarchy for disclosure of fair value measurement and enhances disclosure requirements for fair value measurements. The valuation hierarchy is based upon the transparency of inputs to the valuation of an asset or liability as of the measurement date. The three levels of valuations are defined as follows:
Level 1 - Inputs to the valuation methodology are quoted prices (unadjusted) for identical assets or liabilities in active markets.
F-39
Notes To Consolidated Financial Statements
December 31, 2010, 2009 and 2008
Level 2 - Inputs to the valuation methodology include quoted prices for similar assets and liabilities in active markets, and inputs that are observable for the asset or liability, either directly or indirectly, for substantially the full term of the financial instrument.
Level 3 - Inputs to the valuation methodology are unobservable and significant to the fair value measurement, and requires significant management judgment or estimation using pricing models, discounted cash flow methodologies or similar techniques.
Fair Value on a Recurring Basis. The Company measures certain assets at fair value on a recurring basis and the following is a general description of the methods used to value such assets.
Securities Available for Sale. The fair values of securities available for sale are recorded at quoted market prices, if available. If quoted market prices are not available, fair values are measured using independent pricing models or other model-based valuation techniques such as the present value of future cash flows, adjusted for the security’s credit rating, prepayment assumptions and other factors such as credit loss assumptions. Level 1 valuation securities include those traded on an active exchange, such as the New York Stock Exchange, U.S. Treasury securities that are traded by dealers or brokers in active over-the-counter markets and money market funds. Level 2 valuation securities include mortgage-backed
securities issued by government sponsored entities, municipal bonds and corporate debt securities. Securities classified as Level 3 valuation include asset-backed securities in less liquid markets.
Derivative Assets and Liabilities. The values of derivative instruments held or issued by the Company for risk management purposes are traded in over-the-counter markets where quoted market prices are not readily available. For those derivatives, the Company measures fair value using models that use primarily market observable inputs, such as yield curves and option volatilities, and include the value associated with counterparty credit risk. The Company classifies derivatives instruments held or issued for risk management purposes as Level 2 valuation.
Below is a table that presents information about certain assets and liabilities measured at fair value on a recurring basis:
|
Assets
|
||||||||||||||||
|
(Liabilities)
|
||||||||||||||||
|
Measured at
|
Fair Value Measured Using
|
|||||||||||||||
|
Description
|
Fair Value
|
Level 1
|
Level 2
|
Level 3
|
||||||||||||
|
(Amounts in thousands)
|
||||||||||||||||
|
At December 31, 2010
|
||||||||||||||||
|
Available-for-sale securities
|
$ | 352,871 | $ | - | $ | 352,871 | $ | - | ||||||||
|
Interest rate swaps
|
255 | - | 255 | - | ||||||||||||
|
Interest rate cap
|
5,754 | - | 5,754 | - | ||||||||||||
|
At December 31, 2009
|
||||||||||||||||
|
Available-for-sale securities
|
$ | 360,506 | $ | - | $ | 360,506 | $ | - | ||||||||
|
Interest rate swaps
|
2,561 | - | 2,561 | - | ||||||||||||
|
Interest rate cap
|
20,336 | - | 20,336 | - | ||||||||||||
Fair Value on a Nonrecurring Basis. The Company measures certain assets at fair value on a nonrecurring basis and the following is a general description of the methods used to value such assets.
Loans Held for Sale. Loans held for sale are carried at the lower of cost or market value. The fair value of loans held for sale is based on what secondary markets are currently offering for portfolios with similar characteristics. As such, the Company classifies loans subjected to nonrecurring fair value adjustments as Level 2 valuation.
F-40
Notes To Consolidated Financial Statements
December 31, 2010, 2009 and 2008
Impaired Loans. Fair values of impaired loans are generally estimated using one of several methods, including collateral value, market value of similar debt, enterprise value, liquidation value and discounted cash flows. Those impaired loans not requiring an allowance represent loans for which the fair value of the expected repayments or collateral exceed the recorded investments in such loans. At December 31, 2010 and 2009, substantially all of the total impaired loans were evaluated based on the fair value of the collateral. When the fair value of the collateral is based on an observable market price or a current appraised value, the Company records the impaired loan as Level 2 valuation. When current appraised value is not
available or management determines the fair value of the collateral is further impaired below the appraised value and there is no observable market price, the Company records the impaired loan as Level 3 valuation.
Other Real Estate Owned. Fair values of other real estate owned are carried at the lower of carrying value or fair value. Fair value is based upon independent market prices, appraised values of the collateral or management’s estimation of the value of the collateral. When the fair value of the collateral is based on an observable market price or a current appraised value, the Company records the foreclosed asset as Level 2 valuation. When an appraised value is not available or management determines the fair value of the collateral is further impaired below the appraised value and there is no observable market price, the Company records the foreclosed asset as Level 3 valuation.
Below is a table that presents information about certain assets and liabilities measured at fair value on a nonrecurring basis:
|
Assets
|
||||||||||||||||
|
(Liabilities)
|
||||||||||||||||
|
Measured at
|
Fair Value Measured Using
|
|||||||||||||||
|
Description
|
Fair Value
|
Level 1
|
Level 2
|
Level 3
|
||||||||||||
|
(Amounts in thousands)
|
||||||||||||||||
|
At December 31, 2010
|
||||||||||||||||
|
Loans held for sale
|
$ | 6,751 | $ | - | $ | 6,751 | $ | - | ||||||||
|
Impaired loans
|
106,122 | - | - | 106,122 | ||||||||||||
|
Other real estate owned
|
39,737 | - | - | 39,737 | ||||||||||||
|
At December 31, 2009
|
||||||||||||||||
|
Loans held for sale
|
$ | 2,766 | $ | - | $ | 2,766 | $ | - | ||||||||
|
Impaired loans
|
20,757 | - | - | 20,757 | ||||||||||||
|
Other real estate owned
|
14,325 | - | - | 14,325 | ||||||||||||
The fair values of securities held to maturity are recorded at fair value on a nonrecurring basis when an impairment in value that is deemed to be other than temporary occurs. Fair value measurement is based upon quoted prices, if available. If quoted prices are not available, fair values are measured using independent pricing models or other model-based valuation techniques such as the present value of future cash flows, adjusted for the security’s credit rating, prepayment assumptions and other factors such as credit loss assumptions. At December 31, 2010 and 2009, there were no fair value adjustments related to $6.0 million of securites held to maturity.
Goodwill and other intangible assets are subject to impairment testing. When appropriate, a projected cash flow valuation method is used in the completion of impairment testing. This valuation method requires a significant degree of management judgment. In the event the projected undiscounted net operating cash flows are less than the carrying value, the asset is recorded at fair value as determined by the valuation model. As such, the Company classifies goodwill and other intangible assets as Level 3 valuation. At December 31, 2010 and 2009 there were no fair value adjustments related to $26.1 million of goodwill, and other intangible assets of $2.3 and $1.6 million, respectively.
F-41
Notes To Consolidated Financial Statements
December 31, 2010, 2009 and 2008
NOTE R - FAIR VALUE OF FINANCIAL INSTRUMENTS
Estimated fair values of financial instruments have been estimated by the Company using the provisions of ASC Topic 825, Financial Instruments “ASC 825”, which requires disclosure of fair value information about financial instruments, whether or not recognized in the balance sheet, for which it is practicable to estimate that value. In cases where quoted market prices are not available, fair values are based on estimates using present value or other valuation techniques.
Those techniques are significantly affected by the assumptions used, including the discount rate and estimates of future cash flows. In that regard, the derived fair value estimates cannot be substantiated by comparison to independent markets and, in many cases, could not be realized in immediate settlement of the instruments. ASC 825 excludes certain financial instruments and all nonfinancial instruments from its disclosure requirements. Accordingly, the aggregate fair value amounts presented do not represent the underlying value of the Company. The following methods and assumptions were used to estimate the fair value of financial instruments:
Cash and Cash Equivalents - The carrying amounts reported in the balance sheets for cash and cash equivalents approximate the fair value of those assets.
Securities Available for Sale and Securities Held to Maturity - Fair values for securities are based on quoted market prices, where available. If quoted market prices are not available, fair values are based on quoted market prices of comparable instruments.
Federal Home Loan Bank Stock - The fair value for FHLB stock is its carrying value, since this is the amount for which it could be redeemed. There is no active market for this stock and the Company, in order to be a member of the FHLB, is required to maintain a minimum investment.
Loans Held for Sale - Fair values of mortgage loans held for sale are based on commitments on hand from investors or prevailing market prices.
Loans Receivable - The fair values for fixed rate loans are estimated using discounted cash flow analyses using interest rates currently being offered for loans with similar terms and credit ratings for the same remaining maturities, adjusted for the allowance for loan losses.
FDIC Indemnification Asset - The fair value for the FDIC indemnification asset is estimated based on discounted future cash flows using current discount rates.
Investment in Life Insurance - The carrying value of life insurance approximates fair value because this investment is carried at cash surrender value, as determined by the insurer.
Accrued Interest Receivable and Accrued Interest Payable - The carrying amount of accrued interest is assumed to approximate fair value.
Deposits - The fair values disclosed for deposits with no stated maturity (e.g., interest and non-interest checking, passbook savings, and certain types of money market accounts) are, by definition, equal to the amount payable on demand at the reporting date (i.e., their carrying amounts). Fair values for deposits with a stated maturity date (time deposits) are estimated using a discounted cash flow calculation that applies interest rates currently being offered on these accounts to a schedule of aggregated expected monthly maturities on time deposits.
Short-term Borrowings and Long-Term Debt - Rates currently available to the Company for borrowings and debt with similar terms and remaining maturities are used to estimate fair value of the existing debt.
Derivative Financial Instruments - Fair values for derivatives are based values from third parties typically determined using widely accepted discounted cash flow models or Level 2 measurements.
Financial Instruments with Off-Balance Sheet Risk - The fair value of financial instruments with off-balance sheet risk discussed in Note P is not material.
F-42
Notes To Consolidated Financial Statements
December 31, 2010, 2009 and 2008
The estimated carrying and fair values of the Company’s financial instruments are as follows:
|
December 31, 2010
|
December 31, 2009
|
|||||||||||||||
|
Carrying
|
Estimated
|
Carrying
|
Estimated
|
|||||||||||||
|
value
|
fair value
|
value
|
fair value
|
|||||||||||||
|
(Amounts in thousands)
|
||||||||||||||||
|
Financial assets:
|
||||||||||||||||
|
Cash and cash equivalents
|
$ | 30,087 | $ | 30,087 | $ | 48,173 | $ | 48,173 | ||||||||
|
Investment securities available for sale
|
352,871 | 352,871 | 360,506 | 360,506 | ||||||||||||
|
Investment securities held to maturity
|
6,000 | 5,280 | 6,000 | 5,360 | ||||||||||||
|
Federal Home Loan Bank stock
|
9,146 | 9,146 | 6,160 | 6,160 | ||||||||||||
|
Loans held for sale
|
6,751 | 6,751 | 2,766 | 2,766 | ||||||||||||
|
Loans receivable, net
|
1,483,367 | 1,481,315 | 1,061,870 | 1,066,819 | ||||||||||||
|
Accrued interest receivable
|
10,363 | 10,363 | 8,178 | 8,178 | ||||||||||||
|
FDIC indemnification asset
|
69,493 | 69,493 | - | - | ||||||||||||
|
Investment in bank-owned life insurance
|
46,607 | 46,607 | 27,593 | 27,593 | ||||||||||||
|
Financial liabilities:
|
||||||||||||||||
|
Demand deposits and savings
|
$ | 948,609 | $ | 948,609 | $ | 645,130 | $ | 645,130 | ||||||||
|
Time deposits
|
879,461 | 905,670 | 704,748 | 718,580 | ||||||||||||
|
Short-term borrowings
|
60,207 | 60,207 | 50,283 | 50,283 | ||||||||||||
|
Long-term debt
|
97,713 | 88,315 | 100,713 | 89,793 | ||||||||||||
|
Accrued interest payable
|
1,554 | 1,554 | 1,402 | 1,402 | ||||||||||||
|
On-balance sheet derivative financial instruments:
|
||||||||||||||||
|
Derivative agreements – asset (liability):
|
||||||||||||||||
|
Interest rate swap agreements
|
$ | 255 | $ | 255 | $ | 2,561 | $ | 2,561 | ||||||||
|
Interest rate cap agreement
|
5,754 | 5,754 | 20,336 | 20,336 | ||||||||||||
F-43
Notes To Consolidated Financial Statements
December 31, 2010, 2009 and 2008
NOTE S - PARENT COMPANY FINANCIAL DATA
Following are condensed financial statements of BNC Bancorp as of and for the years ended December 31, 2010 and 2009 (In thousands):
December 31, 2010 and 2009
|
2010
|
2009
|
|||||||
|
Assets
|
||||||||
|
Cash and due from banks
|
$ | 108 | $ | 515 | ||||
|
Investment in bank subsidiary
|
178,649 | 164,854 | ||||||
|
Other assets
|
1,367 | 969 | ||||||
|
Total assets
|
$ | 180,124 | $ | 166,338 | ||||
|
Liabilities and Shareholders’ Equity
|
||||||||
|
Liabilities:
|
||||||||
|
Other liabilities
|
$ | 932 | $ | 920 | ||||
|
Short-term borrowings
|
3,255 | 15,499 | ||||||
|
Long-term debt
|
23,713 | 23,713 | ||||||
|
Total liabilities
|
27,900 | 40,132 | ||||||
|
Shareholders’ Equity
|
||||||||
|
Preferred stock
|
46,918 | 29,304 | ||||||
|
Common stock, no par value
|
86,791 | 70,376 | ||||||
|
Common stock warrants
|
2,412 | 2,412 | ||||||
|
Retained earnings
|
22,901 | 19,009 | ||||||
|
Accumulated other comprehensive income (loss)
|
(6,798 | ) | 5,105 | |||||
|
Total shareholders’ equity
|
152,224 | 126,206 | ||||||
|
Total liabilities and shareholders’ equity
|
$ | 180,124 | $ | 166,338 | ||||
Condensed Statements of Income
Years ended December 31, 2010, 2009 and 2008
|
2010
|
2009
|
2008
|
||||||||||
|
Dividends from bank subsidiary
|
$ | - | $ | 232 | $ | 720 | ||||||
|
Equity in undistributed earnings of bank subsidiary
|
8,901 | 7,148 | 5,290 | |||||||||
|
Other income
|
134 | 24 | 35 | |||||||||
|
Interest expense
|
(1,116 | ) | (835 | ) | (1,967 | ) | ||||||
|
Non-interest expense
|
(193 | ) | (32 | ) | (91 | ) | ||||||
|
Net income
|
$ | 7,726 | $ | 6,537 | $ | 3,987 | ||||||
Notes To Consolidated Financial Statements
December 31, 2010, 2009 and 2008
Condensed Statements of Cash Flows
Years ended December 31, 2010, 2009 and 2008
|
2010
|
2009
|
2008
|
||||||||||
|
(Amounts in thousands)
|
||||||||||||
|
Operating Activities
|
||||||||||||
|
Net income
|
$ | 7,726 | $ | 6,537 | $ | 3,987 | ||||||
|
Adjustments to reconcile net income to net cash provided by operating activities
|
||||||||||||
|
Equity in undistributed earnings of bank subsidiary
|
(8,901 | ) | (7,148 | ) | (5,290 | ) | ||||||
|
Amortization
|
11 | 11 | 11 | |||||||||
|
Stock-based compensation
|
247 | 52 | 55 | |||||||||
|
(Increase) decrease in other assets
|
(256 | ) | 6 | (1 | ) | |||||||
|
Increase in other liabilities
|
12 | 267 | 50 | |||||||||
|
Net cash provided (used) by operating activities
|
(1,161 | ) | (275 | ) | (1,188 | ) | ||||||
|
Investing Activities
|
||||||||||||
|
Net cash used for investment in subsidiaries
|
(16,950 | ) | (15,000 | ) | (25,086 | ) | ||||||
|
Financing Activities
|
||||||||||||
|
Due to subsidiaries
|
- | - | 376 | |||||||||
|
Proceeds (repayments) on short-term borrowings
|
(12,244 | ) | 14,754 | (7,000 | ) | |||||||
|
Proceeds from issuance of preferred stock
|
17,161 | - | 31,260 | |||||||||
|
Proceeds from issuance of common stock
|
16,161 | - | - | |||||||||
|
Proceeds from exercise of stock options
|
5 | 32 | 435 | |||||||||
|
Tax benefit from exercise of stock options
|
1 | 3 | 286 | |||||||||
|
Purchase and retirement of common stock
|
- | (144 | ) | (386 | ) | |||||||
|
Cash dividends paid, net of accretion
|
(3,380 | ) | (2,944 | ) | (1,457 | ) | ||||||
|
Net cash provided by financing activities
|
17,704 | 11,701 | 23,514 | |||||||||
|
Net decrease in cash and cash equivalents
|
(407 | ) | (3,574 | ) | (2,760 | ) | ||||||
|
Cash and cash equivalents, beginning
|
515 | 4,089 | 6,849 | |||||||||
|
Cash and cash equivalents, ending
|
$ | 108 | $ | 515 | $ | 4,089 | ||||||
|
ITEM 9.
|
CHANGES IN AND DISAGREEMENTS WITH ACCOUNTANTS ON ACCOUNTING AND FINANCIAL DISCLOSURE
|
None.
|
ITEM 9A.
|
CONTROLS AND PROCEDURES
|
The Company’s management, under the supervision and with the participation of the Chief Executive Officer and the Chief Financial Officer of the Company (its principal executive officer and principal financial officer, respectively), has concluded based on their evaluation as of the end of the period covered by this Report, that the Company’s disclosure controls and procedures are effective to ensure that information required to be disclosed by the Company in the reports filed or submitted by it under the Securities Exchange Act of 1934, as amended, is recorded, processed, summarized and reported within the time periods specified in the applicable rules and forms, and include controls and procedures designed to ensure that information required to be disclosed by the Company in such reports is
accumulated and communicated to the Company’s management, including the Chief Executive Officer and the Chief Financial Officer of the Company, as appropriate to allow timely decisions regarding required disclosure.
Our management, including the Chief Executive Officer and the Chief Financial Officer, does not expect that our disclosure controls will prevent all errors and all fraud. A control system, no matter how well conceived and operated, can provide only reasonable, not absolute, assurance that the objectives of the control system are met. Moreover, the design of a control system must reflect the fact that there are resource constraints, and the benefits of controls must be considered relative to their costs. Because of the inherent limitations in all control systems, no evaluation of controls can provide absolute assurance that all control issues and instances of fraud, if any, within the Company have been detected. These inherent limitations include the realities that the judgments in decision making can be
faulty, and that breakdowns can occur because of simple error or mistake. The design of any system of controls also is based in part upon certain assumptions about the likelihood of future events, and there can be no assurance that any design will succeed in achieving its stated goals under all potential future conditions.
Management’s Report on Internal Control Over Financial Reporting
The management of the Company is responsible for establishing and maintaining adequate internal control over financial reporting. The Company’s internal control system is designed to provide reasonable assurance to its management and board of directors regarding the preparation and fair presentation of published financial statements.
All internal control systems, no matter how well designed, have inherent limitations. Therefore, even those systems determined to be effective can provide only reasonable assurance with respect to financial statement preparation and presentation.
The Company’s management assessed the effectiveness of the Company’s internal control over financial reporting as of December 31, 2010. In making this assessment, management used the criteria set forth by the Committee of Sponsoring Organizations of the Treadway Commission (“COSO”) in Internal Control – Integrated Framework. Management concluded that the Company’s internal control over financial reporting was effective as of December 31, 2010, based on the evaluation under the framework in Internal Control – Integrated Framework.
|
W. Swope Montgomery, Jr.
|
David B. Spencer
|
|
President and Chief Executive Officer
|
Chief Financial Officer
|
There were no changes in the Company’s internal control over financial reporting that occurred during the last quarter of the period covered by this report that have materially affected, or are reasonably likely to materially affect, the Company’s internal control over financial reporting.
62
|
ITEM 9B.
|
OTHER INFORMATION
|
None.
PART III
ITEM 10. DIRECTORS AND EXECUTIVE OFFICERS AND CORPORATE GOVERNANCE
Directors and Executive Officers. The information concerning the Company’s directors and executive officers required by this Item 10 is incorporated herein by reference from the Company’s definitive proxy statement for the 2010 Annual Meeting of Shareholders, a copy of which will be filed with the SEC not later than 120 days after the end of the Company’s fiscal year.
Section 16(a) Beneficial Ownership Reporting Compliance. The information concerning compliance with the reporting requirements of Section 16(a) of the Exchange Act by our directors, officers, and ten percent shareholders required by this Item 10 is incorporated herein by reference from the Company’s definitive proxy statement, a copy of which will be filed with the SEC not later than 120 days after the end of the Company’s fiscal year.
Code of Ethics. The Company has adopted a Code of Business Conduct and Ethics that is applicable to all of its directors, officers and employees, including its principal executive and senior financial officers, as required by Section 406 of the Sarbanes-Oxley Act of 2002 and applicable SEC rules. A copy of the Company’s Code of Business conduct and Ethics adopted by the Company’s Board of Directors may be found on the Bank’s website: www.bankofnc.com.
In the event that the Company makes any amendment to, or grants any waivers of, a provision of its Code of Business Conduct and Ethics that applies to the principal executive officer or senior financial officer that requires disclosure under applicable SEC rules, the Company intends to disclose such amendment or waiver by filing a Form 8-K with the SEC.
The information regarding the Company’s audit committee required by this Item 10 is incorporated herein by reference from the Company’s definitive proxy statement for the 2011 Annual Meeting of Shareholders, a copy of which will be filed with the SEC not later than 120 days after the end of the Company’s fiscal year.
ITEM 11. EXECUTIVE COMPENSATION
The information concerning compensation and other matters required by this Item 11 is incorporated herein by reference from the Company’s definitive proxy statement for the 2011 Annual Meeting of Shareholders, a copy of which will be filed with the SEC not later than 120 days after the end of the Company’s fiscal year.
ITEM 12. SECURITY OWNERSHIP OF CERTAIN BENEFICIAL OWNERS AND MANAGEMENT AND RELATED STOCKHOLDER MATTERS
The information concerning security ownership of certain beneficial owners and management required by this Item 12 is incorporated herein by reference from the Company’s definitive proxy statement for the 2011 Annual Meeting of Shareholders, a copy of which will be filed with the SEC not later than 120 days after the end of the Company’s fiscal year.
Securities Authorized for Issuance Under Equity Compensation Plans
The following table presents as of December 31, 2010, the number of securities to be issued upon the exercise of outstanding options, the weighted average price of the outstanding options and the number of securities remaining for further issuance under the plans. The Bank of North Carolina Stock Option Plans for Non-Employees/Directors and Key Employees and the Omnibus Stock Ownership and Long Term Incentive Plan have been approved by the shareholders.
63
|
Plan category
|
(a)
Number of shares
to be issued upon
exercise of
outstanding options
|
(b)
Weighted-average
exercise price of
outstanding options
|
(c)
Number of shares remaining
available for future issuance under
equity compensation plans (excluding
shares reflected in column (a))
|
|||||||||
|
Equity compensation plans Approved by our shareholders
|
269,245 | $ | 9.64 | 385,440 | ||||||||
|
Equity compensation plans not Approved by our shareholders
|
- | - | - | |||||||||
|
Total
|
269,245 | $ | 9.64 | 385,440 | ||||||||
|
|
1
|
Of the 269,245 stock options issued under the Plans, a total of 249,629 of those stock options have vested or are exercisable within 60 days.
|
ITEM 13. CERTAIN RELATIONSHIPS AND RELATED TRANSACTIONS, AND DIRECTOR INDEPENDENCE
The information concerning certain relationships and related transactions and director independence required by this Item 13 is incorporated herein by reference from the Company’s definitive proxy statement for the 2011 Annual Meeting of Shareholders, a copy of which will be filed with the SEC not later than 120 days after the end of the Company’s fiscal year.
ITEM 14. PRINCIPAL ACCOUNTANT FEES AND SERVICES
The information concerning principal accounting fees and services required by this Item 14 is incorporated herein by reference from the Company’s definitive proxy statement for the 2011 Annual Meeting of Shareholders, a copy of which will be filed with the SEC not later than 120 days after the end of the Company’s fiscal year.
ITEM 15. EXHIBITS AND FINANCIAL STATEMENT SCHEDULES
(a)(1) Financial Statements. For a list of the financial statements included in this Form 10-K, see “Index to the Consolidated Financial Statements” on page F-1.
(a)(2) Financial Statement Schedules. All schedules are omitted because they are not applicable or because the required information is shown under Item 8, “Financial Statements and Supplementary Data.”
(a)(3) Exhibits. The list of exhibits filed as a part of this Form 10-K is set forth on the Exhibit Index immediately preceding such exhibits and is incorporated by reference in this Item 15(a)(3).
(b) Exhibits. See Exhibit Index.
(c) Separate Financial Statements and Schedules. None.
64
SIGNATURES
Pursuant to the requirements of Section 13 of the Securities Exchange Act of 1934, the registrant has duly caused this report to be signed on its behalf by the undersigned, thereunto duly authorized.
|
BNC BANCORP
|
|||
|
By:
|
/s/ W. Swope Montgomery, Jr.
|
||
|
W. Swope Montgomery, Jr.
|
|||
|
Date: March 15, 2011
|
President and Chief Executive Officer
|
||
Pursuant to the requirements of the Securities Exchange Act of 1934, this report has been signed below by the following persons on behalf of the Bank and in the capacities and on the dates indicated:
|
Signature
|
Title
|
Date
|
||
|
/s/ W. Swope Montgomery, Jr.
|
President, Chief Executive Officer
|
March 15, 2011
|
||
|
W. Swope Montgomery, Jr.
|
and Director
|
|||
|
/s/ David B. Spencer
|
Executive Vice President, and
|
March 15, 2011
|
||
|
David B. Spencer
|
Chief Financial Officer (Principal Financial
|
|||
|
Officer and Principal Accounting Officer)
|
||||
|
/s/ Richard D. Callicutt II
|
Executive Vice President,
|
March 15, 2011
|
||
|
Richard D. Callicutt II
|
Chief Operating Officer, and
|
|||
|
Director
|
||||
|
/s/ Lenin J. Peters, M.D.
|
Director
|
March 15, 2011
|
||
|
Lenin J. Peters, M.D.
|
||||
|
/s/ Thomas R. Smith, CPA
|
Director
|
March 15, 2011
|
||
|
Thomas R. Smith, CPA
|
||||
|
/s/ Larry L. Callahan
|
Director
|
March 15, 2011
|
||
|
Larry L. Callahan
|
||||
|
/s/ Joseph M. Coltrane, Jr.
|
Director
|
March 15, 2011
|
||
|
Joseph M. Coltrane, Jr.
|
||||
|
/s/Charles T. Hagan III
|
Director
|
March 15, 2011
|
||
|
Charles T. Hagan III
|
||||
|
/s/R. Mark Graf
|
Director
|
March 15, 2011
|
||
|
R. Mark Graf
|
||||
|
/s/Thomas R. Sloan
|
Director
|
March 15, 2011
|
||
|
Thomas R. Sloan
|
||||
|
/s/ Robert A. Team, Jr.
|
Director
|
March 15, 2011
|
||
|
Robert A. Team, Jr.
|
||||
|
/s/ D. Vann Williford
|
Director
|
March 15, 2011
|
||
|
D. Vann Williford
|
||||
|
/s/ Richard F. Wood
|
Director
|
March 15, 2011
|
||
|
Richard F. Wood
|
|
|
65
EXHIBIT INDEX
Exhibit (2)(i) Purchase and Assumption Agreement Whole Bank All Deposits among the Federal Deposit Insurance Corporation, receiver of Beach First National Bank, Myrtle Beach, South Carolina, Federal Deposit Insurance Corporation and Bank of North Carolina, dated effective as of April 9, 2010, incorporated by reference to Exhibit 2.1 to the Form 8-K filed with the SEC on April 15, 2010.
Exhibit (3)(i) Articles of Incorporation, incorporated herein by reference to Exhibit (3)(i) to the Form 8-K - Rule 12g-3, filed with the SEC on December 18, 2002.
Exhibit (3)(i)(a) Articles of Amendment dated December 2, 2008, regarding the Series A Preferred Stock, incorporated herein by reference to Exhibit 3.1 to the Form 8-K filed with the SEC on December 8, 2008.
Exhibit (3)(ii) Bylaws, incorporated herein by reference to Exhibit (3)(ii) to the Form 8-K - Rule 12g-3, filed with the SEC on December 17, 2002.
Exhibit (4) Form of Stock Certificate, incorporated herein by reference to the Form 8-K - Rule 12g-3, filed with the SEC on December 17, 2002.
Exhibit (4)(i)(a) Form of Stock Certificate, regarding the Series A Preferred Stock incorporated herein by reference to Exhibit 4.1 to the Form 8-K filed with the SEC on December 5, 2008.
Exhibit (4)(i)(b) Form of Certificate for the Series B Preferred Stock, incorporated by reference to Exhibit 4.1 to the Form 8-K filed with the SEC on June 18, 2010.
Exhibit (4)(ii) Warrant dated December 5, 2008, for the purchase of shares of Common Stock incorporated herein by reference to Exhibit 4.2 to the Form 8-K filed with the SEC on December 5, 2008.
Exhibit (10)(i)(a) Employment Agreement dated as of December 31, 2005 among BNC Bancorp, Bank of North Carolina and W. Swope Montgomery, Jr., incorporated herein by reference to Exhibit 10(i)(a) to the Form 8-K filed with the SEC on January 4, 2005.*
Exhibit (10)(i)(a)(1) Employment Letter Agreement dated December 5, 2008 by and among BNC Bancorp, Bank of North Carolina and W. Swope Montgomery, Jr. incorporated herein by reference to Exhibit 10.2 to the form 8-K filed with the SEC on December 5, 2008.*
Exhibit (10)(i)(b) Employment Agreement dated as of December 31, 2005 among BNC Bancorp, Bank of North Carolina and Richard D. Callicutt, II, incorporated herein by reference to Exhibit 10(i)(b) to the Form 8-K filed with the SEC on January 4, 2005.*
Exhibit (10)(i)(b)(2) Employment Letter Agreement dated December 5, 2008 by and among BNC Bancorp, Bank of North Carolina and Richard D. Callicutt, II incorporated herein by reference to Exhibit 10.5 to the form 8-K filed with the SEC on December 5, 2008.*
Exhibit (10)(i)(c) Employment Agreement dated as of December 31, 2005 among BNC Bancorp, Bank of North Carolina and David B. Spencer, incorporated herein by reference to Exhibit 10(i)(c) to the Form 8-K filed with the SEC on January 4, 2005.*
Exhibit (10)(i)(c)(3) Employment Letter Agreement dated December 5, 2008 by and among BNC Bancorp, Bank of North Carolina and David B. Spencer incorporated herein by reference to Exhibit 10.3 to the form 8-K filed with the SEC on December 5, 2008.*
Exhibit (10)(ii)(a) Salary Continuation Agreement dated as of December 31, 2005 between Bank of North Carolina and W. Swope Montgomery, Jr., incorporated herein by reference to Exhibit 10(ii)(a) to the Form 8-K filed with the SEC on January 4, 2005.*
Exhibit (10)(ii)(b) Salary Continuation Agreement dated as of December 31, 2005 between Bank of North Carolina and Richard D. Callicutt, II, incorporated herein by reference to Exhibit 10(ii)(b) to the Form 8-K filed with the SEC on January 4, 2005.*
66
Exhibit (10)(ii)(c) Salary Continuation Agreement dated as of December 31, 2005 between Bank of North Carolina and David B. Spencer, incorporated herein by reference to Exhibit 10(ii)(c) to the Form 8-K filed with the SEC on January 4, 2005.*
Exhibit (10)(ii)(d) Amended Salary Continuation Agreement dated as of December 18, 2007 between Bank of North Carolina and W. Swope Montgomery, Jr., incorporated by reference to Exhibit 10(ii)(a) to the Form 8-K filed with the SEC on December 27, 2007.*
Exhibit (10)(ii)(e) Amended Salary Continuation Agreement dated as of December 18, 2007 between Bank of North Carolina and Richard D. Callicutt, II, incorporated by reference to Exhibit 10(ii)(b) to the Form 8-K filed with the SEC on December 27, 2007.*
Exhibit (10)(ii)(f) Amended Salary Continuation Agreement dated as of December 18, 2007 between Bank of North Carolina and David B. Spencer, incorporated by reference to Exhibit 10(ii)(c) to the Form 8-K filed with the SEC on December 27, 2007.*
Exhibit (10)(iii) Bank of North Carolina Stock Option Plan for Directors, incorporated by reference to Exhibit 10(iii) to the Form 10-Q, filed with the SEC on November 2, 2009.
Exhibit (10)(iv) Bank of North Carolina Stock Option Plan for Key Employees, incorporated by reference to Exhibit 10(iv) of the Form 10-Q, filed with the SEC on November 2, 2009.*
Exhibit (10)(v) Directors Deferred Compensation Plan, incorporated by reference to Exhibit 10(v) of the Form 10-Q, filed with the SEC on November 2, 2009.
Exhibit (10)(vi)(a) Endorsement Split Dollar Agreement dated December 31, 2005 between Bank of North Carolina and W. Swope Montgomery, Jr., incorporated herein by reference to Exhibit (10)(vi)(a) to the Form 8-K filed with the SEC on January 4, 2005.*
Exhibit (10)(vi)(b) Endorsement Split Dollar Agreement dated December 31, 2005 between Bank of North Carolina and Richard D. Callicutt II, incorporated herein by reference to Exhibit (10)(vi)(b) to the Form 8-K filed with the SEC on January 4, 2005.*
Exhibit (10)(vi)(c) Endorsement Split Dollar Agreement dated December 31, 2005 between Bank of North Carolina and David B. Spencer, incorporated herein by reference to Exhibit (10)(vi)(c) to the Form 8-K filed with the SEC on January 4, 2005.*
Exhibit (10)(vi)(d) Amended Endorsement Split Dollar Agreement dated December 18, 2007 between Bank of North Carolina and W. Swope Montgomery, Jr., incorporated by reference to Exhibit (10)(vi)(a) to the Form 8-K filed with the SEC on December 27, 2007.*
Exhibit (10)(vi)(e) Amended Endorsement Split Dollar Agreement dated December 18, 2007 between Bank of North Carolina and Richard D. Callicutt II, incorporated by reference to Exhibit (10)(vi)(b) to the Form 8-K filed with the SEC on December 27, 2007.*
Exhibit (10)(vi)(f) Amended Endorsement Split Dollar Agreement dated December 18, 2007 between Bank of North Carolina and David B. Spencer, incorporated by reference to Exhibit (10)(vi)(c) to the Form 8-K filed with the SEC on December 27, 2007.*
Exhibit (10)(vii) BNC Bancorp Omnibus Stock Ownership and Long Term Incentive Plan incorporated herein by reference to Exhibit (10)(vii) of Form 10-K filed with the SEC on March 31, 2005.*
Exhibit (10)(viii) Amendment No. 1 to Omnibus Stock Ownership and Long Term Incentive Plan, incorporated by reference to Exhibit 10.3 to the Form 8-K filed with the SEC on June 18, 2010.*
67
Exhibit (10)(vix) Investment Agreement by and among BNC Bancorp and Aquiline BNC Holdings LLC dated as of June 14, 2010, incorporated by reference to Exhibit 10.1 to the Form 8-K filed with the SEC on June 18, 2010.
Exhibit (10)(x) Form of Subscription and Registration Rights Agreement, incorporated by reference to Exhibit 10.2 to the Form 8-K filed with the SEC on June 18, 2010.
Exhibit (10)(xi) Policy document for Performance Compensation for Stakeholders, incorporated by reference to Exhibit 10(xi) to the form 10-Q filed with the SEC on November 2, 2009.
Exhibit (10)(xii) Letter Agreement dated December 23, 2008 between the Registrant and the United States Treasury, incorporated herein by reference to Exhibit 10.1 to the Form 8-K filed with the SEC on December 5, 2008.
Exhibit (11) Statement regarding computation of per share earnings (included herein on Page F-15)
Exhibit (12) Statement regarding computation of ratios
Exhibit (21) Subsidiaries of the Registrant: incorporated by reference to ITEM 1. Business “Subsidiaries”
Exhibit (23)(i) Consent of Cherry, Bekaert & Holland, L.L.P.
Exhibit (31)(i) Rule 13a-14(a)\15d-14(a) Certifications
Exhibit (31)(ii) Rule 13a-14(a)\15d-14(a) Certifications
Exhibit (32) Section 1350 Certification
Exhibit 99.1 TARP Certificate by Chief Executive Officer
Exhibit 99.2 TARP Certificate by Chief Financial Officer
*Indicates a management contract or compensatory plan or arrangement.
68